National Institute of Economic and Social Research An Introduction to the Analysis of WERS 2004 John...
39
National Institute of Economic and Social An Introduction to the Analysis of WERS 2004 John Forth & Lucy Stokes WERS 2004 Information & Advice Service
-
Upload
jeffrey-burke -
Category
Documents
-
view
219 -
download
1
Transcript of National Institute of Economic and Social Research An Introduction to the Analysis of WERS 2004 John...
National Instituteof Economic and Social Research
An Introduction to the Analysis of WERS 2004
John Forth & Lucy StokesWERS 2004 Information & Advice Service
Aims
• Introduce the publicly-available data files– Content– Availability and access procedures– Key features
• Analytical issues– First steps– Weighting and statistical inference– Linking data files
• Where to get help and advice

Assumptions
• Know something about nature and content of WERS 2004
• Yet to obtain or use the data, or
• At the very early stages in your analysis
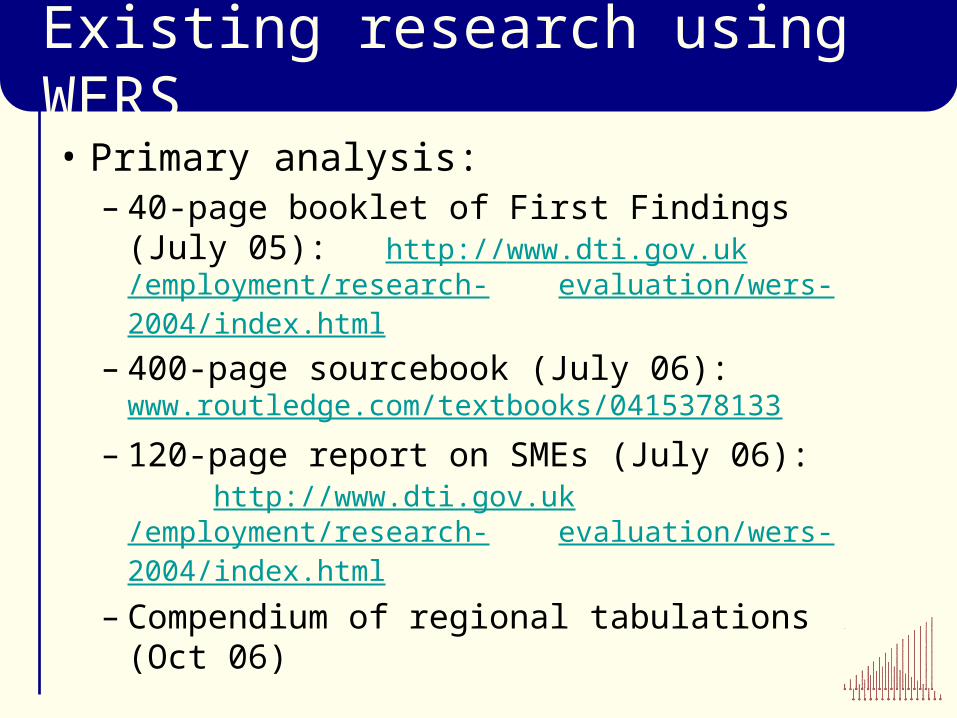
Existing research using WERS
• Primary analysis:– 40-page booklet of First Findings (July
05): http://www.dti.gov.uk/employment/research-evaluation/wers-2004/index.html
– 400-page sourcebook (July 06): www.routledge.com/textbooks/0415378133
– 120-page report on SMEs (July 06): http://www.dti.gov.uk/employment/research-
evaluation/wers-2004/index.html
– Compendium of regional tabulations (Oct 06)

Existing research using WERS
• Secondary analysis:– Bibliography of research using WERS
1980-1998– Searchable on-line database of research
using WERS 2004
Both available at:http://www.wers2004.info/research/search.php

Overview of WERS 2004 data
WERS 2004
2004 Cross-section 1998-2004 Panel Survey
Survey of Managers
Survey of Employee Representatives
Survey of Employees
Financial Performance Questionnaire
2,295 (64%)
985 (82%)
22,451 (61%)
1,070 (47%)
Annual Business Inquiry
932 (47%; 51% in trading sector)

Cross-Section: Managers• Workforce composition • Management of personnel and employment
relations • Recruitment and training • Workplace flexibility and the organisation of
work • Consultation and information • Employee representation • Payment systems and pay determination • Grievance, disciplinary and dispute procedures • Equal opportunities, work-life balance • Workplace performance

Cross-Section: Employee Reps• Structure of representation at the workplace • Time spent on representative duties • Means of communication with employees • Incidence of negotiation and consultation
over pay and other matters • Involvement in redundancies, discipline and
grievance matters • Incidence of collective disputes and
industrial action • Relations with managers • Union recruitment

Cross-Section: Employees• Working hours • Job influence • Job satisfaction • Working arrangements • Training and skills • Information and consultation • Employee representation • Pay

Cross-Section: FPQ / ABI• Turnover• Employment costs• Purchases• Capital stocks• Capital expenditure (acquisitions and
disposals)• R&D activity

Longitudinal analysis
• Each XS: independent samples – no overlap between surveys
• Time-series with 5 data points– Changes to questionnaires over time– 1998 a major break point– Expansion of population in 1998 and
2004 to include smaller workplaces

Longitudinal analysis
• Two-wave Panel Surveys provide longitudinal data on individual workplaces– 1984-1990 (trading sector only)– 1990-1998 (all workplaces with 25+)– 1998-2004 (all workplaces with 10+)
• Survival status of original x-section• Changes in practice in continuing
workplaces (headline practices only)

Overview of WERS 2004 data
1998-2004 Panel Survey
WERS 1998 Cross-Section2,192 (80%)
1242 (99%)
67% random sample of continuing workplaces Survival status of all other workplaces
Survey of Managers
Annual Business Inquiry
938 (76%)
166 matched for 1998 and 2004 (18%)

Data availability
• General release data• Restricted until April 2007
– Region identifiers– Detailed industry (below SIC(2003) Section
level)– Financial Performance Questionnaire
• Permanently restricted– Annual Business Inquiry
• Not available– Names & addresses of respondents /
workplaces and the wider organisation
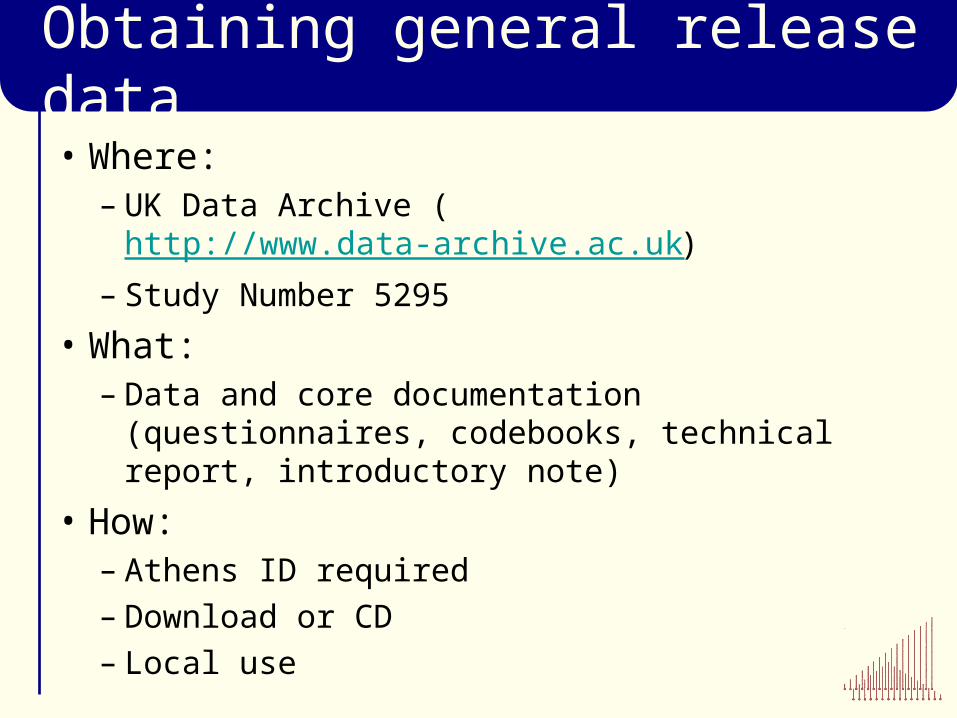
Obtaining general release data• Where:
– UK Data Archive (http://www.data-archive.ac.uk)
– Study Number 5295
• What:– Data and core documentation
(questionnaires, codebooks, technical report, introductory note)
• How:– Athens ID required– Download or CD– Local use

Obtaining financial data• Where:
– ONS Virtual Micro-data Lab (http://www.statistics.gov.uk/about/bdl/)
– London, Newport, Titchfield, Southport
• What:– General release data + FPQ + ABI – Core documentation (limited for ABI)
• How:– Application to ONS Micro-data Release Panel– Site access only– Withdrawal limited to non-disclosive results
Timed release of restricted data• In April 2007:
– FPQ to the UK Data Archive– Region codes and detailed industry
codes to UKDA and ONS
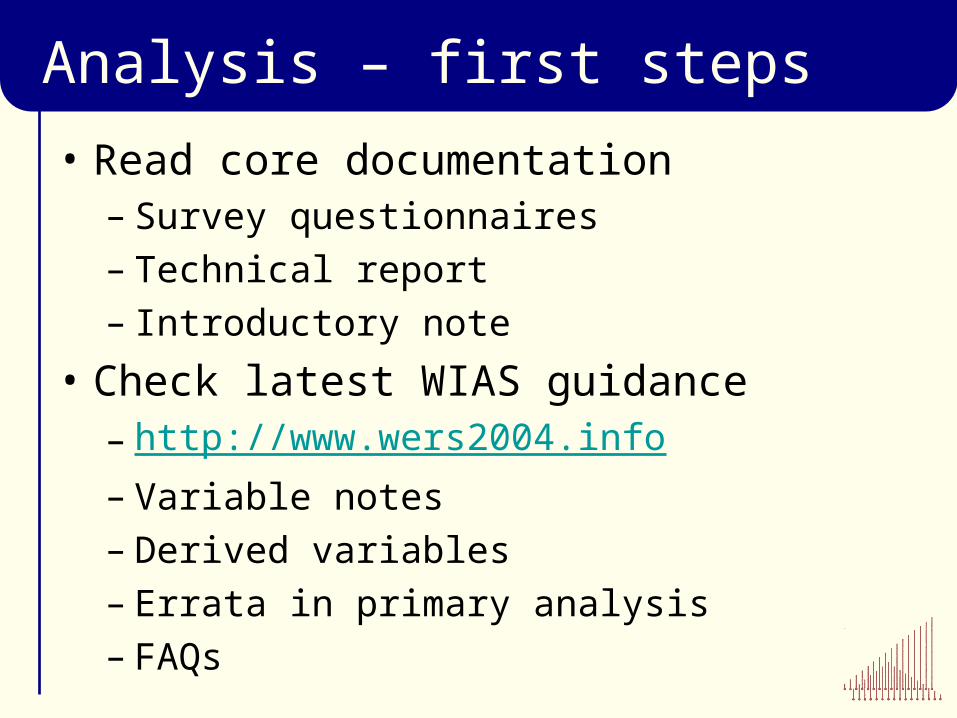
Analysis – first steps
• Read core documentation– Survey questionnaires– Technical report– Introductory note
• Check latest WIAS guidance– http://www.wers2004.info– Variable notes– Derived variables– Errata in primary analysis– FAQs
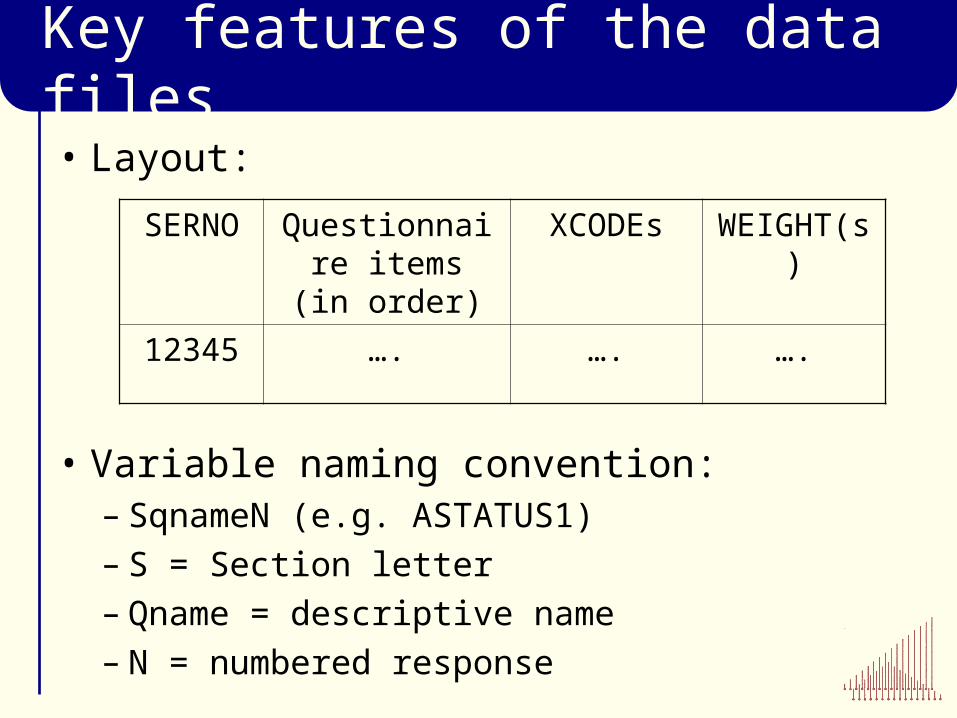
Key features of the data files
• Layout:
• Variable naming convention:– SqnameN (e.g. ASTATUS1)– S = Section letter– Qname = descriptive name– N = numbered response
SERNO Questionnaire items (in
order)
XCODEs WEIGHT(s)
12345 …. …. ….

Key features of the data files
• Multiple-response sets (e.g. CFACTORS)
CFACTORS*^ Which of the following factors are important when recruiting new employees? PROBE: Which others? UNTIL 'None':
1) References, 2) Availability, 3) Recommended by another employee, 4) Skills5) Age6) Qualifications, 7) Experience, 8) Motivation, 9) Other (please specify CFACTOTH)

Key features of the data files
• Multiple-response sets– CFACTOR1 = 1st response given– CFACTOR2 = 2nd response given, etc– XCFACT1-3 = codes for verbatim
responses using ‘other, please specify’ code
– Convert to dummies using ANY command (SPSS) or EGEN command with EQANY option (Stata)

Key features of the data files
•T variables (e.g. FMEASPR, FMEASPRT)FMEASPR* What proportion of non-managerial employees at this workplace have their performance formally appraised? INTERVIEWER: If respondent gives answer as an exact number you can code “97” here and record the number of the next question 1) All (100%), 2) Almost all (80-99%), 3) Most (60-79%), 4) Around half (40-59%), 5) Some (20-39%), 6) Just a few (1-19%), 97) Number
{If giving exact number } FMEASPRT How many non-managerial employees here have their performance formally appraised? ENTER NUMBER

Key features of the data files
• In this case, code FMEASPRT into FMEASPR using total non-managerial employees (ZALLEMPS – ZMNG_TOT)
• Syntax available for all T variables at:
http://www.wers2004.info/FAQ.php#syntax

Key features of the data files
• Missing values:-9 = Not answered / refused-8 = Don’t know-1 = Not applicable
• Treatment in data files:– SPSS: Assigned as user-missing values– Stata: Not assigned as missing values
(valid values)

Producing reliable estimates
• Sample bias Weights
• Less precision than SRS Survey-adjusted variance estimation

Importance of weighting
• Sample of workplaces not SRS• Unequal probabilities of selection by
workplace size and industry (IDBR)• Large workplaces and small industries
over-represented vs population• Also: variations in response rates by size
and industry (at least)• Weight = 1 / p(selection and response)• Weighted estimates free of known
biases (i.e. representative of wider population)
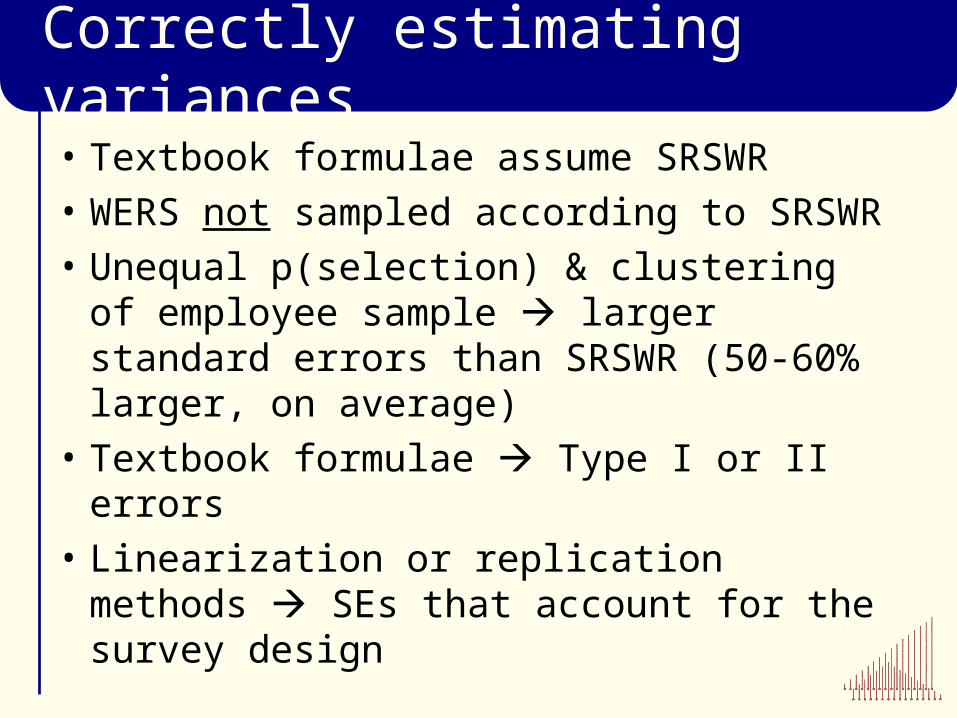
Correctly estimating variances• Textbook formulae assume SRSWR• WERS not sampled according to SRSWR• Unequal p(selection) & clustering of
employee sample larger standard errors than SRSWR (50-60% larger, on average)
• Textbook formulae Type I or II errors• Linearization or replication methods
SEs that account for the survey design

Software options
• Stata version 5 onwards:– ‘svy’ suite of commands (included)– svyset informs Stata about the sample
design– svy: prefix can be used with wide range
of statistical procedures– iweights will remove bias but
incorrectly estimate variances (SEs)– Syntax examples at:
http://www.wers2004.info/FAQ.php#stata
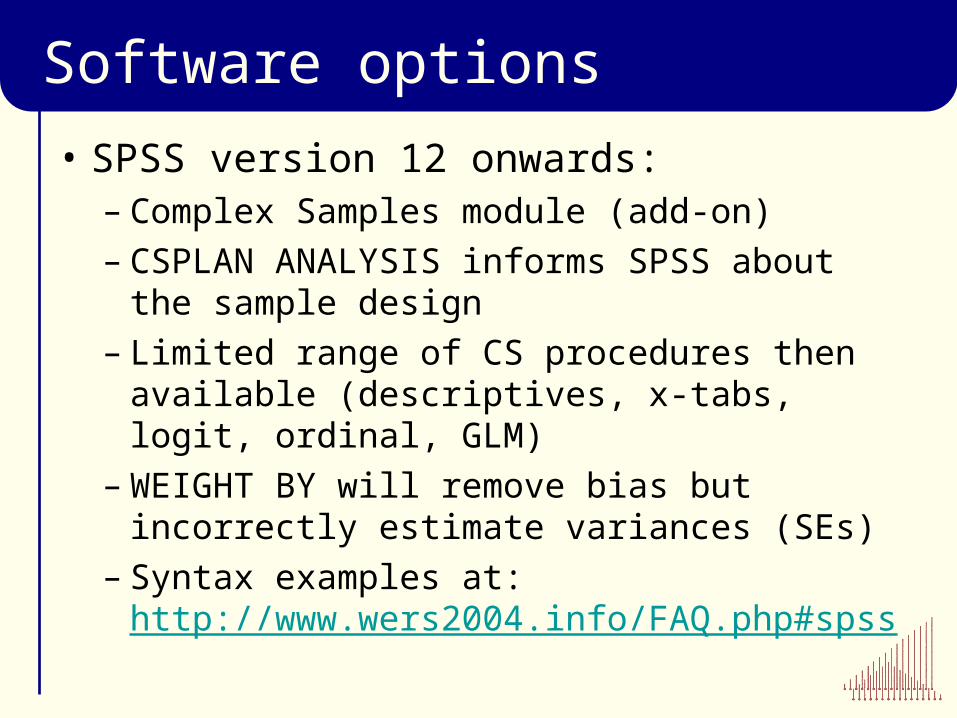
Software options
• SPSS version 12 onwards:– Complex Samples module (add-on)– CSPLAN ANALYSIS informs SPSS about
the sample design– Limited range of CS procedures then
available (descriptives, x-tabs, logit, ordinal, GLM)
– WEIGHT BY will remove bias but incorrectly estimate variances (SEs)
– Syntax examples at: http://www.wers2004.info/FAQ.php#spss

Linking data files
• Combining data from different questionnaires for linked analysis
• Examples:– Using data on payment practices from
MQ in analysis of employees’ wages– Comparing managers’ and employee
representatives’ ratings of climate– Linking 1998 and 2004 observations in
Panel
• Link via unique workplace identifier (SERNO)

Linking data files (cross-section)• One-to-one match: FPQ MQ
Master (FPQ) Secondary (MQ)
SERNO SERNO
12345 12345
12346
12347 12347
12348

Linking data files (cross-section)• One-to-many match: SEQ, ERQ MQ
Master (SEQ)
Master (SEQ)
Secondary (MQ)
SERNO PERSID SERNO
12345 1 12345
12345 2 12345
12346
12347 1 12347

Software options
• SPSS:MATCH FILES FILE=master file
/TABLE=secondary file/BY serno
• Stata:get file=master file
merge serno using secondary file
drop _merge==2

Linking data files (cross-section)• Many-to-one match: MQ SEQ, ERQ
Master (MQ)
Secondary (SEQ)
Secondary (SEQ)
SERNO SERNO PERSID
12345 12345 1
12345 2
12345 3

Software options
• SPSS:AGGREGATE then MATCH FILES
• Stata:collapse then merge
• Issue:– summary data item from SEQ may be
measured with error (sampling error)– errors in variables regression?

Linking data files (panel)
• One-to-one match: 1998 2004• Wide form: one record per workplace
Master (1998)
Secondary (2004)
SERNO Xvar1 Xvar2 SERNO Yvar1 Yvar2
12345 1 2 12345 2 1
12346 1 1 12345 1 2

Linking data files (panel)
• Long form: one record per workplace per year
• Syntax for wide and long forms available at: http://www.wers2004.info/FAQ.php#construct
SERNO year var1 var2
12345 1998 1 2
12345 2004 2 1
12346 1998 1 1
12346 2004 1 2

Aims
• Introduce the publicly-available data files– Content– Availability and access procedures– Key features
• Analytical issues– First steps– Weighting and statistical inference– Linking data files
• Where to get help and advice

Further info and advice
WERS 2004 Information and Advice Service
Website: http://www.wers2004.info
Email: [email protected]
Telephone: +44 (0) 20 7654 1933