National Diabetes Audit 2012-2013 · PDF fileNational Diabetes Audit 2012-2013 Report 1: ......
17
Key findings about the outcomes for people with diabetes in NHS Wirral CCG National Diabetes Audit 2012-2013 Report 1: Care Processes and Treatment Targets Summary for NHS Wirral CCG (12F) Clinical Commissioning Group (CCG) / Local Health Board (LHB) Report
Transcript of National Diabetes Audit 2012-2013 · PDF fileNational Diabetes Audit 2012-2013 Report 1: ......
Key findings about the outcomes for people with diabetes in NHS Wirral CCG
National Diabetes Audit 2012-2013
Report 1: Care Processes and Treatment Targets
Summary for NHS Wirral CCG (12F)
Clinical Commissioning Group (CCG) / Local Health Board (LHB) Report

The National Diabetes Audit is commissioned by
The National Diabetes Audit is delivered by
The National Diabetes Audit is supported by
The national cardiovascular intelligence network (NCVIN) is a partnership of leading national cardiovascular organisations which analyses information and data and turns it into meaningful timely health intelligence for commissioners, policy makers, clinicians and health professionals to improve services and outcomes.
Diabetes UK is the largest organisation in the UK working for people with diabetes, funding research, campaigning and helping people live with the condition.
The Health and Social Care Information Centre (HSCIC) is England’s central, authoritative source of essential data and statistical information for frontline decision makers in health and social care. The HSCIC managed the publication of the 2012-2013 reports.
The Healthcare Quality Improvement Partnership (HQIP) The National Diabetes Audit is commissioned by the Healthcare Quality Improvement Partnership (HQIP) as part of the National Clinical Audit Programme (NCA). HQIP is led by a consortium of the Academy of Medical Royal Colleges, the Royal College of Nursing and National Voices. Its aim is to promote quality improvement, and in particular to increase the impact that clinical audit has on healthcare quality in England and Wales. HQIP holds the contract to manage and develop the NCA Programme, comprising more than 30 clinical audits that cover care provided to people with a wide range of medical, surgical and mental health conditions. The programme is funded by NHS England, the Welsh Government and, with some individual audits, also funded by the Health Department of the Scottish Government, DHSSPS Northern Ireland and the Channel Islands.
National Diabetes Audit 2012-2013 Report 1: Care Processes and Treatment Targets – NHS Wirral CCGCopyright © 2014, The Health and Social Care Information Centre, National Diabetes Audit. All rights reserved.
2

Introduction
The National Diabetes Audit is commissioned by The Healthcare Quality Improvement Partnership (HQIP) as part of the National Clinical Audit Programme (NCA). The NDA is managed by the Health and Social Care Information Centre (HSCIC) in partnership with Diabetes UK and supported by Public Health England.
This report, from the tenth year of the audit, presents key findings on key care processes and treatment target achievement rates from 2012-2013 in all age groups in NHS Wirral CCG. From 2015 the audit intends to publish 6 months after the end of the audit year.
The report sets out to answer the following audit questions:
• Registrations: Is everyone with diabetes diagnosed and recorded on a practice diabetes register?
• Care Processes: What percentage of people registered with diabetes received eight of the nine care processes (eye screening is recorded by NHS Diabetes Eye Screening). National Institute for Health and Care Excellence (NICE) key processes of diabetes care?
• Treatment Targets: What percentage of people registered with diabetes achieved NICE defined treatment targets for glucose control, blood pressure and blood cholesterol?
For further information, refer to the 2012-2013 national report, which is available on the NDA website:
www.hscic.gov.uk/nda
The NDA reports on the provision of core diabetes care for everyone with diabetes. This provides commissioners with age, ethnicity and social deprivation related perspectives across the whole population for which they are responsible. The NDA also reports to participating individual General Practices (via individual secure sign-on) and participating adult specialist services allowing them to benchmark their care against their peers. Clinical leads can request supporting GP Practice data via the [email protected] inbox. The National Paediatric Diabetes Audit (NPDA) reports separately to individual participating paediatric diabetes centres regarding their provision of diabetes care for the children and young people attending their services. Those reviewing the NDA and NPDA reports side by side need to be aware of these differences but, equally, those wanting to get the most complete picture of local needs and service provision should consider the two reports togetherᵃ.
In all of the tables within this report, CCG/LHB refer to NHS Wirral CCG.
National Diabetes Audit 2012-2013 Report 1: Care Processes and Treatment Targets – NHS Wirral CCGCopyright © 2014, The Health and Social Care Information Centre, National Diabetes Audit. All rights reserved.
3

ᵃ Because the care of adults and children with diabetes is mixed between GP services (this includes ALL patients) and hospital, paediatric and community specialist services (these each include SOME patients), the different ‘views’ that the two national audits NDA and NPDA give to the providers of the services will inevitably include overlapping patients. Thus someone with diabetes attending a specialist service should also appear in the relevant GP report. The NDA integrates data from participating specialist and GP services for adults with diabetes so that if a care process or treatment target is recorded by one but not the other both get the complete data reported back to them i.e. a ‘whole person’ view. This makes sense because it reflects the fact that there is no clinical value in duplicating something carried out elsewhere. The population level NDA reports include all people with diabetes in a geographical area, irrespective of their mix of provider services, and use integrated data where they are available.
But the NPDA runs independently of the NDA and of GP services so its data are not integrated, making it possible that GP reports do not include all care processes or treatment targets measured in specialist paediatric units and vice versa. Specialist paediatric diabetes units are primarily responsible for the care of most children and young people with diabetes and for the collection of their care process and outcome data. Although GPs do not provide the majority of care for children and young people living with diabetes they do prescribe all their medications. Therefore it is in this age group, and also adults with Type 1 or complex diabetes that attend specialist services not participating in the NDA, where lack of data integration is most likely to result in a slightly deficient ‘whole systems’ view. Furthermore, for under-17s, the age cut-off for the QOF GP incentive scheme means that there is no financial value to the practice in replicating results from external services. Nonetheless, because less than 10% of all people with Type 1 diabetes, and less than 1% of people with diabetes in general are under 17years, the overall impact on population level NDA results is minimal.
National Diabetes Audit 2012-2013 Report 1: Care Processes and Treatment Targets – NHS Wirral CCGCopyright © 2014, The Health and Social Care Information Centre, National Diabetes Audit. All rights reserved.
4
Total number of registrations Percentage of the populationᵃ
All diabetesᵇ Type 1 Type 2 All diabetesᵇ Type 1 Type 2
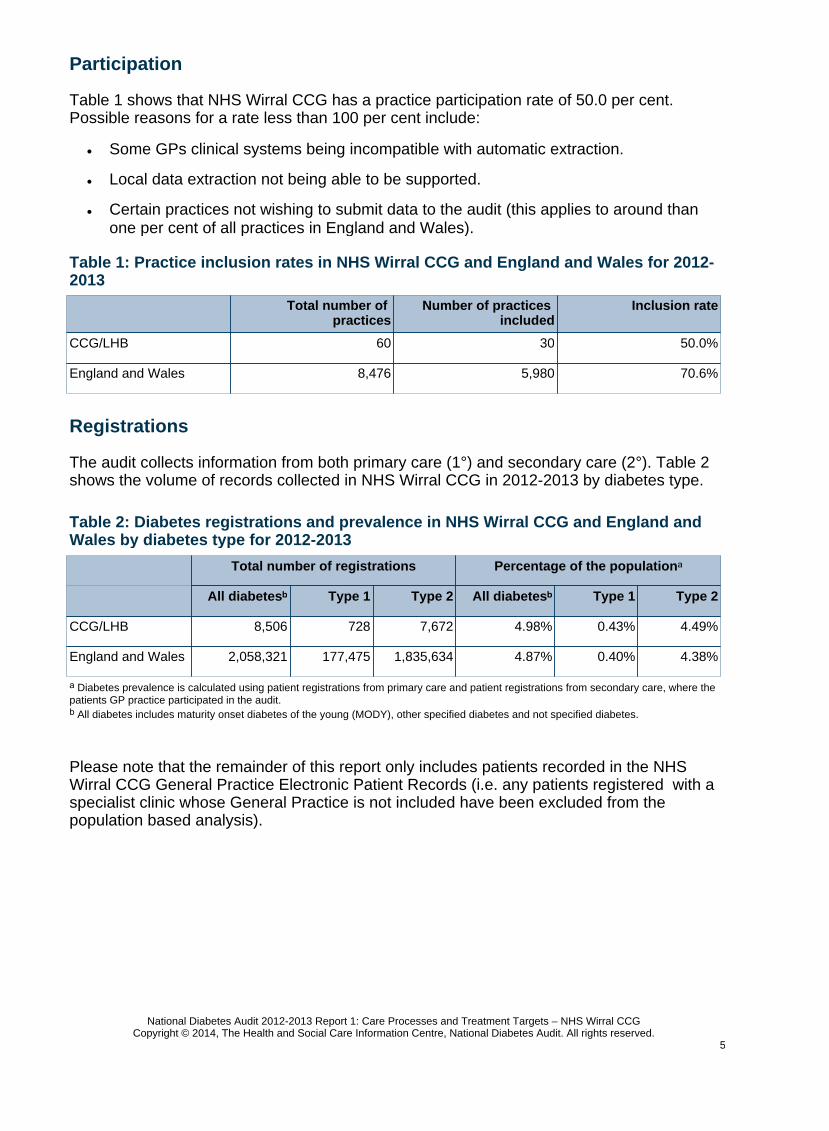
CCG/LHB 8,506 728 7,672 4.98% 0.43% 4.49%
England and Wales 2,058,321 177,475 1,835,634 4.87% 0.40% 4.38%
Total number of practices
Number of practices included
Inclusion rate
CCG/LHB 60 30 50.0%
England and Wales 8,476 5,980 70.6%
Participation
Table 2: Diabetes registrations and prevalence in NHS Wirral CCG and England and Wales by diabetes type for 2012-2013
Registrations
ᵃ Diabetes prevalence is calculated using patient registrations from primary care and patient registrations from secondary care, where the patients GP practice participated in the audit.ᵇ All diabetes includes maturity onset diabetes of the young (MODY), other specified diabetes and not specified diabetes.
Table 1: Practice inclusion rates in NHS Wirral CCG and England and Wales for 2012-2013
Table 1 shows that NHS Wirral CCG has a practice participation rate of 50.0 per cent. Possible reasons for a rate less than 100 per cent include:
• Some GPs clinical systems being incompatible with automatic extraction.
• Local data extraction not being able to be supported.
• Certain practices not wishing to submit data to the audit (this applies to around than one per cent of all practices in England and Wales).
The audit collects information from both primary care (1°) and secondary care (2°). Table 2 shows the volume of records collected in NHS Wirral CCG in 2012-2013 by diabetes type.
Please note that the remainder of this report only includes patients recorded in the NHS Wirral CCG General Practice Electronic Patient Records (i.e. any patients registered with a specialist clinic whose General Practice is not included have been excluded from the population based analysis).
National Diabetes Audit 2012-2013 Report 1: Care Processes and Treatment Targets – NHS Wirral CCGCopyright © 2014, The Health and Social Care Information Centre, National Diabetes Audit. All rights reserved.
5
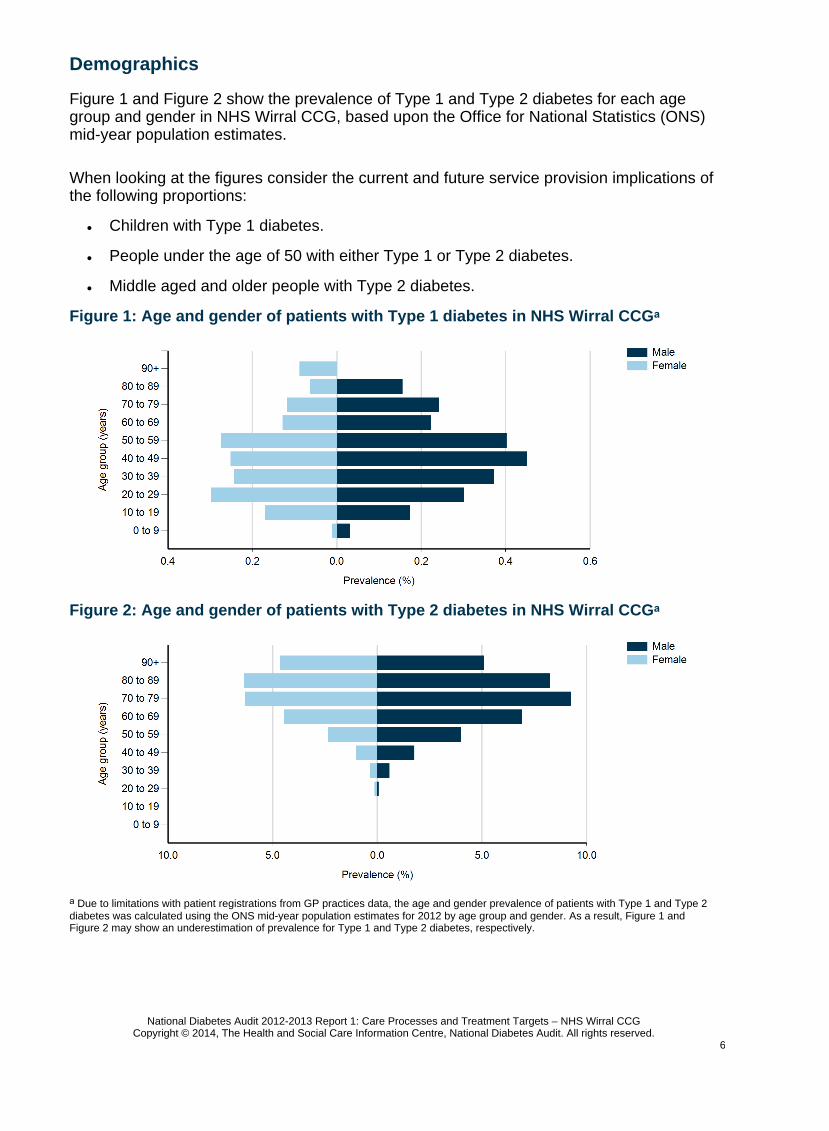
Figure 1: Age and gender of patients with Type 1 diabetes in NHS Wirral CCGᵃ
Figure 2: Age and gender of patients with Type 2 diabetes in NHS Wirral CCGᵃ
ᵃ Due to limitations with patient registrations from GP practices data, the age and gender prevalence of patients with Type 1 and Type 2 diabetes was calculated using the ONS mid-year population estimates for 2012 by age group and gender. As a result, Figure 1 and Figure 2 may show an underestimation of prevalence for Type 1 and Type 2 diabetes, respectively.
Demographics
Figure 1 and Figure 2 show the prevalence of Type 1 and Type 2 diabetes for each age group and gender in NHS Wirral CCG, based upon the Office for National Statistics (ONS) mid-year population estimates.
• Children with Type 1 diabetes.
• People under the age of 50 with either Type 1 or Type 2 diabetes.
• Middle aged and older people with Type 2 diabetes.
When looking at the figures consider the current and future service provision implications of the following proportions:
National Diabetes Audit 2012-2013 Report 1: Care Processes and Treatment Targets – NHS Wirral CCGCopyright © 2014, The Health and Social Care Information Centre, National Diabetes Audit. All rights reserved.
6
Care Processes
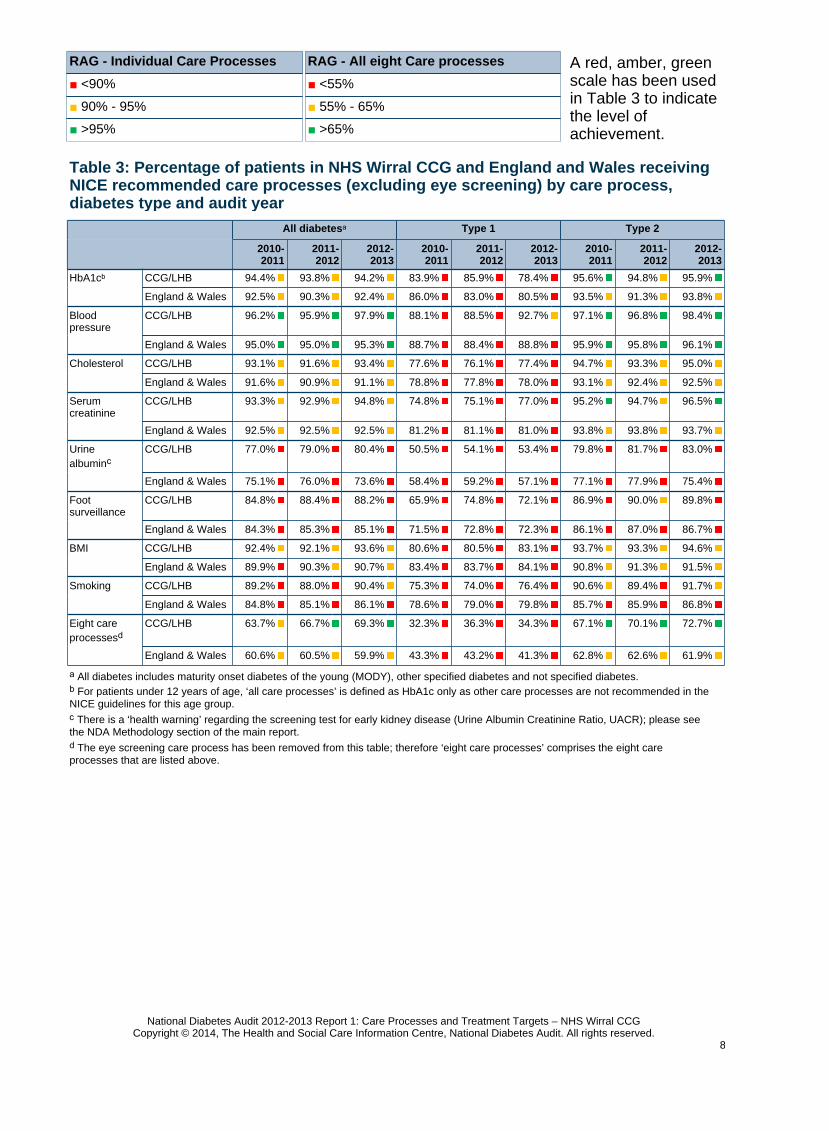
Table 3 shows the completion rates for eight of the nine NICE recommended care processes in NHS Wirral CCG and in England and Wales, as eye screening is not included in this year’s analysis. Inspecting the table will enable you to see how NHS Wirral CCG is performing relative to the rest of England and Wales and to the absolute standard of 100 per cent. For a comparison of care process completion amongst every CCG/LHB, please see the 2012-2013 national report supporting documents, which are available on the NDA website:
It is recommended to consider the variation for each of the eight NICE recommended care processes. An action plan might include a focused strategy to improve one or more particularly poor care process. In 2012-2013, urine albumin was the most poorly recorded care process in NHS Wirral CCG.
www.hscic.gov.uk/nda
All patients aged 12 years and over should receive all nine of the NICE recommended care processes. These are the annual checks for:
• The effectiveness of diabetes treatment; HbA1c.
• Cardiovascular risk factors; blood pressure (BP), serum cholesterol, body mass index (BMI) and smoking.
• Emergence of early complications; urine albumin/serum creatinine (kidney surveillance), eye screening and foot surveillance.
The number of people with diabetes recorded in electronic patient records as having eye screening is not reported this year. To improve alignment with NICE guidelines, a revised Read code set of terms describing digital eye screening was used. This identified that variation in the use of terminology and its impact on the consistency of data extraction from electronic clinical records rendered it unreliable as a measure of this care process. The NHS Diabetic Eye Screening Programme (NHS DESP) records every digital eye screening and we believe that its records should now be used as the preferred measure for this annual care process. Presently this is reported only nationally. The NHS DESP data are available on the NHS England website:
www.england.nhs.uk/statistics/statistical-work-areas/integrated-performance-measures-monitoring/diabetes-data/
Please note there is a 'health warning' regarding the screening test for early kidney disease (Urine Albumin Creatinine Ration, UACR); please see the NDA Methodology section of the main report.
National Diabetes Audit 2012-2013 Report 1: Care Processes and Treatment Targets – NHS Wirral CCGCopyright © 2014, The Health and Social Care Information Centre, National Diabetes Audit. All rights reserved.
7
RAG - Individual Care Processes
■ <90%
■ 90% - 95%
■ >95%
All diabetesᵃ Type 1 Type 2
2010-2011
2011-2012
2012-2013
2010-2011
2011-2012
2012-2013
2010-2011
2011-2012
2012-2013
HbA1cᵇ CCG/LHB 94.4% 93.8% 94.2% 83.9% 85.9% 78.4% 95.6% 94.8% 95.9%
England & Wales 92.5% 90.3% 92.4% 86.0% 83.0% 80.5% 93.5% 91.3% 93.8%
Blood pressure
CCG/LHB 96.2% 95.9% 97.9% 88.1% 88.5% 92.7% 97.1% 96.8% 98.4%
England & Wales 95.0% 95.0% 95.3% 88.7% 88.4% 88.8% 95.9% 95.8% 96.1%
Cholesterol CCG/LHB 93.1% 91.6% 93.4% 77.6% 76.1% 77.4% 94.7% 93.3% 95.0%
England & Wales 91.6% 90.9% 91.1% 78.8% 77.8% 78.0% 93.1% 92.4% 92.5%
Serum creatinine
CCG/LHB 93.3% 92.9% 94.8% 74.8% 75.1% 77.0% 95.2% 94.7% 96.5%
England & Wales 92.5% 92.5% 92.5% 81.2% 81.1% 81.0% 93.8% 93.8% 93.7%
Urine albuminᶜ
CCG/LHB 77.0% 79.0% 80.4% 50.5% 54.1% 53.4% 79.8% 81.7% 83.0%
England & Wales 75.1% 76.0% 73.6% 58.4% 59.2% 57.1% 77.1% 77.9% 75.4%
Foot surveillance
CCG/LHB 84.8% 88.4% 88.2% 65.9% 74.8% 72.1% 86.9% 90.0% 89.8%
England & Wales 84.3% 85.3% 85.1% 71.5% 72.8% 72.3% 86.1% 87.0% 86.7%
BMI CCG/LHB 92.4% 92.1% 93.6% 80.6% 80.5% 83.1% 93.7% 93.3% 94.6%
England & Wales 89.9% 90.3% 90.7% 83.4% 83.7% 84.1% 90.8% 91.3% 91.5%
Smoking CCG/LHB 89.2% 88.0% 90.4% 75.3% 74.0% 76.4% 90.6% 89.4% 91.7%
England & Wales 84.8% 85.1% 86.1% 78.6% 79.0% 79.8% 85.7% 85.9% 86.8%
Eight care processesᵈ
CCG/LHB 63.7% 66.7% 69.3% 32.3% 36.3% 34.3% 67.1% 70.1% 72.7%
England & Wales 60.6% 60.5% 59.9% 43.3% 43.2% 41.3% 62.8% 62.6% 61.9%
Table 3: Percentage of patients in NHS Wirral CCG and England and Wales receiving NICE recommended care processes (excluding eye screening) by care process, diabetes type and audit year
ᵃ All diabetes includes maturity onset diabetes of the young (MODY), other specified diabetes and not specified diabetes.ᵇ For patients under 12 years of age, ‘all care processes’ is defined as HbA1c only as other care processes are not recommended in the NICE guidelines for this age group.
A red, amber, green scale has been used in Table 3 to indicate the level of achievement.
ᶜ There is a ‘health warning’ regarding the screening test for early kidney disease (Urine Albumin Creatinine Ratio, UACR); please see the NDA Methodology section of the main report.
ᵈ The eye screening care process has been removed from this table; therefore ‘eight care processes’ comprises the eight care processes that are listed above.
RAG - All eight Care processes
■ <55%
■ 55% - 65%
■ >65%
National Diabetes Audit 2012-2013 Report 1: Care Processes and Treatment Targets – NHS Wirral CCGCopyright © 2014, The Health and Social Care Information Centre, National Diabetes Audit. All rights reserved.
8

Although NHS Wirral CCG is in the top 25 per cent of all CCG/LHBs for the eight care processes combined (Q4), there will still be areas of underperformance, either relative or absolute. The improvements in care processes seen in 2003-2010 have largely levelled out across England and Wales. Now it is time for innovation to set the benchmark higher. Because diabetes is such a major contributor to premature mortality and disability the successful CCG/LHBs will lead the field in improving their population health over the next decade.
The care process quartile rankings for NHS Wirral CCG are shown in Table 5. Q1 depicts the bottom 25 per cent and Q4 depicts the top 25 per cent, as compared to all CCG/LHBs.
Type 1 Type 2
Under 40 40 to 64 65 to 79 80 and over
Under 40 40 to 64 65 to 79 80 and over
HbA1cᵃ CCG/LHB 66.4% 87.4% 84.0% 76.5% 89.4% 94.8% 97.2% 96.5%
England & Wales 68.9% 88.0% 93.5% 92.4% 85.7% 92.7% 95.6% 93.6%
Blood pressure
CCG/LHB 85.3% 97.1% 97.5% 100.0% 94.5% 97.7% 99.3% 98.9%
England & Wales 81.3% 93.0% 96.9% 95.8% 89.3% 95.0% 97.5% 96.8%
Cholesterol CCG/LHB 64.8% 85.0% 87.7% 76.5% 85.4% 93.9% 97.2% 93.3%
England & Wales 64.0% 86.1% 92.6% 89.5% 82.5% 91.6% 94.6% 91.7%
Serum creatinine
CCG/LHB 65.2% 83.9% 87.7% 76.5% 87.4% 95.0% 98.1% 97.5%
England & Wales 68.5% 88.1% 94.0% 93.2% 84.8% 92.3% 95.6% 94.6%
Urine albuminᵇ
CCG/LHB 37.4% 61.6% 70.4% 64.7% 60.3% 79.4% 87.5% 84.2%
England & Wales 43.7% 63.0% 76.4% 75.0% 59.2% 72.0% 79.6% 77.0%
Foot surveillance
CCG/LHB 59.0% 80.1% 80.2% 82.4% 73.9% 87.3% 92.8% 91.0%
England & Wales 59.3% 79.4% 87.6% 83.8% 73.8% 84.8% 90.1% 85.5%
BMI CCG/LHB 78.0% 85.9% 86.4% 94.1% 88.4% 94.4% 96.4% 91.6%
England & Wales 77.6% 87.9% 91.9% 85.5% 86.4% 91.4% 93.6% 87.4%
Smoking CCG/LHB 75.1% 78.3% 75.3% 64.7% 88.4% 90.7% 92.8% 92.3%
England & Wales 75.8% 82.1% 84.8% 79.4% 84.1% 86.8% 88.3% 83.3%
All eight care processesᶜ
CCG/LHB 22.1% 41.6% 45.7% 41.2% 45.7% 69.0% 78.5% 71.2%
England & Wales 29.1% 47.7% 59.9% 54.4% 46.3% 59.2% 66.7% 59.8%
ᵇ There is a ‘health warning’ regarding the screening test for early kidney disease (Urine Albumin Creatinine Ratio, UACR); please see the NDA Methodology section of the main report.
ᶜ The eye screening care process has been removed from this table; therefore ‘eight care processes’ comprises the eight care processes that are listed above.
ᵃ For patients under 12 years of age, ‘all care processes’ is defined as HbA1c only as other care processes are not recommended in the NICE guidelines for this age group.
Table 4: Percentage of patients in NHS Wirral CCG and England and Wales receiving NICE recommended care processes (excluding eye screening) by care process, diabetes type and age group
National Diabetes Audit 2012-2013 Report 1: Care Processes and Treatment Targets – NHS Wirral CCGCopyright © 2014, The Health and Social Care Information Centre, National Diabetes Audit. All rights reserved.
9

Table 5: All diabetesᵃ patients care process quartile rankings for NHS Wirral CCG in 2012-2013Care Process QuartileᵇHbA1cᶜ Q4
Blood pressure Q4
Cholesterol Q4
Serum creatinine Q4
Urine albuminᵈ Q3
Foot surveillance Q4
BMI Q4
Smoking Q4
Eight care processesᵉ Q4
Figure 3: Percentage of patients receiving the eight care processesᵃ for all GP practices within NHS Wirral CCG
Figure 3 shows the spread of the percentage of patients receiving the eight care processes combined for all GP practices within NHS Wirral CCG. All CCG/LHBs could improve immediately by helping the weakest performing practices to do at least as well as the average.
Alternatively, or in addition, NHS Wirral CCG may consider a programme to encourage innovation within all the GP practices.
ᵃ All diabetes includes maturity onset diabetes of the young (MODY), other specified diabetes and not specified diabetes.ᵇ Q1 depicts the bottom 25 per cent and Q4 depicts the top 25 per cent, as compared to all CCG/LHBs.ᶜ For patients under 12 years of age, ‘all care processes’ is defined as HbA1c only as other care processes are not recommended in the NICE guidelines for this age group.
- Average value for NHS Wirral CCG.ᵃ The eight care processes are those that are listed in Table 3 (i.e. eye screening is not included in this analysis).
ᵉ The eye screening care process has been removed from this table; therefore ‘eight care processes’ comprises the eight care processes that are listed above.
ᵈ There is a ‘health warning’ regarding the screening test for early kidney disease (Urine Albumin Creatinine Ratio, UACR); please see the NDA Methodology section of the main report.
National Diabetes Audit 2012-2013 Report 1: Care Processes and Treatment Targets – NHS Wirral CCGCopyright © 2014, The Health and Social Care Information Centre, National Diabetes Audit. All rights reserved.
10

Figure 4: Percentage of all patients in NHS Wirral CCG receiving NICE recommended care processes (excluding eye screening) by care process and audit year
Figure 5: Percentage of all patients in NHS Wirral CCG receiving the eight NICE recommended care processesᵃ by audit year and diabetes type
The completion rates for each individual care process (excluding eye screening) and for the eight care processes combined in NHS Wirral CCG are shown as bar charts in Figure 4 and Figure 5, respectively.
ᵃ For patients under 12 years of age, ‘all care processes’ is defined as HbA1c only as other care processes are not recommended in the NICE guidelines for this age group.
ᵃ The eight NICE recommended care processes are those that are listed in Table 3 (i.e. eye screening is not included in this analysis).ᵇ All diabetes includes maturity onset diabetes of the young (MODY), other specified diabetes and not specified diabetes.
ᵇ There is a ‘health warning’ regarding the screening test for early kidney disease (Urine Albumin Creatinine Ratio, UACR); please see the NDA Methodology section of the main report.
National Diabetes Audit 2012-2013 Report 1: Care Processes and Treatment Targets – NHS Wirral CCGCopyright © 2014, The Health and Social Care Information Centre, National Diabetes Audit. All rights reserved.
11
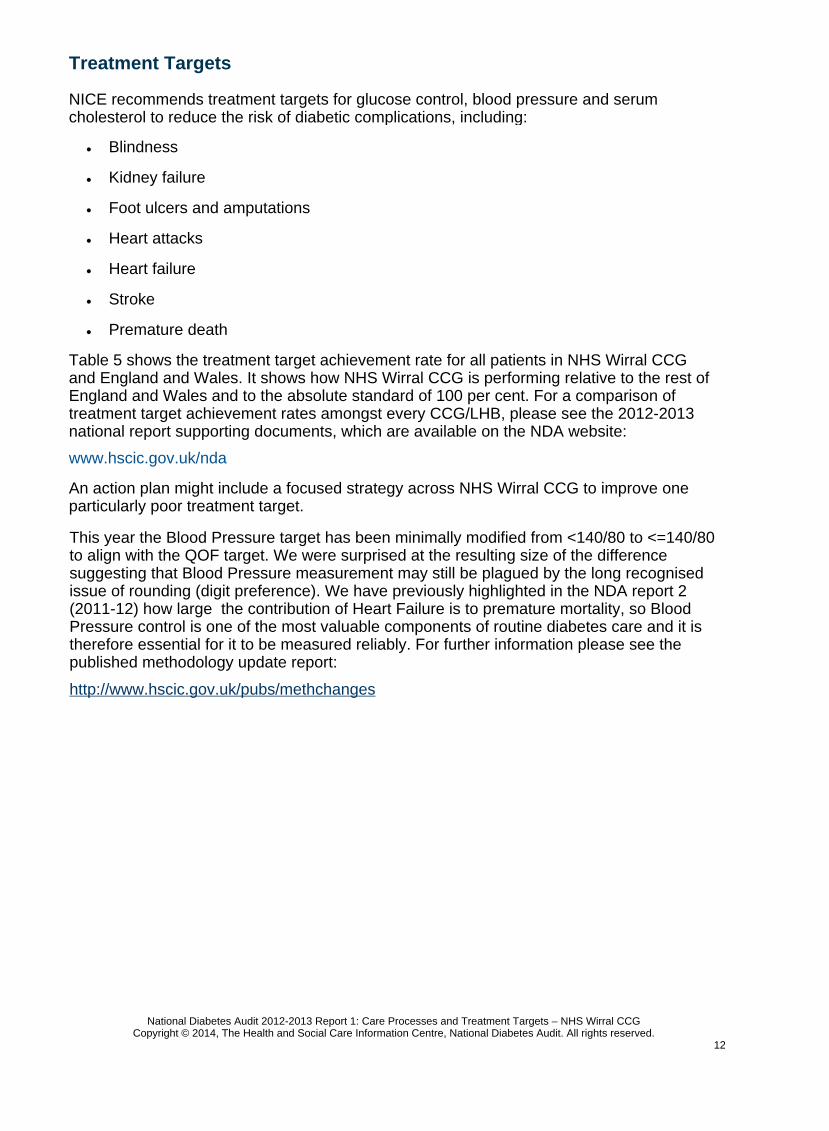
Treatment Targets
NICE recommends treatment targets for glucose control, blood pressure and serum cholesterol to reduce the risk of diabetic complications, including:
Table 5 shows the treatment target achievement rate for all patients in NHS Wirral CCG and England and Wales. It shows how NHS Wirral CCG is performing relative to the rest of England and Wales and to the absolute standard of 100 per cent. For a comparison of treatment target achievement rates amongst every CCG/LHB, please see the 2012-2013 national report supporting documents, which are available on the NDA website:
An action plan might include a focused strategy across NHS Wirral CCG to improve one particularly poor treatment target.
www.hscic.gov.uk/nda
• Blindness
• Kidney failure
• Foot ulcers and amputations
• Heart attacks
• Heart failure
• Stroke
• Premature death
This year the Blood Pressure target has been minimally modified from <140/80 to <=140/80 to align with the QOF target. We were surprised at the resulting size of the difference suggesting that Blood Pressure measurement may still be plagued by the long recognised issue of rounding (digit preference). We have previously highlighted in the NDA report 2 (2011-12) how large the contribution of Heart Failure is to premature mortality, so Blood Pressure control is one of the most valuable components of routine diabetes care and it is therefore essential for it to be measured reliably. For further information please see the published methodology update report:
http://www.hscic.gov.uk/pubs/methchanges
National Diabetes Audit 2012-2013 Report 1: Care Processes and Treatment Targets – NHS Wirral CCGCopyright © 2014, The Health and Social Care Information Centre, National Diabetes Audit. All rights reserved.
12
All diabetesᵃ Type 1 Type 2
2010-11 2011-12 2012-13 2010-11 2011-12 2012-13 2010-11 2011-12 2012-13
HbA1c <48mmol/mol (6.5%)ᵇ
CCG/LHB 28.9% 29.7% 28.4% 5.5% 6.4% 6.3% 30.9% 31.7% 30.0%
England & Wales 24.8% 24.7% 25.1% 6.8% 6.5% 7.5% 26.4% 26.2% 26.4%
HbA1c ≤58mmol/mol (7.5%)ᵇ
CCG/LHB 71.6% 69.7% 69.7% 26.7% 23.0% 24.2% 75.7% 73.8% 73.2%
England & Wales 63.3% 62.7% 62.2% 28.1% 27.0% 27.3% 66.5% 65.8% 64.8%
HbA1c ≤86mmol/mol (10.0%)ᵇ
CCG/LHB 94.5% 92.8% 92.7% 81.1% 77.8% 75.6% 95.7% 94.2% 94.0%
England & Wales 92.1% 91.9% 92.4% 82.4% 81.9% 83.0% 93.0% 92.8% 93.1%
BP ≤140/80ᶜ CCG/LHB 67.2% 69.5% 70.2% 71.3% 74.6% 75.0% 66.8% 69.1% 70.0%
England & Wales 62.0% 67.1% 69.0% 68.8% 72.2% 73.4% 61.4% 66.7% 68.7%
Cholesterol <4mmol/L
CCG/LHB 41.2% 39.4% 39.1% 34.2% 31.7% 30.0% 41.8% 40.1% 39.9%
England & Wales 40.7% 40.4% 39.6% 30.4% 29.7% 28.7% 41.6% 41.3% 40.5%
Cholesterol <5mmol/L
CCG/LHB 78.1% 76.9% 76.4% 75.5% 70.9% 71.5% 78.4% 77.4% 76.8%
England & Wales 77.6% 77.0% 76.2% 72.0% 71.1% 70.2% 78.1% 77.5% 76.8%
Meet all treatment targetsᵈ
CCG/LHB 41.0% 41.2% 41.6% 16.4% 14.2% 16.1% 43.0% 43.3% 43.4%
England & Wales 33.7% 35.9% 35.9% 16.5% 16.5% 16.2% 35.2% 37.5% 37.4%
ᵃ All diabetes includes maturity onset diabetes of the young (MODY), other specified diabetes and not specified diabetes.ᵇ For patients under 12 years of age, 'all treatment targets' is defined as HbA1c only as other treatment targets are not recommended in the NICE guidelines for this age group.ᶜ BP ≤140/80 does not take into account whether or not patients have eye, kidney or vascular disease.ᵈ Where patients have achieved HbA1c ≤58mmol/mol, cholesterol <5mmol/L and the blood pressure target.
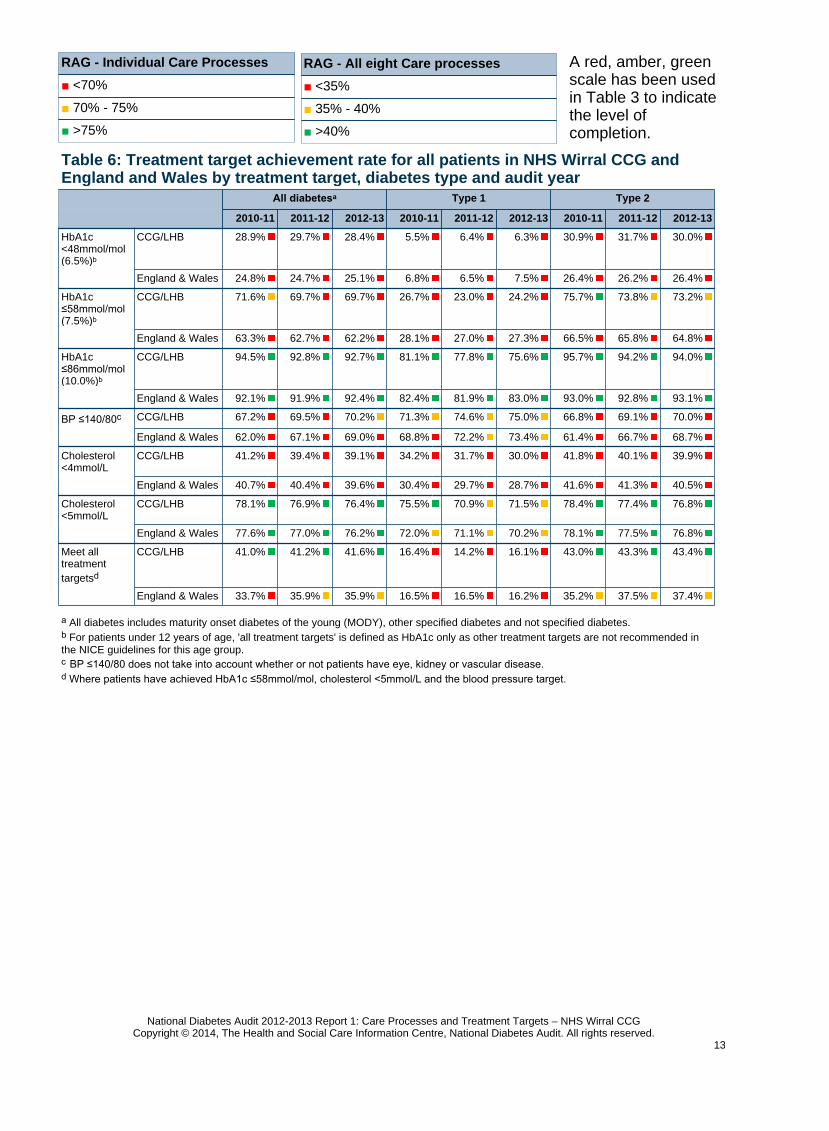
Table 6: Treatment target achievement rate for all patients in NHS Wirral CCG and England and Wales by treatment target, diabetes type and audit year
RAG - Individual Care Processes
■ <70%
■ 70% - 75%
■ >75%
A red, amber, green scale has been used in Table 3 to indicate the level of completion.
RAG - All eight Care processes
■ <35%
■ 35% - 40%
■ >40%
National Diabetes Audit 2012-2013 Report 1: Care Processes and Treatment Targets – NHS Wirral CCGCopyright © 2014, The Health and Social Care Information Centre, National Diabetes Audit. All rights reserved.
13
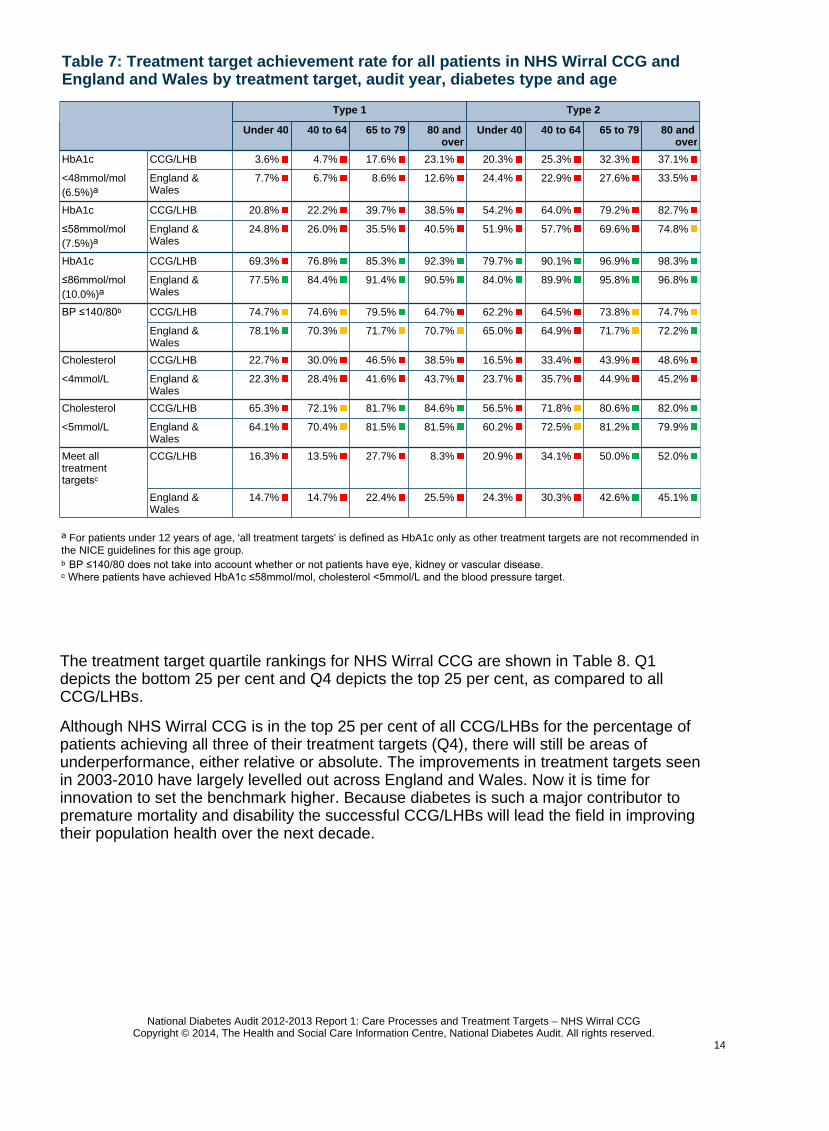
Although NHS Wirral CCG is in the top 25 per cent of all CCG/LHBs for the percentage of patients achieving all three of their treatment targets (Q4), there will still be areas of underperformance, either relative or absolute. The improvements in treatment targets seen in 2003-2010 have largely levelled out across England and Wales. Now it is time for innovation to set the benchmark higher. Because diabetes is such a major contributor to premature mortality and disability the successful CCG/LHBs will lead the field in improving their population health over the next decade.
The treatment target quartile rankings for NHS Wirral CCG are shown in Table 8. Q1 depicts the bottom 25 per cent and Q4 depicts the top 25 per cent, as compared to all CCG/LHBs.
Table 7: Treatment target achievement rate for all patients in NHS Wirral CCG and England and Wales by treatment target, audit year, diabetes type and age
ᵃ For patients under 12 years of age, 'all treatment targets' is defined as HbA1c only as other treatment targets are not recommended in the NICE guidelines for this age group.ᵇ BP ≤140/80 does not take into account whether or not patients have eye, kidney or vascular disease.ᶜ Where patients have achieved HbA1c ≤58mmol/mol, cholesterol <5mmol/L and the blood pressure target.
Type 1 Type 2
Under 40 40 to 64 65 to 79 80 and over
Under 40 40 to 64 65 to 79 80 and over
HbA1c CCG/LHB 3.6% 4.7% 17.6% 23.1% 20.3% 25.3% 32.3% 37.1%
<48mmol/mol (6.5%)ᵃ
England & Wales
7.7% 6.7% 8.6% 12.6% 24.4% 22.9% 27.6% 33.5%
HbA1c CCG/LHB 20.8% 22.2% 39.7% 38.5% 54.2% 64.0% 79.2% 82.7%
≤58mmol/mol (7.5%)ᵃ
England & Wales
24.8% 26.0% 35.5% 40.5% 51.9% 57.7% 69.6% 74.8%
HbA1c CCG/LHB 69.3% 76.8% 85.3% 92.3% 79.7% 90.1% 96.9% 98.3%
≤86mmol/mol (10.0%)ᵃ
England & Wales
77.5% 84.4% 91.4% 90.5% 84.0% 89.9% 95.8% 96.8%
BP ≤140/80ᵇ CCG/LHB 74.7% 74.6% 79.5% 64.7% 62.2% 64.5% 73.8% 74.7%
England & Wales
78.1% 70.3% 71.7% 70.7% 65.0% 64.9% 71.7% 72.2%
Cholesterol CCG/LHB 22.7% 30.0% 46.5% 38.5% 16.5% 33.4% 43.9% 48.6%
<4mmol/L England & Wales
22.3% 28.4% 41.6% 43.7% 23.7% 35.7% 44.9% 45.2%
Cholesterol CCG/LHB 65.3% 72.1% 81.7% 84.6% 56.5% 71.8% 80.6% 82.0%
<5mmol/L England & Wales
64.1% 70.4% 81.5% 81.5% 60.2% 72.5% 81.2% 79.9%
Meet all treatment targetsᶜ
CCG/LHB 16.3% 13.5% 27.7% 8.3% 20.9% 34.1% 50.0% 52.0%
England & Wales
14.7% 14.7% 22.4% 25.5% 24.3% 30.3% 42.6% 45.1%
National Diabetes Audit 2012-2013 Report 1: Care Processes and Treatment Targets – NHS Wirral CCGCopyright © 2014, The Health and Social Care Information Centre, National Diabetes Audit. All rights reserved.
14

Table 8: All diabetesᵃ patients treatment target quartile rankings for NHS Wirral CCG
Care Process QuartileᵇHbA1c <48mmol/mol (6.5%)ᶜ Q3
HbA1c ≤58mmol/mol (7.5%)ᶜ Q4
HbA1c ≤86mmol/mol (10.0%)ᶜ Q3
BP ≤140/80ᵈ Q3
Cholesterol <4mmol/L Q2
Cholesterol <5mmol/L Q3
Meet all treatment targetsᵉ Q4
Figure 6: Percentage of patients achieving HbA1c ≤58mmol/mol, cholesterol <5mmol/L and blood pressure ≤140/80 for all GP practices within NHS Wirral CCG
Figure 6 shows the spread of the percentage of patients achieving all three of their treatment targets for all GP practices within NHS Wirral CCG. All CCG/LHBs could improve immediately by helping the weakest performing practices to do at least as well as the average.
Alternatively, or in addition, NHS Wirral CCG may consider a programme to encourage innovation within the GP practices and in NHS Wirral CCG as a whole.
ᵃ All diabetes includes maturity onset diabetes of the young (MODY), other specified diabetes and not specified diabetes.ᵇ Q1 depicts the bottom 25 per cent and Q4 depicts the top 25 per cent, as compared to all CCG/LHBs.ᶜ For patients under 12 years of age, 'all treatment targets' is defined as HbA1c only as other treatment targets are not recommended in the NICE guidelines for this age group.ᵈ BP ≤140/80 does not take into account whether or not patients have eye, kidney or vascular disease.ᵉ Where patients have achieved HbA1c ≤58mmol/mol, cholesterol <5mmol/L and the blood pressure target.
- Average value for NHS Wirral CCG.
National Diabetes Audit 2012-2013 Report 1: Care Processes and Treatment Targets – NHS Wirral CCGCopyright © 2014, The Health and Social Care Information Centre, National Diabetes Audit. All rights reserved.
15

Figure 7: Percentage of all patients in NHS Wirral CCG achieving treatment targets by treatment target and audit year
Figure 8: Percentage of all patients in NHS Wirral CCG achieving HbA1c ≤58mmol/mol, cholesterol <5mmol/L and their relevant blood pressure target by audit year and diabetes type
The achievement rates in NHS Wirral CCG over the past three years for each individual treatment target and for the percentage of patients achieving all three of their treatment targets are shown as bar charts in Figure 7 and Figure 8, respectively.
ᵃ For patients under 12 years of age, 'all treatment targets' is defined as HbA1c only as other treatment targets are not recommended in the NICE guidelines for this age group.ᵇ BP ≤140/80 does not take into account whether or not patients have eye, kidney or vascular disease.
ᵃ All diabetes includes maturity onset diabetes of the young (MODY), other specified diabetes and not specified diabetes.
National Diabetes Audit 2012-2013 Report 1: Care Processes and Treatment Targets – NHS Wirral CCGCopyright © 2014, The Health and Social Care Information Centre, National Diabetes Audit. All rights reserved.
16
Number diagnosed
Offered Attended Offered or attendedᵃ
All diabetesᵇ n CCG/LHB 822 165 0 165
England & Wales 196,675 31,336 6,740 36,270
% CCG/LHB n/a 20.1% 0.0% 20.1%
England & Wales n/a 15.9% 3.4% 18.4%
Type 1 n CCG/LHB 27 * 0 *
England & Wales 6,847 264 60 320
% CCG/LHB n/a * 0.0% *
England & Wales n/a 3.9% 0.9% 4.7%
Type 2 n CCG/LHB 774 163 0 163
England & Wales 182,045 30,409 6,569 35,201
% CCG/LHB n/a 21.1% 0.0% 21.1%
England & Wales n/a 16.7% 3.6% 19.3%
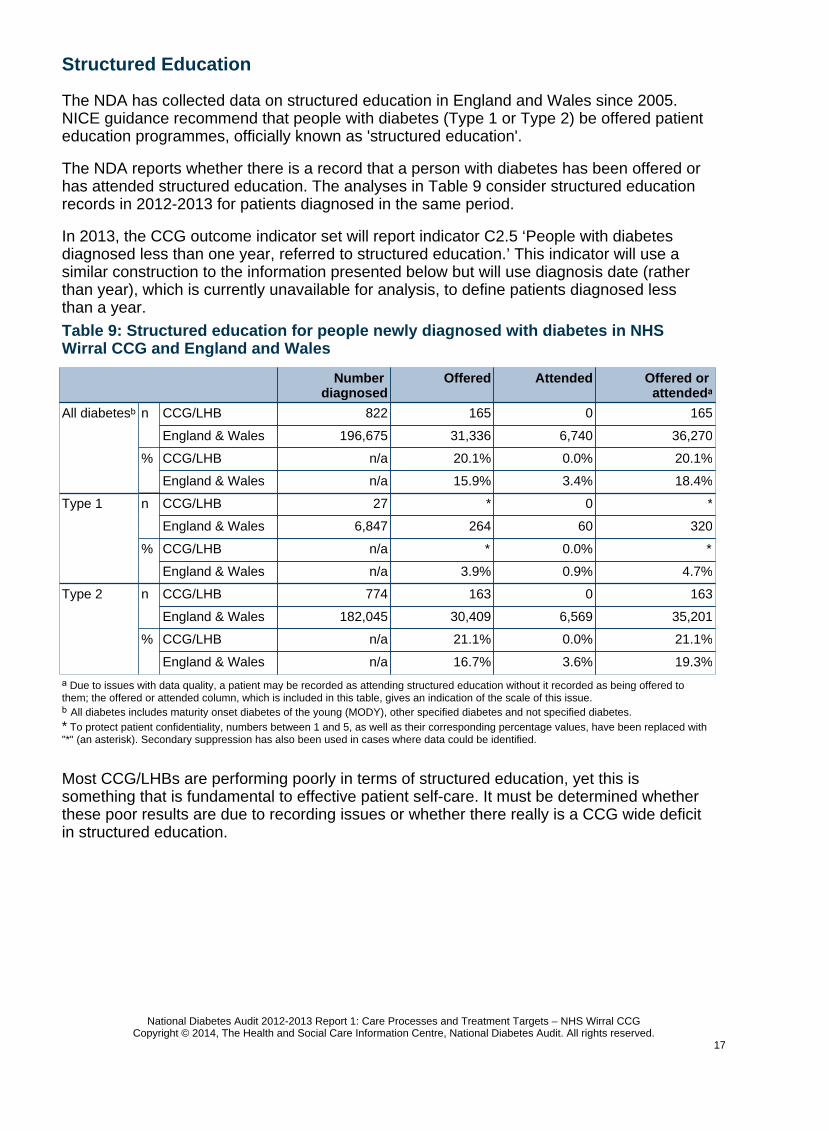
Structured Education
The NDA has collected data on structured education in England and Wales since 2005. NICE guidance recommend that people with diabetes (Type 1 or Type 2) be offered patient education programmes, officially known as 'structured education'.
The NDA reports whether there is a record that a person with diabetes has been offered or has attended structured education. The analyses in Table 9 consider structured education records in 2012-2013 for patients diagnosed in the same period.
In 2013, the CCG outcome indicator set will report indicator C2.5 ‘People with diabetes diagnosed less than one year, referred to structured education.’ This indicator will use a similar construction to the information presented below but will use diagnosis date (rather than year), which is currently unavailable for analysis, to define patients diagnosed less than a year.
Table 9: Structured education for people newly diagnosed with diabetes in NHS Wirral CCG and England and Wales
Most CCG/LHBs are performing poorly in terms of structured education, yet this is something that is fundamental to effective patient self-care. It must be determined whether these poor results are due to recording issues or whether there really is a CCG wide deficit in structured education.
ᵃ Due to issues with data quality, a patient may be recorded as attending structured education without it recorded as being offered to them; the offered or attended column, which is included in this table, gives an indication of the scale of this issue.ᵇ All diabetes includes maturity onset diabetes of the young (MODY), other specified diabetes and not specified diabetes.* To protect patient confidentiality, numbers between 1 and 5, as well as their corresponding percentage values, have been replaced with "*" (an asterisk). Secondary suppression has also been used in cases where data could be identified.
National Diabetes Audit 2012-2013 Report 1: Care Processes and Treatment Targets – NHS Wirral CCGCopyright © 2014, The Health and Social Care Information Centre, National Diabetes Audit. All rights reserved.
17