National Diabetes Audit, 2017-18 Report 2a: Complications ...
36
National Diabetes Audit, 2017-18 Report 2a: Complications and Mortality (complications of diabetes) England and Wales • V0.22 • 7 March 2017
Transcript of National Diabetes Audit, 2017-18 Report 2a: Complications ...

National Diabetes Audit, 2017-18
Report 2a: Complications and Mortality (complications of diabetes)
England and Wales
• V0.22
• 7 March 2017

Introduction
2
• This report from the National Diabetes Audit (NDA)
covers complications of diabetes. It does not include
diabetic eye disease or hypoglycaemia because
presently there are no reliable records that the NDA can
access. Most other cardiovascular and diabetes specific
complications are included.
• The accompanying Report 2b presents a new statistical
analysis of person based demographic and diabetes
related factors associated with adverse cardiovascular
outcomes and diabetic complications. It culminates in
case-mix adjusted analysis at Clinical Commissioning
Group (CCG) and Local Health Board (LHB) level.

Aims and Objectives
3
• To monitor progress towards reducing the prevalence of long term diabetes
complications and additional mortality.
• To highlight variation in outcomes between health economies and stimulate
service improvements.
The report has been divided into three main sections. Each section aims to
address overall rates, time trends, geographical variation, hospital utilisation.
1. Cardiovascular Complications
– Angina,
– Myocardial Infarction (MI),
– Heart failure,
– Stroke.
2. Diabetes Specific Complications
– End Stage Kidney Disease (Renal Replacement Therapy, RRT),
– Amputations,
– Diabetic Ketoacidosis (DKA) is not considered in this report, but is investigated in more detail than previously in
Report 2b: Complications and Mortality, that accompanies this report.
3. Mortality
– Causes of death compared to general population,
– Rates of death related to age and type of diabetes.

Key Findings (1)
4
• Diabetes remains responsible for a large number
of additional deaths, with the greatest relative
risk in younger people.
• Deaths in people with diabetes under the age of
80 years are more often due to cardiovascular
disease than in the general population.
• About 1 in 20 people have diabetes, yet people
with diabetes account for one quarter to one third
of hospital admissions for cardiovascular
disease.

Key Findings (2)
5
• The relative risk of cardiovascular disease in
people with diabetes as compared to people
without diabetes remains high.
• The variation in age and sex standardised rates
over time is erratic, suggesting these factors alone
do not adequately describe the differences seen in
admissions.
• The factors influencing diabetes related
admissions have been investigated and published
in ‘National Diabetes Audit, 2017-18, Report 2b’,
which accompanies this report.

1. Cardiovascular
complications

Cardiovascular prevalence
7
Table 1: One year prevalence of cardiovascular complications of diabetes,
England and Wales, 2016-17 audit, complications during 2017-18
Number of people
experiencing the
complication
Prevalence percentage
(not adjusted for the age
and sex structure of the
population)
Number of people
experiencing the
complication
Prevalence percentage
(not adjusted for the age
and sex structure of the
population)
Angina 3,040 1.3 89,415 3.0
Myocardial Infarction 1,250 0.5 24,470 0.8
Heart failure 3,355 1.4 98,945 3.4
Stroke 1,270 0.5 32,540 1.1
Type 1 Type 2 and Other
Complication
From the NDA 2016-17 audit, a total of 240,950 people with Type 1 diabetes,
and 2,937,020 people with Type 2 and other diabetes, were alive on 31st
March 2017 and were included in the analysis of diabetic complications.
Table 1 shows the prevalence of cardiovascular complications based on the
number of people admitted to hospital between 1st April 2017 and 31st March
2018, as recorded in Hospital Episode statistics (HES) or Patient Episode
Database for Wales (PEDW).

Complication ratios – methodology update
8
• The methodology for calculating complication ratios in this report is consistent with the
NDA Complications and Mortality 2015-2016, July 2017 which was amended from that
used previously in NDA Report 2, January 2015: Complications and Mortality for the 2012-
13 audit period.
• When calculating complication ratios in people with diabetes, rates of conditions such as
MI or Stroke are compared with rates of the same conditions in people without diabetes,
the non-diabetic population. This non-diabetic population had previously been defined by
excluding from HES and PEDW data, people with diabetes included in the specific audit
period being reported. However, because NDA ascertainment is always less than 100%,
this approach means that some people in the ‘non-diabetic population’ will actually have
diabetes. Each year participation by practices and specialist services is slightly different so,
to reduce this misclassification, the non-diabetic population in this report has been
identified differently. People with diabetes reported in any NDA period and diagnosed
before the start of the HES and PEDW collection periods have been excluded from HES
and PEDW data.
• We believe that this provides a more accurate picture of relative complication risk in people
with diabetes because those who appear in a previous audit, but not the audit period being
reported, are correctly identified as having diabetes and not placed in the non-diabetic
population. This change in methodology means that complication ratios and
additional risk figures in this report should not be compared directly with figures
from NDA complication and Mortality Reports published before January 2017.

Cardiovascular complication ratios
9
Table 2: Standardised ratios for cardiovascular complications of diabetes,
England and Wales, 2016-17 audit, complications during 2017-18
These ratios compare the prevalence of complications during a one-year
follow-up period for people in the 2016-17 NDA with the prevalence for
people who have never appeared in the NDA.
The risk of cardiovascular complication is approximately 3.5 to 4.5
times as great as that for people with Type 1 diabetes and 2 to 2.5
times as great as that for people with Type 2 and other diabetes.
Complicationa
Type 1 Type 2 and Other
Total Expectedb ObservedStandardised
ratioTotal Expectedb Observed
Standardised
ratio
Angina 796 2,875 361 36,846 86,875 236
Myocardial Infarction 310 1,175 379 11,687 23,715 203
Heart failure 723 3,135 434 40,522 95,555 236
Stroke 375 1,205 322 18,002 31,500 175
a Complications in the financial year following the audit period. b Based on the prevalence in the population who have never appeared in the NDA. This may include people with diabetes who have never appeared in the
NDA. Standardised by age, sex and locality. Expected values are calculated projections and are not suppressed. For definitions, see the Glossary section.

0
50
100
150
200
250
300
350
400
Complication and Audit Year
Angina Heart Failure Myocardial Infarction Stroke
Cardiovascular complication ratios, Type 1
Figure 1: Additional riska of cardiovascular complication among people with
Type 1 diabetes, England and Wales, 2012-13 to 2016-17 audits, complications
during the following yearFluctuations over time may be due
to changing audit participation, or
the standardisation method not
sufficiently accounting for variation.
The additional risk due to Type 1 diabetes appears to have fluctuated over the past five
years. This may be caused by changing audit participation over these years (2012-13:
70.6%; 2013-14: 57.1%; 2014-15: 57.3%; 2015-16: 82.4%; 2016-17: 95.3%) having a
greater impact than previously thought, or it may be due to the standardisation method
not sufficiently accounting for variation.
a The additional risk due to diabetes, based on the standardised ratio for each complication.10

Cardiovascular complication ratios, Type 2 and
other
Figure 2: Additional riska of cardiovascular complication among people with
Type 2 and other diabetes, England and Wales, 2012-13 to 2016-17 audits,
complications during the following year
The additional risk due to Type 2 diabetes appears to have fluctuated over the past five
years. This may be caused by changing audit participation over these years (2012-13:
70.6%; 2013-14: 57.1%; 2014-15: 57.3%; 2015-16: 82.4%; 2016-17: 95.3%) having a
greater impact than previously thought, or it may be due to the standardisation method
not sufficiently accounting for variation.
a The additional risk due to
diabetes, based on the
standardised ratio for each
complication.
0
20
40
60
80
100
120
140
160
180
200
Complication and Audit Year
Angina Heart Failure Myocardial Infarction Stroke
Fluctuations over time may be due
to changing audit participation, or
the standardisation method not
sufficiently accounting for variation.
11

Cardiovascular complication ratios –
locality variationFigure 3 shows the variation in the complication ratios among the CCGs and LHBs of
England and Wales.
This may be due to the standardisation method not sufficiently accounting for key
predictive characteristics outside the control of healthcare. Report 2b, accompanying
this report, investigates this and provides an assessment of whether CCGs and LHBs
are performing as expected.
12
Figure 3: The range of CCG/LHB cardiovascular complication ratios for
people with diabetes, England and Wales, 2016-17 audit, complications during
2017-18

Cardiovascular complications - hospital
admissions Table 3 shows the rate of admission to hospital between 1st April 2017 and 31st
March 2018 for cardiovascular disease in people with diabetes – defined as
individuals who have appeared in the 2016-17 audit.
People with diabetes comprise about 5.5 per cent of the adult population yet
account for around 25-30 per cent of admissions for cardiovascular
complications.
13
Table 3: Number of hospital admissions and NDA related hospital admissions
for cardiovascular complications, England and Wales, 2017-2018 HES/PEDW
Number of all
non emergency
admissions
Number of non
emergency
admissions for
NDA population
Percentage of
non emergency
admissions for
NDA population
Number of all
emergency
admissions
Number of
emergency
admissions for
NDA population
Percentage of
emergency
admissions for
NDA population
Angina 228,135 65,845 28.9 263,345 81,780 31.1
Myocardial Infarction 15,305 3,870 25.3 93,675 23,010 24.6
Heart Failure 135,810 41,025 30.2 421,025 134,520 32.0
Stroke 37,615 8,520 22.7 134,895 30,670 22.7
Complicationa
Non-Emergency Admissions Emergency Admissions
a The complication was not necessarily the primary reason for admission

Cardiovascular hospital bed days
Table 4 shows hospital bed days between 1st April 2017 and 31st March 2018 for
people admitted for cardiovascular disease, for all people, and those with diabetes –
defined as individuals who have appeared in the NDA at any time up to the 2016-17.
audit.
People with diabetes account for a higher proportion of bed days for
cardiovascular conditions than would be expected based on the general
population.
14
Complicationa
Non-Emergency Admissions Emergency Admissions
Total number
of bed days
Number of bed
days for NDA
population
Percentage of
bed days for
NDA population
Total number of
bed days
Number of bed
days for NDA
population
Percentage of
bed days for
NDA population
Angina 298,145 93,190 31.3 1,511,615 539,685 35.7
Myocardial Infarction 101,365 32,815 32.4 636,595 203,105 31.9
Heart Failure 441,975 141,740 32.1 3,818,620 1,354,795 35.5
Stroke 396,420 92,325 23.3 1,552,630 403,955 26.0
Table 4: Percentage of hospital bed days and NDA related hospital bed days
for cardiovascular complications, England and Wales, 2017-2018 HES/PEDW
a The complication was not necessarily the primary reason for admission
2. Diabetes specific
complications

Diabetes specific complications prevalence,
amputations and End Stage Kidney Disease (ESKD)
16
Table 5: One year prevalence of diabetes specific complications, England and
Wales, 2016-17 audit, complications during 2017-18
From the NDA 2016-17, a total of 240,950 people with Type 1 diabetes, and
2,937,020 people with Type 2 and other diabetes, were alive on 31st March 2017
and were included in the analysis of diabetic complications.
Table 5 shows the prevalence of the amputation and ESKD diabetes specifica
complications recorded between 1st April 2017 and 31st March 2018 in HES and
PEDW.
Complicationa
Type 1 Type 2 and Other
Number of people
experiencing the
complication
Prevalence percentage
(not adjusted for the
ethnicity, age and sex
structure of the
population)
Number of people
experiencing the
complication
Prevalence percentage
(not adjusted for the
ethnicity, age and sex
structure of the
population)
Major Amputation 305 0.1 2,005 0.1
Minor Amputation 770 0.3 4,600 0.2
Renal Replacement
Therapy (ESKD)b 2,665 1.1 17,745 0.6
a Complications in the financial year following the audit period. b Very small numbers of amputations and ESKD will be due to non-diabetic disease.

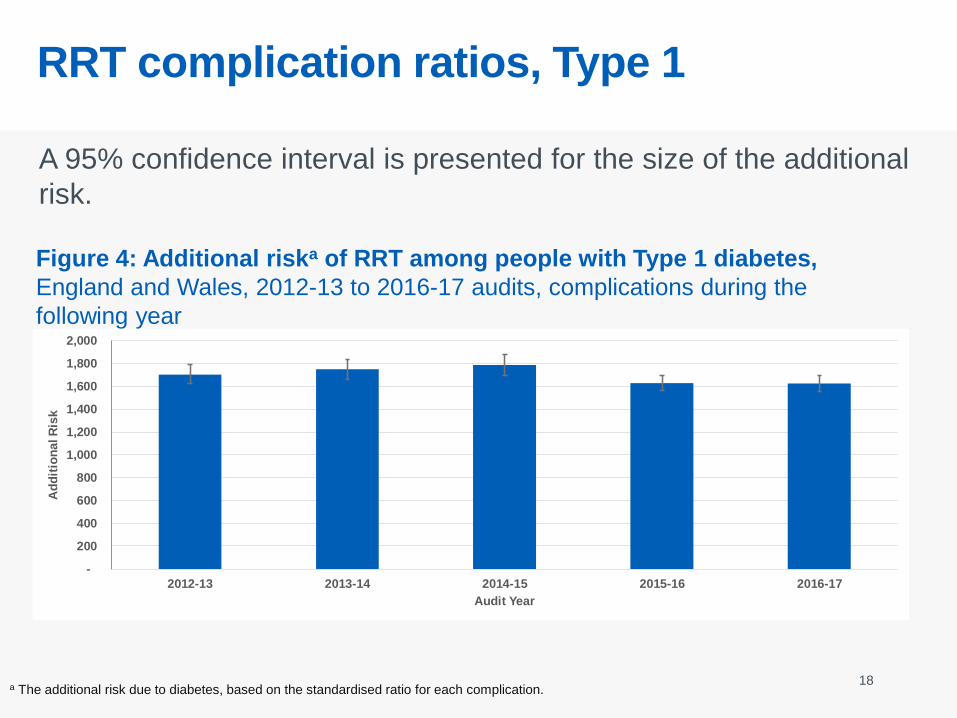
RRT complication ratios
These complication ratios compare the prevalence of RRT during a one-
year follow-up period for people in the 2016-17 NDA with the prevalence of
RRT for people who have never appeared in the NDA.
The risk of ESKD is 17 times as great for people with Type 1 diabetes
and 3.6 times as great for people with Type 2 diabetes.
17
a Complications in the financial year following the audit period.b Based on the prevalence in the population who have never appeared in the NDA. This may include people with diabetes who have never
appeared in the NDA. Standardised by age, sex and locality. Expected values are calculated projections and are not suppressed. For definitions,
see the Glossary section.c The ICD-10 diagnosis and OPCS procedure codes used to identify the RRT complication have changed since the NDA 2012-13 Report 2 and
are therefore not comparable.
Table 6: Standardised ratios for RRT, England and Wales, 2016-2017 audit,
complications during 2017-18
Complicationa
Type 1 Type 2 and Other
Total Expectedb ObservedStandardised
Ratiob Total Expectedb ObservedStandardised
Ratiob
RRT (ESKD)c 144 2,490 1,724 4,656 16,870 362
RRT complication ratios, Type 1
A 95% confidence interval is presented for the size of the additional
risk.
18
Figure 4: Additional riska of RRT among people with Type 1 diabetes,
England and Wales, 2012-13 to 2016-17 audits, complications during the
following year
a The additional risk due to diabetes, based on the standardised ratio for each complication.
-
200
400
600
800
1,000
1,200
1,400
1,600
1,800
2,000
2012-13 2013-14 2014-15 2015-16 2016-17
Ad
dit
ion
al R
isk
Audit Year

RRT complication ratio, Type 2 and other
19a The additional risk due to diabetes, based on the standardised ratio for each complication.
-
50
100
150
200
250
300
350
400
2012-13 2013-14 2014-15 2015-16 2016-17
Ad
dit
ion
al R
isk
Audit Year
The additional risk due to Type 2 diabetes appears to have fluctuated over the past
five years. This may be caused by changing audit participation over these years
(2012-13: 70.6 per cent; 2013-14: 57.1; 2014-15: 57.3; 2015-16: 82.4; 2016-17:
95.3) having a greater impact than previously thought, or it may be due to the
standardisation method not sufficiently accounting for variation.
Figure 5: Age specific mortality rate ratios by type of diabetes and sex,
2015-16 audit, England and Wales, deaths in 2017
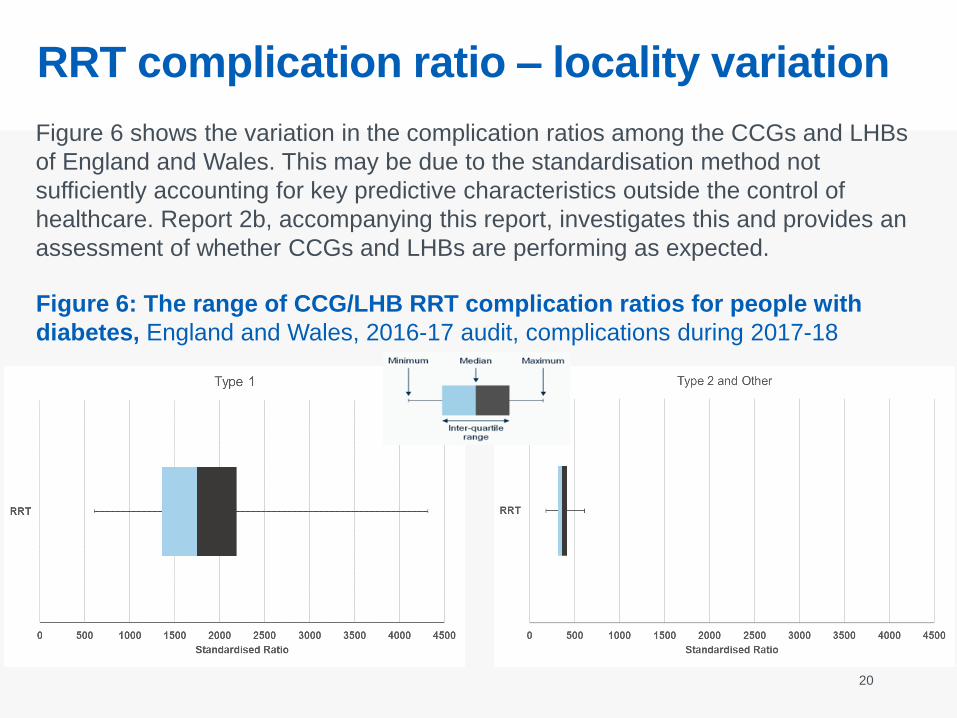
RRT complication ratio – locality variation
20
Figure 6: The range of CCG/LHB RRT complication ratios for people with
diabetes, England and Wales, 2016-17 audit, complications during 2017-18
Figure 6 shows the variation in the complication ratios among the CCGs and LHBs
of England and Wales. This may be due to the standardisation method not
sufficiently accounting for key predictive characteristics outside the control of
healthcare. Report 2b, accompanying this report, investigates this and provides an
assessment of whether CCGs and LHBs are performing as expected.

Amputation prevalence in people with
diabetes
21
• In the last NDA Complications report the association
of duration of diabetes with amputation rates was
considered in addition to age and sex. This showed
that duration was a more dominant factor than age
when considering all people with diabetes.
• This approach has been extended to consider other
characteristics in Report 2b: Complications and
Mortality, that accompanies this report.

Hospital admissions for diabetes specific
complicationsPeople with diabetes comprise about 5% of the adult population yet account for 40-
70% of admissions for amputations and RRT.
More than 4 out of 10 of all admissions for major amputations and almost 3 out
of 4 of all emergency admissions for minor amputations are in people with
diagnosed diabetes.
22
Table 7: Number of hospital admissions and NDA related hospital admissions
for diabetes specific complications, England and Wales, 2017-2018 HES/PEDW
Complicationa
Non-Emergency Admissions Emergency Admissions
Number of all
non
emergency
admissions
Number of non
emergency
admissions for
NDA population
Percentage of
non emergency
admissions for
NDA population
Number of all
emergency
admissions
Number of
emergency
admissions for
NDA population
Percentage of
emergency
admissions for
NDA population
Major Amputation 1,385 565 40.8 2,000 880 44.0
Minor Amputation 4,495 2,095 46.6 3,085 2,215 71.8
RRT 63,380 22,480 35.5 66,915 28,045 41.9
a The complication was not necessarily the primary reason for admission

Diabetes specific hospital bed days
23
Table 8: Number of hospital bed days and NDA related hospital bed days,
England and Wales, 2017-2018 HES/PEDW
Table 12 shows hospital bed days for people admitted for amputations or RRT
between 1st April 2017 and 31st March 2018 for the known diabetic population –
defined as individuals who have appeared in the NDA at any time up to the 2016-17
audit – alongside the total number of bed days for these admissions in all people.
People with diabetes represent about 5% of the adult population but account
for more than 40% of bed days for amputation and RRT.
a The complication was not necessarily the primary reason for admission
Complicationa
Non-Emergency Admissions Emergency Admissions
Total number of
bed days
Number of bed
days for NDA
population
Percentage of
bed days for
NDA population
Total number of
bed days
Number of bed
days for NDA
population
Percentage of
bed days for
NDA population
Major Amputation 26,890 13,385 49.8 57,930 29,260 50.5
Minor Amputation 18,960 13,080 69.0 52,685 40,980 77.8
RRT 174,355 70,455 40.4 557,785 264,430 47.4

3. Mortality

Causes of death – people in the NDA
25
Table 9: Causes of death for people in the NDA, England and Wales, 2007-2017
Table 10: Further breakdown of ‘All Vascular Outcomes’ cause of death for
people in the NDA, England and Wales, 2007-2017
Although deaths from vascular disease are declining year on year, there is
still a higher percentage of deaths due to vascular disease in people with
diabetes than cancer.
Year of Death 2007 2008 2009 2010 2011 2012 2013 2014 2015 2016 2017
Number of Deaths 36,980 54,320 65,145 75,085 78,795 88,675 94,725 97,525 105,065 111,750 117,465
All Cancers 23.8% 24.3% 24.7% 25.2% 26.0% 25.7% 25.4% 25.6% 24.5% 25.3% 25.2%
All Vascular
Outcomes38.8% 38.2% 37.8% 37.2% 35.3% 34.9% 34.4% 34.0% 33.3% 32.4% 32.1%
All Non-Cancer, Non-
Vascular Outcomes36.3% 36.5% 36.6% 36.7% 37.6% 38.4% 39.1% 39.2% 40.9% 41.0% 41.3%
All Unknown Causes 1.1% 1.0% 0.9% 1.0% 1.1% 1.1% 1.2% 1.2% 1.2% 1.3% 1.3%
Year of Death 2007 2008 2009 2010 2011 2012 2013 2014 2015 2016 2017
Coronary Heart
Disease22.1% 21.1% 20.7% 19.7% 18.5% 18.2% 17.6% 16.9% 16.4% 15.6% 15.2%
Cerebrovascular
Disease8.9% 9.0% 8.6% 8.8% 9.0% 8.9% 8.7% 9.2% 9.1% 8.7% 8.6%
Other Vascular
Disease7.9% 8.1% 8.5% 8.7% 7.8% 7.8% 8.0% 7.9% 7.9% 8.0% 8.2%

Causes of death – general population
26
Table 11: Causes of death in the General Population, England and Wales, 2007-
2017
Table 12: Further breakdown of ‘All Vascular Outcomes’ cause of death in the
General Population, England and Wales, 2007-2017
Deaths due to vascular disease are also declining in the general population,
however the percentage of deaths due to vascular disease is similar to the
percentage due to cancer.
Year of Death 2007 2008 2009 2010 2011 2012 2013 2014 2015 2016 2017
Number of Deaths 505,325 508,725 490,130 493,960 483,895 502,685 505,315 502,465 527,295 529,005 527,380
All Cancers 27.7% 27.7% 28.6% 28.6% 29.6% 29.0% 28.7% 29.2% 28.0% 28.4% 28.3%
All Vascular
Outcomes33.9% 33.2% 32.8% 32.2% 30.4% 30.1% 29.6% 29.3% 28.5% 28.0% 27.8%
All Non-Cancer, Non-
Vascular Outcomes35.6% 36.3% 36.1% 36.5% 37.3% 38.2% 39.0% 38.8% 40.8% 40.9% 41.5%
All Unknown Causes 2.8% 2.8% 2.5% 2.6% 2.7% 2.7% 2.7% 2.7% 2.7% 2.7% 2.4%
Year of Death 2007 2008 2009 2010 2011 2012 2013 2014 2015 2016 2017
Coronary Heart
Disease15.8% 15.1% 14.7% 14.2% 13.3% 12.8% 12.6% 12.1% 11.5% 11.0% 10.9%
Cerebrovascular
Disease9.3% 9.2% 9.0% 8.9% 8.9% 8.9% 8.7% 8.9% 8.9% 8.6% 8.5%
Other Vascular
Disease8.8% 8.9% 9.1% 9.1% 8.2% 8.3% 8.3% 8.3% 8.2% 8.3% 8.3%

Deaths by age and cause of death
The distribution of causes of death are similar in the two populations at the
age of 80 and over. Below this age, vascular causes account for a greater
proportion of deaths in people with diabetes.
Figure 7: Deaths by broad cause and age, in the diabetic and general
population, England and Wales, 2017
NDA Deaths, Age 0-64
Vascular Cancer Other
NDA Deaths, Age 65-79
Vascular Cancer Other
NDA Deaths, Age 80+
Vascular Cancer Other
All Deaths, Age 0-64
Vascular Cancer Other
All Deaths, Age 65-79
Vascular Cancer Other
All Deaths, Age 80+
Vascular Cancer Other

Mortality ratios
All diabetes is associated with additional deaths. Type 1 diabetes has a
particularly large influence.
28
Table 13: Mortality in people with diabetes, 2015-16 audit, England and Wales,
deaths in 2017
a Please refer to the Glossary section.b All diabetes includes maturity onset diabetes of the young (MODY, other specified diabetes and not specified diabetes)
PYaRᵃExpected
Deathsᵃ
Observed
DeathsSMRᵃ
Lower 95%
Confidence
Limit
Upper 95%
Confidence
Limit
Additional risk of
death among
people with
diabetes %
All Diabetes
Typesb
Persons 2,613,810 61,814 94,520 153 152 154 52.9
Male 1,454,318 34,164 51,790 152 150 153 51.6
Female 1,156,775 27,649 42,615 154 153 156 54.1
Type 1
Diabetes
Persons 213,400 1,278 3,170 248 239 257 148.0
Male 120,482 763 1,835 240 230 252 140.5
Female 92,913 515 1,335 259 246 274 159.2
Type 2 and
Other
Diabetes
Persons 2,348,189 59,795 89,825 150 149 151 50.2
Male 1,311,866 33,014 49,210 149 148 150 49.1
Female 1,036,314 26,781 40,620 152 150 153 51.7

Age specific mortality rate ratios
The relative risk of death is increased at all ages, in both men and
women, in younger people more than older peoplea.
a Smaller numbers of deaths in the 15-34 year age group may affect ratios.
Figure 8: Age specific mortality rate ratios by type of diabetes and sex,
2015-16 audit, England and Wales, deaths in 2017
29

4. Definitions, glossary,
data sources and
additional information

Definitions (1)
31
Diabetes
Diabetes is a condition where the amount of glucose in the blood is too high because the
pancreas does not produce enough insulin. Insulin is a hormone produced by the pancreas
that allows glucose to be used as a body fuel and other nutrients to be used as building
blocks. There are two main types of diabetes: Type 1 diabetes (no insulin); Type 2 diabetes
(insufficient insulin)
Cardiovascular Complications
Angina is chest pain that occurs when the blood supply to the muscles of the heart is
restricted. It usually happens because the arteries supplying the heart become hardened
and narrowed.
Myocardial Infarction (MI), commonly known as a heart attack, is a serious medical
emergency in which the supply of blood to the heart is suddenly blocked, usually by a blood
clot.
Heart failure means that the heart is unable to pump blood around the body properly. It
usually occurs because the heart has become too weak or stiff.
A stroke is a serious life-threatening medical condition that occurs when the blood supply to
part of the brain is cut off.

Definitions (2)
32
Diabetes Specific Complications
Renal Replacement Therapy (RRT) is therapy that replaces the normal blood-filtering
function of the kidneys. RRT includes dialysis, hemofiltration and hemodiafiltration, which are
various ways of filtration of blood with or without machine. It can also include kidney
transplantation.
Amputation is the surgical removal of part of the body, such as an arm or leg.
Diabetic Ketoacidosis (DKA) is a serious problem that can occur in people with diabetes if
their body starts to run out of insulin. This causes harmful substances called ketones to build
up in the body, which can be life-threatening if not spotted and treated quickly.
Glossary (1)
33
Confidence Interval
A confidence interval is a range of values that quantifies the imprecision in the estimate of a
statistic. Specifically it quantifies the imprecision that results from random variation in the
estimation of the value; it does not include imprecision resulting from systematic error (bias).
Population Years at Risk (PYaR)
The population-years-at-risk is the total amount of time during which the population is
exposed to a risk. For example, during the one-year mortality follow-up period a person who
survives the whole year contributes one year to the total PYaR; a person who dies after three
months contributes only 0.25 years to the total PYaR.
Standardised Mortality Ratio (SMR)
The SMR is a form of indirect standardisation. The age specific mortality rates of a chosen
standard population (usually the relevant national or study aggregate population) are applied
to the age structure of the subject population to give an expected number of deaths. The
observed number of events is then compared to the expected and is usually expressed as a
ratio (observed/expected). For presentation purposes, the SMR is usually expressed per 100.
By definition, the standard population will have a SMR of 100. SMRs above 100 indicate that
the death count observed was greater than that expected from the standard mortality rate and
SMRs below 100 that it was lower.

Glossary (2)
34
Expected Deaths
The expected death count is that which would occur if the observed subject population
experienced the standard population’s age-specific mortality rates.
Standardised Ratio
The standardised ratio is a form of indirect standardisation. The age and sex specific rates for
each complication of a chosen population (usually the relevant national or study aggregate
population) are applied to the age and sex structure of the subject population to give an
expected number of complications. The observed number of events is then compared to the
expected and is usually expressed as ratio (observed/expected). For presentation purposes
the standardised ratio is usually expressed per 100. By definition, the standard population will
have a standardised ratio of 100. Standardised ratios above 100 indicate that the complication
count observed was greater than that expected from the standardised complication rates and
for standard ratios below 100 that it was lower.
Expected Complications
The expected complication count is what would occur if the observed subject population
experienced the standard population’s age and sex specific complication rates.

The Healthcare Quality Improvement Partnership (HQIP). The National Diabetes Audit
(NDA) is part of the National Clinical Audit and Patient Outcomes Programme (NCAPOP)
which is commissioned by the Healthcare Quality Improvement Partnership (HQIP) and
funded by NHS England. HQIP is led by a consortium of the Academy of Medical Royal
Colleges, the Royal College of Nursing and National Voices. Its aim is to promote quality
improvement, and in particular to increase the impact that clinical audit has on healthcare
quality in England and Wales. HQIP holds the contract to manage and develop the
NCAPOP Programme, comprising more than 30 clinical audits that cover care provided to
people with a wide range of medical, surgical and mental health conditions. The
programme is funded by NHS England, the Welsh Government and, with some individual
audits, also funded by the Health Department of the Scottish Government, DHSSPS
Northern Ireland and the Channel Islands.
NHS Digital is the trading name for the Health and Social Care Information Centre
(HSCIC). NHS Digital managed the publication of the 2017-18 annual report.
Diabetes UK is the charity leading the fight against the most devastating and fastest
growing health crisis of our time, creating a world where diabetes can do no harm. They
provide patient engagement and quality improvement services to the audit programme.
Prepared in collaboration with:
The National Cardiovascular Intelligence Network (NCVIN) is a partnership of
leading national cardiovascular organisations which analyses information and data and
turns it into meaningful timely health intelligence for commissioners, policy makers,
clinicians and health professionals to improve services and outcomes. Public Health
England provide analytical and policy context expertise to the audit programme.
Supported by:
35
National Diabetes Audit, 2017-18

36
Published by NHS Digital
Part of the Government Statistical Service
For further information
digital.nhs.uk
0300 303 5678
Copyright © 2019, Health and Social Care Information Centre.
NHS Digital is the trading name of the Health and Social Care Information Centre.
This work may be re-used by NHS and government organisations without permission.
National Diabetes Audit, 2017-18


![Obesity Diabetes and Complications[1]](https://static.fdocuments.us/doc/165x107/544958b7af7959a0538b47b6/obesity-diabetes-and-complications1.jpg)