National Data - Bureau of Economic Analysis June/D-pages/0609dpg...D–2 June 2009 National Data A....
44
D–2 June 2009 National Data A. Selected NIPA Tables The selected set of NIPA tables presents the most recent estimates of gross domestic product (GDP) and its components, which were released on May 29, 2009. These estimates include the “preliminary” estimates for the first quarter of 2009. Also included are revised estimates of wages and salaries and of affected income-side series for the fourth quarter of 2008 and for 2008. The selected set presents quarterly estimates that are updated monthly. Annual estimates are presented in most of the tables. The GDP news release is available on BEA’s Web site within minutes after the release. To receive an e-mail noti- fication of the release, go to www.bea.gov and subscribe. The “Selected NIPA Tables” are available later that day. 1. Domestic Product and Income Table 1.1.1. Percent Change From Preceding Period in Real Table 1.1.2. Contributions to Percent Change in Real Gross Domestic Product Gross Domestic Product [Percent] Line 2007 2008 Seasonally adjusted at annual rates 2008 2009 I II III IV I Gross domestic product .... Personal consumption 1 2.0 1.1 0.9 2.8 –0.5 –6.3 –5.7 expenditures ........................... 2 2.8 0.2 0.9 1.2 –3.8 –4.3 1.5 Durable goods .......................... 3 4.8 –4.3 –4.3 –2.8 –14.8 –22.1 9.6 Nondurable goods .................... 4 2.5 –0.6 –0.4 3.9 –7.1 –9.4 –0.6 Services ................................... Gross private domestic 5 2.6 1.5 2.4 0.7 –0.1 1.5 1.3 investment............................... 6 –5.4 –6.7 –5.8 –11.5 0.4 –23.0 –49.3 Fixed investment....................... 7 –3.1 –5.0 –5.6 –1.7 –5.3 –22.0 –37.3 Nonresidential ...................... 8 4.9 1.6 2.4 2.5 –1.7 –21.7 –36.9 Structures ......................... 9 12.7 11.2 8.6 18.5 9.7 –9.4 –42.3 Equipment and software 10 1.7 –3.0 –0.6 –5.0 –7.5 –28.1 –33.5 Residential............................ 11 –17.9 –20.8 –25.1 –13.3 –16.0 –22.8 –38.7 Change in private inventories ... Net exports of goods and 12 .............. ............. ............. ............. ............. ............. ............. services ................................... 13 .............. ............. ............. ............. ............. ............. ............. Exports ..................................... 14 8.4 6.2 5.1 12.3 3.0 –23.6 –28.7 Goods................................... 15 7.5 6.0 4.5 16.3 3.7 –32.0 –37.8 Services ............................... 16 10.5 6.6 6.4 3.8 1.4 –1.5 –7.2 Imports ..................................... 17 2.2 –3.5 –0.8 –7.3 –3.5 –17.5 –34.1 Goods................................... 18 1.7 –4.1 –2.0 –7.1 –4.7 –19.6 –39.6 Services ............................... Government consumption expenditures and gross 19 4.4 0.2 5.5 –8.0 3.3 –6.7 –4.3 investment............................... 20 2.1 2.9 1.9 3.9 5.8 1.3 –3.5 Federal ..................................... 21 1.6 6.0 5.8 6.6 13.8 7.0 –4.3 National defense................... 22 2.5 7.2 7.3 7.3 18.0 3.4 –6.8 Nondefense .......................... 23 –0.2 3.6 2.9 5.0 5.1 15.3 1.0 State and local .......................... 24 2.3 1.1 –0.3 2.5 1.3 –2.0 –2.9 Line 2007 2008 Seasonally adjusted at annual rates 2008 2009 I II III IV I Percent change at annual rate: Gross domestic product .... 1 2.0 1.1 0.9 2.8 –0.5 –6.3 –5.7 Percentage points at annual rates: Personal consumption expenditures ........................... 2 1.95 0.16 0.61 0.87 –2.75 –2.99 1.08 Durable goods .......................... 3 0.38 –0.33 –0.33 –0.21 –1.16 –1.67 0.62 Nondurable goods .................... 4 0.50 –0.13 –0.08 0.80 –1.57 –1.97 –0.11 Services .................................... Gross private domestic 5 1.07 0.62 1.02 0.28 –0.03 0.66 0.58 investment ............................... 6 –0.90 –1.02 –0.89 –1.74 0.06 –3.47 –8.27 Fixed investment ....................... 7 –0.50 –0.76 –0.86 –0.25 –0.79 –3.36 –5.93 Nonresidential ....................... 8 0.52 0.17 0.26 0.27 –0.19 –2.56 –4.54 Structures ......................... 9 0.40 0.39 0.30 0.64 0.36 –0.38 –2.02 Equipment and software 10 0.13 –0.22 –0.04 –0.37 –0.55 –2.18 –2.52 Residential ............................ 11 –1.02 –0.93 –1.12 –0.52 –0.60 –0.80 –1.39 Change in private inventories ... Net exports of goods and 12 –0.40 –0.26 –0.02 –1.50 0.84 –0.11 –2.34 services ................................... 13 0.58 1.40 0.77 2.93 1.05 –0.15 2.18 Exports ..................................... 14 0.95 0.76 0.63 1.54 0.40 –3.44 –3.86 Goods ................................... 15 0.59 0.51 0.39 1.39 0.34 –3.38 –3.57 Services................................ 16 0.36 0.25 0.24 0.15 0.06 –0.06 –0.29 Imports...................................... 17 –0.37 0.64 0.14 1.39 0.65 3.29 6.05 Goods ................................... 18 –0.25 0.65 0.29 1.14 0.74 3.09 5.92 Services................................ 19 –0.12 –0.01 –0.15 0.25 –0.09 0.20 0.12 Government consumption expenditures and gross investment ............................... 20 0.40 0.57 0.38 0.78 1.14 0.26 –0.71 Federal ...................................... 21 0.11 0.43 0.41 0.47 0.97 0.52 –0.34 National defense................... 22 0.12 0.35 0.34 0.36 0.85 0.18 –0.37 Nondefense .......................... 23 0.00 0.08 0.06 0.11 0.12 0.34 0.03 State and local .......................... 24 0.28 0.14 –0.03 0.31 0.17 –0.25 –0.37
Transcript of National Data - Bureau of Economic Analysis June/D-pages/0609dpg...D–2 June 2009 National Data A....

D–2 June 2009
National Data
A. Selected NIPA Tables The selected set of NIPA tables presents the most recent estimates of gross domestic product (GDP) and its components, which were released on May 29, 2009. These estimates include the “preliminary” estimates for the first quarter of 2009. Also included are revised estimates of wages and salaries and of affected income-side series for the fourth quarter of 2008 and for 2008.
The selected set presents quarterly estimates that are updated monthly. Annual estimates are presented in most of the tables.
The GDP news release is available on BEA’s Web site within minutes after the release. To receive an e-mail notification of the release, go to www.bea.gov and subscribe. The “Selected NIPA Tables” are available later that day.
1. Domestic Product and Income
Table 1.1.1. Percent Change From Preceding Period in Real Table 1.1.2. Contributions to Percent Change in Real Gross Domestic Product Gross Domestic Product
[Percent]
Line 2007 2008
Seasonally adjusted at annual rates
2008 2009
I II III IV I
Gross domestic product .... Personal consumption
1 2.0 1.1 0.9 2.8 –0.5 –6.3 –5.7
expenditures ........................... 2 2.8 0.2 0.9 1.2 –3.8 –4.3 1.5 Durable goods .......................... 3 4.8 –4.3 –4.3 –2.8 –14.8 –22.1 9.6 Nondurable goods .................... 4 2.5 –0.6 –0.4 3.9 –7.1 –9.4 –0.6 Services ...................................
Gross private domestic 5 2.6 1.5 2.4 0.7 –0.1 1.5 1.3
investment............................... 6 –5.4 –6.7 –5.8 –11.5 0.4 –23.0 –49.3 Fixed investment....................... 7 –3.1 –5.0 –5.6 –1.7 –5.3 –22.0 –37.3
Nonresidential ...................... 8 4.9 1.6 2.4 2.5 –1.7 –21.7 –36.9 Structures......................... 9 12.7 11.2 8.6 18.5 9.7 –9.4 –42.3 Equipment and software 10 1.7 –3.0 –0.6 –5.0 –7.5 –28.1 –33.5
Residential............................ 11 –17.9 –20.8 –25.1 –13.3 –16.0 –22.8 –38.7 Change in private inventories ...
Net exports of goods and 12 .............. ............. ............. ............. ............. ............. .............
services ................................... 13 .............. ............. ............. ............. ............. ............. ............. Exports ..................................... 14 8.4 6.2 5.1 12.3 3.0 –23.6 –28.7
Goods................................... 15 7.5 6.0 4.5 16.3 3.7 –32.0 –37.8 Services ............................... 16 10.5 6.6 6.4 3.8 1.4 –1.5 –7.2
Imports ..................................... 17 2.2 –3.5 –0.8 –7.3 –3.5 –17.5 –34.1 Goods................................... 18 1.7 –4.1 –2.0 –7.1 –4.7 –19.6 –39.6 Services ...............................
Government consumption expenditures and gross
19 4.4 0.2 5.5 –8.0 3.3 –6.7 –4.3
investment............................... 20 2.1 2.9 1.9 3.9 5.8 1.3 –3.5 Federal ..................................... 21 1.6 6.0 5.8 6.6 13.8 7.0 –4.3
National defense................... 22 2.5 7.2 7.3 7.3 18.0 3.4 –6.8 Nondefense .......................... 23 –0.2 3.6 2.9 5.0 5.1 15.3 1.0
State and local.......................... 24 2.3 1.1 –0.3 2.5 1.3 –2.0 –2.9
Line 2007 2008
Seasonally adjusted at annual rates
2008 2009
I II III IV I
Percent change at annual rate: Gross domestic product .... 1 2.0 1.1 0.9 2.8 –0.5 –6.3 –5.7
Percentage points at annual rates:
Personal consumption expenditures ........................... 2 1.95 0.16 0.61 0.87 –2.75 –2.99 1.08 Durable goods .......................... 3 0.38 –0.33 –0.33 –0.21 –1.16 –1.67 0.62 Nondurable goods .................... 4 0.50 –0.13 –0.08 0.80 –1.57 –1.97 –0.11 Services....................................
Gross private domestic 5 1.07 0.62 1.02 0.28 –0.03 0.66 0.58
investment ............................... 6 –0.90 –1.02 –0.89 –1.74 0.06 –3.47 –8.27 Fixed investment ....................... 7 –0.50 –0.76 –0.86 –0.25 –0.79 –3.36 –5.93
Nonresidential....................... 8 0.52 0.17 0.26 0.27 –0.19 –2.56 –4.54 Structures ......................... 9 0.40 0.39 0.30 0.64 0.36 –0.38 –2.02 Equipment and software 10 0.13 –0.22 –0.04 –0.37 –0.55 –2.18 –2.52
Residential ............................ 11 –1.02 –0.93 –1.12 –0.52 –0.60 –0.80 –1.39 Change in private inventories ...
Net exports of goods and 12 –0.40 –0.26 –0.02 –1.50 0.84 –0.11 –2.34
services ................................... 13 0.58 1.40 0.77 2.93 1.05 –0.15 2.18 Exports ..................................... 14 0.95 0.76 0.63 1.54 0.40 –3.44 –3.86
Goods ................................... 15 0.59 0.51 0.39 1.39 0.34 –3.38 –3.57 Services................................ 16 0.36 0.25 0.24 0.15 0.06 –0.06 –0.29
Imports...................................... 17 –0.37 0.64 0.14 1.39 0.65 3.29 6.05 Goods ................................... 18 –0.25 0.65 0.29 1.14 0.74 3.09 5.92 Services................................ 19 –0.12 –0.01 –0.15 0.25 –0.09 0.20 0.12
Government consumption expenditures and gross investment ............................... 20 0.40 0.57 0.38 0.78 1.14 0.26 –0.71 Federal...................................... 21 0.11 0.43 0.41 0.47 0.97 0.52 –0.34
National defense................... 22 0.12 0.35 0.34 0.36 0.85 0.18 –0.37 Nondefense .......................... 23 0.00 0.08 0.06 0.11 0.12 0.34 0.03
State and local .......................... 24 0.28 0.14 –0.03 0.31 0.17 –0.25 –0.37

June 2009 SURVEY OF CURRENT BUSINESS D–3
Table 1.1.3. Real Gross Domestic Product, Quantity Indexes Table 1.1.4. Price Indexes for Gross Domestic Product [Index numbers, 2000=100] [Index numbers, 2000=100]
Line 2007 2008
Seasonally adjusted
2008 2009
I II III IV I
Gross domestic product .... Personal consumption
1 117.388 118.692 118.631 119.460 119.308 117.369 115.654
expenditures ........................... 2 122.456 122.743 123.395 123.770 122.572 121.235 121.702 Durable goods .......................... 3 143.908 137.666 143.284 142.273 136.695 128.413 131.396 Nondurable goods .................... 4 122.872 122.143 123.147 124.317 122.035 119.071 118.899 Services ...................................
Gross private domestic 5 118.259 119.992 119.739 119.937 119.916 120.376 120.774
investment............................... 6 104.278 97.328 101.110 98.071 98.169 91.961 77.600 Fixed investment....................... 7 107.717 102.375 104.969 104.522 103.102 96.907 86.222
Nonresidential ...................... 8 112.244 114.069 115.504 116.212 115.714 108.847 96.998 Structures......................... 9 97.264 108.180 104.206 108.716 111.257 108.543 94.591 Equipment and software 10 117.412 113.939 118.470 116.961 114.709 105.616 95.374
Residential............................ 11 101.534 80.436 85.698 82.692 79.154 74.201 65.661 Change in private inventories ...
Net exports of goods and 12 ............. ............. ............. ............. ............. ............. .............
services ................................... 13 ............. ............. ............. ............. ............. ............. ............. Exports ..................................... 14 130.068 138.111 136.880 140.908 141.943 132.713 121.943
Goods................................... 15 127.335 134.948 133.690 138.826 140.079 127.198 112.961 Services ............................... 16 136.868 145.916 144.792 146.131 146.640 146.100 143.402
Imports ..................................... 17 133.654 129.038 132.991 130.509 129.367 123.283 111.092 Goods................................... 18 134.921 129.326 133.654 131.212 129.653 122.785 108.237 Services ............................... 19 127.581 127.856 129.913 127.217 128.249 126.043 124.656
Government consumption expenditures and gross investment............................... 20 116.871 120.250 118.443 119.594 121.288 121.674 120.600 Federal ..................................... 21 130.078 137.913 133.488 135.628 140.080 142.457 140.884
National defense................... 22 135.596 145.318 140.125 142.621 148.643 149.882 147.283 Nondefense .......................... 23 120.127 124.469 121.469 122.949 124.473 128.984 129.314
State and local.......................... 24 110.167 111.394 110.844 111.517 111.891 111.326 110.496
Line 2007 2008
Seasonally adjusted
2008 2009
I II III IV I
Gross domestic product .... Personal consumption
1 119.819 122.500 121.613 121.951 123.134 123.302 124.168
expenditures ........................... 2 117.659 121.596 120.283 121.544 123.041 121.514 121.208 Durable goods .......................... 3 87.154 86.071 86.581 86.237 86.110 85.357 84.999 Nondurable goods .................... 4 118.407 124.666 123.059 125.021 128.129 122.455 120.835 Services....................................
Gross private domestic 5 124.712 128.752 127.133 128.450 129.538 129.885 130.233
investment ............................... 6 117.735 118.509 117.815 117.926 118.510 119.786 119.206 Fixed investment ....................... 7 117.995 118.727 118.117 118.353 119.037 119.400 118.819
Nonresidential....................... 8 108.739 110.513 109.177 109.788 110.913 112.174 111.849 Structures ......................... 9 157.662 163.298 160.182 161.496 164.285 167.229 165.867 Equipment and software 10 94.870 95.485 94.700 95.101 95.710 96.431 96.454
Residential ............................ 11 138.884 135.587 137.900 136.687 135.535 132.226 130.687 Change in private inventories ...
Net exports of goods and 12 ............. ............. ............. ............. ............. ............. .............
services ................................... 13 ............. ............. ............. ............. ............. ............. ............. Exports ..................................... 14 116.586 122.788 121.397 124.560 126.592 118.601 115.199
Goods ................................... 15 115.062 121.147 119.916 123.456 125.137 116.082 112.516 Services................................ 16 120.211 126.684 124.932 127.211 130.082 124.510 121.424
Imports...................................... 17 120.168 132.698 128.722 137.136 140.189 124.747 114.218 Goods ................................... 18 118.326 131.408 127.427 136.387 139.607 122.209 110.591 Services................................ 19 129.928 139.217 135.377 140.740 142.873 137.879 132.643
Government consumption expenditures and gross investment ............................... 20 132.941 139.234 137.237 139.588 141.107 139.002 138.887 Federal...................................... 21 130.076 134.289 132.879 134.553 135.447 134.277 135.176
National defense................... 22 131.874 136.574 134.905 136.967 138.004 136.421 137.336 Nondefense .......................... 23 126.636 129.869 128.986 129.868 130.465 130.157 131.025
State and local .......................... 24 134.671 142.219 139.866 142.632 144.540 141.838 141.068
Table 1.1.5. Gross Domestic Product Table 1.1.6. Real Gross Domestic Product, Chained Dollars [Billions of dollars] [Billions of chained (2000) dollars]
Line 2007 2008
Seasonally adjusted at annual rates
2008 2009
I II III IV I
Gross domestic product .... Personal consumption
1 13,807.5 14,264.6 14,150.8 14,294.5 14,412.8 14,200.3 14,089.7
expenditures ........................... 2 9,710.2 10,057.9 10,002.3 10,138.0 10,163.5 9,927.9 9,941.0 Durable goods .......................... 3 1,082.8 1,023.2 1,071.0 1,059.3 1,016.2 946.3 964.2 Nondurable goods .................... 4 2,833.0 2,965.1 2,950.7 3,026.2 3,044.6 2,839.0 2,797.4 Services ...................................
Gross private domestic 5 5,794.4 6,069.6 5,980.6 6,052.5 6,102.7 6,142.5 6,179.4
investment............................... 6 2,130.4 1,993.5 2,056.1 2,000.9 2,010.9 1,906.1 1,598.7 Fixed investment....................... 7 2,134.0 2,040.5 2,081.7 2,077.0 2,060.6 1,942.7 1,720.1
Nonresidential ...................... 8 1,503.8 1,552.8 1,553.6 1,571.9 1,581.2 1,504.3 1,336.6 Structures......................... 9 480.3 553.4 522.7 549.8 572.4 568.4 491.3 Equipment and software 10 1,023.5 999.4 1,030.9 1,022.1 1,008.8 935.8 845.3
Residential............................ 11 630.2 487.7 528.1 505.0 479.4 438.4 383.4 Change in private inventories ...
Net exports of goods and 12 –3.6 –47.0 –25.6 –76.0 –49.7 –36.6 –121.4
services ................................... 13 –707.8 –669.2 –705.7 –718.2 –707.7 –545.1 –333.4 Exports ..................................... 14 1,662.4 1,859.4 1,820.8 1,923.2 1,968.9 1,724.7 1,539.3
Goods................................... 15 1,149.2 1,283.1 1,256.9 1,343.7 1,374.3 1,157.6 996.5 Services ............................... 16 513.2 576.3 563.9 579.5 594.6 567.1 542.8
Imports ..................................... 17 2,370.2 2,528.6 2,526.5 2,641.4 2,676.6 2,269.7 1,872.7 Goods................................... 18 1,985.2 2,115.2 2,118.0 2,225.5 2,251.0 1,866.1 1,488.6 Services ...............................
Government consumption expenditures and gross
19 385.1 413.4 408.5 415.9 425.6 403.6 384.0
investment............................... 20 2,674.8 2,882.4 2,798.1 2,873.7 2,946.1 2,911.4 2,883.3 Federal ..................................... 21 979.3 1,071.9 1,026.5 1,056.1 1,098.0 1,107.0 1,102.1
National defense................... 22 662.2 734.9 699.9 723.3 759.5 757.0 748.9 Nondefense .......................... 23 317.1 337.0 326.6 332.9 338.5 350.0 353.2
State and local.......................... 24 1,695.5 1,810.4 1,771.6 1,817.6 1,848.1 1,804.4 1,781.2
Line 2007 2008
Seasonally adjusted at annual rates
2008 2009
I II III IV I
Gross domestic product .... Personal consumption
1 11,523.9 11,652.0 11,646.0 11,727.4 11,712.4 11,522.1 11,353.7
expenditures ........................... 2 8,252.8 8,272.1 8,316.1 8,341.3 8,260.6 8,170.5 8,202.0 Durable goods .......................... 3 1,242.4 1,188.5 1,237.0 1,228.3 1,180.1 1,108.6 1,134.4 Nondurable goods .................... 4 2,392.6 2,378.4 2,397.9 2,420.7 2,376.3 2,318.6 2,315.2 Services....................................
Gross private domestic 5 4,646.2 4,714.3 4,704.3 4,712.1 4,711.3 4,729.4 4,745.0
investment ............................... 6 1,809.7 1,689.1 1,754.7 1,702.0 1,703.7 1,596.0 1,346.7 Fixed investment ....................... 7 1,808.5 1,718.9 1,762.4 1,754.9 1,731.1 1,627.0 1,447.6
Nonresidential....................... 8 1,382.9 1,405.4 1,423.1 1,431.8 1,425.7 1,341.1 1,195.1 Structures ......................... 9 304.6 338.8 326.4 340.5 348.4 339.9 296.2 Equipment and software ... 10 1,078.9 1,047.0 1,088.6 1,074.7 1,054.0 970.5 876.4
Residential ............................ 11 453.8 359.5 383.0 369.6 353.7 331.6 293.4 Change in private inventories ...
Net exports of goods and 12 –2.5 –29.0 –10.2 –50.6 –29.6 –25.8 –91.4
services ................................... 13 –546.5 –390.2 –462.0 –381.3 –353.1 –364.5 –302.6 Exports ..................................... 14 1,425.9 1,514.1 1,500.6 1,544.7 1,556.1 1,454.9 1,336.8
Goods ................................... 15 998.7 1,058.5 1,048.6 1,088.9 1,098.7 997.7 886.0 Services................................ 16 426.9 455.2 451.7 455.8 457.4 455.7 447.3
Imports...................................... 17 1,972.4 1,904.3 1,962.6 1,926.0 1,909.1 1,819.4 1,639.5 Goods ................................... 18 1,677.7 1,608.1 1,662.0 1,631.6 1,612.2 1,526.8 1,345.9 Services................................
Government consumption expenditures and gross
19 296.4 297.0 301.8 295.5 297.9 292.8 289.6
investment ............................... 20 2,012.1 2,070.2 2,039.1 2,058.9 2,088.1 2,094.7 2,076.3 Federal...................................... 21 752.9 798.2 772.6 785.0 810.8 824.5 815.4
National defense................... 22 502.1 538.1 518.9 528.1 550.4 555.0 545.4 Nondefense .......................... 23 250.4 259.5 253.2 256.3 259.5 268.9 269.6
State and local .......................... 24 1,259.0 1,273.0 1,266.7 1,274.4 1,278.7 1,272.3 1,262.8 Residual........................................ 25 –55.1 –24.7 –56.3 –44.3 –16.4 19.3 8.9
NOTE. Chained (2000) dollar series are calculated as the product of the chain-type quantity index and the 2000 current-dollar value of the corresponding series, divided by 100. Because the formula for the chain-type quantity indexes uses weights of more than one period, the corresponding chained-dollar estimates are usually not additive. The residual line is the difference between the first line and the sum of the most detailed lines.

D–4 National Data June 2009
Table 1.1.7. Percent Change From Preceding Period in Prices for Table 1.1.8. Contributions to Percent Change in the Gross Domestic Product Gross Domestic Product Price Index
[Percent]
Line 2007 2008
Seasonally adjusted at annual rates
2008 2009
I II III IV I
Gross domestic product .... Personal consumption
1 2.7 2.2 2.6 1.1 3.9 0.5 2.8
expenditures ........................... 2 2.6 3.3 3.6 4.3 5.0 –4.9 –1.0 Durable goods .......................... 3 –1.8 –1.2 –0.1 –1.6 –0.6 –3.5 –1.7 Nondurable goods .................... 4 3.0 5.3 6.7 6.5 10.3 –16.6 –5.2 Services ...................................
Gross private domestic 5 3.3 3.2 2.8 4.2 3.4 1.1 1.1
investment............................... 6 1.4 0.7 –0.5 0.4 2.0 4.4 –1.9 Fixed investment....................... 7 1.4 0.6 –0.2 0.8 2.3 1.2 –1.9
Nonresidential ...................... 8 1.4 1.6 0.6 2.3 4.2 4.6 –1.2 Structures......................... 9 3.8 3.6 2.7 3.3 7.1 7.4 –3.2 Equipment and software 10 0.3 0.6 –0.4 1.7 2.6 3.0 0.1
Residential............................ 11 1.5 –2.4 –2.6 –3.5 –3.3 –9.4 –4.6 Change in private inventories ...
Net exports of goods and 12 .............. .............. ............. .............. .............. ............. ..............
services ................................... 13 .............. .............. ............. .............. .............. ............. .............. Exports ..................................... 14 3.5 5.3 9.1 10.8 6.7 –23.0 –11.0
Goods................................... 15 3.5 5.3 10.0 12.3 5.6 –26.0 –11.7 Services ............................... 16 3.5 5.4 6.9 7.5 9.3 –16.1 –9.6
Imports ..................................... 17 3.7 10.4 12.8 28.8 9.2 –37.3 –29.7 Goods................................... 18 3.6 11.1 13.8 31.2 9.8 –41.3 –32.9 Services ...............................
Government consumption expenditures and gross
19 3.7 7.1 7.8 16.8 6.2 –13.3 –14.3
investment............................... 20 4.5 4.7 6.2 7.0 4.4 –5.8 –0.3 Federal ..................................... 21 3.4 3.2 5.6 5.1 2.7 –3.4 2.7
National defense................... 22 3.5 3.6 5.1 6.3 3.1 –4.5 2.7 Nondefense .......................... 23 3.1 2.6 6.8 2.8 1.9 –0.9 2.7
State and local.......................... Addendum:
24 5.1 5.6 6.6 8.1 5.5 –7.3 –2.2
Gross national product ............. 25 2.7 2.2 2.6 1.1 3.9 0.6 2.8
Line 2007 2008
Seasonally adjusted at annual rates
2008 2009
I II III IV I
Percent change at annual rate: Gross domestic product ....
Percentage points at annual rates:
Personal consumption
1 2.7 2.2 2.6 1.1 3.9 0.5 2.8
expenditures ........................... 2 1.83 2.34 2.53 2.96 3.52 –3.51 –0.71 Durable goods .......................... 3 –0.15 –0.10 –0.01 –0.12 –0.04 –0.24 –0.11 Nondurable goods .................... 4 0.61 1.08 1.35 1.33 2.11 –3.73 –1.06 Services....................................
Gross private domestic 5 1.36 1.36 1.18 1.75 1.45 0.46 0.47
investment ............................... 6 0.23 0.09 –0.07 0.05 0.28 0.58 –0.23 Fixed investment ....................... 7 0.22 0.09 –0.04 0.12 0.34 0.17 –0.25
Nonresidential....................... 8 0.15 0.18 0.07 0.25 0.45 0.49 –0.12 Structures ......................... 9 0.13 0.13 0.10 0.12 0.27 0.28 –0.12 Equipment and software... 10 0.02 0.05 –0.03 0.12 0.18 0.20 0.01
Residential ............................ 11 0.08 –0.09 –0.10 –0.13 –0.12 –0.32 –0.14 Change in private inventories ...
Net exports of goods and 12 0.01 0.00 –0.04 –0.06 –0.05 0.41 0.02
services ................................... 13 –0.21 –1.12 –1.02 –3.26 –0.75 4.71 3.84 Exports ..................................... 14 0.41 0.66 1.11 1.36 0.88 –3.36 –1.34
Goods ................................... 15 0.28 0.46 0.84 1.06 0.52 –2.65 –0.95 Services................................ 16 0.12 0.21 0.27 0.29 0.37 –0.71 –0.39
Imports...................................... 17 –0.62 –1.78 –2.13 –4.61 –1.63 8.07 5.18 Goods ................................... 18 –0.52 –1.58 –1.92 –4.16 –1.46 7.66 4.75 Services................................
Government consumption expenditures and gross
19 –0.10 –0.20 –0.21 –0.45 –0.18 0.41 0.43
investment ............................... 20 0.85 0.92 1.20 1.36 0.89 –1.23 –0.07 Federal...................................... 21 0.24 0.23 0.40 0.37 0.20 –0.27 0.21
National defense................... 22 0.17 0.17 0.25 0.30 0.16 –0.24 0.14 Nondefense .......................... 23 0.07 0.06 0.15 0.06 0.04 –0.02 0.07
State and local .......................... 24 0.61 0.69 0.80 0.99 0.69 –0.96 –0.28
Table 1.1.9. Implicit Price Deflators for Gross Domestic Product Table 1.1.10. Percentage Shares of Gross Domestic Product [Index numbers, 2000=100] [Percent]
Line 2007 2008
Seasonally adjusted
2008 2009
I II III IV I
Gross domestic product .... Personal consumption
1 119.816 122.422 121.508 121.890 123.056 123.244 124.097
expenditures ........................... 2 117.659 121.588 120.277 121.539 123.036 121.509 121.203 Durable goods .......................... 3 87.154 86.092 86.584 86.240 86.113 85.360 85.002 Nondurable goods .................... 4 118.408 124.671 123.053 125.014 128.123 122.448 120.829 Services ...................................
Gross private domestic 5 124.712 128.748 127.128 128.445 129.532 129.880 130.228
investment............................... 6 117.718 118.023 117.174 117.564 118.032 119.434 118.709 Fixed investment....................... 7 117.995 118.711 118.116 118.352 119.035 119.399 118.817
Nonresidential ...................... 8 108.740 110.484 109.173 109.784 110.909 112.170 111.844 Structures......................... 9 157.661 163.325 160.172 161.486 164.276 167.219 165.857 Equipment and software 10 94.870 95.457 94.699 95.099 95.708 96.429 96.453
Residential............................ 11 138.885 135.676 137.878 136.665 135.512 132.204 130.665 Change in private inventories ...
Net exports of goods and 12 .............. .............. ............. .............. .............. ............. ..............
services ................................... 13 .............. .............. ............. .............. .............. ............. .............. Exports ..................................... 14 116.585 122.805 121.337 124.498 126.528 118.541 115.141
Goods................................... 15 115.062 121.225 119.864 123.403 125.083 116.031 112.467 Services ............................... 16 120.210 126.604 124.847 127.124 129.992 124.426 121.341
Imports ..................................... 17 120.168 132.782 128.730 137.144 140.198 124.755 114.225 Goods................................... 18 118.326 131.529 127.441 136.403 139.623 122.223 110.604 Services ............................... 19 129.929 139.194 135.364 140.727 142.859 137.866 132.630
Government consumption expenditures and gross investment............................... 20 132.940 139.229 137.223 139.573 141.092 138.987 138.872 Federal ..................................... 21 130.077 134.291 132.867 134.540 135.435 134.265 135.163
National defense................... 22 131.874 136.573 134.885 136.946 137.983 136.400 137.315 Nondefense .......................... 23 126.636 129.874 128.984 129.865 130.463 130.154 131.023
State and local.......................... Addendum:
24 134.671 142.212 139.854 142.619 144.527 141.825 141.056
Gross national product ............. 25 119.813 122.407 121.495 121.876 123.037 123.226 124.064
Line 2007 2008 2008 2009
I II III IV I
Gross domestic product .... Personal consumption
1 100.0 100.0 100.0 100.0 100.0 100.0 100.0
expenditures ........................... 2 70.3 70.5 70.7 70.9 70.5 69.9 70.6 Durable goods .......................... 3 7.8 7.2 7.6 7.4 7.1 6.7 6.8 Nondurable goods .................... 4 20.5 20.8 20.9 21.2 21.1 20.0 19.9 Services....................................
Gross private domestic 5 42.0 42.5 42.3 42.3 42.3 43.3 43.9
investment ............................... 6 15.4 14.0 14.5 14.0 14.0 13.4 11.3 Fixed investment ....................... 7 15.5 14.3 14.7 14.5 14.3 13.7 12.2
Nonresidential....................... 8 10.9 10.9 11.0 11.0 11.0 10.6 9.5 Structures ......................... 9 3.5 3.9 3.7 3.8 4.0 4.0 3.5 Equipment and software... 10 7.4 7.0 7.3 7.2 7.0 6.6 6.0
Residential ............................ 11 4.6 3.4 3.7 3.5 3.3 3.1 2.7 Change in private inventories ...
Net exports of goods and 12 0.0 –0.3 –0.2 –0.5 –0.3 –0.3 –0.9
services ................................... 13 –5.1 –4.7 –5.0 –5.0 –4.9 –3.8 –2.4 Exports ..................................... 14 12.0 13.0 12.9 13.5 13.7 12.1 10.9
Goods ................................... 15 8.3 9.0 8.9 9.4 9.5 8.2 7.1 Services................................ 16 3.7 4.0 4.0 4.1 4.1 4.0 3.9
Imports...................................... 17 17.2 17.7 17.9 18.5 18.6 16.0 13.3 Goods ................................... 18 14.4 14.8 15.0 15.6 15.6 13.1 10.6 Services................................
Government consumption expenditures and gross
19 2.8 2.9 2.9 2.9 3.0 2.8 2.7
investment ............................... 20 19.4 20.2 19.8 20.1 20.4 20.5 20.5 Federal...................................... 21 7.1 7.5 7.3 7.4 7.6 7.8 7.8
National defense................... 22 4.8 5.2 4.9 5.1 5.3 5.3 5.3 Nondefense .......................... 23 2.3 2.4 2.3 2.3 2.3 2.5 2.5
State and local .......................... 24 12.3 12.7 12.5 12.7 12.8 12.7 12.6

June 2009 SURVEY OF CURRENT BUSINESS D–5
Table 1.2.1. Percent Change From Preceding Period in Real Table 1.2.2. Contributions to Percent Change in Real Gross Domestic Product by Major Type of Product Gross Domestic Product by Major Type of Product
[Percent]
Line 2007 2008
Seasonally adjusted at annual rates
2008 2009
I II III IV I
Gross domestic product ....... Final sales of domestic
1 2.0 1.1 0.9 2.8 –0.5 –6.3 –5.7
product ............................ Change in private
2 2.4 1.4 0.9 4.4 –1.3 –6.2 –3.4
inventories ....................... 3 ............ ............. ............. ............ ............. ............. ............ Goods ............................................. 4 3.1 1.0 0.9 4.9 –4.2 –19.2 –7.6
Final sales ............................... 5 4.5 1.8 1.0 10.1 –6.7 –18.7 0.2 Change in private inventories 6 ............ ............. ............. ............ ............. ............. ............
Durable goods ............................. 7 4.2 1.4 0.7 –5.9 6.4 –22.2 –26.8 Final sales ............................... 8 5.9 1.2 0.9 1.4 –5.4 –21.3 –2.7 Change in private inventories 1 9 ............ ............. ............. ............ ............. ............. ............
Nondurable goods ....................... 10 2.3 0.6 1.1 14.1 –11.6 –16.8 9.1 Final sales ............................... 11 3.4 2.3 1.1 17.4 –7.7 –16.7 2.3 Change in private inventories 1 12 ............ ............. ............. ............ ............. ............. ............
Services 2 ....................................... 13 2.8 2.2 2.7 1.7 1.5 1.9 0.3 Structures ...................................... Addenda:
14 –5.0 –5.1 –10.1 3.3 –1.0 –13.8 –34.6
Motor vehicle output .................... Gross domestic product
15 –1.1 –17.7 –14.2 –33.8 7.3 –62.8 –56.5
excluding motor vehicle output 16 2.1 1.7 1.3 4.0 –0.7 –4.5 –4.5 Final sales of computers 3........... Gross domestic product
excluding final sales of
17 21.3 18.5 8.2 28.4 –1.7 –4.8 10.8
computers................................ Gross domestic purchases
excluding final sales of computers to domestic
18 1.9 1.0 0.8 2.7 –0.5 –6.4 –5.8
purchasers............................... 19 1.2 –0.4 0.0 –0.3 –1.4 –5.7 –7.6
Line 2007 2008
Seasonally adjusted at annual rates
2008 2009
I II III IV I
Percent change at annual rate: Gross domestic product ....... 1 2.0 1.1 0.9 2.8 –0.5 –6.3 –5.7
Percentage points at annual rates:
Final sales of domestic product.............................
Change in private 2 2.43 1.37 0.89 4.32 –1.35 –6.23 –3.38
inventories ....................... 3 –0.40 –0.26 –0.02 –1.50 0.84 –0.11 –2.34 Goods ............................................. 4 0.97 0.31 0.29 1.49 –1.29 –6.16 –2.23
Final sales................................ 5 1.37 0.57 0.31 2.98 –2.13 –6.05 0.11 Change in private inventories 6 –0.40 –0.26 –0.02 –1.50 0.84 –0.11 –2.34
Durable goods ............................. 7 0.57 0.20 0.10 –0.80 0.82 –3.15 –3.73 Final sales................................ 8 0.80 0.18 0.12 0.20 –0.74 –3.00 –0.29 Change in private inventories 1 9 –0.23 0.03 –0.02 –1.00 1.56 –0.15 –3.44
Nondurable goods ....................... 10 0.40 0.10 0.19 2.29 –2.11 –3.01 1.50 Final sales................................ 11 0.57 0.39 0.19 2.79 –1.39 –3.05 0.40 Change in private inventories 1 12 –0.17 –0.28 0.00 –0.49 –0.71 0.04 1.10
Services 2 ....................................... 13 1.61 1.32 1.62 1.02 0.87 1.17 0.21 Structures ....................................... Addenda:
14 –0.55 –0.52 –1.03 0.32 –0.09 –1.35 –3.70
Motor vehicle output .................... Gross domestic product excluding
15 –0.03 –0.50 –0.41 –1.01 0.16 –2.01 –1.36
motor vehicle output ................ 16 2.06 1.61 1.28 3.84 –0.67 –4.34 –4.36 Final sales of computers 3 ........... Gross domestic product excluding
17 0.13 0.12 0.05 0.17 –0.01 –0.02 0.06
final sales of computers........... 18 1.90 1.00 0.82 2.66 –0.50 –6.32 –5.78
1. Estimates for durable goods and nondurable goods for 1996 and earlier periods are based on the 1987 Standard Industrial Classification (SIC); later estimates for these industries are based on the North American Industry Classification System (NAICS).
2. Includes government consumption expenditures, which are for services (such as education and national defense) produced by government. In current dollars, these services are valued at their cost of production.
3. Some components of final sales of computers include computer parts.
Table 1.2.3. Real Gross Domestic Product by Major Type of Product, Quantity Indexes
[Index numbers, 2000=100]
Line 2007 2008
Seasonally adjusted
2008 2009
I II III IV I
Gross domestic product ....... Final sales of domestic
1 117.388 118.692 118.631 119.460 119.308 117.369 115.654
product ............................ Change in private
2 118.062 119.677 119.397 120.679 120.273 118.357 117.329
inventories ....................... 3 ............. ............ ............. ............ ............. ............. ............ Goods ............................................. 4 121.819 123.007 124.165 125.657 124.327 117.882 115.589
Final sales ............................... 5 123.980 126.238 126.661 129.733 127.497 121.063 121.122 Change in private inventories 6 ............. ............ ............. ............ ............. ............. ............
Durable goods ............................. 7 123.215 124.986 127.375 125.460 127.422 119.686 110.703 Final sales ............................... 8 126.764 128.332 130.779 131.235 129.429 121.887 121.061 Change in private inventories 1 9 ............. ............ ............. ............ ............. ............. ............
Nondurable goods ....................... 10 121.079 121.807 122.025 126.129 122.284 116.788 119.364 Final sales ............................... 11 122.064 124.829 123.725 128.779 126.215 120.596 121.298 Change in private inventories 1 12 ............. ............ ............. ............ ............. ............. ............
Services 2 ....................................... 13 118.248 120.874 120.128 120.637 121.075 121.655 121.755 Structures ...................................... Addenda:
14 101.904 96.687 97.097 97.897 97.653 94.103 84.613
Motor vehicle output .................... Gross domestic product
15 113.904 93.768 106.030 95.654 97.343 76.043 61.753
excluding motor vehicle output 16 117.488 119.435 119.009 120.173 119.967 118.590 117.237 Final sales of computers 3........... 17 278.889 330.612 317.000 337.452 336.042 331.953 340.609 Gross domestic product
excluding final sales of computers................................ 18 116.612 117.780 117.751 118.531 118.382 116.455 114.725
Gross domestic purchases excluding final sales of computers to domestic purchasers............................... 19 117.129 116.693 117.388 117.301 116.900 115.183 112.940
1. Estimates for durable goods and nondurable goods for 1996 and earlier periods are based on the 1987 Standard Industrial Classification (SIC); later estimates for these industries are based on the North American Industry Classification System (NAICS).
2. Includes government consumption expenditures, which are for services (such as education and national defense) produced by government. In current dollars, these services are valued at their cost of production.
3. Some components of final sales of computers include computer parts.
Table 1.2.4. Price Indexes for Gross Domestic Product by Major Type of Product
[Index numbers, 2000=100]
Line 2007 2008
Seasonally adjusted
2008 2009
I II III IV I
Gross domestic product ....... Final sales of domestic
1 119.819 122.500 121.613 121.951 123.134 123.302 124.168
product............................. Change in private
2 119.853 122.528 121.653 122.008 123.204 123.245 124.099
inventories ....................... 3 ............ ............. ............. ............ ............. ............. ............ Goods ............................................. 4 101.692 101.454 101.688 100.206 101.245 102.677 104.960
Final sales................................ 5 101.662 101.413 101.675 100.257 101.327 102.392 104.612 Change in private inventories 6 ............ ............. ............. ............ ............. ............. ............
Durable goods ............................. 7 90.584 89.051 89.625 88.743 88.924 88.911 89.545 Final sales................................ 8 90.447 89.039 89.522 88.703 88.935 88.998 89.601 Change in private inventories 1 9 ............ ............. ............. ............ ............. ............. ............
Nondurable goods ....................... 10 112.039 113.086 112.983 110.919 112.791 115.652 119.488 Final sales................................ 11 112.124 113.022 113.075 111.074 112.954 114.985 118.744 Change in private inventories 1 12 ............ ............. ............. ............ ............. ............. ............
Services 2 ....................................... 13 126.792 131.428 129.814 131.357 132.626 131.916 132.105 Structures ....................................... Addenda:
14 145.862 148.205 147.227 147.509 148.667 149.414 148.767
Motor vehicle output .................... Gross domestic product
15 96.738 94.271 95.413 94.710 94.312 92.648 93.827
excluding motor vehicle output 16 120.718 123.577 122.625 122.998 124.232 124.452 125.314 Final sales of computers 3 ........... 17 29.500 24.809 26.310 25.177 24.327 23.420 22.825 Gross domestic product
excluding final sales of computers ................................ 18 121.184 124.054 123.102 123.482 124.715 124.916 125.819
1. Estimates for durable goods and nondurable goods for 1996 and earlier periods are based on the 1987 Standard Industrial Classification (SIC); later estimates for these industries are based on the North American Industry Classification System (NAICS).
2. Includes government consumption expenditures, which are for services (such as education and national defense) produced by government. In current dollars, these services are valued at their cost of production.
3. Some components of final sales of computers include computer parts.

D–6 National Data June 2009
Table 1.2.5. Gross Domestic Product Table 1.2.6. Real Gross Domestic Product by Major Type of Product by Major Type of Product, Chained Dollars
[Billions of dollars] [Billions of chained (2000) dollars]
Line 2007 2008
Seasonally adjusted at annual rates
2008 2009
I II III IV I
Gross domestic product ....... Final sales of domestic
1 13,807.5 14,264.6 14,150.8 14,294.5 14,412.8 14,200.3 14,089.7
product ............................ Change in private
2 13,811.2 14,311.6 14,176.4 14,370.5 14,462.5 14,236.9 14,211.0
inventories ....................... 3 –3.6 –47.0 –25.6 –76.0 –49.7 –36.6 –121.4 Goods ............................................. 4 4,272.7 4,296.0 4,343.9 4,337.1 4,333.6 4,169.3 4,177.8
Final sales ............................... 5 4,276.4 4,342.9 4,369.5 4,413.1 4,383.3 4,205.9 4,299.1 Change in private inventories 6 –3.6 –47.0 –25.6 –76.0 –49.7 –36.6 –121.4
Durable goods ............................. 7 1,885.4 1,880.5 1,928.7 1,881.0 1,914.2 1,798.0 1,675.2 Final sales ............................... 8 1,895.6 1,889.5 1,935.9 1,924.9 1,903.4 1,793.7 1,793.6 Change in private inventories 1 9 –10.2 –9.0 –7.2 –43.9 10.9 4.3 –118.4
Nondurable goods ....................... 10 2,387.3 2,415.5 2,415.2 2,456.1 2,419.4 2,371.3 2,502.5 Final sales ............................... 11 2,380.8 2,453.5 2,433.6 2,488.2 2,480.0 2,412.2 2,505.5 Change in private inventories 1 12 6.5 –38.0 –18.4 –32.1 –60.5 –40.8 –3.0
Services 2 ....................................... 13 8,134.5 8,618.8 8,460.2 8,597.0 8,711.5 8,706.4 8,726.1 Structures....................................... Addenda:
14 1,400.3 1,349.8 1,346.7 1,360.4 1,367.7 1,324.6 1,185.8
Motor vehicle output .................... Gross domestic product
15 402.2 322.4 368.5 330.4 333.5 257.2 211.1
excluding motor vehicle output 16 13,405.3 13,942.2 13,782.3 13,964.1 14,079.3 13,943.2 13,878.5 Final sales of computers 3........... Gross domestic product
excluding final sales of
17 90.4 90.7 92.3 94.0 90.4 86.0 86.0
computers................................ 18 13,717.1 14,173.9 14,058.6 14,200.5 14,322.4 14,114.3 14,003.7
Line 2007 2008
Seasonally adjusted at annual rates
2008 2009
I II III IV I
Gross domestic product ...... Final sales of domestic
1 11,523.9 11,652.0 11,646.0 11,727.4 11,712.4 11,522.1 11,353.7
product............................ Change in private
2 11,523.4 11,681.0 11,653.7 11,778.8 11,739.2 11,552.2 11,451.9
inventories ...................... 3 –2.5 –29.0 –10.2 –50.6 –29.6 –25.8 –91.4 Residual.............................. 4 3.0 0.0 2.5 –0.8 2.8 –4.3 –6.8
Goods ............................................ 5 4,201.9 4,243.0 4,282.9 4,334.3 4,288.5 4,066.1 3,987.1 Final sales............................... 6 4,206.5 4,283.1 4,297.4 4,401.6 4,325.8 4,107.5 4,109.5 Change in private inventories 7 –2.5 –29.0 –10.2 –50.6 –29.6 –25.8 –91.4
Durable goods ............................ 8 2,081.6 2,111.5 2,151.8 2,119.5 2,152.6 2,021.9 1,870.2 Final sales............................... 9 2,095.8 2,121.7 2,162.2 2,169.7 2,139.9 2,015.2 2,001.5 Change in private inventories 1 10 –8.7 –7.2 –6.1 –36.1 9.3 3.9 –103.2
Nondurable goods ...................... 11 2,131.0 2,143.8 2,147.6 2,219.8 2,152.2 2,055.4 2,100.8 Final sales............................... 12 2,123.3 2,171.4 2,152.2 2,240.2 2,195.6 2,097.8 2,110.0 Change in private inventories 1 13 5.3 –20.6 –4.3 –16.9 –34.3 –27.0 3.7
Services 2 ...................................... 14 6,415.6 6,558.1 6,517.6 6,545.3 6,569.0 6,600.5 6,605.9 Structures ...................................... 15 960.0 910.8 914.7 922.2 919.9 886.5 797.1 Residual.......................................... Addenda:
16 –67.4 –82.2 –90.3 –97.0 –87.0 –54.8 –61.3
Motor vehicle output ................... Gross domestic product
17 415.7 342.2 387.0 349.1 355.3 277.5 225.4
excluding motor vehicle output 18 11,105.0 11,289.0 11,248.7 11,358.8 11,339.3 11,209.1 11,081.2 Final sales of computers 3 .......... Gross domestic product
excluding final sales of
19 306.6 363.5 348.5 371.0 369.4 364.9 374.5
computers ............................... 20 11,319.6 11,432.9 11,430.1 11,505.8 11,491.4 11,304.3 11,136.4 1. Estimates for durable goods and nondurable goods for 1996 and earlier periods are based on the 1987 Standard Industrial Classification (SIC); later estimates for these industries are based on the North American Industry Classification System (NAICS).
2. Includes government consumption expenditures, which are for services (such as education and national defense) produced by government. In current dollars, these services are valued at their cost of production.
3. Some components of final sales of computers include computer parts.
Table 1.3.1. Percent Change From Preceding Period in Real Gross Value Added by Sector
[Percent]
Line 2007 2008
Seasonally adjusted at annual rates
2008 2009
I II III IV I
Gross domestic product .... 1 2.0 1.1 0.9 2.8 –0.5 –6.3 –5.7 Business 1................................... 2 2.0 0.8 0.7 2.6 –1.8 –8.5 –7.2
Nonfarm 2 ................................. 3 2.0 0.8 0.9 2.8 –1.9 –8.8 –7.6 Farm ......................................... 4 9.7 –1.9 –15.5 –10.7 7.1 26.1 35.8
Households and institutions ..... 5 2.7 2.3 0.8 4.5 4.5 –0.3 –3.2 Households .............................. 6 3.0 1.7 –1.2 5.0 5.5 –1.6 –6.8 Nonprofit institutions serving
households 3 ........................ 7 2.2 3.0 3.5 3.7 3.3 1.4 1.4 General government 4 ................ 8 1.3 2.1 2.2 2.4 3.0 2.2 1.5
Federal ..................................... 9 0.7 3.7 3.7 4.3 6.9 6.8 4.9 State and local.......................... 10 1.6 1.4 1.6 1.6 1.4 0.2 0.0
Addendum: Gross housing value added...... 11 3.7 2.1 –1.0 5.4 5.5 –1.3 –6.5
1. Equals gross domestic product excluding gross value added of households and institutions and of general government. 2. Equals gross domestic business value added excluding gross farm value added. 3. Equals compensation of employees of nonprofit institutions, the rental value of nonresidential fixed assets owned and
used by nonprofit institutions serving households, and rental income of persons for tenant-occupied housing owned by nonprofit institutions.
4. Equals compensation of general government employees plus general government consumption of fixed capital.
1. Estimates for durable goods and nondurable goods for 1996 and earlier periods are based on the 1987 Standard Industrial Classification (SIC); later estimates for these industries are based on the North American Industry Classification System (NAICS).
2. Includes government consumption expenditures, which are for services (such as education and national defense) produced by government. In current dollars, these services are valued at their cost of production.
3. Some components of final sales of computers include computer parts. NOTE. Chained (2000) dollar series are calculated as the product of the chain-type quantity index and the 2000 current-
dollar value of the corresponding series, divided by 100. Because the formula for the chain-type quantity indexes uses weights of more than one period, the corresponding chained-dollar estimates are usually not additive. The residual line following change in private inventories is the difference between gross domestic product and the sum of final sales of domestic product and of change in private inventories; the residual line following structures is the difference between gross domestic product and the sum of the detailed lines of goods, of services, and of structures.
Table 1.3.3. Real Gross Value Added by Sector, Quantity Indexes
[Index numbers, 2000=100]
Line 2007 2008
Seasonally adjusted
2008 2009
I II III IV I
Gross domestic product .... 1 117.388 118.692 118.631 119.460 119.308 117.369 115.654 Business 1 ................................... 2 119.063 119.985 120.328 121.115 120.573 117.925 115.739
Nonfarm 2 ................................. 3 118.951 119.919 120.265 121.106 120.532 117.775 115.469 Farm ......................................... 4 127.943 125.547 125.276 121.771 123.878 131.263 141.712
Households and institutions ..... 5 115.821 118.493 116.894 118.174 119.490 119.414 118.438 Households............................... 6 118.550 120.623 118.834 120.301 121.920 121.436 119.309 Nonprofit institutions serving
households 3......................... 7 112.654 116.047 114.675 115.732 116.684 117.098 117.501 General government 4 ................ 8 108.403 110.718 109.661 110.322 111.147 111.742 112.155
Federal...................................... 9 107.655 111.668 109.403 110.570 112.424 114.275 115.647 State and local .......................... 10 108.732 110.297 109.773 110.210 110.581 110.625 110.615
Addendum: Gross housing value added ...... 11 115.030 117.477 115.635 117.179 118.749 118.347 116.378
1. Equals gross domestic product excluding gross value added of households and institutions and of general government. 2. Equals gross domestic business value added excluding gross farm value added. 3. Equals compensation of employees of nonprofit institutions, the rental value of nonresidential fixed assets owned and
used by nonprofit institutions serving households, and rental income of persons for tenant-occupied housing owned by nonprofit institutions.
4. Equals compensation of general government employees plus general government consumption of fixed capital.

June 2009 SURVEY OF CURRENT BUSINESS D–7
Table 1.3.4. Price Indexes for Gross Value Added by Sector Table 1.3.5. Gross Value Added by Sector [Index numbers, 2000=100] [Billions of dollars]
Line 2007 2008
Seasonally adjusted
2008 2009
I II III IV I
Gross domestic product .... 1 119.819 122.500 121.613 121.951 123.134 123.302 124.168 Business 1................................... 2 116.631 118.821 118.051 118.251 119.505 119.478 120.159
Nonfarm 2 ................................. 3 116.321 118.529 117.637 117.860 119.226 119.395 120.228 Farm ......................................... 4 149.982 150.179 162.072 159.800 149.255 129.587 116.304
Households and institutions ..... 5 126.083 130.431 129.363 129.987 130.735 131.640 132.604 Households .............................. 6 120.862 125.122 124.126 124.831 125.332 126.198 127.222 Nonprofit institutions serving
households 3 ........................ 7 132.840 137.292 136.128 136.640 137.722 138.680 139.559 General government 4 ................ 8 136.547 141.248 139.658 140.764 141.853 142.718 144.861
Federal ..................................... 9 142.629 146.493 145.621 146.562 146.879 146.908 151.427 State and local.......................... 10 134.010 139.063 137.167 138.343 139.758 140.982 142.093
Addendum: Gross housing value added...... 11 121.146 125.509 124.357 125.104 125.781 126.795 127.890
Line 2007 2008
Seasonally adjusted at annual rates
2008 2009
I II III IV I
Gross domestic product .... 1 13,807.5 14,264.6 14,150.8 14,294.5 14,412.8 14,200.3 14,089.7 Business 1 ................................... 2 10,642.3 10,917.6 10,874.7 10,969.5 11,034.3 10,791.8 10,650.7
Nonfarm 2 ................................. 3 10,505.1 10,791.2 10,739.2 10,838.2 10,910.2 10,677.3 10,539.7 Farm ......................................... 4 137.3 126.3 135.5 131.3 124.1 114.5 111.0
Households and institutions ..... 5 1,582.0 1,674.3 1,638.1 1,664.0 1,692.2 1,702.9 1,701.3 Households............................... 6 882.1 929.2 908.1 924.5 940.7 943.4 934.4 Nonprofit institutions serving
households 3......................... 7 699.9 745.1 730.0 739.5 751.5 759.4 766.9 General government 4 ................ 8 1,583.2 1,672.7 1,638.0 1,661.0 1,686.3 1,705.7 1,737.7
Federal...................................... 9 484.2 515.9 502.4 511.1 520.7 529.4 552.3 State and local .......................... 10 1,099.0 1,156.8 1,135.6 1,149.9 1,165.6 1,176.2 1,185.4
Addendum: Gross housing value added ...... 11 1,106.9 1,171.1 1,142.1 1,164.3 1,186.3 1,191.8 1,182.1
1. Equals gross domestic product excluding gross value added of households and institutions and of general govern- 1. Equals gross domestic product excluding gross value added of households and institutions and of general government. ment.
2. Equals gross domestic business value added excluding gross farm value added. 2. Equals gross domestic business value added excluding gross farm value added. 3. Equals compensation of employees of nonprofit institutions, the rental value of nonresidential fixed assets owned and 3. Equals compensation of employees of nonprofit institutions, the rental value of nonresidential fixed assets owned and
used by nonprofit institutions serving households, and rental income of persons for tenant-occupied housing owned by used by nonprofit institutions serving households, and rental income of persons for tenant-occupied housing owned by nonprofit institutions. nonprofit institutions.
4. Equals compensation of general government employees plus general government consumption of fixed capital. 4. Equals compensation of general government employees plus general government consumption of fixed capital.
Table 1.3.6. Real Gross Value Added by Sector, Chained Dollars [Billions of chained (2000) dollars]
Line 2007 2008
Seasonally adjusted at annual rates
2008 2009
I II III IV I
Gross domestic product ............................................. 1 11,523.9 11,652.0 11,646.0 11,727.4 11,712.4 11,522.1 11,353.7 Business 1 ............................................................................ 2 9,128.2 9,198.9 9,225.2 9,285.5 9,243.9 9,040.9 8,873.3
Nonfarm 2 .......................................................................... 3 9,034.5 9,108.1 9,134.3 9,198.2 9,154.6 8,945.2 8,770.0 Farm .................................................................................. 4 91.5 89.8 89.6 87.1 88.6 93.9 101.4
Households and institutions .............................................. 5 1,251.7 1,280.6 1,263.3 1,277.1 1,291.3 1,290.5 1,280.0 Households ....................................................................... 6 729.9 742.6 731.6 740.6 750.6 747.6 734.5 Nonprofit institutions serving households 3 ....................... 7 523.9 539.7 533.3 538.2 542.7 544.6 546.5
General government 4 ......................................................... 8 1,159.5 1,184.2 1,172.9 1,180.0 1,188.8 1,195.2 1,199.6 Federal .............................................................................. 9 339.5 352.2 345.0 348.7 354.5 360.4 364.7 State and local................................................................... 10 820.1 831.9 827.9 831.2 834.0 834.4 834.3
Residual................................................................................. 11 –15.5 –12.3 –15.7 –16.6 –12.6 –4.0 2.3 Addendum:
Gross housing value added............................................... 12 913.7 933.1 918.5 930.7 943.2 940.0 924.4
1. Equals gross domestic product excluding gross value added of households 4. Equals compensation of general government employees plus general and institutions and of general government. government consumption of fixed capital.
2. Equals gross domestic business value added excluding gross farm value NOTE. Chained (2000) dollar series are calculated as the product of the chain-added. type quantity index and the 2000 current-dollar value of the corresponding
3. Equals compensation of employees of nonprofit institutions, the rental series, divided by 100. Because the formula for the chain-type quantity indexes value of nonresidential fixed assets owned and used by nonprofit institutions uses weights of more than one period, the corresponding chained-dollar estiserving households, and rental income of persons for tenant-occupied housing mates are usually not additive. The residual line is the difference between the owned by nonprofit institutions. first line and the sum of the most detailed lines.
Table 1.4.1. Percent Change From Preceding Period in Real Gross Domestic Product, Real Gross Domestic Purchases, and Real Final Sales to Domestic Purchasers
[Percent]
Line 2007 2008
Seasonally adjusted at annual rates
2008 2009
I II III IV I
Gross domestic product ..................................................... 1 2.0 1.1 0.9 2.8 –0.5 –6.3 –5.7 Less: Exports of goods and services .................................... 2 8.4 6.2 5.1 12.3 3.0 –23.6 –28.7 Plus: Imports of goods and services ..................................... 3 2.2 –3.5 –0.8 –7.3 –3.5 –17.5 –34.1 Equals: Gross domestic purchases................................... 4 1.4 –0.3 0.1 –0.1 –1.5 –5.9 –7.5 Less: Change in private inventories....................................... 5 ................ ................ ................. ................ ................. ................ ................. Equals: Final sales to domestic purchasers ..................... 6 1.8 0.0 0.1 1.3 –2.3 –5.8 –5.3 Addendum:
Final sales of domestic product ......................................... 7 2.4 1.4 0.9 4.4 –1.3 –6.2 –3.4

D–8 National Data June 2009
Table 1.4.3. Real Gross Domestic Product, Real Gross Domestic Table 1.4.4. Price Indexes for Gross Domestic Product, Gross Domestic Purchases, and Real Final Sales to Domestic Purchasers, Quantity Indexes Purchases, and Final Sales to Domestic Purchasers
[Index numbers, 2000=100] [Index numbers, 2000=100]
Line 2007 2008
Seasonally adjusted
2008 2009
I II III IV I
Gross domestic product ............ Less: Exports of goods and
1 117.388 118.692 118.631 119.460 119.308 117.369 115.654
services .................................... Plus: Imports of goods and
2 130.068 138.111 136.880 140.908 141.943 132.713 121.943
services .................................... Equals: Gross domestic
3 133.654 129.038 132.991 130.509 129.367 123.283 111.092
purchases................................ Less: Change in private
4 118.343 118.033 118.726 118.694 118.255 116.457 114.201
inventories ................................ Equals: Final sales to domestic
5 .............. .............. ............. .............. ............. .............. .............
purchasers .............................. Addendum:
6 118.995 118.971 119.461 119.853 119.173 117.397 115.798
Final sales of domestic product 7 118.062 119.677 119.397 120.679 120.273 118.357 117.329
Line 2007 2008
Seasonally adjusted
2008 2009
I II III IV I
Gross domestic product ............ Less: Exports of goods and
1 119.819 122.500 121.613 121.951 123.134 123.302 124.168
services .................................... Plus: Imports of goods and
2 116.586 122.788 121.397 124.560 126.592 118.601 115.199
services .................................... Equals: Gross domestic
3 120.168 132.698 128.722 137.136 140.189 124.747 114.218
purchases ................................ Less: Change in private
4 120.294 124.158 122.821 124.103 125.475 124.232 123.929
inventories ................................ Equals: Final sales to domestic
5 .............. ............. .............. ............. .............. ............. ..............
purchasers............................... Addendum:
6 120.329 124.187 122.863 124.160 125.543 124.181 123.873
Final sales of domestic product 7 119.853 122.528 121.653 122.008 123.204 123.245 124.099
Table 1.4.5. Relation of Gross Domestic Product, Gross Domestic Table 1.4.6. Relation of Real Gross Domestic Product, Real Gross Domestic Purchases, and Final Sales to Domestic Purchasers Purchases, and Real Final Sales to Domestic Purchasers, Chained Dollars
[Billions of dollars] [Billions of chained (2000) dollars]
Line 2007 2008
Seasonally adjusted at annual rates
2008 2009
I II III IV I
Gross domestic product ............ Less: Exports of goods and
1 13,807.5 14,264.6 14,150.8 14,294.5 14,412.8 14,200.3 14,089.7
services .................................... Plus: Imports of goods and
2 1,662.4 1,859.4 1,820.8 1,923.2 1,968.9 1,724.7 1,539.3
services .................................... Equals: Gross domestic
3 2,370.2 2,528.6 2,526.5 2,641.4 2,676.6 2,269.7 1,872.7
purchases................................ Less: Change in private
4 14,515.3 14,933.8 14,856.6 15,012.7 15,120.5 14,745.4 14,423.1
inventories ................................ Equals: Final sales to domestic
5 –3.6 –47.0 –25.6 –76.0 –49.7 –36.6 –121.4
purchasers .............................. Addendum:
6 14,519.0 14,980.7 14,882.2 15,088.7 15,170.2 14,782.0 14,544.4
Final sales of domestic product 7 13,811.2 14,311.6 14,176.4 14,370.5 14,462.5 14,236.9 14,211.0
Line 2007 2008
Seasonally adjusted at annual rates
2008 2009
I II III IV I
Gross domestic product ............ Less: Exports of goods and
1 11,523.9 11,652.0 11,646.0 11,727.4 11,712.4 11,522.1 11,353.7
services .................................... Plus: Imports of goods and
2 1,425.9 1,514.1 1,500.6 1,544.7 1,556.1 1,454.9 1,336.8
services .................................... Equals: Gross domestic
3 1,972.4 1,904.3 1,962.6 1,926.0 1,909.1 1,819.4 1,639.5
purchases ................................ Less: Change in private
4 12,066.8 12,035.2 12,105.8 12,102.6 12,057.8 11,874.5 11,644.4
inventories ................................ Equals: Final sales to domestic
5 –2.5 –29.0 –10.2 –50.6 –29.6 –25.8 –91.4
purchasers............................... Addendum:
6 12,066.0 12,063.6 12,113.3 12,153.0 12,084.1 11,904.0 11,741.9
Final sales of domestic product 7 11,523.4 11,681.0 11,653.7 11,778.8 11,739.2 11,552.2 11,451.9
NOTE. Chained (2000) dollar series are calculated as the product of the chain-type quantity index and the 2000 current-dollar value of the corresponding series, divided by 100. Because the formula for the chain-type quantity indexes uses weights of more than one period, the corresponding chained-dollar estimates are usually not additive.

June 2009 SURVEY OF CURRENT BUSINESS D–9
Table 1.5.1. Percent Change From Preceding Period in Real Table 1.5.2. Contributions to Percent Change in Real Gross Domestic Product, Expanded Detail Gross Domestic Product, Expanded Detail
[Percent]
Line 2007 2008
Seasonally adjusted at annual rates
2008 2009
I II III IV I
Gross domestic product .... Personal consumption
1 2.0 1.1 0.9 2.8 –0.5 –6.3 –5.7
expenditures ........................... 2 2.8 0.2 0.9 1.2 –3.8 –4.3 1.5 Durable goods .......................... 3 4.8 –4.3 –4.3 –2.8 –14.8 –22.1 9.6
Motor vehicles and parts ...... Furniture and household
4 2.0 –13.3 –10.7 –19.7 –26.6 –37.9 19.1
equipment......................... 5 8.0 3.4 1.8 14.0 –8.2 –8.8 4.2 Other .................................... 6 4.8 –0.8 –2.3 2.4 –4.6 –17.0 6.2
Nondurable goods .................... 7 2.5 –0.6 –0.4 3.9 –7.1 –9.4 –0.6 Food ..................................... 8 1.9 –0.1 1.3 4.1 –7.3 –14.7 –3.1 Clothing and shoes............... Gasoline, fuel oil, and other
9 4.7 0.4 3.0 10.9 –13.3 –9.3 0.1
energy goods.................... 10 0.8 –4.5 –6.0 –6.4 –13.4 8.6 5.6 Other .................................... 11 3.2 0.3 –1.8 6.2 0.2 –7.8 1.3
Services ................................... 12 2.6 1.5 2.4 0.7 –0.1 1.5 1.3 Housing ................................ 13 1.5 0.9 0.5 1.7 0.7 0.4 –0.1 Household operation ............ 14 1.8 –0.3 1.8 –4.3 –8.2 8.2 7.5
Electricity and gas ............ 15 1.9 –2.0 7.4 –11.0 –20.7 19.1 18.1 Other household operation 16 1.8 1.1 –2.1 1.0 2.1 0.9 0.4
Transportation....................... 17 1.9 –0.6 1.7 –3.0 –2.3 –6.6 –5.0 Medical care ......................... 18 2.9 3.5 4.9 2.8 2.5 3.0 2.0 Recreation ............................ 19 4.5 –0.8 –4.7 1.3 –1.5 –1.1 2.3 Other ....................................
Gross private domestic 20 3.2 1.4 4.1 –0.3 0.2 1.4 1.1
investment............................... 21 –5.4 –6.7 –5.8 –11.5 0.4 –23.0 –49.3 Fixed investment....................... 22 –3.1 –5.0 –5.6 –1.7 –5.3 –22.0 –37.3
Nonresidential ...................... 23 4.9 1.6 2.4 2.5 –1.7 –21.7 –36.9 Structures......................... 24 12.7 11.2 8.6 18.5 9.7 –9.4 –42.3 Equipment and software...
Information processing equipment and
25 1.7 –3.0 –0.6 –5.0 –7.5 –28.1 –33.5
software.................... Computers and
peripheral
26 9.6 4.7 7.2 8.0 –4.2 –22.8 –18.0
equipment ............ 27 17.9 6.5 16.1 13.0 –22.4 –38.7 –12.5 Software 1 ................ 28 10.0 4.8 9.9 2.1 –4.4 –13.3 –19.9 Other ........................ 29 5.4 3.7 0.2 13.0 5.3 –26.1 –17.9
Industrial equipment..... Transportation
30 1.4 –4.2 0.8 –3.6 –8.8 –14.7 –47.4
equipment ................ 31 –12.6 –28.6 –14.0 –46.6 –44.7 –70.0 –74.6 Other equipment .......... 32 –5.2 –1.4 –12.5 –3.2 18.0 –23.0 –33.2
Residential............................ 33 –17.9 –20.8 –25.1 –13.3 –16.0 –22.8 –38.7 Change in private inventories ... 34 ............. ............. ............. ............. ............. ............. .............
Farm ..................................... 35 ............. ............. ............. ............. ............. ............. ............. Nonfarm................................
Net exports of goods and 36 ............. ............. ............. ............. ............. ............. .............
services ................................... 37 ............. ............. ............. ............. ............. ............. ............. Exports ..................................... 38 8.4 6.2 5.1 12.3 3.0 –23.6 –28.7
Goods................................... 39 7.5 6.0 4.5 16.3 3.7 –32.0 –37.8 Services ............................... 40 10.5 6.6 6.4 3.8 1.4 –1.5 –7.2
Imports ..................................... 41 2.2 –3.5 –0.8 –7.3 –3.5 –17.5 –34.1 Goods................................... 42 1.7 –4.1 –2.0 –7.1 –4.7 –19.6 –39.6 Services ...............................
Government consumption expenditures and gross
43 4.4 0.2 5.5 –8.0 3.3 –6.7 –4.3
investment............................... 44 2.1 2.9 1.9 3.9 5.8 1.3 –3.5 Federal ..................................... 45 1.6 6.0 5.8 6.6 13.8 7.0 –4.3
National defense................... 46 2.5 7.2 7.3 7.3 18.0 3.4 –6.8 Consumption expenditures 47 2.6 6.3 7.4 3.4 17.3 3.7 –5.8 Gross investment.............. 48 1.6 13.6 6.0 38.7 22.7 1.5 –12.9
Nondefense .......................... 49 –0.2 3.6 2.9 5.0 5.1 15.3 1.0 Consumption expenditures 50 –0.2 2.9 2.9 4.0 5.6 10.4 6.1 Gross investment.............. 51 0.2 8.2 2.8 11.8 1.5 52.4 –26.2
State and local.......................... 52 2.3 1.1 –0.3 2.5 1.3 –2.0 –2.9 Consumption expenditures 53 2.0 1.3 1.4 1.2 1.1 0.0 –0.5 Gross investment.................. 54 3.7 0.3 –6.8 7.8 2.3 –9.6 –12.0
Line 2007 2008
Seasonally adjusted at annual rates
2008 2009
I II III IV I
Percent change at annual rate: Gross domestic product ....
Percentage points at annual rates:
Personal consumption
1 2.0 1.1 0.9 2.8 –0.5 –6.3 –5.7
expenditures ........................... 2 1.95 0.16 0.61 0.87 –2.75 –2.99 1.08 Durable goods .......................... 3 0.38 –0.33 –0.33 –0.21 –1.16 –1.67 0.62
Motor vehicles and parts ...... Furniture and household
4 0.07 –0.42 –0.35 –0.64 –0.83 –1.13 0.41
equipment......................... 5 0.24 0.10 0.05 0.39 –0.25 –0.25 0.12 Other..................................... 6 0.08 –0.01 –0.04 0.04 –0.08 –0.29 0.10
Nondurable goods .................... 7 0.50 –0.13 –0.08 0.80 –1.57 –1.97 –0.11 Food...................................... 8 0.18 –0.02 0.13 0.40 –0.75 –1.52 –0.30 Clothing and shoes ............... Gasoline, fuel oil, and other
9 0.13 0.01 0.08 0.28 –0.38 –0.24 0.00
energy goods .................... 10 0.02 –0.14 –0.18 –0.20 –0.45 0.23 0.11 Other..................................... 11 0.17 0.02 –0.10 0.33 0.01 –0.43 0.07
Services.................................... 12 1.07 0.62 1.02 0.28 –0.03 0.66 0.58 Housing................................. 13 0.16 0.10 0.05 0.18 0.08 0.04 –0.01 Household operation............. 14 0.07 –0.01 0.07 –0.17 –0.33 0.31 0.29
Electricity and gas ............ 15 0.03 –0.04 0.11 –0.19 –0.38 0.29 0.28 Other household operation 16 0.04 0.02 –0.05 0.02 0.05 0.02 0.01
Transportation ....................... 17 0.05 –0.02 0.04 –0.08 –0.06 –0.17 –0.13 Medical care ......................... 18 0.35 0.43 0.59 0.35 0.31 0.38 0.26 Recreation ............................ 19 0.13 –0.02 –0.14 0.04 –0.04 –0.03 0.07 Other.....................................
Gross private domestic 20 0.31 0.14 0.40 –0.03 0.02 0.14 0.11
investment ............................... 21 –0.90 –1.02 –0.89 –1.74 0.06 –3.47 –8.27 Fixed investment ....................... 22 –0.50 –0.76 –0.86 –0.25 –0.79 –3.36 –5.93
Nonresidential....................... 23 0.52 0.17 0.26 0.27 –0.19 –2.56 –4.54 Structures ......................... 24 0.40 0.39 0.30 0.64 0.36 –0.38 –2.02 Equipment and software ...
Information processing equipment and
25 0.13 –0.22 –0.04 –0.37 –0.55 –2.18 –2.52
software .................... Computers and
peripheral
26 0.34 0.18 0.27 0.30 –0.16 –0.92 –0.68
equipment............. 27 0.11 0.05 0.10 0.08 –0.16 –0.28 –0.07 Software 1................. 28 0.15 0.08 0.16 0.04 –0.08 –0.23 –0.35 Other......................... 29 0.08 0.05 0.00 0.18 0.08 –0.42 –0.26
Industrial equipment ..... Transportation
30 0.02 –0.06 0.01 –0.05 –0.12 –0.19 –0.72
equipment................. 31 –0.17 –0.32 –0.16 –0.58 –0.47 –0.75 –0.66 Other equipment........... 32 –0.07 –0.02 –0.16 –0.04 0.20 –0.31 –0.46
Residential ............................ 33 –1.02 –0.93 –1.12 –0.52 –0.60 –0.80 –1.39 Change in private inventories ... 34 –0.40 –0.26 –0.02 –1.50 0.84 –0.11 –2.34
Farm ..................................... 35 0.04 0.02 –0.17 –0.14 0.01 0.06 0.04 Nonfarm................................
Net exports of goods and 36 –0.44 –0.28 0.15 –1.36 0.83 –0.17 –2.38
services ................................... 37 0.58 1.40 0.77 2.93 1.05 –0.15 2.18 Exports ..................................... 38 0.95 0.76 0.63 1.54 0.40 –3.44 –3.86
Goods ................................... 39 0.59 0.51 0.39 1.39 0.34 –3.38 –3.57 Services................................ 40 0.36 0.25 0.24 0.15 0.06 –0.06 –0.29
Imports...................................... 41 –0.37 0.64 0.14 1.39 0.65 3.29 6.05 Goods ................................... 42 –0.25 0.65 0.29 1.14 0.74 3.09 5.92 Services................................
Government consumption expenditures and gross
43 –0.12 –0.01 –0.15 0.25 –0.09 0.20 0.12
investment ............................... 44 0.40 0.57 0.38 0.78 1.14 0.26 –0.71 Federal...................................... 45 0.11 0.43 0.41 0.47 0.97 0.52 –0.34
National defense................... 46 0.12 0.35 0.34 0.36 0.85 0.18 –0.37 Consumption expenditures 47 0.11 0.27 0.31 0.15 0.72 0.17 –0.27 Gross investment .............. 48 0.01 0.08 0.04 0.21 0.14 0.01 –0.09
Nondefense .......................... 49 0.00 0.08 0.06 0.11 0.12 0.34 0.03 Consumption expenditures 50 0.00 0.06 0.06 0.08 0.11 0.21 0.13 Gross investment .............. 51 0.00 0.02 0.01 0.03 0.00 0.14 –0.10
State and local .......................... 52 0.28 0.14 –0.03 0.31 0.17 –0.25 –0.37 Consumption expenditures ... 53 0.20 0.13 0.14 0.12 0.11 0.00 –0.05 Gross investment .................. 54 0.09 0.01 –0.18 0.19 0.06 –0.25 –0.32
1. Excludes software “embedded,” or bundled, in computers and other equipment.
1. Excludes software “embedded,” or bundled, in computers and other equipment.

D–10 National Data June 2009
Table 1.5.3. Real Gross Domestic Product, Expanded Detail, Quantity Indexes Table 1.5.4. Price Indexes for Gross Domestic Product, Expanded Detail [Index numbers, 2000=100] [Index numbers, 2000=100]
Line 2007 2008
Seasonally adjusted
2008 2009
I II III IV I
Gross domestic product .... Personal consumption
1 117.388 118.692 118.631 119.460 119.308 117.369 115.654
expenditures ........................... 2 122.456 122.743 123.395 123.770 122.572 121.235 121.702 Durable goods .......................... 3 143.908 137.666 143.284 142.273 136.695 128.413 131.396
Motor vehicles and parts ...... Furniture and household
4 115.582 100.189 111.313 105.357 97.517 86.570 90.445
equipment......................... 5 189.830 196.325 194.714 201.210 196.934 192.442 194.422 Other .................................... 6 139.314 138.197 139.967 140.804 139.174 132.844 134.842
Nondurable goods .................... 7 122.872 122.143 123.147 124.317 122.035 119.071 118.899 Food ..................................... 8 120.038 119.908 121.315 122.534 120.232 115.549 114.655 Clothing and shoes............... Gasoline, fuel oil, and other
9 138.677 139.228 139.821 143.488 138.462 135.141 135.176
energy goods.................... 10 103.438 98.819 101.329 99.664 96.137 98.147 99.489 Other .................................... 11 128.976 129.350 128.514 130.448 130.525 127.912 128.331
Services ................................... 12 118.259 119.992 119.739 119.937 119.916 120.376 120.774 Housing ................................ 13 116.420 117.483 116.978 117.469 117.687 117.799 117.760 Household operation ............ 14 107.959 107.678 109.183 108.001 105.716 107.810 109.770
Electricity and gas ............ 15 105.447 103.310 107.453 104.375 98.502 102.911 107.284 Other household operation 16 109.760 110.966 110.404 110.677 111.261 111.521 111.635
Transportation....................... 17 102.731 102.093 103.408 102.628 102.026 100.311 99.021 Medical care ......................... 18 129.317 133.888 132.522 133.451 134.285 135.295 135.970 Recreation ............................ 19 124.880 123.846 123.860 124.263 123.801 123.461 124.179 Other ....................................
Gross private domestic 20 115.218 116.868 116.814 116.714 116.768 117.176 117.502
investment............................... 21 104.278 97.328 101.110 98.071 98.169 91.961 77.600 Fixed investment....................... 22 107.717 102.375 104.969 104.522 103.102 96.907 86.222
Nonresidential ...................... 23 112.244 114.069 115.504 116.212 115.714 108.847 96.998 Structures......................... 24 97.264 108.180 104.206 108.716 111.257 108.543 94.591 Equipment and software 25 117.412 113.939 118.470 116.961 114.709 105.616 95.374
Information processing equipment and software.................... 26 139.842 146.477 147.465 150.324 148.727 139.394 132.635 Computers and
peripheral equipment ............ 27 230.472 245.458 254.682 262.580 246.464 218.104 210.927
Software 1 ................ 28 134.548 140.988 142.463 143.201 141.617 136.672 129.296 Other ........................ 29 114.710 118.992 117.698 121.342 122.931 113.997 108.517
Industrial equipment..... Transportation
30 97.805 93.709 96.369 95.494 93.311 89.664 76.365
equipment ................ 31 86.683 61.933 78.949 67.497 58.204 43.082 30.597 Other equipment .......... 32 113.095 111.517 111.679 110.767 115.457 108.163 97.767
Residential............................ 33 101.534 80.436 85.698 82.692 79.154 74.201 65.661 Change in private inventories ... 34 .............. .............. ............. .............. .............. ............. ..............
Farm ..................................... 35 .............. .............. ............. .............. .............. ............. .............. Nonfarm................................
Net exports of goods and 36 .............. .............. ............. .............. .............. ............. ..............
services ................................... 37 .............. .............. ............. .............. .............. ............. .............. Exports ..................................... 38 130.068 138.111 136.880 140.908 141.943 132.713 121.943
Goods................................... 39 127.335 134.948 133.690 138.826 140.079 127.198 112.961 Services ............................... 40 136.868 145.916 144.792 146.131 146.640 146.100 143.402
Imports ..................................... 41 133.654 129.038 132.991 130.509 129.367 123.283 111.092 Goods................................... 42 134.921 129.326 133.654 131.212 129.653 122.785 108.237 Services ............................... 43 127.581 127.856 129.913 127.217 128.249 126.043 124.656
Government consumption expenditures and gross investment............................... 44 116.871 120.250 118.443 119.594 121.288 121.674 120.600 Federal ..................................... 45 130.078 137.913 133.488 135.628 140.080 142.457 140.884
National defense................... 46 135.596 145.318 140.125 142.621 148.643 149.882 147.283 Consumption expenditures 47 132.457 140.765 136.773 137.921 143.533 144.831 142.685 Gross investment.............. 48 159.765 181.536 166.030 180.174 189.622 190.318 183.862
Nondefense .......................... 49 120.127 124.469 121.469 122.949 124.473 128.984 129.314 Consumption expenditures 50 119.048 122.541 120.061 121.235 122.897 125.971 127.838 Gross investment.............. 51 128.357 138.925 132.081 135.821 136.325 151.474 140.415
State and local.......................... 52 110.167 111.394 110.844 111.517 111.891 111.326 110.496 Consumption expenditures 53 109.828 111.271 110.874 111.201 111.509 111.500 111.349 Gross investment.................. 54 111.471 111.832 110.632 112.741 113.391 110.565 107.076
Line 2007 2008
Seasonally adjusted
2008 2009
I II III IV I
Gross domestic product .... Personal consumption
1 119.819 122.500 121.613 121.951 123.134 123.302 124.168
expenditures ........................... 2 117.659 121.596 120.283 121.544 123.041 121.514 121.208 Durable goods .......................... 3 87.154 86.071 86.581 86.237 86.110 85.357 84.999
Motor vehicles and parts ...... Furniture and household
4 98.589 98.046 98.698 98.382 98.345 96.758 96.586
equipment......................... 5 69.924 66.991 68.115 67.161 66.716 65.972 65.395 Other..................................... 6 99.421 102.264 100.809 102.109 102.720 103.418 103.450
Nondurable goods .................... 7 118.407 124.666 123.059 125.021 128.129 122.455 120.835 Food...................................... 8 119.682 126.182 123.007 124.943 127.519 129.258 129.556 Clothing and shoes............... Gasoline, fuel oil, and other
9 90.595 90.133 90.203 89.520 90.817 89.992 90.775
energy goods .................... 10 185.237 217.688 218.289 231.457 251.777 169.228 140.452 Other..................................... 11 111.013 113.241 112.598 113.027 113.325 114.016 115.571
Services.................................... 12 124.712 128.752 127.133 128.450 129.538 129.885 130.233 Housing ................................ 13 124.679 128.013 126.994 127.623 128.405 129.029 129.555 Household operation............. 14 124.813 131.675 127.183 131.604 134.783 133.132 132.409
Electricity and gas ............ 15 144.797 157.114 148.139 157.995 164.322 158.000 155.231 Other household operation 16 113.275 117.076 115.093 116.476 117.958 118.776 119.176
Transportation ....................... 17 119.318 125.478 122.455 124.768 126.808 127.879 128.852 Medical care ......................... 18 126.601 129.566 128.364 129.127 130.037 130.737 131.440 Recreation ............................ 19 120.418 124.177 122.851 123.699 125.200 124.959 125.418 Other.....................................
Gross private domestic 20 125.365 129.914 128.529 129.950 130.416 130.763 130.690
investment ............................... 21 117.735 118.509 117.815 117.926 118.510 119.786 119.206 Fixed investment ....................... 22 117.995 118.727 118.117 118.353 119.037 119.400 118.819
Nonresidential....................... 23 108.739 110.513 109.177 109.788 110.913 112.174 111.849 Structures ......................... 24 157.662 163.298 160.182 161.496 164.285 167.229 165.867 Equipment and software... 25 94.870 95.485 94.700 95.101 95.710 96.431 96.454
Information processing equipment and software .................... 26 79.170 78.219 78.245 78.370 78.293 77.967 77.450 Computers and
peripheral equipment............. 27 40.062 35.967 37.024 36.297 35.608 34.940 33.960
Software 1................. 28 95.888 96.820 96.339 96.976 97.196 96.767 96.359 Other ........................ 29 90.278 90.930 90.345 90.863 91.160 91.353 91.259
Industrial equipment ..... Transportation
30 115.968 121.111 118.620 120.525 122.615 122.685 122.485
equipment................. 31 112.762 112.881 111.871 111.849 112.692 115.113 120.727 Other equipment........... 32 113.222 116.771 114.175 114.579 116.616 121.714 122.086
Residential ............................ 33 138.884 135.587 137.900 136.687 135.535 132.226 130.687 Change in private inventories ... 34 .............. ............. .............. .............. ............. .............. ..............
Farm ..................................... 35 .............. ............. .............. .............. ............. .............. .............. Nonfarm................................
Net exports of goods and 36 .............. ............. .............. .............. ............. .............. ..............
services ................................... 37 .............. ............. .............. .............. ............. .............. .............. Exports ..................................... 38 116.586 122.788 121.397 124.560 126.592 118.601 115.199
Goods ................................... 39 115.062 121.147 119.916 123.456 125.137 116.082 112.516 Services................................ 40 120.211 126.684 124.932 127.211 130.082 124.510 121.424
Imports...................................... 41 120.168 132.698 128.722 137.136 140.189 124.747 114.218 Goods ................................... 42 118.326 131.408 127.427 136.387 139.607 122.209 110.591 Services................................ 43 129.928 139.217 135.377 140.740 142.873 137.879 132.643
Government consumption expenditures and gross investment ............................... 44 132.941 139.234 137.237 139.588 141.107 139.002 138.887 Federal...................................... 45 130.076 134.289 132.879 134.553 135.447 134.277 135.176
National defense................... 46 131.874 136.574 134.905 136.967 138.004 136.421 137.336 Consumption expenditures 47 136.220 141.371 139.603 141.872 142.967 141.042 142.243 Gross investment .............. 48 105.255 107.386 106.296 107.217 107.925 108.108 107.544
Nondefense .......................... 49 126.636 129.869 128.986 129.868 130.465 130.157 131.025 Consumption expenditures 50 130.378 134.090 133.128 134.139 134.776 134.316 135.370 Gross investment .............. 51 104.556 105.204 104.758 104.948 105.326 105.785 105.706
State and local .......................... 52 134.671 142.219 139.866 142.632 144.540 141.838 141.068 Consumption expenditures ... 53 134.517 142.427 140.173 143.333 145.179 141.023 139.730 Gross investment .................. 54 135.383 141.478 138.722 139.890 142.050 145.252 146.664
1. Excludes software “embedded,” or bundled, in computers and other equipment. 1. Excludes software “embedded,” or bundled, in computers and other equipment.
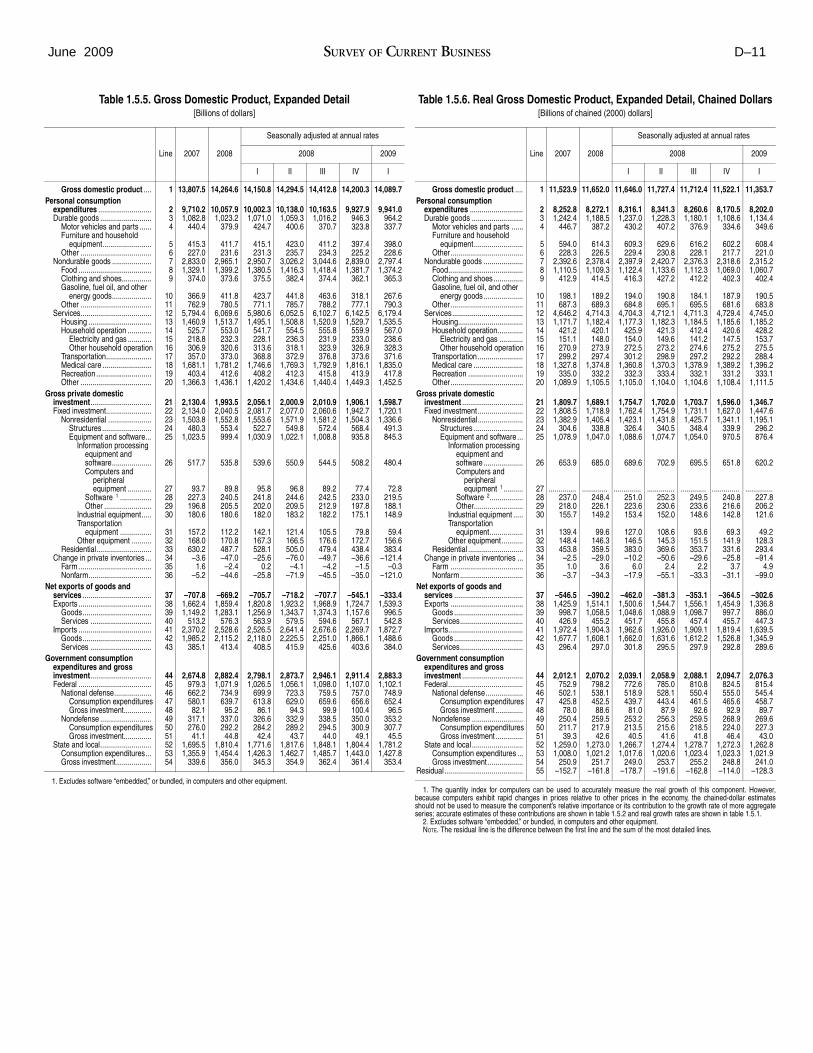
June 2009 SURVEY OF CURRENT BUSINESS D–11
Table 1.5.5. Gross Domestic Product, Expanded Detail Table 1.5.6. Real Gross Domestic Product, Expanded Detail, Chained Dollars [Billions of dollars] [Billions of chained (2000) dollars]
Line 2007 2008
Seasonally adjusted at annual rates
2008 2009
I II III IV I
Gross domestic product .... Personal consumption
1 13,807.5 14,264.6 14,150.8 14,294.5 14,412.8 14,200.3 14,089.7
expenditures ........................... 2 9,710.2 10,057.9 10,002.3 10,138.0 10,163.5 9,927.9 9,941.0 Durable goods .......................... 3 1,082.8 1,023.2 1,071.0 1,059.3 1,016.2 946.3 964.2
Motor vehicles and parts ...... Furniture and household
4 440.4 379.9 424.7 400.6 370.7 323.8 337.7
equipment......................... 5 415.3 411.7 415.1 423.0 411.2 397.4 398.0 Other .................................... 6 227.0 231.6 231.3 235.7 234.3 225.2 228.6
Nondurable goods .................... 7 2,833.0 2,965.1 2,950.7 3,026.2 3,044.6 2,839.0 2,797.4 Food ..................................... 8 1,329.1 1,399.2 1,380.5 1,416.3 1,418.4 1,381.7 1,374.2 Clothing and shoes............... Gasoline, fuel oil, and other
9 374.0 373.6 375.5 382.4 374.4 362.1 365.3
energy goods.................... 10 366.9 411.8 423.7 441.8 463.6 318.1 267.6 Other .................................... 11 762.9 780.5 771.1 785.7 788.2 777.1 790.3
Services.................................... 12 5,794.4 6,069.6 5,980.6 6,052.5 6,102.7 6,142.5 6,179.4 Housing ................................ 13 1,460.9 1,513.7 1,495.1 1,508.8 1,520.9 1,529.7 1,535.5 Household operation ............ 14 525.7 553.0 541.7 554.5 555.8 559.9 567.0
Electricity and gas ............ 15 218.8 232.3 228.1 236.3 231.9 233.0 238.6 Other household operation 16 306.9 320.6 313.6 318.1 323.9 326.9 328.3
Transportation....................... 17 357.0 373.0 368.8 372.9 376.8 373.6 371.6 Medical care ......................... 18 1,681.1 1,781.2 1,746.6 1,769.3 1,792.9 1,816.1 1,835.0 Recreation ............................ 19 403.4 412.6 408.2 412.3 415.8 413.9 417.8 Other ....................................
Gross private domestic 20 1,366.3 1,436.1 1,420.2 1,434.6 1,440.4 1,449.3 1,452.5
investment............................... 21 2,130.4 1,993.5 2,056.1 2,000.9 2,010.9 1,906.1 1,598.7 Fixed investment....................... 22 2,134.0 2,040.5 2,081.7 2,077.0 2,060.6 1,942.7 1,720.1
Nonresidential ...................... 23 1,503.8 1,552.8 1,553.6 1,571.9 1,581.2 1,504.3 1,336.6 Structures......................... 24 480.3 553.4 522.7 549.8 572.4 568.4 491.3 Equipment and software...
Information processing equipment and
25 1,023.5 999.4 1,030.9 1,022.1 1,008.8 935.8 845.3
software.................... Computers and
peripheral
26 517.7 535.8 539.6 550.9 544.5 508.2 480.4
equipment ............ 27 93.7 89.8 95.8 96.8 89.2 77.4 72.8 Software 1 ................ 28 227.3 240.5 241.8 244.6 242.5 233.0 219.5 Other ........................ 29 196.8 205.5 202.0 209.5 212.9 197.8 188.1
Industrial equipment..... Transportation
30 180.6 180.6 182.0 183.2 182.2 175.1 148.9
equipment ................ 31 157.2 112.2 142.1 121.4 105.5 79.8 59.4 Other equipment .......... 32 168.0 170.8 167.3 166.5 176.6 172.7 156.6
Residential............................ 33 630.2 487.7 528.1 505.0 479.4 438.4 383.4 Change in private inventories ... 34 –3.6 –47.0 –25.6 –76.0 –49.7 –36.6 –121.4
Farm ..................................... 35 1.6 –2.4 0.2 –4.1 –4.2 –1.5 –0.3 Nonfarm................................
Net exports of goods and 36 –5.2 –44.6 –25.8 –71.9 –45.5 –35.0 –121.0
services ................................... 37 –707.8 –669.2 –705.7 –718.2 –707.7 –545.1 –333.4 Exports ..................................... 38 1,662.4 1,859.4 1,820.8 1,923.2 1,968.9 1,724.7 1,539.3
Goods................................... 39 1,149.2 1,283.1 1,256.9 1,343.7 1,374.3 1,157.6 996.5 Services ............................... 40 513.2 576.3 563.9 579.5 594.6 567.1 542.8
Imports ..................................... 41 2,370.2 2,528.6 2,526.5 2,641.4 2,676.6 2,269.7 1,872.7 Goods................................... 42 1,985.2 2,115.2 2,118.0 2,225.5 2,251.0 1,866.1 1,488.6 Services ...............................
Government consumption expenditures and gross
43 385.1 413.4 408.5 415.9 425.6 403.6 384.0
investment............................... 44 2,674.8 2,882.4 2,798.1 2,873.7 2,946.1 2,911.4 2,883.3 Federal ..................................... 45 979.3 1,071.9 1,026.5 1,056.1 1,098.0 1,107.0 1,102.1
National defense................... 46 662.2 734.9 699.9 723.3 759.5 757.0 748.9 Consumption expenditures 47 580.1 639.7 613.8 629.0 659.6 656.6 652.4 Gross investment.............. 48 82.1 95.2 86.1 94.3 99.9 100.4 96.5
Nondefense .......................... 49 317.1 337.0 326.6 332.9 338.5 350.0 353.2 Consumption expenditures 50 276.0 292.2 284.2 289.2 294.5 300.9 307.7 Gross investment.............. 51 41.1 44.8 42.4 43.7 44.0 49.1 45.5
State and local.......................... 52 1,695.5 1,810.4 1,771.6 1,817.6 1,848.1 1,804.4 1,781.2 Consumption expenditures... 53 1,355.9 1,454.4 1,426.3 1,462.7 1,485.7 1,443.0 1,427.8 Gross investment.................. 54 339.6 356.0 345.3 354.9 362.4 361.4 353.4
Line 2007 2008
Seasonally adjusted at annual rates
2008 2009
I II III IV I
Gross domestic product .... Personal consumption
1 11,523.9 11,652.0 11,646.0 11,727.4 11,712.4 11,522.1 11,353.7
expenditures ........................... 2 8,252.8 8,272.1 8,316.1 8,341.3 8,260.6 8,170.5 8,202.0 Durable goods .......................... 3 1,242.4 1,188.5 1,237.0 1,228.3 1,180.1 1,108.6 1,134.4
Motor vehicles and parts ...... Furniture and household
4 446.7 387.2 430.2 407.2 376.9 334.6 349.6
equipment......................... 5 594.0 614.3 609.3 629.6 616.2 602.2 608.4 Other..................................... 6 228.3 226.5 229.4 230.8 228.1 217.7 221.0
Nondurable goods .................... 7 2,392.6 2,378.4 2,397.9 2,420.7 2,376.3 2,318.6 2,315.2 Food...................................... 8 1,110.5 1,109.3 1,122.4 1,133.6 1,112.3 1,069.0 1,060.7 Clothing and shoes ............... Gasoline, fuel oil, and other
9 412.9 414.5 416.3 427.2 412.2 402.3 402.4
energy goods .................... 10 198.1 189.2 194.0 190.8 184.1 187.9 190.5 Other..................................... 11 687.3 689.3 684.8 695.1 695.5 681.6 683.8
Services.................................... 12 4,646.2 4,714.3 4,704.3 4,712.1 4,711.3 4,729.4 4,745.0 Housing................................. 13 1,171.7 1,182.4 1,177.3 1,182.3 1,184.5 1,185.6 1,185.2 Household operation............. 14 421.2 420.1 425.9 421.3 412.4 420.6 428.2
Electricity and gas ............ 15 151.1 148.0 154.0 149.6 141.2 147.5 153.7 Other household operation 16 270.9 273.9 272.5 273.2 274.6 275.2 275.5
Transportation ....................... 17 299.2 297.4 301.2 298.9 297.2 292.2 288.4 Medical care ......................... 18 1,327.8 1,374.8 1,360.8 1,370.3 1,378.9 1,389.2 1,396.2 Recreation ............................ 19 335.0 332.2 332.3 333.4 332.1 331.2 333.1 Other.....................................
Gross private domestic 20 1,089.9 1,105.5 1,105.0 1,104.0 1,104.6 1,108.4 1,111.5
investment ............................... 21 1,809.7 1,689.1 1,754.7 1,702.0 1,703.7 1,596.0 1,346.7 Fixed investment ....................... 22 1,808.5 1,718.9 1,762.4 1,754.9 1,731.1 1,627.0 1,447.6
Nonresidential....................... 23 1,382.9 1,405.4 1,423.1 1,431.8 1,425.7 1,341.1 1,195.1 Structures ......................... 24 304.6 338.8 326.4 340.5 348.4 339.9 296.2 Equipment and software ...
Information processing equipment and
25 1,078.9 1,047.0 1,088.6 1,074.7 1,054.0 970.5 876.4
software .................... Computers and
peripheral
26 653.9 685.0 689.6 702.9 695.5 651.8 620.2
equipment 1 .......... 27 .............. ............. .............. .............. ............. .............. .............. Software 2................. 28 237.0 248.4 251.0 252.3 249.5 240.8 227.8 Other......................... 29 218.0 226.1 223.6 230.6 233.6 216.6 206.2
Industrial equipment ..... Transportation
30 155.7 149.2 153.4 152.0 148.6 142.8 121.6
equipment................. 31 139.4 99.6 127.0 108.6 93.6 69.3 49.2 Other equipment........... 32 148.4 146.3 146.5 145.3 151.5 141.9 128.3
Residential ............................ 33 453.8 359.5 383.0 369.6 353.7 331.6 293.4 Change in private inventories ... 34 –2.5 –29.0 –10.2 –50.6 –29.6 –25.8 –91.4
Farm ..................................... 35 1.0 3.6 6.0 2.4 2.2 3.7 4.9 Nonfarm................................
Net exports of goods and 36 –3.7 –34.3 –17.9 –55.1 –33.3 –31.1 –99.0
services ................................... 37 –546.5 –390.2 –462.0 –381.3 –353.1 –364.5 –302.6 Exports ..................................... 38 1,425.9 1,514.1 1,500.6 1,544.7 1,556.1 1,454.9 1,336.8
Goods ................................... 39 998.7 1,058.5 1,048.6 1,088.9 1,098.7 997.7 886.0 Services................................ 40 426.9 455.2 451.7 455.8 457.4 455.7 447.3
Imports...................................... 41 1,972.4 1,904.3 1,962.6 1,926.0 1,909.1 1,819.4 1,639.5 Goods ................................... 42 1,677.7 1,608.1 1,662.0 1,631.6 1,612.2 1,526.8 1,345.9 Services................................
Government consumption expenditures and gross
43 296.4 297.0 301.8 295.5 297.9 292.8 289.6
investment ............................... 44 2,012.1 2,070.2 2,039.1 2,058.9 2,088.1 2,094.7 2,076.3 Federal...................................... 45 752.9 798.2 772.6 785.0 810.8 824.5 815.4
National defense................... 46 502.1 538.1 518.9 528.1 550.4 555.0 545.4 Consumption expenditures 47 425.8 452.5 439.7 443.4 461.5 465.6 458.7 Gross investment .............. 48 78.0 88.6 81.0 87.9 92.6 92.9 89.7
Nondefense .......................... 49 250.4 259.5 253.2 256.3 259.5 268.9 269.6 Consumption expenditures 50 211.7 217.9 213.5 215.6 218.5 224.0 227.3 Gross investment .............. 51 39.3 42.6 40.5 41.6 41.8 46.4 43.0
State and local .......................... 52 1,259.0 1,273.0 1,266.7 1,274.4 1,278.7 1,272.3 1,262.8 Consumption expenditures ... 53 1,008.0 1,021.2 1,017.6 1,020.6 1,023.4 1,023.3 1,021.9 Gross investment .................. 54 250.9 251.7 249.0 253.7 255.2 248.8 241.0
Residual........................................ 55 –152.7 –161.8 –178.7 –191.6 –162.8 –114.0 –128.3 1. Excludes software “embedded,” or bundled, in computers and other equipment.
1. The quantity index for computers can be used to accurately measure the real growth of this component. However, because computers exhibit rapid changes in prices relative to other prices in the economy, the chained-dollar estimates should not be used to measure the component’s relative importance or its contribution to the growth rate of more aggregate series; accurate estimates of these contributions are shown in table 1.5.2 and real growth rates are shown in table 1.5.1.
2. Excludes software “embedded,” or bundled, in computers and other equipment. NOTE. The residual line is the difference between the first line and the sum of the most detailed lines.

D–12 National Data June 2009
Table 1.6.4. Price Indexes for Table 1.6.7. Percent Change From Preceding Period in Prices for Gross Domestic Purchases Gross Domestic Purchases
[Index numbers, 2000=100] [Percent]
Line 2007 2008
Seasonally adjusted
2008 2009
I II III IV I
Gross domestic purchases ... Personal consumption
1 120.294 124.158 122.821 124.103 125.475 124.232 123.929
expenditures ........................... 2 117.659 121.596 120.283 121.544 123.041 121.514 121.208 Durable goods .......................... 3 87.154 86.071 86.581 86.237 86.110 85.357 84.999
Motor vehicles and parts ...... Furniture and household
4 98.589 98.046 98.698 98.382 98.345 96.758 96.586
equipment......................... 5 69.924 66.991 68.115 67.161 66.716 65.972 65.395 Other .................................... 6 99.421 102.264 100.809 102.109 102.720 103.418 103.450
Nondurable goods .................... 7 118.407 124.666 123.059 125.021 128.129 122.455 120.835 Food ..................................... 8 119.682 126.182 123.007 124.943 127.519 129.258 129.556 Clothing and shoes............... Gasoline, fuel oil, and other
9 90.595 90.133 90.203 89.520 90.817 89.992 90.775
energy goods.................... 10 185.237 217.688 218.289 231.457 251.777 169.228 140.452 Other .................................... 11 111.013 113.241 112.598 113.027 113.325 114.016 115.571
Services ................................... 12 124.712 128.752 127.133 128.450 129.538 129.885 130.233 Housing ................................ 13 124.679 128.013 126.994 127.623 128.405 129.029 129.555 Household operation ............ 14 124.813 131.675 127.183 131.604 134.783 133.132 132.409
Electricity and gas ............ 15 144.797 157.114 148.139 157.995 164.322 158.000 155.231 Other household operation 16 113.275 117.076 115.093 116.476 117.958 118.776 119.176
Transportation....................... 17 119.318 125.478 122.455 124.768 126.808 127.879 128.852 Medical care ......................... 18 126.601 129.566 128.364 129.127 130.037 130.737 131.440 Recreation ............................ 19 120.418 124.177 122.851 123.699 125.200 124.959 125.418 Other ....................................
Gross private domestic 20 125.365 129.914 128.529 129.950 130.416 130.763 130.690
investment............................... 21 117.735 118.509 117.815 117.926 118.510 119.786 119.206 Fixed investment....................... 22 117.995 118.727 118.117 118.353 119.037 119.400 118.819
Nonresidential ...................... 23 108.739 110.513 109.177 109.788 110.913 112.174 111.849 Structures......................... 24 157.662 163.298 160.182 161.496 164.285 167.229 165.867 Equipment and software... 25 94.870 95.485 94.700 95.101 95.710 96.431 96.454
Information processing equipment and software.................... 26 79.170 78.219 78.245 78.370 78.293 77.967 77.450 Computers and
peripheral equipment ............ 27 40.062 35.967 37.024 36.297 35.608 34.940 33.960
Software 1 ................ 28 95.888 96.820 96.339 96.976 97.196 96.767 96.359 Other ........................ 29 90.278 90.930 90.345 90.863 91.160 91.353 91.259
Industrial equipment..... Transportation
30 115.968 121.111 118.620 120.525 122.615 122.685 122.485
equipment ................ 31 112.762 112.881 111.871 111.849 112.692 115.113 120.727 Other equipment .......... 32 113.222 116.771 114.175 114.579 116.616 121.714 122.086
Residential............................ 33 138.884 135.587 137.900 136.687 135.535 132.226 130.687 Change in private inventories ... 34 ............. ............. ............. ............. ............. ............. .............
Farm ..................................... 35 ............. ............. ............. ............. ............. ............. ............. Nonfarm................................ 36 ............. ............. ............. ............. ............. ............. .............
Government consumption expenditures and gross investment............................... 37 132.941 139.234 137.237 139.588 141.107 139.002 138.887 Federal ..................................... 38 130.076 134.289 132.879 134.553 135.447 134.277 135.176
National defense................... 39 131.874 136.574 134.905 136.967 138.004 136.421 137.336 Consumption expenditures 40 136.220 141.371 139.603 141.872 142.967 141.042 142.243 Gross investment.............. 41 105.255 107.386 106.296 107.217 107.925 108.108 107.544
Nondefense .......................... 42 126.636 129.869 128.986 129.868 130.465 130.157 131.025 Consumption expenditures 43 130.378 134.090 133.128 134.139 134.776 134.316 135.370 Gross investment.............. 44 104.556 105.204 104.758 104.948 105.326 105.785 105.706
State and local.......................... 45 134.671 142.219 139.866 142.632 144.540 141.838 141.068 Consumption expenditures 46 134.517 142.427 140.173 143.333 145.179 141.023 139.730 Gross investment.............. 47 135.383 141.478 138.722 139.890 142.050 145.252 146.664
Addenda: Final sales of computers to
domestic purchasers 2 ......... 48 34.096 30.261 31.478 30.688 29.840 29.039 28.292 Gross domestic purchases
excluding final sales of computers to domestic purchasers............................ 49 122.010 126.126 124.703 126.052 127.496 126.254 125.973
Food ......................................... 50 119.572 126.072 122.979 124.814 127.400 129.093 129.251 Energy goods and services ...... Gross domestic purchases
51 171.369 199.385 194.992 210.365 222.469 169.715 149.710
excluding food and energy.... 52 118.194 120.762 119.770 120.421 121.243 121.615 122.052 Gross domestic product ........... 53 119.819 122.500 121.613 121.951 123.134 123.302 124.168
Gross domestic product excluding final sales of computers .................... 54 121.184 124.054 123.102 123.482 124.715 124.916 125.819
Food ................................. Energy goods and
55 120.469 128.157 125.086 127.311 129.889 130.343 130.524
services ........................ 56 139.410 135.297 140.086 129.829 135.251 136.023 148.650 Gross domestic product
excluding food and energy .......................... 57 119.152 121.480 120.661 121.111 122.008 122.140 122.750
Final sales of domestic product Final sales to domestic
58 119.853 122.528 121.653 122.008 123.204 123.245 124.099
purchasers............................ 59 120.329 124.187 122.863 124.160 125.543 124.181 123.873
Line 2007 2008
Seasonally adjusted at annual rates
2008 2009
I II III IV I
Gross domestic purchases.... Personal consumption
1 2.8 3.2 3.5 4.2 4.5 –3.9 –1.0
expenditures ........................... 2 2.6 3.3 3.6 4.3 5.0 –4.9 –1.0 Durable goods .......................... 3 –1.8 –1.2 –0.1 –1.6 –0.6 –3.5 –1.7
Motor vehicles and parts ...... Furniture and household
4 –0.5 –0.6 –0.9 –1.3 –0.2 –6.3 –0.7
equipment......................... 5 –4.6 –4.2 –1.9 –5.5 –2.6 –4.4 –3.5 Other..................................... 6 1.0 2.9 4.9 5.3 2.4 2.7 0.1
Nondurable goods .................... 7 3.0 5.3 6.7 6.5 10.3 –16.6 –5.2 Food...................................... 8 3.8 5.4 4.9 6.4 8.5 5.6 0.9 Clothing and shoes ............... Gasoline, fuel oil, and other
9 –0.8 –0.5 –0.5 –3.0 5.9 –3.6 3.5
energy goods .................... 10 8.3 17.5 27.0 26.4 40.0 –79.6 –52.6 Other..................................... 11 1.1 2.0 3.5 1.5 1.1 2.5 5.6
Services.................................... 12 3.3 3.2 2.8 4.2 3.4 1.1 1.1 Housing................................. 13 3.7 2.7 2.9 2.0 2.5 2.0 1.6 Household operation............. 14 2.7 5.5 3.8 14.6 10.0 –4.8 –2.2
Electricity and gas ............ 15 2.4 8.5 5.5 29.4 17.0 –14.5 –6.8 Other household operation 16 2.9 3.4 2.6 4.9 5.2 2.8 1.4
Transportation ....................... 17 2.7 5.2 4.9 7.8 6.7 3.4 3.1 Medical care ......................... 18 3.7 2.3 0.9 2.4 2.8 2.2 2.2 Recreation ............................ 19 1.6 3.1 3.4 2.8 4.9 –0.8 1.5 Other.....................................
Gross private domestic 20 3.3 3.6 4.1 4.5 1.4 1.1 –0.2
investment ............................... 21 1.4 0.7 –0.5 0.4 2.0 4.4 –1.9 Fixed investment ....................... 22 1.4 0.6 –0.2 0.8 2.3 1.2 –1.9
Nonresidential....................... 23 1.4 1.6 0.6 2.3 4.2 4.6 –1.2 Structures ......................... 24 3.8 3.6 2.7 3.3 7.1 7.4 –3.2 Equipment and software ...
Information processing equipment and
25 0.3 0.6 –0.4 1.7 2.6 3.0 0.1
software .................... Computers and
peripheral
26 –2.1 –1.2 –1.7 0.6 –0.4 –1.7 –2.6
equipment............. 27 –10.5 –10.2 –13.5 –7.6 –7.4 –7.3 –10.8 Software 1................. 28 0.4 1.0 0.8 2.7 0.9 –1.8 –1.7 Other......................... 29 –0.6 0.7 1.3 2.3 1.3 0.8 –0.4
Industrial equipment ..... Transportation
30 4.0 4.4 3.9 6.6 7.1 0.2 –0.7
equipment................. 31 1.7 0.1 –2.3 –0.1 3.0 8.9 21.0 Other equipment........... 32 2.3 3.1 0.9 1.4 7.3 18.7 1.2
Residential ............................ 33 1.5 –2.4 –2.6 –3.5 –3.3 –9.4 –4.6 Change in private inventories ... 34 ............. ............. ............. ............. ............. ............. .............
Farm ..................................... 35 ............. ............. ............. ............. ............. ............. ............. Nonfarm................................
Government consumption expenditures and gross
36 ............. ............. ............. ............. ............. ............. .............
investment ............................... 37 4.5 4.7 6.2 7.0 4.4 –5.8 –0.3 Federal...................................... 38 3.4 3.2 5.6 5.1 2.7 –3.4 2.7
National defense................... 39 3.5 3.6 5.1 6.3 3.1 –4.5 2.7 Consumption expenditures 40 3.8 3.8 5.6 6.7 3.1 –5.3 3.4 Gross investment .............. 41 1.5 2.0 1.4 3.5 2.7 0.7 –2.1
Nondefense .......................... 42 3.1 2.6 6.8 2.8 1.9 –0.9 2.7 Consumption expenditures 43 3.5 2.8 7.8 3.1 1.9 –1.4 3.2 Gross investment .............. 44 0.6 0.6 0.0 0.7 1.4 1.8 –0.3
State and local .......................... 45 5.1 5.6 6.6 8.1 5.5 –7.3 –2.2 Consumption expenditures 46 4.7 5.9 7.7 9.3 5.3 –11.0 –3.6 Gross investment ..............
Addenda: Final sales of computers to
47 6.9 4.5 2.4 3.4 6.3 9.3 3.9
domestic purchasers 2.......... Gross domestic purchases
excluding final sales of computers to domestic
48 –10.8 –11.2 –10.8 –9.7 –10.6 –10.3 –9.9
purchasers ............................ 49 2.9 3.4 3.7 4.4 4.7 –3.8 –0.9 Food.......................................... 50 3.8 5.4 4.7 6.1 8.5 5.4 0.5 Energy goods and services ...... Gross domestic purchases
51 6.2 16.3 24.2 35.5 25.1 –66.1 –39.4
excluding food and energy.... 52 2.4 2.2 2.2 2.2 2.8 1.2 1.4 Gross domestic product............
Gross domestic product excluding final sales of
53 2.7 2.2 2.6 1.1 3.9 0.5 2.8
computers..................... 54 2.8 2.4 2.7 1.2 4.1 0.6 2.9 Food.................................. Energy goods and
55 4.3 6.4 7.2 7.3 8.3 1.4 0.6
services ........................ Gross domestic product
excluding food and
56 3.0 –3.0 7.0 –26.2 17.8 2.3 42.6
energy........................... 57 2.5 2.0 2.0 1.5 3.0 0.4 2.0 Final sales of domestic product Final sales to domestic
58 2.7 2.2 2.7 1.2 4.0 0.1 2.8
purchasers ............................ 59 2.8 3.2 3.5 4.3 4.5 –4.3 –1.0
1. Excludes software “embedded,” or bundled, in computers and other equipment. 1. Excludes software “embedded,” or bundled, in computers and other equipment. 2. Some components of final sales of computers include computer parts. 2. Some components of final sales of computers include computer parts.

June 2009 SURVEY OF CURRENT BUSINESS D–13
Table 1.6.8. Contributions to Percent Change in the Gross Domestic Table 1.7.1. Percent Change from Preceding Period in Real Gross Domestic Purchases Price Index Product, Real Gross National Product, and Real Net National Product
[Percent]
Line 2007 2008
Seasonally adjusted at annual rates
2008 2009
I II III IV I
Percent change at annual rate: Gross domestic purchases ... 1 2.8 3.2 3.5 4.2 4.5 –3.9 –1.0
Percentage points at annual rates:
Personal consumption expenditures ........................... 2 1.73 2.24 2.43 2.87 3.37 –3.31 –0.68 Durable goods .......................... 3 –0.14 –0.09 –0.01 –0.11 –0.04 –0.23 –0.11
Motor vehicles and parts ...... Furniture and household
4 –0.02 –0.01 –0.03 –0.04 0.00 –0.15 –0.02
equipment......................... 5 –0.14 –0.12 –0.05 –0.16 –0.07 –0.12 –0.10 Other .................................... 6 0.02 0.04 0.08 0.08 0.04 0.04 0.00
Nondurable goods .................... 7 0.58 1.03 1.30 1.29 2.02 –3.52 –1.03 Food ..................................... 8 0.34 0.50 0.45 0.60 0.78 0.51 0.09 Clothing and shoes............... Gasoline, fuel oil, and other
9 –0.02 –0.01 –0.01 –0.08 0.15 –0.09 0.09
energy goods.................... 10 0.20 0.44 0.68 0.69 1.03 –4.07 –1.49 Other .................................... 11 0.06 0.11 0.18 0.08 0.06 0.13 0.29
Services ................................... 12 1.29 1.30 1.13 1.69 1.39 0.44 0.45 Housing ................................ 13 0.36 0.27 0.29 0.20 0.25 0.20 0.17 Household operation ............ 14 0.10 0.20 0.14 0.51 0.36 –0.18 –0.08
Electricity and gas ............ 15 0.04 0.13 0.08 0.41 0.25 –0.24 –0.11 Other household operation 16 0.06 0.07 0.06 0.10 0.11 0.06 0.03
Transportation....................... 17 0.07 0.13 0.12 0.19 0.16 0.08 0.08 Medical care ......................... 18 0.42 0.28 0.11 0.28 0.34 0.26 0.27 Recreation ............................ 19 0.04 0.09 0.09 0.08 0.14 –0.02 0.04 Other ....................................
Gross private domestic 20 0.31 0.34 0.38 0.43 0.14 0.10 –0.02
investment............................... 21 0.22 0.09 –0.07 0.05 0.27 0.56 –0.22 Fixed investment....................... 22 0.21 0.09 –0.03 0.11 0.32 0.16 –0.24
Nonresidential ...................... 23 0.14 0.17 0.06 0.23 0.43 0.47 –0.11 Structures......................... 24 0.12 0.13 0.09 0.12 0.26 0.27 –0.12 Equipment and software... 25 0.02 0.05 –0.03 0.12 0.17 0.19 0.01
Information processing equipment and software.................... 26 –0.08 –0.04 –0.06 0.02 –0.01 –0.06 –0.09 Computers and
peripheral equipment ............ 27 –0.07 –0.07 –0.09 –0.05 –0.05 –0.04 –0.06
Software 1 ................ 28 0.01 0.02 0.01 0.04 0.01 –0.03 –0.03 Other ........................ 29 –0.01 0.01 0.02 0.03 0.02 0.01 –0.01
Industrial equipment..... Transportation
30 0.05 0.05 0.05 0.08 0.08 0.00 –0.01
equipment ................ 31 0.02 0.00 –0.02 0.00 0.02 0.05 0.09 Other equipment .......... 32 0.03 0.04 0.01 0.02 0.08 0.20 0.01
Residential............................ 33 0.07 –0.09 –0.10 –0.12 –0.11 –0.30 –0.13 Change in private inventories ... 34 0.01 0.00 –0.03 –0.06 –0.05 0.40 0.02
Farm ..................................... 35 0.00 0.01 0.04 –0.03 0.00 –0.01 –0.01 Nonfarm................................ 36 0.01 0.00 –0.08 –0.03 –0.05 0.41 0.04
Government consumption expenditures and gross investment............................... 37 0.81 0.88 1.15 1.32 0.85 –1.16 –0.07 Federal ..................................... 38 0.23 0.22 0.38 0.36 0.19 –0.25 0.20
National defense................... 39 0.16 0.17 0.24 0.29 0.15 –0.23 0.14 Consumption expenditures 40 0.15 0.15 0.23 0.27 0.13 –0.23 0.15 Gross investment.............. 41 0.01 0.01 0.01 0.02 0.02 0.00 –0.01
Nondefense .......................... 42 0.07 0.06 0.15 0.06 0.04 –0.02 0.06 Consumption expenditures 43 0.07 0.05 0.15 0.06 0.04 –0.03 0.06 Gross investment.............. 44 0.00 0.00 0.00 0.00 0.00 0.01 0.00
State and local.......................... 45 0.58 0.66 0.77 0.96 0.66 –0.91 –0.27 Consumption expenditures 46 0.43 0.55 0.72 0.88 0.51 –1.12 –0.36 Gross investment.............. 47 0.15 0.11 0.06 0.08 0.15 0.22 0.09
Addenda: Final sales of computers to
domestic purchasers 2 ......... 48 –0.12 –0.12 –0.12 –0.11 –0.11 –0.10 –0.09 Gross domestic purchases
excluding final sales of computers to domestic purchasers............................ 49 2.88 3.34 3.63 4.35 4.61 –3.80 –0.88
Food ......................................... 50 0.35 0.53 0.44 0.57 0.80 0.51 0.05 Energy goods and services ...... Gross domestic purchases
51 0.30 0.84 1.21 1.79 1.34 –5.48 –2.25
excluding food and energy.... 52 2.10 1.84 1.85 1.88 2.35 1.07 1.24
Line 2007 2008
Seasonally adjusted at annual rates
2008 2009
I II III IV I
Gross domestic product ............ 1 2.0 1.1 0.9 2.8 –0.5 –6.3 –5.7 Plus: Income receipts from the
rest of the world ........................ 2 15.7 –10.1 –28.0 –13.0 –7.8 –39.6 –53.2 Less: Income payments to the rest
of the world ............................... 3 14.3 –15.3 –21.8 –2.5 –15.3 –54.7 –61.5 Equals: Gross national product 4 2.2 1.3 0.1 2.1 –0.2 –5.6 –5.8 Less: Consumption of fixed capital 5 3.7 7.0 8.0 6.4 21.9 –10.0 2.0
Private .......................... 6 3.9 7.8 9.1 7.0 26.0 –12.5 1.6 Government .................. 7 3.0 3.1 2.6 3.5 3.5 3.8 4.3
General government 8 3.1 3.1 2.6 3.5 3.6 3.9 4.5 Government
enterprises ........... 9 2.9 3.0 2.6 3.6 3.2 3.4 3.7 Equals: Net national product ..... 10 2.0 0.5 –1.0 1.5 –3.0 –4.9 –6.9 Addenda:
Gross domestic income 1 ......... 11 1.4 –0.5 –0.5 0.7 –0.9 –7.8 –3.6 Gross national income 2 ........... 12 1.5 –0.2 –1.3 0.0 –0.5 –7.0 –3.7 Net domestic product................ 13 1.8 0.3 –0.1 2.3 –3.5 –5.8 –6.8 Net domestic income 3 ............. 14 1.1 –1.5 –1.7 –0.1 –3.9 –7.4 –4.5
1. Gross domestic income deflated by the implicit price deflator for gross domestic product. 2. Gross national income deflated by the implicit price deflator for gross national product. 3. Net domestic income deflated by the implicit price deflator for net domestic product.
Table 1.7.3. Real Gross Domestic Product, Real Gross National Product, and Real Net National Product, Quantity Indexes
[Index numbers, 2000=100]
Line 2007 2008
Seasonally adjusted
2008 2009
I II III IV I
Gross domestic product ............ Plus: Income receipts from the
1 117.388 118.692 118.631 119.460 119.308 117.369 115.654
rest of the world ........................ Less: Income payments to the rest
2 188.098 169.079 180.516 174.333 170.835 150.632 124.565
of the world ............................... 3 184.231 156.033 167.341 166.304 159.560 130.928 103.120 Equals: Gross national product 4 117.795 119.342 119.329 119.950 119.901 118.190 116.443 Less: Consumption of fixed capital 5 126.321 135.143 131.133 133.184 139.944 136.310 136.999
Private .......................... 6 127.463 137.403 132.871 135.137 143.163 138.443 138.979 Government .................. 7 120.585 124.263 122.626 123.699 124.775 125.952 127.298
General government Government
8 120.211 123.898 122.253 123.318 124.411 125.612 126.994
enterprises ........... 9 122.684 126.320 124.726 125.837 126.829 127.887 129.050 Equals: Net national product ..... Addendum:
10 116.652 117.270 117.763 118.201 117.292 115.824 113.774
Net domestic product................ 11 116.187 116.525 116.966 117.639 116.610 114.886 112.871
Table 1.7.4. Price Indexes for Gross Domestic Product, Gross National Product, and Net National Product
[Index numbers, 2000=100]
1. Excludes software “embedded,” or bundled, in computers and other equipment. 2. Some components of final sales of computers include computer parts.
Line 2007 2008
Seasonally adjusted
2008 2009
I II III IV I
Gross domestic product ............ Plus: Income receipts from the
1 119.819 122.500 121.613 121.951 123.134 123.302 124.168
rest of the world ........................ Less: Income payments to the rest
2 119.722 123.452 122.117 123.386 124.803 123.502 123.178
of the world ............................... 3 119.907 124.019 122.572 124.018 125.573 123.913 123.671 Equals: Gross national product 4 119.815 122.485 121.601 121.938 123.117 123.286 124.136 Less: Consumption of fixed capital 5 114.661 114.139 114.142 113.974 114.180 114.262 114.232
Private .......................... 6 113.313 111.869 112.213 111.821 111.792 111.649 111.545 Government .................. 7 121.816 126.303 124.403 125.463 126.994 128.350 128.727
General government Government
8 120.682 125.193 123.312 124.385 125.901 127.174 127.473
enterprises ........... 9 127.796 132.149 130.151 131.143 132.751 134.550 135.342 Equals: Net national product ..... Addendum:
10 120.554 123.708 122.685 123.099 124.432 124.614 125.607
Net domestic product................ 11 120.561 123.733 122.706 123.122 124.460 124.643 125.655

D–14 National Data June 2009
Table 1.7.5. Relation of Gross Domestic Product, Gross National Product, Net Table 1.7.6. Relation of Real Gross Domestic Product, Real Gross National National Product, National Income, and Personal Income Product, and Real Net National Product, Chained Dollars
[Billions of dollars] [Billions of chained (2000) dollars]
Line 2007 2008
Seasonally adjusted at annual rates
2008 2009
I II III IV I
Gross domestic product ............... Plus: Income receipts from the rest
1 13,807.5 14,264.6 14,150.8 14,294.5 14,412.8 14,200.3 14,089.7
of the world.................................. Less: Income payments to the rest
2 861.7 798.3 843.2 822.8 815.6 711.6 586.9
of the world.................................. 3 759.3 665.1 705.1 708.9 688.7 557.7 438.4 Equals: Gross national product ... 4 13,910.0 14,397.8 14,289.0 14,408.3 14,539.6 14,354.3 14,238.2 Less: Consumption of fixed capital 5 1,720.5 1,832.3 1,778.0 1,803.1 1,898.1 1,850.1 1,859.0
Private ............................. 6 1,431.1 1,523.1 1,477.5 1,497.4 1,585.9 1,531.7 1,536.2 Domestic business ......
Capital consumption 7 1,147.0 1,225.0 1,186.1 1,205.6 1,266.0 1,242.5 1,248.7
allowances .......... Less: Capital
consumption
8 1,055.5 1,305.6 1,286.0 1,295.2 1,323.6 1,317.5 1,258.5
adjustment .......... Households and
9 –91.5 80.5 100.0 89.6 57.6 75.0 9.8
institutions ............... 10 284.1 298.1 291.4 291.8 320.0 289.2 287.5 Government..................... 11 289.4 309.2 300.5 305.7 312.1 318.4 322.8
General government.... Government
12 241.4 258.1 250.8 255.2 260.6 265.8 269.3
enterprises .............. 13 48.0 51.1 49.7 50.5 51.5 52.6 53.4 Equals: Net national product........ 14 12,189.5 12,565.5 12,511.1 12,605.2 12,641.6 12,504.2 12,379.3 Less: Statistical discrepancy ....... 15 –81.4 138.1 63.4 136.6 150.2 202.2 124.8 Equals: National income............... Less: Corporate profits with
inventory valuation and capital
16 12,270.9 12,427.4 12,447.6 12,468.6 12,491.4 12,302.0 12,254.5
consumption adjustments............ Taxes on production and
17 1,642.4 1,476.5 1,593.5 1,533.3 1,514.8 1,264.5 1,307.1
imports less subsidies..... Contributions for
government social
18 963.2 983.1 975.1 988.5 993.8 974.9 964.3
insurance......................... Net interest and
miscellaneous payments
19 965.1 995.7 992.2 995.4 1,000.0 995.2 993.9
on assets......................... Business current transfer
20 664.4 682.7 662.3 683.4 656.6 728.6 718.4
payments (net) ................ Current surplus of
21 100.2 103.6 103.2 102.1 92.1 116.8 122.8
government enterprises Wage accruals less
22 –7.9 –8.1 –7.1 –7.7 –8.0 –9.6 –11.6
disbursements ................. Plus: Personal income receipts on
23 –6.3 0.0 0.0 0.0 0.0 0.0 0.0
assets .......................................... Personal current transfer
24 2,000.1 2,037.7 2,054.1 2,052.3 2,055.7 1,988.5 1,912.9
receipts............................ 25 1,713.3 1,869.1 1,778.1 1,926.3 1,872.7 1,899.3 1,988.1 Equals: Personal income .............. Addenda:
26 11,663.2 12,100.6 11,960.5 12,152.2 12,170.4 12,119.5 12,060.6
Gross domestic income............... 27 13,889.0 14,126.5 14,087.4 14,157.8 14,262.6 13,998.1 13,964.9 Gross national income................. 28 13,991.4 14,259.7 14,225.6 14,271.7 14,389.4 14,152.1 14,113.4 Gross national factor income 1 .... 29 12,935.9 13,181.1 13,154.4 13,188.7 13,311.5 13,070.0 13,037.9 Net domestic product .................. 30 12,087.1 12,432.3 12,372.9 12,491.3 12,514.8 12,350.2 12,230.7 Net domestic income................... 31 12,168.5 12,294.2 12,309.5 12,354.7 12,364.5 12,148.0 12,105.9 Net national factor income 2 ........ 32 11,215.5 11,348.8 11,376.4 11,385.6 11,413.4 11,219.9 11,179.0
1. Consists of compensation of employees, proprietors’ income with inventory valuation adjustment (IVA) and capital consumption adjustment (CCAdj), rental income of persons with CCAdj, corporate profits with IVA and CCAdj, net interest and miscellaneous payments, and consumption of fixed capital.
2. Consists of gross national factor income less consumption of fixed capital.
Line 2007 2008
Seasonally adjusted at annual rates
2008 2009
I II III IV I
Gross domestic product ............ 1 11,523.9 11,652.0 11,646.0 11,727.4 11,712.4 11,522.1 11,353.7 Plus: Income receipts from the
rest of the world ........................ 2 719.9 647.2 690.9 667.2 653.9 576.7 477.0 Less: Income payments to the rest
of the world ............................... 3 633.3 536.3 575.2 571.6 548.5 450.0 354.5 Equals: Gross national product 4 11,609.8 11,762.3 11,760.9 11,822.2 11,817.3 11,648.7 11,476.5 Less: Consumption of fixed capital 5 1,500.5 1,605.3 1,557.6 1,582.0 1,662.3 1,619.1 1,627.3
Private .......................... 6 1,263.0 1,361.5 1,316.6 1,339.0 1,418.5 1,371.8 1,377.1 Government.................. 7 237.5 244.8 241.6 243.7 245.8 248.1 250.8
General government 8 200.0 206.2 203.4 205.2 207.0 209.0 211.3 Government
enterprises ........... 9 37.5 38.6 38.2 38.5 38.8 39.1 39.5 Equals: Net national product ..... 10 10,111.5 10,165.0 10,207.8 10,245.7 10,166.9 10,039.7 9,862.0 Addenda:
Gross domestic income 1 ......... 11 11,591.9 11,539.2 11,593.8 11,615.2 11,590.3 11,358.1 11,253.2 Gross national income 2 ........... 12 11,677.7 11,649.4 11,708.8 11,710.0 11,695.2 11,484.6 11,375.9 Net domestic product................ 13 10,025.9 10,055.1 10,093.2 10,151.2 10,062.4 9,913.7 9,739.8 Net domestic income 3 ............. 14 10,093.5 9,943.5 10,041.4 10,040.2 9,941.7 9,751.3 9,640.4
1. Gross domestic income deflated by the implicit price deflator for gross domestic product. 2. Gross national income deflated by the implicit price deflator for gross national product. 3. Net domestic income deflated by the implicit price deflator for net domestic product. NOTE. Except as noted in footnotes 1, 2 and 3, chained (2000) dollar series are calculated as the product of the chain-type
quantity index and the 2000 current-dollar value of the corresponding series, divided by 100. Because the formula for the chain-type quantity indexes uses weights of more than one period, the corresponding chained-dollar estimates are usually not additive.
Table 1.8.3. Command-Basis Real Gross National Product, Quantity Indexes [Index numbers, 2000=100]
Line 2007 2008
Seasonally adjusted
2008 2009
I II III IV I
Gross national product .............. Less: Exports of goods and
services and income receipts
1 117.795 119.342 119.329 119.950 119.901 118.190 116.443
from the rest of the world .......... Plus: Command-basis exports of
goods and services and income receipts from the rest of the
2 145.597 146.613 148.662 150.058 149.930 137.803 122.888
world 1 ...................................... Equals: Command-basis gross
3 142.179 137.617 141.612 138.541 137.696 132.619 124.323
national product...................... Addendum:
Percent change from preceding period in command-basis
4 117.282 117.992 118.271 118.222 118.065 117.412 116.658
real gross national product ... 5 2.1 0.6 –0.4 –0.2 –0.5 –2.2 –2.5
1. Exports of goods and services and income receipts deflated by the implicit price deflator for imports of goods and services and income payments.
Table 1.8.6. Command-Basis Real Gross National Product, Chained Dollars [Billions of chained (2000) dollars]
Line 2007 2008
Seasonally adjusted at annual rates
2008 2009
I II III IV I
Gross national product .............. Less: Exports of goods and
services and income receipts
1 11,609.8 11,762.3 11,760.9 11,822.2 11,817.3 11,648.7 11,476.5
from the rest of the world .......... Plus: Command-basis exports of
goods and services and income receipts from the rest of the
2 2,153.3 2,168.3 2,198.6 2,219.3 2,217.4 2,038.0 1,817.4
world 1 ...................................... Equals: Command-basis gross
3 2,102.7 2,035.3 2,094.4 2,049.0 2,036.5 1,961.4 1,838.7
national product...................... Addendum:
4 11,559.2 11,629.3 11,656.8 11,651.9 11,636.5 11,572.1 11,497.8
Terms of trade 2 ........................ 5 97.652 93.918 95.261 92.328 91.843 96.241 101.171
1. Exports of goods and services and income receipts deflated by the implicit price deflator for imports of goods and services and income payments.
2. Ratio of the implicit price deflator for exports of goods and services and income receipts to the corresponding implicit price deflator for imports divided by 100.
NOTE. Chained (2000) dollar series are calculated as the product of the chain-type quantity index and the 2000 current-dollar value of the corresponding series, divided by 100. Because the formula for the chain-type quantity indexes uses weights of more than one period, the corresponding chained-dollar estimates are usually not additive.
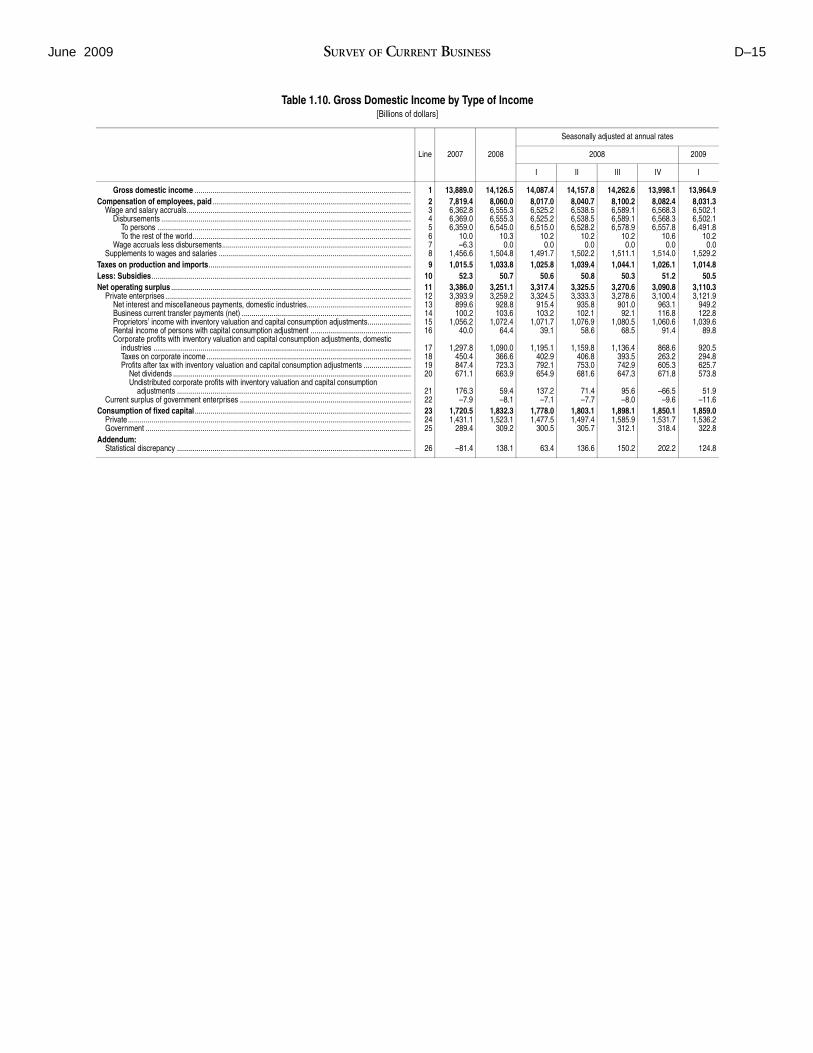
June 2009 SURVEY OF CURRENT BUSINESS D–15
Table 1.10. Gross Domestic Income by Type of Income [Billions of dollars]
Line 2007 2008
Seasonally adjusted at annual rates
2008 2009
I II III IV I
Gross domestic income .............................................................................................................. 1 13,889.0 14,126.5 14,087.4 14,157.8 14,262.6 13,998.1 13,964.9 Compensation of employees, paid ..................................................................................................... 2 7,819.4 8,060.0 8,017.0 8,040.7 8,100.2 8,082.4 8,031.3
Wage and salary accruals.................................................................................................................. 3 6,362.8 6,555.3 6,525.2 6,538.5 6,589.1 6,568.3 6,502.1 Disbursements ............................................................................................................................... 4 6,369.0 6,555.3 6,525.2 6,538.5 6,589.1 6,568.3 6,502.1
To persons ................................................................................................................................. 5 6,359.0 6,545.0 6,515.0 6,528.2 6,578.9 6,557.8 6,491.8 To the rest of the world............................................................................................................... 6 10.0 10.3 10.2 10.2 10.2 10.6 10.2
Wage accruals less disbursements................................................................................................ 7 –6.3 0.0 0.0 0.0 0.0 0.0 0.0 Supplements to wages and salaries .................................................................................................. 8 1,456.6 1,504.8 1,491.7 1,502.2 1,511.1 1,514.0 1,529.2
Taxes on production and imports....................................................................................................... 9 1,015.5 1,033.8 1,025.8 1,039.4 1,044.1 1,026.1 1,014.8 Less: Subsidies.................................................................................................................................... 10 52.3 50.7 50.6 50.8 50.3 51.2 50.5 Net operating surplus .......................................................................................................................... 11 3,386.0 3,251.1 3,317.4 3,325.5 3,270.6 3,090.8 3,110.3
Private enterprises ............................................................................................................................. 12 3,393.9 3,259.2 3,324.5 3,333.3 3,278.6 3,100.4 3,121.9 Net interest and miscellaneous payments, domestic industries..................................................... 13 899.6 928.8 915.4 935.8 901.0 963.1 949.2 Business current transfer payments (net) ...................................................................................... 14 100.2 103.6 103.2 102.1 92.1 116.8 122.8 Proprietors’ income with inventory valuation and capital consumption adjustments...................... 15 1,056.2 1,072.4 1,071.7 1,076.9 1,080.5 1,060.6 1,039.6 Rental income of persons with capital consumption adjustment ................................................... 16 40.0 64.4 39.1 58.6 68.5 91.4 89.8 Corporate profits with inventory valuation and capital consumption adjustments, domestic
industries ................................................................................................................................... 17 1,297.8 1,090.0 1,195.1 1,159.8 1,136.4 868.6 920.5 Taxes on corporate income ........................................................................................................ 18 450.4 366.6 402.9 406.8 393.5 263.2 294.8 Profits after tax with inventory valuation and capital consumption adjustments ........................ 19 847.4 723.3 792.1 753.0 742.9 605.3 625.7
Net dividends ......................................................................................................................... 20 671.1 663.9 654.9 681.6 647.3 671.8 573.8 Undistributed corporate profits with inventory valuation and capital consumption
adjustments ....................................................................................................................... 21 176.3 59.4 137.2 71.4 95.6 –66.5 51.9 Current surplus of government enterprises ....................................................................................... 22 –7.9 –8.1 –7.1 –7.7 –8.0 –9.6 –11.6
Consumption of fixed capital .............................................................................................................. 23 1,720.5 1,832.3 1,778.0 1,803.1 1,898.1 1,850.1 1,859.0 Private ................................................................................................................................................ 24 1,431.1 1,523.1 1,477.5 1,497.4 1,585.9 1,531.7 1,536.2 Government ....................................................................................................................................... 25 289.4 309.2 300.5 305.7 312.1 318.4 322.8
Addendum: Statistical discrepancy ....................................................................................................................... 26 –81.4 138.1 63.4 136.6 150.2 202.2 124.8

D–16 National Data June 2009
Table 1.12. National Income by Type of Income [Billions of dollars]
Line 2007 2008
Seasonally adjusted at annual rates
2008 2009
I II III IV I
National income ........................................................................................................................... 1 12,270.9 12,427.4 12,447.6 12,468.6 12,491.4 12,302.0 12,254.5 Compensation of employees .............................................................................................................. 2 7,812.3 8,052.8 8,009.7 8,033.5 8,092.9 8,074.9 8,024.0
Wage and salary accruals.................................................................................................................. 3 6,355.7 6,548.0 6,518.0 6,531.3 6,581.8 6,560.8 6,494.8 Government ................................................................................................................................... 4 1,075.2 1,129.5 1,109.7 1,123.4 1,138.3 1,146.7 1,164.2 Other .............................................................................................................................................. 5 5,280.5 5,418.5 5,408.3 5,407.9 5,443.5 5,414.2 5,330.6
Supplements to wages and salaries .................................................................................................. 6 1,456.6 1,504.8 1,491.7 1,502.2 1,511.1 1,514.0 1,529.2 Employer contributions for employee pension and insurance funds .............................................. 7 991.9 1,026.9 1,015.3 1,024.4 1,031.2 1,036.7 1,052.3 Employer contributions for government social insurance ............................................................... 8 464.7 477.9 476.4 477.8 479.9 477.4 476.9
Proprietors’ income with IVA and CCAdj ........................................................................................... 9 1,056.2 1,072.4 1,071.7 1,076.9 1,080.5 1,060.6 1,039.6 Farm................................................................................................................................................... 10 44.0 34.6 41.6 38.0 32.4 26.3 24.1 Nonfarm ............................................................................................................................................. 11 1,012.2 1,037.9 1,030.1 1,039.0 1,048.2 1,034.2 1,015.5
Rental income of persons with CCAdj ............................................................................................... 12 40.0 64.4 39.1 58.6 68.5 91.4 89.8 Corporate profits with IVA and CCAdj ................................................................................................ 13 1,642.4 1,476.5 1,593.5 1,533.3 1,514.8 1,264.5 1,307.1
Taxes on corporate income ................................................................................................................ 14 450.4 366.6 402.9 406.8 393.5 263.2 294.8 Profits after tax with IVA and CCAdj................................................................................................... 15 1,192.0 1,109.9 1,190.6 1,126.5 1,121.3 1,001.2 1,012.3
Net dividends ................................................................................................................................. 16 788.7 832.1 832.5 846.4 841.1 808.3 766.1 Undistributed profits with IVA and CCAdj ....................................................................................... 17 403.4 277.8 358.1 280.0 280.3 192.9 246.2
Net interest and miscellaneous payments......................................................................................... 18 664.4 682.7 662.3 683.4 656.6 728.6 718.4 Taxes on production and imports....................................................................................................... 19 1,015.5 1,033.8 1,025.8 1,039.4 1,044.1 1,026.1 1,014.8 Less: Subsidies .................................................................................................................................... 20 52.3 50.7 50.6 50.8 50.3 51.2 50.5 Business current transfer payments (net) ......................................................................................... 21 100.2 103.6 103.2 102.1 92.1 116.8 122.8
To persons (net) ................................................................................................................................. 22 31.9 34.7 32.2 32.4 41.5 32.8 32.7 To government (net) ........................................................................................................................... 23 61.4 63.3 63.0 63.6 46.4 80.2 86.3 To the rest of the world (net)............................................................................................................... 24 6.9 5.5 8.0 6.1 4.2 3.8 3.8
Current surplus of government enterprises ...................................................................................... 25 –7.9 –8.1 –7.1 –7.7 –8.0 –9.6 –11.6 Cash flow:
Net cash flow with IVA and CCAdj ..................................................................................................... 26 1,348.7 1,288.9 1,337.0 1,276.5 1,319.6 1,222.6 1,281.6 Undistributed profits with IVA and CCAdj ....................................................................................... 27 403.4 277.8 358.1 280.0 280.3 192.9 246.2 Consumption of fixed capital .......................................................................................................... 28 945.3 1,011.1 978.8 996.5 1,039.4 1,029.7 1,035.4
Less: Inventory valuation adjustment ................................................................................................. 29 –51.2 –49.0 –109.4 –154.0 –90.9 158.1 105.3 Equals: Net cash flow......................................................................................................................... 30 1,399.9 1,338.0 1,446.3 1,430.5 1,410.5 1,064.5 1,176.3
Addenda: Proprietors’ income with IVA and CCAdj ............................................................................................ 31 1,056.2 1,072.4 1,071.7 1,076.9 1,080.5 1,060.6 1,039.6
Farm............................................................................................................................................... 32 44.0 34.6 41.6 38.0 32.4 26.3 24.1 Proprietors’ income with IVA ...................................................................................................... 33 51.5 42.6 49.4 45.9 40.6 34.7 32.3 Capital consumption adjustment ................................................................................................ 34 –7.5 –8.1 –7.8 –7.9 –8.2 –8.3 –8.3
Nonfarm ......................................................................................................................................... 35 1,012.2 1,037.9 1,030.1 1,039.0 1,048.2 1,034.2 1,015.5 Proprietors’ income (without IVA and CCAdj) ............................................................................ 36 893.5 865.6 871.0 881.9 883.5 826.1 824.5 Inventory valuation adjustment .................................................................................................. 37 –6.8 –5.6 –13.5 –19.7 –10.5 21.2 13.1 Capital consumption adjustment ................................................................................................ 38 125.5 177.9 172.6 176.7 175.2 187.0 177.9
Rental income of persons with CCAdj................................................................................................ 39 40.0 64.4 39.1 58.6 68.5 91.4 89.8 Rental income of persons (without CCAdj) .................................................................................... 40 56.8 81.9 55.9 75.1 89.9 106.9 104.8 Capital consumption adjustment .................................................................................................... 41 –16.8 –17.5 –16.8 –16.5 –21.4 –15.5 –15.0
Corporate profits with IVA and CCAdj ................................................................................................ 42 1,642.4 1,476.5 1,593.5 1,533.3 1,514.8 1,264.5 1,307.1 Corporate profits with IVA .............................................................................................................. 43 1,835.1 1,548.2 1,641.5 1,596.0 1,602.8 1,352.6 1,452.0
Profits before tax (without IVA and CCAdj) ................................................................................ 44 1,886.3 1,597.3 1,750.9 1,750.0 1,693.7 1,194.5 1,346.6 Taxes on corporate income .................................................................................................... 45 450.4 366.6 402.9 406.8 393.5 263.2 294.8 Profits after tax (without IVA and CCAdj) ............................................................................... 46 1,435.9 1,230.6 1,348.0 1,343.2 1,300.1 931.2 1,051.8
Net dividends ..................................................................................................................... 47 788.7 832.1 832.5 846.4 841.1 808.3 766.1 Undistributed profits (without IVA and CCAdj) ................................................................... 48 647.3 398.6 515.5 496.7 459.1 122.9 285.7
Inventory valuation adjustment .................................................................................................. 49 –51.2 –49.0 –109.4 –154.0 –90.9 158.1 105.3 Capital consumption adjustment .................................................................................................... 50 –192.7 –71.7 –48.0 –62.7 –88.0 –88.1 –144.9
IVA Inventory valuation adjustment CCAdj Capital consumption adjustment
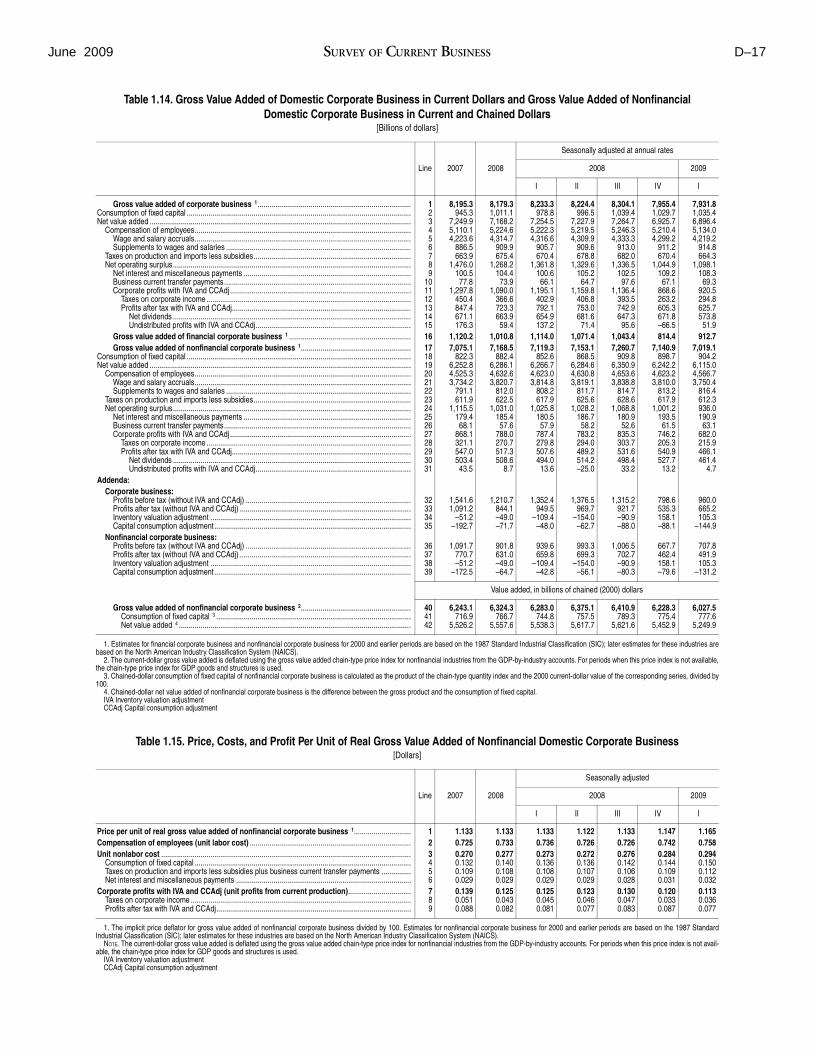
June 2009 SURVEY OF CURRENT BUSINESS D–17
Table 1.14. Gross Value Added of Domestic Corporate Business in Current Dollars and Gross Value Added of Nonfinancial Domestic Corporate Business in Current and Chained Dollars
[Billions of dollars]
Line 2007 2008
Seasonally adjusted at annual rates
2008 2009
I II III IV I
Gross value added of corporate business 1.............................................................................. Consumption of fixed capital .................................................................................................................. Net value added .....................................................................................................................................
Compensation of employees.............................................................................................................. Wage and salary accruals.............................................................................................................. Supplements to wages and salaries ..............................................................................................
Taxes on production and imports less subsidies................................................................................ Net operating surplus.........................................................................................................................
Net interest and miscellaneous payments ..................................................................................... Business current transfer payments............................................................................................... Corporate profits with IVA and CCAdj ............................................................................................
Taxes on corporate income ........................................................................................................ Profits after tax with IVA and CCAdj...........................................................................................
Net dividends ......................................................................................................................... Undistributed profits with IVA and CCAdj...............................................................................
Gross value added of financial corporate business 1 .............................................................. Gross value added of nonfinancial corporate business 1........................................................
Consumption of fixed capital .................................................................................................................. Net value added .....................................................................................................................................
Compensation of employees.............................................................................................................. Wage and salary accruals.............................................................................................................. Supplements to wages and salaries ..............................................................................................
Taxes on production and imports less subsidies................................................................................ Net operating surplus.........................................................................................................................
Net interest and miscellaneous payments ..................................................................................... Business current transfer payments............................................................................................... Corporate profits with IVA and CCAdj ............................................................................................
Taxes on corporate income ........................................................................................................ Profits after tax with IVA and CCAdj...........................................................................................
Net dividends ......................................................................................................................... Undistributed profits with IVA and CCAdj...............................................................................
Addenda: Corporate business:
Profits before tax (without IVA and CCAdj) .................................................................................... Profits after tax (without IVA and CCAdj) ....................................................................................... Inventory valuation adjustment ...................................................................................................... Capital consumption adjustment ....................................................................................................
Nonfinancial corporate business: Profits before tax (without IVA and CCAdj) .................................................................................... Profits after tax (without IVA and CCAdj) ....................................................................................... Inventory valuation adjustment ...................................................................................................... Capital consumption adjustment ....................................................................................................
1 2 3 4 5 6 7 8 9
10 11 12 13 14 15 16 17 18 19 20 21 22 23 24 25 26 27 28 29 30 31
32 33 34 35
36 37 38 39
8,195.3 945.3
7,249.9 5,110.1 4,223.6
886.5 663.9
1,476.0 100.5 77.8
1,297.8 450.4 847.4 671.1 176.3
1,120.2 7,075.1
822.3 6,252.8 4,525.3 3,734.2
791.1 611.9
1,115.5 179.4 68.1
868.1 321.1 547.0 503.4 43.5
1,541.6 1,091.2
–51.2 –192.7
1,091.7 770.7 –51.2
–172.5
8,179.3 1,011.1 7,168.2 5,224.6 4,314.7
909.9 675.4
1,268.2 104.4 73.9
1,090.0 366.6 723.3 663.9 59.4
1,010.8 7,168.5
882.4 6,286.1 4,632.6 3,820.7
812.0 622.5
1,031.0 185.4 57.6
788.0 270.7 517.3 508.6
8.7
1,210.7 844.1 –49.0 –71.7
901.8 631.0 –49.0 –64.7
8,233.3 978.8
7,254.5 5,222.3 4,316.6
905.7 670.4
1,361.8 100.6 66.1
1,195.1 402.9 792.1 654.9 137.2
1,114.0 7,119.3
852.6 6,266.7 4,623.0 3,814.8
808.2 617.9
1,025.8 180.5 57.9
787.4 279.8 507.6 494.0 13.6
1,352.4 949.5
–109.4 –48.0
939.6 659.8
–109.4 –42.8
8,224.4 996.5
7,227.9 5,219.5 4,309.9
909.6 678.8
1,329.6 105.2
64.7 1,159.8
406.8 753.0 681.6
71.4 1,071.4 7,153.1
868.5 6,284.6 4,630.8 3,819.1
811.7 625.6
1,028.2 186.7
58.2 783.2 294.0 489.2 514.2 –25.0
1,376.5 969.7
–154.0 –62.7
993.3 699.3
–154.0 –56.1
8,304.1 1,039.4 7,264.7 5,246.3 4,333.3
913.0 682.0
1,336.5 102.5
97.6 1,136.4
393.5 742.9 647.3
95.6 1,043.4 7,260.7
909.8 6,350.9 4,653.6 3,838.8
814.7 628.6
1,068.8 180.9
52.6 835.3 303.7 531.6 498.4
33.2
1,315.2 921.7 –90.9 –88.0
1,006.5 702.7 –90.9 –80.3
7,955.4 1,029.7 6,925.7 5,210.4 4,299.2
911.2 670.4
1,044.9 109.2
67.1 868.6 263.2 605.3 671.8 –66.5 814.4
7,140.9 898.7
6,242.2 4,623.2 3,810.0
813.2 617.9
1,001.2 193.5
61.5 746.2 205.3 540.9 527.7
13.2
798.6 535.3 158.1 –88.1
667.7 462.4 158.1 –79.6
7,931.8 1,035.4 6,896.4 5,134.0 4,219.2
914.8 664.3
1,098.1 108.3
69.3 920.5 294.8 625.7 573.8
51.9 912.7
7,019.1 904.2
6,115.0 4,566.7 3,750.4
816.4 612.3 936.0 190.9
63.1 682.0 215.9 466.1 461.4
4.7
960.0 665.2 105.3
–144.9
707.8 491.9 105.3
–131.2
Value added, in billions of chained (2000) dollars
Gross value added of nonfinancial corporate business 2........................................................ Consumption of fixed capital 3 ................................................................................................... Net value added 4 ......................................................................................................................
40 41 42
6,243.1 716.9
5,526.2
6,324.3 766.7
5,557.6
6,283.0 744.8
5,538.3
6,375.1 757.5
5,617.7
6,410.9 789.3
5,621.6
6,228.3 775.4
5,452.9
6,027.5 777.6
5,249.9
1. Estimates for financial corporate business and nonfinancial corporate business for 2000 and earlier periods are based on the 1987 Standard Industrial Classification (SIC); later estimates for these industries are based on the North American Industry Classification System (NAICS).
2. The current-dollar gross value added is deflated using the gross value added chain-type price index for nonfinancial industries from the GDP-by-industry accounts. For periods when this price index is not available, the chain-type price index for GDP goods and structures is used.
3. Chained-dollar consumption of fixed capital of nonfinancial corporate business is calculated as the product of the chain-type quantity index and the 2000 current-dollar value of the corresponding series, divided by 100.
4. Chained-dollar net value added of nonfinancial corporate business is the difference between the gross product and the consumption of fixed capital. IVA Inventory valuation adjustment CCAdj Capital consumption adjustment
Table 1.15. Price, Costs, and Profit Per Unit of Real Gross Value Added of Nonfinancial Domestic Corporate Business [Dollars]
Line 2007 2008
Seasonally adjusted
2008 2009
I II III IV I
Price per unit of real gross value added of nonfinancial corporate business 1............................. 1 1.133 1.133 1.133 1.122 1.133 1.147 1.165 Compensation of employees (unit labor cost) .................................................................................. 2 0.725 0.733 0.736 0.726 0.726 0.742 0.758 Unit nonlabor cost ............................................................................................................................... 3 0.270 0.277 0.273 0.272 0.276 0.284 0.294
Consumption of fixed capital .............................................................................................................. 4 0.132 0.140 0.136 0.136 0.142 0.144 0.150 Taxes on production and imports less subsidies plus business current transfer payments ............... 5 0.109 0.108 0.108 0.107 0.106 0.109 0.112 Net interest and miscellaneous payments ......................................................................................... 6 0.029 0.029 0.029 0.029 0.028 0.031 0.032
Corporate profits with IVA and CCAdj (unit profits from current production)................................ 7 0.139 0.125 0.125 0.123 0.130 0.120 0.113 Taxes on corporate income ................................................................................................................ 8 0.051 0.043 0.045 0.046 0.047 0.033 0.036 Profits after tax with IVA and CCAdj................................................................................................... 9 0.088 0.082 0.081 0.077 0.083 0.087 0.077
1. The implicit price deflator for gross value added of nonfinancial corporate business divided by 100. Estimates for nonfinancial corporate business for 2000 and earlier periods are based on the 1987 Standard Industrial Classification (SIC); later estimates for these industries are based on the North American Industry Classification System (NAICS).
NOTE. The current-dollar gross value added is deflated using the gross value added chain-type price index for nonfinancial industries from the GDP-by-industry accounts. For periods when this price index is not available, the chain-type price index for GDP goods and structures is used.
IVA Inventory valuation adjustment CCAdj Capital consumption adjustment

D–18 National Data June 2009
2. Personal Income and Outlays
Table 2.1. Personal Income and Its Disposition [Billions of dollars]
Line 2007 2008
Seasonally adjusted at annual rates
2008 2009
I II III IV I
Personal income................................................................................................................................... 1 11,663.2 12,100.6 11,960.5 12,152.2 12,170.4 12,119.5 12,060.6 Compensation of employees, received .............................................................................................. 2 7,818.6 8,052.8 8,009.7 8,033.5 8,092.9 8,074.9 8,024.0
Wage and salary disbursements.................................................................................................... 3 6,362.0 6,548.0 6,518.0 6,531.3 6,581.8 6,560.8 6,494.8 Private industries ....................................................................................................................... 4 5,286.7 5,418.5 5,408.3 5,407.9 5,443.5 5,414.2 5,330.6 Government ............................................................................................................................... 5 1,075.2 1,129.5 1,109.7 1,123.4 1,138.3 1,146.7 1,164.2
Supplements to wages and salaries .............................................................................................. 6 1,456.6 1,504.8 1,491.7 1,502.2 1,511.1 1,514.0 1,529.2 Employer contributions for employee pension and insurance funds .......................................... 7 991.9 1,026.9 1,015.3 1,024.4 1,031.2 1,036.7 1,052.3 Employer contributions for government social insurance........................................................... 8 464.7 477.9 476.4 477.8 479.9 477.4 476.9
Proprietors’ income with inventory valuation and capital consumption adjustments.......................... 9 1,056.2 1,072.4 1,071.7 1,076.9 1,080.5 1,060.6 1,039.6 Farm............................................................................................................................................... 10 44.0 34.6 41.6 38.0 32.4 26.3 24.1 Nonfarm ......................................................................................................................................... 11 1,012.2 1,037.9 1,030.1 1,039.0 1,048.2 1,034.2 1,015.5
Rental income of persons with capital consumption adjustment........................................................ 12 40.0 64.4 39.1 58.6 68.5 91.4 89.8 Personal income receipts on assets................................................................................................... 13 2,000.1 2,037.7 2,054.1 2,052.3 2,055.7 1,988.5 1,912.9
Personal interest income................................................................................................................ 14 1,214.3 1,208.5 1,224.6 1,208.7 1,217.4 1,183.4 1,150.0 Personal dividend income .............................................................................................................. 15 785.8 829.1 829.5 843.6 838.3 805.1 762.9
Personal current transfer receipts ...................................................................................................... 16 1,713.3 1,869.1 1,778.1 1,926.3 1,872.7 1,899.3 1,988.1 Government social benefits to persons.......................................................................................... 17 1,681.4 1,834.4 1,745.8 1,893.9 1,831.2 1,866.6 1,955.4
Old-age, survivors, disability, and health insurance benefits...................................................... 18 999.4 1,058.3 1,032.4 1,050.0 1,068.9 1,081.9 1,132.4 Government unemployment insurance benefits......................................................................... 19 32.3 52.3 38.2 41.4 59.2 70.4 94.6 Veterans benefits ....................................................................................................................... 20 41.9 45.4 44.6 44.9 45.7 46.5 49.3 Family assistance 1 .................................................................................................................... 21 18.8 19.3 19.2 19.3 19.4 19.5 19.6 Other .......................................................................................................................................... 22 588.9 659.0 611.5 738.4 637.9 648.3 659.5
Other current transfer receipts, from business (net)....................................................................... 23 31.9 34.7 32.2 32.4 41.5 32.8 32.7 Less: Contributions for government social insurance......................................................................... 24 965.1 995.7 992.2 995.4 1,000.0 995.2 993.9
Less: Personal current taxes .............................................................................................................. 25 1,492.8 1,457.3 1,535.0 1,346.1 1,470.7 1,477.4 1,276.7 Equals: Disposable personal income ................................................................................................ 26 10,170.5 10,643.3 10,425.5 10,806.0 10,699.7 10,642.0 10,783.9 Less: Personal outlays ........................................................................................................................ 27 10,113.1 10,450.7 10,404.9 10,538.2 10,559.9 10,299.7 10,308.4
Personal consumption expenditures .................................................................................................. 28 9,710.2 10,057.9 10,002.3 10,138.0 10,163.5 9,927.9 9,941.0 Personal interest payments 2 ............................................................................................................. 29 265.4 248.2 261.7 253.8 248.9 228.4 217.4 Personal current transfer payments ................................................................................................... 30 137.5 144.5 140.8 146.4 147.5 143.4 150.0
To government ............................................................................................................................... 31 81.2 84.4 82.9 83.7 84.8 86.3 87.9 To the rest of the world (net) .......................................................................................................... 32 56.3 60.1 57.9 62.7 62.7 57.1 62.2
Equals: Personal saving ...................................................................................................................... 33 57.4 192.7 20.6 267.9 139.8 342.3 475.5 Personal saving as a percentage of disposable personal income .............................................. 34 0.6 1.8 0.2 2.5 1.3 3.2 4.4
Addenda: Disposable personal income:
Total, billions of chained (2000) dollars 3 ....................................................................................... 35 8,644.0 8,753.6 8,667.9 8,891.0 8,696.4 8,758.2 8,897.4 Per capita:
Current dollars ........................................................................................................................... 36 33,706 34,950 34,351 35,531 35,096 34,821 35,213 Chained (2000) dollars............................................................................................................... 37 28,648 28,745 28,560 29,234 28,525 28,657 29,053
Population (midperiod, thousands) .................................................................................................... 38 301,737 304,529 303,498 304,128 304,872 305,619 306,245 Percent change from preceding period:
Disposable personal income, current dollars ........................................................................... 39 5.5 4.6 2.9 15.4 –3.9 –2.1 5.4 Disposable personal income, chained (2000) dollars............................................................... 40 2.8 1.3 –0.7 10.7 –8.5 2.9 6.5
1. Consists of aid to families with dependent children and, beginning with 1996, assistance programs operating under the Personal Responsibility and Work Opportunity Reconciliation Act of 1996. 2. Consists of nonmortgage interest paid by households. 3. Equals disposable personal income deflated by the implicit price deflator for personal consumption expenditures.
Table 2.2B. Wage and Salary Disbursements by Industry [Billions of dollars]
Line 2007 2008
Seasonally adjusted at annual rates
2008 2009
I II III IV I
Wage and salary disbursements ................................................................................................. Private industries..................................................................................................................................
Goods-producing industries................................................................................................................ Manufacturing.................................................................................................................................
Services-producing industries ............................................................................................................ Trade, transportation, and utilities................................................................................................... Other services-producing industries 1 ............................................................................................
Government...........................................................................................................................................
1 2 3 4 5 6 7 8
6,362.0 5,286.7 1,205.4
746.0 4,081.3 1,035.2 3,046.1 1,075.2
6,548.0 5,418.5 1,210.0
742.4 4,208.5 1,047.7 3,160.8 1,129.5
6,518.0 5,408.3 1,217.7
748.4 4,190.5 1,050.4 3,140.2 1,109.7
6,531.3 5,407.9 1,212.7
745.0 4,195.2 1,048.4 3,146.7 1,123.4
6,581.8 5,443.5 1,211.7
742.2 4,231.8 1,050.4 3,181.5 1,138.3
6,560.8 5,414.2 1,197.7
733.9 4,216.5 1,041.6 3,174.9 1,146.7
6,494.8 5,330.6 1,154.6
708.1 4,176.0 1,035.0 3,141.0 1,164.2
1. Other services-producing industries consists of information; finance and insurance; real estate and rental and leasing; professional, scientific, and technical services; management of companies and enterprises, administrative and support and waste management and remediation services; educational services; health care and social assistance; arts, entertainment, and recreation; accommodation and food services; and other services.
NOTE. Estimates in this table are based on the 1997 North American Industry Classification System (NAICS).
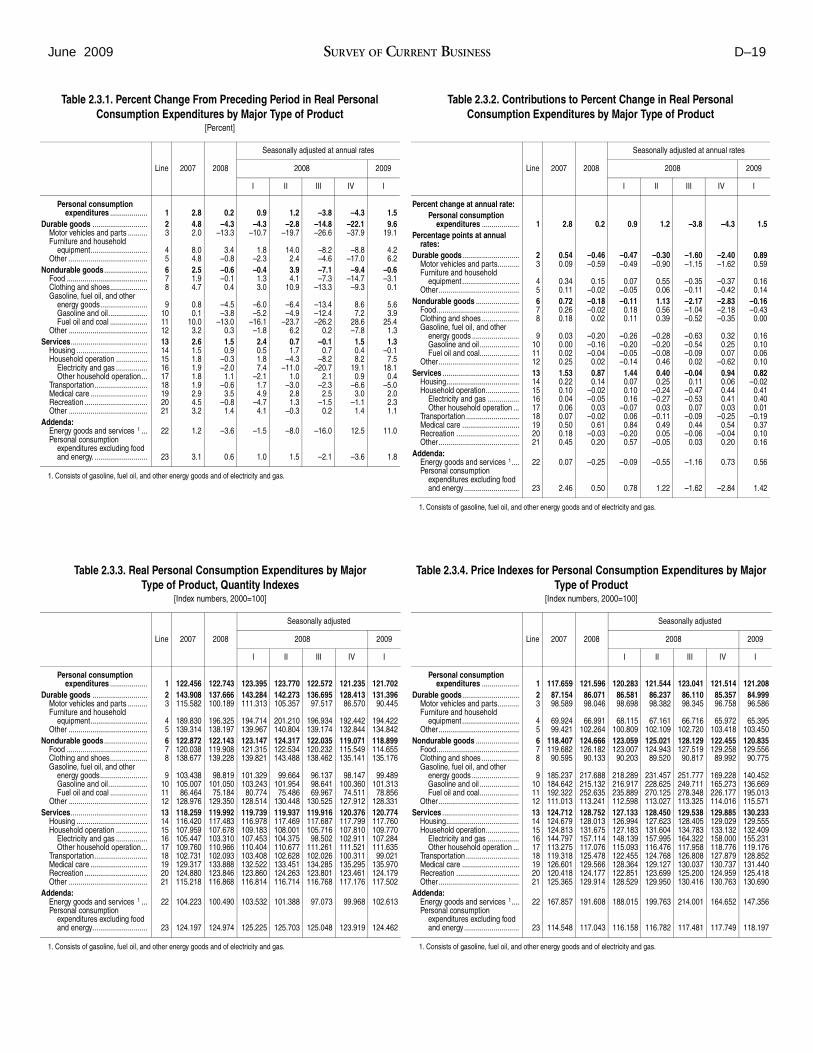
June 2009 SURVEY OF CURRENT BUSINESS D–19
Table 2.3.1. Percent Change From Preceding Period in Real Personal Table 2.3.2. Contributions to Percent Change in Real Personal Consumption Expenditures by Major Type of Product Consumption Expenditures by Major Type of Product
[Percent]
Line 2007 2008
Seasonally adjusted at annual rates
2008 2009
I II III IV I
Personal consumption expenditures ................... 1 2.8 0.2 0.9 1.2 –3.8 –4.3 1.5
Durable goods ............................ 2 4.8 –4.3 –4.3 –2.8 –14.8 –22.1 9.6 Motor vehicles and parts .......... Furniture and household
3 2.0 –13.3 –10.7 –19.7 –26.6 –37.9 19.1
equipment............................. 4 8.0 3.4 1.8 14.0 –8.2 –8.8 4.2 Other ........................................ 5 4.8 –0.8 –2.3 2.4 –4.6 –17.0 6.2
Nondurable goods ...................... 6 2.5 –0.6 –0.4 3.9 –7.1 –9.4 –0.6 Food ......................................... 7 1.9 –0.1 1.3 4.1 –7.3 –14.7 –3.1 Clothing and shoes................... Gasoline, fuel oil, and other
8 4.7 0.4 3.0 10.9 –13.3 –9.3 0.1
energy goods........................ 9 0.8 –4.5 –6.0 –6.4 –13.4 8.6 5.6 Gasoline and oil.................... 10 0.1 –3.8 –5.2 –4.9 –12.4 7.2 3.9 Fuel oil and coal ................... 11 10.0 –13.0 –16.1 –23.7 –26.2 28.6 25.4
Other ........................................ 12 3.2 0.3 –1.8 6.2 0.2 –7.8 1.3 Services....................................... 13 2.6 1.5 2.4 0.7 –0.1 1.5 1.3
Housing .................................... 14 1.5 0.9 0.5 1.7 0.7 0.4 –0.1 Household operation ................ 15 1.8 –0.3 1.8 –4.3 –8.2 8.2 7.5
Electricity and gas ................ 16 1.9 –2.0 7.4 –11.0 –20.7 19.1 18.1 Other household operation... 17 1.8 1.1 –2.1 1.0 2.1 0.9 0.4
Transportation........................... 18 1.9 –0.6 1.7 –3.0 –2.3 –6.6 –5.0 Medical care ............................. 19 2.9 3.5 4.9 2.8 2.5 3.0 2.0 Recreation ................................ 20 4.5 –0.8 –4.7 1.3 –1.5 –1.1 2.3 Other ........................................
Addenda: 21 3.2 1.4 4.1 –0.3 0.2 1.4 1.1
Energy goods and services 1 ... Personal consumption
expenditures excluding food
22 1.2 –3.6 –1.5 –8.0 –16.0 12.5 11.0
and energy. ........................... 23 3.1 0.6 1.0 1.5 –2.1 –3.6 1.8
Line 2007 2008
Seasonally adjusted at annual rates
2008 2009
I II III IV I
Percent change at annual rate: Personal consumption
expenditures ................... Percentage points at annual
rates:
1 2.8 0.2 0.9 1.2 –3.8 –4.3 1.5
Durable goods............................. 2 0.54 –0.46 –0.47 –0.30 –1.60 –2.40 0.89 Motor vehicles and parts........... Furniture and household
3 0.09 –0.59 –0.49 –0.90 –1.15 –1.62 0.59
equipment ............................. 4 0.34 0.15 0.07 0.55 –0.35 –0.37 0.16 Other......................................... 5 0.11 –0.02 –0.05 0.06 –0.11 –0.42 0.14
Nondurable goods ...................... 6 0.72 –0.18 –0.11 1.13 –2.17 –2.83 –0.16 Food.......................................... 7 0.26 –0.02 0.18 0.56 –1.04 –2.18 –0.43 Clothing and shoes ................... Gasoline, fuel oil, and other
8 0.18 0.02 0.11 0.39 –0.52 –0.35 0.00
energy goods ........................ 9 0.03 –0.20 –0.26 –0.28 –0.63 0.32 0.16 Gasoline and oil .................... 10 0.00 –0.16 –0.20 –0.20 –0.54 0.25 0.10 Fuel oil and coal.................... 11 0.02 –0.04 –0.05 –0.08 –0.09 0.07 0.06
Other......................................... 12 0.25 0.02 –0.14 0.46 0.02 –0.62 0.10 Services ....................................... 13 1.53 0.87 1.44 0.40 –0.04 0.94 0.82
Housing..................................... 14 0.22 0.14 0.07 0.25 0.11 0.06 –0.02 Household operation................. 15 0.10 –0.02 0.10 –0.24 –0.47 0.44 0.41
Electricity and gas ................ 16 0.04 –0.05 0.16 –0.27 –0.53 0.41 0.40 Other household operation ... 17 0.06 0.03 –0.07 0.03 0.07 0.03 0.01
Transportation ........................... 18 0.07 –0.02 0.06 –0.11 –0.09 –0.25 –0.19 Medical care ............................. 19 0.50 0.61 0.84 0.49 0.44 0.54 0.37 Recreation ................................ 20 0.18 –0.03 –0.20 0.05 –0.06 –0.04 0.10 Other.........................................
Addenda: 21 0.45 0.20 0.57 –0.05 0.03 0.20 0.16
Energy goods and services 1.... Personal consumption
expenditures excluding food
22 0.07 –0.25 –0.09 –0.55 –1.16 0.73 0.56
and energy............................ 23 2.46 0.50 0.78 1.22 –1.62 –2.84 1.42 1. Consists of gasoline, fuel oil, and other energy goods and of electricity and gas.
1. Consists of gasoline, fuel oil, and other energy goods and of electricity and gas.
Table 2.3.3. Real Personal Consumption Expenditures by Major Table 2.3.4. Price Indexes for Personal Consumption Expenditures by Major Type of Product, Quantity Indexes Type of Product
[Index numbers, 2000=100] [Index numbers, 2000=100]
Line 2007 2008
Seasonally adjusted
2008 2009
I II III IV I
Personal consumption expenditures ................... 1 122.456 122.743 123.395 123.770 122.572 121.235 121.702
Durable goods ............................ 2 143.908 137.666 143.284 142.273 136.695 128.413 131.396 Motor vehicles and parts .......... Furniture and household
3 115.582 100.189 111.313 105.357 97.517 86.570 90.445
equipment............................. 4 189.830 196.325 194.714 201.210 196.934 192.442 194.422 Other ........................................ 5 139.314 138.197 139.967 140.804 139.174 132.844 134.842
Nondurable goods ...................... 6 122.872 122.143 123.147 124.317 122.035 119.071 118.899 Food ......................................... 7 120.038 119.908 121.315 122.534 120.232 115.549 114.655 Clothing and shoes................... Gasoline, fuel oil, and other
8 138.677 139.228 139.821 143.488 138.462 135.141 135.176
energy goods........................ 9 103.438 98.819 101.329 99.664 96.137 98.147 99.489 Gasoline and oil.................... 10 105.007 101.050 103.243 101.954 98.641 100.360 101.313 Fuel oil and coal ................... 11 86.464 75.184 80.774 75.486 69.967 74.511 78.856
Other ........................................ 12 128.976 129.350 128.514 130.448 130.525 127.912 128.331 Services....................................... 13 118.259 119.992 119.739 119.937 119.916 120.376 120.774
Housing .................................... 14 116.420 117.483 116.978 117.469 117.687 117.799 117.760 Household operation ................ 15 107.959 107.678 109.183 108.001 105.716 107.810 109.770
Electricity and gas ................ 16 105.447 103.310 107.453 104.375 98.502 102.911 107.284 Other household operation... 17 109.760 110.966 110.404 110.677 111.261 111.521 111.635
Transportation........................... 18 102.731 102.093 103.408 102.628 102.026 100.311 99.021 Medical care ............................. 19 129.317 133.888 132.522 133.451 134.285 135.295 135.970 Recreation ................................ 20 124.880 123.846 123.860 124.263 123.801 123.461 124.179 Other ........................................
Addenda: 21 115.218 116.868 116.814 116.714 116.768 117.176 117.502
Energy goods and services 1 ... 22 104.223 100.490 103.532 101.388 97.073 99.968 102.613 Personal consumption
expenditures excluding food and energy............................ 23 124.197 124.974 125.225 125.703 125.048 123.919 124.462
Line 2007 2008
Seasonally adjusted
2008 2009
I II III IV I
Personal consumption expenditures ................... 1 117.659 121.596 120.283 121.544 123.041 121.514 121.208
Durable goods............................. 2 87.154 86.071 86.581 86.237 86.110 85.357 84.999 Motor vehicles and parts........... Furniture and household
3 98.589 98.046 98.698 98.382 98.345 96.758 96.586
equipment ............................. 4 69.924 66.991 68.115 67.161 66.716 65.972 65.395 Other......................................... 5 99.421 102.264 100.809 102.109 102.720 103.418 103.450
Nondurable goods ...................... 6 118.407 124.666 123.059 125.021 128.129 122.455 120.835 Food.......................................... 7 119.682 126.182 123.007 124.943 127.519 129.258 129.556 Clothing and shoes ................... Gasoline, fuel oil, and other
8 90.595 90.133 90.203 89.520 90.817 89.992 90.775
energy goods ........................ 9 185.237 217.688 218.289 231.457 251.777 169.228 140.452 Gasoline and oil .................... 10 184.642 215.132 216.917 228.625 249.711 165.273 136.669 Fuel oil and coal.................... 11 192.322 252.635 235.889 270.125 278.348 226.177 195.013
Other......................................... 12 111.013 113.241 112.598 113.027 113.325 114.016 115.571 Services ....................................... 13 124.712 128.752 127.133 128.450 129.538 129.885 130.233
Housing..................................... 14 124.679 128.013 126.994 127.623 128.405 129.029 129.555 Household operation................. 15 124.813 131.675 127.183 131.604 134.783 133.132 132.409
Electricity and gas ................ 16 144.797 157.114 148.139 157.995 164.322 158.000 155.231 Other household operation ... 17 113.275 117.076 115.093 116.476 117.958 118.776 119.176
Transportation ........................... 18 119.318 125.478 122.455 124.768 126.808 127.879 128.852 Medical care ............................. 19 126.601 129.566 128.364 129.127 130.037 130.737 131.440 Recreation ................................ 20 120.418 124.177 122.851 123.699 125.200 124.959 125.418 Other.........................................
Addenda: 21 125.365 129.914 128.529 129.950 130.416 130.763 130.690
Energy goods and services 1.... 22 167.857 191.608 188.015 199.763 214.001 164.652 147.356 Personal consumption
expenditures excluding food and energy............................ 23 114.548 117.043 116.158 116.782 117.481 117.749 118.197
1. Consists of gasoline, fuel oil, and other energy goods and of electricity and gas. 1. Consists of gasoline, fuel oil, and other energy goods and of electricity and gas.

D–20 National Data June 2009
Table 2.3.5. Personal Consumption Expenditures by Major Table 2.3.6. Real Personal Consumption Expenditures by Major Type of Product Type of Product, Chained Dollars
[Billions of dollars] [Billions of chained (2000) dollars]
Line 2007 2008
Seasonally adjusted at annual rates
2008 2009
I II III IV I
Personal consumption expenditures ................... 1 9,710.2 10,057.9 10,002.3 10,138.0 10,163.5 9,927.9 9,941.0
Durable goods ............................ 2 1,082.8 1,023.2 1,071.0 1,059.3 1,016.2 946.3 964.2 Motor vehicles and parts .......... Furniture and household
3 440.4 379.9 424.7 400.6 370.7 323.8 337.7
equipment............................. 4 415.3 411.7 415.1 423.0 411.2 397.4 398.0 Other ........................................ 5 227.0 231.6 231.3 235.7 234.3 225.2 228.6
Nondurable goods...................... 6 2,833.0 2,965.1 2,950.7 3,026.2 3,044.6 2,839.0 2,797.4 Food ......................................... 7 1,329.1 1,399.2 1,380.5 1,416.3 1,418.4 1,381.7 1,374.2 Clothing and shoes................... Gasoline, fuel oil, and other
8 374.0 373.6 375.5 382.4 374.4 362.1 365.3
energy goods........................ 9 366.9 411.8 423.7 441.8 463.6 318.1 267.6 Gasoline and oil.................... 10 340.6 381.8 393.4 409.5 432.7 291.4 243.3 Fuel oil and coal ................... 11 26.3 30.0 30.2 32.3 30.9 26.7 24.4
Other ........................................ 12 762.9 780.5 771.1 785.7 788.2 777.1 790.3 Services....................................... 13 5,794.4 6,069.6 5,980.6 6,052.5 6,102.7 6,142.5 6,179.4
Housing .................................... 14 1,460.9 1,513.7 1,495.1 1,508.8 1,520.9 1,529.7 1,535.5 Household operation ................ 15 525.7 553.0 541.7 554.5 555.8 559.9 567.0
Electricity and gas ................ 16 218.8 232.3 228.1 236.3 231.9 233.0 238.6 Other household operation... 17 306.9 320.6 313.6 318.1 323.9 326.9 328.3
Transportation........................... 18 357.0 373.0 368.8 372.9 376.8 373.6 371.6 Medical care ............................. 19 1,681.1 1,781.2 1,746.6 1,769.3 1,792.9 1,816.1 1,835.0 Recreation ................................ 20 403.4 412.6 408.2 412.3 415.8 413.9 417.8 Other ........................................
Addenda: 21 1,366.3 1,436.1 1,420.2 1,434.6 1,440.4 1,449.3 1,452.5
Energy goods and services 1 ... Personal consumption
expenditures excluding food
22 585.7 644.2 651.8 678.1 695.6 551.1 506.3
and energy ........................... 23 7,795.3 8,014.5 7,970.1 8,043.5 8,049.5 7,995.0 8,060.6
Line 2007 2008
Seasonally adjusted at annual rates
2008 2009
I II III IV I
Personal consumption expenditures ................... 1 8,252.8 8,272.1 8,316.1 8,341.3 8,260.6 8,170.5 8,202.0
Durable goods............................. 2 1,242.4 1,188.5 1,237.0 1,228.3 1,180.1 1,108.6 1,134.4 Motor vehicles and parts .......... Furniture and household
3 446.7 387.2 430.2 407.2 376.9 334.6 349.6
equipment ............................. 4 594.0 614.3 609.3 629.6 616.2 602.2 608.4 Other......................................... 5 228.3 226.5 229.4 230.8 228.1 217.7 221.0
Nondurable goods ...................... 6 2,392.6 2,378.4 2,397.9 2,420.7 2,376.3 2,318.6 2,315.2 Food.......................................... 7 1,110.5 1,109.3 1,122.4 1,133.6 1,112.3 1,069.0 1,060.7 Clothing and shoes ................... Gasoline, fuel oil, and other
8 412.9 414.5 416.3 427.2 412.2 402.3 402.4
energy goods ........................ 9 198.1 189.2 194.0 190.8 184.1 187.9 190.5 Gasoline and oil .................... 10 184.5 177.5 181.4 179.1 173.3 176.3 178.0 Fuel oil and coal ................... 11 13.7 11.9 12.8 11.9 11.1 11.8 12.5
Other......................................... 12 687.3 689.3 684.8 695.1 695.5 681.6 683.8 Services ....................................... 13 4,646.2 4,714.3 4,704.3 4,712.1 4,711.3 4,729.4 4,745.0
Housing..................................... 14 1,171.7 1,182.4 1,177.3 1,182.3 1,184.5 1,185.6 1,185.2 Household operation................. 15 421.2 420.1 425.9 421.3 412.4 420.6 428.2
Electricity and gas ................ 16 151.1 148.0 154.0 149.6 141.2 147.5 153.7 Other household operation ... 17 270.9 273.9 272.5 273.2 274.6 275.2 275.5
Transportation ........................... 18 299.2 297.4 301.2 298.9 297.2 292.2 288.4 Medical care ............................. 19 1,327.8 1,374.8 1,360.8 1,370.3 1,378.9 1,389.2 1,396.2 Recreation ................................ 20 335.0 332.2 332.3 333.4 332.1 331.2 333.1 Other......................................... 21 1,089.9 1,105.5 1,105.0 1,104.0 1,104.6 1,108.4 1,111.5
Residual........................................ Addenda:
22 –70.7 –72.6 –73.6 –84.9 –78.1 –54.3 –58.0
Energy goods and services 1.... Personal consumption
expenditures excluding food
23 348.9 336.4 346.6 339.4 325.0 334.7 343.5
and energy............................ 24 6,805.3 6,847.9 6,861.6 6,887.8 6,851.9 6,790.1 6,819.8 1. Consists of gasoline, fuel oil, and other energy goods and of electricity and gas.
1. Consists of gasoline, fuel oil, and other energy goods and of electricity and gas. NOTE. Chained (2000) dollar series are calculated as the product of the chain-type quantity index and the 2000 current-
dollar value of the corresponding series, divided by 100. Because the formula for the chain-type quantity indexes uses weights of more than one period, the corresponding chained-dollar estimates are usually not additive. The residual line is the difference between the first line and the sum of the most detailed lines.

June 2009 SURVEY OF CURRENT BUSINESS D–21
3. Government Current Receipts and Expenditures
Table 3.1. Government Current Receipts and Expenditures [Billions of dollars]
Line 2007 2008
Seasonally adjusted at annual rates
2008 2009
I II III IV I
Current receipts........................................................................... 1 4,177.8 4,116.2 4,215.6 4,049.9 4,154.1 4,045.3 3,870.8 Current tax receipts ............................................................................... 2 2,948.5 2,845.3 2,951.8 2,779.2 2,895.2 2,755.0 2,574.5
Personal current taxes....................................................................... 3 1,492.8 1,457.3 1,535.0 1,346.1 1,470.7 1,477.4 1,276.7 Taxes on production and imports ...................................................... 4 1,015.5 1,033.8 1,025.8 1,039.4 1,044.1 1,026.1 1,014.8 Taxes on corporate income ............................................................... 5 426.3 338.7 375.8 378.9 365.2 235.0 268.9 Taxes from the rest of the world ........................................................ 6 14.0 15.5 15.3 14.8 15.2 16.5 14.0
Contributions for government social insurance...................................... 7 965.1 995.7 992.2 995.4 1,000.0 995.2 993.9 Income receipts on assets..................................................................... 8 129.5 135.5 132.7 135.6 135.7 138.1 139.9
Interest and miscellaneous receipts .................................................. 9 126.6 132.6 129.7 132.7 132.9 134.9 136.7 Dividends........................................................................................... 10 2.8 3.0 3.0 2.9 2.8 3.2 3.2
Current transfer receipts........................................................................ 11 142.6 147.8 145.9 147.4 131.2 166.6 174.2 From business (net)........................................................................... 12 61.4 63.3 63.0 63.6 46.4 80.2 86.3 From persons .................................................................................... 13 81.2 84.4 82.9 83.7 84.8 86.3 87.9
Current surplus of government enterprises........................................... 14 –7.9 –8.1 –7.1 –7.7 –8.0 –9.6 –11.6 Current expenditures .................................................................. 15 4,396.7 4,721.3 4,598.7 4,766.3 4,801.7 4,718.4 4,775.4
Consumption expenditures.................................................................... 16 2,212.0 2,386.4 2,324.3 2,380.9 2,439.8 2,400.5 2,388.0 Current transfer payments ..................................................................... 17 1,721.3 1,874.0 1,793.5 1,930.2 1,866.8 1,905.4 1,986.0
Government social benefits ............................................................... 18 1,685.0 1,838.1 1,749.5 1,897.6 1,834.9 1,870.3 1,959.1 To persons..................................................................................... 19 1,681.4 1,834.4 1,745.8 1,893.9 1,831.2 1,866.6 1,955.4 To the rest of the world .................................................................. 20 3.6 3.7 3.7 3.8 3.7 3.8 3.7
Other current transfer payments to the rest of the world (net)........... 21 36.3 35.9 44.0 32.6 31.9 35.0 26.8 Interest payments .................................................................................. 22 411.1 410.2 430.3 404.4 444.8 361.3 351.0
To persons and business................................................................... 23 246.0 243.2 259.2 232.4 278.6 202.7 203.9 To the rest of the world ...................................................................... 24 165.1 167.0 171.1 172.0 166.2 158.7 147.1
Subsidies............................................................................................... 25 52.3 50.7 50.6 50.8 50.3 51.2 50.5 Less: Wage accruals less disbursements ............................................. 26 0.0 0.0 0.0 0.0 0.0 0.0 0.0
Net government saving............................................................... 27 –218.9 –605.1 –383.1 –716.4 –647.6 –673.1 –904.6 Social insurance funds .......................................................................... 28 11.9 –32.3 2.2 –14.2 –44.9 –72.4 –147.5 Other ..................................................................................................... 29 –230.8 –572.7 –385.3 –702.2 –602.7 –600.7 –757.1 Addenda:
Total receipts ................................................................................... 30 4,209.3 4,149.6 4,249.8 4,084.8 4,187.1 4,076.6 3,900.6 Current receipts............................................................................. 31 4,177.8 4,116.2 4,215.6 4,049.9 4,154.1 4,045.3 3,870.8 Capital transfer receipts................................................................. 32 31.6 33.4 34.3 35.0 33.0 31.3 29.8
Total expenditures ........................................................................... 33 4,608.7 4,994.4 4,810.0 4,906.4 5,034.8 5,226.4 5,215.6 Current expenditures..................................................................... 34 4,396.7 4,721.3 4,598.7 4,766.3 4,801.7 4,718.4 4,775.4 Gross government investment....................................................... 35 462.8 496.0 473.9 492.8 506.3 510.9 495.4 Capital transfer payments.............................................................. 36 28.8 102.3 34.6 34.6 34.6 305.4 257.2 Net purchases of nonproduced assets.......................................... 37 9.7 –16.0 3.3 –81.6 4.4 10.1 10.4 Less: Consumption of fixed capital................................................ 38 289.4 309.2 300.5 305.7 312.1 318.4 322.8
Net lending or net borrowing (–) .................................................... 39 –399.4 –844.8 –560.2 –821.6 –847.7 –1,149.8 –1,315.0

D–22 National Data June 2009
Table 3.2. Federal Government Current Receipts and Expenditures Table 3.3. State and Local Government Current Receipts and Expenditures [Billions of dollars] [Billions of dollars]
Line 2007 2008
Seasonally adjusted at annual rates
2008 2009
I II III IV I
Current receipts....................... 1 2,651.2 2,569.3 2,672.5 2,478.8 2,595.7 2,530.3 2,374.7 Current tax receipts ........................... 2 1,644.5 1,526.8 1,634.9 1,436.0 1,565.0 1,471.3 1,313.9
Personal current taxes................... 3 1,167.3 1,124.0 1,201.2 999.8 1,141.7 1,153.1 979.0 Taxes on production and imports... 4 97.7 96.2 95.8 96.9 94.7 97.3 89.7
Excise taxes .............................. 5 68.9 67.2 66.8 67.5 66.1 68.3 66.1 Customs duties.......................... 6 28.8 29.0 29.0 29.4 28.6 29.0 23.6
Taxes on corporate income ........... 7 365.4 291.1 322.5 324.4 313.4 204.3 231.2 Federal Reserve banks ............. 8 34.6 32.7 32.9 28.5 31.6 37.6 26.4 Other ......................................... 9 330.8 258.5 289.6 296.0 281.7 166.6 204.9
Taxes from the rest of the world .... Contributions for government social
10 14.0 15.5 15.3 14.8 15.2 16.5 14.0
insurance....................................... 11 942.3 972.0 968.9 971.8 976.0 971.0 969.5 Income receipts on assets................. 12 29.2 31.8 29.9 31.7 32.4 33.1 33.5
Interest receipts ............................. 13 21.9 22.2 21.7 21.9 22.4 22.8 23.1 Rents and royalties........................ 14 7.2 9.6 8.2 9.8 10.1 10.3 10.5
Current transfer receipts .................... 15 37.5 39.3 39.4 40.0 22.4 55.6 60.3 From business ............................... 16 20.5 21.3 21.7 22.0 4.3 37.4 42.4 From persons ................................
Current surplus of government 17 17.1 18.0 17.7 18.0 18.1 18.2 17.9
enterprises .................................... 18 –2.2 –0.5 –0.5 –0.6 –0.1 –0.7 –2.4 Current expenditures .............. 19 2,880.5 3,094.3 3,003.2 3,128.4 3,139.8 3,105.9 3,205.2
Consumption expenditures................ 20 856.1 931.9 898.0 918.2 954.2 957.5 960.1 Current transfer payments ................. 21 1,666.7 1,806.4 1,729.2 1,860.1 1,794.9 1,841.5 1,949.5
Government social benefits ........... 22 1,254.2 1,382.3 1,305.3 1,443.1 1,376.5 1,404.2 1,486.3 To persons................................. 23 1,250.6 1,378.6 1,301.7 1,439.4 1,372.7 1,400.4 1,482.6 To the rest of the world .............. 24 3.6 3.7 3.7 3.8 3.7 3.8 3.7
Other current transfer payments.... Grants-in-aid to state and local
25 412.5 424.2 423.9 417.0 418.4 437.3 463.2
governments.......................... 26 376.3 388.3 379.9 384.4 386.6 402.3 436.3 To the rest of the world (net)...... 27 36.3 35.9 44.0 32.6 31.9 35.0 26.8
Interest payments .............................. 28 312.6 308.2 329.4 302.3 342.6 258.5 247.1 To persons and business............... 29 147.5 141.2 158.3 130.3 176.4 99.9 100.0 To the rest of the world .................. 30 165.1 167.0 171.1 172.0 166.2 158.7 147.1
Subsidies........................................... Less: Wage accruals less
31 45.2 47.7 46.6 47.8 48.2 48.3 48.5
disbursements ............................... Net Federal Government
32 0.0 0.0 0.0 0.0 0.0 0.0 0.0
saving ................................... 33 –229.3 –525.0 –330.7 –649.6 –544.0 –575.6 –830.4 Social insurance funds ...................... 34 6.4 –37.9 –3.2 –19.8 –50.5 –78.1 –153.2 Other ................................................. Addenda:
35 –235.7 –487.1 –327.5 –629.8 –493.5 –497.5 –677.2
Total receipts ............................... 36 2,677.7 2,597.5 2,701.7 2,508.7 2,623.5 2,556.2 2,399.1 Current receipts......................... 37 2,651.2 2,569.3 2,672.5 2,478.8 2,595.7 2,530.3 2,374.7 Capital transfer receipts............. 38 26.5 28.2 29.2 29.8 27.8 25.9 24.4
Total expenditures ....................... 39 2,973.1 3,247.2 3,095.5 3,144.4 3,251.0 3,498.1 3,532.8 Current expenditures................. 40 2,880.5 3,094.3 3,003.2 3,128.4 3,139.8 3,105.9 3,205.2 Gross government investment... 41 123.2 140.0 128.5 138.0 143.9 149.5 142.0 Capital transfer payments.......... Net purchases of nonproduced
42 82.4 157.8 86.4 87.5 93.2 364.1 307.9
assets .................................... Less: Consumption of fixed
43 –1.3 –27.0 –7.7 –92.6 –6.6 –0.9 –0.6
capital .................................... 44 111.8 117.9 115.0 116.9 119.2 120.5 121.7 Net lending or net borrowing (–) 45 –295.4 –649.7 –393.8 –635.8 –627.4 –941.9 –1,133.6
Line 2007 2008
Seasonally adjusted at annual rates
2008 2009
I II III IV I
Current receipts ....................... 1 1,902.8 1,935.1 1,922.9 1,955.4 1,944.9 1,917.3 1,932.4 Current tax receipts ........................... 2 1,304.1 1,318.6 1,317.0 1,343.3 1,330.2 1,283.7 1,260.6
Personal current taxes ................... 3 325.4 333.4 333.7 346.4 329.0 324.3 297.8 Income taxes ............................. 4 298.3 305.9 306.7 319.0 301.3 296.7 270.1 Other.......................................... 5 27.1 27.4 27.0 27.4 27.6 27.6 27.7
Taxes on production and imports ... 6 917.8 937.6 929.9 942.4 949.4 928.7 925.1 Sales taxes ................................ 7 436.5 436.3 438.5 436.9 440.2 429.8 425.0 Property taxes ........................... 8 390.9 404.6 401.5 403.8 405.9 407.0 408.2 Other.......................................... 9 90.3 96.7 89.9 101.7 103.4 91.9 92.0
Taxes on corporate income............ Contributions for government social
10 60.9 47.6 53.3 54.5 51.9 30.7 37.7
insurance ....................................... 11 22.8 23.7 23.3 23.6 23.9 24.2 24.4 Income receipts on assets ................. 12 100.3 103.7 102.9 103.9 103.2 105.0 106.4
Interest receipts ............................. 13 84.6 87.7 87.0 88.2 87.3 88.2 88.9 Dividends....................................... 14 2.8 3.0 3.0 2.9 2.8 3.2 3.2 Rents and royalties ........................ 15 12.8 13.1 12.8 12.9 13.1 13.6 14.3
Current transfer receipts .................... 16 481.3 496.7 486.4 491.8 495.4 513.3 550.2 Federal grants-in-aid...................... 17 376.3 388.3 379.9 384.4 386.6 402.3 436.3 From business (net) ....................... 18 40.9 42.0 41.4 41.6 42.1 42.8 43.9 From persons.................................
Current surplus of government 19 64.1 66.5 65.2 65.8 66.8 68.2 70.0
enterprises..................................... 20 –5.7 –7.6 –6.6 –7.1 –7.9 –8.9 –9.2 Current expenditures .............. 21 1,892.4 2,015.2 1,975.3 2,022.3 2,048.5 2,014.8 2,006.6
Consumption expenditures ................ Government social benefit payments
22 1,355.9 1,454.4 1,426.3 1,462.7 1,485.7 1,443.0 1,427.8
to persons ...................................... 23 430.8 455.8 444.2 454.5 458.4 466.1 472.8 Interest payments .............................. 24 98.5 102.0 100.9 102.1 102.2 102.8 103.9 Subsidies ........................................... Less: Wage accruals less
25 7.1 3.0 4.0 3.0 2.2 2.8 2.0
disbursements ............................... Net state and local
26 0.0 0.0 0.0 0.0 0.0 0.0 0.0
government saving.............. 27 10.4 –80.1 –52.4 –66.9 –103.6 –97.4 –74.2 Social insurance funds....................... 28 5.5 5.6 5.4 5.5 5.6 5.7 5.7 Other.................................................. Addenda:
29 4.9 –85.6 –57.8 –72.4 –109.2 –103.1 –79.9
Total receipts................................ 30 1,961.5 1,995.9 1,979.8 2,013.5 2,008.7 1,981.4 1,988.5 Current receipts ......................... 31 1,902.8 1,935.1 1,922.9 1,955.4 1,944.9 1,917.3 1,932.4 Capital transfer receipts ............. 32 58.7 60.7 56.9 58.1 63.8 64.0 56.1
Total expenditures ....................... 33 2,065.5 2,190.9 2,146.2 2,199.3 2,229.0 2,189.2 2,169.9 Current expenditures ................. 34 1,892.4 2,015.2 1,975.3 2,022.3 2,048.5 2,014.8 2,006.6 Gross government investment ... 35 339.6 356.0 345.3 354.9 362.4 361.4 353.4 Capital transfer payments .......... Net purchases of nonproduced
36 ............ ............. ............. ............. ............ ............. .............
assets .................................... Less: Consumption of fixed
37 11.0 11.0 11.1 11.0 11.0 11.0 11.1
capital .................................... 38 177.6 191.3 185.5 188.8 192.9 197.9 201.1 Net lending or net borrowing (–) 39 –104.0 –195.1 –166.3 –185.8 –220.3 –207.9 –181.4

June 2009 SURVEY OF CURRENT BUSINESS D–23
Table 3.9.1. Percent Change From Preceding Period in Real Government Table 3.9.2. Contributions to Percent Change in Real Government Consumption Expenditures and Gross Investment Consumption Expenditures and Gross Investment
[Percent]
Line 2007 2008
Seasonally adjusted at annual rates
2008 2009
I II III IV I
Government consumption expenditures and gross investment.......................... 1 2.1 2.9 1.9 3.9 5.8 1.3 –3.5 Consumption expenditures 1 2 1.9 2.8 3.2 2.1 5.8 2.2 –1.2 Gross investment 2 .............. 3 3.0 3.3 –3.8 13.4 5.9 –3.0 –13.6
Structures........................ 4 3.8 1.0 –9.4 9.5 6.1 –7.7 –12.2 Equipment and software 5 1.7 7.8 7.3 20.7 5.7 6.0 –16.1
Federal ............................................ 6 1.6 6.0 5.8 6.6 13.8 7.0 –4.3 Consumption expenditures...... 7 1.7 5.2 6.0 3.6 13.5 5.7 –2.2 Gross investment..................... 8 1.2 11.8 4.9 29.4 15.7 15.4 –17.4
Structures............................ 9 7.4 18.3 –13.8 16.5 50.1 32.5 2.8 Equipment and software...... 10 0.2 10.7 8.9 31.8 10.2 12.3 –21.2
National defense........................ 11 2.5 7.2 7.3 7.3 18.0 3.4 –6.8 Consumption expenditures...... 12 2.6 6.3 7.4 3.4 17.3 3.7 –5.8 Gross investment..................... 13 1.6 13.6 6.0 38.7 22.7 1.5 –12.9
Structures............................ 14 12.8 28.1 –45.1 60.4 100.3 36.5 –1.9 Equipment and software...... 15 0.6 12.2 14.0 36.6 16.1 –2.2 –14.3
Nondefense ................................ 16 –0.2 3.6 2.9 5.0 5.1 15.3 1.0 Consumption expenditures...... 17 –0.2 2.9 2.9 4.0 5.6 10.4 6.1 Gross investment..................... 18 0.2 8.2 2.8 11.8 1.5 52.4 –26.2
Structures............................ 19 4.0 11.6 19.6 –6.9 19.4 29.3 6.9 Equipment and software...... 20 –1.0 7.0 –3.0 20.0 –4.7 62.7 –36.8
State and local ............................... 21 2.3 1.1 –0.3 2.5 1.3 –2.0 –2.9 Consumption expenditures.......... 22 2.0 1.3 1.4 1.2 1.1 0.0 –0.5 Gross investment......................... 23 3.7 0.3 –6.8 7.8 2.3 –9.6 –12.0
Structures ................................ 24 3.6 –0.1 –9.1 9.0 3.4 –10.3 –13.4 Equipment and software.......... 25 4.6 2.5 4.5 2.5 –2.6 –5.8 –4.8
Line 2007 2008
Seasonally adjusted at annual rates
2008 2009
I II III IV I
Percent change at annual rate: Government consumption
expenditures and gross investment .......................... 1 2.1 2.9 1.9 3.9 5.8 1.3 –3.5
Percentage points at annual rates:
Consumption expenditures 1 2 1.56 2.32 2.60 1.76 4.77 1.80 –0.98 Gross investment 2 .............. 3 0.52 0.57 –0.67 2.18 1.02 –0.53 –2.51
Structures ........................ 4 0.41 0.11 –1.10 1.01 0.66 –0.89 –1.43 Equipment and software 5 0.11 0.46 0.43 1.17 0.35 0.36 –1.08
Federal ............................................ 6 0.59 2.18 2.09 2.38 4.92 2.54 –1.66 Consumption expenditures ...... 7 0.54 1.65 1.87 1.15 4.19 1.82 –0.71 Gross investment ..................... 8 0.05 0.53 0.22 1.23 0.72 0.72 –0.95
Structures ............................ 9 0.05 0.12 –0.11 0.11 0.32 0.23 0.02 Equipment and software ...... 10 0.01 0.41 0.33 1.12 0.41 0.49 –0.98
National defense ........................ 11 0.61 1.76 1.76 1.81 4.33 0.86 –1.79 Consumption expenditures ...... 12 0.56 1.35 1.58 0.75 3.63 0.81 –1.33 Gross investment ..................... 13 0.05 0.41 0.18 1.06 0.70 0.05 –0.46
Structures ............................ 14 0.03 0.08 –0.19 0.14 0.24 0.12 –0.01 Equipment and software ...... 15 0.02 0.33 0.36 0.92 0.46 –0.07 –0.45
Nondefense ................................ 16 –0.02 0.42 0.33 0.57 0.59 1.68 0.12 Consumption expenditures ...... 17 –0.02 0.30 0.29 0.40 0.56 1.01 0.62 Gross investment ..................... 18 0.00 0.12 0.04 0.17 0.02 0.67 –0.49
Structures ............................ 19 0.02 0.05 0.08 –0.03 0.08 0.12 0.03 Equipment and software ...... 20 –0.01 0.08 –0.03 0.20 –0.05 0.55 –0.52
State and local ............................... 21 1.48 0.71 –0.16 1.56 0.87 –1.26 –1.82 Consumption expenditures .......... 22 1.02 0.67 0.73 0.61 0.58 –0.02 –0.26 Gross investment ......................... 23 0.46 0.04 –0.89 0.95 0.29 –1.25 –1.55
Structures ................................ 24 0.36 –0.01 –0.99 0.90 0.35 –1.12 –1.45 Equipment and software .......... 25 0.10 0.05 0.10 0.05 –0.05 –0.12 –0.10
1. Government consumption expenditures are services (such as education and national defense) produced by government that are valued at their cost of production. Excludes government sales to other sectors and government own-account investment (construction and software).
2. Gross government investment consists of general government and government enterprise expenditures for fixed assets; inventory investment is included in government consumption expenditures.
Table 3.9.3. Real Government Consumption Expenditures and Gross Investment, Quantity Indexes
[Index numbers, 2000=100]
1. Government consumption expenditures are services (such as education and national defense) produced by government that are valued at their cost of production. Excludes government sales to other sectors and government own-account investment (construction and software).
2. Gross government investment consists of general government and government enterprise expenditures for fixed assets; inventory investment is included in government consumption expenditures.
Table 3.9.4. Price Indexes for Government Consumption Expenditures and Gross Investment
[Index numbers, 2000=100]
Line 2007 2008
Seasonally adjusted
2008 2009
I II III IV I
Government consumption expenditures and gross investment.......................... 1 116.871 120.250 118.443 119.594 121.288 121.674 120.600 Consumption expenditures 1 2 116.177 119.430 117.969 118.584 120.256 120.912 120.547 Gross investment 2 .............. 3 120.192 124.213 120.662 124.513 126.317 125.360 120.848
Structures........................ 4 107.222 108.300 106.217 108.649 110.258 108.076 104.605 Equipment and software 5 146.140 157.475 150.355 157.610 159.804 162.131 155.175
Federal ............................................ 6 130.078 137.913 133.488 135.628 140.080 142.457 140.884 Consumption expenditures...... 7 127.744 134.385 130.915 132.071 136.324 138.231 137.472 Gross investment..................... 8 147.570 165.037 152.854 163.015 169.051 175.229 167.032
Structures............................ 9 97.565 115.423 104.397 108.456 120.041 128.800 129.700 Equipment and software...... 10 158.877 175.879 163.622 175.330 179.636 184.928 174.230
National defense........................ 11 135.596 145.318 140.125 142.621 148.643 149.882 147.283 Consumption expenditures...... 12 132.457 140.765 136.773 137.921 143.533 144.831 142.685 Gross investment..................... 13 159.765 181.536 166.030 180.174 189.622 190.318 183.862
Structures............................ 14 105.467 135.108 110.037 123.836 147.324 159.234 158.489 Equipment and software...... 15 166.336 186.599 172.794 186.813 193.933 192.858 185.574
Nondefense ................................ 16 120.127 124.469 121.469 122.949 124.473 128.984 129.314 Consumption expenditures...... 17 119.048 122.541 120.061 121.235 122.897 125.971 127.838 Gross investment..................... 18 128.357 138.925 132.081 135.821 136.325 151.474 140.415
Structures............................ 19 92.648 103.397 100.780 98.994 103.471 110.343 112.198 Equipment and software...... 20 144.470 154.606 145.551 152.354 150.519 170.002 151.596
State and local ............................... 21 110.167 111.394 110.844 111.517 111.891 111.326 110.496 Consumption expenditures.......... 22 109.828 111.271 110.874 111.201 111.509 111.500 111.349 Gross investment......................... 23 111.471 111.832 110.632 112.741 113.391 110.565 107.076
Structures ................................ 24 107.965 107.848 106.396 108.713 109.616 106.667 102.890 Equipment and software.......... 25 128.636 131.791 132.115 132.924 132.051 130.076 128.493
Line 2007 2008
Seasonally adjusted
2008 2009
I II III IV I
Government consumption expenditures and gross investment .......................... 1 132.941 139.234 137.237 139.588 141.107 139.002 138.887 Consumption expenditures 1 2 134.359 141.010 139.047 141.695 143.184 140.113 139.804 Gross investment 2 .............. 3 126.461 131.127 128.990 130.006 131.654 133.858 134.634
Structures ........................ 4 147.467 155.096 151.825 153.179 155.763 159.616 161.469 Equipment and software 5 97.122 98.131 97.371 97.956 98.469 98.729 98.279
Federal ............................................ 6 130.076 134.289 132.879 134.553 135.447 134.277 135.176 Consumption expenditures ...... 7 134.215 138.888 137.386 139.241 140.187 138.737 139.887 Gross investment ..................... 8 105.078 106.720 105.838 106.520 107.124 107.397 106.993
Structures ............................ 9 141.487 145.912 144.468 144.946 146.208 148.024 149.875 Equipment and software ...... 10 99.751 101.023 100.223 100.926 101.441 101.503 100.772
National defense ........................ 11 131.874 136.574 134.905 136.967 138.004 136.421 137.336 Consumption expenditures ...... 12 136.220 141.371 139.603 141.872 142.967 141.042 142.243 Gross investment ..................... 13 105.255 107.386 106.296 107.217 107.925 108.108 107.544
Structures ............................ 14 143.122 145.546 145.342 145.282 145.635 145.925 148.695 Equipment and software ...... 15 102.270 104.375 103.220 104.211 104.948 105.122 104.238
Nondefense ................................ 16 126.636 129.869 128.986 129.868 130.465 130.157 131.025 Consumption expenditures ...... 17 130.378 134.090 133.128 134.139 134.776 134.316 135.370 Gross investment ..................... 18 104.556 105.204 104.758 104.948 105.326 105.785 105.706
Structures ............................ 19 140.686 146.641 144.225 145.078 147.069 150.193 151.267 Equipment and software ...... 20 93.892 93.225 93.278 93.299 93.269 93.055 92.678
State and local ............................... 21 134.671 142.219 139.866 142.632 144.540 141.838 141.068 Consumption expenditures .......... 22 134.517 142.427 140.173 143.333 145.179 141.023 139.730 Gross investment ......................... 23 135.383 141.478 138.722 139.890 142.050 145.252 146.664
Structures ................................ 24 147.857 155.722 152.308 153.727 156.413 160.439 162.289 Equipment and software .......... 25 92.969 93.550 92.846 93.232 93.744 94.377 94.450
1. Government consumption expenditures are services (such as education and national defense) produced by government 1. Government consumption expenditures are services (such as education and national defense) produced by government that are valued at their cost of production. Excludes government sales to other sectors and government own-account invest- that are valued at their cost of production. Excludes government sales to other sectors and government own-account investment (construction and software). ment (construction and software).
2. Gross government investment consists of general government and government enterprise expenditures for fixed assets; 2. Gross government investment consists of general government and government enterprise expenditures for fixed assets; inventory investment is included in government consumption expenditures. inventory investment is included in government consumption expenditures.

D–24 National Data June 2009
Table 3.9.5. Government Consumption Expenditures and Table 3.9.6. Real Government Consumption Expenditures and Gross Investment Gross Investment, Chained Dollars
[Billions of dollars] [Billions of chained (2000) dollars]
Line 2007 2008
Seasonally adjusted at annual rates
2008 2009
I II III IV I
Government consumption expenditures and gross investment .......................... 1 2,674.8 2,882.4 2,798.1 2,873.7 2,946.1 2,911.4 2,883.3 Consumption expenditures 1 2 2,212.0 2,386.4 2,324.3 2,380.9 2,439.8 2,400.5 2,388.0 Gross investment 2............... 3 462.8 496.0 473.9 492.8 506.3 510.9 495.4
Structures......................... 4 299.4 318.0 305.2 315.0 325.1 326.5 319.7 Equipment and software... 5 163.5 178.0 168.6 177.8 181.3 184.4 175.7
Federal............................................. 6 979.3 1,071.9 1,026.5 1,056.1 1,098.0 1,107.0 1,102.1 Consumption expenditures....... 7 856.1 931.9 898.0 918.2 954.2 957.5 960.1 Gross investment...................... 8 123.2 140.0 128.5 138.0 143.9 149.5 142.0
Structures............................. 9 18.4 22.4 20.0 20.9 23.3 25.3 25.8 Equipment and software....... 10 104.9 117.6 108.5 117.1 120.6 124.2 116.2
National defense......................... 11 662.2 734.9 699.9 723.3 759.5 757.0 748.9 Consumption expenditures....... 12 580.1 639.7 613.8 629.0 659.6 656.6 652.4 Gross investment...................... 13 82.1 95.2 86.1 94.3 99.9 100.4 96.5
Structures............................. 14 7.5 9.8 7.9 8.9 10.7 11.5 11.7 Equipment and software....... 15 74.6 85.4 78.2 85.4 89.2 88.9 84.8
Nondefense ................................. 16 317.1 337.0 326.6 332.9 338.5 350.0 353.2 Consumption expenditures....... 17 276.0 292.2 284.2 289.2 294.5 300.9 307.7 Gross investment...................... 18 41.1 44.8 42.4 43.7 44.0 49.1 45.5
Structures............................. 19 10.9 12.6 12.1 12.0 12.7 13.8 14.1 Equipment and software....... 20 30.3 32.2 30.3 31.7 31.3 35.3 31.4
State and local ................................ 21 1,695.5 1,810.4 1,771.6 1,817.6 1,848.1 1,804.4 1,781.2 Consumption expenditures........... 22 1,355.9 1,454.4 1,426.3 1,462.7 1,485.7 1,443.0 1,427.8 Gross investment.......................... 23 339.6 356.0 345.3 354.9 362.4 361.4 353.4
Structures................................. 24 281.0 295.6 285.2 294.1 301.8 301.2 293.9 Equipment and software........... 25 58.6 60.4 60.1 60.7 60.7 60.2 59.5
Line 2007 2008
Seasonally adjusted at annual rates
2008 2009
I II III IV I
Government consumption expenditures and gross investment .......................... 1 2,012.1 2,070.2 2,039.1 2,058.9 2,088.1 2,094.7 2,076.3 Consumption expenditures 1 2 1,646.3 1,692.4 1,671.7 1,680.4 1,704.1 1,713.4 1,708.3 Gross investment 2 .............. 3 366.0 378.2 367.4 379.2 384.7 381.7 368.0
Structures ........................ 4 203.0 205.0 201.1 205.7 208.7 204.6 198.0 Equipment and software 5 168.3 181.4 173.2 181.5 184.1 186.8 178.7
Federal ............................................ 6 752.9 798.2 772.6 785.0 810.8 824.5 815.4 Consumption expenditures ...... 7 637.8 671.0 653.7 659.5 680.7 690.2 686.4 Gross investment ..................... 8 117.3 131.1 121.5 129.5 134.3 139.2 132.7
Structures ............................ 9 13.0 15.3 13.9 14.4 16.0 17.1 17.2 Equipment and software...... 10 105.1 116.4 108.3 116.0 118.9 122.4 115.3
National defense ........................ 11 502.1 538.1 518.9 528.1 550.4 555.0 545.4 Consumption expenditures ...... 12 425.8 452.5 439.7 443.4 461.5 465.6 458.7 Gross investment ..................... 13 78.0 88.6 81.0 87.9 92.6 92.9 89.7
Structures ............................ 14 5.2 6.7 5.5 6.2 7.3 7.9 7.9 Equipment and software...... 15 72.9 81.8 75.8 81.9 85.0 84.6 81.4
Nondefense ................................ 16 250.4 259.5 253.2 256.3 259.5 268.9 269.6 Consumption expenditures ...... 17 211.7 217.9 213.5 215.6 218.5 224.0 227.3 Gross investment ..................... 18 39.3 42.6 40.5 41.6 41.8 46.4 43.0
Structures ............................ 19 7.7 8.6 8.4 8.2 8.6 9.2 9.3 Equipment and software...... 20 32.3 34.5 32.5 34.0 33.6 38.0 33.8
State and local ............................... 21 1,259.0 1,273.0 1,266.7 1,274.4 1,278.7 1,272.3 1,262.8 Consumption expenditures .......... 22 1,008.0 1,021.2 1,017.6 1,020.6 1,023.4 1,023.3 1,021.9 Gross investment ......................... 23 250.9 251.7 249.0 253.7 255.2 248.8 241.0
Structures ................................ 24 190.1 189.8 187.3 191.4 193.0 187.8 181.1 Equipment and software .......... 25 63.1 64.6 64.8 65.2 64.7 63.8 63.0
Residual........................................... 26 –4.7 –7.4 –6.0 –7.6 –7.5 –9.5 –8.1 1. Government consumption expenditures are services (such as education and national defense) produced by government
that are valued at their cost of production. Excludes government sales to other sectors and government own-account investment (construction and software).
2. Gross government investment consists of general government and government enterprise expenditures for fixed assets; inventory investment is included in government consumption expenditures.
1. Government consumption expenditures are services (such as education and national defense) produced by government that are valued at their cost of production. Excludes government sales to other sectors and government own-account investment (construction and software).
2. Gross government investment consists of general government and government enterprise expenditures for fixed assets; inventory investment is included in government consumption expenditures.
NOTE. Chained (2000) dollar series are calculated as the product of the chain-type quantity index and the 2000 current-dollar value of the corresponding series, divided by 100. Because the formula for the chain-type quantity indexes uses weights of more than one period, the corresponding chained-dollar estimates are usually not additive. The residual line is the difference between the first line and the sum of the most detailed lines.

June 2009 SURVEY OF CURRENT BUSINESS D–25
Table 3.10.1. Percent Change From Preceding Period in Real Government Consumption Expenditures and General Government Gross Output
[Percent]
Line 2007 2008
Seasonally adjusted at annual rates
2008 2009
I II III IV I
Government consumption expenditures 1 ............................................................................ 1 1.9 2.8 3.2 2.1 5.8 2.2 –1.2 Gross output of general government ..................................................................................... 2 1.9 2.6 2.9 2.1 5.3 2.0 –0.8
Value added....................................................................................................................... 3 1.3 2.1 2.2 2.4 3.0 2.2 1.5 Compensation of general government employees ........................................................ 4 1.0 2.0 2.2 2.2 2.9 1.8 0.9 Consumption of general government fixed capital 2 ...................................................... 5 3.1 3.1 2.6 3.5 3.6 3.9 4.5
Intermediate goods and services purchased 3 .................................................................. 6 2.8 3.3 3.9 1.5 8.8 1.7 –4.3 Durable goods ............................................................................................................... 7 6.2 9.8 6.8 10.3 13.3 6.1 –15.4 Nondurable goods ......................................................................................................... 8 2.8 1.5 2.1 2.0 4.4 0.4 6.6 Services......................................................................................................................... 9 2.5 3.5 4.4 0.5 10.5 1.8 –6.8
Less: Own-account investment 4 ........................................................................................... 10 3.5 –1.0 –10.2 4.1 1.0 –3.8 –9.3 Sales to other sectors ................................................................................................ 11 1.8 1.6 2.1 1.6 2.8 0.9 2.7
Federal consumption expenditures 1................................................................................................. 12 1.7 5.2 6.0 3.6 13.5 5.7 –2.2 Gross output of general government ......................................................................................... 13 1.6 5.0 5.7 3.6 13.7 5.3 –1.9
Value added ........................................................................................................................... 14 0.7 3.7 3.7 4.3 6.9 6.8 4.9 Compensation of general government employees............................................................. 15 0.0 3.8 4.0 4.6 7.6 7.3 4.6 Consumption of general government fixed capital 2 .......................................................... 16 3.5 3.3 2.7 3.6 4.3 4.8 5.8
Intermediate goods and services purchased 3 ...................................................................... 17 2.7 6.6 8.1 2.7 22.4 3.6 –9.7 Durable goods.................................................................................................................... 18 7.8 15.0 10.8 15.7 20.8 9.3 –23.9 Nondurable goods.............................................................................................................. 19 0.9 1.3 9.3 6.4 23.1 –2.9 34.2 Services............................................................................................................................. 20 2.3 6.3 7.6 0.5 22.6 3.8 –12.3
Less: Own-account investment 4 ............................................................................................... 21 –4.1 –5.5 –10.4 –7.3 4.2 0.4 3.1 Sales to other sectors .................................................................................................... 22 –1.4 –9.3 –14.4 11.2 47.1 –32.8 41.8
Defense consumption expenditures 1 ....................................................................................... 23 2.6 6.3 7.4 3.4 17.3 3.7 –5.8 Gross output of general government ......................................................................................... 24 2.6 6.0 7.0 3.4 17.1 3.6 –5.8
Value added ........................................................................................................................... 25 0.5 3.7 3.1 4.0 8.6 6.5 4.6 Compensation of general government employees............................................................. 26 –0.4 3.9 3.3 4.2 10.1 7.1 4.2 Consumption of general government fixed capital 2 .......................................................... 27 3.1 3.2 2.6 3.5 4.1 4.7 5.7
Intermediate goods and services purchased 3 ...................................................................... 28 5.2 8.6 11.6 2.7 26.9 0.7 –16.4 Durable goods.................................................................................................................... 29 8.5 15.5 11.5 16.5 21.2 8.5 –25.8 Nondurable goods.............................................................................................................. 30 2.8 –2.4 12.3 10.1 26.3 –10.1 11.9 Services............................................................................................................................. 31 4.9 8.7 11.6 –0.4 28.1 0.7 –16.9
Less: Own-account investment 4 ............................................................................................... 32 –4.5 –8.4 –12.7 –10.1 –7.3 –6.7 9.5 Sales to other sectors .................................................................................................... 33 7.4 –27.8 –39.2 12.3 –4.1 3.1 –5.1
Nondefense consumption expenditures 1................................................................................. 34 –0.2 2.9 2.9 4.0 5.6 10.4 6.1 Gross output of general government ......................................................................................... 35 –0.4 3.0 2.9 4.0 6.7 9.0 6.9
Value added ........................................................................................................................... 36 1.3 3.8 4.9 4.9 3.7 7.2 5.5 Compensation of general government employees............................................................. 37 0.6 3.8 5.4 5.2 3.5 7.7 5.4 Consumption of general government fixed capital 2 .......................................................... 38 4.6 3.7 2.8 3.7 4.8 5.0 5.9
Intermediate goods and services purchased 3 ...................................................................... 39 –2.8 1.8 –0.2 2.5 11.4 11.7 9.0 Durable goods.................................................................................................................... 40 0.9 8.0 1.9 5.2 15.4 20.2 6.6 Nondurable goods.............................................................................................................. 41 .................. .................. ................. .................. ................. ................. ..................
Commodity Credit Corporation inventory change.......................................................... 42 .................. .................. ................. .................. ................. ................. .................. Other nondurable goods ................................................................................................ 43 –1.8 2.9 5.1 6.4 –12.0 6.2 55.0
Services............................................................................................................................. 44 –3.1 0.7 –1.4 2.7 9.8 12.2 0.0 Less: Own-account investment 4 ............................................................................................... 45 –3.8 –3.2 –8.6 –5.1 13.7 5.8 –1.2
Sales to other sectors .................................................................................................... 46 –8.9 9.4 10.5 10.5 94.3 –49.2 84.9 State and local consumption expenditures 1 .................................................................................... 47 2.0 1.3 1.4 1.2 1.1 0.0 –0.5
Gross output of general government ......................................................................................... 48 2.0 1.4 1.5 1.3 1.3 0.3 –0.2 Value added ........................................................................................................................... 49 1.6 1.4 1.6 1.6 1.4 0.2 0.0
Compensation of general government employees............................................................. 50 1.4 1.2 1.4 1.3 1.1 –0.3 –0.6 Consumption of general government fixed capital 2 .......................................................... 51 2.7 2.9 2.5 3.5 3.1 3.3 3.5
Intermediate goods and services purchased 3 ...................................................................... 52 2.8 1.4 1.4 0.8 1.1 0.5 –0.5 Durable goods.................................................................................................................... 53 3.6 1.9 0.6 2.1 1.6 0.6 1.1 Nondurable goods.............................................................................................................. 54 3.2 1.5 0.9 1.2 1.2 1.1 1.7 Services............................................................................................................................. 55 2.6 1.2 1.7 0.4 1.0 0.0 –1.7
Less: Own-account investment 4 ............................................................................................... 56 5.4 0.0 –10.1 6.5 0.4 –4.6 –11.7 Sales to other sectors .................................................................................................... 57 1.9 1.9 2.5 1.4 2.0 1.8 2.0
Tuition and related educational charges .................................................................... 58 1.1 1.5 2.0 2.0 2.0 2.0 2.0 Health and hospital charges ...................................................................................... 59 1.5 2.0 2.0 2.0 2.0 2.0 2.0 Other sales ................................................................................................................ 60 3.0 2.0 3.6 0.2 1.9 1.4 2.0
1. Government consumption expenditures are services (such as education and national defense) produced by government that are valued at their cost of production. Excludes government sales to other sectors and government own-account investment (construction and software).
2. Consumption of fixed capital, or depreciation, is included in government gross output as a partial measure of the services of general government fixed assets; the use of depreciation assumes a zero net return on these assets.
3. Includes general government intermediate inputs for goods and services sold to other sectors and for own-account investment. 4. Own-account investment is measured in current dollars by compensation of general government employees and related expenditures for goods and services and is classified as investment in structures and in soft
ware in table 3.9.5.
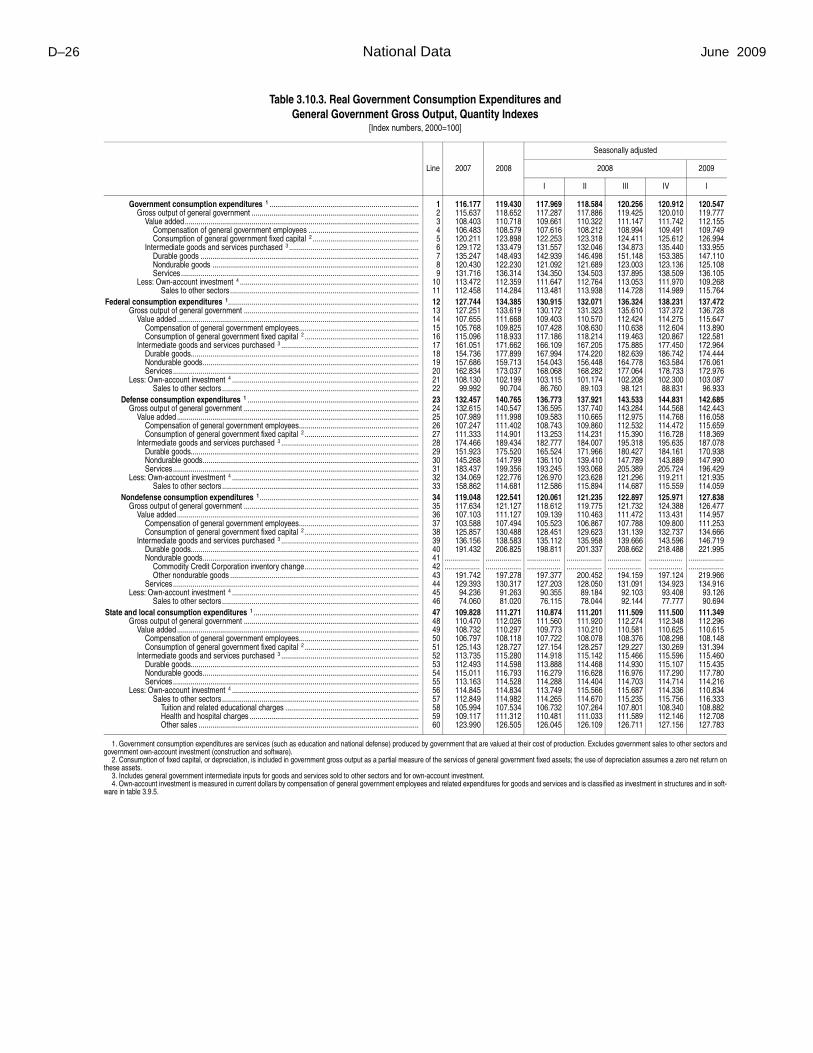
D–26 National Data June 2009
Table 3.10.3. Real Government Consumption Expenditures and General Government Gross Output, Quantity Indexes
[Index numbers, 2000=100]
Line 2007 2008
Seasonally adjusted
2008 2009
I II III IV I
Government consumption expenditures 1 ............................................................................ 1 116.177 119.430 117.969 118.584 120.256 120.912 120.547 Gross output of general government ..................................................................................... 2 115.637 118.652 117.287 117.886 119.425 120.010 119.777
Value added....................................................................................................................... 3 108.403 110.718 109.661 110.322 111.147 111.742 112.155 Compensation of general government employees ........................................................ 4 106.483 108.579 107.616 108.212 108.994 109.491 109.749 Consumption of general government fixed capital 2 ...................................................... 5 120.211 123.898 122.253 123.318 124.411 125.612 126.994
Intermediate goods and services purchased 3 .................................................................. 6 129.172 133.479 131.557 132.046 134.873 135.440 133.955 Durable goods ............................................................................................................... 7 135.247 148.493 142.939 146.498 151.148 153.385 147.110 Nondurable goods ......................................................................................................... 8 120.430 122.230 121.092 121.689 123.003 123.136 125.108 Services......................................................................................................................... 9 131.716 136.314 134.350 134.503 137.895 138.509 136.105
Less: Own-account investment 4 ........................................................................................... 10 113.472 112.359 111.647 112.764 113.053 111.970 109.268 Sales to other sectors ................................................................................................ 11 112.458 114.284 113.481 113.938 114.728 114.989 115.764
Federal consumption expenditures 1................................................................................................. 12 127.744 134.385 130.915 132.071 136.324 138.231 137.472 Gross output of general government ......................................................................................... 13 127.251 133.619 130.172 131.323 135.610 137.372 136.728
Value added ........................................................................................................................... 14 107.655 111.668 109.403 110.570 112.424 114.275 115.647 Compensation of general government employees............................................................. 15 105.768 109.825 107.428 108.630 110.638 112.604 113.890 Consumption of general government fixed capital 2 .......................................................... 16 115.096 118.933 117.186 118.214 119.463 120.867 122.581
Intermediate goods and services purchased 3 ...................................................................... 17 161.051 171.662 166.109 167.205 175.885 177.450 172.964 Durable goods.................................................................................................................... 18 154.736 177.899 167.994 174.220 182.639 186.742 174.444 Nondurable goods.............................................................................................................. 19 157.686 159.713 154.043 156.448 164.778 163.584 176.061 Services............................................................................................................................. 20 162.834 173.037 168.068 168.282 177.064 178.733 172.976
Less: Own-account investment 4 ............................................................................................... 21 108.130 102.199 103.115 101.174 102.208 102.300 103.087 Sales to other sectors .................................................................................................... 22 99.992 90.704 86.760 89.103 98.121 88.831 96.933
Defense consumption expenditures 1 ....................................................................................... 23 132.457 140.765 136.773 137.921 143.533 144.831 142.685 Gross output of general government ......................................................................................... 24 132.615 140.547 136.595 137.740 143.284 144.568 142.443
Value added ........................................................................................................................... 25 107.989 111.998 109.583 110.665 112.975 114.768 116.058 Compensation of general government employees............................................................. 26 107.247 111.402 108.743 109.860 112.532 114.472 115.659 Consumption of general government fixed capital 2 .......................................................... 27 111.333 114.901 113.253 114.231 115.390 116.728 118.369
Intermediate goods and services purchased 3 ...................................................................... 28 174.466 189.434 182.777 184.007 195.318 195.635 187.078 Durable goods.................................................................................................................... 29 151.923 175.520 165.524 171.966 180.427 184.161 170.938 Nondurable goods.............................................................................................................. 30 145.268 141.799 136.110 139.410 147.789 143.889 147.990 Services............................................................................................................................. 31 183.437 199.356 193.245 193.068 205.389 205.724 196.429
Less: Own-account investment 4 ............................................................................................... 32 134.069 122.776 126.970 123.628 121.296 119.211 121.935 Sales to other sectors .................................................................................................... 33 158.862 114.681 112.586 115.894 114.687 115.559 114.059
Nondefense consumption expenditures 1................................................................................. 34 119.048 122.541 120.061 121.235 122.897 125.971 127.838 Gross output of general government ......................................................................................... 35 117.634 121.127 118.612 119.775 121.732 124.388 126.477
Value added ........................................................................................................................... 36 107.103 111.127 109.139 110.463 111.472 113.431 114.957 Compensation of general government employees............................................................. 37 103.588 107.494 105.523 106.867 107.788 109.800 111.253 Consumption of general government fixed capital 2 .......................................................... 38 125.857 130.488 128.451 129.623 131.139 132.737 134.666
Intermediate goods and services purchased 3 ...................................................................... 39 136.156 138.583 135.112 135.958 139.666 143.596 146.719 Durable goods.................................................................................................................... 40 191.432 206.825 198.811 201.337 208.662 218.488 221.995 Nondurable goods.............................................................................................................. 41 .................. .................. ................. .................. ................. ................. ..................
Commodity Credit Corporation inventory change.......................................................... 42 .................. .................. ................. .................. ................. ................. .................. Other nondurable goods ................................................................................................ 43 191.742 197.278 197.377 200.452 194.159 197.124 219.966
Services............................................................................................................................. 44 129.393 130.317 127.203 128.050 131.091 134.923 134.916 Less: Own-account investment 4 ............................................................................................... 45 94.236 91.263 90.355 89.184 92.103 93.408 93.126
Sales to other sectors .................................................................................................... 46 74.060 81.020 76.115 78.044 92.144 77.777 90.694 State and local consumption expenditures 1 .................................................................................... 47 109.828 111.271 110.874 111.201 111.509 111.500 111.349
Gross output of general government ......................................................................................... 48 110.470 112.026 111.560 111.920 112.274 112.348 112.296 Value added ........................................................................................................................... 49 108.732 110.297 109.773 110.210 110.581 110.625 110.615
Compensation of general government employees............................................................. 50 106.797 108.118 107.722 108.078 108.376 108.298 108.148 Consumption of general government fixed capital 2 .......................................................... 51 125.143 128.727 127.154 128.257 129.227 130.269 131.394
Intermediate goods and services purchased 3 ...................................................................... 52 113.735 115.280 114.918 115.142 115.466 115.596 115.460 Durable goods.................................................................................................................... 53 112.493 114.598 113.888 114.468 114.930 115.107 115.435 Nondurable goods.............................................................................................................. 54 115.011 116.793 116.279 116.628 116.976 117.290 117.780 Services............................................................................................................................. 55 113.163 114.528 114.288 114.404 114.703 114.714 114.216
Less: Own-account investment 4 ............................................................................................... 56 114.845 114.834 113.749 115.566 115.687 114.336 110.834 Sales to other sectors .................................................................................................... 57 112.849 114.982 114.265 114.670 115.235 115.756 116.333
Tuition and related educational charges .................................................................... 58 105.994 107.534 106.732 107.264 107.801 108.340 108.882 Health and hospital charges ...................................................................................... 59 109.117 111.312 110.481 111.033 111.589 112.146 112.708 Other sales ................................................................................................................ 60 123.990 126.505 126.045 126.109 126.711 127.156 127.783
1. Government consumption expenditures are services (such as education and national defense) produced by government that are valued at their cost of production. Excludes government sales to other sectors and government own-account investment (construction and software).
2. Consumption of fixed capital, or depreciation, is included in government gross output as a partial measure of the services of general government fixed assets; the use of depreciation assumes a zero net return on these assets.
3. Includes general government intermediate inputs for goods and services sold to other sectors and for own-account investment. 4. Own-account investment is measured in current dollars by compensation of general government employees and related expenditures for goods and services and is classified as investment in structures and in soft
ware in table 3.9.5.

June 2009 SURVEY OF CURRENT BUSINESS D–27
Table 3.10.4. Price Indexes for Government Consumption Expenditures and General Government Gross Output
[Index numbers, 2000=100]
Line 2007 2008
Seasonally adjusted
2008 2009
I II III IV I
Government consumption expenditures 1 ............................................................................ 1 134.359 141.010 139.047 141.695 143.184 140.113 139.804 Gross output of general government ..................................................................................... 2 134.197 140.670 138.733 141.173 142.656 140.117 139.935
Value added....................................................................................................................... 3 136.547 141.248 139.658 140.764 141.853 142.718 144.861 Compensation of general government employees ........................................................ 4 139.519 144.248 142.722 143.833 144.830 145.606 148.134 Consumption of general government fixed capital 2 ...................................................... 5 120.682 125.193 123.312 124.385 125.901 127.174 127.473
Intermediate goods and services purchased 3 .................................................................. 6 130.138 139.273 136.809 141.248 143.315 135.719 132.053 Durable goods ............................................................................................................... 7 107.355 108.943 107.837 108.460 109.362 110.112 110.387 Nondurable goods ......................................................................................................... 8 148.731 172.298 169.221 182.830 185.953 151.189 136.113 Services......................................................................................................................... 9 126.514 131.753 129.367 131.262 133.120 133.262 132.863
Less: Own-account investment 4 ........................................................................................... 10 129.105 134.218 132.347 133.874 135.514 135.136 135.275 Sales to other sectors ................................................................................................ 11 133.553 138.985 137.206 138.369 139.797 140.569 141.196
Federal consumption expenditures 1................................................................................................. 12 134.215 138.888 137.386 139.241 140.187 138.737 139.887 Gross output of general government ......................................................................................... 13 134.117 138.775 137.278 139.123 140.064 138.634 139.783
Value added ........................................................................................................................... 14 142.629 146.493 145.621 146.562 146.879 146.908 151.427 Compensation of general government employees............................................................. 15 153.196 157.573 156.846 157.787 157.783 157.878 164.258 Consumption of general government fixed capital 2 .......................................................... 16 112.290 114.739 113.502 114.427 115.586 115.440 114.929
Intermediate goods and services purchased 3 ...................................................................... 17 123.265 128.731 126.576 129.368 130.958 128.024 125.561 Durable goods.................................................................................................................... 18 104.642 105.087 104.337 104.850 105.348 105.814 105.822 Nondurable goods.............................................................................................................. 19 139.217 160.007 154.817 170.131 171.892 143.190 125.661 Services............................................................................................................................. 20 123.877 128.294 126.276 127.973 129.715 129.213 128.225
Less: Own-account investment 4 ............................................................................................... 21 135.161 138.854 137.738 138.791 139.444 139.440 141.376 Sales to other sectors .................................................................................................... 22 123.360 126.848 125.743 126.775 127.437 127.436 128.063
Defense consumption expenditures 1 ....................................................................................... 23 136.220 141.371 139.603 141.872 142.967 141.042 142.243 Gross output of general government ......................................................................................... 24 136.200 141.350 139.582 141.847 142.939 141.031 142.231
Value added ........................................................................................................................... 25 146.218 150.632 149.545 150.754 151.126 151.104 155.968 Compensation of general government employees............................................................. 26 159.639 164.637 163.763 164.975 164.854 164.957 172.250 Consumption of general government fixed capital 2 .......................................................... 27 114.249 117.307 115.762 116.945 118.414 118.109 117.431
Intermediate goods and services purchased 3 ...................................................................... 28 124.212 129.996 127.603 130.834 132.582 128.965 126.632 Durable goods.................................................................................................................... 29 106.301 107.026 106.142 106.740 107.299 107.922 107.981 Nondurable goods.............................................................................................................. 30 156.573 190.503 180.365 209.218 212.474 159.952 132.150 Services............................................................................................................................. 31 124.706 129.116 127.053 128.757 130.624 130.032 129.302
Less: Own-account investment 4 ............................................................................................... 32 137.008 141.141 139.726 141.220 141.900 141.719 142.602 Sales to other sectors .................................................................................................... 33 132.067 137.594 135.565 137.537 138.448 138.824 140.110
Nondefense consumption expenditures 1................................................................................. 34 130.378 134.090 133.128 134.139 134.776 134.316 135.370 Gross output of general government ......................................................................................... 35 130.200 133.884 132.929 133.929 134.564 134.113 135.167
Value added ........................................................................................................................... 36 136.397 139.309 138.809 139.289 139.510 139.629 143.550 Compensation of general government employees............................................................. 37 143.439 146.875 146.369 146.901 147.074 147.157 152.147 Consumption of general government fixed capital 2 .......................................................... 38 107.265 108.194 107.725 108.007 108.400 108.645 108.549
Intermediate goods and services purchased 3 ...................................................................... 39 121.314 126.036 124.457 126.169 127.367 126.149 123.389 Durable goods.................................................................................................................... 40 87.379 84.881 85.568 85.170 85.007 83.779 83.273 Nondurable goods.............................................................................................................. 41 .................. .................. ................. .................. ................. ................. ..................
Commodity Credit Corporation inventory change.......................................................... 42 .................. .................. ................. .................. ................. ................. .................. Other nondurable goods ................................................................................................ 43 121.338 129.535 128.643 130.852 131.553 127.090 118.841
Services............................................................................................................................. 44 122.569 127.039 125.119 126.810 128.255 127.973 126.368 Less: Own-account investment 4 ............................................................................................... 45 133.568 136.916 136.032 136.750 137.382 137.502 140.170
Sales to other sectors .................................................................................................... 46 117.891 120.043 119.503 119.951 120.466 120.253 120.502 State and local consumption expenditures 1 .................................................................................... 47 134.517 142.427 140.173 143.333 145.179 141.023 139.730
Gross output of general government ......................................................................................... 48 134.287 141.688 139.527 142.275 144.043 140.908 140.009 Value added ........................................................................................................................... 49 134.010 139.063 137.167 138.343 139.758 140.982 142.093
Compensation of general government employees............................................................. 50 134.707 139.559 137.751 138.921 140.271 141.294 142.417 Consumption of general government fixed capital 2 .......................................................... 51 128.103 134.443 131.989 133.193 135.026 137.563 138.587
Intermediate goods and services purchased 3 ...................................................................... 52 134.810 146.456 143.815 149.406 151.812 140.791 136.251 Durable goods.................................................................................................................... 53 111.263 114.834 113.079 113.893 115.538 116.824 117.596 Nondurable goods.............................................................................................................. 54 150.480 174.556 171.909 185.162 188.561 152.591 138.107 Services............................................................................................................................. 55 128.737 134.702 131.986 134.054 136.015 136.754 136.895
Less: Own-account investment 4 ............................................................................................... 56 127.627 133.014 131.002 132.618 134.443 133.994 133.775 Sales to other sectors .................................................................................................... 57 133.804 139.285 137.490 138.655 140.102 140.893 141.520
Tuition and related educational charges .................................................................... 58 162.313 172.450 168.651 171.447 173.773 175.930 178.493 Health and hospital charges ...................................................................................... 59 130.111 133.927 132.719 133.537 134.417 135.034 135.742 Other sales ................................................................................................................ 60 122.004 127.127 125.647 126.388 128.096 128.378 127.857
1. Government consumption expenditures are services (such as education and national defense) produced by government that are valued at their cost of production. Excludes government sales to other sectors and government own-account investment (construction and software).
2. Consumption of fixed capital, or depreciation, is included in government gross output as a partial measure of the services of general government fixed assets; the use of depreciation assumes a zero net return on these assets.
3. Includes general government intermediate inputs for goods and services sold to other sectors and for own-account investment. 4. Own-account investment is measured in current dollars by compensation of general government employees and related expenditures for goods and services and is classified as investment in structures and in soft
ware in table 3.9.5.
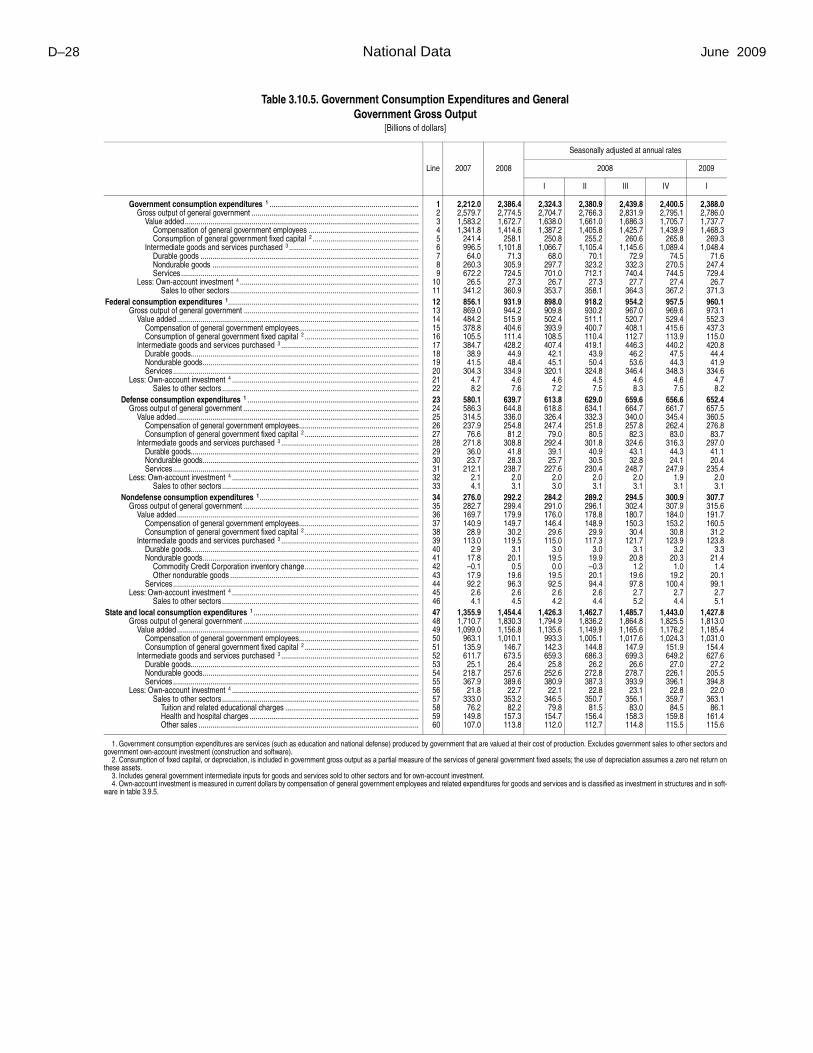
D–28 National Data June 2009
Table 3.10.5. Government Consumption Expenditures and General Government Gross Output
[Billions of dollars]
Line 2007 2008
Seasonally adjusted at annual rates
2008 2009
I II III IV I
Government consumption expenditures 1 ............................................................................ 1 2,212.0 2,386.4 2,324.3 2,380.9 2,439.8 2,400.5 2,388.0 Gross output of general government ..................................................................................... 2 2,579.7 2,774.5 2,704.7 2,766.3 2,831.9 2,795.1 2,786.0
Value added....................................................................................................................... 3 1,583.2 1,672.7 1,638.0 1,661.0 1,686.3 1,705.7 1,737.7 Compensation of general government employees ........................................................ 4 1,341.8 1,414.6 1,387.2 1,405.8 1,425.7 1,439.9 1,468.3 Consumption of general government fixed capital 2 ...................................................... 5 241.4 258.1 250.8 255.2 260.6 265.8 269.3
Intermediate goods and services purchased 3 .................................................................. 6 996.5 1,101.8 1,066.7 1,105.4 1,145.6 1,089.4 1,048.4 Durable goods ............................................................................................................... 7 64.0 71.3 68.0 70.1 72.9 74.5 71.6 Nondurable goods ......................................................................................................... 8 260.3 305.9 297.7 323.2 332.3 270.5 247.4 Services......................................................................................................................... 9 672.2 724.5 701.0 712.1 740.4 744.5 729.4
Less: Own-account investment 4 ........................................................................................... 10 26.5 27.3 26.7 27.3 27.7 27.4 26.7 Sales to other sectors ................................................................................................ 11 341.2 360.9 353.7 358.1 364.3 367.2 371.3
Federal consumption expenditures 1................................................................................................. 12 856.1 931.9 898.0 918.2 954.2 957.5 960.1 Gross output of general government ......................................................................................... 13 869.0 944.2 909.8 930.2 967.0 969.6 973.1
Value added ........................................................................................................................... 14 484.2 515.9 502.4 511.1 520.7 529.4 552.3 Compensation of general government employees............................................................. 15 378.8 404.6 393.9 400.7 408.1 415.6 437.3 Consumption of general government fixed capital 2 .......................................................... 16 105.5 111.4 108.5 110.4 112.7 113.9 115.0
Intermediate goods and services purchased 3 ...................................................................... 17 384.7 428.2 407.4 419.1 446.3 440.2 420.8 Durable goods.................................................................................................................... 18 38.9 44.9 42.1 43.9 46.2 47.5 44.4 Nondurable goods.............................................................................................................. 19 41.5 48.4 45.1 50.4 53.6 44.3 41.9 Services............................................................................................................................. 20 304.3 334.9 320.1 324.8 346.4 348.3 334.6
Less: Own-account investment 4 ............................................................................................... 21 4.7 4.6 4.6 4.5 4.6 4.6 4.7 Sales to other sectors .................................................................................................... 22 8.2 7.6 7.2 7.5 8.3 7.5 8.2
Defense consumption expenditures 1 ....................................................................................... 23 580.1 639.7 613.8 629.0 659.6 656.6 652.4 Gross output of general government ......................................................................................... 24 586.3 644.8 618.8 634.1 664.7 661.7 657.5
Value added ........................................................................................................................... 25 314.5 336.0 326.4 332.3 340.0 345.4 360.5 Compensation of general government employees............................................................. 26 237.9 254.8 247.4 251.8 257.8 262.4 276.8 Consumption of general government fixed capital 2 .......................................................... 27 76.6 81.2 79.0 80.5 82.3 83.0 83.7
Intermediate goods and services purchased 3 ...................................................................... 28 271.8 308.8 292.4 301.8 324.6 316.3 297.0 Durable goods.................................................................................................................... 29 36.0 41.8 39.1 40.9 43.1 44.3 41.1 Nondurable goods.............................................................................................................. 30 23.7 28.3 25.7 30.5 32.8 24.1 20.4 Services............................................................................................................................. 31 212.1 238.7 227.6 230.4 248.7 247.9 235.4
Less: Own-account investment 4 ............................................................................................... 32 2.1 2.0 2.0 2.0 2.0 1.9 2.0 Sales to other sectors .................................................................................................... 33 4.1 3.1 3.0 3.1 3.1 3.1 3.1
Nondefense consumption expenditures 1................................................................................. 34 276.0 292.2 284.2 289.2 294.5 300.9 307.7 Gross output of general government ......................................................................................... 35 282.7 299.4 291.0 296.1 302.4 307.9 315.6
Value added ........................................................................................................................... 36 169.7 179.9 176.0 178.8 180.7 184.0 191.7 Compensation of general government employees............................................................. 37 140.9 149.7 146.4 148.9 150.3 153.2 160.5 Consumption of general government fixed capital 2 .......................................................... 38 28.9 30.2 29.6 29.9 30.4 30.8 31.2
Intermediate goods and services purchased 3 ...................................................................... 39 113.0 119.5 115.0 117.3 121.7 123.9 123.8 Durable goods.................................................................................................................... 40 2.9 3.1 3.0 3.0 3.1 3.2 3.3 Nondurable goods.............................................................................................................. 41 17.8 20.1 19.5 19.9 20.8 20.3 21.4
Commodity Credit Corporation inventory change.......................................................... 42 –0.1 0.5 0.0 –0.3 1.2 1.0 1.4 Other nondurable goods ................................................................................................ 43 17.9 19.6 19.5 20.1 19.6 19.2 20.1
Services............................................................................................................................. 44 92.2 96.3 92.5 94.4 97.8 100.4 99.1 Less: Own-account investment 4 ............................................................................................... 45 2.6 2.6 2.6 2.6 2.7 2.7 2.7
Sales to other sectors .................................................................................................... 46 4.1 4.5 4.2 4.4 5.2 4.4 5.1 State and local consumption expenditures 1 .................................................................................... 47 1,355.9 1,454.4 1,426.3 1,462.7 1,485.7 1,443.0 1,427.8
Gross output of general government ......................................................................................... 48 1,710.7 1,830.3 1,794.9 1,836.2 1,864.8 1,825.5 1,813.0 Value added ........................................................................................................................... 49 1,099.0 1,156.8 1,135.6 1,149.9 1,165.6 1,176.2 1,185.4
Compensation of general government employees............................................................. 50 963.1 1,010.1 993.3 1,005.1 1,017.6 1,024.3 1,031.0 Consumption of general government fixed capital 2 .......................................................... 51 135.9 146.7 142.3 144.8 147.9 151.9 154.4
Intermediate goods and services purchased 3 ...................................................................... 52 611.7 673.5 659.3 686.3 699.3 649.2 627.6 Durable goods.................................................................................................................... 53 25.1 26.4 25.8 26.2 26.6 27.0 27.2 Nondurable goods.............................................................................................................. 54 218.7 257.6 252.6 272.8 278.7 226.1 205.5 Services............................................................................................................................. 55 367.9 389.6 380.9 387.3 393.9 396.1 394.8
Less: Own-account investment 4 ............................................................................................... 56 21.8 22.7 22.1 22.8 23.1 22.8 22.0 Sales to other sectors .................................................................................................... 57 333.0 353.2 346.5 350.7 356.1 359.7 363.1
Tuition and related educational charges .................................................................... 58 76.2 82.2 79.8 81.5 83.0 84.5 86.1 Health and hospital charges ...................................................................................... 59 149.8 157.3 154.7 156.4 158.3 159.8 161.4 Other sales ................................................................................................................ 60 107.0 113.8 112.0 112.7 114.8 115.5 115.6
1. Government consumption expenditures are services (such as education and national defense) produced by government that are valued at their cost of production. Excludes government sales to other sectors and government own-account investment (construction and software).
2. Consumption of fixed capital, or depreciation, is included in government gross output as a partial measure of the services of general government fixed assets; the use of depreciation assumes a zero net return on these assets.
3. Includes general government intermediate inputs for goods and services sold to other sectors and for own-account investment. 4. Own-account investment is measured in current dollars by compensation of general government employees and related expenditures for goods and services and is classified as investment in structures and in soft
ware in table 3.9.5.

June 2009 SURVEY OF CURRENT BUSINESS D–29
Table 3.10.6. Real Government Consumption Expenditures and General Government Gross Output, Chained Dollars
[Billions of chained (2000) dollars]
Line 2007 2008
Seasonally adjusted at annual rates
2008 2009
I II III IV I
Government consumption expenditures 1 ............................................................................ 1 1,646.3 1,692.4 1,671.7 1,680.4 1,704.1 1,713.4 1,708.3 Gross output of general government ..................................................................................... 2 1,922.3 1,972.4 1,949.7 1,959.7 1,985.3 1,995.0 1,991.1
Value added....................................................................................................................... 3 1,159.5 1,184.2 1,172.9 1,180.0 1,188.8 1,195.2 1,199.6 Compensation of general government employees ........................................................ 4 961.8 980.7 972.0 977.4 984.4 988.9 991.3 Consumption of general government fixed capital 2 ...................................................... 5 200.0 206.2 203.4 205.2 207.0 209.0 211.3
Intermediate goods and services purchased 3 .................................................................. 6 765.7 791.2 779.8 782.7 799.5 802.9 794.1 Durable goods ............................................................................................................... 7 59.6 65.5 63.0 64.6 66.6 67.6 64.9 Nondurable goods ......................................................................................................... 8 175.0 177.6 176.0 176.8 178.7 178.9 181.8 Services......................................................................................................................... 9 531.3 549.9 542.0 542.6 556.3 558.7 549.0
Less: Own-account investment 4 ........................................................................................... 10 20.5 20.3 20.2 20.4 20.5 20.3 19.8 Sales to other sectors ................................................................................................ 11 255.5 259.6 257.8 258.8 260.6 261.2 263.0
Federal consumption expenditures 1................................................................................................. 12 637.8 671.0 653.7 659.5 680.7 690.2 686.4 Gross output of general government ......................................................................................... 13 647.9 680.3 662.8 668.7 690.5 699.5 696.2
Value added ........................................................................................................................... 14 339.5 352.2 345.0 348.7 354.5 360.4 364.7 Compensation of general government employees............................................................. 15 247.2 256.7 251.1 253.9 258.6 263.2 266.2 Consumption of general government fixed capital 2 .......................................................... 16 93.9 97.1 95.6 96.5 97.5 98.6 100.0
Intermediate goods and services purchased 3 ...................................................................... 17 312.1 332.7 321.9 324.1 340.9 343.9 335.2 Durable goods.................................................................................................................... 18 37.2 42.7 40.4 41.9 43.9 44.9 41.9 Nondurable goods.............................................................................................................. 19 29.8 30.2 29.1 29.6 31.2 30.9 33.3 Services............................................................................................................................. 20 245.7 261.1 253.6 253.9 267.1 269.6 261.0
Less: Own-account investment 4 ............................................................................................... 21 3.5 3.3 3.3 3.3 3.3 3.3 3.3 Sales to other sectors .................................................................................................... 22 6.6 6.0 5.7 5.9 6.5 5.9 6.4
Defense consumption expenditures 1 ....................................................................................... 23 425.8 452.5 439.7 443.4 461.5 465.6 458.7 Gross output of general government ......................................................................................... 24 430.4 456.2 443.4 447.1 465.1 469.2 462.3
Value added ........................................................................................................................... 25 215.1 223.1 218.3 220.4 225.0 228.6 231.2 Compensation of general government employees............................................................. 26 149.0 154.8 151.1 152.6 156.4 159.1 160.7 Consumption of general government fixed capital 2 .......................................................... 27 67.1 69.2 68.2 68.8 69.5 70.3 71.3
Intermediate goods and services purchased 3 ...................................................................... 28 218.8 237.6 229.2 230.8 244.9 245.3 234.6 Durable goods.................................................................................................................... 29 33.8 39.1 36.9 38.3 40.2 41.0 38.1 Nondurable goods.............................................................................................................. 30 15.1 14.8 14.2 14.5 15.4 15.0 15.4 Services............................................................................................................................. 31 170.1 184.8 179.2 179.0 190.4 190.7 182.1
Less: Own-account investment 4 ............................................................................................... 32 1.5 1.4 1.4 1.4 1.4 1.4 1.4 Sales to other sectors .................................................................................................... 33 3.1 2.2 2.2 2.3 2.2 2.3 2.2
Nondefense consumption expenditures 1................................................................................. 34 211.7 217.9 213.5 215.6 218.5 224.0 227.3 Gross output of general government ......................................................................................... 35 217.1 223.6 219.0 221.1 224.7 229.6 233.5
Value added ........................................................................................................................... 36 124.4 129.1 126.8 128.3 129.5 131.8 133.6 Compensation of general government employees............................................................. 37 98.2 101.9 100.1 101.3 102.2 104.1 105.5 Consumption of general government fixed capital 2 .......................................................... 38 26.9 27.9 27.5 27.7 28.0 28.4 28.8
Intermediate goods and services purchased 3 ...................................................................... 39 93.1 94.8 92.4 93.0 95.5 98.2 100.4 Durable goods.................................................................................................................... 40 3.4 3.6 3.5 3.6 3.7 3.9 3.9 Nondurable goods.............................................................................................................. 41 14.7 15.6 15.1 15.2 15.7 16.4 18.1
Commodity Credit Corporation inventory change.......................................................... 42 –0.1 0.5 0.0 –0.2 0.8 1.2 1.2 Other nondurable goods ................................................................................................ 43 14.7 15.2 15.2 15.4 14.9 15.1 16.9
Services............................................................................................................................. 44 75.2 75.8 74.0 74.5 76.2 78.5 78.5 Less: Own-account investment 4 ............................................................................................... 45 2.0 1.9 1.9 1.9 1.9 2.0 2.0
Sales to other sectors .................................................................................................... 46 3.5 3.8 3.6 3.6 4.3 3.6 4.2 State and local consumption expenditures 1 .................................................................................... 47 1,008.0 1,021.2 1,017.6 1,020.6 1,023.4 1,023.3 1,021.9
Gross output of general government ......................................................................................... 48 1,273.9 1,291.9 1,286.5 1,290.7 1,294.7 1,295.6 1,295.0 Value added ........................................................................................................................... 49 820.1 831.9 827.9 831.2 834.0 834.4 834.3
Compensation of general government employees............................................................. 50 714.9 723.8 721.1 723.5 725.5 725.0 724.0 Consumption of general government fixed capital 2 .......................................................... 51 106.1 109.1 107.8 108.7 109.6 110.4 111.4
Intermediate goods and services purchased 3 ...................................................................... 52 453.8 459.9 458.5 459.4 460.7 461.2 460.7 Durable goods.................................................................................................................... 53 22.6 23.0 22.8 23.0 23.1 23.1 23.2 Nondurable goods.............................................................................................................. 54 145.4 147.6 147.0 147.4 147.8 148.2 148.9 Services............................................................................................................................. 55 285.8 289.2 288.6 288.9 289.7 289.7 288.4
Less: Own-account investment 4 ............................................................................................... 56 17.1 17.1 16.9 17.2 17.2 17.0 16.5 Sales to other sectors .................................................................................................... 57 248.9 253.6 252.0 252.9 254.2 255.3 256.6
Tuition and related educational charges .................................................................... 58 47.0 47.7 47.3 47.5 47.8 48.0 48.3 Health and hospital charges ...................................................................................... 59 115.1 117.5 116.6 117.2 117.7 118.3 118.9 Other sales ................................................................................................................ 60 87.7 89.5 89.2 89.2 89.6 89.9 90.4
Residual ................................................................................................................................................. 61 –4.9 –6.8 –6.4 –6.3 –7.2 –7.8 –6.1
1. Government consumption expenditures are services (such as education and national defense) produced by government that are valued at their cost of production. Excludes government sales to other sectors and government own-account investment (construction and software).
2. Consumption of fixed capital, or depreciation, is included in government gross output as a partial measure of the services of general government fixed assets; the use of depreciation assumes a zero net return on these assets.
3. Includes general government intermediate inputs for goods and services sold to other sectors and for own-account investment. 4. Own-account investment is measured in current dollars by compensation of general government employees and related expenditures for goods and services and is classified as investment in structures and in
software in table 3.9.5. NOTE. Chained (2000) dollar series are calculated as the product of the chain-type quantity index and the 2000 current-dollar value of the corresponding series, divided by 100. Because the formula for the chain-type
quantity indexes uses weights of more than one period, the corresponding chained-dollar estimates are usually not additive. The residual line is the difference between the first line and the sum of the most detailed lines.

D–30 National Data June 2009
Table 3.11.1. Percent Change From Preceding Period in Real National Defense Consumption Expenditures and Gross Investment by Type
[Percent]
Line 2007 2008
Seasonally adjusted at annual rates
2008 2009
I II III IV I
National defense consumption expenditures and gross investment ..................................... 1 2.5 7.2 7.3 7.3 18.0 3.4 –6.8 Consumption expenditures 1 .............................................................................................................. 2 2.6 6.3 7.4 3.4 17.3 3.7 –5.8
Gross output of general government.................................................................................................. 3 2.6 6.0 7.0 3.4 17.1 3.6 –5.8 Value added ................................................................................................................................... 4 0.5 3.7 3.1 4.0 8.6 6.5 4.6
Compensation of general government employees..................................................................... 5 –0.4 3.9 3.3 4.2 10.1 7.1 4.2 Military ................................................................................................................................... 6 –0.8 4.5 5.7 3.0 11.9 9.9 5.8 Civilian ................................................................................................................................... 7 0.6 2.6 –1.9 6.7 6.2 1.0 0.7
Consumption of general government fixed capital 2 .................................................................. 8 3.1 3.2 2.6 3.5 4.1 4.7 5.7 Intermediate goods and services purchased 3 .............................................................................. 9 5.2 8.6 11.6 2.7 26.9 0.7 –16.4
Durable goods............................................................................................................................ 10 8.5 15.5 11.5 16.5 21.2 8.5 –25.8 Aircraft ................................................................................................................................... 11 4.4 13.9 –30.3 44.9 26.1 21.1 –6.8 Missiles .................................................................................................................................. 12 7.4 3.7 –13.4 2.6 –1.8 4.0 –39.6 Ships...................................................................................................................................... 13 2.1 5.9 12.6 –1.7 59.1 –8.8 –4.3 Vehicles.................................................................................................................................. 14 34.4 27.9 3.6 79.6 –20.5 122.6 –68.3 Electronics ............................................................................................................................. 15 22.0 37.6 103.6 44.1 43.2 –2.0 –41.4 Other durable goods .............................................................................................................. 16 –0.9 1.3 35.1 –35.9 14.4 –17.1 2.4
Nondurable goods...................................................................................................................... 17 2.8 –2.4 12.3 10.1 26.3 –10.1 11.9 Petroleum products................................................................................................................ 18 2.3 –7.4 –8.7 28.8 33.9 –27.8 38.9 Ammunition ............................................................................................................................ 19 –3.7 2.8 68.4 –41.3 45.4 15.2 –51.6 Other nondurable goods ........................................................................................................ 20 7.6 3.5 29.6 12.8 1.3 16.9 33.4
Services ..................................................................................................................................... 21 4.9 8.7 11.6 –0.4 28.1 0.7 –16.9 Research and development ................................................................................................... 22 –3.0 4.2 –5.8 20.2 –3.1 61.3 –47.6 Installation support ................................................................................................................ 23 –0.2 8.1 28.4 –7.9 35.3 –17.3 –6.1 Weapons support................................................................................................................... 24 11.8 13.6 25.4 –12.2 92.0 –37.1 –34.2 Personnel support.................................................................................................................. 25 6.5 14.3 21.5 1.5 40.8 –15.3 8.2 Transportation of material ...................................................................................................... 26 50.5 3.5 –18.0 –27.5 7.1 46.0 46.3 Travel of persons.................................................................................................................... 27 9.6 –11.2 –6.4 –18.6 –19.2 35.3 17.5
Less: Own-account investment 4 ....................................................................................................... 28 –4.5 –8.4 –12.7 –10.1 –7.3 –6.7 9.5 Sales to other sectors ............................................................................................................ 29 7.4 –27.8 –39.2 12.3 –4.1 3.1 –5.1
Gross investment 5 .............................................................................................................................. 30 1.6 13.6 6.0 38.7 22.7 1.5 –12.9 Structures........................................................................................................................................... 31 12.8 28.1 –45.1 60.4 100.3 36.5 –1.9 Equipment and software .................................................................................................................... 32 0.6 12.2 14.0 36.6 16.1 –2.2 –14.3
Aircraft............................................................................................................................................ 33 –5.8 5.1 –36.7 326.6 –4.8 2.4 –5.7 Missiles .......................................................................................................................................... 34 –6.7 –1.8 –3.7 127.9 27.1 –48.1 48.1 Ships .............................................................................................................................................. 35 –6.2 –0.6 –45.0 32.1 11.3 19.4 –22.1 Vehicles.......................................................................................................................................... 36 20.5 44.2 276.2 –6.3 70.5 7.3 –46.3 Electronics and software................................................................................................................ 37 17.4 24.6 35.9 28.3 22.0 –1.0 –24.1 Other equipment ............................................................................................................................ 38 –5.0 7.1 27.7 –12.2 10.0 –7.4 0.4
1. National defense consumption expenditures are defense services produced by government that are valued at their cost of production. Excludes government sales to other sectors and government own-account investment (construction and software).
2. Consumption of fixed capital, or depreciation, is included in government gross output as a partial measure of the services of general government fixed assets; the use of depreciation assumes a zero net return on these assets.
3. Includes general government intermediate inputs for goods and services sold to other sectors and for own-account investment. 4. Own-account investment is measured in current dollars by compensation of general government employees and related expenditures for goods and services and is classified as investment in structures and in
software. 5. Gross government investment consists of general government and government enterprise expenditures for fixed assets; inventory investment is included in government consumption expenditures.

June 2009 SURVEY OF CURRENT BUSINESS D–31
Table 3.11.3. Real National Defense Consumption Expenditures Table 3.11.4. Price Indexes for National Defense Consumption and Gross Investment by Type, Quantity Indexes Expenditures and Gross Investment by Type
[Index numbers, 2000=100] [Index numbers, 2000=100]
Line 2007 2008
Seasonally adjusted
2008 2009
I II III IV I
National defense consumption expenditures and gross investment.......................... 1 135.596 145.318 140.125 142.621 148.643 149.882 147.283
Consumption expenditures 1 ....... Gross output of general
2 132.457 140.765 136.773 137.921 143.533 144.831 142.685
government ............................. 3 132.615 140.547 136.595 137.740 143.284 144.568 142.443 Value added ............................
Compensation of general 4 107.989 111.998 109.583 110.665 112.975 114.768 116.058
government employees ... 5 107.247 111.402 108.743 109.860 112.532 114.472 115.659 Military............................. 6 108.650 113.490 110.596 111.422 114.603 117.337 118.992 Civilian.............................
Consumption of general 7 105.015 107.752 105.574 107.311 108.925 109.198 109.397
government fixed capital 2
Intermediate goods and 8 111.333 114.901 113.253 114.231 115.390 116.728 118.369
services purchased 3 .......... 9 174.466 189.434 182.777 184.007 195.318 195.635 187.078 Durable goods ..................... 10 151.923 175.520 165.524 171.966 180.427 184.161 170.938
Aircraft ............................. 11 108.826 123.925 110.668 121.411 128.654 134.966 132.605 Missiles ........................... 12 162.779 168.775 167.922 169.023 168.256 169.899 149.773 Ships ............................... 13 104.894 111.128 105.680 105.217 118.160 115.455 114.192 Vehicles ........................... 14 268.205 343.081 299.234 346.415 327.119 399.557 299.721 Electronics....................... 15 283.075 389.640 347.384 380.609 416.337 414.230 362.406 Other durable goods........ 16 153.997 156.036 168.557 150.796 155.970 148.822 149.690
Nondurable goods ............... 17 145.268 141.799 136.110 139.410 147.789 143.889 147.990 Petroleum products ......... 18 134.493 124.529 116.718 124.341 133.764 123.292 133.856 Ammunition ..................... 19 182.816 187.874 196.088 171.644 188.481 195.284 162.886 Other nondurable goods 20 142.512 147.557 142.592 146.941 147.411 153.282 164.746
Services .............................. Research and
21 183.437 199.356 193.245 193.068 205.389 205.724 196.429
development................ 22 180.920 188.494 177.127 185.459 184.017 207.375 176.416 Installation support .......... 23 116.496 125.923 124.562 122.029 131.612 125.491 123.544 Weapons support ............ 24 247.616 281.336 273.010 264.249 311.062 277.024 249.507 Personnel support ........... 25 238.770 272.821 263.232 264.183 287.765 276.104 281.577 Transportation of material 26 209.966 217.218 223.197 205.930 209.472 230.274 253.246 Travel of persons ............. 27 131.967 117.221 122.697 116.545 110.479 119.163 124.069
Less: Own-account investment 4 28 134.069 122.776 126.970 123.628 121.296 119.211 121.935 Sales to other sectors ..... 29 158.862 114.681 112.586 115.894 114.687 115.559 114.059
Gross investment 5........................ 30 159.765 181.536 166.030 180.174 189.622 190.318 183.862 Structures .................................... 31 105.467 135.108 110.037 123.836 147.324 159.234 158.489 Equipment and software.............. 32 166.336 186.599 172.794 186.813 193.933 192.858 185.574
Aircraft ..................................... 33 196.590 206.673 156.436 224.825 222.049 223.383 220.114 Missiles.................................... 34 150.912 148.181 127.727 156.938 166.632 141.426 156.003 Ships ....................................... 35 118.700 118.020 109.180 117.039 120.202 125.660 118.049 Vehicles ................................... 36 338.161 487.795 458.841 451.455 515.870 525.015 449.383 Electronics and software ......... 37 187.839 234.107 217.863 231.853 243.649 243.060 226.850 Other equipment...................... 38 148.332 158.913 161.658 156.481 160.272 157.242 157.384
Line 2007 2008
Seasonally adjusted
2008 2009
I II III IV I
National defense consumption expenditures and gross investment .......................... 1 131.874 136.574 134.905 136.967 138.004 136.421 137.336
Consumption expenditures 1........ Gross output of general
2 136.220 141.371 139.603 141.872 142.967 141.042 142.243
government.............................. 3 136.200 141.350 139.582 141.847 142.939 141.031 142.231 Value added.............................
Compensation of general 4 146.218 150.632 149.545 150.754 151.126 151.104 155.968
government employees ... 5 159.639 164.637 163.763 164.975 164.854 164.957 172.250 Military ............................. 6 167.465 173.295 172.162 173.811 173.550 173.657 182.103 Civilian .............................
Consumption of general 7 144.559 147.985 147.599 147.987 148.130 148.225 153.279
government fixed capital 2
Intermediate goods and 8 114.249 117.307 115.762 116.945 118.414 118.109 117.431
services purchased 3........... 9 124.212 129.996 127.603 130.834 132.582 128.965 126.632 Durable goods ..................... 10 106.301 107.026 106.142 106.740 107.299 107.922 107.981
Aircraft ............................. 11 106.086 105.315 104.673 104.989 105.494 106.104 106.705 Missiles............................ 12 111.246 112.726 111.892 112.514 112.833 113.662 113.472 Ships................................ 13 108.860 111.221 109.075 110.131 112.701 112.977 112.632 Vehicles ........................... 14 120.803 122.299 121.599 121.873 121.331 124.394 124.157 Electronics ....................... 15 95.252 95.109 94.889 95.022 95.285 95.241 94.884 Other durable goods ........ 16 108.127 111.185 109.213 110.818 111.991 112.720 112.766
Nondurable goods ............... 17 156.573 190.503 180.365 209.218 212.474 159.952 132.150 Petroleum products.......... 18 224.381 311.574 286.283 366.222 372.172 221.618 141.483 Ammunition...................... 19 122.886 130.701 126.868 130.288 133.627 132.022 128.493 Other nondurable goods 20 114.008 117.428 115.813 117.461 118.456 117.983 118.881
Services............................... Research and
21 124.706 129.116 127.053 128.757 130.624 130.032 129.302
development ................ 22 123.754 128.299 126.567 127.725 129.372 129.532 130.019 Installation support .......... 23 128.472 133.333 131.279 133.163 134.396 134.492 132.270 Weapons support ............ 24 118.471 121.264 120.145 120.858 121.971 122.082 123.163 Personnel support ........... 25 124.281 126.899 125.671 126.466 127.543 127.915 128.389 Transportation of material 26 128.907 140.955 132.695 140.968 149.714 140.442 129.028 Travel of persons.............. 27 131.264 145.724 137.492 146.285 155.475 143.645 138.308
Less: Own-account investment 4 28 137.008 141.141 139.726 141.220 141.900 141.719 142.602 Sales to other sectors...... 29 132.067 137.594 135.565 137.537 138.448 138.824 140.110
Gross investment 5 ........................ 30 105.255 107.386 106.296 107.217 107.925 108.108 107.544 Structures .................................... 31 143.122 145.546 145.342 145.282 145.635 145.925 148.695 Equipment and software .............. 32 102.270 104.375 103.220 104.211 104.948 105.122 104.238
Aircraft ..................................... 33 83.714 86.581 86.308 86.313 86.371 87.331 87.481 Missiles.................................... 34 105.554 107.216 106.547 106.596 106.992 108.728 108.568 Ships........................................ 35 134.873 145.159 138.880 145.704 150.818 145.235 137.970 Vehicles ................................... 36 101.514 103.495 103.023 102.781 101.886 106.288 106.063 Electronics and software.......... 37 87.256 85.321 85.567 85.434 85.420 84.862 84.146 Other equipment ...................... 38 109.422 111.987 110.308 111.671 112.822 113.149 113.234
1. National defense consumption expenditures are defense services produced by government that are valued at their cost of production. Excludes government sales to other sectors and government own-account investment (construction and software).
2. Consumption of fixed capital, or depreciation, is included in government gross output as a partial measure of the services of general government fixed assets; the use of depreciation assumes a zero net return on these assets.
3. Includes general government intermediate inputs for goods and services sold to other sectors and for own-account investment.
4. Own-account investment is measured in current dollars by compensation of general government employees and related expenditures for goods and services and is classified as investment in structures and in software.
5. Gross government investment consists of general government and government enterprise expenditures for fixed assets; inventory investment is included in government consumption expenditures.

D–32 National Data June 2009
Table 3.11.5. National Defense Consumption Expenditures Table 3.11.6. Real National Defense Consumption Expenditures and Gross Investment by Type and Gross Investment by Type, Chained Dollars
[Billions of dollars] [Billions of chained (2000) dollars]
Line 2007 2008
Seasonally adjusted at annual rates
2008 2009
I II III IV I
National defense consumption expenditures and gross investment ........ 1 662.2 734.9 699.9 723.3 759.5 757.0 748.9
Consumption expenditures 1 ........ Gross output of general
2 580.1 639.7 613.8 629.0 659.6 656.6 652.4
government .............................. 3 586.3 644.8 618.8 634.1 664.7 661.7 657.5 Value added .............................
Compensation of general 4 314.5 336.0 326.4 332.3 340.0 345.4 360.5
government employees .... 5 237.9 254.8 247.4 251.8 257.8 262.4 276.8 Military.............................. 6 162.7 175.9 170.3 173.2 177.9 182.2 193.8 Civilian..............................
Consumption of general 7 75.2 79.0 77.2 78.6 79.9 80.2 83.0
government fixed capital 2
Intermediate goods and 8 76.6 81.2 79.0 80.5 82.3 83.0 83.7
services purchased 3 ........... 9 271.8 308.8 292.4 301.8 324.6 316.3 297.0 Durable goods ...................... 10 36.0 41.8 39.1 40.9 43.1 44.3 41.1
Aircraft .............................. 11 11.3 12.8 11.4 12.5 13.4 14.1 13.9 Missiles ............................ 12 4.4 4.7 4.6 4.7 4.7 4.7 4.2 Ships ................................ 13 1.5 1.6 1.5 1.5 1.8 1.7 1.7 Vehicles ............................ 14 2.5 3.3 2.8 3.3 3.1 3.9 2.9 Electronics........................ 15 7.9 10.8 9.6 10.6 11.6 11.5 10.0 Other durable goods......... 16 8.3 8.6 9.2 8.3 8.7 8.3 8.4
Nondurable goods ................ 17 23.7 28.3 25.7 30.5 32.8 24.1 20.4 Petroleum products .......... 18 12.2 15.9 13.6 18.6 20.3 11.1 7.7 Ammunition ...................... 19 4.1 4.5 4.5 4.1 4.6 4.7 3.8 Other nondurable goods... 20 7.4 7.9 7.5 7.9 8.0 8.2 8.9
Services ............................... Research and
21 212.1 238.7 227.6 230.4 248.7 247.9 235.4
development................. 22 58.8 63.6 58.9 62.2 62.6 70.6 60.3 Installation support ........... 23 37.3 41.8 40.7 40.5 44.1 42.1 40.7 Weapons support ............. 24 28.1 32.7 31.4 30.6 36.3 32.4 29.4 Personnel support ............ 25 68.1 79.4 75.9 76.6 84.2 81.0 82.9 Transportation of material 26 11.6 13.1 12.7 12.5 13.5 13.9 14.0 Travel of persons .............. 27 8.1 8.0 7.9 8.0 8.1 8.0 8.0
Less: Own-account investment 4 28 2.1 2.0 2.0 2.0 2.0 1.9 2.0 Sales to other sectors ...... 29 4.1 3.1 3.0 3.1 3.1 3.1 3.1
Gross investment 5......................... 30 82.1 95.2 86.1 94.3 99.9 100.4 96.5 Structures ..................................... 31 7.5 9.8 7.9 8.9 10.7 11.5 11.7 Equipment and software............... 32 74.6 85.4 78.2 85.4 89.2 88.9 84.8
Aircraft ...................................... 33 12.8 13.9 10.5 15.1 14.9 15.1 15.0 Missiles..................................... 34 4.3 4.3 3.7 4.5 4.8 4.1 4.6 Ships ........................................ 35 10.5 11.3 10.0 11.2 11.9 12.0 10.7 Vehicles .................................... 36 6.3 9.3 8.7 8.5 9.7 10.3 8.8 Electronics and software .......... 37 16.6 20.2 18.9 20.0 21.1 20.9 19.3 Other equipment....................... 38 24.1 26.5 26.5 26.0 26.9 26.5 26.5
Line 2007 2008
Seasonally adjusted at annual rates
2008 2009
I II III IV I
National defense consumption expenditures and gross investment .......................... 1 502.1 538.1 518.9 528.1 550.4 555.0 545.4
Consumption expenditures 1........ Gross output of general
2 425.8 452.5 439.7 443.4 461.5 465.6 458.7
government.............................. 3 430.4 456.2 443.4 447.1 465.1 469.2 462.3 Value added.............................
Compensation of general 4 215.1 223.1 218.3 220.4 225.0 228.6 231.2
government employees ... 5 149.0 154.8 151.1 152.6 156.4 159.1 160.7 Military ............................. 6 97.2 101.5 98.9 99.6 102.5 104.9 106.4 Civilian .............................
Consumption of general 7 52.0 53.4 52.3 53.1 53.9 54.1 54.2
government fixed capital 2
Intermediate goods and 8 67.1 69.2 68.2 68.8 69.5 70.3 71.3
services purchased 3........... 9 218.8 237.6 229.2 230.8 244.9 245.3 234.6 Durable goods ..................... 10 33.8 39.1 36.9 38.3 40.2 41.0 38.1
Aircraft ............................. 11 10.7 12.2 10.9 11.9 12.6 13.3 13.0 Missiles............................ 12 4.0 4.1 4.1 4.1 4.1 4.2 3.7 Ships................................ 13 1.4 1.5 1.4 1.4 1.6 1.5 1.5 Vehicles ........................... 14 2.1 2.7 2.3 2.7 2.5 3.1 2.3 Electronics ....................... 15 8.3 11.4 10.1 11.1 12.2 12.1 10.6 Other durable goods ........ 16 7.7 7.8 8.4 7.5 7.8 7.4 7.4
Nondurable goods ............... 17 15.1 14.8 14.2 14.5 15.4 15.0 15.4 Petroleum products.......... 18 5.5 5.0 4.7 5.0 5.4 5.0 5.4 Ammunition...................... 19 3.3 3.4 3.6 3.1 3.4 3.5 3.0 Other nondurable goods 20 6.5 6.7 6.5 6.7 6.7 7.0 7.5
Services............................... Research and
21 170.1 184.8 179.2 179.0 190.4 190.7 182.1
development ................ 22 47.5 49.5 46.5 48.7 48.3 54.5 46.3 Installation support .......... 23 29.0 31.4 31.0 30.4 32.8 31.3 30.8 Weapons support ............ 24 23.7 27.0 26.2 25.3 29.8 26.6 23.9 Personnel support ........... 25 54.8 62.6 60.4 60.6 66.0 63.4 64.6 Transportation of material 26 9.0 9.3 9.6 8.9 9.0 9.9 10.9 Travel of persons.............. 27 6.2 5.5 5.8 5.5 5.2 5.6 5.8
Less: Own-account investment 4 28 1.5 1.4 1.4 1.4 1.4 1.4 1.4 Sales to other sectors...... 29 3.1 2.2 2.2 2.3 2.2 2.3 2.2
Gross investment 5 ........................ 30 78.0 88.6 81.0 87.9 92.6 92.9 89.7 Structures .................................... 31 5.2 6.7 5.5 6.2 7.3 7.9 7.9 Equipment and software .............. 32 72.9 81.8 75.8 81.9 85.0 84.6 81.4
Aircraft ..................................... 33 15.2 16.0 12.1 17.4 17.2 17.3 17.1 Missiles.................................... 34 4.1 4.0 3.4 4.2 4.5 3.8 4.2 Ships........................................ 35 7.8 7.8 7.2 7.7 7.9 8.3 7.8 Vehicles ................................... 36 6.2 8.9 8.4 8.3 9.4 9.6 8.2 Electronics and software.......... 37 19.0 23.7 22.0 23.4 24.6 24.6 22.9 Other equipment ...................... 38 22.1 23.6 24.0 23.3 23.8 23.4 23.4
Residual........................................... 39 –8.9 –13.2 –11.0 –13.1 –14.0 –13.9 –11.1 1. National defense consumption expenditures are defense services produced by government that are valued at their cost of production. Excludes government sales to other sectors and government own-account investment (construction and software).
2. Consumption of fixed capital, or depreciation, is included in government gross output as a partial measure of the services of general government fixed assets; the use of depreciation assumes a zero net return on these assets.
3. Includes general government intermediate inputs for goods and services sold to other sectors and for own-account investment.
4. Own-account investment is measured in current dollars by compensation of general government employees and related expenditures for goods and services and is classified as investment in structures and in software.
5. Gross government investment consists of general government and government enterprise expenditures for fixed assets; inventory investment is included in government consumption expenditures.
1. National defense consumption expenditures are defense services produced by government that are valued at their cost of production. Excludes government sales to other sectors and government own-account investment (construction and software).
2. Consumption of fixed capital, or depreciation, is included in government gross output as a partial measure of the services of general government fixed assets; the use of depreciation assumes a zero net return on these assets.
3. Includes general government intermediate inputs for goods and services sold to other sectors and for own-account investment.
4. Own-account investment is measured in current dollars by compensation of general government employees and related expenditures for goods and services and is classified as investment in structures and in software.
5. Gross government investment consists of general government and government enterprise expenditures for fixed assets; inventory investment is included in government consumption expenditures.
NOTE. Chained (2000) dollar series are calculated as the product of the chain-type quantity index and the 2000 current-dollar value of the corresponding series, divided by 100. Because the formula for the chain-type quantity indexes uses weights of more than one period, the corresponding chained-dollar estimates are usually not additive. The residual line is the difference between the first line and the sum of the most detailed lines.
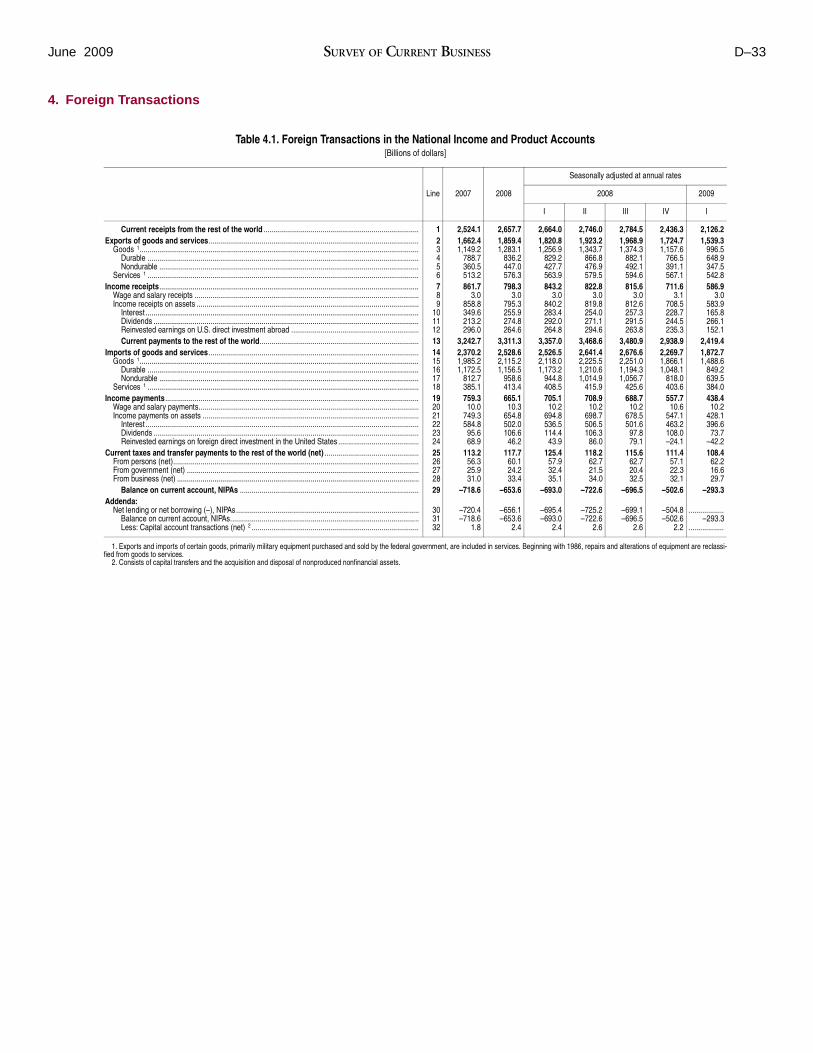
June 2009 SURVEY OF CURRENT BUSINESS D–33
4. Foreign Transactions
Table 4.1. Foreign Transactions in the National Income and Product Accounts [Billions of dollars]
Line 2007 2008
Seasonally adjusted at annual rates
2008 2009
I II III IV I
Current receipts from the rest of the world ............................................................................... 1 2,524.1 2,657.7 2,664.0 2,746.0 2,784.5 2,436.3 2,126.2 Exports of goods and services........................................................................................................... 2 1,662.4 1,859.4 1,820.8 1,923.2 1,968.9 1,724.7 1,539.3
Goods 1.............................................................................................................................................. 3 1,149.2 1,283.1 1,256.9 1,343.7 1,374.3 1,157.6 996.5 Durable .......................................................................................................................................... 4 788.7 836.2 829.2 866.8 882.1 766.5 648.9 Nondurable .................................................................................................................................... 5 360.5 447.0 427.7 476.9 492.1 391.1 347.5
Services 1 .......................................................................................................................................... 6 513.2 576.3 563.9 579.5 594.6 567.1 542.8 Income receipts.................................................................................................................................... 7 861.7 798.3 843.2 822.8 815.6 711.6 586.9
Wage and salary receipts .................................................................................................................. 8 3.0 3.0 3.0 3.0 3.0 3.1 3.0 Income receipts on assets ................................................................................................................. 9 858.8 795.3 840.2 819.8 812.6 708.5 583.9
Interest ........................................................................................................................................... 10 349.6 255.9 283.4 254.0 257.3 228.7 165.8 Dividends ....................................................................................................................................... 11 213.2 274.8 292.0 271.1 291.5 244.5 266.1 Reinvested earnings on U.S. direct investment abroad ................................................................. 12 296.0 264.6 264.8 294.6 263.8 235.3 152.1 Current payments to the rest of the world................................................................................. 13 3,242.7 3,311.3 3,357.0 3,468.6 3,480.9 2,938.9 2,419.4
Imports of goods and services ........................................................................................................... 14 2,370.2 2,528.6 2,526.5 2,641.4 2,676.6 2,269.7 1,872.7 Goods 1.............................................................................................................................................. 15 1,985.2 2,115.2 2,118.0 2,225.5 2,251.0 1,866.1 1,488.6
Durable .......................................................................................................................................... 16 1,172.5 1,156.5 1,173.2 1,210.6 1,194.3 1,048.1 849.2 Nondurable .................................................................................................................................... 17 812.7 958.6 944.8 1,014.9 1,056.7 818.0 639.5
Services 1 .......................................................................................................................................... 18 385.1 413.4 408.5 415.9 425.6 403.6 384.0 Income payments................................................................................................................................. 19 759.3 665.1 705.1 708.9 688.7 557.7 438.4
Wage and salary payments................................................................................................................ 20 10.0 10.3 10.2 10.2 10.2 10.6 10.2 Income payments on assets .............................................................................................................. 21 749.3 654.8 694.8 698.7 678.5 547.1 428.1
Interest ........................................................................................................................................... 22 584.8 502.0 536.5 506.5 501.6 463.2 396.6 Dividends ....................................................................................................................................... 23 95.6 106.6 114.4 106.3 97.8 108.0 73.7 Reinvested earnings on foreign direct investment in the United States ......................................... 24 68.9 46.2 43.9 86.0 79.1 –24.1 –42.2
Current taxes and transfer payments to the rest of the world (net) ................................................ 25 113.2 117.7 125.4 118.2 115.6 111.4 108.4 From persons (net)............................................................................................................................. 26 56.3 60.1 57.9 62.7 62.7 57.1 62.2 From government (net) ...................................................................................................................... 27 25.9 24.2 32.4 21.5 20.4 22.3 16.6 From business (net) ........................................................................................................................... 28 31.0 33.4 35.1 34.0 32.5 32.1 29.7
Balance on current account, NIPAs ........................................................................................... 29 –718.6 –653.6 –693.0 –722.6 –696.5 –502.6 –293.3 Addenda:
Net lending or net borrowing (–), NIPAs............................................................................................. 30 –720.4 –656.1 –695.4 –725.2 –699.1 –504.8 .................. Balance on current account, NIPAs................................................................................................ 31 –718.6 –653.6 –693.0 –722.6 –696.5 –502.6 –293.3 Less: Capital account transactions (net) 2 ..................................................................................... 32 1.8 2.4 2.4 2.6 2.6 2.2 ..................
1. Exports and imports of certain goods, primarily military equipment purchased and sold by the federal government, are included in services. Beginning with 1986, repairs and alterations of equipment are reclassified from goods to services.
2. Consists of capital transfers and the acquisition and disposal of nonproduced nonfinancial assets.

D–34 National Data June 2009
Table 4.2.1. Percent Change From Preceding Period in Real Exports and in Table 4.2.2. Contributions to Percent Change in Real Exports and in Real Imports of Goods and Services by Type of Product Real Imports of Goods and Services by Type of Product
Line 2007 2008
Seasonally adjusted at annual rates
2008 2009
I II III IV I
Exports of goods and services ........................... 1 8.4 6.2 5.1 12.3 3.0 –23.6 –28.7
Exports of goods 1 ..................... 2 7.5 6.0 4.5 16.3 3.7 –32.0 –37.8 Foods, feeds, and beverages.... Industrial supplies and
3 8.8 4.7 14.3 8.7 –10.8 –27.7 –7.3
materials............................... 4 5.5 10.5 11.2 29.0 8.7 –29.0 –34.4 Durable goods ...................... 5 5.6 9.3 –5.4 41.9 7.4 –22.7 –50.9 Nondurable goods ................
Capital goods, except 6 5.4 11.2 21.7 22.5 9.4 –32.1 –23.4
automotive............................ Civilian aircraft, engines, and
7 8.0 4.1 –3.6 11.2 4.4 –33.2 –35.0
parts ................................. Computers, peripherals, and
8 11.4 –5.4 –24.1 –3.2 –3.0 –65.6 89.0
parts ................................. 9 3.5 5.5 0.4 57.4 5.4 –45.2 –21.0 Other ....................................
Automotive vehicles, engines, 10 7.9 6.7 2.7 10.3 6.4 –19.8 –52.0
and parts .............................. Consumer goods, except
11 11.9 –0.9 –11.5 4.3 25.9 –56.6 –82.4
automotive............................ 12 10.9 8.1 14.9 15.3 12.8 –29.1 –22.7 Durable goods ...................... 13 15.4 7.7 14.6 12.7 2.2 –47.2 –37.5 Nondurable goods ................ 14 5.4 8.6 15.4 18.9 28.5 1.1 –3.1
Other ........................................ 15 –5.4 6.4 37.1 28.8 –53.3 28.0 –26.3 Exports of services 1 .................
Transfers under U.S. military 16 10.5 6.6 6.4 3.8 1.4 –1.5 –7.2
agency sales contracts......... 17 –12.3 –19.3 77.3 –68.4 –6.6 10.6 18.4 Travel ........................................ 18 8.9 9.9 –0.4 12.5 11.6 –15.4 –23.6 Passenger fares........................ 19 7.6 6.2 –10.5 11.8 8.6 –29.4 –16.1 Other transportation ................. 20 7.4 0.4 8.2 –6.8 –19.8 8.4 –5.4 Royalties and license fees ........ 21 11.4 8.7 4.7 8.6 8.3 3.5 –3.5 Other private services .............. 22 14.5 8.7 10.0 7.3 5.2 –0.8 –2.6 Other ........................................
Imports of goods and 23 4.9 –4.1 –6.4 –3.1 –44.3 93.4 8.0
services ........................... 24 2.2 –3.5 –0.8 –7.3 –3.5 –17.5 –34.1 Imports of goods 1 ..................... 25 1.7 –4.1 –2.0 –7.1 –4.7 –19.6 –39.6
Foods, feeds, and beverages.... 26 1.3 –1.5 –5.2 4.7 –1.4 3.4 –22.7 Industrial supplies and
materials, except petroleum and products......................... 27 –3.8 –8.4 –17.3 –0.4 7.7 –25.3 –52.0 Durable goods ...................... 28 –9.7 –9.2 –10.4 –11.8 7.8 –20.0 –60.3 Nondurable goods ................ 29 3.7 –7.6 –24.2 13.2 7.6 –30.3 –42.6
Petroleum and products ........... Capital goods, except
30 –2.0 –4.0 17.6 –38.1 –6.6 40.7 2.5
automotive............................ Civilian aircraft, engines, and
31 5.9 0.5 1.1 8.9 –5.4 –28.3 –45.2
parts ................................. Computers, peripherals, and
32 15.3 –3.1 17.0 3.4 –37.3 –25.3 –28.6
parts ................................. 33 9.8 1.7 6.3 26.0 –13.1 –47.4 –23.1 Other ....................................
Automotive vehicles, engines, 34 3.6 0.5 –2.2 4.3 1.8 –21.6 –51.9
and parts .............................. Consumer goods, except
35 –0.1 –11.9 –7.9 –12.7 –25.7 –50.5 –79.9
automotive............................ 36 5.8 –1.4 –6.5 8.2 4.3 –31.3 –26.2 Durable goods ...................... 37 7.0 –1.7 –15.2 19.7 2.0 –40.5 –32.5 Nondurable goods ................ 38 4.4 –1.1 5.3 –4.4 7.3 –18.3 –18.7
Other ........................................ 39 –0.4 –6.6 –0.1 23.2 –17.7 –27.3 –23.8 Imports of services 1.................. 40 4.4 0.2 5.5 –8.0 3.3 –6.7 –4.3
Direct defense expenditures ..... 41 –4.1 –8.6 –12.3 –21.8 0.2 6.3 41.3 Travel ........................................ 42 –1.7 1.8 8.5 –11.2 4.9 17.3 –8.1 Passenger fares........................ 43 –2.7 1.1 32.9 –21.0 –5.4 –25.1 –9.1 Other transportation ................. 44 4.4 –4.4 4.2 –12.3 –11.4 –19.6 –18.8 Royalties and license fees ........ 45 2.6 1.6 11.4 5.2 80.9 –48.5 –10.9 Other private services .............. 46 12.4 3.6 3.9 0.5 2.5 –1.9 –3.4 Other ........................................
Addenda: 47 1.6 –0.7 –3.6 –7.7 2.9 20.5 13.2
Exports of durable goods ......... 48 8.5 4.6 –2.2 15.1 4.9 –36.1 –46.8 Exports of nondurable goods ... 49 5.4 8.7 19.7 18.6 1.5 –23.6 –16.1 Exports of agricultural goods 2
Exports of nonagricultural 50 7.1 5.2 11.8 10.5 –7.0 –15.2 –7.5
goods.................................... 51 7.6 6.1 3.8 17.0 4.9 –33.5 –40.3 Imports of durable goods.......... 52 2.2 –4.3 –6.3 3.7 –7.1 –35.0 –52.6 Imports of nondurable goods.... 53 1.1 –4.0 4.0 –18.7 –1.7 3.6 –17.4 Imports of nonpetroleum goods 54 2.5 –4.1 –6.4 4.0 –4.1 –30.5 –45.4
[Percent]
Line 2007 2008
Seasonally adjusted at annual rates
2008 2009
I II III IV I
Percent change at annual rate: Exports of goods and
services ........................... Percentage points at annual
rates:
1 8.4 6.2 5.1 12.3 3.0 –23.6 –28.7
Exports of goods 1 ..................... 2 5.26 4.14 3.13 11.11 2.55 –23.17 –26.57 Foods, feeds, and beverages.... Industrial supplies and
3 0.42 0.22 0.77 0.52 –0.70 –1.61 –0.36
materials ............................... 4 1.01 2.00 2.02 5.34 1.75 –5.89 –6.15 Durable goods ...................... 5 0.39 0.65 –0.37 2.57 0.52 –1.52 –3.62 Nondurable goods ................
Capital goods, except 6 0.62 1.35 2.39 2.77 1.23 –4.37 –2.53
automotive ............................ Civilian aircraft, engines, and
7 2.21 1.10 –0.95 2.85 1.09 –8.95 –9.42
parts ................................. Computers, peripherals, and
8 0.58 –0.28 –1.45 –0.16 –0.14 –4.14 3.17
parts ................................. 9 0.11 0.14 0.01 1.15 0.13 –1.22 –0.48 Other.....................................
Automotive vehicles, engines, 10 1.53 1.25 0.49 1.85 1.10 –3.59 –12.11
and parts............................... Consumer goods, except
11 0.85 –0.06 –0.84 0.29 1.52 –4.76 –7.89
automotive ............................ 12 0.94 0.70 1.21 1.29 1.04 –2.67 –2.01 Durable goods ...................... 13 0.73 0.38 0.69 0.63 0.11 –2.71 –1.89 Nondurable goods ................ 14 0.21 0.32 0.52 0.66 0.93 0.05 –0.12
Other......................................... 15 –0.18 0.18 0.92 0.82 –2.15 0.71 –0.74 Exports of services 1..................
Transfers under U.S. military 16 3.19 2.04 1.97 1.19 0.43 –0.41 –2.15
agency sales contracts ......... 17 –0.13 –0.16 0.45 –0.79 –0.04 0.06 0.13 Travel......................................... 18 0.52 0.58 –0.03 0.71 0.65 –0.97 –1.46 Passenger fares........................ 19 0.12 0.09 –0.18 0.18 0.13 –0.55 –0.25 Other transportation.................. 20 0.23 0.00 0.26 –0.23 –0.72 0.26 –0.15 Royalties and license fees ........ 21 0.56 0.43 0.23 0.41 0.38 0.17 –0.18 Other private services............... 22 1.85 1.16 1.31 0.95 0.65 –0.10 –0.35 Other.........................................
Percent change at annual rate: Imports of goods and
23 0.06 –0.05 –0.07 –0.04 –0.63 0.72 0.11
services ........................... Percentage points at annual
rates:
24 2.2 –3.5 –0.8 –7.3 –3.5 –17.5 –34.1
Imports of goods 1...................... 25 1.46 –3.49 –1.65 –5.97 –3.97 –16.46 –33.37 Foods, feeds, and beverages.... Industrial supplies and
materials, except petroleum
26 0.04 –0.05 –0.18 0.16 –0.05 0.12 –0.86
and products ......................... 27 –0.50 –1.04 –2.25 –0.03 0.92 –3.48 –7.05 Durable goods ...................... 28 –0.71 –0.60 –0.67 –0.76 0.47 –1.33 –4.27 Nondurable goods ................ 29 0.21 –0.44 –1.58 0.73 0.45 –2.15 –2.78
Petroleum and products............ Capital goods, except
30 –0.28 –0.77 2.74 –8.59 –1.29 5.83 0.34
automotive ............................ Civilian aircraft, engines, and
31 1.08 0.11 0.21 1.52 –0.97 –5.52 –9.35
parts ................................. Computers, peripherals, and
32 0.20 –0.04 0.23 0.05 –0.63 –0.36 –0.42
parts ................................. 33 0.42 0.08 0.26 0.96 –0.56 –2.27 –0.86 Other.....................................
Automotive vehicles, engines, 34 0.46 0.07 –0.28 0.52 0.22 –2.88 –8.08
and parts............................... Consumer goods, except
35 –0.01 –1.20 –0.85 –1.31 –2.66 –5.61 –10.23
automotive ............................ 36 1.15 –0.27 –1.30 1.49 0.80 –6.72 –5.28 Durable goods ...................... 37 0.76 –0.18 –1.75 1.87 0.21 –5.06 –3.57 Nondurable goods ................ 38 0.39 –0.10 0.45 –0.38 0.59 –1.66 –1.70
Other......................................... 39 –0.02 –0.26 0.00 0.78 –0.71 –1.08 –0.94 Imports of services 1 .................. 40 0.71 0.04 0.86 –1.29 0.51 –1.07 –0.69
Direct defense expenditures ..... 41 –0.06 –0.12 –0.18 –0.33 0.00 0.09 0.56 Travel......................................... 42 –0.05 0.06 0.26 –0.36 0.15 0.53 –0.29 Passenger fares........................ 43 –0.03 0.01 0.35 –0.29 –0.07 –0.37 –0.13 Other transportation.................. 44 0.13 –0.12 0.12 –0.36 –0.34 –0.59 –0.55 Royalties and license fees ........ 45 0.03 0.01 0.11 0.05 0.61 –0.70 –0.12 Other private services............... 46 0.69 0.21 0.23 0.03 0.14 –0.11 –0.23 Other......................................... 47 0.01 0.00 –0.02 –0.03 0.01 0.09 0.07
1. Exports and imports of certain goods, primarily military equipment purchased and sold by the federal government, are included in services. Beginning with 1986, repairs and alterations of equipment are reclassified from goods to services.
1. Exports and imports of certain goods, primarily military equipment purchased and sold by the federal government, are included in services. Beginning with 1986, repairs and alterations of equipment are reclassified from goods to services.
2. Includes parts of foods, feeds, and beverages, of nondurable industrial supplies and materials, and of nondurable nonautomotive consumer goods.

June 2009 SURVEY OF CURRENT BUSINESS D–35
Table 4.2.3. Real Exports and Imports of Goods and Services Table 4.2.4. Price Indexes for Exports and Imports of Goods and Services by Type of Product, Quantity Indexes by Type of Product
[Index numbers, 2000=100] [Index numbers, 2000=100]
Line 2007 2008
Seasonally adjusted
2008 2009
I II III IV I
Exports of goods and services ........................... 1 130.068 138.111 136.880 140.908 141.943 132.713 121.943
Exports of goods 1 ..................... 2 127.335 134.948 133.690 138.826 140.079 127.198 112.961 Foods, feeds, and beverages.... Industrial supplies and
3 119.271 124.889 127.180 129.849 126.180 116.347 114.159
materials............................... 4 122.476 135.352 130.383 138.941 141.863 130.220 117.204 Durable goods ...................... 5 118.170 129.194 121.763 132.886 135.281 126.844 106.189 Nondurable goods ................
Capital goods, except 6 125.223 139.290 135.750 142.815 146.043 132.552 124.013
automotive............................ Civilian aircraft, engines, and
7 127.527 132.803 132.678 136.258 137.745 124.533 111.801
parts ................................. Computers, peripherals, and
8 137.935 130.505 139.942 138.797 137.757 105.524 123.723
parts ................................. 9 115.369 121.705 115.052 128.863 130.555 112.351 105.906 Other ....................................
Automotive vehicles, engines, 10 127.650 136.256 134.568 137.895 140.039 132.521 110.324
and parts .............................. Consumer goods, except
11 142.112 140.895 142.695 144.199 152.742 123.947 80.245
automotive............................ 12 155.341 167.910 164.473 170.414 175.616 161.136 151.075 Durable goods ...................... 13 170.904 184.067 186.423 192.062 193.125 164.657 146.375 Nondurable goods ................ 14 138.535 150.446 140.907 147.140 156.648 157.087 155.859
Other ........................................ 15 90.843 96.687 99.614 106.123 87.711 93.302 86.438 Exports of services 1 .................
Transfers under U.S. military 16 136.868 145.916 144.792 146.131 146.640 146.100 143.402
agency sales contracts......... 17 103.511 83.561 103.088 77.285 75.967 77.904 81.261 Travel ........................................ 18 99.730 109.653 106.880 110.083 113.135 108.515 101.458 Passenger fares........................ 19 82.805 87.919 87.045 89.501 91.371 83.758 80.157 Other transportation ................. 20 125.616 126.090 130.621 128.335 121.458 123.944 122.226 Royalties and license fees ........ 21 159.545 173.378 168.639 172.160 175.606 177.107 175.551 Other private services .............. 22 178.017 193.562 189.916 193.273 195.718 195.341 194.057 Other ........................................
Imports of goods and 23 107.650 103.219 106.953 106.118 91.682 108.123 110.211
services ........................... 24 133.654 129.038 132.991 130.509 129.367 123.283 111.092 Imports of goods 1 ..................... 25 134.921 129.326 133.654 131.212 129.653 122.785 108.237
Foods, feeds, and beverages.... 26 139.687 137.600 136.368 137.957 137.459 138.614 129.975 Industrial supplies and
materials, except petroleum and products......................... 27 124.901 114.361 115.429 115.320 117.475 109.221 90.898 Durable goods ...................... 28 128.155 116.385 119.673 115.967 118.154 111.747 88.696 Nondurable goods ................ 29 122.231 112.979 111.806 115.321 117.455 107.333 93.432
Petroleum and products ........... Capital goods, except
30 112.670 108.157 116.638 103.467 101.727 110.797 111.485
automotive............................ Civilian aircraft, engines, and
31 141.960 142.653 144.252 147.344 145.299 133.717 115.043
parts ................................. Computers, peripherals, and
32 106.094 102.840 109.995 110.914 98.700 91.753 84.348
parts ................................. 33 200.083 203.387 205.800 218.025 210.478 179.244 167.832 Other ....................................
Automotive vehicles, engines, 34 129.089 129.719 130.354 131.724 132.308 124.490 103.668
and parts .............................. Consumer goods, except
35 125.864 110.886 122.624 118.526 110.056 92.336 61.830
automotive............................ 36 167.794 165.469 165.927 169.218 171.012 155.718 144.319 Durable goods ...................... 37 179.857 176.873 175.981 184.064 184.982 162.467 147.289 Nondurable goods ................ 38 154.939 153.298 155.176 153.435 156.147 148.433 140.963
Other ........................................ 39 106.881 99.847 100.254 105.627 100.600 92.906 86.800 Imports of services 1.................. 40 127.581 127.856 129.913 127.217 128.249 126.043 124.656
Direct defense expenditures ..... 41 137.224 125.480 130.835 123.016 123.082 124.989 136.267 Travel ........................................ 42 84.472 85.984 86.503 83.980 84.993 88.461 86.607 Passenger fares........................ 43 86.966 87.958 94.132 88.756 87.528 81.418 79.507 Other transportation ................. 44 128.657 123.040 129.672 125.470 121.731 115.287 109.422 Royalties and license fees ........ 45 127.134 129.126 123.500 125.079 145.057 122.869 119.389 Other private services .............. 46 193.484 200.406 199.847 200.087 201.324 200.368 198.635 Other ........................................
Addenda: 47 110.284 109.494 109.441 107.269 108.051 113.215 116.788
Exports of durable goods ......... 48 130.213 136.197 135.479 140.328 142.009 126.974 108.435 Exports of nondurable goods ... 49 122.542 133.217 130.919 136.624 137.131 128.193 122.677 Exports of agricultural goods 2
Exports of nonagricultural 50 117.787 123.883 123.936 127.064 124.789 119.743 117.433
goods.................................... 51 128.309 136.143 134.709 140.091 141.760 128.010 112.543 Imports of durable goods.......... 52 140.459 134.386 138.219 139.473 136.912 122.940 102.034 Imports of nondurable goods.... 53 127.961 122.862 127.688 121.248 120.726 121.785 116.094 Imports of nonpetroleum goods 54 139.177 133.499 136.179 137.510 136.077 124.229 106.798
Line 2007 2008
Seasonally adjusted
2008 2009
I II III IV I
Exports of goods and services ........................... 1 116.586 122.788 121.397 124.560 126.592 118.601 115.199
Exports of goods 1 ..................... 2 115.062 121.147 119.916 123.456 125.137 116.082 112.516 Foods, feeds, and beverages.... Industrial supplies and
3 147.582 183.512 180.050 193.041 196.142 164.817 161.834
materials ............................... 4 148.503 162.902 160.153 170.957 176.443 144.056 128.736 Durable goods ...................... 5 151.498 155.509 157.844 163.036 164.607 136.550 128.147 Nondurable goods ................
Capital goods, except 6 146.653 166.996 161.369 175.337 183.065 148.211 129.034
automotive ............................ Civilian aircraft, engines, and
7 98.278 98.954 98.410 98.790 99.191 99.427 99.685
parts ................................. Computers, peripherals, and
8 131.606 138.055 135.724 136.905 138.530 141.061 144.550
parts ................................. 9 71.080 65.060 67.654 65.881 64.124 62.582 60.972 Other.....................................
Automotive vehicles, engines, 10 97.268 98.102 97.263 97.910 98.521 98.713 98.760
and parts............................... Consumer goods, except
11 105.999 107.317 106.744 107.184 107.455 107.884 107.983
automotive ............................ 12 105.231 107.470 106.761 107.639 107.970 107.510 107.531 Durable goods ...................... 13 103.620 105.705 104.782 105.162 106.111 106.764 106.333 Nondurable goods ................ 14 107.233 109.724 109.256 110.847 110.317 108.475 108.986
Other......................................... 15 120.698 128.253 126.673 130.764 132.799 122.777 118.936 Exports of services 1..................
Transfers under U.S. military 16 120.211 126.684 124.932 127.211 130.082 124.510 121.424
agency sales contracts ......... 17 109.910 112.895 111.868 112.553 113.274 113.885 113.783 Travel......................................... 18 117.687 122.940 121.940 123.610 126.347 119.862 116.693 Passenger fares........................ 19 149.360 165.229 159.669 161.357 174.462 165.427 154.119 Other transportation.................. 20 137.793 160.415 153.404 166.021 175.746 146.487 128.452 Royalties and license fees ........ 21 119.775 123.519 122.169 123.461 124.900 123.545 123.224 Other private services............... 22 114.840 117.837 117.291 117.885 118.949 117.221 116.144 Other.........................................
Imports of goods and 23 126.772 148.832 142.119 151.672 159.815 141.723 141.019
services ........................... 24 120.168 132.698 128.722 137.136 140.189 124.747 114.218 Imports of goods 1...................... 25 118.326 131.408 127.427 136.387 139.607 122.209 110.591
Foods, feeds, and beverages.... 26 127.179 140.409 136.193 141.977 145.124 138.342 135.291 Industrial supplies and
materials, except petroleum and products ......................... 27 136.387 156.793 149.143 163.340 166.465 148.223 130.229 Durable goods ...................... 28 138.711 152.583 144.953 160.575 163.412 141.391 123.436 Nondurable goods ................ 29 133.004 160.244 152.649 165.193 168.601 154.535 136.595
Petroleum and products............ Capital goods, except
30 244.422 349.202 320.072 397.641 430.013 249.083 153.557
automotive ............................ Civilian aircraft, engines, and
31 90.226 91.512 90.777 91.795 92.031 91.444 90.720
parts ................................. Computers, peripherals, and
32 122.958 130.602 127.586 130.173 131.369 133.278 135.604
parts ................................. 33 58.552 55.201 56.434 55.893 54.670 53.810 52.408 Other.....................................
Automotive vehicles, engines, 34 102.305 105.777 104.058 105.850 106.907 106.294 105.732
and parts............................... Consumer goods, except
35 105.022 107.713 107.118 107.641 107.982 108.109 108.042
automotive ............................ 36 101.130 103.735 102.875 104.003 104.282 103.781 103.347 Durable goods ...................... 37 98.070 100.167 99.344 100.524 100.764 100.035 98.700 Nondurable goods ................ 38 104.641 107.900 106.995 108.050 108.380 108.175 108.828
Other......................................... 39 113.066 119.579 116.944 118.809 119.692 122.873 121.267 Imports of services 1 .................. 40 129.928 139.217 135.377 140.740 142.873 137.879 132.643
Direct defense expenditures ..... 41 177.523 206.650 199.134 213.891 217.715 195.861 179.378 Travel......................................... 42 139.353 145.991 145.244 150.763 148.065 139.892 137.317 Passenger fares........................ 43 134.939 155.504 141.005 153.358 159.501 168.153 151.721 Other transportation.................. 44 125.798 140.716 133.055 142.827 149.398 137.585 123.309 Royalties and license fees ........ 45 119.644 123.476 122.127 123.418 124.857 123.502 123.181 Other private services............... 46 116.559 120.580 118.934 120.466 122.082 120.839 120.348 Other.........................................
Addenda: 47 127.079 133.623 131.890 135.544 136.640 130.419 127.116
Exports of durable goods.......... 48 106.408 107.807 107.529 108.520 109.130 106.048 105.136 Exports of nondurable goods.... 49 136.746 155.837 151.990 162.407 166.985 141.967 131.812 Exports of agricultural goods 2
Exports of nonagricultural 50 148.110 183.355 180.483 193.981 197.549 161.407 155.490
goods.................................... 51 112.617 116.726 115.619 118.478 120.031 112.776 109.381 Imports of durable goods.......... 52 101.715 104.841 103.430 105.766 106.289 103.879 101.407 Imports of nondurable goods.... 53 150.215 184.554 174.843 197.803 206.845 158.725 130.161 Imports of nonpetroleum goods 54 105.809 111.004 109.126 112.067 112.867 109.956 106.934
1. Exports and imports of certain goods, primarily military equipment purchased and sold by the federal government, 1. Exports and imports of certain goods, primarily military equipment purchased and sold by the federal government, are are included in services. Beginning with 1986, repairs and alterations of equipment are reclassified from goods to services. included in services. Beginning with 1986, repairs and alterations of equipment are reclassified from goods to services.
2. Includes parts of foods, feeds, and beverages, of nondurable industrial supplies and materials, and of nondurable 2. Includes parts of foods, feeds, and beverages, of nondurable industrial supplies and materials, and of nondurable nonautomotive consumer goods. nonautomotive consumer goods.
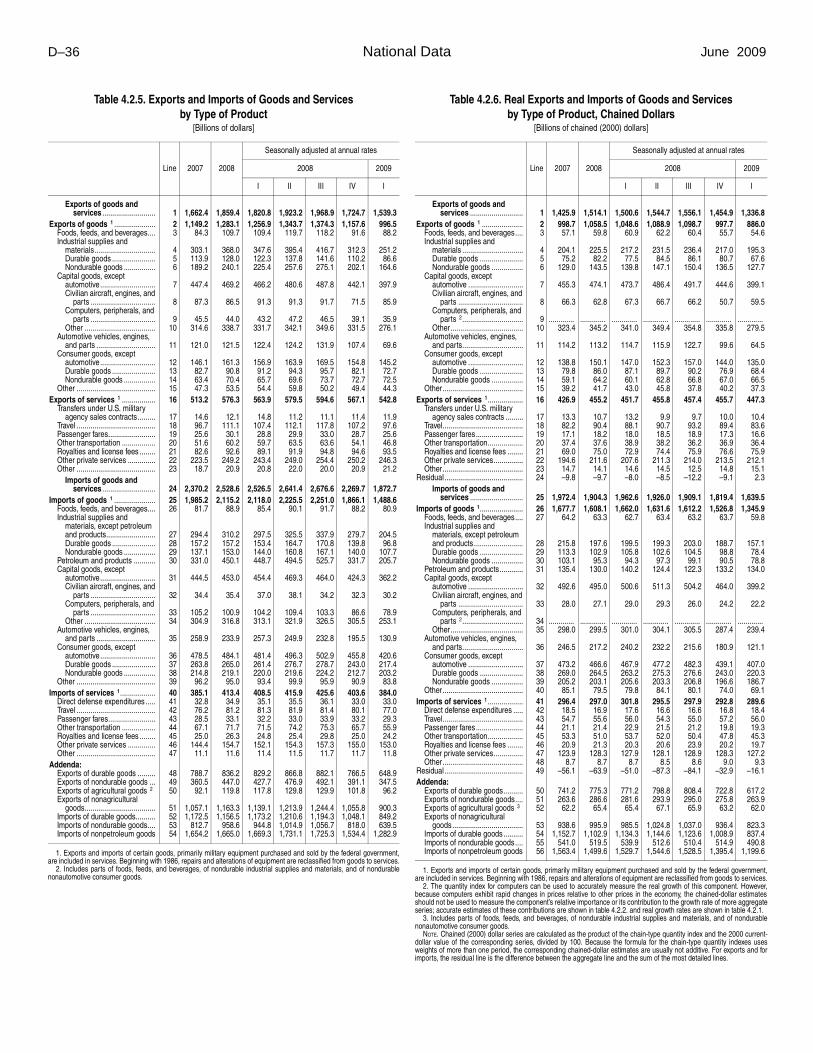
D–36 National Data June 2009
Table 4.2.5. Exports and Imports of Goods and Services Table 4.2.6. Real Exports and Imports of Goods and Services by Type of Product by Type of Product, Chained Dollars
[Billions of dollars] [Billions of chained (2000) dollars]
Line 2007 2008
Seasonally adjusted at annual rates
2008 2009
I II III IV I
Exports of goods and services ........................... 1 1,662.4 1,859.4 1,820.8 1,923.2 1,968.9 1,724.7 1,539.3
Exports of goods 1 ..................... 2 1,149.2 1,283.1 1,256.9 1,343.7 1,374.3 1,157.6 996.5 Foods, feeds, and beverages.... Industrial supplies and
3 84.3 109.7 109.4 119.7 118.2 91.6 88.2
materials............................... 4 303.1 368.0 347.6 395.4 416.7 312.3 251.2 Durable goods ...................... 5 113.9 128.0 122.3 137.8 141.6 110.2 86.6 Nondurable goods ................
Capital goods, except 6 189.2 240.1 225.4 257.6 275.1 202.1 164.6
automotive............................ Civilian aircraft, engines, and
7 447.4 469.2 466.2 480.6 487.8 442.1 397.9
parts ................................. Computers, peripherals, and
8 87.3 86.5 91.3 91.3 91.7 71.5 85.9
parts ................................. 9 45.5 44.0 43.2 47.2 46.5 39.1 35.9 Other ....................................
Automotive vehicles, engines, 10 314.6 338.7 331.7 342.1 349.6 331.5 276.1
and parts .............................. Consumer goods, except
11 121.0 121.5 122.4 124.2 131.9 107.4 69.6
automotive............................ 12 146.1 161.3 156.9 163.9 169.5 154.8 145.2 Durable goods ...................... 13 82.7 90.8 91.2 94.3 95.7 82.1 72.7 Nondurable goods ................ 14 63.4 70.4 65.7 69.6 73.7 72.7 72.5
Other ........................................ 15 47.3 53.5 54.4 59.8 50.2 49.4 44.3 Exports of services 1 .................
Transfers under U.S. military 16 513.2 576.3 563.9 579.5 594.6 567.1 542.8
agency sales contracts......... 17 14.6 12.1 14.8 11.2 11.1 11.4 11.9 Travel ........................................ 18 96.7 111.1 107.4 112.1 117.8 107.2 97.6 Passenger fares........................ 19 25.6 30.1 28.8 29.9 33.0 28.7 25.6 Other transportation ................. 20 51.6 60.2 59.7 63.5 63.6 54.1 46.8 Royalties and license fees ........ 21 82.6 92.6 89.1 91.9 94.8 94.6 93.5 Other private services .............. 22 223.5 249.2 243.4 249.0 254.4 250.2 246.3 Other ........................................
Imports of goods and 23 18.7 20.9 20.8 22.0 20.0 20.9 21.2
services ........................... 24 2,370.2 2,528.6 2,526.5 2,641.4 2,676.6 2,269.7 1,872.7 Imports of goods 1 ..................... 25 1,985.2 2,115.2 2,118.0 2,225.5 2,251.0 1,866.1 1,488.6
Foods, feeds, and beverages.... Industrial supplies and
materials, except petroleum
26 81.7 88.9 85.4 90.1 91.7 88.2 80.9
and products......................... 27 294.4 310.2 297.5 325.5 337.9 279.7 204.5 Durable goods ...................... 28 157.2 157.2 153.4 164.7 170.8 139.8 96.8 Nondurable goods ................ 29 137.1 153.0 144.0 160.8 167.1 140.0 107.7
Petroleum and products ........... Capital goods, except
30 331.0 450.1 448.7 494.5 525.7 331.7 205.7
automotive............................ Civilian aircraft, engines, and
31 444.5 453.0 454.4 469.3 464.0 424.3 362.2
parts ................................. Computers, peripherals, and
32 34.4 35.4 37.0 38.1 34.2 32.3 30.2
parts ................................. 33 105.2 100.9 104.2 109.4 103.3 86.6 78.9 Other ....................................
Automotive vehicles, engines, 34 304.9 316.8 313.1 321.9 326.5 305.5 253.1
and parts .............................. Consumer goods, except
35 258.9 233.9 257.3 249.9 232.8 195.5 130.9
automotive............................ 36 478.5 484.1 481.4 496.3 502.9 455.8 420.6 Durable goods ...................... 37 263.8 265.0 261.4 276.7 278.7 243.0 217.4 Nondurable goods ................ 38 214.8 219.1 220.0 219.6 224.2 212.7 203.2
Other ........................................ 39 96.2 95.0 93.4 99.9 95.9 90.9 83.8 Imports of services 1.................. 40 385.1 413.4 408.5 415.9 425.6 403.6 384.0
Direct defense expenditures ..... 41 32.8 34.9 35.1 35.5 36.1 33.0 33.0 Travel ........................................ 42 76.2 81.2 81.3 81.9 81.4 80.1 77.0 Passenger fares........................ 43 28.5 33.1 32.2 33.0 33.9 33.2 29.3 Other transportation ................. 44 67.1 71.7 71.5 74.2 75.3 65.7 55.9 Royalties and license fees ........ 45 25.0 26.3 24.8 25.4 29.8 25.0 24.2 Other private services .............. 46 144.4 154.7 152.1 154.3 157.3 155.0 153.0 Other ........................................
Addenda: 47 11.1 11.6 11.4 11.5 11.7 11.7 11.8
Exports of durable goods ......... 48 788.7 836.2 829.2 866.8 882.1 766.5 648.9 Exports of nondurable goods ... 49 360.5 447.0 427.7 476.9 492.1 391.1 347.5 Exports of agricultural goods 2
Exports of nonagricultural 50 92.1 119.8 117.8 129.8 129.9 101.8 96.2
goods.................................... 51 1,057.1 1,163.3 1,139.1 1,213.9 1,244.4 1,055.8 900.3 Imports of durable goods.......... 52 1,172.5 1,156.5 1,173.2 1,210.6 1,194.3 1,048.1 849.2 Imports of nondurable goods.... 53 812.7 958.6 944.8 1,014.9 1,056.7 818.0 639.5 Imports of nonpetroleum goods 54 1,654.2 1,665.0 1,669.3 1,731.1 1,725.3 1,534.4 1,282.9
Line 2007 2008
Seasonally adjusted at annual rates
2008 2009
I II III IV I
Exports of goods and services ........................... 1 1,425.9 1,514.1 1,500.6 1,544.7 1,556.1 1,454.9 1,336.8
Exports of goods 1 ..................... 2 998.7 1,058.5 1,048.6 1,088.9 1,098.7 997.7 886.0 Foods, feeds, and beverages.... Industrial supplies and
3 57.1 59.8 60.9 62.2 60.4 55.7 54.6
materials ............................... 4 204.1 225.5 217.2 231.5 236.4 217.0 195.3 Durable goods ...................... 5 75.2 82.2 77.5 84.5 86.1 80.7 67.6 Nondurable goods ................
Capital goods, except 6 129.0 143.5 139.8 147.1 150.4 136.5 127.7
automotive ............................ Civilian aircraft, engines, and
7 455.3 474.1 473.7 486.4 491.7 444.6 399.1
parts ................................. Computers, peripherals, and
8 66.3 62.8 67.3 66.7 66.2 50.7 59.5
parts 2............................... 9 ............. ............. ............. ............. ............. ............. ............. Other.....................................
Automotive vehicles, engines, 10 323.4 345.2 341.0 349.4 354.8 335.8 279.5
and parts............................... Consumer goods, except
11 114.2 113.2 114.7 115.9 122.7 99.6 64.5
automotive ............................ 12 138.8 150.1 147.0 152.3 157.0 144.0 135.0 Durable goods ...................... 13 79.8 86.0 87.1 89.7 90.2 76.9 68.4 Nondurable goods ................ 14 59.1 64.2 60.1 62.8 66.8 67.0 66.5
Other......................................... 15 39.2 41.7 43.0 45.8 37.8 40.2 37.3 Exports of services 1..................
Transfers under U.S. military 16 426.9 455.2 451.7 455.8 457.4 455.7 447.3
agency sales contracts ......... 17 13.3 10.7 13.2 9.9 9.7 10.0 10.4 Travel......................................... 18 82.2 90.4 88.1 90.7 93.2 89.4 83.6 Passenger fares........................ 19 17.1 18.2 18.0 18.5 18.9 17.3 16.6 Other transportation.................. 20 37.4 37.6 38.9 38.2 36.2 36.9 36.4 Royalties and license fees ........ 21 69.0 75.0 72.9 74.4 75.9 76.6 75.9 Other private services............... 22 194.6 211.6 207.6 211.3 214.0 213.5 212.1 Other......................................... 23 14.7 14.1 14.6 14.5 12.5 14.8 15.1
Residual........................................ Imports of goods and
24 –9.8 –9.7 –8.0 –8.5 –12.2 –9.1 2.3
services ........................... 25 1,972.4 1,904.3 1,962.6 1,926.0 1,909.1 1,819.4 1,639.5 Imports of goods 1...................... 26 1,677.7 1,608.1 1,662.0 1,631.6 1,612.2 1,526.8 1,345.9
Foods, feeds, and beverages.... Industrial supplies and
materials, except petroleum
27 64.2 63.3 62.7 63.4 63.2 63.7 59.8
and products ......................... 28 215.8 197.6 199.5 199.3 203.0 188.7 157.1 Durable goods ...................... 29 113.3 102.9 105.8 102.6 104.5 98.8 78.4 Nondurable goods ................ 30 103.1 95.3 94.3 97.3 99.1 90.5 78.8
Petroleum and products............ Capital goods, except
31 135.4 130.0 140.2 124.4 122.3 133.2 134.0
automotive ............................ Civilian aircraft, engines, and
32 492.6 495.0 500.6 511.3 504.2 464.0 399.2
parts ................................. Computers, peripherals, and
33 28.0 27.1 29.0 29.3 26.0 24.2 22.2
parts 2............................... 34 ............. ............. ............. ............. ............. ............. ............. Other.....................................
Automotive vehicles, engines, 35 298.0 299.5 301.0 304.1 305.5 287.4 239.4
and parts............................... Consumer goods, except
36 246.5 217.2 240.2 232.2 215.6 180.9 121.1
automotive ............................ 37 473.2 466.6 467.9 477.2 482.3 439.1 407.0 Durable goods ...................... 38 269.0 264.5 263.2 275.3 276.6 243.0 220.3 Nondurable goods ................ 39 205.2 203.1 205.6 203.3 206.8 196.6 186.7
Other......................................... 40 85.1 79.5 79.8 84.1 80.1 74.0 69.1 Imports of services 1 .................. 41 296.4 297.0 301.8 295.5 297.9 292.8 289.6
Direct defense expenditures ..... 42 18.5 16.9 17.6 16.6 16.6 16.8 18.4 Travel......................................... 43 54.7 55.6 56.0 54.3 55.0 57.2 56.0 Passenger fares........................ 44 21.1 21.4 22.9 21.5 21.2 19.8 19.3 Other transportation.................. 45 53.3 51.0 53.7 52.0 50.4 47.8 45.3 Royalties and license fees ........ 46 20.9 21.3 20.3 20.6 23.9 20.2 19.7 Other private services............... 47 123.9 128.3 127.9 128.1 128.9 128.3 127.2 Other......................................... 48 8.7 8.7 8.7 8.5 8.6 9.0 9.3
Residual........................................ Addenda:
49 –56.1 –63.9 –51.0 –87.3 –84.1 –32.9 –16.1
Exports of durable goods.......... 50 741.2 775.3 771.2 798.8 808.4 722.8 617.2 Exports of nondurable goods.... 51 263.6 286.6 281.6 293.9 295.0 275.8 263.9 Exports of agricultural goods 3
Exports of nonagricultural 52 62.2 65.4 65.4 67.1 65.9 63.2 62.0
goods.................................... 53 938.6 995.9 985.5 1,024.8 1,037.0 936.4 823.3 Imports of durable goods.......... 54 1,152.7 1,102.9 1,134.3 1,144.6 1,123.6 1,008.9 837.4 Imports of nondurable goods.... 55 541.0 519.5 539.9 512.6 510.4 514.9 490.8 Imports of nonpetroleum goods 56 1,563.4 1,499.6 1,529.7 1,544.6 1,528.5 1,395.4 1,199.6 1. Exports and imports of certain goods, primarily military equipment purchased and sold by the federal government,
are included in services. Beginning with 1986, repairs and alterations of equipment are reclassified from goods to services. 2. Includes parts of foods, feeds, and beverages, of nondurable industrial supplies and materials, and of nondurable
nonautomotive consumer goods. 1. Exports and imports of certain goods, primarily military equipment purchased and sold by the federal government,
are included in services. Beginning with 1986, repairs and alterations of equipment are reclassified from goods to services. 2. The quantity index for computers can be used to accurately measure the real growth of this component. However,
because computers exhibit rapid changes in prices relative to other prices in the economy, the chained-dollar estimates should not be used to measure the component’s relative importance or its contribution to the growth rate of more aggregate series; accurate estimates of these contributions are shown in table 4.2.2. and real growth rates are shown in table 4.2.1.
3. Includes parts of foods, feeds, and beverages, of nondurable industrial supplies and materials, and of nondurable nonautomotive consumer goods.
NOTE. Chained (2000) dollar series are calculated as the product of the chain-type quantity index and the 2000 current-dollar value of the corresponding series, divided by 100. Because the formula for the chain-type quantity indexes uses weights of more than one period, the corresponding chained-dollar estimates are usually not additive. For exports and for imports, the residual line is the difference between the aggregate line and the sum of the most detailed lines.

June 2009 SURVEY OF CURRENT BUSINESS D–37
5. Saving and Investment
Table 5.1. Saving and Investment [Billions of dollars]
Line 2007 2008
Seasonally adjusted at annual rates
2008 2009
I II III IV I
Gross saving.......................... 1 1,956.0 1,697.7 1,773.6 1,634.6 1,670.5 1,712.3 1,676.0 Net saving ...................................... 2 235.6 –134.6 –4.4 –168.5 –227.5 –137.9 –183.0
Net private saving........................ 3 454.5 470.5 378.7 547.9 420.1 535.2 721.7 Personal saving ....................... Undistributed corporate profits
with inventory valuation and capital consumption
4 57.4 192.7 20.6 267.9 139.8 342.3 475.5
adjustments......................... 5 403.4 277.8 358.1 280.0 280.3 192.9 246.2 Undistributed profits ............ Inventory valuation
6 647.3 398.6 515.5 496.7 459.1 122.9 285.7
adjustment....................... Capital consumption
7 –51.2 –49.0 –109.4 –154.0 –90.9 158.1 105.3
adjustment....................... Wage accruals less
8 –192.7 –71.7 –48.0 –62.7 –88.0 –88.1 –144.9
disbursements ..................... 9 –6.3 0.0 0.0 0.0 0.0 0.0 0.0 Net government saving................ 10 –218.9 –605.1 –383.1 –716.4 –647.6 –673.1 –904.6
Federal .................................... 11 –229.3 –525.0 –330.7 –649.6 –544.0 –575.6 –830.4 State and local......................... 12 10.4 –80.1 –52.4 –66.9 –103.6 –97.4 –74.2
Consumption of fixed capital ....... 13 1,720.5 1,832.3 1,778.0 1,803.1 1,898.1 1,850.1 1,859.0 Private ......................................... 14 1,431.1 1,523.1 1,477.5 1,497.4 1,585.9 1,531.7 1,536.2
Domestic business .................. 15 1,147.0 1,225.0 1,186.1 1,205.6 1,266.0 1,242.5 1,248.7 Households and institutions .... 16 284.1 298.1 291.4 291.8 320.0 289.2 287.5
Government................................. 17 289.4 309.2 300.5 305.7 312.1 318.4 322.8 Federal .................................... 18 111.8 117.9 115.0 116.9 119.2 120.5 121.7 State and local......................... Gross domestic investment,
capital account transactions, and net
19 177.6 191.3 185.5 188.8 192.9 197.9 201.1
lending, NIPAs ................... 20 1,874.6 1,835.9 1,837.0 1,771.2 1,820.7 1,914.5 1,800.8 Gross domestic investment .............
Gross private domestic 21 2,593.2 2,489.5 2,530.0 2,493.8 2,517.2 2,417.0 2,094.0
investment ............................... 22 2,130.4 1,993.5 2,056.1 2,000.9 2,010.9 1,906.1 1,598.7 Gross government investment..... 23 462.8 496.0 473.9 492.8 506.3 510.9 495.4
Capital account transactions (net) 1
Net lending or net borrowing (–), 24 1.8 2.4 2.4 2.6 2.6 2.2 ..............
NIPAs........................................... 25 –720.4 –656.1 –695.4 –725.2 –699.1 –504.8 .............. Statistical discrepancy .........
Addenda: 26 –81.4 138.1 63.4 136.6 150.2 202.2 124.8
Gross private saving.................... 27 1,885.6 1,993.6 1,856.2 2,045.3 2,006.0 2,066.9 2,257.8 Gross government saving............ 28 70.4 –295.9 –82.6 –410.7 –335.5 –354.7 –581.9
Federal .................................... 29 –117.5 –407.1 –215.8 –532.7 –424.8 –455.1 –708.7 State and local......................... 30 187.9 111.2 133.1 122.0 89.3 100.4 126.9
Net domestic investment ............. Gross saving as a percentage
31 872.7 657.2 752.0 690.7 619.2 566.9 235.1
of gross national income ...... Net saving as a percentage of
32 14.0 11.9 12.5 11.5 11.6 12.1 11.9
gross national income .......... 33 1.7 –0.9 0.0 –1.2 –1.6 –1.0 –1.3
1. Consists of capital transfers and the acquisition and disposal of nonproduced nonfinancial assets.
Table 5.3.1. Percent Change From Preceding Period in Real Private Fixed Investment by Type
[Percent]
Line 2007 2008
Seasonally adjusted at annual rates
2008 2009
I II III IV I
Private fixed investment..... 1 –3.1 –5.0 –5.6 –1.7 –5.3 –22.0 –37.3 Nonresidential............................. 2 4.9 1.6 2.4 2.5 –1.7 –21.7 –36.9
Structures................................ 3 12.7 11.2 8.6 18.5 9.7 –9.4 –42.3 Commercial and health care 4 8.3 –0.3 –3.6 0.2 –8.8 –21.9 –31.3 Manufacturing ....................... 5 14.1 39.4 13.0 136.1 16.5 10.5 45.5 Power and communication.... Mining exploration, shafts,
6 23.1 14.7 23.2 0.5 6.8 –2.0 –26.5
and wells........................... 7 9.3 17.1 15.5 31.6 45.3 2.4 –78.1 Other structures 1 ................. 8 19.3 13.0 12.8 17.3 1.9 –17.1 –28.4
Equipment and software ........ Information processing
9 1.7 –3.0 –0.6 –5.0 –7.5 –28.1 –33.5
equipment and software ... Computers and peripheral
10 9.6 4.7 7.2 8.0 –4.2 –22.8 –18.0
equipment..................... 11 17.9 6.5 16.1 13.0 –22.4 –38.7 –12.5 Software 2......................... 12 10.0 4.8 9.9 2.1 –4.4 –13.3 –19.9 Other 3 .............................. 13 5.4 3.7 0.2 13.0 5.3 –26.1 –17.9
Industrial equipment ............. 14 1.4 –4.2 0.8 –3.6 –8.8 –14.7 –47.4 Transportation equipment ..... 15 –12.6 –28.6 –14.0 –46.6 –44.7 –70.0 –74.6 Other equipment 4 ................ 16 –5.2 –1.4 –12.5 –3.2 18.0 –23.0 –33.2
Residential................................... 17 –17.9 –20.8 –25.1 –13.3 –16.0 –22.8 –38.7 Structures................................ 18 –18.1 –21.0 –25.4 –13.7 –16.0 –22.9 –39.2
Permanent site...................... 19 –25.8 –32.1 –40.8 –23.2 –24.2 –38.0 –60.4 Single family ..................... 20 –27.4 –36.5 –46.2 –30.7 –30.4 –42.2 –67.1 Multifamily......................... 21 –12.8 –4.9 –1.1 24.7 7.8 –19.3 –28.1
Other structures 5 ................. 22 –5.3 –6.6 –3.6 –3.1 –7.6 –7.1 –16.2 Equipment ...............................
Addenda: Private fixed investment in
23 –1.4 –3.8 –4.9 8.0 –17.4 –16.0 –8.6
structures.............................. Private fixed investment in
24 –7.1 –6.8 –10.4 1.6 –3.1 –15.6 –41.0
equipment and software ....... Private fixed investment in new
25 1.7 –3.0 –0.6 –4.9 –7.6 –28.0 –33.3
structures 6 ........................... 26 –6.3 –5.8 –10.1 2.1 –2.6 –15.0 –42.2 Nonresidential structures...... 27 12.7 11.2 8.5 18.3 9.6 –9.4 –42.3 Residential structures ........... 28 –18.4 –21.2 –26.9 –14.7 –16.9 –22.6 –42.0
1. Consists primarily of religious, educational, vocational, lodging, railroads, farm, and amusement and recreational structures, net purchases of used structures, and brokers’ commissions on the sale of structures.
2. Excludes software “embedded,” or bundled, in computers and other equipment. 3. Includes communication equipment, nonmedical instruments, medical equipment and instruments, photocopy and
related equipment, and office and accounting equipment. 4. Consists primarily of furniture and fixtures, agricultural machinery, construction machinery, mining and oilfield
machinery, service industry machinery, and electrical equipment not elsewhere classified. 5. Consists primarily of manufactured homes, improvements, dormitories, net purchases of used structures, and
brokers’ commissions on the sale of residential structures. 6. Excludes net purchases of used structures and brokers’ commissions on the sale of structures.

D–38 National Data June 2009
Table 5.3.2. Contributions to Percent Change in Real Private Fixed Table 5.3.3. Real Private Fixed Investment by Type, Quantity Indexes Investment by Type [Index numbers, 2000=100]
Line 2007 2008
Seasonally adjusted at annual rates
2008 2009
I II III IV I
Percent change at annual rate: Private fixed investment ....
Percentage points at annual rates:
1 –3.1 –5.0 –5.6 –1.7 –5.3 –22.0 –37.3
Nonresidential ............................ 2 3.20 1.12 1.77 1.84 –1.27 –16.71 –28.57 Structures ............................... 3 2.43 2.55 2.04 4.36 2.50 –2.50 –12.71
Commercial and health care 4 0.59 –0.03 –0.32 0.02 –0.80 –1.98 –2.77 Manufacturing....................... 5 0.18 0.62 0.22 1.79 0.37 0.28 1.30 Power and communication ... Mining exploration, shafts,
6 0.52 0.43 0.70 0.02 0.24 –0.07 –1.05
and wells .......................... 7 0.46 0.96 0.84 1.72 2.60 0.19 –8.67 Other structures 1................. 8 0.67 0.57 0.59 0.81 0.10 –0.91 –1.51
Equipment and software........ Information processing
9 0.78 –1.43 –0.27 –2.52 –3.78 –14.21 –15.86
equipment and software ... Computers and peripheral
10 2.10 1.14 1.77 2.01 –1.12 –6.04 –4.29
equipment .................... 11 0.70 0.30 0.68 0.56 –1.13 –1.80 –0.44 Software 2 ........................ 12 0.94 0.51 1.07 0.24 –0.52 –1.50 –2.19 Other 3.............................. 13 0.47 0.34 0.02 1.20 0.53 –2.74 –1.66
Industrial equipment............. 14 0.12 –0.37 0.07 –0.32 –0.81 –1.26 –4.54 Transportation equipment..... 15 –1.03 –2.09 –1.04 –3.95 –3.21 –4.89 –4.13 Other equipment 4 ................ 16 –0.41 –0.11 –1.07 –0.26 1.37 –2.02 –2.91
Residential .................................. 17 –6.25 –6.08 –7.40 –3.53 –4.05 –5.25 –8.77 Structures ............................... 18 –6.25 –6.06 –7.38 –3.57 –3.97 –5.18 –8.73
Permanent site ..................... 19 –5.56 –5.24 –6.94 –3.19 –3.03 –4.39 –6.96 Single family ..................... 20 –5.24 –5.13 –6.92 –3.66 –3.20 –3.97 –6.38 Multifamily ........................ 21 –0.32 –0.11 –0.02 0.47 0.17 –0.42 –0.58
Other structures 5................. 22 –0.69 –0.82 –0.44 –0.38 –0.94 –0.79 –1.77 Equipment ...............................
Addenda: Private fixed investment in
23 –0.01 –0.02 –0.02 0.03 –0.08 –0.07 –0.03
structures.............................. Private fixed investment in
24 –3.82 –3.51 –5.34 0.80 –1.47 –7.67 –21.44
equipment and software ....... Private fixed investment in new
25 0.77 –1.44 –0.29 –2.49 –3.86 –14.28 –15.90
structures 6........................... 26 –3.09 –2.76 –4.85 0.99 –1.14 –6.90 –20.91 Nonresidential structures...... 27 2.42 2.53 2.02 4.33 2.48 –2.50 –12.67 Residential structures........... 28 –5.51 –5.29 –6.86 –3.34 –3.63 –4.40 –8.24
1. Consists primarily of religious, educational, vocational, lodging, railroads, farm, and amusement and recreational structures, net purchases of used structures, and brokers’ commissions on the sale of structures.
2. Excludes software “embedded,” or bundled, in computers and other equipment. 3. Includes communication equipment, nonmedical instruments, medical equipment and instruments, photocopy and
related equipment, and office and accounting equipment. 4. Consists primarily of furniture and fixtures, agricultural machinery, construction machinery, mining and oilfield machinery,
service industry machinery, and electrical equipment not elsewhere classified. 5. Consists primarily of manufactured homes, improvements, dormitories, net purchases of used structures, and brokers’
commissions on the sale of residential structures. 6. Excludes net purchases of used structures and brokers’ commissions on the sale of structures.
Line 2007 2008
Seasonally adjusted
2008 2009
I II III IV I
Private fixed investment..... 1 107.717 102.375 104.969 104.522 103.102 96.907 86.222 Nonresidential............................. 2 112.244 114.069 115.504 116.212 115.714 108.847 96.998
Structures................................ 3 97.264 108.180 104.206 108.716 111.257 108.543 94.591 Commercial and health care 4 87.048 86.797 89.086 89.133 87.099 81.869 74.532 Manufacturing ....................... 5 75.083 104.671 86.364 107.059 111.222 114.039 125.243 Power and communication.... Mining exploration, shafts,
6 92.881 106.508 105.666 105.804 107.551 107.009 99.067
and wells........................... 7 163.896 191.904 173.291 185.600 203.757 204.968 140.251 Other structures 1 ................. 8 95.505 107.895 105.677 109.978 110.490 105.434 96.972
Equipment and software ........ Information processing
9 117.412 113.939 118.470 116.961 114.709 105.616 95.374
equipment and software ... Computers and peripheral
10 139.842 146.477 147.465 150.324 148.727 139.394 132.635
equipment..................... 11 230.472 245.458 254.682 262.580 246.464 218.104 210.927 Software 2......................... 12 134.548 140.988 142.463 143.201 141.617 136.672 129.296 Other 3 .............................. 13 114.710 118.992 117.698 121.342 122.931 113.997 108.517
Industrial equipment ............. 14 97.805 93.709 96.369 95.494 93.311 89.664 76.365 Transportation equipment ..... 15 86.683 61.933 78.949 67.497 58.204 43.082 30.597 Other equipment 4 ................ 16 113.095 111.517 111.679 110.767 115.457 108.163 97.767
Residential................................... 17 101.534 80.436 85.698 82.692 79.154 74.201 65.661 Structures................................ 18 101.216 79.919 85.216 82.144 78.634 73.683 65.061
Permanent site...................... 19 93.247 63.283 70.609 66.108 61.683 54.732 43.407 Single family ..................... 20 90.399 57.433 66.172 60.369 55.132 48.062 36.400 Multifamily......................... 21 117.306 111.558 107.427 113.512 115.667 109.627 100.948
Other structures 5 ................. 22 114.250 106.707 108.883 108.043 105.916 103.987 99.486 Equipment ...............................
Addenda: Private fixed investment in
23 128.580 123.664 126.133 128.573 122.582 117.368 114.769
structures.............................. Private fixed investment in
24 100.474 93.621 94.690 95.063 94.327 90.404 79.232
equipment and software ....... Private fixed investment in new
25 117.501 114.017 118.530 117.055 114.771 105.711 95.534
structures 6 ........................... 26 98.988 93.267 94.142 94.638 94.021 90.267 78.711 Nonresidential structures...... 27 97.241 108.100 104.159 108.637 111.163 108.443 94.520 Residential structures ........... 28 98.884 77.930 83.356 80.114 76.502 71.748 62.605
1. Consists primarily of religious, educational, vocational, lodging, railroads, farm, and amusement and recreational structures, net purchases of used structures, and brokers’ commissions on the sale of structures.
2. Excludes software “embedded,” or bundled, in computers and other equipment. 3. Includes communication equipment, nonmedical instruments, medical equipment and instruments, photocopy and
related equipment, and office and accounting equipment. 4. Consists primarily of furniture and fixtures, agricultural machinery, construction machinery, mining and oilfield machinery,
service industry machinery, and electrical equipment not elsewhere classified. 5. Consists primarily of manufactured homes, improvements, dormitories, net purchases of used structures, and brokers’
commissions on the sale of residential structures. 6. Excludes net purchases of used structures and brokers’ commissions on the sale of structures.

June 2009 SURVEY OF CURRENT BUSINESS D–39
Table 5.3.4. Price Indexes for Private Fixed Investment by Type Table 5.3.5. Private Fixed Investment by Type [Index numbers, 2000=100] [Billions of dollars]
Line 2007 2008
Seasonally adjusted
2008 2009
I II III IV I
Private fixed investment .... 1 117.995 118.727 118.117 118.353 119.037 119.400 118.819 Nonresidential............................. 2 108.739 110.513 109.177 109.788 110.913 112.174 111.849
Structures ............................... 3 157.662 163.298 160.182 161.496 164.285 167.229 165.867 Commercial and health care 4 145.646 150.290 148.729 149.067 150.169 153.193 153.580 Manufacturing....................... 5 138.106 145.257 141.573 142.078 145.475 151.902 154.106 Power and communication ... Mining exploration, shafts,
6 143.206 152.463 146.941 149.897 154.762 158.251 157.739
and wells .......................... 7 265.158 273.096 265.221 269.548 277.090 280.525 269.266 Other structures 1................. 8 138.742 141.870 140.978 141.296 142.169 143.036 142.899
Equipment and software........ Information processing
9 94.870 95.485 94.700 95.101 95.710 96.431 96.454
equipment and software ... Computers and peripheral
10 79.170 78.219 78.245 78.370 78.293 77.967 77.450
equipment .................... 11 40.062 35.967 37.024 36.297 35.608 34.940 33.960 Software 2 ........................ 12 95.888 96.820 96.339 96.976 97.196 96.767 96.359 Other 3.............................. 13 90.278 90.930 90.345 90.863 91.160 91.353 91.259
Industrial equipment ............. 14 115.968 121.111 118.620 120.525 122.615 122.685 122.485 Transportation equipment..... 15 112.762 112.881 111.871 111.849 112.692 115.113 120.727 Other equipment 4 ................ 16 113.222 116.771 114.175 114.579 116.616 121.714 122.086
Residential .................................. 17 138.884 135.587 137.900 136.687 135.535 132.226 130.687 Structures ............................... 18 139.508 136.130 138.512 137.276 136.061 132.669 131.078
Permanent site ..................... 19 142.989 137.116 140.827 138.467 136.207 132.964 132.474 Single family ..................... 20 142.573 136.529 140.224 137.874 135.624 132.394 131.907 Multifamily ........................ 21 145.435 140.223 144.018 141.605 139.293 135.977 135.476
Other structures 5................. 22 134.056 133.263 134.364 134.220 133.968 130.502 128.133 Equipment ...............................
Addenda: Private fixed investment in
23 100.892 101.054 100.461 100.246 101.678 101.829 102.277
structures.............................. Private fixed investment in
24 145.566 146.431 146.120 146.097 146.842 146.667 145.228
equipment and software ....... Private fixed investment in new
25 94.921 95.533 94.750 95.145 95.761 96.477 96.504
structures 6........................... 26 147.387 148.716 148.062 148.255 149.270 149.275 148.041 Nonresidential structures...... 27 158.055 163.745 160.603 161.927 164.739 167.712 166.344 Residential structures........... 28 141.150 137.989 140.117 139.124 138.138 134.576 133.441
Line 2007 2008
Seasonally adjusted at annual rates
2008 2009
I II III IV I
Private fixed investment..... 1 2,134.0 2,040.5 2,081.7 2,077.0 2,060.6 1,942.7 1,720.1 Nonresidential ............................. 2 1,503.8 1,552.8 1,553.6 1,571.9 1,581.2 1,504.3 1,336.6
Structures ................................ 3 480.3 553.4 522.7 549.8 572.4 568.4 491.3 Commercial and health care 4 174.4 179.3 182.2 182.7 179.9 172.5 157.4 Manufacturing ....................... 5 33.0 48.4 38.9 48.4 51.5 55.1 61.4 Power and communication.... Mining exploration, shafts,
6 62.3 76.0 72.6 74.2 77.9 79.2 73.1
and wells........................... 7 118.1 142.7 125.0 136.1 153.5 156.4 102.7 Other structures 1 ................. 8 92.6 106.9 104.0 108.5 109.7 105.3 96.7
Equipment and software ........ Information processing
9 1,023.5 999.4 1,030.9 1,022.1 1,008.8 935.8 845.3
equipment and software ... Computers and peripheral
10 517.7 535.8 539.6 550.9 544.5 508.2 480.4
equipment..................... 11 93.7 89.8 95.8 96.8 89.2 77.4 72.8 Software 2......................... 12 227.3 240.5 241.8 244.6 242.5 233.0 219.5 Other 3 .............................. 13 196.8 205.5 202.0 209.5 212.9 197.8 188.1
Industrial equipment ............. 14 180.6 180.6 182.0 183.2 182.2 175.1 148.9 Transportation equipment ..... 15 157.2 112.2 142.1 121.4 105.5 79.8 59.4 Other equipment 4 ................ 16 168.0 170.8 167.3 166.5 176.6 172.7 156.6
Residential................................... 17 630.2 487.7 528.1 505.0 479.4 438.4 383.4 Structures ................................ 18 620.7 478.5 518.7 495.6 470.2 429.6 374.8
Permanent site...................... 19 353.4 230.3 263.4 242.5 222.6 192.8 152.3 Single family ..................... 20 305.2 186.1 219.7 197.1 177.1 150.7 113.7 Multifamily......................... 21 48.2 44.2 43.7 45.4 45.5 42.1 38.6
Other structures 5 ................. 22 267.3 248.2 255.3 253.1 247.6 236.8 222.4 Equipment ...............................
Addenda: Private fixed investment in
23 9.5 9.2 9.3 9.5 9.2 8.8 8.6
structures.............................. Private fixed investment in
24 1,100.9 1,031.9 1,041.5 1,045.4 1,042.6 998.0 866.1
equipment and software ....... Private fixed investment in new
25 1,033.1 1,008.6 1,040.2 1,031.6 1,018.0 944.6 853.9
structures 6 ........................... 26 1,017.1 966.9 971.7 978.1 978.4 939.3 812.3 Nonresidential structures...... 27 479.7 552.6 522.1 549.1 571.6 567.7 490.7 Residential structures ........... 28 537.4 414.3 449.6 429.0 406.8 371.7 321.6
1. Consists primarily of religious, educational, vocational, lodging, railroads, farm, and amusement and recreational structures, net purchases of used structures, and brokers’ commissions on the sale of structures.
2. Excludes software “embedded,” or bundled, in computers and other equipment. 3. Includes communication equipment, nonmedical instruments, medical equipment and instruments, photocopy and
related equipment, and office and accounting equipment. 4. Consists primarily of furniture and fixtures, agricultural machinery, construction machinery, mining and oilfield machinery,
service industry machinery, and electrical equipment not elsewhere classified. 5. Consists primarily of manufactured homes, improvements, dormitories, net purchases of used structures, and brokers’
commissions on the sale of residential structures. 6. Excludes net purchases of used structures and brokers’ commissions on the sale of structures.

D–40 National Data June 2009
Table 5.3.6. Real Private Fixed Investment by Type, Chained Dollars Table 5.6.5B. Change in Private Inventories by Industry [Billions of chained (2000) dollars] [Billions of dollars]
Line 2007 2008
Seasonally adjusted at annual rates
2008 2009
I II III IV I
Private fixed investment .... 1 1,808.5 1,718.9 1,762.4 1,754.9 1,731.1 1,627.0 1,447.6 Nonresidential ............................ 2 1,382.9 1,405.4 1,423.1 1,431.8 1,425.7 1,341.1 1,195.1
Structures ............................... 3 304.6 338.8 326.4 340.5 348.4 339.9 296.2 Commercial and health care 4 119.7 119.4 122.5 122.6 119.8 112.6 102.5 Manufacturing....................... 5 23.9 33.3 27.5 34.0 35.4 36.3 39.8 Power and communication ... Mining exploration, shafts,
6 43.5 49.9 49.5 49.5 50.3 50.1 46.4
and wells .......................... 7 44.5 52.1 47.1 50.4 55.4 55.7 38.1 Other structures 1................. 8 66.7 75.4 73.8 76.8 77.2 73.7 67.7
Equipment and software........ Information processing
9 1,078.9 1,047.0 1,088.6 1,074.7 1,054.0 970.5 876.4
equipment and software ... Computers and peripheral
10 653.9 685.0 689.6 702.9 695.5 651.8 620.2
equipment 2.................. 11 ............. ............. ............. ............. ............. ............. ............. Software 3 ........................ 12 237.0 248.4 251.0 252.3 249.5 240.8 227.8 Other 4.............................. 13 218.0 226.1 223.6 230.6 233.6 216.6 206.2
Industrial equipment............. 14 155.7 149.2 153.4 152.0 148.6 142.8 121.6 Transportation equipment..... 15 139.4 99.6 127.0 108.6 93.6 69.3 49.2 Other equipment 5 ................ 16 148.4 146.3 146.5 145.3 151.5 141.9 128.3
Residential .................................. 17 453.8 359.5 383.0 369.6 353.7 331.6 293.4 Structures ............................... 18 444.9 351.3 374.6 361.1 345.6 323.9 286.0
Permanent site ..................... 19 247.1 167.7 187.1 175.2 163.5 145.1 115.0 Single family ..................... 20 214.1 136.0 156.7 142.9 130.5 113.8 86.2 Multifamily ........................ 21 33.1 31.5 30.4 32.1 32.7 31.0 28.5
Other structures 6................. 22 199.4 186.2 190.0 188.5 184.8 181.5 173.6 Equipment ............................... 23 9.5 9.1 9.3 9.5 9.0 8.6 8.4
Residual ....................................... Addenda:
Private fixed investment in
24 –78.2 –92.6 –104.3 –106.6 –90.8 –68.9 –90.7
structures.............................. Private fixed investment in
25 756.3 704.7 712.8 715.6 710.0 680.5 596.4
equipment and software ....... Private fixed investment in new
26 1,088.4 1,056.1 1,097.9 1,084.2 1,063.1 979.1 884.9
structures 7........................... 27 690.1 650.2 656.3 659.8 655.5 629.3 548.7 Nonresidential structures...... 28 303.5 337.4 325.1 339.1 347.0 338.5 295.0 Residential structures........... 29 380.7 300.0 320.9 308.4 294.5 276.2 241.0
1. Consists primarily of religious, educational, vocational, lodging, railroads, farm, and amusement and recreational structures, net purchases of used structures, and brokers’ commissions on the sale of structures.
2. The quantity index for computers can be used to accurately measure the real growth rate of this component. However, because computers exhibit rapid changes in prices relative to other prices in the economy, the chained-dollar estimates should not be used to measure the component’s relative importance or its contribution to the growth rate of more aggregate series; accurate estimates of these contributions are shown in table 5.3.2 and real growth rates are shown in table 5.3.1.
3. Excludes software “embedded,” or bundled, in computers and other equipment. 4. Includes communication equipment, nonmedical instruments, medical equipment and instruments, photocopy and
related equipment, and office and accounting equipment. 5. Consists primarily of furniture and fixtures, agricultural machinery, construction machinery, mining and oilfield
machinery, service industry machinery, and electrical equipment not elsewhere classified. 6. Consists primarily of manufactured homes, improvements, dormitories, net purchases of used structures, and
brokers’ commissions on the sale of residential structures. 7. Excludes net purchases of used structures and brokers’ commissions on the sale of structures. NOTE. Chained (2000) dollar series are calculated as the product of the chain-type quantity index and the 2000 current-
dollar value of the corresponding series, divided by 100. Because the formula for the chain-type quantity indexes uses weights of more than one period, the corresponding chained-dollar estimates are usually not additive. The residual line is the difference between the first line and the sum of the most detailed lines.
Line 2007 2008
Seasonally adjusted at annual rates
2008 2009
I II III IV I
Change in private inventories....................... 1 –3.6 –47.0 –25.6 –76.0 –49.7 –36.6 –121.4
Farm.............................................. 2 1.6 –2.4 0.2 –4.1 –4.2 –1.5 –0.3 Mining, utilities, and construction 3 –1.1 –14.0 –15.4 –14.4 –15.0 –11.1 –7.8 Manufacturing ............................... 4 –4.9 –12.3 18.1 –37.2 –38.7 8.6 –13.9
Durable goods industries .......... 5 –0.2 6.8 3.9 –19.7 –8.2 51.2 –12.6 Nondurable goods industries .... 6 –4.7 –19.1 14.2 –17.5 –30.6 –42.5 –1.4
Wholesale trade ............................ 7 3.6 –1.0 –8.0 2.1 5.6 –3.6 –48.3 Durable goods industries .......... 8 –1.7 5.7 6.4 2.8 23.6 –10.0 –58.4 Nondurable goods industries .... 9 5.4 –6.6 –14.4 –0.7 –18.0 6.5 10.1
Retail trade ................................... 10 –6.2 –17.2 –20.8 –18.3 4.0 –33.9 –51.3 Motor vehicle and parts dealers 11 –8.6 –6.9 –10.4 –13.1 5.2 –9.1 –38.8 Food and beverage stores ........ 12 0.9 0.6 0.4 0.8 1.2 –0.2 2.7 General merchandise stores..... 13 –0.5 –2.4 –3.1 0.1 –0.8 –5.8 –3.6 Other retail stores ..................... 14 2.0 –8.5 –7.7 –6.2 –1.5 –18.7 –11.6
Other industries ............................ Addenda:
15 3.3 –0.1 0.3 –4.2 –1.3 4.9 0.3
Change in private inventories ... 16 –3.6 –47.0 –25.6 –76.0 –49.7 –36.6 –121.4 Durable goods industries ...... 17 –10.2 –9.0 –7.2 –43.9 10.9 4.3 –118.4 Nondurable goods industries 18 6.5 –38.0 –18.4 –32.1 –60.5 –40.8 –3.0
Nonfarm industries.................... Nonfarm change in book
19 –5.2 –44.6 –25.8 –71.9 –45.5 –35.0 –121.0
value 1 .............................. Nonfarm inventory valuation
20 54.4 10.6 111.0 124.9 51.2 –244.7 –254.5
adjustment 2 ..................... 21 –59.6 –55.2 –136.8 –196.8 –96.7 209.7 133.5 Wholesale trade........................ 22 3.6 –1.0 –8.0 2.1 5.6 –3.6 –48.3
Merchant wholesale trade..... 23 5.9 8.6 –2.1 12.8 21.6 2.2 –38.3 Durable goods industries Nondurable goods
24 –1.2 11.6 14.6 11.6 29.0 –8.9 –47.9
industries ...................... Nonmerchant wholesale
25 7.1 –2.9 –16.7 1.2 –7.4 11.2 9.6
trade ................................. 26 –2.3 –9.6 –5.9 –10.7 –16.0 –5.8 –10.0
1. This series is derived from the Census Bureau series “current cost inventories.” 2. The inventory valuation adjustment (IVA) shown in this table differs from the IVA that adjusts business incomes. The
IVA in this table reflects the mix of methods (such as first-in, first-out and last-in, first-out) underlying inventories derived primarily from Census Bureau statistics (see footnote 1). This mix differs from that underlying business income derived primarily from Internal Revenue Service statistics.
NOTE. Estimates in this table are based on the North American Industry Classification System (NAICS).
Table 5.6.6B. Real Change in Private Inventories by Industry, Chained Dollars
[Billions of chained (2000) dollars]
Line 2007 2008
Seasonally adjusted at annual rates
2008 2009
I II III IV I
Change in private inventories....................... 1 –2.5 –29.0 –10.2 –50.6 –29.6 –25.8 –91.4
Farm.............................................. 2 1.0 3.6 6.0 2.4 2.2 3.7 4.9 Mining, utilities, and construction 3 –0.6 –8.0 –9.4 –8.0 –8.0 –6.6 –5.2 Manufacturing ............................... 4 –3.5 –9.6 13.7 –26.0 –25.6 –0.7 –11.2
Durable goods industries .......... 5 0.0 5.6 3.0 –14.4 –5.7 39.7 –10.3 Nondurable goods industries .... 6 –3.2 –13.5 9.7 –11.3 –18.0 –34.5 –1.3
Wholesale trade ............................ 7 3.2 –0.3 –5.1 1.0 4.2 –1.5 –39.1 Durable goods industries .......... 8 –1.5 4.7 5.6 2.3 19.7 –8.8 –51.3 Nondurable goods industries .... 9 4.0 –3.6 –8.4 –0.8 –10.8 5.6 7.5
Retail trade ................................... 10 –5.6 –14.8 –18.5 –16.0 3.5 –28.2 –45.8 Motor vehicle and parts dealers 11 –8.6 –6.8 –10.3 –13.0 5.1 –9.1 –38.9 Food and beverage stores ........ 12 0.7 0.4 0.3 0.6 0.9 –0.2 2.1 General merchandise stores..... 13 –0.4 –2.1 –2.8 0.1 –0.7 –5.1 –3.2 Other retail stores ..................... 14 1.8 –6.7 –6.5 –5.1 –1.2 –14.0 –9.8
Other industries ............................ 15 3.0 0.3 0.3 –3.4 –1.0 5.4 0.5 Residual........................................ 16 1.3 –2.9 2.3 0.0 –12.1 –1.9 13.6 Addenda:
Change in private inventories ... 17 –2.5 –29.0 –10.2 –50.6 –29.6 –25.8 –91.4 Durable goods industries ...... 18 –8.7 –7.2 –6.1 –36.1 9.3 3.9 –103.2 Nondurable goods industries 19 5.3 –20.6 –4.3 –16.9 –34.3 –27.0 3.7
Nonfarm industries.................... 20 –3.7 –34.3 –17.9 –55.1 –33.3 –31.1 –99.0 Wholesale trade........................ 21 3.2 –0.3 –5.1 1.0 4.2 –1.5 –39.1
Merchant wholesale trade..... 22 5.2 7.4 –0.5 9.6 16.2 4.4 –31.1 Durable goods industries 23 –1.0 9.7 12.8 9.8 24.1 –7.7 –42.0 Nondurable goods
industries ...................... 24 5.5 –1.0 –10.3 0.8 –4.6 10.1 7.1 Nonmerchant wholesale
trade ................................. 25 –1.8 –6.8 –4.1 –7.4 –10.2 –5.4 –8.1
NOTE. Estimates in this table are based on the North American Industry Classification System (NAICS). Chained (2000) dollar series for real change in private inventories are calculated as the period-to-period change in
chained-dollar end-of-period inventories. Quarterly changes in end-of-period inventories are stated at annual rates. Because the formula for the chain-type quantity indexes uses weights of more than one period, the corresponding chained-dollar estimates are usually not additive. The residual line is the difference between the first line and the sum of the most detailed lines.

June 2009 SURVEY OF CURRENT BUSINESS D–41
Table 5.7.5B. Private Inventories and Domestic Final Sales by Industry [Billions of dollars]
Line
Seasonally adjusted quarterly totals
2008 2009
I II III IV I
Private inventories 1............................................ 1 2,178.2 2,264.4 2,233.8 2,041.6 1,969.6 Farm .............................................................................. 2 220.2 235.1 227.0 202.4 196.1 Mining, utilities, and construction................................... 3 95.2 103.5 98.9 80.7 72.4 Manufacturing................................................................ 4 661.9 697.2 677.8 600.5 581.8
Durable goods industries........................................... 5 373.4 389.9 387.4 367.9 354.9 Nondurable goods industries..................................... 6 288.5 307.3 290.4 232.6 226.9
Wholesale trade............................................................. 7 531.2 552.3 546.4 499.3 481.1 Durable goods industries........................................... 8 286.6 295.3 302.5 288.0 270.1 Nondurable goods industries..................................... 9 244.5 256.9 243.9 211.4 211.1
Retail trade .................................................................... 10 518.4 522.4 527.0 506.7 491.1 Motor vehicle and parts dealers ................................ 11 150.8 147.9 149.7 145.8 134.6 Food and beverage stores......................................... 12 43.2 44.6 45.3 44.2 44.3 General merchandise stores ..................................... 13 81.6 82.8 83.5 81.7 80.7 Other retail stores...................................................... 14 242.9 247.1 248.4 235.0 231.5
Other industries ............................................................. Addenda:
15 151.4 153.9 156.7 152.0 147.1
Private inventories ..................................................... 16 2,178.2 2,264.4 2,233.8 2,041.6 1,969.6 Durable goods industries....................................... 17 927.0 949.7 956.7 909.6 863.8 Nondurable goods industries................................. 18 1,251.2 1,314.7 1,277.1 1,132.1 1,105.9
Nonfarm industries .................................................... 19 1,958.0 2,029.3 2,006.8 1,839.2 1,773.5 Wholesale trade ........................................................ 20 531.2 552.3 546.4 499.3 481.1
Merchant wholesale trade ..................................... 21 456.9 475.5 476.1 443.5 429.4 Durable goods industries................................... 22 254.4 264.5 272.8 259.6 244.6 Nondurable goods industries............................. 23 202.5 211.0 203.3 183.9 184.8
Nonmerchant wholesale trade............................... 24 74.3 76.8 70.3 55.8 51.7 Final sales of domestic business 2.................... Final sales of goods and structures of
25 804.1 813.7 814.4 797.4 794.8
domestic business 2 ....................................... Ratios of private inventories to final sales of
domestic business:
26 476.4 481.1 479.2 460.9 457.1
Private inventories to final sales ................................ 27 2.71 2.78 2.74 2.56 2.48 Nonfarm inventories to final sales ............................. Nonfarm inventories to final sales of goods and
28 2.44 2.49 2.46 2.31 2.23
structures............................................................... 29 4.11 4.22 4.19 3.99 3.88
1. Inventories are as of the end of the quarter. The quarter-to-quarter change in inventories calculated from current-dollar inventories in this table is not the current-dollar change in private inventories component of GDP. The former is the difference between two inventory stocks, each valued at its respective end-of-quarter prices. The latter is the change in the physical volume of inventories valued at average prices of the quarter. In addition, changes calculated from this table are at quarterly rates, whereas, the change in private inventories is stated at annual rates.
2. Quarterly totals at monthly rates. Final sales of domestic business equals final sales of domestic product less gross output of general government, gross value added of nonprofit institutions, compensation paid to domestic workers, and space rent for owner-occupied housing. It includes a small amount of final sales by farm and by government enterprises.
NOTE. Estimates in this table are based on the North American Industry Classification System (NAICS).
Table 5.7.9B. Implicit Price Deflators for Private Inventories by Industry [Index numbers, 2000=100]
Table 5.7.6B. Real Private Inventories and Real Domestic Final Sales by Industry, Chained Dollars
[Billions of chained (2000) dollars]
Line
Seasonally adjusted quarterly totals
2008 2009
I II III IV I
Private inventories 1 ........................................... 1 1,646.2 1,633.6 1,626.2 1,619.7 1,596.9 Farm.............................................................................. 2 129.8 130.4 130.9 131.9 133.1 Mining, utilities, and construction.................................. 3 57.8 55.8 53.8 52.2 50.9 Manufacturing ............................................................... 4 467.0 460.5 454.1 453.9 451.1
Durable goods industries .......................................... 5 287.1 283.5 282.1 292.0 289.4 Nondurable goods industries .................................... 6 180.3 177.5 173.0 164.3 164.0
Wholesale trade ............................................................ 7 400.3 400.5 401.6 401.2 391.5 Durable goods industries .......................................... 8 247.2 247.8 252.7 250.5 237.7 Nondurable goods industries .................................... 9 153.8 153.6 150.9 152.3 154.2
Retail trade ................................................................... 10 461.8 457.8 458.7 451.6 440.2 Motor vehicle and parts dealers................................ 11 149.9 146.7 147.9 145.7 135.9 Food and beverage stores ........................................ 12 33.4 33.6 33.8 33.8 34.3 General merchandise stores..................................... 13 72.6 72.6 72.4 71.2 70.4 Other retail stores ..................................................... 14 204.8 203.6 203.3 199.8 197.3
Other industries ............................................................ 15 127.6 126.8 126.5 127.9 128.0 Residual........................................................................ Addenda:
16 1.9 1.7 –1.1 –1.9 1.7
Private inventories .................................................... 17 1,646.2 1,633.6 1,626.2 1,619.7 1,596.9 Durable goods industries ...................................... 18 787.5 778.5 780.8 781.8 756.0 Nondurable goods industries ................................ 19 859.6 855.4 846.8 840.0 841.0
Nonfarm industries.................................................... 20 1,516.9 1,503.2 1,494.8 1,487.1 1,462.3 Wholesale trade........................................................ 21 400.3 400.5 401.6 401.2 391.5
Merchant wholesale trade..................................... 22 350.2 352.6 356.7 357.8 350.0 Durable goods industries .................................. 23 218.7 221.1 227.1 225.2 214.7 Nondurable goods industries ............................ 24 132.2 132.4 131.3 133.8 135.6
Nonmerchant wholesale trade .............................. 25 50.4 48.5 45.9 44.6 42.6 Final sales of domestic business 2 ................... Final sales of goods and structures of
26 693.4 702.8 696.1 678.5 669.9
domestic business 2....................................... Ratios of private inventories to final sales of
domestic business:
27 426.5 435.3 429.2 408.9 399.3
Private inventories to final sales ................................... 28 2.37 2.32 2.34 2.39 2.38 Nonfarm inventories to final sales................................. Nonfarm inventories to final sales of goods and
29 2.19 2.14 2.15 2.19 2.18
structures .................................................................. 30 3.56 3.45 3.48 3.64 3.66
1. Inventories are as of the end of the quarter. The quarter-to-quarter changes calculated from this table are at quarterly rates, whereas the change in private inventories component of GDP is stated at annual rates.
2. Quarterly totals at monthly rates. Final sales of domestic business equals final sales of domestic product less gross output of general government, gross value added of nonprofit institutions, compensation paid to domestic workers, and space rent for owner-occupied housing. It includes a small amount of final sales by farm and by government enterprises.
NOTE. Estimates in this table are based on the North American Industry Classification System (NAICS). Chained (2000) dollar inventory series are calculated to ensure that the chained (2000) dollar change in inventories for
2000 equals the current-dollar change in inventories for 2000 and that the average of the 1999 and 2000 end-of-year chain-weighted and fixed-weighted inventories are equal.
Line
Seasonally adjusted
2008 2009
I II III IV I
Private inventories 1............................................ 1 132.316 138.617 137.369 126.047 123.343 Farm .............................................................................. 2 169.647 180.322 173.373 153.495 147.350 Mining, utilities, and construction................................... 3 164.593 185.324 183.703 154.770 142.293 Manufacturing................................................................ 4 141.740 151.408 149.268 132.281 128.963
Durable goods industries........................................... 5 130.063 137.523 137.343 125.972 122.609 Nondurable goods industries..................................... 6 160.029 173.197 167.903 141.546 138.356
Wholesale trade............................................................. 7 132.696 137.889 136.069 124.452 122.911 Durable goods industries........................................... 8 115.925 119.176 119.684 114.935 113.607 Nondurable goods industries..................................... 9 158.996 167.290 161.660 138.785 136.914
Retail trade .................................................................... 10 112.258 114.119 114.900 112.199 111.568 Motor vehicle and parts dealers ................................ 11 100.562 100.856 101.212 100.075 99.049 Food and beverage stores......................................... 12 129.248 132.804 133.924 130.966 129.076 General merchandise stores ..................................... 13 112.391 114.066 115.354 114.844 114.718 Other retail stores...................................................... 14 118.560 121.357 122.215 117.624 117.304
Other industries ............................................................. 15 118.630 121.371 123.845 118.847 114.954 Addenda:
Private inventories ..................................................... 16 132.316 138.617 137.369 126.047 123.343 Durable goods industries....................................... 17 117.709 121.997 122.529 116.343 114.255 Nondurable goods industries................................. 18 145.562 153.697 150.821 134.761 131.497
Nonfarm industries .................................................... 19 129.077 135.001 134.250 123.678 121.281 Wholesale trade ........................................................ 20 132.696 137.889 136.069 124.452 122.911
Merchant wholesale trade ..................................... 21 130.449 134.838 133.482 123.955 122.677 Durable goods industries................................... 22 116.338 119.620 120.111 115.290 113.939 Nondurable goods industries............................. 23 153.162 159.365 154.883 137.441 136.288
Nonmerchant wholesale trade............................... 24 147.483 158.353 153.079 125.210 121.577
1. Implicit price deflators are as of the end of the quarter and are consistent with inventory stocks. NOTE. Estimates in this table are based on the North American Industry Classification System (NAICS).

D–42 National Data June 2009
6. Income and Employment by Industry
Table 6.1D. National Income Without Capital Consumption Adjustment by Industry [Billions of dollars]
Line 2007 2008
Seasonally adjusted at annual rates
2008 2009
I II III IV I
National income without capital consumption adjustment ................................................. 1 12,362.4 12,346.8 12,347.7 12,379.0 12,433.7 12,227.0 12,244.7 Domestic industries ............................................................................................................................. 2 12,260.0 12,213.6 12,209.5 12,265.1 12,306.9 12,073.0 12,096.1
Private industries ............................................................................................................................. 3 10,806.5 10,686.0 10,708.7 10,745.6 10,767.8 10,522.0 10,518.8 Agriculture, forestry, fishing, and hunting ....................................................................................... 4 117.4 106.9 113.5 110.1 104.0 99.8 ................. Mining ............................................................................................................................................ 5 204.9 231.6 216.3 226.1 242.7 241.2 ................. Utilities ........................................................................................................................................... 6 216.3 216.3 207.1 218.5 219.5 220.2 ................. Construction................................................................................................................................... 7 563.5 519.2 527.4 522.9 516.0 510.4 ................. Manufacturing ................................................................................................................................ 8 1,489.6 1,415.4 1,419.7 1,397.2 1,448.9 1,396.0 .................
Durable goods............................................................................................................................ 9 839.8 780.1 800.0 769.4 780.7 770.6 ................. Nondurable goods...................................................................................................................... 10 649.8 635.3 619.8 627.9 668.2 625.4 .................
Wholesale trade ............................................................................................................................. 11 765.2 755.2 723.8 739.5 776.3 781.2 ................. Retail trade..................................................................................................................................... 12 908.0 870.7 892.8 877.6 866.9 845.4 ................. Transportation and warehousing .................................................................................................... 13 361.5 342.8 343.8 342.0 342.1 343.3 ................. Information ..................................................................................................................................... 14 463.4 464.3 465.9 478.0 469.9 443.3 ................. Finance, insurance, real estate, rental, and leasing....................................................................... 15 2,193.0 2,120.4 2,165.9 2,175.2 2,095.4 2,045.2 ................. Professional and business services 1 ............................................................................................ 16 1,717.3 1,768.6 1,788.9 1,786.0 1,806.8 1,692.5 ................. Educational services, health care, and social assistance .............................................................. 17 1,060.1 1,119.6 1,096.9 1,110.9 1,119.4 1,151.2 ................. Arts, entertainment, recreation, accommodation, and food services............................................. 18 449.9 453.2 446.7 459.3 457.3 449.5 ................. Other services, except government ............................................................................................... 19 296.4 301.9 299.8 302.3 302.6 303.1 .................
Government ...................................................................................................................................... 20 1,453.6 1,527.6 1,500.7 1,519.5 1,539.1 1,551.0 1,577.4 Rest of the world .................................................................................................................................. 21 102.4 133.2 138.2 113.9 126.8 153.9 148.6
1. Consists of professional, scientific, and technical services; management of companies and enterprises; and administrative and waste management services. NOTE. Estimates in this table are based on the 1997 North American Industry Classification System (NAICS).
Table 6.16D. Corporate Profits by Industry [Billions of dollars]
Line 2007 2008
Seasonally adjusted at annual rates
2008 2009
I II III IV I
Corporate profits with inventory valuation and capital consumption adjustments .............. 1 1,642.4 1,476.5 1,593.5 1,533.3 1,514.8 1,264.5 1,307.1 Domestic industries ............................................................................................................................. 2 1,297.8 1,090.0 1,195.1 1,159.8 1,136.4 868.6 920.5
Financial 1 .......................................................................................................................................... 3 429.7 301.9 407.6 376.6 301.1 122.4 238.5 Nonfinancial ....................................................................................................................................... 4 868.1 788.0 787.4 783.2 835.3 746.2 682.0
Rest of the world .................................................................................................................................. 5 344.7 386.6 398.5 373.5 378.4 395.9 386.6 Receipts from the rest of the world .................................................................................................... 6 509.2 539.4 556.8 565.7 555.3 479.8 418.1 Less: Payments to the rest of the world ............................................................................................. 7 164.5 152.8 158.3 192.2 176.9 83.9 31.5
Corporate profits with inventory valuation adjustment............................................................ 8 1,835.1 1,548.2 1,641.5 1,596.0 1,602.8 1,352.6 1,452.0 Domestic industries ............................................................................................................................. 9 1,490.5 1,161.7 1,243.1 1,222.5 1,224.4 956.7 1,065.4
Financial............................................................................................................................................. 10 449.9 308.9 412.8 383.2 308.8 130.9 252.2 Federal Reserve banks .................................................................................................................. 11 37.7 35.5 35.8 31.0 34.4 41.0 28.7 Other financial 2 ............................................................................................................................. 12 412.2 273.4 377.1 352.2 274.3 89.9 223.5
Nonfinancial ....................................................................................................................................... 13 1,040.6 852.7 830.2 839.3 915.6 825.8 813.1 Utilities ........................................................................................................................................... 14 58.5 54.6 46.2 56.7 59.1 56.3 .................. Manufacturing ................................................................................................................................ 15 316.6 239.8 240.5 214.9 272.6 231.2 ..................
Durable goods............................................................................................................................ 16 127.4 69.0 85.5 54.2 68.4 67.9 .................. Fabricated metal products ..................................................................................................... 17 21.7 16.5 18.9 15.1 14.7 17.2 .................. Machinery .............................................................................................................................. 18 22.3 18.9 19.2 14.8 12.3 29.2 .................. Computer and electronic products ......................................................................................... 19 13.5 8.1 14.4 6.6 4.0 7.6 .................. Electrical equipment, appliances, and components............................................................... 20 10.9 6.1 6.9 5.9 5.6 6.2 .................. Motor vehicles, bodies and trailers, and parts ....................................................................... 21 –5.9 –23.9 –19.9 –27.4 –20.2 –28.0 .................. Other durable goods 3 ........................................................................................................... 22 64.9 43.3 46.1 39.3 52.0 35.8 ..................
Nondurable goods...................................................................................................................... 23 189.3 170.8 155.0 160.7 204.2 163.3 .................. Food and beverage and tobacco products............................................................................. 24 38.5 37.7 34.8 40.9 40.8 34.2 .................. Petroleum and coal products ................................................................................................. 25 66.9 61.3 48.8 36.6 92.0 67.7 .................. Chemical products ................................................................................................................. 26 66.4 66.4 60.2 78.5 70.8 56.1 .................. Other nondurable goods 4 ..................................................................................................... 27 17.5 5.4 11.1 4.7 0.6 5.3 ..................
Wholesale trade ............................................................................................................................. 28 102.6 76.5 49.2 59.4 92.1 105.2 .................. Retail trade..................................................................................................................................... 29 132.3 91.7 112.0 92.7 86.2 75.8 .................. Transportation and warehousing .................................................................................................... 30 42.7 24.7 24.4 24.8 25.2 24.4 .................. Information ..................................................................................................................................... 31 103.0 101.9 106.0 115.0 103.8 82.6 .................. Other nonfinancial 5 ....................................................................................................................... 32 284.9 263.7 252.0 275.8 276.6 250.4 ..................
Rest of the world .................................................................................................................................. 33 344.7 386.6 398.5 373.5 378.4 395.9 386.6
1. Consists of finance and insurance and bank and other holding companies. 2. Consists of credit intermediation and related activities; securities, commodity contracts, and other financial investments and related activities; insurance carriers and related activities; funds, trusts, and other finan
cial vehicles; and bank and other holding companies. 3. Consists of wood products; nonmetallic mineral products; primary metals; other transportation equipment; furniture and related products; and miscellaneous manufacturing. 4. Consists of textile mills and textile product mills; apparel; leather and allied products; paper products; printing and related support activities; and plastics and rubber products. 5. Consists of agriculture, forestry, fishing, and hunting; mining; construction; real estate and rental and leasing; professional, scientific, and technical services; administrative and waste management services; educa
tional services; health care and social assistance; arts, entertainment, and recreation; accommodation and food services; and other services, except government. NOTE. Estimates in this table are based on the 1997 North American Industry Classification System (NAICS).

June 2009 SURVEY OF CURRENT BUSINESS D–43
7. Supplemental Tables
Table 7.1. Selected Per Capita Product and Income Series in Table 7.2.1B. Percent Change from Preceding Period in Current and Chained Dollars Real Motor Vehicle Output
[Dollars] [Percent]
Line 2007 2008
Seasonally adjusted at annual rates
2008 2009
I II III IV I
Current dollars: Gross domestic product ........... 1 45,760 46,842 46,626 47,001 47,275 46,464 46,008 Gross national product ............. 2 46,100 47,279 47,081 47,376 47,691 46,968 46,493 Personal income....................... 3 38,654 39,736 39,409 39,957 39,920 39,656 39,382 Disposable personal income .... 4 33,706 34,950 34,351 35,531 35,096 34,821 35,213 Personal consumption
expenditures......................... 5 32,181 33,028 32,957 33,335 33,337 32,484 32,461 Durable goods ...................... 6 3,589 3,360 3,529 3,483 3,333 3,096 3,149 Nondurable goods ................ 7 9,389 9,737 9,722 9,951 9,986 9,289 9,135 Services ............................... 8 19,203 19,931 19,705 19,901 20,017 20,099 20,178
Chained (2000) dollars: Gross domestic product ........... 9 38,192 38,262 38,372 38,561 38,418 37,701 37,074 Gross national product ............. 10 38,476 38,624 38,751 38,872 38,762 38,115 37,475 Disposable personal income .... 11 28,648 28,745 28,560 29,234 28,525 28,657 29,053 Personal consumption
expenditures......................... 12 27,351 27,164 27,401 27,427 27,095 26,734 26,782 Durable goods ...................... 13 4,117 3,903 4,076 4,039 3,871 3,627 3,704 Nondurable goods ................ 14 7,929 7,810 7,901 7,960 7,794 7,586 7,560 Services ............................... 15 15,398 15,481 15,500 15,494 15,453 15,475 15,494
Population (midperiod, thousands) 16 301,737 304,529 303,498 304,128 304,872 305,619 306,245
Line 2007 2008
Seasonally adjusted at annual rates
2008 2009
I II III IV I
Motor vehicle output ...... 1 –1.1 –17.7 –14.2 –33.8 7.3 –62.8 –56.5 Auto output ................... 2 –1.8 –7.0 –3.9 –7.0 13.9 –67.8 –79.1 Truck output .................. 3 –0.7 –24.0 –20.2 –48.0 2.2 –58.1 –29.3
Final sales of domestic product Personal consumption
4 0.0 –17.8 –18.8 –35.9 –15.5 –54.1 21.9
expenditures ....................... 5 2.1 –14.9 –11.9 –23.0 –28.9 –41.7 27.3 New motor vehicles............... 6 0.9 –19.3 –20.9 –25.3 –35.0 –50.3 10.4
Autos................................. Light trucks (including
7 –3.8 –10.7 –10.4 23.4 –53.6 –58.3 –11.1
utility vehicles) .............. Net purchases of used autos
8 4.7 –25.5 –28.4 –53.0 –9.6 –42.0 31.3
and used light trucks......... 9 4.6 –6.3 8.1 –18.8 –17.0 –24.4 57.7 Used autos ....................... Used light trucks (including
10 –1.2 –9.2 9.3 –19.3 –23.8 –35.8 60.8
utility vehicles) .............. 11 10.2 –3.6 7.2 –18.4 –10.6 –13.3 55.3 Private fixed investment......... 12 –15.6 –32.1 –23.3 –56.1 –40.2 –80.1 –76.9
New motor vehicles............... 13 –6.7 –21.2 –17.0 –36.3 –23.3 –63.4 –65.0 Autos................................. 14 2.4 –14.3 –17.1 –14.8 –12.7 –69.2 –56.1 Trucks ...............................
Light trucks (including 15 –11.1 –25.0 –17.0 –46.7 –29.8 –58.8 –70.0
utility vehicles) .......... 16 –0.3 –25.7 –15.4 –55.4 –30.5 –69.2 –65.8 Other.............................
Net purchases of used autos 17 –36.7 –23.1 –23.5 5.0 –27.2 –6.6 –78.4
and used light trucks......... 18 13.5 –2.8 –5.9 6.6 2.5 –33.6 –50.5 Used autos ....................... Used light trucks (including
19 7.9 –0.9 13.6 7.3 8.9 –42.0 –47.6
utility vehicles) .............. Gross government
20 19.0 –4.4 –20.3 6.0 –3.1 –24.8 –53.0
investment ........................... 21 2.3 –1.7 –17.8 –25.4 16.6 –29.7 –61.3 Autos..................................... 22 0.5 –5.1 –31.0 –41.5 44.3 –0.6 –45.0 Trucks ................................... 23 2.8 –0.8 –13.5 –20.2 9.8 –36.7 –65.6
Net exports .............................. 24 ............. ............. ............. ............. ............. ............. ............. Exports ................................. 25 22.7 7.3 –10.9 4.7 52.4 –62.6 –86.9
Autos................................. 26 32.0 17.6 6.4 10.7 55.1 –62.8 –91.2 Trucks ............................... 27 14.0 –3.9 –28.3 –2.7 48.8 –62.4 –78.8
Imports.................................. 28 –2.6 –11.1 –2.8 –7.8 –33.8 –53.2 –83.4 Autos................................. 29 –1.6 –0.1 7.4 –3.5 5.0 –35.5 –87.4 Trucks ............................... 30 –3.6 –21.6 –12.1 –12.1 –61.8 –70.8 –75.1
Change in private inventories.... 31 ............. ............. ............. ............. ............. ............. ............. Autos......................................... 32 ............. ............. ............. ............. ............. ............. .............
New....................................... 33 ............. ............. ............. ............. ............. ............. ............. Domestic........................... 34 ............. ............. ............. ............. ............. ............. ............. Foreign.............................. 35 ............. ............. ............. ............. ............. ............. .............
Used ..................................... 36 ............. ............. ............. ............. ............. ............. ............. Trucks........................................ 37 ............. ............. ............. ............. ............. ............. .............
New....................................... 38 ............. ............. ............. ............. ............. ............. ............. Domestic........................... 39 ............. ............. ............. ............. ............. ............. ............. Foreign.............................. 40 ............. ............. ............. ............. ............. ............. .............
Used 1................................... Addenda:
Final sales of motor vehicles to
41 ............. ............. ............. ............. ............. ............. .............
domestic purchasers............. Private fixed investment in new
42 –3.0 –18.8 –15.0 –32.3 –30.0 –52.0 –6.6
autos and new light trucks .... 43 0.8 –21.0 –16.1 –40.8 –22.6 –69.2 –61.4 Domestic output of new autos 2 44 –3.3 –2.7 –0.8 –23.7 53.3 –62.8 –95.6 Sales of imported new autos 3 45 3.2 –10.8 –20.2 42.5 –42.7 –59.0 –12.6
1. Consists of used light trucks only. 2. Consists of final sales and change in private inventories of new autos assembled in the United States. 3. Consists of personal consumption expenditures, private fixed investment, and gross government investment.

D–44 National Data June 2009
Table 7.2.3B. Real Motor Vehicle Output, Quantity Indexes Table 7.2.4B. Price Indexes for Motor Vehicle Output [Index numbers, 2000=100] [Index numbers, 2000=100]
Line 2007 2008
Seasonally adjusted
2008 2009
I II III IV I
Motor vehicle output ....... 1 113.904 93.768 106.030 95.654 97.343 76.043 61.753 Auto output .................... 2 100.871 93.774 99.746 97.957 101.190 76.203 51.494 Truck output ................... 3 123.268 93.625 110.483 93.809 94.325 75.884 69.575
Final sales of domestic product Personal consumption
4 119.594 98.252 113.613 101.676 97.481 80.236 84.304
expenditures ........................ 5 115.840 98.565 111.109 104.072 95.563 83.515 88.703 New motor vehicles ............... 6 118.554 95.703 110.459 102.699 92.224 77.430 79.368
Autos ................................. Light trucks (including
7 101.340 90.469 99.882 105.272 86.899 69.823 67.796
utility vehicles) ............... Net purchases of used autos
8 134.736 100.327 120.174 99.477 97.008 84.647 90.612
and used light trucks ......... 9 110.623 103.698 112.107 106.417 101.564 94.705 106.122 Used autos ........................ Used light trucks (including
10 92.577 84.079 92.747 87.913 82.140 73.514 82.777
utility vehicles) ............... 11 132.777 127.958 135.897 129.162 125.594 121.181 135.272 Private fixed investment ......... 12 100.189 68.062 90.513 73.668 64.795 43.272 30.001
New motor vehicles ............... 13 106.460 83.878 99.266 88.679 82.994 64.575 49.683 Autos ................................. 14 96.977 83.076 92.789 89.136 86.170 64.208 52.273 Trucks ................................
Light trucks (including 15 112.570 84.377 103.433 88.362 80.894 64.821 47.984
utility vehicles) ........... 16 127.170 94.450 121.135 98.968 90.360 67.337 51.493 Other .............................
Net purchases of used autos 17 77.587 59.642 61.695 62.455 57.695 56.722 38.649
and used light trucks ......... 18 115.249 112.062 113.153 114.972 115.682 104.440 87.592 Used autos ........................ Used light trucks (including
19 101.215 100.271 101.164 102.955 105.170 91.795 78.106
utility vehicles) ............... 20 131.278 125.512 126.830 128.680 127.667 118.871 98.404 Gross government investment 21 128.541 126.306 133.665 124.238 129.097 118.225 93.264
Autos ..................................... 22 111.978 106.222 112.084 98.039 107.459 107.308 92.393 Trucks .................................... 23 134.864 133.852 141.795 134.017 137.199 122.395 93.755
Net exports............................... 24 .............. ............. .............. ............. .............. .............. ............. Exports .................................. 25 213.573 229.181 228.382 231.004 256.654 200.684 120.791
Autos ................................. 26 244.559 287.665 283.120 290.385 324.062 253.095 137.803 Trucks ................................ 27 187.144 179.757 182.075 180.825 199.716 156.410 106.141
Imports .................................. 28 115.740 102.876 114.477 112.172 101.167 83.689 53.400 Autos ................................. 29 105.268 105.179 108.056 107.101 108.403 97.157 57.873 Trucks ................................ 30 128.049 100.389 122.092 118.212 92.935 68.317 48.264
Change in private inventories .... 31 .............. ............. .............. ............. .............. .............. ............. Autos ......................................... 32 .............. ............. .............. ............. .............. .............. .............
New ....................................... 33 .............. ............. .............. ............. .............. .............. ............. Domestic ........................... 34 .............. ............. .............. ............. .............. .............. ............. Foreign .............................. 35 .............. ............. .............. ............. .............. .............. .............
Used ...................................... 36 .............. ............. .............. ............. .............. .............. ............. Trucks ........................................ 37 .............. ............. .............. ............. .............. .............. .............
New ....................................... 38 .............. ............. .............. ............. .............. .............. ............. Domestic ........................... 39 .............. ............. .............. ............. .............. .............. ............. Foreign .............................. 40 .............. ............. .............. ............. .............. .............. .............
Used 1 ................................... 41 .............. ............. .............. ............. .............. .............. ............. Addenda:
Final sales of motor vehicles to domestic purchasers .............
Private fixed investment in new 42 112.677 91.525 106.813 96.893 88.624 73.772 72.528
autos and new light trucks..... 43 112.884 89.207 107.726 94.476 88.602 66.023 52.053 Domestic output of new autos 2 44 90.459 87.978 92.936 86.855 96.644 75.478 34.612 Sales of imported new autos 3 45 124.797 111.372 117.123 127.964 111.330 89.070 86.121
Line 2007 2008
Seasonally adjusted
2008 2009
I II III IV I
Motor vehicle output ....... 1 96.738 94.271 95.413 94.710 94.312 92.648 93.827 Auto output .................... 2 98.795 97.812 97.100 97.528 99.248 97.373 97.604 Truck output ................... 3 95.425 91.838 94.318 92.839 90.854 89.339 91.078
Final sales of domestic product Personal consumption
4 96.659 94.310 95.406 94.770 94.321 92.742 93.658
expenditures ........................ 5 95.863 94.229 95.456 94.905 94.454 92.100 91.724 New motor vehicles ............... 6 94.607 93.197 94.021 93.634 93.295 91.839 92.450
Autos.................................. Light trucks (including
7 97.214 96.894 96.668 96.803 97.668 96.435 96.619
utility vehicles) ............... Net purchases of used autos
8 92.723 90.340 92.103 91.257 89.818 88.181 89.105
and used light trucks.......... 9 98.447 96.472 98.408 97.550 96.895 93.036 91.173 Used autos ........................ Used light trucks (including
10 100.575 100.545 101.066 101.429 102.668 97.015 94.337
utility vehicles) ............... 11 96.282 92.720 95.812 93.959 91.793 89.318 88.066 Private fixed investment.......... 12 107.595 106.662 106.086 105.746 106.184 108.631 115.964
New motor vehicles ............... 13 97.801 96.784 97.452 97.096 96.823 95.763 96.563 Autos.................................. 14 97.214 96.891 96.667 96.800 97.659 96.439 96.629 Trucks ................................
Light trucks (including 15 98.205 96.714 97.967 97.307 96.268 95.314 96.527
utility vehicles) ........... 16 92.726 90.365 92.103 91.258 89.887 88.211 89.163 Other..............................
Net purchases of used autos 17 116.038 118.783 117.870 118.175 118.653 120.434 122.564
and used light trucks.......... 18 85.319 84.879 86.526 86.160 85.228 81.603 78.504 Used autos ........................ Used light trucks (including
19 86.343 85.441 87.321 86.716 85.553 82.173 79.340
utility vehicles) ............... 20 84.324 84.297 85.730 85.581 84.860 81.017 77.687 Gross government investment 21 107.837 108.929 108.444 109.020 109.165 109.086 111.690
Autos...................................... 22 103.554 105.276 103.354 106.225 107.142 104.381 108.183 Trucks .................................... 23 109.162 110.081 109.993 109.907 109.828 110.598 112.774
Net exports ............................... 24 ............. .............. ............. .............. ............. .............. ............. Exports .................................. 25 108.926 110.098 109.530 109.864 110.158 110.840 110.713
Autos.................................. 26 106.099 106.780 106.493 106.598 106.661 107.370 107.094 Trucks ................................ 27 111.676 113.433 112.478 113.128 113.745 114.380 114.445
Imports .................................. 28 106.226 108.366 107.879 108.198 108.700 108.686 108.330 Autos.................................. 29 104.763 106.899 106.905 107.039 107.211 106.443 106.045 Trucks ................................ 30 107.765 110.038 108.914 109.431 110.335 111.471 111.184
Change in private inventories..... 31 ............. .............. ............. .............. ............. .............. ............. Autos.......................................... 32 ............. .............. ............. .............. ............. .............. .............
New........................................ 33 ............. .............. ............. .............. ............. .............. ............. Domestic............................ 34 ............. .............. ............. .............. ............. .............. ............. Foreign............................... 35 ............. .............. ............. .............. ............. .............. .............
Used ...................................... 36 ............. .............. ............. .............. ............. .............. ............. Trucks ........................................ 37 ............. .............. ............. .............. ............. .............. .............
New........................................ 38 ............. .............. ............. .............. ............. .............. ............. Domestic............................ 39 ............. .............. ............. .............. ............. .............. ............. Foreign............................... 40 ............. .............. ............. .............. ............. .............. .............
Used 1 ................................... 41 ............. .............. ............. .............. ............. .............. ............. Addenda:
Final sales of motor vehicles to domestic purchasers .............
Private fixed investment in new 42 98.471 97.002 97.845 97.379 97.121 95.665 96.383
autos and new light trucks ..... 43 94.612 93.149 94.020 93.590 93.226 91.763 92.358 Domestic output of new autos 2 44 98.814 98.829 98.497 98.604 99.222 98.991 100.474 Sales of imported new autos 3 45 97.215 96.896 96.669 96.805 97.669 96.442 96.626
1. Consists of used light trucks only. 1. Consists of used light trucks only. 2. Consists of final sales and change in private inventories of new autos assembled in the United States. 2. Consists of final sales and change in private inventories of new autos assembled in the United States. 3. Consists of personal consumption expenditures, private fixed investment, and gross government investment. 3. Consists of personal consumption expenditures, private fixed investment, and gross government investment.

June 2009 SURVEY OF CURRENT BUSINESS D–45
Table 7.2.5B. Motor Vehicle Output Table 7.2.6B. Real Motor Vehicle Output, Chained Dollars [Billions of dollars] [Billions of chained (2000) dollars]
Line 2007 2008
Seasonally adjusted at annual rates
2008 2009
I II III IV I
Motor vehicle output ....... 1 402.2 322.4 368.5 330.4 333.5 257.2 211.1 Auto output .................... 2 150.6 138.7 146.4 144.5 151.8 112.2 76.1 Truck output ................... 3 251.6 183.7 222.1 185.9 181.7 144.9 135.0
Final sales of domestic product Personal consumption
4 409.7 328.8 384.2 341.5 325.9 263.7 279.8
expenditures ........................ 5 361.5 302.7 345.2 321.5 293.8 250.4 264.8 New motor vehicles ............... 6 240.3 191.3 222.5 206.0 184.3 152.3 157.2
Autos ................................. Light trucks (including
7 102.0 90.8 100.0 105.6 87.9 69.7 67.9
utility vehicles) ............... Net purchases of used autos
8 138.3 100.5 122.5 100.5 96.4 82.6 89.3
and used light trucks ......... 9 121.2 111.4 122.7 115.5 109.5 98.0 107.6 Used autos ........................ Used light trucks (including
10 56.5 51.3 56.9 54.1 51.1 43.3 47.4
utility vehicles) ............... 11 64.7 60.1 65.9 61.4 58.3 54.8 60.3 Private fixed investment ......... 12 127.5 85.7 113.6 92.1 81.4 55.6 41.1
New motor vehicles ............... 13 201.3 157.1 187.1 166.5 155.4 119.6 92.8 Autos ................................. 14 72.0 61.5 68.5 65.9 64.3 47.3 38.6 Trucks ................................
Light trucks (including 15 129.3 95.6 118.6 100.6 91.1 72.3 54.2
utility vehicles) ........... 16 101.5 73.7 96.0 77.7 69.9 51.1 39.5 Other .............................
Net purchases of used autos 17 27.8 21.9 22.5 22.9 21.2 21.2 14.7
and used light trucks ......... 18 –73.9 –71.5 –73.5 –74.4 –74.0 –64.0 –51.6 Used autos ........................ Used light trucks (including
19 –34.8 –34.2 –35.2 –35.6 –35.9 –30.1 –24.7
utility vehicles) ............... Gross government
20 –39.0 –37.3 –38.3 –38.8 –38.2 –33.9 –26.9
investment............................ 21 17.2 17.0 17.9 16.8 17.4 16.0 12.9 Autos ..................................... 22 4.0 3.8 4.0 3.6 3.9 3.8 3.4 Trucks .................................... 23 13.2 13.2 14.0 13.2 13.5 12.1 9.5
Net exports............................... 24 –96.4 –76.6 –92.5 –88.9 –66.7 –58.2 –39.0 Exports .................................. 25 60.8 65.9 65.3 66.3 73.8 58.1 34.9
Autos ................................. 26 31.7 37.6 36.9 37.9 42.3 33.2 18.1 Trucks ................................ 27 29.0 28.3 28.4 28.4 31.6 24.9 16.9
Imports .................................. 28 157.2 142.5 157.9 155.2 140.6 116.3 74.0 Autos ................................. 29 76.6 78.1 80.2 79.6 80.7 71.8 42.6 Trucks ................................ 30 80.6 64.4 77.7 75.6 59.9 44.5 31.4
Change in private inventories .... 31 –7.5 –6.4 –15.7 –11.2 7.6 –6.6 –68.7 Autos ......................................... 32 –4.2 5.9 –4.4 –7.3 18.8 16.7 –31.8
New ....................................... 33 –3.2 7.6 –2.1 –4.1 19.0 17.6 –26.9 Domestic ........................... 34 –2.3 5.5 –5.1 –3.4 14.9 15.8 –20.3 Foreign .............................. 35 –0.8 2.1 3.0 –0.6 4.0 1.8 –6.7
Used ...................................... 36 –1.1 –1.7 –2.4 –3.3 –0.2 –0.9 –4.9 Trucks ........................................ 37 –3.3 –12.4 –11.3 –3.8 –11.1 –23.3 –36.9
New ....................................... 38 –3.0 –11.9 –9.1 –3.3 –12.4 –22.7 –26.1 Domestic ........................... 39 –2.3 –12.7 –11.3 –5.1 –21.1 –13.5 –20.4 Foreign .............................. 40 –0.8 0.9 2.2 1.8 8.6 –9.2 –5.7
Used 1 ................................... 41 –0.3 –0.5 –2.1 –0.6 1.3 –0.6 –10.8 Addenda:
Final sales of motor vehicles to domestic purchasers .............
Private fixed investment in new 42 506.1 405.4 476.7 430.4 392.6 321.9 318.9
autos and new light trucks..... 43 173.5 135.2 164.5 143.6 134.2 98.4 78.1 Domestic output of new autos 2 44 98.8 96.2 101.2 94.8 106.0 82.6 38.5 Sales of imported new autos 3 45 101.7 90.5 95.0 103.9 91.2 72.0 69.8
Line 2007 2008
Seasonally adjusted at annual rates
2008 2009
I II III IV I
Motor vehicle output ....... 1 415.7 342.2 387.0 349.1 355.3 277.5 225.4 Auto output .................... 2 152.4 141.7 150.7 148.0 152.9 115.1 77.8 Truck output ................... 3 263.6 200.2 236.3 200.6 201.7 162.3 148.8
Final sales of domestic product Personal consumption
4 423.9 348.2 402.7 360.4 345.5 284.4 298.8
expenditures ........................ 5 377.1 320.8 361.7 338.7 311.1 271.8 288.7 New motor vehicles................ 6 254.0 205.0 236.7 220.0 197.6 165.9 170.0
Autos.................................. Light trucks (including
7 105.0 93.7 103.5 109.0 90.0 72.3 70.2
utility vehicles) ............... Net purchases of used autos
8 149.1 111.0 133.0 110.1 107.4 93.7 100.3
and used light trucks.......... 9 123.1 115.4 124.7 118.4 113.0 105.4 118.1 Used autos ........................ Used light trucks (including
10 56.1 51.0 56.3 53.3 49.8 44.6 50.2
utility vehicles) ............... 11 67.2 64.7 68.8 65.4 63.5 61.3 68.4 Private fixed investment.......... 12 118.5 80.5 107.0 87.1 76.6 51.2 35.5
New motor vehicles................ 13 205.9 162.2 192.0 171.5 160.5 124.9 96.1 Autos.................................. 14 74.1 63.5 70.9 68.1 65.8 49.0 39.9 Trucks ................................
Light trucks (including 15 131.7 98.7 121.0 103.4 94.6 75.8 56.1
utility vehicles) ........... 16 109.5 81.3 104.3 85.2 77.8 58.0 44.3 Other..............................
Net purchases of used autos 17 24.0 18.4 19.1 19.3 17.8 17.5 11.9
and used light trucks.......... 18 –86.6 –84.2 –85.0 –86.4 –86.9 –78.4 –65.8 Used autos ........................ Used light trucks (including
19 –40.3 –40.0 –40.3 –41.0 –41.9 –36.6 –31.1
utility vehicles) ............... 20 –46.3 –44.2 –44.7 –45.4 –45.0 –41.9 –34.7 Gross government investment 21 15.9 15.6 16.6 15.4 16.0 14.6 11.6
Autos...................................... 22 3.8 3.6 3.8 3.3 3.7 3.7 3.2 Trucks .................................... 23 12.1 12.0 12.7 12.0 12.3 11.0 8.4
Net exports ............................... 24 –92.2 –71.6 –86.7 –83.1 –62.3 –54.6 –36.7 Exports .................................. 25 55.8 59.9 59.7 60.4 67.1 52.4 31.6
Autos.................................. 26 29.9 35.2 34.6 35.5 39.6 31.0 16.9 Trucks ................................ 27 26.0 25.0 25.3 25.1 27.7 21.7 14.7
Imports................................... 28 148.0 131.5 146.3 143.4 129.3 107.0 68.3 Autos.................................. 29 73.1 73.0 75.0 74.3 75.2 67.4 40.2 Trucks ................................ 30 74.8 58.7 71.3 69.1 54.3 39.9 28.2
Change in private inventories..... 31 –7.5 –6.3 –15.3 –10.9 8.1 –7.1 –69.3 Autos.......................................... 32 –4.5 6.2 –4.6 –7.7 19.5 17.6 –33.7
New........................................ 33 –3.2 7.4 –2.1 –4.1 18.4 17.2 –26.2 Domestic............................ 34 –2.4 5.4 –5.2 –3.5 14.7 15.6 –20.0 Foreign............................... 35 –0.8 1.9 2.8 –0.6 3.8 1.7 –6.3
Used ...................................... 36 –1.2 –1.9 –2.7 –3.7 –0.2 –1.1 –6.1 Trucks......................................... 37 –3.1 –11.4 –10.3 –3.4 –9.7 –22.3 –35.1
New........................................ 38 –2.7 –10.2 –7.8 –2.7 –10.2 –20.1 –22.8 Domestic............................ 39 –2.0 –11.0 –9.8 –4.3 –18.2 –11.5 –17.5 Foreign............................... 40 –0.7 0.8 2.1 1.7 8.0 –8.7 –5.4
Used 1.................................... 41 –0.3 –0.6 –2.4 –0.6 1.5 –0.7 –13.4 Residual......................................... 42 0.8 4.1 1.2 3.6 6.7 4.2 –0.1 Addenda:
Final sales of motor vehicles to domestic purchasers..............
Private fixed investment in new 43 514.0 417.5 487.2 442.0 404.3 336.5 330.8
autos and new light trucks ..... 44 183.4 144.9 175.0 153.5 143.9 107.3 84.6 Domestic output of new autos 2 45 100.0 97.2 102.7 96.0 106.8 83.4 38.2 Sales of imported new autos 3 46 104.7 93.4 98.2 107.3 93.4 74.7 72.2
1. Consists of used light trucks only. 2. Consists of final sales and change in private inventories of new autos assembled in the United States. 3. Consists of personal consumption expenditures, private fixed investment, and gross government investment.
1. Consists of used light trucks only. 2. Consists of final sales and change in private inventories of new autos assembled in the United States. 3. Consists of personal consumption expenditures, private fixed investment, and gross government investment. NOTE. Chained (2000) dollar series are calculated as the product of the chain-type quantity index and the 2000 current-
dollar value of the corresponding series, divided by 100. Because the formula for the chain-type quantity indexes uses weights of more than one period, the corresponding chained-dollar estimates are usually not additive. The residual line is the difference between the first line and the sum of the most detailed lines, excluding the lines in the addenda.


![National Data: Selected NIPA Tables · 2011. 10. 20. · May 2005 SURVEY OF CURRENT BUSINESS D–3 Table 1.1.3. Real Gross Domestic Product, Quantity Indexes [Index numbers, 2000=100]](https://static.fdocuments.us/doc/165x107/612e86481ecc51586942de43/national-data-selected-nipa-tables-2011-10-20-may-2005-survey-of-current-business.jpg)