B. Other NIPA and NIPA-Related Tables · D–30 August 2003 B. Other NIPA and NIPA-Related Tables...
9
D–30 August 2003 B. Other NIPA and NIPA-Related Tables Monthly Estimates Tables B.1 and B.2 include the most recent estimates of personal income and its components; these estimates were released on August 1, 2003, and they include “preliminary” estimates for June 2003 and “revised” estimates for April–May 2003. Table B.1. Personal Income [Billions of dollars; monthly estimates seasonally adjusted at annual rates] 2001 2002 2002 2003 May June July Aug. Sep. Oct. Nov. Dec. Jan. Feb. Mar. Apr. r May r June p Personal Income .................................................................... 8,685.3 8,922.2 8,904.9 8,971.7 8,934.8 8,958.7 8,983.1 8,983.1 9,007.1 9,047.4 9,069.1 9,096.0 9,119.2 9,139.5 9,169.4 9,198.7 Wage and salary disbursements ......................................... 4,950.6 4,996.4 4,989.0 5,034.0 4,985.0 5,009.8 5,027.4 5,009.7 5,020.1 5,039.5 5,050.9 5,074.1 5,083.4 5,082.5 5,092.1 5,107.0 Private industries............................................................. 4,139.8 4,143.6 4,140.7 4,183.1 4,131.4 4,152.1 4,167.4 4,146.4 4,154.5 4,172.2 4,175.1 4,191.9 4,198.4 4,195.6 4,202.7 4,212.6 Goods–producing industries ....................................... 1,142.4 1,115.7 1,119.3 1,128.2 1,111.4 1,117.0 1,117.3 1,110.7 1,107.1 1,110.0 1,109.5 1,111.0 1,113.5 1,111.6 1,114.7 1,116.3 Manufacturing.......................................................... 789.4 758.7 764.3 771.2 756.8 759.1 757.8 753.8 750.4 751.8 751.3 752.7 752.9 748.8 749.3 749.4 Distributive industries .................................................. 1,109.2 1,114.4 1,113.2 1,124.7 1,111.3 1,118.4 1,123.7 1,112.5 1,114.6 1,116.7 1,114.5 1,117.8 1,118.5 1,118.3 1,119.2 1,121.1 Service industries........................................................ 1,888.2 1,913.5 1,908.2 1,930.2 1,908.7 1,916.7 1,926.4 1,923.3 1,932.8 1,945.5 1,951.1 1,963.1 1,966.4 1,965.6 1,968.8 1,975.2 Government..................................................................... 810.8 852.8 848.3 851.0 853.6 857.7 860.0 863.3 865.6 867.3 875.8 882.2 885.0 886.9 889.4 894.4 Other labor income .............................................................. 570.4 610.6 603.9 608.5 613.0 617.5 622.1 625.9 630.1 634.4 637.0 639.4 641.1 642.8 645.2 646.9 Proprietors' income with IVA and CCAdj ............................. 727.9 756.5 746.0 745.1 755.0 757.4 763.8 769.7 770.4 774.6 783.3 782.3 787.7 797.1 803.5 809.9 Farm ................................................................................ 19.0 12.9 5.1 3.3 7.7 10.7 13.8 13.0 11.8 10.2 12.3 14.4 15.9 15.8 15.0 14.8 Nonfarm........................................................................... 708.8 743.7 740.9 741.7 747.4 746.7 750.0 756.7 758.6 764.4 771.0 767.9 771.7 781.3 788.5 795.2 Rental income of persons with CCAdj ................................. 137.9 142.4 153.5 158.7 152.4 144.1 135.9 133.2 130.6 127.9 127.5 126.9 126.2 121.8 116.2 111.0 Personal dividend income ................................................... 409.2 433.8 430.3 432.7 435.0 437.3 439.4 441.6 443.8 446.0 448.6 451.2 453.7 456.4 459.1 461.5 Personal interest income ..................................................... 1,091.3 1,078.5 1,082.3 1,088.9 1,084.8 1,080.7 1,076.7 1,078.8 1,080.9 1,083.1 1,079.4 1,075.8 1,072.2 1,076.9 1,081.6 1,086.3 Transfer payments to persons ............................................. 1,170.4 1,288.0 1,282.9 1,289.9 1,293.2 1,297.3 1,304.6 1,309.9 1,317.6 1,329.8 1,333.9 1,339.6 1,348.9 1,356.0 1,366.5 1,371.9 Old–age, survivors, disability, and health insurance........ benefits........................................................................ 664.3 699.8 696.3 697.4 699.2 701.9 704.6 704.5 710.3 717.6 718.2 722.4 727.1 729.6 737.3 738.5 Government unemployment insurance benefits .............. 31.9 62.9 67.7 70.8 68.1 66.9 67.8 66.0 63.3 63.3 60.9 61.5 63.6 64.8 65.7 67.8 Other ............................................................................... 474.2 525.4 518.9 521.7 525.9 528.5 532.3 539.4 544.0 548.9 554.8 555.7 558.1 561.6 563.4 565.5 Less: Personal contributions for social insurance.................... 372.3 384.0 383.0 386.1 383.7 385.4 386.7 385.7 386.6 388.0 391.6 393.2 394.0 394.1 394.8 395.9 Table B.2. The Disposition of Personal Income [Monthly estimates seasonally adjusted at annual rates] 2001 2002 2002 2003 May June July Aug. Sep. Oct. Nov. Dec. Jan. Feb. Mar. Apr. r May r June p Billions of dollars, unless otherwise indicated Personal income ............................................................... 8,685.3 8,922.2 8,904.9 8,971.7 8,934.8 8,958.7 8,983.1 8,983.1 9,007.1 9,047.4 9,069.1 9,096.0 9,119.2 9,139.5 9,169.4 9,198.7 Less: Personal tax and nontax payments ........................... 1,292.1 1,111.9 1,119.6 1,122.0 1,101.4 1,098.8 1,096.8 1,089.6 1,088.5 1,092.2 1,070.1 1,078.3 1,083.1 1,083.1 1,085.1 1,088.3 Equals: Disposable personal income ............................. 7,393.2 7,810.3 7,785.3 7,849.7 7,833.4 7,859.9 7,886.4 7,893.6 7,918.6 7,955.2 7,998.9 8,017.7 8,036.1 8,056.4 8,084.3 8,110.5 Less: Personal outlays........................................................ 7,223.5 7,524.5 7,467.9 7,501.8 7,579.9 7,601.6 7,567.5 7,592.0 7,626.0 7,704.1 7,707.7 7,705.4 7,769.8 7,782.3 7,815.8 7,841.3 Personal consumption expenditures............................... 6,987.0 7,303.7 7,244.6 7,276.7 7,355.7 7,379.3 7,347.2 7,374.3 7,410.7 7,491.2 7,493.4 7,490.3 7,553.9 7,563.2 7,593.9 7,616.5 Durable goods ............................................................ 835.9 871.9 845.2 857.4 901.6 919.0 872.8 848.1 857.7 915.9 866.3 845.7 871.7 894.1 897.3 901.2 Nondurable goods ...................................................... 2,041.3 2,115.0 2,101.9 2,111.7 2,117.8 2,117.3 2,115.6 2,137.5 2,150.2 2,162.1 2,193.3 2,203.7 2,223.3 2,193.5 2,193.2 2,202.4 Services ..................................................................... 4,109.9 4,316.8 4,297.4 4,307.6 4,336.3 4,343.0 4,358.8 4,388.6 4,402.7 4,413.2 4,433.8 4,441.0 4,458.9 4,475.6 4,503.3 4,512.9 Interest paid by persons ................................................. 205.4 188.4 191.3 193.2 191.3 189.3 187.4 185.0 182.5 180.1 180.9 181.7 182.5 185.4 188.3 191.2 Personal transfer payments to the rest of the world (net) 31.1 32.3 31.9 31.9 32.9 32.9 32.9 32.8 32.8 32.8 33.4 33.4 33.4 33.6 33.6 33.6 Equals: Personal saving .................................................. 169.7 285.8 317.5 347.9 253.5 258.3 318.8 301.5 292.7 251.1 291.2 312.3 266.4 274.1 268.5 269.2 Addenda: Disposable personal income: Billions of chained (1996) dollars 1 .............................. 6,748.0 7,032.2 7,024.4 7,073.9 7,049.5 7,057.4 7,067.2 7,061.5 7,079.4 7,105.9 7,131.0 7,118.2 7,109.1 7,140.0 7,170.3 7,177.0 Per capita: Current dollars ............................................................ 25,957 27,170 27,120 27,324 27,245 27,313 27,381 27,383 27,450 27,557 27,688 27,733 27,774 27,821 27,893 27,958 Chained (1996 dollars) ............................................... 23,692 24,463 24,470 24,623 24,518 24,525 24,537 24,497 24,540 24,615 24,684 24,622 24,571 24,656 24,740 24,740 Population (thousands) 2 ................................................. 284,822 287,456 287,067 287,284 287,519 287,768 288,024 288,263 288,480 288,682 288,893 289,098 289,335 289,579 289,830 290,100 Personal consumption expenditures: Billions of chained (1996) dollars ............................... 6,377.2 6,576.0 6,536.6 6,557.5 6,619.7 6,625.9 6,584.0 6,596.9 6,625.3 6,691.4 6,680.3 6,649.9 6,682.5 6,702.9 6,735.3 6,739.9 Durable goods ........................................................ 931.9 999.9 966.3 983.2 1,036.4 1,057.3 1,003.5 977.0 991.7 1,062.9 1,008.7 987.6 1,019.8 1,048.6 1,058.6 1,066.6 Nondurable goods .................................................. 1,869.8 1,929.5 1,919.7 1,926.9 1,931.0 1,926.2 1,920.2 1,937.9 1,950.0 1,962.0 1,984.4 1,972.0 1,980.4 1,970.8 1,982.6 1,984.2 Services ................................................................. 3,594.9 3,675.6 3,672.4 3,672.9 3,688.5 3,683.4 3,689.0 3,704.0 3,708.7 3,708.1 3,716.2 3,714.2 3,714.2 3,721.6 3,734.0 3,731.3 Implicit price deflator, 1996=100 ................................ 109.56 111.06 110.83 110.97 111.12 111.37 111.59 111.79 111.86 111.95 112.17 112.64 113.04 112.83 112.75 113.01 Personal saving as percentage of disposable personal income........................................................................ 2.3 3.7 4.1 4.4 3.2 3.3 4.0 3.8 3.7 3.2 3.6 3.9 3.3 3.4 3.3 3.3 Percent change from preceding period, monthly changes at monthly rates Personal income, current dollars.................................... 3.3 2.7 0.4 0.7 –0.4 0.3 0.3 0.0 0.3 0.4 0.2 0.3 0.3 0.2 0.3 0.3 Disposable personal income: Current dollars ................................................................ 3.8 5.6 0.6 0.8 –0.2 0.3 0.3 0.1 0.3 0.5 0.5 0.2 0.2 0.3 0.3 0.3 Chained (1996) dollars ................................................... 1.8 4.2 0.6 0.7 –0.3 0.1 0.1 –0.1 0.3 0.4 0.4 –0.2 –0.1 0.4 0.4 0.1 Personal consumption expenditures: Current dollars ................................................................ 4.5 4.5 0.0 0.4 1.1 0.3 –0.4 0.4 0.5 1.1 0.0 0.0 0.8 0.1 0.4 0.3 Chained (1996) dollars ................................................... 2.5 3.1 0.1 0.3 0.9 0.1 –0.6 0.2 0.4 1.0 –0.2 –0.5 0.5 0.3 0.5 0.1 p Preliminary. r Revised. CCAdj Capital consumption adjustment. IVA Inventory valuation adjustment. Source: U.S. Bureau of Economic Analysis. p Preliminary. r Revised. 1. Equals disposable personal income deflated by the implicit price deflator for personal consumption expenditures. 2. Population is the total population of the United States, including the Armed Forces overseas and the institutionalized population. The monthly estimate is the average of estimates for the first of the month and the first of the following month; the annual estimate is the average of the monthly estimates. Source: U.S. Bureau of Economic Analysis.
Transcript of B. Other NIPA and NIPA-Related Tables · D–30 August 2003 B. Other NIPA and NIPA-Related Tables...

D–30 August 2003
B. Other NIPA and NIPA-Related TablesMonthly EstimatesTables B.1 and B.2 include the most recent estimates of personal income and its components; these estimates werereleased on August 1, 2003, and they include “preliminary” estimates for June 2003 and “revised” estimates forApril–May 2003.
Table B.1. Personal Income[Billions of dollars; monthly estimates seasonally adjusted at annual rates]
2001 20022002 2003
May June July Aug. Sep. Oct. Nov. Dec. Jan. Feb. Mar. Apr. r May r June p
Personal Income .................................................................... 8,685.3 8,922.2 8,904.9 8,971.7 8,934.8 8,958.7 8,983.1 8,983.1 9,007.1 9,047.4 9,069.1 9,096.0 9,119.2 9,139.5 9,169.4 9,198.7Wage and salary disbursements ......................................... 4,950.6 4,996.4 4,989.0 5,034.0 4,985.0 5,009.8 5,027.4 5,009.7 5,020.1 5,039.5 5,050.9 5,074.1 5,083.4 5,082.5 5,092.1 5,107.0
Private industries............................................................. 4,139.8 4,143.6 4,140.7 4,183.1 4,131.4 4,152.1 4,167.4 4,146.4 4,154.5 4,172.2 4,175.1 4,191.9 4,198.4 4,195.6 4,202.7 4,212.6Goods–producing industries ....................................... 1,142.4 1,115.7 1,119.3 1,128.2 1,111.4 1,117.0 1,117.3 1,110.7 1,107.1 1,110.0 1,109.5 1,111.0 1,113.5 1,111.6 1,114.7 1,116.3
Manufacturing.......................................................... 789.4 758.7 764.3 771.2 756.8 759.1 757.8 753.8 750.4 751.8 751.3 752.7 752.9 748.8 749.3 749.4Distributive industries .................................................. 1,109.2 1,114.4 1,113.2 1,124.7 1,111.3 1,118.4 1,123.7 1,112.5 1,114.6 1,116.7 1,114.5 1,117.8 1,118.5 1,118.3 1,119.2 1,121.1Service industries........................................................ 1,888.2 1,913.5 1,908.2 1,930.2 1,908.7 1,916.7 1,926.4 1,923.3 1,932.8 1,945.5 1,951.1 1,963.1 1,966.4 1,965.6 1,968.8 1,975.2
Government..................................................................... 810.8 852.8 848.3 851.0 853.6 857.7 860.0 863.3 865.6 867.3 875.8 882.2 885.0 886.9 889.4 894.4Other labor income.............................................................. 570.4 610.6 603.9 608.5 613.0 617.5 622.1 625.9 630.1 634.4 637.0 639.4 641.1 642.8 645.2 646.9Proprietors' income with IVA and CCAdj ............................. 727.9 756.5 746.0 745.1 755.0 757.4 763.8 769.7 770.4 774.6 783.3 782.3 787.7 797.1 803.5 809.9
Farm ................................................................................ 19.0 12.9 5.1 3.3 7.7 10.7 13.8 13.0 11.8 10.2 12.3 14.4 15.9 15.8 15.0 14.8Nonfarm........................................................................... 708.8 743.7 740.9 741.7 747.4 746.7 750.0 756.7 758.6 764.4 771.0 767.9 771.7 781.3 788.5 795.2
Rental income of persons with CCAdj................................. 137.9 142.4 153.5 158.7 152.4 144.1 135.9 133.2 130.6 127.9 127.5 126.9 126.2 121.8 116.2 111.0Personal dividend income ................................................... 409.2 433.8 430.3 432.7 435.0 437.3 439.4 441.6 443.8 446.0 448.6 451.2 453.7 456.4 459.1 461.5Personal interest income ..................................................... 1,091.3 1,078.5 1,082.3 1,088.9 1,084.8 1,080.7 1,076.7 1,078.8 1,080.9 1,083.1 1,079.4 1,075.8 1,072.2 1,076.9 1,081.6 1,086.3Transfer payments to persons ............................................. 1,170.4 1,288.0 1,282.9 1,289.9 1,293.2 1,297.3 1,304.6 1,309.9 1,317.6 1,329.8 1,333.9 1,339.6 1,348.9 1,356.0 1,366.5 1,371.9
Old–age, survivors, disability, and health insurance........benefits........................................................................ 664.3 699.8 696.3 697.4 699.2 701.9 704.6 704.5 710.3 717.6 718.2 722.4 727.1 729.6 737.3 738.5
Government unemployment insurance benefits .............. 31.9 62.9 67.7 70.8 68.1 66.9 67.8 66.0 63.3 63.3 60.9 61.5 63.6 64.8 65.7 67.8Other ............................................................................... 474.2 525.4 518.9 521.7 525.9 528.5 532.3 539.4 544.0 548.9 554.8 555.7 558.1 561.6 563.4 565.5
Less: Personal contributions for social insurance.................... 372.3 384.0 383.0 386.1 383.7 385.4 386.7 385.7 386.6 388.0 391.6 393.2 394.0 394.1 394.8 395.9
Table B.2. The Disposition of Personal Income[Monthly estimates seasonally adjusted at annual rates]
2001 20022002 2003
May June July Aug. Sep. Oct. Nov. Dec. Jan. Feb. Mar. Apr. r May r June p
Billions of dollars, unless otherwise indicated
Personal income ............................................................... 8,685.3 8,922.2 8,904.9 8,971.7 8,934.8 8,958.7 8,983.1 8,983.1 9,007.1 9,047.4 9,069.1 9,096.0 9,119.2 9,139.5 9,169.4 9,198.7Less: Personal tax and nontax payments........................... 1,292.1 1,111.9 1,119.6 1,122.0 1,101.4 1,098.8 1,096.8 1,089.6 1,088.5 1,092.2 1,070.1 1,078.3 1,083.1 1,083.1 1,085.1 1,088.3Equals: Disposable personal income ............................. 7,393.2 7,810.3 7,785.3 7,849.7 7,833.4 7,859.9 7,886.4 7,893.6 7,918.6 7,955.2 7,998.9 8,017.7 8,036.1 8,056.4 8,084.3 8,110.5Less: Personal outlays........................................................ 7,223.5 7,524.5 7,467.9 7,501.8 7,579.9 7,601.6 7,567.5 7,592.0 7,626.0 7,704.1 7,707.7 7,705.4 7,769.8 7,782.3 7,815.8 7,841.3
Personal consumption expenditures............................... 6,987.0 7,303.7 7,244.6 7,276.7 7,355.7 7,379.3 7,347.2 7,374.3 7,410.7 7,491.2 7,493.4 7,490.3 7,553.9 7,563.2 7,593.9 7,616.5Durable goods ............................................................ 835.9 871.9 845.2 857.4 901.6 919.0 872.8 848.1 857.7 915.9 866.3 845.7 871.7 894.1 897.3 901.2Nondurable goods ...................................................... 2,041.3 2,115.0 2,101.9 2,111.7 2,117.8 2,117.3 2,115.6 2,137.5 2,150.2 2,162.1 2,193.3 2,203.7 2,223.3 2,193.5 2,193.2 2,202.4Services ..................................................................... 4,109.9 4,316.8 4,297.4 4,307.6 4,336.3 4,343.0 4,358.8 4,388.6 4,402.7 4,413.2 4,433.8 4,441.0 4,458.9 4,475.6 4,503.3 4,512.9
Interest paid by persons ................................................. 205.4 188.4 191.3 193.2 191.3 189.3 187.4 185.0 182.5 180.1 180.9 181.7 182.5 185.4 188.3 191.2Personal transfer payments to the rest of the world (net) 31.1 32.3 31.9 31.9 32.9 32.9 32.9 32.8 32.8 32.8 33.4 33.4 33.4 33.6 33.6 33.6
Equals: Personal saving .................................................. 169.7 285.8 317.5 347.9 253.5 258.3 318.8 301.5 292.7 251.1 291.2 312.3 266.4 274.1 268.5 269.2Addenda:
Disposable personal income:Billions of chained (1996) dollars1 .............................. 6,748.0 7,032.2 7,024.4 7,073.9 7,049.5 7,057.4 7,067.2 7,061.5 7,079.4 7,105.9 7,131.0 7,118.2 7,109.1 7,140.0 7,170.3 7,177.0Per capita:Current dollars............................................................ 25,957 27,170 27,120 27,324 27,245 27,313 27,381 27,383 27,450 27,557 27,688 27,733 27,774 27,821 27,893 27,958Chained (1996 dollars) ............................................... 23,692 24,463 24,470 24,623 24,518 24,525 24,537 24,497 24,540 24,615 24,684 24,622 24,571 24,656 24,740 24,740
Population (thousands)2 ................................................. 284,822 287,456 287,067 287,284 287,519 287,768 288,024 288,263 288,480 288,682 288,893 289,098 289,335 289,579 289,830 290,100Personal consumption expenditures:
Billions of chained (1996) dollars ............................... 6,377.2 6,576.0 6,536.6 6,557.5 6,619.7 6,625.9 6,584.0 6,596.9 6,625.3 6,691.4 6,680.3 6,649.9 6,682.5 6,702.9 6,735.3 6,739.9Durable goods ........................................................ 931.9 999.9 966.3 983.2 1,036.4 1,057.3 1,003.5 977.0 991.7 1,062.9 1,008.7 987.6 1,019.8 1,048.6 1,058.6 1,066.6Nondurable goods .................................................. 1,869.8 1,929.5 1,919.7 1,926.9 1,931.0 1,926.2 1,920.2 1,937.9 1,950.0 1,962.0 1,984.4 1,972.0 1,980.4 1,970.8 1,982.6 1,984.2Services ................................................................. 3,594.9 3,675.6 3,672.4 3,672.9 3,688.5 3,683.4 3,689.0 3,704.0 3,708.7 3,708.1 3,716.2 3,714.2 3,714.2 3,721.6 3,734.0 3,731.3
Implicit price deflator, 1996=100 ................................ 109.56 111.06 110.83 110.97 111.12 111.37 111.59 111.79 111.86 111.95 112.17 112.64 113.04 112.83 112.75 113.01Personal saving as percentage of disposable personal
income........................................................................ 2.3 3.7 4.1 4.4 3.2 3.3 4.0 3.8 3.7 3.2 3.6 3.9 3.3 3.4 3.3 3.3
Percent change from preceding period, monthly changes at monthly rates
Personal income, current dollars.................................... 3.3 2.7 0.4 0.7 –0.4 0.3 0.3 0.0 0.3 0.4 0.2 0.3 0.3 0.2 0.3 0.3Disposable personal income:
Current dollars................................................................ 3.8 5.6 0.6 0.8 –0.2 0.3 0.3 0.1 0.3 0.5 0.5 0.2 0.2 0.3 0.3 0.3Chained (1996) dollars ................................................... 1.8 4.2 0.6 0.7 –0.3 0.1 0.1 –0.1 0.3 0.4 0.4 –0.2 –0.1 0.4 0.4 0.1
Personal consumption expenditures:Current dollars................................................................ 4.5 4.5 0.0 0.4 1.1 0.3 –0.4 0.4 0.5 1.1 0.0 0.0 0.8 0.1 0.4 0.3Chained (1996) dollars ................................................... 2.5 3.1 0.1 0.3 0.9 0.1 –0.6 0.2 0.4 1.0 –0.2 –0.5 0.5 0.3 0.5 0.1
p Preliminary.r Revised.
CCAdj Capital consumption adjustment.IVA Inventory valuation adjustment.Source: U.S. Bureau of Economic Analysis.
p Preliminary.r Revised.1. Equals disposable personal income deflated by the implicit price deflator for personal consumption expenditures.
2. Population is the total population of the United States, including the Armed Forces overseas and the institutionalized population. The monthly estimate is the average of estimates for the first of the month and the first of the following month; the annual estimate is the average of the monthly estimates.
Source: U.S. Bureau of Economic Analysis.
August 2003 SURVEY OF CURRENT BUSINESS D–31
Annual EstimatesExcept as noted for table B.3 below, these tables are derived from the NIPA tables that were published in theAugust and September 2002 issues of the SURVEY OF CURRENT BUSINESS, and the estimates reflect the most recentcomprehensive and annual NIPA revisions.
Table B.3. Gross Domestic Product by Industry,
Billions of dollars Billions of chained (1996) dollars
1999 2000 2001 1999 2000 2001
Gross domestic product ........ 9,274.3 9,824.6 10,082.2 8,859.0 9,191.4 9,214.5
Private industries .............................. 8,123.0 8,606.9 8,800.8 7,851.0 8,157.8 8,189.4
Agriculture, forestry, and fishing 127.7 134.3 140.6 154.6 166.7 163.9Farms ......................................... 75.2 77.8 80.6 108.1 120.5 114.3Agricultural services, forestry,
and fishing ............................. 52.5 56.5 60.1 46.2 47.6 49.1
Mining ........................................... 104.1 133.1 139.0 114.7 101.9 106.8Metal mining .............................. 5.6 5.2 5.7 9.0 8.0 9.6Coal mining ............................... 10.8 9.2 10.5 13.5 11.9 13.9Oil and gas extraction................. 76.4 106.5 110.3 82.0 70.5 72.9Nonmetallic minerals, except
fuels ....................................... 11.4 12.2 12.6 10.7 12.2 12.4
Construction .................................. 425.4 461.3 480.0 367.8 378.0 371.9
Manufacturing ............................... 1,481.3 1,520.3 1,423.0 1,513.9 1,585.4 1,490.3Durable goods............................ 853.8 886.4 812.8 949.3 1,044.3 990.1
Lumber and wood products 44.1 42.1 39.2 40.9 41.8 39.0Furniture and fixtures ............. 25.8 26.1 25.0 23.7 24.1 22.4Stone, clay, and glass
products............................. 41.4 40.6 36.7 37.4 37.2 33.9Primary metal industries ........ 50.5 50.2 45.1 57.0 56.1 53.5Fabricated metal products...... 106.9 109.6 100.8 97.7 102.7 92.3Industrial machinery and
equipment ......................... 152.3 173.1 148.2 206.7 249.2 222.5Electronic and other electric
equipment .......................... 161.2 162.0 143.1 249.2 311.8 335.2Motor vehicles and equipment 119.4 120.4 111.4 115.0 117.3 108.5Other transportation
equipment .......................... 65.1 66.3 71.4 61.7 60.5 62.0Instruments and related
products............................. 58.2 63.5 61.7 47.6 51.0 46.1Miscellaneous manufacturing
industries .......................... 28.9 32.5 30.2 27.4 31.3 28.5Nondurable goods...................... 627.5 633.9 610.2 570.8 558.0 518.3
Food and kindred products .... 136.6 127.0 123.7 120.5 111.2 106.5Tobacco products................... 19.4 21.2 21.1 6.8 6.2 5.0Textile mill products ............... 24.9 23.8 22.1 23.0 23.2 20.7Apparel and other textile
products............................. 24.7 24.7 23.3 22.9 23.3 22.3Paper and allied products....... 56.8 60.2 55.9 56.1 53.1 49.7Printing and publishing .......... 105.4 106.5 100.2 90.4 90.1 80.8Chemicals and allied products 167.3 169.0 163.5 160.6 162.8 157.8Petroleum and coal products 30.4 38.5 40.6 35.3 29.9 24.6Rubber and miscellaneous
plastics products................ 58.7 59.3 56.6 57.6 61.3 57.0Leather and leather products 3.4 3.7 3.3 3.2 3.6 3.1
Transportation and public utilities ... 770.1 809.3 819.5 732.2 781.9 780.5Transportation ................................ 301.9 313.7 306.1 268.6 282.5 270.3
Railroad transportation .............. 23.1 24.8 25.8 22.4 25.0 25.0Local and interurban passenger
transit..................................... 17.9 18.3 19.1 16.8 17.2 17.2Trucking and warehousing ......... 121.4 123.3 126.0 100.2 103.4 99.3Water transportation .................. 13.4 15.0 15.7 12.0 13.4 13.3Transportation by air .................. 90.0 91.9 80.2 80.7 84.8 78.3Pipelines, except natural gas ...... 6.2 6.3 6.5 6.6 6.4 6.0
Current-Dollar and Real Estimates for 1999–2001
Billions of dollars Billions of chained (1996) dollars
1999 2000 2001 1999 2000 2001
Transportation services........... 29.9 34.1 32.9 29.8 32.4 31.2Communications......................... 257.2 279.1 291.5 255.3 286.7 321.9
Telephone and telegraph ......... 193.7 208.0 218.5 205.3 236.7 265.7Radio and television................ 63.6 71.1 72.9 51.5 53.4 60.0
Electric, gas, and sanitary services .................................. 211.0 216.5 221.9 208.8 213.9 194.3
Wholesale trade............................. 645.3 696.8 680.7 708.6 750.2 748.7
Retail trade .................................... 831.7 887.3 931.8 846.2 909.2 951.2
Finance, insurance, and real estate ......................................... 1,798.8 1,976.7 2,076.9 1,688.3 1,793.5 1,843.5Depository institutions................ 330.3 361.1 359.8 274.9 287.4 290.4Nondepository institutions.......... 57.7 69.5 88.8 65.4 79.0 91.9Security and commodity brokers 128.2 150.8 175.0 174.8 216.8 245.1Insurance carriers....................... 153.8 182.4 170.1 133.0 146.0 141.2Insurance agents, brokers, and
service .................................... 61.5 61.6 66.5 54.6 51.9 53.5Real estate .................................. 1,050.5 1,123.7 1,171.7 982.1 1,016.7 1,022.0
Nonfarm housing services ...... 766.9 811.4 845.1 704.1 722.9 725.6Other real estate...................... 283.5 312.3 326.6 279.3 295.5 298.2
Holding and other investment offices..................................... 16.8 27.7 45.0 10.0 13.7 22.7
Services ......................................... 1,977.2 2,116.4 2,226.6 1,768.4 1,826.0 1,843.3Hotels and other lodging places 80.0 87.4 88.4 64.5 68.4 65.6Personal services ....................... 58.5 59.3 62.7 53.6 52.9 53.3Business services ....................... 501.0 534.4 544.1 449.6 460.1 459.4Auto repair, services, and
parking.................................... 89.2 94.9 99.5 81.8 84.8 87.5Miscellaneous repair services..... 24.9 27.7 27.0 19.9 20.9 17.7Motion pictures........................... 31.2 32.5 35.5 28.5 27.9 29.5Amusement and recreation
services .................................. 72.6 76.6 79.3 63.6 63.6 62.6Health services ........................... 515.4 548.5 589.8 470.7 487.9 501.2Legal services............................. 123.6 134.4 145.6 111.0 116.8 120.2Educational services ................... 72.3 77.9 84.4 62.4 64.1 66.5Social services............................ 61.9 67.7 74.7 53.9 56.0 58.4Membership organizations ......... 58.0 61.4 63.0 48.1 47.8 46.6Other services............................. 276.0 300.3 320.7 250.2 263.9 267.1Private households ..................... 12.7 13.6 11.9 11.7 12.0 10.1
Statistical discrepancy 1 ................ –38.8 –128.5 –117.3 –37.3 –121.3 –108.3
Government........................................ 1,151.3 1,217.7 1,281.3 1,061.1 1,088.8 1,107.5
Federal ........................................... 369.8 389.5 396.2 346.5 355.0 350.9General government ................... 307.6 323.4 332.8 285.2 289.4 291.3Government enterprises ............. 62.2 66.1 63.4 61.4 66.0 59.4
State and local ............................... 781.5 828.2 885.1 714.4 733.6 756.1General government .................. 715.9 758.7 807.0 653.7 669.0 687.0Government enterprises ............. 65.6 69.4 78.1 60.7 64.7 69.4
Not allocated by industry 2................. ................ ................ ................ –97.1 –159.1 –204.4
1. The current-dollar statistical discrepancy equals gross domestic product (GDP) measured as the sum ofexpenditures less gross domestic income—that is, GDP measured as the costs incurred and profits earned indomestic production. The chained (1996) dollar statistical discrepancy equals the current-dollar statisticaldiscrepancy deflated by the implicit price deflator for gross domestic business product.
2. Equals GDP in chained (1996) dollars less the statistical discrepancy and the sum of GDP by industry of the
detailed industries. The value of not allocated by industry reflects the nonadditivity of chained-dollar estimatesand the differences in source data used to estimate real GDP by industry and the expenditures measure of realGDP.
NOTE. Estimates are based on the 1987 Standard Industrial Classification. The table is derived from tables 1and 6 in “Gross Domestic Product by Industry for 1999–2001” in the November 2002 SURVEY.
D–32 National Data August 2003
Billions of dollars Billions of chained (1996) dollars
1999 2000 2001 1999 2000 2001
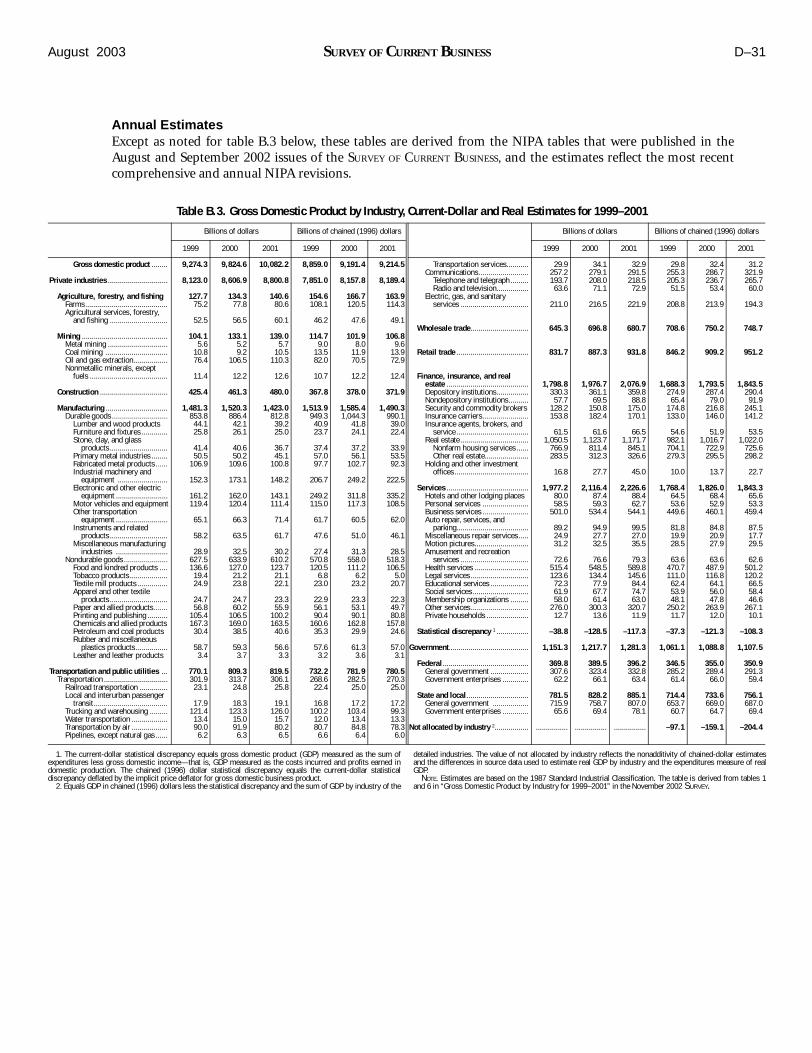
Personal consumption expenditures ................. 6,246.5 6,683.7 6,987.0 5,964.5 6,223.9 6,377.2
Food and tobacco ....................................................... 964.7 1,027.2 1,068.7 888.9 919.4 926.0 Food purchased for off-premise consumption
(n.d.).................................................................. 537.7 568.6 589.0 512.4 530.0 533.6 Purchased meals and beverages 1 (n.d.) ................ 351.5 376.5 393.2 325.4 339.8 344.0 Food furnished to employees (including military)
(n.d.).................................................................. 9.1 9.4 9.7 8.5 8.7 8.8 Food produced and consumed on farms (n.d.) ...... .5 .5 .5 .5 .5 .5 Tobacco products (n.d.) ......................................... 65.9 72.2 76.3 43.4 42.8 42.1 Addenda: Food excluding alcoholic beverages
(n.d.).................................................................. 786.2 834.2 866.2 741.0 768.8 775.2 Alcoholic beverages purchased for off-
premise consumption (n.d.) .......... 65.2 70.3 73.1 62.5 65.4 66.5 Other alcoholic beverages (n.d.) ........ 47.4 50.5 53.1 43.3 44.8 45.3
Clothing, accessories, and jewelry ........................... 391.2 409.8 412.6 404.9 428.4 435.9 Shoes (n.d.) ............................................................ 44.7 46.3 47.0 46.4 48.8 49.9 Clothing and accessories except shoes 2................. 256.1 267.1 267.9 265.4 280.3 287.5 Women's and children’s (n.d.) ............................. 164.1 171.9 172.6 172.6 183.1 187.1 Men’s and boys’ (n.d.) ......................................... 92.0 95.2 95.3 92.9 97.3 100.5
Standard clothing issued to military personnel (n.d) .3 .3 .3 .3 .3 .3 Cleaning, storage, and repair of clothing and shoes
(s.) ...................................................................... 14.6 15.5 15.6 13.8 14.3 13.7 Jewelry and watches (d.) ........................................ 48.5 51.1 51.0 53.7 58.1 58.0 Other 3 (s.) ............................................................... 27.0 29.5 30.8 25.6 27.1 27.0
Personal care ............................................................. 84.0 87.8 89.1 80.0 81.7 81.5 Toilet articles and preparations (n.d.) ..................... 55.1 56.5 56.5 53.4 54.1 53.6 Barbershops, beauty parlors, and health clubs (s.) 28.9 31.2 32.6 26.6 27.6 27.8
Housing ...................................................................... 912.6 960.0 1,014.5 835.0 851.3 866.0 Owner-occupied nonfarm dwellings–space rent 4
(s.).................................................................... 666.4 704.9 751.0 610.7 627.3 643.5 Tenant-occupied nonfarm dwellings–rent 5 (s.) ...... 202.8 207.8 217.1 185.8 184.0 184.3 Rental value of farm dwellings (s.) ......................... 7.2 7.6 8.0 6.1 6.0 5.9 Other 6 (s.).............................................................. 36.1 39.6 38.5 32.5 34.1 32.5
Household operation.................................................. 677.7 723.9 747.3 677.7 712.2 721.8 Furniture, including mattresses and bedsprings
(d.) ..................................................................... 60.3 64.4 64.0 60.6 65.0 65.7 Kitchen and other household appliances 7 (d.) ....... 34.1 35.7 36.1 35.5 37.5 38.3 China, glassware, Tableware, and utensils (d.) ....... 31.4 33.3 34.1 31.8 34.2 35.9 Other durable house furnishings 8 (d.).................... 61.6 65.1 66.4 61.9 65.9 68.0 Semidurable house furnishings 9 (n.d.) .................. 36.8 38.3 38.7 38.9 41.6 43.0 Cleaning and polishing preparations, and
miscellaneous household supplies and paper products (n.d) .................................................... 56.9 59.3 61.7 54.4 54.4 54.6
Stationery and writing supplies (n.d.) .................... 22.6 23.4 23.5 21.2 22.3 22.4 Household utilities.................................................. 190.1 209.2 221.7 190.1 195.0 191.3
Electricity (s.)..................................................... 96.7 101.5 105.3 101.0 104.4 101.2 Gas (s.) .............................................................. 33.3 40.8 49.1 31.6 32.9 33.3 Water and other sanitary services (s.) ............... 46.6 48.8 50.7 43.0 43.9 44.4 Fuel oil and coal (n.d.) ....................................... 13.6 18.1 16.5 14.7 14.0 12.6
Telephone and telegraph (s.) .................................. 122.3 130.6 136.5 127.1 141.1 151.2 Domestic service (s.) ............................................. 14.9 16.0 14.6 13.7 14.1 12.4 Other 10 (s.) ............................................................ 46.6 48.5 50.0 43.0 42.9 42.9
Medical care .............................................................. 1,097.9 1,171.1 1,270.2 1,025.5 1,062.0 1,110.2 Drug preparations and sundries 11 (n.d.) ............... 139.2 156.3 176.4 129.4 140.6 152.3 Ophthalmic products and orthopedic appliances
(d.) ................................................................... 21.6 22.9 21.6 20.6 21.3 19.4 Physicians (s.)....................................................... 230.3 244.3 266.7 218.7 228.0 242.1 Dentists (s.)........................................................... 58.3 62.7 67.5 51.1 52.5 54.4 Other professional services 12 (s.) ......................... 137.0 142.8 153.5 126.5 128.5 133.9 Hospitals and nursing homes 13............................. 445.8 471.5 509.6 418.1 427.4 443.9
Hospitals........................................................... 370.7 392.3 425.9 350.7 359.8 376.8 Nonprofit (s.) ............................................... 245.9 259.7 281.0 229.8 234.8 244.1 Proprietary (s.)............................................. 42.4 44.8 50.8 41.0 42.2 46.6 Government (s.) ........................................... 82.5 87.8 94.1 79.9 82.8 86.2
Nursing homes (s.) ........................................... 75.1 79.2 83.6 67.5 67.7 67.5 Health insurance.................................................... 65.7 70.6 75.0 61.3 63.8 64.5
Medical care and hospitalization 14 (s.) ............. 57.7 63.0 66.8 49.5 51.4 51.6Income loss 15 (s.) ............................................. 1.5 1.7 1.8 .9 1.0 1.0Workers’ compensation 16 (s.) ........................... 6.5 5.9 6.4 10.8 11.4 12.1
Billions of dollars Billions of chained (1996) dollars
1999 2000 2001 1999 2000 2001
Personal business....................................................... 575.2 632.5 634.3 514.2 550.0 550.1 Brokerage charges and investment counseling (s.) 72.2 88.4 74.2 80.0 98.9 86.2 Bank service charges, trust services, and safe
deposit box rental (s.) ......................................... 63.2 68.4 73.5 56.8 58.8 60.7 Services furnished without payment by financial
intermediaries except life insurance carriers (s.) 233.8 258.1 259.5 201.4 220.0 227.4 Expense of handling life insurance and pension
plans 17 (s.) .......................................................... 96.2 102.8 103.9 82.3 82.0 80.3 Legal services (s.) .................................................... 62.4 65.2 70.4 54.7 54.4 55.7 Funeral and burial expenses (s.) .............................. 16.5 16.4 17.5 14.6 14.1 14.6 Other 18 (s.) .............................................................. 31.0 33.2 35.3 28.1 28.9 29.4
Transportation ............................................................ 707.8 768.9 794.8 704.8 726.8 750.4User-operated transportation................................... 654.7 711.9 742.0 653.1 673.9 699.8 New autos (d.) ..................................................... 98.4 105.5 105.9 99.9 107.0 108.0 Net purchases of used autos (d.)......................... 57.7 59.4 60.6 59.8 60.4 60.4 Other motor vehicles (d.) .................................... 118.7 125.9 149.0 116.8 123.9 147.3 Tires, tubes, accessories, and other parts (d.)..... 44.4 45.9 45.8 45.3 46.7 45.4 Repair, greasing, washing, parking, storage,
rental, and leasing (s.) .................................... 165.1 175.5 181.6 156.7 162.1 162.2 Gasoline and oil (n.d.) ......................................... 129.3 164.4 162.1 136.4 135.7 138.8 Bridge, tunnel, ferry, and road tolls (s.) ............... 4.4 4.6 4.9 3.8 3.9 3.9 Insurance 19 (s.)................................................... 36.8 30.7 32.1 34.1 34.3 34.3Purchased local transportation ................................ 12.4 12.7 13.2 12.5 12.6 12.7 Mass transit systems (s.) .................................... 8.6 9.1 9.5 8.7 9.0 9.1 Taxicab (s.) .......................................................... 3.8 3.6 3.7 3.8 3.5 3.5
Purchased intercity transportation ........................... 40.7 44.3 39.7 39.3 40.3 38.0 Railway (s.) .......................................................... .7 .8 .9 .7 .8 .8 Bus (s.) ................................................................ 2.0 1.5 1.5 1.8 1.3 1.3 Airline (s.) ............................................................ 32.7 36.7 32.4 31.7 33.4 31.6 Other 20 (s.) .......................................................... 5.3 5.2 4.8 5.0 4.7 4.3
Recreation.................................................................. 526.5 564.7 593.9 558.3 604.9 644.6 Books and maps (d.) .............................................. 30.8 33.2 35.1 30.2 32.5 34.1 Magazines, newspapers, and sheet music (n.d.) .... 32.5 34.2 35.2 30.8 31.8 32.1 Nondurable toys and sport supplies (n.d.) ............. 60.4 62.7 66.7 67.8 74.5 82.6 Wheel goods, sports and photographic equipment,
boats, and pleasure aircraft (d.)......................... 50.4 55.3 60.8 52.3 58.1 64.5 Video and audio goods, including musical
instruments, and computer goods (d.) .............. 98.1 106.3 105.6 152.7 185.5 211.5 Video and audio goods, including musical
instruments (d.).............................................. 66.7 71.8 72.7 78.3 90.7 99.0 Computers, peripherals, and software*(d.) ........ 31.4 34.5 32.9 91.0 122.0 152.6
Radio and television repair (s.)............................... 4.1 4.1 4.2 3.9 4.0 4.1 Flowers, seeds, and potted plants (n.d.)................. 16.7 17.5 18.5 17.4 17.5 17.9 Admissions to specified spectator amusements .... 25.0 27.1 29.4 22.6 23.1 23.9
Motion picture theaters (s.) ............................... 7.6 7.8 8.7 6.9 6.6 7.1 Legitimate theaters and opera, and
entertainments of nonprofit institutions (except athletics) (s.) .................................... 8.9 9.9 10.6 8.1 8.4 8.7
Spectator sports 21 (s.)....................................... 8.5 9.5 10.1 7.7 8.1 8.1 Clubs and fraternal organizations 22 (s.) ................. 15.9 16.7 17.3 14.7 14.9 14.9 Commercial participant amusements 23 (s.) ........... 63.0 68.4 73.3 58.8 61.6 63.9 Pari-mutuel net receipts (s.)................................... 4.5 4.7 4.8 4.2 4.3 4.3 Other 24 (s.) ............................................................ 125.1 134.4 142.9 114.2 118.7 122.2
Education and research ............................................. 152.1 164.0 174.9 136.8 141.3 144.9 Higher education 25 (s.)........................................... 79.3 83.1 87.6 71.5 72.2 73.6 Nursery, elementary, and secondary schools 26 (s.) 32.0 34.0 35.5 29.2 29.8 29.9 Other 27 (s.) ............................................................. 40.8 46.9 51.7 36.1 39.2 41.3
Religious and welfare activities 28 (s.)...................... 172.9 190.1 199.6 157.5 164.9 166.4
Foreign travel and other, net ..................................... –16.0 –16.1 –12.9 –11.7 –7.5 –5.0 Foreign travel by U.S. residents 29 (s.)..................... 72.3 80.9 76.3 70.9 78.7 73.3 Expenditures abroad by U.S. residents (n.d.) .......... 3.2 3.3 3.6 3.6 4.0 4.4 Less: Expenditures in the United States by
nonresidents 30 (s.) ............................................. 89.6 98.3 90.6 84.2 88.2 80.6 Less: Personal remittances in kind to nonresidents
(n.d.) ................................................................... 1.9 2.0 2.2 1.9 1.9 2.1
Residual ..................................................................... .............. .............. .............. –41.6 –72.6 –100.5
Table B.4. Personal Consumption Expenditures by Type of Expenditure
* Because of rapid changes in relative prices, the chained-dollar estimates for computers are especially misleading as ameasure of the contribution or relative importance of this component.
1. Consists of purchases (including tips) of meals and beverages from retail, service, and amusement establishments,hotels, dining and buffet cars, schools, school fraternities, institutions, clubs, and industrial lunchrooms. Includes mealsand beverages consumed both on- and off-premise.
2. Includes luggage.3. Consists of watch, clock, and jewelry repairs, costume and dress suit rental, and miscellaneous personal services.4. Consists of rent for space and for heating and plumbing facilities, water heaters, lighting fixtures, kitchen cabinets,
linoleum, storm windows and doors, window screens, and screen doors, but excludes rent for appliances and furniture andpurchases of fuel and electricity.
5. Consists of space rent (see footnote 4) and rent for appliances, furnishings, and furniture.6. Consists of transient hotels, motels, clubs, schools, and other group housing.7. Consists of refrigerators and freezers, cooking ranges, dishwashers, laundry equipment, stoves, room air conditioners,
sewing machines, vacuum cleaners, and other appliances.8. Includes such house furnishings as floor coverings, comforters, quilts, blankets, pillows, picture frames, mirrors, art
products, portable lamps, and clocks. Also includes writing equipment and hand, power, and garden tools.9. Consists largely of textile house furnishings, including piece goods allocated to house furnishing use. Also includes
lamp shades, brooms, and brushes.10. Consists of maintenance services for appliances and house furnishings, moving and warehouse expenses, postage
and express charges, premiums for fire and theft insurance on personal property less benefits and dividends, and miscella-neous household operation services.
11. Excludes drug preparations and related products dispensed by physicians, hospitals, and other medical services.12. Consists of osteopathic physicians, chiropractors, private duty nurses, chiropodists, podiatrists, and others providing
health and allied services, not elsewhere classified.13. Consists of (1) current expenditures (including consumption of fixed capital) of nonprofit hospitals and nursing
homes, and (2) payments by patients to proprietary and government hospitals and nursing homes.14. Consists of (1) premiums, less benefits and dividends, for health, hospitalization, and accidental death and dismem-
berment insurance provided by commercial insurance carriers, and (2) administrative expenses (including consumption offixed capital) of nonprofit and self-insured health plans.
15. Consists of premiums, less benefits and dividends, for income loss insurance.16. Consists of premiums, less benefits and dividends, for privately administered workers' compensation.17. Consists of (1) operating expenses of commercial life insurance carriers, (2) administrative expenses of private
noninsured pension plans and publicly administered government employee retirement plans, and (3) premiums, less bene-fits and dividends, of fraternal benefit societies. For commercial life insurance carriers, excludes expenses for accident andhealth insurance and includes profits of stock companies and services furnished without payment by banks, credit agen-cies, and investment companies. For pension and retirement plans, excludes services furnished without payment by banks,credit agencies, and investment companies.
18. Consists of current expenditures (including consumption of fixed capital) of trade unions and professional associa-tions, employment agency fees, money order fees, spending for classified advertisements, tax return preparation services,and other personal business services.
19. Consists of premiums, less benefits and dividends, for motor vehicle insurance.20. Consists of baggage charges, coastal and inland waterway fares, travel agents' fees, and airport bus fares.21. Consists of admissions to professional and amateur athletic events and to racetracks.22. Consists of dues and fees excluding insurance premiums.23. Consists of billiard parlors; bowling alleys; dancing, riding, shooting, skating, and swimming places; amusement
devices and parks; golf courses; sightseeing buses and guides; private flying operations; casino gambling; and othercommercial participant amusements.
24. Consists of net receipts of lotteries and expenditures for purchases of pets and pet care services, cable TV, filmprocessing, photographic studios, sporting and recreation camps, video cassette rentals, and recreational services, not else-where classified.
25. For private institutions, equals current expenditures (including consumption of fixed capital) less receipts—such asthose from meals, rooms, and entertainments—accounted for separately in consumer expenditures, and less expendituresfor research and development financed under contracts or grants. For government institutions, equals student payments oftuition.
26. For private institutions, equals current expenditures (including consumption of fixed capital) less receipts—such asthose from meals, rooms, and entertainments—accounted for separately in consumer expenditures. For government institu-tions, equals student payments of tuition. Excludes child day care services, which are included in religious and welfare activ-ities.
27. Consists of (1) fees paid to commercial, business, trade, and correspondence schools and for educational services,not elsewhere classified, and (2) current expenditures (including consumption of fixed capital) by research organizationsand foundations for education and research.
28. For nonprofit institutions, equals current expenditures (including consumption of fixed capital) of religious, socialwelfare, foreign relief, and political organizations, museums, libraries, and foundations. The expenditures are net ofreceipts—such as those from meals, rooms, and entertainments—accounted for separately in consumer expenditures, andexcludes relief payments within the United States and expenditures by foundations for education and research. For propri-etary and government institutions, equals receipts from users.
29. Beginning with 1981, includes U.S. students' expenditures abroad; these expenditures were $0.3 billion in 1981.30. Beginning with 1981, includes nonresidents' student and medical care expenditures in the United States; student
expenditures were $2.2 billion and medical expenditures were $0.4 billion in 1981.
NOTE. Consumer durable goods are designated (d.), nondurable goods (n.d.), and services (s.). Chained (1996) dollar series are calculated as the product of the chain-type quantity index and the 1996 current-dollar
value of the corresponding series, divided by 100. Because the formula for the chain-type quantity indexes uses weights ofmore than one period, the corresponding chained-dollar estimates are usually not additive. The residual line is the differencebetween the first line and the sum of the most detailed lines.
August 2003 SURVEY OF CURRENT BUSINESS D–33
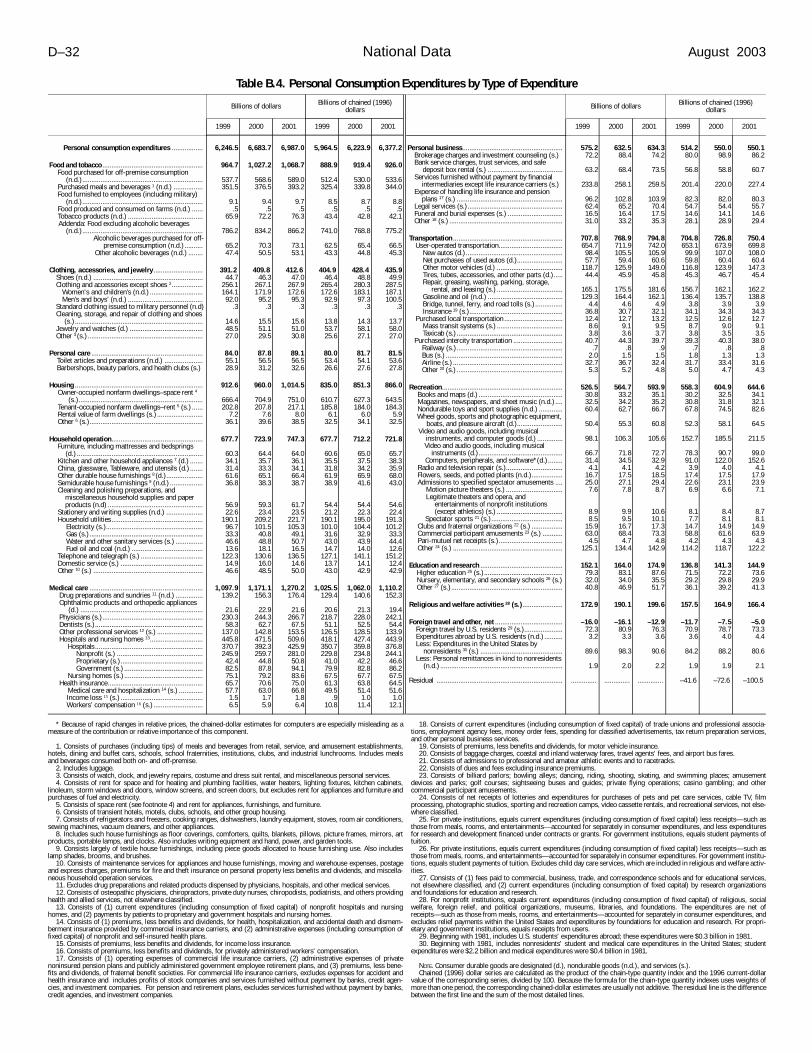
Table B.5. Private Fixed Investment in Structures by Type
Billions of dollars Billions of chained (1996) dollars
1999 2000 2001 1999 2000 2001
Private fixed investment in structures .......... 678.5 731.0 759.9 617.9 638.5 634.9
Nonresidential ................................................... 283.7 314.2 324.5 258.6 275.5 270.9
New............................................................... 283.1 313.5 320.8 258.0 274.7 267.7
Nonresidential buildings, excluding farm 201.8 217.9 210.1 181.0 187.1 173.6 Industrial ............................................. 28.7 28.0 25.6 25.8 24.0 21.1 Commercial ......................................... 110.1 122.8 118.5 98.7 105.5 97.9 Office buildings 1 ......................... 55.4 64.7 60.5 49.6 55.6 50.0 Other 2 ......................................... 54.7 58.1 58.0 49.1 49.9 48.0 Religious ............................................. 7.2 7.8 8.1 6.4 6.7 6.7 Educational.......................................... 10.3 12.4 13.7 9.3 10.6 11.3 Hospital and institutional ..................... 15.1 16.1 16.8 13.5 13.8 13.9 Other 3 ................................................. 30.4 30.8 27.4 27.2 26.5 22.6
Utilities..................................................... 47.3 53.7 55.0 45.7 50.4 50.3 Railroads .............................................. 4.7 4.3 4.1 4.7 4.2 4.2 Telecommunications ............................ 18.3 18.7 18.4 18.2 18.2 17.3 Electric light and power........................ 14.7 21.3 22.7 14.0 19.5 20.1 Gas....................................................... 8.1 8.5 8.9 7.6 7.6 7.8 Petroleum pipelines.............................. 1.5 1.0 .9 1.4 .9 .8
Farm ........................................................ 5.1 6.0 6.1 4.5 5.1 5.1 Mining exploration, shafts, and wells ....... 22.8 29.2 42.7 21.6 27.0 34.0 Petroleum and natural gas ................... 21.6 28.0 41.3 20.4 26.0 32.8 Other .................................................... 1.2 1.1 1.4 1.1 1.0 1.2
Other 4 ...................................................... 6.2 6.7 6.8 5.7 6.0 5.9
Brokers’ commissions on sale of structures 2.4 2.5 2.5 2.3 2.4 2.2
Net purchases of used structures ................. –1.8 –1.9 1.2 –1.6 –1.6 1.0
Residential ........................................................ 394.8 416.8 435.4 359.4 363.0 364.0
New............................................................... 344.4 363.6 377.8 311.7 315.1 315.2
New housing units .................................... 250.1 259.7 271.6 225.6 224.2 225.5 Permanent site ..................................... 236.1 248.9 262.8 212.2 213.9 217.0 Single-family structures ................... 208.6 220.7 232.1 189.0 191.0 192.6 Multifamily structures ...................... 27.4 28.3 30.7 23.4 23.0 24.4
Manufactured homes ........................... 14.0 10.8 8.8 13.2 10.0 8.1 Improvements .......................................... 93.0 102.4 104.6 84.9 89.7 88.4 Other 5 ...................................................... 1.3 1.4 1.6 1.2 1.2 1.4
Brokers’ commissions on sale of structures 53.9 56.2 60.0 51.0 50.6 50.9 Net purchases of used structures ................. –3.5 –2.9 –2.3 –3.1 –2.5 –1.9
Residual ............................................................. .............. .............. .............. –.9 –.9 –1.0
1. Consists of office buildings, except those constructed at industrial sites and those constructed by utilities fortheir own use.
2. Consists of stores, restaurants, garages, service stations, warehouses, mobile structures, and other build-ings used for commercial purposes.
3. Consists of hotels and motels, buildings used primarily for social and recreational activities, and buildingsnot elsewhere classified, such as passenger terminals, greenhouses, and animal hospitals.
4. Consists primarily of streets, dams and reservoirs, sewer and water facilities, parks, and airfields.5. Consists primarily of dormitories and of fraternity and sorority houses.
NOTE. Chained (1996) dollar series are calculated as the product of the chain-type quantity index and the 1996current-dollar value of the corresponding series, divided by 100. Because the formula for the chain-type quantityindexes uses weights of more than one period, the corresponding chained-dollar estimates are usually not addi-tive. The residual line is the difference between the first line and the sum of the most detailed lines.
Table B.6. Private Fixed Investment in Equipment and Software by Type
Billions of dollars Billions of chained (1996) dollars
1999 2000 2001 1999 2000 2001
Private fixed investment in equipment and software........................................ 898.7 960.8 886.4 984.8 1,065.4 997.6
Nonresidential equipment and software ............ 889.8 951.6 877.1 975.9 1,056.0 988.2
Information processing equipment and software....................................................... 402.3 446.9 404.3 508.1 583.3 548.5
Computers and peripheral equipment 1........ 90.4 93.3 74.2 207.4 246.4 239.9 Software 2.................................................... 162.5 179.4 180.4 169.3 184.4 182.0 Communication equipment ......................... 93.7 116.6 90.6 102.5 132.1 105.8 Instruments................................................. 38.2 40.6 43.6 37.9 40.1 42.6 Photocopy and related equipment ............... 10.5 9.5 8.0 10.7 9.5 8.0 Office and accounting equipment ................ 7.0 7.5 7.6 7.1 7.5 7.8
Industrial equipment ....................................... 150.4 164.9 159.0 147.5 160.8 153.8 Fabricated metal products ........................... 13.4 13.8 13.7 13.5 13.9 13.4 Engines and turbines................................... 5.7 7.0 9.3 5.4 6.6 8.8 Metalworking machinery ............................. 34.2 35.3 31.3 33.6 34.6 30.5 Special industry machinery, n.e.c. ............... 38.3 44.4 41.0 37.2 43.0 39.4 General industrial, including materials
handling, equipment ............................... 34.0 36.6 34.4 33.0 35.3 32.9 Electrical transmission, distribution, and
industrial apparatus.................................. 24.8 27.8 29.3 24.8 27.3 28.7
Transportation equipment ............................... 194.7 189.7 165.8 193.2 186.6 163.6 Trucks, buses, and truck trailers................. 112.3 107.4 90.1 112.4 106.5 90.5 Autos .......................................................... 43.1 40.5 34.1 42.5 40.8 35.4 Aircraft........................................................ 29.1 31.5 33.7 28.3 29.3 29.8 Ships and boats.......................................... 2.7 3.2 3.2 2.6 2.9 2.9 Railroad equipment .................................... 7.6 7.1 4.7 7.7 7.2 4.8
Other equipment ............................................. 145.6 153.4 150.8 141.8 148.5 144.5 Furniture and fixtures.................................. 38.1 40.6 35.7 37.1 39.2 34.0 Tractors....................................................... 12.8 13.7 14.5 12.5 13.4 14.1 Agricultural machinery, except tractors....... 9.9 10.8 12.0 9.5 10.3 11.3 Construction machinery, except tractors..... 21.6 21.7 19.9 20.4 20.4 18.5 Mining and oilfield machinery ..................... 5.6 5.2 6.5 5.3 5.0 5.9 Service industry machinery ........................ 16.5 16.4 16.1 15.9 15.7 15.3 Electrical equipment, n.e.c. ......................... 14.4 16.4 17.9 14.9 17.3 19.0 Other........................................................... 26.8 28.4 28.2 26.2 27.4 26.8
Less: Sale of equipment scrap, excluding autos .......................................................... 3.2 3.3 2.8 4.1 3.8 3.5
Residential equipment........................................ 8.8 9.3 9.3 9.0 9.4 9.5
Residual ............................................................... .............. .............. .............. –37.8 –56.3 –56.5
Addenda: Private fixed investment in equipment and
software ....................................................... 898.7 960.8 886.4 .............. .............. .............. Less: Dealers’ margin on used equipment....... 8.1 8.8 8.6 .............. .............. ..............
Net purchases of used equipment from government ....................................... 1.0 1.0 .9 .............. .............. ..............
Plus: Net sales of used equipment .................. 39.3 38.5 32.5 .............. .............. .............. Net exports of used equipment .............. .4 –.2 .0 .............. .............. .............. Sale of equipment scrap ........................ 3.3 3.4 2.9 .............. .............. ..............
Equals: Private fixed investment in new equipment and software.............................. 932.6 992.7 912.4 .............. .............. ..............
1. Includes new computers and peripheral equipment only. Because of rapid changes in relative prices, thechained-dollar estimates for computers are especially misleading as a measure of the contribution or relativeimportance of this component.
2. Excludes software “embedded,” or bundled, in computers and other equipment.
NOTE. Chained (1996) dollar series are calculated as the product of the chain-type quantity index and the 1996current-dollar value of the corresponding series, divided by 100. Because the formula for the chain-type quantityindexes uses weights of more than one period, the corresponding chained-dollar estimates are usually not addi-tive. The residual line is the difference between the first line and the sum of the most detailed lines.
n.e.c. Not elsewhere classified.
D–34 National Data August 2003
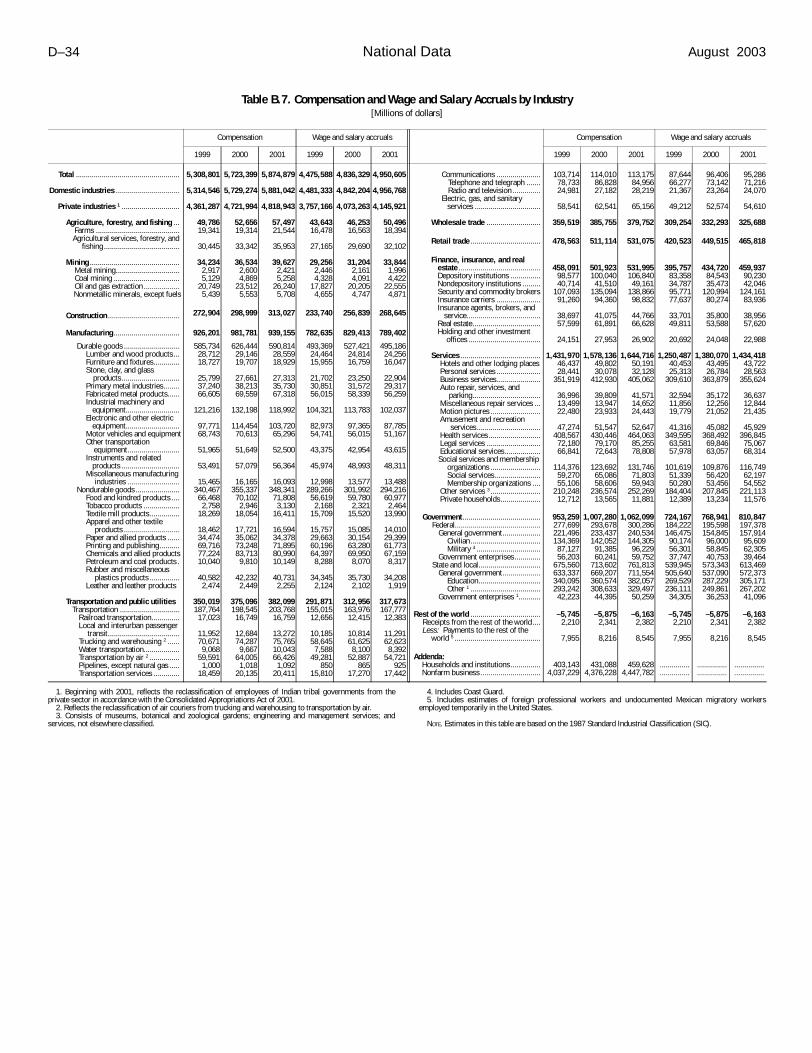
Compensation Wage and salary accruals
1999 2000 2001 1999 2000 2001
Total .................................................... 5,308,801 5,723,399 5,874,879 4,475,588 4,836,329 4,950,605
Domestic industries ................................ 5,314,546 5,729,274 5,881,042 4,481,333 4,842,204 4,956,768
Private industries 1 ............................. 4,361,287 4,721,994 4,818,943 3,757,166 4,073,263 4,145,921
Agriculture, forestry, and fishing ... 49,786 52,656 57,497 43,643 46,253 50,496 Farms .......................................... 19,341 19,314 21,544 16,478 16,563 18,394 Agricultural services, forestry, and
fishing...................................... 30,445 33,342 35,953 27,165 29,690 32,102
Mining ............................................. 34,234 36,534 39,627 29,256 31,204 33,844 Metal mining................................ 2,917 2,600 2,421 2,446 2,161 1,996 Coal mining ................................. 5,129 4,869 5,258 4,328 4,091 4,422 Oil and gas extraction .................. 20,749 23,512 26,240 17,827 20,205 22,555 Nonmetallic minerals, except fuels 5,439 5,553 5,708 4,655 4,747 4,871
Construction .................................... 272,904 298,999 313,027 233,740 256,839 268,645
Manufacturing ................................. 926,201 981,781 939,155 782,635 829,413 789,402
Durable goods ............................ 585,734 626,444 590,814 493,369 527,421 495,186 Lumber and wood products... 28,712 29,146 28,559 24,464 24,814 24,256 Furniture and fixtures............. 18,727 19,707 18,929 15,955 16,759 16,047 Stone, clay, and glass
products............................. 25,799 27,661 27,313 21,702 23,250 22,904 Primary metal industries........ 37,240 38,213 35,730 30,851 31,572 29,317 Fabricated metal products...... 66,605 69,559 67,318 56,015 58,339 56,259 Industrial machinery and
equipment........................... 121,216 132,198 118,992 104,321 113,783 102,037 Electronic and other electric
equipment........................... 97,771 114,454 103,720 82,973 97,365 87,785 Motor vehicles and equipment 68,743 70,613 65,296 54,741 56,015 51,167 Other transportation
equipment.......................... 51,965 51,649 52,500 43,375 42,954 43,615 Instruments and related
products ............................. 53,491 57,079 56,364 45,974 48,993 48,311 Miscellaneous manufacturing
industries .......................... 15,465 16,165 16,093 12,998 13,577 13,488 Nondurable goods ...................... 340,467 355,337 348,341 289,266 301,992 294,216
Food and kindred products .... 66,468 70,102 71,808 56,619 59,780 60,977 Tobacco products .................. 2,758 2,946 3,130 2,168 2,321 2,464 Textile mill products............... 18,269 18,054 16,411 15,709 15,520 13,990 Apparel and other textile
products ............................ 18,462 17,721 16,594 15,757 15,085 14,010 Paper and allied products ...... 34,474 35,062 34,378 29,663 30,154 29,399 Printing and publishing.......... 69,716 73,248 71,895 60,196 63,280 61,773 Chemicals and allied products 77,224 83,713 80,990 64,397 69,950 67,159 Petroleum and coal products . 10,040 9,810 10,149 8,288 8,070 8,317 Rubber and miscellaneous
plastics products ............... 40,582 42,232 40,731 34,345 35,730 34,208 Leather and leather products 2,474 2,449 2,255 2,124 2,102 1,919
Transportation and public utilities 350,019 375,096 382,099 291,871 312,956 317,673 Transportation .............................. 187,764 198,545 203,768 155,015 163,976 167,777 Railroad transportation.............. 17,023 16,749 16,759 12,656 12,415 12,383 Local and interurban passenger
transit.................................... 11,952 12,684 13,272 10,185 10,814 11,291 Trucking and warehousing 2 ...... 70,671 74,287 75,765 58,645 61,625 62,623 Water transportation.................. 9,068 9,667 10,043 7,588 8,100 8,392 Transportation by air 2 ............... 59,591 64,005 66,426 49,281 52,887 54,721 Pipelines, except natural gas ..... 1,000 1,018 1,092 850 865 925 Transportation services ............. 18,459 20,135 20,411 15,810 17,270 17,442
Compensation Wage and salary accruals
1999 2000 2001 1999 2000 2001
Communications ...................... 103,714 114,010 113,175 87,644 96,406 95,286 Telephone and telegraph ....... 78,733 86,828 84,956 66,277 73,142 71,216 Radio and television .............. 24,981 27,182 28,219 21,367 23,264 24,070
Electric, gas, and sanitary services ................................. 58,541 62,541 65,156 49,212 52,574 54,610
Wholesale trade ........................... 359,519 385,755 379,752 309,254 332,293 325,688
Retail trade ................................... 478,563 511,114 531,075 420,523 449,515 465,818
Finance, insurance, and real estate ......................................... 458,091 501,923 531,995 395,757 434,720 459,937
Depository institutions ............... 98,577 100,040 106,840 83,358 84,543 90,230 Nondepository institutions ......... 40,714 41,510 49,161 34,787 35,473 42,046 Security and commodity brokers 107,093 135,094 138,866 95,771 120,994 124,161 Insurance carriers ...................... 91,260 94,360 98,832 77,637 80,274 83,936 Insurance agents, brokers, and
service..................................... 38,697 41,075 44,766 33,701 35,800 38,956 Real estate.................................. 57,599 61,891 66,628 49,811 53,588 57,620 Holding and other investment
offices .................................... 24,151 27,953 26,902 20,692 24,048 22,988
Services ........................................ 1,431,970 1,578,136 1,644,716 1,250,487 1,380,070 1,434,418 Hotels and other lodging places 46,437 49,802 50,191 40,453 43,495 43,722 Personal services ...................... 28,441 30,078 32,128 25,313 26,784 28,563 Business services...................... 351,919 412,930 405,062 309,610 363,879 355,624 Auto repair, services, and
parking.................................. 36,996 39,809 41,571 32,594 35,172 36,637 Miscellaneous repair services ... 13,499 13,947 14,652 11,856 12,256 12,844 Motion pictures ......................... 22,480 23,933 24,443 19,779 21,052 21,435 Amusement and recreation
services................................ 47,274 51,547 52,647 41,316 45,082 45,929 Health services.......................... 408,567 430,446 464,063 349,595 368,492 396,845 Legal services ........................... 72,180 79,170 85,255 63,581 69,846 75,067 Educational services.................. 66,841 72,643 78,808 57,978 63,057 68,314 Social services and membership
organizations ......................... 114,376 123,692 131,746 101,619 109,876 116,749 Social services....................... 59,270 65,086 71,803 51,339 56,420 62,197 Membership organizations .... 55,106 58,606 59,943 50,280 53,456 54,552
Other services 3 ......................... 210,248 236,574 252,269 184,404 207,845 221,113 Private households.................... 12,712 13,565 11,881 12,389 13,234 11,576
Government ....................................... 953,259 1,007,280 1,062,099 724,167 768,941 810,847 Federal........................................... 277,699 293,678 300,286 184,222 195,598 197,378 General government................... 221,496 233,437 240,534 146,475 154,845 157,914
Civilian................................... 134,369 142,052 144,305 90,174 96,000 95,609 Military 4 ................................ 87,127 91,385 96,229 56,301 58,845 62,305
Government enterprises............. 56,203 60,241 59,752 37,747 40,753 39,464 State and local............................... 675,560 713,602 761,813 539,945 573,343 613,469 General government................... 633,337 669,207 711,554 505,640 537,090 572,373
Education............................... 340,095 360,574 382,057 269,529 287,229 305,171 Other 1 ................................... 293,242 308,633 329,497 236,111 249,861 267,202
Government enterprises 1........... 42,223 44,395 50,259 34,305 36,253 41,096
Rest of the world ................................... –5,745 –5,875 –6,163 –5,745 –5,875 –6,163 Receipts from the rest of the world.... 2,210 2,341 2,382 2,210 2,341 2,382 Less: Payments to the rest of the
world 5 ........................................... 7,955 8,216 8,545 7,955 8,216 8,545
Addenda: Households and institutions............... 403,143 431,088 459,628 ............... ............... ............... Nonfarm business .............................. 4,037,229 4,376,228 4,447,782 ............... ............... ...............
Table B.7. Compensation and Wage and Salary Accruals by Industry[Millions of dollars]
1. Beginning with 2001, reflects the reclassification of employees of Indian tribal governments from theprivate sector in accordance with the Consolidated Appropriations Act of 2001.
2. Reflects the reclassification of air couriers from trucking and warehousing to transportation by air.3. Consists of museums, botanical and zoological gardens; engineering and management services; and
services, not elsewhere classified.
4. Includes Coast Guard.5. Includes estimates of foreign professional workers and undocumented Mexican migratory workers
employed temporarily in the United States.
NOTE. Estimates in this table are based on the 1987 Standard Industrial Classification (SIC).
August 2003 SURVEY OF CURRENT BUSINESS D–35
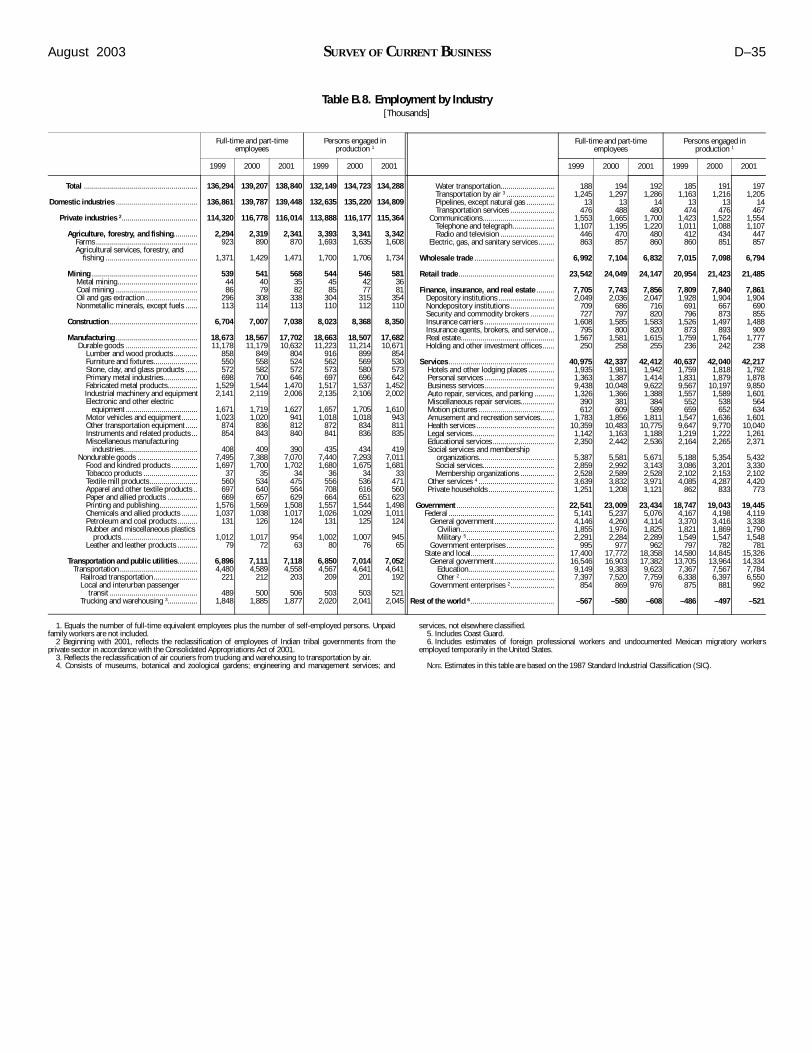
Full-time and part-time employees
Persons engaged in production 1
1999 2000 2001 1999 2000 2001
Total ......................................................... 136,294 139,207 138,840 132,149 134,723 134,288
Domestic industries ......................................... 136,861 139,787 139,448 132,635 135,220 134,809
Private industries 2...................................... 114,320 116,778 116,014 113,888 116,177 115,364
Agriculture, forestry, and fishing............ 2,294 2,319 2,341 3,393 3,341 3,342 Farms................................................... 923 890 870 1,693 1,635 1,608 Agricultural services, forestry, and
fishing .............................................. 1,371 1,429 1,471 1,700 1,706 1,734
Mining ..................................................... 539 541 568 544 546 581 Metal mining........................................ 44 40 35 45 42 36 Coal mining ......................................... 86 79 82 85 77 81 Oil and gas extraction .......................... 296 308 338 304 315 354 Nonmetallic minerals, except fuels ...... 113 114 113 110 112 110
Construction ............................................ 6,704 7,007 7,038 8,023 8,368 8,350
Manufacturing ......................................... 18,673 18,567 17,702 18,663 18,507 17,682 Durable goods .................................... 11,178 11,179 10,632 11,223 11,214 10,671 Lumber and wood products............ 858 849 804 916 899 854 Furniture and fixtures...................... 550 558 524 562 569 530 Stone, clay, and glass products ...... 572 582 572 573 580 573 Primary metal industries................. 698 700 646 697 696 642 Fabricated metal products............... 1,529 1,544 1,470 1,517 1,537 1,452 Industrial machinery and equipment 2,141 2,119 2,006 2,135 2,106 2,002 Electronic and other electric
equipment .................................... 1,671 1,719 1,627 1,657 1,705 1,610 Motor vehicles and equipment........ 1,023 1,020 941 1,018 1,018 943 Other transportation equipment ...... 874 836 812 872 834 811 Instruments and related products... 854 843 840 841 836 835 Miscellaneous manufacturing
industries..................................... 408 409 390 435 434 419 Nondurable goods .............................. 7,495 7,388 7,070 7,440 7,293 7,011 Food and kindred products ............. 1,697 1,700 1,702 1,680 1,675 1,681 Tobacco products ........................... 37 35 34 36 34 33 Textile mill products........................ 560 534 475 556 536 471 Apparel and other textile products .. 697 640 564 708 616 560 Paper and allied products ............... 669 657 629 664 651 623 Printing and publishing................... 1,576 1,569 1,508 1,557 1,544 1,498 Chemicals and allied products ........ 1,037 1,038 1,017 1,026 1,029 1,011 Petroleum and coal products .......... 131 126 124 131 125 124 Rubber and miscellaneous plastics
products...................................... 1,012 1,017 954 1,002 1,007 945 Leather and leather products .......... 79 72 63 80 76 65
Transportation and public utilities.......... 6,896 7,111 7,118 6,850 7,014 7,052 Transportation ....................................... 4,480 4,589 4,558 4,567 4,641 4,641 Railroad transportation...................... 221 212 203 209 201 192 Local and interurban passenger
transit ............................................ 489 500 506 503 503 521 Trucking and warehousing 3............... 1,848 1,885 1,877 2,020 2,041 2,045
Full-time and part-time employees
Persons engaged in production 1
1999 2000 2001 1999 2000 2001
Water transportation........................... 188 194 192 185 191 197 Transportation by air 3 ........................ 1,245 1,297 1,286 1,163 1,216 1,205 Pipelines, except natural gas .............. 13 13 14 13 13 14 Transportation services ...................... 476 488 480 474 476 467
Communications.................................... 1,553 1,665 1,700 1,423 1,522 1,554 Telephone and telegraph..................... 1,107 1,195 1,220 1,011 1,088 1,107 Radio and television ........................... 446 470 480 412 434 447
Electric, gas, and sanitary services........ 863 857 860 860 851 857
Wholesale trade ........................................ 6,992 7,104 6,832 7,015 7,098 6,794
Retail trade................................................ 23,542 24,049 24,147 20,954 21,423 21,485
Finance, insurance, and real estate ......... 7,705 7,743 7,856 7,809 7,840 7,861 Depository institutions ............................ 2,049 2,036 2,047 1,928 1,904 1,904 Nondepository institutions ...................... 709 686 716 691 667 690 Security and commodity brokers ............ 727 797 820 796 873 855 Insurance carriers ................................... 1,608 1,585 1,583 1,526 1,497 1,488 Insurance agents, brokers, and service ... 795 800 820 873 893 909 Real estate............................................... 1,567 1,581 1,615 1,759 1,764 1,777 Holding and other investment offices...... 250 258 255 236 242 238
Services ..................................................... 40,975 42,337 42,412 40,637 42,040 42,217 Hotels and other lodging places ............. 1,935 1,981 1,942 1,759 1,818 1,792 Personal services ................................... 1,363 1,387 1,414 1,831 1,879 1,878 Business services................................... 9,438 10,048 9,622 9,567 10,197 9,850 Auto repair, services, and parking .......... 1,326 1,366 1,388 1,557 1,589 1,601 Miscellaneous repair services................. 390 381 384 552 538 564 Motion pictures ...................................... 612 609 589 659 652 634 Amusement and recreation services....... 1,783 1,856 1,811 1,547 1,636 1,601 Health services ....................................... 10,359 10,483 10,775 9,647 9,770 10,040 Legal services......................................... 1,142 1,163 1,188 1,219 1,222 1,261 Educational services............................... 2,350 2,442 2,536 2,164 2,265 2,371 Social services and membership
organizations...................................... 5,387 5,581 5,671 5,188 5,354 5,432 Social services.................................... 2,859 2,992 3,143 3,086 3,201 3,330 Membership organizations ................. 2,528 2,589 2,528 2,102 2,153 2,102
Other services 4 ...................................... 3,639 3,832 3,971 4,085 4,287 4,420 Private households ................................. 1,251 1,208 1,121 862 833 773
Government ................................................. 22,541 23,009 23,434 18,747 19,043 19,445 Federal ..................................................... 5,141 5,237 5,076 4,167 4,198 4,119 General government .............................. 4,146 4,260 4,114 3,370 3,416 3,338 Civilian............................................... 1,855 1,976 1,825 1,821 1,869 1,790 Military 5............................................ 2,291 2,284 2,289 1,549 1,547 1,548
Government enterprises ........................ 995 977 962 797 782 781 State and local.......................................... 17,400 17,772 18,358 14,580 14,845 15,326 General government .............................. 16,546 16,903 17,382 13,705 13,964 14,334 Education........................................... 9,149 9,383 9,623 7,367 7,567 7,784 Other 2 ............................................... 7,397 7,520 7,759 6,338 6,397 6,550
Government enterprises 2...................... 854 869 976 875 881 992
Rest of the world 6 .......................................... –567 –580 –608 –486 –497 –521
Table B.8. Employment by Industry[Thousands]
1. Equals the number of full-time equivalent employees plus the number of self-employed persons. Unpaidfamily workers are not included.
2 Beginning with 2001, reflects the reclassification of employees of Indian tribal governments from theprivate sector in accordance with the Consolidated Appropriations Act of 2001.
3. Reflects the reclassification of air couriers from trucking and warehousing to transportation by air.4. Consists of museums, botanical and zoological gardens; engineering and management services; and
services, not elsewhere classified.5. Includes Coast Guard.6. Includes estimates of foreign professional workers and undocumented Mexican migratory workers
employed temporarily in the United States.
NOTE. Estimates in this table are based on the 1987 Standard Industrial Classification (SIC).
D–36 National Data August 2003
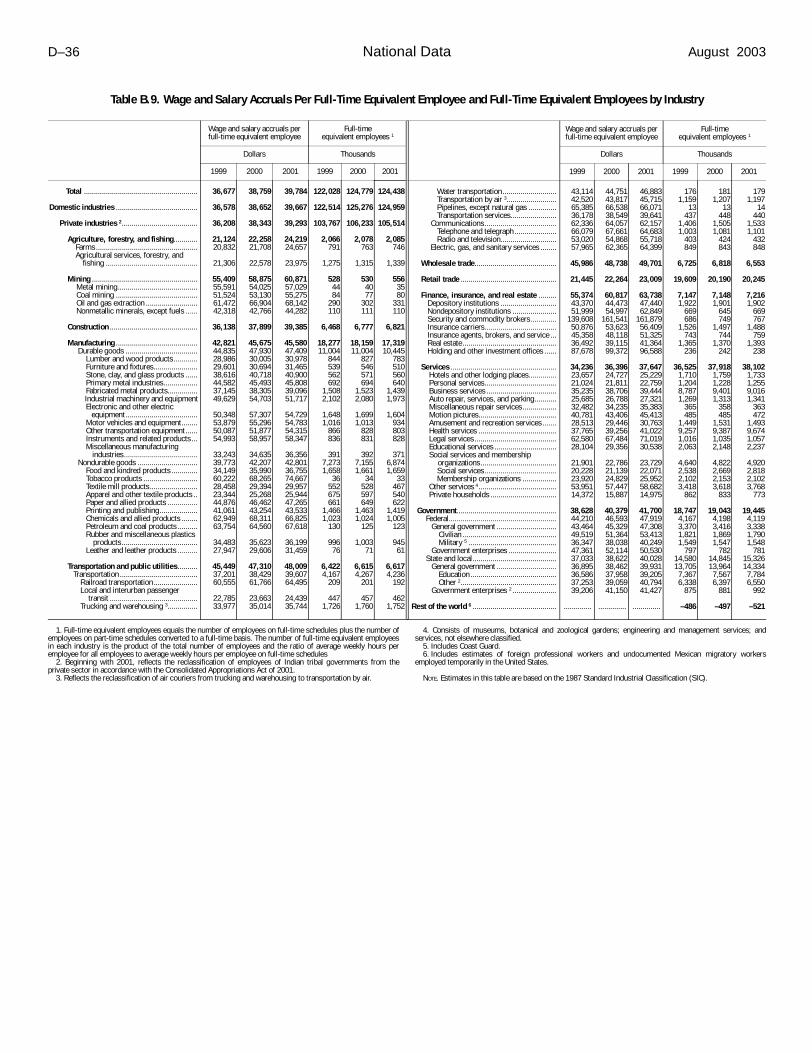
Wage and salary accruals per full-time equivalent employee
Full-timeequivalent employees 1
Dollars Thousands
1999 2000 2001 1999 2000 2001
Water transportation........................... 43,114 44,751 46,883 176 181 179Transportation by air 3......................... 42,520 43,817 45,715 1,159 1,207 1,197
Pipelines, except natural gas .............. 65,385 66,538 66,071 13 13 14 Transportation services....................... 36,178 38,549 39,641 437 448 440
Communications.................................... 62,336 64,057 62,157 1,406 1,505 1,533 Telephone and telegraph ..................... 66,079 67,661 64,683 1,003 1,081 1,101 Radio and television............................ 53,020 54,868 55,718 403 424 432
Electric, gas, and sanitary services ........ 57,965 62,365 64,399 849 843 848
Wholesale trade......................................... 45,986 48,738 49,701 6,725 6,818 6,553
Retail trade ................................................ 21,445 22,264 23,009 19,609 20,190 20,245
Finance, insurance, and real estate ......... 55,374 60,817 63,738 7,147 7,148 7,216 Depository institutions ............................ 43,370 44,473 47,440 1,922 1,901 1,902 Nondepository institutions ...................... 51,999 54,997 62,849 669 645 669 Security and commodity brokers............. 139,608 161,541 161,879 686 749 767 Insurance carriers.................................... 50,876 53,623 56,409 1,526 1,497 1,488 Insurance agents, brokers, and service ... 45,358 48,118 51,325 743 744 759 Real estate ............................................... 36,492 39,115 41,364 1,365 1,370 1,393 Holding and other investment offices ...... 87,678 99,372 96,588 236 242 238
Services ..................................................... 34,236 36,396 37,647 36,525 37,918 38,102 Hotels and other lodging places.............. 23,657 24,727 25,229 1,710 1,759 1,733 Personal services.................................... 21,024 21,811 22,759 1,204 1,228 1,255 Business services ................................... 35,235 38,706 39,444 8,787 9,401 9,016 Auto repair, services, and parking........... 25,685 26,788 27,321 1,269 1,313 1,341 Miscellaneous repair services................. 32,482 34,235 35,383 365 358 363 Motion pictures....................................... 40,781 43,406 45,413 485 485 472 Amusement and recreation services ....... 28,513 29,446 30,763 1,449 1,531 1,493 Health services ....................................... 37,765 39,256 41,022 9,257 9,387 9,674 Legal services......................................... 62,580 67,484 71,019 1,016 1,035 1,057 Educational services ............................... 28,104 29,356 30,538 2,063 2,148 2,237 Social services and membership
organizations...................................... 21,901 22,786 23,729 4,640 4,822 4,920 Social services.................................... 20,228 21,139 22,071 2,538 2,669 2,818 Membership organizations ................. 23,920 24,829 25,952 2,102 2,153 2,102
Other services 4....................................... 53,951 57,447 58,682 3,418 3,618 3,768 Private households ................................. 14,372 15,887 14,975 862 833 773
Government.................................................. 38,628 40,379 41,700 18,747 19,043 19,445 Federal...................................................... 44,210 46,593 47,919 4,167 4,198 4,119 General government .............................. 43,464 45,329 47,308 3,370 3,416 3,338 Civilian ............................................... 49,519 51,364 53,413 1,821 1,869 1,790 Military 5 ............................................ 36,347 38,038 40,249 1,549 1,547 1,548
Government enterprises ........................ 47,361 52,114 50,530 797 782 781 State and local.......................................... 37,033 38,622 40,028 14,580 14,845 15,326 General government .............................. 36,895 38,462 39,931 13,705 13,964 14,334 Education ........................................... 36,586 37,958 39,205 7,367 7,567 7,784 Other 2................................................ 37,253 39,059 40,794 6,338 6,397 6,550
Government enterprises 2 ...................... 39,206 41,150 41,427 875 881 992
Rest of the world 6 .......................................... .............. .............. .............. –486 –497 –521
Table B.9. Wage and Salary Accruals Per Full-Time Equivalent Employee and Full-Time Equivalent Employees by Industry
Wage and salary accruals per full-time equivalent employee
Full-timeequivalent employees 1
Dollars Thousands
1999 2000 2001 1999 2000 2001
Total ......................................................... 36,677 38,759 39,784 122,028 124,779 124,438
Domestic industries ......................................... 36,578 38,652 39,667 122,514 125,276 124,959
Private industries 2...................................... 36,208 38,343 39,293 103,767 106,233 105,514
Agriculture, forestry, and fishing............ 21,124 22,258 24,219 2,066 2,078 2,085 Farms................................................... 20,832 21,708 24,657 791 763 746 Agricultural services, forestry, and
fishing .............................................. 21,306 22,578 23,975 1,275 1,315 1,339
Mining ..................................................... 55,409 58,875 60,871 528 530 556 Metal mining........................................ 55,591 54,025 57,029 44 40 35 Coal mining ......................................... 51,524 53,130 55,275 84 77 80 Oil and gas extraction .......................... 61,472 66,904 68,142 290 302 331 Nonmetallic minerals, except fuels ...... 42,318 42,766 44,282 110 111 110
Construction ............................................ 36,138 37,899 39,385 6,468 6,777 6,821
Manufacturing ......................................... 42,821 45,675 45,580 18,277 18,159 17,319 Durable goods .................................... 44,835 47,930 47,409 11,004 11,004 10,445 Lumber and wood products............ 28,986 30,005 30,978 844 827 783 Furniture and fixtures...................... 29,601 30,694 31,465 539 546 510 Stone, clay, and glass products ...... 38,616 40,718 40,900 562 571 560 Primary metal industries................. 44,582 45,493 45,808 692 694 640 Fabricated metal products............... 37,145 38,305 39,096 1,508 1,523 1,439 Industrial machinery and equipment 49,629 54,703 51,717 2,102 2,080 1,973 Electronic and other electric
equipment .................................... 50,348 57,307 54,729 1,648 1,699 1,604 Motor vehicles and equipment........ 53,879 55,296 54,783 1,016 1,013 934 Other transportation equipment ...... 50,087 51,877 54,315 866 828 803 Instruments and related products... 54,993 58,957 58,347 836 831 828 Miscellaneous manufacturing
industries..................................... 33,243 34,635 36,356 391 392 371 Nondurable goods .............................. 39,773 42,207 42,801 7,273 7,155 6,874 Food and kindred products ............. 34,149 35,990 36,755 1,658 1,661 1,659 Tobacco products ........................... 60,222 68,265 74,667 36 34 33 Textile mill products........................ 28,458 29,394 29,957 552 528 467 Apparel and other textile products .. 23,344 25,268 25,944 675 597 540 Paper and allied products ............... 44,876 46,462 47,265 661 649 622 Printing and publishing................... 41,061 43,254 43,533 1,466 1,463 1,419 Chemicals and allied products ........ 62,949 68,311 66,825 1,023 1,024 1,005 Petroleum and coal products .......... 63,754 64,560 67,618 130 125 123 Rubber and miscellaneous plastics
products...................................... 34,483 35,623 36,199 996 1,003 945 Leather and leather products .......... 27,947 29,606 31,459 76 71 61
Transportation and public utilities.......... 45,449 47,310 48,009 6,422 6,615 6,617 Transportation ....................................... 37,201 38,429 39,607 4,167 4,267 4,236 Railroad transportation...................... 60,555 61,766 64,495 209 201 192 Local and interurban passenger
transit ............................................ 22,785 23,663 24,439 447 457 462 Trucking and warehousing 3............... 33,977 35,014 35,744 1,726 1,760 1,752
1. Full-time equivalent employees equals the number of employees on full-time schedules plus the number ofemployees on part-time schedules converted to a full-time basis. The number of full-time equivalent employeesin each industry is the product of the total number of employees and the ratio of average weekly hours peremployee for all employees to average weekly hours per employee on full-time schedules
2. Beginning with 2001, reflects the reclassification of employees of Indian tribal governments from theprivate sector in accordance with the Consolidated Appropriations Act of 2001.
3. Reflects the reclassification of air couriers from trucking and warehousing to transportation by air.
4. Consists of museums, botanical and zoological gardens; engineering and management services; andservices, not elsewhere classified.
5. Includes Coast Guard.6. Includes estimates of foreign professional workers and undocumented Mexican migratory workers
employed temporarily in the United States.
NOTE. Estimates in this table are based on the 1987 Standard Industrial Classification (SIC).
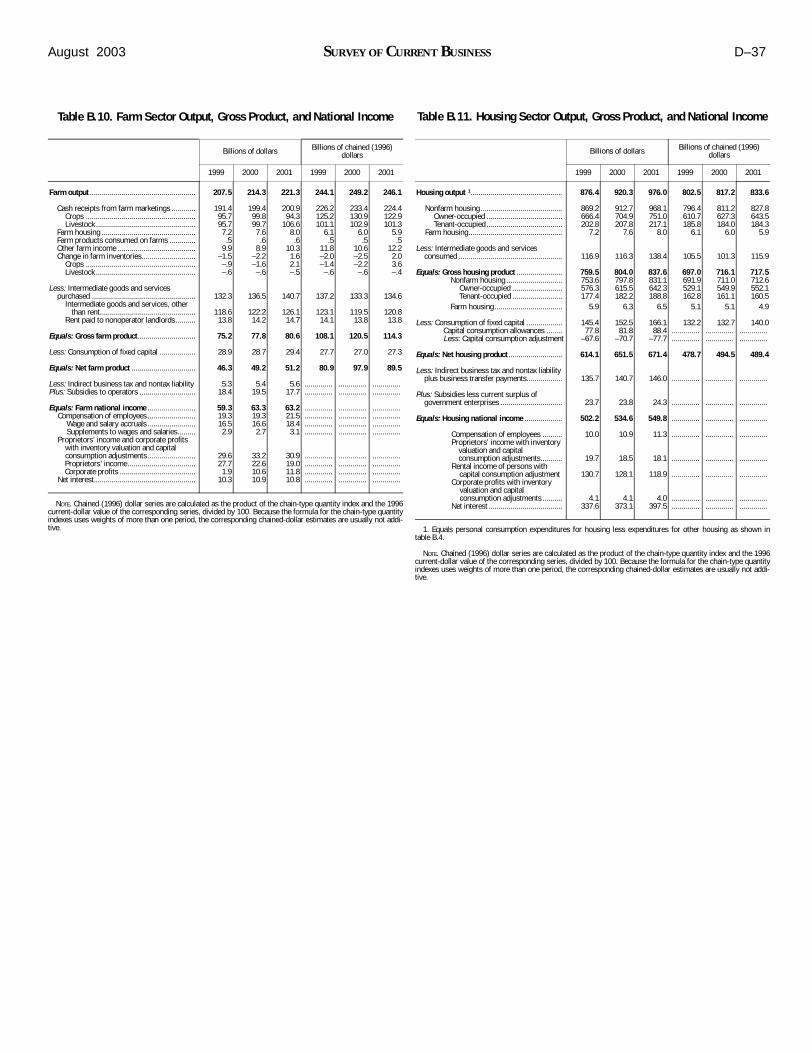
August 2003 SURVEY OF CURRENT BUSINESS D–37
Table B.10. Farm Sector Output, Gross Product, and National Income
Billions of dollars Billions of chained (1996) dollars
1999 2000 2001 1999 2000 2001
Farm output ..................................................... 207.5 214.3 221.3 244.1 249.2 246.1
Cash receipts from farm marketings ............ 191.4 199.4 200.9 226.2 233.4 224.4 Crops ....................................................... 95.7 99.8 94.3 125.2 130.9 122.9 Livestock .................................................. 95.7 99.7 106.6 101.1 102.9 101.3
Farm housing ............................................... 7.2 7.6 8.0 6.1 6.0 5.9 Farm products consumed on farms ............. .5 .6 .6 .5 .5 .5 Other farm income ....................................... 9.9 8.9 10.3 11.8 10.6 12.2 Change in farm inventories........................... –1.5 –2.2 1.6 –2.0 –2.5 2.0
Crops ....................................................... –.9 –1.6 2.1 –1.4 –2.2 3.6 Livestock .................................................. –.6 –.6 –.5 –.6 –.6 –.4
Less: Intermediate goods and services purchased .................................................... 132.3 136.5 140.7 137.2 133.3 134.6
Intermediate goods and services, other than rent................................................ 118.6 122.2 126.1 123.1 119.5 120.8
Rent paid to nonoperator landlords.......... 13.8 14.2 14.7 14.1 13.8 13.8
Equals: Gross farm product............................. 75.2 77.8 80.6 108.1 120.5 114.3
Less: Consumption of fixed capital .................. 28.9 28.7 29.4 27.7 27.0 27.3
Equals: Net farm product ................................ 46.3 49.2 51.2 80.9 97.9 89.5
Less: Indirect business tax and nontax liability 5.3 5.4 5.6 .............. .............. ..............Plus: Subsidies to operators ............................ 18.4 19.5 17.7 .............. .............. ..............
Equals: Farm national income ........................ 59.3 63.3 63.2 .............. .............. .............. Compensation of employees ........................ 19.3 19.3 21.5 .............. .............. ..............
Wage and salary accruals ........................ 16.5 16.6 18.4 .............. .............. .............. Supplements to wages and salaries......... 2.9 2.7 3.1 .............. .............. ..............
Proprietors’ income and corporate profits with inventory valuation and capital consumption adjustments........................ 29.6 33.2 30.9 .............. .............. ..............
Proprietors’ income.................................. 27.7 22.6 19.0 .............. .............. .............. Corporate profits ...................................... 1.9 10.6 11.8 .............. .............. ..............
Net interest................................................... 10.3 10.9 10.8 .............. .............. ..............
NOTE. Chained (1996) dollar series are calculated as the product of the chain-type quantity index and the 1996current-dollar value of the corresponding series, divided by 100. Because the formula for the chain-type quantityindexes uses weights of more than one period, the corresponding chained-dollar estimates are usually not addi-tive.
Table B.11. Housing Sector Output, Gross Product, and National Income
Billions of dollars Billions of chained (1996)
dollars
1999 2000 2001 1999 2000 2001
Housing output 1.............................................. 876.4 920.3 976.0 802.5 817.2 833.6
Nonfarm housing......................................... 869.2 912.7 968.1 796.4 811.2 827.8 Owner-occupied ...................................... 666.4 704.9 751.0 610.7 627.3 643.5 Tenant-occupied ...................................... 202.8 207.8 217.1 185.8 184.0 184.3
Farm housing............................................... 7.2 7.6 8.0 6.1 6.0 5.9
Less: Intermediate goods and services consumed .................................................... 116.9 116.3 138.4 105.5 101.3 115.9
Equals: Gross housing product ....................... 759.5 804.0 837.6 697.0 716.1 717.5 Nonfarm housing ............................ 753.6 797.8 831.1 691.9 711.0 712.6
Owner-occupied ......................... 576.3 615.5 642.3 529.1 549.9 552.1 Tenant-occupied ......................... 177.4 182.2 188.8 162.8 161.1 160.5
Farm housing.................................. 5.9 6.3 6.5 5.1 5.1 4.9
Less: Consumption of fixed capital .................. 145.4 152.5 166.1 132.2 132.7 140.0 Capital consumption allowances ........ 77.8 81.8 88.4 .............. .............. ..............
Less: Capital consumption adjustment –67.6 –70.7 –77.7 .............. .............. ..............
Equals: Net housing product ........................... 614.1 651.5 671.4 478.7 494.5 489.4
Less: Indirect business tax and nontax liability plus business transfer payments.................. 135.7 140.7 146.0 .............. .............. ..............
Plus: Subsidies less current surplus of government enterprises ............................... 23.7 23.8 24.3 .............. .............. ..............
Equals: Housing national income ................... 502.2 534.6 549.8 .............. .............. ..............
Compensation of employees .......... 10.0 10.9 11.3 .............. .............. .............. Proprietors’ income with inventory
valuation and capital consumption adjustments........... 19.7 18.5 18.1 .............. .............. ..............
Rental income of persons with capital consumption adjustment 130.7 128.1 118.9 .............. .............. ..............
Corporate profits with inventory valuation and capital consumption adjustments .......... 4.1 4.1 4.0 .............. .............. ..............
Net interest ..................................... 337.6 373.1 397.5 .............. .............. ..............
1. Equals personal consumption expenditures for housing less expenditures for other housing as shown intable B.4.
NOTE. Chained (1996) dollar series are calculated as the product of the chain-type quantity index and the 1996current-dollar value of the corresponding series, divided by 100. Because the formula for the chain-type quantityindexes uses weights of more than one period, the corresponding chained-dollar estimates are usually not addi-tive.
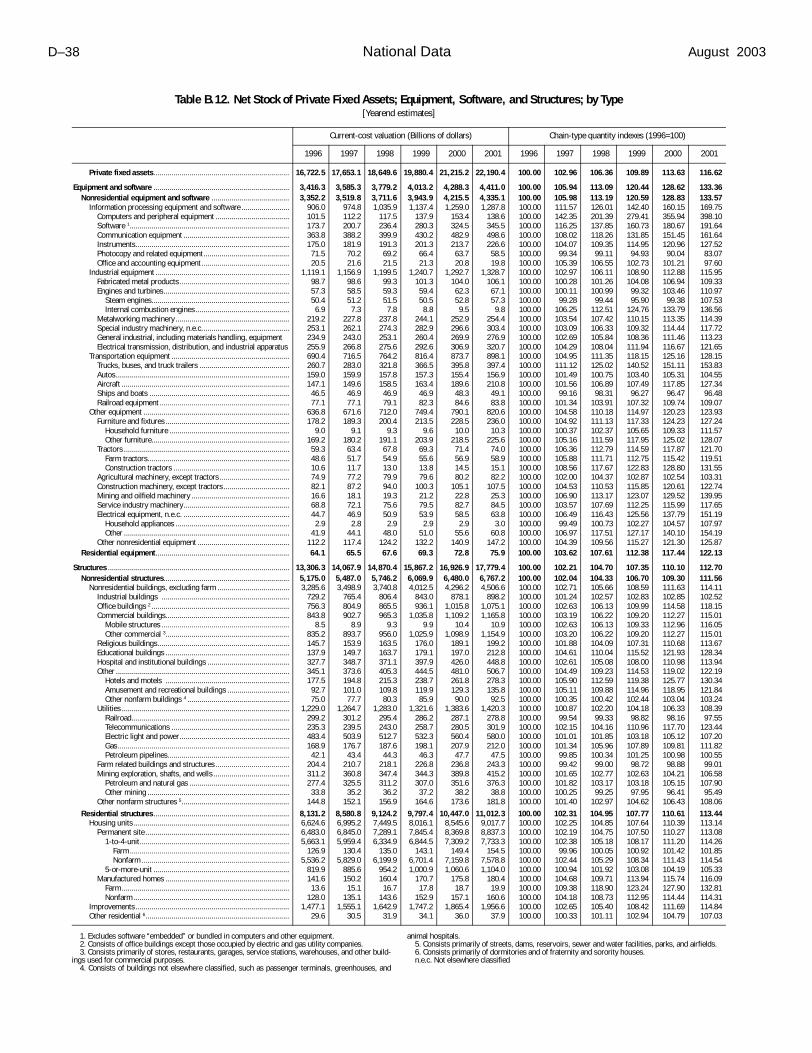
D–38 National Data August 2003
Table B.12. Net Stock of Private Fixed Assets; Equipment, Software, and Structures; by Type[Yearend estimates]
Current-cost valuation (Billions of dollars) Chain-type quantity indexes (1996=100)
1996 1997 1998 1999 2000 2001 1996 1997 1998 1999 2000 2001
Private fixed assets.................................................................... 16,722.5 17,653.1 18,649.6 19,880.4 21,215.2 22,190.4 100.00 102.96 106.36 109.89 113.63 116.62
Equipment and software .................................................................... 3,416.3 3,585.3 3,779.2 4,013.2 4,288.3 4,411.0 100.00 105.94 113.09 120.44 128.62 133.36Nonresidential equipment and software ....................................... 3,352.2 3,519.8 3,711.6 3,943.9 4,215.5 4,335.1 100.00 105.98 113.19 120.59 128.83 133.57
Information processing equipment and software ........................ 906.0 974.8 1,035.9 1,137.4 1,259.0 1,287.8 100.00 111.57 126.01 142.40 160.15 169.75Computers and peripheral equipment ..................................... 101.5 112.2 117.5 137.9 153.4 138.6 100.00 142.35 201.39 279.41 355.94 398.10Software 1................................................................................ 173.7 200.7 236.4 280.3 324.5 345.5 100.00 116.25 137.85 160.73 180.67 191.64Communication equipment ..................................................... 363.8 388.2 399.9 430.2 482.9 498.6 100.00 108.02 118.26 131.85 151.45 161.64Instruments............................................................................. 175.0 181.9 191.3 201.3 213.7 226.6 100.00 104.07 109.35 114.95 120.96 127.52Photocopy and related equipment........................................... 71.5 70.2 69.2 66.4 63.7 58.5 100.00 99.34 99.11 94.93 90.04 83.07Office and accounting equipment ............................................ 20.5 21.6 21.5 21.3 20.8 19.8 100.00 105.39 106.55 102.73 101.21 97.60
Industrial equipment ................................................................... 1,119.1 1,156.9 1,199.5 1,240.7 1,292.7 1,328.7 100.00 102.97 106.11 108.90 112.88 115.95Fabricated metal products....................................................... 98.7 98.6 99.3 101.3 104.0 106.1 100.00 100.28 101.26 104.08 106.94 109.33Engines and turbines............................................................... 57.3 58.5 59.3 59.4 62.3 67.1 100.00 100.11 100.99 99.32 103.46 110.97
Steam engines..................................................................... 50.4 51.2 51.5 50.5 52.8 57.3 100.00 99.28 99.44 95.90 99.38 107.53Internal combustion engines............................................... 6.9 7.3 7.8 8.8 9.5 9.8 100.00 106.25 112.51 124.76 133.79 136.56
Metalworking machinery ......................................................... 219.2 227.8 237.8 244.1 252.9 254.4 100.00 103.54 107.42 110.15 113.35 114.39Special industry machinery, n.e.c............................................ 253.1 262.1 274.3 282.9 296.6 303.4 100.00 103.09 106.33 109.32 114.44 117.72General industrial, including materials handling, equipment 234.9 243.0 253.1 260.4 269.9 276.9 100.00 102.69 105.84 108.36 111.46 113.23Electrical transmission, distribution, and industrial apparatus 255.9 266.8 275.6 292.6 306.9 320.7 100.00 104.29 108.04 111.94 116.67 121.65
Transportation equipment ........................................................... 690.4 716.5 764.2 816.4 873.7 898.1 100.00 104.95 111.35 118.15 125.16 128.15Trucks, buses, and truck trailers ............................................. 260.7 283.0 321.8 366.5 395.8 397.4 100.00 111.12 125.02 140.52 151.11 153.83Autos....................................................................................... 159.0 159.9 157.8 157.3 155.4 156.9 100.00 101.49 100.75 103.40 105.31 104.55Aircraft .................................................................................... 147.1 149.6 158.5 163.4 189.6 210.8 100.00 101.56 106.89 107.49 117.85 127.34Ships and boats ...................................................................... 46.5 46.9 46.9 46.9 48.3 49.1 100.00 99.16 98.31 96.27 96.47 96.48Railroad equipment ................................................................. 77.1 77.1 79.1 82.3 84.6 83.8 100.00 101.34 103.91 107.32 109.74 109.07
Other equipment ......................................................................... 636.8 671.6 712.0 749.4 790.1 820.6 100.00 104.58 110.18 114.97 120.23 123.93Furniture and fixtures .............................................................. 178.2 189.3 200.4 213.5 228.5 236.0 100.00 104.92 111.13 117.33 124.23 127.24
Household furniture ............................................................ 9.0 9.1 9.3 9.6 10.0 10.3 100.00 100.37 102.37 105.65 109.33 111.57Other furniture..................................................................... 169.2 180.2 191.1 203.9 218.5 225.6 100.00 105.16 111.59 117.95 125.02 128.07
Tractors ................................................................................... 59.3 63.4 67.8 69.3 71.4 74.0 100.00 106.36 112.79 114.59 117.87 121.70Farm tractors....................................................................... 48.6 51.7 54.9 55.6 56.9 58.9 100.00 105.88 111.71 112.75 115.42 119.51Construction tractors .......................................................... 10.6 11.7 13.0 13.8 14.5 15.1 100.00 108.56 117.67 122.83 128.80 131.55
Agricultural machinery, except tractors................................... 74.9 77.2 79.9 79.6 80.2 82.2 100.00 102.00 104.37 102.87 102.54 103.31Construction machinery, except tractors................................. 82.1 87.2 94.0 100.3 105.1 107.5 100.00 104.53 110.53 115.85 120.61 122.74Mining and oilfield machinery ................................................. 16.6 18.1 19.3 21.2 22.8 25.3 100.00 106.90 113.17 123.07 129.52 139.95Service industry machinery..................................................... 68.8 72.1 75.6 79.5 82.7 84.5 100.00 103.57 107.69 112.25 115.99 117.65Electrical equipment, n.e.c. ..................................................... 44.7 46.9 50.9 53.9 58.5 63.8 100.00 106.49 116.43 125.56 137.79 151.19
Household appliances ......................................................... 2.9 2.8 2.9 2.9 2.9 3.0 100.00 99.49 100.73 102.27 104.57 107.97Other ................................................................................... 41.9 44.1 48.0 51.0 55.6 60.8 100.00 106.97 117.51 127.17 140.10 154.19
Other nonresidential equipment .............................................. 112.2 117.4 124.2 132.2 140.9 147.2 100.00 104.39 109.56 115.27 121.30 125.87Residential equipment................................................................... 64.1 65.5 67.6 69.3 72.8 75.9 100.00 103.62 107.61 112.38 117.44 122.13
Structures ........................................................................................... 13,306.3 14,067.9 14,870.4 15,867.2 16,926.9 17,779.4 100.00 102.21 104.70 107.35 110.10 112.70Nonresidential structures............................................................... 5,175.0 5,487.0 5,746.2 6,069.9 6,480.0 6,767.2 100.00 102.04 104.33 106.70 109.30 111.56
Nonresidential buildings, excluding farm .................................... 3,285.6 3,498.9 3,740.8 4,012.5 4,296.2 4,506.6 100.00 102.71 105.66 108.59 111.63 114.11Industrial buildings ................................................................ 729.2 765.4 806.4 843.0 878.1 898.2 100.00 101.24 102.57 102.83 102.85 102.52Office buildings 2 ..................................................................... 756.3 804.9 865.5 936.1 1,015.8 1,075.1 100.00 102.63 106.13 109.99 114.58 118.15Commercial buildings.............................................................. 843.8 902.7 965.3 1,035.8 1,109.2 1,165.8 100.00 103.19 106.22 109.20 112.27 115.01
Mobile structures ................................................................ 8.5 8.9 9.3 9.9 10.4 10.9 100.00 102.63 106.13 109.33 112.96 116.05Other commercial 3.............................................................. 835.2 893.7 956.0 1,025.9 1,098.9 1,154.9 100.00 103.20 106.22 109.20 112.27 115.01
Religious buildings.................................................................. 145.7 153.9 163.5 176.0 189.1 199.2 100.00 101.88 104.09 107.31 110.68 113.67Educational buildings .............................................................. 137.9 149.7 163.7 179.1 197.0 212.8 100.00 104.61 110.04 115.52 121.93 128.34Hospital and institutional buildings ......................................... 327.7 348.7 371.1 397.9 426.0 448.8 100.00 102.61 105.08 108.00 110.98 113.94Other ....................................................................................... 345.1 373.6 405.3 444.5 481.0 506.7 100.00 104.49 109.23 114.53 119.02 122.19
Hotels and motels .............................................................. 177.5 194.8 215.3 238.7 261.8 278.3 100.00 105.90 112.59 119.38 125.77 130.34Amusement and recreational buildings ............................... 92.7 101.0 109.8 119.9 129.3 135.8 100.00 105.11 109.88 114.96 118.95 121.84Other nonfarm buildings 4 ................................................... 75.0 77.7 80.3 85.9 90.0 92.5 100.00 100.35 100.42 102.44 103.04 103.24
Utilities .................................................................................... 1,229.0 1,264.7 1,283.0 1,321.6 1,383.6 1,420.3 100.00 100.87 102.20 104.18 106.33 108.39Railroad............................................................................... 299.2 301.2 295.4 286.2 287.1 278.8 100.00 99.54 99.33 98.82 98.16 97.55Telecommunications ........................................................... 235.3 239.5 243.0 258.7 280.5 301.9 100.00 102.15 104.16 110.96 117.70 123.44Electric light and power....................................................... 483.4 503.9 512.7 532.3 560.4 580.0 100.00 101.01 101.85 103.18 105.12 107.20Gas...................................................................................... 168.9 176.7 187.6 198.1 207.9 212.0 100.00 101.34 105.96 107.89 109.81 111.82Petroleum pipelines............................................................. 42.1 43.4 44.3 46.3 47.7 47.5 100.00 99.85 100.34 101.25 100.98 100.55
Farm related buildings and structures ..................................... 204.4 210.7 218.1 226.8 236.8 243.3 100.00 99.42 99.00 98.72 98.88 99.01Mining exploration, shafts, and wells ...................................... 311.2 360.8 347.4 344.3 389.8 415.2 100.00 101.65 102.77 102.63 104.21 106.58
Petroleum and natural gas .................................................. 277.4 325.5 311.2 307.0 351.6 376.3 100.00 101.82 103.17 103.18 105.15 107.90Other mining ....................................................................... 33.8 35.2 36.2 37.2 38.2 38.8 100.00 100.25 99.25 97.95 96.41 95.49
Other nonfarm structures 5...................................................... 144.8 152.1 156.9 164.6 173.6 181.8 100.00 101.40 102.97 104.62 106.43 108.06Residential structures .................................................................... 8,131.2 8,580.8 9,124.2 9,797.4 10,447.0 11,012.3 100.00 102.31 104.95 107.77 110.61 113.44
Housing units .............................................................................. 6,624.6 6,995.2 7,449.5 8,016.1 8,545.6 9,017.7 100.00 102.25 104.85 107.64 110.39 113.14Permanent site ........................................................................ 6,483.0 6,845.0 7,289.1 7,845.4 8,369.8 8,837.3 100.00 102.19 104.75 107.50 110.27 113.08
1-to-4-unit........................................................................... 5,663.1 5,959.4 6,334.9 6,844.5 7,309.2 7,733.3 100.00 102.38 105.18 108.17 111.20 114.26Farm................................................................................ 126.9 130.4 135.0 143.1 149.4 154.5 100.00 99.96 100.05 100.92 101.42 101.85Nonfarm .......................................................................... 5,536.2 5,829.0 6,199.9 6,701.4 7,159.8 7,578.8 100.00 102.44 105.29 108.34 111.43 114.54
5-or-more-unit .................................................................... 819.9 885.6 954.2 1,000.9 1,060.6 1,104.0 100.00 100.94 101.92 103.08 104.19 105.33Manufactured homes .............................................................. 141.6 150.2 160.4 170.7 175.8 180.4 100.00 104.68 109.71 113.94 115.74 116.09
Farm.................................................................................... 13.6 15.1 16.7 17.8 18.7 19.9 100.00 109.38 118.90 123.24 127.90 132.81Nonfarm .............................................................................. 128.0 135.1 143.6 152.9 157.1 160.6 100.00 104.18 108.73 112.95 114.44 114.31
Improvements............................................................................. 1,477.1 1,555.1 1,642.9 1,747.2 1,865.4 1,956.6 100.00 102.65 105.40 108.42 111.69 114.84Other residential 6........................................................................ 29.6 30.5 31.9 34.1 36.0 37.9 100.00 100.33 101.11 102.94 104.79 107.03
1. Excludes software “embedded” or bundled in computers and other equipment. 2. Consists of office buildings except those occupied by electric and gas utility companies. 3. Consists primarily of stores, restaurants, garages, service stations, warehouses, and other build-
ings used for commercial purposes.4. Consists of buildings not elsewhere classified, such as passenger terminals, greenhouses, and
animal hospitals. 5. Consists primarily of streets, dams, reservoirs, sewer and water facilities, parks, and airfields. 6. Consists primarily of dormitories and of fraternity and sorority houses. n.e.c. Not elsewhere classified