
National Casino Industry Forum Response to · The National Casino Industry Forum (NCiF) welcomes...
66
National Casino Industry Forum Response to: DCMS Consultation: Gambling Act 2005: Triennial Review of Gaming Machines Stake and Prize Limits 9 th April 2013
Transcript of National Casino Industry Forum Response to · The National Casino Industry Forum (NCiF) welcomes...

National Casino Industry Forum
Response to:
DCMS Consultation: Gambling Act 2005: Triennial Review of Gaming Machines Stake and Prize Limits
9th April 2013

Introduction The National Casino Industry Forum (NCiF) welcomes the opportunity to respond to the Triennial Review - Proposals for Change document. The National Casino Industry Forum is the major trade body representing the land based casino industry. NCiF represents all the major operators in the UK and most of the smaller independent operators. Together our members hold 90% of all casino licences. At the outset, we wish to state that NCiF’s members continue to be totally committed to ensuring that all aspects of casino gaming, both traditional and technology based, are conducted strictly in accordance with the objectives of the Act. As an industry, we have taken ownership of those objectives and are determined, in particular, to operate leisure environments in which we are better able to:
• Ensure customers are fully aware of the extent of their involvement in gambling
• Identify customers who may be suffering or are at risk of harm through gambling
• Minimise the risk of harm through gambling in the way we offer and manage our products NCiF’s members intend to set the agenda for the development of machine regulation that properly recognises the need for player protection in the commercial context of casino gaming. We want to work with DCMS and the Gambling Commission to develop commercially acceptable and socially responsible player tracking technologies that are genuinely proportionate to identified risks. To achieve this changes are needed to help the terrestrial industry. Since March 2011 the number of casinos operating in the UK has reduced from 149 to 144 and investment in the industry is stagnant. Competition from other sectors offering ‘casino games’ continues to erode the regulatory pyramid. Terrestrial casinos are increasingly perceived by customers as offering less attractive products than other sectors and with considerably greater limitations on availability and restrictions on access. In our view more flexibility is needed to allow all stakeholders to assess the impact of higher numbers of machines with higher stakes and prizes in the controlled environment of terrestrial casinos. We have made a number of suggestions to allow this to happen. The industry is keen to make progress and we welcome this review.
Tracy Damestani Chief Executive Officer
2

1. NCiF – A consistent Position on Electronic Wagering Opportunities and Player Protection 1.1. With the emergence of on-line gambling and gambling products being available on
numerous mobile platforms, the distinction between gaming machines, as defined by the 2005 Act, and their virtual equivalents has become largely irrelevant to the consumer, who sees them all as electronic wagering opportunities. We recognise that there is concern about some electronic wagering opportunities, their availability and the ways in which they are offered. However our strong contention – supported by informed opinion - is that terrestrial casinos offer the safest venues for all kinds of electronic wagering to be enjoyed.
1.2. NCiF has been entirely consistent in our evidence to the Culture Media and Sport Scrutiny Committee and to the Culture Media and Sport Select Committee. As long ago as 2002, the terrestrial industry made it clear that many of the measures the casino industry might wish to trial or employ in order to better understand the impact, in particular, of machine play on UK players were, because of the size (less than 3000 machines which is less than 1% of the UK machine estate) of the UK casino machines market either unavailable or uneconomic to deploy.
1.3. We have consistently said that to access the wider international style products that provide
both customer choice and features that allow operators to better understand their players, like tracking technologies, operators need to be able to offer machines in the kinds of numbers and specification that the internationally available monitoring products are designed to support.
1.4. We fully understand that machine numbers are not directly part of this consultation, but in
the terrestrial casino environment the two issues are inextricably linked and this perhaps highlights a shortcoming of this consultation process and the need for more work.
2. The changing commercial environment
2.1. We are aware that there is a view in government and with the regulator that NCiF’s arguments for relaxation of the terrestrial regime are focused on the product, (i.e. the game) offered on each medium (on-line and terrestrial machines). That is not NCiF’s position. We accept that games played on-line at home or outside the environment of a casino offer a different experience to a game played in a casino. However, our strong and evidence based contention is that gaming experienced in a casino is a safer experience than one enjoyed remotely and in isolation.
2.2. We continue to be concerned that the Triennial Review Process reflects a view of the gambling industry in two silos: terrestrial and on-line. That is not how either customers or the supply industry e.g. games designers perceive gaming. The proposed regulatory changes to the UK’s on-line environment will further increase competition with the terrestrial industry. Whilst terrestrial casino businesses are constrained by stake and prize controls, machine number controls and location controls the on-line world has no such restraints. That is unfair to consumers and suppliers of terrestrial products alike.
2.3. Currently, the supply chain for both the hardware and the software for UK casino gaming machines is being inhibited by the lack of opportunities for growth and expansion in the sector. In the main the terrestrial sector gets what can be adapted for use rather than fostering innovation in British Industry. If the government and regulator accept that casinos are the safest places to gamble, they need to support measures that, in turn,
3

directly support the sector by ensuring our products are attractive and competitive to those available outside a casino.
2.4. Operators are simply seeking to grow legitimate businesses and bring in investment from
overseas into UK and local communities, but whilst the on-line industry thrives, growth in UK terrestrial industry is stagnant. Investment in the industry has diminished, (see Appendix A Ernst and Young 2010). Despite the availability of 202 potential terrestrial casinos (16 new licences through the 2005 Act process and 186 licences via the 1968 Act),there has been a net growth of just 4 operating businesses in 8 years and an industry operating at 71% of its capacity. At the time of our response there are now only 144 operating businesses in the UK today, five fewer than when the consultation paper was written in March 2012. In the last year there have been more closures than openings. Recently large modern premises in Swansea and Leeds have closed with the loss of over 200 jobs from direct employment not including the impact of job losses at a local level along with, a significant loss of revenue. It is critical that the government and the regulator do not confuse stability in the industry with stagnation.
2.5. We are fully aware that this consultation is a stake and prize review, but the government has quite rightly extended the discussion by introducing player tracking and protection measures. Consequently, in determining our proposals and protection measures, we have had to confront the evolution of our commercial competition, particularly from the on-line industry.
2.6. Notwithstanding the above comment on the difference in experience in gaming venues, our
customers do not understand why they cannot access their favourite games and a wider choice of stake and prize while enjoying an evening out with friends in the safe and secure environment of a casino.
2.7. It seems entirely logical and consistent with player protection and consumer choice that if a
terrestrially based casino offers precisely the same protective measures as on-line operators and offers the additional benefits of identification verification - by actually being present and visible - and direct supervision by licensed and qualified supervisors, then product availability – including stake and prize - should be at least comparable. We have therefore included a suggestion to allow on-line gaming in casinos.
2.8. Some might contend that this would allow de-facto category A machines in casinos.
Government needs to confront the reality that category A machines are everywhere, in their tens of millions, except in casinos. Unarguably, this would provide precisely the kind of platform for trialling the technology the Commission is seeking without major changes to the 2005 Act.
4

Question 1 1) How often should the government schedule these reviews? Please explain the reasons for any
time frame put forward for consideration. a) The triennial process was simply and routinely conducted until 2001 and took less than a
year to complete. As indicated in the consultation document (para 3.3), it is now over 12 years since the last full review took place. This current triennial process is now scheduled in chapter 3 of the consultation document (para 3.1) to take 18 months. It is likely to be approaching 14 years before any changes are implemented! That is too long.
b) Before 2001 there was very limited unregulated competition to terrestrial gambling. If the government remains intent on continuing to regulate the pricing of some parts of the industry, but not others and intends to do so through a periodic mechanism, that mechanism must regularly, routinely and frequently take into account changes in the competitive landscape and be linked to the government’s own changes to taxation.
c) We are aware that BACTA have made additional points concerning the difficulties a shorter
cycle would make to the machine manufacturing process. We entirely concur with BACTA’s comments on this topic. Moreover, we wish to highlight the potential benefits to the supply chain in that increasing the stake/prize limits is more than simply helping operators.
d) However, our preference would be to abandon the process that centrally sets limits and
instead agree a process where the regulator (or expert panel) assesses the player protection measures applied within a casino premises –against an agreed sector standard - and allows proportionate commercial freedoms and subject to the regulator’s discretionary parameters. We would be pleased to work with the department and regulator to establish the details of any such mechanism.
Question 2 2) The government would like to hear about any types of consumer protection measures that
have been trialled internationally, which have been found most effective and whether there is consensus in international research as to the most effective forms of machine-based interventions. The government would also like to hear views about any potential issues around data protection and how these might be addressed. a) Our view is that the most effective player protection programmes currently available are
based on programmes designed to train floor employees to recognize players who appeared to be in trouble and to interface with them in a non-threatening manner. We firmly believe that more can be done to develop and refine an informed intervention programme based on direct supervision of gaming machines. We refer to Gambling Commission’s Qualitative Study into Machine Gamblers GFK NOP Social Research – October 2009, extraction attached as Appendix C. Use of a mandatory card with responsible gambling (RG) features has been implemented in some jurisdictions. It is too early for formal studies to show efficacy but anecdotal information indicates that it is primarily the hard core and problem players who go to the trouble to obtain the card while recreational and casual players don’t bother. Requiring a card to play the machines can be an inconvenience. We carry too many cards already and it is likely the casual player who forgets to bring their card to a dinner outing with friends will
5

simply forego playing the games. Also some players, often problem players, prefer to remain anonymous so avoid any means that would identify them or their level of play. Norway (a state monopoly) set daily and monthly loss limits on all players. Calls to the problem gambling helpline disappeared but revenues dropped 90%. They later removed the slot machines but the research group, Stiftelsen for industriell og teknisk forkning (SINTEF), suggested problem gamblers simply migrated to the internet.
b) We concur with much of paragraph 3.4 in the consultation document. However, this goes to the heart of the regulatory pyramid on which the 2005 Act was constructed. For example, if an operator of a gambling premises were to be able to demonstrate that a given electronic wagering opportunity (EWO) was able to deliver the kind of very sophisticated player tracking and consumer protection technologies envisaged, what then would be the argument for confining that device to one specific, or for that matter any kind of, gaming premises? It would simply be access to a server based device that happens to be fixed. If the evolution of the EWO is perceived to be so intrinsically safe, why should it not be available anywhere and everywhere? The answer must be that that was not parliament’s intention when it passed the 2005 Act. The clear intention is a pyramid that balanced risk and protection and categorised premises accordingly. Consequently, the regulations required the casino industry to have stronger regulatory controls, have designed premises, installed technologies and instituted training regimes that provide the safest environment in which to gamble, whether on an EWO or a table. This should be read as complementary to our comments at 1(d) above.
c) We have researched the international experience with operators and suppliers of gaming technologies. It is important to recognise the difference between systems that provide data about machine play and systems that track individual players.
d) There are effective and extensively used systems available to operators that provide data
about the use of any gaming device that can be linked to a server. These systems are relatively cheap, widely used by most major operators to track the performance of their gaming machines. They do not however link the identity of an individual player to the gaming machine. The objective of the data capture technology is to monitor machine performance: not player activity. It is probably accurate to say that all cat B1 machines capture some machine performance data.
e) We agree to the principles set out in consultation document but there are genuine
operational difficulties that would need to be addressed. The industry has offered to meet with Ministers, DCMS and Gambling Commission officials to discuss solutions and to implement a ‘road map’ that would balance the risks associated with change with appropriate and proportionate player protection measures. Currently however, because of the very limited size of the UK machines estate, we have similarly limited direct UK based knowledge of player tracking.
f) Player tracking is available but comes at a price and is not cost effective on very small
machine estates. It relies on the player being identified, either by the use of a credit or debit card directly into the device – synonymous with on-line play but not currently permitted on terrestrial casino machines -or through a player loyalty card issued by an individual operator. The extent of the data captured by these cards varies considerably. However, there are no algorithms to diagnose problem gamblers, but experts seem to agree that there are play patterns that indicate "risky behaviour." There are some commercially available products
6

which claim to do so. There is technology in Europe and Saskatchewan that is designed to identify risky behaviours, but we have been unable to find any definitive research on its effectiveness. Given the differences in the way and the numbers in which the products are delivered, we doubt any useful comparisons can be made with the UK market.
g) There is also concern that requiring a player to identify themselves when engaged in low
stake and prize play in a casino would be counterproductive. It could drive players into less closely regulated environments where access to games does not require identification. This is a particular concern while stake and prize differentials between gaming venues remain small or indistinct.
h) The industry would also need to address issues of data protection and confidentially.
Question 3 3) The government would like to hear from gambling businesses, including operators,
manufacturers and suppliers, as to whether they would be prepared to in the future develop tracking technology in order to better utilise customer play information for player protection in exchange for potentially greater freedoms around stake and prize limits a) The casino industry would very much welcome this opportunity. We have been clear on this
for over a decade. The problem we have as an industry is that, while the market for B1 machines remains so small (many single casino operations outside the UK offer more gaming machines than the entire UK casino industry), we have very limited influence over manufacturers or capacity for trialling and experimentation. If the UK market was to be given a genuine growth path, (see Appendix D) the casino industry would have a much greater opportunity to provide the kinds of measures suggested.
b) However, the ‘exchange’ mentioned in the question would – in order to protect jobs and businesses in the casino sector – have to offer relevant commercial advantages to the sector to offset costs and any loss of business which might occur as a result of the trialling of technology pushing customers towards more accessible, less controlled wagering opportunities.
c) We believe that there are two opportunities to conduct extensive trialling immediately.
i) Trialling of additional machines using player tracking technology. (see below)
ii) Through a minor change to the Gambling (Advertising and Licensing) Bill to allow UK
terrestrial casinos to offer remote gambling, allowing casinos to offer a tracked play option alongside untracked devices would provide a genuine assessment opportunity.
d) This does not conflate our arguments about the need for more gaming machines across the
UK estate with our remote argument, nor do we offer this second suggestion as a quid pro quo for trialling technology: it presents a genuine opportunity for research and trial that could facilitate the increase in electronic wagering opportunities necessary to support it.
7

Question 4 4) We agree with the government’s rejection of Package 1
Question 5 5) We agree with the government’s rejection of Package 2
Question 6 6) We agree with the government’s assessment of the proposals put forward by the industry
Question 7 7) Do you agree with the government’s proposals for adjusting the maximum stake limit to £5 on
category B1 gaming machines? If not, why not? a) The short answer to this question is ‘Yes’.
b) In general the problem with low limits on small machine numbers is that there is limited
opportunity to provide consumers a spread of stakes and prizes.
c) The industry is confident that increasing the upper staking limit to £5 will increase the industry’s ability to offer a broader range of prizes and improve the customer experience, especially for table players who find the £2 maximum on machines unattractive and for international visitors used to much higher staking levels.
Question 8 8) Do you consider that this increase will provide sufficient benefit to the casino and
manufacturing and supply sectors, whilst remaining consistent with the licensing objectives of the Gambling Act a) Given the last increase was in 2005 and that a number of other changes affecting the play on
gaming machines took place at the same time e.g. changes to hours, entry policy and the removal of Section 16 and Section 21 machines, the limited amount of data available within the industry does not provide a useful benchmark by which to measure the impact of increased stakes and prizes at that time. The sector is looking towards this Triennial Review to be the benchmark for monitoring the effect of a £5 stake and a £10,000 prize.
b) There is nothing in our submission for increases that will impact on the objectives of preventing gambling being a source of crime, ensuring gambling is conducted in a fair and open way and protecting the young and vulnerable. All the measures currently in place to ensure compliance will remain extant and the industry has a programme of improving the effectiveness of the measures, e.g. a national voluntary self-exclusion scheme. NCiF members have agreed to further underpin the licensing objective ‘protecting the young’ and are currently working with the regulator to develop an enhanced test purchasing scheme. NCiF members have agreed to assist the Responsible Gambling Trust’s (RGT) Category B Research.
8

c) The increase will also help us to retain our existing customer base who are frustrated with the lack of product choice within casinos and are aware of the variety and price diversity available on-line. Manufacturers have told us that a wider choice of games would be available to us with the increased stakes and prizes we seek.
d) Taken on its own this increase will not entirely provide sufficient benefit to the casino,
manufacturing and supply sectors. Whilst gaming machine numbers remain restricted to 20 machines in all but one of the 144 operational casinos in the UK and the proportion of gaming machines in casinos remains at below 1% of all gaming machines in the UK, its impact will be limited. The Sector needs to be able to offer a wider range of machine product and in greater numbers to generate growth in the sector and to future proof the industry to avoid market failure.
Question 9 9) Do you agree with the government’s proposals for adjusting the maximum prize limit on B1
gaming machines? a) We agree with the proposal that the prize limit should be increased. We are not supportive
of maintaining a prize of £4,000 which represents a decrease in value to the consumer. Casinos are by virtue of the Gambling Act 2005 intended to sit at the top of the regulatory pyramid with risks and controls balanced. Without an increase in prize limits, the balance in the market and the regulatory pyramid is jeopardised. The suggestion of £7,000 and £15,000 maximum prizes came as a surprise to the industry, neither were sought, whilst the £10,000 prize is an internationally comparable target maximum prize that would allow access to a broader range of products and would encourage manufacturers to develop the product.
b) A £7,000 prize with a £5 stake would be a very difficult product to provide. The stake to jackpot ratio is not found elsewhere in the world. Therefore adapting the pay tables for the ratios between £5 stake and £7,000 prize would require manufacturers to write new and unique software for the UK’s very limited market. This would be costly for manufactures to develop and that cost would inevitably be passed on to the operators. The prize would also be inconsistent with jackpot prizes found in other jurisdictions with which UK customers are familiar and would be unhelpful to customer retention.
c) The industry is attracted by the £15,000 and higher prizes but feels that such levels should
march in tandem with the development of player protection evolution. As previously stated, the casino sector is keen to work with the regulator to trial higher stake and prize machines with improved tracking and monitoring technology.
d) We are concerned about the proposed conditionality at 3.53 in the consultation which has
been attached to the higher limits. The only alternative other than identification from a loyalty card is identification by a debit or credit card, which is how on-line customers are identified. Credit and debit cards are not available to the casino sector for use in the machine, therefore the potential benefits of gathering meaningful customer information is restricted to the on-line sector, a position which has been recognised by government. (Evidence given by the Permanent Secretary and the CEO of the Gambling Commission to the CMS Select Committee).
9

e) However, the industry has not closed its mind to the issue and whilst data capture is patchy across the existing estate, effective and relevant player data with the current machine numbers, improved player interaction and monitoring is an issue the industry is prepared to address. We have noted the language in the consultation document (para 3.53) very carefully and respond accordingly.
f) To summarise, the perceived benefits for the industry are; re-establishing the ‘hierarchy’
intended by the 2005 Act, improved player retention, wider consumer choice and fairness for the UK market.
Question 10 10) If so, which limit would provide the most practical benefit to the casino and machine
manufacturers without negatively impacting on the licensing objectives of the Gambling Act 2005. a) We are content to remain with a request for £10,000. We see nothing in this change that
would impact the objectives of keeping crime out of gambling, ensuring it is fair and open and protecting the young and vulnerable.
b) The pay tables and existing software availability mean that a £5 stake and a £10,000 prize could be implemented efficiently and at minimum cost to the industry as existing stake and prize ratios would be maintained. The £10,000 prize resonates with similar internationally available jackpots, where prizes tend to be in multiples of 10s, 100s and 1,000s, either in US$ or Euros.
c) NCiF is unable to offer any further evidence/data to support cost/benefit analysis at this
stage – there were too many other factors impacting at the same time to be able to isolate the impact of the stake and price increase - and the revenue projections originally submitted were our ‘best guess’. However, NCIF is keen to help DCMS/Gambling Commission in monitoring the impact of any increases going forward.
d) The perceived benefits of changing the limit for the industry are in relation to; maintaining
the ‘hierarchy’, improved player retention, wider consumer choice, fairness for the UK market and consistency with other gambling offers.
e) Where the maximum prize on a single gaming machines is permitted to be £10,000 or
more.
NCiF members commit to trialling:- • Funding and developing, with a care provider e.g. GamCare, a specific training course to focus on problems specifically associated with machine play.
• Accepting that a member of staff who has received the appropriate accreditation from GamCare as a trained individual MUST be available when higher prize gaming machines are available for play.
• Through the mechanism of the NCiF Playing Safe Forum, invite a continuing and structured dialogue on machine play with the participation of an expert in responsible gambling, the regulator and to produce a report annually.
10

Question 11 11) Are there any other options that should be considered?
a) There are two additional options:
i) Trialling higher value machines with enhanced consumer protection measures ii) Progressive linked jackpots
i) Trialling higher value machines with enhanced consumer protection measures
(1) The consultation document in Package 4 (the government’s preferred option)
(para3.51) accurately describes the casino industry’s position, where it states that the industry has signalled its ‘willingness to consider’ trialling consumer protection measures available from server based systems. The government’s plans to increase the machine estate through the Gambling Act 2005 have not worked; therefore a new approach is needed.
(2) For more than 10 years the industry has been clearly stating that the kind of data monitoring and control mechanisms suggested by the government (para 3.53) are only viable on larger machine numbers. We made this clear during the passage of the Bill, during the Pre legislative Scrutiny and at numerous other times. The industry’s evidence has been consistent. We want to fall in line with European countries and offer more electronic wagering opportunities, we acknowledge that greater machine numbers offer an opportunity for more modern and sophisticated data capture from either the machine - through economies of scale – or more likely server based machine parks as does access to remote gambling in casinos.
(3) It is important to recognise that it is not simply the cost of the physical devices, but also the loyalty programmes needed to support player identification. We have researched the available systems and the basic cost of an online monitoring and tracking system based on a loyalty card is not less than £100,000 for a single unit operation of twenty machines, which is unaffordable for many casino operations.
(4) We suggest the government considers allowing casinos to trial for a specified period
additional gaming machines (by using the discretionary powers given to the Secretary of State in Section 172(11) of the Gambling Act 2005) and consider the use of both cash and ‘debit cards’ but on which play is only permitted with a loyalty card that allows tracked play and offers players information about their play. Only by increasing the number electronic wagering opportunities can the industry deliver server based machine gaming and provide the kind of data the industry, the regulator and researchers seek to better understand machine gaming.
(5) We have also submitted to the department that the data collection objective is also
quickly and easily available if casinos could be permitted to offer an on-line product within casino premises. This is achievable through an amendment to the current Gambling (Licensing and Advertising) Bill to permit casinos to offer on-line gaming.
(6) The industry will also work with the regulator and manufacturers to identify what
simple changes could be made to non-server based machines as software is
11

upgraded and existing machines are replaced that might provide enhanced player protection messaging, e.g. about time spent playing .
ii) Progressive linked Jackpots
(1) We welcome the comment in the consultation at 3.41 referring to aspects of the
consultation the government thinks have merit and the reference to linked progressive jackpots. Linked jackpots are a well accepted and normal feature of both the UK and the international gambling landscapes. The UK National Bingo game offers a jackpot of £250,000 and UK bingo operators operating linked games are able to offer unlimited jackpots and UK table games can be linked. In Gibraltar, Gala Casinos operates a casino with several hundred machines, of which 40 machines are linked (via the Novomatic Flexilink system) offering a jackpot of between £40,000 and £70,000. It is anomalous that UK casinos cannot link jackpots in the same way.
(2) In the discussion leading to the submission of our initial proposals, the casino industry was specifically advised by DCMS officials to make a request for a change in the rules relating to Progressive Linked Jackpots (PLJ). This paper (Appendix B) has not yet been separately addressed, but we are pleased to see the comments at 3.41 recognising the opportunity to re-examine the potential for larger prizes using the provision for PLJ’s in the Gaming Act. We have therefore re-submitted and amended our submission on this issue which addresses the questions posed to the industry by the department in April 2012.
(3) The key requests contained in that submission are:-
(a) The Secretary of State to use the powers given in Section 244(3) to permit any number of linked B1 gaming machines whether or not they are on the same premises.
(b) The industry asks initially to trial a linked progressive jackpot limited to £50,000 regardless of the number of machines linked.
(4) The requests contained within that submission would put casinos in no better position than bingo clubs in respect of a linked national game.
(5) This would be very helpful in particular to the high-end clubs that only want to offer a very limited number of machines and find it impossible to meet the needs of wealthy international tourist customers who want to play machines but find the stakes, prizes and jackpots unattractive.
Question 12 12) The government would also like to hear from the casino industry and other interested parties
about what types of consumer protection measures have been trialled internationally, which have been found to be most effective and whether there is any consensus in international research as to the most effective forms of machine – based interventions.
a) To answer this question comprehensively would require a very detailed submission;
even then the measure of effectiveness is subjective. Additionally, measures applied in other international jurisdictions are applied to machine parks that are significantly
12

larger than those permitted in the UK. A slots park of hundreds and more machines in say, a US jurisdiction, may be able to sustain a server based data rich system that delivers. This data is not available from a park of twenty machines.
b) We have looked at schemes operated in Canada and in Australia. However the Canadian scheme is applied to 35,000 machines and the locations are not comparable with UK casinos. Similarly, we have looked at messaging delivered in Australia between 7 and 10 years, where messaging is applied in pubs, clubs and casinos, again across thousands of machines where direct supervision is problematical. Whilst some of the messaging might prove helpful in providing a framework for the UK regulatory environment, there are some concerns over the game statistics which some operators believe infringe their intellectual property rights.
c) UK machines already carry a responsible gambling message. From the information
available, we believe it is possible for the UK industry to agree periodic messaging that would inform a player how long they have been playing which could be specified on new products.
d) We have also canvassed manufacturers and suppliers and are unaware of the
development of any algorithms that operate on server based or on-line systems that are effective in detecting distress or problem gambling symptoms.
e) Anecdotal evidence from NCiF member organisations points towards direct
supervision by slots hosts as providing the most effective protective measures. We remain confident that, direct supervision coupled with the level of surveillance monitoring present in UK casinos, delivers a very effective player protection measure.
Question 13 & 14
a) Based on the Gambling Commission’s Statistics published December 2012 we can identify that less than 0.25% (actual 0.17%) of all Category B2 machines in operation exist in casino venues. Therefore, given this extremely low and insignificant number we do not feel qualified to address these questions.
Question 15 – 29
a) NCiF does not wish to comment on these questions. Question 30 30) Do you agree with the methodology used in the impact assessment to assess the costs and
benefits of the proposed measures? If not, why not? (Provide evidence to support your answer).
a) We agree the validity of the methodology but question whether the mechanisms are proportionate going forward.
13

Question 31 31) Do you agree with the government’s approach to monitoring and evaluating the impact of
changes to future reviews? If not, why not? (Provide evidence to support your answer).
a) We recognise the difficulties the government has in identifying data from some sources. However, we suggest that as far as the casino industry is concerned there is the opportunity to create a virtuous circle of more product producing more and better data.
Question 32 32) What other evidence would stakeholders be able to provide to help monitoring and
evaluation?
a) No additional comments.
14

The Economics of the UK Casino Industry A report commissioned by the National Casino Industry Forum
July 2010
Appendix A
Contents
Contents
Executive summary .................................................................................................................................... 1 1. Introduction ..................................................................................................................................... 3
1.1 Scope of this report ............................................................................................................................................................... 3 1.2 The UK betting and gaming sector in 2000/09 ....................................................................................................................... 3 1.3 2008 to 2009 – challenging times ......................................................................................................................................... 4 1.4 Content of this report ............................................................................................................................................................. 5
2. Economic Impact Assessment ............................................................................................................ 6 2.1 Performance of the UK Casino Industry over time .................................................................................................................... 6
2.1.1 Scope of the analysis .............................................................................................................................................. 6 2.1.2 Data sampled and groupings .................................................................................................................................. 6 2.1.3 Analytics ............................................................................................................................................................ 7
2.2 Summary of main findings ..................................................................................................................................................... 7 2.3 Analysis of key indicators by sub-grouping ............................................................................................................................ 10 2.4 Conclusions from economic impact assessment ................................................................................................................... 11 2.5 Which policy changes could make a difference? ................................................................................................................... 12 2.6 The likely impact of a ‘do nothing’ approach ......................................................................................................................... 13
3. Policy modelling scenarios ................................................................................................................ 14 3.1 Three key policy proposals ................................................................................................................................................... 14
3.1.1 Interaction with other policy discussions................................................................................................................ 14 3.2 The Gaming Machines Proposal ........................................................................................................................................... 15
3.2.1 Policy background ................................................................................................................................................ 15 3.2.2 Policy proposal ..................................................................................................................................................... 16 3.2.3 Modelling rationale............................................................................................................................................... 16 3.2.4 Modelling results .................................................................................................................................................. 17 3.2.5 Modelling conclusion ............................................................................................................................................ 18
3.3 The Casino Location Proposal .............................................................................................................................................. 19 3.3.1 Policy background ................................................................................................................................................ 19 3.3.2 Policy proposal ..................................................................................................................................................... 19 3.3.3 Modelling rationale............................................................................................................................................... 20 3.3.4 Modelling results .................................................................................................................................................. 20 3.3.5 Modelling conclusion ............................................................................................................................................ 21
3.4 The Modernisation Proposal................................................................................................................................................. 23 3.4.1 Policy background ................................................................................................................................................ 23 3.4.2 Policy proposal ..................................................................................................................................................... 23 3.4.3 Modelling rationale............................................................................................................................................... 23 3.4.4 Modelling results .................................................................................................................................................. 25 3.4.5 Modelling conclusion ............................................................................................................................................ 25 3.4.6 Further product offering ........................................................................................................................................ 25
4. Conclusions from policy modelling ................................................................................................... 26 A. Economic Impact Assessment ........................................................................................................... 27
A.1 The econometrics ................................................................................................................................................................ 27 A.2 Sub-groupings ..................................................................................................................................................................... 28 A.3 Key findings ......................................................................................................................................................................... 28 A.4 Detailed findings ................................................................................................................................................................. 29
A.4.1 Admissions 29 A.4.2 Gaming revenues per admission ............................................................................................................................ 30 A.4.3 Total revenues per admission ................................................................................................................................ 31 A.4.4 Machines win ....................................................................................................................................................... 32 A.4.5 Tables drop 33 A.4.6 Gaming duty ......................................................................................................................................................... 34 A.4.7 EBITDAR .......................................................................................................................................................... 35 A.4.8 Remote gambling ................................................................................................................................................. 36
B. Analysis from modelling of policy proposals........................................................................................ 37 B.1 Gaming Machine Proposal ................................................................................................................................................... 37 B.2 The Modernisation Proposal................................................................................................................................................. 38
Ernst & Young i

Contents
Table of figures
Figure 1 - UK expenditure on games of chance .............................................................................................................................................. 4 Figure 2 - UK tax receipts from betting and gaming ....................................................................................................................................... 5 Figure 3 - Number of opened and closed casinos .......................................................................................................................................... 8 Figure 4 - Capital expenditure on casinos ..................................................................................................................................................... 9 Figure 5 - Employment in casinos ................................................................................................................................................................. 9 Figure 6 - Deployment of machines (2009) ................................................................................................................................................. 15 Figure 7 – Admissions and machine win (2000 - 2009) .............................................................................................................................. 17
Table of tables
Table 1 - Summary of impact of 2007 Package ........................................................................................................................................... 12 Table 2 – Correlation between machine win and table drop ......................................................................................................................... 17 Table 3 – Illustrative impact of new opening ............................................................................................................................................... 21 Table 4 - Estimate of reduction in measurement with growth in remote gaming ............................................................................................ 24 Table 5 - Elasticity of key performance indicators with admissions .............................................................................................................. 25 Table 6 – Impact of 15% increase in admissions, per casino sub-group ....................................................................................................... 25
Ernst & Young ii

Executive summary
This report examines the performance of the casino industry in the UK over the period 2000 to 2009, in light of fundamental change to its regulatory, fiscal and competitive environment, and considers the impact of a range of policy proposals designed to help UK casinos to invest, grow and further contribute to the success of the UK economy.
Economic impact assessment
An economic impact assessment undertaken by Ernst & Young shows that British Casinos suffered a significant decline following tax and regulatory changes introduced by the Government in 2007. Most notably, casinos’ revenue generation saw large and significant reductions, by as much as 20%.
The report finds that regulatory changes introduced through the Gambling Act 2005 limited the capacity for existing casinos to innovate through their product offering, whilst a fixed stakes and prizes regime for gaming machines left them unable to absorb cost increases by passing on any of it through the ‘price’ of the product. The replacement of the casino duty 2.5% rate with a starting rate of 15% (a 500% increase in tax) and an increase in the top rate to 50% led to an overall increase in the tax burden on their activities. In addition, the emergence of tax-favoured remote gaming as a significant recipient of betting and gaming custom (approximately £1.45bn per annum), has been a significant market development.
The need to control costs in the face of constraints in the ability to generate revenues has led to an under investment in product offering, exacerbated by disparities in the types of product that can be offered in “bricks and mortar” casinos compared to those online. This has impaired the competitiveness of the product offering for physical British casinos in comparison to the remote sector and overseas competitors.
Ultimately the impact assessment shows that measures introduced in 2007 (specifically the Gambling Act 2005 changes, smoking ban (albeit not uniquely impacting the casino industry) and changes in gaming duty rates) have contributed significantly to fostering an environment which acts as a barrier to growth for casino operators.
Policy proposals for change
The analysis in this report reveals that this situation does not need to continue and examines three proposals that are consistent with government policy and that could drive investment, growth and jobs; alongside consequential benefits to the Exchequer in terms of tax receipts. These are set out below:
Extending the uniform 5:1 machines:tables ratio to all casinos can be expected to raise additional AMLD of £12.5m per annum.
Each casino licence that is currently inactive could be generating £600,000 per annum in gaming duties, simply by permitting 1968 Act licences to be moved from an existing Permitted Area to a Local Authority that wishes to have a casino. On this basis activating between 10 and 20 dormant casino licenses would generate £6m to £12m per annum in additional gaming duties.
Enabling modernisation of the casino industry by allowing a greater range of electronic gaming inside casinos can be expected to increase investment in casinos, admissions and growth. An increase of 15% in admissions could generate in excess of £20m of additional gaming duties.
These measures, focused around bringing fairness by levelling the playing field and modernising the permitted casino offering, could reinvigorate the industry and provide additional annual revenues of at least £45m per annum to the Exchequer. Given the one-off nature of cost-saving measures and the constraints on revenue generation, the decline described in this report can be expected to continue if nothing is done to arrest it, with resulting lower investment, employment and tax revenues.

Executive summary
Ernst & Young 2
Introduction
1. Introduction
1.1 Scope of this report
Ernst & Young LLP was commissioned by the National Casino Industry Forum (“NCiF”) to undertake an economic assessment of the impact on British casinos of significant taxation and regulatory changes in recent years, as well as of the economic conditions and rapid evolution of the remote gaming sector and the potential positive impacts of a number of policy proposals. The work consisted of:
an economic assessment of the impact of these recent changes on the industry; and
the analysis and modelling of policy changes proposed by the NCiF, to improve casinos’ ability to innovate, invest and achieve growth.
The output of that work is set out in this report.
1.2 The UK betting and gaming sector in 2000 to 2009
In order to fully appreciate the business environment in which casinos operate, it is necessary to understand the broader set of businesses with which casinos are inextricably linked. The UK betting and gaming sector consists of betting, lotteries, gaming machines, casinos and bingo and generated combined revenues of £9.9 billion in 20071. This does not include betting and gaming activity undertaken remotely and online (see below). Some operators of casinos have varied interests across a number of these areas. The different betting and gaming activities can, to a varying extent, also be seen as substitutes for each other and so the tax treatment and regulatory regime governing them will be a core driver of the performance of that sector.
The majority of the industry is legislated by the Gambling Act 2005, which was fully implemented in September 2007, and is regulated by the UK Gambling Commission. Fundamental changes to the tax system for casinos were also introduced in 2007, including changes to gaming duty bands that moved the starting rate from 2.5% to 15% and increased the top rate from 40% to 50%.
The rise of remote gaming
The remote sector is now a significant and still growing area of the industry. The development of remote gaming has taken place mostly outside UK regulation and UK taxation, due to operations being sited outside the UK (even though their customers may be in the UK). The remote sector offers all of the products available in the “bricks and mortar” casinos, but operates substantially outside the framework of UK regulatory constraints; and also without regulatory limits on stakes and prizes (effectively the “price” of the product). The evolution of this sector in 2009 saw approximately 2.8m people spend £1.45bn (approximately £10 per head, per week), in online gambling2. In addition, the increase in the diversity and accessibility of digital platforms (including internet, telephones and digital television) has had a marked impact on the level of unfettered competition for the regulated casino market. In practice casinos face an uneven playing field when competing with the remote sector.
The advent of the Fixed Odds Betting Terminal
Further competition to casinos has been created by allowing Licensed Betting Offices (LBOs) to deploy Fixed Odds Betting Terminals (FOBTs). FOBTs are now categorised as ‘B2’ machines under the Gambling Act 2005 and there are now more than 30,000 of these machines in operation in over 8,800
1 All statistics in this section are taken from UK Gambling Commission Industry Statistics, October 2009, unless otherwise stated. 2 Online and interactive gambling, special report; Mintel, July 2009
Ernst & Young 3
Introduction
LBOs. This compares with 2,300 B1 machines in 141 casinos. This relationship of approximately 10:1 is reflected in revenues generated, with machine win from FOBTs being £1,138m against £120.5m for the win from machines in casinos.3 FOBT machines offer many of the gaming products that were previously confined to casino premises, like roulette and card games, but without the regulatory safeguards present in casinos.
The review of stakes and prizes
Prior to the passage of the 2005 Act, the government reviewed the stake and prize limits for all regulated slot machines triennially. Although there was no legal framework for this process, this had been the regulatory custom and practice for many years. When the Act was in the drafting process, the government understandably suspended this process. However, no mechanism was established to replace it and there has been no increase in stakes and prizes for category B1 machines for five years, whereas some other machine categories have seen significant increases.
The previous administration launched and completed a formal review of stakes and prizes prior to the 2010 General Election. The industry submitted a detailed response to government but to date no action has been taken. This means that the “price” of the Category B1 machines has been frozen since 2005, whilst costs have increased over time through increases in general taxation and AMLD.
1.3 2008 to 2009 – challenging times
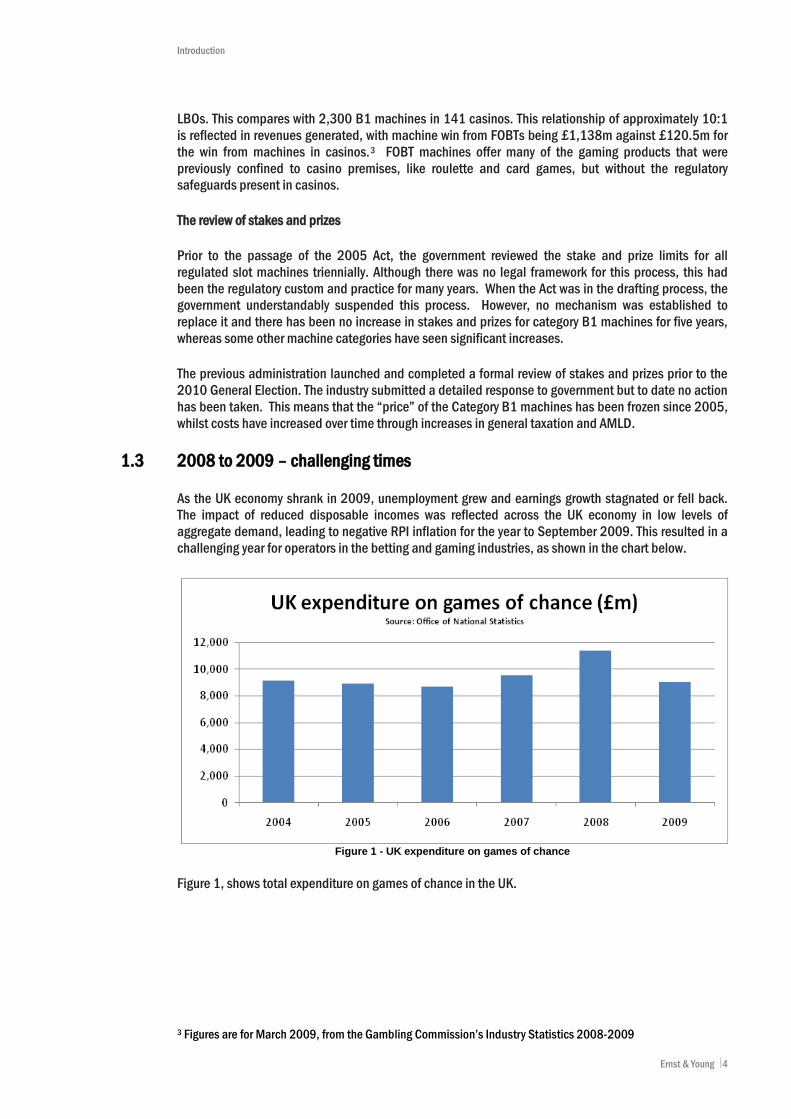
As the UK economy shrank in 2009, unemployment grew and earnings growth stagnated or fell back. The impact of reduced disposable incomes was reflected across the UK economy in low levels of aggregate demand, leading to negative RPI inflation for the year to September 2009. This resulted in a challenging year for operators in the betting and gaming industries, as shown in the chart below.
Figure 1 - UK expenditure on games of chance
Figure 1, shows total expenditure on games of chance in the UK.
3 Figures are for March 2009, from the Gambling Commission’s Industry Statistics 2008-2009
Ernst & Young 4
Introduction
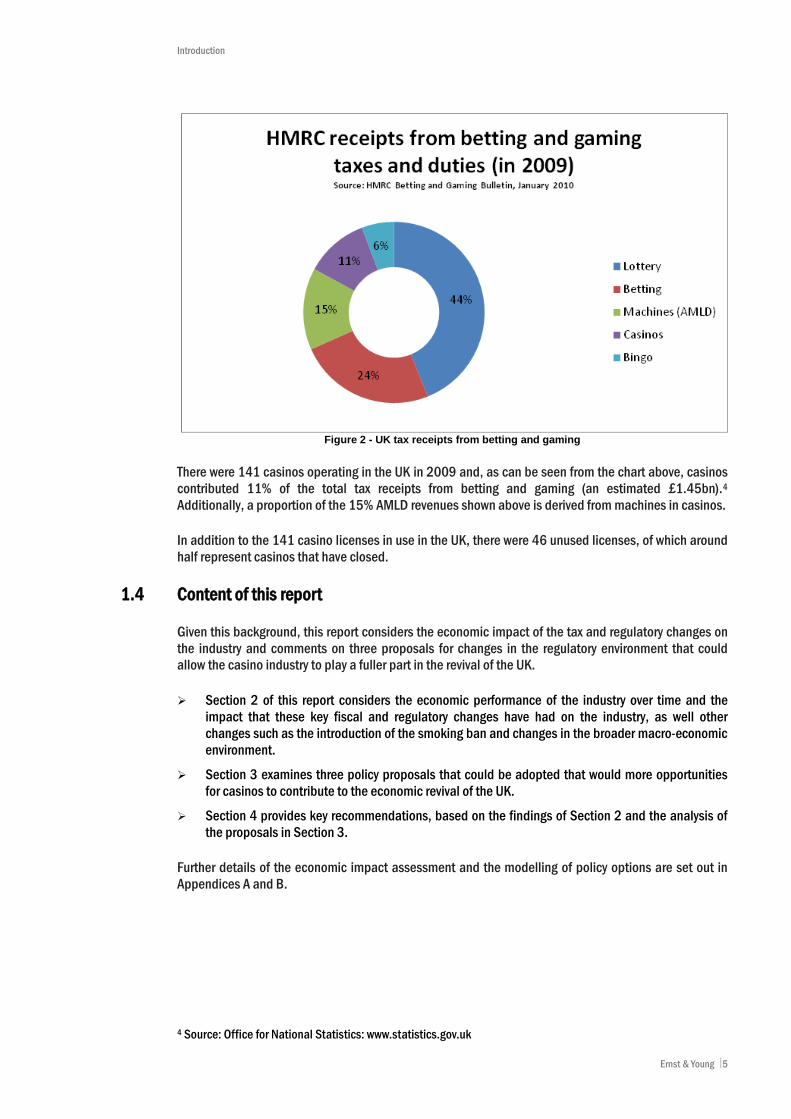
Figure 2 - UK tax receipts from betting and gaming
There were 141 casinos operating in the UK in 2009 and, as can be seen from the chart above, casinos contributed 11% of the total tax receipts from betting and gaming (an estimated £1.45bn).4 Additionally, a proportion of the 15% AMLD revenues shown above is derived from machines in casinos.
In addition to the 141 casino licenses in use in the UK, there were 46 unused licenses, of which around half represent casinos that have closed.
1.4 Content of this report
Given this background, this report considers the economic impact of the tax and regulatory changes on the industry and comments on three proposals for changes in the regulatory environment that could allow the casino industry to play a fuller part in the revival of the UK.
Section 2 of this report considers the economic performance of the industry over time and the impact that these key fiscal and regulatory changes have had on the industry, as well other changes such as the introduction of the smoking ban and changes in the broader macro-economic environment.
Section 3 examines three policy proposals that could be adopted that would more opportunities for casinos to contribute to the economic revival of the UK.
Section 4 provides key recommendations, based on the findings of Section 2 and the analysis of the proposals in Section 3.
Further details of the economic impact assessment and the modelling of policy options are set out in Appendices A and B.
4 Source: Office for National Statistics: www.statistics.gov.uk
Ernst & Young 5

Economic Impact Assessment
2. Economic Impact Assessment
2.1 Performance of the UK Casino Industry over time 2.1.1 Scope of the analysis
The purpose of this economic impact assessment is to examine the effect on the performance of British Casinos of significant legislative and fiscal changes, in recent years. The key changes (hereafter referred to together as the “2007 Package”) are:
The development of a new regulatory regime under the Gambling Act 2005, whose effects included:
o the loss of unlimited numbers of Section 21 prize gaming equipment devices (sometimes referred to as Section 21 machines) from casinos and
o the categorisation of FOBT machines as “B2” and an increase in the permitted number, to 4 per licensed betting office.
Changes to gaming duty bands in April 2007, that moved the starting rate from 2.5% to 15% and increased the top rate from 40% to 50%.
The introduction of the smoking ban from 1 July 2007, which was in no sense unique to the casino industry.
The analysis undertaken also considers the following economic factors, which could have impacted the performance of the casino industry:
macro-economic growth / recession; and the development of remote gambling services.
2.1.2 Data sampled and groupings
The analysis is based on data submitted by the operators of 124 casinos in the UK (being almost 90% of the total number of casinos in the UK). The analysis shows the impact of the 2007 Package across a set of performance indicators:
casino admissions; gaming revenues per admission; total revenues per admission; machines win per admission; tables drop per admission; gaming duties (the amount payable per admission); and Earnings before interest, taxation (other than gaming taxation), depreciation, amortisation and
rent (“EBITDAR”).
The casino sample has been segmented into three groups:
High-end London casinos; Other London casinos; and Non-London casinos.
The rationale for this segmentation is that High-end London casinos have a very different customer profile to the others, and that Non-London casinos are subject to different economic and market forces than those in London. The assumption is that the demographics of the customer base could lead to different reactions to changes in the tax, regulatory or macro-economic environment. This was borne out in the results of the analysis, supporting the approach adopted.
Ernst & Young 6
Economic Impact Assessment
2.1.3 Analytics
Data were collected on activity, employment, revenues, gaming duty, EBITDAR and capital expenditure. While not all operators were able to provide a full set of data for each casino for the full assessment period (2000-2009), sufficient data were received to be able to draw robust conclusions on the drivers of performance in the industry.
Detailed econometric analysis was conducted for casinos that were in continuous operation during the period 2003-2009 (78 casinos). The performance of opening, closing and moving casinos was separately analysed to identify further trends in the industry.
Regression analysis was used to identify correlations between the key industry metrics at the individual casino level and the external drivers relating to the economy, the market and the timing of legislative changes. The results have generally been expressed in terms of the percentage change in the performance metric that could be explained by the change in the driver. These percentages should be interpreted as changes in one of the drivers while keeping the remaining ones unchanged. The percentages therefore should not be added together. It is a common approach to express the impact of economic variables in terms of elasticities. Further details on the approach to the econometric analysis are set out in Appendix A.
2.2 Summary of main findings
The analysis of the data overall reveals a story of an industry dominated by regulation, with optimism and growth surrounding the deregulation debate followed by a marked decline in the years following the 2007 Package. The key findings from this analysis are summarised in this section and set out in greater detail in Appendix A.
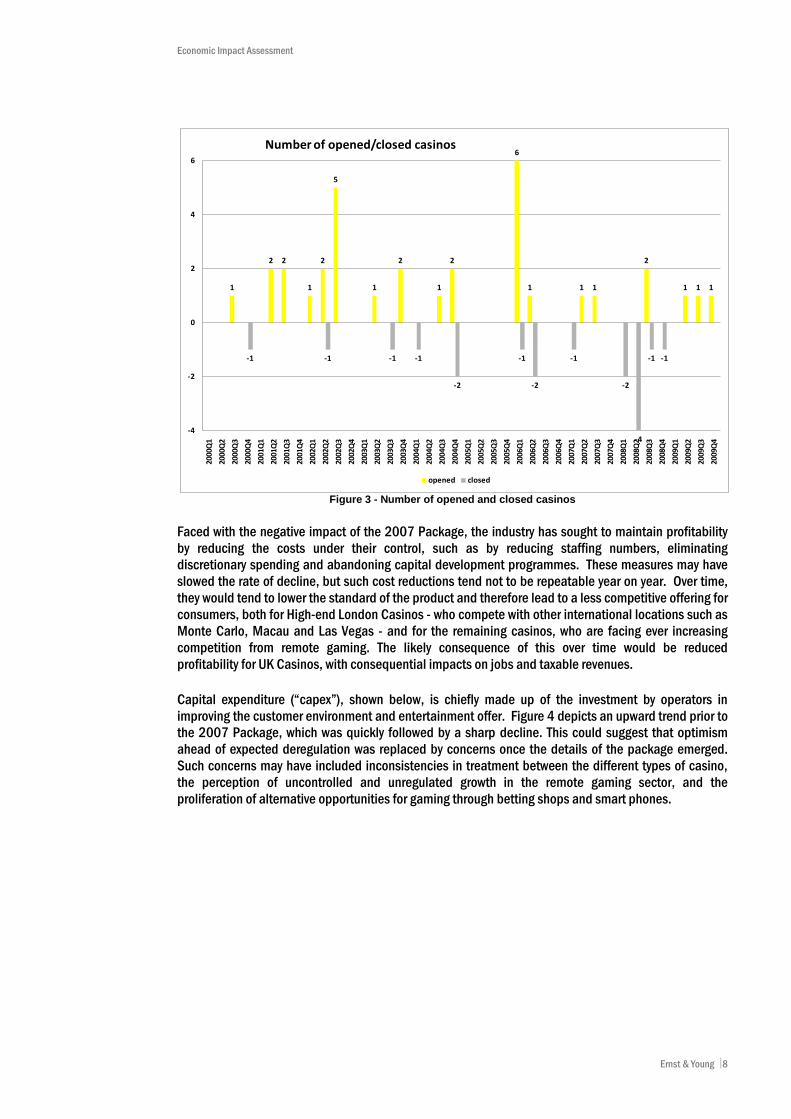
The overall decline in the industry across this period is illustrated by the number of casinos in operation during this period, which grew until 2007 but has declined since then. The impact of the package of changes can be seen more starkly when examining the data for new casino openings and casino closures. Figure 3 below shows that the period in the run up to the 2007 Package saw 28 new casino openings (85% of the total across the entire period) and only 5 from Q3 2007 onwards. The Q3 developments probably still flatter the investment profile, many of which were likely to be legacy developments that had to be contractually honoured. Moreover, the net impact of the changes, which saw 8 casino closures, was actually to reduce the total number of casinos in operation from 2007.
Ernst & Young 7
Economic Impact Assessment
Figure 3 - Number of opened and closed casinos
Faced with the negative impact of the 2007 Package, the industry has sought to maintain profitability by reducing the costs under their control, such as by reducing staffing numbers, eliminating discretionary spending and abandoning capital development programmes. These measures may have slowed the rate of decline, but such cost reductions tend not to be repeatable year on year. Over time, they would tend to lower the standard of the product and therefore lead to a less competitive offering for consumers, both for High-end London Casinos - who compete with other international locations such as Monte Carlo, Macau and Las Vegas - and for the remaining casinos, who are facing ever increasing competition from remote gaming. The likely consequence of this over time would be reduced profitability for UK Casinos, with consequential impacts on jobs and taxable revenues.
Capital expenditure (“capex”), shown below, is chiefly made up of the investment by operators in improving the customer environment and entertainment offer. Figure 4 depicts an upward trend prior to the 2007 Package, which was quickly followed by a sharp decline. This could suggest that optimism ahead of expected deregulation was replaced by concerns once the details of the package emerged. Such concerns may have included inconsistencies in treatment between the different types of casino, the perception of uncontrolled and unregulated growth in the remote gaming sector, and the proliferation of alternative opportunities for gaming through betting shops and smart phones.
1
2 2
1
2
5
1
2
1
2
6
1 1 1
2
1 1 1
-1 -1 -1 -1
-2
-1
-2
-1
-2
-4
-1 -1
-4
-2
0
2
4
6
2000
Q1
2000
Q2
2000
Q3
2000
Q4
2001
Q1
2001
Q2
2001
Q3
2001
Q4
2002
Q1
2002
Q2
2002
Q3
2002
Q4
2003
Q1
2003
Q2
2003
Q3
2003
Q4
2004
Q1
2004
Q2
2004
Q3
2004
Q4
2005
Q1
2005
Q2
2005
Q3
2005
Q4
2006
Q1
2006
Q2
2006
Q3
2006
Q4
2007
Q1
2007
Q2
2007
Q3
2007
Q4
2008
Q1
2008
Q2
2008
Q3
2008
Q4
2009
Q1
2009
Q2
2009
Q3
2009
Q4
Number of opened/closed casinos
opened closed
Ernst & Young 8

Economic Impact Assessment
Figure 4 - Capital expenditure on casinos
The large fall in capital expenditure from 2007 was followed by a steadier decrease in 2008. By 2009, capital expenditure was less than half of the level it was in 2004. Such a profile in capital expenditure is indicative of a lack of confidence among operators as to the competitiveness and stability of their operating environment and the reduced return on investment that resulted from the 2007 Package. This reduction in capex is consistent with other cost-cutting measures (such as reductions in staff) that have been taken to preserve profitability in light of falling revenues and higher taxation.
As might be expected in a period of declining casino numbers, the picture for employment in casinos, post-implementation of the 2007 Package, has also shown a steady decline, as shown below.
Figure 5 - Employment in casinos
-
20,000,000
40,000,000
60,000,000
80,000,000
100,000,000
120,000,000
140,000,000
2004 2005 2006 2007 2008 2009
CAPEX
12,548 12,075 11,709 11,345 11,122 11,171 11,147 11,109 11,203
0
2000
4000
6000
8000
10000
12000
14000
2007Q4 2008Q1 2008Q2 2008Q3 2008Q4 2009Q1 2009Q2 2009Q3 2009Q4
Employment in casinos
Ernst & Young 9

Economic Impact Assessment
The number of employees in casinos and related functions in the UK, as reported by operators in their returns to the survey, declined by approximately 11% in the period from Q4 2007 to Q4 2009. This should be seen in the context of an overall decline in employment in the labour market as a whole, of around 3%, in the same period.5
The reduced staff numbers could also be expected to impact the quality of the customer experience and result in lower activity, less revenue and lower tax receipts for the Exchequer.
2.3 Analysis of key indicators by sub-grouping
For those casinos in continuous operation throughout the 2003-2009 period, admissions peaked in 2006 before declining thereafter. In addition, with revenue per admission also being in steady decline, the impact on profitability has been an accelerating reduction across the period of study.
The econometric analysis undertaken implied that the legislative changes had a statistically significant impact on the performance of the industry over and above any impact of the economic downturn. There were, however, significant differences between the casino sub-groupings:
High-end London Casinos
For High-end London casinos, the analysis supported the hypothesis that the changes in 2007 had reduced both admissions (by approximately 10%) and revenue per admission (both gaming revenue per admission and total revenue per admission fell by approximately 20% as a result of the changes). EBITDAR per admission appeared not to have been affected by the 2007 changes. This suggests that whilst the 2007 Package had a negative impact on casinos’ ability for revenue generation, the industry’s focus on cost reduction had offset that impact to an extent. The broader economic factors (GDP growth etc), by contrast, only appeared to have affected revenue per admission.
Cost reduction in High-end London casinos that have been achieved by reduced service levels could threaten their international competitiveness with other international gaming destinations like Monte Carlo, Las Vegas and Macau.
Other London
For Other London casinos, admissions do not appear to have been affected by the 2007 changes, although there was a statistical link to GDP growth (unlike High-end London Casinos). This is consistent with expectations for the client group for these casinos, who could be more acutely affected by changes to economic growth, than High-end London casino customers.
The data also show that revenue per admission has fallen following the 2007 changes (by approximately 17%). This metric also appears to have been significantly adversely affected by the economic factors and the increase in remote gaming.
As with the High-end London casinos, it appears that aggressive cost reduction has offset the revenue effects of the 2007 changes, so that there is no apparent impact on EBITDAR per admission. However these reductions are generally one-off in nature and further opportunities for cost-reductions may be unlikely.
Non-London casinos
5 Source: www.statistics.gov.uk
Ernst & Young 10

Economic Impact Assessment
The Non-London casinos appear to have been adversely affected, both in terms of admissions (down 10%), gaming revenue per admission (down 8%) and total revenue per admission (down 10%), by the 2007 Package, the economic factors and the growth in remote gaming. Unsurprisingly, the combination of these factors also appears to have adversely affected EBITDAR per admission (suggesting that cost cutting has been less effective in offsetting overall decline). Prior to the 2007 Package, this sector was on average subject to a Gaming Duty rate of 2.5% of gross gaming yield, given the average turnover of the casinos. Consequently the 500% increase in the starting rate of 2.5% to 15% significantly impacted the EBITDAR and overall profitability of these clubs.
These findings suggest that overall the 2007 Package and other macro-economic drivers have limited casinos’ ability to generate revenues over the period.
The analysis of gaming duty indicated that, for Non-London casinos only, there was an increase in duty as a percentage of revenue and a corresponding increase in duty per admission in 2007. The econometrics show that for this group the 2007 Package increased gaming duty per admission by between 4% and 16%. As noted above, there was no statistically significant impact on gaming duties per admission in the other sub-groupings.
2.4 Conclusions from economic impact assessment As noted above, and set out in detail in Appendix A, the analysis of performance of British Casinos over the time period shows an overall decline, with a statistically significant impact of tax and regulatory changes made in 2007 on some of the key performance indicators. Most notably, casinos’ revenue generation (both gaming revenues per admission and total revenues per admission), saw large and significant reductions overall and in each sub-grouping, by as much as 20% for High-end London casinos.
Ernst & Young 11

Economic Impact Assessment
Measure High-end London Other London Non-London
Admissions Decrease by10% Decrease by 10%
Gaming revenue per admission
Decrease by 20% Decrease by 17% Decrease by 8%
Total Revenue per admission
Decrease by 20% Decrease by 17% Decrease by 10%
Machine win per admission
* * Increase by 15%
Table drop per admission * Decrease by 10% Decrease by 5%
Gaming duty per admission
* * Increase by 4-16%
EBITDAR per admission * * Decrease by 30%
Table 1 - Summary of impact of 2007 Package * Denotes no statistically significant relationship supported by the data.
Casino operators have seen overall profitability (using EBITDAR as a proxy) stagnate for High-end London and Other London casinos. For Non-London casinos the 2007 Package reduced EBITDAR by 30% (and by up to 46% in the worst case). The impacts could have been much worse without cost cutting and revenue controls having been implemented.
The emergence of remote gaming as a significant recipient of betting and gaming custom (approximately £1.45bn per annum)6, and the impact of the global economic downturn in part explain this trend in recent years, but this study shows that the measures introduced in 2007 (specifically the Gambling Act 2005 changes, smoking ban - which was in no sense unique to the casino industry - and changes in gaming duty rates) have contributed significantly to fostering an environment which acts as a barrier to growth. As shown above, this is borne out by the high-level data on casino openings and closures, trends in employment in casinos and overall capital expenditure.
2.5 Which policy changes could make a difference?
It is clear from the analysis that there are potential changes that could be expected to improve the industry’s economic performance. The period in the run-up to implementation of the Gambling Act 2005 could be characterised as optimistic. Operators were opening new casinos and redeveloping existing ones, and the data show that admissions and overall revenues significantly increased in the case of the latter.
The economic impact assessment that has been undertaken has provided the basis for a set of policy changes that could improve the environment for operators and encourage investment in the future. The policy scenarios identified and the results of this modelling are set out in section 3, which follows.
6 Online and interactive gambling, special report; Mintel, July 2009
Ernst & Young 12

Economic Impact Assessment
2.6 The likely impact of a ‘do nothing’ approach
The assessment above demonstrates the decline that the industry has experienced since the 2007 package of changes was introduced. Given the one-off nature of cost-saving measures and the constraints on revenue generation, this decline can be expected to continue if nothing is done to arrest it. Such decline would have implications for industry investment, jobs and in due course Treasury receipts, as the ability of the industry to modernise and play its part in the broader leisure industry is constrained.
Ernst & Young 13

Policy modelling scenarios
3. Policy modelling scenarios 3.1 Three key policy proposals
The following three policy scenarios have been identified as consistent with the direction and aims of government policy and likely to improve the competitive environment for casino operators:
Providing a consistent regime that determines the number of machines across all casinos, following the approach set out in the Gambling Act 2005;
Modernising the approach to the location of Casinos licensed under the Gaming Act 1968 through offering local authorities greater powers to decide their location; and
Modernising the rules determining the use of electronic gaming devices and allowing product that is legal outside a casino to be legal inside a casino.
These proposals are described in detail below and the impacts are described in section 4.
3.1.1 Interaction with other policy discussions
In addition to the above proposals, the industry has already opened discussions regarding changes in the regulatory regime governing the restrictions on stakes and prizes. Given the nature of the industry, the relationship between stakes and prizes and the quantum of each are core elements to the overall ‘price’ of the product that the casino offers. Since such elements are regulated, the casino operator has no ability to respond to an increase in its operating cost through an increase in the price of its product7.
Prior to 2005, the government conducted ‘triennial reviews’ of stakes and prizes and increased the ‘price’ of the products the industry was able to offer. However, since 2005 there has been no such review and no increases in stakes or prizes, even though the government has increased the industry’s cost base through repeated rises in taxation. This remains important and a high priority for the casino industry but is not the focus of this report. This should not be interpreted as a reduction in importance to NCiF of the re-establishment of a robust and routine review of stakes and prizes.
7 Other than food and beverages
Ernst & Young 14

Policy modelling scenarios
3.2 The Gaming Machines Proposal 3.2.1 Policy background
As discussed in Section 2.5, a key constituent of the gambling offering is the provision of "machines". The capabilities of machines have evolved over time and now reflect a complex combination of options and functions. The Gambling Act 2005 revised the definition of machines and provided a more modern categorisation. Under these regulatory provisions, the number and type of machines that can be provided in casinos is carefully controlled.
Prior to the Gambling Act 2005, the number of machines in a casino was controlled by an absolute limit of 20 gaming machines per casino. The actual number of machines deployed per casino varies across the categories of casino, with the largest take up being in the Non-London casinos. The chart below shows the number and proportion of machines operated per casino for each sub-category.
Figure 6 - Deployment of machines (2009) Source: NCiF members 8
The Gambling Act 2005 did not address the number of B1 machines (previously Section 31 machines) in 1968 Act casinos, that remained at 20 regardless of table numbers. At the same time the 2005 Act reclassified the Prize Gaming Equipment (Section 21 devices) as gaming machines. This removed the ability for a casino to have an unlimited number of these devices in addition to its other gaming machines (requiring the casino to count any such devices as part of its maximum complement of 20 gaming machines).
The Act established the number of machines permissible in 2005 Act casinos. It did so by establishing machine to table ratios. It set a ratio of machines:tables of 5:1 for a “Large” casino and a ratio of 2:1 for a “Small” casino. The Act also placed an upper limit for “Small” casinos of 80 machines and 150 for Large casinos
8 Sample size equals 90 out of 141 Casinos or 64%, for whom data was available, per casino i.e. disaggregated by casino sub-group.
20%, 1
0%0%
20%, 1
40%, 2
20%, 1
83%, 5
0%0%0%0%
17%, 1
71%, 56
16%, 13
8%, 6
3%, 20%
3%, 2
2015 - 1910 - 146 - 91 - 50
Number of Machines per Venue(% of Total Sub-Category)
High-End Other London Non-London
Ernst & Young 15

Policy modelling scenarios
When considering the suitable ratio of machines, it is understood that the intent of the ratio is to avoid a change in the character of a casino and the creation of the so-called “machine shed”. This character and approach should be consistent across all types of casino and there appears to be no principled rationale why the ratio should be restricted for smaller casinos. If a ratio of 5:1 (provided for in the 2005 Act for a Large casino) is consistent with maintaining such character, this should be available across the whole population. The current approach actually gives rise to a distortion, where a Small casino would need to operate a larger table gaming floor than a Large casino, in order to be able to offer any given number of machines.
As can be seen from the chart, 20% of the High-end London casinos currently deploy no machines. This is due to the lack of machines at the appropriate “price point” for the customer of the High-end London casino. The current limit of £2 stake and £4,000 prize is well below the amounts that can be wagered on tables within the casino, meaning they are unlikely to be an attractive substitute.
Given this environment, growth from this option would be limited in the High-end London casino segment, but this could be addressed separately through the reform of stakes and prizes. The growth following this reform would occur in the Other casino and the Non-London casino segments.
In contrast to the UK rules, international competitors to the UK High-end London casinos offer machine stake and prizes that are commensurate with the amounts that can be wagered on tables and a stake of $100 for a potential prize of $1,000,000 is not uncommon. Appendix B sets out in more detail the limits in machine numbers and stakes/prizes in other jurisdictions.
As seen in the above chart, a far higher percentage, (71%), of Non London and (83%) Other London Casinos are operating with their current full deployment of machines. Those that have less than full deployment tend to be constrained by size of the premises and local demand. The response to this proposal would therefore be expected to come from the fully deployed casinos.
In general, the current machines: tables ratio for casinos9 that are currently operating at their full capacity of machines is 1.6:1. This shows that there is a considerable gap between the current deployment of 20 machines and the amount that would be available under a consistent cap of 5:1.
3.2.2 Policy proposal
The NCiF believes that there should be consistency amongst the different types of casino and, based on the above, the policy change proposed would be to increase the machines: tables ratio for all casinos, to 5 to 1. This would leave the number of tables as the key determinant of the size of the casino and prevent the evolution of so called machine sheds. It would encourage investment and provide consumers with consistency of offer. It would also adjust the national machine profile which currently indicates that less than 1% of all machines are found in licensed casino premises.
3.2.3 Modelling rationale
The information obtained from the casino operators across the period included the number of machines that were deployed in each casino for each time period. Such data allow an examination of the impact of the measurable outputs to distinct changes in the number of machines. In addition, the change in the regulatory environment provides an opportunity to examine the response to a change in policy.
As noted above, the number of machines that may be operated in a casino governed by the Gaming Act 1968 is currently limited to 20 machines. This limit was increased from 10 machines to 20 machines in Q3 2005. Given that this date is within the sample period, it has been possible to identify the response to the increase in the limit.
9 Excluding ‘High-End London’ casinos
Ernst & Young 16

Policy modelling scenarios
3.2.4 Modelling results
The changes in Q3 2005 to the number of slot machines permitted in 1968 Act casinos (from a maximum of 10 to a maximum of 20) led to an increase in numbers and demonstrated the industry’s willingness to invest. The analysis and chart below show the extent to which casinos were able to fully deploy their ‘allowance’ of 20 machines and what the impact was on other parts of the casino, specifically on gaming tables. The data from operators showed that fully deployed casinos typically achieved full deployment within 12 to 24 months of the Q3 2005 change.
Correlation
12 months after change -0.20
24 months after change 0.69
36 months after change 0.57
4 years after change 0.49
Table 2 – Correlation between machine win and table drop
The correlation coefficient between machine win and table win for the first 12 months (see Table 2, above) showed an inverse correlation between machine win and table drop – indicating that an increase in machine win led to a reduced table drop in the immediate term.
After a year, this relationship dissipates suggesting that, other than in the first year, the machines activity is additional to the total casino activity and any cannibalisation of tables business from increased machines numbers has ceased. A further explanation for the negative correlation in the first year following the change in the regulation could be the lag in rolling out new machines to meet the new cap.
In the medium term, increased machine win seems to also lead to increased admissions. This clearly supports a view that further increasing gaming machine numbers in casinos could satisfy latent demand rather than detract from other areas of gambling. This can also be seen in the chart below.
Figure 7 – Admissions and machine win (2000 - 2009)
Consequently the increase in machines is additional to the overall gross win of the casino and a commensurate increase in tax revenues can be expected. Given this additive nature, it can be deduced that the total benefit to the Exchequer of the increase in machine numbers from 10 to 20 has been
Ernst & Young 17

Policy modelling scenarios
approximately £2m per annum directly from AMLD10, even without considering the increase in corporation tax and duties on table win.
Based on statistical analysis, the above additional machine win can be seen to have supported £220m of additional table drop, providing approximately £4.4m additional duty on gross gaming yield. Hence the increase from 10 to 20 machines will have generated additional duties revenue of £6.5m per annum.
3.2.5 Modelling conclusion
It can be estimated from the above that a move to a machines:tables ratio of 5:1 would generate a maximum capacity of 4,300 additional machines across the casinos sampled that are fully deploying the current limit of 20 machines11. Even with this increase, the total number of machines in UK casinos would represent just over 2.5% of total machines in the UK.12 Should all these casinos deploy the new maximum of 5:1, the additional machines would generate additional AMLD of £12.5m and gaming yield of £8.613.
This figure would clearly be the limiting case for this sample (as some casinos would not have the floor space or business case for deploying machines to the new absolute maximum). In order to assess the total increase in machine numbers for the parent population, it would be necessary to extrapolate from the sampling distribution and then offset for those casinos that would not fully deploy the new maximum number of machines. Given the above, estimates for benefits accruing to the Exchequer in section 4, are based on data from the sample only. This is equivalent to an additional £12.5m in AMLD.
The Exchequer could also expect to receive additional corporation tax on the profit from any increased activity and gaming duties from increased table win.
10 Calculated as the sum (for all casinos with > 10 machines) of (for each such casino: (number of machines – 10)) x AMLD charge for each machine 11 Calculated as (for all casinos currently deploying 20 machines) the number of machines available under the 5:1 ratio less the number of machines currently deployed in those casinos (i.e. the number of such casinos multiplied by 20) 12 Gambling Machine industry statistics 2008-2009 estimates total UK machines at 248,000. Report at: www.gamblingcommission.gov.uk 13 Calculated from the ratio of AMLD:GGY from previous changes.
Ernst & Young 18
Policy modelling scenarios
3.3 The Casino Location Proposal 3.3.1 Policy background
Key contributors to the success of any business, casinos included, comprise its location, its product offering and its environment. Consequently it can be expected that the precise location of the casino is a critical choice for a casino operator.
A side-effect of the creation of 16 potential new 2005 Act licences has been the freezing of the regulatory regime applying to the casinos governed by the Gaming Act 1968. The rationale for the freezing of the licensing regime was that the eight, new “Large” and eight, “small” casinos were originally conceived, alongside eight, “Regional” or so-called ‘super casinos’ (each of which was intended to have 1,250 Category A, unlimited stake and prize machines), as ‘an experiment’. The proposed eight Regional casinos were initially reduced to one through the political process in the first half of 2005. The one remaining Regional casino was also eventually shelved in the second half of 2005, thus the intended ‘experiment’ stalled at the conceptual stage.
The resulting regulatory environment is acting to frustrate the free choice of location, both for operators and consumers. Under the frozen 1968 regime these casinos may only be sited in the areas specified at the time of the 1968 Act (the so-called “Permitted Areas”), over 40 years ago. Relocation of a 1968 Act casino is therefore not possible outside the specific Permitted Area in which it was originally licensed, even if there is agreement between all the stakeholders (such as the local residents, the local councils and the operator), as to the benefits that a successful casino could bring to the area.
The precise positioning of any casino will necessarily depend on the environment and the demand from the local residents, both in terms of custom and acceptability and are also regulated by planning and gaming law. Controls on the establishment of casinos are therefore to be expected, but these should be for sound social and economic reasons.
The Gambling Act 2005 prevented the issue of any further casino licences (beyond the 16 new licences). There are 187 1968 Act licences in existence and this number cannot be increased so proliferation risk does not exist. This can be compared to Betting Shops of which there are more than 8,800 and to which no numeric constraint applies.
3.3.2 Policy proposal
Based on the above, the policy change proposed would be to permit the 1968 Act licences to be moved from an existing Permitted Area to any Local Authority that wishes to have a casino and is prepared to reflect that in its licensing policy. This would enable the commercialisation of licences that are currently inactive due to applying to areas where the demographics do not allow for the profitable utilisation of the license, as well as the porting of the casino from an area of low demand to an area of high demand.
In essence, the proposal would widen the possible sites for a casino. Given the expansion in choice, it is highly likely that there are profitable new sites to which the inactive licences could be applied and that there are some new sites that would be more profitable than the less profitable sites currently hosting casinos.
The relocation resulting from this policy change would increase the efficiency of the sector. This is particularly likely given that the choice of the Permitted Areas was determined over 40 years ago and the demographics of the areas will have changed significantly over this period. Furthermore, given that 10 of the new casinos under the Gambling Act 2005 are in existing Permitted Areas, this change would also avoid a level of cannibalisation from the new casinos.
Ernst & Young 19

Policy modelling scenarios
This policy option is consistent with a general decentralisation policy that allows local authorities greater powers of self determination in these policy areas. It would also be helpful in meeting the demand from the more than 60 local authorities that applied for new licences and were disappointed not to be awarded one.14
The checks and balances on proliferation are clear:
The overall number of casinos in the UK is now fixed – changes to primary legislation would be required for there to be an increase.
Section 166 of the Gambling Act 2005 allows a local authority to pass a resolution not to have a casino within its local authority area. Licensing policy is subject to public consultation.
Planning consent for casinos requires specific permission which involves public consultation.
Although planning consent may be granted for a casino, the premises also require a Premises Licence to be granted by the local authority under the Gambling Act, which is also subject to public consultation.
3.3.3 Modelling rationale
A detailed analysis of the impact of opening a casino in a particular location would involve a study of all of the various input factors and would be site specific. Rather than seek to identify the particular upside for a suite of casinos, this paper seeks to demonstrate that there are clearly positive benefits by examining the result of previous openings.
It is necessary to consider the potential impact of cannibalisation on the business of competing casinos. By comparing to those casinos opening or moving within a Permitted Area, the cannibalisation could be expected to be over-estimated, as the likelihood of cannibalisation can be expected to reduce as the distance to competitors increases. Therefore the modelling should produce a worst case scenario and downplay the benefits.
3.3.4 Modelling results
The data provided included those casinos that were opened during the period, as well as other casinos that were active in the vicinity. By examining the impact of the opening of a rival casino on the existing stock, the benefits brought by the new casino and the cannibalisation can be evaluated.
The analysis suggests that a new opening causes a significant increase in the number of admissions and revenues. The table below shows changes in the average number of admissions, revenues and gaming duty paid in local markets in percent and in absolute values for the first and second years after the openings.
Base case scenario
Change in % one year after opening
Change one year after opening
Change in % two years after opening
Change two years after opening
Admissions 95,355 +41% 134,829 +70%
161,983
Gaming revenue (£)
2,648,897 +49%
3,946,506 +68%
4,441,710
Total revenue (£) +53% +74%
14 Of 68 local authorities who originally expressed an interest in having a 2005 Act casino in their local authority area, 27 were for a Regional casino; 41 for a Large or Small casino.
Ernst & Young 20

Policy modelling scenarios
2,850,726 4,373,959 4,947,913
Machines win (£) 433,960 +43%
619,162 +127%
984,723
Tables drop (£) 15,019,273 +20%
18,075,541 +35%
20,226,534
Tables win (£) 2,202,079 +51%
3,318,977 +64%
3,602,420
Total gaming duty (£)
298,991 +77%
527,726 +117%
648,462
EBITDAR (£) 351,316 +2%
359,217 +71%
600,990
Table 3 – Illustrative impact of new opening
The table shows the percentage increase in admissions in regions in which new casinos were opened. It can be seen that the admissions increased by 41% in the first 12 months; and were 70% greater two years after opening. This indicates that newly opened casinos were, in general, stimulating new demand, because overall admissions in a region were greater after opening. It was not the case that existing demand was “shared out” between the casinos. Furthermore new casinos will tend to be larger, employ more people and therefore return more to the Exchequer through taxation. Based on its experience of new casino openings, NCiF believes that this option could generate between 120 and 150 new jobs per casino opening.
The total number of possible casino openings under the current regulations is 46.15 If this policy were to result in 20 new casino openings, the total increase in gaming duties would be approximately £600,000 per casino, or £12m in total. On the above basis, NCiF believes 2,400 to 3,000 new jobs could be created.
3.3.5 Modelling conclusion
It is assumed that openings of casinos took place in permitted areas in which casino operators saw latent demand, as compared to other locations in which demand may be saturated. Since there are many areas without any casinos at all, this analysis suggests that a new opening would lead to an increase in admissions, revenues and gaming duty overall. This would not, however, lead to an explosion of casinos in any area. There has been no increase in the number of 1968 Act casino licenses – which is finite at 187. Moreover, there already exist safeguards for local authorities and local communities to prevent proliferation of casinos under the 2005 Act.
In conclusion:
Abolition of Permitted Areas should result in a significant increase in the number of admissions, revenues and gaming duty paid.
As new areas are identified, there is likely to be limited or no cannibalisation between existing and newly opened casinos.
Some casinos will move from existing Permitted Areas, reducing oversupply in some areas.
There will be additional jobs and increased profits generated by newly opened casinos, leading to higher tax receipts for the Exchequer.
15 There are a total of 187 1968 Act licenses available, with 141 currently used. There are 46 licenses which remain dormant (either unused or closed),
Ernst & Young 21

Policy modelling scenarios
Ernst & Young 22
Policy modelling scenarios
3.4 The Modernisation Proposal 3.4.1 Policy background
One of the intentions of the Gambling Act 2005 was to regulate the emerging remote gambling market. A by-product of the regime has restricted the use of electronic gaming equipment in “bricks and mortar” casinos. This issue is quite distinct from ‘on-line’ or ‘remote gaming’, but stifled the innovations that have been adopted elsewhere.
For example, the restriction on the use of some electronic virtual gaming equipment, including random number generators, has inhibited the use of new technology in game delivery. Operators of any “bricks and mortar” casino cannot use digital representations of casino equipment (such as cards and dice). This can result in a less attractive offering in UK casinos compared to overseas competitors. Furthermore, there are security issues in being compelled to only use “real” cards, dice and roulette wheels, as cards and dice need constant checking, monitoring and replacement to avoid customer marking and tampering.
As a second and quite separate issue, it is also not permissible to install dedicated internet terminals linked to remote gaming sites in the regulated environment of a casino. This results in a more restrictive environment within the ‘protection’ of a casino than is available without supervision in any broadband-connected home or internet cafe.
Some UK “bricks and mortar” operators have interests in remote gaming businesses. It seems anomalous that a customer could play on a remote site owned by that company immediately outside the company’s “bricks and mortar” premises, but that the operator cannot offer the identical facility within the casino on a dedicated terminal.
3.4.2 Policy proposal
The proposed policy change would remove the restriction to only use real gaming products in licensed casinos and allow casinos to offer a much wider product range and access to modern electronic gaming equipment.
A separate policy change would also allow remote gaming to take place under licence in the regulated environment of a casino.
3.4.3 Modelling rationale
Rather than seeking to model a response to the precise policy option, this section seeks to identify the benefits of the likely increases in admissions resulting from such policy proposals. This increase in admissions could arise for a number of reasons.
Firstly, the deployment of new technologies and dedicated internet terminals will enhance the experience of customers and this can be expected to increase admissions.
Secondly, removing the prohibition of remote gaming within a casino can be expected to allow “bricks and mortar” casinos to more readily compete with remote gaming on the same gaming experience. There is evidence from the data that the growth of remote gaming has in part been at the expense of admissions to, and activity within, “bricks and mortar” casinos
In order to place the level of additional admissions into context in relation to the removal of the prohibition of remote gaming, the data supplied by operators has been used to estimate the impact of
Ernst & Young 23
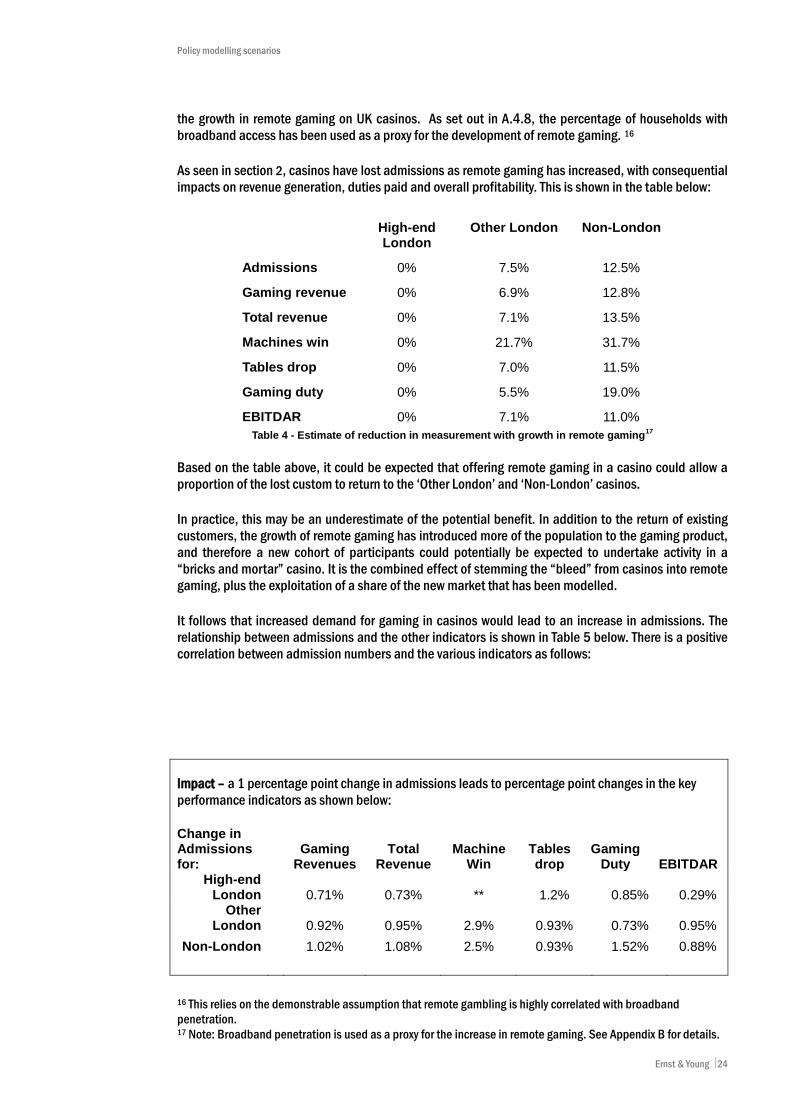
Policy modelling scenarios
the growth in remote gaming on UK casinos. As set out in A.4.8, the percentage of households with broadband access has been used as a proxy for the development of remote gaming. 16
As seen in section 2, casinos have lost admissions as remote gaming has increased, with consequential impacts on revenue generation, duties paid and overall profitability. This is shown in the table below:
High-end London
Other London Non-London
Admissions 0% 7.5% 12.5%
Gaming revenue 0% 6.9% 12.8%
Total revenue 0% 7.1% 13.5%
Machines win 0% 21.7% 31.7%
Tables drop 0% 7.0% 11.5%
Gaming duty 0% 5.5% 19.0%
EBITDAR 0% 7.1% 11.0% Table 4 - Estimate of reduction in measurement with growth in remote gaming17
Based on the table above, it could be expected that offering remote gaming in a casino could allow a proportion of the lost custom to return to the ‘Other London’ and ‘Non-London’ casinos.
In practice, this may be an underestimate of the potential benefit. In addition to the return of existing customers, the growth of remote gaming has introduced more of the population to the gaming product, and therefore a new cohort of participants could potentially be expected to undertake activity in a “bricks and mortar” casino. It is the combined effect of stemming the “bleed” from casinos into remote gaming, plus the exploitation of a share of the new market that has been modelled.
It follows that increased demand for gaming in casinos would lead to an increase in admissions. The relationship between admissions and the other indicators is shown in Table 5 below. There is a positive correlation between admission numbers and the various indicators as follows:
16 This relies on the demonstrable assumption that remote gambling is highly correlated with broadband penetration. 17 Note: Broadband penetration is used as a proxy for the increase in remote gaming. See Appendix B for details.
Impact – a 1 percentage point change in admissions leads to percentage point changes in the key performance indicators as shown below: Change in Admissions for:
Gaming Revenues
Total Revenue
Machine Win
Tables drop
Gaming Duty EBITDAR
High-end London 0.71% 0.73% ** 1.2% 0.85% 0.29%
Other London 0.92% 0.95% 2.9% 0.93% 0.73% 0.95%
Non-London 1.02% 1.08% 2.5% 0.93% 1.52% 0.88%
Ernst & Young 24
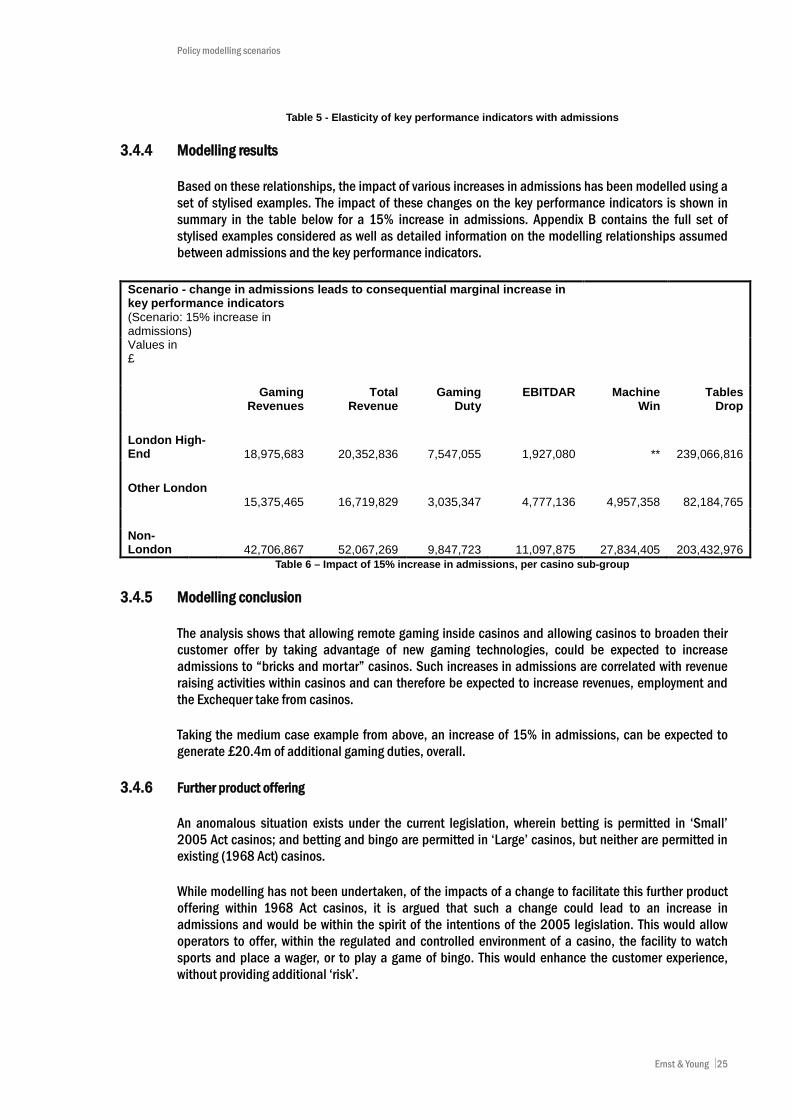
Policy modelling scenarios
Table 5 - Elasticity of key performance indicators with admissions
3.4.4 Modelling results
Based on these relationships, the impact of various increases in admissions has been modelled using a set of stylised examples. The impact of these changes on the key performance indicators is shown in summary in the table below for a 15% increase in admissions. Appendix B contains the full set of stylised examples considered as well as detailed information on the modelling relationships assumed between admissions and the key performance indicators.
Scenario - change in admissions leads to consequential marginal increase in key performance indicators
(Scenario: 15% increase in admissions)
Values in £
Gaming Revenues
Total Revenue
Gaming Duty
EBITDAR Machine Win
Tables Drop
London High-End
18,975,683
20,352,836
7,547,055
1,927,080
**
239,066,816
Other London 15,375,465
16,719,829
3,035,347
4,777,136
4,957,358
82,184,765
Non-London
42,706,867
52,067,269
9,847,723
11,097,875
27,834,405
203,432,976
Table 6 – Impact of 15% increase in admissions, per casino sub-group
3.4.5 Modelling conclusion
The analysis shows that allowing remote gaming inside casinos and allowing casinos to broaden their customer offer by taking advantage of new gaming technologies, could be expected to increase admissions to “bricks and mortar” casinos. Such increases in admissions are correlated with revenue raising activities within casinos and can therefore be expected to increase revenues, employment and the Exchequer take from casinos.
Taking the medium case example from above, an increase of 15% in admissions, can be expected to generate £20.4m of additional gaming duties, overall.
3.4.6 Further product offering
An anomalous situation exists under the current legislation, wherein betting is permitted in ‘Small’ 2005 Act casinos; and betting and bingo are permitted in ‘Large’ casinos, but neither are permitted in existing (1968 Act) casinos.
While modelling has not been undertaken, of the impacts of a change to facilitate this further product offering within 1968 Act casinos, it is argued that such a change could lead to an increase in admissions and would be within the spirit of the intentions of the 2005 legislation. This would allow operators to offer, within the regulated and controlled environment of a casino, the facility to watch sports and place a wager, or to play a game of bingo. This would enhance the customer experience, without providing additional ‘risk’.
Ernst & Young 25

Conclusions from policy modelling
4. Conclusions from policy modelling
Based on the above analysis, it can be seen that the three policy proposals would provide a valuable opportunity for the casino industry to invest, grow and further contribute to the success of the UK. The key messages from the modelling are as set out below. The modelling does not seek to quantify other additional benefits from further investment including the creation of additional employment and spill-over and multiplier effects for the wider economy.
Policy change – Consistent machines:tables ratios
Extending the uniform 5:1 machines:tables ratio to all casinos can be expected to raise additional AMLD of £12.5m per annum, from an additional 4,300 machines, predominantly in the Other casinos
This additional revenue could be expected to drive additional gaming duties from additional gaming activities of £8.6m
Full deployment of machines can be expected within 24 months
Policy change – Location of casinos
Each casino licence that is currently inactive (due to being restricted to a Permitted Area) could be generating £600,000 per annum in gaming duties
Permitting the 1968 Act licences to be moved (from an existing Permitted Area to any Local Authority that wishes to have a casino and is prepared to amend and reflect that in its licensing policy) would activate those licenses
Such changes would also lead to casinos moving, which would generate additional revenue
This would also maximise the benefit of the Small and Large casinos and avoid cannibalisation
Policy change – Modernisation of electronic gaming rules
Allowing a greater range of electronic gaming inside casinos can be expected to increase admissions
Such increases in admissions are correlated with growth and increase in gaming duties
An increase of 15% in admissions, can be expected to generate £20.4m of additional gaming duties.
As a result of these changes, the annual benefit to the Exchequer (once full year impact has been achieved) could be estimated as follows:
Policy proposal Impact (£s) 1. Consistent machines:tables ratios 12,500,000 2. Location of casinos (assuming 20 casinos) 12,000,000 3. Modernisation of the electronic gaming rules 20,400,000 Total Exchequer gain per annum £44,900,000
In practice there is interaction between these policy proposals. For instance, if each were to be introduced, it could be expected that a greater impact could be seen on admissions and casino openings. Hence the example above using 20 new casinos as a base should be considered indicative.
Ernst & Young 26
Economic Impact Assessment
A. Economic Impact Assessment
A.1 The econometrics
The key findings below and those discussed in section 2 and elsewhere in this report are based on econometric regression analysis. Regression analysis is a standard statistical method used to analyse dependencies between economic variables.
Regression analysis was used to analyse changes in the following industry indicators:
Number of admissions Gambling and total revenues (£) Gaming duty paid (£) EBITDAR (£) Tables drop (£) Machines win (£)
The following set of economic variables was used to explain changes in the industry indicators:
Changes in average income in London and in the UK. The variable “changes in average income” is commonly used as a proxy for disposable income and in the regression analysis it was used to identify the extent to which admissions to casinos and spending on gambling are influenced by income. Such dependence, being the income elasticity of demand, identifies how much consumption changes in response to any given percentage change in average income.
GDP growth rate and unemployment rate. GDP growth rate and unemployment are correlated with each other and illustrate general macroeconomic conditions. These variables measure the impact of the country’s economic situation on the consumption of gambling.
Percentage of households with broadband access. The percentage of households with broadband access was used to measure the impact of remote gaming on casinos admissions and spending on gambling. This relies on the assumption that remote gambling is highly correlated with broadband penetration.
Data were aggregated across casinos within the same categories and annual data from 2000 to 2009 have been used to derive the results.18 Mostly, linear regression analysis was applied in order to derive the results (especially where the sample size resulted in low degrees of freedom). Therefore, in some cases it was not possible to clearly identify the joint interaction of independent variables on admissions and other key performance indicators.
18 All analytical results are expressed in real terms in 2009 prices.
Ernst & Young 27

Economic Impact Assessment
A.2 Sub-groupings
The casinos were segmented into three groups:
High-end London casinos;
Other London casinos; and
Non-London casinos.
The rationale for this split was that High-end London casinos have a very different customer profile and customer offer to the others, and that provincial casinos are subject to different economic and market forces than those in London. High-end London casinos also compete with different, international markets, as the wealth and mobility of its client base allows it to ‘export’ services to customers. Other London casinos similarly have a very different customer base as opposed to High-end London casinos and Non-London Casinos. The results of the analysis do show significantly different impacts between sub-groupings, supporting the approach adopted.
A.3 Key findings
The table below sets out the significant effects of the 2007 regulatory and tax changes on the performance indicators, between sub-groupings:
High-end London Other London Non-London
Admissions: decrease by 10% Gaming revenue per admission: decrease by 17%
Admissions: decrease by 10%
Gaming revenue per admission: decrease by 20%
Total Revenue per admission: decrease by 17%
Gaming revenue per admission: decrease by 8%
Total Revenue per admission: decrease by 20%
Table drop per admission: decrease by 10%
Total Revenue per admission: decrease by 10%
Gaming duty per admission: increased by 4-16%
EBITDAR per admission: decrease by 30%
Machine win per admission: increase by 15%
Table drop per admission, decrease by 5%
Ernst & Young 28
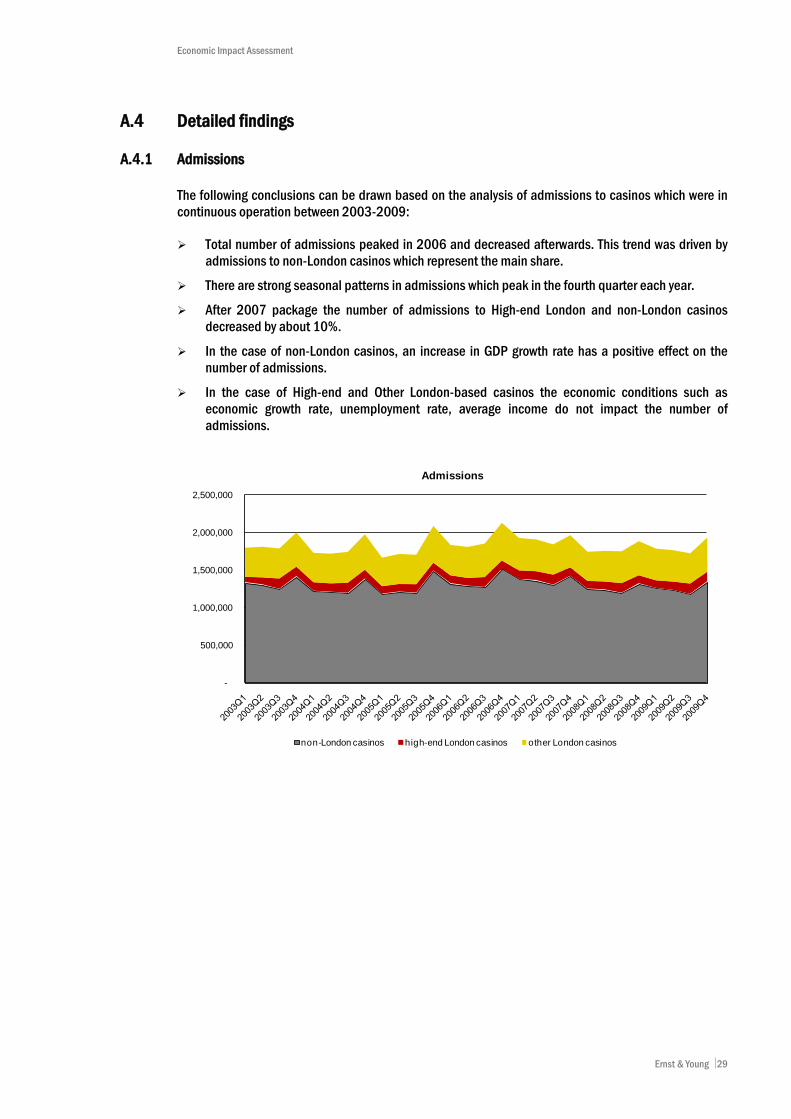
Economic Impact Assessment
A.4 Detailed findings
A.4.1 Admissions
The following conclusions can be drawn based on the analysis of admissions to casinos which were in continuous operation between 2003-2009:
Total number of admissions peaked in 2006 and decreased afterwards. This trend was driven by admissions to non-London casinos which represent the main share.
There are strong seasonal patterns in admissions which peak in the fourth quarter each year.
After 2007 package the number of admissions to High-end London and non-London casinos decreased by about 10%.
In the case of non-London casinos, an increase in GDP growth rate has a positive effect on the number of admissions.
In the case of High-end and Other London-based casinos the economic conditions such as economic growth rate, unemployment rate, average income do not impact the number of admissions.
-
500,000
1,000,000
1,500,000
2,000,000
2,500,000
Admissions
non-London casinos high-end London casinos other London casinos
Ernst & Young 29

Economic Impact Assessment
A.4.2 Gaming revenues per admission
The following conclusions can be drawn based on the analysis of gaming revenues in casinos which were in continuous operation between 2003-2009:
Total gaming revenue decreased in the years 2003-2009 driven largely by a decrease in non-London casinos.
There are no seasonal effects in gaming revenue per admission. The observed seasonality in total gaming revenues results from seasonal effects in the number of admissions.
The 2007 package decreased gaming revenue per admission by about 20% in High-end London casinos, by about 17% in other London casinos and by about 8% in non-London casinos.
In the case of High-end London and other London-based casinos, the economic conditions such as economic growth rate, unemployment rate and average income do impact gaming revenue per admission. In the case of non-London casinos, the economic factors have a significant impact.
-
20,000,000
40,000,000
60,000,000
80,000,000
100,000,000
120,000,000
140,000,000
160,000,000
180,000,000
Gaming revenues
non-London casinos high-end London casinos other London casinos
Ernst & Young 30

Economic Impact Assessment
A.4.3 Total revenues per admission
In High-end London and other-London casinos, gaming revenues represent between 97-98% of total revenues. Therefore, the effects described above for gaming revenues, broadly hold for the total. See section 2 for the headline impacts. In non-London casinos, the corresponding figure is 91%, so some differences can be seen compared to gaming revenues:
The 2007 package decreased total revenue per admission in non-London casinos by about 10%.
The total revenue per admission is positively influenced by changes in average income.
-
20,000,000
40,000,000
60,000,000
80,000,000
100,000,000
120,000,000
140,000,000
160,000,000
180,000,000
200,000,000
Total revenues
non-London casinos high-end London casinos other London casinos
Ernst & Young 31
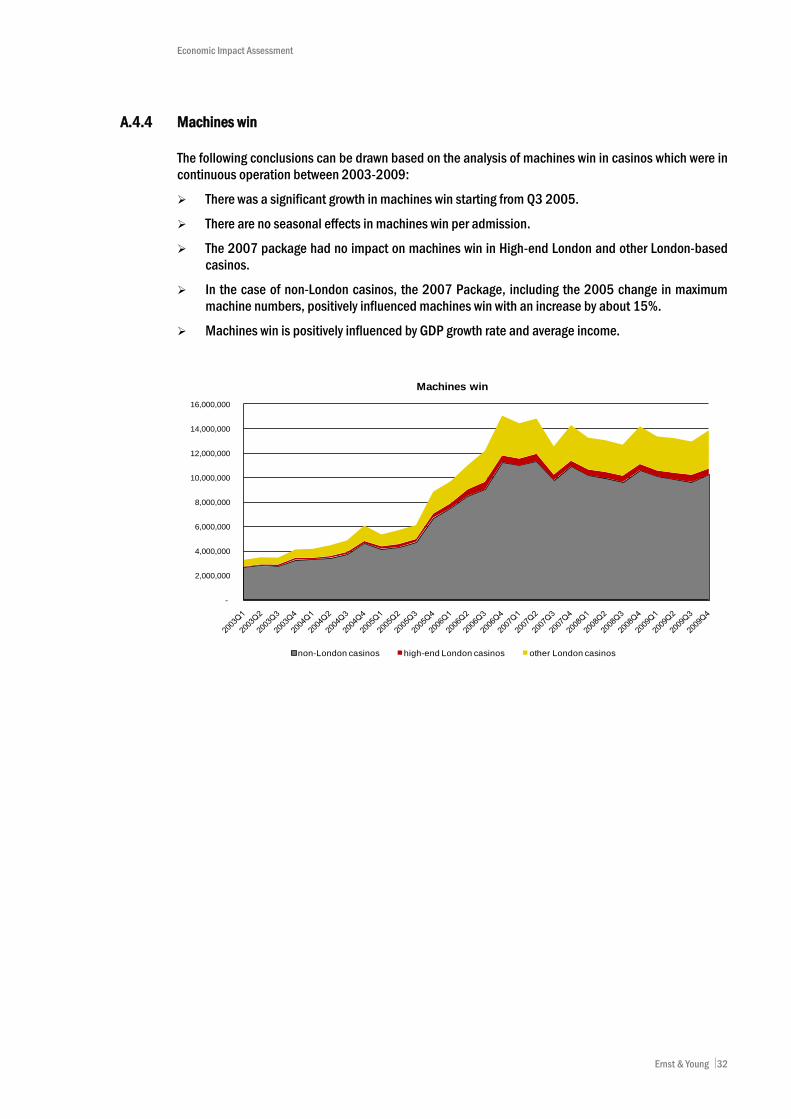
Economic Impact Assessment
A.4.4 Machines win
The following conclusions can be drawn based on the analysis of machines win in casinos which were in continuous operation between 2003-2009:
There was a significant growth in machines win starting from Q3 2005.
There are no seasonal effects in machines win per admission.
The 2007 package had no impact on machines win in High-end London and other London-based casinos.
In the case of non-London casinos, the 2007 Package, including the 2005 change in maximum machine numbers, positively influenced machines win with an increase by about 15%.
Machines win is positively influenced by GDP growth rate and average income.
-
2,000,000
4,000,000
6,000,000
8,000,000
10,000,000
12,000,000
14,000,000
16,000,000
Machines win
non-London casinos high-end London casinos other London casinos
Ernst & Young 32

Economic Impact Assessment
A.4.5 Tables drop
The following conclusions can be drawn based on the analysis of tables drop in casinos which were in continuous operation between 2003-2009:
Total tables drop increased in High-end London casinos. There was a decrease in tables drop in the other casinos in the years 2003-2009.
There are no seasonal effects in tables drop per admission. Instead the seasonality in total tables drop arises due to seasonality in the number of admissions.
The 2007 package had no impact on tables drop in High-end London casinos.
In the case of other London casinos, the 2007 Package decreased tables drop by about 10% and in the case of non-London casinos by about 5%.
Tables drop increases with an increase in average income.
-
100,000,000
200,000,000
300,000,000
400,000,000
500,000,000
600,000,000
700,000,000
800,000,000
900,000,000
Tables drop
non-London casinos high-end London casinos other London casinos
Ernst & Young 33

Economic Impact Assessment
A.4.6 Gaming duty
The following conclusions can be drawn based on the analysis of gaming duty paid by casinos which were in continuous operation between 2003-2009:
The gaming duty paid decreased in the years 2003-2009.
There are no seasonal effects in gaming duty per admission. However, there is seasonality in total gaming duty due to seasonality in the number of admissions.
The 2007 package had no effect on the value of gaming duty per admission in High-end London and other London-based casinos.
The 2007 package increased gaming duty per admission in non-London casinos by about 4-16%.
There is a positive effect of economic conditions on gaming duty represented by average income.
-
5,000,000
10,000,000
15,000,000
20,000,000
25,000,000
30,000,000
35,000,000
40,000,000
45,000,000
Total duty
non-London casinos high-end London casinos other London casinos
Ernst & Young 34

Economic Impact Assessment
A.4.7 EBITDAR
The following conclusions can be drawn based on the analysis of EBITDAR in casinos which were in continuous operation between 2003-2009:
Total EBITDAR decreased significantly in the years 2003-2009.
There are no seasonal effects in the EBITDAR per admission.
The 2007 package had no net impact on the EBITDAR per admission in High-end London and other London-based casinos (presumably due to cost cutting as a result of lower earnings).
The 2007 package decreased the EBITDAR per admission in non-London casinos by 30% (46% in the worst case).
The EBITDAR per admission is not impacted by economic factors, such as economic growth rate, unemployment rate and average income.
-
10,000,000
20,000,000
30,000,000
40,000,000
50,000,000
60,000,000
70,000,000
EBITDAR
non-London casinos high-end London casinos other London casinos
Ernst & Young 35

Economic Impact Assessment
A.4.8 Remote gambling
There is a general consensus that broadband diffusion has supported the growth of remote gambling, and there is strong positive correlation over time between remote gambling and broadband penetration. Broadband penetration and in particular the growth in the broadband market since 2004, have coincided with the proliferation of online and remote gaming activities. Therefore, broadband penetration has been used as a proxy for remote gambling growth.
The relationship between broadband penetration and admissions has been analysed for the core casino groupings.
Over the 2000 - 2009 period Based on the regression results: High-end London: No statistically significant results
Other London: 100% change in broadband penetration leads to a 0.3% change in admissions
Non London: 100% change in broadband penetration leads to a 0.5% change in admissions
Based on the econometric results and growth in broadband penetration over the observation period the growth in broadband penetration has led to circa a 7.5% and 12.5% reduction in admissions for Other London and Non London casinos respectively. Admissions in High-end London casinos have not seen any reduction alongside the growth of broadband.
Ernst & Young 36
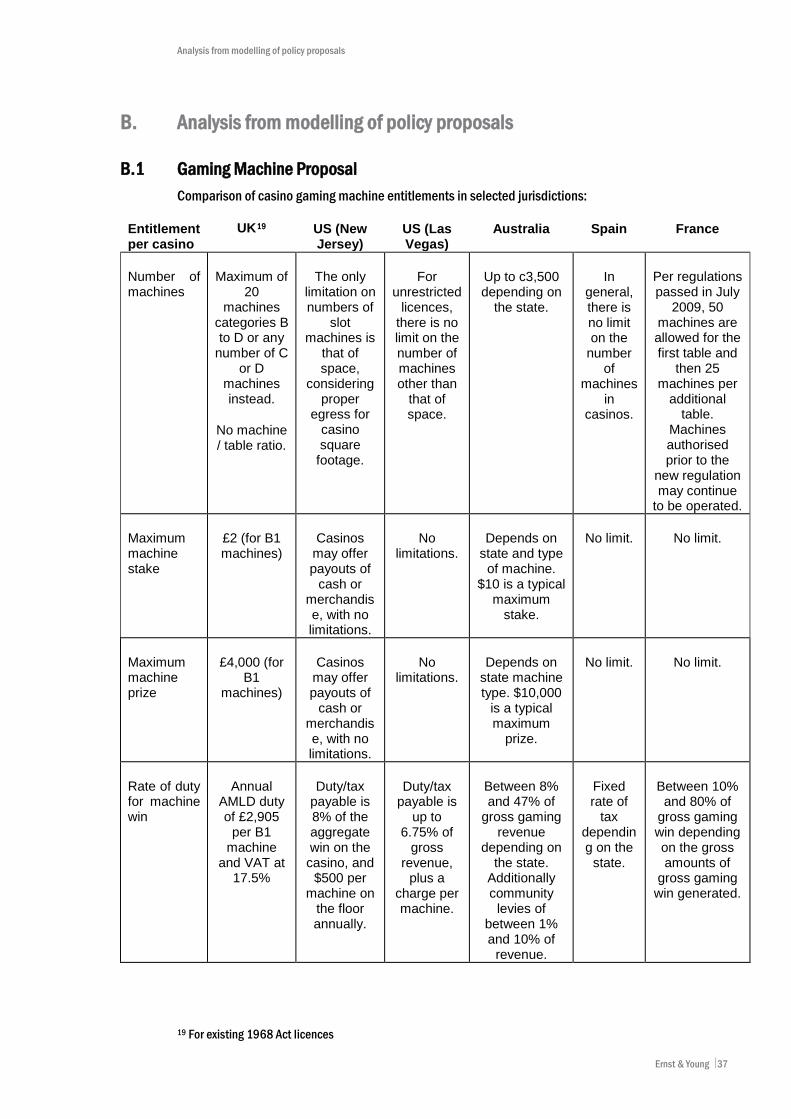
Analysis from modelling of policy proposals
B. Analysis from modelling of policy proposals
B.1 Gaming Machine Proposal Comparison of casino gaming machine entitlements in selected jurisdictions:
Entitlement per casino
UK19 US (New Jersey)
US (Las Vegas)
Australia Spain France
Number of machines
Maximum of 20
machines categories B to D or any
number of C or D
machines instead.
No machine / table ratio.
The only limitation on numbers of
slot machines is
that of space,
considering proper
egress for casino square
footage.
For unrestricted
licences, there is no limit on the number of machines other than
that of space.
Up to c3,500 depending on
the state.
In general, there is no limit on the
number of
machines in
casinos.
Per regulations passed in July
2009, 50 machines are allowed for the first table and
then 25 machines per
additional table.
Machines authorised prior to the
new regulation may continue
to be operated.
Maximum machine stake
£2 (for B1 machines)
Casinos may offer payouts of
cash or merchandise, with no limitations.
No limitations.
Depends on state and type
of machine. $10 is a typical
maximum stake.
No limit. No limit.
Maximum machine prize
£4,000 (for B1
machines)
Casinos may offer payouts of
cash or merchandise, with no limitations.
No limitations.
Depends on state machine type. $10,000
is a typical maximum
prize.
No limit. No limit.
Rate of duty for machine win
Annual AMLD duty of £2,905
per B1 machine
and VAT at 17.5%
Duty/tax payable is 8% of the aggregate win on the casino, and
$500 per machine on
the floor annually.
Duty/tax payable is
up to 6.75% of
gross revenue,
plus a charge per machine.
Between 8% and 47% of
gross gaming revenue
depending on the state.
Additionally community
levies of between 1% and 10% of
revenue.
Fixed rate of
tax depending on the
state.
Between 10% and 80% of
gross gaming win depending on the gross amounts of
gross gaming win generated.
19 For existing 1968 Act licences
Ernst & Young 37
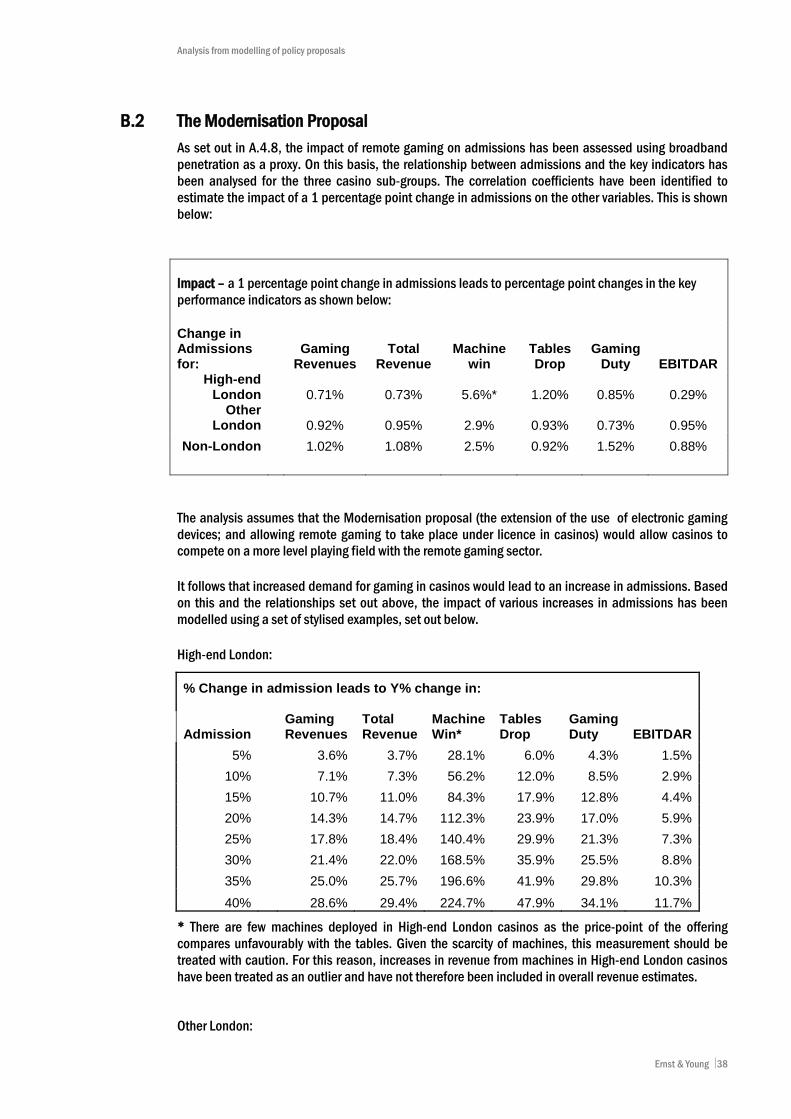
Analysis from modelling of policy proposals
B.2 The Modernisation Proposal As set out in A.4.8, the impact of remote gaming on admissions has been assessed using broadband penetration as a proxy. On this basis, the relationship between admissions and the key indicators has been analysed for the three casino sub-groups. The correlation coefficients have been identified to estimate the impact of a 1 percentage point change in admissions on the other variables. This is shown below:
The analysis assumes that the Modernisation proposal (the extension of the use of electronic gaming devices; and allowing remote gaming to take place under licence in casinos) would allow casinos to compete on a more level playing field with the remote gaming sector.
It follows that increased demand for gaming in casinos would lead to an increase in admissions. Based on this and the relationships set out above, the impact of various increases in admissions has been modelled using a set of stylised examples, set out below.
High-end London:
% Change in admission leads to Y% change in:
Admission Gaming Revenues
Total Revenue
Machine Win*
Tables Drop
Gaming Duty EBITDAR
5% 3.6% 3.7% 28.1% 6.0% 4.3% 1.5% 10% 7.1% 7.3% 56.2% 12.0% 8.5% 2.9% 15% 10.7% 11.0% 84.3% 17.9% 12.8% 4.4% 20% 14.3% 14.7% 112.3% 23.9% 17.0% 5.9% 25% 17.8% 18.4% 140.4% 29.9% 21.3% 7.3% 30% 21.4% 22.0% 168.5% 35.9% 25.5% 8.8% 35% 25.0% 25.7% 196.6% 41.9% 29.8% 10.3% 40% 28.6% 29.4% 224.7% 47.9% 34.1% 11.7%
* There are few machines deployed in High-end London casinos as the price-point of the offering compares unfavourably with the tables. Given the scarcity of machines, this measurement should be treated with caution. For this reason, increases in revenue from machines in High-end London casinos have been treated as an outlier and have not therefore been included in overall revenue estimates.
Other London:
Impact – a 1 percentage point change in admissions leads to percentage point changes in the key performance indicators as shown below: Change in Admissions for:
Gaming Revenues
Total Revenue
Machine win
Tables Drop
Gaming Duty EBITDAR
High-end London 0.71% 0.73% 5.6%* 1.20% 0.85% 0.29%
Other London 0.92% 0.95% 2.9% 0.93% 0.73% 0.95%
Non-London 1.02% 1.08% 2.5% 0.92% 1.52% 0.88%
Ernst & Young 38
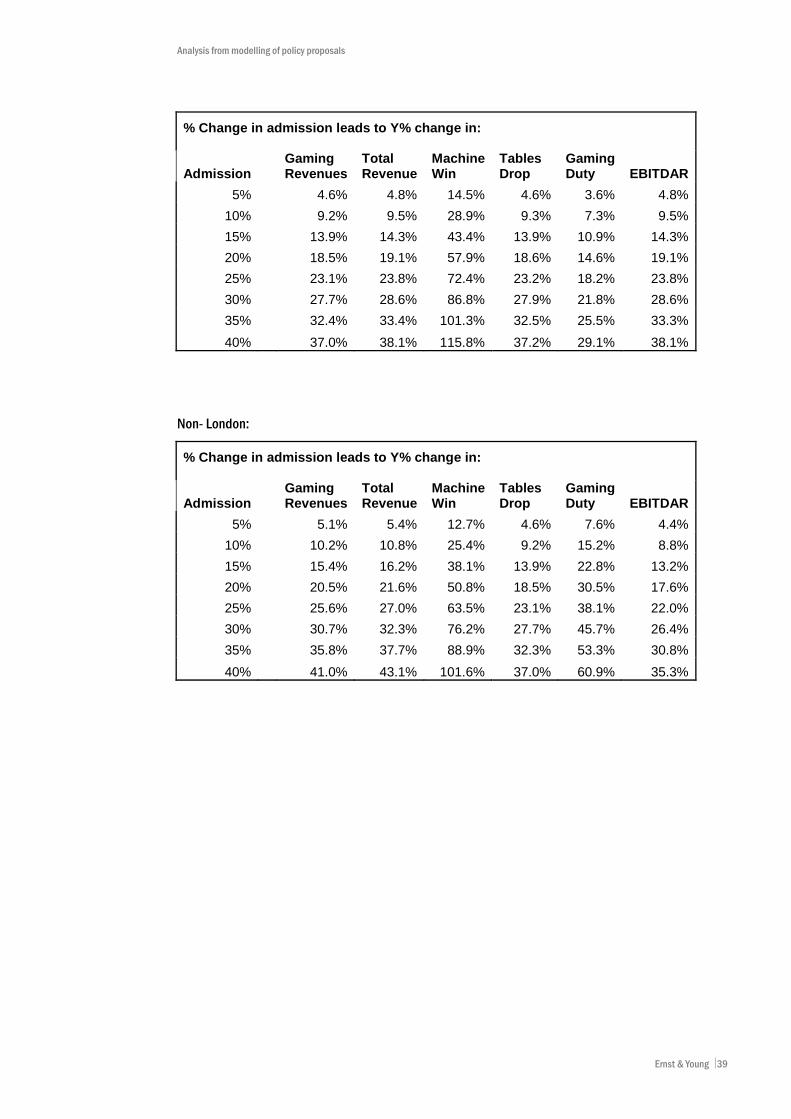
Analysis from modelling of policy proposals
% Change in admission leads to Y% change in:
Admission Gaming Revenues
Total Revenue
Machine Win
Tables Drop
Gaming Duty EBITDAR
5% 4.6% 4.8% 14.5% 4.6% 3.6% 4.8% 10% 9.2% 9.5% 28.9% 9.3% 7.3% 9.5% 15% 13.9% 14.3% 43.4% 13.9% 10.9% 14.3% 20% 18.5% 19.1% 57.9% 18.6% 14.6% 19.1% 25% 23.1% 23.8% 72.4% 23.2% 18.2% 23.8% 30% 27.7% 28.6% 86.8% 27.9% 21.8% 28.6% 35% 32.4% 33.4% 101.3% 32.5% 25.5% 33.3% 40% 37.0% 38.1% 115.8% 37.2% 29.1% 38.1%
Non- London:
% Change in admission leads to Y% change in:
Admission Gaming Revenues
Total Revenue
Machine Win
Tables Drop
Gaming Duty EBITDAR
5% 5.1% 5.4% 12.7% 4.6% 7.6% 4.4% 10% 10.2% 10.8% 25.4% 9.2% 15.2% 8.8% 15% 15.4% 16.2% 38.1% 13.9% 22.8% 13.2% 20% 20.5% 21.6% 50.8% 18.5% 30.5% 17.6% 25% 25.6% 27.0% 63.5% 23.1% 38.1% 22.0% 30% 30.7% 32.3% 76.2% 27.7% 45.7% 26.4% 35% 35.8% 37.7% 88.9% 32.3% 53.3% 30.8% 40% 41.0% 43.1% 101.6% 37.0% 60.9% 35.3%
Ernst & Young 39

Appendix B
The Rationale for a Progressive Linked Jackpot in UK Casinos
Executive Summary • Casinos offer the highest level of player protection and should be permitted to offer the
widest range of gaming products • Progressive linked jackpots for casinos were an intended part of the Gambling Act 2005 • Linked jackpots have operated since 2005 – all we seek is a competitive increase in size of
jackpots • Linked progressives are widely accepted internationally as a safe product • Jackpots on-line and in other land based sectors vastly exceed casino jackpots • Jackpots should be competitive and aspirational • Casinos should be permitted to link machines between premises • The industry asks initially to trial a linked progressive jackpot limited to £50,000 regardless of
the number of machines linked • This would result in players switching back to safer places to gamble • The UK would benefit from increased tax revenue NCiF asks the Secretary of State to: Use the powers given in Section 244(3) of Gambling Act 2005 to permit any number of linked B1 gaming machines whether or not they are on the same premises. Permit the maximum prize offered by linked gaming machines which shall be fixed or calculated as the product of the number of machines registered or declared part of any link multiplied by the maximum prize permitted on a single machine. (See comments above) but shall not exceed £50,000.
Introduction We welcome the comment in the consultation at 3.41 referring to aspects of the consultation the government thinks have merit and the reference to linked progressive jackpots. The British casino industry, as represented by NCiF, is wholeheartedly supportive of the precautionary policy the government has articulated in respect of gaming machines and stakes and prizes. NCiF believes that increasing the attractiveness and supply of machines in casinos is entirely consistent with this policy. Improving the product in land based casinos can help persuade some of the millions of customers who enjoy modern electronic gambling in less regulated or untaxed (as far as the UK exchequer is concerned) environments, such as on-line, to play in a UK regulated and taxed environment. NCiF’s aim is to pursue policies which redistribute gaming machines to land based casinos and to increase, from the current position of less than 1% of the total number of gaming machines in the UK, to a level that offers consumers a wider product choice in the acknowledged ‘safest places in which to gamble’, i.e. casinos: progressive linked jackpots are part of that choice.
i

A brief history Progressive linkage was considered and accepted for casinos at the outset of the deregulation process. ‘Linked jackpots only in casinos to provide very large jackpots’ (4.24) was a specific recommendation of the ‘Safe Bet for Success’ report (23.68). When the 2005 Act passed into law, Section 244 made it an offence to link jackpots on a gaming machine except for where the person making the gaming machine available for use is the holder of a casino Premises Licence. The Section also provides wide powers to the Secretary of State to control, by order, the use of linked jackpot machines in casinos whether or not they are on the same premises. The intent is clear: parliament understood and intended that linking of gaming machines could take place both within a casino and between casinos but not elsewhere. Since September 2007 casinos have been able to link category B gaming machines within a single casino premises in accordance with the Gambling Commission’s Machine Standards - Linked Progressives Regulation. The value of linkage was – along with many other casino recommendations - eroded by the political furore that prevailed at the time the Gambling Act 2005 passed into law and the linked prize was limited to a prize no greater than the maximum jackpot permitted on a single machine (currently £4,000). So, although some casinos already offer linked machines, these are restricted to what are known as ‘mystery progressives’. Machines specially modified for the UK, ensure that customers can only win either the ‘progressive jackpot’ or the ‘in game’ jackpot in a single game. Therefore, the value for casinos and customers in linking of machines to generate a larger jackpot has been significantly negated. However, the appetite for large progressive jackpots on gaming machines is evident and appropriate in casinos where table games have unlimited stakes and prizes, unlimited progressive jackpots, and the commensurate player protections are already in place. The Regulatory Pyramid and Budd The 2005 Act was a direct result of the work carried out by Professor Sir Alan Budd’s Committee in producing the 2001 ‘Gambling Review Report’ into gambling regulation. The report and the debate that followed and eventually produced the 2005 Act recognized that there should be a pyramid that balanced the risks of particular kinds of gambling against the protective measures required of operators. It was acknowledged that casinos should sit at the top of that regulatory pyramid and to both offer the widest range of gaming products with the highest stakes and prizes, balancing that offer with a set of precautionary measures to limit any potential negative impacts. The outcome was that casinos are required to licence all gaming staff. Licence Conditions and Codes of Practice imposed training standards, including training in promoting responsible gambling and the prevention of money laundering. This regime, along with effective door and other control mechanisms were to be commensurate with the position casinos were intended to occupy at the top of pyramid. The outcome is that casinos are the most regulated gambling environments in the UK, and their players are afforded the highest level of player protection. But, as the wider gambling industry has evolved, casinos have been left behind in a number of respects, including product innovation, availability and stake and prize limits. However, while the casino industry has been constrained, higher stakes and prizes and games have been delivered on the high street and in on-line environments that do not have the commensurate protective measures.
ii

Whilst the maximum prize on a B1 machine in casinos remains at £4,000, on-line virtual machine stakes and prizes are considerably greater. For example, Gala’s Megajackpot progressive machine jackpot currently stands in excess of £3 million and has previously been won at over £2 million. Jackpotjoy (a Gibraltar registered operator) offers £1.3 million in progressive jackpots and identifies individual winners of sums in excess of £900,000. The maximum stake we have identified on-line is £250 and the maximum progressive jackpot in excess of £5 million. There are hundreds more that massively exceed the £4,000 jackpot in UK casinos. There are countless examples of large jackpots being offered to the UK gaming consumer with less protection than in casinos and no tax benefit to the exchequer. Even our domestic Bingo offers larger jackpots, the National Bingo game offers a jackpot of £250,000 and UK bingo operators operating linked games are able to offer unlimited jackpots. A further anomaly exists, in that casinos have been able to offer unlimited LAN or WAN (Local or Wide Area Networked) progressive table games jackpots for more than a decade, even long before the Budd Report was commissioned. Perhaps due to the opportunity to win a six figure jackpot from a £1 stake, provided a particular Poker or Blackjack hand is dealt, these linked table games attract significant customer interest. Large jackpots are attractive to customers and many will follow them and play other games in the same environments. Failing to address the disparity in product and protection is undermining the regulatory pyramid, forcing customers for innovative, higher stake and prize machine gaming into less well regulated environments. We submit that our proposition on linking is entirely consistent with the intentions of the Act and will go some way in redressing the current imbalance. Casino innovation - Market Failure In terms of machine gaming, evolution and innovation has been led by the international, on-line, and B2 markets. The market for B1 machines is too small to create development interest. Currently, in the 143 operational 1968 Act casinos, where the maximum number of machines permitted is 20, there is a total of 2,457 category B1 gaming machines, an average of 17 machines per casino with a range of none to 20. The Gross Gaming yield from UK gaming machines in casinos was around £118 million and has increased year on year by just 1%. Even if every dormant original 1968 act license were to be opened and if all the 16, 2005 Act casinos were opened, (both of which scenarios are highly unlikely!) the theoretical maximum number of machines in all UK casinos would only be 5,560, or about the same as you get in 2 large US Casinos. (3,720 could be offered in 186 1968 Act casinos; 640 could be offered in 8 Small casinos and finally 1,200 could be offered in 8 Large casinos. (186x20 + 8x150 + 8x80 = 5,560). In comparative terms, Licensed Betting Offices - the only other sector with a regulatory limit on machine numbers – the maximum permitted is 4 machines in any premises, year on year numbers of Betting Office premises grew at a rate of around one per working day to 9,067. The Gambling Commission reports there to be 32,340 B2 Machines or 84% of the potential maximum of 38,268 machines. Revenue is growing about 10% each year, growing in 2011 by 11% year on year to almost £1.3 billion. Equally in comparative terms, the Gambling Commission estimates the size of the UK on-line gambling market to be £1.9 billion and is growing at 10% per annum.
iii
These comparisons are important because they illustrate that the size of the market for either the hardware or the software for UK B1 casino machines is not large enough to support innovation and unique development. Consequently, the UK casino gaming industry is reliant, in the main, on international manufacturers and products that are tweaked for the UK market and regulations. Indeed, several international manufacturers have withdrawn from the UK in recent years (Aristocrat, Ainsworth & Atronic) due to the combination of the UK regulatory burden & the severely restricted scale of the commercial opportunity. As far as linked games are concerned, only IGT & more recently Novomatic machines offer linked games. Development in the on-line market The on-line market is able to offer consumers a virtually – in every sense of the word – limitless product range which can be modified to reflect cultural trends, for example quickly reflecting television series and film series in the iconography of the games. The Bet365 site offers a choice of 150 different games on ‘machines’. The difference in the tax regime also allows it to offer £150 sign-up fee and generous incentives to players. William Hill on-line is similarly generous with a ‘sign-up’ bonus and whilst offering a huge range of innovative media linked slots, with games linked to television and film series, including The Incredible Hulk, X-men, Gladiators and Iron Man. Whilst it remains illegal for a converted (under the 2005 Act) 1968 Act casino to offer betting or bingo, the on-line market is unencumbered by the boundaries between gaming products. On-line operators offer casino gaming, bingo and every conceivable form of betting, often in a UK tax free environment. Demonstration of customer product dissatisfaction, i.e. moving to on-line environment The UK casino gambling market GGY grew between 2008 and 2010 by just 1.3% but machine gaming yield grew more slowly and by less than 1% in three years. On-line the picture is very different. Even the small Commission regulated on-line market grew by 19% in the same period and internationally the on-line market is estimated to have grown by 10% in 2010, making a significant growth of 23% since 2008. This is clear evidence that UK customers are dissatisfied with the UK casino slots products and are switching to playing on-line. We accept that all ‘high street’ businesses are challenged by the emergence of on-line operators. However, at least a high street and an on-line retailer share similar tax burdens and have the ability to offer identical products in environments where prices are controlled by market forces. Our competitive environment is completely skewed. Our prices and product offerings are controlled by government and we suffer a far less advantageous tax regime than our on-line competitors. This results in UK on-shore businesses being unable to offer competitive levels of incentives or loyalty rewards. Financial benefits for business The industry currently estimates that around 25% of the revenue from gaming machines is derived from linked machines. It is extremely difficult to estimate what additional revenue could be derived from competitive progressive jackpots. Increased revenue would be substantially dependent on the permitted stake and the number of machines linked to generate the jackpot. For example assuming the industry’s bid – in the current review process - to increase the stake and prize on B1 machines to £5 and £10,000 is accepted, linking multiples of machines to generate genuinely competitive (with on-line) jackpots is still limited by maximum machine numbers. To achieve a £1 million jackpot, 100 machines, each with a maximum prize of £10,000, would be required to be linked.
iv

Operators are prepared to trial a capped jackpot in order to provide the regulator with the opportunity to observe how the player interacts with a PLJ offering and therefore continuing to uphold the licensing objectives. However, whilst acknowledging there may be a political or presentational desire for a cap on jackpots, we are informed that this approach is undesirable for the player and uncompetitive compared to on-line. Moreover, if the prize level climbs to the cap and stops for any length of time, then players lose confidence in the system. It is essential therefore to be able to have any cap high enough to be well above the level at which it is expected to be paid. There are no regulatory defined caps on the jackpots offered either by bingo or on-line operators, or on progressive casino table games. NCiF would ask for similar consideration and dialogue if the government considers a cap desirable for any reason, especially if the jackpot was defined by the multiple of the number of machines declared in the link and their maximum prize, i.e. £10,000. (NB this is not the way most progressives work in the rest of the world. Typically, a small proportion of the stake is used to fund the jackpot, leaving a far greater proportion to be returned to the player in more frequent & lesser prizes. The idea that a specific number of machines multiplied by the maximum prize is equal to a jackpot opportunity of £1m is simplistic.) Providing the jackpot is allowed to be reasonably aspirational, the industry projects that linking could increase machine revenues by around 10%. Outline of the benefits for industry & customers The benefit to customers of linked jackpots in casinos is that the customer no longer has to go outside the safety of the casino environment to play for an aspirational prize. Genuinely progressive Category B1 machines, with an appropriate level of progressive jackpot should attract the type of customer who already plays progressives on-line. A higher jackpot, of itself, might be expected to broaden the appeal of slot machines to a wider customer base, thus increasing casinos revenue and tax yield. The need for new, innovative technical solutions to deliver progressive jackpots could encourage both UK & international manufacturers to review their position with regard to the UK, which may lead to greater consumer choice. The current position, whereby two manufacturers (IGT & Novomatic) dominate the UK Category B1 market is inherently unhealthy & restricts choice for both customers & operators. Positive innovative outcomes from PLJ - EG examples of other jurisdictions. International evidence is that linkage can be provided either by an operator or, more commonly, by a machine supplier. The involvement of manufactures has the advantage of creating the ability for small, independent operators to benefit from linking in the same way as larger companies by taking advantage of the technology platforms provided by the manufactures. This prevents the risk of anti-competitive behaviour or predatory pricing by way of proprietary links. No operator is excluded. We have carefully examined how best to structure the links and we are strongly advised by the industry’s technical advisors that simply declaring the number of machines in any given link – regardless of whether they are in single premises or not – is the international industry standard
v

Simplicity is important. In practice large numbers of machines are required to be able to offer a large prize on a progressive link and so any concerns about very large prizes from just two linked machines is not a rational objection. Nevertheless we fully recognise that this is liable to be an emotive discussion and so we aim to include some protection against this objection. Evidence of customer perception to Stake and Prize levels (value for money) To design better products, gaming manufacturers routinely study the effects of stake and prize amounts on customer behaviour. The results of these studies conducted through focus groups and direct machine data collection are consistent in North America, Europe and Australasia. Consumers like choice and value. Value for money is typically associated with prize pools greatly exceeding the maximum wager amount and the feedback rarely varies on this point. Consumers want winning to be memorable if they “get lucky”. Choice is a matter of spending habits. Research conducted on actual stake amounts in the USA and Australia indicate that <5% of players wager more than $5 per spin but that spend amount is highly correlated to spending patterns outside of gaming. A buyer of luxury products such as sporting tickets, hand bags, jewels or cars is typically the high spender on entertainment and that includes gaming. Higher stake amounts give this consumer the same choice in gaming as in other entertainment options. Evidence of consumer protections Casinos have effective door controls and do not allow entry by people under 18. Casinos do not provide a so called ‘ambient gambling’ environment; customers make a conscious decision to visit a casino, typically with a planned amount of expenditure. All casino gaming staff receive mandatory responsible gambling training and there is a high ratio of gaming staff to players resulting in casinos being recognised as the ‘safest places to gamble’. Domestically, Professor Mark Griffiths concluded some time ago that the jackpot level is not a significant determinant in problem gambling. The risk lies elsewhere, e.g. in the stake and rapidity of game. During the past decade, international evidence and feedback from researchers, regulators and operators produced a global evolution in the design and manufacture of linked jackpots. Linked progressive designers now produce linked products that are more flexible in structure with more and stronger consumer protection. The majority of games produced today can be linked to jackpots so players are not tied to specific titles, manufacturers or themes. Jackpot levels have increased from one level to multiple levels with different win amounts thus reducing the “chase” factor. Symbol driven progressives with “near-miss” outcomes have largely been withdrawn and replaced with mystery set ups based on random coin-in triggers. New era progressives are popular with customers. The US gaming market has some of the largest linked progressives in the world and the popularity of these products continues to grow with consumers because the entertainment value continues to grow with the game designs. Progressive games (either LAN, WAN or, in some cases, both) operate safely in many mature slots markets – USA, many European markets (inc. Holland, Belgium, France, Switzerland & Italy) & the Far East. Local legislation determines the specific country rules of operation, but the principle that customers should be offered linked products, on the basis that they are no more likely to engender problem gaming than existing machines, is well established. The casino industry has continually demonstrated its commitment to responsible gambling – whether on table or slots play. It must follow that if similar products exist and are attractive to UK
vi

players on-line – often in less protected or regulated environments - it has to be desirable to offer that product in casinos where the staff are licensed and trained to recognise and deal with problem gambling. In recent evidence to the CMS Select Committee the former Secretary of State and the former Gambling Minister acknowledged casinos to be the safest place to gamble. We are always content to discuss improvements to consumer protection and suggest the following practical protection measures are worthy of dialogue. However, to avoid controls becoming disproportionate and to establish some balance, further measures would have to be linked to further deregulation - including linkage. Practical Protection Measures
• ‘Loyalty / Reward’ schemes could require that customers insert their card to be eligible to participate in the progressive jackpot opportunity. Tracking play in this way would support the following additional measures.
• Tracking technology can monitor patterns of problem play, i.e. length of time on device,
chasing, speed of play and so on. If risk indicative patterns are discerned consumer protection responses can be triggered including a directed reminder to consider length of play and wagering limits.
• Screens could include information on problem/responsible gaming as well as myths about
gaming. • A review of payout %, with an undertaking to offer a negotiated minimum level, if
progressive games were to be permitted.
vii
GfK NOP Social Research
Appendix C
1.2.2 Attitudes towards social responsibility measures
When it came to exploring reactions to social responsibility measures, participants agreed that where social relationships existed within the gambling environment, there was an opportunity for gamblers to be supported in changing their behaviour (either by members of staff or even by fellow customers, who might be able to identify and address any obvious problem gambling behaviour). However, it was observed that these types of social relationships did not always exist and that such social relationships may be more likely amongst regular rather than problem gamblers, as regular gamblers were more likely to be loyal to particular venues.
Despite this, it was widely felt that not all venues the gamblers participating in the research had attended were doing enough to support and assist problem gamblers. In particular, two of the recovering problem gamblers gave examples of staff in different venues not implementing self-exclusion arrangements properly. In one case, the gambler felt he had been hindered from self-excluding from an adult gaming centre, where the proprietor said he did not have the appropriate forms to implement a self-exclusion when approached. In the other, the gambler had self-excluded himself from a betting shop but sent a friend in to play the machines on his behalf. When the proprietor saw him standing outside, looking in through the window, he did not try and stop him from playing vicariously and actually asked how his game was going.
Furthermore, in one of the venues visited, the visibility of gaming machines was impeded while in others, staff showed a reluctance to address problem gambling for fear of aggression on the part of the customer. This suggested that more could be done in venues, whether through their physical arrangement or through staff training, to improve customer interaction as a route to addressing problem gambling.
Use of player or loyalty cards as a social responsibility measure was viewed with scepticism by participants. None of the respondents were using cards at the time and while they could see them as being used by venues for marketing and promotions, they were doubtful of their applicability in a social responsibility context. One of the suggestions made by participants was that venues might phone them up to check everything was all right if they noticed a spike in their spending patterns. However, most did not believe that venues would use them in such an interventionist way, or that such an approach would be particularly effective.
Most of the suggestions focusing on interrupting the flow of machine play (mandatory game breaks, time limits, money limits) were unpopular as they were perceived to run against the pattern of play, which was often repetitive and protracted. Specifically, many players were concerned that machines would stop when they were on a lucky streak or close to winning and interrupt the momentum they had achieved. There were also concerns that such
viii

disruption could aggravate violence and aggression amongst gamblers.
However, regular gamblers were open to the idea of pop-up messages informing them of money spent or length of time played. A small number of players felt that this type of information would be useful and could encourage them to stop and think about their behaviour and potentially modify it if deemed necessary. Overall, it should be noted that participants considered the social responsibility measures discussed in the research rather ineffectual given the prevalence of machines and the ease of access described by respondents during the focus groups and depth interviews. If gamblers were deterred from playing machines in one venue, there was likely to be another venue where they could play in the vicinity.
ix
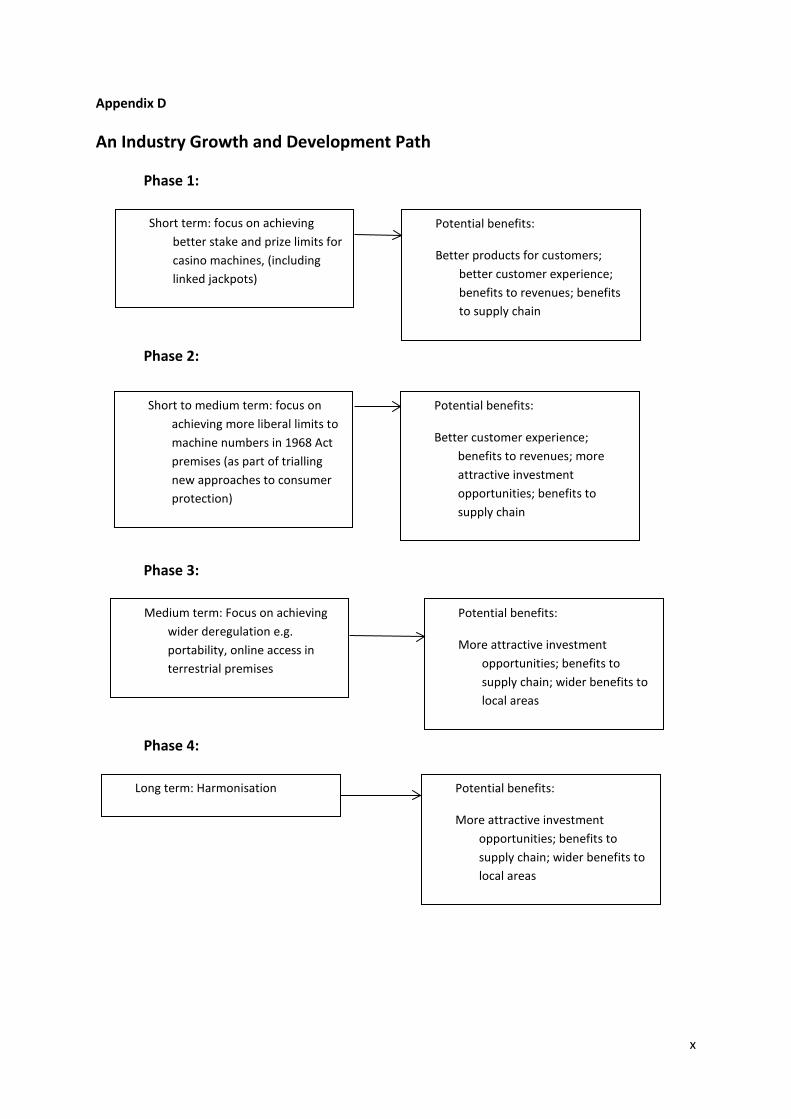
Appendix D An Industry Growth and Development Path
Phase 1:
Phase 2:
Phase 3:
Phase 4:
Short term: focus on achieving better stake and prize limits for casino machines, (including linked jackpots)
Potential benefits:
Better products for customers; better customer experience; benefits to revenues; benefits to supply chain
Short to medium term: focus on achieving more liberal limits to machine numbers in 1968 Act premises (as part of trialling new approaches to consumer protection)
Potential benefits:
Better customer experience; benefits to revenues; more attractive investment opportunities; benefits to supply chain
Medium term: Focus on achieving wider deregulation e.g. portability, online access in terrestrial premises
Potential benefits:
More attractive investment opportunities; benefits to supply chain; wider benefits to local areas
Long term: Harmonisation Potential benefits:
More attractive investment opportunities; benefits to supply chain; wider benefits to local areas
x