NATIONAL ASSOCIATION OF REALTORS® COMMERCIAL REAL …
21
NATIONAL ASSOCIATION OF REALTORS® e Voice for Real Estate® COMMERCIAL REAL ESTATE INTERNATIONAL BUSINESS TRENDS 2018
Transcript of NATIONAL ASSOCIATION OF REALTORS® COMMERCIAL REAL …

N A T I O N A L A S S O C I A T I O N O F R E A L T O R S ®
The Voice for Real Estate®
COMMERCIAL REAL ESTATEINTERNATIONAL
BUSINESS TRENDS 2018

N A T I O N A L A S S O C I A T I O N O F R E A L T O R S ®2018 LEADERSHIP TEAM
P R E S I D E N T
Elizabeth J. Mendenhall, ABR, ABRM, CIPS, CRB, GRI, ePRO, LCI, PMN
P R E S I D E N T- E L E C T
John S. Smaby
F I R S T V I C E P R E S I D E N T
Vince E. Malta
T R E A S U R E R
Thomas A. Riley, CCIM, CRB
I M M E D I AT E PA S T- P R E S I D E N T
Bill E. Brown
V I C E P R E S I D E N T
Colleen A. Badagliacco, CRB, CRS, ePro, GRI, SRES
V I C E P R E S I D E N T
Kenny Parcell, ABR, CRS
C H I E F E X E C U T I V E O F F I C E R
Bob Goldberg
COMMERCIAL REAL ESTATE INTERNATIONAL BUSINESS TRENDS 2018© 2 0 1 8 | N A T I O N A L A S S O C I A T I O N O F R E A L T O R S ®
A l l R i g h t s R e s e r v e d .
Reproduction, reprinting or retransmission in any form is prohibited without written permission. Although the information presented in this survey has been obtained from reliable sources, NAR does not guarantee
its accuracy, and such information may be incomplete. This report is for information purposes only.

TABLE OF CONTENTS
1 | Introduction 5
2 | Survey Highlights 8
3 | Survey Results 10
4 | Methodology 19
N A T I O N A L A S S O C I A T I O N O F R E A L T O R S ®
COMMERCIAL REAL ESTATEINTERNATIONAL
BUSINESS TRENDS 2018

INTRODUCTION

COMMERCIAL REAL ESTATE INTERNATIONAL BUSINESS TRENDS 2018
N A T I O N A L A S S O C I A T I O N O F R E A L T O R S ®
5
On the global front, the past year has experienced a thaw in economic conditions. It was not long ago that developed economies were grap-pling with economic weakness, as central banks reached for unprece-dented negative interest rates to stem the declines in output. However, from the midpoint of 2016, world economies have regained their foot-ing and have pressed toward higher ground. Global economic output increased in 2017, with the International Monetary Fund (IMF) estimating it at 3.7 percent, an upward revision from earlier forecasts. Equally importantly, the IMF noted that 75 percent of the world economy experienced accelerating growth this past year. Encouragingly, the IMF’s projections for the growth of global economies calls for 3.9 percent advanced in both 2018 and 2019.
The economic gains were most noticeable across Europe, where the anxiety sparked by the 2016 United Kingdom referendum decision to leave the European Union gave way to a more tempered outlook. The Asian region also recorded positive economic performance, as Chinese growth picked up a slight tailwind. In the Americas, economic trends underscored a rising global tide, with the United States (US) and Canada posting solid economic gains. Central and South American economies took more moderate paths. Canada and Mexico remained engaged in renegotiating the North American Free Trade Agreement with the United States during the year.
With the backdrop of rising economic conditions,
international commercial real estate transactions moved sideways. Total global sales volume for investment properties totaled $873.3 billion in 2017, according to Real Capital Analytics (RCA), on par with the prior year. However, sales of development sites jumped 39 percent year-over-year, adding an additional $674.5 billion to global volume. Most of development-tied investment took place in China. While office remained the largest sector by volume, global investment sales declined by one percent. The industrial and apartment sectors were the only two to experience yearly investment gains, of 33 percent and two percent, respectively.
In the US, large cap investment sales reached $463.9 billion in 2017, a seven percent drop from 2016 levels, based on RCA data. International investors remained active in U.S. commercial markets, however their market share returned to historical levels, accounting for 11 percent of total volume.
Cross-border capital focused primarily on office and apartment properties during the year, mostly in major metropolitan areas. However, foreign

COMMERCIAL REAL ESTATE INTERNATIONAL BUSINESS TRENDS 2018
N A T I O N A L A S S O C I A T I O N O F R E A L T O R S ®
6
investors remained increasingly active in secondary and tertiary markets, where strengthening economies, rising employment and solid cash flows for income-producing properties have resulted in higher returns. Canada retained the number one spot for the highest investment volume in large cap US markets, followed by Singapore and China. Germany continued as a major source of funding in 2017, coming in the fourth spot in the rankings. The Netherlands jumped from the 20th spot in 2016 to number five, with a significant increase in investments.
In contrast to the large cap commercial market transactions reported by RCA (aggregated at $10 million and above), most REALTORS® who specialize in commercial real estate managed investment deals averaging less than $2.5 million per deal, frequently located in secondary and tertiary markets. The Commercial Real Estate International Business Trends 2018 focuses on this significant segment of the economy and real estate markets.
Based on data from a national survey, REALTORS® were active in cross-border commercial real estate transactions during 2017. With the rising profile of smaller capitalization markets, 18 percent of survey respondents reported closing an investment sale involving international clients. Respondents completed a median of one buyer-side international deal in 2017, and two seller-side international transactions. In addition, 19 percent of REALTORS® who answered the survey indicated they completed a lease agreement on behalf of an international client during the year. Business relationships were at the core of REALTORS®’ transactions, with personal contacts, former clients and previous client referrals comprising the majority of investment sources. A higher share of international transactions were closed with cash during the year, accounting for 70 percent of total, while 25 percent of deals involved debt financing from U.S. sources. Over a third of REALTORS® expect international buying activity to increase in 2018.
GLOBAL COMMERCIAL REAL ESTATE SALES VOLUME

SURVEY HIGHLIGHTS

COMMERCIAL REAL ESTATE INTERNATIONAL BUSINESS TRENDS 2018
N A T I O N A L A S S O C I A T I O N O F R E A L T O R S ®
8
Total Commercial Transactions in 2017
• 59% of respondents closed commercial real estate deals in 2017
• Respondents who closed a transaction had a median of 6 transactions, and an average of 9 commercial transactions
• The median value per transaction was $625,000 ($650,000 in 2016), while the average value was $2.0 million ($2.3 million in 2016)
International Commercial Transactions in 2017
• 18% respondents closed a sale involving international clients/investors
• Respondents who closed an international transaction completed a median of one buyer-side international transaction with a median value per transaction of $975,000; the average value per transaction was $2.0 million ($2.0 million in 2016)
• Respondents who closed transactions with international sellers had a median of two seller-side international sales (two in 2016), with a median value per transaction of $1.0 million ($550,000 in 2016); the average value per transaction was at $1.4 million
• 19% of respondents completed a lease agreement for an international client, with a median of two leases and a median gross lease value of $200,000
• 26% of space leased by international clients was under 2,500 square feet (27% in 2016)
• Over the past five years, 35% of survey respondents experienced an increase in the number of international clients
• Region of REALTORS®’ most frequent international client:
- Europe 29% - Asia 28% - Americas 25% - Middle East 1% - Oceania 1% - Africa 0% - Unknown 10%
• Top Countries – Buyer-Side Commercial Real Estate Investments in U.S. (by share of responses)
1. China2. Mexico3. Canada4. United Kingdom5. Germany6. Russian Federation7. India8. Philippines9. Switzerland10. Israel
• Top U.S. destination states – Buyer-Side (by share of responses)
1. Florida2. Texas3. California4. Massachusetts5. Illinois6. Michigan7. Nevada8. Arizona9. Connecticut10. Georgia
• 34% of REALTORS® who responded to the survey expect international buying activity to increase during 2018

SURVEY RESULTS

COMMERCIAL REAL ESTATE INTERNATIONAL BUSINESS TRENDS 2018
N A T I O N A L A S S O C I A T I O N O F R E A L T O R S ®
10
Commercial Transactions
During 2017, 59 percent of REALTORS® who reported that their real estate specialty was sales and sales/leasing completed a commercial real estate transaction (69 percent in 2016).
International Investment Activity
Among respondents engaged in sales and sales/leasing, and who completed a commercial transaction during 2017, 18 percent closed a transaction with international clients (20 percent in 2016). This is in line with historical data collected by the National Association of REALTORS®.
Among respondents who closed an international transaction, 46 percent closed a buyer-side transaction, 13 percent a seller-side transaction, and the remainder closed both types of transactions.
Most buyer-side sales, 63 percent, were transactions with foreign buyers who primarily reside abroad (Type A). Most seller-side transactions, 57 percent, were of properties sold by clients who were temporarily residing in the United States on non-immigrant visas.
TYPE OF INTERNAT IONAL COMMERCIAL CL IENT
COMMERCIAL REAL ESTATE ACT IV I TY
COMMERCIAL REAL ESTATE SPECIALTY
SALES TRANSACT IONS INVOLV ING INTERNAT IONAL CL IENTS

COMMERCIAL REAL ESTATE INTERNATIONAL BUSINESS TRENDS 2018
N A T I O N A L A S S O C I A T I O N O F R E A L T O R S ®
11
Among respondents who closed a buyer-side international transaction, the median was two sales, and the average was also two sales. Among respondents who closed a seller-side international transaction, the median was two sales, and the average was also two sales. In comparison, the median number of all commercial transactions among those who closed a transaction was six sales, and the average was nine sales.
International commercial buyers and sellers transactions typically tend to be at the higher end of the market. During 2017, the median international buyer-side transaction was $975,000 and a median seller-side transaction was $1 million, while the median commercial transaction was $625,000.
REALTORS®’ international clients found U.S. commercial real estate markets a good value in 2017. About seven in ten respondents reported that international clients view U.S. prices to be about the same or less expensive than prices in their home country.
A majority of commercial buyers, 70 percent, made an all-cash purchase, and 25 percent obtained financing from a U.S. source.
INTERNAT IONAL CL IENTS ’ V IEW OF U .S . REAL ESTATE PRICES
MEDIAN AND AVERAGE NUMBER OF COMMERCIAL SALES IN 2017
MEDIAN AND AVERAGE VALUE OF COMMERCIAL SALES IN 2017
CAPITAL SOURCE OF INTERNAT IONAL ACQUIS IT ION

COMMERCIAL REAL ESTATE INTERNATIONAL BUSINESS TRENDS 2018
N A T I O N A L A S S O C I A T I O N O F R E A L T O R S ®
12
International commercial buyers come from across the world: Europe (29 percent), Asia (28 percent), Americas, which includes Canada and Latin America (25 percent), Middle East (12 percent), Oceania (one percent), and from other countries that were not identified by respondents (six percent).
By country of origin, the top countries were China (20 percent), Mexico (11 percent), Canada (eight percent), United Kingdom (six percent), and Germany (five percent). Buyers from the Russian Federation, India, the Philippines, Switzerland, and Israel each accounted for three percent.
The top state destinations were Florida (23 percent), Texas (19 percent), and California (13 percent. Other top destinations were Massachusetts, Michigan, Illinois, Nevada, Arizona, Connecticut, Georgia, and Ohio.
International commercial buyers purchased across a variety of property types: apartment (20 percent), industrial (20 percent), land (16 percent), retail (13 percent), office (9 percent), hotel (two percent), and other types.
BUYER-S IDE : PROPERTY TYPE
REGION OF ORIG IN
TOP COUNTRIES OF ORIG IN OF INTERNAT IONAL COMMERCIAL BUYERS
TOP DEST INAT IONS OF INTERNAT IONAL COMMERCIAL BUYERS

COMMERCIAL REAL ESTATE INTERNATIONAL BUSINESS TRENDS 2018
N A T I O N A L A S S O C I A T I O N O F R E A L T O R S ®
13
Among commercial international buyers, 39 percent purchased the commercial property as an investment, and 34 percent purchased the property for a business they participate in. The Other category, which accounted for 16 percent, includes a purchase of the property for the buyer’s residential use, either for primary or vacation use.
About one-in-five international clients decided not to purchase U.S. commercial properties in 2017. Over 37 percent of those who chose not to buy
cited lack of inventory as a main reason, echoing broader trends in U.S. markets. The high cost of property was the second main reason for not purchasing, at 23 percent of responses. Difficulty moving money out of the home country was the third major reason, at 17 percent of responses. Immigration laws, financing, and exposure to U.S. tax laws, and property taxes were also cited as other reasons why the client decided not to purchase property.
INTENDED USE REASONS FOR NOT PURCHASING U .S . PROPERTY

COMMERCIAL REAL ESTATE INTERNATIONAL BUSINESS TRENDS 2018
N A T I O N A L A S S O C I A T I O N O F R E A L T O R S ®
14
International Investment Activity (1 of 3)
BUYER SIDE SELLER SIDE
Median number of transactions 2 Median number of transactions 2Median value $975,000 Median value $1,000,000
Referral sourcesFormer client 25% Former client 33%Personal contact 14% Personal contact 24%Previous client referral 13% Previous client referral 19%Website/Organic search 12% Website/Organic search 10%U.S. business contact 6% U.S. business contact 10%Signs/ads on boards/yards 6% Signs/ads on boards/yards *Website/Paid ad 4% Website/Paid ad *Outside U.S. business contact 4% Outside U.S. business contact *Walked into office 1% Walked into office *
Online referral sourcesOwn (agent’s) website 26% Own (agent’s) website 36%Unknown 22% Unknown 23%Own (agent’s) social media 7% My firm’s/franchise’s website 18%Commercial listing: LoopNet 6% Commercial listing: Other 9%
Realtor.com 3% Client’s country’s real estate internet portal *
Commercial listing: Other 3% Commercial listing: CommercialSearch *Other online real estate websites 1% Commercial listing: LoopNet *Commercial listing: CommercialSearch 1% My firm/franchise’s social media *Client’s country’s real estate internet portal 1% Other broker’s website *
My firm’s/franchise’s website * Other online real estate websites *My firm/franchise’s social media * Own (agent’s) social media *Other broker’s website * Realtor.com *
Global region of originEurope 29% Americas 43%Asia 28% Asia 17%Americas 25% Middle East 13%Middle East 12% Unknown 13%Unknown 6% Europe 9%Oceania 1% Oceania 4%Africa * Africa *
*Note: Responses comprised less than 1%.

COMMERCIAL REAL ESTATE INTERNATIONAL BUSINESS TRENDS 2018
N A T I O N A L A S S O C I A T I O N O F R E A L T O R S ®
15
International Investment Activity (2 of 3)
BUYER SIDE SELLER SIDE
Top countries of originChina 20% Mexico 20%Mexico 11% China 15%Canada 8% Brazil 10%United Kingdom 6% Israel 10%Germany 5% Barbados 5%Russian Federation 5% Canada 5%India 3% El Salvador 5%Philippines 3% Venezuela 5%Switzerland 3% Japan 5%Israel 3% Spain 5%Argentina Estonia 2% United Kingdom 5%Australia France 2% Iran 5%Austria Iran 2% Australia 5%Bahamas Japan 2% Barbados Kuwait 2% Bulgaria Malaysia 2% Costa Rica Spain 2% Czech Republic Sweden 2% Denmark Venezuela 2%
Top U.S. Destination StatesFlorida 23% Florida 27%Texas 16% Texas 27%California 13% California 9%Massachusetts 6% Massachusetts 9%Michigan 6% Michigan 9%Illinois 5% Illinois 5%Nevada 5% Ohio 5%Arizona 3% Oregon 5%Connecticut 3% Pennsylvania 5%Georgia 3%Ohio 3%Indiana Oklahoma 2%Minnesota Pennsylvania 2%Mississippi Virginia 2%New York Washington 2%

COMMERCIAL REAL ESTATE INTERNATIONAL BUSINESS TRENDS 2018
N A T I O N A L A S S O C I A T I O N O F R E A L T O R S ®
16
International Investment Activity (3 of 3)
BUYER SIDE SELLER SIDE
Sale price of property$100,000 or less 3% $100,000 or less 5%$100,001 to $250,000 9% $100,001 to $250,000 14%$250,001 to $500,000 16% $250,001 to $500,000 18%$500,001 to $1,000,000 20% $500,001 to $1,000,000 *$1,000,001 to $1,500,000 17% $1,000,001 to $1,500,000 27%$1,500,001 to $2,000,000 9% $1,500,001 to $2,000,000 5%$2,000,001 to $5,000,000 14% $2,000,001 to $5,000,000 18%$5,000,001 to $10,000,000 8% $5,000,001 to $10,000,000 14%$10,000,000 or more 3% $10,000,000 or more *
Capital sourcesAll cash (no mortgage financing) 70%With mortgage financing - U.S. sources 25%With mortgage financing - sources in buyer’s home country 2%
Unknown 3%
Property typeApartment 20% Other 27%Industrial 20% Industrial 23%Other 20% Apartment 18%Land 16% Land 14%Retail 13% Office 14%Office 9% Hotel 5%Hotel 2% Retail *
Intended use of propertyCommercial rental property for investment 39% Commercial rental property for
investment 32%
Commercial property for business 34% Commercial property for business 27%Other 16% Other 27%Unknown 11% Unknown 14%
COMMERCIAL REAL ESTATE INTERNATIONAL BUSINESS TRENDS 2018
N A T I O N A L A S S O C I A T I O N O F R E A L T O R S ®
17
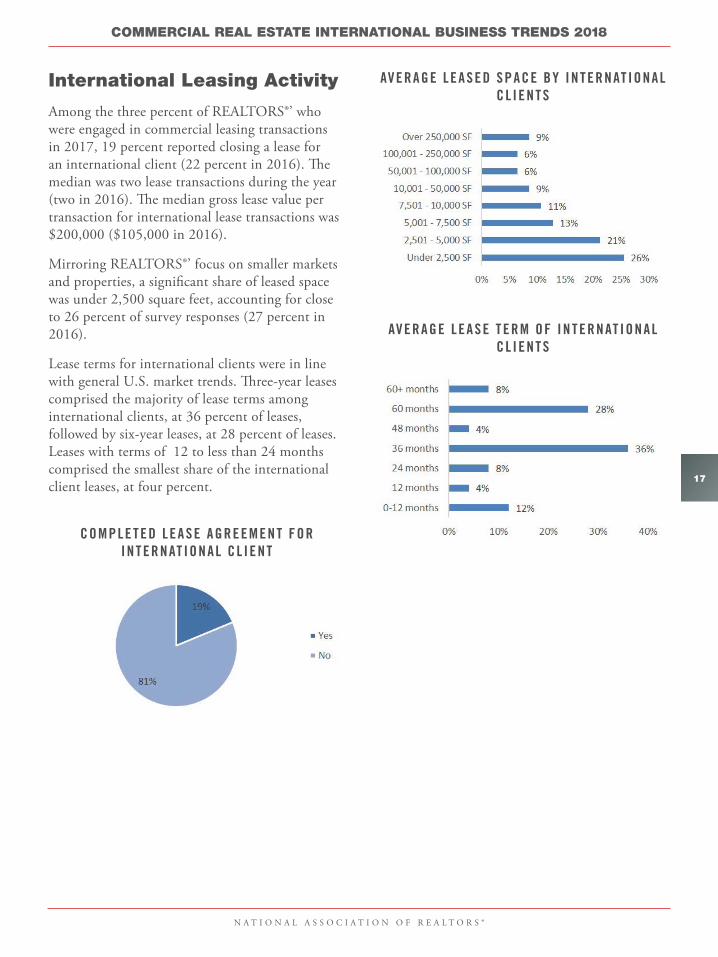
International Leasing Activity
Among the three percent of REALTORS®’ who were engaged in commercial leasing transactions in 2017, 19 percent reported closing a lease for an international client (22 percent in 2016). The median was two lease transactions during the year (two in 2016). The median gross lease value per transaction for international lease transactions was $200,000 ($105,000 in 2016).
Mirroring REALTORS®’ focus on smaller markets and properties, a significant share of leased space was under 2,500 square feet, accounting for close to 26 percent of survey responses (27 percent in 2016).
Lease terms for international clients were in line with general U.S. market trends. Three-year leases comprised the majority of lease terms among international clients, at 36 percent of leases, followed by six-year leases, at 28 percent of leases. Leases with terms of 12 to less than 24 months comprised the smallest share of the international client leases, at four percent.
COMPLETED LEASE AGREEMENT FOR INTERNAT IONAL CL IENT
AVERAGE LEASED SPACE BY INTERNAT IONAL CL IENTS
AVERAGE LEASE TERM OF INTERNAT IONAL CL IENTS

COMMERCIAL REAL ESTATE INTERNATIONAL BUSINESS TRENDS 2018
N A T I O N A L A S S O C I A T I O N O F R E A L T O R S ®
18
International Appraisal Activity
During 2017, eight percent of REALTORS®’ specializing in commercial appraisals who responded to the survey were engaged with international clients (15 percent in 2016). Respondents reported having completed a median of two appraisals for their clients (two appraisals in 2016).
The incidence of failed transactions due to appraised value being lower than the price, was generally below the trends for U.S. clients, accounting for eight percent of appraisal transactions for international clients. Survey data indicated that most appraisal issues arose at a loan-to-value median value of 90 percent (78 percent in 2016).
The main reason for appraisal problems with international transactions was declining net operating incomes, cited by 31 percent of respondents. Other reasons were related to environmental conditions, location obsolescence, zoning.
APPRAISALS OF U .S . PROPERT IES FOR INTERNAT IONAL CL IENTS
FA ILED TRANSACT IONS DUE SOLELY TO APPRAISED VALUE
REASONS FOR APPRAISAL ISSUES INVOLV ING INTERNAT IONAL TRANSACT IONS

COMMERCIAL REAL ESTATE INTERNATIONAL BUSINESS TRENDS 2018
N A T I O N A L A S S O C I A T I O N O F R E A L T O R S ®
19
Outlook
Over the past 12 months, 25 percent of survey respondents experienced an increase in the number of international clients looking to buy, while 15 percent experienced an increase in the number of international clients seeking to sell. Interest of international clients seeking to buy or sell appears to have eased in the past 12 months compared to conditions during the last five years, which is indicated by the higher fraction of respondents who reported an increase in clients seeking to buy (35 percent) and seeking to sell ( 20 percent).
Based on survey data, 34 percent of survey takers expect an increase in international buying clients, and 26 percent expect an increase in international selling clients in 2018. The majority of REALTORS® who responded to the survey expect buying and selling activity by international clients to stay the same or to increase during 2018. Considering that international transactions are impacted by several factors, including political, economic, and regulatory events, both in the United States and abroad, approximately one third of respondents responded “don’t know” for each of the outlook for buying and selling activity.
12-MONTH CHANGE IN INTERNAT IONAL CL IENTS
F IVE-YEAR CHANGE IN INTERNAT IONAL CL IENTS
12-MONTH OUTLOOK FOR INTERNAT IONAL TRANSACT ION ACT IV I TY
Methodology of NAR’s Commercial Real Estate International Business Survey
In December of 2017, NAR invited a random sample of 67,802 REALTORS® with an interest in commercial real estate to fill out an online survey. A total of 1,108 responses were received for an overall response rate of 1.6 percent.
The primary measure of central tendency used throughout the report is the median, the middle point in the distribution of responses to a particular question. The report also employs frequency distributions, to display the number of observations within a given interval.

ABOUT THE NATIONAL ASSOCIATION OF REALTORS®
The National Association of REALTORS®, “The Voice for Real Estate,” is America’s largest trade association, representing 1.3 million members, including NAR’s institutes, societies and councils, involved in all aspects of the real estate industry. NAR membership includes brokers, salespeople, property managers, appraisers, counselors and others engaged in both residential and commercial real estate. The term REALTOR® is a registered collective membership mark that identifies a real estate professional who is a member of the National Association of REALTORS® and subscribes to its strict Code of Ethics. Working for America’s property owners, the National Association provides a facility for professional development, research and exchange of information among its members and to the public and government for the purpose of preserving the free enterprise system and the right to own real
property.
NAR’S RESEARCH GROUPThe mission of the National Association of REALTORS® Research Group is to collect and disseminate timely, accurate and comprehensive real estate data and to conduct economic analysis in order to inform and engage members, consumers, and policy makers and the media in a professional and accessible
manner.
www.nar.realtor/research-and-statistics.
N A T I O N A L A S S O C I A T I O N O F R E A L T O R S ®
CHICAGO OFFICE430 North Michigan Avenue
Chicago, IL 60611800-874-6500
WASHINGTON, DC OFFICE500 New Jersey Avenue, NW
Washington, DC 20001202-383-1000

500 New Jersey Avenue, NW • Washington, DC 20001-2020800.874.6500 • www.NAR.realtor
N A T I O N A L A S S O C I A T I O N O F R E A L T O R S ®
COMMERCIAL REAL ESTATEINTERNATIONAL
BUSINESS TRENDS 2018