(NASA-TM-4k53) FLIGHT EXPERIENCE T2Z SYSTEMS … · 2013-08-30 · (NASA-TM-4k53) FLIGHT EXPERIENCE...
22
(NASA-TM-4k53) FLIGHT EXPERIENCE N93-23102 _T2Z WITH LIGHTWEIGHT, LQW-POWER =. --- MINIATURIZED INSTRUMENTATION SYSTEMS (NASA) 18 p Unclas HI/06 0153118 https://ntrs.nasa.gov/search.jsp?R=19930013913 2018-07-13T00:34:14+00:00Z
Transcript of (NASA-TM-4k53) FLIGHT EXPERIENCE T2Z SYSTEMS … · 2013-08-30 · (NASA-TM-4k53) FLIGHT EXPERIENCE...

(NASA-TM-4k53) FLIGHT EXPERIENCE N93-23102 _T2Z
WITH LIGHTWEIGHT, LQW-POWER =.--- MINIATURIZED INSTRUMENTATION
SYSTEMS (NASA) 18 p Unclas
HI/06 0153118
https://ntrs.nasa.gov/search.jsp?R=19930013913 2018-07-13T00:34:14+00:00Z


NASA Technical Memorandum 4463
Flight Experience With Lightweight,
Low-Power Miniaturized
Instrumentation Systems
Philip J. Hamory and James E. Murray
Dryden Flight Research Facility
Edwards, California
National Aeronautics andSpace Administration
Office of Management
Scientific and Technical
Information Program
1993

Use of trade names or names of manufacturers in this report does
not constitute an official endorsement of such products or
manufacturers, either expressed or implied, by the National
Aeronautics and Space Administration.
!
i_
r.
!|
=
I
m
z
Z

FLIGHT EXPERIENCE WITH LIGHTWEIGHT, LOW-POWER
MINIATURIZED INSTRUMENTATION SYSTEMS
Philip J. Hamory*James E. Murray**
NASA Dryden Flight Research FacilityEdwards, California
Abstract
Engineers at the NASA Dryden Flight Research Fa-
cility (NASA-Dryden) have conducted two flight re-search programs with lightweight, low-power miniatur-
ized instrumentation systems built around commercial
data loggers. One program quantified the performance
of a radio-controlled model airplane. The other pro-
gram was a laminar boundary-layer transition experi-ment on a manned sailplane.
The purpose of this paper is to report NASA-Drydenpersonnel's flight experience with the miniaturized in-
strumentation systems used on these two programs.
The paper will describe the data loggers, the sensors,
and the hardware and software developed to complete
the systems. The paper also describes how the sys-
tems were used and covers the challenges encounteredto make them work. Examples of raw data and derived
results will be shown as well. Finally, future plans for
these systems will be discussed.
For some flight research applications where minia-
turized instrumentation is a requirement, the authors
conclude that commercially available data loggers and
sensors are viable alternatives. In fact, the data loggers
and sensors make it possible to gather research-qualitydata in a timely and cost-effective manner.
Nomenclature
Acronyms
A/D analog to digital
CMOS complementary metal oxide semiconductor
CPT control position transducer
*Electrical Engineer.
**Aerospace Engineer.
Copyright @1992 by the American Institute of Aeronau-
tics and Astronautics, Inc. No copyright is asserted in the
United States under Title 17, U.S. Code. The U.S. Govern-
ment has a royalty-free license to exercise all rights under
the copyright claimed herein for Governmental purposes. All
other rights are reserved by the copyright owner.
POPU pushover-pullup
RAM random access memory
Symbols
a,_ normal acceleration, g
ax axial acceleration, g
Co vehicle drag coefficient
Cn vehicle lift coefficient
L/D lift-to-drag ratio
q dynamic pressure, psf
T total thrust, lb
Vtr_e true airspeed, ft/sec
a angle of attack, deg
% angle-of-attack breakpoint, deg
6e symmetric elevon deflection, deg
5e_ left-elevon deflection, deg
5_ right-elevon deflection, deg
Apt left-engine static pressure rise, psi
ApT right-engine static pressure rise, psi
Introduction
Engineers at NASA-Dryden fly radio-controlled
model aircraft for preliminary validation of risky design
concepts. For programs with limited budgets, the engi-
neers also operate a manned, self-launching sailplane as
a low-speed flight research platform. Though the tworesearch efforts are quite different, their instrumenta-
tion system requirements are similar. Each system re-quires up to 24 channels of data acquisition, onboard
recording, and operation using batteries, in addition to
small size, weight, and price.
The instrumentation systems currently in use
at NASA-Dryden are overly complex for these
applications. A class of instruments, commonly called
data loggers, was investigated as an alternative. Data
loggers are commercially available data acquisition

unitswith onboardstorage. Fromthe Tattletale@lineof dataloggers, the Model4 wasselectedforthe radio-controlledmodelaircraft. Later,whentheModel7 becameavailable,it wasselectedfor themannedsailplane.
Thisreport describesthe flightexperiencegainedwith miniaturizedinstrumentationsystemsbuiltaroundtheModel4 andModel7 data loggers. Fol-
lowing a brief outline of the data loggers' features, thereport will cover the transducers the data loggers were
interfaced to and how they were used. Additional dis-cussions include the software and hardware developed
to complete the systems, and the challenges faced in
getting the systems to work properly. Examples of raw
and derived data will be shown. Finally, future plans
for use of these systems will be outlined.
System Description of Tattletale Data
Loggers
Model 4 Data Logger
The Model 4 data logger contains a 6301 micropro-
cessor (Hitachi America Ltd., San Jose, California), adescendant of the Motorola 6800 microprocessor (Mo-
torola, Inc., Phoenix, Arizona). The Model 4 has
32 kbytes of onboard memory. For measurcment of
analog signals, tile Mode] 4 has an ll-channcl, 10-bit
analog to digital (A/D) converter that can operate at
up to approximately 600 samples/see. It has an RS-
232 serial communication port and can be programmed
in TTBASIC, which is the BASIC computer language
with extra commands for data logging and host inter-
face. Softwarc development can be conducted on anIBM PC@or compatible machine.
The Model 4 measures 3.725 by 2.25 by 0.8 in.,
weighs 2.2 oz, and consumes a maximum of 100 mW. Ithas an onboard 3-V lithium battery to sustain volatile
memory. Tile internal bus is brought out to 32 pins.
These pins are arranged so that one can build a sys-
tem by stacking memory expansion boards and user-
designed application boards on top of the Model 4.
Model 7 Data Logger
The Model 7 data logger contains a 68332 mi-
croprocessor, a low-power version of the Motorola
68020 microprocessor (Motorola, Inc., Phoenix, Ari-
zona) and has 2 Mbytes of onboard memory. For
measurement of analog signals, the Mode] 7 has a
4-channel, 12-bit A/D converter that can operate at upto 100,000 samples/see. It has an RS-232 serial com-
munication port and a high-speed parallel interface.The Model 7 is programmed in Think C (Symantec
Corp., Cupertino, California). Think C is an Amer-
ican National Standards Institute (ANSI)-C language
Table 1. Comparison of Tattletale data loggers.
Specification Model 4 Model 7
Microprocessor
Onboard memory
A/D converter resolution, bits
Maximum sample rate,
samples/sec
Host computer
6301 68332
32 kbytes 2 Mbytes10 12
600 100,000
(approximate)
PC compatible
Langmage TTBASICRS-232 port Yes
Parallel port No
Battery-backed RAM YesHard drive No
Real-time clock No
Size, in. 3.725 by 2.25 by 0.8
Weight, oz 2.2
Weight including hard drive, ozMaximum power consumption, mW 100
Typical power with hard drive, WApproximate cost with startup materials $500
Macintosh
(PC interfaceplanned)
C
Yes
Yes
No
Yes (up to 80 Mbytes)Yes
4.0 by 2.75 by 0.442.5
8
500
3$3300
@ Tattletale is a registered trademark of Onset ComputerCorp., North Falmouth, Massachusetts.
@ IBM PC is a registered trademark of the IBM Corp.,Armonk, New York.
developmentenvironment.SoftwaredevelopmentcanbeconductedonaMacintosh@computer.
TheModel7measures4.0by2.75by0.44in.,weighs2.5oz,andconsumesamaximumof500mW.It isalsodesignedto interfaceto aharddrive,thesamekindofdriveusedinmanylaptop computers. The hard driveadds 1 in. to the vertical measurement and 5.5 oz to
the total weight. As with the Model 4, user-designed
. application boards can be stacked upon the Model 7
and interfaced to a 120-pin internal bus.
Flight Experience With a
Radio-Controlled Model Aircraft
Test Objective
The Model 4 has been used on several model aircraft
flight programs where research-quality data were re-quired for quantitative analysis. An objective of one of
these flight programs was to measure the performance
of the test aircraft, which was powered by two ducted-
fan engines. Performance parameters of interest were
the lift-curve slope, the lift-to-drag ratio, and the trimcurve.
Maneuver Design
A flight test maneuver commonly used to quantify
aircraft performance is a quasi-static pushover-pullup
(POPU). Properly executed, a single POPU maneu-
ver can simultaneously characterize the lift curve, the
lift-to-drag ratio, and the trim curve over a large angle-of-attack range. 1 For its simplicity, the POPU maneu-
ver was initially selected as the primary maneuver forperformance measurement.
acceleration (a_ and an, respectively), angle of attack
(a), dynamic pressure ((]), and thrust (T).
Accurate measurement of the thrust produced by
the ducted-fan engines was central to obtaining accu-
rate drag measurements. An engine and fan assemblywas calibrated in a wind-tunnel test program. Then a
model of engine thrust as a linear function of dynamic
pressure and static pressure rise across the fan assem-
bly was obtained. Measurement of in-flight thrust also
required measurement of the static pressure rise across
the left- and right-fan assembly, (Ap, and Apt, respec-
tively). Measurement of the trim curve also requiredmeasurements of the elevon control surface deflections
(act and 5_r).
Because of size and weight constraints, no lateral- ordirectional-axis variables were measured. All test ma-
neuvers were flown while minimizing cross-axis motion;
the analysis assumed purely longitudinal motion.
The selection of sensors for the test program was
driven primarily by weight and power considerations.Table 2 presents sources and specifications for the sen-
sors used in the test program.
Instrumentation System
The Model 4 was the core of the instrumentation sys-
tem used on the model aircraft. A 128 kbyte memory
expansion board was added to increase data storage
capability to approximately 150 kbytes. Two applica-
tion boards were also needed to complete the hardware.
These were designed at NASA-Dryden and consisted
of an analog multiplexer board and a power supply
Table 2. Sensor specifications.
Variable Model number Range Resolution Accuracy
a, deg NASA-Dryden noseboom -5 to 40 0.0d 0.25_, psf SenSym 142SC01D* 0 to 55 0.058 0.144
act, deg; a_r, deg NASA-Dryden CPT -40 to 20 0.06 0.20
Ap_, psi; Apt , psi SenSym 142SC01D* 0.0 to 0.6 0.0006 0.001
az, g IC Sensors 3110-002"* -1 to 1 0.002 0.015
an, g IC Sensors 3110-005'* -0.5 to 2.5 0.003 0.02
*SenSym Inc., Sunnyvale, California.
**IC Sensors, Milpitas, California.
Measurement Requirements and SensorSelection
Minimum measurement requirements for the test
program were determined from the test requirements
and maneuver selection. Measurement of the aerody-namic forces (lift and drag) and their nondimensional
coefficients required measurement of axial and normal
@Macintosh is a registered trademark of Apple Computer,Inc., Cupertino, California.
board. The circuitry for each channel on the mul-
tiplexer board consisted of a differential amplifier, a
third-order Butterworth low-pass filter, and a comple-
mentary metal oxide semiconductor (CMOS) switch.The schematic is shown in Fig. 1. The power sup-
ply board provided voltage regulation and excitation
to the sensors, and contained a voltage reference for
the A/D converter. Figure 2 shows the complete data
acquisition system including the Model 4, the mem-
ory expansion board, application boards, battery pack,
and all sensors. These components weighed 1.7 lb

andconsumed500mW of power.Figure3 showstheModel4 packageinstalledin thenosesectionof themodelaircraft.
Theinstrumentationsystemis incompletewithoutsoftware.Threesoftwaremoduleswererequiredtooperateandobtaindatafromthesystem.Thefirstmodulecontrolledthe Model4 in flight. Thesec-ondmoduledownloadedflightdatafromtheModel4.Thethird moduleconvertedtherawflightdataintoanengineeringformatcompatiblewithsoftwareusedon severalcomputersat NASA-Dryden.The firstandthird moduleswerewrittenat NASA-DrydeninTTBASICandFORTRAN77, respectively. The sec-
ond module, Procomm (Datastorm Technologies, Inc.,
Columbia, Missouri), was obtained commercially.
Only the first module ran on the Model 4. It was up-
loaded from the PC compatible before flight and was
left in standby mode. At the runway, a ground oper-
ator threw a switch to start data logging and released
the aircraft for takeoff. The Model 4 recorded eightchannels of data continuously at 25 samples/see. Data
logging stopped automatically in approximately 6 min
when random access memory (RAM) was full.
The other two modules ran on the PC compatible.
By using an 8086 class PC compatible, a flight's data
set (150 kbytes) could be downloaded in approximately
6 rain and converted to engineering format in approxi-
mately 30 min. Though the total time is comparatively
long, it was adequate for the project needs. The totaltime can be shortened by using a more powerful PC
compatible.
Implementation Challenges
In anticipation of potential interference between
the avionics and instrumentation systems, the powerswitch for the instrumentation system was attached to
a servoactuator of the avionics system. This gave the
pilot the ability to turn the instrumentation system
on or off in flight. Likewise, the model aircraft re-
ceiver was programmed to turn off the instrumentation
system automatically upon loss of the transmitter sig-
nal. The logger program and any data gathered wouldnot be lost upon shutdown because of the 3-V backup
battery.
There was never any interference between the sys-
tems in flight. Itowever, getting the systems to work
together on the ground was a major challenge initially.
From successful noninstrumented flights it was clear
that the avionics system worked. From practice
flights using a different model airplane it was alsoclear that the instrumentation worked. However, for
an unknown reason, the preflight checks sometimes
failed with the instrumentation system in place and
turned on. Different transmitters, receivers, uplink
frequencies, and antenna orientations were tried with-
out success. Boosting uplink power from 0.5 to 5W
provided some improvement; however, upon elimina-
tion of an intermittent ground loop in the instrumen-
tation the preflight checks succeeded consistently.
The high-vibration environment in the model air-
craft provided another challenge. At high power set-tings, the structural vibration from the reciprocating
engines was in excess of 5 g. This overwhelmed thelower level acceleration signals from the lift and drag
forces during the test maneuver. Different mountingtechniques and mounting locations for the engines and
accelerometers were attempted but failed to alleviate
the problem. Ultimately, a "pullup" maneuver was de-
veloped that could be flown with the engines at an idle
power setting. Under these conditions the accelerome-
ter data were suitable for analysis.
Results of Model Aircraft Flights
Figure 4 shows a time history of a representative
pullup maneuver. Included are the raw measured vari-
ables, c_, _, 5_,, 5_r, Ap,, Apt, an, and ax, as well as thederived variables true airspeed (Vm,_), lift coefficient
(CL), drag coefficient (CD), T, and lift-to-drag ratio
(L/D). Light turbulence is evident in a, a,_, and a_.
Figures 5, 6, and 7 show results derived from the
time history data shown in Fig. 4. The turbulence-induced and other noises were removed from a subset
of the raw data using a digital low-pass filter, and these
data were used in the following results.
Figure 5 shows the flight-determined lift curve for
the aircraft. The small symbols represent the CL and
angle-of-attack measurements at each sample point,
and the solid line is a piecewise linear fit to the data
points. There is a change in slope at a = a0 where the
aerodynamics of the aircraft change character. Bothabove and below a = a0 the slope is consistent.
Figure 6 shows the flight-detemined lift-to-drag ra-
tio for the aircraft. The small symbols represent the
L/D measurements at each sample point, and the solid
line is a hand-faired estimate through the data points.The dotted lines above and below the solid lines are
estimates of the error bounds for the data based on in-
strumentation error estimates, data repeatability, ma-
neuver quality, and signal-to-noise ratio.
Figure 7 shows the flight-determined trim curve for
the aircraft. The small symbols represent the a_ and
angle-of-attack measurements at each sample point,and the solid line is a piecewise linear fit to the data
points. As with the lift curve shown in Fig. 5, there
is definite change in the trim curve at approximately
= c_0, where there is a measurable change in the
aircraft aerodynamics.

Flight Experience With a MannedSailplane
TestObjective
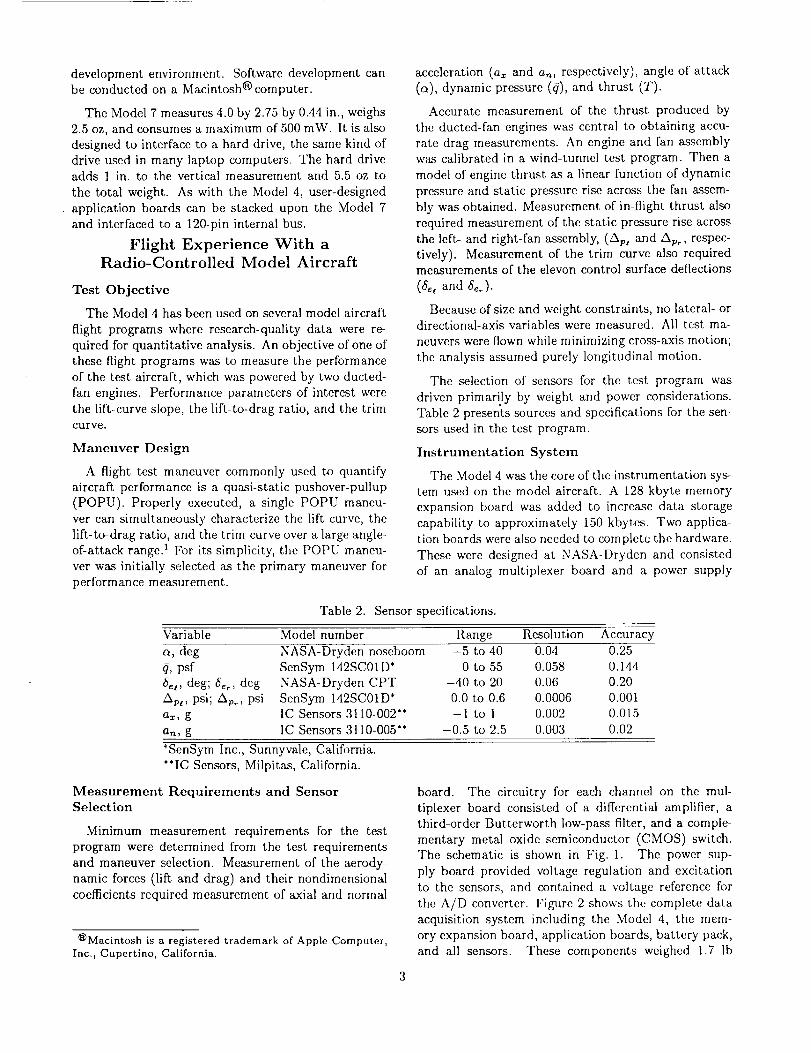
Forprogramswith limitedbudgets,aself-launchingsailplane(shownin Fig. 8) serves as a low-speed flight
research platform. The objective of one flight programwas to determine the maximum size of excrescence tol-
erable on a laminar-flow wing before boundary-layer
transition occurs. Excrescences are rough spots on asurface.
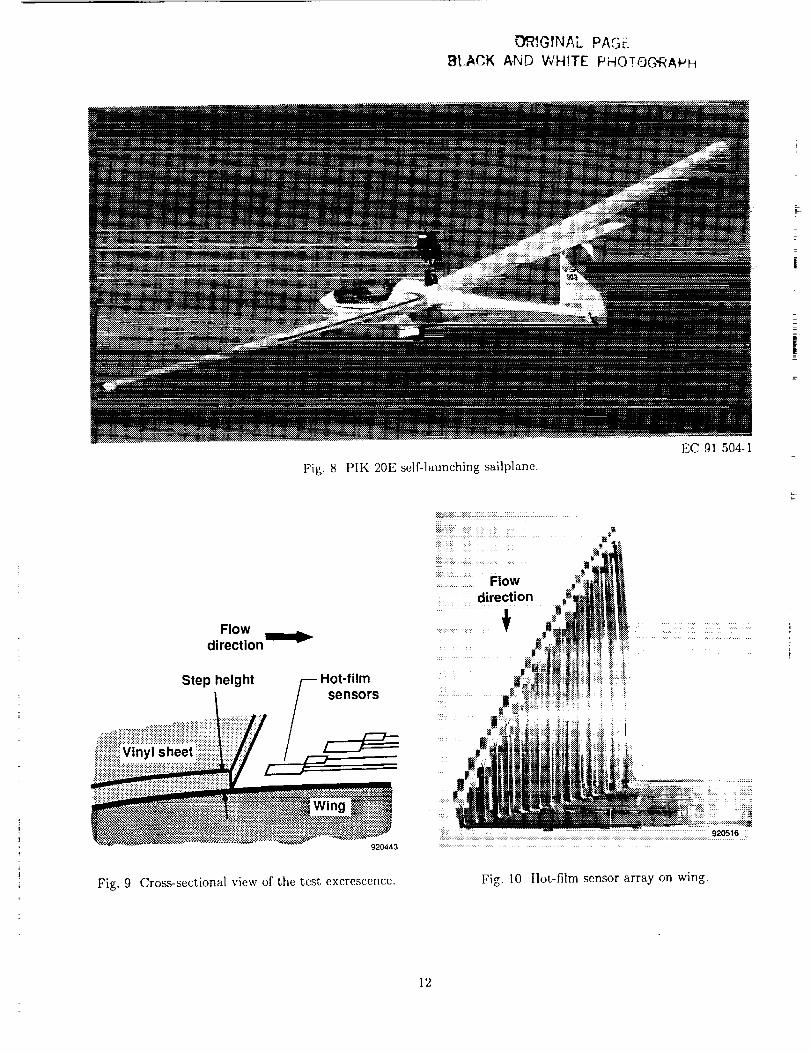
Experiment Design
A set of calibration flights determined the natural
boundary-layer transition location on the wing. In sub-
sequent flights, excrescenscs of varying thickness were
applied to the wing, and changes in the boundary-layertransition location were observed. The excresences
were simulated by using vinyl sheets 0.032 in. or less in
thickness. The sheets were wrapped around the leading
edge of the wing leaving an aft-facing step as shown inFig. 9. Maneuvers were flown 5000 to 10,000 ft above
sea level, and straight and level flight was used to ob-tain stabilized data.
Measurement Requirements
To pinpoint transition location, an array of hot films
(shown in Fig. 10) was lald on the wing such that partof the array would see laminar flow and part wouldsec turbulent flow. Hot-film anemometers developed
at NASA-Dryden 2 provided signal conditioning for the
hot films. Figure l0 shows the hot-film array on the
wing. It was a requirement to record eight of the hot-
film signals at 1500 samples/see.
Airdata parameters such as outside air temperature,
airspeed, and altitude were also measured. For expedi-
ency, these measurements were not recorded electron-ically. Rather, the pilot read the measurements from
the cockpit instrument panel and noted them on the
flight card. The pilot also noted the time for correla-tion to the electronic data.
Instrumentation System
The Model 7 was the core of this instrumentation
system. The Model 7 was selected for its high sampling
rate capability and greater data storage capacity.
Two application boards were stacked on the Model 7
to complete the system. One was an eight-channel ana-
log multiplexer board, and the other was a power sup-
ply board. Both were designed at NASA-Dryden. Thecircuitry for each channel on the multiplexer board con-
sisted of a differential amplifier and a CMOS switch.
Overvoltage protection for the A/D converter inputs, a
lamp driver, and triggering circuitry were included on
this board as well. No anti-aliasing was included be-
cause it existed on the anemometers. A patch panel be-
tween the anemometers and the multiplexer board pro-
vided easy selection of hot films between flights. The
power supply board provided voltage regulation and a
voltage reference for the system as well as a voltageoffset for the differential amplifiers on the multiplexer
board.
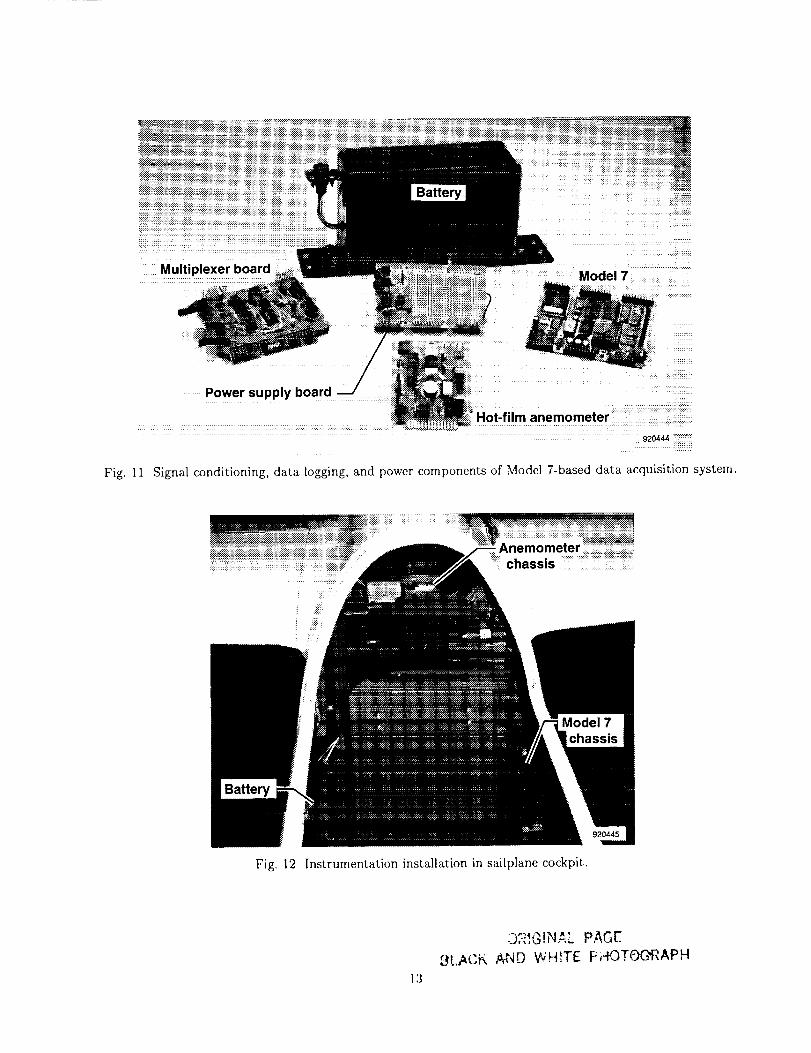
Figure 11 shows the Model 7, the analog multiplexer
board, and power supply board. Also shown is oneof the anemometers and the 72-Whr nickel-cadmium
battery pack that powered the entire system. The sizeof the battery pack was driven by three factors: (1)
the power requirements of the anemometers, (2) the
flight time, and (3) the need to provide reserve capacityto power instrumentation added in the future. Theanemometer chassis consumed up to 23 W when fully
stocked and flights generally lasted 1 hr. The Model 7
package alone consumed only 0.9 W. Figure 12 showsthe battery pack, Model 7 chassis, and anemometer
chassis installed in the cockpit.
Three software modules wcrc required to operate and
obtain data from the system. The first module con-
trolled the Model 7 in flight. The second module oper-
ated the parallel interface and downloaded data fromthe Model 7. The third module converted the raw flight
data into a format readable by plotting software avail-
able for the Macintosh computer. The three modules
were written at NASA-Dryden in C.
Only the first module ran on the Model 7. It was
uploaded from the Macintosh computer before flight
and it remained in standby mode. When triggered by
the pilot, it turned on a lamp in the cockpit, gathered
eight channels of hot-film data at a rate of 1500 sam-
ples/sec for 4 sec, turned off the lamp, and waited for
the next trigger. Data for up to l0 maneuvers could
be captured in this manner during 1 flight.
The other two modules ran on the Macintosh com-
puter. A flight's data set (1 Mbyte) could be down-
loaded in approximately 3 rain, and conversion of the
data from binary format only required a few minutes.
Hence, flight data were available quickly after landing.
Implementation Challenges
The major challenge involved triggering the system.
Initially, the triggering circuitry consisted of a digital
input pin on the Model 7, a 100 kf_ pullup resistor,and a 6-ft wire to a switch on the control stick. This
circuitry was susceptible to false triggering upon engine
startup.
To solve the triggering problem, a 1-#F capacitor
was attached to the digital input pin, and the pullup
resistor was reduced to l kfi. However, for added ro-
bustness, the software was changed to look for a trigger
pulse lasting at least 0.25 sec. Previously it had only

lookedfora momentarytrigger.Furthermore,a lampin the cockpit, previously illuminated only while data
were being gathered, was programmed to blink once
every lO sec after the memory was filled. This pro-
vided some visible indication of the system's state.
Results of Sailplane Flights
Figure 13 shows a time history of eight hot films for
one maneuver conducted at 70 knots during a smooth-
wing flight; that is, a flight without excrescences. The
signals are offset by chord location measured in per-cent chord. The lower amplitude signals, such as those
from 22.6 to 59.2 percent chord, indicate laminar flow.
The large amplitude signal at 62.8 percent indicatesturbulent flow. Thus the transition location for this
maneuver was between 59.2 and 62.8 percent chord.
Figure 14 shows results derived from flights with aft-
facing steps located at 42.6-percent chord. The tran-
sition location resulting from step heights of 0.012,0.015, and 0.020 in. are compared with the transi-
tion location of the smooth wing. Notice that with
all step heights the transition location moves for-ward. Whereas the location resulting from step heights
0.012 in. and 0.020 in. appear to be independent
of Reynolds number, the location resulting from the
0.015-in. step moves forward at Reynolds numbersgreater than 1 million.
Future Plans
System Architecture
For applications where a data logger is appropriate,
plans call for use of the Model 7. Designs for tile analogmultiplexer and power supply boards will be finalizedand printed circuit boards will be manufactured. Tile
boards flown on the manned sailplane were prototypes
wired at NASA-Dryden upon blank prototyping boardsavailable from the manufacturer. The printed circuit
boards will have slightly larger dimensions than the
Model 7 in order to improve the system's structural
integrity.
Currently, a stack of boards is held together by fourscrews. These four screws are not located in the cor-
ners, so the ends of tile boards can bend when experi-
encing vibration. Application boards designed in-house
will have an extra 1/16-in. on each side so that the
boards can slide into grooves within a box. The grooveswill keep the ends of tile boards rigid. With this mod-
ification, a stack should bc able to withstand greatervibration.
The high-speed parallel interface between the
Model 7 and the Macintosh computer will be repack-
aged as well. The interface currently resides on a
tiny circuit board connected perpendicularly to the
Model 7. It will be redesigned in-house to attach in
parallel and will have the extra 1/16 in. on each sideas mentioned previously. The header strip will be
replaced by a D-subminiature connector. These en-
hancements will make the interface more practical towork with.
System Applications
Eventually this may develop into a "shoebox" instru-mentation system; that is, a self-contained system, ap-
proximately the size of a shoebox. This system would
be capable of measuring the basic parameters needed
to determine an aircraft's performance: accelerations,
rates, positions, pressures, and temperatures. In ad-
dition, this would be a system that could be rapidlyinstalled on an aircraft to address last-minute needs or
to support projects with very short lead times.
Concluding Remarks
The flight programs described acquired research-
quality data in a timely and cost-effective manner us-
ing instrumentation systems built around commerciallyavailable data loggers and sensors. Data loggers are
well suited for applications requiring miniaturized in-
strumentation and onboard recording.
The data loggers provide large bandwidth and on-board storage capabilities in a small-sized and low-
power package. In the case of the sailplane program,
eight channels of data were acquired at 1500 sam-
ples/see for 40 sec with 12-bit (0.024-percent) resolu-
tion. The package measured approximately 4 by 2.75
by 2.5 in., weighed approximately 8 oz, and consumedapproximately 900 mW of power.
References
llliff, Kenneth W., "Maximum Likelihood Estima-
tion of Lift and Drag from Dynamic Aircraft Ma-
neuvers," J. of Aircraft, vol. 14, no. 12, Dec. 1977,
pp. 1175-1181.
2Chiles, [larry R., The Design and Use of a
Temperature-Compensated Hot-Film Anemometer Sys-tem for Boundary-Layer Transition Detection on Su-
personic Aircraft, NASA TM-100421, 1988.
Iz
"2
6

Differential Third-orderamplifier • Butterworth = CMOS
DatareturnDatain vAv_ I°w'pass filter _
T
Fig. 1 One channel of analog multiplexer board used wit,h the Model 4.
To A/D
920436

Fig. 2 Model 4 onboard data acquisition components.
_-=_
Fig. 3 Model 4 package installed in model aircraft.
ORI(3/NAL PACE
BLACK AND WHITE PHOTE_--'_RAPH

,_ f
I ! I I
d
__
I I I I
f
t
"SHI I
I I
?
.E_I-
o
/
1I I I1 I
c,O '_
q,I
o
00
I--
_r
q,I
o
o
o

f
|-
/
I I _ I I
\
I I
Q-n
I I
_10
10
ID
i o
Ewl
HI I ! I
0
0
IN
I
"1
I"0
0r_
EI--
i

C L
Fig. 5
w
_2" n Piecewise linear fit
I I I I I I I I I I
cc-o_
(X, deg 92_4o
Flight-determined lift curve for model aircraft.
L/D
.3 //_
[-- ///// x Flight data
J_//j / / _ Curve fit
| f / --- Estimated error
r t / bounds/
l-- ]141_/ I I I I I I I I I I
(X, deg 9_41
Fig. 6 Flight-determined lift-to-drag ratio for modelaircraft.
_e,
deg
Fig. 7
,_, x Flight data- linear fit
I I 1 I I
o_=cc 0
oq deg9_2
Flight-determined trim curve for model aircraft.
ll
I:_,IGINAL PAG;
BL,_,CK AND WHITE PHOTOG"RAPFi
i;
Fig. 8 PIK 20E self-launching sailplane.
EC 91 504-1
Flowdirection
Step height /_ H°t'filmssensor
iiiiiiiiiiii::::i_i::__!
Fig. 9 Cross-sectional view of the test excrescence.
. +:...-- .................................
Flow
: : d!recuon
Fig. 10 tlot-film sensor array on wing.
12
920444 i:,i:.:_iii:,i._:i:i
Fig. 11 Signal conditioning, data logging, and power components of Model 7-based data acquisition system.
Fig. 12 Instrumentation installation in sailplane cockpit.
13
-.J,-_,_1N_-,_. PAGE
L_L_CK A-NO WHITE PH-OTOG-"RAPH

62.8
59.2
55.5
Amplitude 51.8offset bypercentchord 44.4
location
33.4
26.2
22.6
2.00I I I I
2.05 2.10 2.15 2.20
Time, sec 92o_8
Fig. 13 Time history of hot films on smooth wing at 70 knots.
I2.25
Percentchord
transitionlocation
1.0
.8
.6
.4
.2
0
Fig. 14
-- F Hot-film locations
/-- +
+
+
- Aft steplocation
Smooth
0.012 in.----D-- 0.015 in.
0.020 in.
+ Hot-film sensors
I I I1 2 3
Reynolds number x 10 6 92O447
Transition location for aft step configuration at 42.6-percent chord.
14


Form Approved
REPORT DOCUMENTATION PAGE OMBNo.0704-01_8
Public repoalng t>uroen or this co lee1 on o n orrna o1115 Is irna ed to average 1 h0ut let response including the timo tot reviewing instructions, searching existing 0ata =oun=es.
gather ng and maintain n_ the da a needed, and corn01et ng and reviewing he collection el ;n|otmafion. Send comments regarding this burden estimate Or any Other aspect of this
CO lection o! information, _ncluding suggest/one tot reducing this burden. Io Washington Headquatlet$ Services, Oiredot&te for informalion Operations and Reporl$. t215 Jefferson
Davit Highway, Suite t204. Arlington. VA 22202-4302, and to the Office of Management and Budget. Paperwork Pleduclion Pro eel 0704-011111 , Washington, OC 20503.
I. AGENCY USE ONLY (Leave blank) 2. REPORT DATE 3. REPORT TYPE AND DATES COVERED
March 1993 Technical Memorandum
4. TITLE ,_ND SUBTITLE 5. FUNDING NUMBERS
Hight Experience With Lightweight, Low-Power MiniaturizedInstrumentation Systems
...... WU 505-59-546. AUTHOR(S)
Philip J. Hamory and James E. Murray
7. PERFORMINGORGANIZATIONNAME(S)ANDADDRESS(ES)
NASA Dryden Right Research FacilityP.O. Box 273
Edwards, California 93523-0273
9. SPONSORING/MONITORING AGENCY NAME(S) AND ADDRESS(ES)
National Aeronautics and Space Administration
Washington, DC 20546-0001
8. PERFORMING ORGANIZATIONREPORT NUMBER
H-1879
10. SPONSORING/Mc)NITORING
AGENCY REPORT NUMBER
NASA TM-4463
11. SUPPLEMENTARYNOTES
Prepaw.d as AIAA-92-4111 for presentation at the AIAA 6th Biennial Flight Test Conference, Hilton Head, SouthCarolina, August 24--26, 1992.
12a. DISTRIBUTION/AVAILABILITY STATEMENT
Unclassified -- Unlimited
Subject Category 06
12b. DISTRIBUTION CODE
13. ABSTRACT (Maximum 200 words)
Engineers at the NASA Dryden Flight Research Facility _NASA-Dryden) have conducted two flight research programs withlightweight, low-power miniaturized instrumentation systems built around commercial data loggers. One program quantifiedthe performance of a radio-controlled model airplane. The other program was a lain inar boundary-layer u'ansition experimenton a manned sailplane.
The purpose of this paper is to report NASA-Dryden personnel's flight experience with the miniaturized instrumentationsystems used on these two programs. The paper will describe the data loggers, the sensors, and the hardware and softwaredeveloped to complete the systems. The paper also describes how the systems were used and covers the challengesencountered to make them work. Examples of raw data and derived results will be shown as well. Finally, future plans for
these systems will be discussed.
For some flight research applications where miniaturized instrumentation is a requirement, the authors conclude thatcommercially available data loggers and sensors are viable ahernatives. In fact, the data loggers and sensors make it possibleto gather research-quality data in a timely and cost-effective manner.
14. SUBJECT TERMS
Data acquisition; Data loggers; Onboard recording; Radio-controlled model air-
planes; Sailplanes; Self-contained instrumentation
17. SECURITY CLASSIFICATION' 18. SECURITY CLASSIFICATION
OF REPORT OF THIS PAGE
Unclassi fled Unclassi fled
NSN 7S40-O 1-280-5500
15. NUMBER OF PAGES
2016. PRICE CODE
A0319. SECURITY CLASSIFICATION 20. LIMITATION OFABSTRAC]
OF ABSTRACT
Unclassified Unlimited
Standard Form 298 (Rev. 2-89)Prescribed by ANSI St¢l Z39-10
298 -102
NASA-Langley, 1993
t