NASA Technical Memorandum 81942
37
NASA Technical Memorandum 81942 (NASA-Ta-819U2) PREDICTION OP FATIGUE-CRACK Ndl- 19480 GEIiJYTtl UYDEn VABlABLEAiIPLlTUDE AND SYECTiiUtl 4. LOADIF3 USING A CLOSURE MODLi (NASA) 3d p 3 3 kiC A33/IlP A0 1 CSCL 23K Uncl ds -- 3 G3/39 4lbLL '9 t .g < : > *? .. . '--. PREDICTION OF FATIGUE-CRACK GROWTH UNDER VARIABLE-AMPLITUDE AND SPECTRUM LOADLNS USING A CLOSURE MODEL Janua rv 1981 Langley Research Center !idr-rlp: - ,v 'r;,,>,4 36t35
Transcript of NASA Technical Memorandum 81942

NASA Technical Memorandum 81942
(NASA-Ta-819U2) PREDICTION OP FATIGUE-CRACK Ndl- 19480 GEIiJYTtl UYDEn VABlABLEAiIPLlTUDE AND SYECTiiUtl 4.
L O A D I F 3 USING A CLOSURE MODLi (NASA) 3d p 3 3
kiC A33/IlP A0 1 CSCL 23K Uncl ds -- 3 G3/39 4 l b L L '9
t .g <:>
*? .. . '--. P R E D I C T I O N O F FATIGUE-CRACK GROWTH
UNDER VARIABLE-AMPLITUDE AND SPECTRUM
LOADLNS USING A CLOSURE MODEL
Janua rv 1981
Langley Research Center !idr-rlp: - ,v 'r;,,>,4 36t35

PREDICTION O F FATIGUE-CRACK GROWTH mDER VARIABLE-AMPLITUDE AND
SPECTRUM LOADING U S I N G A CLOSURE MOOEL
J. C. N e w m a n , Jr. NASA i a n g l e y Research Center
Hampton, V i r g i n i a 23665
ABSTRACT
The present paper is concerned w t t h t h e a p p l i c a t i o n of an e x i s t i n g
a n a l y t i c ~ l criack-closure model t o s tudy c rack growth under v a r i s u s load h i s -
t o r i e s . The model was based cr. a concept like t h e D ~ g d a l e m o d ~ l , bu t modified
t o leave plas t ica l ly-deformed m a t e r i a l i n t h e wake of t h e advanciag c r a c k t i p .
The model was used t o c o r r e l a t e crack-growth r a t e s under constant -ampl i tude
loading, and t o pr.adi;t c rack growth under var iable-ampl i tdde and a i r c r a f t -
spec t r u a Loading on 2219-T851 aluminum a l l o y s h e e t m a t e r i a l . The p red ic ted
crack-growth l i v e s agreed we l l wi th exper imenta l d a t a . For 80 crack-growth
t e s t s sub jec ted t o v a r i o u s load h i s t o r i e s , t h e r a t i o of predic ted- to-exper imenta l
l i v e s (Np!NT) ranged from 0.5 t o 1.8. T h e mean v a l u e of Np/NT was 0.97 and
the s tandard d e v i a t i o n Gas 0 . 2 7 .

SYMBOLS
material crack-growth constants (k - 1.5) half-length of crack, m
half-length of final crack, m
half-length of initial crack, m
half-length of starter notch, m
half-length of crack plus tensile plastic zone, m
b~undary-correction factor on stress intensity
maximum stress-intensity factor, MPa - m 112 elastic-plasttc fracture toughness, Wa - m 1/2 frdcture toughness parameter
number of cycles
number of crack-growth delay cycles
number of cycles predicted from analysis
number of cycles from test specimen
stress ratio (Smin/Snaxj
applied stress, MPa
maximum applied stress, MPa
minimum applied stress, M?a
crack-opening stress, MPa
specimen thickness, m
specimen width, rn
corstraint factor, n = 1 for plane stress
.jnd cx - 3 for plane strain
stress-intensitv factor range, ?Pa - m1-I2 effective stress-intensity f a c t o r range, MFa - m 1/2
% effectiw threshold atrees-int-ity factor range, WPa - m 1/2 &th thre~hold atrere-inturoity factor r.nga, MPa - m 1/ 2
ASeff effective stress range, HPa
P length of te~ile plastic rone, m
P~~ plastic-zone &ire calculated from overload, m
f I ' ; OO flow streas (average between Uys and uU), MPa . r
1 u
YS yield stress (0.2 percent offset), MPa
a, ultimate tensile strength, MPa
u length of compressive plastic zone, m
INTRODUCTION
Fatigue cracks remain closed during part of the load cycle under fatigue
loading. The crack-closure concept has been used to correlate crack-growth
rates under constant-amplitude loading [1,2] and is a significant factor in
causing load-interaction effects on crack-growth rates (retardation and
acceleration) under variable-amplitude loading. Fatigue-crack closure is
caused by residual plastic deformations remaining in the wake of an advancing
crack.
The crack-closure pt~enomenon has been analyzed using two-dimensional,
elastic-plastic, finite-element methods [3-61. The finite-element analyses
were shown to be quite accurate, but were very complicated and required large
computing facilities. There have elso been several attempts to develop simple
analytical models of crack closure [3,7-121. All of these trjdels were based on
a cdncept similar to the Dugdale mdel [13] or strip-yield model, but modified
to leave plastically-deformed material in the wake of the crack. Newman 131,
Budisnsky and Hutchinson [ a ] , and ~Liir1.n~ and Seager [10,11] studied only the
crack-closure behavior. But, Dill and Saff [7 ] , Mrdrath, Neua~en, Elber and
Poe [9 ] , and Newman [12] used the crack-opening stresses from the models to
predict crack growth under spectrur loading.
The purpose of the present paper is to apply an existing analytical crack-
closure model [12], which simulates rlane-strees and plane-strain conditions,
to crack growth under various load histories. The model was based on the
Dugdale model [13], but modified to leave plastically-deformed material along
the crack surfaces as the crack advances. Plane-stress and plane-strain condi-
tions vere simulated by using a "constraint" factor on tensile yielding.
The crack-closure model, developed in reference 12, was for a central
crack in a finite-width plate that was subjected to a uniformly applied stress.
To calculate Elber's effective stress-intensity factor range [2], crack-opening
stresses were calculated from the model under constant-amplitude loading at
various applied stress levels and stress ratios. Experimental crack-growth rate
data from 2219-T851 aluminum alloy sheet material under constant-amplitude
loading [14] were correlated with the effective stress-intensity factor range
for a wide range of stress levels and stress ratios. An equation relating
crack-growth rate to effective stress-inteusity factor range, threshold stress-
intensity factor range, and fracture toughness, developed in reference 12, was
applied herein over the total range of crack-growth rates. The closure model
was then used to predict crack growth in 2219-T851 aluminum alloy sheet
material under variable-amplitude and aircraft-spectrum loading 1141.
ANALYTICAL CRACK-CLOSURE MODEL
The following section is a brief description of the analytical crack-
closure model developed in reference 12.

To c a l c u l a t e crack-closure and crack-opanirpg stresses d u r i n g c r a c k propaga-
t i o n , t h e e l a s t i c - p l a s t i c s o l u t i o n f o r stresses m d disp lacc l s sn t s i n a cracked
body must be known, Because t h e r e a r e no closed-form s o l u t i o n s t o elastic-
p l a s t i c cracked bodies , s imple apprclximations must b e used. The Dugdale model.
[13] is one such approximation. f i e crack-surface displacements , which are used
t o c a l c u l a t e con tac t ( o r c l o s u r e ) s t r e s s e s under c y c l i c load ing , a r e in f luenced
by p l a s t i c y i e l d i n g a t t h e c r a c k t i p and r e s i d u a i deformat ions l e f t i n t h e wake
of t h e advancing crack. The a p p l i e d stress l e v e l a t which t h e c r a c k s u r f a c c s
become f u l l y open (no s u r f a c e c o n t a c t ) i s d i r e c t l y r e l a t e d t o c o n t a c t s t r e s s a s ,
This s t r e s s is c a l l e d t h e "crack-opening s t r e s s . "
The model was developed f o r a c e n t r a l c r a c k i n a f i n i t e - w i d t h specimen sub-
j e c t e d t o uniform a p p l i e d s t r e s s , a s shown i n f i g u r e 1. The model was based on
t h e Dugdale model bu t modified t o l e a v e plas t ica l ly-deformed m a t e r i a l i n t h e
wake of the crack. The primary advantage i n us ing t h i s model is thdc t h e
p las t i c -zone s i z e and crack-surface displacements are ob ta ined 1 s u p e r p o s i t i o n
of two e l a s t i c problems: a c rack i n a f in i t e -wid th p l a t e s u b j e c t e d t o (1) a
remote uniform s t r e s s , S , o r (2) a uniform stress, o, a p p l i e d over a segment
of t h e c rack sn r face . The s ~ r e s s - i n t e n s i t y f a c t o r and crack-surface d i sp lace -
ment cquatlclns f o r these load ing c o n d i t i o n s a r e given i n r e f e r e n c e 12.
F igure 2 shows a schematic of t h e model a t maximum and minimum a p p l i e d
s t r e s s e s . The model w . 1 ~ composed of t h r e e regions: (1) a l i ~ e a r e l a s t i c r eg ion
con ta in ing n f i c t i t i o r ~ s c rack of ha l f - l eng th c + p , (2) a p l a s t i c r eg ion of
l e n g t h i ~ , and ( 3 ) ,t r e s i d u a l p l a s t i c dt>foru:;~t ion region a long t h e crack : ur-
faces. T h e physical c r a c k is of half-lt.ngt11 c. The compressive p l a s t i c zone
!.s 4. liegio11 1 was t r e a t e d as an e l a s t i c continuum, and t h e crack-surface
displscrr . l rn ts u~\rter v t l r i ~ :IS loaciint; c o n d i t i o n s are given i n r e f e r e n c e 12 .

Regions 2 and 3 were composed of r ig id-per fec t ly p l a r t i c (constant s t r e s s ) bar
elements with a flow stress, u0, which is t h e average between the y i e l d
s t r e s s , Uys, and the u l t imate t e n s i l e s t rength , aU. The shaded regions
i n l i gu re ?(a) and 2(b) i nd i ca t e ataterial which is i n a p l a s t i c state. A t any
rpplied strttss l eve l , t he ba r elements a r e e i t h e r i n t a c t ( i n t h e p l a s t i c zone)
o r broken ( res idua l p l a s t i c deformation). The broken elements ca r ry compressive
loads only, and then only i f they a r e i n contact. The eiements i n contact y ie ld
i n compression when the contact s t r e s s reaches 4 . Those elements t h a t a r e
not i n contsct do not e f f e c t the ca l cu la t ion of crack-surface displacements.
To account fo r the e f f e c t s of s ta te -of -s t ress on plastic-zone s i z e a cons t r a in t
fac tor a was used t o e l eva t e the t e n s i l e flow stress f o r the i n t a c t elements
i n the p l a s t i c zone. The e f f ec t ive flow s t r e s s aa0 under simulated plane-
s t r e s s conditions was oo and under simulated plane- t r a i n condit ions
was 30,. The cons t ra in t f ac to r is a lower bound f o r plane s t r e s s and an
approximate upper 1)ound f o r plane s t r a i n . These cons t ra in t f a c t o r s dere ver i -
f i e d using e l a s t i c -p l a s t i c finite-element analyses of cracked bodies under plane
s t r e s s 161 and plane-strain conditions. The procedure used t o e s t a b l i s h the
cons t ra in t f ac to r (a) used herein is discussed l a t e r .
The ana ly t i ca l crack-closure model, discussed i n d e t a i l i n reference 12,
was used t o ca l cu la t e crack-opening s t r e s s e s , So, a s a function of crack length
and load his tory. In turn , the crack-opening s t r e s s was used t o ca l cu la t e the
e f f e c t i v e s t r e s s - i n t e n s i t y f ac to r range, a s proposed by Elber, and, consequently,
the crack-growth r a t e s ,
FATIGUE-CRACK GROWTH RATE EQUATION
The crack-growth equation proposed by Elber [ 2 ] s t a t e s t ha t the crack-
growth r a t e i s a power function of the e f f e c t i v e s t r e s s - in t ens i ty f ac to r range
6
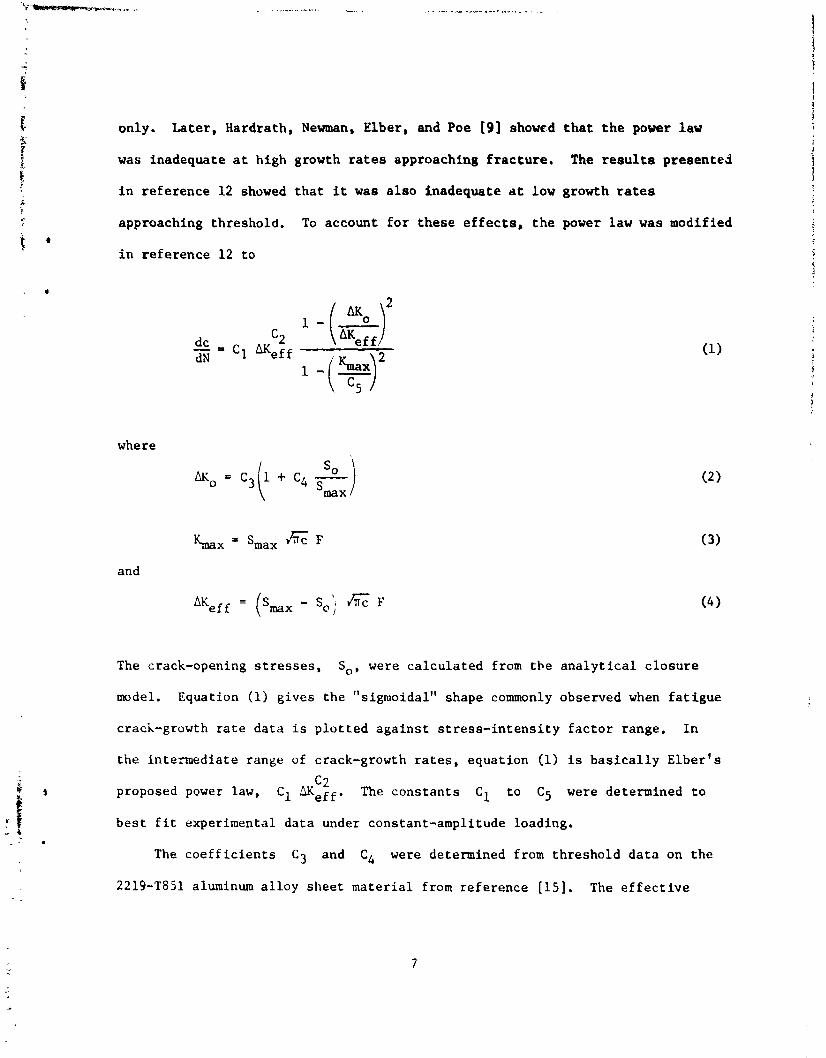
f only. Later, Hardrath, Newman, Elber, and Poe 19) showed that the power law $ r f was inadequate at high growth rates approaching fracture. The results presented I
in reference 12 showed that it was also inadequate at low growth rates
C approaching threshold. To account for these effects, the power law was modified
I t in reference 12 to
where
and
The crack-opening stresses, S,, were calculated from the analytical closure
model. Equation (1) gives the "sigmoidal" shape commonly observed when fatigue
crack-growth rate data is plotted against stress-intensity factor range. In
the intermediate range of crack-growth rates, equation (1) is basically ~lber's =# c 2
proposed power law, C1 AKeff. The constants C1 to Cg were determined to
best fit experimental data under constant-amplitude loading.
The coefficients C3 and C4 were determined from threshold data on the
2219-T651 aluminum alloy sheet material from reference [15]. The effective

threshold stress-intensity factor range, 4, was determined from the threshold stress-intensity factor range, Mth, as
The coefficient C5 is the elastic stress-intensity factor at failure or
cyclic fracture toughness. The coefficient C5 was chosen to be
77 MFa - m (70 ksi - in1I2) on the basis of the crack-growth tests in reference [14]. (See ref. 12.)
The coefficients C1 and C2 were found from constant-amplitude rate
data [14], after C3, C4, and C5 were determined, by using a least-squares
regression analysis. The constant-amplitude correlations were made using So
values computed from the model with various constraint factors. It was found
that an R of about 1.9 would give a good correlation under constant-amplitude
loading, The procedure used to obtain a will be discussed later. A summary
of the coefficie..ts used to correlate the constant-amplitude data with a = 1.9
are as follows:
c, = 2.486 x 10-lo ( - 314 x
C2 a 3,115
C j = 2.97 &Pa - m 'I2 (2.7 ksi - in 11 2) 1 C; = 0.8
C 5 = 77 NTa - ml/' (70 ksi - in1I2) J

i When SI unit. are used, Meff and Lx ara ~iven in HPa - dl2 and dc/&
1 Y is given in mlcycle. When U.S. Cubtowry wits are used, &ff and bX
are given in k s i - in1I2 and dc/dN is given in in./cycle.
Figure 3 shows a plot of iX against dc/dN for several R ratios for
: * 2219-T851 aluminum alloy sheet material to illustrate the sigmoidal shape of
equation (1). The experimental data were obtained from reference [15] and the e
curves were calculated from equation (1). The R - -1 data were obtained
from a small center-crack tension specimen (W = 76.2 mm) and the other data were
obtained from small compact specimens (W - 50.8 mm). The crack-growth coef-
ficients (C1, Cz, C3, and C4) used to calculate the curves were identical to
those shown in equations (6). However, the coefficient C5 for the small com-
pact specimens was 38.5 MPa - m and for the smll center-crack specimen
was 55 MPa - ml". The coefficients ( C 5 ; were calculated from the Two-Parameter
Fracture Criterion [16] using KF = 550 MPa - m and m = 1 These values
of "na m were obtained from the final crack lengths and maximum stress
levels used in the constant-amplitude tests from reference [14]. (See ref. 12.)
The crack-growth rate curves in figure 3 are in good agreement with the experi-
mental data.
APPLICATION OF THE CRACK-CLOSURE MODEL AND RATE EQUATION
The analytical crack-closdre model [12] and crack-growth program (FAST - Fatigue Crack Growth Analysis of Structures) was applied to constant-amplitude, - -
C
. - variable-amplitude and aircraft-spectrum loading on 2219-T851 alum+ n alloy . *
* . : . sheet material. * / '
Under constant-amplitude loading, the model was exercised under simulated
plane stress, plane strain, and ctt;ditions between these limits. The particular
constraint factor (a) used herein, to approximate the state-of-stress, w ~ s

obtained from t h e constant-amplitude crack-growth rate da ta . The crack-growth
r a t e equat ion (eq, (1)) was a l s o determined from t h e conetant-amplitude da ta .
The same c o n s t r a i n t f a c t o r was a l s o used t o p r e d i c t c r a c k growth under
variable-amplitude and a i rc ra f t - spec t rum loadjng. The crack-opening strt:,
were c a l c u l a t e d from t h e model as a f u r ~ c t i o n of c rack l e n g t h and load h l s c o r y ,
and the crack-growth r a t e s were p red ic ted from equa t ion (1). The p red ic ted
crack-growth l i v e s a r e com?ared w i t h experimental d a t a i n t h e fol lowing s e c t i o n s .
CONSTANT-MLITUDE LOADING
Crack-opening s t r e s s e s . - Reference 12 showed t h a t t h e c a l c u l a t e d crack-
opening s t r e s s e s under constant-amplitude load ing were independent of t h e con-
s t r a i n t f a c t o r f o r s t r e s s r a t i s (R) g r e a t e r than about 0.7 and were equal t o
t h e minimum app l ied s t r e s s . Thus, AKeff is equal t o AK f o r R L 0.7.
Using crack-growth r a t e d a t a from r e f e r e n c e s 14 and 15 f o r R 2 0.7, t h e crack-
growth c o n s t a n t s C1 and C2 were determined t o b e s t f i t t h e high R va lue
d a t a only. Bas ica l ly , t h i s crack-growth r a t e equat ion (eq. ( 1 ) ) d e p i c t s t h e
r e l a t i o n between hKeff and crack-growth r a t e . I f AKeff and dc/dN a r e
unique, then t h e crack-growth r a t e s f o r t e s t s a t R r a t i o l e s s than 0.7 should
i n d i c a t e t h e experimental AKeff and, consequently, t h e experi.menta1 va lue
of So. This value of So i s r e f e r r e d t o as t h e "semi-empirical" crack-opening
s t r e s s . For each t e s t , le semi-empirical So va lue was >:-sumed t o be cons tan t
and was determined from a l eas t - squares r e g r e s s i o n a n a l y s i s . These crack-
opening s t r e s s e s , normalized by t h e maximum app l ied s t r e s s , a r e shown i n f i g -
ure 4 a s a funct ion of t h e K r a t i o (symbols). The open symbols and t h e s o l i d
c i r c u l a r symbol a r e r e s u l t s from center-crack t e n s i o n (CCT) specimens (14,151.
The s o l i d t r i a n g u l a r symbols a r e r e s u l t s from compact specimens [15]. These
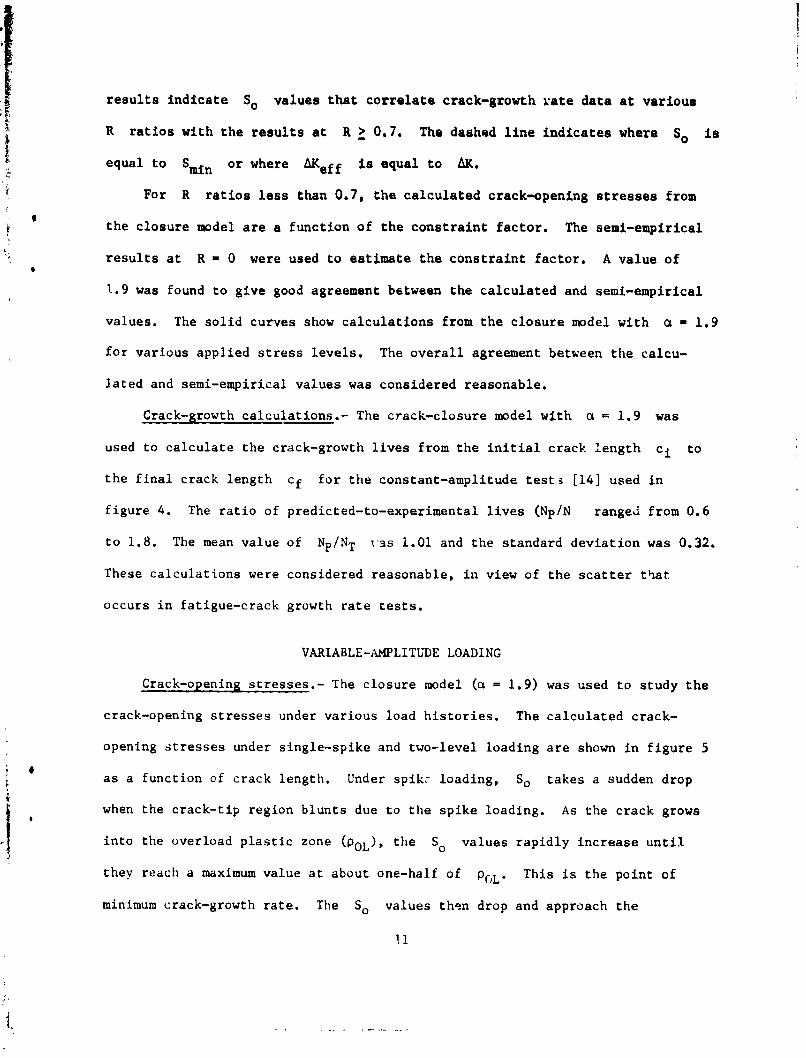
r e s u l t s i n d t c a t e So v a l u e s t h a t c o r r e l a t e crack-growth rate d a t a a t v a r i o u r
R r a t i o s w i t h t h e r e s u l t s a t R 2 0.7. The dashed l i n e i n d i c a t e s where So is
equa l t o Smin o r where hKaff is equa l t o &. For R r a t i o s less than 0.7, t h e c a l c u l a t e d crack-opening s t r e s s e s from
t h e c l o s u r e model a r e a f u n c t i o n o f t h e c o n s t r a i n t f a c t o r . The semi-empirical
r e s u l t s a t R = 0 were used t o estimate t h e c o n s t r a i n t f a c t o r . A v a l u e of
1.9 was found t o g i v e good agreement between t h e c a l c u l a t e d and semi-empirical
values . The s o l i d curves show c a l c u l a t i o n s from t h e c l o s u r e model w i t h a = 1.9
f o r va r ious a p p l i e d s t r e s s l e v e l s . The o v e r a l l agreement between t h e calcu-
l a t e d and semi-empirical va lues was considered reasonable .
Crack-growth ca lcu la t ions . - The crack-closure model w i t h a = 1.9 was
used t o c a l c u l a t e t h e crack-growth l i v e s from t h e i n i t i a l c rack l e n g t h c i t o
t h e f i n a l crack l e n g t h c f f o r t h e constant-amplitude t e s t ; [14] used i n
f i g u r e 4. The r a t i o of predicted-to-experimental l i v e s (Np/N ranged from 0.6
t o 1.8. The mean va lue of Np/NT 1-3s 1.01 and t h e s t andard d e v i a t i o n was 0.32.
These c a l c u l a t i o n s were considered reasonable , i n view of t h e s c a t t e r t h a t
occurs i n fa t igue-crack growth r a t e t e s t s .
VARIABLE-AMPLITUDE LOADING
Crack-opening s t r e s s e s . - The c l o s u r e model (a = 1.9) was used t o s tudy t h e
crack-opening s t r e s s e s under va r ious load h i s t o r i e s . The c a l c u l a t e d crack-
opening s t r e s s e s under s ing le - sp ike and two-level load ing a r e shown i n f i g u r e 5
a s a func t ion of c rack l eng th . Under spikc loading, So t a k e s a sudden drop
when the c rack- t ip region b l u n t s due t o t h e s p i k e loading. A s t h e c rack grows
i n t o t h e over load p l a s t i c zone (pOL), t h e So v a l u e s r a p i d l y i n c r e a s e u n t i l
they reach a maximum value a t about one-half of pClL. This i s t h e po in t of
minimum crack-growth r a t e . The S, va lues t h s n drop and approach t h e
I1

s t a b i l i z e d crack-opening stress (dashed l i n e ) f o r t h e low-level cons tan t -
amplitude loading, The r e t a r d a t i o n e f f e c t s (So g r e a t e r than dashed l i n e ) are
near ly e l imina ted when t h e c r a c k has grown about one over load plas t ic-zone
s i z e . I n c o n t r a s t , under two-level load ing t h e high load was app l ied from the
i n i t i a l c rack l e n g t h (ci 0 3 mm) f o r about 2500 cycles . Agatn, che So v a l u e s
r a p i d l y i n c r e a s e a s t h e c rack grows i n t o t h e over load p l a s t i c zone, but they
reach h igher va lues than those occur r ing vnder t h e s ingle-spike loading. Thus,
r e t a r d a t i o n e f f e c t s a r e much s t r o n g e r a f t e r mul t i -over loads than a f t e r s ing le -
sp ike loading.
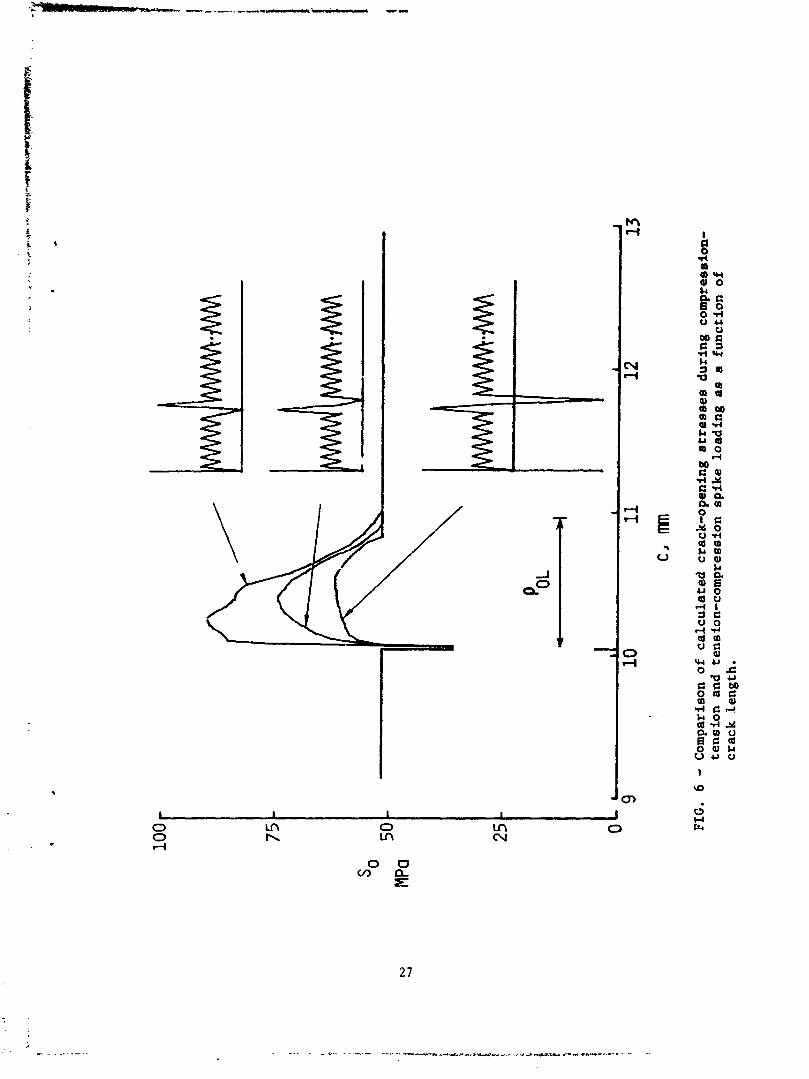
The c a l c u l a t e d crack-opening s t r e s s e s under compression-tension and
tension-compression s p i k e loading a r e shown i n f i g u r e 6 a s a func t ion of c rack
length , The h o r i z o n t a l l i n e is t h e crack-opening s t r e s s f o r t h e high R r ~ t i o
(0.5) constant-amplitude loading. Under compression-tension s p i k e loading,
t h e "compressive underload" ( s i n g l e downward load excurs ion) had no i n f l u e n c e
on t h e subseqcent So values . B L ~ L t h s t e n s i l e overload caused t h e So va lues
t o drop immediately, then r a p i d l y r i s e above those from t h e s t eady
s t a t e constant-amplitude loading (dashed l i n e ) f o r about one overload p l a s t i c -
zone s i z e . Xf t h e compressive underload i s spp l ied immediately a f t e r t h e
t e n s i l e , verload, t h e S, va lues a r e considerably lower than those from t h e
compression-tension s p i k e loading. Thus, t h e compressive underload a f t e r t h e
spike e l imina tes some of the r e t a r d a t i o n e f f e c t s dile t o t h e t e n s i l e overload.
r\ l a r g e r compressive underlcad a f t e r t h e sp ike causes a l a r g e r reduc t ion i n
t h e So va lues , but d id not completely e l i m i n a t e t h e r e t a r d a t i o n e f f e c t due
to the t e n s i l e overload.
Figure 7 shows t h e c a l c u l a t e d crack-opening s t r e s s e s dur ing repeated
compression-tension s p i k e loadinb as a f u ~ ~ c t i o n of c rack ! .gth. The fjrst

load l e v e l (i = 1 ) was appl ied fo r 2500 cycles. The compression-tension epike
(i = 2) was then applied. These load sequences were repeated u n t i l t h e speci-
men fa i led . The dashed l i n e shows t h e s t a b i l i z e d crack-opening stress (Sol)
i-
' 6 f o r l e v e l 1 only. The dash-dot l ine shows t h e s t a b i l i z e d crack-opening stress
i f l e v e l 2 only was applied. These results show t h a t t h e i n t e r a c t i o n between
l e v e l s 1 and 2 cause So values t o i nc rease s l i g h t l y during t h e compressive
underload, drop abrupt ly during t h e t e n s i l e overload and rap id ly increase
during the appl ica t ion of t he 2500 cycles. Again, t h e So va lues reach a
maximum a s t he crack grows i n t o t h e p l a s t i c zone caused by t h e t e n s i l e over-
load. The So values would approach Sol i f t h e t e n s i l e overload was not
repeated.
Crack-growth predictions.- The crack-growth r a t e , a t each load cycle , was
computed from equation ( I ) , using t h e cur ren t values of Smx, Smin, an2 So.
Equatian (1) p red ic t s r e t a r d a t i o ~ (or acce le ra t ion) i f So is l a r g e r (or
smaller) than t h e crack-opening s t r e s s t h a t would have been proauced under
constant-amplitcde loading a t Smax and Smin. To demonstrate how crack-
growth r a t e s were ca lcu la ted under variable-amplitude loading, an example is
given. Figure 8 shows a t yp i ca l variable-amplitude load his t roy. The growth
r a t e was computed from equation (1) using
wilere isef ft is the e f f e c t i v e s t r e s s range on t h e kth cycle. The growth
increment per cycle is

On t h e f i r s t and second tensile l o a d excurs ion, Sank S,q,
where k 1 o r 2, r espec t ive ly . Th is equa t ion was proposed by Elber [21
However, on t h e t h i r d t e n s i l e load excurs ion, Sminj is g r e a t e r than So,
t h e r e f o r e t h e e f f e c t i v e stress range was a s s u m d t o b e
where k = 3 and C2 i s t h e power on t h e growth law. Thus, t h e growth
increment, Ac2 + Ac3, i s s l i g h t l y l a r g e r than Lcl, i f S - m a X 1 - s-x3*
The
use of equat ion (10) was neces4ary because no crack-growth law, when expressed
i n terms of a power func t ion (C2 $ 1 ) . would sum t o t h e c o r r e c t growth inc re -
ment under variable-amplitude loading. For ins tance , i f t h e load excurs ion
S max2
t o Smin was extremely smal l , then t h e sum of growth increments Ac2 3
and Ac3 should b e equal t o t h e growth increment A c l I f Sminj was l e s s
tk.an So, then t h e growth increment Ac3 ehould be equal t o t h e growth incre-
ment A . Equation (10) accounts f o r t h e s e l i m i t i n g behaviors. Equation (10)
is app l ied only when Smink i s g r e a t e r than So and on ly when t h e c u r r e n t
maximum app l ied s t r e s s i s h igher than t h e h ighes t maximum stress occur r ing
s i n c e a s t r e s s excurs ion crossed So. On t h e f o u r t h excurs ion, ASeff was,
again , c o r ~ u t e d from equat ion (9) . The e f f e c t i v e s t r e s s range on t h e 5 t h
and 7th excurs ion were, aga in , computed from equat ion (10). But on t h e 6 t h ,
8 th , and 9 t h excursion,
where k = 6, 8, o r 9, respec t ive ly . Note that Lx6 _< S ux5. Equation (11)
was a l s o proposed by Elber (21.
Figure 9 shows t h e e f f e c t of t h e number of overload cyclea on pred ic ted
crack-growth delay. Crack-growth delay is t h e add i t i ona l number of cyclea
required t o grow the crack t o f a i l u r e , following an overload, over t h e number
required t o grow t h e crack t o f a i l u r e under constant-aaplitude loading only
( l eve l 3). The predicted r e s u l t s (symbols) show t h a t delay o r r e t a rda t ion is
longer f o r l a r g e r number of overload cycles. These r e s u l t s a r e i n q u a n t i t a t i v e
agreement wi th experimental observat ions 1171. Other r e t a r d a t i ~ n models
account fo r the e f f e c t of t h e number of overload cycles on crack-growth re ta rda-
t i o n empir ical ly [18] , o r do not account f o r it a t a l l [19,20] . A comparison between experimental and predicted crack-length-against-
cycles curves during two-level loading is shown i n f i g u r e 10. The load sequence
is shown i n t h e i n s e r t . The high load ( leve l 1) was a factor-of-2 l a r g e r than
lave1 2. The predicted r e s u l t s ( so l id curve) were ca lcu la ted from equation (1)
using the So values computed from the c losure model. The maximum computed
value of S o , during t h e appl ica t ion of l e v e l 2, was about 115 MPa and the
minimuin crack-growth r a t e was about 1.4 x m/cycle. The predicted l i f e
was about one-half of t he experimental l i f e ( symb~ls ) . The dash-dot curve
shows the predicted r e s u l t s using no load in te rac t ion .
Figure 11 shows a comparison of experimental and predicted crack-length-
against-cycles curves f o r repeated tension-compression and compression-tension
spike loading. The load sequences appl ied a r e shown i n t he i n s e r t s . The
experimental r e s u l t s (symbols) and t h e predicted r e s u l t s ( so l id curves) show
tha t t he compressive underload appl ied a f t e r the t e n s i l e overload causes t h e
crack to grow f a s t e r than when the compressive underload occurs before the

t e n s i l e overload. Although the predicted results show a etronger e f f e c t of
t he compressive underload than t h e experimental da ta , t h e agreements between
the predicted and experimental d a t a are considered good.
A comparison of experimental (symbols) and predicted ( so l id curve) crack-
length-against-cycles curves f o r a repeated block loading sequence is shown i n
f!gure 12. The load sequence is shown i n the i n s e r t . I n con t r a s t t o t h e
previous case, f i f t y cycle" of t he t e n s i l e overload were appl ied before t he
compressive underload. The predicted r e s u l t s a r e i n good agreement with the
experimentai data.
SPECTRM LOADING
Crack-opening s t resses . - The va r i a t i on of crack-opening s t r e s s with crack
length f o r a t yp ica l spectrum loading t e s t is shown i n f i gu re 13. The half-
length of the elox notch (c,) was 3.2 mm. The specimen was cycled under -
constant-amplitude loading (Smax = 69 m a ) a t R = 0 u n t i l t he crack grew t o
a crack half-length (ci) of 3.8 m. Next, a t yp ica l f i g h t e r a i r c r a f t spectrum
was applied to the specimen. The maximum s t r e s s was about 183 MPa and the
minimum s t r e s s was about -30 MPa. The p a r t i c u l a r spectrum loads appl ied a r e
given in refer en^ [14] under test M91. The ca lcu la ted crack-opening s t r e s s e s
plot ted i n f igure 13 show only a small f r ac t ion of the number of values computed
from the awdel. The crack-opening s t r e s s e s follow a very i r r e g u l a r pa t t e rn
while the cyc l ic loads a r e applied; even so, they tend t o o s c i l l a t e about a
mean value.
The use of an "equivalent" crack-opening s t r e s s concept would g rea t ly
reduce the ccrnputer times required t o complete a simulated t e s t . The use r l
an equivalent s t r e s s is j u s t i f i e d because, a t low t o medium s t r e s s l e v e l s , the

crack-opening stresses s t a b i l i z e under constant-amplitude loading. Tkey a l s o
,tend t o o s c i l l a t e about a mean value under spectrum loading. The equation f o r -
:he equivalent crack-opening stress, So, uae
where t h e sumnation was performed over t h e crack extension increment
C i + 5 Pmax t o ci + 10 p,,. Tha maximum plastic-zone s;.ze, pmx, was
ca lcu la ted using t h e maximum stress i n t he spectrum. (For extremely high stress
l e v e l s and low R r a t i o s , where So values do not s t a b i l i z e , t h e simulated
test specimen may f a i l before t h e equivalent crack-opening stress rout ine is
act ivateu.) The dashed l i n e i n f i gu re 1 3 shows t h e ca lcu la ted equivalent -
crack-o2rning s t r e s s . The predicted crack-growth l i f e using So was 3.5 per-
cent l e s s than the predicted l i f e using So, but t h e computer time was only
about one-half as l a rge (2.6 minutes t o 5.6 minutes).
C- &-growth predictions.- In reference 14 crack-growth t e s t s were con-
ducted on center-crack tension specimens subjected t o f i v e bas ic a i r c r a f t - t ype
load spectra . Three of t h e spec t ra were each appl ied a t t h r ee d i f f e r e n t s c a l e
f ac to r s (same shape spectrum with d i f f e r e n t s ca l i ng of t he s t r e s s e s ) , and t h e
o ther tt - spec t ra were each appl ied a t two d i f f e r e n t s ca l e fac tors . There
we--- ,h i r teen d i f f e r e n t spectrum loading t e s t s .
Figure 14 compares predicted and experimental crack-length- gain st-cycles
curves f o r a t yp i ca l f i g h t e r spectrum. The specimens were subjected t o t h e
same speclrum, but with t h r e e d i f f e r e n t s c a l e f a c t o r s (0.2, 0.3, and 0.4). The
pre? ic ted r e s u l t s using a = 1.9 ( so l id curves) a r e i n good agreement with t h e
experimental da ta (symbols). However, f o r a l l spectrum t e s t s conducted a t a

low-stress level (scale factor = 0.2), the predicted results gave longer lives
than the experimental data. A t the lorstress level, the plastic-zone eitee
are small compared to thickness and plane-strain conditions map prevail. The
dashed curve shows calculated results using a constrain factor of 2.7 (plane
strain) and the results are in excellent agreement with the experimental data,
whereas, at the high-stress level, the predicted results gave shorter lives
than the experimental data. At the high-stress level, the plastic-zone sizes
are about a factor-of-4 larger than the low-stress level case, and plane-stress
conditions m y prevail. The dash-dot curve was calculated using an a = 1.15.
The calculated results are in better agreement with the experimental data than
the results with an a = 1.9. These results indicate that the constraint
fac:or rnay vary with stress level and crack length.
COMPARISON OF EXPERIMENTAL AND PREDICTED LIVES
Figure 15 compares experimental (NT) and predicted (Np) lives for
18 constant-amplitude load tests, 49 variable-amplitude load tests, and
13 spectrum-load tests. The crack-closure model with a = 1.9 was used to
predict crack-growth lives from the initial crack length ci to the final
crack length c f . The ratio of predicted-to-experimental life (Np/NT) ranged
from 0.5 tr 1.8. The mean value of Np/NT was 0.97 and the standard deviation
wa.; 0.27.
CONCLUDING REMARKS
An existing analytical crack-closure model (FAST) was used to correlate
crack-growth rate data under constant-amplitude loading, and to predict crack
growth under variable-amplitude and aircraft-spectrum loading. The model was
based on the Dugdale model, but mdified to leave plastically-deformed material

in the wake of the advancing crack tip. The mdel was used to calculate the
crack-opening stresses as a function of crack length and load history under
simulated plane-stress and plane-strain conditions.
A previously developed crack-growth rate equation, in terms of ~lber's
effective stress-intensity factor range, threshold stress-intensity factor
range, and fracture toughness, was used to correlate constant-amplitude rate
data. The rate equation gives the "sigmidal" shape co~m~only observed when
fatigue crack-growth rate data is plotted against stress-intensity factor range.
The five crack-growth constants in this equation were determined from constant-
amplitude data on 2219-T851 aluminum alloy sheet material. The equation cor-
related the constant-amplitude date ovex a wide range of stress ratios and
stress levels quite well.
The analytical closure mdel with a constraint factor of 1.9 and the rate
equation were used to predict crack growth under variable-amplitude and
aircraft-spectrum loading on the 2219-T851 aluminum alloy material. The proper
constraint factor was determined from the constant-amplitude data. The model
predicts the effects of load interaction, such as retardation and acceleration.
The ratio of predicted-to-experimental crack-growth lives (Np/NT) ranged
from 0.5 to 1.8 in sixty-two variable-amplitude and spectrum load tests. The
mean of Np/Ny was 0.97 and the standard deviation was 0.27. Thus, the
analytical crack-closure model and the proposed crack-growth law predicted
crack growth behavior in all tests quite well.

REFERENCES
1. Elber , W.: "Fatigue Crack Closure Under Cyc l i c Tension." Engineer ing F r a c t u r e Mechanics, Vol. 2, No. 1, J u l y 1970, pp. 37-45.
2 . Elber, W . : "The S i g n i f i c a n c e of Fa t igue Crack Closure. ' ' ASTM STP-486, American Soc ie ty f o r T e s t i n g and Materials, 1971, pp. 230-242.
3. :Jewman, J . C. , J r . : "Finite-Element Analys is of Fa t igue Crack Propagat ion - Inc lud ing t h e E f f e c t s of Crack Closure." PhD Thes i s , VPI & SU, Blacksburg, VA, May 1974.
4. Newman, J . C. , J r . ; and Armen, Harry, Jr. : " E l a s t i c - P l a s t i c Ana lys i s o f a Propagat ing Crack Under Cyc l i c Loading." AIAA J o u r n a l , Vol. 13, No. 8 , August 1975, pp. 1017-1023.
). o h j i, I;. ; Ogura, LC.; and Ohkubo, Y . : "Cyclic Analys is of a Propagat ing Crack and Its C o r r e l a t i o n wi th Fa t igue Crack Growth." Eng i tde r ing Frac tu re Mechanics J., Vol. 7, 1975, pp. 457-464.
6. tiewman, .I. C . , J r . : "A Finite-Element Analys is of Fatigue-Crack Closure." Mechanics o t Crack Growth, ASEI STP-490, American Soc ie ty f o r T e s t i n g and F la te r i a l s , 1976, pp. 281-301.
7. D i l l , H . D . ; and S a f f , C . R. : "Spectrum Crack Growth P r e d i c t i o n Method Eased on Crack Sul-iace Displaceme~?t and Contact Analyses." F a t i g u e Crack Growth Under Spectrum Loads, ASTM STP-595, American Soc ie ty f o r Tes t ing and Y a t e r i a l s , 1976, pp. 306-319.
8. Budiansky, B. ; and Hutchinson, J . W . : "Analysis of Closure i n Fa t igue Crack Growth." Divis ion of Applied Science , DAS H-1, Harvard U n i v e r s i t y , June 1977.
9. I lardrath, 11. F . ; Newman, J . C., J r . ; Elber , W . ; and Poe, C . C . , J r . : " ~ e c e n t Developments i n Analys is of Crack Propagat ion and F r a c t u r e of P r a c t i c a l ~ a t e r i a l s . " F r a c t u r e Mechailics, e d i t e d by N. Perrone, Univers i ty P ress of V i r g i n i a , 1978.
10. ~ ; ; l l r i n g , H.; and Seeger, T . : " D u ~ d a l e Crack Closure Analys is of F '.igue Cracks Gnder Constant Amplitude Loading." Engineering F r a c t u r e Mechanics J . , V n l . 11, 1979, pp. 99-12?.
11. ~ G h r i n ~ , H . ; and Seeger, 'T. : " S t r u c t u r a l Memory of Cracked Components Under I r r e g u l a r Loading." F r a c t u r e Mechanics, ASTN STP-677, C . W . Smith, Ed , , America11 Socie ty f o r Tes t ing and M a t e r i a l s , 1979, pp. 144-167.
12. ;;ewman, J . (:. , Jr . : "A Crack-Closure Model f o r P r e d i c t i n g Fatigue-Crack- Growth Under A i r c r a f t Spectrum Loading." Methods and Models f o r P red ic t ing Crack Growtl; Under Random Loading, ASTM STP- -9 J . B. Chang, - Ed., American Socie ty t o r Tes t ing and b la te r i a l s , 1981, pp. -.
13. Dugdale, D. S.: "Yielding of S t e e l Sheets Containing S l i t s . " Journal Nech. Phys. Sol ids , Vol. 8, 1960.
14. Chang, J. B. ; and Stolpestad, J. H. : "Improved Methods f o r P red i c t i ng Spectrum Loading Ef f a c t s - Phase I ~ e p o r t ." AFFDL-TR-79-3036, Volume 11, March 1979.
It 15. Hudak, S. J. ; Saxena, A.; Bucci, R. J.; and Malcolm, R. C. : Development of Standard Methods of Test ing and Analyzing Fatigue Crack Growth Rate Data. " AFFIL-TR-78-40, May 1978.
16, Netman, J . C., J r . : "Fracture Analysis of Various Cracked Configurations i n Sheet and P l a t e Piater ia ls , Proper t ies Related t o Frac ture Toughness." ASTM STP-605, American Society f o r Test ing and Mater ia ls , 1976, pp. 104-123.
17 . Hudson, C. 1.1. ; and Raju, K. N. : "Invest igat ion of Fatigue-Crack Growth Under Simple Variable-Amplitude Loading." In te rna t iona l Journal of Nondestructive Testing, Vol. 2, 1970, pp. 189-205.
18. Johnson, W. S.: "Multi-Parameter Yield Zone Model f o r Pred ic t ing Spectrum Crack Growth." Methods and Models f o r Pred ic t ing Fatigue Crack Growth Under Random Loading, ASTM qTP, J. B. Chang, Ed., American Society f o r Testing and Mater ia ls , 1981.
19. Willenborg, J. D.; Engle, R. M., Jr.; and Wood, '1. A,: "A Crack Growth Retardation Model Using Effec t ive S t r e s s Concept. " AFFDL-TM-71-1-FBR, Jan. 1971.
20. Chang, J. B. ; Engle, R. M.; and Stolpestad, J. : "Fatigue Crack Growth Behavior and L i f e Pred ic t ions f o r 2219-T851 Aluminum Subjected t o Variable-Amplitude Loadings." Presented a t t he 13 th National Symposium on Fracture Mechanics, June 1980.
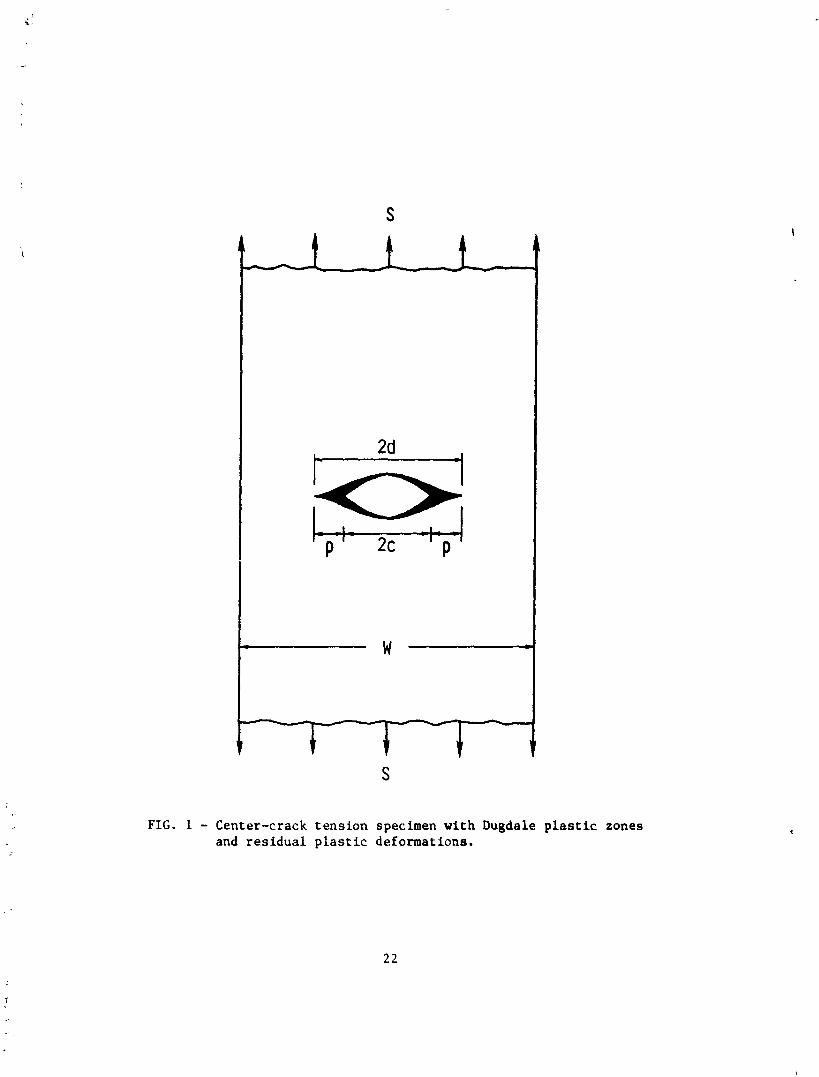
FIG. 1 - Center-crack tension specimen w i t h Dugdale p las t i c zones and residual p las t i c deformations.
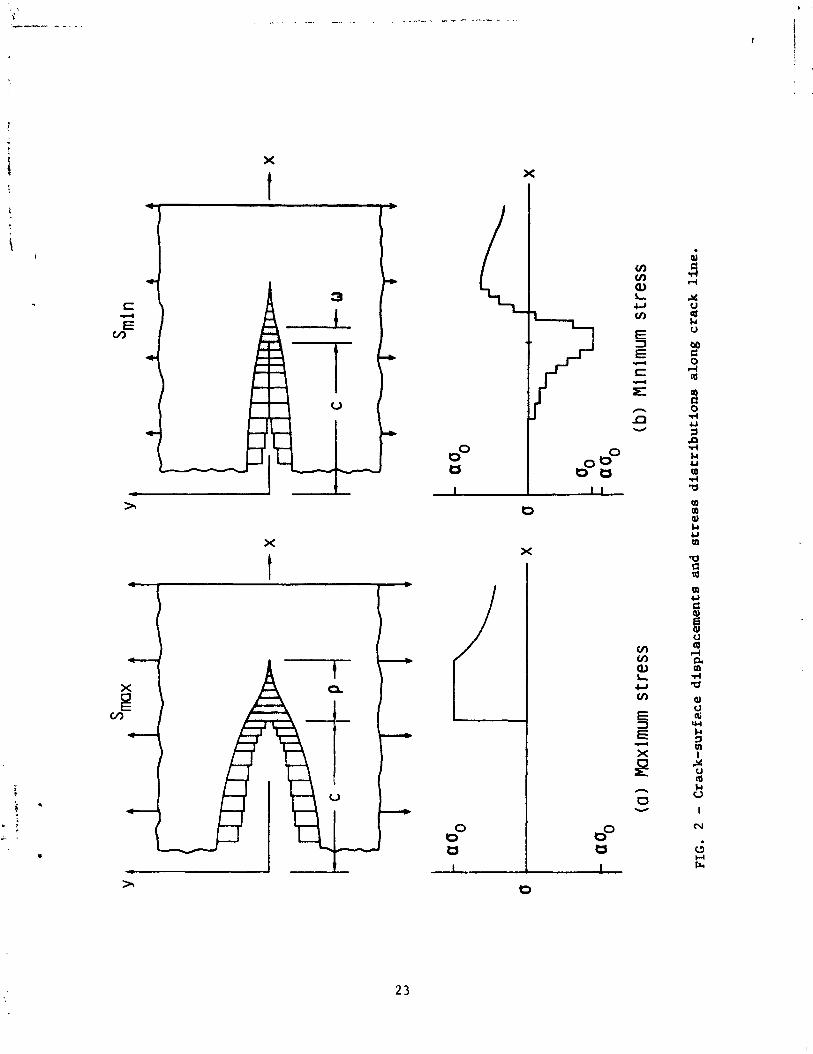

FIG. 3 - Comparison of experimental crack-grobth rates and rate equatinn for 2219-T851 aluminum a l loy at various R ra t io s .


FIG.
5 - Comparison o
f ca
lcu
late
d c
rack
-op
enin
g st
re
sse
s du
ring
tw
o-l
evel
ao
d
sin
gle
-sp
ike
loa
dia
g a
s a
fu
nct
ion
of crack
len
gth
.


F t-'
5


CIJ W C,
C1 W
I
R c-4 Y p1 a r
r! L L wm
R L m P- 0. r( r1 0 e .(r( L L m o n r I m o -a -a ID (D 0 3 rn P
1" m t-'R 0 r( Q ID a 0) w m 3 (P 00 0)
0 m L
m C
$ R P. 0 0
0 m O 1 0 0 r t-'
2 00 fi 3-
L (D
r(


o Constant o Variable
Spectrum
t ude tude
Np, predicted cycles
FIG. 15 - Comparison of experimental (141 and predicted cycles to failure for 2219-T851 aluminum alloy material under constant-amplitude, variable-amplitude, and spectrum loading.