NASA Technical Memorandum 104042
12
4 qlS" NASA Technical Memorandum 104042 (NASA-TM-I04042) SENSITIVITY-BASED SCALING FOR CORRELATING STRUCTURAL RESPONSE FROM DIFFERLNT ANALYTICAL MODELS (NASA) 11 p C_CL 20K Ngl-22D75 Uncl _Js G 3/.39 0002 705 Sensitivity-Based Scaling for Correlating Structural Response from Different Analytical Models Kwan J. Chang. Raphael T. Haftka Gary L. Giles Pi-Jen Kao February 1991 National Aeronautics and Space Administration Langley Research Center Hampton, Virginia 23665-5225 brought to you by CORE View metadata, citation and similar papers at core.ac.uk provided by NASA Technical Reports Server
Transcript of NASA Technical Memorandum 104042

4 qlS"
NASA Technical Memorandum 104042
(NASA-TM-I04042) SENSITIVITY-BASED SCALING
FOR CORRELATING STRUCTURAL RESPONSE FROM
DIFFERLNT ANALYTICAL MODELS (NASA) 11 pC_CL 20K
Ngl-22D75
Uncl _Js
G 3/.39 0002 705
Sensitivity-Based Scaling for CorrelatingStructural Response from DifferentAnalytical Models
Kwan J. Chang.Raphael T. HaftkaGary L. GilesPi-Jen Kao
February 1991
National Aeronautics andSpace Administration
Langley Research CenterHampton, Virginia 23665-5225
https://ntrs.nasa.gov/search.jsp?R=19910013265 2020-03-19T18:00:07+00:00Zbrought to you by COREView metadata, citation and similar papers at core.ac.uk
provided by NASA Technical Reports Server

2

Sensitivity-Based Scaling for Correlating StructuralResponse from Different Analytical Models
Kwan J. Chang °Lockheed Engineering and Science Company
Hampton, Virginia 23666
Raphael T. Haftka *'Virginia Polytechnic Institute and State University
Blacksburg, Virginia 24061
Gary L. Giles +NASA Langley Research Center
Hampton, Virginia 23665
Pi-Jen Kao ++Analytical Services and Materials, Inc.
Hampton, Virginia 23666
Abstract
This paper presents a sensitivity-based linearly vary-ing scale factor used to reconcile results from simpleand refined models for analysis of the same structure.The improved accuracy of the linear scale factor com-pared to a constant scale factor as well as the com-monly used tangent approximation is demonstrated.A wing box structure is used as an example, withdisplacements, stresses and frequencies correlated.The linear scale factor could permit the use of a simpli-fied model in an optimization procedure during prelim-inary design to approximate the response given by ar_fined model over a considerable range of designchanges.
Introduction
The design optimization of an engineering systemtypically requires hundreds of analyses of that system.The use of approximations to the objective functionand constraints during portions of the design processis quite common (e.g., [1]), because of the high com-putational cost of these analyses. Such designapproximations can be divided into two classes. Firstthere are local, derivative-based approximations suchas the linear approximation based on a Taylor-series
* Staff Engineer.** Professor, Associate Fellow AIAA.+ Senior Research Engineer, Associate Fellow AIAA.++ Research Scientist, Member AIAA.
expansion about a design point. These approxima-tions are typically based on an accurate model toobtain the system response and its derivatives.Second, there are global approximations that try tocapture the behavior of the objective function or con-straints over the entire design domain. Such approx-imations are often based on a simplified theory, acoarser model or both (e.g., [2]). Here such globalapproximations are referred to as simple-modelapproximations. Local approximations are typicallyvery accurate near the design point where they aregenerated but, since they are based on an extrapola-tion procedure, their accuracy can deteriorate catas-lrophically at a distance. Simple-model approxima-lions are intended to capture the physics of the prob-lem at some lower, but acceptable, level of accuracyover the entire design domain. Hence, at a particulardesign point the simple-model approximations aregenerally less accurate than local approximations buton the other hand they typically do not experience thecatastrophic deterioration in accuracy if significantdesign changes are made.
There has been much research into improving localapproximations to extend their region of usefulness.In structural optimization the use of intervening vari-ables has been found to be effective. For example,for many structural design problems (such as stressoptimization) it was found that the linear approximationin the reciprocal of the design variables is more accu-rate than the ordinary linear approximation (e.g., [3]).Similarly, it was found that forces are approximatedbetter than stresses (see [4]), so that a linear approxi-mation of element forces followed by explicit calcula-tion of stresses is more accurate than a linear approxi-mation of the stresses. Similarly, in aerodynamicsthere have been efforts, such as coordinate stretch-

ing [5], to improve local approximations for aerody-namic drag.
There has also been some research into improvingglobal or simple-model approximations. One activearea is the use of the so called reduced-basis approx-imations in structural dynamics. There, the order ofthe structural model is reduced by retaining only asmall number of deformation shapes, e.g. vibrationmodes, and assuming that the structural response canbe approximated as a linear combination of theseshapes. Research has focused on the best selectionof these shapes [6] as well as on methods thatimprove accuracy for a given set of shapes (e.g., [7]).The most commonly used global approximations,however, are based on coarser discretizations or lesscomputationally expensive theoretical models for thesame problem. For example, in the optimization ofwing structures plate models have been used toreplace the more expensive built-up finite-elementmodels (e.g., [8]-[10]).
It may be expected that the advantages of localapproximations and simple-model approximations canbe combined. In fact, multi-grid analysis methods(e.g., [11]) have demonstrated the utilily of workingsimultaneously with coarse and refined approxima-tions. In [12] a method, called the global-local approx-imation, was proposed which uses sensitivity informa-tion from both a refined and a coarse model of thestructure to construct an approximation that combinesthe advantages of local and global approximations.The method was used with coarse and refined finite-element models of a simple beam structure. Theobjective of the present paper is to show that themethod can be used for better correlation of resultsobtained with models based on different analyticalformulations. In particular, the method is applied Ioequivalent-plate and finite-element models of a candi-date wing structure for a supersonic transport.
Sensitivity-Based Scaling Approximation
Scaling factors have been used in the past (e.g.,[13]) for the correlation of simplified and refinedmodels. Use of a scale factor involves comparingresults from a coarse model or simplified approxima-tion at a given design poinl to results for a morerefined approximation, or to the exact result, if avail-able. The ratio of results from the refined approxima-tion to results from the coarse approximation is a scal-ing factor that is used to multiply the coarse approxi-mation results at other points in the design domain.Recall that the coarse approximation is viewed as aglobal approximation. Then the scaling factor intro-duces some local flavor into the process in thai it ismost effective near the point in the design domain
where the factor is calculated. It is possible, in caseswhere the value of the scaling factor changes consid-erably over the design domain, that the localimprovement comes at the expense ol reduced accu-racy of the scaled coarse approximation far from thepoint where the scale factor is calculated.
The newly developed sensitivity-based correlationapproach refines the traditional constant scaling factorby using a linearly varying scaling factor. The methodcan be viewed as a combination of the local aspect ofderivative based approximations with the globalaspect of coarse-model approximations. For simplic-ity, consider first a structural response from a refinedanalysis that is a function of a single design variable,fR(x) which is approximated by a simplified analysis asfs(x), and define a scaling factor, 13calculated at adesign point Xo as
j3(Xo) = fR(xo)/ fS(Xo) (1)
The scaling factor at any other point can be approxi-mated as
= I}(Xo)+ (2)
where the prime symbol denotes the derivative withrespect to x. Taking the derivative of the expressionfor the scale factor, [3in Eq. (1) gives
13'(Xo)= _(Xo) [ f'R(Xo)/fR(Xo)- f'S(Xo)/fS(Xo)] (3)
Substituting Eq. (3) into Eq. (2) gives the sensitivitybased correlation factor, J3(x), and approximations tothe global response using constant and linear scalingare given respectively by
fSRC(X) = J3(Xo)fs(x) and fSRL(X)= _x)fs(x) (4)
This approach is applicable to a vector of design vari-ables with the single scale factor, 13,in Eq. (2) beingreplaced by the first-order Taylor series expansion of13.
Wing-Box Example
The proposed method is demonstrated for a wing-box model of a high speed civil transport shown in Fig.1. The simplified-model of the wing box is analyzedusing the equivalent-plate analysis method describedin Refs. 9 and 10. The simplified model (Fig. l(a)) iscomposed of 3 equivalent plates, referred to aspanels I, II, and III, and 22 spar caps (not shown onfigure). The cross-sectional geometry of the equiva-lent plate is given by the location of the midcambersurface and depth which are both defined as polyno-mial functions over the planform of the wing. The
2

thicknesses of the upper and lower cover skins ineach panel are given in polynomial form as
t = Co+C1_+C_+C3_ (5)
where _,and q are the fraction of chord and fraction ofsemispan of each panel, and Co, C1, C2, and C3 arethickness coefficients which are used as design vari-ables. The initial design point for the equivalent platemodel has thickness coefficients for the three panelsgiven in Table 1.
The refined analysis is performed with a finite-element program [14] using a built-up model, shownin Fig. l(b), containing 60 membrane elements, 70shear webs, and 180 bar elements to represent riband spar caps and vertical posts between the covers.The thickness coefficients of the simplified model areused to generate the thickness of the membraneelements in the upper and lower skins in the finite-element model by averaging plate thickness valuescorresponding to the four nodes of each finiteelement. The wing is loaded by two 25,000 lb. loadsin the z direction at the two extreme points of the tip ofthe model (nodes 1 and 7 in Fig. 1). The wing isassumed to be made of silicon carbide fiber in atitanium metal matrix (SCS6/Ti) stacked into a quasi-isotropic laminate. The material properties used hereare a Young's modulus of 21.32 x 10⁶ psi, Poisson'sratio of 0.325, shear modulus of 8.0 x 10⁶ psi, and adensity of 0.144 Ib/in2.
Values for the nominal displacements, stresses andIowesl frequencies of the two models are given inTable 2 with the locations of the displacement andstress values shown in Fig. 1. These results indicatethat the agreement between the calculated structuralresponses from the two models at the initial designpoint is quite good. The corresponding derivatives oftip displacement, stress value at the specified loca-tion, and lowest frequency with respect to the thick-ness coefficients in each panel are given in Table 3 forboth models. These derivatives are needed to calcu-late the linearly varying scale factor, fSRL. The valuesof the derivatives given by the simplified and refinedmodels have a reasonable level of agreement, withthe largest differences being in the stress derivatives.
Approximation Results and Discussion
The accuracy of the scaling methods are tested bymaking changes in the values of thickness coeffi-cients and evaluating the structural responses givenby the various approximations. The approximationsare evaluated as the ratios of the thickness coeffi-
cients are increased up to factors of C i / Co = 5, where
the superscript ,o, denotes the original value. Resultsare presented for a subset of the design variableslisted in Table 3. The coefficient Co, the constant termin the thickness polynomial of Eq. 5, is selected formany of the results because the derivatives of thestructural response quantities with respect to Co arelarge compared to derivatives with respect to othercoefficients. The coefficent, C2, is also used forsome cases to illustrate the change of a linear term inthe thickness polynomial.
A comparison of values of normalized tip displace-ment (again refer to Fig. 1) are shown in Figs. 2 and 3for changes in CO in panel I and C2 in panel 11.In thesefigures fR represents results from the refined (finite-element) analysis, fs are results from the simplified(equivalent-plate) analysis, and fSRC and fSRL are theconstant and linearly scaled approximations, respec-tively. The displacements are normalized by the valueof the refined model at the initial design. The twofigures show that the error associated with the simplemodel increases as the design variables move awayfrom the initial design. The factor corresponding tothe constant scale approximation fSRC is small sincethe agreement between the two models is quite goodat the initial design and this factor contributes very littleIo correcting the error at points away from the initialdesign. The linear scale factor approximation, fSRL,on the other hand, almost completely eliminates theerror due to change in design. The linear Taylor series(tangent) approximation, commonly used in optimiza-tion is also shown in Fig. 2 and 3. However, it is clearthal such a tangent approximation is less accurate forthe displacement here than either scale factor approx-imation. To keep an expanded scale on Fig. 2, thetangent approximation is not extended to the point at
Ci / Cu = 5.
Figures 4 and 5 show the same approximationsapplied to the stress at the point shown in Fig. 1 forchanges in Co for panel I as before and Co instead ofC2 for panel II. For changes in Co for panel I (Fig. 4)the relative ranking of the approximations remains thesame. The errors in fs, though, are much larger, sothat the improvement due to scaling is more evident.This time, however, it appears that while the linearlyvarying scaling is much better than a tangent approx-imation, the constant scale factor is about the same.For changes in Co for panel II (Fig. 5) the situation isdifferent. In this case, the linearly varying scale factoris the most accurate approximation only near the initialdesign. Further away the constant scale factor isslightly better. This is an example where the localnature introduced by using derivatives asserts itself.Note, however, that even in this case both scaling
3

methods are better than the tangent approximation ata distance from the initial design.
Figures 6 and 7 show the approximations applied tothe first (lowest) natural frequency of lhe structure. Aswith the tip displacement, the frequencies o! therefined and simple models are almost the same at theinitial design. Therefore, very little improvement inaccuracy is afforded by the constant scale factorapproximation. Again the linear scale factor approxi-mation is very accurate, and much better than thetangent approximation.
The previous figures show the effect of changingonly one design variable at a time. These results donot check the effect of design variable interaction onthe quality of the approximation. This effect wasdemonstrated by making a change to a selectedcombination of design variables. The combinedchange was made by simultaneously applying thechanges given in the following four equations
Co = C_ (1 + ,5) in panel I
Co = C°(1-8) inpanelll
(6)o
C2= C2(1+8) in panelll
Co = C°(1 +8) inpanellll
Note that the fractional design variable change, 8,was applied in the negative direction for Co in panel I1.Figures 8 to 10 show the effect of such a combineddesign variable change on displacement, stress andfrequency. Again the same general trend of the linearscale factor giving better correlation than the constantscale factor is observed. However for large designchanges, even the linear scale factor only accounts forapproximately half the difference between the simpli-fied and refined analysis results. Again, both scalingmethods give better correlation than the tangentapproximation at a sufficiently large distance from theinitial design.
Implications for Design Optimization
Design optimization of complex structures is typicallyperformed in procedures which solve a sequence olapproximate optimization problems. Wilh thisapproach each optimization is based on an approxi-mation to the structural response. The traditional,most often used local approximation is the tangentapproximation. Global approximations based on sim-
pier theory or a coarser model are used with or withoutscale factors. The approximation is updated at theoptimum of the approximate problem, and the processis repeated to convergence. The process of updatingthe approximation involves at least an analysis andpossibly an analysis plus derivative calculation for lherefined model. This updating often accounts for moreihan half of the total computational cost of the entireoptimization procedure.
Periodic update of a constant scale factor requiresonly a single analysis of the refined model, however,updating the linear scale factor requires an analysisplus derivative calculation of the refined model. Foreffective struclural design, the procedure should beselected that will result in lowest computational costfor the overall optimization procedure. This selectionis application-, procedure-, and problem-dependent.In particular, it will depend strongly on the computa-tional efficiency and level of accuracy of the simplifiedmodel. When the scale factor does not vary muchover the design space the constant scale factor will bemore effective because it does not require the calcu-lation of expensive derivatives of the refined model. Ifthe scale faclor does vary substantially Over thedesign space then the linear approximationTs neededand is a valuable tool to provide the d_ed_yei ofaccuracy over a considerable region of the designdomain. Actual experience in applying lhese scalingmethods in a variety of problems is needed to estab-lish guidelines for selecting the most effective approx-imation for a particular design problem. However,such applications are beyond the scope of this paper.
Concluding Remarks
A description is given of a new sensitivity-based scal-ing method for correlating structural response fromdifferent analytical models. Traditionally, a constantfactor based on a single design point has been usedto scale results between simple and refined models ofthe same structure. Here two different formulationsare used to analyze the same structure; a simplifiedrepresentation using an equivalent-plate analysismethod, and a refined representation using a con-ventional finite-element analysis program. A wing boxstructure is used as an example, with displacements,stresses and frequencies correlaled. The accuracy ofthe approximate responses given by the constant andlinear varying scale factors as well as the commonlyused tangent method are compared. In most casespresented, the linearly varying scale factor gave con-siderably better correlation than the constant scalefactor. Both scaling methods gave results that weresuperior to the tangent approximation at a distanceaway from the initial design point. The linear scale fac-tor was demonstrated to give good correlation with the
4

refinedanalysisresultsover a considerable range ofchanges in design variables (up to a factor of 5change).
This linear scaling method provides a new approachfor approximating structural response which shouldprove to be effective when applied in overall designoptimization procedures. Moreover, the method isnot limited to structural applications and can be usedby other disciplines to correlate responses fromdifferent analytical models.
Acknowledgement
The work of the second author was sponsored byNASA grant NAG-I-224.
References
1Haftka, R.T., Gurdal, Z., and Kamat, M.P., Elementsof Structural Optimization, 2nd Edition, KluwerAcademic Publishers Group, Netherlands, 1990.
2Barthelemy, J.-F., and Raftka, R.T., "RecentAdvances in Approximations for Optimum StructuralDesign," NASA TM-104032, 1991.
3Storaasli, O.O., and Sobieszczanski, J., "On theAccuracy of the Taylor Approximation for StructureResizing," AIAA Journal, 12, 1974, pp. 231-233.
JVanderplaats G.N., and Salajeghah, E., "A NewApproximation Method for Stress Constraints inStructural Synthesis," AIAA J., 27, 1989, pp. 352-358.
5joh, C.-Y., Grossman, B. and Haftka, R. T., "EfficientOptimization Procedures for Transonic Airfoil Design,"Presented at the ASME Winter Annual Meeting, SanFrancisco, California, December, 1989.
6Skelton, R.E., Hughes, P.C., and Hablani, H.B.,"Order Reduction for Models 6f Space Structures withModal Cost Analysis," J. Guidance, 5, 1982, pp. 351-357.
c
7Camarda, C.J., Haftka, R.T., and Riley, M.F., "AnEvaluation of Higher-Order Modal Methods forCalculating Transient Structural Response,"Computers and Structures, 27, 1, 1987, pp. 89-101.
8McCuUers, L.A., and Lynch, R.W., "Composite WingDesign for Aeroelastic Tailoring Requirements," AirForce Conference on Fibrous Composites in FlightVehicle Design, 1972.
9Giles, G.L., "Equivalent Plate Analysis of AircraftWing Box Structures with General PTanformGeometry," Journal of Aircraft, Vol. 23, Nov. 1986,pp. 859-864.
iOGiles, G.L., "Further Generalization of an EquivalentPlate Representation for Aircraft Structural Analysis,"Journal of Aircraft, Vol. 26, January, 1989, pp. 67-74.
11Brandt, A., "Multi-level Adaptive Solutions to!Boundary-Value Problems," Math. Comp., 31, 138,1977, pp. 333-390.
12Haftka, R.T., "Combining Global and LocalApproximations," AIAA Journal (in Press).
13Ricketts, R.H., and Sobieszczanski-Sobieski, J.,"Simplified and Refined Structural Modeling forEconomical Flutter Analysis and Design," AIAA PaperNo. 77-421, Presented at the AIAA/ASME/SAE 18thStructures, Structural Dynamics, and MaterialsConference, San Diego, California, March, 1977.
14Stewart, C.B., "The Computational StructuralMechanics Testbed User's Manual," NASA TM-100644, October 1989.
Table 1. Initial variables of the equivalentplates.
Coefficient, inch
Panel no. Co C1 C2 C3
1 0.008 -0.001 -0.001 -0.001II 0.007 -0.001 -0.001 -0.001III 0.006 -0.001 -0.001 -0.001
Table 2. Comparison of analysis results forsimplified and refined analyses.
Displacement yon Mises stress First freq.inch xlO6 I-_
Simplified 13.30 7.48 1.80model
Refined 13.40 8.53 1.74model
5
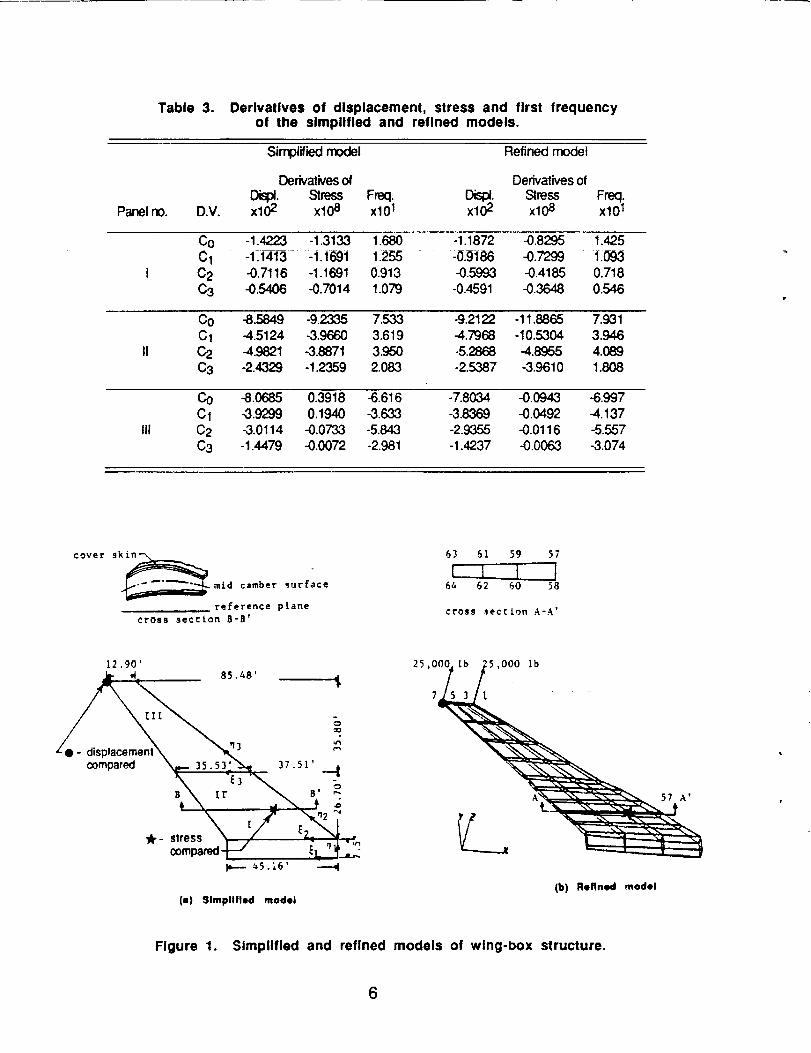
Table 3. Derlvatlves of dlsplacement, stress and first frequencyof the slmpllfied and refined models.
Simpl_,d model Refined model
Panel no.
Derivatives of Derivatives of
x[x_" Stress Freq. Dispt Stress Freq.D.V. xl08 xl01 xl02 xl08 xl01
Co -1.4223 -1.3133 1.680 -1.1872 -0.8295 1.425C! -1,14_3 -i. i=_i i_255 :0.gi86 -0.7299 ii_C2 -0.7116 -1.1691 0.913 -0.5993 -0.4185 0.718C3 -0,5406 -0.7014 1.079 -0.4591 -0.3648 0.546
Co -8.5849 -9.2335 7.533 -9.2122 -11.8865 7.931C1 -4.5124 -3.9660 3.619 4.7968 -10.5304 3.946C2 -4.9821 -3.8871 3.950 -5.2868 -4.8955 4.089C3 -2.4329 -1.2359 2.083 -2.5387 -3.9610 1.808
III
CO -8.0685 0.39i8 -6.616 -7.8034 -0.0943 -6.997C1 -3.9299 0.1940 -3.633 -3.8369 -0.0492 -4.137C2 -3.0114 -0.0733 -5.843 -2.9355 -0.0116 -5.557C3 -1.4479 -0.0072 -2.981 -1.4237 -0.0063 -3.074
cover
.mid camber _urface 64 62 60 58
reference plane cross _eccion A-A'cross secc£on 5-B'
12.90'
compared _ 35.53" "_ 37.51'
'r '3 '_ ,,_
[ q2
compared-I---/ _L "']__,_M--- _5.;6'
(e) Simplified model
!5,0OO Ib
[
(b) Refined model
57 A'
Figure 1. Simplified and refined models of wing-box structure.
6

1.02
1.001
C• 0.98EQtJm 0.96
m
o.94"1=QN 0.92
41
E0.g0
Z
0.88
0.86
;\: -- -- f SI:I.
ftangent_...%1
Is
• I ! • i _ i e
2 3 4 5
Co/co° for panel I
1.1
1.0
e)mo
0.9
"0
N
e_ 0.8Eoz
0.7
0.6
_ SI:iLIFt
fSRC
f tan ge nt
fS
1 _ x , I • I .. ,
2 3 4 5
Co/C o for panel l
Figure 2. Approximations to wing tipdisplacement.
Figure 4. Approximations to von Misesstress at node 59.
1.3
E1.2E
_J
"_ 1.1
o
E'- 1.00
Z
0.9
fs
fsR.
• _nfsliC
f tangent
I | I . , i . I |
2 3 4 5
C 2/C ° for panel II
1.0
0,
0.4 - _ tSRC
fSRL
0.2 ' ' '2 3
C o tC_ for panel II
Figure 3. Approximations to wing tipdisplacement.
Flgure 5. Approximations to yon Misesstress at node 59.
7

1.12
1.10
1.08
P 1.06q,.
1.04
1.0=Z
1.1111
0.g6
j s "°
o'**"
p(i I"
ftangen fSRL• j°
f
2 3 4 5 6
C o/Co° for panel I
E
E4)O
IQ
QN
EO
Z
1.4
1.3
1.2
1.1
1,0
/_/e fRf_
0.9 = I . n I _ I * ! . I ,
0.0 0.1 0.2 0.3 0.4 0.5
Fractional design variable change, S
0.6
Figure 6. Approximations to first frequency. Figure 8. Approximations to wing tip dis-placement for combined changesof variables (see Eq. (6)),
"t.
t
N
Z
O.5
•_ f
-'_ fSl:_":1 !R
tSr¢
l I , 1 l ,
2 3 4 S
C o/co 0 for panel ill
3f S 1fR
2 fSRL
" fs I
:_3 1 _'- ftangent I
Z
. I = • , 1 i 1 . 1 _ •00.0 0.1 0.2 0.3 0.4 0.$ 0.6
Fractional design variable change, 6
Figure 7. Approximations to first frequency. Figure 9. Approximations to yon Misesstress for combined changesof variables (see Eq. (6)).
8

1.1
1"01_
.=_" 0.9
0.8 fS
tangent
Z 0.7 • fR
%._0 ..... ' ' ' ' ' '0. 0.1 0.2 0.3 0.4 0.5 0.15
Fractional design variable change, 8
Figure 10. Approxlmationsto the firstfrequency for combined changesof variables (see Eq. (6)).
9
_w_t Report Documentation Page
1. Report No.
NASA TM- 104042
2. Government Accession No.
4, Title and Subtitle
Sensitivity-Based Scaling for Correlating Structural Responsefrom Different Analytical Models
7. Author(s) Kwan J. Chang *Raphael T. Haftka **Gary L. GilesPi-Jen Kao ***
9. Performing Organization Name and Address
NASA Langley Research Center
Hampton, Virginia 23665-5225
12. Sponsoring Agency Name and Address
National Aeronautics and Space AdministrationWashington, DC 20546
3. Recipient's Catalog No.
5. Report Date
February 199 1
6. Performing Organization Code
8. Performing Organization Report No.
10. Work Unit No.
505-63-50-0611. Contract or Grant No.
13. Type of Report and Period Covered
Technical Memorandum
14. Sponsoring Agency Code
15. Sup_ementary Notes
Presented at 32nd Structures, Structural Dynamics and Materials (SDM)Conference,Baltimore, MD., April 8-10, 1991. AIAA Paper No. 91-0925.
* Lockheed Engineering and Science Co., Hampton, VA.*" Virginia Polytechnic Instilule andState University, Blacksburg, VA.*'" AnalyticalServices and Materials, Inc., Hampton, VA
16. Abstract
Paper presents a sensitivity-based linearly varying scale factor used to reconcile results from
refined models for analysis of the same structure. The improved accuracy of the linear scale
factor compared to a constant scale factor as well as the commonly used tangent approxi-
mation is demonstrated. A wing box structure is used as an example, with displacements,stresses and frequencies correlated. The linear scale factor could permit the use of a
simplified model in an optimization procedure during preliminary design to approximate theresponse given by a refined model over a considerable range of design changes.
17. Key Words (Suggested by Author(s))
Structural Sensitivity
ApproximationCorrelation
Scaling
19. Security ClaM.if. (of this report)
Unclassified
NASA FORM 16211 OCT 86
20, Security Classif. {of this page)Unclassified
18. Distribution Statement
Unclassified- Unlimited
21 No. of pages I 22 Price10 A02
Star Category 39