NAPLAN 2014 Outcomes: all Queensland schools · 2015-09-24 · Year level (3, 5, 7, 9) Shows the...
151
For all Queensland schools www.qcaa.qld.edu.au 2014 NAPLAN Outcomes All Schools NAPLAN 2014 Outcomes All Queensland Schools December 2014
Transcript of NAPLAN 2014 Outcomes: all Queensland schools · 2015-09-24 · Year level (3, 5, 7, 9) Shows the...

For all Queensland schoolswww.qcaa.qld.edu.au
2014 NAPLAN Outcomes
All Schools
NAPLAN 2014 OutcomesAll Queensland Schools
December 2014

2014 NAPLAN Outcomes
All SchoolsIntroductionThe following report shows Queensland student achievement inthe 2014 NAPLAN tests on a school-by-school basis.
The data provides only a snapshot of the school’s results in theareas of literacy and numeracy. For comprehensive informationabout a school or your child’s achievements at school, contactthe school directly. Detailed reports on individual studentachievement are sent to parents by schools each year.
Additional information can be found at the NAPLAN website:www.nap.edu.au
Reading the tableSchool
Shows the name of the school
Locality
Shows the city, town or suburb where the school is located.
Year level enrolments
Shows the total enrolments in the year level at the time theNAPLAN tests were undertaken.
Year level (3, 5, 7, 9)
Shows the year level of the students tested.
Average score of the school
Shows the average scale score of students at the school.
Raw scores are transformed into scale scores that allowcomparison of students between year levels and in the future,across years.
Percentage of students at or above National MinimumStandard (NMS)
Shows the percentage of students at or above the NationalMinimum Standards in literacy and numeracy for a given yearlevel.
Reading (READ)
Students read a variety of texts and respond to multiple-choiceand constructed reponse questions which assess variousaspects of reading such as:
• locating information• interpreting information• analysing and evaluating information• applying information.
Writing (WRIT)
Students write a persuasive essay to demonstrate theirknowledge and mastery of written language.
In 2014 the task was a persuasive essay, as it was from 2011 to2013. The results from these four years can therefore becompared with each other.
From 2008 to 2010, students wrote a narrative text. NAPLAN’snarrative and non-narrative writing tasks test different aspects ofwhat is taught in the curriculum, so the 2011–2014 resultscannot be usefully compared with the results of the narrativemarking from 2008–2010.
Spelling (SPEL)
Spelling requires students to do two things: correct an identifiedmisspelt word and find and correct an unidentified misspelt word.
Grammar and Punctuation (GP)
Grammar items require students to answer multiple-choicequestions relating to grammar, such as subject-verb agreement,tense and parts of speech.
Punctuation items require students to recognise correctpunctuation and to accurately insert punctuation.
Numeracy (NMCY)
Students are tested in the key areas of:
• number• algebra, function and pattern• measurement, chance and data• space.
They are asked to respond to multiple-choice and constructedresponse questions.

Year level enrolments Year 3 Year 5 Year 7 Year 9
School Locality Yr 3 Yr 5 Yr 7 Yr 9 READ WRIT SPEL GP NMCY READ WRIT SPEL GP NMCY READ WRIT SPEL GP NMCY READ WRIT SPEL GP NMCY
A B Paterson College Arundel 102 103 109 112
Average score of the school 478 459 469 499 457 552 524 537 565 532 591 552 579 594 592 625 620 615 624 624
Percentage (%) of students at or above NMS 98% 98% 99% 99% 100% 100% 97% 100% 100% 99% 100% 98% 100% 100% 100% 99% 96% 97% 99% 100%
Abercorn State School Abercorn 3 3 1 –
Average score of the school ∧ ∧ ∧ ∧ ∧ ∧ ∧ ∧ ∧ ∧ ∧ ∧ ∧ ∧ ∧ – – – – –
Percentage (%) of students at or above NMS ∧ ∧ ∧ ∧ ∧ ∧ ∧ ∧ ∧ ∧ ∧ ∧ ∧ ∧ ∧ – – – – –
Abergowrie State School Abergowrie – 2 – –
Average score of the school – – – – – ∧ ∧ ∧ ∧ ∧ – – – – – – – – – –
Percentage (%) of students at or above NMS – – – – – ∧ ∧ ∧ ∧ ∧ – – – – – – – – – –
Aboriginal and Islander Independent
Community School
Acacia Ridge 3 13 3 15
Average score of the school ∧ ∧ ∧ ∧ ∧ 391 363 440 408 377 ∧ ∧ ∧ ∧ ∧ 485 407 524 488 494
Percentage (%) of students at or above NMS ∧ ∧ ∧ ∧ ∧ 45% 22% 89% 44% 36% ∧ ∧ ∧ ∧ ∧ 69% 38% 86% 57% 69%
Acacia Ridge State School Acacia Ridge 35 27 22 –
Average score of the school 371 390 371 380 361 431 428 454 436 430 491 507 529 505 519 – – – – –
Percentage (%) of students at or above NMS 88% 85% 73% 82% 85% 67% 67% 78% 74% 70% 68% 90% 70% 80% 84% – – – – –
Agnes Water State School Agnes Water 34 38 26 –
Average score of the school 387 374 371 408 374 510 451 487 510 490 537 458 526 535 555 – – – – –
Percentage (%) of students at or above NMS 87% 90% 90% 97% 90% 100% 85% 94% 97% 94% 96% 83% 92% 96% 100% – – – – –
Agnew School Wakerley 18 14 13 12
Average score of the school 435 393 394 430 418 545 467 503 550 493 541 513 546 546 550 611 589 630 600 619
Percentage (%) of students at or above NMS 94% 100% 89% 94% 100% 100% 100% 100% 100% 93% 92% 92% 85% 92% 92% 100% 92% 100% 100% 100%
Agnew School (Darling Downs) Toowoomba 9 7 7 12
Average score of the school 436 373 422 449 440 530 472 545 548 532 589 523 539 591 593 575 549 568 567 632
Percentage (%) of students at or above NMS 89% 89% 100% 100% 100% 100% 100% 100% 86% 100% 100% 86% 86% 100% 100% 92% 92% 100% 92% 100%
Agnew School (Nambour) Nambour Heights 10 2 2 8
Average score of the school 469 425 452 455 454 ∧ ∧ ∧ ∧ ∧ ∧ ∧ ∧ ∧ ∧ 621 580 626 600 642
Percentage (%) of students at or above NMS 100% 100% 100% 100% 100% ∧ ∧ ∧ ∧ ∧ ∧ ∧ ∧ ∧ ∧ 100% 100% 100% 100% 100%
Agnew School (Wide Bay) Maryborough 4 5 3 7
Average score of the school ∧ ∧ ∧ ∧ ∧ 602 472 552 583 525 ∧ ∧ ∧ ∧ ∧ 622 567 608 556 603
Percentage (%) of students at or above NMS ∧ ∧ ∧ ∧ ∧ 100% 100% 100% 100% 100% ∧ ∧ ∧ ∧ ∧ 100% 86% 100% 100% 100%
Airville State School Airville via Ayr 3 2 1 –
Average score of the school ∧ ∧ ∧ ∧ ∧ ∧ ∧ ∧ ∧ ∧ ∧ ∧ ∧ ∧ ∧ – – – – –
Percentage (%) of students at or above NMS ∧ ∧ ∧ ∧ ∧ ∧ ∧ ∧ ∧ ∧ ∧ ∧ ∧ ∧ ∧ – – – – –
KEY∧ to maintain privacy of individual student information, where there are fewer than five students tested results are not provided∗ no students in the year level sat the test due to absence, exemption or withdrawal– no students in the year levelNMS National Minimum Standard (for further information see www.nap.edu.au)
Queensland Curriculum & Assessment Authority
Page 1 of 149
NAPLAN 2014 Outcomes — All Queensland schools
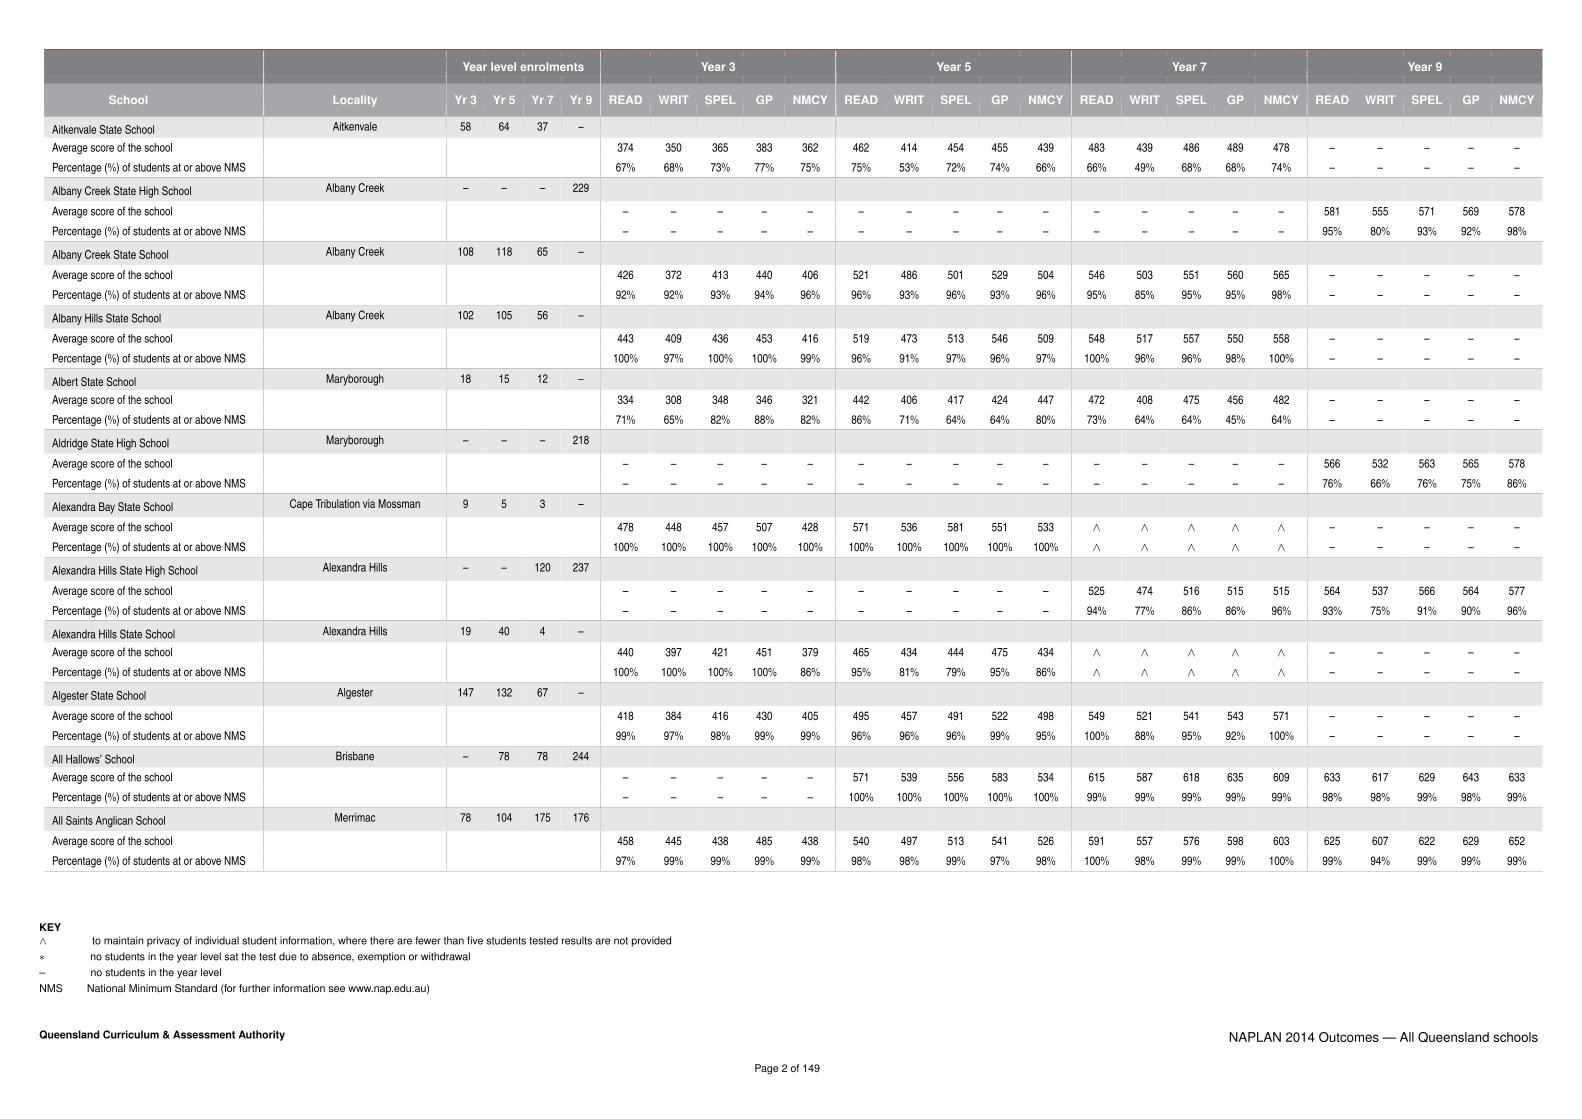
Year level enrolments Year 3 Year 5 Year 7 Year 9
School Locality Yr 3 Yr 5 Yr 7 Yr 9 READ WRIT SPEL GP NMCY READ WRIT SPEL GP NMCY READ WRIT SPEL GP NMCY READ WRIT SPEL GP NMCY
Aitkenvale State School Aitkenvale 58 64 37 –
Average score of the school 374 350 365 383 362 462 414 454 455 439 483 439 486 489 478 – – – – –
Percentage (%) of students at or above NMS 67% 68% 73% 77% 75% 75% 53% 72% 74% 66% 66% 49% 68% 68% 74% – – – – –
Albany Creek State High School Albany Creek – – – 229
Average score of the school – – – – – – – – – – – – – – – 581 555 571 569 578
Percentage (%) of students at or above NMS – – – – – – – – – – – – – – – 95% 80% 93% 92% 98%
Albany Creek State School Albany Creek 108 118 65 –
Average score of the school 426 372 413 440 406 521 486 501 529 504 546 503 551 560 565 – – – – –
Percentage (%) of students at or above NMS 92% 92% 93% 94% 96% 96% 93% 96% 93% 96% 95% 85% 95% 95% 98% – – – – –
Albany Hills State School Albany Creek 102 105 56 –
Average score of the school 443 409 436 453 416 519 473 513 546 509 548 517 557 550 558 – – – – –
Percentage (%) of students at or above NMS 100% 97% 100% 100% 99% 96% 91% 97% 96% 97% 100% 96% 96% 98% 100% – – – – –
Albert State School Maryborough 18 15 12 –
Average score of the school 334 308 348 346 321 442 406 417 424 447 472 408 475 456 482 – – – – –
Percentage (%) of students at or above NMS 71% 65% 82% 88% 82% 86% 71% 64% 64% 80% 73% 64% 64% 45% 64% – – – – –
Aldridge State High School Maryborough – – – 218
Average score of the school – – – – – – – – – – – – – – – 566 532 563 565 578
Percentage (%) of students at or above NMS – – – – – – – – – – – – – – – 76% 66% 76% 75% 86%
Alexandra Bay State School Cape Tribulation via Mossman 9 5 3 –
Average score of the school 478 448 457 507 428 571 536 581 551 533 ∧ ∧ ∧ ∧ ∧ – – – – –
Percentage (%) of students at or above NMS 100% 100% 100% 100% 100% 100% 100% 100% 100% 100% ∧ ∧ ∧ ∧ ∧ – – – – –
Alexandra Hills State High School Alexandra Hills – – 120 237
Average score of the school – – – – – – – – – – 525 474 516 515 515 564 537 566 564 577
Percentage (%) of students at or above NMS – – – – – – – – – – 94% 77% 86% 86% 96% 93% 75% 91% 90% 96%
Alexandra Hills State School Alexandra Hills 19 40 4 –
Average score of the school 440 397 421 451 379 465 434 444 475 434 ∧ ∧ ∧ ∧ ∧ – – – – –
Percentage (%) of students at or above NMS 100% 100% 100% 100% 86% 95% 81% 79% 95% 86% ∧ ∧ ∧ ∧ ∧ – – – – –
Algester State School Algester 147 132 67 –
Average score of the school 418 384 416 430 405 495 457 491 522 498 549 521 541 543 571 – – – – –
Percentage (%) of students at or above NMS 99% 97% 98% 99% 99% 96% 96% 96% 99% 95% 100% 88% 95% 92% 100% – – – – –
All Hallows’ School Brisbane – 78 78 244
Average score of the school – – – – – 571 539 556 583 534 615 587 618 635 609 633 617 629 643 633
Percentage (%) of students at or above NMS – – – – – 100% 100% 100% 100% 100% 99% 99% 99% 99% 99% 98% 98% 99% 98% 99%
All Saints Anglican School Merrimac 78 104 175 176
Average score of the school 458 445 438 485 438 540 497 513 541 526 591 557 576 598 603 625 607 622 629 652
Percentage (%) of students at or above NMS 97% 99% 99% 99% 99% 98% 98% 99% 97% 98% 100% 98% 99% 99% 100% 99% 94% 99% 99% 99%
KEY∧ to maintain privacy of individual student information, where there are fewer than five students tested results are not provided∗ no students in the year level sat the test due to absence, exemption or withdrawal– no students in the year levelNMS National Minimum Standard (for further information see www.nap.edu.au)
Queensland Curriculum & Assessment Authority
Page 2 of 149
NAPLAN 2014 Outcomes — All Queensland schools

Year level enrolments Year 3 Year 5 Year 7 Year 9
School Locality Yr 3 Yr 5 Yr 7 Yr 9 READ WRIT SPEL GP NMCY READ WRIT SPEL GP NMCY READ WRIT SPEL GP NMCY READ WRIT SPEL GP NMCY
All Saints Primary School (Albany Creek) Albany Creek 107 79 42 –
Average score of the school 427 406 398 443 404 514 498 519 518 496 571 549 556 579 552 – – – – –
Percentage (%) of students at or above NMS 98% 99% 98% 99% 100% 99% 97% 100% 99% 96% 100% 95% 95% 100% 100% – – – – –
All Saints’ School Boonah 28 31 14 –
Average score of the school 388 396 354 390 351 506 480 493 504 501 546 522 556 563 545 – – – – –
Percentage (%) of students at or above NMS 92% 100% 92% 92% 92% 100% 100% 96% 96% 100% 100% 92% 100% 92% 100% – – – – –
All Souls St Gabriels School Charters Towers 15 13 15 57
Average score of the school 378 373 388 410 369 483 459 457 453 466 552 505 513 531 519 549 502 533 548 564
Percentage (%) of students at or above NMS 79% 100% 93% 93% 100% 85% 92% 85% 92% 92% 100% 93% 93% 100% 100% 75% 56% 76% 82% 89%
Allenstown State School Rockhampton 45 48 43 –
Average score of the school 364 360 362 364 336 461 408 457 446 423 522 463 513 506 504 – – – – –
Percentage (%) of students at or above NMS 74% 85% 76% 78% 78% 80% 70% 82% 78% 70% 83% 68% 80% 83% 83% – – – – –
Alligator Creek State School Alligator Creek via Mackay 52 42 44 –
Average score of the school 423 421 395 448 400 481 464 466 485 464 521 473 527 526 527 – – – – –
Percentage (%) of students at or above NMS 100% 98% 100% 100% 100% 98% 90% 90% 90% 95% 95% 86% 93% 93% 100% – – – – –
Allora State School Allora 27 16 14 19
Average score of the school 381 368 373 377 362 475 451 496 503 455 513 472 495 501 496 548 508 559 550 567
Percentage (%) of students at or above NMS 92% 92% 88% 92% 88% 94% 94% 88% 100% 94% 80% 91% 82% 91% 100% 94% 71% 94% 76% 95%
Alloway State School Bundaberg 6 6 6 –
Average score of the school 426 392 443 463 434 457 402 483 489 467 483 466 479 515 512 – – – – –
Percentage (%) of students at or above NMS 100% 100% 100% 100% 100% 80% 80% 80% 100% 80% 80% 80% 80% 100% 100% – – – – –
Aloomba State School Aloomba 7 12 1 –
Average score of the school 456 398 429 445 439 502 497 507 535 501 ∧ ∧ ∧ ∧ ∧ – – – – –
Percentage (%) of students at or above NMS 100% 100% 100% 100% 100% 100% 92% 92% 100% 100% ∧ ∧ ∧ ∧ ∧ – – – – –
Alpha State School Alpha 5 9 10 7
Average score of the school 432 328 421 427 404 522 500 530 551 519 526 491 548 533 519 583 554 579 607 573
Percentage (%) of students at or above NMS 100% 80% 100% 80% 100% 100% 100% 100% 100% 100% 100% 90% 100% 90% 100% 71% 57% 71% 71% 100%
Amamoor State School Amamoor 11 8 7 –
Average score of the school 368 372 375 404 415 470 459 429 452 470 545 507 506 525 536 – – – – –
Percentage (%) of students at or above NMS 73% 100% 100% 91% 91% 75% 88% 88% 75% 88% 71% 71% 71% 71% 71% – – – – –
Amberley District State School Yamanto 99 96 30 –
Average score of the school 409 368 400 426 391 479 437 475 479 464 514 508 546 518 515 – – – – –
Percentage (%) of students at or above NMS 91% 84% 91% 94% 90% 90% 79% 84% 85% 80% 93% 93% 97% 90% 97% – – – – –
Ambrose State School Ambrose 14 11 4 –
Average score of the school 449 426 454 437 476 465 459 478 464 481 ∧ ∧ ∧ ∧ ∧ – – – – –
Percentage (%) of students at or above NMS 100% 100% 100% 100% 100% 91% 91% 100% 91% 100% ∧ ∧ ∧ ∧ ∧ – – – – –
KEY∧ to maintain privacy of individual student information, where there are fewer than five students tested results are not provided∗ no students in the year level sat the test due to absence, exemption or withdrawal– no students in the year levelNMS National Minimum Standard (for further information see www.nap.edu.au)
Queensland Curriculum & Assessment Authority
Page 3 of 149
NAPLAN 2014 Outcomes — All Queensland schools

Year level enrolments Year 3 Year 5 Year 7 Year 9
School Locality Yr 3 Yr 5 Yr 7 Yr 9 READ WRIT SPEL GP NMCY READ WRIT SPEL GP NMCY READ WRIT SPEL GP NMCY READ WRIT SPEL GP NMCY
Amiens State School Amiens 6 8 5 –
Average score of the school 334 319 323 378 357 462 365 425 449 433 495 481 494 521 494 – – – – –
Percentage (%) of students at or above NMS 83% 83% 83% 100% 100% 88% 63% 75% 88% 88% 80% 80% 80% 80% 100% – – – – –
Anakie State School Anakie 13 10 12 –
Average score of the school 393 396 373 455 344 488 436 456 492 447 541 524 535 553 524 – – – – –
Percentage (%) of students at or above NMS 83% 100% 83% 100% 82% 100% 89% 89% 100% 89% 91% 82% 91% 100% 100% – – – – –
Ananda Marga River School Maleny 17 11 12 –
Average score of the school 379 335 362 354 360 520 469 506 517 505 590 555 568 588 572 – – – – –
Percentage (%) of students at or above NMS 81% 94% 100% 75% 100% 100% 100% 100% 86% 100% 100% 100% 100% 100% 100% – – – – –
Andergrove State School Andergrove 43 45 27 –
Average score of the school 384 358 394 433 375 487 438 487 508 491 523 487 546 536 541 – – – – –
Percentage (%) of students at or above NMS 90% 92% 98% 95% 90% 88% 88% 95% 98% 100% 100% 84% 100% 96% 96% – – – – –
Anglican Church Grammar School East Brisbane 46 111 153 228
Average score of the school 464 444 437 466 462 535 503 516 546 533 587 536 563 591 614 623 606 607 613 646
Percentage (%) of students at or above NMS 100% 100% 98% 100% 100% 100% 97% 100% 100% 100% 100% 97% 97% 99% 100% 99% 98% 96% 97% 100%
Annandale Christian College Annandale 52 48 30 53
Average score of the school 427 404 414 432 404 497 464 507 525 494 577 513 542 571 578 597 554 577 593 582
Percentage (%) of students at or above NMS 96% 90% 94% 96% 98% 96% 90% 98% 98% 96% 100% 90% 86% 100% 100% 96% 85% 91% 85% 98%
Annandale State School Annandale 125 94 61 –
Average score of the school 422 401 413 441 399 517 473 500 524 492 544 475 534 530 534 – – – – –
Percentage (%) of students at or above NMS 96% 95% 96% 96% 97% 93% 83% 88% 90% 93% 96% 84% 91% 86% 95% – – – – –
Applethorpe State School Applethorpe 1 4 3 –
Average score of the school ∧ ∗ ∗ ∗ ∧ ∧ ∧ ∧ ∧ ∧ ∧ ∧ ∧ ∧ ∧ – – – – –
Percentage (%) of students at or above NMS ∧ ∗ ∗ ∗ ∧ ∧ ∧ ∧ ∧ ∧ ∧ ∧ ∧ ∧ ∧ – – – – –
Aquinas College Southport – – – 220
Average score of the school – – – – – – – – – – – – – – – 580 561 584 574 584
Percentage (%) of students at or above NMS – – – – – – – – – – – – – – – 98% 90% 95% 93% 97%
Aramac State School Aramac 8 2 2 4
Average score of the school 301 316 274 308 340 ∧ ∧ ∧ ∧ ∧ ∧ ∧ ∧ ∧ ∧ ∧ ∧ ∧ ∧ ∧Percentage (%) of students at or above NMS 50% 75% 38% 50% 100% ∧ ∧ ∧ ∧ ∧ ∧ ∧ ∧ ∧ ∧ ∧ ∧ ∧ ∧ ∧
Aratula State School Aratula 5 5 1 –
Average score of the school ∧ ∧ ∧ ∧ ∧ ∧ ∧ ∧ ∧ ∧ ∧ ∧ ∧ ∧ ∧ – – – – –
Percentage (%) of students at or above NMS ∧ ∧ ∧ ∧ ∧ ∧ ∧ ∧ ∧ ∧ ∧ ∧ ∧ ∧ ∧ – – – – –
Arcadia Valley State School Arcadia Valley via Injune – 1 – –
Average score of the school – – – – – ∧ ∧ ∧ ∧ ∧ – – – – – – – – – –
Percentage (%) of students at or above NMS – – – – – ∧ ∧ ∧ ∧ ∧ – – – – – – – – – –
KEY∧ to maintain privacy of individual student information, where there are fewer than five students tested results are not provided∗ no students in the year level sat the test due to absence, exemption or withdrawal– no students in the year levelNMS National Minimum Standard (for further information see www.nap.edu.au)
Queensland Curriculum & Assessment Authority
Page 4 of 149
NAPLAN 2014 Outcomes — All Queensland schools

Year level enrolments Year 3 Year 5 Year 7 Year 9
School Locality Yr 3 Yr 5 Yr 7 Yr 9 READ WRIT SPEL GP NMCY READ WRIT SPEL GP NMCY READ WRIT SPEL GP NMCY READ WRIT SPEL GP NMCY
Arethusa College Deception Bay – – – 17
Average score of the school – – – – – – – – – – – – – – – 467 264 459 434 469
Percentage (%) of students at or above NMS – – – – – – – – – – – – – – – 33% 0% 40% 30% 67%
Arundel State School Arundel 158 125 86 –
Average score of the school 418 375 416 440 400 512 453 514 512 498 541 532 535 551 555 – – – – –
Percentage (%) of students at or above NMS 91% 88% 94% 93% 95% 93% 83% 93% 92% 95% 94% 90% 93% 98% 96% – – – – –
Ascot State School Ascot 124 102 44 –
Average score of the school 455 417 441 485 437 551 496 525 545 520 559 533 547 557 561 – – – – –
Percentage (%) of students at or above NMS 100% 98% 99% 100% 99% 100% 97% 100% 99% 99% 100% 95% 95% 98% 98% – – – – –
Ashgrove State School Ashgrove 103 101 46 –
Average score of the school 491 433 457 504 464 571 527 541 580 545 598 558 570 592 610 – – – – –
Percentage (%) of students at or above NMS 100% 99% 100% 100% 100% 99% 100% 100% 100% 100% 100% 98% 96% 98% 100% – – – – –
Ashmore State School Ashmore 122 99 42 –
Average score of the school 420 411 416 450 431 535 496 513 536 509 564 531 545 566 572 – – – – –
Percentage (%) of students at or above NMS 96% 96% 95% 96% 97% 98% 94% 99% 98% 95% 97% 89% 95% 95% 100% – – – – –
Ashwell State School Ashwell via Rosewood 10 5 – –
Average score of the school 438 387 391 427 412 ∧ ∧ ∧ ∧ ∧ – – – – – – – – – –
Percentage (%) of students at or above NMS 100% 100% 100% 100% 100% ∧ ∧ ∧ ∧ ∧ – – – – – – – – – –
Aspley East State School Aspley 103 122 57 –
Average score of the school 426 404 424 464 419 500 450 492 508 493 559 502 556 567 566 – – – – –
Percentage (%) of students at or above NMS 96% 96% 94% 97% 98% 94% 84% 95% 97% 97% 100% 89% 100% 95% 98% – – – – –
Aspley Special School Aspley – – 12 19
Average score of the school – – – – – – – – – – ∗ ∗ ∗ ∗ ∗ ∗ ∗ ∗ ∗ ∗Percentage (%) of students at or above NMS – – – – – – – – – – ∗ ∗ ∗ ∗ ∗ ∗ ∗ ∗ ∗ ∗
Aspley State High School Aspley – – – 124
Average score of the school – – – – – – – – – – – – – – – 569 545 568 556 577
Percentage (%) of students at or above NMS – – – – – – – – – – – – – – – 92% 80% 91% 86% 98%
Aspley State School Aspley 85 97 43 –
Average score of the school 426 395 413 431 410 515 458 499 511 503 566 537 565 579 583 – – – – –
Percentage (%) of students at or above NMS 94% 96% 98% 95% 95% 97% 89% 97% 98% 97% 98% 98% 95% 100% 98% – – – – –
Assisi Catholic College Upper Coomera 84 84 106 143
Average score of the school 411 405 403 422 393 508 480 509 501 479 539 521 546 530 527 573 565 579 558 571
Percentage (%) of students at or above NMS 98% 97% 100% 99% 100% 96% 95% 100% 96% 99% 97% 96% 99% 92% 99% 93% 90% 96% 90% 100%
Assumption College Warwick – – – 83
Average score of the school – – – – – – – – – – – – – – – 573 558 572 574 581
Percentage (%) of students at or above NMS – – – – – – – – – – – – – – – 97% 90% 95% 92% 99%
KEY∧ to maintain privacy of individual student information, where there are fewer than five students tested results are not provided∗ no students in the year level sat the test due to absence, exemption or withdrawal– no students in the year levelNMS National Minimum Standard (for further information see www.nap.edu.au)
Queensland Curriculum & Assessment Authority
Page 5 of 149
NAPLAN 2014 Outcomes — All Queensland schools

Year level enrolments Year 3 Year 5 Year 7 Year 9
School Locality Yr 3 Yr 5 Yr 7 Yr 9 READ WRIT SPEL GP NMCY READ WRIT SPEL GP NMCY READ WRIT SPEL GP NMCY READ WRIT SPEL GP NMCY
Atherton State High School Atherton – – – 137
Average score of the school – – – – – – – – – – – – – – – 567 519 551 550 565
Percentage (%) of students at or above NMS – – – – – – – – – – – – – – – 87% 69% 80% 82% 93%
Atherton State School Atherton 68 73 54 –
Average score of the school 393 377 379 405 379 464 402 439 463 455 524 460 508 522 519 – – – – –
Percentage (%) of students at or above NMS 93% 94% 88% 97% 91% 82% 62% 80% 77% 85% 91% 81% 85% 91% 100% – – – – –
Augathella State School Augathella 6 6 – –
Average score of the school ∧ 357 370 360 ∧ 496 467 438 474 442 – – – – – – – – – –
Percentage (%) of students at or above NMS ∧ 83% 83% 67% ∧ 100% 100% 83% 100% 100% – – – – – – – – – –
Augusta State School Augustine Heights 95 48 22 –
Average score of the school 380 348 366 378 367 469 419 459 469 452 510 494 502 530 498 – – – – –
Percentage (%) of students at or above NMS 90% 88% 89% 92% 93% 91% 76% 81% 90% 91% 83% 89% 89% 83% 100% – – – – –
Aurukun Campus of CYAAA Aurukun 23 20 14 –
Average score of the school 252 199 248 277 265 322 307 407 339 337 371 264 428 368 421 – – – – –
Percentage (%) of students at or above NMS 48% 30% 43% 61% 63% 25% 8% 75% 25% 0% 9% 0% 46% 31% 45% – – – – –
Australian Christian College - Moreton Caboolture 28 32 24 39
Average score of the school 400 348 380 377 387 469 434 463 485 455 557 499 553 559 543 556 491 538 561 556
Percentage (%) of students at or above NMS 96% 92% 96% 85% 92% 76% 73% 87% 83% 83% 100% 91% 100% 100% 95% 85% 70% 74% 85% 97%
Australian International Islamic College Durack 47 47 25 20
Average score of the school 404 397 440 437 415 456 437 507 489 456 537 546 598 545 525 552 536 579 547 544
Percentage (%) of students at or above NMS 86% 82% 83% 86% 85% 87% 80% 88% 85% 83% 85% 79% 85% 80% 79% 90% 80% 100% 85% 95%
Australian International Islamic College -
Carrara
Carrara 7 1 4 7
Average score of the school 360 413 424 380 380 ∧ ∧ ∧ ∧ ∧ ∧ ∧ ∧ ∧ ∧ 553 489 530 539 524
Percentage (%) of students at or above NMS 86% 100% 100% 100% 100% ∧ ∧ ∧ ∧ ∧ ∧ ∧ ∧ ∧ ∧ 100% 71% 71% 86% 100%
Australian International School United Arab Emirates 102 100 54 51
Average score of the school 380 369 408 382 379 454 454 491 464 460 526 507 553 526 513 575 566 608 589 573
Percentage (%) of students at or above NMS 89% 96% 93% 93% 93% 88% 87% 89% 81% 90% 96% 96% 100% 98% 98% 96% 92% 94% 86% 98%
Aviation High Clayfield – – – 69
Average score of the school – – – – – – – – – – – – – – – 583 540 589 580 598
Percentage (%) of students at or above NMS – – – – – – – – – – – – – – – 95% 85% 95% 98% 98%
Avoca State School Bundaberg 61 51 43 –
Average score of the school 405 394 389 428 390 440 411 445 455 449 523 494 523 525 523 – – – – –
Percentage (%) of students at or above NMS 98% 98% 95% 95% 100% 73% 67% 85% 80% 81% 98% 95% 95% 95% 98% – – – – –
KEY∧ to maintain privacy of individual student information, where there are fewer than five students tested results are not provided∗ no students in the year level sat the test due to absence, exemption or withdrawal– no students in the year levelNMS National Minimum Standard (for further information see www.nap.edu.au)
Queensland Curriculum & Assessment Authority
Page 6 of 149
NAPLAN 2014 Outcomes — All Queensland schools

Year level enrolments Year 3 Year 5 Year 7 Year 9
School Locality Yr 3 Yr 5 Yr 7 Yr 9 READ WRIT SPEL GP NMCY READ WRIT SPEL GP NMCY READ WRIT SPEL GP NMCY READ WRIT SPEL GP NMCY
Avondale State School Avondale 3 4 – –
Average score of the school ∧ ∧ ∧ ∧ ∧ ∧ ∧ ∧ ∧ ∧ – – – – – – – – – –
Percentage (%) of students at or above NMS ∧ ∧ ∧ ∧ ∧ ∧ ∧ ∧ ∧ ∧ – – – – – – – – – –
Ayr East State School Ayr 92 79 50 –
Average score of the school 381 391 386 407 361 477 467 474 497 479 532 505 524 557 542 – – – – –
Percentage (%) of students at or above NMS 88% 96% 93% 94% 90% 92% 95% 96% 99% 97% 91% 91% 89% 91% 100% – – – – –
Ayr State High School Ayr – – – 114
Average score of the school – – – – – – – – – – – – – – – 555 536 556 548 567
Percentage (%) of students at or above NMS – – – – – – – – – – – – – – – 86% 76% 86% 78% 97%
Ayr State School Ayr 21 24 17 –
Average score of the school 332 261 299 226 325 378 331 403 407 409 481 431 469 475 479 – – – – –
Percentage (%) of students at or above NMS 79% 53% 63% 47% 89% 46% 38% 67% 58% 61% 71% 65% 59% 65% 65% – – – – –
Babinda State School Babinda 13 12 10 25
Average score of the school 386 404 406 416 366 484 432 503 475 464 541 518 576 527 581 574 548 588 581 591
Percentage (%) of students at or above NMS 77% 92% 85% 92% 85% 91% 73% 91% 91% 91% 100% 100% 100% 89% 100% 86% 77% 91% 82% 100%
Back Plains State School Back Plains 2 4 – –
Average score of the school ∧ ∧ ∧ ∧ ∧ ∧ ∧ ∧ ∧ ∧ – – – – – – – – – –
Percentage (%) of students at or above NMS ∧ ∧ ∧ ∧ ∧ ∧ ∧ ∧ ∧ ∧ – – – – – – – – – –
Badu Island State School via Thursday Island 21 23 23 –
Average score of the school 284 312 323 296 296 383 347 448 360 369 479 438 532 461 534 – – – – –
Percentage (%) of students at or above NMS 50% 84% 79% 74% 70% 59% 27% 82% 36% 50% 87% 65% 100% 78% 96% – – – – –
Bajool State School Bajool 4 5 1 –
Average score of the school ∧ ∧ ∧ ∧ ∧ 573 402 529 616 513 ∧ ∧ ∧ ∧ ∧ – – – – –
Percentage (%) of students at or above NMS ∧ ∧ ∧ ∧ ∧ 100% 80% 100% 100% 100% ∧ ∧ ∧ ∧ ∧ – – – – –
Balaclava State School Cairns 39 40 20 –
Average score of the school 329 324 358 313 312 404 400 439 411 385 480 427 493 452 475 – – – – –
Percentage (%) of students at or above NMS 69% 85% 82% 74% 82% 63% 65% 70% 65% 55% 85% 55% 75% 55% 75% – – – – –
Bald Hills State School Bald Hills 103 81 37 –
Average score of the school 420 407 415 436 394 533 467 497 522 502 541 501 531 535 550 – – – – –
Percentage (%) of students at or above NMS 93% 97% 95% 93% 96% 99% 87% 96% 96% 97% 100% 92% 100% 97% 100% – – – – –
Ballandean State School Ballandean 8 6 14 –
Average score of the school ∧ ∧ ∧ ∧ ∧ 518 492 437 465 ∧ 541 523 561 518 571 – – – – –
Percentage (%) of students at or above NMS ∧ ∧ ∧ ∧ ∧ 80% 100% 83% 83% ∧ 100% 100% 93% 93% 100% – – – – –
Balmoral State High School Morningside – – – 91
Average score of the school – – – – – – – – – – – – – – – 573 548 581 556 561
Percentage (%) of students at or above NMS – – – – – – – – – – – – – – – 94% 83% 97% 85% 97%
KEY∧ to maintain privacy of individual student information, where there are fewer than five students tested results are not provided∗ no students in the year level sat the test due to absence, exemption or withdrawal– no students in the year levelNMS National Minimum Standard (for further information see www.nap.edu.au)
Queensland Curriculum & Assessment Authority
Page 7 of 149
NAPLAN 2014 Outcomes — All Queensland schools
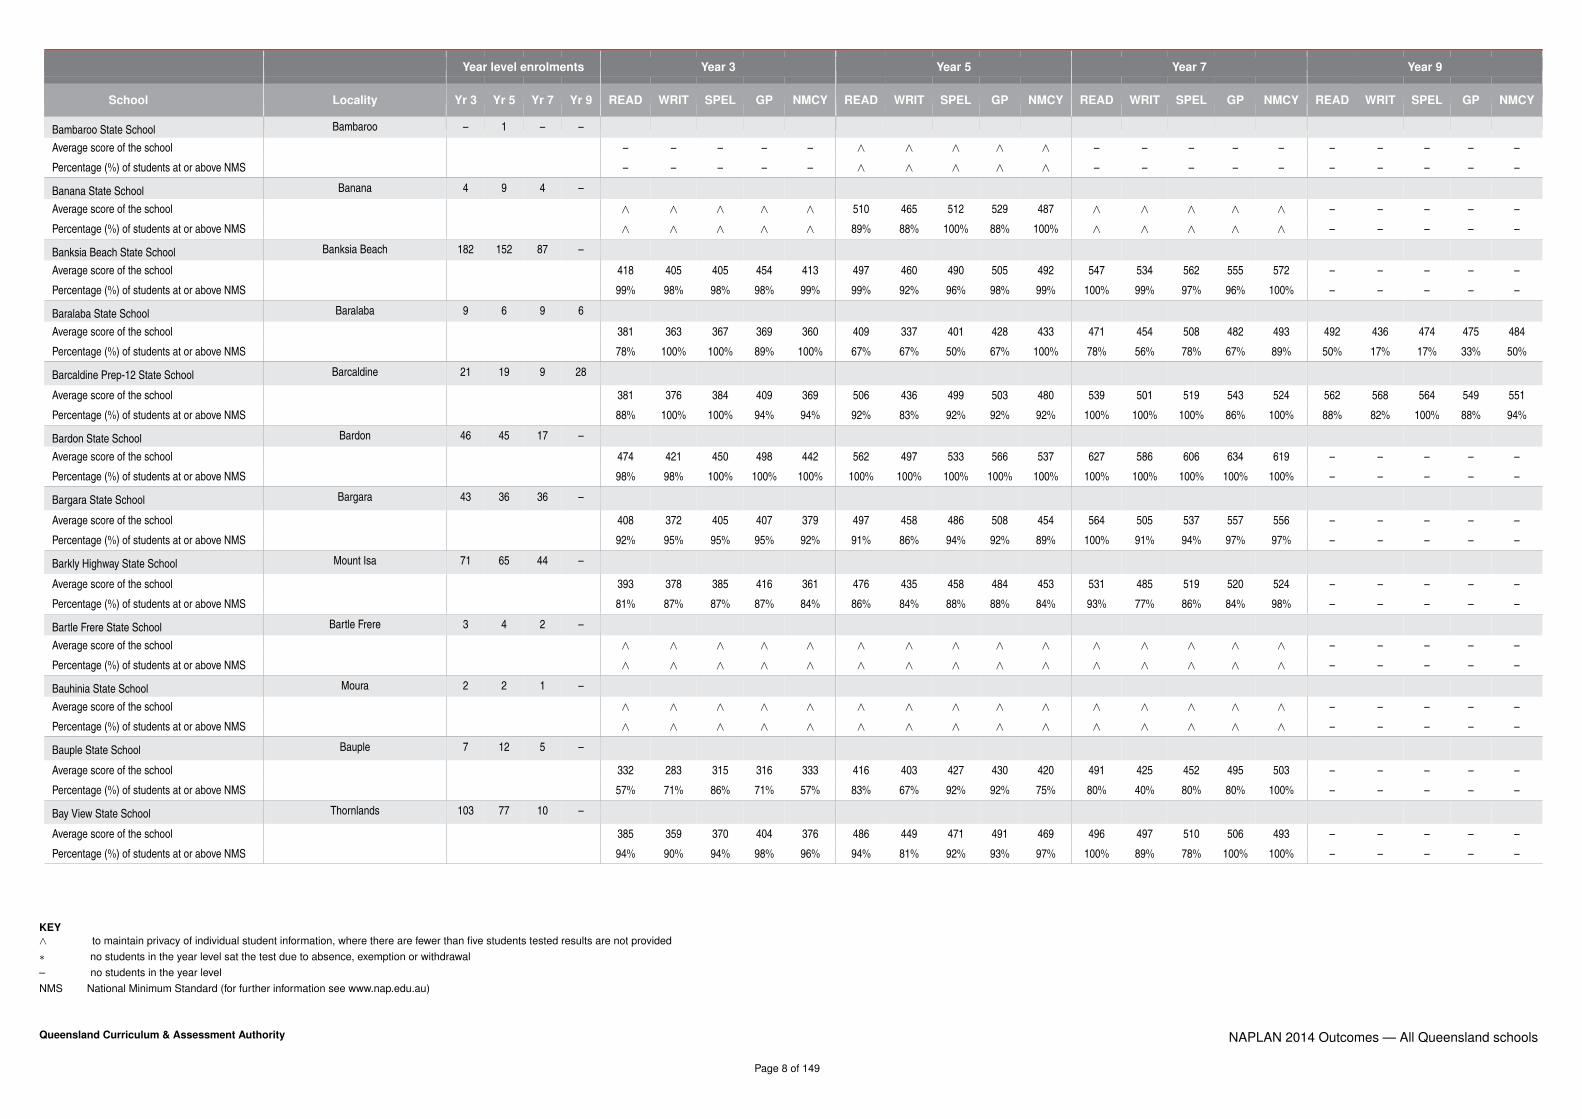
Year level enrolments Year 3 Year 5 Year 7 Year 9
School Locality Yr 3 Yr 5 Yr 7 Yr 9 READ WRIT SPEL GP NMCY READ WRIT SPEL GP NMCY READ WRIT SPEL GP NMCY READ WRIT SPEL GP NMCY
Bambaroo State School Bambaroo – 1 – –
Average score of the school – – – – – ∧ ∧ ∧ ∧ ∧ – – – – – – – – – –
Percentage (%) of students at or above NMS – – – – – ∧ ∧ ∧ ∧ ∧ – – – – – – – – – –
Banana State School Banana 4 9 4 –
Average score of the school ∧ ∧ ∧ ∧ ∧ 510 465 512 529 487 ∧ ∧ ∧ ∧ ∧ – – – – –
Percentage (%) of students at or above NMS ∧ ∧ ∧ ∧ ∧ 89% 88% 100% 88% 100% ∧ ∧ ∧ ∧ ∧ – – – – –
Banksia Beach State School Banksia Beach 182 152 87 –
Average score of the school 418 405 405 454 413 497 460 490 505 492 547 534 562 555 572 – – – – –
Percentage (%) of students at or above NMS 99% 98% 98% 98% 99% 99% 92% 96% 98% 99% 100% 99% 97% 96% 100% – – – – –
Baralaba State School Baralaba 9 6 9 6
Average score of the school 381 363 367 369 360 409 337 401 428 433 471 454 508 482 493 492 436 474 475 484
Percentage (%) of students at or above NMS 78% 100% 100% 89% 100% 67% 67% 50% 67% 100% 78% 56% 78% 67% 89% 50% 17% 17% 33% 50%
Barcaldine Prep-12 State School Barcaldine 21 19 9 28
Average score of the school 381 376 384 409 369 506 436 499 503 480 539 501 519 543 524 562 568 564 549 551
Percentage (%) of students at or above NMS 88% 100% 100% 94% 94% 92% 83% 92% 92% 92% 100% 100% 100% 86% 100% 88% 82% 100% 88% 94%
Bardon State School Bardon 46 45 17 –
Average score of the school 474 421 450 498 442 562 497 533 566 537 627 586 606 634 619 – – – – –
Percentage (%) of students at or above NMS 98% 98% 100% 100% 100% 100% 100% 100% 100% 100% 100% 100% 100% 100% 100% – – – – –
Bargara State School Bargara 43 36 36 –
Average score of the school 408 372 405 407 379 497 458 486 508 454 564 505 537 557 556 – – – – –
Percentage (%) of students at or above NMS 92% 95% 95% 95% 92% 91% 86% 94% 92% 89% 100% 91% 94% 97% 97% – – – – –
Barkly Highway State School Mount Isa 71 65 44 –
Average score of the school 393 378 385 416 361 476 435 458 484 453 531 485 519 520 524 – – – – –
Percentage (%) of students at or above NMS 81% 87% 87% 87% 84% 86% 84% 88% 88% 84% 93% 77% 86% 84% 98% – – – – –
Bartle Frere State School Bartle Frere 3 4 2 –
Average score of the school ∧ ∧ ∧ ∧ ∧ ∧ ∧ ∧ ∧ ∧ ∧ ∧ ∧ ∧ ∧ – – – – –
Percentage (%) of students at or above NMS ∧ ∧ ∧ ∧ ∧ ∧ ∧ ∧ ∧ ∧ ∧ ∧ ∧ ∧ ∧ – – – – –
Bauhinia State School Moura 2 2 1 –
Average score of the school ∧ ∧ ∧ ∧ ∧ ∧ ∧ ∧ ∧ ∧ ∧ ∧ ∧ ∧ ∧ – – – – –
Percentage (%) of students at or above NMS ∧ ∧ ∧ ∧ ∧ ∧ ∧ ∧ ∧ ∧ ∧ ∧ ∧ ∧ ∧ – – – – –
Bauple State School Bauple 7 12 5 –
Average score of the school 332 283 315 316 333 416 403 427 430 420 491 425 452 495 503 – – – – –
Percentage (%) of students at or above NMS 57% 71% 86% 71% 57% 83% 67% 92% 92% 75% 80% 40% 80% 80% 100% – – – – –
Bay View State School Thornlands 103 77 10 –
Average score of the school 385 359 370 404 376 486 449 471 491 469 496 497 510 506 493 – – – – –
Percentage (%) of students at or above NMS 94% 90% 94% 98% 96% 94% 81% 92% 93% 97% 100% 89% 78% 100% 100% – – – – –
KEY∧ to maintain privacy of individual student information, where there are fewer than five students tested results are not provided∗ no students in the year level sat the test due to absence, exemption or withdrawal– no students in the year levelNMS National Minimum Standard (for further information see www.nap.edu.au)
Queensland Curriculum & Assessment Authority
Page 8 of 149
NAPLAN 2014 Outcomes — All Queensland schools
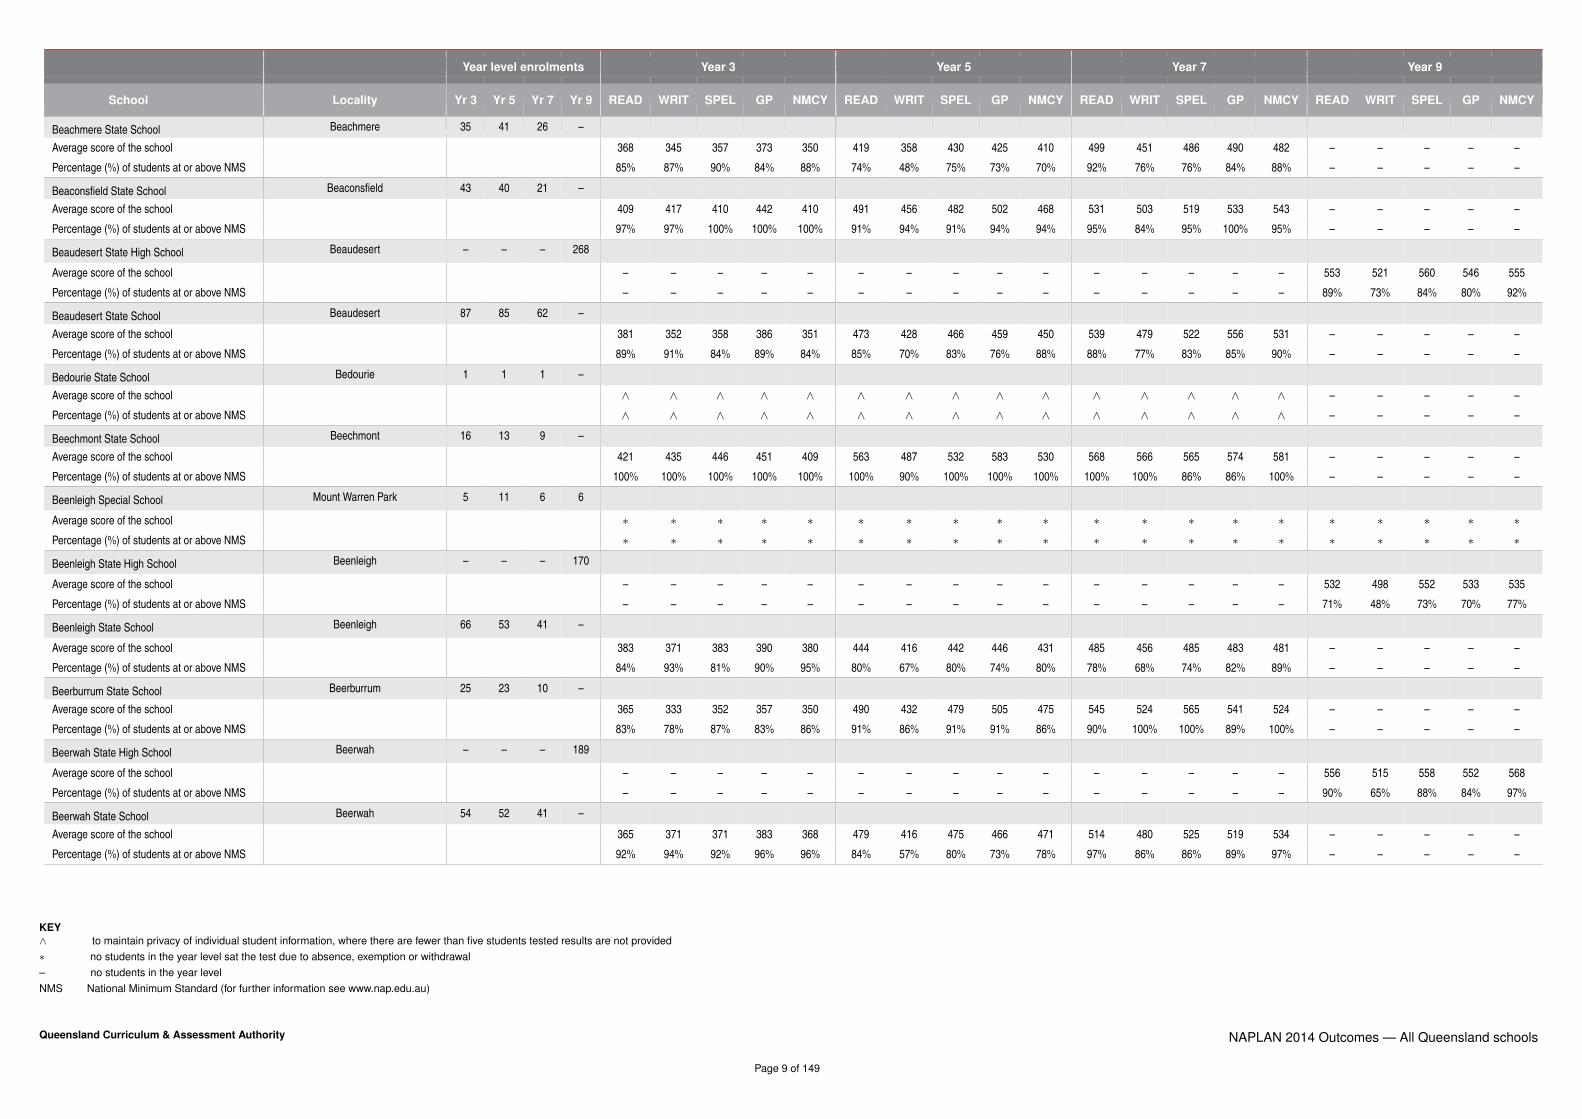
Year level enrolments Year 3 Year 5 Year 7 Year 9
School Locality Yr 3 Yr 5 Yr 7 Yr 9 READ WRIT SPEL GP NMCY READ WRIT SPEL GP NMCY READ WRIT SPEL GP NMCY READ WRIT SPEL GP NMCY
Beachmere State School Beachmere 35 41 26 –
Average score of the school 368 345 357 373 350 419 358 430 425 410 499 451 486 490 482 – – – – –
Percentage (%) of students at or above NMS 85% 87% 90% 84% 88% 74% 48% 75% 73% 70% 92% 76% 76% 84% 88% – – – – –
Beaconsfield State School Beaconsfield 43 40 21 –
Average score of the school 409 417 410 442 410 491 456 482 502 468 531 503 519 533 543 – – – – –
Percentage (%) of students at or above NMS 97% 97% 100% 100% 100% 91% 94% 91% 94% 94% 95% 84% 95% 100% 95% – – – – –
Beaudesert State High School Beaudesert – – – 268
Average score of the school – – – – – – – – – – – – – – – 553 521 560 546 555
Percentage (%) of students at or above NMS – – – – – – – – – – – – – – – 89% 73% 84% 80% 92%
Beaudesert State School Beaudesert 87 85 62 –
Average score of the school 381 352 358 386 351 473 428 466 459 450 539 479 522 556 531 – – – – –
Percentage (%) of students at or above NMS 89% 91% 84% 89% 84% 85% 70% 83% 76% 88% 88% 77% 83% 85% 90% – – – – –
Bedourie State School Bedourie 1 1 1 –
Average score of the school ∧ ∧ ∧ ∧ ∧ ∧ ∧ ∧ ∧ ∧ ∧ ∧ ∧ ∧ ∧ – – – – –
Percentage (%) of students at or above NMS ∧ ∧ ∧ ∧ ∧ ∧ ∧ ∧ ∧ ∧ ∧ ∧ ∧ ∧ ∧ – – – – –
Beechmont State School Beechmont 16 13 9 –
Average score of the school 421 435 446 451 409 563 487 532 583 530 568 566 565 574 581 – – – – –
Percentage (%) of students at or above NMS 100% 100% 100% 100% 100% 100% 90% 100% 100% 100% 100% 100% 86% 86% 100% – – – – –
Beenleigh Special School Mount Warren Park 5 11 6 6
Average score of the school ∗ ∗ ∗ ∗ ∗ ∗ ∗ ∗ ∗ ∗ ∗ ∗ ∗ ∗ ∗ ∗ ∗ ∗ ∗ ∗Percentage (%) of students at or above NMS ∗ ∗ ∗ ∗ ∗ ∗ ∗ ∗ ∗ ∗ ∗ ∗ ∗ ∗ ∗ ∗ ∗ ∗ ∗ ∗
Beenleigh State High School Beenleigh – – – 170
Average score of the school – – – – – – – – – – – – – – – 532 498 552 533 535
Percentage (%) of students at or above NMS – – – – – – – – – – – – – – – 71% 48% 73% 70% 77%
Beenleigh State School Beenleigh 66 53 41 –
Average score of the school 383 371 383 390 380 444 416 442 446 431 485 456 485 483 481 – – – – –
Percentage (%) of students at or above NMS 84% 93% 81% 90% 95% 80% 67% 80% 74% 80% 78% 68% 74% 82% 89% – – – – –
Beerburrum State School Beerburrum 25 23 10 –
Average score of the school 365 333 352 357 350 490 432 479 505 475 545 524 565 541 524 – – – – –
Percentage (%) of students at or above NMS 83% 78% 87% 83% 86% 91% 86% 91% 91% 86% 90% 100% 100% 89% 100% – – – – –
Beerwah State High School Beerwah – – – 189
Average score of the school – – – – – – – – – – – – – – – 556 515 558 552 568
Percentage (%) of students at or above NMS – – – – – – – – – – – – – – – 90% 65% 88% 84% 97%
Beerwah State School Beerwah 54 52 41 –
Average score of the school 365 371 371 383 368 479 416 475 466 471 514 480 525 519 534 – – – – –
Percentage (%) of students at or above NMS 92% 94% 92% 96% 96% 84% 57% 80% 73% 78% 97% 86% 86% 89% 97% – – – – –
KEY∧ to maintain privacy of individual student information, where there are fewer than five students tested results are not provided∗ no students in the year level sat the test due to absence, exemption or withdrawal– no students in the year levelNMS National Minimum Standard (for further information see www.nap.edu.au)
Queensland Curriculum & Assessment Authority
Page 9 of 149
NAPLAN 2014 Outcomes — All Queensland schools

Year level enrolments Year 3 Year 5 Year 7 Year 9
School Locality Yr 3 Yr 5 Yr 7 Yr 9 READ WRIT SPEL GP NMCY READ WRIT SPEL GP NMCY READ WRIT SPEL GP NMCY READ WRIT SPEL GP NMCY
Begonia State School St George – 2 1 –
Average score of the school – – – – – ∧ ∧ ∧ ∧ ∧ ∧ ∧ ∧ ∧ ∧ – – – – –
Percentage (%) of students at or above NMS – – – – – ∧ ∧ ∧ ∧ ∧ ∧ ∧ ∧ ∧ ∧ – – – – –
Belgian Gardens State School Belgian Gardens 73 66 43 –
Average score of the school 427 384 390 434 393 527 488 517 546 499 556 518 546 563 538 – – – – –
Percentage (%) of students at or above NMS 91% 91% 90% 94% 97% 97% 95% 95% 97% 98% 98% 95% 100% 98% 98% – – – – –
Bell State School Bell 8 9 5 6
Average score of the school 323 346 257 308 335 485 440 486 482 504 ∧ ∧ ∧ ∧ ∧ 560 557 592 549 573
Percentage (%) of students at or above NMS 63% 63% 38% 63% 63% 88% 88% 100% 88% 100% ∧ ∧ ∧ ∧ ∧ 100% 83% 100% 100% 100%
Bellenden Ker State School Bellenden Ker 1 2 1 –
Average score of the school ∧ ∧ ∧ ∧ ∧ ∧ ∧ ∧ ∧ ∧ ∧ ∧ ∧ ∧ ∧ – – – – –
Percentage (%) of students at or above NMS ∧ ∧ ∧ ∧ ∧ ∧ ∧ ∧ ∧ ∧ ∧ ∧ ∧ ∧ ∧ – – – – –
Bellevue Park State School Southport 84 79 37 –
Average score of the school 418 416 420 448 410 504 473 501 508 474 558 518 561 555 573 – – – – –
Percentage (%) of students at or above NMS 96% 99% 96% 99% 99% 100% 96% 95% 96% 95% 100% 94% 100% 100% 100% – – – – –
Belmont State School Carindale 122 105 63 –
Average score of the school 425 411 440 462 417 519 495 514 545 531 563 547 558 570 585 – – – – –
Percentage (%) of students at or above NMS 93% 93% 95% 96% 96% 97% 98% 98% 98% 100% 98% 95% 98% 97% 98% – – – – –
Benaraby State School Benaraby via Gladstone 7 9 13 –
Average score of the school 490 435 448 490 451 517 478 498 532 552 552 500 552 566 576 – – – – –
Percentage (%) of students at or above NMS 100% 100% 100% 100% 100% 100% 100% 100% 100% 100% 100% 92% 100% 100% 100% – – – – –
Benarkin State School Benarkin 3 1 3 –
Average score of the school ∗ ∗ ∗ ∗ ∗ ∧ ∧ ∧ ∧ ∧ ∧ ∧ ∧ ∧ ∧ – – – – –
Percentage (%) of students at or above NMS ∗ ∗ ∗ ∗ ∗ ∧ ∧ ∧ ∧ ∧ ∧ ∧ ∧ ∧ ∧ – – – – –
Benowa State High School Benowa – – – 421
Average score of the school – – – – – – – – – – – – – – – 580 548 599 583 593
Percentage (%) of students at or above NMS – – – – – – – – – – – – – – – 93% 80% 93% 91% 95%
Benowa State School Benowa 118 136 81 –
Average score of the school 413 377 421 430 398 505 453 498 509 501 540 498 552 545 550 – – – – –
Percentage (%) of students at or above NMS 92% 91% 93% 96% 95% 97% 87% 94% 92% 96% 98% 86% 95% 93% 98% – – – – –
Bentley Park College Edmonton 91 87 70 172
Average score of the school 388 391 397 394 360 452 450 479 464 449 473 428 496 466 487 541 502 556 523 550
Percentage (%) of students at or above NMS 92% 95% 89% 91% 90% 88% 80% 85% 82% 86% 79% 59% 81% 71% 92% 81% 61% 84% 73% 91%
Berrinba East State School Berrinba 60 58 37 –
Average score of the school 357 328 366 327 318 419 409 444 423 410 489 490 506 465 485 – – – – –
Percentage (%) of students at or above NMS 81% 71% 80% 76% 68% 74% 69% 90% 67% 74% 97% 86% 89% 72% 97% – – – – –
KEY∧ to maintain privacy of individual student information, where there are fewer than five students tested results are not provided∗ no students in the year level sat the test due to absence, exemption or withdrawal– no students in the year levelNMS National Minimum Standard (for further information see www.nap.edu.au)
Queensland Curriculum & Assessment Authority
Page 10 of 149
NAPLAN 2014 Outcomes — All Queensland schools

Year level enrolments Year 3 Year 5 Year 7 Year 9
School Locality Yr 3 Yr 5 Yr 7 Yr 9 READ WRIT SPEL GP NMCY READ WRIT SPEL GP NMCY READ WRIT SPEL GP NMCY READ WRIT SPEL GP NMCY
Berserker Street State School North Rockhampton 61 66 34 –
Average score of the school 384 388 388 414 378 444 425 460 450 455 519 491 533 534 541 – – – – –
Percentage (%) of students at or above NMS 85% 85% 85% 85% 85% 70% 71% 80% 66% 83% 76% 64% 73% 73% 76% – – – – –
Bethania Lutheran School Bethania 45 22 16 –
Average score of the school 402 396 397 404 379 460 466 478 470 450 521 479 530 533 523 – – – – –
Percentage (%) of students at or above NMS 98% 98% 98% 96% 98% 75% 100% 100% 95% 89% 94% 88% 94% 100% 100% – – – – –
Bethany Lutheran Primary School
(Raceview)
Raceview 33 21 17 –
Average score of the school 432 391 421 455 412 497 445 469 488 477 547 496 516 537 539 – – – – –
Percentage (%) of students at or above NMS 97% 100% 97% 100% 97% 95% 86% 90% 100% 100% 88% 81% 81% 88% 93% – – – – –
Biboohra State School Biboohra via Mareeba 12 7 10 –
Average score of the school 393 377 381 432 355 465 426 436 449 443 542 464 522 547 528 – – – – –
Percentage (%) of students at or above NMS 100% 100% 100% 100% 91% 71% 67% 83% 83% 71% 100% 70% 90% 90% 100% – – – – –
Biddeston State School Biddeston 8 11 7 –
Average score of the school 406 360 374 413 362 489 432 486 490 466 544 547 558 564 553 – – – – –
Percentage (%) of students at or above NMS 100% 100% 86% 100% 100% 91% 64% 100% 91% 91% 100% 100% 100% 100% 100% – – – – –
Biggenden State School Biggenden 11 11 9 14
Average score of the school 364 374 343 455 424 458 456 461 461 450 501 450 492 491 489 537 503 512 542 559
Percentage (%) of students at or above NMS 78% 89% 89% 100% 100% 100% 100% 100% 100% 100% 86% 63% 63% 88% 100% 83% 50% 67% 83% 92%
Biggera Waters State School Biggera Waters 127 94 35 –
Average score of the school 414 395 410 428 392 506 437 508 519 489 512 495 512 493 504 – – – – –
Percentage (%) of students at or above NMS 97% 97% 96% 96% 98% 99% 82% 98% 99% 94% 100% 90% 97% 86% 100% – – – – –
Biloela State High School Biloela – – – 123
Average score of the school – – – – – – – – – – – – – – – 569 535 553 566 580
Percentage (%) of students at or above NMS – – – – – – – – – – – – – – – 85% 66% 77% 82% 92%
Biloela State School Biloela 42 52 36 –
Average score of the school 381 357 372 383 384 449 398 438 437 453 516 459 513 527 510 – – – – –
Percentage (%) of students at or above NMS 79% 79% 80% 73% 83% 77% 65% 78% 73% 82% 80% 74% 74% 82% 94% – – – – –
Binjour Plateau State School via Gayndah 3 2 1 –
Average score of the school ∧ ∧ ∧ ∧ ∧ ∧ ∧ ∧ ∧ ∧ ∧ ∧ ∧ ∧ ∧ – – – – –
Percentage (%) of students at or above NMS ∧ ∧ ∧ ∧ ∧ ∧ ∧ ∧ ∧ ∧ ∧ ∧ ∧ ∧ ∧ – – – – –
Birdsville State School Birdsville 1 2 1 –
Average score of the school ∧ ∧ ∧ ∧ ∧ ∧ ∧ ∧ ∧ ∧ ∧ ∧ ∧ ∧ ∧ – – – – –
Percentage (%) of students at or above NMS ∧ ∧ ∧ ∧ ∧ ∧ ∧ ∧ ∧ ∧ ∧ ∧ ∧ ∧ ∧ – – – – –
Birkdale South State School Birkdale 85 85 31 –
Average score of the school 399 357 386 405 374 497 474 493 504 487 535 491 537 516 514 – – – – –
Percentage (%) of students at or above NMS 97% 89% 96% 94% 99% 92% 92% 95% 95% 95% 96% 81% 89% 86% 96% – – – – –
KEY∧ to maintain privacy of individual student information, where there are fewer than five students tested results are not provided∗ no students in the year level sat the test due to absence, exemption or withdrawal– no students in the year levelNMS National Minimum Standard (for further information see www.nap.edu.au)
Queensland Curriculum & Assessment Authority
Page 11 of 149
NAPLAN 2014 Outcomes — All Queensland schools
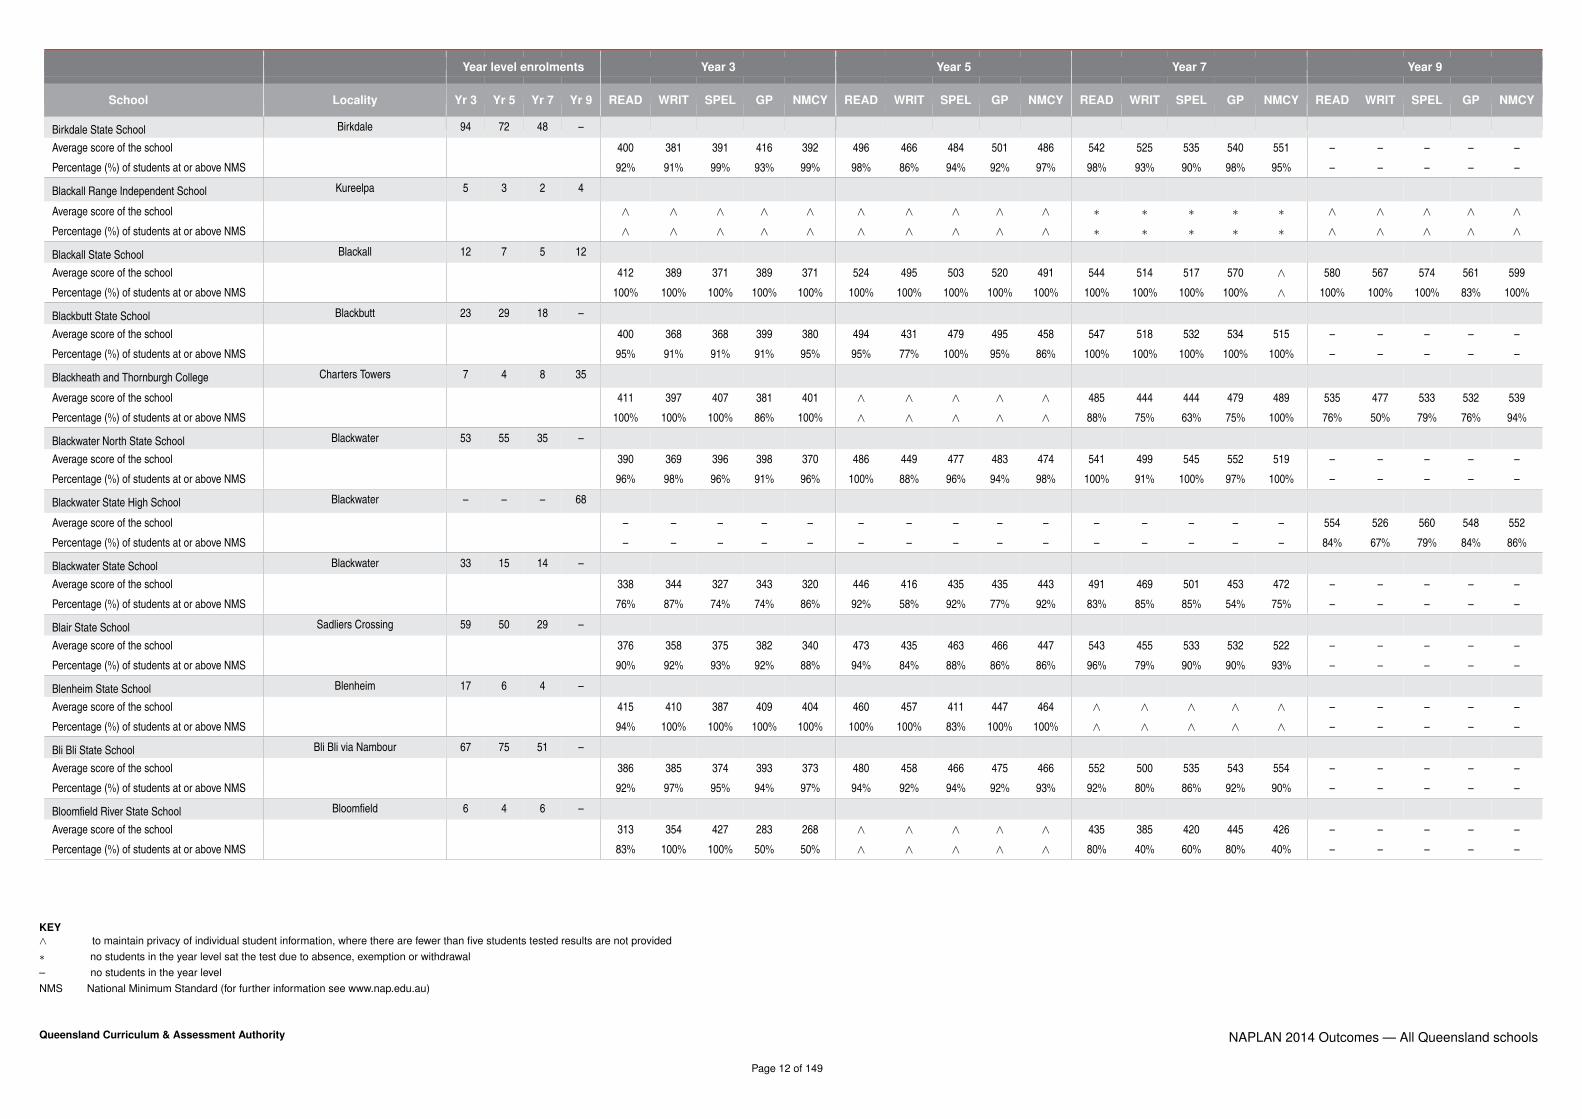
Year level enrolments Year 3 Year 5 Year 7 Year 9
School Locality Yr 3 Yr 5 Yr 7 Yr 9 READ WRIT SPEL GP NMCY READ WRIT SPEL GP NMCY READ WRIT SPEL GP NMCY READ WRIT SPEL GP NMCY
Birkdale State School Birkdale 94 72 48 –
Average score of the school 400 381 391 416 392 496 466 484 501 486 542 525 535 540 551 – – – – –
Percentage (%) of students at or above NMS 92% 91% 99% 93% 99% 98% 86% 94% 92% 97% 98% 93% 90% 98% 95% – – – – –
Blackall Range Independent School Kureelpa 5 3 2 4
Average score of the school ∧ ∧ ∧ ∧ ∧ ∧ ∧ ∧ ∧ ∧ ∗ ∗ ∗ ∗ ∗ ∧ ∧ ∧ ∧ ∧Percentage (%) of students at or above NMS ∧ ∧ ∧ ∧ ∧ ∧ ∧ ∧ ∧ ∧ ∗ ∗ ∗ ∗ ∗ ∧ ∧ ∧ ∧ ∧
Blackall State School Blackall 12 7 5 12
Average score of the school 412 389 371 389 371 524 495 503 520 491 544 514 517 570 ∧ 580 567 574 561 599
Percentage (%) of students at or above NMS 100% 100% 100% 100% 100% 100% 100% 100% 100% 100% 100% 100% 100% 100% ∧ 100% 100% 100% 83% 100%
Blackbutt State School Blackbutt 23 29 18 –
Average score of the school 400 368 368 399 380 494 431 479 495 458 547 518 532 534 515 – – – – –
Percentage (%) of students at or above NMS 95% 91% 91% 91% 95% 95% 77% 100% 95% 86% 100% 100% 100% 100% 100% – – – – –
Blackheath and Thornburgh College Charters Towers 7 4 8 35
Average score of the school 411 397 407 381 401 ∧ ∧ ∧ ∧ ∧ 485 444 444 479 489 535 477 533 532 539
Percentage (%) of students at or above NMS 100% 100% 100% 86% 100% ∧ ∧ ∧ ∧ ∧ 88% 75% 63% 75% 100% 76% 50% 79% 76% 94%
Blackwater North State School Blackwater 53 55 35 –
Average score of the school 390 369 396 398 370 486 449 477 483 474 541 499 545 552 519 – – – – –
Percentage (%) of students at or above NMS 96% 98% 96% 91% 96% 100% 88% 96% 94% 98% 100% 91% 100% 97% 100% – – – – –
Blackwater State High School Blackwater – – – 68
Average score of the school – – – – – – – – – – – – – – – 554 526 560 548 552
Percentage (%) of students at or above NMS – – – – – – – – – – – – – – – 84% 67% 79% 84% 86%
Blackwater State School Blackwater 33 15 14 –
Average score of the school 338 344 327 343 320 446 416 435 435 443 491 469 501 453 472 – – – – –
Percentage (%) of students at or above NMS 76% 87% 74% 74% 86% 92% 58% 92% 77% 92% 83% 85% 85% 54% 75% – – – – –
Blair State School Sadliers Crossing 59 50 29 –
Average score of the school 376 358 375 382 340 473 435 463 466 447 543 455 533 532 522 – – – – –
Percentage (%) of students at or above NMS 90% 92% 93% 92% 88% 94% 84% 88% 86% 86% 96% 79% 90% 90% 93% – – – – –
Blenheim State School Blenheim 17 6 4 –
Average score of the school 415 410 387 409 404 460 457 411 447 464 ∧ ∧ ∧ ∧ ∧ – – – – –
Percentage (%) of students at or above NMS 94% 100% 100% 100% 100% 100% 100% 83% 100% 100% ∧ ∧ ∧ ∧ ∧ – – – – –
Bli Bli State School Bli Bli via Nambour 67 75 51 –
Average score of the school 386 385 374 393 373 480 458 466 475 466 552 500 535 543 554 – – – – –
Percentage (%) of students at or above NMS 92% 97% 95% 94% 97% 94% 92% 94% 92% 93% 92% 80% 86% 92% 90% – – – – –
Bloomfield River State School Bloomfield 6 4 6 –
Average score of the school 313 354 427 283 268 ∧ ∧ ∧ ∧ ∧ 435 385 420 445 426 – – – – –
Percentage (%) of students at or above NMS 83% 100% 100% 50% 50% ∧ ∧ ∧ ∧ ∧ 80% 40% 60% 80% 40% – – – – –
KEY∧ to maintain privacy of individual student information, where there are fewer than five students tested results are not provided∗ no students in the year level sat the test due to absence, exemption or withdrawal– no students in the year levelNMS National Minimum Standard (for further information see www.nap.edu.au)
Queensland Curriculum & Assessment Authority
Page 12 of 149
NAPLAN 2014 Outcomes — All Queensland schools

Year level enrolments Year 3 Year 5 Year 7 Year 9
School Locality Yr 3 Yr 5 Yr 7 Yr 9 READ WRIT SPEL GP NMCY READ WRIT SPEL GP NMCY READ WRIT SPEL GP NMCY READ WRIT SPEL GP NMCY
Bloomsbury State School Bloomsbury via Mackay 11 5 4 –
Average score of the school 392 365 377 400 376 ∧ ∧ ∧ ∧ ∧ ∧ ∧ ∧ ∧ ∧ – – – – –
Percentage (%) of students at or above NMS 89% 89% 100% 100% 89% ∧ ∧ ∧ ∧ ∧ ∧ ∧ ∧ ∧ ∧ – – – – –
Bluewater State School Bluewater 47 48 11 –
Average score of the school 382 413 383 413 387 496 466 493 504 474 558 496 556 549 577 – – – – –
Percentage (%) of students at or above NMS 88% 100% 98% 98% 98% 93% 90% 93% 98% 93% 78% 67% 89% 89% 89% – – – – –
Bluff State School Bluff 3 4 – –
Average score of the school ∧ ∧ ∧ ∧ ∧ ∧ ∧ ∧ ∧ ∧ – – – – – – – – – –
Percentage (%) of students at or above NMS ∧ ∧ ∧ ∧ ∧ ∧ ∧ ∧ ∧ ∧ – – – – – – – – – –
Bohlevale State School Bohle 104 87 28 –
Average score of the school 353 354 355 374 346 461 423 446 461 451 524 488 532 489 527 – – – – –
Percentage (%) of students at or above NMS 81% 87% 88% 85% 92% 82% 73% 80% 81% 85% 96% 81% 92% 88% 96% – – – – –
Bollon State School Bollon 4 5 1 –
Average score of the school ∧ ∧ ∧ ∧ ∧ ∧ ∧ ∧ ∧ 447 ∗ ∗ ∗ ∗ ∗ – – – – –
Percentage (%) of students at or above NMS ∧ ∧ ∧ ∧ ∧ ∧ ∧ ∧ ∧ 100% ∗ ∗ ∗ ∗ ∗ – – – – –
Boonah State High School Boonah – – – 120
Average score of the school – – – – – – – – – – – – – – – 558 528 563 558 579
Percentage (%) of students at or above NMS – – – – – – – – – – – – – – – 89% 77% 89% 83% 98%
Boonah State School Boonah 37 34 22 –
Average score of the school 391 348 352 386 382 501 434 484 494 482 514 536 515 518 538 – – – – –
Percentage (%) of students at or above NMS 94% 88% 82% 88% 94% 93% 68% 94% 90% 93% 95% 100% 90% 100% 100% – – – – –
Boondall State School Boondall 87 94 59 –
Average score of the school 399 376 403 415 380 480 441 485 495 480 523 493 536 533 533 – – – – –
Percentage (%) of students at or above NMS 94% 94% 97% 95% 88% 96% 81% 95% 92% 94% 88% 79% 86% 82% 86% – – – – –
Booyal Central State School Booyal 4 5 1 –
Average score of the school ∧ ∧ ∧ ∧ ∧ 540 496 505 556 492 ∧ ∧ ∧ ∧ ∧ – – – – –
Percentage (%) of students at or above NMS ∧ ∧ ∧ ∧ ∧ 100% 100% 100% 100% 100% ∧ ∧ ∧ ∧ ∧ – – – – –
Boronia Heights State School Boronia Heights 93 87 47 –
Average score of the school 358 355 365 348 349 456 430 480 476 441 488 474 494 473 487 – – – – –
Percentage (%) of students at or above NMS 83% 83% 84% 81% 83% 84% 73% 88% 85% 83% 88% 85% 83% 71% 95% – – – – –
Bororen State School Bororen 8 9 3 –
Average score of the school 401 406 397 380 387 479 462 474 491 499 ∧ ∧ ∧ ∧ ∧ – – – – –
Percentage (%) of students at or above NMS 100% 100% 100% 100% 100% 75% 63% 75% 88% 75% ∧ ∧ ∧ ∧ ∧ – – – – –
Bouldercombe State School Bouldercombe 27 21 13 –
Average score of the school 384 416 369 412 367 459 491 473 485 446 508 495 502 494 498 – – – – –
Percentage (%) of students at or above NMS 91% 100% 95% 95% 100% 95% 95% 85% 95% 95% 92% 85% 85% 77% 92% – – – – –
KEY∧ to maintain privacy of individual student information, where there are fewer than five students tested results are not provided∗ no students in the year level sat the test due to absence, exemption or withdrawal– no students in the year levelNMS National Minimum Standard (for further information see www.nap.edu.au)
Queensland Curriculum & Assessment Authority
Page 13 of 149
NAPLAN 2014 Outcomes — All Queensland schools

Year level enrolments Year 3 Year 5 Year 7 Year 9
School Locality Yr 3 Yr 5 Yr 7 Yr 9 READ WRIT SPEL GP NMCY READ WRIT SPEL GP NMCY READ WRIT SPEL GP NMCY READ WRIT SPEL GP NMCY
Boulia State School Boulia 4 4 3 –
Average score of the school ∧ ∧ ∧ ∧ ∧ ∧ ∧ ∧ ∧ ∧ ∧ ∧ ∧ ∧ ∧ – – – – –
Percentage (%) of students at or above NMS ∧ ∧ ∧ ∧ ∧ ∧ ∧ ∧ ∧ ∧ ∧ ∧ ∧ ∧ ∧ – – – – –
Bounty Boulevard State School North Lakes 157 125 56 –
Average score of the school 393 375 390 394 374 493 435 490 490 468 529 502 536 525 531 – – – – –
Percentage (%) of students at or above NMS 89% 93% 91% 91% 91% 89% 80% 90% 92% 93% 91% 89% 93% 89% 100% – – – – –
Bowen State High School Bowen – – – 124
Average score of the school – – – – – – – – – – – – – – – 561 528 551 559 567
Percentage (%) of students at or above NMS – – – – – – – – – – – – – – – 85% 76% 81% 81% 91%
Bowen State School Bowen 54 55 33 –
Average score of the school 393 377 389 385 351 485 467 500 499 465 525 502 524 498 542 – – – – –
Percentage (%) of students at or above NMS 90% 88% 82% 88% 80% 92% 92% 98% 94% 92% 96% 93% 93% 79% 96% – – – – –
Bowenville State School Bowenville 3 3 2 –
Average score of the school ∧ ∧ ∧ ∧ ∧ ∧ ∧ ∧ ∧ ∧ ∧ ∧ ∧ ∧ ∧ – – – – –
Percentage (%) of students at or above NMS ∧ ∧ ∧ ∧ ∧ ∧ ∧ ∧ ∧ ∧ ∧ ∧ ∧ ∧ ∧ – – – – –
Boyne Island State School Boyne Island 54 36 25 –
Average score of the school 446 423 427 454 421 490 453 486 500 473 538 536 514 557 523 – – – – –
Percentage (%) of students at or above NMS 94% 98% 94% 96% 96% 94% 91% 94% 91% 88% 96% 91% 87% 96% 95% – – – – –
Boynewood State School via Mundubbera 2 2 1 –
Average score of the school ∧ ∧ ∧ ∧ ∧ ∧ ∧ ∧ ∧ ∧ ∧ ∧ ∧ ∧ ∧ – – – – –
Percentage (%) of students at or above NMS ∧ ∧ ∧ ∧ ∧ ∧ ∧ ∧ ∧ ∧ ∧ ∧ ∧ ∧ ∧ – – – – –
Bracken Ridge State High School Bracken Ridge – – – 93
Average score of the school – – – – – – – – – – – – – – – 567 538 565 557 565
Percentage (%) of students at or above NMS – – – – – – – – – – – – – – – 87% 77% 90% 82% 99%
Bracken Ridge State School Bracken Ridge 60 56 46 –
Average score of the school 362 328 375 374 358 485 449 487 502 484 531 490 539 520 528 – – – – –
Percentage (%) of students at or above NMS 78% 85% 93% 93% 88% 91% 85% 93% 91% 92% 95% 93% 98% 91% 100% – – – – –
Brandon State School Brandon 5 4 – –
Average score of the school 342 386 329 386 319 ∧ ∧ ∧ ∧ ∧ – – – – – – – – – –
Percentage (%) of students at or above NMS 80% 100% 100% 100% 100% ∧ ∧ ∧ ∧ ∧ – – – – – – – – – –
Branyan Road State School Bundaberg 42 43 15 –
Average score of the school 392 369 405 403 363 473 464 462 475 488 531 526 523 541 554 – – – – –
Percentage (%) of students at or above NMS 90% 90% 93% 93% 90% 86% 88% 95% 91% 95% 86% 86% 79% 86% 93% – – – – –
Brassall State School Brassall 98 112 79 –
Average score of the school 373 347 351 358 355 440 386 430 435 421 507 456 496 496 503 – – – – –
Percentage (%) of students at or above NMS 90% 88% 84% 84% 89% 76% 61% 70% 74% 67% 88% 66% 82% 84% 93% – – – – –
KEY∧ to maintain privacy of individual student information, where there are fewer than five students tested results are not provided∗ no students in the year level sat the test due to absence, exemption or withdrawal– no students in the year levelNMS National Minimum Standard (for further information see www.nap.edu.au)
Queensland Curriculum & Assessment Authority
Page 14 of 149
NAPLAN 2014 Outcomes — All Queensland schools

Year level enrolments Year 3 Year 5 Year 7 Year 9
School Locality Yr 3 Yr 5 Yr 7 Yr 9 READ WRIT SPEL GP NMCY READ WRIT SPEL GP NMCY READ WRIT SPEL GP NMCY READ WRIT SPEL GP NMCY
Bray Park State High School Bray Park – – 54 168
Average score of the school – – – – – – – – – – 514 475 507 515 508 548 525 551 540 549
Percentage (%) of students at or above NMS – – – – – – – – – – 94% 89% 85% 96% 92% 86% 74% 86% 80% 89%
Bray Park State School Bray Park 60 74 29 –
Average score of the school 399 384 384 381 373 458 417 463 461 440 516 463 502 499 497 – – – – –
Percentage (%) of students at or above NMS 96% 98% 92% 96% 98% 88% 64% 90% 86% 84% 92% 64% 91% 87% 91% – – – – –
Bremer State High School Ipswich – – 50 363
Average score of the school – – – – – – – – – – 531 481 528 526 504 546 516 553 533 547
Percentage (%) of students at or above NMS – – – – – – – – – – 98% 83% 87% 85% 84% 85% 71% 87% 77% 94%
Bribie Island State High School Bribie Island – – – 196
Average score of the school – – – – – – – – – – – – – – – 558 532 560 553 556
Percentage (%) of students at or above NMS – – – – – – – – – – – – – – – 88% 70% 85% 82% 92%
Bribie Island State School Bongaree 96 79 68 –
Average score of the school 365 341 373 371 364 465 441 459 472 460 530 472 523 519 522 – – – – –
Percentage (%) of students at or above NMS 82% 87% 87% 88% 90% 93% 88% 85% 92% 92% 98% 78% 92% 88% 97% – – – – –
Brigalow State School Brigalow 3 – 2 –
Average score of the school ∧ ∧ ∧ ∧ ∧ – – – – – ∧ ∧ ∧ ∧ ∧ – – – – –
Percentage (%) of students at or above NMS ∧ ∧ ∧ ∧ ∧ – – – – – ∧ ∧ ∧ ∧ ∧ – – – – –
Brighton State School Brighton 46 48 17 –
Average score of the school 405 381 395 418 401 494 456 491 491 482 530 515 545 540 539 – – – – –
Percentage (%) of students at or above NMS 91% 95% 93% 95% 98% 93% 91% 98% 93% 93% 81% 81% 88% 81% 88% – – – – –
Brightwater State School Mountain Creek 80 71 31 –
Average score of the school 439 425 438 466 426 522 485 497 513 508 538 533 535 542 543 – – – – –
Percentage (%) of students at or above NMS 99% 99% 100% 100% 100% 99% 99% 99% 100% 99% 97% 94% 100% 97% 97% – – – – –
Brigidine College Indooroopilly – – – 151
Average score of the school – – – – – – – – – – – – – – – 600 584 597 598 590
Percentage (%) of students at or above NMS – – – – – – – – – – – – – – – 99% 97% 99% 95% 100%
Brisbane Adventist College Wishart 49 52 32 47
Average score of the school 441 416 437 461 411 520 492 517 525 495 550 514 535 553 563 580 588 593 586 594
Percentage (%) of students at or above NMS 96% 90% 96% 94% 94% 98% 92% 100% 98% 100% 97% 90% 94% 97% 100% 98% 96% 98% 96% 98%
Brisbane Bayside State College Wynnum West – – – 179
Average score of the school – – – – – – – – – – – – – – – 561 511 565 549 561
Percentage (%) of students at or above NMS – – – – – – – – – – – – – – – 88% 75% 91% 83% 96%
Brisbane Boys’ College Toowong 32 83 109 210
Average score of the school 486 430 431 475 466 556 493 529 556 548 584 518 566 588 592 597 566 593 600 628
Percentage (%) of students at or above NMS 100% 100% 97% 100% 97% 100% 98% 99% 98% 99% 99% 89% 99% 100% 100% 97% 87% 96% 96% 99%
KEY∧ to maintain privacy of individual student information, where there are fewer than five students tested results are not provided∗ no students in the year level sat the test due to absence, exemption or withdrawal– no students in the year levelNMS National Minimum Standard (for further information see www.nap.edu.au)
Queensland Curriculum & Assessment Authority
Page 15 of 149
NAPLAN 2014 Outcomes — All Queensland schools

Year level enrolments Year 3 Year 5 Year 7 Year 9
School Locality Yr 3 Yr 5 Yr 7 Yr 9 READ WRIT SPEL GP NMCY READ WRIT SPEL GP NMCY READ WRIT SPEL GP NMCY READ WRIT SPEL GP NMCY
Brisbane Central State School Spring Hill 38 23 14 –
Average score of the school 447 425 460 482 452 482 464 498 489 497 582 554 578 609 593 – – – – –
Percentage (%) of students at or above NMS 92% 95% 92% 95% 100% 100% 87% 91% 91% 96% 100% 100% 100% 100% 100% – – – – –
Brisbane Christian College Salisbury 45 46 41 41
Average score of the school 435 409 430 454 400 522 464 511 526 506 550 516 544 555 543 578 537 579 579 590
Percentage (%) of students at or above NMS 100% 96% 96% 100% 93% 95% 91% 95% 95% 95% 95% 87% 95% 92% 100% 92% 73% 89% 89% 97%
Brisbane Girls Grammar School Brisbane – – – 243
Average score of the school – – – – – – – – – – – – – – – 650 630 635 654 669
Percentage (%) of students at or above NMS – – – – – – – – – – – – – – – 100% 99% 100% 100% 100%
Brisbane Grammar School Brisbane – 104 103 243
Average score of the school – – – – – 563 504 543 589 566 620 565 597 630 641 642 627 635 643 673
Percentage (%) of students at or above NMS – – – – – 100% 100% 98% 100% 100% 100% 99% 100% 99% 100% 98% 99% 100% 100% 100%
Brisbane Independent School (Kenmore) Pullenvale 3 3 1 –
Average score of the school ∧ ∧ ∧ ∧ ∧ ∧ ∧ ∧ ∧ ∧ ∧ ∧ ∧ ∧ ∧ – – – – –
Percentage (%) of students at or above NMS ∧ ∧ ∧ ∧ ∧ ∧ ∧ ∧ ∧ ∧ ∧ ∧ ∧ ∧ ∧ – – – – –
Brisbane Montessori School Fig Tree Pocket 21 12 9 –
Average score of the school 500 418 409 478 423 516 413 443 488 445 634 512 562 608 562 – – – – –
Percentage (%) of students at or above NMS 100% 100% 100% 100% 100% 100% 63% 88% 88% 75% 100% 100% 100% 100% 100% – – – – –
Brisbane School of Distance Education Coorparoo 72 83 88 204
Average score of the school 502 384 460 490 428 582 463 521 581 522 577 509 569 583 554 597 520 609 584 590
Percentage (%) of students at or above NMS 50% 46% 50% 50% 50% 53% 45% 51% 53% 55% 92% 85% 81% 88% 88% 74% 56% 73% 68% 76%
Brisbane State High School South Brisbane – – – 548
Average score of the school – – – – – – – – – – – – – – – 638 608 642 639 666
Percentage (%) of students at or above NMS – – – – – – – – – – – – – – – 99% 96% 99% 98% 100%
Brisbane Youth Education Training Centre Wacol – – – 1
Average score of the school – – – – – – – – – – – – – – – ∗ ∗ ∗ ∗ ∗Percentage (%) of students at or above NMS – – – – – – – – – – – – – – – ∗ ∗ ∗ ∗ ∗
Broadbeach State School Broadbeach 83 89 40 –
Average score of the school 410 403 418 438 409 523 503 535 559 524 541 504 566 555 554 – – – – –
Percentage (%) of students at or above NMS 95% 92% 99% 99% 97% 97% 99% 100% 99% 100% 97% 86% 97% 100% 97% – – – – –
Broadwater State School Broadwater via Stanthorpe 4 5 4 –
Average score of the school ∧ ∧ ∧ ∧ ∧ 301 293 377 333 362 ∧ ∧ ∧ ∧ ∧ – – – – –
Percentage (%) of students at or above NMS ∧ ∧ ∧ ∧ ∧ 60% 40% 40% 60% 80% ∧ ∧ ∧ ∧ ∧ – – – – –
Brookfield State School Brookfield 67 75 37 –
Average score of the school 479 445 437 508 448 563 505 524 557 537 603 575 576 608 608 – – – – –
Percentage (%) of students at or above NMS 97% 98% 97% 98% 98% 100% 100% 100% 100% 100% 100% 97% 97% 97% 100% – – – – –
KEY∧ to maintain privacy of individual student information, where there are fewer than five students tested results are not provided∗ no students in the year level sat the test due to absence, exemption or withdrawal– no students in the year levelNMS National Minimum Standard (for further information see www.nap.edu.au)
Queensland Curriculum & Assessment Authority
Page 16 of 149
NAPLAN 2014 Outcomes — All Queensland schools

Year level enrolments Year 3 Year 5 Year 7 Year 9
School Locality Yr 3 Yr 5 Yr 7 Yr 9 READ WRIT SPEL GP NMCY READ WRIT SPEL GP NMCY READ WRIT SPEL GP NMCY READ WRIT SPEL GP NMCY
Brookstead State School Brookstead 4 2 4 –
Average score of the school ∧ ∧ ∧ ∧ ∧ ∗ ∗ ∗ ∗ ∗ ∧ ∧ ∧ ∧ ∧ – – – – –
Percentage (%) of students at or above NMS ∧ ∧ ∧ ∧ ∧ ∗ ∗ ∗ ∗ ∗ ∧ ∧ ∧ ∧ ∧ – – – – –
Brooweena State School Brooweena 2 2 – –
Average score of the school ∧ ∧ ∧ ∧ ∧ ∧ ∧ ∧ ∧ ∧ – – – – – – – – – –
Percentage (%) of students at or above NMS ∧ ∧ ∧ ∧ ∧ ∧ ∧ ∧ ∧ ∧ – – – – – – – – – –
Browns Plains State High School Browns Plains – – – 223
Average score of the school – – – – – – – – – – – – – – – 557 534 565 548 563
Percentage (%) of students at or above NMS – – – – – – – – – – – – – – – 89% 75% 87% 85% 96%
Browns Plains State School Browns Plains 84 67 60 –
Average score of the school 357 370 368 376 356 459 437 464 453 445 516 474 536 519 512 – – – – –
Percentage (%) of students at or above NMS 82% 89% 80% 84% 86% 81% 75% 81% 78% 79% 86% 72% 83% 83% 85% – – – – –
Bucasia State School Bucasia 50 47 – –
Average score of the school 405 377 382 421 386 483 468 482 482 479 – – – – – – – – – –
Percentage (%) of students at or above NMS 90% 94% 92% 96% 100% 93% 87% 87% 91% 96% – – – – – – – – – –
Buddina State School Buddina 115 85 50 –
Average score of the school 417 397 421 427 400 498 453 500 489 480 516 501 537 509 532 – – – – –
Percentage (%) of students at or above NMS 96% 94% 95% 93% 97% 95% 90% 98% 95% 91% 100% 87% 98% 91% 100% – – – – –
Buderim Mountain State School Buderim 132 140 89 –
Average score of the school 438 392 421 464 421 534 489 500 521 509 553 528 543 565 565 – – – – –
Percentage (%) of students at or above NMS 94% 91% 96% 96% 96% 97% 93% 96% 96% 95% 99% 94% 95% 98% 98% – – – – –
Builyan State School Builyan via Gladstone 1 1 2 –
Average score of the school ∧ ∧ ∧ ∧ ∧ ∧ ∧ ∧ ∧ ∧ ∧ ∧ ∧ ∧ ∧ – – – – –
Percentage (%) of students at or above NMS ∧ ∧ ∧ ∧ ∧ ∧ ∧ ∧ ∧ ∧ ∧ ∧ ∧ ∧ ∧ – – – – –
Bulimba State School Bulimba 122 92 40 –
Average score of the school 461 424 437 481 434 536 484 518 544 508 584 533 563 596 591 – – – – –
Percentage (%) of students at or above NMS 97% 97% 97% 97% 98% 99% 95% 98% 98% 98% 100% 100% 97% 97% 100% – – – – –
Bullyard State School Gin Gin 4 3 2 –
Average score of the school ∧ ∧ ∧ ∧ ∧ ∧ ∧ ∧ ∧ ∧ ∧ ∧ ∧ ∧ ∧ – – – – –
Percentage (%) of students at or above NMS ∧ ∧ ∧ ∧ ∧ ∧ ∧ ∧ ∧ ∧ ∧ ∧ ∧ ∧ ∧ – – – – –
Bundaberg Central State School Bundaberg 9 7 8 –
Average score of the school 322 322 326 322 309 443 405 440 415 434 476 437 459 462 465 – – – – –
Percentage (%) of students at or above NMS 63% 89% 78% 67% 50% 80% 71% 86% 57% 100% 75% 63% 50% 50% 75% – – – – –
Bundaberg Christian College Bundaberg 32 40 50 76
Average score of the school 408 364 373 376 377 447 438 455 442 443 542 488 531 544 542 572 518 556 569 593
Percentage (%) of students at or above NMS 100% 91% 91% 91% 100% 92% 79% 95% 87% 89% 98% 89% 96% 89% 98% 90% 72% 90% 94% 96%
KEY∧ to maintain privacy of individual student information, where there are fewer than five students tested results are not provided∗ no students in the year level sat the test due to absence, exemption or withdrawal– no students in the year levelNMS National Minimum Standard (for further information see www.nap.edu.au)
Queensland Curriculum & Assessment Authority
Page 17 of 149
NAPLAN 2014 Outcomes — All Queensland schools

Year level enrolments Year 3 Year 5 Year 7 Year 9
School Locality Yr 3 Yr 5 Yr 7 Yr 9 READ WRIT SPEL GP NMCY READ WRIT SPEL GP NMCY READ WRIT SPEL GP NMCY READ WRIT SPEL GP NMCY
Bundaberg East State School Bundaberg East 69 63 43 –
Average score of the school 415 417 424 453 422 505 472 507 546 511 548 522 558 560 585 – – – – –
Percentage (%) of students at or above NMS 100% 100% 100% 100% 100% 100% 96% 100% 98% 100% 97% 92% 100% 100% 97% – – – – –
Bundaberg North State High School Bundaberg North – – – 152
Average score of the school – – – – – – – – – – – – – – – 542 518 550 550 565
Percentage (%) of students at or above NMS – – – – – – – – – – – – – – – 85% 75% 84% 89% 98%
Bundaberg North State School Bundaberg North 62 54 44 –
Average score of the school 383 392 384 380 371 500 423 487 503 476 538 458 524 526 531 – – – – –
Percentage (%) of students at or above NMS 86% 94% 96% 92% 96% 100% 68% 95% 95% 95% 98% 67% 90% 88% 90% – – – – –
Bundaberg South State School Bundaberg South 23 30 17 –
Average score of the school 371 380 382 382 387 467 437 475 463 466 500 472 494 492 515 – – – – –
Percentage (%) of students at or above NMS 91% 95% 95% 95% 95% 93% 90% 100% 90% 90% 94% 76% 88% 82% 94% – – – – –
Bundaberg Special School Bundaberg 6 8 15 14
Average score of the school ∗ ∗ ∗ ∗ ∗ ∗ ∗ ∗ ∗ ∗ ∗ ∗ ∗ ∗ ∗ ∗ ∗ ∗ ∗ ∗Percentage (%) of students at or above NMS ∗ ∗ ∗ ∗ ∗ ∗ ∗ ∗ ∗ ∗ ∗ ∗ ∗ ∗ ∗ ∗ ∗ ∗ ∗ ∗
Bundaberg State High School Bundaberg – – – 276
Average score of the school – – – – – – – – – – – – – – – 557 515 558 551 570
Percentage (%) of students at or above NMS – – – – – – – – – – – – – – – 85% 61% 81% 78% 89%
Bundaberg West State School Bundaberg West 37 37 21 –
Average score of the school 344 329 348 354 353 465 388 456 451 440 502 442 499 482 481 – – – – –
Percentage (%) of students at or above NMS 76% 82% 79% 82% 85% 83% 53% 84% 91% 83% 89% 70% 70% 75% 94% – – – – –
Bundamba State School Bundamba 97 81 41 –
Average score of the school 360 324 336 352 360 447 414 431 429 441 499 456 465 488 502 – – – – –
Percentage (%) of students at or above NMS 81% 81% 77% 86% 94% 87% 74% 73% 73% 83% 83% 56% 61% 81% 95% – – – – –
Bundamba State Secondary College Bundamba – – – 173
Average score of the school – – – – – – – – – – – – – – – 520 472 531 509 531
Percentage (%) of students at or above NMS – – – – – – – – – – – – – – – 70% 48% 78% 65% 89%
Bungunya State School Bungunya 2 6 – –
Average score of the school ∧ ∧ ∧ ∧ ∧ 438 450 418 470 459 – – – – – – – – – –
Percentage (%) of students at or above NMS ∧ ∧ ∧ ∧ ∧ 67% 67% 67% 67% 83% – – – – – – – – – –
Bunker’s Hill State School Westbrook via Toowoomba 35 26 13 –
Average score of the school 402 398 403 427 391 518 477 512 516 493 549 491 554 537 562 – – – – –
Percentage (%) of students at or above NMS 89% 100% 97% 94% 100% 100% 96% 100% 100% 100% 100% 85% 100% 100% 100% – – – – –
Buranda State School Buranda 31 21 22 –
Average score of the school 463 413 452 490 441 578 547 551 599 539 593 586 568 594 592 – – – – –
Percentage (%) of students at or above NMS 97% 100% 100% 100% 97% 100% 100% 100% 100% 100% 100% 100% 100% 100% 100% – – – – –
KEY∧ to maintain privacy of individual student information, where there are fewer than five students tested results are not provided∗ no students in the year level sat the test due to absence, exemption or withdrawal– no students in the year levelNMS National Minimum Standard (for further information see www.nap.edu.au)
Queensland Curriculum & Assessment Authority
Page 18 of 149
NAPLAN 2014 Outcomes — All Queensland schools

Year level enrolments Year 3 Year 5 Year 7 Year 9
School Locality Yr 3 Yr 5 Yr 7 Yr 9 READ WRIT SPEL GP NMCY READ WRIT SPEL GP NMCY READ WRIT SPEL GP NMCY READ WRIT SPEL GP NMCY
Burdekin Catholic High School Ayr – – – 80
Average score of the school – – – – – – – – – – – – – – – 588 573 601 594 610
Percentage (%) of students at or above NMS – – – – – – – – – – – – – – – 96% 90% 96% 95% 97%
Burdekin Christian College Ayr 19 11 15 –
Average score of the school 395 348 377 375 353 475 421 479 464 431 552 480 567 557 576 – – – – –
Percentage (%) of students at or above NMS 94% 88% 94% 88% 100% 90% 80% 90% 80% 80% 100% 85% 100% 100% 93% – – – – –
Burdekin School Ayr 1 2 – 2
Average score of the school ∗ ∗ ∗ ∗ ∗ ∗ ∗ ∗ ∗ ∗ – – – – – ∗ ∗ ∗ ∗ ∗Percentage (%) of students at or above NMS ∗ ∗ ∗ ∗ ∗ ∗ ∗ ∗ ∗ ∗ – – – – – ∗ ∗ ∗ ∗ ∗
Burketown State School Burketown 3 1 2 –
Average score of the school ∧ ∧ ∧ ∧ ∧ ∧ ∧ ∧ ∧ ∧ ∧ ∧ ∧ ∧ ∧ – – – – –
Percentage (%) of students at or above NMS ∧ ∧ ∧ ∧ ∧ ∧ ∧ ∧ ∧ ∧ ∧ ∧ ∧ ∧ ∧ – – – – –
Burleigh Heads State School Burleigh Heads 87 75 50 –
Average score of the school 385 371 374 396 375 482 436 471 488 455 531 510 519 522 535 – – – – –
Percentage (%) of students at or above NMS 87% 89% 85% 95% 93% 91% 78% 86% 91% 87% 93% 93% 88% 88% 93% – – – – –
Burnett Heads State School Burnett Heads 20 16 11 –
Average score of the school 374 394 372 392 358 425 420 423 469 457 515 464 523 522 510 – – – – –
Percentage (%) of students at or above NMS 95% 95% 95% 90% 90% 60% 80% 80% 80% 79% 90% 90% 80% 70% 90% – – – – –
Burnett State College Gayndah – – – 50
Average score of the school – – – – – – – – – – – – – – – 570 527 574 568 578
Percentage (%) of students at or above NMS – – – – – – – – – – – – – – – 95% 73% 92% 86% 97%
Burnett Youth Learning Centre Bundaberg South – – – 7
Average score of the school – – – – – – – – – – – – – – – ∗ ∗ ∗ ∗ ∗Percentage (%) of students at or above NMS – – – – – – – – – – – – – – – ∗ ∗ ∗ ∗ ∗
Burnside State High School Nambour – – – 146
Average score of the school – – – – – – – – – – – – – – – 572 511 562 553 579
Percentage (%) of students at or above NMS – – – – – – – – – – – – – – – 93% 67% 86% 87% 99%
Burnside State School Nambour 68 66 37 –
Average score of the school 384 385 377 385 376 472 443 471 474 459 515 485 496 500 538 – – – – –
Percentage (%) of students at or above NMS 83% 92% 89% 91% 92% 81% 77% 84% 84% 84% 88% 76% 76% 76% 100% – – – – –
Burpengary Meadows State School Burpengary 80 59 56 –
Average score of the school 394 374 380 385 366 501 439 476 491 463 521 489 512 525 522 – – – – –
Percentage (%) of students at or above NMS 91% 95% 92% 90% 89% 96% 86% 91% 96% 93% 94% 88% 90% 98% 98% – – – – –
Burpengary State School Burpengary 162 123 102 –
Average score of the school 389 390 388 394 378 491 460 488 492 476 534 495 543 539 542 – – – – –
Percentage (%) of students at or above NMS 91% 96% 94% 92% 93% 93% 92% 94% 89% 92% 98% 86% 96% 94% 98% – – – – –
KEY∧ to maintain privacy of individual student information, where there are fewer than five students tested results are not provided∗ no students in the year level sat the test due to absence, exemption or withdrawal– no students in the year levelNMS National Minimum Standard (for further information see www.nap.edu.au)
Queensland Curriculum & Assessment Authority
Page 19 of 149
NAPLAN 2014 Outcomes — All Queensland schools

Year level enrolments Year 3 Year 5 Year 7 Year 9
School Locality Yr 3 Yr 5 Yr 7 Yr 9 READ WRIT SPEL GP NMCY READ WRIT SPEL GP NMCY READ WRIT SPEL GP NMCY READ WRIT SPEL GP NMCY
Burra Burri State School Burra Burri 1 2 1 –
Average score of the school ∧ ∧ ∧ ∧ ∧ ∧ ∧ ∧ ∧ ∧ ∧ ∧ ∧ ∧ ∧ – – – – –
Percentage (%) of students at or above NMS ∧ ∧ ∧ ∧ ∧ ∧ ∧ ∧ ∧ ∧ ∧ ∧ ∧ ∧ ∧ – – – – –
Burrowes State School Marsden 114 79 55 –
Average score of the school 364 335 362 357 337 435 418 455 439 422 492 453 497 486 486 – – – – –
Percentage (%) of students at or above NMS 84% 84% 81% 85% 91% 83% 78% 79% 81% 78% 93% 63% 92% 82% 91% – – – – –
Butchers Creek State School Butchers Creek 2 3 2 –
Average score of the school ∧ ∧ ∧ ∧ ∧ ∧ ∧ ∧ ∧ ∧ ∧ ∧ ∧ ∧ ∧ – – – – –
Percentage (%) of students at or above NMS ∧ ∧ ∧ ∧ ∧ ∧ ∧ ∧ ∧ ∧ ∧ ∧ ∧ ∧ ∧ – – – – –
Bwgcolman Community School Palm Island 18 23 22 28
Average score of the school 269 287 279 274 262 348 242 329 351 346 423 321 387 384 426 424 275 386 379 472
Percentage (%) of students at or above NMS 50% 75% 44% 56% 53% 26% 15% 30% 35% 25% 53% 20% 33% 20% 50% 25% 0% 8% 0% 45%
Byfield State School Byfield 6 6 – –
Average score of the school 464 415 402 447 418 487 445 460 481 448 – – – – – – – – – –
Percentage (%) of students at or above NMS 83% 83% 83% 83% 83% 83% 83% 83% 83% 83% – – – – – – – – – –
Bymount East State School Bymount via Roma 2 1 – –
Average score of the school ∧ ∧ ∧ ∧ ∧ ∧ ∧ ∧ ∧ ∧ – – – – – – – – – –
Percentage (%) of students at or above NMS ∧ ∧ ∧ ∧ ∧ ∧ ∧ ∧ ∧ ∧ – – – – – – – – – –
Caboolture East State School Caboolture 82 80 65 –
Average score of the school 343 331 333 353 345 434 379 441 442 432 504 455 512 503 498 – – – – –
Percentage (%) of students at or above NMS 82% 87% 77% 84% 93% 78% 57% 78% 86% 79% 92% 64% 92% 86% 94% – – – – –
Caboolture Special School Morayfield 18 12 18 26
Average score of the school ∗ ∗ ∗ ∗ ∗ ∗ ∗ ∗ ∗ ∗ ∗ ∗ ∗ ∗ ∗ ∗ ∗ ∗ ∗ ∗Percentage (%) of students at or above NMS ∗ ∗ ∗ ∗ ∗ ∗ ∗ ∗ ∗ ∗ ∗ ∗ ∗ ∗ ∗ ∗ ∗ ∗ ∗ ∗
Caboolture State High School Caboolture – – – 233
Average score of the school – – – – – – – – – – – – – – – 553 517 559 545 559
Percentage (%) of students at or above NMS – – – – – – – – – – – – – – – 90% 66% 87% 85% 97%
Caboolture State School Caboolture 79 68 47 –
Average score of the school 371 361 366 353 357 451 425 452 441 440 500 451 482 486 486 – – – – –
Percentage (%) of students at or above NMS 83% 91% 87% 84% 91% 88% 79% 82% 80% 84% 89% 67% 73% 76% 89% – – – – –
Cairns Adventist College Gordonvale 13 10 6 –
Average score of the school 389 391 406 431 397 463 434 474 445 454 583 561 590 603 590 – – – – –
Percentage (%) of students at or above NMS 85% 92% 92% 92% 92% 100% 90% 90% 80% 100% 100% 100% 100% 100% 100% – – – – –
Cairns School of Distance Education Manunda Cairns 12 10 11 28
Average score of the school 463 362 448 562 452 490 ∧ ∧ ∧ 474 ∧ ∧ ∧ ∧ ∧ 596 572 591 585 587
Percentage (%) of students at or above NMS 100% 83% 100% 100% 100% 67% ∧ ∧ ∧ 83% ∧ ∧ ∧ ∧ ∧ 67% 50% 83% 83% 83%
KEY∧ to maintain privacy of individual student information, where there are fewer than five students tested results are not provided∗ no students in the year level sat the test due to absence, exemption or withdrawal– no students in the year levelNMS National Minimum Standard (for further information see www.nap.edu.au)
Queensland Curriculum & Assessment Authority
Page 20 of 149
NAPLAN 2014 Outcomes — All Queensland schools

Year level enrolments Year 3 Year 5 Year 7 Year 9
School Locality Yr 3 Yr 5 Yr 7 Yr 9 READ WRIT SPEL GP NMCY READ WRIT SPEL GP NMCY READ WRIT SPEL GP NMCY READ WRIT SPEL GP NMCY
Cairns State High School Cairns – – – 296
Average score of the school – – – – – – – – – – – – – – – 582 556 585 575 590
Percentage (%) of students at or above NMS – – – – – – – – – – – – – – – 95% 84% 91% 92% 97%
Cairns West State School Manunda Cairns 100 78 52 –
Average score of the school 334 326 364 346 315 398 390 434 401 390 467 428 504 445 463 – – – – –
Percentage (%) of students at or above NMS 79% 80% 84% 82% 81% 58% 56% 77% 62% 50% 79% 49% 83% 57% 83% – – – – –
Calamvale Community College Calamvale 160 142 95 200
Average score of the school 400 373 407 403 385 481 448 485 490 480 525 504 527 520 534 561 546 576 555 569
Percentage (%) of students at or above NMS 95% 95% 94% 96% 95% 92% 85% 91% 93% 94% 89% 87% 89% 85% 93% 88% 81% 89% 83% 95%
Calamvale State Special School Calamvale 9 10 5 6
Average score of the school ∗ ∗ ∗ ∗ ∗ ∗ ∗ ∗ ∗ ∗ ∗ ∗ ∗ ∗ ∗ ∗ ∗ ∗ ∗ ∗Percentage (%) of students at or above NMS ∗ ∗ ∗ ∗ ∗ ∗ ∗ ∗ ∗ ∗ ∗ ∗ ∗ ∗ ∗ ∗ ∗ ∗ ∗ ∗
Calen District State College Calen 17 17 5 20
Average score of the school 391 370 387 383 359 487 454 472 505 487 ∧ ∧ ∧ ∧ ∧ 568 483 543 547 559
Percentage (%) of students at or above NMS 94% 94% 100% 81% 88% 100% 100% 88% 94% 94% ∧ ∧ ∧ ∧ ∧ 95% 58% 84% 79% 89%
Calliope State School Calliope 72 70 44 –
Average score of the school 400 393 389 409 386 482 449 473 471 460 539 493 530 540 537 – – – – –
Percentage (%) of students at or above NMS 90% 99% 96% 94% 95% 93% 94% 94% 91% 94% 95% 88% 95% 93% 100% – – – – –
Caloundra Christian College Caloundra 29 29 35 28
Average score of the school 394 395 392 404 366 493 460 478 480 474 525 486 520 522 512 552 514 557 552 557
Percentage (%) of students at or above NMS 100% 96% 100% 96% 96% 100% 86% 96% 93% 100% 94% 94% 91% 97% 97% 78% 61% 89% 86% 96%
Caloundra City Private School Pelican Waters 20 26 23 23
Average score of the school 453 415 427 442 437 512 482 531 540 542 583 539 562 579 572 612 575 610 616 608
Percentage (%) of students at or above NMS 95% 100% 95% 95% 100% 96% 96% 100% 100% 100% 100% 100% 100% 96% 100% 100% 100% 100% 100% 100%
Caloundra State High School Caloundra – – – 222
Average score of the school – – – – – – – – – – – – – – – 571 551 576 572 580
Percentage (%) of students at or above NMS – – – – – – – – – – – – – – – 95% 86% 94% 91% 99%
Caloundra State School Caloundra 76 58 53 –
Average score of the school 425 391 397 438 417 503 466 512 512 482 567 522 551 570 554 – – – – –
Percentage (%) of students at or above NMS 99% 95% 92% 95% 100% 100% 96% 100% 96% 96% 100% 98% 98% 98% 100% – – – – –
Calvary Christian College Mount Louisa 59 59 55 78
Average score of the school 403 384 368 399 388 493 467 479 494 476 530 490 523 534 529 560 527 568 557 557
Percentage (%) of students at or above NMS 93% 95% 95% 93% 95% 100% 96% 93% 98% 95% 94% 89% 94% 91% 94% 83% 78% 88% 83% 92%
Calvary Christian College Carbrook 94 95 75 76
Average score of the school 438 408 412 434 414 500 470 488 504 482 554 518 541 560 562 580 542 571 570 584
Percentage (%) of students at or above NMS 98% 95% 98% 98% 98% 97% 96% 96% 98% 98% 100% 96% 99% 99% 100% 90% 78% 90% 87% 99%
KEY∧ to maintain privacy of individual student information, where there are fewer than five students tested results are not provided∗ no students in the year level sat the test due to absence, exemption or withdrawal– no students in the year levelNMS National Minimum Standard (for further information see www.nap.edu.au)
Queensland Curriculum & Assessment Authority
Page 21 of 149
NAPLAN 2014 Outcomes — All Queensland schools

Year level enrolments Year 3 Year 5 Year 7 Year 9
School Locality Yr 3 Yr 5 Yr 7 Yr 9 READ WRIT SPEL GP NMCY READ WRIT SPEL GP NMCY READ WRIT SPEL GP NMCY READ WRIT SPEL GP NMCY
Cambooya State School Cambooya 18 17 6 –
Average score of the school 414 403 397 435 381 478 469 465 479 452 ∧ 490 556 524 ∧ – – – – –
Percentage (%) of students at or above NMS 94% 100% 100% 94% 94% 94% 94% 88% 94% 94% ∧ 60% 100% 100% ∧ – – – – –
Camira State School Camira 94 95 43 –
Average score of the school 379 372 369 396 367 449 419 445 443 440 500 462 492 492 496 – – – – –
Percentage (%) of students at or above NMS 91% 90% 85% 95% 94% 75% 74% 79% 75% 83% 86% 77% 81% 81% 88% – – – – –
Camooweal State School Camooweal 3 7 2 –
Average score of the school ∧ ∧ ∧ ∧ ∧ 338 363 388 340 367 ∧ ∧ ∧ ∧ ∧ – – – – –
Percentage (%) of students at or above NMS ∧ ∧ ∧ ∧ ∧ 0% 43% 57% 29% 43% ∧ ∧ ∧ ∧ ∧ – – – – –
Camp Hill State Infants and Primary School Camp Hill 119 88 44 –
Average score of the school 453 389 414 468 424 534 467 502 535 502 546 514 535 572 552 – – – – –
Percentage (%) of students at or above NMS 96% 94% 96% 96% 97% 98% 93% 97% 98% 95% 86% 88% 86% 88% 90% – – – – –
Candlenut Steiner School Kuranda – 2 – 1
Average score of the school – – – – – ∧ ∧ ∧ ∧ ∧ – – – – – ∧ ∧ ∧ ∧ ∧Percentage (%) of students at or above NMS – – – – – ∧ ∧ ∧ ∧ ∧ – – – – – ∧ ∧ ∧ ∧ ∧
Caningeraba State School Burleigh Waters 122 119 76 –
Average score of the school 407 381 403 417 404 500 482 506 514 504 546 520 544 564 560 – – – – –
Percentage (%) of students at or above NMS 93% 97% 96% 97% 97% 97% 95% 99% 97% 98% 99% 90% 99% 97% 99% – – – – –
Cannon Hill Anglican College Cannon Hill – 28 58 145
Average score of the school – – – – – 556 523 550 555 537 619 556 586 629 606 630 597 624 636 632
Percentage (%) of students at or above NMS – – – – – 100% 100% 100% 100% 100% 100% 97% 98% 100% 100% 99% 96% 99% 99% 100%
Cannon Hill State School Cannon Hill 37 37 13 –
Average score of the school 450 391 441 442 410 520 483 505 511 491 554 494 570 542 528 – – – – –
Percentage (%) of students at or above NMS 95% 92% 97% 95% 100% 97% 91% 97% 94% 100% 100% 89% 100% 100% 100% – – – – –
Cannonvale State School Cannonvale 84 76 47 –
Average score of the school 390 376 378 405 370 493 444 470 484 476 550 521 524 534 533 – – – – –
Percentage (%) of students at or above NMS 90% 90% 93% 96% 90% 93% 88% 91% 89% 88% 96% 91% 94% 91% 96% – – – – –
Canterbury College Waterford 58 83 76 148
Average score of the school 453 438 440 482 431 512 492 511 527 503 555 524 541 555 558 608 597 611 608 621
Percentage (%) of students at or above NMS 98% 100% 100% 98% 98% 100% 96% 99% 99% 96% 99% 92% 94% 94% 100% 100% 94% 97% 98% 100%
Canungra State School Canungra 54 56 42 –
Average score of the school 393 385 396 428 373 486 449 462 478 467 555 497 538 544 541 – – – – –
Percentage (%) of students at or above NMS 96% 98% 94% 98% 96% 96% 94% 90% 92% 98% 97% 85% 95% 95% 95% – – – – –
Capalaba State College Capalaba 62 75 37 84
Average score of the school 373 337 353 377 353 478 427 467 493 478 519 493 543 521 507 550 512 557 533 544
Percentage (%) of students at or above NMS 87% 88% 80% 92% 82% 86% 72% 80% 90% 93% 91% 85% 91% 91% 100% 91% 69% 90% 78% 94%
KEY∧ to maintain privacy of individual student information, where there are fewer than five students tested results are not provided∗ no students in the year level sat the test due to absence, exemption or withdrawal– no students in the year levelNMS National Minimum Standard (for further information see www.nap.edu.au)
Queensland Curriculum & Assessment Authority
Page 22 of 149
NAPLAN 2014 Outcomes — All Queensland schools

Year level enrolments Year 3 Year 5 Year 7 Year 9
School Locality Yr 3 Yr 5 Yr 7 Yr 9 READ WRIT SPEL GP NMCY READ WRIT SPEL GP NMCY READ WRIT SPEL GP NMCY READ WRIT SPEL GP NMCY
Capella State High School Capella – – – 34
Average score of the school – – – – – – – – – – – – – – – 566 556 577 561 576
Percentage (%) of students at or above NMS – – – – – – – – – – – – – – – 100% 71% 89% 89% 96%
Capella State School Capella 22 28 17 –
Average score of the school 392 415 384 417 398 473 438 463 454 455 537 502 535 538 509 – – – – –
Percentage (%) of students at or above NMS 95% 100% 86% 100% 100% 86% 79% 89% 86% 96% 94% 94% 94% 94% 94% – – – – –
Capricornia (Emerald Campus) School of
Distance Education
Emerald 21 19 13 14
Average score of the school 432 407 405 454 419 546 519 526 562 517 567 499 555 572 559 ∧ ∧ ∧ ∧ ∧Percentage (%) of students at or above NMS 93% 100% 88% 94% 100% 100% 100% 100% 100% 100% 90% 90% 80% 90% 100% ∧ ∧ ∧ ∧ ∧
Caravonica State School Caravonica 61 65 31 –
Average score of the school 405 409 420 447 395 512 469 506 521 487 532 511 549 537 536 – – – – –
Percentage (%) of students at or above NMS 97% 98% 97% 100% 98% 98% 87% 95% 94% 95% 100% 90% 97% 90% 97% – – – – –
Carbrook State School Carbrook 72 50 36 –
Average score of the school 412 406 401 426 385 495 471 491 503 481 553 509 546 550 538 – – – – –
Percentage (%) of students at or above NMS 100% 100% 95% 98% 98% 98% 95% 98% 95% 100% 97% 90% 100% 97% 100% – – – – –
Cardwell State School Cardwell 10 11 7 –
Average score of the school 455 428 459 455 422 475 449 480 485 470 527 499 545 497 521 – – – – –
Percentage (%) of students at or above NMS 100% 100% 100% 100% 100% 100% 100% 100% 100% 100% 100% 83% 100% 100% 100% – – – – –
Carina State School Carina 51 52 28 –
Average score of the school 421 411 423 423 405 479 435 475 487 470 562 488 541 557 560 – – – – –
Percentage (%) of students at or above NMS 98% 100% 96% 96% 100% 88% 82% 88% 88% 86% 100% 96% 96% 100% 100% – – – – –
Carinity Education - Glendyne Nikenbah – – 7 24
Average score of the school – – – – – – – – – – ∧ ∧ ∧ ∧ ∧ 494 242 465 476 485
Percentage (%) of students at or above NMS – – – – – – – – – – ∧ ∧ ∧ ∧ ∧ 50% 11% 55% 40% 64%
Carinity Education - Southside Sunnybank – – – 10
Average score of the school – – – – – – – – – – – – – – – 540 292 610 652 582
Percentage (%) of students at or above NMS – – – – – – – – – – – – – – – 75% 25% 100% 100% 100%
Carlisle Christian College Beaconsfield 9 10 7 8
Average score of the school 307 318 313 335 350 471 430 473 460 459 610 519 582 614 588 520 501 511 517 554
Percentage (%) of students at or above NMS 56% 78% 67% 100% 89% 88% 100% 100% 86% 100% 100% 83% 100% 100% 100% 71% 57% 57% 71% 83%
Carmel College Thornlands – – – 210
Average score of the school – – – – – – – – – – – – – – – 574 552 575 572 592
Percentage (%) of students at or above NMS – – – – – – – – – – – – – – – 95% 86% 95% 94% 100%
KEY∧ to maintain privacy of individual student information, where there are fewer than five students tested results are not provided∗ no students in the year level sat the test due to absence, exemption or withdrawal– no students in the year levelNMS National Minimum Standard (for further information see www.nap.edu.au)
Queensland Curriculum & Assessment Authority
Page 23 of 149
NAPLAN 2014 Outcomes — All Queensland schools

Year level enrolments Year 3 Year 5 Year 7 Year 9
School Locality Yr 3 Yr 5 Yr 7 Yr 9 READ WRIT SPEL GP NMCY READ WRIT SPEL GP NMCY READ WRIT SPEL GP NMCY READ WRIT SPEL GP NMCY
Carmila State School Carmila 4 5 4 –
Average score of the school ∧ ∧ ∧ ∧ ∧ 594 459 546 544 533 ∧ ∧ ∧ ∧ ∧ – – – – –
Percentage (%) of students at or above NMS ∧ ∧ ∧ ∧ ∧ 100% 100% 100% 100% 100% ∧ ∧ ∧ ∧ ∧ – – – – –
Carole Park State School Carole Park 26 26 17 –
Average score of the school 338 325 359 342 336 420 436 468 435 426 476 434 482 477 489 – – – – –
Percentage (%) of students at or above NMS 80% 83% 96% 88% 92% 87% 86% 95% 90% 82% 69% 56% 75% 81% 94% – – – – –
Cavendish Road State High School Holland Park – – – 260
Average score of the school – – – – – – – – – – – – – – – 593 576 600 589 615
Percentage (%) of students at or above NMS – – – – – – – – – – – – – – – 95% 91% 95% 95% 99%
Cawarral State School Cawarral 12 12 9 –
Average score of the school 384 341 357 400 398 490 451 485 524 471 539 490 516 556 515 – – – – –
Percentage (%) of students at or above NMS 91% 82% 82% 91% 100% 70% 64% 75% 75% 67% 86% 71% 86% 86% 86% – – – – –
Cecil Plains State School Cecil Plains 7 7 5 5
Average score of the school 325 360 294 311 299 466 446 437 453 421 560 528 556 554 559 ∧ ∧ ∧ ∧ ∧Percentage (%) of students at or above NMS 86% 100% 57% 86% 71% 71% 71% 86% 71% 71% 100% 100% 100% 100% 100% ∧ ∧ ∧ ∧ ∧
Cedar Creek State School Cedar Creek 23 26 19 –
Average score of the school 412 407 402 422 407 523 469 512 518 486 562 520 537 553 583 – – – – –
Percentage (%) of students at or above NMS 95% 100% 100% 100% 95% 100% 95% 100% 95% 100% 100% 94% 93% 100% 100% – – – – –
Centenary Heights State High School Toowoomba – – – 285
Average score of the school – – – – – – – – – – – – – – – 587 554 583 586 593
Percentage (%) of students at or above NMS – – – – – – – – – – – – – – – 95% 86% 95% 90% 98%
Centenary State High School Jindalee – – – 271
Average score of the school – – – – – – – – – – – – – – – 577 552 593 578 593
Percentage (%) of students at or above NMS – – – – – – – – – – – – – – – 94% 82% 98% 93% 99%
Central Queensland Christian College Berserker 2 6 5 6
Average score of the school ∧ ∧ ∧ ∧ ∧ 544 468 522 554 505 593 456 562 567 548 ∧ ∧ ∧ ∧ 571
Percentage (%) of students at or above NMS ∧ ∧ ∧ ∧ ∧ 100% 100% 100% 100% 100% 100% 60% 100% 100% 100% ∧ ∧ ∧ ∧ 80%
Chancellor State College Sippy Downs 139 154 111 305
Average score of the school 406 394 388 433 404 506 460 496 520 490 557 520 538 551 548 585 565 588 584 591
Percentage (%) of students at or above NMS 95% 99% 97% 98% 97% 96% 90% 97% 97% 97% 96% 89% 94% 92% 96% 95% 86% 95% 94% 97%
Chanel College Gladstone – – – 129
Average score of the school – – – – – – – – – – – – – – – 588 557 591 584 592
Percentage (%) of students at or above NMS – – – – – – – – – – – – – – – 91% 82% 90% 93% 96%
Chapel Hill State School Chapel Hill 89 66 51 –
Average score of the school 498 452 450 509 453 577 499 536 578 541 605 582 586 618 619 – – – – –
Percentage (%) of students at or above NMS 99% 100% 100% 99% 96% 98% 94% 98% 98% 98% 100% 98% 98% 98% 98% – – – – –
KEY∧ to maintain privacy of individual student information, where there are fewer than five students tested results are not provided∗ no students in the year level sat the test due to absence, exemption or withdrawal– no students in the year levelNMS National Minimum Standard (for further information see www.nap.edu.au)
Queensland Curriculum & Assessment Authority
Page 24 of 149
NAPLAN 2014 Outcomes — All Queensland schools

Year level enrolments Year 3 Year 5 Year 7 Year 9
School Locality Yr 3 Yr 5 Yr 7 Yr 9 READ WRIT SPEL GP NMCY READ WRIT SPEL GP NMCY READ WRIT SPEL GP NMCY READ WRIT SPEL GP NMCY
Charleville School of Distance Education Charleville 11 15 6 6
Average score of the school 462 428 430 484 439 563 479 523 582 531 608 568 648 617 610 559 547 562 554 553
Percentage (%) of students at or above NMS 100% 100% 100% 100% 100% 100% 93% 93% 100% 100% 100% 100% 100% 100% 100% 83% 83% 83% 83% 83%
Charleville State High School Charleville – – – 58
Average score of the school – – – – – – – – – – – – – – – 543 472 546 523 542
Percentage (%) of students at or above NMS – – – – – – – – – – – – – – – 80% 65% 79% 75% 89%
Charleville State School Charleville 39 29 21 –
Average score of the school 323 333 306 317 336 415 359 415 398 400 470 440 484 463 461 – – – – –
Percentage (%) of students at or above NMS 67% 83% 66% 74% 90% 74% 52% 67% 70% 63% 85% 63% 74% 63% 80% – – – – –
Charters Towers Central State School Charters Towers 20 21 16 –
Average score of the school 375 360 380 463 333 475 413 469 562 456 584 519 562 538 530 – – – – –
Percentage (%) of students at or above NMS 93% 94% 100% 94% 88% 89% 76% 94% 100% 100% 100% 100% 100% 92% 100% – – – – –
Charters Towers School of Distance
Education
Charters Towers 29 20 15 29
Average score of the school 375 393 354 405 385 493 457 458 508 446 555 472 514 527 511 558 537 549 555 546
Percentage (%) of students at or above NMS 100% 100% 100% 93% 100% 100% 100% 100% 100% 91% 91% 75% 83% 75% 100% 82% 64% 91% 82% 100%
Charters Towers State High School Charters Towers – – – 83
Average score of the school – – – – – – – – – – – – – – – 507 440 528 514 534
Percentage (%) of students at or above NMS – – – – – – – – – – – – – – – 65% 40% 73% 65% 89%
Chatswood Hills State School Springwood 82 93 39 –
Average score of the school 407 398 398 418 397 498 465 488 501 485 529 509 526 533 535 – – – – –
Percentage (%) of students at or above NMS 88% 99% 96% 91% 95% 98% 89% 93% 96% 93% 97% 95% 81% 89% 97% – – – – –
Chatsworth State School Chatsworth via Gympie 26 24 13 –
Average score of the school 367 394 379 411 389 493 421 473 484 467 499 477 527 514 499 – – – – –
Percentage (%) of students at or above NMS 95% 100% 95% 95% 100% 100% 72% 94% 100% 100% 75% 92% 92% 100% 100% – – – – –
Chelona State School Chelona 10 8 4 –
Average score of the school 385 367 371 420 401 595 500 573 605 549 ∧ ∧ ∧ ∧ ∧ – – – – –
Percentage (%) of students at or above NMS 100% 100% 100% 100% 100% 100% 100% 100% 100% 100% ∧ ∧ ∧ ∧ ∧ – – – – –
Cherbourg State School Cherbourg 16 18 10 –
Average score of the school 319 266 320 295 341 340 325 442 330 360 434 380 397 390 426 – – – – –
Percentage (%) of students at or above NMS 79% 69% 69% 62% 100% 64% 40% 67% 58% 73% 67% 14% 25% 0% 75% – – – – –
Chevallum State School Chevallum 75 62 36 –
Average score of the school 440 393 402 463 432 519 439 463 533 494 551 475 523 565 543 – – – – –
Percentage (%) of students at or above NMS 97% 98% 100% 100% 100% 98% 82% 84% 98% 100% 93% 79% 89% 96% 100% – – – – –
Childers State School Childers 56 41 25 –
Average score of the school 413 396 378 422 399 485 436 471 481 492 550 480 506 523 542 – – – – –
Percentage (%) of students at or above NMS 96% 98% 94% 96% 100% 91% 80% 86% 89% 97% 95% 91% 95% 95% 100% – – – – –
KEY∧ to maintain privacy of individual student information, where there are fewer than five students tested results are not provided∗ no students in the year level sat the test due to absence, exemption or withdrawal– no students in the year levelNMS National Minimum Standard (for further information see www.nap.edu.au)
Queensland Curriculum & Assessment Authority
Page 25 of 149
NAPLAN 2014 Outcomes — All Queensland schools

Year level enrolments Year 3 Year 5 Year 7 Year 9
School Locality Yr 3 Yr 5 Yr 7 Yr 9 READ WRIT SPEL GP NMCY READ WRIT SPEL GP NMCY READ WRIT SPEL GP NMCY READ WRIT SPEL GP NMCY
Chillagoe State School Chillagoe 2 4 2 –
Average score of the school ∧ ∧ ∧ ∧ ∧ ∧ ∧ ∧ ∧ ∧ ∧ ∧ ∧ ∧ ∧ – – – – –
Percentage (%) of students at or above NMS ∧ ∧ ∧ ∧ ∧ ∧ ∧ ∧ ∧ ∧ ∧ ∧ ∧ ∧ ∧ – – – – –
Chinchilla Christian School Chinchilla 25 17 1 –
Average score of the school 410 380 408 396 404 464 372 480 483 461 ∗ ∗ ∗ ∗ ∗ – – – – –
Percentage (%) of students at or above NMS 84% 92% 92% 88% 88% 88% 56% 94% 100% 100% ∗ ∗ ∗ ∗ ∗ – – – – –
Chinchilla State High School Chinchilla – – – 109
Average score of the school – – – – – – – – – – – – – – – 569 534 562 563 577
Percentage (%) of students at or above NMS – – – – – – – – – – – – – – – 91% 75% 85% 83% 96%
Chinchilla State School Chinchilla 65 67 57 –
Average score of the school 408 402 400 417 399 492 451 485 491 479 544 488 529 537 542 – – – – –
Percentage (%) of students at or above NMS 87% 87% 84% 84% 89% 92% 87% 92% 90% 92% 89% 77% 89% 87% 92% – – – – –
Chisholm Catholic College Cornubia – – – 175
Average score of the school – – – – – – – – – – – – – – – 573 553 570 563 576
Percentage (%) of students at or above NMS – – – – – – – – – – – – – – – 92% 82% 90% 88% 98%
Christ the King Catholic Primary School Deception Bay 44 20 22 –
Average score of the school 384 386 383 393 375 485 486 504 517 490 525 488 550 551 532 – – – – –
Percentage (%) of students at or above NMS 90% 90% 90% 92% 92% 85% 89% 85% 85% 90% 95% 85% 90% 90% 90% – – – – –
Christ the King School (Graceville) Graceville 57 28 14 –
Average score of the school 453 454 404 490 428 524 499 503 511 481 567 555 577 586 554 – – – – –
Percentage (%) of students at or above NMS 100% 100% 98% 100% 100% 100% 100% 100% 100% 96% 100% 100% 100% 100% 93% – – – – –
Christian Outreach College Toowoomba Toowoomba 41 32 39 53
Average score of the school 436 434 432 466 421 490 452 488 519 495 572 520 556 590 555 610 573 584 615 618
Percentage (%) of students at or above NMS 100% 95% 98% 95% 98% 97% 87% 100% 93% 100% 100% 91% 97% 100% 100% 94% 86% 88% 90% 94%
Churchill State School Churchill 62 44 22 –
Average score of the school 395 391 394 400 378 453 422 448 460 447 487 468 489 499 491 – – – – –
Percentage (%) of students at or above NMS 89% 96% 95% 95% 96% 92% 64% 77% 92% 85% 80% 85% 85% 85% 85% – – – – –
Citipointe Christian College Carindale 133 133 106 139
Average score of the school 453 437 449 483 439 542 504 535 553 524 578 552 567 589 585 607 586 612 623 635
Percentage (%) of students at or above NMS 98% 99% 100% 98% 100% 100% 97% 99% 98% 100% 100% 99% 97% 100% 100% 100% 97% 100% 99% 100%
Clairvaux MacKillop College Upper Mount Gravatt – – – 238
Average score of the school – – – – – – – – – – – – – – – 575 532 576 574 581
Percentage (%) of students at or above NMS – – – – – – – – – – – – – – – 91% 77% 93% 92% 98%
Clare State School Claredale 6 3 5 –
Average score of the school 377 387 383 427 352 ∧ ∧ ∧ ∧ ∧ 532 521 542 544 588 – – – – –
Percentage (%) of students at or above NMS 100% 100% 100% 100% 83% ∧ ∧ ∧ ∧ ∧ 100% 100% 100% 100% 100% – – – – –
KEY∧ to maintain privacy of individual student information, where there are fewer than five students tested results are not provided∗ no students in the year level sat the test due to absence, exemption or withdrawal– no students in the year levelNMS National Minimum Standard (for further information see www.nap.edu.au)
Queensland Curriculum & Assessment Authority
Page 26 of 149
NAPLAN 2014 Outcomes — All Queensland schools

Year level enrolments Year 3 Year 5 Year 7 Year 9
School Locality Yr 3 Yr 5 Yr 7 Yr 9 READ WRIT SPEL GP NMCY READ WRIT SPEL GP NMCY READ WRIT SPEL GP NMCY READ WRIT SPEL GP NMCY
Claremont Special School Ipswich 5 11 11 11
Average score of the school ∗ ∗ ∗ ∗ ∗ ∗ ∗ ∗ ∗ ∗ ∗ ∗ ∗ ∗ ∗ ∗ ∗ ∗ ∗ ∗Percentage (%) of students at or above NMS ∗ ∗ ∗ ∗ ∗ ∗ ∗ ∗ ∗ ∗ ∗ ∗ ∗ ∗ ∗ ∗ ∗ ∗ ∗ ∗
Clarendon State School Clarendon via Lowood 6 8 2 –
Average score of the school 341 363 361 371 307 474 442 459 467 441 ∧ ∧ ∧ ∧ ∧ – – – – –
Percentage (%) of students at or above NMS 83% 100% 83% 100% 83% 100% 100% 100% 100% 100% ∧ ∧ ∧ ∧ ∧ – – – – –
Clarke Creek State School via Marlborough 3 2 – –
Average score of the school ∧ ∧ ∧ ∧ ∧ ∧ ∧ ∧ ∧ ∧ – – – – – – – – – –
Percentage (%) of students at or above NMS ∧ ∧ ∧ ∧ ∧ ∧ ∧ ∧ ∧ ∧ – – – – – – – – – –
Clayfield College Clayfield 51 44 69 88
Average score of the school 474 422 449 496 440 524 513 525 541 523 581 571 576 584 576 607 600 610 609 605
Percentage (%) of students at or above NMS 98% 100% 100% 100% 100% 95% 100% 100% 100% 98% 100% 100% 100% 99% 100% 98% 96% 99% 99% 100%
Clermont State High School Clermont – – – 40
Average score of the school – – – – – – – – – – – – – – – 560 518 552 550 580
Percentage (%) of students at or above NMS – – – – – – – – – – – – – – – 89% 65% 81% 78% 100%
Clermont State School Clermont 36 39 19 –
Average score of the school 414 373 392 390 402 474 453 464 478 483 499 451 486 500 514 – – – – –
Percentage (%) of students at or above NMS 97% 97% 100% 91% 100% 85% 85% 87% 92% 97% 95% 68% 84% 95% 100% – – – – –
Cleveland District State High School Cleveland – – 222 324
Average score of the school – – – – – – – – – – 532 516 541 533 533 574 535 578 567 585
Percentage (%) of students at or above NMS – – – – – – – – – – 99% 93% 98% 96% 99% 94% 80% 95% 89% 99%
Cleveland Education and Training Centre Belgian Gardens – – 2 7
Average score of the school – – – – – – – – – – ∗ ∗ ∗ ∗ ∗ ∗ ∗ ∗ ∗ ∗Percentage (%) of students at or above NMS – – – – – – – – – – ∗ ∗ ∗ ∗ ∗ ∗ ∗ ∗ ∗ ∗
Cleveland State School Cleveland 113 97 9 –
Average score of the school 416 407 414 444 404 506 461 502 510 486 511 519 527 492 532 – – – – –
Percentage (%) of students at or above NMS 95% 94% 95% 96% 97% 95% 85% 89% 94% 95% 88% 86% 100% 75% 100% – – – – –
Clifford Park Special School Toowoomba – – 3 20
Average score of the school – – – – – – – – – – ∗ ∗ ∗ ∗ ∗ ∗ ∗ ∗ ∗ ∗Percentage (%) of students at or above NMS – – – – – – – – – – ∗ ∗ ∗ ∗ ∗ ∗ ∗ ∗ ∗ ∗
Clifton State High School Clifton – – 27 59
Average score of the school – – – – – – – – – – 511 478 519 518 512 538 503 547 541 547
Percentage (%) of students at or above NMS – – – – – – – – – – 81% 70% 78% 81% 81% 76% 54% 81% 83% 89%
Clifton State School Clifton 12 14 – –
Average score of the school 320 302 315 343 330 479 447 465 465 454 – – – – – – – – – –
Percentage (%) of students at or above NMS 80% 60% 70% 70% 70% 93% 79% 86% 93% 86% – – – – – – – – – –
KEY∧ to maintain privacy of individual student information, where there are fewer than five students tested results are not provided∗ no students in the year level sat the test due to absence, exemption or withdrawal– no students in the year levelNMS National Minimum Standard (for further information see www.nap.edu.au)
Queensland Curriculum & Assessment Authority
Page 27 of 149
NAPLAN 2014 Outcomes — All Queensland schools

Year level enrolments Year 3 Year 5 Year 7 Year 9
School Locality Yr 3 Yr 5 Yr 7 Yr 9 READ WRIT SPEL GP NMCY READ WRIT SPEL GP NMCY READ WRIT SPEL GP NMCY READ WRIT SPEL GP NMCY
Clinton State School Gladstone 109 105 61 –
Average score of the school 387 363 389 386 365 472 446 466 474 458 548 501 534 523 528 – – – – –
Percentage (%) of students at or above NMS 90% 89% 94% 88% 96% 91% 82% 85% 86% 90% 95% 86% 91% 93% 100% – – – – –
Cloncurry State School Cloncurry 26 13 18 28
Average score of the school 343 348 350 346 344 464 410 474 438 423 471 408 487 477 468 500 456 516 481 506
Percentage (%) of students at or above NMS 71% 82% 83% 70% 86% 77% 54% 85% 69% 77% 76% 44% 72% 78% 71% 46% 44% 63% 48% 78%
Clontarf Beach State High School Clontarf Beach – – – 210
Average score of the school – – – – – – – – – – – – – – – 545 531 557 543 565
Percentage (%) of students at or above NMS – – – – – – – – – – – – – – – 88% 77% 88% 83% 96%
Clontarf Beach State School Clontarf 64 50 26 –
Average score of the school 376 366 374 351 363 461 447 477 467 445 508 478 526 519 523 – – – – –
Percentage (%) of students at or above NMS 89% 93% 90% 79% 95% 96% 91% 96% 91% 87% 96% 83% 88% 96% 100% – – – – –
Clover Hill State School Mudgeeraba 157 132 73 –
Average score of the school 431 430 420 458 414 510 464 498 501 490 536 507 539 541 530 – – – – –
Percentage (%) of students at or above NMS 97% 97% 95% 98% 97% 95% 89% 96% 95% 98% 99% 96% 91% 94% 96% – – – – –
Cloyna State School Cloyna 3 – – –
Average score of the school ∧ ∧ ∧ ∧ ∧ – – – – – – – – – – – – – – –
Percentage (%) of students at or above NMS ∧ ∧ ∧ ∧ ∧ – – – – – – – – – – – – – – –
Coalstoun Lakes State School via Biggenden 4 7 3 –
Average score of the school ∧ ∧ ∧ ∧ ∧ 507 471 528 472 476 ∧ ∧ ∧ ∧ ∧ – – – – –
Percentage (%) of students at or above NMS ∧ ∧ ∧ ∧ ∧ 100% 86% 100% 100% 100% ∧ ∧ ∧ ∧ ∧ – – – – –
Coconut Island State School via Thursday Island 3 2 1 –
Average score of the school ∧ ∧ ∧ ∧ ∧ ∧ ∧ ∧ ∧ ∧ ∧ ∧ ∧ ∧ ∧ – – – – –
Percentage (%) of students at or above NMS ∧ ∧ ∧ ∧ ∧ ∧ ∧ ∧ ∧ ∧ ∧ ∧ ∧ ∧ ∧ – – – – –
Coen Campus of CYAAA Coen 4 5 3 –
Average score of the school ∧ ∧ ∧ ∧ ∧ 399 425 466 373 412 ∧ ∧ ∧ ∧ ∧ – – – – –
Percentage (%) of students at or above NMS ∧ ∧ ∧ ∧ ∧ 80% 60% 100% 40% 80% ∧ ∧ ∧ ∧ ∧ – – – – –
Collingwood Park State School Collingwood Park 64 84 52 –
Average score of the school 366 337 373 376 359 482 451 483 489 465 517 472 527 503 519 – – – – –
Percentage (%) of students at or above NMS 84% 80% 93% 90% 89% 89% 85% 86% 88% 87% 98% 79% 92% 84% 96% – – – – –
Collinsville State High School Collinsville – – – 11
Average score of the school – – – – – – – – – – – – – – – 527 511 534 497 547
Percentage (%) of students at or above NMS – – – – – – – – – – – – – – – 55% 55% 64% 45% 82%
Collinsville State School Collinsville 6 5 2 –
Average score of the school 479 369 446 525 397 446 ∧ ∧ ∧ ∧ ∧ ∧ ∧ ∧ ∧ – – – – –
Percentage (%) of students at or above NMS 83% 100% 83% 83% 83% 100% ∧ ∧ ∧ ∧ ∧ ∧ ∧ ∧ ∧ – – – – –
KEY∧ to maintain privacy of individual student information, where there are fewer than five students tested results are not provided∗ no students in the year level sat the test due to absence, exemption or withdrawal– no students in the year levelNMS National Minimum Standard (for further information see www.nap.edu.au)
Queensland Curriculum & Assessment Authority
Page 28 of 149
NAPLAN 2014 Outcomes — All Queensland schools

Year level enrolments Year 3 Year 5 Year 7 Year 9
School Locality Yr 3 Yr 5 Yr 7 Yr 9 READ WRIT SPEL GP NMCY READ WRIT SPEL GP NMCY READ WRIT SPEL GP NMCY READ WRIT SPEL GP NMCY
Columba Catholic College Charters Towers 33 44 26 56
Average score of the school 446 434 407 467 437 501 479 493 504 479 521 513 503 519 498 545 512 550 536 546
Percentage (%) of students at or above NMS 93% 97% 97% 97% 97% 93% 98% 98% 95% 98% 92% 92% 88% 84% 96% 75% 67% 85% 78% 85%
Comet State School Comet 3 1 3 –
Average score of the school ∧ ∧ ∧ ∧ ∧ ∗ ∗ ∗ ∗ ∗ ∧ ∧ ∧ ∧ ∧ – – – – –
Percentage (%) of students at or above NMS ∧ ∧ ∧ ∧ ∧ ∗ ∗ ∗ ∗ ∗ ∧ ∧ ∧ ∧ ∧ – – – – –
Concordia Lutheran College Toowoomba – – 34 71
Average score of the school – – – – – – – – – – 550 485 526 562 582 597 567 585 590 608
Percentage (%) of students at or above NMS – – – – – – – – – – 100% 91% 97% 100% 100% 97% 90% 96% 97% 100%
Concordia Lutheran College (Concordia
Primary)
Toowoomba 23 42 – –
Average score of the school 474 437 439 473 437 523 464 503 511 514 – – – – – – – – – –
Percentage (%) of students at or above NMS 100% 100% 95% 95% 100% 100% 98% 98% 95% 98% – – – – – – – – – –
Concordia Lutheran College (Martin Luther
Primary)
Toowoomba 21 20 – –
Average score of the school 445 427 391 435 436 525 472 501 543 519 – – – – – – – – – –
Percentage (%) of students at or above NMS 100% 100% 100% 100% 100% 89% 95% 100% 95% 95% – – – – – – – – – –
Condamine State School Condamine 4 5 3 –
Average score of the school ∧ ∧ ∧ ∧ ∧ 476 ∧ ∧ ∧ 498 ∧ ∧ ∧ ∧ ∧ – – – – –
Percentage (%) of students at or above NMS ∧ ∧ ∧ ∧ ∧ 100% ∧ ∧ ∧ 100% ∧ ∧ ∧ ∧ ∧ – – – – –
Coningsby State School Mackay 9 7 2 –
Average score of the school 461 383 410 472 443 506 447 446 482 487 ∧ ∧ ∧ ∧ ∧ – – – – –
Percentage (%) of students at or above NMS 100% 100% 100% 100% 100% 83% 83% 83% 83% 100% ∧ ∧ ∧ ∧ ∧ – – – – –
Conondale State School Conondale 11 11 5 –
Average score of the school 452 417 404 433 479 509 483 483 457 499 559 566 526 576 556 – – – – –
Percentage (%) of students at or above NMS 100% 100% 100% 100% 100% 90% 82% 82% 73% 80% 100% 100% 100% 100% 100% – – – – –
Cooktown State School Cooktown 25 21 15 40
Average score of the school 370 366 370 381 369 429 397 438 432 441 502 463 520 513 555 527 492 517 519 540
Percentage (%) of students at or above NMS 83% 96% 83% 87% 86% 68% 55% 75% 75% 90% 75% 64% 64% 64% 100% 71% 48% 76% 72% 89%
Coolabunia State School Coolabunia 21 13 7 –
Average score of the school 407 393 382 426 428 499 444 450 493 492 511 485 496 502 507 – – – – –
Percentage (%) of students at or above NMS 95% 90% 95% 95% 95% 83% 75% 67% 92% 83% 86% 86% 86% 86% 86% – – – – –
Coolangatta State School Kirra 28 26 24 –
Average score of the school 373 369 395 410 373 493 458 494 483 478 536 483 537 513 517 – – – – –
Percentage (%) of students at or above NMS 83% 96% 91% 100% 100% 96% 88% 92% 88% 92% 100% 86% 100% 91% 100% – – – – –
KEY∧ to maintain privacy of individual student information, where there are fewer than five students tested results are not provided∗ no students in the year level sat the test due to absence, exemption or withdrawal– no students in the year levelNMS National Minimum Standard (for further information see www.nap.edu.au)
Queensland Curriculum & Assessment Authority
Page 29 of 149
NAPLAN 2014 Outcomes — All Queensland schools

Year level enrolments Year 3 Year 5 Year 7 Year 9
School Locality Yr 3 Yr 5 Yr 7 Yr 9 READ WRIT SPEL GP NMCY READ WRIT SPEL GP NMCY READ WRIT SPEL GP NMCY READ WRIT SPEL GP NMCY
Coolnwynpin State School Capalaba 35 52 12 –
Average score of the school 413 335 399 425 378 496 451 498 501 488 512 466 522 537 518 – – – – –
Percentage (%) of students at or above NMS 100% 73% 100% 97% 87% 94% 91% 91% 94% 96% 100% 80% 90% 100% 90% – – – – –
Cooloola Christian College Gympie 37 28 29 45
Average score of the school 404 372 394 412 388 518 433 500 505 491 542 480 539 556 537 603 561 581 586 593
Percentage (%) of students at or above NMS 97% 100% 97% 94% 97% 100% 85% 100% 100% 100% 100% 88% 100% 96% 100% 91% 91% 90% 94% 100%
Coolum Beach Christian College Yandina Creek 18 25 19 10
Average score of the school 475 446 424 485 432 528 472 472 510 483 536 489 537 538 542 556 566 536 517 561
Percentage (%) of students at or above NMS 94% 88% 94% 94% 94% 96% 100% 96% 100% 100% 100% 94% 94% 100% 100% 100% 90% 70% 70% 100%
Coolum State High School Coolum Beach – – – 128
Average score of the school – – – – – – – – – – – – – – – 559 524 555 550 572
Percentage (%) of students at or above NMS – – – – – – – – – – – – – – – 91% 74% 91% 89% 99%
Coolum State School Coolum Beach 147 126 99 –
Average score of the school 399 385 387 411 386 494 453 481 498 483 546 504 539 537 543 – – – – –
Percentage (%) of students at or above NMS 93% 94% 92% 97% 95% 96% 86% 91% 97% 96% 97% 92% 94% 97% 99% – – – – –
Coombabah State High School Coombabah – – – 212
Average score of the school – – – – – – – – – – – – – – – 543 503 559 541 553
Percentage (%) of students at or above NMS – – – – – – – – – – – – – – – 80% 62% 83% 78% 91%
Coombabah State School Coombabah 90 92 52 –
Average score of the school 393 375 391 399 367 457 415 464 459 452 510 479 517 506 515 – – – – –
Percentage (%) of students at or above NMS 92% 93% 91% 89% 94% 84% 74% 89% 89% 89% 77% 80% 83% 81% 90% – – – – –
Coomera Anglican College Coomera 115 114 112 102
Average score of the school 443 438 424 455 426 527 503 517 530 515 574 546 577 581 582 593 592 609 591 617
Percentage (%) of students at or above NMS 99% 100% 100% 99% 99% 100% 99% 99% 99% 99% 98% 98% 100% 98% 100% 96% 93% 96% 96% 100%
Coomera Rivers State School Coomera 143 92 – –
Average score of the school 422 414 415 442 421 515 473 520 530 505 – – – – – – – – – –
Percentage (%) of students at or above NMS 99% 97% 97% 97% 100% 99% 92% 100% 98% 99% – – – – – – – – – –
Coomera Springs State School Coomera Springs 113 98 16 –
Average score of the school 383 368 381 389 370 481 458 490 495 471 522 515 534 531 536 – – – – –
Percentage (%) of students at or above NMS 91% 93% 93% 96% 97% 94% 86% 93% 93% 90% 100% 100% 100% 93% 100% – – – – –
Coomera State School Coomera 140 133 54 –
Average score of the school 412 389 412 427 388 498 433 490 499 481 539 480 536 540 546 – – – – –
Percentage (%) of students at or above NMS 93% 93% 96% 95% 94% 92% 80% 90% 90% 94% 94% 75% 94% 94% 96% – – – – –
Coominya State School Coominya 17 14 9 –
Average score of the school 378 364 385 381 361 455 412 421 440 435 536 512 512 559 510 – – – – –
Percentage (%) of students at or above NMS 88% 88% 81% 88% 88% 100% 69% 69% 77% 83% 100% 100% 88% 100% 100% – – – – –
KEY∧ to maintain privacy of individual student information, where there are fewer than five students tested results are not provided∗ no students in the year level sat the test due to absence, exemption or withdrawal– no students in the year levelNMS National Minimum Standard (for further information see www.nap.edu.au)
Queensland Curriculum & Assessment Authority
Page 30 of 149
NAPLAN 2014 Outcomes — All Queensland schools

Year level enrolments Year 3 Year 5 Year 7 Year 9
School Locality Yr 3 Yr 5 Yr 7 Yr 9 READ WRIT SPEL GP NMCY READ WRIT SPEL GP NMCY READ WRIT SPEL GP NMCY READ WRIT SPEL GP NMCY
Coopers Plains State School Coopers Plains 24 32 18 –
Average score of the school 367 396 389 386 379 460 452 463 473 463 520 495 542 530 520 – – – – –
Percentage (%) of students at or above NMS 100% 96% 87% 96% 96% 81% 88% 84% 94% 91% 100% 89% 100% 94% 100% – – – – –
Cooran State School Cooran 33 14 20 –
Average score of the school 442 412 403 441 418 571 489 514 552 575 554 479 547 525 549 – – – – –
Percentage (%) of students at or above NMS 100% 100% 92% 100% 96% 100% 91% 100% 91% 100% 100% 83% 94% 100% 100% – – – – –
Cooroy State School Cooroy 81 72 48 –
Average score of the school 422 412 391 448 397 523 465 481 520 495 546 489 529 563 562 – – – – –
Percentage (%) of students at or above NMS 94% 100% 97% 96% 100% 94% 88% 92% 92% 95% 98% 90% 90% 88% 100% – – – – –
Coorparoo Secondary College Coorparoo – – – 48
Average score of the school – – – – – – – – – – – – – – – 563 521 579 555 562
Percentage (%) of students at or above NMS – – – – – – – – – – – – – – – 90% 68% 88% 86% 95%
Coorparoo State School Coorparoo 130 93 53 –
Average score of the school 469 441 459 499 444 537 489 523 543 501 582 552 579 578 576 – – – – –
Percentage (%) of students at or above NMS 94% 91% 94% 94% 94% 91% 93% 92% 91% 91% 90% 90% 88% 90% 92% – – – – –
Coowonga State School Coowonga 4 4 1 –
Average score of the school ∧ ∧ ∧ ∧ ∧ ∧ ∧ ∧ ∧ ∧ ∧ ∧ ∧ ∧ ∧ – – – – –
Percentage (%) of students at or above NMS ∧ ∧ ∧ ∧ ∧ ∧ ∧ ∧ ∧ ∧ ∧ ∧ ∧ ∧ ∧ – – – – –
Cooyar State School Cooyar 8 6 1 –
Average score of the school 417 302 347 439 378 521 470 506 533 487 ∧ ∧ ∧ ∧ ∧ – – – – –
Percentage (%) of students at or above NMS 86% 57% 86% 86% 86% 100% 83% 100% 83% 100% ∧ ∧ ∧ ∧ ∧ – – – – –
Coppabella State School Coppabella via Mackay 4 7 1 –
Average score of the school ∧ ∧ ∧ ∧ ∧ 539 504 509 516 503 ∧ ∧ ∧ ∧ ∧ – – – – –
Percentage (%) of students at or above NMS ∧ ∧ ∧ ∧ ∧ 100% 100% 100% 83% 100% ∧ ∧ ∧ ∧ ∧ – – – – –
Coral Coast Christian School North Bundaberg 2 6 4 –
Average score of the school ∧ ∧ ∧ ∧ ∧ 447 426 425 429 407 ∧ ∧ ∧ ∧ ∧ – – – – –
Percentage (%) of students at or above NMS ∧ ∧ ∧ ∧ ∧ 83% 83% 67% 83% 83% ∧ ∧ ∧ ∧ ∧ – – – – –
Cordalba State School Cordalba 17 17 6 –
Average score of the school 430 400 428 441 402 496 434 495 495 477 507 458 483 528 491 – – – – –
Percentage (%) of students at or above NMS 100% 100% 100% 100% 100% 100% 73% 100% 93% 100% 100% 83% 100% 100% 100% – – – – –
Corinda State High School Corinda – – – 351
Average score of the school – – – – – – – – – – – – – – – 581 556 591 571 586
Percentage (%) of students at or above NMS – – – – – – – – – – – – – – – 95% 87% 92% 91% 99%
Corinda State School Corinda 73 80 56 –
Average score of the school 449 404 451 463 419 509 456 506 524 491 551 509 547 540 566 – – – – –
Percentage (%) of students at or above NMS 94% 99% 97% 97% 97% 99% 86% 94% 94% 96% 98% 90% 94% 92% 100% – – – – –
KEY∧ to maintain privacy of individual student information, where there are fewer than five students tested results are not provided∗ no students in the year level sat the test due to absence, exemption or withdrawal– no students in the year levelNMS National Minimum Standard (for further information see www.nap.edu.au)
Queensland Curriculum & Assessment Authority
Page 31 of 149
NAPLAN 2014 Outcomes — All Queensland schools

Year level enrolments Year 3 Year 5 Year 7 Year 9
School Locality Yr 3 Yr 5 Yr 7 Yr 9 READ WRIT SPEL GP NMCY READ WRIT SPEL GP NMCY READ WRIT SPEL GP NMCY READ WRIT SPEL GP NMCY
Craigslea State High School Chermside West – – – 191
Average score of the school – – – – – – – – – – – – – – – 581 573 597 585 594
Percentage (%) of students at or above NMS – – – – – – – – – – – – – – – 88% 82% 93% 90% 96%
Craigslea State School Chermside West 83 82 46 –
Average score of the school 420 380 412 430 397 521 461 502 505 523 571 526 580 558 550 – – – – –
Percentage (%) of students at or above NMS 96% 93% 95% 99% 93% 95% 88% 95% 90% 99% 100% 96% 96% 100% 98% – – – – –
Cranbrook State School Cranbrook 67 79 30 –
Average score of the school 396 367 399 420 385 476 415 474 470 470 501 472 481 509 504 – – – – –
Percentage (%) of students at or above NMS 94% 91% 97% 97% 97% 84% 74% 91% 82% 92% 80% 79% 80% 83% 90% – – – – –
Crawford State School Crawford 6 7 4 –
Average score of the school ∧ ∧ ∧ ∧ ∧ 477 453 452 488 502 ∧ ∧ ∧ ∧ ∧ – – – – –
Percentage (%) of students at or above NMS ∧ ∧ ∧ ∧ ∧ 100% 80% 80% 100% 100% ∧ ∧ ∧ ∧ ∧ – – – – –
Crescent Lagoon State School Rockhampton 55 53 33 –
Average score of the school 397 385 392 422 382 478 445 457 469 448 515 464 498 509 512 – – – – –
Percentage (%) of students at or above NMS 92% 96% 93% 96% 91% 88% 80% 82% 84% 81% 90% 77% 81% 77% 90% – – – – –
Crestmead State School Crestmead 164 128 85 –
Average score of the school 383 384 399 390 371 464 425 456 454 444 512 481 502 505 511 – – – – –
Percentage (%) of students at or above NMS 89% 94% 94% 90% 92% 89% 76% 85% 79% 81% 87% 82% 78% 84% 87% – – – – –
Crow’s Nest State School Crow’S Nest 32 36 19 29
Average score of the school 366 358 363 359 363 510 461 491 519 485 541 496 538 551 532 566 529 538 539 571
Percentage (%) of students at or above NMS 93% 90% 94% 84% 87% 94% 89% 92% 92% 92% 94% 89% 100% 94% 94% 81% 62% 77% 77% 92%
Croydon State School Croydon 4 4 2 –
Average score of the school ∧ ∧ ∧ ∧ ∧ ∧ ∧ ∧ ∧ ∧ ∧ ∧ ∧ ∧ ∧ – – – – –
Percentage (%) of students at or above NMS ∧ ∧ ∧ ∧ ∧ ∧ ∧ ∧ ∧ ∧ ∧ ∧ ∧ ∧ ∧ – – – – –
Cunnamulla State School Cunnamulla 10 10 1 8
Average score of the school 275 303 280 298 269 376 376 391 366 386 ∧ ∧ ∧ ∧ ∧ 475 389 465 480 495
Percentage (%) of students at or above NMS 56% 80% 60% 70% 67% 44% 44% 56% 44% 44% ∧ ∧ ∧ ∧ ∧ 33% 13% 38% 38% 67%
Currajong State School Currajong 90 68 58 –
Average score of the school 370 368 368 380 360 436 395 448 435 421 488 429 481 472 475 – – – – –
Percentage (%) of students at or above NMS 84% 85% 90% 86% 90% 80% 63% 83% 83% 79% 83% 60% 72% 71% 84% – – – – –
Currimundi Special School Currimundi 10 12 11 17
Average score of the school ∗ ∗ ∗ ∗ ∗ ∗ ∗ ∗ ∗ ∗ ∗ ∗ ∗ ∗ ∗ ∗ ∗ ∗ ∗ ∗Percentage (%) of students at or above NMS ∗ ∗ ∗ ∗ ∗ ∗ ∗ ∗ ∗ ∗ ∗ ∗ ∗ ∗ ∗ ∗ ∗ ∗ ∗ ∗
Currimundi State School Caloundra 87 66 47 –
Average score of the school 434 417 405 460 421 508 487 497 518 486 557 511 551 560 561 – – – – –
Percentage (%) of students at or above NMS 97% 99% 100% 99% 97% 98% 92% 98% 96% 98% 100% 92% 100% 100% 97% – – – – –
KEY∧ to maintain privacy of individual student information, where there are fewer than five students tested results are not provided∗ no students in the year level sat the test due to absence, exemption or withdrawal– no students in the year levelNMS National Minimum Standard (for further information see www.nap.edu.au)
Queensland Curriculum & Assessment Authority
Page 32 of 149
NAPLAN 2014 Outcomes — All Queensland schools

Year level enrolments Year 3 Year 5 Year 7 Year 9
School Locality Yr 3 Yr 5 Yr 7 Yr 9 READ WRIT SPEL GP NMCY READ WRIT SPEL GP NMCY READ WRIT SPEL GP NMCY READ WRIT SPEL GP NMCY
Currumbin Community Special School Currumbin Waters 6 3 5 5
Average score of the school ∗ ∗ ∗ ∗ ∗ ∗ ∗ ∗ ∗ ∗ ∗ ∗ ∗ ∗ ∗ ∗ ∗ ∗ ∗ ∗Percentage (%) of students at or above NMS ∗ ∗ ∗ ∗ ∗ ∗ ∗ ∗ ∗ ∗ ∗ ∗ ∗ ∗ ∗ ∗ ∗ ∗ ∗ ∗
Currumbin State School Currumbin 150 136 82 –
Average score of the school 417 403 414 433 394 515 464 501 517 494 534 483 538 533 544 – – – – –
Percentage (%) of students at or above NMS 96% 99% 97% 97% 97% 99% 93% 98% 97% 95% 96% 84% 94% 91% 98% – – – – –
Currumbin Valley State School Currumbin Valley 25 14 4 –
Average score of the school 512 434 443 534 463 527 475 516 559 518 ∧ ∧ ∧ ∧ ∧ – – – – –
Percentage (%) of students at or above NMS 100% 100% 100% 100% 100% 100% 100% 100% 100% 100% ∧ ∧ ∧ ∧ ∧ – – – – –
Dagun State School Dagun 4 1 3 –
Average score of the school ∧ ∧ ∧ ∧ ∧ ∧ ∧ ∧ ∧ ∧ ∧ ∧ ∧ ∧ ∧ – – – – –
Percentage (%) of students at or above NMS ∧ ∧ ∧ ∧ ∧ ∧ ∧ ∧ ∧ ∧ ∧ ∧ ∧ ∧ ∧ – – – – –
Daintree State School Daintree 1 3 1 –
Average score of the school ∧ ∧ ∧ ∧ ∧ ∧ ∧ ∧ ∧ ∧ ∧ ∧ ∧ ∧ ∧ – – – – –
Percentage (%) of students at or above NMS ∧ ∧ ∧ ∧ ∧ ∧ ∧ ∧ ∧ ∧ ∧ ∧ ∧ ∧ ∧ – – – – –
Dajarra State School Dajarra via Mount Isa 4 3 4 –
Average score of the school ∧ ∧ ∧ ∧ ∧ ∧ ∧ ∧ ∧ ∧ ∧ ∧ ∧ ∧ ∧ – – – – –
Percentage (%) of students at or above NMS ∧ ∧ ∧ ∧ ∧ ∧ ∧ ∧ ∧ ∧ ∧ ∧ ∧ ∧ ∧ – – – – –
Dakabin State High School Dakabin – – – 160
Average score of the school – – – – – – – – – – – – – – – 548 519 559 543 555
Percentage (%) of students at or above NMS – – – – – – – – – – – – – – – 90% 74% 94% 86% 94%
Dakabin State School Kallangur 72 56 35 –
Average score of the school 362 356 358 371 344 480 443 475 473 460 513 480 524 511 507 – – – – –
Percentage (%) of students at or above NMS 80% 90% 87% 90% 93% 96% 90% 90% 88% 94% 91% 88% 85% 94% 91% – – – – –
Dalby Christian College Dalby 18 27 19 21
Average score of the school 443 412 424 427 420 517 477 479 508 477 536 496 536 538 533 603 559 600 599 566
Percentage (%) of students at or above NMS 100% 100% 100% 100% 100% 85% 89% 85% 89% 81% 95% 89% 84% 84% 95% 100% 90% 100% 95% 100%
Dalby South State School Dalby 109 76 52 –
Average score of the school 444 395 384 450 402 534 459 485 562 520 561 509 538 575 563 – – – – –
Percentage (%) of students at or above NMS 100% 98% 98% 99% 98% 100% 91% 94% 100% 100% 98% 87% 93% 100% 100% – – – – –
Dalby State High School Dalby – – – 201
Average score of the school – – – – – – – – – – – – – – – 560 511 569 555 568
Percentage (%) of students at or above NMS – – – – – – – – – – – – – – – 85% 68% 89% 80% 93%
Dalby State School Dalby 55 67 50 –
Average score of the school 380 385 373 388 376 463 426 468 465 454 529 484 540 528 523 – – – – –
Percentage (%) of students at or above NMS 98% 96% 93% 96% 96% 78% 76% 84% 84% 78% 96% 87% 91% 93% 98% – – – – –
KEY∧ to maintain privacy of individual student information, where there are fewer than five students tested results are not provided∗ no students in the year level sat the test due to absence, exemption or withdrawal– no students in the year levelNMS National Minimum Standard (for further information see www.nap.edu.au)
Queensland Curriculum & Assessment Authority
Page 33 of 149
NAPLAN 2014 Outcomes — All Queensland schools

Year level enrolments Year 3 Year 5 Year 7 Year 9
School Locality Yr 3 Yr 5 Yr 7 Yr 9 READ WRIT SPEL GP NMCY READ WRIT SPEL GP NMCY READ WRIT SPEL GP NMCY READ WRIT SPEL GP NMCY
Dallarnil State School Dallarnil via Biggenden 2 3 3 –
Average score of the school ∧ ∧ ∧ ∧ ∧ ∧ ∧ ∧ ∧ ∧ ∧ ∧ ∧ ∧ ∧ – – – – –
Percentage (%) of students at or above NMS ∧ ∧ ∧ ∧ ∧ ∧ ∧ ∧ ∧ ∧ ∧ ∧ ∧ ∧ ∧ – – – – –
Dalveen State School Dalveen 2 3 4 –
Average score of the school ∧ ∧ ∧ ∧ ∧ ∧ ∧ ∧ ∧ ∧ ∧ ∧ ∧ ∧ ∧ – – – – –
Percentage (%) of students at or above NMS ∧ ∧ ∧ ∧ ∧ ∧ ∧ ∧ ∧ ∧ ∧ ∧ ∧ ∧ ∧ – – – – –
Darling Downs Christian School Toowoomba 12 16 12 13
Average score of the school 368 362 357 374 370 501 434 474 505 481 585 517 567 592 544 552 525 549 564 544
Percentage (%) of students at or above NMS 100% 100% 91% 91% 100% 87% 87% 93% 100% 100% 100% 91% 100% 100% 100% 83% 77% 85% 77% 75%
Darling Heights State School Toowoomba 88 81 51 –
Average score of the school 387 396 392 403 364 506 462 501 525 490 533 491 530 542 561 – – – – –
Percentage (%) of students at or above NMS 94% 94% 94% 96% 88% 98% 88% 97% 97% 95% 94% 85% 91% 91% 94% – – – – –
Darling Point Special School Manly 7 5 9 13
Average score of the school ∗ ∗ ∗ ∗ ∗ ∗ ∗ ∗ ∗ ∗ ∗ ∗ ∗ ∗ ∗ ∗ ∗ ∗ ∗ ∗Percentage (%) of students at or above NMS ∗ ∗ ∗ ∗ ∗ ∗ ∗ ∗ ∗ ∗ ∗ ∗ ∗ ∗ ∗ ∗ ∗ ∗ ∗ ∗
Darlington State School Darlington 3 4 2 –
Average score of the school ∧ ∧ ∧ ∧ ∧ ∧ ∧ ∧ ∧ ∧ ∧ ∧ ∧ ∧ ∧ – – – – –
Percentage (%) of students at or above NMS ∧ ∧ ∧ ∧ ∧ ∧ ∧ ∧ ∧ ∧ ∧ ∧ ∧ ∧ ∧ – – – – –
Darra State School Darra 26 29 16 –
Average score of the school 385 400 433 433 386 480 446 516 471 475 536 502 548 555 553 – – – – –
Percentage (%) of students at or above NMS 91% 91% 91% 91% 91% 75% 68% 79% 75% 78% 100% 88% 88% 100% 94% – – – – –
Dauan Island State School via Thursday Island 3 4 4 –
Average score of the school ∧ ∧ ∧ ∧ ∧ ∧ ∧ ∧ ∧ ∧ ∧ ∧ ∧ ∧ ∧ – – – – –
Percentage (%) of students at or above NMS ∧ ∧ ∧ ∧ ∧ ∧ ∧ ∧ ∧ ∧ ∧ ∧ ∧ ∧ ∧ – – – – –
Dayboro State School Dayboro 55 35 17 –
Average score of the school 408 373 373 404 382 507 459 480 492 464 555 512 557 556 535 – – – – –
Percentage (%) of students at or above NMS 96% 94% 90% 94% 90% 88% 94% 88% 85% 85% 100% 94% 94% 94% 100% – – – – –
Deception Bay Flexible Learning Centre Deception Bay – – – 10
Average score of the school – – – – – – – – – – – – – – – ∗ ∗ ∧ ∧ ∗Percentage (%) of students at or above NMS – – – – – – – – – – – – – – – ∗ ∗ ∧ ∧ ∗
Deception Bay North State School Deception Bay 88 72 47 –
Average score of the school 361 354 364 369 356 460 407 454 472 454 539 476 537 524 544 – – – – –
Percentage (%) of students at or above NMS 91% 88% 90% 94% 90% 90% 67% 87% 88% 88% 100% 86% 100% 95% 100% – – – – –
Deception Bay State High School Deception Bay – – – 142
Average score of the school – – – – – – – – – – – – – – – 528 510 543 520 532
Percentage (%) of students at or above NMS – – – – – – – – – – – – – – – 76% 63% 85% 75% 90%
KEY∧ to maintain privacy of individual student information, where there are fewer than five students tested results are not provided∗ no students in the year level sat the test due to absence, exemption or withdrawal– no students in the year levelNMS National Minimum Standard (for further information see www.nap.edu.au)
Queensland Curriculum & Assessment Authority
Page 34 of 149
NAPLAN 2014 Outcomes — All Queensland schools

Year level enrolments Year 3 Year 5 Year 7 Year 9
School Locality Yr 3 Yr 5 Yr 7 Yr 9 READ WRIT SPEL GP NMCY READ WRIT SPEL GP NMCY READ WRIT SPEL GP NMCY READ WRIT SPEL GP NMCY
Deception Bay State School Deception Bay 65 51 28 –
Average score of the school 362 328 352 362 347 416 404 434 420 420 497 486 510 508 512 – – – – –
Percentage (%) of students at or above NMS 87% 85% 85% 85% 88% 77% 54% 81% 74% 74% 79% 79% 71% 83% 83% – – – – –
Delaneys Creek State School D’Aguilar 24 23 11 –
Average score of the school 376 383 388 390 410 493 415 485 496 476 543 507 555 529 542 – – – – –
Percentage (%) of students at or above NMS 92% 100% 100% 96% 96% 96% 65% 91% 91% 91% 100% 100% 100% 82% 100% – – – – –
Denison State School Emerald 86 68 34 –
Average score of the school 399 388 411 417 385 477 457 481 497 470 513 471 522 511 522 – – – – –
Percentage (%) of students at or above NMS 93% 98% 98% 93% 96% 88% 85% 90% 84% 90% 88% 88% 88% 94% 91% – – – – –
Depot Hill State School Rockhampton 6 4 3 –
Average score of the school 349 348 337 327 329 ∧ ∧ ∧ ∧ ∧ ∧ ∧ ∧ ∧ ∧ – – – – –
Percentage (%) of students at or above NMS 100% 100% 100% 83% 100% ∧ ∧ ∧ ∧ ∧ ∧ ∧ ∧ ∧ ∧ – – – – –
Dimbulah State School Dimbulah 8 17 8 14
Average score of the school 415 353 396 407 429 497 416 478 466 480 531 505 503 501 532 576 561 592 567 616
Percentage (%) of students at or above NMS 100% 88% 100% 100% 100% 100% 60% 93% 87% 100% 100% 88% 88% 75% 100% 100% 92% 92% 83% 100%
Dingo State School Dingo 9 3 3 –
Average score of the school 353 368 332 354 355 ∧ ∧ ∧ ∧ ∧ ∧ ∧ ∧ ∧ ∧ – – – – –
Percentage (%) of students at or above NMS 78% 100% 78% 78% 100% ∧ ∧ ∧ ∧ ∧ ∧ ∧ ∧ ∧ ∧ – – – – –
Dirranbandi State School Dirranbandi 10 6 5 6
Average score of the school 341 375 363 346 389 502 480 482 474 476 467 381 521 476 475 539 490 536 509 547
Percentage (%) of students at or above NMS 78% 100% 100% 89% 100% 100% 100% 100% 83% 100% 100% 80% 100% 100% 80% 80% 60% 100% 80% 100%
Djarragun College Gordonvale 17 24 8 44
Average score of the school 281 265 315 274 257 388 340 446 378 373 423 378 488 417 429 464 395 486 463 476
Percentage (%) of students at or above NMS 67% 60% 73% 67% 53% 70% 50% 86% 50% 56% 33% 40% 83% 50% 40% 24% 13% 55% 33% 45%
Doomadgee State School Doomadgee 30 29 27 18
Average score of the school 233 210 221 256 266 325 255 314 303 329 395 223 335 331 430 439 297 427 397 440
Percentage (%) of students at or above NMS 15% 40% 19% 31% 56% 4% 13% 17% 21% 20% 33% 0% 0% 0% 41% 14% 0% 17% 17% 60%
Downlands Sacred Heart College Toowoomba – – – 131
Average score of the school – – – – – – – – – – – – – – – 587 563 585 584 608
Percentage (%) of students at or above NMS – – – – – – – – – – – – – – – 95% 87% 92% 92% 98%
Drayton State School Drayton 47 34 19 –
Average score of the school 400 359 397 388 385 504 473 515 510 486 515 490 503 500 501 – – – – –
Percentage (%) of students at or above NMS 85% 85% 100% 88% 98% 97% 94% 97% 100% 94% 100% 80% 73% 80% 100% – – – – –
Drillham State School Drillham 2 3 1 –
Average score of the school ∧ ∧ ∧ ∧ ∧ ∧ ∧ ∧ ∧ ∧ ∧ ∧ ∧ ∧ ∗ – – – – –
Percentage (%) of students at or above NMS ∧ ∧ ∧ ∧ ∧ ∧ ∧ ∧ ∧ ∧ ∧ ∧ ∧ ∧ ∗ – – – – –
KEY∧ to maintain privacy of individual student information, where there are fewer than five students tested results are not provided∗ no students in the year level sat the test due to absence, exemption or withdrawal– no students in the year levelNMS National Minimum Standard (for further information see www.nap.edu.au)
Queensland Curriculum & Assessment Authority
Page 35 of 149
NAPLAN 2014 Outcomes — All Queensland schools

Year level enrolments Year 3 Year 5 Year 7 Year 9
School Locality Yr 3 Yr 5 Yr 7 Yr 9 READ WRIT SPEL GP NMCY READ WRIT SPEL GP NMCY READ WRIT SPEL GP NMCY READ WRIT SPEL GP NMCY
Duaringa State School Duaringa 4 3 3 –
Average score of the school ∧ ∧ ∧ ∧ ∧ ∧ ∧ ∧ ∧ ∧ ∧ ∧ ∧ ∧ ∧ – – – – –
Percentage (%) of students at or above NMS ∧ ∧ ∧ ∧ ∧ ∧ ∧ ∧ ∧ ∧ ∧ ∧ ∧ ∧ ∧ – – – – –
Dulacca State School Dulacca 4 2 5 –
Average score of the school ∧ ∧ ∧ ∧ ∧ ∧ ∧ ∧ ∧ ∧ 451 451 446 476 480 – – – – –
Percentage (%) of students at or above NMS ∧ ∧ ∧ ∧ ∧ ∧ ∧ ∧ ∧ ∧ 100% 80% 100% 100% 80% – – – – –
Dundula State School Bakers Creek via Mackay 12 4 7 –
Average score of the school 404 340 363 366 347 ∧ ∧ ∧ ∧ ∧ 461 467 500 461 490 – – – – –
Percentage (%) of students at or above NMS 91% 91% 91% 91% 73% ∧ ∧ ∧ ∧ ∧ 57% 57% 71% 57% 71% – – – – –
Dunkeld State School Dunkeld via Mitchell 3 1 – –
Average score of the school ∧ ∧ ∧ ∧ ∧ ∧ ∧ ∧ ∧ ∧ – – – – – – – – – –
Percentage (%) of students at or above NMS ∧ ∧ ∧ ∧ ∧ ∧ ∧ ∧ ∧ ∧ – – – – – – – – – –
Dunwich State School Dunwich Stradbroke Island 15 17 15 –
Average score of the school 449 400 449 481 409 486 452 484 506 482 530 525 559 536 587 – – – – –
Percentage (%) of students at or above NMS 86% 80% 87% 87% 86% 100% 87% 100% 100% 93% 82% 82% 73% 64% 82% – – – – –
Durack State School Durack 79 68 31 –
Average score of the school 383 377 414 403 371 463 440 499 492 476 499 502 521 503 521 – – – – –
Percentage (%) of students at or above NMS 86% 87% 87% 86% 85% 80% 71% 85% 89% 86% 93% 83% 83% 93% 96% – – – – –
Durong South State School Durong 3 4 4 –
Average score of the school ∧ ∧ ∧ ∧ ∧ ∧ ∧ ∧ ∧ ∧ ∧ ∧ ∧ ∧ ∧ – – – – –
Percentage (%) of students at or above NMS ∧ ∧ ∧ ∧ ∧ ∧ ∧ ∧ ∧ ∧ ∧ ∧ ∧ ∧ ∧ – – – – –
Dutton Park State School Dutton Park 46 41 30 –
Average score of the school 427 360 407 423 392 542 482 534 553 511 602 557 564 602 587 – – – – –
Percentage (%) of students at or above NMS 88% 84% 89% 93% 93% 98% 95% 98% 100% 98% 100% 100% 100% 100% 100% – – – – –
Dysart State High School Dysart – – – 35
Average score of the school – – – – – – – – – – – – – – – 540 530 555 558 564
Percentage (%) of students at or above NMS – – – – – – – – – – – – – – – 88% 68% 85% 88% 94%
Dysart State School Dysart 49 59 22 –
Average score of the school 370 375 367 391 357 470 434 461 472 450 493 508 527 502 500 – – – – –
Percentage (%) of students at or above NMS 85% 91% 78% 91% 87% 85% 71% 78% 81% 89% 91% 95% 95% 82% 91% – – – – –
Eagle Junction State School Clayfield 115 94 41 –
Average score of the school 468 440 460 497 448 537 485 505 547 506 604 561 601 603 610 – – – – –
Percentage (%) of students at or above NMS 98% 99% 99% 99% 99% 97% 97% 97% 96% 96% 98% 98% 98% 98% 98% – – – – –
Eagleby South State School Eagleby 59 43 35 –
Average score of the school 346 347 363 345 338 417 426 468 453 420 507 501 517 516 493 – – – – –
Percentage (%) of students at or above NMS 87% 93% 91% 89% 93% 76% 89% 89% 89% 74% 88% 92% 92% 88% 100% – – – – –
KEY∧ to maintain privacy of individual student information, where there are fewer than five students tested results are not provided∗ no students in the year level sat the test due to absence, exemption or withdrawal– no students in the year levelNMS National Minimum Standard (for further information see www.nap.edu.au)
Queensland Curriculum & Assessment Authority
Page 36 of 149
NAPLAN 2014 Outcomes — All Queensland schools

Year level enrolments Year 3 Year 5 Year 7 Year 9
School Locality Yr 3 Yr 5 Yr 7 Yr 9 READ WRIT SPEL GP NMCY READ WRIT SPEL GP NMCY READ WRIT SPEL GP NMCY READ WRIT SPEL GP NMCY
Eagleby State School Eagleby 54 50 37 –
Average score of the school 375 360 357 385 357 459 442 459 470 445 492 466 495 485 492 – – – – –
Percentage (%) of students at or above NMS 93% 93% 91% 91% 96% 84% 78% 82% 91% 87% 87% 84% 84% 77% 96% – – – – –
Earnshaw State College Banyo 40 50 30 58
Average score of the school 366 352 393 395 357 471 465 474 479 473 520 513 534 524 525 561 523 576 562 560
Percentage (%) of students at or above NMS 79% 87% 92% 95% 87% 94% 94% 96% 94% 96% 100% 90% 100% 90% 100% 82% 70% 84% 82% 87%
East Brisbane State School East Brisbane 26 26 13 –
Average score of the school 456 423 432 459 422 544 478 508 515 505 543 504 545 550 552 – – – – –
Percentage (%) of students at or above NMS 84% 76% 80% 80% 84% 92% 83% 96% 83% 87% 100% 92% 92% 100% 100% – – – – –
Eatons Hill State School Eatons Hill 140 133 98 –
Average score of the school 428 402 425 446 402 500 482 481 509 491 566 543 544 559 558 – – – – –
Percentage (%) of students at or above NMS 98% 98% 98% 98% 96% 96% 91% 94% 98% 97% 95% 95% 91% 91% 98% – – – – –
Edens Landing State School Edens Landing 109 86 47 –
Average score of the school 388 374 399 400 365 488 445 498 494 471 512 485 511 506 526 – – – – –
Percentage (%) of students at or above NMS 89% 92% 92% 92% 94% 88% 85% 94% 91% 88% 96% 93% 85% 91% 98% – – – – –
Edge Hill State School Edge Hill 128 136 78 –
Average score of the school 425 437 419 439 401 502 474 508 526 498 539 493 549 546 546 – – – – –
Percentage (%) of students at or above NMS 95% 97% 96% 96% 95% 94% 94% 98% 97% 97% 96% 89% 99% 97% 99% – – – – –
Eidsvold State School Eidsvold 8 6 5 10
Average score of the school 341 353 366 362 340 414 397 428 366 416 498 462 500 484 495 542 487 540 531 533
Percentage (%) of students at or above NMS 63% 100% 100% 100% 100% 83% 83% 100% 50% 83% 80% 80% 100% 100% 100% 89% 67% 89% 78% 89%
Eight Mile Plains State School Eight Mile Plains 32 24 14 –
Average score of the school 392 348 394 400 367 463 438 483 470 448 528 452 526 497 506 – – – – –
Percentage (%) of students at or above NMS 94% 84% 94% 90% 87% 83% 74% 87% 87% 74% 100% 71% 100% 86% 100% – – – – –
Eimeo Road State School Mackay 127 134 – –
Average score of the school 415 396 405 445 405 494 460 481 502 488 – – – – – – – – – –
Percentage (%) of students at or above NMS 96% 98% 94% 96% 98% 93% 86% 90% 95% 96% – – – – – – – – – –
El Arish State School El Arish 7 6 3 –
Average score of the school 428 389 400 394 467 ∧ ∧ ∧ ∧ ∧ ∧ ∧ ∧ ∧ ∧ – – – – –
Percentage (%) of students at or above NMS 100% 100% 100% 100% 100% ∧ ∧ ∧ ∧ ∧ ∧ ∧ ∧ ∧ ∧ – – – – –
Elanora State High School Elanora – – – 153
Average score of the school – – – – – – – – – – – – – – – 557 519 561 553 569
Percentage (%) of students at or above NMS – – – – – – – – – – – – – – – 86% 68% 89% 85% 95%
Elanora State School Elanora 157 136 115 –
Average score of the school 442 410 425 455 419 509 463 503 508 494 562 520 561 559 568 – – – – –
Percentage (%) of students at or above NMS 99% 100% 99% 100% 100% 96% 91% 98% 95% 97% 100% 95% 99% 99% 100% – – – – –
KEY∧ to maintain privacy of individual student information, where there are fewer than five students tested results are not provided∗ no students in the year level sat the test due to absence, exemption or withdrawal– no students in the year levelNMS National Minimum Standard (for further information see www.nap.edu.au)
Queensland Curriculum & Assessment Authority
Page 37 of 149
NAPLAN 2014 Outcomes — All Queensland schools

Year level enrolments Year 3 Year 5 Year 7 Year 9
School Locality Yr 3 Yr 5 Yr 7 Yr 9 READ WRIT SPEL GP NMCY READ WRIT SPEL GP NMCY READ WRIT SPEL GP NMCY READ WRIT SPEL GP NMCY
Elimbah State School Elimbah 74 72 40 –
Average score of the school 388 360 370 397 369 498 450 484 486 473 529 479 518 528 526 – – – – –
Percentage (%) of students at or above NMS 87% 94% 91% 96% 100% 97% 91% 97% 95% 94% 97% 79% 94% 94% 97% – – – – –
Elliott Heads State School Elliott Heads Bundaberg 11 14 6 –
Average score of the school 379 341 395 365 374 425 427 455 427 435 495 430 477 492 484 – – – – –
Percentage (%) of students at or above NMS 82% 73% 91% 73% 82% 71% 86% 86% 79% 79% 83% 67% 83% 67% 100% – – – – –
Emerald Christian College Emerald 22 20 17 12
Average score of the school 414 393 408 426 383 488 432 479 489 467 521 462 546 522 517 531 496 512 530 560
Percentage (%) of students at or above NMS 95% 100% 100% 95% 100% 89% 79% 95% 84% 100% 94% 71% 88% 88% 94% 91% 55% 73% 73% 100%
Emerald North State School Emerald 40 40 29 –
Average score of the school 408 366 382 375 362 457 409 446 465 444 502 468 494 503 498 – – – – –
Percentage (%) of students at or above NMS 89% 90% 92% 92% 89% 74% 69% 72% 74% 74% 79% 61% 71% 71% 85% – – – – –
Emerald State High School Emerald – – – 152
Average score of the school – – – – – – – – – – – – – – – 542 501 541 539 556
Percentage (%) of students at or above NMS – – – – – – – – – – – – – – – 80% 61% 79% 72% 94%
Emerald State School Emerald 48 52 28 –
Average score of the school 408 395 389 437 411 466 435 458 473 456 516 502 510 527 524 – – – – –
Percentage (%) of students at or above NMS 92% 98% 98% 98% 98% 88% 78% 92% 92% 90% 96% 93% 92% 96% 100% – – – – –
Emmanuel Catholic Primary School Mount Pleasant 81 78 72 –
Average score of the school 420 412 405 449 415 492 464 480 514 491 551 516 537 542 563 – – – – –
Percentage (%) of students at or above NMS 99% 100% 100% 99% 100% 96% 92% 92% 96% 99% 100% 95% 97% 97% 100% – – – – –
Emmanuel College Carrara 81 116 140 154
Average score of the school 467 443 431 470 420 546 518 519 558 531 584 568 574 585 586 619 609 607 630 628
Percentage (%) of students at or above NMS 100% 100% 100% 99% 99% 100% 99% 100% 100% 99% 100% 99% 98% 100% 100% 98% 98% 99% 99% 99%
Emmaus College North Rockhampton – – – 245
Average score of the school – – – – – – – – – – – – – – – 563 536 579 560 575
Percentage (%) of students at or above NMS – – – – – – – – – – – – – – – 92% 80% 94% 89% 99%
Emmaus College Jimboomba 88 91 63 145
Average score of the school 407 423 403 416 387 490 477 492 499 472 546 492 538 545 546 566 526 565 555 564
Percentage (%) of students at or above NMS 98% 100% 99% 99% 100% 95% 98% 96% 98% 95% 100% 93% 98% 94% 100% 95% 75% 93% 90% 100%
Emu Creek State School East Greenmount 2 3 – –
Average score of the school ∧ ∧ ∧ ∧ ∧ ∧ ∧ ∧ ∧ ∧ – – – – – – – – – –
Percentage (%) of students at or above NMS ∧ ∧ ∧ ∧ ∧ ∧ ∧ ∧ ∧ ∧ – – – – – – – – – –
Emu Park State School Emu Park 57 55 26 –
Average score of the school 377 366 380 411 381 473 442 447 479 480 514 457 478 481 524 – – – – –
Percentage (%) of students at or above NMS 89% 91% 89% 96% 96% 85% 83% 80% 85% 92% 96% 70% 78% 70% 100% – – – – –
KEY∧ to maintain privacy of individual student information, where there are fewer than five students tested results are not provided∗ no students in the year level sat the test due to absence, exemption or withdrawal– no students in the year levelNMS National Minimum Standard (for further information see www.nap.edu.au)
Queensland Curriculum & Assessment Authority
Page 38 of 149
NAPLAN 2014 Outcomes — All Queensland schools

Year level enrolments Year 3 Year 5 Year 7 Year 9
School Locality Yr 3 Yr 5 Yr 7 Yr 9 READ WRIT SPEL GP NMCY READ WRIT SPEL GP NMCY READ WRIT SPEL GP NMCY READ WRIT SPEL GP NMCY
Endeavour Christian College Cooktown 18 12 3 –
Average score of the school 381 416 378 409 381 491 474 496 478 446 ∧ ∧ ∧ ∧ ∧ – – – – –
Percentage (%) of students at or above NMS 100% 100% 100% 100% 91% 100% 100% 88% 100% 88% ∧ ∧ ∧ ∧ ∧ – – – – –
Enoggera State School Enoggera 31 21 9 –
Average score of the school 431 402 405 450 387 506 435 479 486 507 565 512 542 541 564 – – – – –
Percentage (%) of students at or above NMS 93% 93% 93% 97% 100% 89% 79% 84% 89% 100% 100% 100% 100% 88% 100% – – – – –
Eromanga State School Eromanga 1 – – –
Average score of the school ∧ ∧ ∧ ∧ ∧ – – – – – – – – – – – – – – –
Percentage (%) of students at or above NMS ∧ ∧ ∧ ∧ ∧ – – – – – – – – – – – – – – –
Esk State School Esk 28 20 12 –
Average score of the school 371 347 348 352 362 490 416 455 491 467 521 494 529 509 489 – – – – –
Percentage (%) of students at or above NMS 71% 89% 86% 82% 79% 75% 70% 70% 70% 65% 100% 100% 100% 100% 100% – – – – –
Eton North State School North Eton – – 2 –
Average score of the school – – – – – – – – – – ∧ ∧ ∧ ∧ ∧ – – – – –
Percentage (%) of students at or above NMS – – – – – – – – – – ∧ ∧ ∧ ∧ ∧ – – – – –
Eton State School Eton 11 9 3 –
Average score of the school 482 395 414 451 526 472 449 487 487 479 ∧ ∧ ∧ ∧ ∧ – – – – –
Percentage (%) of students at or above NMS 100% 100% 100% 100% 100% 100% 89% 100% 100% 100% ∧ ∧ ∧ ∧ ∧ – – – – –
Eudlo State School Eudlo 10 6 6 –
Average score of the school 376 377 340 371 360 474 455 449 455 462 ∧ ∧ ∧ ∧ ∧ – – – – –
Percentage (%) of students at or above NMS 100% 100% 89% 89% 89% 100% 100% 60% 80% 100% ∧ ∧ ∧ ∧ ∧ – – – – –
Eulo State School Eulo 3 2 2 –
Average score of the school ∧ ∧ ∧ ∧ ∧ ∧ ∧ ∧ ∧ ∧ ∧ ∧ ∧ ∧ ∧ – – – – –
Percentage (%) of students at or above NMS ∧ ∧ ∧ ∧ ∧ ∧ ∧ ∧ ∧ ∧ ∧ ∧ ∧ ∧ ∧ – – – – –
Eumundi State School Eumundi 83 69 54 –
Average score of the school 422 395 403 442 408 522 474 509 530 507 573 541 555 595 597 – – – – –
Percentage (%) of students at or above NMS 95% 100% 96% 99% 99% 98% 98% 98% 95% 98% 100% 98% 98% 100% 100% – – – – –
Eungella State School Dalrymple Heights via Mackay 7 5 4 –
Average score of the school 374 346 323 378 391 525 435 454 527 531 ∧ ∧ ∧ ∧ ∧ – – – – –
Percentage (%) of students at or above NMS 83% 100% 100% 100% 100% 100% 80% 100% 100% 100% ∧ ∧ ∧ ∧ ∧ – – – – –
Everton Park State High School Everton Park – – – 44
Average score of the school – – – – – – – – – – – – – – – 538 490 542 533 551
Percentage (%) of students at or above NMS – – – – – – – – – – – – – – – 74% 58% 70% 68% 87%
Everton Park State School Everton Park 61 63 25 –
Average score of the school 424 391 408 426 410 519 474 507 522 491 608 562 557 596 569 – – – – –
Percentage (%) of students at or above NMS 91% 97% 95% 95% 91% 97% 86% 96% 96% 97% 100% 91% 92% 100% 100% – – – – –
KEY∧ to maintain privacy of individual student information, where there are fewer than five students tested results are not provided∗ no students in the year level sat the test due to absence, exemption or withdrawal– no students in the year levelNMS National Minimum Standard (for further information see www.nap.edu.au)
Queensland Curriculum & Assessment Authority
Page 39 of 149
NAPLAN 2014 Outcomes — All Queensland schools

Year level enrolments Year 3 Year 5 Year 7 Year 9
School Locality Yr 3 Yr 5 Yr 7 Yr 9 READ WRIT SPEL GP NMCY READ WRIT SPEL GP NMCY READ WRIT SPEL GP NMCY READ WRIT SPEL GP NMCY
Fairholme College Toowoomba 23 31 45 104
Average score of the school 501 432 440 519 421 560 497 530 582 532 582 548 571 597 569 613 599 604 628 622
Percentage (%) of students at or above NMS 96% 100% 96% 96% 96% 100% 97% 100% 100% 100% 100% 100% 100% 98% 100% 99% 96% 98% 97% 100%
Fairview Heights State School Toowoomba 81 68 44 –
Average score of the school 395 372 396 394 381 492 425 477 489 471 511 458 510 500 515 – – – – –
Percentage (%) of students at or above NMS 82% 86% 87% 86% 86% 89% 67% 89% 86% 86% 91% 68% 84% 82% 91% – – – – –
Faith Baptist Christian School (Gladstone) Burua 4 8 10 8
Average score of the school ∧ ∧ ∧ ∧ ∧ 475 459 518 519 439 ∧ ∧ ∧ ∧ ∧ 599 585 642 635 636
Percentage (%) of students at or above NMS ∧ ∧ ∧ ∧ ∧ 100% 75% 88% 88% 100% ∧ ∧ ∧ ∧ ∧ 100% 80% 100% 100% 100%
Faith Christian School of Distance Education Karawatha 40 46 26 29
Average score of the school 420 366 375 428 375 529 473 516 575 511 ∧ ∧ ∧ ∧ ∧ 618 559 581 604 608
Percentage (%) of students at or above NMS 100% 100% 100% 100% 100% 92% 85% 92% 92% 92% ∧ ∧ ∧ ∧ ∧ 100% 86% 100% 100% 100%
Faith Lutheran College Plainland – – – 133
Average score of the school – – – – – – – – – – – – – – – 554 520 545 543 560
Percentage (%) of students at or above NMS – – – – – – – – – – – – – – – 93% 73% 82% 84% 97%
Faith Lutheran College - Redlands Victoria Point – – 78 107
Average score of the school – – – – – – – – – – 535 500 525 540 529 579 557 573 572 586
Percentage (%) of students at or above NMS – – – – – – – – – – 99% 96% 95% 96% 99% 96% 85% 94% 95% 98%
Faith Lutheran College - Redlands (Link
Road Campus)
Victoria Point 73 72 – –
Average score of the school 447 421 420 468 435 518 460 477 515 479 – – – – – – – – – –
Percentage (%) of students at or above NMS 100% 99% 99% 100% 100% 100% 92% 98% 100% 97% – – – – – – – – – –
Farleigh State School Farleigh 3 9 – –
Average score of the school ∧ ∧ ∧ ∧ ∧ 447 454 409 472 474 – – – – – – – – – –
Percentage (%) of students at or above NMS ∧ ∧ ∧ ∧ ∧ 89% 100% 67% 100% 89% – – – – – – – – – –
Farnborough State School Farnborough via Yeppoon 38 41 29 –
Average score of the school 426 385 413 438 410 504 462 486 499 481 554 541 528 552 545 – – – – –
Percentage (%) of students at or above NMS 97% 94% 97% 100% 100% 97% 87% 97% 95% 95% 96% 100% 96% 96% 96% – – – – –
Federal State School Pomona 13 9 10 –
Average score of the school 476 423 418 483 487 494 487 519 513 485 565 556 582 578 557 – – – – –
Percentage (%) of students at or above NMS 100% 100% 100% 100% 100% 100% 100% 100% 100% 89% 100% 100% 100% 100% 100% – – – – –
Feluga State School Feluga via Tully 2 2 1 –
Average score of the school ∧ ∧ ∧ ∧ ∧ ∧ ∧ ∧ ∧ ∧ ∧ ∧ ∧ ∧ ∧ – – – – –
Percentage (%) of students at or above NMS ∧ ∧ ∧ ∧ ∧ ∧ ∧ ∧ ∧ ∧ ∧ ∧ ∧ ∧ ∧ – – – – –
KEY∧ to maintain privacy of individual student information, where there are fewer than five students tested results are not provided∗ no students in the year level sat the test due to absence, exemption or withdrawal– no students in the year levelNMS National Minimum Standard (for further information see www.nap.edu.au)
Queensland Curriculum & Assessment Authority
Page 40 of 149
NAPLAN 2014 Outcomes — All Queensland schools

Year level enrolments Year 3 Year 5 Year 7 Year 9
School Locality Yr 3 Yr 5 Yr 7 Yr 9 READ WRIT SPEL GP NMCY READ WRIT SPEL GP NMCY READ WRIT SPEL GP NMCY READ WRIT SPEL GP NMCY
Fernvale State School Fernvale 73 74 65 –
Average score of the school 388 375 384 416 376 518 456 501 516 473 553 507 535 547 559 – – – – –
Percentage (%) of students at or above NMS 86% 94% 90% 91% 92% 90% 81% 93% 90% 92% 93% 81% 89% 91% 97% – – – – –
Ferny Grove State High School Ferny Grove – – – 310
Average score of the school – – – – – – – – – – – – – – – 581 546 572 578 582
Percentage (%) of students at or above NMS – – – – – – – – – – – – – – – 93% 79% 90% 92% 96%
Ferny Grove State School Ferny Grove 100 102 72 –
Average score of the school 418 392 409 426 401 496 443 490 501 478 560 529 534 552 548 – – – – –
Percentage (%) of students at or above NMS 96% 97% 97% 95% 98% 91% 82% 92% 91% 90% 100% 91% 93% 94% 99% – – – – –
Ferny Hills State School Ferny Hills 65 49 32 –
Average score of the school 405 364 390 405 374 503 455 496 504 479 540 516 556 541 551 – – – – –
Percentage (%) of students at or above NMS 92% 90% 92% 94% 92% 100% 92% 96% 98% 96% 100% 97% 97% 97% 100% – – – – –
Fig Tree Pocket State School Fig Tree Pocket 54 72 35 –
Average score of the school 499 459 461 522 470 567 516 530 586 550 594 564 580 608 605 – – – – –
Percentage (%) of students at or above NMS 100% 100% 100% 100% 100% 100% 99% 100% 100% 100% 100% 100% 100% 100% 100% – – – – –
Finch Hatton State School Finch Hatton 6 8 7 –
Average score of the school 385 349 352 378 335 512 448 432 439 455 532 490 547 543 503 – – – – –
Percentage (%) of students at or above NMS 83% 100% 83% 100% 100% 100% 83% 83% 83% 100% 100% 86% 100% 86% 100% – – – – –
Fitzgerald State School Mackay North 97 98 69 –
Average score of the school 403 402 390 421 393 483 454 474 495 467 551 521 552 555 554 – – – – –
Percentage (%) of students at or above NMS 98% 96% 96% 98% 97% 93% 89% 90% 92% 91% 98% 97% 97% 97% 97% – – – – –
Flagstone Creek State School Flagstone Creek via Helidon 8 6 7 –
Average score of the school 411 378 367 406 404 418 435 430 444 397 491 490 479 479 511 – – – – –
Percentage (%) of students at or above NMS 100% 100% 86% 100% 100% 80% 80% 80% 80% 60% 100% 100% 86% 71% 100% – – – – –
Flagstone State Community College Flagstone – – – 170
Average score of the school – – – – – – – – – – – – – – – 547 512 552 536 554
Percentage (%) of students at or above NMS – – – – – – – – – – – – – – – 85% 69% 89% 81% 94%
Flagstone State School Flagstone 89 78 71 –
Average score of the school 374 384 370 390 358 446 426 463 453 441 526 497 522 516 522 – – – – –
Percentage (%) of students at or above NMS 88% 99% 95% 94% 94% 89% 81% 92% 93% 89% 95% 89% 97% 92% 100% – – – – –
Flying Fish Point State School Flying Fish Point 12 12 10 –
Average score of the school 445 413 476 454 427 484 440 470 471 473 498 461 496 513 501 – – – – –
Percentage (%) of students at or above NMS 100% 100% 100% 100% 100% 91% 82% 91% 91% 91% 90% 90% 100% 90% 100% – – – – –
Forest Hill State School Forest Hill 25 22 10 –
Average score of the school 395 343 369 396 365 484 447 434 492 459 551 466 536 523 543 – – – – –
Percentage (%) of students at or above NMS 88% 88% 96% 92% 88% 90% 90% 81% 95% 90% 100% 78% 89% 89% 89% – – – – –
KEY∧ to maintain privacy of individual student information, where there are fewer than five students tested results are not provided∗ no students in the year level sat the test due to absence, exemption or withdrawal– no students in the year levelNMS National Minimum Standard (for further information see www.nap.edu.au)
Queensland Curriculum & Assessment Authority
Page 41 of 149
NAPLAN 2014 Outcomes — All Queensland schools

Year level enrolments Year 3 Year 5 Year 7 Year 9
School Locality Yr 3 Yr 5 Yr 7 Yr 9 READ WRIT SPEL GP NMCY READ WRIT SPEL GP NMCY READ WRIT SPEL GP NMCY READ WRIT SPEL GP NMCY
Forest Lake State High School Forest Lake – – – 265
Average score of the school – – – – – – – – – – – – – – – 567 554 587 565 580
Percentage (%) of students at or above NMS – – – – – – – – – – – – – – – 92% 83% 91% 87% 96%
Forest Lake State School Forest Lake 123 139 78 –
Average score of the school 425 414 450 453 409 505 481 503 510 491 556 511 565 567 572 – – – – –
Percentage (%) of students at or above NMS 99% 98% 98% 98% 97% 96% 92% 95% 92% 94% 96% 85% 95% 88% 97% – – – – –
Forrest Beach State School Allingham 5 8 3 –
Average score of the school 386 409 392 391 359 527 467 507 532 483 ∧ ∧ ∧ ∧ ∧ – – – – –
Percentage (%) of students at or above NMS 100% 100% 100% 100% 100% 100% 88% 100% 100% 100% ∧ ∧ ∧ ∧ ∧ – – – – –
Forsayth State School Forsayth 1 1 1 –
Average score of the school ∧ ∧ ∧ ∧ ∧ ∧ ∧ ∧ ∧ ∧ ∧ ∧ ∧ ∧ ∧ – – – – –
Percentage (%) of students at or above NMS ∧ ∧ ∧ ∧ ∧ ∧ ∧ ∧ ∧ ∧ ∧ ∧ ∧ ∧ ∧ – – – – –
Fraser Coast Anglican College Hervey Bay 46 43 43 73
Average score of the school 432 399 409 439 412 509 495 514 534 504 580 538 564 579 580 620 587 605 609 634
Percentage (%) of students at or above NMS 98% 98% 100% 98% 98% 95% 98% 98% 100% 95% 100% 95% 98% 95% 100% 99% 91% 96% 99% 100%
Freestone State School Freestone via Warwick 8 7 2 –
Average score of the school 405 385 397 459 432 476 496 480 531 501 ∧ ∧ ∧ ∧ ∧ – – – – –
Percentage (%) of students at or above NMS 75% 100% 100% 88% 100% 86% 100% 100% 86% 100% ∧ ∧ ∧ ∧ ∧ – – – – –
Frenchville State School North Rockhampton 143 110 88 –
Average score of the school 430 420 423 457 421 521 471 504 527 499 525 480 520 530 532 – – – – –
Percentage (%) of students at or above NMS 98% 99% 97% 99% 98% 96% 94% 92% 97% 92% 93% 79% 90% 92% 95% – – – – –
Freshwater Christian College Brinsmead 38 38 22 42
Average score of the school 470 403 445 450 433 523 443 481 505 496 527 479 516 526 510 590 554 611 590 583
Percentage (%) of students at or above NMS 100% 100% 100% 100% 100% 97% 86% 92% 94% 94% 95% 85% 90% 90% 95% 100% 92% 100% 97% 100%
Freshwater State School Freshwater 109 73 54 –
Average score of the school 434 381 415 431 407 519 468 493 519 495 573 492 548 555 571 – – – – –
Percentage (%) of students at or above NMS 97% 94% 97% 95% 97% 89% 88% 96% 93% 96% 96% 87% 96% 92% 100% – – – – –
Gabbinbar State School Toowoomba 55 40 34 –
Average score of the school 427 377 393 416 393 510 460 479 485 487 524 444 507 521 506 – – – – –
Percentage (%) of students at or above NMS 91% 89% 80% 89% 91% 83% 85% 85% 80% 90% 97% 68% 88% 91% 94% – – – – –
Garbutt State School Garbutt 16 17 12 –
Average score of the school 319 323 313 318 313 414 377 401 398 386 454 364 468 442 436 – – – – –
Percentage (%) of students at or above NMS 80% 87% 67% 87% 87% 57% 31% 54% 62% 50% 73% 33% 75% 58% 45% – – – – –
Gargett State School Gargett – 3 1 –
Average score of the school – – – – – ∧ ∧ ∧ ∧ ∧ ∧ ∧ ∧ ∧ ∧ – – – – –
Percentage (%) of students at or above NMS – – – – – ∧ ∧ ∧ ∧ ∧ ∧ ∧ ∧ ∧ ∧ – – – – –
KEY∧ to maintain privacy of individual student information, where there are fewer than five students tested results are not provided∗ no students in the year level sat the test due to absence, exemption or withdrawal– no students in the year levelNMS National Minimum Standard (for further information see www.nap.edu.au)
Queensland Curriculum & Assessment Authority
Page 42 of 149
NAPLAN 2014 Outcomes — All Queensland schools

Year level enrolments Year 3 Year 5 Year 7 Year 9
School Locality Yr 3 Yr 5 Yr 7 Yr 9 READ WRIT SPEL GP NMCY READ WRIT SPEL GP NMCY READ WRIT SPEL GP NMCY READ WRIT SPEL GP NMCY
Gatton State School Gatton 61 86 37 –
Average score of the school 387 380 375 392 373 465 416 462 473 468 515 464 509 497 503 – – – – –
Percentage (%) of students at or above NMS 82% 81% 77% 82% 89% 75% 61% 75% 75% 80% 88% 74% 76% 76% 88% – – – – –
Gaven State School Oxenford 86 78 42 –
Average score of the school 364 342 370 384 348 476 427 477 489 469 538 506 541 541 548 – – – – –
Percentage (%) of students at or above NMS 83% 88% 87% 95% 87% 91% 75% 90% 92% 91% 97% 91% 92% 97% 97% – – – – –
Gayndah State School Gayndah 28 17 24 –
Average score of the school 329 360 322 332 398 479 469 461 499 488 534 507 520 547 560 – – – – –
Percentage (%) of students at or above NMS 79% 100% 83% 78% 100% 100% 100% 92% 100% 100% 100% 95% 89% 95% 100% – – – – –
Geebung State School Geebung 38 40 28 –
Average score of the school 463 409 441 479 417 512 467 492 517 493 549 507 549 547 542 – – – – –
Percentage (%) of students at or above NMS 100% 100% 100% 100% 100% 95% 89% 92% 95% 97% 89% 82% 89% 89% 93% – – – – –
Geham State School Cabarlah 18 13 9 –
Average score of the school 433 364 368 423 402 524 462 470 514 505 494 423 475 525 532 – – – – –
Percentage (%) of students at or above NMS 94% 94% 94% 100% 100% 92% 100% 83% 92% 100% 88% 50% 75% 100% 100% – – – – –
Genesis Christian College Bray Park 109 114 111 114
Average score of the school 447 420 428 458 416 522 486 514 539 504 571 542 562 581 576 599 580 598 604 615
Percentage (%) of students at or above NMS 99% 99% 100% 100% 100% 99% 95% 99% 99% 99% 97% 98% 99% 98% 99% 100% 93% 97% 98% 100%
Georgetown State School Georgetown 4 4 – –
Average score of the school ∧ ∧ ∧ ∧ ∧ ∧ ∧ ∧ ∧ ∧ – – – – – – – – – –
Percentage (%) of students at or above NMS ∧ ∧ ∧ ∧ ∧ ∧ ∧ ∧ ∧ ∧ – – – – – – – – – –
Gilroy Santa Maria College Ingham – – – 65
Average score of the school – – – – – – – – – – – – – – – 575 553 587 567 587
Percentage (%) of students at or above NMS – – – – – – – – – – – – – – – 98% 83% 97% 95% 100%
Gilston State School Gilston 87 74 41 –
Average score of the school 417 396 404 436 392 499 445 473 497 463 549 516 541 555 547 – – – – –
Percentage (%) of students at or above NMS 93% 96% 95% 98% 94% 92% 84% 89% 89% 86% 100% 95% 98% 98% 98% – – – – –
Gin Gin State High School Gin Gin – – – 109
Average score of the school – – – – – – – – – – – – – – – 563 528 559 553 569
Percentage (%) of students at or above NMS – – – – – – – – – – – – – – – 88% 70% 84% 84% 96%
Gin Gin State School Gin Gin 47 45 38 –
Average score of the school 401 380 392 405 382 456 412 458 442 454 524 490 508 526 540 – – – – –
Percentage (%) of students at or above NMS 91% 93% 91% 98% 100% 90% 72% 95% 90% 90% 91% 84% 84% 88% 97% – – – – –
Gindie State School Gindie 4 3 – –
Average score of the school ∧ ∧ ∧ ∧ ∧ ∧ ∧ ∧ ∧ ∧ – – – – – – – – – –
Percentage (%) of students at or above NMS ∧ ∧ ∧ ∧ ∧ ∧ ∧ ∧ ∧ ∧ – – – – – – – – – –
KEY∧ to maintain privacy of individual student information, where there are fewer than five students tested results are not provided∗ no students in the year level sat the test due to absence, exemption or withdrawal– no students in the year levelNMS National Minimum Standard (for further information see www.nap.edu.au)
Queensland Curriculum & Assessment Authority
Page 43 of 149
NAPLAN 2014 Outcomes — All Queensland schools

Year level enrolments Year 3 Year 5 Year 7 Year 9
School Locality Yr 3 Yr 5 Yr 7 Yr 9 READ WRIT SPEL GP NMCY READ WRIT SPEL GP NMCY READ WRIT SPEL GP NMCY READ WRIT SPEL GP NMCY
Giru State School Giru 7 9 7 –
Average score of the school 302 348 301 342 330 482 442 519 506 482 529 504 518 509 525 – – – – –
Percentage (%) of students at or above NMS 71% 100% 86% 100% 86% 100% 100% 89% 89% 100% 86% 100% 100% 71% 100% – – – – –
Givelda State School Pine Creek via Bundaberg – 1 1 –
Average score of the school – – – – – ∧ ∧ ∧ ∧ ∧ ∧ ∧ ∧ ∧ ∧ – – – – –
Percentage (%) of students at or above NMS – – – – – ∧ ∧ ∧ ∧ ∧ ∧ ∧ ∧ ∧ ∧ – – – – –
Gladstone Central State School Gladstone 38 36 25 –
Average score of the school 412 397 410 437 404 512 469 483 513 496 538 527 534 532 540 – – – – –
Percentage (%) of students at or above NMS 84% 92% 87% 87% 92% 97% 94% 89% 100% 100% 96% 100% 96% 100% 100% – – – – –
Gladstone South State School Gladstone 37 32 13 –
Average score of the school 376 349 360 367 369 466 418 477 472 465 496 380 501 470 489 – – – – –
Percentage (%) of students at or above NMS 81% 88% 81% 91% 90% 97% 83% 90% 86% 93% 100% 50% 60% 90% 100% – – – – –
Gladstone State High School Gladstone – – – 281
Average score of the school – – – – – – – – – – – – – – – 553 517 568 550 570
Percentage (%) of students at or above NMS – – – – – – – – – – – – – – – 87% 68% 88% 84% 95%
Gladstone West State School Gladstone 89 86 48 –
Average score of the school 407 367 410 415 402 482 453 484 494 470 530 499 536 532 519 – – – – –
Percentage (%) of students at or above NMS 92% 90% 88% 92% 98% 92% 80% 89% 91% 96% 98% 89% 96% 91% 100% – – – – –
Glamorgan Vale State School Glamorgan Vale 10 2 2 –
Average score of the school 410 365 375 439 383 ∧ ∧ ∧ ∧ ∧ ∧ ∧ ∧ ∧ ∧ – – – – –
Percentage (%) of students at or above NMS 90% 90% 90% 90% 90% ∧ ∧ ∧ ∧ ∧ ∧ ∧ ∧ ∧ ∧ – – – – –
Glass House Mountains State School Glass House Mountains 61 57 34 –
Average score of the school 400 383 378 388 377 501 478 498 497 485 526 489 531 535 542 – – – – –
Percentage (%) of students at or above NMS 96% 100% 93% 93% 98% 92% 98% 96% 92% 96% 91% 80% 90% 81% 91% – – – – –
Glasshouse Country Christian College Beerwah 77 59 55 77
Average score of the school 425 391 394 420 394 507 472 494 515 495 542 492 532 526 535 569 525 569 555 577
Percentage (%) of students at or above NMS 96% 99% 94% 96% 99% 95% 95% 98% 95% 97% 100% 88% 94% 96% 100% 94% 75% 91% 93% 100%
Glen Aplin State School Glen Aplin 8 13 8 –
Average score of the school 404 387 402 412 397 463 461 461 498 493 518 494 520 483 520 – – – – –
Percentage (%) of students at or above NMS 88% 88% 88% 88% 100% 85% 85% 85% 100% 100% 88% 100% 88% 88% 100% – – – – –
Glenala State High School Inala Heights – – – 131
Average score of the school – – – – – – – – – – – – – – – 533 499 556 531 551
Percentage (%) of students at or above NMS – – – – – – – – – – – – – – – 82% 63% 86% 75% 97%
Glenden State School Glenden 22 21 13 12
Average score of the school 452 402 429 459 402 468 464 499 480 464 533 519 561 559 580 550 540 581 561 569
Percentage (%) of students at or above NMS 91% 95% 95% 95% 95% 95% 89% 100% 100% 95% 92% 85% 92% 92% 92% 92% 92% 75% 100% 100%
KEY∧ to maintain privacy of individual student information, where there are fewer than five students tested results are not provided∗ no students in the year level sat the test due to absence, exemption or withdrawal– no students in the year levelNMS National Minimum Standard (for further information see www.nap.edu.au)
Queensland Curriculum & Assessment Authority
Page 44 of 149
NAPLAN 2014 Outcomes — All Queensland schools

Year level enrolments Year 3 Year 5 Year 7 Year 9
School Locality Yr 3 Yr 5 Yr 7 Yr 9 READ WRIT SPEL GP NMCY READ WRIT SPEL GP NMCY READ WRIT SPEL GP NMCY READ WRIT SPEL GP NMCY
Gleneagle State School Gleneagle 17 22 14 –
Average score of the school 380 343 372 387 360 475 427 450 464 448 515 474 532 484 483 – – – – –
Percentage (%) of students at or above NMS 87% 88% 100% 94% 94% 91% 86% 91% 86% 95% 100% 77% 100% 85% 92% – – – – –
Glenella State School Glenella 18 22 10 –
Average score of the school 432 444 420 456 424 513 481 481 493 490 545 502 547 550 539 – – – – –
Percentage (%) of students at or above NMS 100% 94% 89% 94% 100% 100% 95% 95% 86% 95% 100% 100% 100% 100% 100% – – – – –
Glenmore State High School North Rockhampton – – 37 116
Average score of the school – – – – – – – – – – 478 424 502 475 483 532 471 541 520 538
Percentage (%) of students at or above NMS – – – – – – – – – – 90% 50% 93% 80% 97% 74% 42% 80% 68% 94%
Glenmore State School Rockhampton North 52 70 – –
Average score of the school 370 394 389 377 348 425 411 440 417 414 – – – – – – – – – –
Percentage (%) of students at or above NMS 87% 88% 89% 91% 86% 76% 71% 75% 68% 69% – – – – – – – – – –
Glenmorgan State School Glenmorgan 2 3 2 –
Average score of the school ∧ ∧ ∧ ∧ ∧ ∧ ∧ ∧ ∧ ∧ ∧ ∧ ∧ ∧ ∧ – – – – –
Percentage (%) of students at or above NMS ∧ ∧ ∧ ∧ ∧ ∧ ∧ ∧ ∧ ∧ ∧ ∧ ∧ ∧ ∧ – – – – –
Glennie Heights State School Glennie Heights Warwick 24 19 9 –
Average score of the school 332 295 322 352 312 459 409 446 438 431 528 465 502 550 534 – – – – –
Percentage (%) of students at or above NMS 68% 76% 71% 90% 78% 76% 67% 88% 88% 75% 86% 86% 71% 86% 86% – – – – –
Glenore Grove State School Glenore Grove 12 22 8 –
Average score of the school 335 290 319 335 328 441 433 455 445 439 491 429 512 480 483 – – – – –
Percentage (%) of students at or above NMS 88% 67% 78% 78% 78% 81% 68% 85% 85% 76% 63% 38% 75% 63% 75% – – – – –
Glenvale Christian School (Toowoomba) Toowoomba 12 8 4 –
Average score of the school 456 344 421 461 410 498 473 512 492 455 ∧ ∧ ∧ ∧ ∧ – – – – –
Percentage (%) of students at or above NMS 100% 92% 100% 100% 100% 100% 100% 100% 100% 100% ∧ ∧ ∧ ∧ ∧ – – – – –
Glenvale State School Toowoomba 103 91 52 –
Average score of the school 421 417 404 428 397 500 449 492 512 481 517 481 514 514 514 – – – – –
Percentage (%) of students at or above NMS 100% 97% 98% 96% 98% 94% 89% 98% 94% 98% 94% 82% 92% 94% 98% – – – – –
Glenview State School Glenview via Mooloolah 38 29 19 –
Average score of the school 453 444 416 462 456 535 493 497 541 510 541 535 534 548 562 – – – – –
Percentage (%) of students at or above NMS 100% 100% 97% 100% 100% 100% 96% 92% 96% 92% 100% 95% 95% 95% 100% – – – – –
Glenwood State School Glenwood 11 13 12 –
Average score of the school 375 356 376 397 404 490 433 491 494 492 530 510 544 520 518 – – – – –
Percentage (%) of students at or above NMS 89% 90% 100% 100% 100% 70% 60% 70% 80% 67% 82% 82% 82% 82% 80% – – – – –
Gogango State School Gogango 1 – 1 –
Average score of the school ∧ ∧ ∧ ∧ ∧ – – – – – ∧ ∧ ∧ ∧ ∧ – – – – –
Percentage (%) of students at or above NMS ∧ ∧ ∧ ∧ ∧ – – – – – ∧ ∧ ∧ ∧ ∧ – – – – –
KEY∧ to maintain privacy of individual student information, where there are fewer than five students tested results are not provided∗ no students in the year level sat the test due to absence, exemption or withdrawal– no students in the year levelNMS National Minimum Standard (for further information see www.nap.edu.au)
Queensland Curriculum & Assessment Authority
Page 45 of 149
NAPLAN 2014 Outcomes — All Queensland schools

Year level enrolments Year 3 Year 5 Year 7 Year 9
School Locality Yr 3 Yr 5 Yr 7 Yr 9 READ WRIT SPEL GP NMCY READ WRIT SPEL GP NMCY READ WRIT SPEL GP NMCY READ WRIT SPEL GP NMCY
Gold Coast Christian College Reedy Creek 28 18 18 15
Average score of the school 423 403 403 435 406 524 502 516 525 500 517 510 540 539 553 568 524 554 534 571
Percentage (%) of students at or above NMS 100% 100% 100% 100% 96% 94% 94% 94% 100% 94% 92% 93% 100% 93% 92% 93% 86% 85% 85% 92%
Golden Beach State School Golden Beach 81 89 48 –
Average score of the school 404 392 410 422 400 496 477 494 500 485 554 505 543 547 550 – – – – –
Percentage (%) of students at or above NMS 97% 97% 99% 99% 100% 97% 95% 95% 95% 96% 100% 97% 95% 92% 97% – – – – –
Gooburrum State School Gooburrum via Bundaberg 20 20 7 –
Average score of the school 388 369 384 387 397 469 429 466 472 462 514 543 510 522 542 – – – – –
Percentage (%) of students at or above NMS 94% 100% 89% 89% 100% 95% 78% 90% 95% 100% 100% 100% 100% 83% 100% – – – – –
Good Counsel College Innisfail – – – 133
Average score of the school – – – – – – – – – – – – – – – 569 555 579 570 597
Percentage (%) of students at or above NMS – – – – – – – – – – – – – – – 93% 89% 97% 93% 99%
Good Counsel Primary School (Innisfail) Innisfail 42 36 42 –
Average score of the school 425 393 413 438 414 484 470 481 486 487 524 519 527 550 552 – – – – –
Percentage (%) of students at or above NMS 97% 97% 95% 97% 97% 97% 97% 89% 100% 100% 95% 98% 92% 95% 100% – – – – –
Good News Lutheran School Middle Park 58 55 50 –
Average score of the school 486 442 454 512 465 543 501 519 563 545 588 550 561 591 609 – – – – –
Percentage (%) of students at or above NMS 100% 100% 100% 100% 100% 100% 98% 100% 98% 98% 96% 98% 98% 100% 100% – – – – –
Good Shepherd Catholic College Mount Isa – – – 108
Average score of the school – – – – – – – – – – – – – – – 561 540 573 550 547
Percentage (%) of students at or above NMS – – – – – – – – – – – – – – – 89% 84% 94% 82% 91%
Good Shepherd Catholic Community School Rasmussen 43 45 31 –
Average score of the school 386 359 381 392 364 461 433 449 474 452 487 449 462 466 491 – – – – –
Percentage (%) of students at or above NMS 88% 93% 88% 88% 91% 82% 80% 77% 86% 86% 84% 78% 74% 74% 97% – – – – –
Good Shepherd Catholic Primary School Springfield Lakes 13 11 – –
Average score of the school 414 305 377 386 371 453 434 442 469 431 – – – – – – – – – –
Percentage (%) of students at or above NMS 91% 73% 100% 82% 92% 100% 91% 91% 91% 82% – – – – – – – – – –
Good Shepherd Christian School Albany Creek 13 8 4 8
Average score of the school 463 415 439 440 416 463 440 482 492 472 ∧ ∧ ∧ ∧ ∧ 559 537 568 534 550
Percentage (%) of students at or above NMS 100% 100% 100% 100% 100% 100% 75% 100% 100% 100% ∧ ∧ ∧ ∧ ∧ 100% 100% 100% 83% 100%
Good Shepherd Lutheran College Noosaville 51 56 68 70
Average score of the school 459 424 428 470 424 548 496 529 543 532 567 549 559 563 572 608 593 609 590 613
Percentage (%) of students at or above NMS 100% 100% 98% 100% 100% 98% 98% 100% 100% 100% 97% 100% 98% 98% 100% 96% 96% 100% 100% 99%
Goodna Special School Goodna 9 12 9 15
Average score of the school ∗ ∗ ∗ ∗ ∗ ∗ ∗ ∗ ∗ ∗ ∗ ∗ ∗ ∗ ∗ ∗ ∗ ∗ ∗ ∗Percentage (%) of students at or above NMS ∗ ∗ ∗ ∗ ∗ ∗ ∗ ∗ ∗ ∗ ∗ ∗ ∗ ∗ ∗ ∗ ∗ ∗ ∗ ∗
KEY∧ to maintain privacy of individual student information, where there are fewer than five students tested results are not provided∗ no students in the year level sat the test due to absence, exemption or withdrawal– no students in the year levelNMS National Minimum Standard (for further information see www.nap.edu.au)
Queensland Curriculum & Assessment Authority
Page 46 of 149
NAPLAN 2014 Outcomes — All Queensland schools
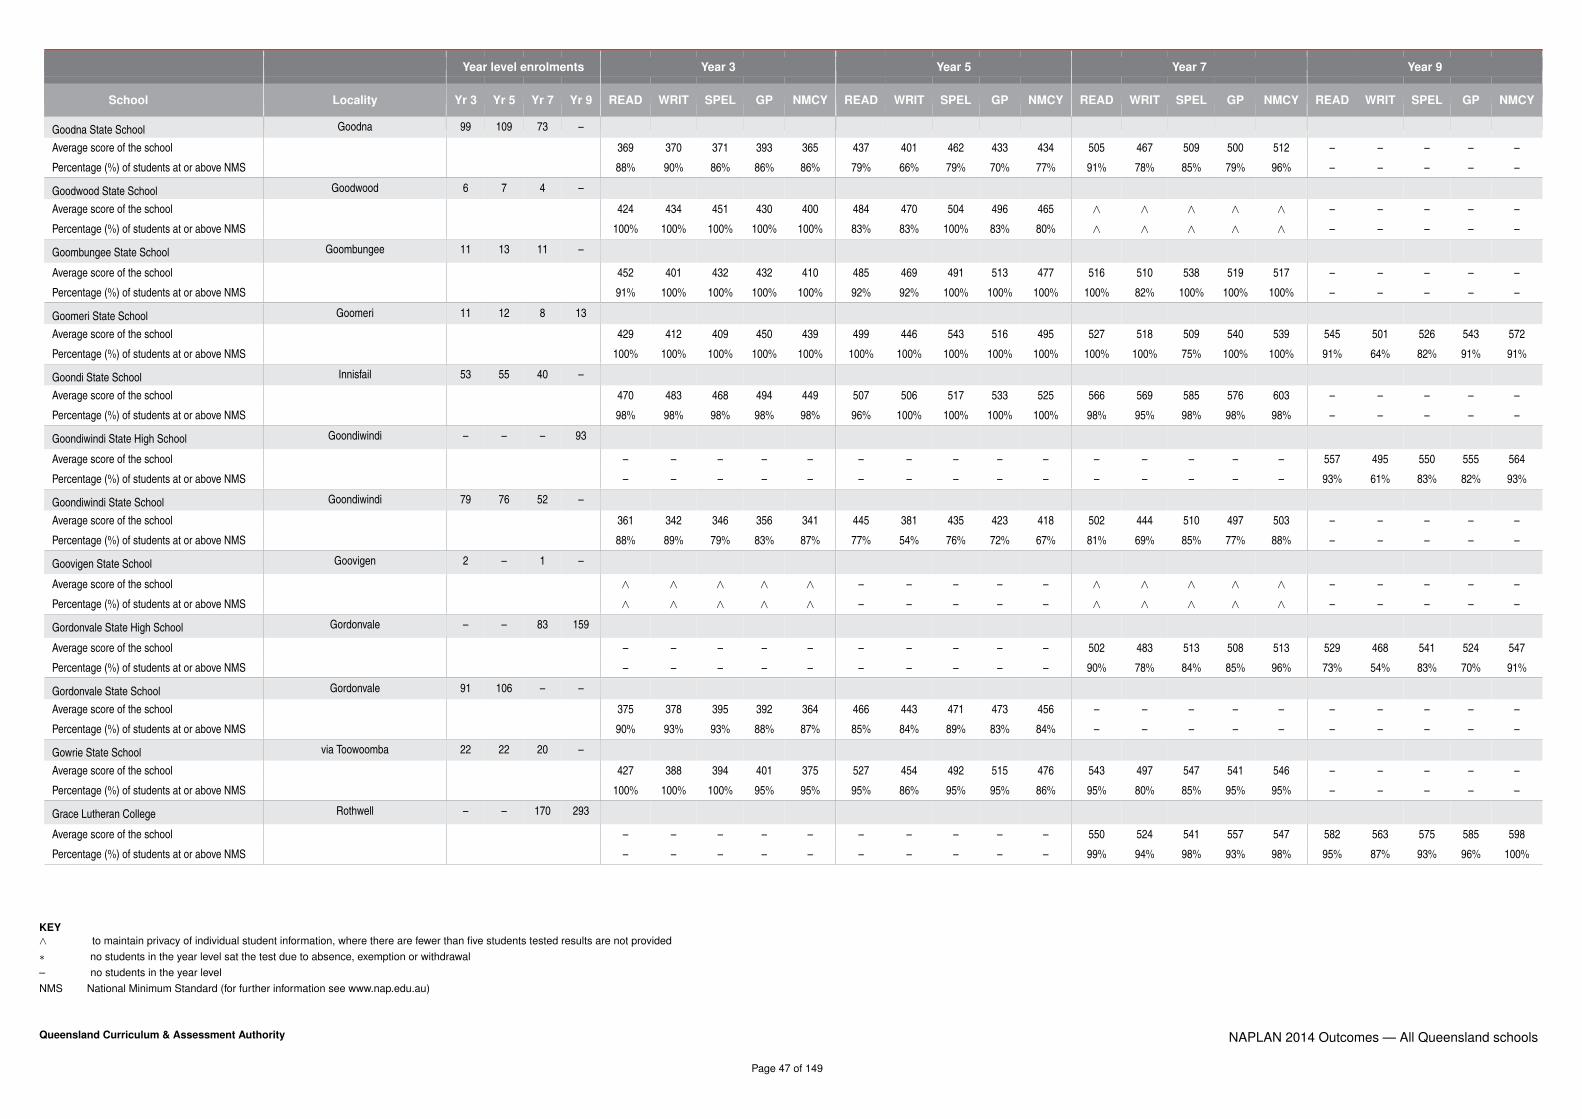
Year level enrolments Year 3 Year 5 Year 7 Year 9
School Locality Yr 3 Yr 5 Yr 7 Yr 9 READ WRIT SPEL GP NMCY READ WRIT SPEL GP NMCY READ WRIT SPEL GP NMCY READ WRIT SPEL GP NMCY
Goodna State School Goodna 99 109 73 –
Average score of the school 369 370 371 393 365 437 401 462 433 434 505 467 509 500 512 – – – – –
Percentage (%) of students at or above NMS 88% 90% 86% 86% 86% 79% 66% 79% 70% 77% 91% 78% 85% 79% 96% – – – – –
Goodwood State School Goodwood 6 7 4 –
Average score of the school 424 434 451 430 400 484 470 504 496 465 ∧ ∧ ∧ ∧ ∧ – – – – –
Percentage (%) of students at or above NMS 100% 100% 100% 100% 100% 83% 83% 100% 83% 80% ∧ ∧ ∧ ∧ ∧ – – – – –
Goombungee State School Goombungee 11 13 11 –
Average score of the school 452 401 432 432 410 485 469 491 513 477 516 510 538 519 517 – – – – –
Percentage (%) of students at or above NMS 91% 100% 100% 100% 100% 92% 92% 100% 100% 100% 100% 82% 100% 100% 100% – – – – –
Goomeri State School Goomeri 11 12 8 13
Average score of the school 429 412 409 450 439 499 446 543 516 495 527 518 509 540 539 545 501 526 543 572
Percentage (%) of students at or above NMS 100% 100% 100% 100% 100% 100% 100% 100% 100% 100% 100% 100% 75% 100% 100% 91% 64% 82% 91% 91%
Goondi State School Innisfail 53 55 40 –
Average score of the school 470 483 468 494 449 507 506 517 533 525 566 569 585 576 603 – – – – –
Percentage (%) of students at or above NMS 98% 98% 98% 98% 98% 96% 100% 100% 100% 100% 98% 95% 98% 98% 98% – – – – –
Goondiwindi State High School Goondiwindi – – – 93
Average score of the school – – – – – – – – – – – – – – – 557 495 550 555 564
Percentage (%) of students at or above NMS – – – – – – – – – – – – – – – 93% 61% 83% 82% 93%
Goondiwindi State School Goondiwindi 79 76 52 –
Average score of the school 361 342 346 356 341 445 381 435 423 418 502 444 510 497 503 – – – – –
Percentage (%) of students at or above NMS 88% 89% 79% 83% 87% 77% 54% 76% 72% 67% 81% 69% 85% 77% 88% – – – – –
Goovigen State School Goovigen 2 – 1 –
Average score of the school ∧ ∧ ∧ ∧ ∧ – – – – – ∧ ∧ ∧ ∧ ∧ – – – – –
Percentage (%) of students at or above NMS ∧ ∧ ∧ ∧ ∧ – – – – – ∧ ∧ ∧ ∧ ∧ – – – – –
Gordonvale State High School Gordonvale – – 83 159
Average score of the school – – – – – – – – – – 502 483 513 508 513 529 468 541 524 547
Percentage (%) of students at or above NMS – – – – – – – – – – 90% 78% 84% 85% 96% 73% 54% 83% 70% 91%
Gordonvale State School Gordonvale 91 106 – –
Average score of the school 375 378 395 392 364 466 443 471 473 456 – – – – – – – – – –
Percentage (%) of students at or above NMS 90% 93% 93% 88% 87% 85% 84% 89% 83% 84% – – – – – – – – – –
Gowrie State School via Toowoomba 22 22 20 –
Average score of the school 427 388 394 401 375 527 454 492 515 476 543 497 547 541 546 – – – – –
Percentage (%) of students at or above NMS 100% 100% 100% 95% 95% 95% 86% 95% 95% 86% 95% 80% 85% 95% 95% – – – – –
Grace Lutheran College Rothwell – – 170 293
Average score of the school – – – – – – – – – – 550 524 541 557 547 582 563 575 585 598
Percentage (%) of students at or above NMS – – – – – – – – – – 99% 94% 98% 93% 98% 95% 87% 93% 96% 100%
KEY∧ to maintain privacy of individual student information, where there are fewer than five students tested results are not provided∗ no students in the year level sat the test due to absence, exemption or withdrawal– no students in the year levelNMS National Minimum Standard (for further information see www.nap.edu.au)
Queensland Curriculum & Assessment Authority
Page 47 of 149
NAPLAN 2014 Outcomes — All Queensland schools

Year level enrolments Year 3 Year 5 Year 7 Year 9
School Locality Yr 3 Yr 5 Yr 7 Yr 9 READ WRIT SPEL GP NMCY READ WRIT SPEL GP NMCY READ WRIT SPEL GP NMCY READ WRIT SPEL GP NMCY
Grace Lutheran Primary School (Clontarf) Clontarf 63 44 – –
Average score of the school 430 384 409 418 395 498 480 489 493 475 – – – – – – – – – –
Percentage (%) of students at or above NMS 97% 93% 100% 100% 98% 93% 95% 100% 93% 95% – – – – – – – – – –
Gracemere State School Gracemere 41 22 27 –
Average score of the school 341 366 367 380 352 455 411 442 452 430 528 475 498 530 537 – – – – –
Percentage (%) of students at or above NMS 78% 90% 85% 83% 88% 81% 62% 81% 76% 79% 89% 63% 78% 78% 100% – – – – –
Graceville State School Graceville 107 92 39 –
Average score of the school 487 434 455 488 461 570 509 537 571 553 594 561 560 607 607 – – – – –
Percentage (%) of students at or above NMS 99% 98% 100% 99% 100% 99% 100% 100% 100% 100% 100% 97% 95% 100% 100% – – – – –
Grand Avenue State School Forest Lake 186 146 100 –
Average score of the school 409 413 436 439 403 498 471 499 508 484 534 506 546 533 548 – – – – –
Percentage (%) of students at or above NMS 96% 99% 100% 99% 99% 96% 96% 99% 95% 96% 97% 88% 93% 96% 97% – – – – –
Grandchester State School Grandchester 10 3 3 –
Average score of the school 403 384 370 430 389 ∧ ∧ ∧ ∧ ∧ ∧ ∧ ∧ ∧ ∧ – – – – –
Percentage (%) of students at or above NMS 90% 100% 80% 100% 100% ∧ ∧ ∧ ∧ ∧ ∧ ∧ ∧ ∧ ∧ – – – – –
Grantham State School Grantham 15 12 6 –
Average score of the school 370 376 373 403 351 437 433 425 431 427 514 515 521 526 525 – – – – –
Percentage (%) of students at or above NMS 86% 100% 93% 93% 87% 83% 75% 67% 67% 75% 83% 83% 83% 100% 83% – – – – –
Granville State School Granville 38 47 35 –
Average score of the school 372 387 385 375 393 469 468 483 498 465 533 523 540 535 533 – – – – –
Percentage (%) of students at or above NMS 83% 91% 89% 80% 86% 76% 90% 81% 88% 82% 97% 97% 84% 94% 97% – – – – –
Greenbank State School Greenbank 152 164 62 –
Average score of the school 388 388 385 407 378 480 449 483 491 461 535 518 516 537 535 – – – – –
Percentage (%) of students at or above NMS 93% 95% 91% 96% 95% 94% 86% 95% 94% 92% 98% 88% 93% 95% 98% – – – – –
Greenlands State School Stanthorpe 11 16 9 –
Average score of the school 537 454 465 550 483 521 488 537 589 538 543 466 543 552 561 – – – – –
Percentage (%) of students at or above NMS 100% 100% 100% 100% 100% 100% 100% 100% 100% 100% 100% 89% 100% 100% 100% – – – – –
Greenmount State School Greenmount 1 5 – –
Average score of the school ∧ ∧ ∧ ∧ ∧ 490 452 463 555 496 – – – – – – – – – –
Percentage (%) of students at or above NMS ∧ ∧ ∧ ∧ ∧ 80% 100% 80% 100% 100% – – – – – – – – – –
Greenslopes State School Greenslopes 36 28 19 –
Average score of the school 458 408 419 463 415 518 479 516 545 505 536 516 524 541 564 – – – – –
Percentage (%) of students at or above NMS 97% 97% 94% 97% 94% 96% 89% 96% 96% 100% 100% 94% 94% 94% 100% – – – – –
Greenvale State School Greenvale 5 4 2 –
Average score of the school ∧ ∧ ∧ ∧ ∧ ∧ ∧ ∧ ∧ ∧ ∧ ∧ ∧ ∧ ∧ – – – – –
Percentage (%) of students at or above NMS ∧ ∧ ∧ ∧ ∧ ∧ ∧ ∧ ∧ ∧ ∧ ∧ ∧ ∧ ∧ – – – – –
KEY∧ to maintain privacy of individual student information, where there are fewer than five students tested results are not provided∗ no students in the year level sat the test due to absence, exemption or withdrawal– no students in the year levelNMS National Minimum Standard (for further information see www.nap.edu.au)
Queensland Curriculum & Assessment Authority
Page 48 of 149
NAPLAN 2014 Outcomes — All Queensland schools

Year level enrolments Year 3 Year 5 Year 7 Year 9
School Locality Yr 3 Yr 5 Yr 7 Yr 9 READ WRIT SPEL GP NMCY READ WRIT SPEL GP NMCY READ WRIT SPEL GP NMCY READ WRIT SPEL GP NMCY
Grosmont State School Wandoan – – 1 –
Average score of the school – – – – – – – – – – ∧ ∧ ∧ ∧ ∧ – – – – –
Percentage (%) of students at or above NMS – – – – – – – – – – ∧ ∧ ∧ ∧ ∧ – – – – –
Grovely State School Grovely 52 38 22 –
Average score of the school 429 373 401 441 412 471 426 452 468 448 532 457 516 523 514 – – – – –
Percentage (%) of students at or above NMS 98% 94% 96% 98% 96% 81% 75% 77% 80% 89% 100% 64% 91% 91% 82% – – – – –
Groves Christian College Kingston 86 – – 94
Average score of the school 380 378 395 394 357 – – – – – – – – – – 553 538 554 545 563
Percentage (%) of students at or above NMS 85% 90% 91% 91% 90% – – – – – – – – – – 83% 73% 85% 79% 95%
Groves Christian College (Distance) Kingston 48 66 46 73
Average score of the school 496 425 470 500 416 541 438 515 566 521 569 478 541 573 573 640 585 630 652 645
Percentage (%) of students at or above NMS 100% 100% 100% 100% 100% 100% 86% 93% 100% 100% 100% 85% 85% 100% 100% 100% 94% 100% 100% 100%
Groves Christian College (Maryfield
Campus)
Kingston – 80 47 –
Average score of the school – – – – – 458 428 472 466 441 524 497 516 516 500 – – – – –
Percentage (%) of students at or above NMS – – – – – 88% 83% 91% 86% 85% 95% 77% 86% 86% 93% – – – – –
Guardian Angels’ Catholic Primary School
(S’port)
Southport 120 95 67 –
Average score of the school 418 428 418 450 390 526 498 528 536 496 542 522 536 554 544 – – – – –
Percentage (%) of students at or above NMS 98% 100% 99% 98% 98% 99% 99% 99% 99% 99% 98% 98% 93% 97% 98% – – – – –
Guardian Angels’ Primary School (Wynnum) Wynnum 108 55 37 –
Average score of the school 433 413 407 442 410 532 493 536 534 507 536 504 537 540 531 – – – – –
Percentage (%) of students at or above NMS 95% 99% 94% 99% 99% 100% 96% 98% 98% 96% 100% 91% 94% 94% 97% – – – – –
Gulf Christian College Normanton 8 6 5 –
Average score of the school 381 385 414 389 381 418 397 420 419 ∧ ∧ ∧ ∧ ∧ ∧ – – – – –
Percentage (%) of students at or above NMS 86% 86% 86% 86% 86% 60% 40% 60% 60% ∧ ∧ ∧ ∧ ∧ ∧ – – – – –
Guluguba State School Guluguba 1 3 1 –
Average score of the school ∧ ∧ ∧ ∧ ∧ ∧ ∧ ∧ ∧ ∧ ∧ ∧ ∧ ∧ ∧ – – – – –
Percentage (%) of students at or above NMS ∧ ∧ ∧ ∧ ∧ ∧ ∧ ∧ ∧ ∧ ∧ ∧ ∧ ∧ ∧ – – – – –
Gumdale State School Gumdale 133 92 47 –
Average score of the school 441 417 424 463 416 521 480 507 521 506 566 531 561 571 569 – – – – –
Percentage (%) of students at or above NMS 98% 98% 98% 98% 96% 93% 91% 97% 98% 94% 100% 89% 96% 98% 100% – – – – –
Gumlu State School Gumlu via Bowen 2 – – –
Average score of the school ∧ ∧ ∧ ∧ ∧ – – – – – – – – – – – – – – –
Percentage (%) of students at or above NMS ∧ ∧ ∧ ∧ ∧ – – – – – – – – – – – – – – –
KEY∧ to maintain privacy of individual student information, where there are fewer than five students tested results are not provided∗ no students in the year level sat the test due to absence, exemption or withdrawal– no students in the year levelNMS National Minimum Standard (for further information see www.nap.edu.au)
Queensland Curriculum & Assessment Authority
Page 49 of 149
NAPLAN 2014 Outcomes — All Queensland schools

Year level enrolments Year 3 Year 5 Year 7 Year 9
School Locality Yr 3 Yr 5 Yr 7 Yr 9 READ WRIT SPEL GP NMCY READ WRIT SPEL GP NMCY READ WRIT SPEL GP NMCY READ WRIT SPEL GP NMCY
Gunalda State School Gunalda 2 3 3 –
Average score of the school ∧ ∧ ∧ ∧ ∗ ∧ ∧ ∧ ∧ ∧ ∧ ∧ ∧ ∧ ∧ – – – – –
Percentage (%) of students at or above NMS ∧ ∧ ∧ ∧ ∗ ∧ ∧ ∧ ∧ ∧ ∧ ∧ ∧ ∧ ∧ – – – – –
Gundiah State School Gundiah 3 4 2 –
Average score of the school ∧ ∧ ∧ ∧ ∧ ∧ ∧ ∧ ∧ ∧ ∧ ∧ ∧ ∧ ∧ – – – – –
Percentage (%) of students at or above NMS ∧ ∧ ∧ ∧ ∧ ∧ ∧ ∧ ∧ ∧ ∧ ∧ ∧ ∧ ∧ – – – – –
Gympie Central State School Gympie 31 28 27 –
Average score of the school 407 396 405 423 388 471 443 455 460 472 493 430 486 486 493 – – – – –
Percentage (%) of students at or above NMS 96% 100% 96% 100% 96% 92% 92% 88% 92% 96% 92% 72% 80% 84% 100% – – – – –
Gympie East State School via Gympie 13 19 9 –
Average score of the school 435 420 418 436 398 488 456 494 515 463 526 503 521 515 537 – – – – –
Percentage (%) of students at or above NMS 92% 100% 92% 100% 92% 94% 84% 100% 95% 94% 89% 100% 100% 67% 100% – – – – –
Gympie Flexible Learning Centre Gympie – – – 6
Average score of the school – – – – – – – – – – – – – – – ∗ ∗ ∗ ∗ ∗Percentage (%) of students at or above NMS – – – – – – – – – – – – – – – ∗ ∗ ∗ ∗ ∗
Gympie South State School Southside Gympie 50 65 38 –
Average score of the school 394 354 373 386 373 496 430 479 500 483 536 510 523 551 560 – – – – –
Percentage (%) of students at or above NMS 89% 75% 78% 84% 89% 90% 77% 95% 92% 90% 97% 89% 92% 95% 97% – – – – –
Gympie Special School Gympie 2 2 5 4
Average score of the school ∗ ∗ ∗ ∗ ∗ ∧ ∧ ∧ ∧ ∧ ∗ ∗ ∗ ∗ ∗ ∗ ∗ ∗ ∗ ∗Percentage (%) of students at or above NMS ∗ ∗ ∗ ∗ ∗ ∧ ∧ ∧ ∧ ∧ ∗ ∗ ∗ ∗ ∗ ∗ ∗ ∗ ∗ ∗
Gympie State High School Gympie – – – 228
Average score of the school – – – – – – – – – – – – – – – 561 530 556 554 566
Percentage (%) of students at or above NMS – – – – – – – – – – – – – – – 90% 77% 87% 88% 96%
Gympie West State School Gympie 63 68 54 –
Average score of the school 378 340 353 383 393 483 425 480 482 466 543 491 529 536 554 – – – – –
Percentage (%) of students at or above NMS 87% 87% 79% 90% 100% 93% 76% 97% 88% 93% 100% 84% 96% 98% 100% – – – – –
Haden State School Haden – 2 1 –
Average score of the school – – – – – ∧ ∧ ∧ ∧ ∧ ∧ ∧ ∧ ∧ ∧ – – – – –
Percentage (%) of students at or above NMS – – – – – ∧ ∧ ∧ ∧ ∧ ∧ ∧ ∧ ∧ ∧ – – – – –
Haigslea State School Haigslea 3 7 1 –
Average score of the school ∧ ∧ ∧ ∧ ∧ 475 432 489 460 451 ∧ ∧ ∧ ∧ ∧ – – – – –
Percentage (%) of students at or above NMS ∧ ∧ ∧ ∧ ∧ 100% 100% 100% 86% 71% ∧ ∧ ∧ ∧ ∧ – – – – –
Halifax State School Halifax 3 3 1 –
Average score of the school ∧ ∧ ∧ ∧ ∧ ∧ ∧ ∧ ∧ ∧ ∧ ∧ ∧ ∧ ∧ – – – – –
Percentage (%) of students at or above NMS ∧ ∧ ∧ ∧ ∧ ∧ ∧ ∧ ∧ ∧ ∧ ∧ ∧ ∧ ∧ – – – – –
KEY∧ to maintain privacy of individual student information, where there are fewer than five students tested results are not provided∗ no students in the year level sat the test due to absence, exemption or withdrawal– no students in the year levelNMS National Minimum Standard (for further information see www.nap.edu.au)
Queensland Curriculum & Assessment Authority
Page 50 of 149
NAPLAN 2014 Outcomes — All Queensland schools

Year level enrolments Year 3 Year 5 Year 7 Year 9
School Locality Yr 3 Yr 5 Yr 7 Yr 9 READ WRIT SPEL GP NMCY READ WRIT SPEL GP NMCY READ WRIT SPEL GP NMCY READ WRIT SPEL GP NMCY
Hambledon State School Edmonton 102 110 37 –
Average score of the school 388 366 385 405 368 472 441 476 482 459 518 484 528 507 521 – – – – –
Percentage (%) of students at or above NMS 91% 89% 93% 94% 98% 93% 88% 92% 95% 87% 90% 84% 94% 81% 90% – – – – –
Hamilton Island State School Hamilton Island 10 5 3 –
Average score of the school 388 392 384 441 427 576 484 540 574 538 ∧ ∧ ∧ ∧ ∧ – – – – –
Percentage (%) of students at or above NMS 90% 100% 100% 100% 100% 100% 100% 100% 100% 100% ∧ ∧ ∧ ∧ ∧ – – – – –
Hamilton State School Hamilton 8 13 4 –
Average score of the school 388 393 366 403 410 509 477 490 506 503 ∧ ∧ ∧ ∧ ∧ – – – – –
Percentage (%) of students at or above NMS 100% 100% 88% 100% 100% 100% 92% 100% 100% 100% ∧ ∧ ∧ ∧ ∧ – – – – –
Hampden State School Kuttabul via Mackay 15 18 12 –
Average score of the school 400 399 354 429 386 529 462 464 488 502 558 501 549 538 543 – – – – –
Percentage (%) of students at or above NMS 92% 100% 83% 100% 92% 94% 88% 94% 94% 100% 100% 78% 89% 89% 100% – – – – –
Hannaford State School Hannaford 3 2 1 –
Average score of the school ∧ ∧ ∧ ∧ ∧ ∧ ∧ ∧ ∧ ∧ ∧ ∧ ∧ ∧ ∧ – – – – –
Percentage (%) of students at or above NMS ∧ ∧ ∧ ∧ ∧ ∧ ∧ ∧ ∧ ∧ ∧ ∧ ∧ ∧ ∧ – – – – –
Happy Valley State School Mount Isa 55 58 30 –
Average score of the school 395 379 376 385 366 466 451 486 485 448 512 473 510 507 511 – – – – –
Percentage (%) of students at or above NMS 98% 89% 94% 93% 91% 91% 83% 92% 81% 91% 89% 78% 81% 81% 93% – – – – –
Harlaxton State School Toowoomba 13 8 11 –
Average score of the school 358 364 387 350 383 424 425 455 408 413 478 454 471 471 500 – – – – –
Percentage (%) of students at or above NMS 62% 62% 62% 62% 62% 75% 75% 100% 75% 75% 82% 64% 82% 55% 80% – – – – –
Harlin State School Harlin 2 4 1 –
Average score of the school ∧ ∧ ∧ ∧ ∧ ∧ ∧ ∧ ∧ ∧ ∧ ∧ ∧ ∧ ∧ – – – – –
Percentage (%) of students at or above NMS ∧ ∧ ∧ ∧ ∧ ∧ ∧ ∧ ∧ ∧ ∧ ∧ ∧ ∧ ∧ – – – – –
Harmony Montessori School - Caboolture Caboolture 16 14 10 –
Average score of the school 428 385 385 426 406 511 454 494 519 480 591 562 565 614 579 – – – – –
Percentage (%) of students at or above NMS 93% 93% 93% 93% 100% 100% 100% 100% 100% 100% 100% 100% 88% 100% 100% – – – – –
Harris Fields State School Woodridge 54 68 40 –
Average score of the school 367 372 429 484 400 479 418 505 530 438 531 503 547 571 535 – – – – –
Percentage (%) of students at or above NMS 94% 94% 96% 98% 98% 89% 67% 95% 97% 77% 95% 87% 92% 97% 97% – – – – –
Harristown State High School Toowoomba – – – 276
Average score of the school – – – – – – – – – – – – – – – 555 530 564 553 564
Percentage (%) of students at or above NMS – – – – – – – – – – – – – – – 86% 73% 91% 84% 98%
Harristown State School Toowoomba 36 37 46 –
Average score of the school 364 329 359 346 336 419 397 442 432 424 506 461 512 489 497 – – – – –
Percentage (%) of students at or above NMS 80% 71% 77% 80% 77% 69% 61% 72% 83% 75% 91% 69% 87% 87% 87% – – – – –
KEY∧ to maintain privacy of individual student information, where there are fewer than five students tested results are not provided∗ no students in the year level sat the test due to absence, exemption or withdrawal– no students in the year levelNMS National Minimum Standard (for further information see www.nap.edu.au)
Queensland Curriculum & Assessment Authority
Page 51 of 149
NAPLAN 2014 Outcomes — All Queensland schools

Year level enrolments Year 3 Year 5 Year 7 Year 9
School Locality Yr 3 Yr 5 Yr 7 Yr 9 READ WRIT SPEL GP NMCY READ WRIT SPEL GP NMCY READ WRIT SPEL GP NMCY READ WRIT SPEL GP NMCY
Harrisville State School Harrisville 10 13 4 –
Average score of the school 413 390 425 423 427 500 461 495 501 478 ∧ ∧ ∧ ∧ ∧ – – – – –
Percentage (%) of students at or above NMS 88% 100% 100% 88% 88% 92% 85% 100% 92% 100% ∧ ∧ ∧ ∧ ∧ – – – – –
Hatton Vale State School Hatton Vale 60 53 39 –
Average score of the school 367 338 367 362 343 448 390 447 435 424 505 451 492 500 495 – – – – –
Percentage (%) of students at or above NMS 78% 83% 83% 90% 88% 81% 62% 87% 81% 77% 92% 66% 84% 84% 85% – – – – –
Hayman Island State School Hayman Island 1 2 – –
Average score of the school ∗ ∗ ∗ ∗ ∗ ∧ ∧ ∧ ∧ ∧ – – – – – – – – – –
Percentage (%) of students at or above NMS ∗ ∗ ∗ ∗ ∗ ∧ ∧ ∧ ∧ ∧ – – – – – – – – – –
Healy State School Mount Isa 29 21 17 –
Average score of the school 328 298 332 325 337 431 392 407 396 397 479 435 488 462 489 – – – – –
Percentage (%) of students at or above NMS 69% 66% 69% 83% 83% 74% 60% 50% 50% 60% 67% 53% 87% 67% 87% – – – – –
Heatley Secondary College Heatley – – – 128
Average score of the school – – – – – – – – – – – – – – – 524 452 527 510 523
Percentage (%) of students at or above NMS – – – – – – – – – – – – – – – 75% 41% 77% 63% 91%
Heatley State School Heatley 84 81 44 –
Average score of the school 347 335 351 357 334 456 401 454 447 446 523 469 521 520 518 – – – – –
Percentage (%) of students at or above NMS 70% 70% 70% 74% 76% 79% 61% 76% 74% 83% 90% 75% 90% 85% 93% – – – – –
Hebel State School Hebel 1 4 2 –
Average score of the school ∧ ∧ ∧ ∧ ∧ ∧ ∧ ∧ ∧ ∧ ∧ ∧ ∧ ∧ ∧ – – – – –
Percentage (%) of students at or above NMS ∧ ∧ ∧ ∧ ∧ ∧ ∧ ∧ ∧ ∧ ∧ ∧ ∧ ∧ ∧ – – – – –
Heights College North Rockhampton 53 51 37 75
Average score of the school 392 386 381 392 369 499 478 503 523 496 549 512 535 555 551 579 545 580 578 590
Percentage (%) of students at or above NMS 90% 98% 100% 94% 94% 94% 92% 96% 100% 98% 94% 92% 94% 97% 94% 97% 89% 92% 93% 100%
Helens Hill State School Helens Hill via Ingham – 3 – –
Average score of the school – – – – – ∧ ∧ ∧ ∧ ∧ – – – – – – – – – –
Percentage (%) of students at or above NMS – – – – – ∧ ∧ ∧ ∧ ∧ – – – – – – – – – –
Helensvale State High School Helensvale – – – 453
Average score of the school – – – – – – – – – – – – – – – 574 556 586 567 587
Percentage (%) of students at or above NMS – – – – – – – – – – – – – – – 92% 80% 95% 88% 96%
Helensvale State School Helensvale 145 135 111 –
Average score of the school 428 386 406 431 394 506 451 491 489 474 534 513 524 532 531 – – – – –
Percentage (%) of students at or above NMS 99% 98% 99% 99% 98% 98% 87% 96% 94% 98% 95% 90% 93% 93% 99% – – – – –
Helidon State School Helidon 24 20 7 –
Average score of the school 344 321 352 362 327 453 430 445 455 453 521 490 528 518 533 – – – – –
Percentage (%) of students at or above NMS 83% 86% 91% 86% 83% 95% 75% 90% 90% 89% 100% 100% 100% 100% 100% – – – – –
KEY∧ to maintain privacy of individual student information, where there are fewer than five students tested results are not provided∗ no students in the year level sat the test due to absence, exemption or withdrawal– no students in the year levelNMS National Minimum Standard (for further information see www.nap.edu.au)
Queensland Curriculum & Assessment Authority
Page 52 of 149
NAPLAN 2014 Outcomes — All Queensland schools
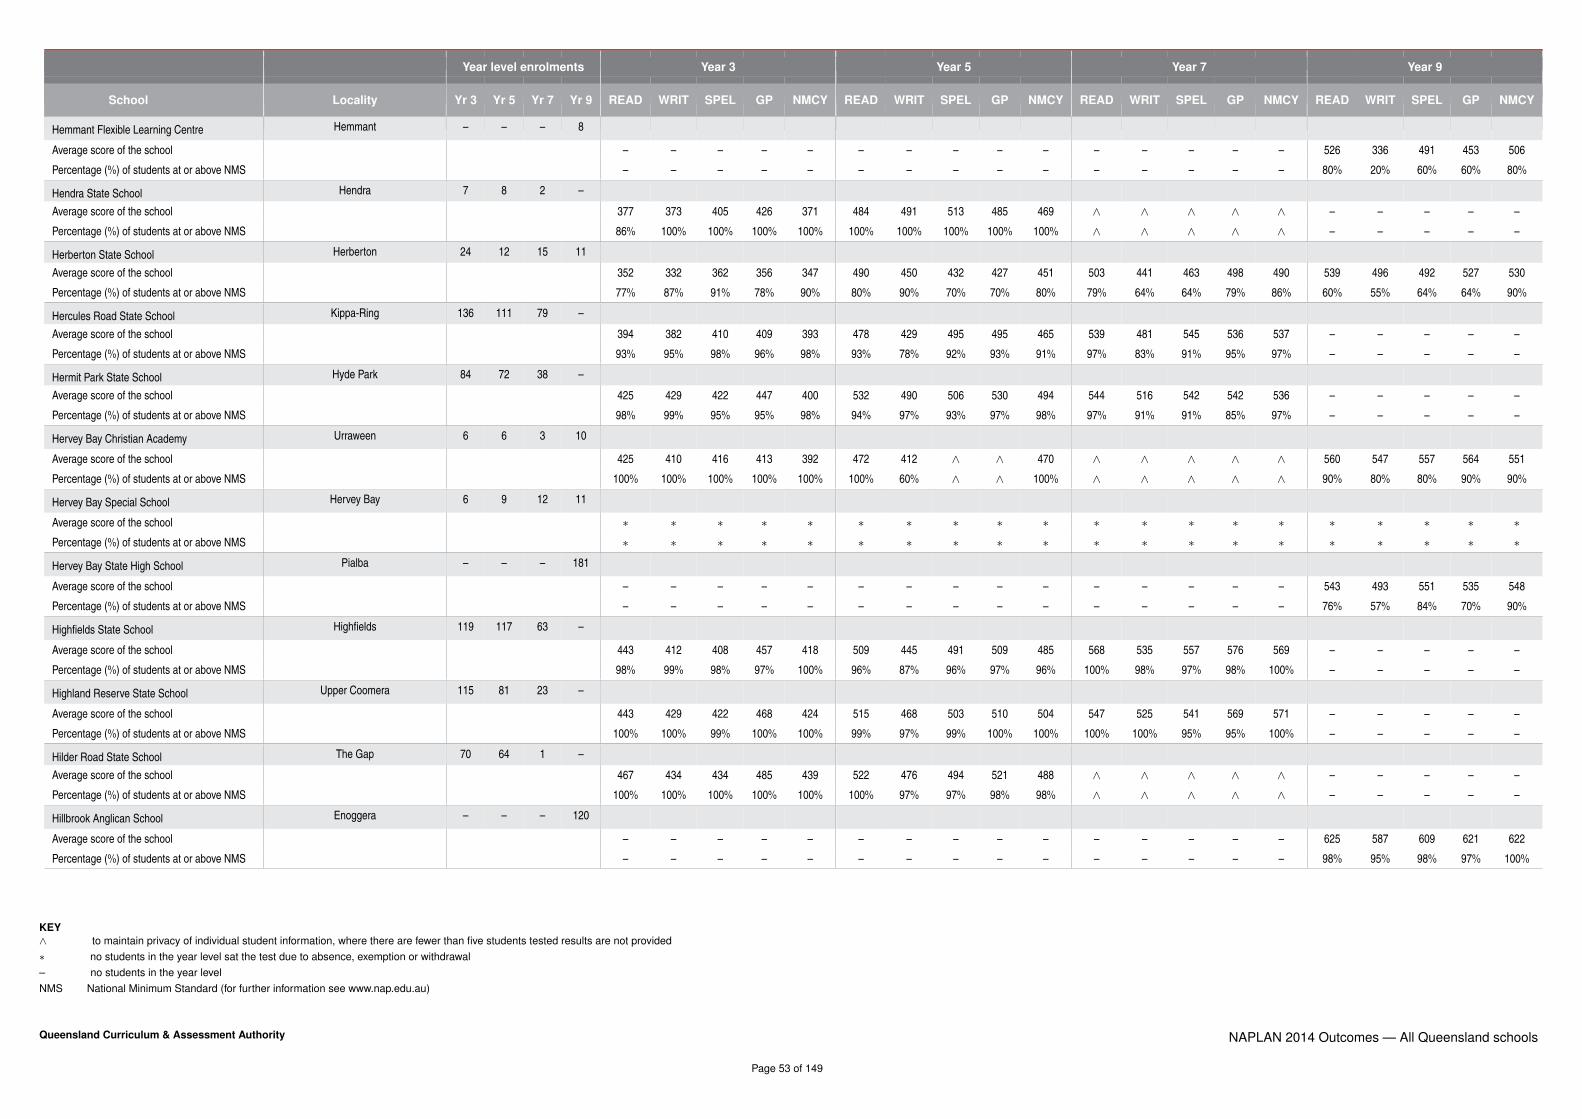
Year level enrolments Year 3 Year 5 Year 7 Year 9
School Locality Yr 3 Yr 5 Yr 7 Yr 9 READ WRIT SPEL GP NMCY READ WRIT SPEL GP NMCY READ WRIT SPEL GP NMCY READ WRIT SPEL GP NMCY
Hemmant Flexible Learning Centre Hemmant – – – 8
Average score of the school – – – – – – – – – – – – – – – 526 336 491 453 506
Percentage (%) of students at or above NMS – – – – – – – – – – – – – – – 80% 20% 60% 60% 80%
Hendra State School Hendra 7 8 2 –
Average score of the school 377 373 405 426 371 484 491 513 485 469 ∧ ∧ ∧ ∧ ∧ – – – – –
Percentage (%) of students at or above NMS 86% 100% 100% 100% 100% 100% 100% 100% 100% 100% ∧ ∧ ∧ ∧ ∧ – – – – –
Herberton State School Herberton 24 12 15 11
Average score of the school 352 332 362 356 347 490 450 432 427 451 503 441 463 498 490 539 496 492 527 530
Percentage (%) of students at or above NMS 77% 87% 91% 78% 90% 80% 90% 70% 70% 80% 79% 64% 64% 79% 86% 60% 55% 64% 64% 90%
Hercules Road State School Kippa-Ring 136 111 79 –
Average score of the school 394 382 410 409 393 478 429 495 495 465 539 481 545 536 537 – – – – –
Percentage (%) of students at or above NMS 93% 95% 98% 96% 98% 93% 78% 92% 93% 91% 97% 83% 91% 95% 97% – – – – –
Hermit Park State School Hyde Park 84 72 38 –
Average score of the school 425 429 422 447 400 532 490 506 530 494 544 516 542 542 536 – – – – –
Percentage (%) of students at or above NMS 98% 99% 95% 95% 98% 94% 97% 93% 97% 98% 97% 91% 91% 85% 97% – – – – –
Hervey Bay Christian Academy Urraween 6 6 3 10
Average score of the school 425 410 416 413 392 472 412 ∧ ∧ 470 ∧ ∧ ∧ ∧ ∧ 560 547 557 564 551
Percentage (%) of students at or above NMS 100% 100% 100% 100% 100% 100% 60% ∧ ∧ 100% ∧ ∧ ∧ ∧ ∧ 90% 80% 80% 90% 90%
Hervey Bay Special School Hervey Bay 6 9 12 11
Average score of the school ∗ ∗ ∗ ∗ ∗ ∗ ∗ ∗ ∗ ∗ ∗ ∗ ∗ ∗ ∗ ∗ ∗ ∗ ∗ ∗Percentage (%) of students at or above NMS ∗ ∗ ∗ ∗ ∗ ∗ ∗ ∗ ∗ ∗ ∗ ∗ ∗ ∗ ∗ ∗ ∗ ∗ ∗ ∗
Hervey Bay State High School Pialba – – – 181
Average score of the school – – – – – – – – – – – – – – – 543 493 551 535 548
Percentage (%) of students at or above NMS – – – – – – – – – – – – – – – 76% 57% 84% 70% 90%
Highfields State School Highfields 119 117 63 –
Average score of the school 443 412 408 457 418 509 445 491 509 485 568 535 557 576 569 – – – – –
Percentage (%) of students at or above NMS 98% 99% 98% 97% 100% 96% 87% 96% 97% 96% 100% 98% 97% 98% 100% – – – – –
Highland Reserve State School Upper Coomera 115 81 23 –
Average score of the school 443 429 422 468 424 515 468 503 510 504 547 525 541 569 571 – – – – –
Percentage (%) of students at or above NMS 100% 100% 99% 100% 100% 99% 97% 99% 100% 100% 100% 100% 95% 95% 100% – – – – –
Hilder Road State School The Gap 70 64 1 –
Average score of the school 467 434 434 485 439 522 476 494 521 488 ∧ ∧ ∧ ∧ ∧ – – – – –
Percentage (%) of students at or above NMS 100% 100% 100% 100% 100% 100% 97% 97% 98% 98% ∧ ∧ ∧ ∧ ∧ – – – – –
Hillbrook Anglican School Enoggera – – – 120
Average score of the school – – – – – – – – – – – – – – – 625 587 609 621 622
Percentage (%) of students at or above NMS – – – – – – – – – – – – – – – 98% 95% 98% 97% 100%
KEY∧ to maintain privacy of individual student information, where there are fewer than five students tested results are not provided∗ no students in the year level sat the test due to absence, exemption or withdrawal– no students in the year levelNMS National Minimum Standard (for further information see www.nap.edu.au)
Queensland Curriculum & Assessment Authority
Page 53 of 149
NAPLAN 2014 Outcomes — All Queensland schools

Year level enrolments Year 3 Year 5 Year 7 Year 9
School Locality Yr 3 Yr 5 Yr 7 Yr 9 READ WRIT SPEL GP NMCY READ WRIT SPEL GP NMCY READ WRIT SPEL GP NMCY READ WRIT SPEL GP NMCY
Hillcrest Christian College Reedy Creek 73 71 56 98
Average score of the school 450 422 444 466 437 535 498 525 543 525 572 542 588 567 582 595 576 604 602 616
Percentage (%) of students at or above NMS 97% 100% 99% 97% 100% 99% 99% 99% 99% 98% 98% 100% 100% 96% 100% 93% 92% 95% 95% 99%
Hilliard State School Alexandra Hills 81 96 7 –
Average score of the school 414 381 410 415 391 491 447 496 485 466 ∧ ∧ ∧ ∧ ∧ – – – – –
Percentage (%) of students at or above NMS 96% 99% 99% 99% 97% 90% 84% 97% 98% 93% ∧ ∧ ∧ ∧ ∧ – – – – –
Hills International College Jimboomba 30 31 21 35
Average score of the school 437 410 426 459 407 490 463 484 491 462 523 499 524 515 551 585 573 611 587 609
Percentage (%) of students at or above NMS 100% 100% 93% 97% 97% 100% 90% 100% 100% 97% 90% 81% 86% 86% 95% 97% 90% 94% 94% 100%
Hillview State School Hillview 2 1 1 –
Average score of the school ∧ ∧ ∧ ∧ ∧ ∧ ∧ ∧ ∧ ∧ ∧ ∧ ∧ ∧ ∧ – – – – –
Percentage (%) of students at or above NMS ∧ ∧ ∧ ∧ ∧ ∧ ∧ ∧ ∧ ∧ ∧ ∧ ∧ ∧ ∧ – – – – –
Hinchinbrook Christian School Ingham 3 1 – –
Average score of the school ∧ ∧ ∧ ∧ ∧ ∧ ∧ ∧ ∧ ∧ – – – – – – – – – –
Percentage (%) of students at or above NMS ∧ ∧ ∧ ∧ ∧ ∧ ∧ ∧ ∧ ∧ – – – – – – – – – –
Holland Park State High School Holland Park – – – 93
Average score of the school – – – – – – – – – – – – – – – 572 524 567 564 582
Percentage (%) of students at or above NMS – – – – – – – – – – – – – – – 96% 70% 90% 87% 100%
Holland Park State School Holland Park 136 102 60 –
Average score of the school 445 425 424 459 424 560 506 532 564 535 586 537 580 594 606 – – – – –
Percentage (%) of students at or above NMS 97% 100% 99% 99% 98% 98% 98% 97% 98% 98% 100% 95% 100% 98% 100% – – – – –
Holy Cross School (Smithfield) Trinity Park 80 59 37 –
Average score of the school 415 400 393 435 387 505 470 503 512 480 543 509 548 541 547 – – – – –
Percentage (%) of students at or above NMS 92% 99% 95% 99% 95% 95% 95% 96% 96% 95% 100% 95% 97% 100% 100% – – – – –
Holy Cross School (Wooloowin) Wooloowin 43 29 10 –
Average score of the school 449 410 417 446 412 522 471 489 501 496 612 560 584 599 615 – – – – –
Percentage (%) of students at or above NMS 98% 100% 98% 100% 95% 97% 90% 90% 97% 97% 100% 100% 100% 100% 100% – – – – –
Holy Family Primary School (Indooroopilly) Indooroopilly 43 23 10 –
Average score of the school 460 435 444 491 443 520 494 532 544 515 562 570 572 538 545 – – – – –
Percentage (%) of students at or above NMS 100% 100% 98% 100% 100% 100% 96% 100% 100% 100% 100% 100% 100% 100% 100% – – – – –
Holy Name Primary School (Toowoomba) Toowoomba 25 18 8 –
Average score of the school 427 387 407 420 414 517 476 524 553 484 539 492 535 545 565 – – – – –
Percentage (%) of students at or above NMS 96% 96% 96% 96% 100% 88% 88% 94% 88% 88% 100% 88% 100% 100% 88% – – – – –
Holy Spirit College North Mackay – – – 169
Average score of the school – – – – – – – – – – – – – – – 584 559 577 575 593
Percentage (%) of students at or above NMS – – – – – – – – – – – – – – – 99% 92% 97% 97% 99%
KEY∧ to maintain privacy of individual student information, where there are fewer than five students tested results are not provided∗ no students in the year level sat the test due to absence, exemption or withdrawal– no students in the year levelNMS National Minimum Standard (for further information see www.nap.edu.au)
Queensland Curriculum & Assessment Authority
Page 54 of 149
NAPLAN 2014 Outcomes — All Queensland schools

Year level enrolments Year 3 Year 5 Year 7 Year 9
School Locality Yr 3 Yr 5 Yr 7 Yr 9 READ WRIT SPEL GP NMCY READ WRIT SPEL GP NMCY READ WRIT SPEL GP NMCY READ WRIT SPEL GP NMCY
Holy Spirit School (Bray Park) Bray Park 80 75 39 –
Average score of the school 380 348 382 388 376 483 460 497 475 465 560 496 555 563 568 – – – – –
Percentage (%) of students at or above NMS 94% 90% 92% 94% 94% 92% 93% 95% 93% 95% 100% 92% 97% 100% 100% – – – – –
Holy Spirit School (Cranbrook) Cranbrook 113 116 69 –
Average score of the school 398 390 400 419 391 487 460 490 495 478 537 504 532 533 547 – – – – –
Percentage (%) of students at or above NMS 96% 94% 96% 97% 99% 97% 96% 97% 96% 99% 96% 93% 93% 96% 100% – – – – –
Holy Spirit School (New Farm) New Farm 27 30 8 –
Average score of the school 462 396 439 443 423 527 490 520 533 511 539 521 548 545 551 – – – – –
Percentage (%) of students at or above NMS 100% 100% 100% 96% 100% 100% 93% 96% 96% 100% 100% 88% 88% 100% 100% – – – – –
Home Hill State High School Home Hill – – – 48
Average score of the school – – – – – – – – – – – – – – – 540 531 561 543 579
Percentage (%) of students at or above NMS – – – – – – – – – – – – – – – 77% 62% 79% 74% 89%
Home Hill State School Home Hill 37 36 28 –
Average score of the school 354 372 367 365 361 460 455 437 463 477 513 485 509 516 527 – – – – –
Percentage (%) of students at or above NMS 83% 94% 97% 94% 92% 83% 81% 75% 83% 92% 96% 89% 89% 93% 100% – – – – –
Homebush State School Mackay 8 6 4 –
Average score of the school 435 401 387 444 438 536 452 522 533 525 ∧ ∧ ∧ ∧ ∧ – – – – –
Percentage (%) of students at or above NMS 100% 100% 100% 100% 100% 100% 83% 100% 83% 100% ∧ ∧ ∧ ∧ ∧ – – – – –
Homestead State School Homestead 1 2 2 –
Average score of the school ∧ ∧ ∧ ∧ ∧ ∧ ∧ ∧ ∧ ∧ ∧ ∧ ∧ ∧ ∧ – – – – –
Percentage (%) of students at or above NMS ∧ ∧ ∧ ∧ ∧ ∧ ∧ ∧ ∧ ∧ ∧ ∧ ∧ ∧ ∧ – – – – –
Hopevale Campus of CYAAA Hopevale via Cooktown 11 6 5 –
Average score of the school 353 238 351 315 412 396 368 431 366 375 ∧ ∧ ∧ ∧ ∧ – – – – –
Percentage (%) of students at or above NMS 100% 45% 91% 64% 100% 67% 33% 83% 33% 33% ∧ ∧ ∧ ∧ ∧ – – – – –
Horizons College Caboolture – – – 14
Average score of the school – – – – – – – – – – – – – – – ∗ ∗ ∗ ∗ ∗Percentage (%) of students at or above NMS – – – – – – – – – – – – – – – ∗ ∗ ∗ ∗ ∗
Horn Island State School Horn Island 8 6 5 –
Average score of the school 349 358 400 369 349 397 392 441 415 390 469 486 525 470 481 – – – – –
Percentage (%) of students at or above NMS 88% 100% 100% 88% 88% 67% 50% 67% 83% 50% 80% 80% 80% 40% 100% – – – – –
Howard State School Howard 20 19 17 –
Average score of the school 393 383 389 417 366 446 395 444 449 448 517 500 494 515 515 – – – – –
Percentage (%) of students at or above NMS 90% 95% 89% 100% 90% 81% 75% 88% 100% 93% 94% 87% 93% 93% 100% – – – – –
Hughenden State School Hughenden 14 14 13 17
Average score of the school 360 369 376 358 416 439 403 431 426 426 486 433 467 489 481 509 456 505 497 544
Percentage (%) of students at or above NMS 71% 86% 100% 71% 100% 77% 64% 71% 79% 77% 69% 62% 62% 69% 77% 64% 47% 69% 56% 86%
KEY∧ to maintain privacy of individual student information, where there are fewer than five students tested results are not provided∗ no students in the year level sat the test due to absence, exemption or withdrawal– no students in the year levelNMS National Minimum Standard (for further information see www.nap.edu.au)
Queensland Curriculum & Assessment Authority
Page 55 of 149
NAPLAN 2014 Outcomes — All Queensland schools

Year level enrolments Year 3 Year 5 Year 7 Year 9
School Locality Yr 3 Yr 5 Yr 7 Yr 9 READ WRIT SPEL GP NMCY READ WRIT SPEL GP NMCY READ WRIT SPEL GP NMCY READ WRIT SPEL GP NMCY
Humpybong State School Margate 105 97 56 –
Average score of the school 396 363 391 377 367 497 425 486 496 468 554 500 540 556 536 – – – – –
Percentage (%) of students at or above NMS 92% 95% 95% 95% 93% 98% 78% 90% 95% 93% 98% 82% 96% 93% 100% – – – – –
Hymba Yumba Community Hub Springfield 9 15 10 17
Average score of the school 286 251 280 296 274 381 351 400 377 381 461 373 421 434 453 471 363 468 475 503
Percentage (%) of students at or above NMS 56% 56% 67% 78% 50% 50% 36% 71% 43% 67% 90% 20% 50% 50% 67% 47% 33% 47% 47% 67%
Ignatius Park College Cranbrook – – – 187
Average score of the school – – – – – – – – – – – – – – – 578 554 570 574 602
Percentage (%) of students at or above NMS – – – – – – – – – – – – – – – 95% 83% 89% 91% 98%
Ilfracombe State School Ilfracombe 1 3 3 –
Average score of the school ∧ ∧ ∧ ∧ ∧ ∧ ∧ ∧ ∧ ∧ ∧ ∧ ∧ ∧ ∧ – – – – –
Percentage (%) of students at or above NMS ∧ ∧ ∧ ∧ ∧ ∧ ∧ ∧ ∧ ∧ ∧ ∧ ∧ ∧ ∧ – – – – –
Immaculate Heart School (Leichhardt) Leichhardt 36 17 15 –
Average score of the school 383 353 376 379 390 498 488 506 500 481 521 521 530 527 510 – – – – –
Percentage (%) of students at or above NMS 97% 86% 94% 91% 94% 100% 100% 94% 100% 100% 100% 100% 93% 93% 93% – – – – –
Immanuel Lutheran College Buderim 45 52 50 85
Average score of the school 454 443 420 475 426 535 501 519 548 522 579 499 553 565 575 602 571 592 599 605
Percentage (%) of students at or above NMS 100% 100% 100% 100% 100% 100% 100% 100% 100% 100% 100% 90% 96% 98% 100% 98% 94% 96% 98% 100%
Inala State School Durack 64 78 62 –
Average score of the school 349 324 354 351 336 435 401 461 440 427 487 446 520 479 489 – – – – –
Percentage (%) of students at or above NMS 85% 79% 87% 89% 87% 68% 55% 78% 68% 65% 82% 65% 83% 73% 92% – – – – –
Indooroopilly State High School Indooroopilly – – – 247
Average score of the school – – – – – – – – – – – – – – – 611 586 598 601 617
Percentage (%) of students at or above NMS – – – – – – – – – – – – – – – 96% 92% 94% 95% 99%
Indooroopilly State School Indooroopilly 108 116 73 –
Average score of the school 478 426 459 512 460 563 509 557 589 557 602 558 585 617 621 – – – – –
Percentage (%) of students at or above NMS 97% 97% 99% 99% 97% 97% 94% 96% 96% 96% 99% 97% 99% 100% 100% – – – – –
Ingham State High School Ingham – – – 108
Average score of the school – – – – – – – – – – – – – – – 567 546 566 560 585
Percentage (%) of students at or above NMS – – – – – – – – – – – – – – – 89% 80% 87% 87% 95%
Ingham State School Ingham 44 52 35 –
Average score of the school 413 406 414 455 416 503 451 486 495 479 522 514 531 518 528 – – – – –
Percentage (%) of students at or above NMS 91% 94% 94% 94% 94% 90% 90% 94% 92% 92% 78% 82% 82% 76% 91% – – – – –
Ingleside State School Tallebudgera Valley 13 6 3 –
Average score of the school 425 393 364 464 422 478 371 462 485 441 ∧ ∧ ∧ ∧ ∧ – – – – –
Percentage (%) of students at or above NMS 85% 100% 92% 100% 100% 80% 40% 100% 100% 80% ∧ ∧ ∧ ∧ ∧ – – – – –
KEY∧ to maintain privacy of individual student information, where there are fewer than five students tested results are not provided∗ no students in the year level sat the test due to absence, exemption or withdrawal– no students in the year levelNMS National Minimum Standard (for further information see www.nap.edu.au)
Queensland Curriculum & Assessment Authority
Page 56 of 149
NAPLAN 2014 Outcomes — All Queensland schools

Year level enrolments Year 3 Year 5 Year 7 Year 9
School Locality Yr 3 Yr 5 Yr 7 Yr 9 READ WRIT SPEL GP NMCY READ WRIT SPEL GP NMCY READ WRIT SPEL GP NMCY READ WRIT SPEL GP NMCY
Inglewood State School Inglewood 25 13 11 16
Average score of the school 402 367 403 420 369 485 465 468 503 494 520 444 507 518 521 582 516 576 547 565
Percentage (%) of students at or above NMS 96% 92% 96% 88% 80% 100% 100% 92% 100% 100% 82% 64% 73% 82% 82% 93% 60% 80% 67% 93%
Injune P-10 State School Injune 9 7 5 4
Average score of the school 384 425 428 434 391 501 463 519 512 521 ∧ ∧ ∧ ∧ ∧ ∧ ∧ ∧ ∧ ∧Percentage (%) of students at or above NMS 100% 100% 100% 100% 100% 100% 86% 100% 100% 100% ∧ ∧ ∧ ∧ ∧ ∧ ∧ ∧ ∧ ∧
Innisfail East State School Innisfail 33 17 19 –
Average score of the school 415 423 420 432 382 491 461 504 528 480 555 522 544 575 561 – – – – –
Percentage (%) of students at or above NMS 100% 100% 100% 100% 100% 82% 88% 88% 94% 94% 100% 89% 95% 95% 100% – – – – –
Innisfail State College Innisfail – – – 161
Average score of the school – – – – – – – – – – – – – – – 545 533 579 553 555
Percentage (%) of students at or above NMS – – – – – – – – – – – – – – – 84% 70% 92% 84% 95%
Innisfail State School Innisfail 30 18 22 –
Average score of the school 349 329 372 333 322 425 406 489 461 441 490 451 474 490 492 – – – – –
Percentage (%) of students at or above NMS 67% 63% 73% 70% 60% 67% 67% 94% 78% 89% 86% 64% 68% 77% 91% – – – – –
Iona College Lindum – 167 131 216
Average score of the school – – – – – 525 475 505 527 517 569 535 551 571 576 587 566 589 582 617
Percentage (%) of students at or above NMS – – – – – 100% 98% 99% 98% 100% 98% 98% 96% 97% 98% 99% 91% 95% 94% 100%
Ipswich Adventist School Brassall 17 9 6 –
Average score of the school 361 377 356 395 386 455 373 454 463 455 479 431 479 462 457 – – – – –
Percentage (%) of students at or above NMS 81% 100% 88% 100% 94% 88% 63% 88% 100% 100% 100% 33% 83% 83% 83% – – – – –
Ipswich Central State School Ipswich 93 76 49 –
Average score of the school 376 363 379 373 355 466 425 473 460 446 523 453 499 517 529 – – – – –
Percentage (%) of students at or above NMS 93% 91% 92% 90% 89% 83% 81% 87% 83% 85% 89% 71% 79% 88% 98% – – – – –
Ipswich East State School East Ipswich 46 56 30 –
Average score of the school 347 344 363 367 345 474 440 474 468 454 517 503 500 503 523 – – – – –
Percentage (%) of students at or above NMS 75% 86% 84% 82% 86% 87% 74% 91% 75% 83% 93% 85% 74% 85% 96% – – – – –
Ipswich Girls’ Grammar School East Ipswich 38 59 40 95
Average score of the school 478 454 449 494 432 552 518 538 557 509 561 546 551 577 578 628 597 624 627 633
Percentage (%) of students at or above NMS 100% 100% 100% 100% 100% 98% 98% 100% 97% 100% 100% 100% 97% 100% 97% 97% 98% 99% 99% 100%
Ipswich Grammar School Ipswich 42 58 60 145
Average score of the school 466 428 445 479 449 532 485 522 549 524 545 528 531 569 560 585 557 587 585 618
Percentage (%) of students at or above NMS 100% 100% 100% 100% 100% 100% 100% 100% 100% 100% 97% 95% 90% 93% 97% 91% 83% 88% 90% 93%
Ipswich North State School North Ipswich 26 28 8 –
Average score of the school 378 352 349 368 392 440 425 432 432 428 478 452 458 465 501 – – – – –
Percentage (%) of students at or above NMS 75% 96% 79% 79% 96% 86% 86% 79% 79% 82% 88% 75% 75% 63% 88% – – – – –
KEY∧ to maintain privacy of individual student information, where there are fewer than five students tested results are not provided∗ no students in the year level sat the test due to absence, exemption or withdrawal– no students in the year levelNMS National Minimum Standard (for further information see www.nap.edu.au)
Queensland Curriculum & Assessment Authority
Page 57 of 149
NAPLAN 2014 Outcomes — All Queensland schools

Year level enrolments Year 3 Year 5 Year 7 Year 9
School Locality Yr 3 Yr 5 Yr 7 Yr 9 READ WRIT SPEL GP NMCY READ WRIT SPEL GP NMCY READ WRIT SPEL GP NMCY READ WRIT SPEL GP NMCY
Ipswich Special School Ipswich 7 9 6 13
Average score of the school ∗ ∗ ∗ ∗ ∗ ∗ ∗ ∗ ∗ ∗ ∗ ∗ ∗ ∗ ∗ ∗ ∗ ∗ ∗ ∗Percentage (%) of students at or above NMS ∗ ∗ ∗ ∗ ∗ ∗ ∗ ∗ ∗ ∗ ∗ ∗ ∗ ∗ ∗ ∗ ∗ ∗ ∗ ∗
Ipswich State High School Brassall – – – 241
Average score of the school – – – – – – – – – – – – – – – 531 499 538 517 537
Percentage (%) of students at or above NMS – – – – – – – – – – – – – – – 78% 57% 81% 68% 89%
Ipswich West Special School West Ipswich 8 6 6 10
Average score of the school ∗ ∗ ∗ ∗ ∗ ∗ ∗ ∗ ∗ ∗ ∗ ∗ ∗ ∗ ∗ ∗ ∗ ∗ ∗ ∗Percentage (%) of students at or above NMS ∗ ∗ ∗ ∗ ∗ ∗ ∗ ∗ ∗ ∗ ∗ ∗ ∗ ∗ ∗ ∗ ∗ ∗ ∗ ∗
Ipswich West State School Ipswich West 33 20 13 –
Average score of the school 343 332 333 337 337 439 436 439 446 449 509 499 511 517 516 – – – – –
Percentage (%) of students at or above NMS 82% 84% 82% 82% 91% 63% 79% 84% 84% 84% 92% 85% 85% 92% 92% – – – – –
Ironside State School St Lucia 121 123 67 –
Average score of the school 503 481 495 542 488 570 513 546 582 558 641 610 611 647 649 – – – – –
Percentage (%) of students at or above NMS 98% 98% 98% 98% 99% 94% 91% 94% 94% 97% 93% 93% 93% 93% 99% – – – – –
Irvinebank State School Irvinebank 1 1 – –
Average score of the school ∧ ∧ ∧ ∧ ∧ ∧ ∧ ∧ ∧ ∧ – – – – – – – – – –
Percentage (%) of students at or above NMS ∧ ∧ ∧ ∧ ∧ ∧ ∧ ∧ ∧ ∧ – – – – – – – – – –
Isabella State School Edmonton 96 72 39 –
Average score of the school 378 360 388 381 356 470 430 469 477 440 507 468 531 504 519 – – – – –
Percentage (%) of students at or above NMS 91% 94% 92% 92% 92% 84% 72% 84% 87% 69% 92% 78% 92% 78% 94% – – – – –
Isis District State High School Childers – – – 95
Average score of the school – – – – – – – – – – – – – – – 558 543 582 570 582
Percentage (%) of students at or above NMS – – – – – – – – – – – – – – – 91% 78% 96% 87% 100%
Isisford State School Isisford 2 2 3 –
Average score of the school ∧ ∧ ∧ ∧ ∧ ∧ ∧ ∧ ∧ ∧ ∧ ∧ ∧ ∧ ∧ – – – – –
Percentage (%) of students at or above NMS ∧ ∧ ∧ ∧ ∧ ∧ ∧ ∧ ∧ ∧ ∧ ∧ ∧ ∧ ∧ – – – – –
Islamic College of Brisbane Karawatha 102 87 68 58
Average score of the school 415 436 458 442 411 490 487 528 532 495 551 551 575 564 568 581 565 618 599 609
Percentage (%) of students at or above NMS 99% 100% 100% 98% 100% 98% 96% 100% 98% 97% 99% 100% 99% 96% 99% 93% 91% 100% 95% 100%
Ithaca Creek State School Bardon 85 52 25 –
Average score of the school 466 427 422 465 441 550 490 521 559 534 617 535 588 594 601 – – – – –
Percentage (%) of students at or above NMS 99% 98% 98% 100% 99% 100% 94% 100% 96% 100% 100% 92% 96% 100% 100% – – – – –
Jambin State School Jambin 14 3 7 –
Average score of the school 352 390 339 364 395 ∧ ∧ ∧ ∧ ∧ 574 532 512 550 576 – – – – –
Percentage (%) of students at or above NMS 79% 100% 86% 93% 100% ∧ ∧ ∧ ∧ ∧ 100% 100% 83% 100% 100% – – – – –
KEY∧ to maintain privacy of individual student information, where there are fewer than five students tested results are not provided∗ no students in the year level sat the test due to absence, exemption or withdrawal– no students in the year levelNMS National Minimum Standard (for further information see www.nap.edu.au)
Queensland Curriculum & Assessment Authority
Page 58 of 149
NAPLAN 2014 Outcomes — All Queensland schools

Year level enrolments Year 3 Year 5 Year 7 Year 9
School Locality Yr 3 Yr 5 Yr 7 Yr 9 READ WRIT SPEL GP NMCY READ WRIT SPEL GP NMCY READ WRIT SPEL GP NMCY READ WRIT SPEL GP NMCY
Jamboree Heights State School Jamboree Heights 113 93 40 –
Average score of the school 437 418 430 450 419 524 479 513 540 508 570 524 569 583 569 – – – – –
Percentage (%) of students at or above NMS 95% 98% 97% 97% 99% 99% 93% 99% 98% 100% 100% 92% 100% 94% 100% – – – – –
James Nash State High School Gympie – – – 221
Average score of the school – – – – – – – – – – – – – – – 572 530 577 570 579
Percentage (%) of students at or above NMS – – – – – – – – – – – – – – – 94% 78% 95% 90% 98%
Jandowae State School Jandowae 20 10 4 8
Average score of the school 438 414 410 414 393 511 451 515 521 502 ∧ ∧ ∧ ∧ ∧ 549 518 535 531 570
Percentage (%) of students at or above NMS 100% 100% 100% 100% 100% 100% 100% 100% 89% 100% ∧ ∧ ∧ ∧ ∧ 88% 75% 75% 88% 100%
Jarvisfield State School Jarvisfield 3 4 – –
Average score of the school ∧ ∧ ∧ ∧ ∧ ∧ ∧ ∧ ∧ ∧ – – – – – – – – – –
Percentage (%) of students at or above NMS ∧ ∧ ∧ ∧ ∧ ∧ ∧ ∧ ∧ ∧ – – – – – – – – – –
Jericho State School Jericho 2 4 2 –
Average score of the school ∧ ∧ ∧ ∧ ∧ ∧ ∧ ∧ ∧ ∧ ∧ ∧ ∧ ∧ ∧ – – – – –
Percentage (%) of students at or above NMS ∧ ∧ ∧ ∧ ∧ ∧ ∧ ∧ ∧ ∧ ∧ ∧ ∧ ∧ ∧ – – – – –
Jimboomba State School Jimboomba 98 116 59 –
Average score of the school 396 385 376 389 376 478 440 474 475 464 533 507 535 528 534 – – – – –
Percentage (%) of students at or above NMS 90% 98% 90% 91% 98% 89% 82% 92% 88% 93% 96% 89% 91% 86% 96% – – – – –
Jimbour State School Jimbour 4 5 2 –
Average score of the school ∧ ∧ ∧ ∧ ∧ ∧ ∧ ∧ ∧ ∧ ∧ ∧ ∧ ∧ ∧ – – – – –
Percentage (%) of students at or above NMS ∧ ∧ ∧ ∧ ∧ ∧ ∧ ∧ ∧ ∧ ∧ ∧ ∧ ∧ ∧ – – – – –
Jindalee State School Jindalee 110 118 65 –
Average score of the school 448 408 435 463 422 514 472 512 527 501 573 557 569 583 587 – – – – –
Percentage (%) of students at or above NMS 96% 94% 98% 97% 97% 98% 92% 96% 95% 97% 100% 98% 100% 98% 100% – – – – –
Jinibara State School Narangba 89 97 58 –
Average score of the school 379 359 373 397 379 473 447 463 480 464 524 487 534 515 522 – – – – –
Percentage (%) of students at or above NMS 88% 88% 93% 93% 96% 88% 83% 85% 89% 92% 92% 88% 92% 85% 100% – – – – –
John Paul College Daisy Hill 89 107 84 144
Average score of the school 447 430 432 464 423 511 469 505 517 511 563 516 544 563 568 597 578 597 592 614
Percentage (%) of students at or above NMS 95% 98% 96% 94% 98% 96% 93% 98% 99% 97% 99% 95% 94% 93% 99% 99% 95% 97% 97% 100%
Jondaryan State School Jondaryan 2 2 1 –
Average score of the school ∧ ∧ ∧ ∧ ∧ ∧ ∧ ∧ ∧ ∧ ∧ ∧ ∧ ∧ ∧ – – – – –
Percentage (%) of students at or above NMS ∧ ∧ ∧ ∧ ∧ ∧ ∧ ∧ ∧ ∧ ∧ ∧ ∧ ∧ ∧ – – – – –
Jones Hill State School Gympie 64 55 27 –
Average score of the school 389 404 369 406 379 472 439 459 483 471 499 487 509 491 493 – – – – –
Percentage (%) of students at or above NMS 93% 100% 96% 93% 91% 88% 88% 85% 92% 90% 91% 83% 91% 83% 87% – – – – –
KEY∧ to maintain privacy of individual student information, where there are fewer than five students tested results are not provided∗ no students in the year level sat the test due to absence, exemption or withdrawal– no students in the year levelNMS National Minimum Standard (for further information see www.nap.edu.au)
Queensland Curriculum & Assessment Authority
Page 59 of 149
NAPLAN 2014 Outcomes — All Queensland schools

Year level enrolments Year 3 Year 5 Year 7 Year 9
School Locality Yr 3 Yr 5 Yr 7 Yr 9 READ WRIT SPEL GP NMCY READ WRIT SPEL GP NMCY READ WRIT SPEL GP NMCY READ WRIT SPEL GP NMCY
Jubilee Christian College (Atherton) Atherton 93 85 81 98
Average score of the school 410 310 379 382 381 518 429 481 522 485 532 445 509 546 514 602 574 600 606 582
Percentage (%) of students at or above NMS 88% 73% 88% 81% 92% 95% 75% 95% 90% 89% 85% 80% 80% 90% 85% 89% 85% 80% 85% 100%
Jubilee Primary School Pacific Pines 62 90 44 –
Average score of the school 428 405 420 450 407 498 466 487 499 478 553 559 554 557 536 – – – – –
Percentage (%) of students at or above NMS 98% 100% 98% 100% 98% 99% 90% 96% 99% 96% 100% 100% 97% 100% 100% – – – – –
Julatten State School Julatten 8 9 6 –
Average score of the school 415 363 411 430 438 507 510 493 512 485 530 551 493 519 515 – – – – –
Percentage (%) of students at or above NMS 100% 88% 100% 100% 100% 100% 100% 100% 100% 100% 100% 100% 83% 83% 100% – – – – –
Julia Creek State School Julia Creek 3 4 3 –
Average score of the school ∧ ∧ ∧ ∧ ∧ ∧ ∧ ∧ ∧ ∧ ∧ ∧ ∧ ∧ ∧ – – – – –
Percentage (%) of students at or above NMS ∧ ∧ ∧ ∧ ∧ ∧ ∧ ∧ ∧ ∧ ∧ ∧ ∧ ∧ ∧ – – – – –
Junction Park State School Annerley 60 42 44 –
Average score of the school 458 412 420 445 416 476 459 482 472 452 572 499 560 548 566 – – – – –
Percentage (%) of students at or above NMS 100% 100% 98% 100% 100% 92% 84% 89% 86% 89% 95% 84% 95% 87% 85% – – – – –
Jundah State School Jundah via Longreach 1 1 – –
Average score of the school ∧ ∧ ∧ ∧ ∧ ∧ ∧ ∧ ∧ ∧ – – – – – – – – – –
Percentage (%) of students at or above NMS ∧ ∧ ∧ ∧ ∧ ∧ ∧ ∧ ∧ ∧ – – – – – – – – – –
Kaimkillenbun State School Kaimkillenbun 5 6 – –
Average score of the school ∧ ∧ ∧ ∧ ∧ 497 490 490 470 481 – – – – – – – – – –
Percentage (%) of students at or above NMS ∧ ∧ ∧ ∧ ∧ 100% 100% 100% 100% 100% – – – – – – – – – –
Kairi State School Kairi 15 10 7 –
Average score of the school 384 351 362 340 377 534 466 510 537 494 534 467 530 537 537 – – – – –
Percentage (%) of students at or above NMS 92% 100% 100% 75% 100% 100% 100% 100% 100% 90% 86% 86% 100% 100% 86% – – – – –
Kalamia State School via Ayr 1 1 2 –
Average score of the school ∧ ∧ ∧ ∧ ∧ ∧ ∧ ∧ ∧ ∧ ∧ ∧ ∧ ∧ ∧ – – – – –
Percentage (%) of students at or above NMS ∧ ∧ ∧ ∧ ∧ ∧ ∧ ∧ ∧ ∧ ∧ ∧ ∧ ∧ ∧ – – – – –
Kalbar State School Kalbar 23 24 16 –
Average score of the school 437 408 411 485 415 499 450 483 505 493 526 513 519 548 565 – – – – –
Percentage (%) of students at or above NMS 96% 96% 91% 100% 96% 96% 88% 92% 96% 96% 100% 100% 100% 100% 100% – – – – –
Kalkie State School Bundaberg 51 46 24 –
Average score of the school 403 378 398 416 396 515 464 494 526 487 545 473 551 542 572 – – – – –
Percentage (%) of students at or above NMS 89% 98% 94% 98% 96% 98% 95% 88% 100% 95% 100% 79% 100% 100% 100% – – – – –
Kallangur State School Kallangur 114 105 50 –
Average score of the school 384 384 395 403 364 475 448 474 478 461 520 483 539 516 508 – – – – –
Percentage (%) of students at or above NMS 94% 95% 94% 97% 97% 93% 87% 89% 91% 89% 95% 82% 98% 93% 95% – – – – –
KEY∧ to maintain privacy of individual student information, where there are fewer than five students tested results are not provided∗ no students in the year level sat the test due to absence, exemption or withdrawal– no students in the year levelNMS National Minimum Standard (for further information see www.nap.edu.au)
Queensland Curriculum & Assessment Authority
Page 60 of 149
NAPLAN 2014 Outcomes — All Queensland schools

Year level enrolments Year 3 Year 5 Year 7 Year 9
School Locality Yr 3 Yr 5 Yr 7 Yr 9 READ WRIT SPEL GP NMCY READ WRIT SPEL GP NMCY READ WRIT SPEL GP NMCY READ WRIT SPEL GP NMCY
Kandanga State School Kandanga 8 4 4 –
Average score of the school 366 360 391 409 358 ∧ ∧ ∧ ∧ ∧ ∧ ∧ ∧ ∧ ∧ – – – – –
Percentage (%) of students at or above NMS 100% 88% 100% 100% 71% ∧ ∧ ∧ ∧ ∧ ∧ ∧ ∧ ∧ ∧ – – – – –
Karalee State School Karalee 80 62 36 –
Average score of the school 421 404 426 447 410 499 426 479 492 488 534 478 516 518 533 – – – – –
Percentage (%) of students at or above NMS 98% 99% 100% 100% 100% 100% 79% 97% 97% 97% 100% 81% 97% 92% 100% – – – – –
Karara State School Karara – 2 1 –
Average score of the school – – – – – ∧ ∧ ∧ ∧ ∧ ∧ ∧ ∧ ∧ ∧ – – – – –
Percentage (%) of students at or above NMS – – – – – ∧ ∧ ∧ ∧ ∧ ∧ ∧ ∧ ∧ ∧ – – – – –
Karumba State School Karumba 5 3 – –
Average score of the school 290 329 282 312 335 ∧ ∧ ∧ ∧ ∧ – – – – – – – – – –
Percentage (%) of students at or above NMS 60% 100% 100% 80% 100% ∧ ∧ ∧ ∧ ∧ – – – – – – – – – –
Kawana Waters State College Bokarina 74 61 60 194
Average score of the school 396 374 361 385 380 493 468 490 491 477 541 507 549 554 546 577 558 583 575 579
Percentage (%) of students at or above NMS 95% 98% 91% 97% 98% 94% 95% 93% 89% 98% 98% 94% 98% 94% 98% 98% 86% 95% 94% 98%
Kawungan State School Kawungan Hervey Bay 136 115 94 –
Average score of the school 408 387 402 422 394 483 423 484 486 463 545 489 531 541 546 – – – – –
Percentage (%) of students at or above NMS 92% 91% 93% 90% 92% 94% 74% 90% 96% 91% 94% 84% 88% 90% 98% – – – – –
Kedron State High School Wooloowin – – – 242
Average score of the school – – – – – – – – – – – – – – – 584 554 587 588 593
Percentage (%) of students at or above NMS – – – – – – – – – – – – – – – 91% 85% 92% 91% 99%
Kedron State School Kedron 56 51 22 –
Average score of the school 456 434 457 479 427 529 472 520 538 502 592 536 559 574 564 – – – – –
Percentage (%) of students at or above NMS 96% 98% 98% 98% 98% 96% 88% 92% 94% 94% 100% 86% 91% 91% 95% – – – – –
Keebra Park State High School Southport – – – 134
Average score of the school – – – – – – – – – – – – – – – 555 533 579 541 562
Percentage (%) of students at or above NMS – – – – – – – – – – – – – – – 92% 75% 96% 85% 95%
Kelso State School Kelso 49 52 38 –
Average score of the school 378 377 378 382 381 457 419 444 452 447 495 466 487 493 495 – – – – –
Percentage (%) of students at or above NMS 94% 96% 96% 94% 96% 84% 69% 78% 80% 86% 91% 80% 80% 86% 91% – – – – –
Kelvin Grove State College Kelvin Grove 87 102 98 270
Average score of the school 499 415 466 514 469 547 492 533 556 522 579 532 573 585 563 602 572 601 602 614
Percentage (%) of students at or above NMS 87% 81% 86% 86% 87% 94% 93% 94% 95% 94% 97% 94% 97% 97% 99% 96% 85% 94% 96% 96%
Kenilworth State Community College Kenilworth 5 7 6 –
Average score of the school 446 370 419 430 397 494 477 515 517 483 585 500 542 539 471 – – – – –
Percentage (%) of students at or above NMS 100% 100% 100% 100% 100% 86% 100% 100% 100% 100% 100% 100% 100% 100% 80% – – – – –
KEY∧ to maintain privacy of individual student information, where there are fewer than five students tested results are not provided∗ no students in the year level sat the test due to absence, exemption or withdrawal– no students in the year levelNMS National Minimum Standard (for further information see www.nap.edu.au)
Queensland Curriculum & Assessment Authority
Page 61 of 149
NAPLAN 2014 Outcomes — All Queensland schools

Year level enrolments Year 3 Year 5 Year 7 Year 9
School Locality Yr 3 Yr 5 Yr 7 Yr 9 READ WRIT SPEL GP NMCY READ WRIT SPEL GP NMCY READ WRIT SPEL GP NMCY READ WRIT SPEL GP NMCY
Kenmore South State School Kenmore 88 59 32 –
Average score of the school 484 446 456 485 442 575 514 537 587 553 590 572 565 609 609 – – – – –
Percentage (%) of students at or above NMS 99% 100% 100% 100% 100% 100% 100% 98% 100% 100% 100% 100% 100% 97% 100% – – – – –
Kenmore State High School Kenmore – – – 351
Average score of the school – – – – – – – – – – – – – – – 612 584 605 607 610
Percentage (%) of students at or above NMS – – – – – – – – – – – – – – – 98% 91% 96% 98% 99%
Kenmore State School Kenmore 35 41 30 –
Average score of the school 430 400 415 445 422 517 457 485 514 494 572 549 553 566 590 – – – – –
Percentage (%) of students at or above NMS 93% 100% 93% 97% 93% 97% 82% 92% 95% 95% 96% 93% 96% 96% 96% – – – – –
Kennedy State School Kennedy 14 5 6 –
Average score of the school 343 381 348 320 329 ∧ ∧ ∧ ∧ ∧ 475 486 496 493 511 – – – – –
Percentage (%) of students at or above NMS 75% 92% 75% 75% 83% ∧ ∧ ∧ ∧ ∧ 100% 100% 100% 100% 100% – – – – –
Kentville State School Kentville via Forest Hill 2 5 3 –
Average score of the school ∧ ∧ ∧ ∧ ∧ 473 430 446 481 473 ∧ ∧ ∧ ∧ ∧ – – – – –
Percentage (%) of students at or above NMS ∧ ∧ ∧ ∧ ∧ 100% 80% 80% 100% 100% ∧ ∧ ∧ ∧ ∧ – – – – –
Kepnock State High School Bundaberg – – – 244
Average score of the school – – – – – – – – – – – – – – – 550 501 555 539 552
Percentage (%) of students at or above NMS – – – – – – – – – – – – – – – 88% 66% 91% 83% 96%
Keppel Sands State School Keppel Sands 5 2 – –
Average score of the school 421 466 472 469 430 ∧ ∧ ∧ ∧ ∧ – – – – – – – – – –
Percentage (%) of students at or above NMS 100% 100% 100% 100% 100% ∧ ∧ ∧ ∧ ∧ – – – – – – – – – –
Kia-Ora State School Kia Ora via Gympie 12 7 6 –
Average score of the school 328 380 394 377 370 468 448 456 475 476 578 500 544 556 564 – – – – –
Percentage (%) of students at or above NMS 83% 92% 92% 83% 83% 86% 86% 86% 71% 86% 100% 100% 100% 100% 100% – – – – –
Kilcoy State High School Kilcoy – – – 61
Average score of the school – – – – – – – – – – – – – – – 541 539 535 532 566
Percentage (%) of students at or above NMS – – – – – – – – – – – – – – – 86% 73% 82% 85% 95%
Kilcoy State School Kilcoy 53 55 32 –
Average score of the school 374 363 382 378 354 481 447 470 473 469 521 476 514 519 516 – – – – –
Percentage (%) of students at or above NMS 86% 92% 92% 90% 90% 87% 81% 79% 87% 87% 90% 75% 88% 88% 93% – – – – –
Kilcummin State School Kilcummin via Clermont 6 4 – –
Average score of the school 431 435 459 465 418 ∧ ∧ ∧ ∧ ∧ – – – – – – – – – –
Percentage (%) of students at or above NMS 100% 100% 100% 100% 100% ∧ ∧ ∧ ∧ ∧ – – – – – – – – – –
Kilkivan State School Kilkivan 8 11 6 10
Average score of the school 361 389 373 383 433 471 446 455 457 441 500 465 492 462 518 554 532 541 510 561
Percentage (%) of students at or above NMS 63% 88% 75% 75% 88% 82% 73% 73% 64% 82% 83% 83% 83% 67% 83% 90% 90% 70% 60% 100%
KEY∧ to maintain privacy of individual student information, where there are fewer than five students tested results are not provided∗ no students in the year level sat the test due to absence, exemption or withdrawal– no students in the year levelNMS National Minimum Standard (for further information see www.nap.edu.au)
Queensland Curriculum & Assessment Authority
Page 62 of 149
NAPLAN 2014 Outcomes — All Queensland schools

Year level enrolments Year 3 Year 5 Year 7 Year 9
School Locality Yr 3 Yr 5 Yr 7 Yr 9 READ WRIT SPEL GP NMCY READ WRIT SPEL GP NMCY READ WRIT SPEL GP NMCY READ WRIT SPEL GP NMCY
Killarney P-10 State School Killarney 16 16 11 21
Average score of the school 365 353 322 349 333 477 396 432 446 455 486 473 511 482 509 542 504 544 546 554
Percentage (%) of students at or above NMS 87% 93% 93% 87% 73% 81% 63% 88% 63% 88% 91% 91% 91% 91% 100% 81% 67% 86% 90% 95%
Kimberley College Carbrook – – – 181
Average score of the school – – – – – – – – – – – – – – – 593 578 571 567 554
Percentage (%) of students at or above NMS – – – – – – – – – – – – – – – 100% 83% 92% 75% 92%
Kimberley Park State School Shailer Park 108 118 74 –
Average score of the school 421 415 404 425 403 488 443 481 488 474 548 514 539 549 540 – – – – –
Percentage (%) of students at or above NMS 95% 99% 94% 97% 96% 94% 83% 97% 96% 94% 97% 90% 93% 97% 97% – – – – –
Kin Kin State School Kin Kin 6 7 7 –
Average score of the school ∧ ∧ ∧ ∧ ∧ 447 403 452 467 450 541 486 488 524 ∧ – – – – –
Percentage (%) of students at or above NMS ∧ ∧ ∧ ∧ ∧ 100% 83% 100% 100% 100% 100% 100% 100% 100% ∧ – – – – –
Kin Kora State School Gladstone 137 102 61 –
Average score of the school 390 381 388 414 386 488 436 493 497 480 516 470 520 520 517 – – – – –
Percentage (%) of students at or above NMS 89% 90% 91% 92% 94% 90% 81% 93% 96% 93% 90% 81% 81% 88% 84% – – – – –
Kindon State School via Goondiwindi 2 – – –
Average score of the school ∧ ∧ ∧ ∧ ∧ – – – – – – – – – – – – – – –
Percentage (%) of students at or above NMS ∧ ∧ ∧ ∧ ∧ – – – – – – – – – – – – – – –
King’s Christian College Reedy Creek 123 121 117 130
Average score of the school 457 440 454 464 437 536 504 513 542 519 552 533 567 563 556 590 574 596 597 594
Percentage (%) of students at or above NMS 98% 100% 100% 98% 100% 97% 96% 98% 97% 97% 98% 99% 100% 99% 100% 98% 89% 98% 94% 100%
Kingaroy State High School Kingaroy – – – 211
Average score of the school – – – – – – – – – – – – – – – 562 530 560 551 569
Percentage (%) of students at or above NMS – – – – – – – – – – – – – – – 91% 73% 91% 84% 94%
Kingaroy State School Kingaroy 86 73 46 –
Average score of the school 372 353 362 374 368 465 409 467 464 456 512 475 510 518 522 – – – – –
Percentage (%) of students at or above NMS 80% 80% 80% 81% 85% 87% 62% 84% 86% 90% 83% 79% 83% 83% 88% – – – – –
Kingsthorpe State School Kingsthorpe 25 30 16 –
Average score of the school 373 374 376 400 382 484 453 475 483 476 491 469 500 493 518 – – – – –
Percentage (%) of students at or above NMS 78% 91% 91% 78% 91% 89% 89% 93% 81% 86% 88% 75% 81% 75% 94% – – – – –
Kingston College Kingston – – – 156
Average score of the school – – – – – – – – – – – – – – – 522 501 537 521 539
Percentage (%) of students at or above NMS – – – – – – – – – – – – – – – 76% 60% 84% 74% 93%
Kingston State School Kingston 107 91 65 –
Average score of the school 349 342 353 357 334 443 426 463 439 430 496 456 499 479 507 – – – – –
Percentage (%) of students at or above NMS 79% 82% 80% 84% 83% 80% 75% 85% 74% 77% 87% 73% 80% 75% 94% – – – – –
KEY∧ to maintain privacy of individual student information, where there are fewer than five students tested results are not provided∗ no students in the year level sat the test due to absence, exemption or withdrawal– no students in the year levelNMS National Minimum Standard (for further information see www.nap.edu.au)
Queensland Curriculum & Assessment Authority
Page 63 of 149
NAPLAN 2014 Outcomes — All Queensland schools

Year level enrolments Year 3 Year 5 Year 7 Year 9
School Locality Yr 3 Yr 5 Yr 7 Yr 9 READ WRIT SPEL GP NMCY READ WRIT SPEL GP NMCY READ WRIT SPEL GP NMCY READ WRIT SPEL GP NMCY
Kioma State School via Toobeah 5 2 – –
Average score of the school 350 432 349 374 ∧ ∧ ∧ ∧ ∧ ∧ – – – – – – – – – –
Percentage (%) of students at or above NMS 100% 100% 80% 100% ∧ ∧ ∧ ∧ ∧ ∧ – – – – – – – – – –
Kippa-Ring State School Kippa-Ring 51 59 38 –
Average score of the school 364 322 363 392 358 449 389 442 441 439 511 459 496 495 524 – – – – –
Percentage (%) of students at or above NMS 82% 78% 94% 90% 88% 88% 64% 81% 81% 81% 97% 71% 81% 83% 97% – – – – –
Kirwan State High School Kirwan – – – 402
Average score of the school – – – – – – – – – – – – – – – 544 497 549 531 541
Percentage (%) of students at or above NMS – – – – – – – – – – – – – – – 86% 57% 82% 77% 90%
Kirwan State School Kirwan 112 99 71 –
Average score of the school 382 376 379 392 379 476 444 487 491 468 512 475 528 523 532 – – – – –
Percentage (%) of students at or above NMS 93% 94% 93% 96% 96% 92% 85% 96% 93% 96% 100% 85% 92% 98% 98% – – – – –
Kogan State School Kogan 7 11 6 –
Average score of the school 352 380 374 371 344 461 465 456 470 476 500 476 505 489 466 – – – – –
Percentage (%) of students at or above NMS 100% 100% 100% 100% 100% 100% 100% 100% 100% 100% 100% 83% 83% 83% 83% – – – – –
Kolan South State School South Kolan 23 20 8 –
Average score of the school 395 393 409 429 402 486 448 495 511 482 524 486 525 535 538 – – – – –
Percentage (%) of students at or above NMS 91% 100% 95% 95% 95% 89% 94% 100% 100% 94% 88% 63% 75% 88% 100% – – – – –
Koumala State School Koumala 15 13 6 –
Average score of the school 418 385 384 435 429 509 460 466 522 460 532 519 494 587 589 – – – – –
Percentage (%) of students at or above NMS 100% 93% 93% 100% 100% 100% 92% 85% 92% 85% 100% 100% 80% 100% 100% – – – – –
Kowanyama State School Kowanyama 17 19 15 10
Average score of the school 272 261 353 333 318 355 332 372 360 337 410 294 445 394 439 450 340 428 421 454
Percentage (%) of students at or above NMS 50% 47% 82% 76% 65% 29% 17% 58% 32% 6% 31% 29% 43% 21% 46% 11% 0% 25% 0% 17%
Kruger State School Bellbird Park 131 123 88 –
Average score of the school 368 355 385 382 342 449 434 474 459 445 490 480 518 493 506 – – – – –
Percentage (%) of students at or above NMS 86% 83% 86% 88% 84% 82% 75% 84% 85% 80% 88% 85% 86% 81% 94% – – – – –
Kubin State School via Thursday Island 2 5 1 –
Average score of the school ∧ ∧ ∧ ∧ ∧ 345 421 471 344 408 ∧ ∧ ∧ ∧ ∧ – – – – –
Percentage (%) of students at or above NMS ∧ ∧ ∧ ∧ ∧ 0% 80% 80% 40% 80% ∧ ∧ ∧ ∧ ∧ – – – – –
Kulpi State School Peranga 2 1 – –
Average score of the school ∧ ∧ ∧ ∧ ∧ ∧ ∧ ∧ ∧ ∧ – – – – – – – – – –
Percentage (%) of students at or above NMS ∧ ∧ ∧ ∧ ∧ ∧ ∧ ∧ ∧ ∧ – – – – – – – – – –
Kuluin State School Maroochydore 115 76 61 –
Average score of the school 394 355 384 409 379 499 444 496 507 480 533 499 523 525 525 – – – – –
Percentage (%) of students at or above NMS 94% 90% 96% 95% 94% 92% 79% 95% 96% 94% 98% 89% 92% 95% 93% – – – – –
KEY∧ to maintain privacy of individual student information, where there are fewer than five students tested results are not provided∗ no students in the year level sat the test due to absence, exemption or withdrawal– no students in the year levelNMS National Minimum Standard (for further information see www.nap.edu.au)
Queensland Curriculum & Assessment Authority
Page 64 of 149
NAPLAN 2014 Outcomes — All Queensland schools

Year level enrolments Year 3 Year 5 Year 7 Year 9
School Locality Yr 3 Yr 5 Yr 7 Yr 9 READ WRIT SPEL GP NMCY READ WRIT SPEL GP NMCY READ WRIT SPEL GP NMCY READ WRIT SPEL GP NMCY
Kumbia State School Kumbia 18 10 5 –
Average score of the school 415 400 415 433 390 505 473 502 521 492 563 502 552 555 567 – – – – –
Percentage (%) of students at or above NMS 89% 94% 89% 94% 100% 78% 75% 88% 88% 78% 100% 80% 100% 100% 100% – – – – –
Kuraby Special School Kuraby 4 4 6 9
Average score of the school ∗ ∗ ∗ ∗ ∗ ∗ ∗ ∗ ∗ ∗ ∗ ∗ ∗ ∗ ∗ ∗ ∗ ∗ ∗ ∗Percentage (%) of students at or above NMS ∗ ∗ ∗ ∗ ∗ ∗ ∗ ∗ ∗ ∗ ∗ ∗ ∗ ∗ ∗ ∗ ∗ ∗ ∗ ∗
Kuraby State School Kuraby 64 60 30 –
Average score of the school 384 381 395 404 383 484 466 494 481 477 508 461 527 494 504 – – – – –
Percentage (%) of students at or above NMS 87% 89% 87% 83% 89% 88% 87% 86% 86% 91% 76% 67% 80% 80% 76% – – – – –
Kuranda District State College Myola 39 29 17 31
Average score of the school 416 339 373 379 352 435 404 420 419 407 495 486 489 494 492 530 408 533 526 542
Percentage (%) of students at or above NMS 94% 77% 89% 86% 89% 70% 54% 70% 52% 52% 88% 71% 86% 79% 79% 71% 50% 71% 71% 85%
Kurwongbah State School Petrie 147 100 42 –
Average score of the school 410 387 396 417 403 507 455 496 512 487 544 499 543 536 545 – – – – –
Percentage (%) of students at or above NMS 92% 95% 94% 94% 98% 95% 86% 93% 94% 97% 100% 95% 95% 90% 100% – – – – –
Labrador State School Labrador 145 102 24 –
Average score of the school 399 386 406 418 380 489 455 501 482 469 543 484 542 532 548 – – – – –
Percentage (%) of students at or above NMS 88% 90% 89% 89% 88% 83% 79% 87% 84% 80% 77% 64% 77% 68% 86% – – – – –
Laidley District State School Laidley 68 52 44 –
Average score of the school 351 354 352 337 348 435 423 434 443 414 509 464 506 497 497 – – – – –
Percentage (%) of students at or above NMS 85% 88% 89% 73% 86% 80% 71% 73% 73% 67% 90% 68% 83% 76% 95% – – – – –
Laidley State High School Laidley – – – 136
Average score of the school – – – – – – – – – – – – – – – 545 509 561 539 549
Percentage (%) of students at or above NMS – – – – – – – – – – – – – – – 80% 66% 79% 77% 86%
Lake Clarendon State School Lake Clarendon 12 19 17 –
Average score of the school 405 362 389 419 383 467 432 446 458 470 542 473 503 538 535 – – – – –
Percentage (%) of students at or above NMS 91% 100% 100% 91% 100% 89% 89% 72% 94% 100% 88% 71% 82% 82% 88% – – – – –
Lakeland State School Lakeland 1 1 – –
Average score of the school ∧ ∧ ∧ ∧ ∧ ∧ ∧ ∧ ∧ ∧ – – – – – – – – – –
Percentage (%) of students at or above NMS ∧ ∧ ∧ ∧ ∧ ∧ ∧ ∧ ∧ ∧ – – – – – – – – – –
Lakes Creek State School Rockhampton North 19 15 14 –
Average score of the school 339 325 325 356 326 468 416 464 495 448 496 439 505 494 506 – – – – –
Percentage (%) of students at or above NMS 67% 89% 56% 83% 67% 80% 67% 87% 87% 87% 69% 54% 85% 77% 100% – – – – –
Landsborough State School Landsborough 32 38 22 –
Average score of the school 407 375 384 421 432 491 437 468 486 461 521 470 495 509 499 – – – – –
Percentage (%) of students at or above NMS 95% 91% 86% 91% 95% 97% 76% 93% 93% 86% 83% 72% 83% 78% 89% – – – – –
KEY∧ to maintain privacy of individual student information, where there are fewer than five students tested results are not provided∗ no students in the year level sat the test due to absence, exemption or withdrawal– no students in the year levelNMS National Minimum Standard (for further information see www.nap.edu.au)
Queensland Curriculum & Assessment Authority
Page 65 of 149
NAPLAN 2014 Outcomes — All Queensland schools

Year level enrolments Year 3 Year 5 Year 7 Year 9
School Locality Yr 3 Yr 5 Yr 7 Yr 9 READ WRIT SPEL GP NMCY READ WRIT SPEL GP NMCY READ WRIT SPEL GP NMCY READ WRIT SPEL GP NMCY
Laura State School Laura 4 1 – –
Average score of the school ∧ ∧ ∧ ∧ ∧ ∧ ∧ ∧ ∧ ∧ – – – – – – – – – –
Percentage (%) of students at or above NMS ∧ ∧ ∧ ∧ ∧ ∧ ∧ ∧ ∧ ∧ – – – – – – – – – –
Lawnton State School Lawnton 32 33 15 –
Average score of the school 356 327 366 358 336 460 409 453 446 434 521 465 493 504 496 – – – – –
Percentage (%) of students at or above NMS 87% 87% 97% 94% 90% 90% 84% 81% 87% 84% 93% 71% 64% 79% 100% – – – – –
Leichhardt State School Leichhardt 36 27 21 –
Average score of the school 335 332 333 313 330 412 349 418 399 400 481 453 491 466 474 – – – – –
Percentage (%) of students at or above NMS 78% 85% 74% 76% 87% 64% 42% 58% 50% 60% 76% 65% 75% 65% 67% – – – – –
Leyburn State School Leyburn 6 3 – –
Average score of the school 397 282 382 367 385 ∧ ∧ ∧ ∧ ∧ – – – – – – – – – –
Percentage (%) of students at or above NMS 83% 67% 100% 83% 83% ∧ ∧ ∧ ∧ ∧ – – – – – – – – – –
Lighthouse Christian School Norman Gardens 16 13 11 10
Average score of the school 370 357 354 374 354 466 439 468 487 467 533 470 557 516 539 512 510 541 511 539
Percentage (%) of students at or above NMS 92% 100% 93% 93% 100% 85% 92% 92% 100% 92% 100% 73% 100% 82% 100% 70% 90% 90% 70% 100%
Linville State School Linville 3 8 2 –
Average score of the school ∧ ∧ ∧ ∧ ∧ 520 459 466 495 502 ∧ ∧ ∧ ∧ ∧ – – – – –
Percentage (%) of students at or above NMS ∧ ∧ ∧ ∧ ∧ 100% 100% 80% 100% 80% ∧ ∧ ∧ ∧ ∧ – – – – –
Living Faith Lutheran Primary School Murrumba Downs 80 77 – –
Average score of the school 426 402 401 423 394 524 482 507 528 498 – – – – – – – – – –
Percentage (%) of students at or above NMS 100% 99% 95% 99% 99% 99% 93% 95% 97% 99% – – – – – – – – – –
Livingstone Christian College Ormeau 90 85 64 58
Average score of the school 386 378 395 399 364 482 467 490 479 463 529 511 544 526 526 554 539 563 555 548
Percentage (%) of students at or above NMS 92% 93% 94% 98% 94% 99% 95% 100% 98% 95% 100% 97% 98% 92% 98% 88% 70% 82% 86% 93%
Lochington State School via Springsure 1 – – –
Average score of the school ∧ ∧ ∧ ∧ ∧ – – – – – – – – – – – – – – –
Percentage (%) of students at or above NMS ∧ ∧ ∧ ∧ ∧ – – – – – – – – – – – – – – –
Lockhart State School Lockhart 20 17 8 3
Average score of the school 258 297 283 249 261 324 241 352 350 336 445 378 460 414 451 ∗ ∧ ∧ ∧ ∧Percentage (%) of students at or above NMS 28% 67% 61% 50% 47% 13% 0% 44% 31% 23% 67% 67% 67% 33% 83% ∗ ∧ ∧ ∧ ∧
Lockrose State School Lockrose 2 9 6 –
Average score of the school ∧ ∧ ∧ ∧ ∧ 442 397 488 452 431 493 494 485 497 476 – – – – –
Percentage (%) of students at or above NMS ∧ ∧ ∧ ∧ ∧ 78% 56% 100% 78% 89% 100% 100% 100% 100% 83% – – – – –
Lockyer District State High School Gatton – – – 218
Average score of the school – – – – – – – – – – – – – – – 559 506 568 548 563
Percentage (%) of students at or above NMS – – – – – – – – – – – – – – – 92% 61% 88% 82% 93%
KEY∧ to maintain privacy of individual student information, where there are fewer than five students tested results are not provided∗ no students in the year level sat the test due to absence, exemption or withdrawal– no students in the year levelNMS National Minimum Standard (for further information see www.nap.edu.au)
Queensland Curriculum & Assessment Authority
Page 66 of 149
NAPLAN 2014 Outcomes — All Queensland schools

Year level enrolments Year 3 Year 5 Year 7 Year 9
School Locality Yr 3 Yr 5 Yr 7 Yr 9 READ WRIT SPEL GP NMCY READ WRIT SPEL GP NMCY READ WRIT SPEL GP NMCY READ WRIT SPEL GP NMCY
Logan City Special School Logan Central 11 9 5 8
Average score of the school ∗ ∗ ∗ ∗ ∗ ∗ ∗ ∗ ∗ ∗ ∗ ∗ ∗ ∗ ∗ ∗ ∗ ∗ ∗ ∗Percentage (%) of students at or above NMS ∗ ∗ ∗ ∗ ∗ ∗ ∗ ∗ ∗ ∗ ∗ ∗ ∗ ∗ ∗ ∗ ∗ ∗ ∗ ∗
Logan Reserve State School Logan Reserve 56 45 33 –
Average score of the school 411 395 432 417 393 507 465 503 507 480 509 476 500 496 480 – – – – –
Percentage (%) of students at or above NMS 94% 96% 98% 87% 98% 93% 91% 95% 95% 98% 94% 79% 88% 88% 84% – – – – –
Logan Village State School Logan Village 79 83 41 –
Average score of the school 383 359 371 401 390 493 459 485 501 477 537 511 522 525 540 – – – – –
Percentage (%) of students at or above NMS 93% 94% 87% 92% 96% 97% 95% 91% 96% 96% 97% 86% 92% 94% 100% – – – – –
Loganholme State School Loganholme 83 73 24 –
Average score of the school 410 388 404 424 407 491 427 488 495 501 514 490 530 521 549 – – – – –
Percentage (%) of students at or above NMS 99% 99% 97% 100% 100% 90% 75% 93% 94% 96% 95% 86% 86% 86% 95% – – – – –
Loganlea State High School Loganlea – – – 104
Average score of the school – – – – – – – – – – – – – – – 523 478 525 518 537
Percentage (%) of students at or above NMS – – – – – – – – – – – – – – – 81% 54% 74% 71% 92%
Longreach School of Distance Education Longreach 24 13 8 7
Average score of the school 395 385 381 408 405 465 427 436 453 439 550 499 510 551 549 ∧ ∧ ∧ ∧ ∧Percentage (%) of students at or above NMS 81% 95% 95% 90% 100% 82% 82% 82% 82% 82% 100% 75% 100% 88% 100% ∧ ∧ ∧ ∧ ∧
Longreach State High School Longreach – – – 42
Average score of the school – – – – – – – – – – – – – – – 553 533 563 545 550
Percentage (%) of students at or above NMS – – – – – – – – – – – – – – – 87% 71% 87% 87% 95%
Longreach State School Longreach 34 45 17 –
Average score of the school 399 399 394 434 399 503 456 473 509 470 537 510 506 531 513 – – – – –
Percentage (%) of students at or above NMS 85% 100% 91% 97% 97% 88% 79% 81% 86% 82% 100% 100% 88% 94% 94% – – – – –
Loreto College Coorparoo Coorparoo – – – 135
Average score of the school – – – – – – – – – – – – – – – 612 609 617 621 615
Percentage (%) of students at or above NMS – – – – – – – – – – – – – – – 99% 99% 100% 98% 100%
Lota State School Lota 36 15 13 –
Average score of the school 407 373 407 404 373 517 440 502 514 463 536 518 556 556 522 – – – – –
Percentage (%) of students at or above NMS 97% 94% 100% 94% 100% 93% 100% 100% 100% 80% 75% 82% 82% 82% 83% – – – – –
Lourdes Hill College Hawthorne – – – 211
Average score of the school – – – – – – – – – – – – – – – 616 603 607 615 606
Percentage (%) of students at or above NMS – – – – – – – – – – – – – – – 99% 97% 98% 98% 100%
Lower Tully State School Lower Tully 8 11 6 –
Average score of the school 397 422 411 385 417 497 457 478 481 476 503 478 524 491 469 – – – – –
Percentage (%) of students at or above NMS 100% 100% 100% 100% 100% 91% 91% 91% 91% 91% 83% 83% 100% 67% 83% – – – – –
KEY∧ to maintain privacy of individual student information, where there are fewer than five students tested results are not provided∗ no students in the year level sat the test due to absence, exemption or withdrawal– no students in the year levelNMS National Minimum Standard (for further information see www.nap.edu.au)
Queensland Curriculum & Assessment Authority
Page 67 of 149
NAPLAN 2014 Outcomes — All Queensland schools

Year level enrolments Year 3 Year 5 Year 7 Year 9
School Locality Yr 3 Yr 5 Yr 7 Yr 9 READ WRIT SPEL GP NMCY READ WRIT SPEL GP NMCY READ WRIT SPEL GP NMCY READ WRIT SPEL GP NMCY
Lowmead State School Lowmead 1 – – –
Average score of the school ∗ ∗ ∗ ∗ ∗ – – – – – – – – – – – – – – –
Percentage (%) of students at or above NMS ∗ ∗ ∗ ∗ ∗ – – – – – – – – – – – – – – –
Lowood State High School Lowood – – – 105
Average score of the school – – – – – – – – – – – – – – – 528 488 515 525 543
Percentage (%) of students at or above NMS – – – – – – – – – – – – – – – 72% 52% 69% 76% 90%
Lowood State School Lowood 39 46 32 –
Average score of the school 323 303 315 307 324 418 355 433 414 409 476 406 453 469 479 – – – – –
Percentage (%) of students at or above NMS 69% 76% 78% 68% 73% 65% 50% 76% 66% 67% 68% 52% 59% 66% 66% – – – – –
Lundavra State School via Goondiwindi 1 4 1 –
Average score of the school ∧ ∧ ∧ ∧ ∧ ∧ ∧ ∧ ∧ ∧ ∧ ∧ ∧ ∧ ∧ – – – – –
Percentage (%) of students at or above NMS ∧ ∧ ∧ ∧ ∧ ∧ ∧ ∧ ∧ ∧ ∧ ∧ ∧ ∧ ∧ – – – – –
Lutheran Ormeau Rivers District School Ormeau 26 26 13 32
Average score of the school 451 461 424 441 398 502 479 506 500 481 521 536 543 532 499 604 588 612 615 597
Percentage (%) of students at or above NMS 100% 100% 100% 100% 100% 92% 100% 100% 100% 100% 100% 100% 100% 100% 100% 100% 96% 96% 100% 100%
Ma Ma Creek State School Ma Ma Creek via Grantham 1 2 1 –
Average score of the school ∧ ∧ ∧ ∧ ∧ ∧ ∧ ∧ ∧ ∧ ∧ ∧ ∧ ∧ ∧ – – – – –
Percentage (%) of students at or above NMS ∧ ∧ ∧ ∧ ∧ ∧ ∧ ∧ ∧ ∧ ∧ ∧ ∧ ∧ ∧ – – – – –
Mabel Park State High School Slacks Creek – – – 101
Average score of the school – – – – – – – – – – – – – – – 537 503 542 529 531
Percentage (%) of students at or above NMS – – – – – – – – – – – – – – – 82% 58% 78% 73% 87%
Mabel Park State School Slacks Creek 96 95 45 –
Average score of the school 356 351 371 361 347 455 434 467 459 441 494 470 498 491 487 – – – – –
Percentage (%) of students at or above NMS 88% 85% 94% 89% 91% 89% 85% 90% 78% 84% 91% 70% 86% 79% 88% – – – – –
Mabuiag Island State School via Thursday Island 9 4 9 –
Average score of the school 278 304 283 281 280 ∧ ∧ ∧ ∧ ∧ 432 446 475 437 460 – – – – –
Percentage (%) of students at or above NMS 44% 78% 67% 56% 67% ∧ ∧ ∧ ∧ ∧ 56% 56% 67% 44% 89% – – – – –
MacGregor State High School Macgregor – – – 277
Average score of the school – – – – – – – – – – – – – – – 567 552 586 567 584
Percentage (%) of students at or above NMS – – – – – – – – – – – – – – – 87% 79% 86% 87% 95%
MacGregor State School Macgregor 172 178 87 –
Average score of the school 452 432 487 504 449 527 499 547 577 540 593 557 598 616 619 – – – – –
Percentage (%) of students at or above NMS 96% 95% 96% 97% 97% 96% 95% 97% 98% 98% 98% 94% 96% 95% 98% – – – – –
KEY∧ to maintain privacy of individual student information, where there are fewer than five students tested results are not provided∗ no students in the year level sat the test due to absence, exemption or withdrawal– no students in the year levelNMS National Minimum Standard (for further information see www.nap.edu.au)
Queensland Curriculum & Assessment Authority
Page 68 of 149
NAPLAN 2014 Outcomes — All Queensland schools

Year level enrolments Year 3 Year 5 Year 7 Year 9
School Locality Yr 3 Yr 5 Yr 7 Yr 9 READ WRIT SPEL GP NMCY READ WRIT SPEL GP NMCY READ WRIT SPEL GP NMCY READ WRIT SPEL GP NMCY
MacKillop Catholic Primary School
(Andergrove)
Andergrove 36 30 16 –
Average score of the school 438 441 424 440 414 497 457 477 475 480 500 496 531 525 533 – – – – –
Percentage (%) of students at or above NMS 100% 100% 100% 100% 97% 93% 90% 90% 100% 97% 87% 80% 93% 93% 100% – – – – –
MacLeay Island State School Macleay Island 23 27 13 –
Average score of the school 372 375 362 381 343 437 391 446 466 438 499 417 512 493 510 – – – – –
Percentage (%) of students at or above NMS 81% 94% 88% 100% 88% 84% 58% 73% 88% 88% 92% 58% 83% 92% 100% – – – – –
Machans Beach State School Machans Beach 16 6 7 –
Average score of the school 373 431 433 397 353 501 466 536 506 481 522 497 530 528 532 – – – – –
Percentage (%) of students at or above NMS 100% 93% 100% 93% 93% 83% 83% 83% 83% 67% 100% 100% 100% 100% 100% – – – – –
Mackay Central State School Mackay 35 28 23 –
Average score of the school 376 372 391 379 354 467 438 481 486 476 499 472 537 495 526 – – – – –
Percentage (%) of students at or above NMS 91% 100% 91% 88% 97% 92% 92% 92% 92% 96% 100% 91% 86% 82% 95% – – – – –
Mackay Christian College North Mackay 49 65 36 94
Average score of the school 396 370 391 403 393 477 424 465 471 461 559 501 542 537 557 557 524 555 546 567
Percentage (%) of students at or above NMS 91% 93% 95% 98% 98% 92% 83% 92% 95% 89% 100% 100% 100% 91% 100% 85% 73% 91% 84% 97%
Mackay District Special School Mackay 4 8 6 8
Average score of the school ∗ ∗ ∗ ∗ ∗ ∗ ∗ ∗ ∗ ∗ ∗ ∗ ∗ ∗ ∗ ∗ ∗ ∗ ∗ ∗Percentage (%) of students at or above NMS ∗ ∗ ∗ ∗ ∗ ∗ ∗ ∗ ∗ ∗ ∗ ∗ ∗ ∗ ∗ ∗ ∗ ∗ ∗ ∗
Mackay North State High School North Mackay – – – 291
Average score of the school – – – – – – – – – – – – – – – 571 531 569 563 590
Percentage (%) of students at or above NMS – – – – – – – – – – – – – – – 88% 73% 88% 84% 95%
Mackay North State School North Mackay 59 43 27 –
Average score of the school 370 403 363 390 366 464 435 463 470 472 547 509 560 558 559 – – – – –
Percentage (%) of students at or above NMS 89% 100% 89% 89% 96% 95% 87% 87% 74% 95% 100% 92% 100% 100% 100% – – – – –
Mackay Northern Beaches State High School Rural View – – 89 136
Average score of the school – – – – – – – – – – 529 482 518 514 520 547 518 558 552 559
Percentage (%) of students at or above NMS – – – – – – – – – – 92% 80% 90% 87% 96% 83% 63% 90% 81% 98%
Mackay State High School Mackay – – – 201
Average score of the school – – – – – – – – – – – – – – – 569 546 579 556 580
Percentage (%) of students at or above NMS – – – – – – – – – – – – – – – 92% 85% 97% 89% 97%
Mackay West State School Mackay West 114 92 63 –
Average score of the school 379 378 368 389 374 494 463 480 500 494 539 486 543 537 546 – – – – –
Percentage (%) of students at or above NMS 84% 92% 83% 92% 93% 93% 91% 89% 93% 95% 95% 80% 90% 92% 95% – – – – –
KEY∧ to maintain privacy of individual student information, where there are fewer than five students tested results are not provided∗ no students in the year level sat the test due to absence, exemption or withdrawal– no students in the year levelNMS National Minimum Standard (for further information see www.nap.edu.au)
Queensland Curriculum & Assessment Authority
Page 69 of 149
NAPLAN 2014 Outcomes — All Queensland schools

Year level enrolments Year 3 Year 5 Year 7 Year 9
School Locality Yr 3 Yr 5 Yr 7 Yr 9 READ WRIT SPEL GP NMCY READ WRIT SPEL GP NMCY READ WRIT SPEL GP NMCY READ WRIT SPEL GP NMCY
Mackenzie River State School Mackenzie River via Dingo 2 4 1 –
Average score of the school ∧ ∧ ∧ ∧ ∧ ∧ ∧ ∧ ∧ ∧ ∧ ∧ ∧ ∧ ∧ – – – – –
Percentage (%) of students at or above NMS ∧ ∧ ∧ ∧ ∧ ∧ ∧ ∧ ∧ ∧ ∧ ∧ ∧ ∧ ∧ – – – – –
Mackenzie State Primary and Special School Mackenzie 5 6 7 6
Average score of the school ∗ ∗ ∗ ∗ ∗ ∗ ∗ ∗ ∗ ∗ ∗ ∗ ∗ ∗ ∗ ∗ ∗ ∗ ∗ ∗Percentage (%) of students at or above NMS ∗ ∗ ∗ ∗ ∗ ∗ ∗ ∗ ∗ ∗ ∗ ∗ ∗ ∗ ∗ ∗ ∗ ∗ ∗ ∗
Mackenzie State Primary and Special School
(Primary)
Mackenzie 10 2 8 –
Average score of the school 458 379 369 401 383 ∧ ∧ ∧ ∧ ∧ 576 476 524 549 590 – – – – –
Percentage (%) of students at or above NMS 89% 100% 90% 100% 100% ∧ ∧ ∧ ∧ ∧ 88% 75% 88% 100% 100% – – – – –
Macknade State School Macknade via Ingham 3 6 3 –
Average score of the school ∧ ∧ ∧ ∧ ∧ 484 475 483 505 477 ∧ ∧ ∧ ∧ ∧ – – – – –
Percentage (%) of students at or above NMS ∧ ∧ ∧ ∧ ∧ 100% 100% 100% 100% 100% ∧ ∧ ∧ ∧ ∧ – – – – –
Magnetic Island State School Nelly Bay 26 20 22 –
Average score of the school 387 374 374 394 376 521 457 489 497 487 552 528 578 537 560 – – – – –
Percentage (%) of students at or above NMS 79% 100% 88% 92% 92% 100% 90% 90% 95% 90% 100% 100% 100% 95% 100% – – – – –
Maidavale State School via Ayr 2 1 3 –
Average score of the school ∧ ∧ ∧ ∧ ∧ ∧ ∧ ∧ ∧ ∧ ∧ ∧ ∧ ∧ ∧ – – – – –
Percentage (%) of students at or above NMS ∧ ∧ ∧ ∧ ∧ ∧ ∧ ∧ ∧ ∧ ∧ ∧ ∧ ∧ ∧ – – – – –
Malanda State High School Malanda – – – 81
Average score of the school – – – – – – – – – – – – – – – 587 556 575 578 590
Percentage (%) of students at or above NMS – – – – – – – – – – – – – – – 94% 75% 89% 88% 96%
Malanda State School Malanda 40 49 26 –
Average score of the school 407 366 377 400 399 496 441 490 499 471 589 540 572 593 578 – – – – –
Percentage (%) of students at or above NMS 95% 95% 98% 100% 98% 91% 85% 98% 89% 89% 96% 91% 91% 96% 96% – – – – –
Maleny State High School Maleny – – – 154
Average score of the school – – – – – – – – – – – – – – – 581 536 577 577 577
Percentage (%) of students at or above NMS – – – – – – – – – – – – – – – 90% 80% 92% 87% 95%
Maleny State School Maleny 61 61 42 –
Average score of the school 404 359 376 424 387 513 435 471 490 510 570 510 549 563 544 – – – – –
Percentage (%) of students at or above NMS 88% 88% 89% 93% 100% 96% 84% 88% 92% 94% 92% 87% 95% 90% 92% – – – – –
Malu Kiwai State School via Thursday Island 6 2 2 –
Average score of the school 297 283 342 308 276 ∧ ∧ ∧ ∧ ∧ ∧ ∧ ∧ ∧ ∧ – – – – –
Percentage (%) of students at or above NMS 50% 50% 67% 50% 50% ∧ ∧ ∧ ∧ ∧ ∧ ∧ ∧ ∧ ∧ – – – – –
KEY∧ to maintain privacy of individual student information, where there are fewer than five students tested results are not provided∗ no students in the year level sat the test due to absence, exemption or withdrawal– no students in the year levelNMS National Minimum Standard (for further information see www.nap.edu.au)
Queensland Curriculum & Assessment Authority
Page 70 of 149
NAPLAN 2014 Outcomes — All Queensland schools

Year level enrolments Year 3 Year 5 Year 7 Year 9
School Locality Yr 3 Yr 5 Yr 7 Yr 9 READ WRIT SPEL GP NMCY READ WRIT SPEL GP NMCY READ WRIT SPEL GP NMCY READ WRIT SPEL GP NMCY
Mango Hill State School Mango Hill 53 69 21 –
Average score of the school 416 396 402 429 394 499 445 486 500 483 539 489 533 526 518 – – – – –
Percentage (%) of students at or above NMS 96% 100% 98% 94% 100% 98% 84% 95% 93% 98% 100% 84% 100% 89% 94% – – – – –
Manly State School Manly 96 69 45 –
Average score of the school 474 415 444 478 448 522 455 490 526 504 595 539 565 605 591 – – – – –
Percentage (%) of students at or above NMS 100% 98% 99% 99% 100% 95% 89% 95% 98% 97% 100% 96% 98% 98% 100% – – – – –
Manly West State School Manly West 65 60 33 –
Average score of the school 422 385 400 411 389 502 427 467 500 476 545 482 522 524 524 – – – – –
Percentage (%) of students at or above NMS 94% 97% 95% 94% 95% 100% 81% 90% 97% 91% 97% 82% 88% 94% 97% – – – – –
Mansfield State High School Mansfield – – – 376
Average score of the school – – – – – – – – – – – – – – – 612 593 622 623 638
Percentage (%) of students at or above NMS – – – – – – – – – – – – – – – 98% 95% 99% 97% 99%
Mansfield State School Mansfield 110 129 64 –
Average score of the school 428 402 419 453 416 521 479 517 536 508 558 524 559 556 579 – – – – –
Percentage (%) of students at or above NMS 96% 97% 96% 96% 97% 98% 95% 99% 98% 99% 100% 97% 94% 94% 98% – – – – –
Mapleton State School Mapleton via Nambour 15 23 17 –
Average score of the school 447 393 444 442 500 544 465 510 515 512 545 537 528 563 548 – – – – –
Percentage (%) of students at or above NMS 100% 100% 100% 100% 100% 100% 100% 100% 100% 100% 100% 100% 100% 100% 100% – – – – –
Marburg State School Marburg 4 10 4 –
Average score of the school ∧ ∧ ∧ ∧ ∧ 471 444 478 484 454 ∧ ∧ ∧ ∧ ∧ – – – – –
Percentage (%) of students at or above NMS ∧ ∧ ∧ ∧ ∧ 89% 100% 100% 100% 100% ∧ ∧ ∧ ∧ ∧ – – – – –
Mareeba State High School Mareeba – – – 125
Average score of the school – – – – – – – – – – – – – – – 534 485 535 525 554
Percentage (%) of students at or above NMS – – – – – – – – – – – – – – – 70% 61% 75% 71% 87%
Mareeba State School Mareeba 93 93 76 –
Average score of the school 394 390 388 413 381 459 437 462 458 442 500 458 493 489 503 – – – – –
Percentage (%) of students at or above NMS 89% 95% 91% 91% 94% 82% 80% 81% 79% 81% 83% 66% 82% 75% 85% – – – – –
Marian Catholic School Currajong 53 53 27 –
Average score of the school 424 395 398 433 395 521 474 504 505 478 552 503 528 536 556 – – – – –
Percentage (%) of students at or above NMS 96% 98% 98% 98% 100% 100% 90% 98% 100% 98% 96% 85% 81% 85% 100% – – – – –
Marian State School Marian 86 70 41 –
Average score of the school 411 397 423 426 394 487 435 478 490 476 538 522 542 541 550 – – – – –
Percentage (%) of students at or above NMS 94% 88% 93% 94% 94% 87% 84% 92% 95% 92% 92% 89% 92% 89% 95% – – – – –
Marist College Ashgrove Ashgrove – 121 144 239
Average score of the school – – – – – 540 470 516 526 530 567 510 556 553 573 594 544 587 584 605
Percentage (%) of students at or above NMS – – – – – 98% 96% 100% 98% 98% 98% 96% 99% 97% 99% 96% 81% 92% 92% 98%
KEY∧ to maintain privacy of individual student information, where there are fewer than five students tested results are not provided∗ no students in the year level sat the test due to absence, exemption or withdrawal– no students in the year levelNMS National Minimum Standard (for further information see www.nap.edu.au)
Queensland Curriculum & Assessment Authority
Page 71 of 149
NAPLAN 2014 Outcomes — All Queensland schools
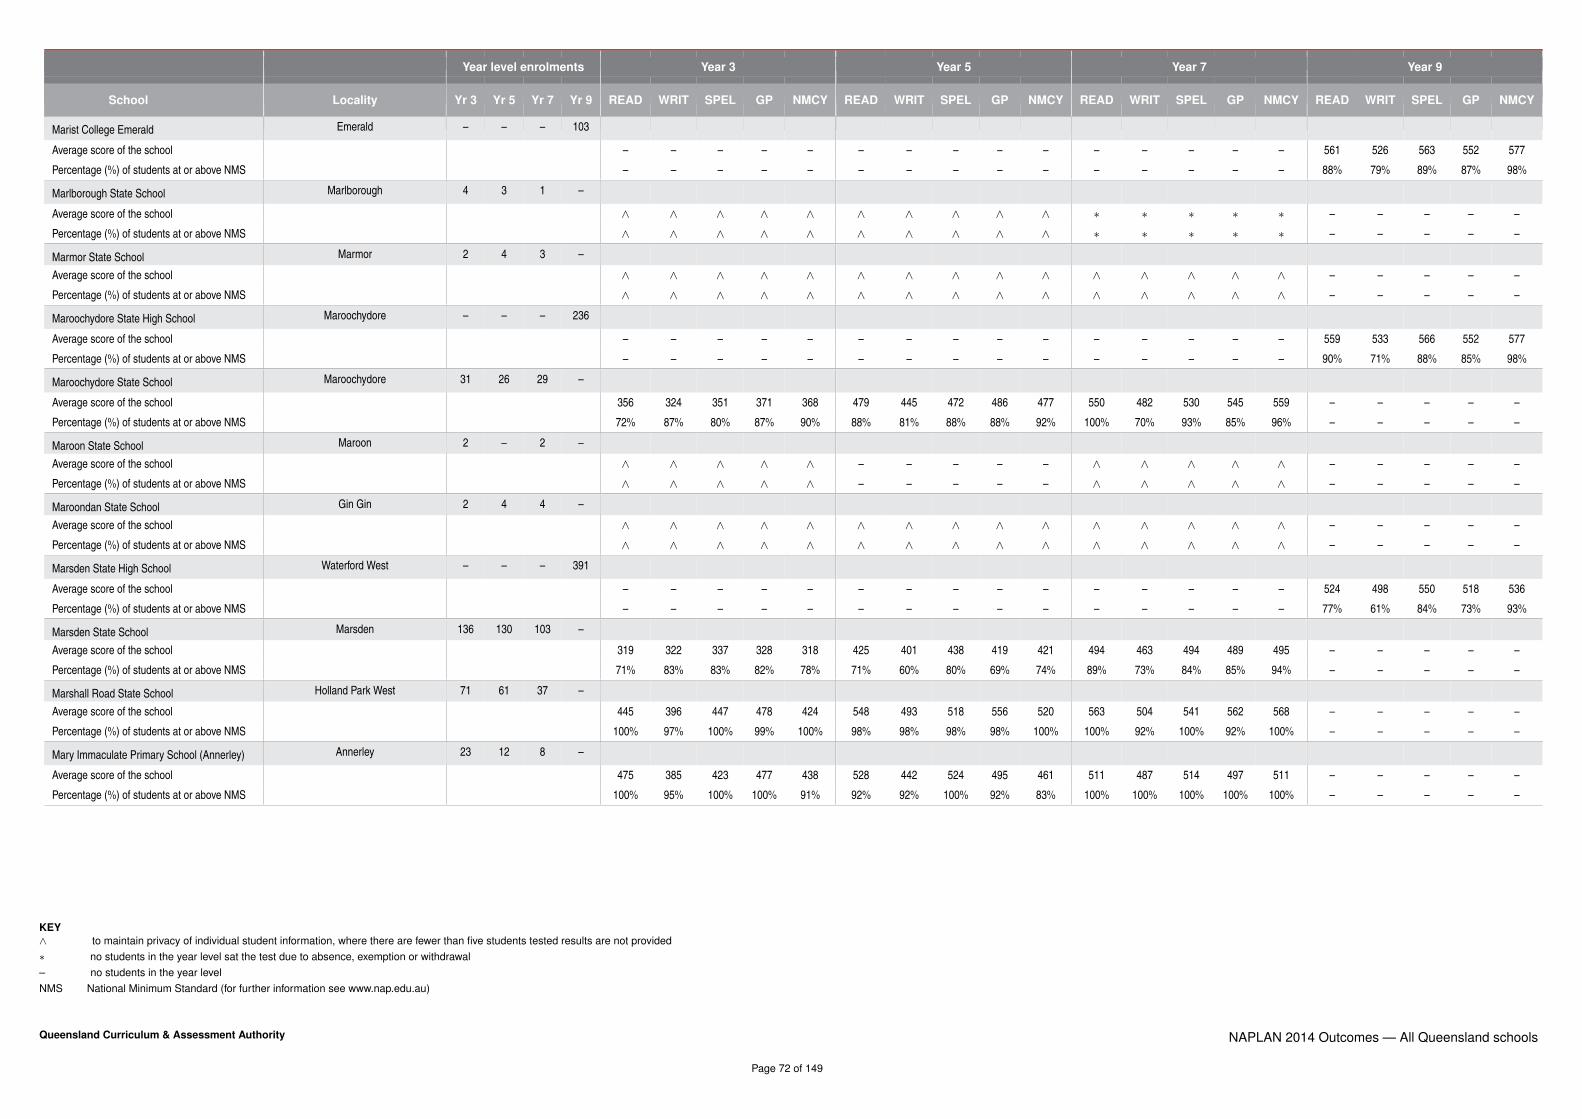
Year level enrolments Year 3 Year 5 Year 7 Year 9
School Locality Yr 3 Yr 5 Yr 7 Yr 9 READ WRIT SPEL GP NMCY READ WRIT SPEL GP NMCY READ WRIT SPEL GP NMCY READ WRIT SPEL GP NMCY
Marist College Emerald Emerald – – – 103
Average score of the school – – – – – – – – – – – – – – – 561 526 563 552 577
Percentage (%) of students at or above NMS – – – – – – – – – – – – – – – 88% 79% 89% 87% 98%
Marlborough State School Marlborough 4 3 1 –
Average score of the school ∧ ∧ ∧ ∧ ∧ ∧ ∧ ∧ ∧ ∧ ∗ ∗ ∗ ∗ ∗ – – – – –
Percentage (%) of students at or above NMS ∧ ∧ ∧ ∧ ∧ ∧ ∧ ∧ ∧ ∧ ∗ ∗ ∗ ∗ ∗ – – – – –
Marmor State School Marmor 2 4 3 –
Average score of the school ∧ ∧ ∧ ∧ ∧ ∧ ∧ ∧ ∧ ∧ ∧ ∧ ∧ ∧ ∧ – – – – –
Percentage (%) of students at or above NMS ∧ ∧ ∧ ∧ ∧ ∧ ∧ ∧ ∧ ∧ ∧ ∧ ∧ ∧ ∧ – – – – –
Maroochydore State High School Maroochydore – – – 236
Average score of the school – – – – – – – – – – – – – – – 559 533 566 552 577
Percentage (%) of students at or above NMS – – – – – – – – – – – – – – – 90% 71% 88% 85% 98%
Maroochydore State School Maroochydore 31 26 29 –
Average score of the school 356 324 351 371 368 479 445 472 486 477 550 482 530 545 559 – – – – –
Percentage (%) of students at or above NMS 72% 87% 80% 87% 90% 88% 81% 88% 88% 92% 100% 70% 93% 85% 96% – – – – –
Maroon State School Maroon 2 – 2 –
Average score of the school ∧ ∧ ∧ ∧ ∧ – – – – – ∧ ∧ ∧ ∧ ∧ – – – – –
Percentage (%) of students at or above NMS ∧ ∧ ∧ ∧ ∧ – – – – – ∧ ∧ ∧ ∧ ∧ – – – – –
Maroondan State School Gin Gin 2 4 4 –
Average score of the school ∧ ∧ ∧ ∧ ∧ ∧ ∧ ∧ ∧ ∧ ∧ ∧ ∧ ∧ ∧ – – – – –
Percentage (%) of students at or above NMS ∧ ∧ ∧ ∧ ∧ ∧ ∧ ∧ ∧ ∧ ∧ ∧ ∧ ∧ ∧ – – – – –
Marsden State High School Waterford West – – – 391
Average score of the school – – – – – – – – – – – – – – – 524 498 550 518 536
Percentage (%) of students at or above NMS – – – – – – – – – – – – – – – 77% 61% 84% 73% 93%
Marsden State School Marsden 136 130 103 –
Average score of the school 319 322 337 328 318 425 401 438 419 421 494 463 494 489 495 – – – – –
Percentage (%) of students at or above NMS 71% 83% 83% 82% 78% 71% 60% 80% 69% 74% 89% 73% 84% 85% 94% – – – – –
Marshall Road State School Holland Park West 71 61 37 –
Average score of the school 445 396 447 478 424 548 493 518 556 520 563 504 541 562 568 – – – – –
Percentage (%) of students at or above NMS 100% 97% 100% 99% 100% 98% 98% 98% 98% 100% 100% 92% 100% 92% 100% – – – – –
Mary Immaculate Primary School (Annerley) Annerley 23 12 8 –
Average score of the school 475 385 423 477 438 528 442 524 495 461 511 487 514 497 511 – – – – –
Percentage (%) of students at or above NMS 100% 95% 100% 100% 91% 92% 92% 100% 92% 83% 100% 100% 100% 100% 100% – – – – –
KEY∧ to maintain privacy of individual student information, where there are fewer than five students tested results are not provided∗ no students in the year level sat the test due to absence, exemption or withdrawal– no students in the year levelNMS National Minimum Standard (for further information see www.nap.edu.au)
Queensland Curriculum & Assessment Authority
Page 72 of 149
NAPLAN 2014 Outcomes — All Queensland schools

Year level enrolments Year 3 Year 5 Year 7 Year 9
School Locality Yr 3 Yr 5 Yr 7 Yr 9 READ WRIT SPEL GP NMCY READ WRIT SPEL GP NMCY READ WRIT SPEL GP NMCY READ WRIT SPEL GP NMCY
Mary MacKillop Catholic Parish Primary
School (Birkdale)
Birkdale 81 72 65 –
Average score of the school 444 418 411 445 408 517 485 497 519 504 556 536 536 533 549 – – – – –
Percentage (%) of students at or above NMS 100% 100% 99% 100% 99% 100% 99% 96% 99% 100% 98% 98% 93% 97% 100% – – – – –
Mary MacKillop Catholic School Highfields 65 64 45 –
Average score of the school 446 431 405 480 434 521 487 498 532 518 566 538 542 572 580 – – – – –
Percentage (%) of students at or above NMS 98% 98% 94% 98% 98% 98% 97% 95% 98% 98% 100% 98% 98% 100% 100% – – – – –
Mary MacKillop College Nundah – – – 86
Average score of the school – – – – – – – – – – – – – – – 603 564 599 603 591
Percentage (%) of students at or above NMS – – – – – – – – – – – – – – – 100% 93% 97% 100% 100%
Mary Valley State College Imbil 18 23 8 8
Average score of the school 362 322 327 359 346 481 352 450 454 457 545 484 521 542 539 568 455 515 566 575
Percentage (%) of students at or above NMS 94% 76% 76% 94% 88% 91% 52% 78% 83% 91% 86% 86% 86% 100% 100% 86% 50% 75% 88% 100%
Maryborough Central State School Maryborough 48 40 39 –
Average score of the school 356 333 359 350 356 453 404 446 464 437 511 448 500 505 485 – – – – –
Percentage (%) of students at or above NMS 75% 81% 81% 75% 88% 78% 71% 75% 75% 87% 89% 66% 76% 74% 82% – – – – –
Maryborough Special School Maryborough 4 4 5 8
Average score of the school ∗ ∗ ∗ ∗ ∗ ∗ ∗ ∗ ∗ ∗ ∗ ∗ ∗ ∗ ∗ ∗ ∗ ∗ ∗ ∗Percentage (%) of students at or above NMS ∗ ∗ ∗ ∗ ∗ ∗ ∗ ∗ ∗ ∗ ∗ ∗ ∗ ∗ ∗ ∗ ∗ ∗ ∗ ∗
Maryborough State High School Maryborough – – – 153
Average score of the school – – – – – – – – – – – – – – – 544 515 553 550 563
Percentage (%) of students at or above NMS – – – – – – – – – – – – – – – 83% 70% 86% 80% 96%
Maryborough West State School Maryborough 63 80 41 –
Average score of the school 368 358 379 385 369 477 425 468 473 462 531 504 519 535 530 – – – – –
Percentage (%) of students at or above NMS 73% 84% 85% 88% 90% 86% 74% 81% 76% 82% 92% 84% 84% 89% 95% – – – – –
Marymount College Burleigh Waters – – – 234
Average score of the school – – – – – – – – – – – – – – – 577 567 581 572 598
Percentage (%) of students at or above NMS – – – – – – – – – – – – – – – 96% 88% 96% 92% 100%
Marymount Primary School (Burleigh Heads) Burleigh Waters 124 136 90 –
Average score of the school 439 422 426 459 419 523 478 507 535 503 542 537 541 543 556 – – – – –
Percentage (%) of students at or above NMS 99% 97% 99% 98% 99% 98% 95% 98% 98% 97% 94% 91% 94% 94% 94% – – – – –
Maryvale State School Maryvale via Warwick – 1 2 –
Average score of the school – – – – – ∗ ∗ ∗ ∗ ∗ ∧ ∧ ∧ ∧ ∧ – – – – –
Percentage (%) of students at or above NMS – – – – – ∗ ∗ ∗ ∗ ∗ ∧ ∧ ∧ ∧ ∧ – – – – –
KEY∧ to maintain privacy of individual student information, where there are fewer than five students tested results are not provided∗ no students in the year level sat the test due to absence, exemption or withdrawal– no students in the year levelNMS National Minimum Standard (for further information see www.nap.edu.au)
Queensland Curriculum & Assessment Authority
Page 73 of 149
NAPLAN 2014 Outcomes — All Queensland schools

Year level enrolments Year 3 Year 5 Year 7 Year 9
School Locality Yr 3 Yr 5 Yr 7 Yr 9 READ WRIT SPEL GP NMCY READ WRIT SPEL GP NMCY READ WRIT SPEL GP NMCY READ WRIT SPEL GP NMCY
Mater Dei Catholic Primary School (St John’s
Wood)
Ashgrove West 57 23 22 –
Average score of the school 454 429 445 469 428 540 491 509 548 506 581 553 561 577 589 – – – – –
Percentage (%) of students at or above NMS 100% 98% 100% 100% 98% 100% 100% 100% 100% 100% 100% 100% 100% 95% 95% – – – – –
Mater Dei Primary School (Toowoomba) Toowoomba 67 49 29 –
Average score of the school 437 426 400 440 418 505 487 495 510 489 591 551 563 587 596 – – – – –
Percentage (%) of students at or above NMS 98% 100% 97% 97% 100% 96% 94% 98% 98% 91% 100% 100% 93% 100% 100% – – – – –
Matthew Flinders Anglican College Buderim 79 78 112 137
Average score of the school 483 448 446 481 441 566 518 532 569 534 593 560 573 589 591 622 577 603 622 636
Percentage (%) of students at or above NMS 100% 100% 100% 99% 100% 100% 99% 100% 100% 100% 100% 100% 99% 100% 99% 98% 91% 99% 99% 99%
Mayfield State School Carina 45 37 15 –
Average score of the school 454 415 439 466 423 523 454 499 519 500 512 480 500 496 554 – – – – –
Percentage (%) of students at or above NMS 100% 100% 100% 100% 98% 97% 89% 92% 100% 92% 93% 87% 93% 80% 93% – – – – –
McDonnell Creek State School Mcdonnell Creek via Fishery Falls 2 2 1 –
Average score of the school ∗ ∗ ∗ ∗ ∗ ∧ ∧ ∧ ∧ ∧ ∗ ∗ ∗ ∗ ∗ – – – – –
Percentage (%) of students at or above NMS ∗ ∗ ∗ ∗ ∗ ∧ ∧ ∧ ∧ ∧ ∗ ∗ ∗ ∗ ∗ – – – – –
McDowall State School Mcdowall 115 99 60 –
Average score of the school 458 447 435 487 446 534 491 529 556 521 553 537 577 573 594 – – – – –
Percentage (%) of students at or above NMS 99% 100% 100% 100% 100% 97% 96% 99% 97% 97% 98% 97% 98% 100% 100% – – – – –
McIlwraith State School Mcilwraith via Gin Gin 3 3 4 –
Average score of the school ∧ ∧ ∧ ∧ ∧ ∧ ∧ ∧ ∧ ∧ ∧ ∧ ∧ ∧ ∧ – – – – –
Percentage (%) of students at or above NMS ∧ ∧ ∧ ∧ ∧ ∧ ∧ ∧ ∧ ∧ ∧ ∧ ∧ ∧ ∧ – – – – –
Meandarra State School Meandarra 4 4 2 –
Average score of the school ∧ ∧ ∧ ∧ ∧ ∧ ∧ ∧ ∧ ∧ ∧ ∧ ∧ ∧ ∧ – – – – –
Percentage (%) of students at or above NMS ∧ ∧ ∧ ∧ ∧ ∧ ∧ ∧ ∧ ∧ ∧ ∧ ∧ ∧ ∧ – – – – –
Mena Creek State School Mena Creek 5 8 3 –
Average score of the school ∧ ∧ ∧ ∧ 345 471 458 475 452 459 ∧ ∧ ∧ ∧ ∧ – – – – –
Percentage (%) of students at or above NMS ∧ ∧ ∧ ∧ 100% 100% 86% 100% 100% 100% ∧ ∧ ∧ ∧ ∧ – – – – –
Mer State School via Thursday Island 8 10 3 –
Average score of the school 329 389 357 330 279 368 381 439 343 347 ∧ ∧ ∧ ∧ ∧ – – – – –
Percentage (%) of students at or above NMS 88% 100% 88% 100% 50% 60% 60% 100% 20% 20% ∧ ∧ ∧ ∧ ∧ – – – – –
Mercy College (Mackay) Mackay – – – 242
Average score of the school – – – – – – – – – – – – – – – 583 544 588 583 593
Percentage (%) of students at or above NMS – – – – – – – – – – – – – – – 95% 83% 96% 94% 98%
KEY∧ to maintain privacy of individual student information, where there are fewer than five students tested results are not provided∗ no students in the year level sat the test due to absence, exemption or withdrawal– no students in the year levelNMS National Minimum Standard (for further information see www.nap.edu.au)
Queensland Curriculum & Assessment Authority
Page 74 of 149
NAPLAN 2014 Outcomes — All Queensland schools

Year level enrolments Year 3 Year 5 Year 7 Year 9
School Locality Yr 3 Yr 5 Yr 7 Yr 9 READ WRIT SPEL GP NMCY READ WRIT SPEL GP NMCY READ WRIT SPEL GP NMCY READ WRIT SPEL GP NMCY
Meridan State College Caloundra 148 184 117 220
Average score of the school 422 403 411 426 402 507 476 491 520 495 527 514 530 532 530 560 540 565 549 575
Percentage (%) of students at or above NMS 97% 99% 98% 99% 99% 98% 95% 96% 100% 99% 93% 93% 92% 95% 98% 87% 80% 85% 85% 99%
Merinda State School Merinda via Bowen 11 8 4 –
Average score of the school 368 365 364 382 391 463 447 459 460 441 ∧ ∧ ∧ ∧ ∧ – – – – –
Percentage (%) of students at or above NMS 100% 100% 91% 100% 100% 88% 88% 88% 88% 88% ∧ ∧ ∧ ∧ ∧ – – – – –
Meringandan State School Meringandan 25 37 15 –
Average score of the school 386 407 405 448 395 510 467 491 506 470 575 532 547 576 583 – – – – –
Percentage (%) of students at or above NMS 92% 92% 96% 96% 96% 97% 86% 94% 100% 92% 93% 93% 93% 93% 100% – – – – –
Merrimac State High School Mermaid Waters – – – 258
Average score of the school – – – – – – – – – – – – – – – 564 538 575 561 571
Percentage (%) of students at or above NMS – – – – – – – – – – – – – – – 91% 76% 86% 85% 94%
Merrimac State School Merrimac 105 107 74 –
Average score of the school 395 370 405 414 379 508 491 523 519 504 540 529 550 542 526 – – – – –
Percentage (%) of students at or above NMS 95% 89% 99% 93% 93% 97% 93% 96% 96% 98% 94% 95% 92% 90% 93% – – – – –
Miallo State School Miallo via Mossman 26 26 12 –
Average score of the school 456 412 476 461 443 519 478 515 511 503 551 537 563 572 564 – – – – –
Percentage (%) of students at or above NMS 100% 100% 100% 100% 100% 100% 96% 100% 96% 100% 100% 100% 100% 100% 100% – – – – –
Miami State High School Miami – – – 227
Average score of the school – – – – – – – – – – – – – – – 572 573 584 574 581
Percentage (%) of students at or above NMS – – – – – – – – – – – – – – – 96% 92% 94% 91% 99%
Miami State School Mermaid Waters 118 104 77 –
Average score of the school 414 390 408 429 411 508 466 503 500 500 545 520 538 532 553 – – – – –
Percentage (%) of students at or above NMS 98% 99% 98% 98% 100% 97% 92% 94% 94% 98% 97% 93% 93% 95% 99% – – – – –
Middle Park State School Middle Park 76 81 35 –
Average score of the school 414 381 412 432 391 527 464 510 530 503 537 504 535 541 545 – – – – –
Percentage (%) of students at or above NMS 92% 96% 97% 99% 94% 97% 89% 96% 95% 97% 97% 94% 97% 94% 97% – – – – –
Middle Ridge State School Middle Ridge Toowoomba 150 114 60 –
Average score of the school 442 413 437 461 417 523 483 507 534 501 550 501 531 552 544 – – – – –
Percentage (%) of students at or above NMS 98% 98% 99% 99% 99% 96% 94% 96% 97% 97% 92% 90% 90% 92% 93% – – – – –
Middlemount Community School Middlemount 36 26 17 28
Average score of the school 417 393 424 424 399 489 453 490 519 486 513 522 530 518 572 567 543 558 543 546
Percentage (%) of students at or above NMS 100% 100% 100% 97% 97% 92% 88% 92% 96% 96% 100% 92% 100% 100% 100% 90% 80% 85% 85% 95%
Miles State High School Miles – – – 34
Average score of the school – – – – – – – – – – – – – – – 560 547 571 570 592
Percentage (%) of students at or above NMS – – – – – – – – – – – – – – – 82% 79% 88% 94% 91%
KEY∧ to maintain privacy of individual student information, where there are fewer than five students tested results are not provided∗ no students in the year level sat the test due to absence, exemption or withdrawal– no students in the year levelNMS National Minimum Standard (for further information see www.nap.edu.au)
Queensland Curriculum & Assessment Authority
Page 75 of 149
NAPLAN 2014 Outcomes — All Queensland schools
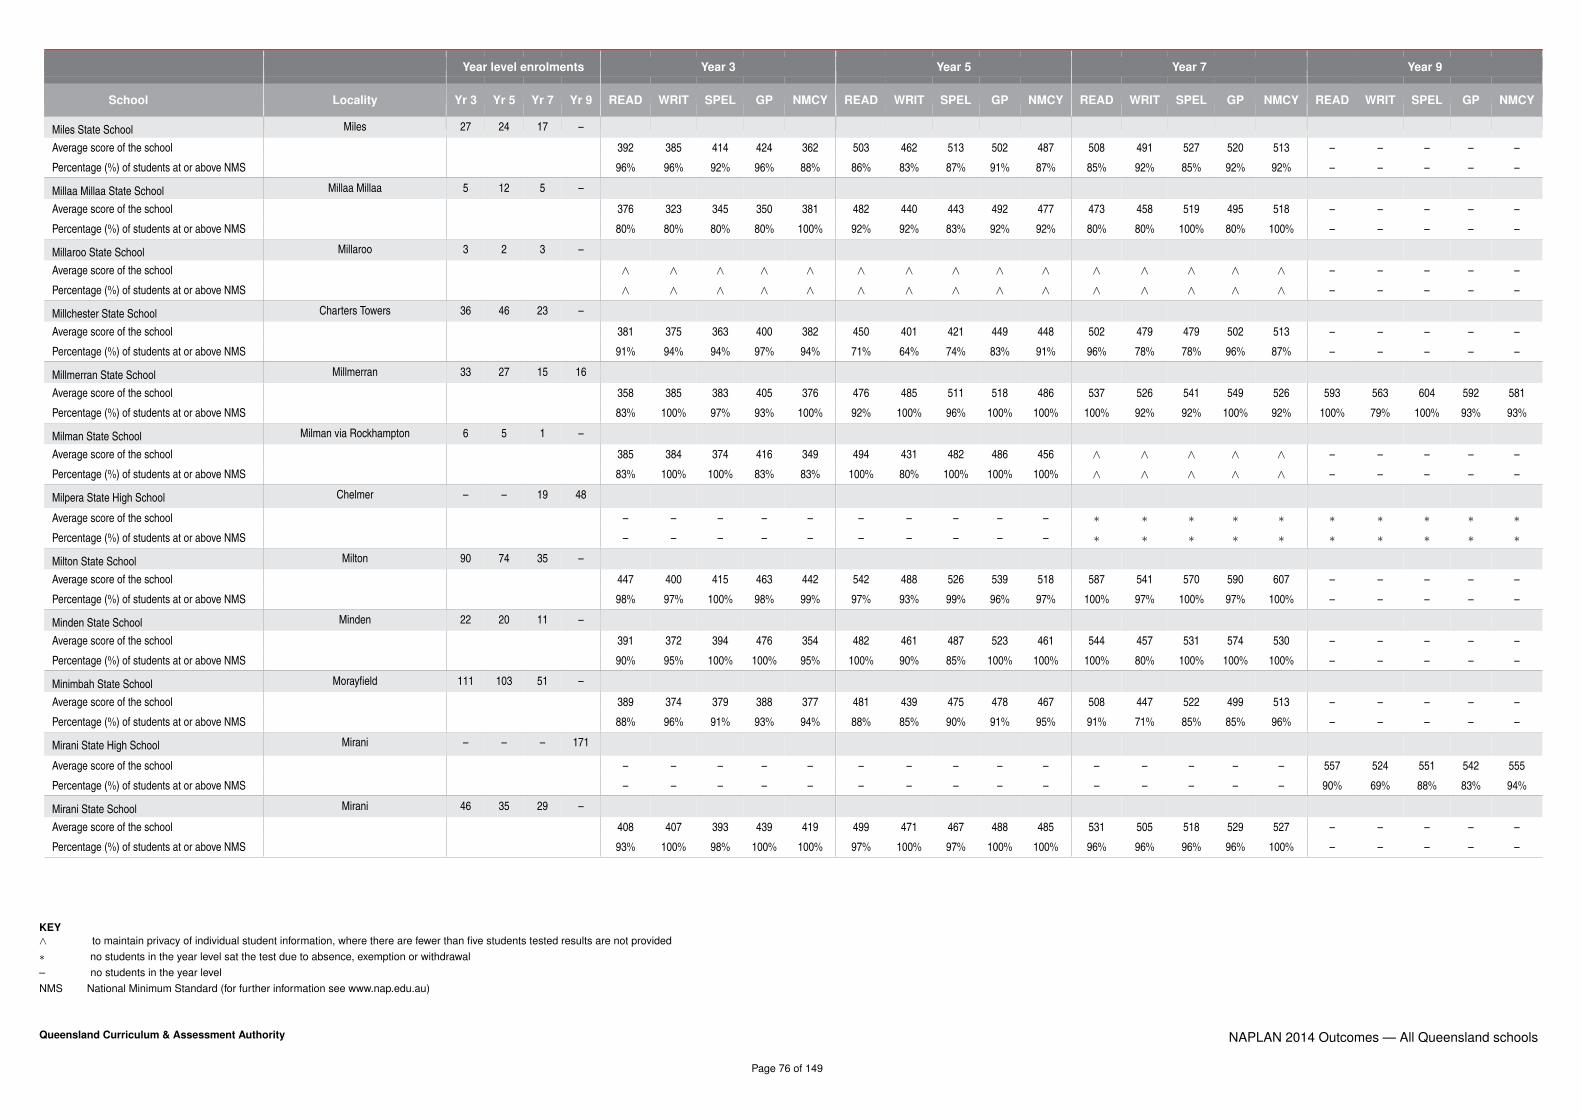
Year level enrolments Year 3 Year 5 Year 7 Year 9
School Locality Yr 3 Yr 5 Yr 7 Yr 9 READ WRIT SPEL GP NMCY READ WRIT SPEL GP NMCY READ WRIT SPEL GP NMCY READ WRIT SPEL GP NMCY
Miles State School Miles 27 24 17 –
Average score of the school 392 385 414 424 362 503 462 513 502 487 508 491 527 520 513 – – – – –
Percentage (%) of students at or above NMS 96% 96% 92% 96% 88% 86% 83% 87% 91% 87% 85% 92% 85% 92% 92% – – – – –
Millaa Millaa State School Millaa Millaa 5 12 5 –
Average score of the school 376 323 345 350 381 482 440 443 492 477 473 458 519 495 518 – – – – –
Percentage (%) of students at or above NMS 80% 80% 80% 80% 100% 92% 92% 83% 92% 92% 80% 80% 100% 80% 100% – – – – –
Millaroo State School Millaroo 3 2 3 –
Average score of the school ∧ ∧ ∧ ∧ ∧ ∧ ∧ ∧ ∧ ∧ ∧ ∧ ∧ ∧ ∧ – – – – –
Percentage (%) of students at or above NMS ∧ ∧ ∧ ∧ ∧ ∧ ∧ ∧ ∧ ∧ ∧ ∧ ∧ ∧ ∧ – – – – –
Millchester State School Charters Towers 36 46 23 –
Average score of the school 381 375 363 400 382 450 401 421 449 448 502 479 479 502 513 – – – – –
Percentage (%) of students at or above NMS 91% 94% 94% 97% 94% 71% 64% 74% 83% 91% 96% 78% 78% 96% 87% – – – – –
Millmerran State School Millmerran 33 27 15 16
Average score of the school 358 385 383 405 376 476 485 511 518 486 537 526 541 549 526 593 563 604 592 581
Percentage (%) of students at or above NMS 83% 100% 97% 93% 100% 92% 100% 96% 100% 100% 100% 92% 92% 100% 92% 100% 79% 100% 93% 93%
Milman State School Milman via Rockhampton 6 5 1 –
Average score of the school 385 384 374 416 349 494 431 482 486 456 ∧ ∧ ∧ ∧ ∧ – – – – –
Percentage (%) of students at or above NMS 83% 100% 100% 83% 83% 100% 80% 100% 100% 100% ∧ ∧ ∧ ∧ ∧ – – – – –
Milpera State High School Chelmer – – 19 48
Average score of the school – – – – – – – – – – ∗ ∗ ∗ ∗ ∗ ∗ ∗ ∗ ∗ ∗Percentage (%) of students at or above NMS – – – – – – – – – – ∗ ∗ ∗ ∗ ∗ ∗ ∗ ∗ ∗ ∗
Milton State School Milton 90 74 35 –
Average score of the school 447 400 415 463 442 542 488 526 539 518 587 541 570 590 607 – – – – –
Percentage (%) of students at or above NMS 98% 97% 100% 98% 99% 97% 93% 99% 96% 97% 100% 97% 100% 97% 100% – – – – –
Minden State School Minden 22 20 11 –
Average score of the school 391 372 394 476 354 482 461 487 523 461 544 457 531 574 530 – – – – –
Percentage (%) of students at or above NMS 90% 95% 100% 100% 95% 100% 90% 85% 100% 100% 100% 80% 100% 100% 100% – – – – –
Minimbah State School Morayfield 111 103 51 –
Average score of the school 389 374 379 388 377 481 439 475 478 467 508 447 522 499 513 – – – – –
Percentage (%) of students at or above NMS 88% 96% 91% 93% 94% 88% 85% 90% 91% 95% 91% 71% 85% 85% 96% – – – – –
Mirani State High School Mirani – – – 171
Average score of the school – – – – – – – – – – – – – – – 557 524 551 542 555
Percentage (%) of students at or above NMS – – – – – – – – – – – – – – – 90% 69% 88% 83% 94%
Mirani State School Mirani 46 35 29 –
Average score of the school 408 407 393 439 419 499 471 467 488 485 531 505 518 529 527 – – – – –
Percentage (%) of students at or above NMS 93% 100% 98% 100% 100% 97% 100% 97% 100% 100% 96% 96% 96% 96% 100% – – – – –
KEY∧ to maintain privacy of individual student information, where there are fewer than five students tested results are not provided∗ no students in the year level sat the test due to absence, exemption or withdrawal– no students in the year levelNMS National Minimum Standard (for further information see www.nap.edu.au)
Queensland Curriculum & Assessment Authority
Page 76 of 149
NAPLAN 2014 Outcomes — All Queensland schools

Year level enrolments Year 3 Year 5 Year 7 Year 9
School Locality Yr 3 Yr 5 Yr 7 Yr 9 READ WRIT SPEL GP NMCY READ WRIT SPEL GP NMCY READ WRIT SPEL GP NMCY READ WRIT SPEL GP NMCY
Miriam Vale State School Miriam Vale 13 15 7 12
Average score of the school 442 393 432 529 384 529 421 497 571 451 591 449 559 623 566 593 519 590 660 573
Percentage (%) of students at or above NMS 100% 100% 100% 100% 91% 100% 83% 100% 100% 92% 100% 71% 86% 100% 100% 100% 91% 91% 100% 100%
Mirriwinni State School Miriwinni 8 4 8 –
Average score of the school 428 440 437 480 422 ∧ ∧ ∧ ∧ ∧ 557 563 526 575 580 – – – – –
Percentage (%) of students at or above NMS 88% 100% 100% 100% 88% ∧ ∧ ∧ ∧ ∧ 100% 100% 88% 100% 100% – – – – –
Mission Beach State School Wongaling Beach 38 29 25 –
Average score of the school 420 407 404 446 408 490 468 490 501 511 580 536 556 580 586 – – – – –
Percentage (%) of students at or above NMS 97% 100% 97% 100% 97% 100% 100% 96% 96% 96% 96% 88% 96% 96% 100% – – – – –
Mistake Creek State School Mistake Creek via Clermont 1 – – –
Average score of the school ∧ ∧ ∧ ∧ ∧ – – – – – – – – – – – – – – –
Percentage (%) of students at or above NMS ∧ ∧ ∧ ∧ ∧ – – – – – – – – – – – – – – –
Mitchell State School Mitchell 9 11 6 6
Average score of the school 417 403 378 408 433 464 458 471 471 462 ∧ ∧ ∧ ∧ ∧ 601 556 605 586 569
Percentage (%) of students at or above NMS 100% 100% 100% 100% 100% 82% 91% 100% 100% 100% ∧ ∧ ∧ ∧ ∧ 100% 80% 100% 100% 100%
Mitchelton Special School Mitchelton 13 7 11 10
Average score of the school ∗ ∗ ∗ ∗ ∗ ∗ ∗ ∗ ∗ ∗ ∗ ∗ ∗ ∗ ∗ ∗ ∗ ∗ ∗ ∗Percentage (%) of students at or above NMS ∗ ∗ ∗ ∗ ∗ ∗ ∗ ∗ ∗ ∗ ∗ ∗ ∗ ∗ ∗ ∗ ∗ ∗ ∗ ∗
Mitchelton State High School Mitchelton – – – 56
Average score of the school – – – – – – – – – – – – – – – 557 518 563 553 550
Percentage (%) of students at or above NMS – – – – – – – – – – – – – – – 91% 72% 92% 85% 95%
Mitchelton State School Mitchelton 44 38 30 –
Average score of the school 403 384 373 414 371 505 472 489 508 480 529 494 545 532 526 – – – – –
Percentage (%) of students at or above NMS 95% 95% 88% 95% 98% 89% 92% 97% 89% 95% 97% 90% 97% 93% 100% – – – – –
Moffatdale State School via Murgon 5 5 2 –
Average score of the school 280 338 311 274 328 396 347 405 406 400 ∧ ∧ ∧ ∧ ∧ – – – – –
Percentage (%) of students at or above NMS 40% 100% 100% 40% 80% 80% 20% 60% 60% 40% ∧ ∧ ∧ ∧ ∧ – – – – –
Moggill State School Moggill 87 86 56 –
Average score of the school 444 412 430 453 416 527 485 518 532 516 578 531 574 582 585 – – – – –
Percentage (%) of students at or above NMS 99% 100% 99% 95% 98% 98% 99% 100% 98% 100% 100% 91% 98% 100% 100% – – – – –
Monkland State School Monkland 7 11 12 –
Average score of the school 354 332 322 300 375 441 435 432 422 436 552 492 554 560 508 – – – – –
Percentage (%) of students at or above NMS 71% 86% 86% 43% 100% 64% 73% 73% 55% 82% 100% 80% 90% 100% 82% – – – – –
Monogorilby State School Monogorilby via Mundubbera 6 2 1 –
Average score of the school 448 417 421 465 453 ∧ ∧ ∧ ∧ ∧ ∧ ∧ ∧ ∧ ∧ – – – – –
Percentage (%) of students at or above NMS 100% 100% 100% 100% 100% ∧ ∧ ∧ ∧ ∧ ∧ ∧ ∧ ∧ ∧ – – – – –
KEY∧ to maintain privacy of individual student information, where there are fewer than five students tested results are not provided∗ no students in the year level sat the test due to absence, exemption or withdrawal– no students in the year levelNMS National Minimum Standard (for further information see www.nap.edu.au)
Queensland Curriculum & Assessment Authority
Page 77 of 149
NAPLAN 2014 Outcomes — All Queensland schools

Year level enrolments Year 3 Year 5 Year 7 Year 9
School Locality Yr 3 Yr 5 Yr 7 Yr 9 READ WRIT SPEL GP NMCY READ WRIT SPEL GP NMCY READ WRIT SPEL GP NMCY READ WRIT SPEL GP NMCY
Montessori International College Buderim 17 12 13 7
Average score of the school 417 410 405 408 384 496 448 449 502 466 551 468 503 559 548 586 481 555 543 566
Percentage (%) of students at or above NMS 88% 100% 100% 94% 88% 100% 92% 83% 92% 100% 100% 89% 78% 100% 100% 67% 33% 83% 83% 100%
Monto State High School Monto – – – 48
Average score of the school – – – – – – – – – – – – – – – 573 538 568 589 584
Percentage (%) of students at or above NMS – – – – – – – – – – – – – – – 85% 73% 83% 88% 90%
Monto State School Monto 15 11 9 –
Average score of the school 412 391 391 442 401 488 470 478 491 472 545 463 532 509 539 – – – – –
Percentage (%) of students at or above NMS 92% 100% 100% 100% 100% 91% 90% 80% 90% 90% 83% 86% 86% 71% 83% – – – – –
Montville State School Montville 22 14 13 –
Average score of the school 396 378 403 404 375 492 431 507 504 459 561 525 561 573 552 – – – – –
Percentage (%) of students at or above NMS 81% 95% 90% 100% 95% 92% 83% 100% 92% 85% 100% 100% 100% 100% 100% – – – – –
Mooloolaba State School Mooloolaba 72 71 46 –
Average score of the school 424 394 411 432 423 512 480 501 503 513 551 510 549 543 540 – – – – –
Percentage (%) of students at or above NMS 91% 91% 91% 91% 93% 94% 91% 91% 96% 97% 100% 96% 98% 100% 100% – – – – –
Mooloolah State School Mooloolah 27 23 7 –
Average score of the school 409 383 389 408 384 497 449 474 504 502 520 476 506 498 495 – – – – –
Percentage (%) of students at or above NMS 89% 100% 100% 100% 96% 95% 79% 89% 89% 100% 100% 57% 71% 71% 100% – – – – –
Moonie State School Moonie 5 4 1 –
Average score of the school 415 369 399 455 424 ∧ ∧ ∧ ∧ ∧ ∧ ∧ ∧ ∧ ∧ – – – – –
Percentage (%) of students at or above NMS 100% 80% 100% 100% 100% ∧ ∧ ∧ ∧ ∧ ∧ ∧ ∧ ∧ ∧ – – – – –
Moore Park State School Moore Park 31 38 27 –
Average score of the school 417 395 407 429 408 509 464 469 503 494 554 497 538 536 563 – – – – –
Percentage (%) of students at or above NMS 97% 100% 100% 97% 100% 94% 94% 88% 94% 97% 92% 88% 85% 92% 88% – – – – –
Moorooka State School Moorooka 49 45 36 –
Average score of the school 403 408 392 402 383 496 418 474 493 452 541 472 518 540 515 – – – – –
Percentage (%) of students at or above NMS 85% 88% 80% 82% 83% 80% 70% 84% 86% 77% 97% 82% 88% 91% 94% – – – – –
Moranbah East State School Moranbah East 102 80 48 –
Average score of the school 398 386 394 413 388 481 460 479 483 467 534 505 522 536 519 – – – – –
Percentage (%) of students at or above NMS 96% 96% 99% 96% 96% 94% 91% 94% 92% 91% 98% 89% 94% 89% 93% – – – – –
Moranbah State High School Moranbah – – – 144
Average score of the school – – – – – – – – – – – – – – – 564 531 569 557 556
Percentage (%) of students at or above NMS – – – – – – – – – – – – – – – 91% 75% 90% 84% 96%
Moranbah State School Moranbah 64 62 41 –
Average score of the school 427 383 422 460 425 495 443 488 508 478 512 483 503 516 519 – – – – –
Percentage (%) of students at or above NMS 100% 98% 97% 100% 100% 92% 87% 88% 95% 93% 95% 82% 85% 95% 92% – – – – –
KEY∧ to maintain privacy of individual student information, where there are fewer than five students tested results are not provided∗ no students in the year level sat the test due to absence, exemption or withdrawal– no students in the year levelNMS National Minimum Standard (for further information see www.nap.edu.au)
Queensland Curriculum & Assessment Authority
Page 78 of 149
NAPLAN 2014 Outcomes — All Queensland schools
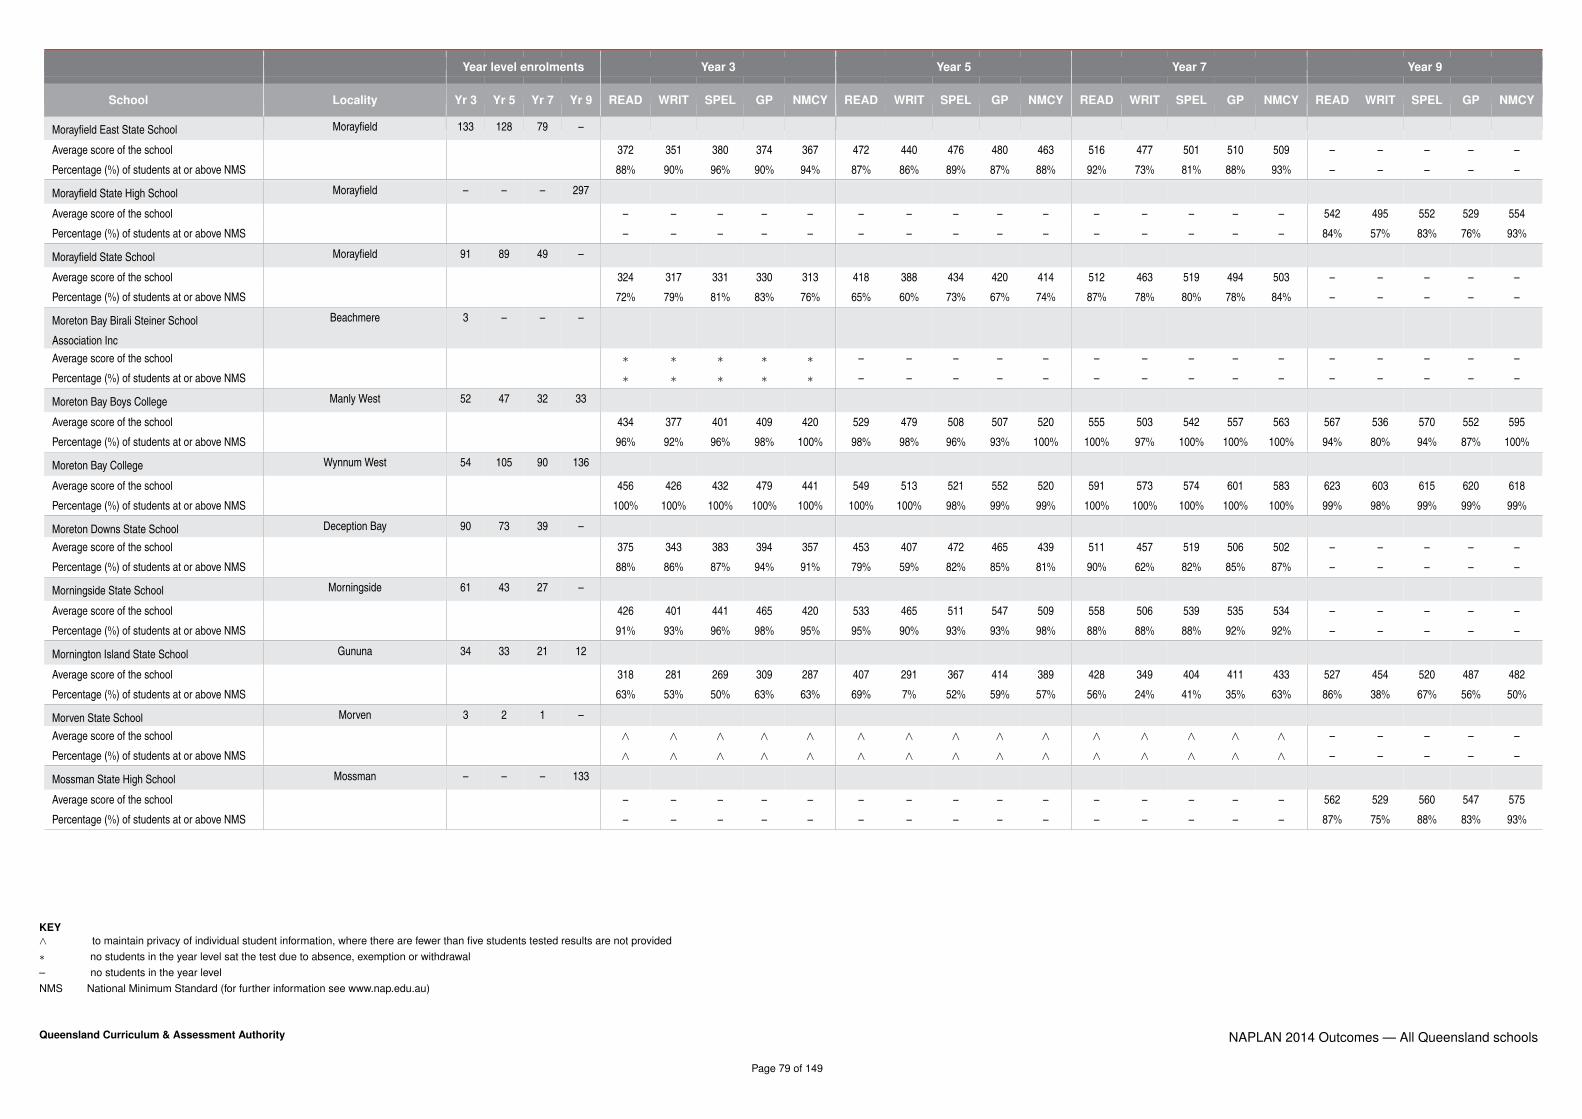
Year level enrolments Year 3 Year 5 Year 7 Year 9
School Locality Yr 3 Yr 5 Yr 7 Yr 9 READ WRIT SPEL GP NMCY READ WRIT SPEL GP NMCY READ WRIT SPEL GP NMCY READ WRIT SPEL GP NMCY
Morayfield East State School Morayfield 133 128 79 –
Average score of the school 372 351 380 374 367 472 440 476 480 463 516 477 501 510 509 – – – – –
Percentage (%) of students at or above NMS 88% 90% 96% 90% 94% 87% 86% 89% 87% 88% 92% 73% 81% 88% 93% – – – – –
Morayfield State High School Morayfield – – – 297
Average score of the school – – – – – – – – – – – – – – – 542 495 552 529 554
Percentage (%) of students at or above NMS – – – – – – – – – – – – – – – 84% 57% 83% 76% 93%
Morayfield State School Morayfield 91 89 49 –
Average score of the school 324 317 331 330 313 418 388 434 420 414 512 463 519 494 503 – – – – –
Percentage (%) of students at or above NMS 72% 79% 81% 83% 76% 65% 60% 73% 67% 74% 87% 78% 80% 78% 84% – – – – –
Moreton Bay Birali Steiner School
Association Inc
Beachmere 3 – – –
Average score of the school ∗ ∗ ∗ ∗ ∗ – – – – – – – – – – – – – – –
Percentage (%) of students at or above NMS ∗ ∗ ∗ ∗ ∗ – – – – – – – – – – – – – – –
Moreton Bay Boys College Manly West 52 47 32 33
Average score of the school 434 377 401 409 420 529 479 508 507 520 555 503 542 557 563 567 536 570 552 595
Percentage (%) of students at or above NMS 96% 92% 96% 98% 100% 98% 98% 96% 93% 100% 100% 97% 100% 100% 100% 94% 80% 94% 87% 100%
Moreton Bay College Wynnum West 54 105 90 136
Average score of the school 456 426 432 479 441 549 513 521 552 520 591 573 574 601 583 623 603 615 620 618
Percentage (%) of students at or above NMS 100% 100% 100% 100% 100% 100% 100% 98% 99% 99% 100% 100% 100% 100% 100% 99% 98% 99% 99% 99%
Moreton Downs State School Deception Bay 90 73 39 –
Average score of the school 375 343 383 394 357 453 407 472 465 439 511 457 519 506 502 – – – – –
Percentage (%) of students at or above NMS 88% 86% 87% 94% 91% 79% 59% 82% 85% 81% 90% 62% 82% 85% 87% – – – – –
Morningside State School Morningside 61 43 27 –
Average score of the school 426 401 441 465 420 533 465 511 547 509 558 506 539 535 534 – – – – –
Percentage (%) of students at or above NMS 91% 93% 96% 98% 95% 95% 90% 93% 93% 98% 88% 88% 88% 92% 92% – – – – –
Mornington Island State School Gununa 34 33 21 12
Average score of the school 318 281 269 309 287 407 291 367 414 389 428 349 404 411 433 527 454 520 487 482
Percentage (%) of students at or above NMS 63% 53% 50% 63% 63% 69% 7% 52% 59% 57% 56% 24% 41% 35% 63% 86% 38% 67% 56% 50%
Morven State School Morven 3 2 1 –
Average score of the school ∧ ∧ ∧ ∧ ∧ ∧ ∧ ∧ ∧ ∧ ∧ ∧ ∧ ∧ ∧ – – – – –
Percentage (%) of students at or above NMS ∧ ∧ ∧ ∧ ∧ ∧ ∧ ∧ ∧ ∧ ∧ ∧ ∧ ∧ ∧ – – – – –
Mossman State High School Mossman – – – 133
Average score of the school – – – – – – – – – – – – – – – 562 529 560 547 575
Percentage (%) of students at or above NMS – – – – – – – – – – – – – – – 87% 75% 88% 83% 93%
KEY∧ to maintain privacy of individual student information, where there are fewer than five students tested results are not provided∗ no students in the year level sat the test due to absence, exemption or withdrawal– no students in the year levelNMS National Minimum Standard (for further information see www.nap.edu.au)
Queensland Curriculum & Assessment Authority
Page 79 of 149
NAPLAN 2014 Outcomes — All Queensland schools

Year level enrolments Year 3 Year 5 Year 7 Year 9
School Locality Yr 3 Yr 5 Yr 7 Yr 9 READ WRIT SPEL GP NMCY READ WRIT SPEL GP NMCY READ WRIT SPEL GP NMCY READ WRIT SPEL GP NMCY
Mossman State School Mossman 31 33 20 –
Average score of the school 368 365 398 376 378 425 406 467 439 435 523 494 506 509 517 – – – – –
Percentage (%) of students at or above NMS 87% 87% 90% 83% 93% 82% 68% 82% 86% 78% 79% 79% 74% 79% 79% – – – – –
Mother Teresa Primary School Ormeau 26 7 – –
Average score of the school 401 401 379 400 368 485 489 487 501 428 – – – – – – – – – –
Percentage (%) of students at or above NMS 96% 96% 100% 96% 96% 86% 86% 86% 100% 71% – – – – – – – – – –
Mother of Good Counsel School (Cairns
North)
Cairns North 50 39 28 –
Average score of the school 452 420 416 446 428 523 484 495 508 499 546 530 538 539 539 – – – – –
Percentage (%) of students at or above NMS 100% 100% 100% 100% 100% 100% 100% 95% 100% 100% 100% 93% 96% 100% 100% – – – – –
Mount Alford State School Mount Alford via Boonah 8 10 3 –
Average score of the school 334 355 337 361 327 489 452 449 492 450 ∧ ∧ ∧ ∧ ∧ – – – – –
Percentage (%) of students at or above NMS 71% 88% 75% 88% 71% 100% 80% 90% 100% 90% ∧ ∧ ∧ ∧ ∧ – – – – –
Mount Alvernia College Kedron – – – 167
Average score of the school – – – – – – – – – – – – – – – 597 580 602 594 579
Percentage (%) of students at or above NMS – – – – – – – – – – – – – – – 99% 96% 97% 95% 99%
Mount Archer State School Rockhampton North 83 76 49 –
Average score of the school 394 374 410 420 379 486 462 494 489 464 525 505 540 546 531 – – – – –
Percentage (%) of students at or above NMS 94% 97% 100% 100% 97% 93% 90% 93% 96% 94% 93% 96% 93% 96% 100% – – – – –
Mount Cotton State School Mount Cotton 100 73 31 –
Average score of the school 450 405 412 457 417 495 470 482 501 482 539 524 530 536 535 – – – – –
Percentage (%) of students at or above NMS 100% 98% 99% 99% 98% 94% 94% 93% 97% 94% 97% 92% 88% 96% 100% – – – – –
Mount Crosby State School Karana Downs 105 77 57 –
Average score of the school 439 409 421 449 426 528 464 501 530 496 571 522 554 576 570 – – – – –
Percentage (%) of students at or above NMS 95% 98% 97% 98% 99% 96% 93% 97% 99% 99% 96% 93% 94% 94% 100% – – – – –
Mount Fox State School Mount Fox 1 2 1 –
Average score of the school ∧ ∧ ∧ ∧ ∧ ∧ ∧ ∧ ∧ ∧ ∧ ∧ ∧ ∧ ∧ – – – – –
Percentage (%) of students at or above NMS ∧ ∧ ∧ ∧ ∧ ∧ ∧ ∧ ∧ ∧ ∧ ∧ ∧ ∧ ∧ – – – – –
Mount Garnet State School Mount Garnet 3 7 5 –
Average score of the school ∧ ∧ ∧ ∧ ∧ 398 298 408 351 410 435 373 403 424 463 – – – – –
Percentage (%) of students at or above NMS ∧ ∧ ∧ ∧ ∧ 43% 29% 43% 43% 67% 60% 40% 20% 60% 100% – – – – –
Mount Gravatt East State School Mount Gravatt East 36 30 20 –
Average score of the school 360 337 368 351 334 478 472 500 481 493 515 481 520 526 539 – – – – –
Percentage (%) of students at or above NMS 83% 83% 86% 86% 83% 89% 86% 93% 86% 100% 95% 84% 89% 89% 100% – – – – –
Mount Gravatt State High School Mount Gravatt – – – 209
Average score of the school – – – – – – – – – – – – – – – 591 572 594 597 601
Percentage (%) of students at or above NMS – – – – – – – – – – – – – – – 96% 91% 96% 93% 98%
KEY∧ to maintain privacy of individual student information, where there are fewer than five students tested results are not provided∗ no students in the year level sat the test due to absence, exemption or withdrawal– no students in the year levelNMS National Minimum Standard (for further information see www.nap.edu.au)
Queensland Curriculum & Assessment Authority
Page 80 of 149
NAPLAN 2014 Outcomes — All Queensland schools

Year level enrolments Year 3 Year 5 Year 7 Year 9
School Locality Yr 3 Yr 5 Yr 7 Yr 9 READ WRIT SPEL GP NMCY READ WRIT SPEL GP NMCY READ WRIT SPEL GP NMCY READ WRIT SPEL GP NMCY
Mount Gravatt State School Mount Gravatt 33 34 21 –
Average score of the school 390 378 419 403 386 508 455 503 510 484 543 489 554 542 542 – – – – –
Percentage (%) of students at or above NMS 84% 94% 97% 97% 97% 94% 85% 91% 82% 85% 95% 81% 90% 81% 95% – – – – –
Mount Isa Central State School Mount Isa 41 32 10 –
Average score of the school 374 372 382 374 352 459 432 480 463 468 512 516 524 515 519 – – – – –
Percentage (%) of students at or above NMS 90% 97% 97% 92% 85% 90% 83% 87% 90% 90% 90% 90% 90% 80% 100% – – – – –
Mount Isa School of the Air Mount Isa 28 19 6 5
Average score of the school 388 362 358 391 390 530 449 485 541 484 606 515 518 558 566 573 402 578 551 547
Percentage (%) of students at or above NMS 92% 96% 92% 92% 100% 100% 82% 94% 100% 100% 100% 83% 100% 83% 83% 80% 60% 100% 80% 80%
Mount Kilcoy State School Mount Kilcoy via Kilcoy 15 17 8 –
Average score of the school 388 372 365 390 368 486 467 510 492 485 525 487 501 528 570 – – – – –
Percentage (%) of students at or above NMS 92% 92% 100% 100% 100% 100% 93% 100% 93% 86% 100% 86% 86% 86% 100% – – – – –
Mount Larcom State School Mount Larcom 6 6 7 14
Average score of the school 336 382 350 402 358 490 450 451 438 432 493 491 494 489 483 530 466 512 501 526
Percentage (%) of students at or above NMS 60% 100% 80% 100% 100% 100% 100% 100% 67% 100% 83% 67% 83% 83% 83% 69% 29% 71% 57% 86%
Mount Marrow State School Mount Marrow via Ipswich 7 11 4 –
Average score of the school 404 417 435 445 324 489 484 507 499 450 ∧ ∧ ∧ ∧ ∧ – – – – –
Percentage (%) of students at or above NMS 86% 83% 83% 83% 86% 91% 100% 100% 100% 91% ∧ ∧ ∧ ∧ ∧ – – – – –
Mount Mee State School Mount Mee 7 13 6 –
Average score of the school 420 369 444 422 377 556 500 489 551 512 589 543 540 583 541 – – – – –
Percentage (%) of students at or above NMS 100% 100% 100% 100% 100% 92% 92% 100% 100% 100% 100% 100% 100% 100% 100% – – – – –
Mount Molloy State School Mount Molloy 3 6 4 –
Average score of the school ∧ ∧ ∧ ∧ ∧ 464 460 444 471 460 ∧ ∧ ∧ ∧ ∧ – – – – –
Percentage (%) of students at or above NMS ∧ ∧ ∧ ∧ ∧ 83% 83% 83% 100% 67% ∧ ∧ ∧ ∧ ∧ – – – – –
Mount Morgan Central State School Mount Morgan 29 32 19 –
Average score of the school 343 327 334 378 363 430 381 435 423 424 472 447 458 485 466 – – – – –
Percentage (%) of students at or above NMS 83% 83% 69% 86% 97% 78% 56% 75% 78% 84% 79% 63% 68% 84% 79% – – – – –
Mount Morgan State High School Mount Morgan – – – 41
Average score of the school – – – – – – – – – – – – – – – 512 498 504 513 524
Percentage (%) of students at or above NMS – – – – – – – – – – – – – – – 57% 64% 61% 61% 83%
Mount Murchison State School via Biloela 4 4 2 –
Average score of the school ∧ ∧ ∧ ∧ ∧ ∧ ∧ ∧ ∧ ∧ ∧ ∧ ∧ ∧ ∧ – – – – –
Percentage (%) of students at or above NMS ∧ ∧ ∧ ∧ ∧ ∧ ∧ ∧ ∧ ∧ ∧ ∧ ∧ ∧ ∧ – – – – –
Mount Nebo State School Mount Nebo 5 4 – –
Average score of the school 375 371 375 396 353 ∧ ∧ ∧ ∧ ∧ – – – – – – – – – –
Percentage (%) of students at or above NMS 100% 100% 100% 100% 100% ∧ ∧ ∧ ∧ ∧ – – – – – – – – – –
KEY∧ to maintain privacy of individual student information, where there are fewer than five students tested results are not provided∗ no students in the year level sat the test due to absence, exemption or withdrawal– no students in the year levelNMS National Minimum Standard (for further information see www.nap.edu.au)
Queensland Curriculum & Assessment Authority
Page 81 of 149
NAPLAN 2014 Outcomes — All Queensland schools

Year level enrolments Year 3 Year 5 Year 7 Year 9
School Locality Yr 3 Yr 5 Yr 7 Yr 9 READ WRIT SPEL GP NMCY READ WRIT SPEL GP NMCY READ WRIT SPEL GP NMCY READ WRIT SPEL GP NMCY
Mount Perry State School Mount Perry 9 9 1 –
Average score of the school 435 379 417 431 415 486 426 457 496 419 ∧ ∧ ∧ ∧ ∧ – – – – –
Percentage (%) of students at or above NMS 100% 100% 100% 100% 100% 100% 78% 89% 100% 89% ∧ ∧ ∧ ∧ ∧ – – – – –
Mount Samson State School Mount Samson 40 35 20 –
Average score of the school 425 422 392 434 402 565 504 518 552 521 534 478 520 530 531 – – – – –
Percentage (%) of students at or above NMS 100% 100% 95% 100% 97% 100% 100% 100% 100% 100% 100% 90% 95% 90% 95% – – – – –
Mount St Bernard College Herberton – – – 50
Average score of the school – – – – – – – – – – – – – – – 498 446 510 477 495
Percentage (%) of students at or above NMS – – – – – – – – – – – – – – – 60% 41% 76% 40% 60%
Mount Surprise State School Mount Surprise – 1 – –
Average score of the school – – – – – ∧ ∧ ∧ ∧ ∧ – – – – – – – – – –
Percentage (%) of students at or above NMS – – – – – ∧ ∧ ∧ ∧ ∧ – – – – – – – – – –
Mount Sylvia State School Mount Sylvia 5 7 2 –
Average score of the school 360 390 368 416 373 462 465 439 504 461 ∧ ∧ ∧ ∧ ∧ – – – – –
Percentage (%) of students at or above NMS 80% 100% 100% 100% 100% 86% 86% 71% 100% 86% ∧ ∧ ∧ ∧ ∧ – – – – –
Mount Tarampa State School Mount Tarampa 3 8 4 –
Average score of the school ∧ ∧ ∧ ∧ ∧ 399 385 434 452 418 ∧ ∧ ∧ ∧ ∧ – – – – –
Percentage (%) of students at or above NMS ∧ ∧ ∧ ∧ ∧ 71% 57% 71% 86% 71% ∧ ∧ ∧ ∧ ∧ – – – – –
Mount Tyson State School Mount Tyson via Pittsworth 8 9 5 –
Average score of the school 355 365 362 449 355 471 422 462 487 498 ∧ ∧ ∧ ∧ ∧ – – – – –
Percentage (%) of students at or above NMS 75% 100% 86% 86% 88% 89% 78% 78% 89% 100% ∧ ∧ ∧ ∧ ∧ – – – – –
Mount Warren Park State School Mount Warren Park 109 80 52 –
Average score of the school 398 378 392 413 377 456 429 483 475 461 530 498 537 531 533 – – – – –
Percentage (%) of students at or above NMS 95% 93% 98% 99% 94% 79% 78% 97% 92% 95% 95% 93% 89% 97% 95% – – – – –
Mount Whitestone State School Mount Whitestone 1 4 3 –
Average score of the school ∧ ∧ ∧ ∧ ∧ ∧ ∧ ∧ ∧ ∧ ∧ ∧ ∧ ∧ ∧ – – – – –
Percentage (%) of students at or above NMS ∧ ∧ ∧ ∧ ∧ ∧ ∧ ∧ ∧ ∧ ∧ ∧ ∧ ∧ ∧ – – – – –
Mountain Creek State High School Mountain Creek – – – 305
Average score of the school – – – – – – – – – – – – – – – 579 562 588 571 593
Percentage (%) of students at or above NMS – – – – – – – – – – – – – – – 94% 84% 93% 90% 97%
Mountain Creek State School Mountain Creek 143 168 114 –
Average score of the school 412 404 396 429 402 504 473 492 503 499 542 508 543 550 552 – – – – –
Percentage (%) of students at or above NMS 96% 99% 93% 97% 97% 95% 92% 95% 93% 96% 90% 91% 93% 91% 97% – – – – –
Moura State High School Moura – – – 24
Average score of the school – – – – – – – – – – – – – – – 553 582 566 553 570
Percentage (%) of students at or above NMS – – – – – – – – – – – – – – – 88% 96% 96% 88% 100%
KEY∧ to maintain privacy of individual student information, where there are fewer than five students tested results are not provided∗ no students in the year level sat the test due to absence, exemption or withdrawal– no students in the year levelNMS National Minimum Standard (for further information see www.nap.edu.au)
Queensland Curriculum & Assessment Authority
Page 82 of 149
NAPLAN 2014 Outcomes — All Queensland schools

Year level enrolments Year 3 Year 5 Year 7 Year 9
School Locality Yr 3 Yr 5 Yr 7 Yr 9 READ WRIT SPEL GP NMCY READ WRIT SPEL GP NMCY READ WRIT SPEL GP NMCY READ WRIT SPEL GP NMCY
Moura State School Moura 34 42 19 –
Average score of the school 408 382 407 417 367 483 469 483 478 459 543 493 536 550 515 – – – – –
Percentage (%) of students at or above NMS 91% 91% 97% 97% 97% 92% 92% 92% 92% 90% 88% 89% 78% 89% 88% – – – – –
Mourilyan State School Mourilyan 12 24 9 –
Average score of the school 423 402 400 428 401 489 473 482 538 492 536 496 541 572 586 – – – – –
Percentage (%) of students at or above NMS 100% 100% 100% 100% 100% 100% 100% 95% 100% 95% 100% 100% 100% 100% 100% – – – – –
Mt Isa Flexible Learning Centre Mt Isa – – – 14
Average score of the school – – – – – – – – – – – – – – – 385 284 372 367 418
Percentage (%) of students at or above NMS – – – – – – – – – – – – – – – 0% 10% 20% 20% 29%
Mt Isa State Special School Mount Isa 2 1 2 –
Average score of the school ∗ ∗ ∗ ∗ ∗ ∗ ∗ ∗ ∗ ∗ ∗ ∗ ∗ ∗ ∗ – – – – –
Percentage (%) of students at or above NMS ∗ ∗ ∗ ∗ ∗ ∗ ∗ ∗ ∗ ∗ ∗ ∗ ∗ ∗ ∗ – – – – –
Mt Maria College Mitchelton – – – 166
Average score of the school – – – – – – – – – – – – – – – 585 557 577 580 581
Percentage (%) of students at or above NMS – – – – – – – – – – – – – – – 93% 86% 92% 90% 96%
Mt Maria College - Petrie Petrie – – – 63
Average score of the school – – – – – – – – – – – – – – – 527 467 508 505 537
Percentage (%) of students at or above NMS – – – – – – – – – – – – – – – 69% 41% 66% 60% 83%
Mt Ommaney Special School Mount Ommaney 5 2 3 4
Average score of the school ∗ ∗ ∗ ∗ ∗ ∗ ∗ ∗ ∗ ∗ ∗ ∗ ∗ ∗ ∗ ∗ ∗ ∗ ∗ ∗Percentage (%) of students at or above NMS ∗ ∗ ∗ ∗ ∗ ∗ ∗ ∗ ∗ ∗ ∗ ∗ ∗ ∗ ∗ ∗ ∗ ∗ ∗ ∗
Mt St Michael’s College Ashgrove – – – 168
Average score of the school – – – – – – – – – – – – – – – 629 612 619 628 626
Percentage (%) of students at or above NMS – – – – – – – – – – – – – – – 100% 97% 100% 100% 100%
Mudgeeraba Creek State School Mudgeeraba 93 97 51 –
Average score of the school 405 390 397 416 401 494 447 481 501 484 539 493 535 529 540 – – – – –
Percentage (%) of students at or above NMS 92% 96% 94% 94% 100% 92% 91% 92% 93% 95% 94% 87% 90% 90% 98% – – – – –
Mudgeeraba Special School Mudgeeraba 7 9 8 21
Average score of the school ∗ ∗ ∗ ∗ ∗ ∗ ∗ ∗ ∗ ∗ ∗ ∗ ∗ ∗ ∗ ∗ ∗ ∗ ∗ ∗Percentage (%) of students at or above NMS ∗ ∗ ∗ ∗ ∗ ∗ ∗ ∗ ∗ ∗ ∗ ∗ ∗ ∗ ∗ ∗ ∗ ∗ ∗ ∗
Mudgeeraba State School Mudgeeraba 115 111 59 –
Average score of the school 423 404 411 446 405 516 467 508 510 505 540 495 545 546 554 – – – – –
Percentage (%) of students at or above NMS 96% 96% 97% 97% 98% 99% 95% 97% 97% 97% 100% 93% 93% 93% 100% – – – – –
Mueller College Rothwell 113 114 96 121
Average score of the school 437 411 428 453 411 504 479 507 506 490 535 509 538 538 534 588 549 591 578 593
Percentage (%) of students at or above NMS 98% 100% 97% 98% 98% 98% 98% 98% 96% 98% 95% 99% 99% 93% 99% 96% 87% 96% 92% 98%
KEY∧ to maintain privacy of individual student information, where there are fewer than five students tested results are not provided∗ no students in the year level sat the test due to absence, exemption or withdrawal– no students in the year levelNMS National Minimum Standard (for further information see www.nap.edu.au)
Queensland Curriculum & Assessment Authority
Page 83 of 149
NAPLAN 2014 Outcomes — All Queensland schools

Year level enrolments Year 3 Year 5 Year 7 Year 9
School Locality Yr 3 Yr 5 Yr 7 Yr 9 READ WRIT SPEL GP NMCY READ WRIT SPEL GP NMCY READ WRIT SPEL GP NMCY READ WRIT SPEL GP NMCY
Mulgildie State School Mulgildie 4 4 6 –
Average score of the school ∧ ∧ ∧ ∧ ∧ ∧ ∧ ∧ ∧ ∧ 495 457 476 461 498 – – – – –
Percentage (%) of students at or above NMS ∧ ∧ ∧ ∧ ∧ ∧ ∧ ∧ ∧ ∧ 100% 83% 67% 83% 100% – – – – –
Mundingburra State School Mundingburra 99 78 50 –
Average score of the school 384 348 386 382 366 488 449 471 496 472 554 531 552 554 545 – – – – –
Percentage (%) of students at or above NMS 86% 88% 97% 94% 89% 89% 81% 92% 93% 93% 100% 94% 94% 96% 98% – – – – –
Mundoo State School Wangan 3 2 2 –
Average score of the school ∧ ∧ ∧ ∧ ∧ ∧ ∧ ∧ ∧ ∧ ∧ ∧ ∧ ∧ ∧ – – – – –
Percentage (%) of students at or above NMS ∧ ∧ ∧ ∧ ∧ ∧ ∧ ∧ ∧ ∧ ∧ ∧ ∧ ∧ ∧ – – – – –
Mundubbera State School Mundubbera 19 23 16 27
Average score of the school 346 356 348 376 336 475 451 465 471 460 526 513 528 525 528 566 530 561 565 581
Percentage (%) of students at or above NMS 95% 100% 95% 95% 89% 91% 86% 90% 86% 85% 100% 100% 100% 92% 100% 96% 75% 96% 96% 96%
Mungallala State School Mungallala 3 2 – –
Average score of the school ∧ ∧ ∧ ∧ ∧ ∧ ∧ ∧ ∧ ∧ – – – – – – – – – –
Percentage (%) of students at or above NMS ∧ ∧ ∧ ∧ ∧ ∧ ∧ ∧ ∧ ∧ – – – – – – – – – –
Mungar State School Mungar 5 4 8 –
Average score of the school 382 408 367 413 361 ∧ ∧ ∧ ∧ ∧ 506 447 418 476 481 – – – – –
Percentage (%) of students at or above NMS 100% 100% 100% 100% 100% ∧ ∧ ∧ ∧ ∧ 88% 75% 50% 75% 88% – – – – –
Murarrie State School Murarrie 11 10 7 –
Average score of the school 401 356 412 406 366 441 390 458 428 445 505 487 499 518 515 – – – – –
Percentage (%) of students at or above NMS 89% 82% 100% 91% 100% 80% 70% 90% 80% 90% 100% 86% 71% 100% 100% – – – – –
Murgon State High School Murgon – – – 77
Average score of the school – – – – – – – – – – – – – – – 513 401 499 504 536
Percentage (%) of students at or above NMS – – – – – – – – – – – – – – – 65% 42% 66% 64% 88%
Murgon State School Murgon 29 25 31 –
Average score of the school 329 362 354 357 367 420 400 443 432 437 466 397 483 455 478 – – – – –
Percentage (%) of students at or above NMS 69% 90% 79% 79% 90% 63% 70% 83% 63% 81% 83% 52% 77% 65% 100% – – – – –
Murphy’s Creek State School Murphys Creek 11 9 6 –
Average score of the school 328 328 318 337 358 428 387 421 414 405 565 533 576 587 589 – – – – –
Percentage (%) of students at or above NMS 90% 90% 90% 90% 90% 78% 44% 78% 67% 67% 100% 100% 100% 100% 100% – – – – –
Murray River Upper State School Murray Upper via Tully 11 7 3 –
Average score of the school 351 358 359 299 360 446 430 495 444 444 ∧ ∧ ∧ ∧ ∧ – – – – –
Percentage (%) of students at or above NMS 100% 91% 100% 64% 100% 86% 71% 100% 86% 83% ∧ ∧ ∧ ∧ ∧ – – – – –
Murray’s Bridge State School Warwick – 5 – –
Average score of the school – – – – – ∧ ∧ ∧ ∧ ∧ – – – – – – – – – –
Percentage (%) of students at or above NMS – – – – – ∧ ∧ ∧ ∧ ∧ – – – – – – – – – –
KEY∧ to maintain privacy of individual student information, where there are fewer than five students tested results are not provided∗ no students in the year level sat the test due to absence, exemption or withdrawal– no students in the year levelNMS National Minimum Standard (for further information see www.nap.edu.au)
Queensland Curriculum & Assessment Authority
Page 84 of 149
NAPLAN 2014 Outcomes — All Queensland schools

Year level enrolments Year 3 Year 5 Year 7 Year 9
School Locality Yr 3 Yr 5 Yr 7 Yr 9 READ WRIT SPEL GP NMCY READ WRIT SPEL GP NMCY READ WRIT SPEL GP NMCY READ WRIT SPEL GP NMCY
Murrumba State Secondary College Murrumba Downs – – 132 198
Average score of the school – – – – – – – – – – 525 499 540 526 533 573 535 579 560 576
Percentage (%) of students at or above NMS – – – – – – – – – – 97% 89% 93% 92% 97% 92% 79% 93% 90% 97%
Musgrave Hill State School Southport 52 52 14 –
Average score of the school 404 375 380 391 392 487 427 471 474 468 573 510 530 535 557 – – – – –
Percentage (%) of students at or above NMS 94% 95% 89% 96% 98% 83% 77% 79% 89% 89% 92% 85% 77% 85% 92% – – – – –
Mutarnee State School Mutarnee 4 2 – –
Average score of the school ∧ ∧ ∧ ∧ ∧ ∧ ∧ ∧ ∧ ∧ – – – – – – – – – –
Percentage (%) of students at or above NMS ∧ ∧ ∧ ∧ ∧ ∧ ∧ ∧ ∧ ∧ – – – – – – – – – –
Mutchilba State School Mutchilba 4 5 5 –
Average score of the school ∧ ∧ ∧ ∧ ∧ 466 421 456 437 500 509 489 484 523 493 – – – – –
Percentage (%) of students at or above NMS ∧ ∧ ∧ ∧ ∧ 80% 80% 100% 80% 100% 100% 100% 100% 100% 100% – – – – –
Mutdapilly State School Mutdapilly 2 2 – –
Average score of the school ∧ ∧ ∧ ∧ ∧ ∧ ∧ ∧ ∧ ∧ – – – – – – – – – –
Percentage (%) of students at or above NMS ∧ ∧ ∧ ∧ ∧ ∧ ∧ ∧ ∧ ∧ – – – – – – – – – –
Muttaburra State School Muttaburra 4 2 1 –
Average score of the school ∧ ∧ ∧ ∧ ∧ ∧ ∧ ∧ ∧ ∧ ∧ ∧ ∧ ∧ ∧ – – – – –
Percentage (%) of students at or above NMS ∧ ∧ ∧ ∧ ∧ ∧ ∧ ∧ ∧ ∧ ∧ ∧ ∧ ∧ ∧ – – – – –
Nagoorin State School Nagoorin via Gladstone 2 1 1 –
Average score of the school ∧ ∧ ∧ ∧ ∧ ∧ ∧ ∧ ∧ ∧ ∧ ∧ ∧ ∧ ∧ – – – – –
Percentage (%) of students at or above NMS ∧ ∧ ∧ ∧ ∧ ∧ ∧ ∧ ∧ ∧ ∧ ∧ ∧ ∧ ∧ – – – – –
Nambour Christian College Woombye 62 75 86 125
Average score of the school 415 416 422 440 419 518 461 495 513 493 564 527 543 562 544 596 551 591 584 604
Percentage (%) of students at or above NMS 95% 100% 98% 100% 98% 95% 92% 96% 95% 97% 100% 96% 96% 99% 96% 100% 85% 95% 93% 100%
Nambour Special School Nambour 10 16 7 8
Average score of the school ∗ ∗ ∗ ∗ ∗ ∗ ∗ ∗ ∗ ∗ ∗ ∗ ∗ ∗ ∗ ∗ ∗ ∗ ∗ ∗Percentage (%) of students at or above NMS ∗ ∗ ∗ ∗ ∗ ∗ ∗ ∗ ∗ ∗ ∗ ∗ ∗ ∗ ∗ ∗ ∗ ∗ ∗ ∗
Nambour State High School Nambour – – 73 182
Average score of the school – – – – – – – – – – 519 484 521 514 507 560 536 578 557 566
Percentage (%) of students at or above NMS – – – – – – – – – – 95% 79% 90% 87% 95% 87% 70% 92% 86% 98%
Nambour State School Nambour 47 49 – –
Average score of the school 369 358 363 386 352 458 404 463 470 437 – – – – – – – – – –
Percentage (%) of students at or above NMS 88% 93% 90% 93% 88% 77% 67% 86% 89% 83% – – – – – – – – – –
Nanango State High School Nanango – – – 90
Average score of the school – – – – – – – – – – – – – – – 564 526 559 543 573
Percentage (%) of students at or above NMS – – – – – – – – – – – – – – – 86% 65% 76% 75% 89%
KEY∧ to maintain privacy of individual student information, where there are fewer than five students tested results are not provided∗ no students in the year level sat the test due to absence, exemption or withdrawal– no students in the year levelNMS National Minimum Standard (for further information see www.nap.edu.au)
Queensland Curriculum & Assessment Authority
Page 85 of 149
NAPLAN 2014 Outcomes — All Queensland schools

Year level enrolments Year 3 Year 5 Year 7 Year 9
School Locality Yr 3 Yr 5 Yr 7 Yr 9 READ WRIT SPEL GP NMCY READ WRIT SPEL GP NMCY READ WRIT SPEL GP NMCY READ WRIT SPEL GP NMCY
Nanango State School Nanango 56 63 46 –
Average score of the school 394 362 380 390 378 468 428 453 478 450 515 455 516 509 510 – – – – –
Percentage (%) of students at or above NMS 87% 87% 89% 91% 90% 77% 68% 73% 70% 81% 88% 65% 78% 85% 86% – – – – –
Narangba State School Narangba 83 72 41 –
Average score of the school 412 413 403 432 394 498 460 487 493 473 521 479 518 510 515 – – – – –
Percentage (%) of students at or above NMS 91% 99% 96% 97% 96% 94% 88% 94% 95% 89% 100% 81% 84% 92% 100% – – – – –
Narangba Valley State High School Narangba – – – 442
Average score of the school – – – – – – – – – – – – – – – 577 561 587 586 576
Percentage (%) of students at or above NMS – – – – – – – – – – – – – – – 93% 86% 95% 93% 98%
Narangba Valley State School Narangba 147 163 82 –
Average score of the school 423 410 422 451 410 500 473 504 509 493 549 518 536 539 551 – – – – –
Percentage (%) of students at or above NMS 100% 100% 99% 100% 100% 93% 93% 97% 97% 96% 99% 94% 96% 93% 99% – – – – –
Narbethong State Special School Buranda 7 2 6 5
Average score of the school ∗ ∗ ∗ ∗ ∗ ∗ ∗ ∗ ∗ ∗ ∗ ∗ ∗ ∗ ∗ ∗ ∗ ∗ ∗ ∗Percentage (%) of students at or above NMS ∗ ∗ ∗ ∗ ∗ ∗ ∗ ∗ ∗ ∗ ∗ ∗ ∗ ∗ ∗ ∗ ∗ ∗ ∗ ∗
Nashville State School Brighton 38 19 29 –
Average score of the school 411 377 379 391 367 500 452 473 501 469 551 496 518 538 546 – – – – –
Percentage (%) of students at or above NMS 95% 92% 86% 86% 92% 78% 84% 79% 95% 100% 100% 93% 90% 90% 100% – – – – –
Nebo State School Nebo 9 8 7 –
Average score of the school 464 456 452 488 467 473 433 493 471 470 508 492 529 517 547 – – – – –
Percentage (%) of students at or above NMS 100% 100% 100% 100% 100% 88% 75% 88% 88% 88% 86% 86% 86% 86% 86% – – – – –
Nerang State High School Nerang – – – 198
Average score of the school – – – – – – – – – – – – – – – 550 535 568 554 560
Percentage (%) of students at or above NMS – – – – – – – – – – – – – – – 83% 81% 92% 85% 94%
Nerang State School Nerang 68 49 37 –
Average score of the school 369 391 379 388 359 459 446 467 465 435 500 451 503 493 498 – – – – –
Percentage (%) of students at or above NMS 89% 95% 92% 97% 94% 98% 88% 93% 93% 93% 86% 69% 84% 81% 89% – – – – –
New Farm State School New Farm 62 45 20 –
Average score of the school 458 440 438 491 426 552 477 525 549 510 585 530 584 605 594 – – – – –
Percentage (%) of students at or above NMS 97% 100% 100% 100% 98% 100% 98% 95% 98% 100% 95% 85% 100% 95% 95% – – – – –
Newmarket State School Newmarket 27 24 16 –
Average score of the school 424 392 419 440 418 555 505 525 565 549 614 557 561 605 593 – – – – –
Percentage (%) of students at or above NMS 96% 96% 96% 100% 100% 92% 92% 100% 100% 100% 100% 100% 100% 100% 100% – – – – –
Newtown State School Toowoomba 48 42 32 –
Average score of the school 365 357 352 380 352 464 430 472 469 454 497 455 493 489 500 – – – – –
Percentage (%) of students at or above NMS 89% 92% 88% 83% 91% 83% 74% 79% 87% 85% 90% 68% 84% 65% 94% – – – – –
KEY∧ to maintain privacy of individual student information, where there are fewer than five students tested results are not provided∗ no students in the year level sat the test due to absence, exemption or withdrawal– no students in the year levelNMS National Minimum Standard (for further information see www.nap.edu.au)
Queensland Curriculum & Assessment Authority
Page 86 of 149
NAPLAN 2014 Outcomes — All Queensland schools

Year level enrolments Year 3 Year 5 Year 7 Year 9
School Locality Yr 3 Yr 5 Yr 7 Yr 9 READ WRIT SPEL GP NMCY READ WRIT SPEL GP NMCY READ WRIT SPEL GP NMCY READ WRIT SPEL GP NMCY
Nobby State School Nobby 4 3 – –
Average score of the school ∧ ∧ ∧ ∧ ∧ ∧ ∧ ∧ ∧ ∧ – – – – – – – – – –
Percentage (%) of students at or above NMS ∧ ∧ ∧ ∧ ∧ ∧ ∧ ∧ ∧ ∧ – – – – – – – – – –
Noosa Christian College Cooroy 19 21 18 18
Average score of the school 439 417 405 459 413 506 463 498 475 479 567 492 563 583 563 567 552 576 561 594
Percentage (%) of students at or above NMS 100% 100% 100% 100% 94% 100% 100% 100% 94% 100% 100% 94% 100% 100% 94% 100% 94% 89% 94% 100%
Noosa District State High School Cooroy – – – 183
Average score of the school – – – – – – – – – – – – – – – 567 532 564 569 567
Percentage (%) of students at or above NMS – – – – – – – – – – – – – – – 83% 68% 79% 81% 87%
Noosa District State High School - Pomona
Campus
Pomona – – – 51
Average score of the school – – – – – – – – – – – – – – – 572 527 561 566 563
Percentage (%) of students at or above NMS – – – – – – – – – – – – – – – 91% 70% 88% 88% 98%
Noosa Pengari Steiner School Doonan 25 27 25 20
Average score of the school ∗ ∗ ∗ ∗ ∧ ∧ ∧ ∧ ∧ ∧ ∧ ∧ ∧ ∧ ∧ ∧ ∧ ∧ ∧ ∧Percentage (%) of students at or above NMS ∗ ∗ ∗ ∗ ∧ ∧ ∧ ∧ ∧ ∧ ∧ ∧ ∧ ∧ ∧ ∧ ∧ ∧ ∧ ∧
Noosaville State School Noosaville 78 81 42 –
Average score of the school 427 391 410 421 396 472 442 477 480 481 510 481 528 525 511 – – – – –
Percentage (%) of students at or above NMS 96% 94% 96% 94% 96% 81% 78% 89% 89% 91% 93% 87% 95% 95% 95% – – – – –
Norfolk Village State School Ormeau 164 136 55 –
Average score of the school 417 396 413 431 394 500 467 509 514 482 536 505 531 528 537 – – – – –
Percentage (%) of students at or above NMS 96% 97% 98% 99% 98% 98% 92% 98% 97% 93% 98% 87% 91% 96% 100% – – – – –
Norman Park State School Norman Park 69 42 21 –
Average score of the school 458 427 448 479 440 558 504 531 556 539 557 542 539 582 585 – – – – –
Percentage (%) of students at or above NMS 96% 96% 100% 99% 99% 100% 98% 95% 98% 100% 95% 95% 100% 90% 100% – – – – –
Normanton State School Normanton 22 17 18 18
Average score of the school 294 311 322 296 283 376 377 396 368 371 451 340 444 403 449 498 449 502 486 497
Percentage (%) of students at or above NMS 59% 73% 73% 55% 57% 38% 35% 47% 29% 29% 57% 20% 63% 38% 87% 28% 28% 61% 50% 50%
Norris Road State School Bracken Ridge 67 69 39 –
Average score of the school 429 408 436 456 398 501 444 483 510 481 537 505 566 560 560 – – – – –
Percentage (%) of students at or above NMS 100% 98% 100% 98% 98% 90% 85% 90% 92% 93% 94% 88% 97% 94% 100% – – – – –
North Arm State School via Yandina 64 41 25 –
Average score of the school 451 408 415 445 438 519 438 474 491 489 541 519 530 540 535 – – – – –
Percentage (%) of students at or above NMS 100% 97% 98% 100% 100% 95% 78% 78% 83% 92% 100% 100% 100% 96% 100% – – – – –
KEY∧ to maintain privacy of individual student information, where there are fewer than five students tested results are not provided∗ no students in the year level sat the test due to absence, exemption or withdrawal– no students in the year levelNMS National Minimum Standard (for further information see www.nap.edu.au)
Queensland Curriculum & Assessment Authority
Page 87 of 149
NAPLAN 2014 Outcomes — All Queensland schools

Year level enrolments Year 3 Year 5 Year 7 Year 9
School Locality Yr 3 Yr 5 Yr 7 Yr 9 READ WRIT SPEL GP NMCY READ WRIT SPEL GP NMCY READ WRIT SPEL GP NMCY READ WRIT SPEL GP NMCY
North Lakes State College North Lakes 154 173 145 302
Average score of the school 416 408 412 434 404 510 464 501 520 500 546 526 551 555 550 570 541 580 568 577
Percentage (%) of students at or above NMS 97% 97% 97% 97% 97% 96% 89% 94% 98% 96% 98% 95% 97% 96% 100% 90% 77% 91% 87% 96%
North Rockhampton State High School Rockhampton North – – – 181
Average score of the school – – – – – – – – – – – – – – – 550 523 554 545 555
Percentage (%) of students at or above NMS – – – – – – – – – – – – – – – 82% 66% 79% 75% 90%
Northern Beaches State High School Deeragun – – 46 114
Average score of the school – – – – – – – – – – 513 478 497 504 505 537 492 537 530 536
Percentage (%) of students at or above NMS – – – – – – – – – – 93% 86% 87% 91% 93% 77% 54% 80% 76% 85%
Northern Peninsula Area College - Bamaga
Junior Campus
Bamaga 31 37 10 –
Average score of the school 318 328 361 322 324 387 397 453 403 408 461 413 481 425 484 – – – – –
Percentage (%) of students at or above NMS 77% 84% 87% 74% 77% 54% 59% 71% 57% 79% 70% 50% 80% 50% 89% – – – – –
Northern Peninsula Area College - Injinoo
Junior Campus
Injinoo 18 23 6 –
Average score of the school 316 286 300 300 272 387 377 431 383 404 423 373 430 401 550 – – – – –
Percentage (%) of students at or above NMS 64% 58% 58% 67% 56% 52% 43% 76% 52% 65% 33% 0% 67% 17% 100% – – – – –
Northern Peninsula Area State College Bamaga – – – 38
Average score of the school – – – – – – – – – – – – – – – 439 397 466 433 474
Percentage (%) of students at or above NMS – – – – – – – – – – – – – – – 15% 6% 44% 24% 55%
Northgate State School Nundah 24 17 16 –
Average score of the school 400 377 377 413 375 508 482 514 559 525 537 495 513 508 553 – – – – –
Percentage (%) of students at or above NMS 96% 96% 91% 87% 91% 88% 88% 88% 88% 88% 100% 80% 80% 73% 100% – – – – –
Northpine Christian College Dakabin 73 70 49 72
Average score of the school 447 415 432 460 421 507 464 505 509 493 558 497 555 547 550 565 504 581 558 583
Percentage (%) of students at or above NMS 100% 99% 99% 100% 100% 97% 91% 99% 100% 99% 100% 87% 96% 96% 100% 93% 62% 94% 87% 99%
Northside Christian College Everton Park 86 90 96 113
Average score of the school 475 433 448 500 440 551 500 502 548 517 554 534 539 560 549 606 601 601 603 604
Percentage (%) of students at or above NMS 100% 97% 100% 100% 98% 100% 98% 100% 99% 100% 95% 93% 93% 95% 95% 97% 94% 97% 96% 97%
Northview State School Mount Pleasant 53 50 30 –
Average score of the school 402 396 395 426 391 479 452 476 482 467 519 512 531 548 555 – – – – –
Percentage (%) of students at or above NMS 83% 88% 89% 89% 92% 91% 87% 91% 91% 96% 79% 86% 82% 82% 89% – – – – –
Norville State School Bundaberg 100 86 80 –
Average score of the school 427 401 412 431 411 475 450 474 496 481 532 455 507 514 540 – – – – –
Percentage (%) of students at or above NMS 96% 98% 97% 96% 98% 86% 85% 91% 98% 93% 91% 70% 72% 81% 88% – – – – –
KEY∧ to maintain privacy of individual student information, where there are fewer than five students tested results are not provided∗ no students in the year level sat the test due to absence, exemption or withdrawal– no students in the year levelNMS National Minimum Standard (for further information see www.nap.edu.au)
Queensland Curriculum & Assessment Authority
Page 88 of 149
NAPLAN 2014 Outcomes — All Queensland schools

Year level enrolments Year 3 Year 5 Year 7 Year 9
School Locality Yr 3 Yr 5 Yr 7 Yr 9 READ WRIT SPEL GP NMCY READ WRIT SPEL GP NMCY READ WRIT SPEL GP NMCY READ WRIT SPEL GP NMCY
Numinbah Valley State School Numinbah Valley via Nerang 1 2 2 –
Average score of the school ∧ ∧ ∧ ∧ ∧ ∧ ∧ ∧ ∧ ∧ ∧ ∧ ∧ ∧ ∧ – – – – –
Percentage (%) of students at or above NMS ∧ ∧ ∧ ∧ ∧ ∧ ∧ ∧ ∧ ∧ ∧ ∧ ∧ ∧ ∧ – – – – –
Nundah State School Nundah 87 84 45 –
Average score of the school 414 398 421 439 407 525 467 502 516 497 559 502 539 551 548 – – – – –
Percentage (%) of students at or above NMS 93% 97% 94% 94% 94% 94% 90% 91% 95% 95% 98% 89% 88% 95% 98% – – – – –
Nursery Road State Special School Holland Park 7 3 11 13
Average score of the school ∗ ∗ ∗ ∗ ∗ ∗ ∗ ∗ ∗ ∗ ∗ ∗ ∗ ∗ ∗ ∗ ∗ ∗ ∗ ∗Percentage (%) of students at or above NMS ∗ ∗ ∗ ∗ ∗ ∗ ∗ ∗ ∗ ∗ ∗ ∗ ∗ ∗ ∗ ∗ ∗ ∗ ∗ ∗
Oakenden State School Sarina 4 3 – –
Average score of the school ∧ ∧ ∧ ∧ ∧ ∧ ∧ ∧ ∧ ∧ – – – – – – – – – –
Percentage (%) of students at or above NMS ∧ ∧ ∧ ∧ ∧ ∧ ∧ ∧ ∧ ∧ – – – – – – – – – –
Oakey State High School Oakey – – – 123
Average score of the school – – – – – – – – – – – – – – – 553 520 553 552 561
Percentage (%) of students at or above NMS – – – – – – – – – – – – – – – 78% 66% 74% 81% 89%
Oakey State School Oakey 62 46 29 –
Average score of the school 359 353 354 353 348 449 422 449 449 442 511 437 506 502 516 – – – – –
Percentage (%) of students at or above NMS 81% 90% 83% 78% 83% 71% 69% 76% 71% 78% 81% 64% 79% 79% 74% – – – – –
Oakleigh State School Ashgrove 83 69 24 –
Average score of the school 477 394 447 478 441 545 478 515 537 510 587 561 554 577 572 – – – – –
Percentage (%) of students at or above NMS 100% 98% 100% 100% 99% 99% 99% 99% 99% 99% 100% 100% 100% 100% 100% – – – – –
Oakwood State School Bundaberg 14 10 12 –
Average score of the school 425 384 411 433 417 476 446 475 472 468 514 481 520 482 526 – – – – –
Percentage (%) of students at or above NMS 100% 100% 100% 100% 100% 100% 80% 100% 100% 100% 100% 91% 82% 73% 100% – – – – –
One Mile State School Gympie 69 60 52 –
Average score of the school 409 396 401 438 377 479 436 471 494 468 520 493 504 518 523 – – – – –
Percentage (%) of students at or above NMS 95% 98% 98% 100% 98% 87% 78% 88% 96% 93% 92% 88% 82% 90% 94% – – – – –
Oonoonba State School Oonoonba 84 70 37 –
Average score of the school 382 358 369 373 365 495 466 469 486 486 538 515 555 537 555 – – – – –
Percentage (%) of students at or above NMS 89% 89% 96% 89% 93% 91% 90% 85% 94% 94% 94% 89% 92% 89% 97% – – – – –
Orion State School Orion via Springsure 3 – – –
Average score of the school ∧ ∧ ∧ ∧ ∧ – – – – – – – – – – – – – – –
Percentage (%) of students at or above NMS ∧ ∧ ∧ ∧ ∧ – – – – – – – – – – – – – – –
Ormeau State School Pimpama 120 126 63 –
Average score of the school 406 392 402 416 394 485 460 493 480 472 549 509 541 558 542 – – – – –
Percentage (%) of students at or above NMS 90% 97% 91% 95% 96% 94% 91% 92% 93% 94% 97% 95% 98% 97% 97% – – – – –
KEY∧ to maintain privacy of individual student information, where there are fewer than five students tested results are not provided∗ no students in the year level sat the test due to absence, exemption or withdrawal– no students in the year levelNMS National Minimum Standard (for further information see www.nap.edu.au)
Queensland Curriculum & Assessment Authority
Page 89 of 149
NAPLAN 2014 Outcomes — All Queensland schools

Year level enrolments Year 3 Year 5 Year 7 Year 9
School Locality Yr 3 Yr 5 Yr 7 Yr 9 READ WRIT SPEL GP NMCY READ WRIT SPEL GP NMCY READ WRIT SPEL GP NMCY READ WRIT SPEL GP NMCY
Ormeau Woods State High School Ormeau – – – 195
Average score of the school – – – – – – – – – – – – – – – 551 525 563 543 559
Percentage (%) of students at or above NMS – – – – – – – – – – – – – – – 90% 73% 90% 83% 98%
Ormiston College Ormiston 83 104 107 136
Average score of the school 456 447 455 490 445 541 510 525 555 551 589 543 573 589 630 625 615 631 638 656
Percentage (%) of students at or above NMS 100% 100% 100% 100% 100% 100% 100% 100% 98% 100% 99% 97% 100% 98% 100% 99% 98% 99% 99% 100%
Ormiston State School Ormiston 88 69 7 –
Average score of the school 447 392 416 454 420 523 450 490 525 500 553 501 538 553 547 – – – – –
Percentage (%) of students at or above NMS 99% 95% 94% 96% 100% 98% 90% 98% 97% 100% 100% 71% 100% 100% 100% – – – – –
Osborne State School via Home Hill 1 2 2 –
Average score of the school ∗ ∗ ∗ ∗ ∗ ∧ ∧ ∧ ∧ ∧ ∧ ∧ ∧ ∧ ∧ – – – – –
Percentage (%) of students at or above NMS ∗ ∗ ∗ ∗ ∗ ∧ ∧ ∧ ∧ ∧ ∧ ∧ ∧ ∧ ∧ – – – – –
Our Lady Help of Christians School (Earlville) Earlville 81 66 52 –
Average score of the school 411 400 398 420 385 495 485 492 490 479 542 500 520 530 540 – – – – –
Percentage (%) of students at or above NMS 94% 96% 95% 96% 95% 94% 91% 94% 94% 97% 94% 88% 88% 92% 96% – – – – –
Our Lady Help of Christians School (Hendra) Hendra 21 9 5 –
Average score of the school 448 423 451 451 426 494 499 512 497 475 584 569 540 568 517 – – – – –
Percentage (%) of students at or above NMS 100% 100% 100% 100% 100% 100% 100% 100% 100% 89% 100% 100% 100% 100% 100% – – – – –
Our Lady of Dolours School (Mitchelton) Mitchelton 32 24 13 –
Average score of the school 466 459 451 514 444 522 493 503 535 500 548 544 530 567 536 – – – – –
Percentage (%) of students at or above NMS 97% 100% 97% 100% 100% 100% 100% 100% 100% 100% 100% 100% 91% 100% 100% – – – – –
Our Lady of Fatima Primary School (Acacia
Ridge)
Acacia Ridge 32 14 12 –
Average score of the school 357 318 365 360 332 465 458 511 486 455 506 479 515 509 488 – – – – –
Percentage (%) of students at or above NMS 84% 81% 88% 88% 81% 85% 92% 92% 92% 92% 92% 92% 83% 83% 100% – – – – –
Our Lady of Good Counsel School (Gatton) Gatton 49 37 21 –
Average score of the school 378 374 365 377 363 447 430 464 461 454 530 496 510 522 524 – – – – –
Percentage (%) of students at or above NMS 85% 100% 89% 91% 96% 80% 79% 85% 94% 91% 84% 84% 89% 74% 95% – – – – –
Our Lady of Lourdes Primary School
(Sunnybank)
Sunnybank 72 50 25 –
Average score of the school 409 411 404 423 408 511 489 516 533 500 554 537 574 563 569 – – – – –
Percentage (%) of students at or above NMS 93% 100% 97% 94% 100% 96% 94% 98% 98% 96% 100% 100% 100% 100% 100% – – – – –
KEY∧ to maintain privacy of individual student information, where there are fewer than five students tested results are not provided∗ no students in the year level sat the test due to absence, exemption or withdrawal– no students in the year levelNMS National Minimum Standard (for further information see www.nap.edu.au)
Queensland Curriculum & Assessment Authority
Page 90 of 149
NAPLAN 2014 Outcomes — All Queensland schools

Year level enrolments Year 3 Year 5 Year 7 Year 9
School Locality Yr 3 Yr 5 Yr 7 Yr 9 READ WRIT SPEL GP NMCY READ WRIT SPEL GP NMCY READ WRIT SPEL GP NMCY READ WRIT SPEL GP NMCY
Our Lady of Lourdes Primary School
(Toowoomba)
Toowoomba 52 50 49 –
Average score of the school 436 401 391 421 396 514 478 494 525 493 523 489 505 521 519 – – – – –
Percentage (%) of students at or above NMS 94% 98% 96% 98% 98% 98% 98% 96% 100% 100% 96% 90% 88% 90% 92% – – – – –
Our Lady of Lourdes School (Ingham) Ingham 34 33 17 –
Average score of the school 400 376 392 401 371 500 484 502 508 472 551 533 575 594 563 – – – – –
Percentage (%) of students at or above NMS 100% 100% 100% 97% 100% 100% 100% 96% 100% 93% 93% 86% 93% 93% 93% – – – – –
Our Lady of Mount Carmel School
(Coorparoo)
Coorparoo 85 51 38 –
Average score of the school 477 452 452 498 437 539 499 507 556 521 591 579 570 600 586 – – – – –
Percentage (%) of students at or above NMS 100% 99% 100% 100% 100% 98% 100% 96% 96% 96% 100% 100% 100% 100% 100% – – – – –
Our Lady of The Sacred Heart Catholic
Primary School (Springsure)
Springsure 15 8 2 –
Average score of the school 400 387 365 396 408 491 460 463 475 450 ∧ ∧ ∧ ∧ ∧ – – – – –
Percentage (%) of students at or above NMS 100% 93% 87% 93% 100% 100% 100% 100% 100% 100% ∧ ∧ ∧ ∧ ∧ – – – – –
Our Lady of the Angels’ School (Wavell
Heights)
Wavell Heights 87 53 31 –
Average score of the school 426 418 401 432 416 519 501 513 514 493 560 530 570 570 543 – – – – –
Percentage (%) of students at or above NMS 94% 99% 99% 98% 99% 94% 94% 96% 94% 94% 97% 97% 97% 97% 97% – – – – –
Our Lady of the Assumption School
(Enoggera)
Enoggera 68 37 31 –
Average score of the school 445 431 438 480 432 510 488 501 515 484 570 537 584 602 575 – – – – –
Percentage (%) of students at or above NMS 93% 94% 96% 94% 96% 100% 95% 97% 97% 100% 94% 94% 94% 94% 100% – – – – –
Our Lady of the Rosary School (Caloundra) Caloundra 55 58 12 –
Average score of the school 406 383 396 412 399 494 450 493 498 477 525 486 536 546 529 – – – – –
Percentage (%) of students at or above NMS 91% 91% 93% 91% 90% 96% 87% 96% 95% 94% 90% 90% 80% 100% 100% – – – – –
Our Lady of the Rosary School (Kenmore) Kenmore 94 60 33 –
Average score of the school 425 409 411 434 407 533 496 512 533 493 585 530 567 571 546 – – – – –
Percentage (%) of students at or above NMS 96% 99% 97% 99% 97% 100% 98% 100% 98% 98% 100% 97% 97% 97% 100% – – – – –
Our Lady of the Sacred Heart (Hammond
Island)
Hammond Island 3 – – –
Average score of the school ∧ ∧ ∧ ∧ ∧ – – – – – – – – – – – – – – –
Percentage (%) of students at or above NMS ∧ ∧ ∧ ∧ ∧ – – – – – – – – – – – – – – –
KEY∧ to maintain privacy of individual student information, where there are fewer than five students tested results are not provided∗ no students in the year level sat the test due to absence, exemption or withdrawal– no students in the year levelNMS National Minimum Standard (for further information see www.nap.edu.au)
Queensland Curriculum & Assessment Authority
Page 91 of 149
NAPLAN 2014 Outcomes — All Queensland schools

Year level enrolments Year 3 Year 5 Year 7 Year 9
School Locality Yr 3 Yr 5 Yr 7 Yr 9 READ WRIT SPEL GP NMCY READ WRIT SPEL GP NMCY READ WRIT SPEL GP NMCY READ WRIT SPEL GP NMCY
Our Lady of the Sacred Heart School
(Thursday Island)
Thursday Island 14 18 12 –
Average score of the school 383 391 390 403 372 444 450 483 458 433 518 477 507 472 508 – – – – –
Percentage (%) of students at or above NMS 85% 100% 100% 100% 100% 78% 89% 94% 83% 72% 89% 70% 90% 60% 100% – – – – –
Our Lady of the Sacred Heart School Darra Darra 69 73 31 –
Average score of the school 402 401 409 414 383 508 483 516 530 505 544 554 525 560 550 – – – – –
Percentage (%) of students at or above NMS 94% 97% 93% 94% 96% 93% 92% 96% 97% 96% 97% 90% 90% 94% 100% – – – – –
Our Lady of the Southern Cross College Dalby 61 38 37 70
Average score of the school 397 378 389 415 374 475 445 474 473 478 527 508 523 540 539 563 529 562 551 565
Percentage (%) of students at or above NMS 97% 95% 98% 97% 95% 91% 89% 80% 94% 97% 95% 95% 92% 89% 97% 90% 70% 87% 86% 100%
Our Lady of the Way School (Petrie) Petrie 50 36 32 –
Average score of the school 408 359 381 390 378 476 439 466 466 468 539 496 519 533 524 – – – – –
Percentage (%) of students at or above NMS 91% 96% 92% 92% 96% 88% 83% 91% 89% 94% 97% 90% 94% 94% 97% – – – – –
Our Lady’s Catholic Primary School
(Longreach)
Longreach 12 16 9 –
Average score of the school 378 348 389 368 353 517 474 477 523 475 483 458 434 464 478 – – – – –
Percentage (%) of students at or above NMS 100% 91% 100% 82% 100% 100% 93% 100% 100% 87% 78% 67% 56% 67% 75% – – – – –
Our Lady’s College Annerley – – – 49
Average score of the school – – – – – – – – – – – – – – – 577 588 595 580 569
Percentage (%) of students at or above NMS – – – – – – – – – – – – – – – 98% 92% 92% 98% 98%
Oxenford State School Oxenford 86 90 42 –
Average score of the school 397 388 406 408 385 491 440 482 495 484 534 501 539 551 531 – – – – –
Percentage (%) of students at or above NMS 89% 96% 91% 90% 92% 90% 75% 88% 89% 90% 95% 80% 95% 95% 97% – – – – –
Oxley State School Oxley 74 49 49 –
Average score of the school 413 391 414 425 404 498 452 489 502 481 558 530 560 563 553 – – – – –
Percentage (%) of students at or above NMS 96% 97% 96% 96% 96% 92% 88% 96% 90% 94% 100% 90% 98% 96% 100% – – – – –
Pacific Lutheran College Meridan Plains 59 69 56 87
Average score of the school 410 401 390 406 390 529 484 518 526 527 551 507 532 548 563 591 567 588 585 597
Percentage (%) of students at or above NMS 95% 98% 100% 97% 97% 97% 97% 100% 97% 100% 100% 88% 92% 96% 100% 95% 89% 90% 94% 99%
Pacific Paradise State School Pacific Paradise 78 84 54 –
Average score of the school 391 370 393 401 381 494 458 489 487 473 543 479 522 537 550 – – – – –
Percentage (%) of students at or above NMS 93% 92% 93% 96% 93% 96% 91% 94% 95% 94% 96% 73% 92% 90% 98% – – – – –
Pacific Pines State High School Pacific Pines – – – 257
Average score of the school – – – – – – – – – – – – – – – 565 537 570 559 571
Percentage (%) of students at or above NMS – – – – – – – – – – – – – – – 90% 76% 89% 85% 95%
KEY∧ to maintain privacy of individual student information, where there are fewer than five students tested results are not provided∗ no students in the year level sat the test due to absence, exemption or withdrawal– no students in the year levelNMS National Minimum Standard (for further information see www.nap.edu.au)
Queensland Curriculum & Assessment Authority
Page 92 of 149
NAPLAN 2014 Outcomes — All Queensland schools

Year level enrolments Year 3 Year 5 Year 7 Year 9
School Locality Yr 3 Yr 5 Yr 7 Yr 9 READ WRIT SPEL GP NMCY READ WRIT SPEL GP NMCY READ WRIT SPEL GP NMCY READ WRIT SPEL GP NMCY
Pacific Pines State School Pacific Pines 156 154 111 –
Average score of the school 397 361 387 406 390 474 433 478 478 470 535 487 532 540 530 – – – – –
Percentage (%) of students at or above NMS 89% 87% 91% 91% 95% 92% 83% 93% 92% 91% 92% 80% 88% 91% 95% – – – – –
Padua College Kedron – 142 86 179
Average score of the school – – – – – 531 482 506 522 521 559 533 541 553 560 595 569 587 595 612
Percentage (%) of students at or above NMS – – – – – 99% 97% 99% 99% 100% 99% 96% 99% 96% 99% 99% 88% 94% 97% 100%
Pallara State School Pallara 32 37 23 –
Average score of the school 411 402 400 407 406 497 461 475 503 472 517 508 528 509 510 – – – – –
Percentage (%) of students at or above NMS 93% 96% 93% 93% 93% 94% 91% 94% 97% 89% 95% 95% 91% 91% 100% – – – – –
Palm Beach State School Palm Beach 56 57 40 –
Average score of the school 425 372 417 433 396 514 469 498 513 496 530 498 525 516 509 – – – – –
Percentage (%) of students at or above NMS 98% 92% 100% 100% 98% 98% 93% 94% 100% 98% 92% 90% 90% 82% 89% – – – – –
Palm Beach-Currumbin State High School Palm Beach – – – 467
Average score of the school – – – – – – – – – – – – – – – 583 567 591 584 595
Percentage (%) of students at or above NMS – – – – – – – – – – – – – – – 96% 87% 96% 95% 99%
Palmwoods State School Palmwoods 65 49 34 –
Average score of the school 386 388 385 405 391 528 447 485 489 487 535 516 528 521 526 – – – – –
Percentage (%) of students at or above NMS 94% 100% 95% 94% 98% 100% 85% 95% 95% 100% 100% 100% 97% 100% 100% – – – – –
Park Avenue State School Rockhampton North 14 12 10 –
Average score of the school 353 346 375 362 338 437 406 460 448 428 473 453 495 488 473 – – – – –
Percentage (%) of students at or above NMS 83% 91% 100% 91% 80% 100% 73% 82% 91% 82% 67% 78% 89% 78% 78% – – – – –
Park Lake State School Pacific Pines 95 90 36 –
Average score of the school 387 390 377 404 388 491 460 498 486 471 526 498 528 533 541 – – – – –
Percentage (%) of students at or above NMS 94% 96% 91% 97% 98% 93% 87% 93% 88% 92% 94% 88% 91% 91% 97% – – – – –
Park Ridge State High School Park Ridge – – – 186
Average score of the school – – – – – – – – – – – – – – – 549 526 557 549 555
Percentage (%) of students at or above NMS – – – – – – – – – – – – – – – 93% 73% 88% 88% 97%
Park Ridge State School Park Ridge 75 65 39 –
Average score of the school 371 365 397 384 364 468 452 485 490 454 503 484 518 496 493 – – – – –
Percentage (%) of students at or above NMS 94% 90% 96% 96% 94% 82% 78% 87% 89% 85% 88% 78% 94% 94% 94% – – – – –
Parke State School Tinana South 10 14 9 –
Average score of the school 375 383 362 389 366 485 484 492 501 470 530 493 501 522 537 – – – – –
Percentage (%) of students at or above NMS 90% 100% 90% 100% 100% 100% 100% 100% 92% 100% 86% 86% 86% 86% 100% – – – – –
Parkhurst State School Parkhurst 39 35 23 –
Average score of the school 362 369 385 389 363 454 432 469 477 448 539 482 528 545 544 – – – – –
Percentage (%) of students at or above NMS 80% 86% 86% 89% 86% 76% 77% 81% 81% 85% 91% 82% 86% 86% 95% – – – – –
KEY∧ to maintain privacy of individual student information, where there are fewer than five students tested results are not provided∗ no students in the year level sat the test due to absence, exemption or withdrawal– no students in the year levelNMS National Minimum Standard (for further information see www.nap.edu.au)
Queensland Curriculum & Assessment Authority
Page 93 of 149
NAPLAN 2014 Outcomes — All Queensland schools

Year level enrolments Year 3 Year 5 Year 7 Year 9
School Locality Yr 3 Yr 5 Yr 7 Yr 9 READ WRIT SPEL GP NMCY READ WRIT SPEL GP NMCY READ WRIT SPEL GP NMCY READ WRIT SPEL GP NMCY
Parklands Christian College Park Ridge 54 47 30 40
Average score of the school 390 369 390 407 376 501 452 496 524 488 488 474 497 498 515 550 527 576 568 557
Percentage (%) of students at or above NMS 90% 94% 98% 94% 94% 95% 88% 98% 98% 95% 93% 79% 86% 86% 97% 95% 75% 93% 95% 97%
Parramatta State School Parramatta Park 62 53 44 –
Average score of the school 352 364 397 345 361 420 412 454 428 436 474 448 502 468 527 – – – – –
Percentage (%) of students at or above NMS 84% 92% 96% 82% 90% 76% 80% 75% 70% 74% 82% 73% 84% 66% 100% – – – – –
Patrick Estate State School Patrick Estate via Lowood 6 6 8 –
Average score of the school 320 308 275 273 301 418 373 408 436 434 511 444 508 517 507 – – – – –
Percentage (%) of students at or above NMS 67% 83% 67% 50% 83% 83% 50% 67% 67% 67% 86% 57% 86% 86% 100% – – – – –
Patricks Road State School Ferny Hills 77 76 64 –
Average score of the school 477 444 452 516 443 541 480 507 549 521 563 520 557 561 566 – – – – –
Percentage (%) of students at or above NMS 99% 100% 100% 99% 99% 99% 95% 92% 100% 99% 100% 97% 100% 98% 100% – – – – –
Payne Road State School The Gap 32 29 17 –
Average score of the school 406 370 381 407 393 507 460 494 523 513 577 531 574 598 577 – – – – –
Percentage (%) of students at or above NMS 90% 94% 94% 90% 94% 93% 83% 93% 100% 100% 92% 93% 100% 100% 100% – – – – –
Peace Lutheran College Kamerunga 47 44 49 59
Average score of the school 452 423 418 460 434 520 478 488 511 481 545 502 552 538 549 589 547 582 574 573
Percentage (%) of students at or above NMS 100% 100% 98% 100% 100% 100% 100% 98% 100% 100% 94% 92% 98% 98% 100% 87% 77% 98% 89% 94%
Peace Lutheran Primary School (Gatton) Gatton 42 37 18 –
Average score of the school 372 320 356 372 360 480 426 477 468 449 490 483 488 486 506 – – – – –
Percentage (%) of students at or above NMS 89% 82% 92% 90% 92% 86% 71% 83% 83% 94% 83% 72% 78% 72% 94% – – – – –
Peachester State School Peachester 21 19 5 –
Average score of the school 416 367 416 443 396 505 431 467 497 476 532 ∧ ∧ ∧ 518 – – – – –
Percentage (%) of students at or above NMS 94% 94% 94% 94% 100% 93% 87% 87% 80% 100% 100% ∧ ∧ ∧ 100% – – – – –
Peak Crossing State School Peak Crossing 37 27 11 –
Average score of the school 404 413 403 417 384 503 460 467 499 482 573 503 562 554 553 – – – – –
Percentage (%) of students at or above NMS 97% 100% 97% 94% 97% 85% 92% 88% 92% 96% 100% 91% 91% 100% 91% – – – – –
Pentland State School Pentland 1 1 1 –
Average score of the school ∧ ∧ ∧ ∧ ∧ ∗ ∗ ∗ ∗ ∗ ∧ ∧ ∧ ∧ ∧ – – – – –
Percentage (%) of students at or above NMS ∧ ∧ ∧ ∧ ∧ ∗ ∗ ∗ ∗ ∗ ∧ ∧ ∧ ∧ ∧ – – – – –
Peregian Beach College Peregian Beach 19 21 15 11
Average score of the school 479 416 443 481 435 541 492 523 536 512 595 548 578 592 590 617 551 595 573 587
Percentage (%) of students at or above NMS 100% 100% 100% 100% 100% 90% 86% 86% 90% 90% 100% 100% 100% 100% 100% 91% 73% 82% 82% 91%
Peregian Springs State School Peregian Springs 129 94 50 –
Average score of the school 438 403 412 445 421 522 478 500 514 506 564 519 575 568 591 – – – – –
Percentage (%) of students at or above NMS 98% 99% 100% 99% 100% 98% 96% 97% 95% 97% 100% 96% 100% 98% 100% – – – – –
KEY∧ to maintain privacy of individual student information, where there are fewer than five students tested results are not provided∗ no students in the year level sat the test due to absence, exemption or withdrawal– no students in the year levelNMS National Minimum Standard (for further information see www.nap.edu.au)
Queensland Curriculum & Assessment Authority
Page 94 of 149
NAPLAN 2014 Outcomes — All Queensland schools

Year level enrolments Year 3 Year 5 Year 7 Year 9
School Locality Yr 3 Yr 5 Yr 7 Yr 9 READ WRIT SPEL GP NMCY READ WRIT SPEL GP NMCY READ WRIT SPEL GP NMCY READ WRIT SPEL GP NMCY
Petrie State School Petrie 78 57 39 –
Average score of the school 398 372 385 422 396 488 424 464 496 482 521 454 514 532 526 – – – – –
Percentage (%) of students at or above NMS 91% 91% 92% 96% 97% 85% 81% 91% 91% 92% 92% 67% 89% 86% 92% – – – – –
Petrie Terrace State School Paddington 30 25 14 –
Average score of the school 430 356 409 410 390 506 460 494 528 495 566 522 556 583 586 – – – – –
Percentage (%) of students at or above NMS 93% 93% 93% 93% 97% 92% 84% 84% 92% 92% 93% 93% 93% 100% 100% – – – – –
Pialba State School Pialba 70 69 59 –
Average score of the school 338 336 354 347 344 462 422 460 460 450 510 463 512 504 496 – – – – –
Percentage (%) of students at or above NMS 68% 79% 81% 78% 78% 74% 69% 78% 81% 80% 87% 70% 86% 77% 80% – – – – –
Pilton State School via Clifton 2 2 – –
Average score of the school ∧ ∧ ∧ ∧ ∧ ∧ ∧ ∧ ∧ ∧ – – – – – – – – – –
Percentage (%) of students at or above NMS ∧ ∧ ∧ ∧ ∧ ∧ ∧ ∧ ∧ ∧ – – – – – – – – – –
Pimlico State High School Pimlico – – – 338
Average score of the school – – – – – – – – – – – – – – – 584 557 583 578 583
Percentage (%) of students at or above NMS – – – – – – – – – – – – – – – 93% 82% 92% 90% 97%
Pimpama State School Pimpama 59 53 16 –
Average score of the school 425 392 412 452 415 503 473 489 501 494 580 521 570 566 553 – – – – –
Percentage (%) of students at or above NMS 96% 100% 92% 100% 98% 98% 92% 96% 96% 96% 100% 100% 93% 93% 100% – – – – –
Pimpama State Secondary College Pimpama – – 146 168
Average score of the school – – – – – – – – – – 524 507 527 520 524 563 546 576 553 558
Percentage (%) of students at or above NMS – – – – – – – – – – 97% 91% 95% 91% 96% 96% 82% 92% 93% 96%
Pindi Pindi State School Pindi Pindi via Calen 2 5 – –
Average score of the school ∧ ∧ ∧ ∧ ∧ ∧ ∧ ∧ ∧ ∧ – – – – – – – – – –
Percentage (%) of students at or above NMS ∧ ∧ ∧ ∧ ∧ ∧ ∧ ∧ ∧ ∧ – – – – – – – – – –
Pine Community School (Arana Hills) Arana Hills 6 6 4 –
Average score of the school ∗ ∗ ∗ ∗ ∗ ∧ ∧ ∧ ∧ ∧ ∧ ∧ ∧ ∧ ∧ – – – – –
Percentage (%) of students at or above NMS ∗ ∗ ∗ ∗ ∗ ∧ ∧ ∧ ∧ ∧ ∧ ∧ ∧ ∧ ∧ – – – – –
Pine Rivers Special School Lawnton 9 16 10 15
Average score of the school ∗ ∗ ∗ ∗ ∗ ∗ ∗ ∗ ∗ ∗ ∗ ∗ ∗ ∗ ∗ ∗ ∗ ∗ ∗ ∗Percentage (%) of students at or above NMS ∗ ∗ ∗ ∗ ∗ ∗ ∗ ∗ ∗ ∗ ∗ ∗ ∗ ∗ ∗ ∗ ∗ ∗ ∗ ∗
Pine Rivers State High School Strathpine – – – 236
Average score of the school – – – – – – – – – – – – – – – 556 514 559 558 568
Percentage (%) of students at or above NMS – – – – – – – – – – – – – – – 89% 69% 86% 83% 93%
Pinnacle State School Pinnacle 5 3 1 –
Average score of the school ∧ ∧ ∧ ∧ ∧ ∧ ∧ ∧ ∧ ∧ ∧ ∧ ∧ ∧ ∧ – – – – –
Percentage (%) of students at or above NMS ∧ ∧ ∧ ∧ ∧ ∧ ∧ ∧ ∧ ∧ ∧ ∧ ∧ ∧ ∧ – – – – –
KEY∧ to maintain privacy of individual student information, where there are fewer than five students tested results are not provided∗ no students in the year level sat the test due to absence, exemption or withdrawal– no students in the year levelNMS National Minimum Standard (for further information see www.nap.edu.au)
Queensland Curriculum & Assessment Authority
Page 95 of 149
NAPLAN 2014 Outcomes — All Queensland schools
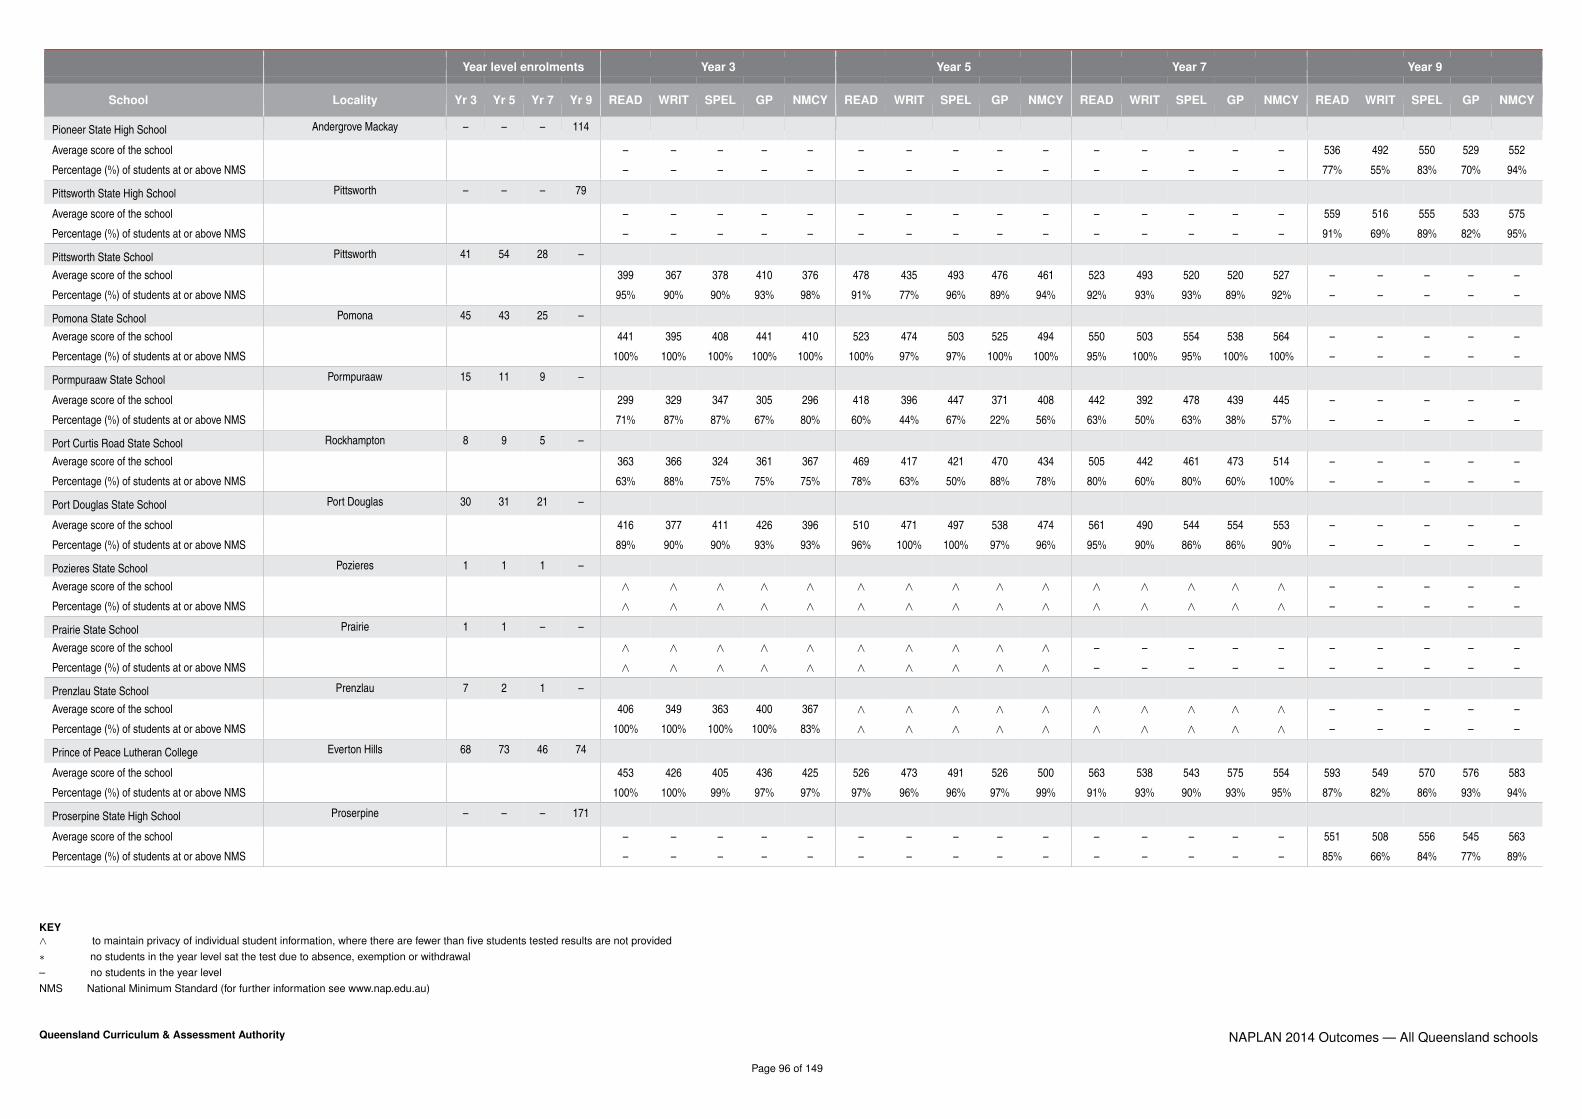
Year level enrolments Year 3 Year 5 Year 7 Year 9
School Locality Yr 3 Yr 5 Yr 7 Yr 9 READ WRIT SPEL GP NMCY READ WRIT SPEL GP NMCY READ WRIT SPEL GP NMCY READ WRIT SPEL GP NMCY
Pioneer State High School Andergrove Mackay – – – 114
Average score of the school – – – – – – – – – – – – – – – 536 492 550 529 552
Percentage (%) of students at or above NMS – – – – – – – – – – – – – – – 77% 55% 83% 70% 94%
Pittsworth State High School Pittsworth – – – 79
Average score of the school – – – – – – – – – – – – – – – 559 516 555 533 575
Percentage (%) of students at or above NMS – – – – – – – – – – – – – – – 91% 69% 89% 82% 95%
Pittsworth State School Pittsworth 41 54 28 –
Average score of the school 399 367 378 410 376 478 435 493 476 461 523 493 520 520 527 – – – – –
Percentage (%) of students at or above NMS 95% 90% 90% 93% 98% 91% 77% 96% 89% 94% 92% 93% 93% 89% 92% – – – – –
Pomona State School Pomona 45 43 25 –
Average score of the school 441 395 408 441 410 523 474 503 525 494 550 503 554 538 564 – – – – –
Percentage (%) of students at or above NMS 100% 100% 100% 100% 100% 100% 97% 97% 100% 100% 95% 100% 95% 100% 100% – – – – –
Pormpuraaw State School Pormpuraaw 15 11 9 –
Average score of the school 299 329 347 305 296 418 396 447 371 408 442 392 478 439 445 – – – – –
Percentage (%) of students at or above NMS 71% 87% 87% 67% 80% 60% 44% 67% 22% 56% 63% 50% 63% 38% 57% – – – – –
Port Curtis Road State School Rockhampton 8 9 5 –
Average score of the school 363 366 324 361 367 469 417 421 470 434 505 442 461 473 514 – – – – –
Percentage (%) of students at or above NMS 63% 88% 75% 75% 75% 78% 63% 50% 88% 78% 80% 60% 80% 60% 100% – – – – –
Port Douglas State School Port Douglas 30 31 21 –
Average score of the school 416 377 411 426 396 510 471 497 538 474 561 490 544 554 553 – – – – –
Percentage (%) of students at or above NMS 89% 90% 90% 93% 93% 96% 100% 100% 97% 96% 95% 90% 86% 86% 90% – – – – –
Pozieres State School Pozieres 1 1 1 –
Average score of the school ∧ ∧ ∧ ∧ ∧ ∧ ∧ ∧ ∧ ∧ ∧ ∧ ∧ ∧ ∧ – – – – –
Percentage (%) of students at or above NMS ∧ ∧ ∧ ∧ ∧ ∧ ∧ ∧ ∧ ∧ ∧ ∧ ∧ ∧ ∧ – – – – –
Prairie State School Prairie 1 1 – –
Average score of the school ∧ ∧ ∧ ∧ ∧ ∧ ∧ ∧ ∧ ∧ – – – – – – – – – –
Percentage (%) of students at or above NMS ∧ ∧ ∧ ∧ ∧ ∧ ∧ ∧ ∧ ∧ – – – – – – – – – –
Prenzlau State School Prenzlau 7 2 1 –
Average score of the school 406 349 363 400 367 ∧ ∧ ∧ ∧ ∧ ∧ ∧ ∧ ∧ ∧ – – – – –
Percentage (%) of students at or above NMS 100% 100% 100% 100% 83% ∧ ∧ ∧ ∧ ∧ ∧ ∧ ∧ ∧ ∧ – – – – –
Prince of Peace Lutheran College Everton Hills 68 73 46 74
Average score of the school 453 426 405 436 425 526 473 491 526 500 563 538 543 575 554 593 549 570 576 583
Percentage (%) of students at or above NMS 100% 100% 99% 97% 97% 97% 96% 96% 97% 99% 91% 93% 90% 93% 95% 87% 82% 86% 93% 94%
Proserpine State High School Proserpine – – – 171
Average score of the school – – – – – – – – – – – – – – – 551 508 556 545 563
Percentage (%) of students at or above NMS – – – – – – – – – – – – – – – 85% 66% 84% 77% 89%
KEY∧ to maintain privacy of individual student information, where there are fewer than five students tested results are not provided∗ no students in the year level sat the test due to absence, exemption or withdrawal– no students in the year levelNMS National Minimum Standard (for further information see www.nap.edu.au)
Queensland Curriculum & Assessment Authority
Page 96 of 149
NAPLAN 2014 Outcomes — All Queensland schools

Year level enrolments Year 3 Year 5 Year 7 Year 9
School Locality Yr 3 Yr 5 Yr 7 Yr 9 READ WRIT SPEL GP NMCY READ WRIT SPEL GP NMCY READ WRIT SPEL GP NMCY READ WRIT SPEL GP NMCY
Proserpine State School Proserpine 68 79 60 –
Average score of the school 379 377 372 391 354 484 454 469 483 467 527 502 530 531 516 – – – – –
Percentage (%) of students at or above NMS 91% 89% 97% 94% 91% 92% 87% 91% 87% 89% 95% 81% 87% 87% 95% – – – – –
Prospect Creek State School Biloela 7 2 5 –
Average score of the school 387 363 356 349 401 ∧ ∧ ∧ ∧ ∧ 548 470 504 539 511 – – – – –
Percentage (%) of students at or above NMS 100% 100% 100% 86% 100% ∧ ∧ ∧ ∧ ∧ 80% 80% 80% 80% 80% – – – – –
Proston State School Proston 8 6 12 8
Average score of the school 395 373 375 373 343 487 470 486 491 451 492 471 446 470 484 544 512 545 544 544
Percentage (%) of students at or above NMS 86% 100% 86% 71% 86% 100% 100% 100% 83% 83% 82% 73% 45% 64% 91% 83% 80% 100% 83% 100%
Pullenvale State School Pullenvale 70 65 33 –
Average score of the school 477 448 453 500 433 570 513 521 556 521 579 549 563 574 583 – – – – –
Percentage (%) of students at or above NMS 100% 100% 100% 100% 100% 100% 93% 100% 97% 98% 100% 100% 100% 94% 100% – – – – –
Queen of Apostles Primary School (Upper
Campus)
Stafford 75 59 32 –
Average score of the school 423 434 416 454 408 510 487 508 523 503 558 535 554 583 566 – – – – –
Percentage (%) of students at or above NMS 97% 99% 99% 99% 97% 95% 95% 98% 98% 98% 97% 100% 97% 100% 100% – – – – –
Queens Beach State School Queens Beach 55 50 33 –
Average score of the school 391 385 389 423 383 481 420 480 484 461 527 496 528 531 540 – – – – –
Percentage (%) of students at or above NMS 92% 90% 92% 90% 94% 91% 79% 94% 91% 93% 94% 82% 94% 85% 97% – – – – –
Queensland Independent College Merrimac 26 8 2 –
Average score of the school 355 387 371 370 385 518 425 502 464 474 ∧ ∧ ∧ ∧ ∧ – – – – –
Percentage (%) of students at or above NMS 78% 100% 89% 89% 94% 100% 86% 100% 100% 86% ∧ ∧ ∧ ∧ ∧ – – – – –
Quilpie State College Quilpie 4 5 6 1
Average score of the school ∧ ∧ ∧ ∧ ∧ ∧ ∧ ∧ ∧ ∧ 498 471 501 502 505 ∧ ∧ ∧ ∧ ∧Percentage (%) of students at or above NMS ∧ ∧ ∧ ∧ ∧ ∧ ∧ ∧ ∧ ∧ 100% 60% 60% 100% 100% ∧ ∧ ∧ ∧ ∧
Quinalow State School Quinalow 4 7 3 1
Average score of the school ∧ ∧ ∧ ∧ ∧ 482 404 450 500 454 ∧ ∧ ∧ ∧ ∧ ∧ ∧ ∧ ∧ ∧Percentage (%) of students at or above NMS ∧ ∧ ∧ ∧ ∧ 100% 71% 71% 86% 86% ∧ ∧ ∧ ∧ ∧ ∧ ∧ ∧ ∧ ∧
Raceview State School Raceview 132 127 73 –
Average score of the school 401 377 395 410 382 502 466 497 509 496 529 505 540 541 541 – – – – –
Percentage (%) of students at or above NMS 94% 92% 94% 95% 97% 96% 90% 93% 94% 95% 98% 94% 97% 94% 98% – – – – –
Radiant Life College East Innisfail 9 4 5 –
Average score of the school 183 201 280 125 262 ∧ ∧ ∧ ∧ ∧ 472 460 535 450 474 – – – – –
Percentage (%) of students at or above NMS 14% 44% 78% 11% 63% ∧ ∧ ∧ ∧ ∧ 100% 100% 100% 80% 100% – – – – –
KEY∧ to maintain privacy of individual student information, where there are fewer than five students tested results are not provided∗ no students in the year level sat the test due to absence, exemption or withdrawal– no students in the year levelNMS National Minimum Standard (for further information see www.nap.edu.au)
Queensland Curriculum & Assessment Authority
Page 97 of 149
NAPLAN 2014 Outcomes — All Queensland schools

Year level enrolments Year 3 Year 5 Year 7 Year 9
School Locality Yr 3 Yr 5 Yr 7 Yr 9 READ WRIT SPEL GP NMCY READ WRIT SPEL GP NMCY READ WRIT SPEL GP NMCY READ WRIT SPEL GP NMCY
Railway Estate State School Railway Estate 33 34 12 –
Average score of the school 384 384 406 366 367 476 424 478 479 460 524 500 541 534 539 – – – – –
Percentage (%) of students at or above NMS 90% 97% 97% 94% 97% 85% 79% 91% 82% 85% 90% 90% 80% 90% 100% – – – – –
Rainbow Beach State School Rainbow Beach 15 14 13 –
Average score of the school 375 368 379 356 364 520 473 497 486 519 512 471 515 504 535 – – – – –
Percentage (%) of students at or above NMS 93% 100% 100% 93% 100% 100% 100% 100% 92% 100% 73% 82% 82% 73% 91% – – – – –
Rainworth State School Rainworth 79 66 34 –
Average score of the school 511 423 442 505 472 577 498 543 580 550 628 575 596 628 613 – – – – –
Percentage (%) of students at or above NMS 100% 96% 100% 100% 100% 100% 98% 100% 100% 100% 100% 97% 97% 100% 100% – – – – –
Ramsay State School Ramsay 8 2 – –
Average score of the school 483 435 432 482 413 ∧ ∧ ∧ ∧ ∧ – – – – – – – – – –
Percentage (%) of students at or above NMS 100% 100% 100% 100% 100% ∧ ∧ ∧ ∧ ∧ – – – – – – – – – –
Rangeville State School Toowoomba 100 112 74 –
Average score of the school 424 397 412 429 403 516 449 512 519 491 548 521 557 544 536 – – – – –
Percentage (%) of students at or above NMS 89% 91% 92% 92% 93% 91% 85% 95% 97% 94% 97% 93% 95% 93% 97% – – – – –
Rasmussen State School Rasmussen 70 45 25 –
Average score of the school 309 300 317 305 313 402 337 413 398 402 447 404 440 444 463 – – – – –
Percentage (%) of students at or above NMS 71% 77% 74% 74% 75% 65% 33% 71% 57% 67% 62% 55% 64% 55% 77% – – – – –
Rathdowney State School Rathdowney 6 2 3 –
Average score of the school 420 400 354 399 410 ∧ ∧ ∧ ∧ ∧ ∧ ∧ ∧ ∧ ∧ – – – – –
Percentage (%) of students at or above NMS 100% 100% 100% 100% 100% ∧ ∧ ∧ ∧ ∧ ∧ ∧ ∧ ∧ ∧ – – – – –
Ravenshoe State School Ravenshoe 47 37 18 39
Average score of the school 345 313 332 364 363 428 391 420 420 425 519 468 505 492 521 511 480 521 511 528
Percentage (%) of students at or above NMS 70% 72% 72% 87% 89% 69% 52% 70% 70% 79% 83% 61% 78% 67% 94% 69% 49% 69% 66% 82%
Ravenswood State School Ravenswood 4 2 – –
Average score of the school ∧ ∧ ∧ ∧ ∧ ∧ ∧ ∧ ∧ ∧ – – – – – – – – – –
Percentage (%) of students at or above NMS ∧ ∧ ∧ ∧ ∧ ∧ ∧ ∧ ∧ ∧ – – – – – – – – – –
Red Hill Special School Red Hill 9 4 1 4
Average score of the school ∗ ∗ ∗ ∗ ∗ ∗ ∗ ∗ ∗ ∗ ∗ ∗ ∗ ∗ ∗ ∗ ∗ ∗ ∗ ∗Percentage (%) of students at or above NMS ∗ ∗ ∗ ∗ ∗ ∗ ∗ ∗ ∗ ∗ ∗ ∗ ∗ ∗ ∗ ∗ ∗ ∗ ∗ ∗
Redbank Plains State High School Redbank Plains – – – 341
Average score of the school – – – – – – – – – – – – – – – 526 506 544 520 530
Percentage (%) of students at or above NMS – – – – – – – – – – – – – – – 83% 61% 84% 73% 91%
Redbank Plains State School Redbank Plains 129 95 69 –
Average score of the school 330 308 344 323 323 446 412 467 451 439 512 497 532 518 501 – – – – –
Percentage (%) of students at or above NMS 78% 76% 82% 77% 81% 87% 74% 93% 84% 89% 89% 84% 94% 88% 94% – – – – –
KEY∧ to maintain privacy of individual student information, where there are fewer than five students tested results are not provided∗ no students in the year level sat the test due to absence, exemption or withdrawal– no students in the year levelNMS National Minimum Standard (for further information see www.nap.edu.au)
Queensland Curriculum & Assessment Authority
Page 98 of 149
NAPLAN 2014 Outcomes — All Queensland schools

Year level enrolments Year 3 Year 5 Year 7 Year 9
School Locality Yr 3 Yr 5 Yr 7 Yr 9 READ WRIT SPEL GP NMCY READ WRIT SPEL GP NMCY READ WRIT SPEL GP NMCY READ WRIT SPEL GP NMCY
Redbank State School Redbank 32 27 19 –
Average score of the school 382 381 393 396 356 444 421 449 441 433 481 462 461 480 496 – – – – –
Percentage (%) of students at or above NMS 91% 94% 91% 94% 90% 85% 77% 78% 89% 93% 88% 72% 72% 78% 88% – – – – –
Redcliffe Special School Redcliffe – 10 16 10
Average score of the school – – – – – ∗ ∗ ∗ ∗ ∗ ∗ ∗ ∗ ∗ ∗ ∗ ∗ ∗ ∗ ∗Percentage (%) of students at or above NMS – – – – – ∗ ∗ ∗ ∗ ∗ ∗ ∗ ∗ ∗ ∗ ∗ ∗ ∗ ∗ ∗
Redcliffe State High School Redcliffe – – – 239
Average score of the school – – – – – – – – – – – – – – – 575 545 581 566 576
Percentage (%) of students at or above NMS – – – – – – – – – – – – – – – 98% 82% 97% 91% 98%
Redeemer Lutheran College Biloela 27 25 19 –
Average score of the school 415 395 384 408 385 536 514 493 523 505 523 509 512 495 521 – – – – –
Percentage (%) of students at or above NMS 93% 100% 93% 100% 96% 83% 92% 88% 92% 96% 95% 89% 84% 79% 100% – – – – –
Redeemer Lutheran College Rochedale 70 67 62 129
Average score of the school 454 433 458 478 427 547 492 537 571 522 572 540 561 577 580 610 582 608 621 643
Percentage (%) of students at or above NMS 99% 100% 100% 100% 100% 100% 95% 100% 100% 99% 98% 97% 98% 97% 97% 96% 89% 97% 98% 98%
Redland Bay State School Redland Bay 107 113 63 –
Average score of the school 409 383 383 414 400 498 458 497 501 480 542 497 539 549 539 – – – – –
Percentage (%) of students at or above NMS 94% 97% 94% 94% 99% 97% 94% 96% 99% 100% 100% 89% 92% 97% 95% – – – – –
Redland District Special School Thornlands 6 13 13 11
Average score of the school ∗ ∗ ∗ ∗ ∗ ∗ ∗ ∗ ∗ ∗ ∗ ∗ ∗ ∗ ∗ ∗ ∗ ∗ ∗ ∗Percentage (%) of students at or above NMS ∗ ∗ ∗ ∗ ∗ ∗ ∗ ∗ ∗ ∗ ∗ ∗ ∗ ∗ ∗ ∗ ∗ ∗ ∗ ∗
Redlands College Wellington Point 57 56 116 153
Average score of the school 436 414 391 433 412 538 497 509 549 523 565 553 549 570 580 604 585 605 609 614
Percentage (%) of students at or above NMS 100% 96% 98% 100% 100% 100% 95% 96% 100% 100% 99% 97% 98% 98% 98% 99% 93% 99% 98% 100%
Redlynch State College Redlynch 131 129 82 189
Average score of the school 391 370 381 401 385 493 455 484 499 482 533 486 519 530 534 565 532 570 564 572
Percentage (%) of students at or above NMS 88% 93% 95% 92% 91% 96% 89% 97% 97% 95% 92% 81% 82% 89% 91% 90% 74% 89% 87% 93%
Regents Park State School Regents Park 81 66 45 –
Average score of the school 398 372 393 394 368 481 423 485 479 455 535 512 544 525 522 – – – – –
Percentage (%) of students at or above NMS 95% 97% 93% 93% 91% 92% 77% 92% 89% 84% 97% 93% 100% 95% 95% – – – – –
Richlands East State School Inala 47 64 33 –
Average score of the school 374 384 400 381 381 426 426 455 446 413 493 457 486 462 495 – – – – –
Percentage (%) of students at or above NMS 83% 91% 93% 87% 85% 67% 65% 75% 77% 63% 88% 79% 76% 70% 91% – – – – –
Richmond Hill State School Charters Towers 69 52 31 –
Average score of the school 384 393 382 383 363 503 444 487 498 492 547 494 516 539 533 – – – – –
Percentage (%) of students at or above NMS 92% 97% 97% 97% 97% 94% 83% 85% 90% 98% 100% 76% 92% 92% 96% – – – – –
KEY∧ to maintain privacy of individual student information, where there are fewer than five students tested results are not provided∗ no students in the year level sat the test due to absence, exemption or withdrawal– no students in the year levelNMS National Minimum Standard (for further information see www.nap.edu.au)
Queensland Curriculum & Assessment Authority
Page 99 of 149
NAPLAN 2014 Outcomes — All Queensland schools

Year level enrolments Year 3 Year 5 Year 7 Year 9
School Locality Yr 3 Yr 5 Yr 7 Yr 9 READ WRIT SPEL GP NMCY READ WRIT SPEL GP NMCY READ WRIT SPEL GP NMCY READ WRIT SPEL GP NMCY
Richmond State School Richmond 10 4 4 7
Average score of the school 335 342 378 373 331 ∧ ∧ ∧ ∧ ∧ ∧ ∧ ∧ ∧ ∧ 498 453 492 502 518
Percentage (%) of students at or above NMS 78% 89% 100% 78% 78% ∧ ∧ ∧ ∧ ∧ ∧ ∧ ∧ ∧ ∧ 50% 33% 67% 83% 83%
Ridgelands State School Ridgelands 12 5 1 –
Average score of the school 363 322 360 355 361 493 437 501 472 430 ∧ ∧ ∧ ∧ ∧ – – – – –
Percentage (%) of students at or above NMS 83% 100% 92% 100% 100% 100% 100% 100% 100% 100% ∧ ∧ ∧ ∧ ∧ – – – – –
Rivermount College - Yatala Yatala 71 60 37 81
Average score of the school 429 411 416 449 415 533 500 526 553 525 536 513 558 539 542 599 570 595 593 589
Percentage (%) of students at or above NMS 96% 96% 99% 99% 99% 100% 100% 98% 100% 100% 100% 92% 100% 95% 100% 97% 92% 94% 96% 100%
Riverside Adventist Christian School Aitkenvale 8 7 5 –
Average score of the school 387 359 363 377 371 443 411 473 465 429 ∧ ∧ ∧ ∧ ∧ – – – – –
Percentage (%) of students at or above NMS 86% 100% 100% 100% 100% 100% 86% 86% 86% 100% ∧ ∧ ∧ ∧ ∧ – – – – –
Riverside Christian College Maryborough West 38 51 28 68
Average score of the school 417 405 390 411 376 470 443 473 472 460 538 501 541 536 516 578 557 574 578 570
Percentage (%) of students at or above NMS 94% 97% 94% 94% 92% 87% 87% 89% 89% 93% 100% 100% 92% 88% 92% 94% 90% 97% 95% 98%
Riverside Christian College (Distance) Maryborough 13 27 26 35
Average score of the school 435 352 391 346 453 457 396 424 456 417 ∧ ∧ ∧ ∧ ∧ ∧ ∧ ∧ ∧ ∧Percentage (%) of students at or above NMS 100% 80% 100% 80% 100% 100% 60% 100% 100% 80% ∧ ∧ ∧ ∧ ∧ ∧ ∧ ∧ ∧ ∧
Riverview State School Riverview 34 31 16 –
Average score of the school 362 319 364 378 359 434 402 441 434 442 507 475 482 505 510 – – – – –
Percentage (%) of students at or above NMS 90% 77% 83% 97% 91% 74% 67% 81% 70% 93% 75% 83% 83% 75% 85% – – – – –
Roadvale State School Roadvale 7 5 4 –
Average score of the school 412 401 404 405 429 ∧ ∧ ∧ ∧ ∧ ∧ ∧ ∧ ∧ ∧ – – – – –
Percentage (%) of students at or above NMS 100% 100% 100% 100% 100% ∧ ∧ ∧ ∧ ∧ ∧ ∧ ∧ ∧ ∧ – – – – –
Robertson State School Robertson 96 91 50 –
Average score of the school 461 407 464 485 452 558 494 538 569 546 578 562 593 587 603 – – – – –
Percentage (%) of students at or above NMS 97% 93% 97% 96% 96% 94% 90% 93% 93% 96% 98% 96% 98% 96% 100% – – – – –
Robina State High School Robina – – – 254
Average score of the school – – – – – – – – – – – – – – – 566 532 565 565 579
Percentage (%) of students at or above NMS – – – – – – – – – – – – – – – 90% 77% 90% 90% 98%
Robina State School Robina 118 107 62 –
Average score of the school 422 401 419 434 419 499 458 498 505 494 536 493 535 528 534 – – – – –
Percentage (%) of students at or above NMS 96% 94% 95% 94% 99% 94% 86% 94% 96% 94% 95% 81% 92% 93% 98% – – – – –
Rochedale South State School Rochedale South 47 32 24 –
Average score of the school 400 379 389 408 368 503 428 502 515 501 529 491 526 505 528 – – – – –
Percentage (%) of students at or above NMS 87% 91% 89% 93% 89% 79% 61% 86% 82% 83% 92% 87% 83% 75% 96% – – – – –
KEY∧ to maintain privacy of individual student information, where there are fewer than five students tested results are not provided∗ no students in the year level sat the test due to absence, exemption or withdrawal– no students in the year levelNMS National Minimum Standard (for further information see www.nap.edu.au)
Queensland Curriculum & Assessment Authority
Page 100 of 149
NAPLAN 2014 Outcomes — All Queensland schools

Year level enrolments Year 3 Year 5 Year 7 Year 9
School Locality Yr 3 Yr 5 Yr 7 Yr 9 READ WRIT SPEL GP NMCY READ WRIT SPEL GP NMCY READ WRIT SPEL GP NMCY READ WRIT SPEL GP NMCY
Rochedale State High School Rochedale – – – 238
Average score of the school – – – – – – – – – – – – – – – 570 549 579 571 576
Percentage (%) of students at or above NMS – – – – – – – – – – – – – – – 96% 88% 95% 93% 97%
Rochedale State School Rochedale 147 118 63 –
Average score of the school 450 428 452 489 448 522 499 508 529 530 562 540 556 556 590 – – – – –
Percentage (%) of students at or above NMS 98% 99% 97% 98% 100% 100% 97% 96% 98% 100% 100% 95% 97% 98% 100% – – – – –
Rockhampton Girls’ Grammar School Rockhampton 9 17 10 38
Average score of the school 436 419 423 456 414 524 453 508 509 493 571 520 576 574 535 581 567 587 569 591
Percentage (%) of students at or above NMS 100% 100% 100% 100% 100% 100% 86% 100% 100% 93% 100% 100% 100% 100% 100% 89% 92% 92% 95% 100%
Rockhampton North Special School Rockhampton North 4 7 8 6
Average score of the school ∗ ∗ ∗ ∗ ∗ ∗ ∗ ∗ ∗ ∗ ∗ ∗ ∗ ∗ ∗ ∗ ∗ ∗ ∗ ∗Percentage (%) of students at or above NMS ∗ ∗ ∗ ∗ ∗ ∗ ∗ ∗ ∗ ∗ ∗ ∗ ∗ ∗ ∗ ∗ ∗ ∗ ∗ ∗
Rockhampton Special School Rockhampton 3 9 7 7
Average score of the school ∗ ∗ ∗ ∗ ∗ ∗ ∗ ∗ ∗ ∗ ∗ ∗ ∗ ∗ ∗ ∗ ∗ ∗ ∗ ∗Percentage (%) of students at or above NMS ∗ ∗ ∗ ∗ ∗ ∗ ∗ ∗ ∗ ∗ ∗ ∗ ∗ ∗ ∗ ∗ ∗ ∗ ∗ ∗
Rockhampton State High School Rockhampton – – – 237
Average score of the school – – – – – – – – – – – – – – – 542 504 546 535 547
Percentage (%) of students at or above NMS – – – – – – – – – – – – – – – 81% 63% 82% 76% 94%
Rocklea State School Rocklea 3 5 2 –
Average score of the school ∧ ∧ ∧ ∧ ∧ ∧ ∧ ∧ ∧ ∧ ∧ ∧ ∧ ∧ ∧ – – – – –
Percentage (%) of students at or above NMS ∧ ∧ ∧ ∧ ∧ ∧ ∧ ∧ ∧ ∧ ∧ ∧ ∧ ∧ ∧ – – – – –
Rockville State School Toowoomba 25 25 20 –
Average score of the school 348 329 367 322 354 416 396 445 423 405 533 472 499 515 489 – – – – –
Percentage (%) of students at or above NMS 68% 68% 68% 59% 82% 63% 48% 65% 57% 70% 88% 71% 82% 94% 87% – – – – –
Rolleston State School Rolleston 10 7 3 –
Average score of the school 427 398 422 479 422 523 493 493 522 490 ∧ ∧ ∧ ∧ ∧ – – – – –
Percentage (%) of students at or above NMS 100% 100% 100% 100% 100% 100% 100% 100% 100% 100% ∧ ∧ ∧ ∧ ∧ – – – – –
Rollingstone State School Rollingstone 12 9 1 –
Average score of the school 357 351 338 360 332 464 406 448 460 460 ∧ ∧ ∧ ∧ ∧ – – – – –
Percentage (%) of students at or above NMS 83% 83% 83% 92% 67% 78% 89% 78% 89% 100% ∧ ∧ ∧ ∧ ∧ – – – – –
Roma State College Roma 73 53 41 66
Average score of the school 356 398 356 383 370 471 473 462 473 469 507 481 485 487 501 540 514 540 537 545
Percentage (%) of students at or above NMS 87% 98% 90% 94% 95% 88% 95% 91% 91% 93% 91% 81% 70% 76% 90% 78% 61% 74% 75% 88%
Ropeley State School Ropeley via Gatton – 1 1 –
Average score of the school – – – – – ∧ ∧ ∧ ∧ ∧ ∧ ∧ ∧ ∧ ∧ – – – – –
Percentage (%) of students at or above NMS – – – – – ∧ ∧ ∧ ∧ ∧ ∧ ∧ ∧ ∧ ∧ – – – – –
KEY∧ to maintain privacy of individual student information, where there are fewer than five students tested results are not provided∗ no students in the year level sat the test due to absence, exemption or withdrawal– no students in the year levelNMS National Minimum Standard (for further information see www.nap.edu.au)
Queensland Curriculum & Assessment Authority
Page 101 of 149
NAPLAN 2014 Outcomes — All Queensland schools

Year level enrolments Year 3 Year 5 Year 7 Year 9
School Locality Yr 3 Yr 5 Yr 7 Yr 9 READ WRIT SPEL GP NMCY READ WRIT SPEL GP NMCY READ WRIT SPEL GP NMCY READ WRIT SPEL GP NMCY
Rosedale State School Rosedale 7 8 6 39
Average score of the school 377 344 390 395 400 440 451 448 479 475 516 478 479 511 524 558 488 558 540 571
Percentage (%) of students at or above NMS 83% 83% 100% 100% 100% 100% 83% 83% 100% 100% 100% 83% 67% 83% 100% 91% 63% 81% 75% 100%
Rosella Park School Gladstone 3 2 4 9
Average score of the school ∗ ∗ ∗ ∗ ∗ ∗ ∗ ∗ ∗ ∗ ∗ ∗ ∗ ∗ ∗ ∗ ∗ ∗ ∗ ∗Percentage (%) of students at or above NMS ∗ ∗ ∗ ∗ ∗ ∗ ∗ ∗ ∗ ∗ ∗ ∗ ∗ ∗ ∗ ∗ ∗ ∗ ∗ ∗
Rosewood State High School Rosewood – – – 97
Average score of the school – – – – – – – – – – – – – – – 545 473 533 520 546
Percentage (%) of students at or above NMS – – – – – – – – – – – – – – – 80% 61% 77% 78% 92%
Rosewood State School Rosewood 37 29 19 –
Average score of the school 403 363 383 406 391 476 442 464 470 467 551 470 511 541 538 – – – – –
Percentage (%) of students at or above NMS 93% 97% 100% 100% 97% 91% 74% 96% 91% 96% 94% 69% 88% 94% 100% – – – – –
Rossville State School Rossville via Cooktown 7 2 3 –
Average score of the school 359 363 372 373 369 ∧ ∧ ∧ ∧ ∧ ∧ ∧ ∧ ∧ ∧ – – – – –
Percentage (%) of students at or above NMS 100% 86% 100% 86% 100% ∧ ∧ ∧ ∧ ∧ ∧ ∧ ∧ ∧ ∧ – – – – –
Runcorn Heights State School Runcorn 72 88 48 –
Average score of the school 418 410 436 424 384 484 470 499 501 483 557 526 576 561 606 – – – – –
Percentage (%) of students at or above NMS 98% 98% 98% 98% 92% 96% 93% 95% 93% 98% 95% 90% 93% 95% 98% – – – – –
Runcorn State High School Runcorn – – – 156
Average score of the school – – – – – – – – – – – – – – – 562 533 575 558 570
Percentage (%) of students at or above NMS – – – – – – – – – – – – – – – 89% 74% 92% 87% 96%
Runcorn State School Sunnybank 52 58 26 –
Average score of the school 426 400 414 451 417 503 466 487 501 485 530 515 548 532 554 – – – – –
Percentage (%) of students at or above NMS 85% 85% 87% 87% 86% 98% 89% 91% 94% 96% 100% 96% 91% 91% 96% – – – – –
Russell Island State School Russell Island 26 25 18 –
Average score of the school 384 348 353 352 368 453 397 457 461 446 513 465 493 522 506 – – – – –
Percentage (%) of students at or above NMS 96% 96% 91% 78% 100% 82% 43% 83% 83% 81% 94% 69% 81% 94% 100% – – – – –
Ryan Catholic College Kirwan 119 120 117 202
Average score of the school 410 408 410 422 400 497 475 489 517 483 551 527 539 547 559 584 550 581 573 587
Percentage (%) of students at or above NMS 92% 95% 94% 96% 97% 96% 91% 95% 94% 97% 97% 92% 97% 95% 97% 95% 81% 95% 92% 97%
Ryeford State School via Clifton 1 1 – –
Average score of the school ∧ ∧ ∧ ∧ ∧ ∧ ∧ ∧ ∧ ∧ – – – – – – – – – –
Percentage (%) of students at or above NMS ∧ ∧ ∧ ∧ ∧ ∧ ∧ ∧ ∧ ∧ – – – – – – – – – –
KEY∧ to maintain privacy of individual student information, where there are fewer than five students tested results are not provided∗ no students in the year level sat the test due to absence, exemption or withdrawal– no students in the year levelNMS National Minimum Standard (for further information see www.nap.edu.au)
Queensland Curriculum & Assessment Authority
Page 102 of 149
NAPLAN 2014 Outcomes — All Queensland schools

Year level enrolments Year 3 Year 5 Year 7 Year 9
School Locality Yr 3 Yr 5 Yr 7 Yr 9 READ WRIT SPEL GP NMCY READ WRIT SPEL GP NMCY READ WRIT SPEL GP NMCY READ WRIT SPEL GP NMCY
Sacred Heart Catholic Primary School
(Yeppoon)
Yeppoon 59 65 45 –
Average score of the school 430 400 401 439 414 512 470 498 502 479 537 484 523 528 538 – – – – –
Percentage (%) of students at or above NMS 100% 98% 97% 100% 98% 95% 89% 95% 95% 97% 98% 90% 98% 88% 98% – – – – –
Sacred Heart Primary School (Cunnamulla) Cunnamulla 11 11 5 –
Average score of the school 343 391 348 362 357 437 466 454 431 445 477 465 489 461 485 – – – – –
Percentage (%) of students at or above NMS 82% 100% 82% 100% 91% 80% 90% 90% 90% 90% 100% 100% 80% 80% 100% – – – – –
Sacred Heart Primary School (Sandgate) Sandgate 50 28 19 –
Average score of the school 421 397 386 413 405 525 485 504 525 478 546 525 549 549 541 – – – – –
Percentage (%) of students at or above NMS 98% 100% 94% 98% 100% 100% 96% 100% 96% 100% 94% 89% 94% 89% 100% – – – – –
Sacred Heart Primary School (Toowoomba) Toowoomba 39 16 18 –
Average score of the school 396 357 376 405 381 499 457 480 502 469 542 481 532 521 542 – – – – –
Percentage (%) of students at or above NMS 92% 86% 84% 92% 89% 94% 93% 87% 93% 94% 94% 82% 100% 88% 100% – – – – –
Sacred Heart School Booval 83 77 41 –
Average score of the school 402 391 388 426 396 513 458 491 504 477 557 517 551 552 552 – – – – –
Percentage (%) of students at or above NMS 92% 99% 97% 99% 98% 99% 94% 96% 97% 99% 100% 97% 100% 97% 100% – – – – –
Saibai Island State School via Thursday Island 8 18 4 –
Average score of the school 309 323 352 298 305 380 372 438 371 373 ∧ ∧ ∧ ∧ ∧ – – – – –
Percentage (%) of students at or above NMS 86% 86% 100% 71% 86% 44% 44% 83% 33% 50% ∧ ∧ ∧ ∧ ∧ – – – – –
Saint Philomena School Park Ridge 11 9 15 7
Average score of the school 412 390 431 431 407 566 456 518 568 520 553 500 561 590 547 609 563 599 642 615
Percentage (%) of students at or above NMS 100% 91% 100% 100% 100% 89% 89% 89% 89% 100% 100% 93% 100% 100% 100% 100% 86% 100% 100% 100%
Saint Stephen’s College Coomera 79 87 103 108
Average score of the school 433 413 419 448 432 528 497 515 535 528 564 548 556 566 562 598 592 600 605 621
Percentage (%) of students at or above NMS 97% 99% 100% 100% 99% 100% 98% 100% 99% 100% 99% 98% 99% 99% 99% 97% 96% 99% 99% 100%
Salisbury State School Salisbury 34 33 15 –
Average score of the school 398 377 391 373 381 485 434 463 473 467 556 514 544 534 589 – – – – –
Percentage (%) of students at or above NMS 82% 90% 91% 81% 88% 97% 78% 88% 91% 97% 93% 80% 87% 80% 93% – – – – –
Samford State School Samford 103 95 70 –
Average score of the school 454 419 423 462 433 531 462 511 538 524 575 530 560 575 599 – – – – –
Percentage (%) of students at or above NMS 99% 98% 100% 99% 100% 93% 90% 100% 98% 98% 97% 100% 97% 98% 100% – – – – –
Samford Valley Steiner School Wights Mountain 27 27 27 16
Average score of the school ∧ ∧ ∧ ∧ ∧ ∗ ∗ ∗ ∗ ∗ 626 532 598 637 589 649 649 636 654 622
Percentage (%) of students at or above NMS ∧ ∧ ∧ ∧ ∧ ∗ ∗ ∗ ∗ ∗ 100% 100% 100% 100% 100% 100% 100% 100% 100% 100%
KEY∧ to maintain privacy of individual student information, where there are fewer than five students tested results are not provided∗ no students in the year level sat the test due to absence, exemption or withdrawal– no students in the year levelNMS National Minimum Standard (for further information see www.nap.edu.au)
Queensland Curriculum & Assessment Authority
Page 103 of 149
NAPLAN 2014 Outcomes — All Queensland schools

Year level enrolments Year 3 Year 5 Year 7 Year 9
School Locality Yr 3 Yr 5 Yr 7 Yr 9 READ WRIT SPEL GP NMCY READ WRIT SPEL GP NMCY READ WRIT SPEL GP NMCY READ WRIT SPEL GP NMCY
San Sisto College Carina – – – 141
Average score of the school – – – – – – – – – – – – – – – 601 586 592 593 585
Percentage (%) of students at or above NMS – – – – – – – – – – – – – – – 98% 97% 98% 95% 98%
Sandgate District State High School Sandgate – – – 192
Average score of the school – – – – – – – – – – – – – – – 565 529 570 559 565
Percentage (%) of students at or above NMS – – – – – – – – – – – – – – – 89% 74% 89% 82% 96%
Sandgate State School Sandgate 61 33 23 –
Average score of the school 430 391 407 449 405 514 460 500 507 468 543 505 524 537 526 – – – – –
Percentage (%) of students at or above NMS 97% 98% 91% 97% 91% 90% 79% 90% 86% 87% 96% 78% 87% 96% 100% – – – – –
Sandy Strait State School Urangan 88 111 79 –
Average score of the school 409 388 393 405 381 493 444 480 508 461 529 485 524 523 531 – – – – –
Percentage (%) of students at or above NMS 97% 94% 94% 94% 90% 96% 84% 91% 93% 91% 87% 78% 80% 84% 93% – – – – –
Sarina State High School Sarina – – – 130
Average score of the school – – – – – – – – – – – – – – – 560 536 557 543 556
Percentage (%) of students at or above NMS – – – – – – – – – – – – – – – 93% 73% 86% 84% 92%
Sarina State School Sarina 59 66 54 –
Average score of the school 377 358 375 377 369 447 415 462 457 439 513 459 510 503 498 – – – – –
Percentage (%) of students at or above NMS 94% 89% 91% 91% 91% 84% 75% 87% 88% 82% 90% 77% 81% 87% 90% – – – – –
Scarborough State School Scarborough 124 111 70 –
Average score of the school 385 367 390 406 394 467 416 462 466 468 528 501 520 513 538 – – – – –
Percentage (%) of students at or above NMS 88% 91% 89% 95% 93% 85% 73% 86% 83% 90% 92% 83% 91% 89% 92% – – – – –
Scottville State School Scottville via Collinsville 8 5 5 –
Average score of the school 397 373 405 417 363 443 475 475 455 430 498 480 476 469 477 – – – – –
Percentage (%) of students at or above NMS 100% 88% 100% 100% 100% 80% 100% 100% 80% 100% 100% 80% 100% 80% 100% – – – – –
Seaforth State School Seaforth via Mackay 17 11 10 –
Average score of the school 414 415 423 423 381 475 430 471 515 417 534 479 523 521 553 – – – – –
Percentage (%) of students at or above NMS 94% 100% 100% 100% 100% 91% 73% 82% 82% 82% 80% 67% 90% 80% 90% – – – – –
Serviceton South State School Inala 44 40 29 –
Average score of the school 378 360 393 382 392 452 426 475 468 449 518 485 530 498 521 – – – – –
Percentage (%) of students at or above NMS 86% 81% 88% 88% 86% 80% 74% 83% 80% 80% 93% 82% 86% 82% 93% – – – – –
Seton College Mount Gravatt East – – – 59
Average score of the school – – – – – – – – – – – – – – – 523 448 500 507 520
Percentage (%) of students at or above NMS – – – – – – – – – – – – – – – 56% 24% 43% 47% 63%
Seven Hills State School Seven Hills 64 48 32 –
Average score of the school 460 431 428 487 423 567 499 536 567 527 610 561 589 618 649 – – – – –
Percentage (%) of students at or above NMS 95% 95% 95% 97% 97% 100% 98% 98% 100% 100% 100% 100% 100% 100% 100% – – – – –
KEY∧ to maintain privacy of individual student information, where there are fewer than five students tested results are not provided∗ no students in the year level sat the test due to absence, exemption or withdrawal– no students in the year levelNMS National Minimum Standard (for further information see www.nap.edu.au)
Queensland Curriculum & Assessment Authority
Page 104 of 149
NAPLAN 2014 Outcomes — All Queensland schools

Year level enrolments Year 3 Year 5 Year 7 Year 9
School Locality Yr 3 Yr 5 Yr 7 Yr 9 READ WRIT SPEL GP NMCY READ WRIT SPEL GP NMCY READ WRIT SPEL GP NMCY READ WRIT SPEL GP NMCY
Severnlea State School Severnlea – 1 2 –
Average score of the school – – – – – ∧ ∧ ∧ ∧ ∧ ∧ ∧ ∧ ∧ ∧ – – – – –
Percentage (%) of students at or above NMS – – – – – ∧ ∧ ∧ ∧ ∧ ∧ ∧ ∧ ∧ ∧ – – – – –
Seville Road State School Holland Park 16 17 10 –
Average score of the school 391 352 406 400 366 454 415 476 462 456 490 479 478 485 500 – – – – –
Percentage (%) of students at or above NMS 93% 86% 86% 93% 100% 81% 73% 87% 80% 81% 90% 80% 90% 70% 80% – – – – –
Shailer Park State High School Shailer Park – – – 132
Average score of the school – – – – – – – – – – – – – – – 534 485 536 528 552
Percentage (%) of students at or above NMS – – – – – – – – – – – – – – – 83% 54% 79% 74% 93%
Shailer Park State School Shailer Park 39 63 38 –
Average score of the school 381 366 367 398 349 514 442 507 504 488 521 484 508 491 507 – – – – –
Percentage (%) of students at or above NMS 84% 97% 91% 97% 88% 96% 85% 92% 92% 96% 94% 81% 84% 81% 93% – – – – –
Shalom Christian College Condon 19 12 6 22
Average score of the school 279 248 262 284 270 365 358 347 347 358 ∧ 371 390 423 465 462 392 474 451 484
Percentage (%) of students at or above NMS 42% 37% 53% 68% 58% 42% 33% 25% 17% 33% ∧ 50% 17% 33% 80% 33% 6% 47% 24% 69%
Shalom College Bundaberg – – – 258
Average score of the school – – – – – – – – – – – – – – – 592 567 595 589 605
Percentage (%) of students at or above NMS – – – – – – – – – – – – – – – 97% 93% 96% 92% 100%
Sharon State School Sharon 20 13 10 –
Average score of the school 400 417 409 433 401 589 505 522 626 553 570 540 586 675 646 – – – – –
Percentage (%) of students at or above NMS 82% 94% 89% 100% 100% 100% 100% 100% 100% 100% 100% 100% 100% 100% 100% – – – – –
Sheldon College Sheldon 107 115 95 124
Average score of the school 455 417 439 480 431 549 500 521 551 527 594 558 573 595 610 617 593 616 623 642
Percentage (%) of students at or above NMS 100% 97% 100% 100% 99% 100% 99% 100% 100% 99% 100% 100% 100% 100% 100% 100% 91% 100% 99% 100%
Sherwood State School Sherwood 75 77 33 –
Average score of the school 453 425 426 463 440 532 480 502 547 526 578 526 568 581 590 – – – – –
Percentage (%) of students at or above NMS 99% 99% 99% 97% 97% 95% 91% 93% 95% 96% 97% 91% 94% 100% 100% – – – – –
Shorncliffe State School Shorncliffe 45 36 16 –
Average score of the school 448 438 443 470 417 552 516 519 552 507 586 572 569 579 568 – – – – –
Percentage (%) of students at or above NMS 100% 100% 98% 100% 98% 100% 100% 100% 100% 100% 100% 100% 100% 100% 100% – – – – –
Siena Catholic College Sippy Downs – – – 153
Average score of the school – – – – – – – – – – – – – – – 585 575 587 579 591
Percentage (%) of students at or above NMS – – – – – – – – – – – – – – – 97% 95% 98% 97% 99%
Siena Catholic Primary School Sippy Downs 83 89 90 –
Average score of the school 427 436 415 453 404 500 478 486 499 486 558 538 542 560 564 – – – – –
Percentage (%) of students at or above NMS 99% 99% 99% 98% 100% 94% 98% 95% 94% 92% 99% 98% 97% 98% 98% – – – – –
KEY∧ to maintain privacy of individual student information, where there are fewer than five students tested results are not provided∗ no students in the year level sat the test due to absence, exemption or withdrawal– no students in the year levelNMS National Minimum Standard (for further information see www.nap.edu.au)
Queensland Curriculum & Assessment Authority
Page 105 of 149
NAPLAN 2014 Outcomes — All Queensland schools

Year level enrolments Year 3 Year 5 Year 7 Year 9
School Locality Yr 3 Yr 5 Yr 7 Yr 9 READ WRIT SPEL GP NMCY READ WRIT SPEL GP NMCY READ WRIT SPEL GP NMCY READ WRIT SPEL GP NMCY
Silkstone State School Silkstone 106 87 45 –
Average score of the school 394 374 378 409 375 464 435 474 474 457 523 493 522 530 543 – – – – –
Percentage (%) of students at or above NMS 99% 95% 94% 98% 99% 88% 79% 89% 87% 87% 97% 92% 82% 89% 97% – – – – –
Silkwood School Mount Nathan 56 40 37 15
Average score of the school 442 402 393 418 420 553 479 501 509 511 568 499 544 573 543 606 570 593 620 ∧Percentage (%) of students at or above NMS 95% 100% 94% 100% 100% 100% 93% 100% 93% 100% 100% 86% 100% 100% 100% 100% 100% 100% 100% ∧
Silkwood State School Silkwood 8 3 8 –
Average score of the school 426 403 418 433 386 ∧ ∧ ∧ ∧ ∧ 529 501 516 527 549 – – – – –
Percentage (%) of students at or above NMS 100% 100% 100% 100% 100% ∧ ∧ ∧ ∧ ∧ 100% 88% 100% 100% 100% – – – – –
Sinai College Burbank 7 5 2 –
Average score of the school 417 396 388 463 429 494 428 468 498 484 ∧ ∧ ∧ ∧ ∧ – – – – –
Percentage (%) of students at or above NMS 100% 100% 100% 100% 100% 100% 100% 80% 100% 80% ∧ ∧ ∧ ∧ ∧ – – – – –
Slacks Creek State School Slacks Creek 29 25 20 –
Average score of the school 379 364 358 355 376 471 436 454 470 470 523 489 510 512 508 – – – – –
Percentage (%) of students at or above NMS 86% 86% 79% 90% 93% 88% 84% 88% 92% 84% 100% 74% 74% 79% 94% – – – – –
Slade Point State School Slade Point Mackay 31 27 20 –
Average score of the school 374 346 395 389 348 423 439 467 463 450 502 469 495 485 497 – – – – –
Percentage (%) of students at or above NMS 81% 90% 90% 87% 90% 81% 96% 88% 85% 96% 94% 83% 83% 83% 100% – – – – –
Smithfield State High School Smithfield – – – 204
Average score of the school – – – – – – – – – – – – – – – 560 528 566 563 572
Percentage (%) of students at or above NMS – – – – – – – – – – – – – – – 90% 73% 89% 90% 98%
Somerset College Mudgeeraba 82 82 118 127
Average score of the school 449 435 426 462 444 539 513 522 570 539 605 565 589 602 618 645 634 644 646 659
Percentage (%) of students at or above NMS 99% 100% 99% 100% 100% 99% 100% 100% 100% 100% 100% 98% 100% 100% 99% 100% 98% 99% 98% 100%
Somerset Hills State School Stafford Heights 14 14 12 –
Average score of the school 326 320 349 349 361 539 506 512 547 508 496 512 503 499 521 – – – – –
Percentage (%) of students at or above NMS 67% 83% 92% 92% 100% 100% 100% 100% 100% 100% 100% 89% 78% 89% 100% – – – – –
Somerville House South Brisbane 52 78 102 160
Average score of the school 453 428 449 486 429 562 520 545 579 542 607 585 608 624 610 631 617 638 636 632
Percentage (%) of students at or above NMS 98% 100% 100% 100% 100% 100% 99% 100% 100% 100% 100% 100% 100% 100% 100% 99% 98% 100% 99% 100%
South Johnstone State School South Johnstone 7 4 – –
Average score of the school 447 403 428 478 411 ∧ ∧ ∧ ∧ ∧ – – – – – – – – – –
Percentage (%) of students at or above NMS 86% 86% 86% 86% 83% ∧ ∧ ∧ ∧ ∧ – – – – – – – – – –
Southbrook Central State School Southbrook 5 6 6 –
Average score of the school ∧ ∧ ∧ ∧ 336 468 398 463 439 426 494 483 551 508 508 – – – – –
Percentage (%) of students at or above NMS ∧ ∧ ∧ ∧ 80% 83% 50% 83% 67% 60% 100% 83% 100% 100% 100% – – – – –
KEY∧ to maintain privacy of individual student information, where there are fewer than five students tested results are not provided∗ no students in the year level sat the test due to absence, exemption or withdrawal– no students in the year levelNMS National Minimum Standard (for further information see www.nap.edu.au)
Queensland Curriculum & Assessment Authority
Page 106 of 149
NAPLAN 2014 Outcomes — All Queensland schools

Year level enrolments Year 3 Year 5 Year 7 Year 9
School Locality Yr 3 Yr 5 Yr 7 Yr 9 READ WRIT SPEL GP NMCY READ WRIT SPEL GP NMCY READ WRIT SPEL GP NMCY READ WRIT SPEL GP NMCY
Southern Cross Catholic College Scarborough 58 58 76 131
Average score of the school 433 420 417 436 400 509 466 497 497 493 527 467 517 522 522 572 530 559 561 561
Percentage (%) of students at or above NMS 89% 91% 94% 94% 94% 95% 93% 93% 93% 97% 96% 79% 92% 96% 99% 92% 74% 89% 90% 95%
Southern Cross Catholic College (Kippa Ring
Prim)
Kippa Ring 44 55 – –
Average score of the school 408 403 386 412 372 506 481 502 510 474 – – – – – – – – – –
Percentage (%) of students at or above NMS 98% 100% 95% 95% 93% 96% 100% 98% 98% 92% – – – – – – – – – –
Southern Cross Catholic College (Woody
Point Prim)
Woody Point 27 26 – –
Average score of the school 404 406 410 418 379 494 472 510 502 474 – – – – – – – – – –
Percentage (%) of students at or above NMS 96% 100% 100% 100% 92% 96% 84% 92% 96% 96% – – – – – – – – – –
Southern Cross Catholic School Annandale 84 85 54 –
Average score of the school 409 400 399 426 406 503 471 501 512 494 554 526 530 552 564 – – – – –
Percentage (%) of students at or above NMS 93% 98% 95% 100% 100% 94% 94% 93% 94% 95% 94% 96% 92% 96% 98% – – – – –
Southport Special School Southport 20 10 12 9
Average score of the school ∗ ∗ ∗ ∗ ∗ ∗ ∗ ∗ ∗ ∗ ∗ ∗ ∗ ∗ ∗ ∗ ∗ ∗ ∗ ∗Percentage (%) of students at or above NMS ∗ ∗ ∗ ∗ ∗ ∗ ∗ ∗ ∗ ∗ ∗ ∗ ∗ ∗ ∗ ∗ ∗ ∗ ∗ ∗
Southport State High School Southport – – 169 304
Average score of the school – – – – – – – – – – 540 509 546 533 548 576 563 593 574 583
Percentage (%) of students at or above NMS – – – – – – – – – – 99% 95% 95% 92% 97% 97% 88% 95% 90% 96%
Southport State School Southport 61 75 25 –
Average score of the school 403 393 402 411 390 475 464 487 484 463 548 510 567 541 553 – – – – –
Percentage (%) of students at or above NMS 94% 98% 98% 96% 100% 90% 91% 92% 91% 94% 96% 88% 100% 96% 92% – – – – –
Spinifex College - Junior Campus Mount Isa – – – 189
Average score of the school – – – – – – – – – – – – – – – 526 461 532 512 534
Percentage (%) of students at or above NMS – – – – – – – – – – – – – – – 68% 42% 74% 64% 87%
Springbrook State School Springbrook 5 3 2 –
Average score of the school 447 422 412 458 449 ∧ ∧ ∧ ∧ ∧ ∧ ∧ ∧ ∧ ∧ – – – – –
Percentage (%) of students at or above NMS 100% 100% 100% 100% 100% ∧ ∧ ∧ ∧ ∧ ∧ ∧ ∧ ∧ ∧ – – – – –
Springfield Central State High School Springfield Central – – 120 189
Average score of the school – – – – – – – – – – 536 518 537 533 535 566 549 575 564 569
Percentage (%) of students at or above NMS – – – – – – – – – – 97% 92% 94% 91% 97% 91% 81% 92% 90% 97%
Springfield Central State School Springfield Central 51 53 – –
Average score of the school 400 375 421 416 384 477 451 498 500 468 – – – – – – – – – –
Percentage (%) of students at or above NMS 98% 92% 100% 96% 92% 88% 90% 96% 98% 96% – – – – – – – – – –
KEY∧ to maintain privacy of individual student information, where there are fewer than five students tested results are not provided∗ no students in the year level sat the test due to absence, exemption or withdrawal– no students in the year levelNMS National Minimum Standard (for further information see www.nap.edu.au)
Queensland Curriculum & Assessment Authority
Page 107 of 149
NAPLAN 2014 Outcomes — All Queensland schools
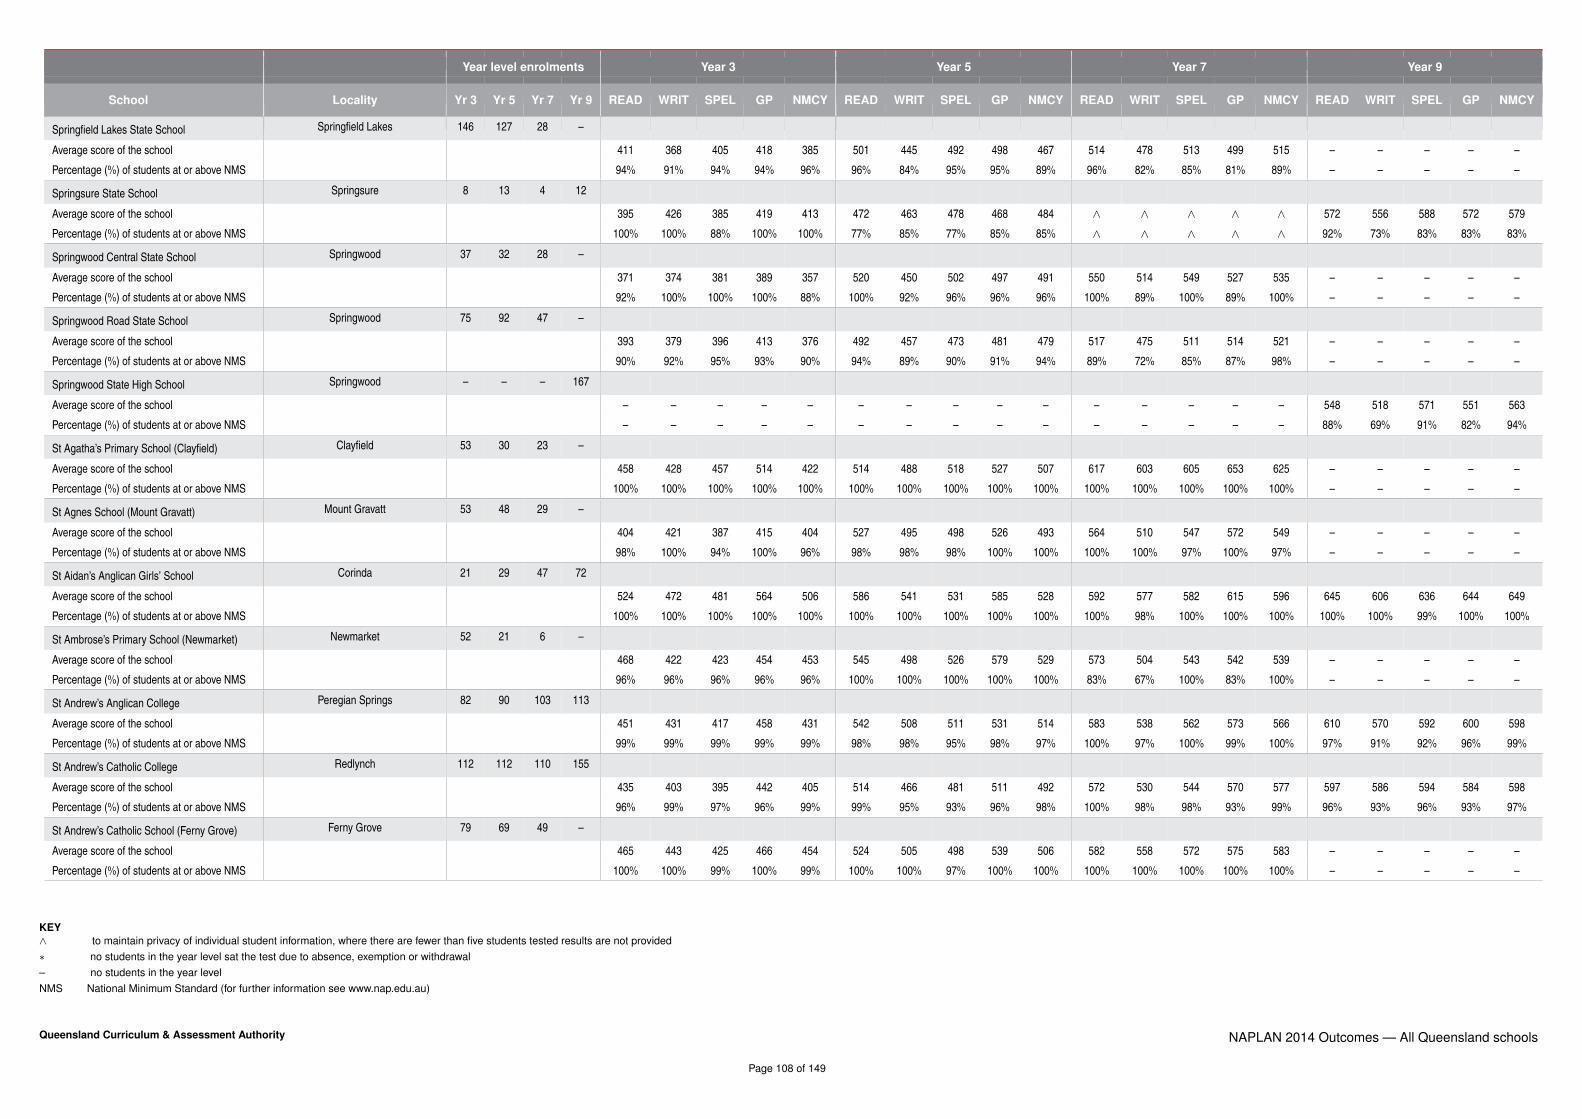
Year level enrolments Year 3 Year 5 Year 7 Year 9
School Locality Yr 3 Yr 5 Yr 7 Yr 9 READ WRIT SPEL GP NMCY READ WRIT SPEL GP NMCY READ WRIT SPEL GP NMCY READ WRIT SPEL GP NMCY
Springfield Lakes State School Springfield Lakes 146 127 28 –
Average score of the school 411 368 405 418 385 501 445 492 498 467 514 478 513 499 515 – – – – –
Percentage (%) of students at or above NMS 94% 91% 94% 94% 96% 96% 84% 95% 95% 89% 96% 82% 85% 81% 89% – – – – –
Springsure State School Springsure 8 13 4 12
Average score of the school 395 426 385 419 413 472 463 478 468 484 ∧ ∧ ∧ ∧ ∧ 572 556 588 572 579
Percentage (%) of students at or above NMS 100% 100% 88% 100% 100% 77% 85% 77% 85% 85% ∧ ∧ ∧ ∧ ∧ 92% 73% 83% 83% 83%
Springwood Central State School Springwood 37 32 28 –
Average score of the school 371 374 381 389 357 520 450 502 497 491 550 514 549 527 535 – – – – –
Percentage (%) of students at or above NMS 92% 100% 100% 100% 88% 100% 92% 96% 96% 96% 100% 89% 100% 89% 100% – – – – –
Springwood Road State School Springwood 75 92 47 –
Average score of the school 393 379 396 413 376 492 457 473 481 479 517 475 511 514 521 – – – – –
Percentage (%) of students at or above NMS 90% 92% 95% 93% 90% 94% 89% 90% 91% 94% 89% 72% 85% 87% 98% – – – – –
Springwood State High School Springwood – – – 167
Average score of the school – – – – – – – – – – – – – – – 548 518 571 551 563
Percentage (%) of students at or above NMS – – – – – – – – – – – – – – – 88% 69% 91% 82% 94%
St Agatha’s Primary School (Clayfield) Clayfield 53 30 23 –
Average score of the school 458 428 457 514 422 514 488 518 527 507 617 603 605 653 625 – – – – –
Percentage (%) of students at or above NMS 100% 100% 100% 100% 100% 100% 100% 100% 100% 100% 100% 100% 100% 100% 100% – – – – –
St Agnes School (Mount Gravatt) Mount Gravatt 53 48 29 –
Average score of the school 404 421 387 415 404 527 495 498 526 493 564 510 547 572 549 – – – – –
Percentage (%) of students at or above NMS 98% 100% 94% 100% 96% 98% 98% 98% 100% 100% 100% 100% 97% 100% 97% – – – – –
St Aidan’s Anglican Girls’ School Corinda 21 29 47 72
Average score of the school 524 472 481 564 506 586 541 531 585 528 592 577 582 615 596 645 606 636 644 649
Percentage (%) of students at or above NMS 100% 100% 100% 100% 100% 100% 100% 100% 100% 100% 100% 98% 100% 100% 100% 100% 100% 99% 100% 100%
St Ambrose’s Primary School (Newmarket) Newmarket 52 21 6 –
Average score of the school 468 422 423 454 453 545 498 526 579 529 573 504 543 542 539 – – – – –
Percentage (%) of students at or above NMS 96% 96% 96% 96% 96% 100% 100% 100% 100% 100% 83% 67% 100% 83% 100% – – – – –
St Andrew’s Anglican College Peregian Springs 82 90 103 113
Average score of the school 451 431 417 458 431 542 508 511 531 514 583 538 562 573 566 610 570 592 600 598
Percentage (%) of students at or above NMS 99% 99% 99% 99% 99% 98% 98% 95% 98% 97% 100% 97% 100% 99% 100% 97% 91% 92% 96% 99%
St Andrew’s Catholic College Redlynch 112 112 110 155
Average score of the school 435 403 395 442 405 514 466 481 511 492 572 530 544 570 577 597 586 594 584 598
Percentage (%) of students at or above NMS 96% 99% 97% 96% 99% 99% 95% 93% 96% 98% 100% 98% 98% 93% 99% 96% 93% 96% 93% 97%
St Andrew’s Catholic School (Ferny Grove) Ferny Grove 79 69 49 –
Average score of the school 465 443 425 466 454 524 505 498 539 506 582 558 572 575 583 – – – – –
Percentage (%) of students at or above NMS 100% 100% 99% 100% 99% 100% 100% 97% 100% 100% 100% 100% 100% 100% 100% – – – – –
KEY∧ to maintain privacy of individual student information, where there are fewer than five students tested results are not provided∗ no students in the year level sat the test due to absence, exemption or withdrawal– no students in the year levelNMS National Minimum Standard (for further information see www.nap.edu.au)
Queensland Curriculum & Assessment Authority
Page 108 of 149
NAPLAN 2014 Outcomes — All Queensland schools

Year level enrolments Year 3 Year 5 Year 7 Year 9
School Locality Yr 3 Yr 5 Yr 7 Yr 9 READ WRIT SPEL GP NMCY READ WRIT SPEL GP NMCY READ WRIT SPEL GP NMCY READ WRIT SPEL GP NMCY
St Andrews Lutheran College Tallebudgera 82 84 101 108
Average score of the school 445 417 425 425 394 536 494 510 541 517 557 528 549 557 556 593 574 597 588 603
Percentage (%) of students at or above NMS 99% 99% 99% 99% 99% 100% 99% 100% 99% 100% 100% 99% 99% 100% 99% 98% 91% 93% 96% 99%
St Anne’s Catholic Primary School (Sarina) Sarina 38 27 19 –
Average score of the school 387 345 368 385 374 490 473 470 488 477 520 507 545 528 534 – – – – –
Percentage (%) of students at or above NMS 91% 83% 94% 91% 100% 96% 91% 88% 92% 92% 94% 94% 94% 94% 100% – – – – –
St Anthony’s Catholic College Deeragun 97 112 50 113
Average score of the school 378 394 380 407 365 480 447 475 482 474 510 446 500 507 507 565 532 560 560 569
Percentage (%) of students at or above NMS 87% 97% 93% 94% 95% 91% 89% 95% 93% 91% 88% 65% 91% 91% 91% 86% 75% 86% 84% 93%
St Anthony’s Catholic Primary School (North
Rockhampton)
North Rockhampton 68 70 52 –
Average score of the school 389 363 386 407 382 483 418 477 486 473 532 478 536 536 547 – – – – –
Percentage (%) of students at or above NMS 88% 98% 99% 96% 100% 96% 80% 90% 90% 93% 92% 86% 94% 94% 94% – – – – –
St Anthony’s School (Alexandra Hills) Alexandra Hills 68 61 24 –
Average score of the school 421 379 403 438 393 496 437 483 492 471 515 507 531 535 514 – – – – –
Percentage (%) of students at or above NMS 99% 100% 97% 97% 97% 92% 83% 90% 98% 88% 95% 86% 91% 95% 95% – – – – –
St Anthony’s School (Dimbulah) Dimbulah 8 11 9 –
Average score of the school 319 317 285 287 344 442 427 449 450 431 512 484 484 490 497 – – – – –
Percentage (%) of students at or above NMS 63% 86% 71% 71% 63% 73% 82% 91% 73% 91% 89% 89% 78% 89% 89% – – – – –
St Anthony’s School (Kedron) Kedron 110 60 33 –
Average score of the school 461 431 445 485 424 530 495 508 529 497 553 552 552 567 563 – – – – –
Percentage (%) of students at or above NMS 99% 98% 99% 99% 97% 100% 100% 100% 98% 98% 97% 97% 100% 97% 94% – – – – –
St Anthony’s School (Toowoomba) Toowoomba 35 25 19 –
Average score of the school 393 355 363 380 377 530 486 499 521 492 559 532 526 548 544 – – – – –
Percentage (%) of students at or above NMS 77% 86% 83% 86% 88% 92% 92% 88% 88% 88% 94% 94% 89% 83% 100% – – – – –
St Augustine’s College Cairns – – – 137
Average score of the school – – – – – – – – – – – – – – – 604 577 601 593 625
Percentage (%) of students at or above NMS – – – – – – – – – – – – – – – 99% 90% 97% 99% 99%
St Augustine’s College Springfield 91 88 71 137
Average score of the school 431 407 417 430 393 498 464 496 491 477 538 496 534 527 536 568 550 569 562 575
Percentage (%) of students at or above NMS 100% 100% 99% 97% 98% 94% 92% 95% 94% 93% 100% 90% 99% 93% 100% 94% 82% 93% 87% 97%
St Augustine’s Parish Primary School
(Currumbin Waters)
Currumbin Waters 49 55 41 –
Average score of the school 437 424 405 419 390 518 478 508 520 503 554 524 531 555 554 – – – – –
Percentage (%) of students at or above NMS 100% 100% 100% 98% 98% 98% 96% 100% 98% 87% 94% 97% 91% 97% 97% – – – – –
KEY∧ to maintain privacy of individual student information, where there are fewer than five students tested results are not provided∗ no students in the year level sat the test due to absence, exemption or withdrawal– no students in the year levelNMS National Minimum Standard (for further information see www.nap.edu.au)
Queensland Curriculum & Assessment Authority
Page 109 of 149
NAPLAN 2014 Outcomes — All Queensland schools
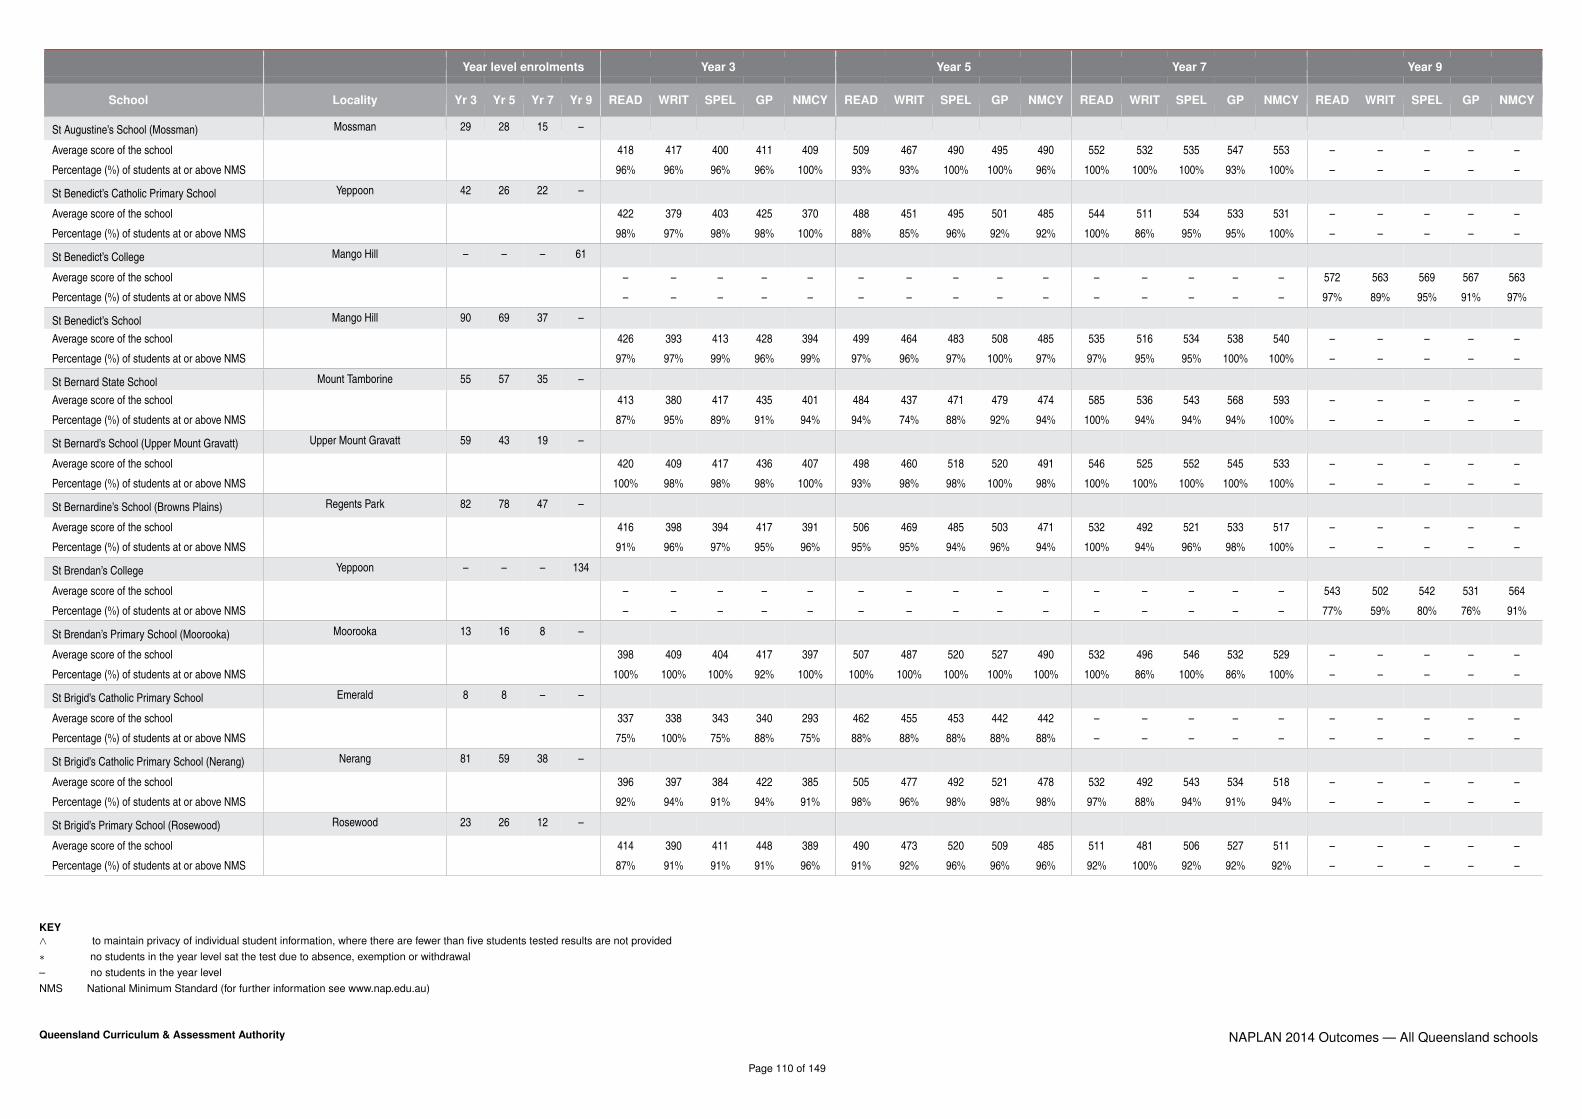
Year level enrolments Year 3 Year 5 Year 7 Year 9
School Locality Yr 3 Yr 5 Yr 7 Yr 9 READ WRIT SPEL GP NMCY READ WRIT SPEL GP NMCY READ WRIT SPEL GP NMCY READ WRIT SPEL GP NMCY
St Augustine’s School (Mossman) Mossman 29 28 15 –
Average score of the school 418 417 400 411 409 509 467 490 495 490 552 532 535 547 553 – – – – –
Percentage (%) of students at or above NMS 96% 96% 96% 96% 100% 93% 93% 100% 100% 96% 100% 100% 100% 93% 100% – – – – –
St Benedict’s Catholic Primary School Yeppoon 42 26 22 –
Average score of the school 422 379 403 425 370 488 451 495 501 485 544 511 534 533 531 – – – – –
Percentage (%) of students at or above NMS 98% 97% 98% 98% 100% 88% 85% 96% 92% 92% 100% 86% 95% 95% 100% – – – – –
St Benedict’s College Mango Hill – – – 61
Average score of the school – – – – – – – – – – – – – – – 572 563 569 567 563
Percentage (%) of students at or above NMS – – – – – – – – – – – – – – – 97% 89% 95% 91% 97%
St Benedict’s School Mango Hill 90 69 37 –
Average score of the school 426 393 413 428 394 499 464 483 508 485 535 516 534 538 540 – – – – –
Percentage (%) of students at or above NMS 97% 97% 99% 96% 99% 97% 96% 97% 100% 97% 97% 95% 95% 100% 100% – – – – –
St Bernard State School Mount Tamborine 55 57 35 –
Average score of the school 413 380 417 435 401 484 437 471 479 474 585 536 543 568 593 – – – – –
Percentage (%) of students at or above NMS 87% 95% 89% 91% 94% 94% 74% 88% 92% 94% 100% 94% 94% 94% 100% – – – – –
St Bernard’s School (Upper Mount Gravatt) Upper Mount Gravatt 59 43 19 –
Average score of the school 420 409 417 436 407 498 460 518 520 491 546 525 552 545 533 – – – – –
Percentage (%) of students at or above NMS 100% 98% 98% 98% 100% 93% 98% 98% 100% 98% 100% 100% 100% 100% 100% – – – – –
St Bernardine’s School (Browns Plains) Regents Park 82 78 47 –
Average score of the school 416 398 394 417 391 506 469 485 503 471 532 492 521 533 517 – – – – –
Percentage (%) of students at or above NMS 91% 96% 97% 95% 96% 95% 95% 94% 96% 94% 100% 94% 96% 98% 100% – – – – –
St Brendan’s College Yeppoon – – – 134
Average score of the school – – – – – – – – – – – – – – – 543 502 542 531 564
Percentage (%) of students at or above NMS – – – – – – – – – – – – – – – 77% 59% 80% 76% 91%
St Brendan’s Primary School (Moorooka) Moorooka 13 16 8 –
Average score of the school 398 409 404 417 397 507 487 520 527 490 532 496 546 532 529 – – – – –
Percentage (%) of students at or above NMS 100% 100% 100% 92% 100% 100% 100% 100% 100% 100% 100% 86% 100% 86% 100% – – – – –
St Brigid’s Catholic Primary School Emerald 8 8 – –
Average score of the school 337 338 343 340 293 462 455 453 442 442 – – – – – – – – – –
Percentage (%) of students at or above NMS 75% 100% 75% 88% 75% 88% 88% 88% 88% 88% – – – – – – – – – –
St Brigid’s Catholic Primary School (Nerang) Nerang 81 59 38 –
Average score of the school 396 397 384 422 385 505 477 492 521 478 532 492 543 534 518 – – – – –
Percentage (%) of students at or above NMS 92% 94% 91% 94% 91% 98% 96% 98% 98% 98% 97% 88% 94% 91% 94% – – – – –
St Brigid’s Primary School (Rosewood) Rosewood 23 26 12 –
Average score of the school 414 390 411 448 389 490 473 520 509 485 511 481 506 527 511 – – – – –
Percentage (%) of students at or above NMS 87% 91% 91% 91% 96% 91% 92% 96% 96% 96% 92% 100% 92% 92% 92% – – – – –
KEY∧ to maintain privacy of individual student information, where there are fewer than five students tested results are not provided∗ no students in the year level sat the test due to absence, exemption or withdrawal– no students in the year levelNMS National Minimum Standard (for further information see www.nap.edu.au)
Queensland Curriculum & Assessment Authority
Page 110 of 149
NAPLAN 2014 Outcomes — All Queensland schools
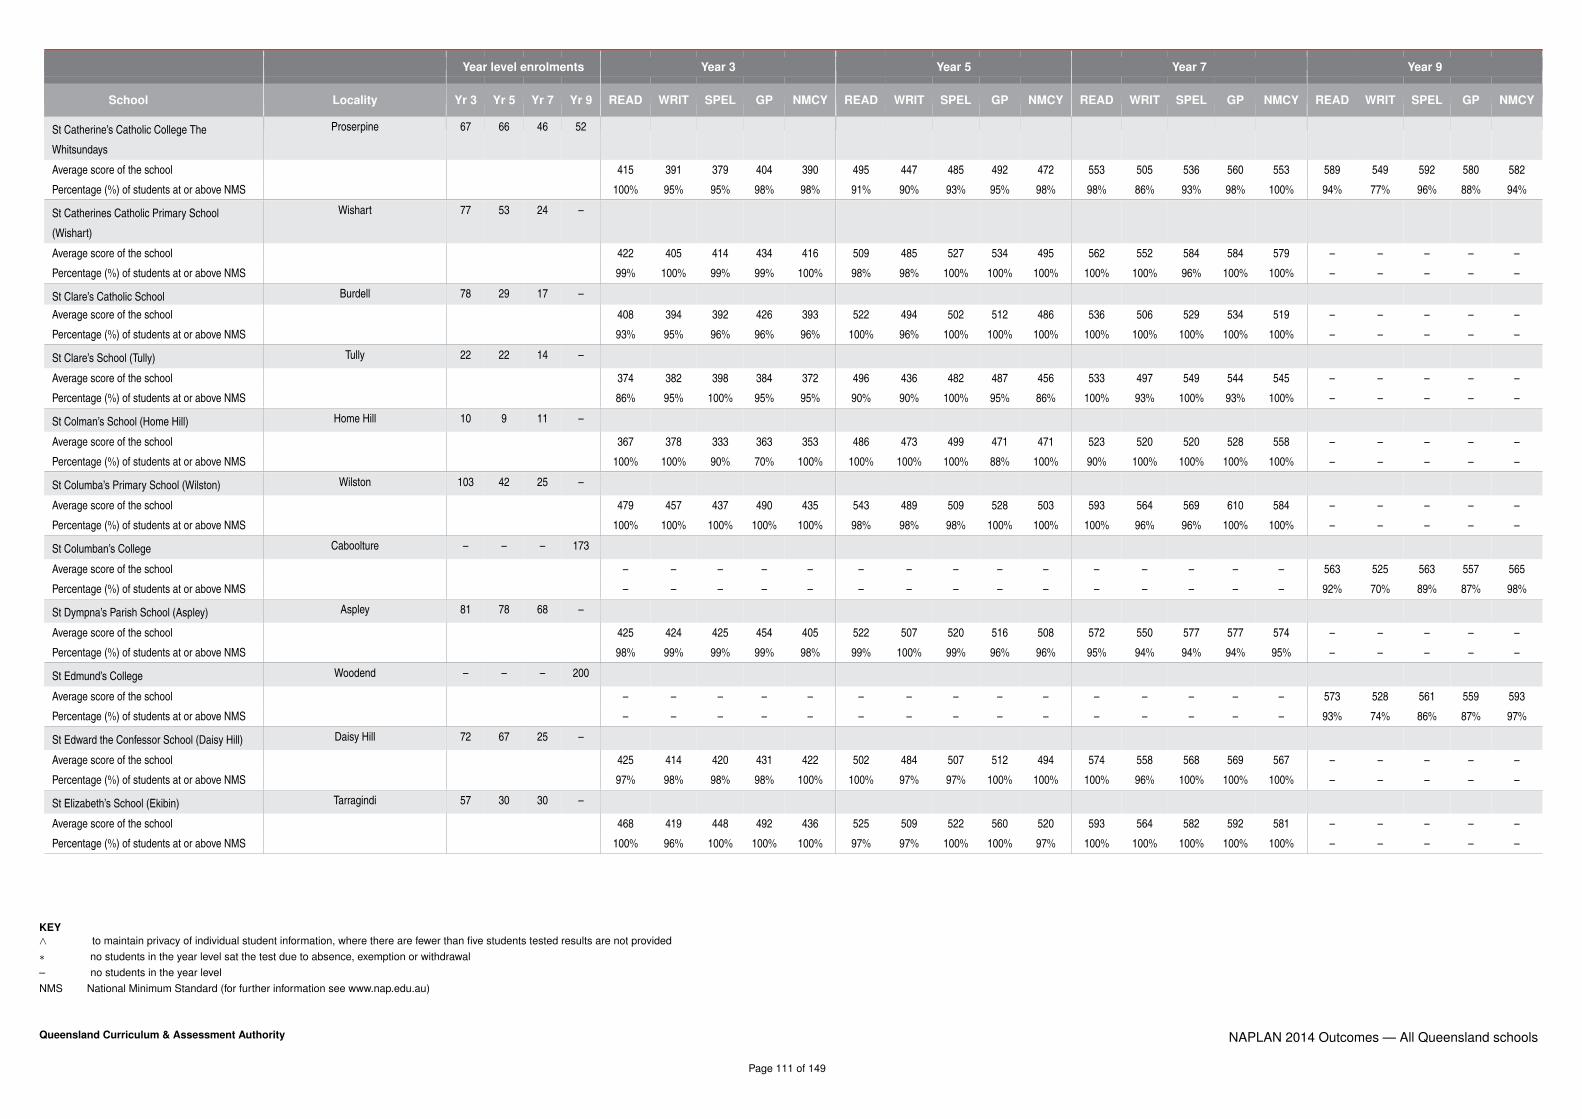
Year level enrolments Year 3 Year 5 Year 7 Year 9
School Locality Yr 3 Yr 5 Yr 7 Yr 9 READ WRIT SPEL GP NMCY READ WRIT SPEL GP NMCY READ WRIT SPEL GP NMCY READ WRIT SPEL GP NMCY
St Catherine’s Catholic College The
Whitsundays
Proserpine 67 66 46 52
Average score of the school 415 391 379 404 390 495 447 485 492 472 553 505 536 560 553 589 549 592 580 582
Percentage (%) of students at or above NMS 100% 95% 95% 98% 98% 91% 90% 93% 95% 98% 98% 86% 93% 98% 100% 94% 77% 96% 88% 94%
St Catherines Catholic Primary School
(Wishart)
Wishart 77 53 24 –
Average score of the school 422 405 414 434 416 509 485 527 534 495 562 552 584 584 579 – – – – –
Percentage (%) of students at or above NMS 99% 100% 99% 99% 100% 98% 98% 100% 100% 100% 100% 100% 96% 100% 100% – – – – –
St Clare’s Catholic School Burdell 78 29 17 –
Average score of the school 408 394 392 426 393 522 494 502 512 486 536 506 529 534 519 – – – – –
Percentage (%) of students at or above NMS 93% 95% 96% 96% 96% 100% 96% 100% 100% 100% 100% 100% 100% 100% 100% – – – – –
St Clare’s School (Tully) Tully 22 22 14 –
Average score of the school 374 382 398 384 372 496 436 482 487 456 533 497 549 544 545 – – – – –
Percentage (%) of students at or above NMS 86% 95% 100% 95% 95% 90% 90% 100% 95% 86% 100% 93% 100% 93% 100% – – – – –
St Colman’s School (Home Hill) Home Hill 10 9 11 –
Average score of the school 367 378 333 363 353 486 473 499 471 471 523 520 520 528 558 – – – – –
Percentage (%) of students at or above NMS 100% 100% 90% 70% 100% 100% 100% 100% 88% 100% 90% 100% 100% 100% 100% – – – – –
St Columba’s Primary School (Wilston) Wilston 103 42 25 –
Average score of the school 479 457 437 490 435 543 489 509 528 503 593 564 569 610 584 – – – – –
Percentage (%) of students at or above NMS 100% 100% 100% 100% 100% 98% 98% 98% 100% 100% 100% 96% 96% 100% 100% – – – – –
St Columban’s College Caboolture – – – 173
Average score of the school – – – – – – – – – – – – – – – 563 525 563 557 565
Percentage (%) of students at or above NMS – – – – – – – – – – – – – – – 92% 70% 89% 87% 98%
St Dympna’s Parish School (Aspley) Aspley 81 78 68 –
Average score of the school 425 424 425 454 405 522 507 520 516 508 572 550 577 577 574 – – – – –
Percentage (%) of students at or above NMS 98% 99% 99% 99% 98% 99% 100% 99% 96% 96% 95% 94% 94% 94% 95% – – – – –
St Edmund’s College Woodend – – – 200
Average score of the school – – – – – – – – – – – – – – – 573 528 561 559 593
Percentage (%) of students at or above NMS – – – – – – – – – – – – – – – 93% 74% 86% 87% 97%
St Edward the Confessor School (Daisy Hill) Daisy Hill 72 67 25 –
Average score of the school 425 414 420 431 422 502 484 507 512 494 574 558 568 569 567 – – – – –
Percentage (%) of students at or above NMS 97% 98% 98% 98% 100% 100% 97% 97% 100% 100% 100% 96% 100% 100% 100% – – – – –
St Elizabeth’s School (Ekibin) Tarragindi 57 30 30 –
Average score of the school 468 419 448 492 436 525 509 522 560 520 593 564 582 592 581 – – – – –
Percentage (%) of students at or above NMS 100% 96% 100% 100% 100% 97% 97% 100% 100% 97% 100% 100% 100% 100% 100% – – – – –
KEY∧ to maintain privacy of individual student information, where there are fewer than five students tested results are not provided∗ no students in the year level sat the test due to absence, exemption or withdrawal– no students in the year levelNMS National Minimum Standard (for further information see www.nap.edu.au)
Queensland Curriculum & Assessment Authority
Page 111 of 149
NAPLAN 2014 Outcomes — All Queensland schools

Year level enrolments Year 3 Year 5 Year 7 Year 9
School Locality Yr 3 Yr 5 Yr 7 Yr 9 READ WRIT SPEL GP NMCY READ WRIT SPEL GP NMCY READ WRIT SPEL GP NMCY READ WRIT SPEL GP NMCY
St Eugene College Burpengary 92 89 91 119
Average score of the school 401 383 383 392 379 475 446 474 456 455 529 477 525 514 508 559 521 565 559 563
Percentage (%) of students at or above NMS 90% 94% 99% 98% 98% 99% 88% 93% 90% 93% 96% 83% 92% 90% 92% 91% 74% 90% 85% 93%
St Finbarr’s School (Ashgrove) Ashgrove 27 16 14 –
Average score of the school 496 432 450 478 457 518 475 501 520 500 562 549 569 575 554 – – – – –
Percentage (%) of students at or above NMS 100% 100% 100% 100% 100% 94% 94% 100% 94% 100% 100% 100% 100% 93% 100% – – – – –
St Finbarr’s School (Quilpie) Quilpie 3 3 – –
Average score of the school ∧ ∧ ∧ ∧ ∧ ∧ ∧ ∧ ∧ ∧ – – – – – – – – – –
Percentage (%) of students at or above NMS ∧ ∧ ∧ ∧ ∧ ∧ ∧ ∧ ∧ ∧ – – – – – – – – – –
St Flannan’s School (Zillmere) Zillmere 38 40 14 –
Average score of the school 379 337 391 379 382 479 449 493 489 456 529 503 525 524 528 – – – – –
Percentage (%) of students at or above NMS 94% 86% 92% 89% 94% 87% 77% 95% 90% 85% 100% 85% 77% 92% 100% – – – – –
St Francis Catholic Primary School Tannum Sands 46 51 30 –
Average score of the school 426 416 410 423 415 517 477 493 528 489 554 490 533 553 570 – – – – –
Percentage (%) of students at or above NMS 91% 98% 100% 91% 95% 94% 94% 98% 96% 92% 100% 93% 100% 97% 100% – – – – –
St Francis College Crestmead 65 69 46 83
Average score of the school 327 337 327 340 333 428 407 443 433 423 495 442 503 486 492 530 495 550 521 533
Percentage (%) of students at or above NMS 73% 90% 77% 89% 93% 76% 71% 82% 80% 74% 80% 63% 71% 71% 80% 79% 58% 81% 69% 88%
St Francis De Sales School (Clifton) Clifton 10 6 7 –
Average score of the school 374 382 366 389 381 522 479 533 500 457 589 541 569 599 543 – – – – –
Percentage (%) of students at or above NMS 90% 100% 100% 90% 100% 100% 100% 100% 100% 100% 100% 100% 100% 100% 100% – – – – –
St Francis Xavier Catholic Primary School
(Mackay)
Mackay West 60 50 45 –
Average score of the school 400 369 380 407 381 506 476 494 513 491 532 510 505 528 523 – – – – –
Percentage (%) of students at or above NMS 86% 82% 88% 90% 86% 93% 91% 93% 93% 91% 95% 98% 89% 93% 100% – – – – –
St Francis Xavier School (Runaway Bay) Runaway Bay 88 83 60 –
Average score of the school 434 424 425 431 403 511 486 497 506 492 564 535 561 573 557 – – – – –
Percentage (%) of students at or above NMS 98% 100% 99% 100% 99% 99% 98% 99% 98% 99% 98% 98% 98% 97% 100% – – – – –
St Francis Xavier’s School (Goodna) Goodna 82 53 33 –
Average score of the school 390 381 388 386 366 490 483 480 505 469 532 501 533 530 540 – – – – –
Percentage (%) of students at or above NMS 93% 95% 90% 90% 95% 92% 94% 87% 90% 92% 97% 88% 91% 91% 97% – – – – –
St Francis Xavier’s School (Manunda) Manunda 75 71 49 –
Average score of the school 403 394 406 421 395 518 465 498 519 497 568 538 551 570 561 – – – – –
Percentage (%) of students at or above NMS 93% 97% 99% 96% 96% 100% 88% 97% 97% 99% 100% 98% 94% 96% 100% – – – – –
KEY∧ to maintain privacy of individual student information, where there are fewer than five students tested results are not provided∗ no students in the year level sat the test due to absence, exemption or withdrawal– no students in the year levelNMS National Minimum Standard (for further information see www.nap.edu.au)
Queensland Curriculum & Assessment Authority
Page 112 of 149
NAPLAN 2014 Outcomes — All Queensland schools

Year level enrolments Year 3 Year 5 Year 7 Year 9
School Locality Yr 3 Yr 5 Yr 7 Yr 9 READ WRIT SPEL GP NMCY READ WRIT SPEL GP NMCY READ WRIT SPEL GP NMCY READ WRIT SPEL GP NMCY
St Francis’ School (Ayr) Ayr 37 39 23 –
Average score of the school 431 426 416 463 420 490 465 480 514 484 533 519 540 541 529 – – – – –
Percentage (%) of students at or above NMS 94% 94% 94% 97% 97% 95% 92% 92% 97% 97% 100% 91% 96% 87% 95% – – – – –
St Francis’ School (Hughenden) Hughenden 5 4 1 –
Average score of the school 469 388 384 416 361 ∧ ∧ ∧ ∧ ∧ ∗ ∗ ∗ ∗ ∗ – – – – –
Percentage (%) of students at or above NMS 100% 100% 100% 100% 80% ∧ ∧ ∧ ∧ ∧ ∗ ∗ ∗ ∗ ∗ – – – – –
St George State High School St George – – – 35
Average score of the school – – – – – – – – – – – – – – – 539 456 540 531 559
Percentage (%) of students at or above NMS – – – – – – – – – – – – – – – 76% 43% 60% 67% 64%
St George State School St George 28 26 20 –
Average score of the school 351 353 338 346 351 422 418 446 424 419 515 493 502 506 517 – – – – –
Percentage (%) of students at or above NMS 82% 95% 79% 89% 87% 59% 71% 79% 67% 78% 88% 81% 75% 81% 93% – – – – –
St Gerard Majella Primary School (Woree) Woree 55 60 51 –
Average score of the school 429 411 416 436 410 521 477 491 505 484 569 531 558 572 554 – – – – –
Percentage (%) of students at or above NMS 96% 100% 96% 98% 100% 100% 92% 98% 97% 97% 94% 94% 96% 94% 100% – – – – –
St Helens State School Maryborough 35 29 21 –
Average score of the school 419 398 404 436 384 480 458 472 487 469 497 505 508 503 506 – – – – –
Percentage (%) of students at or above NMS 97% 100% 97% 97% 100% 88% 85% 89% 89% 100% 95% 100% 95% 95% 100% – – – – –
St Hilda’s School Southport 87 61 69 105
Average score of the school 464 438 455 506 447 544 518 527 566 522 585 558 570 595 577 619 616 625 627 617
Percentage (%) of students at or above NMS 98% 100% 99% 100% 100% 100% 100% 100% 100% 98% 100% 99% 99% 100% 100% 98% 98% 100% 99% 99%
St Ignatius School (Toowong) Toowong 48 22 6 –
Average score of the school 449 419 411 474 423 544 511 526 559 546 639 590 584 630 585 – – – – –
Percentage (%) of students at or above NMS 100% 98% 100% 100% 100% 100% 95% 100% 100% 100% 100% 100% 100% 100% 100% – – – – –
St Ita’s Regional Primary School Dutton Park 55 44 30 –
Average score of the school 463 409 423 466 428 551 492 523 561 520 610 590 595 620 626 – – – – –
Percentage (%) of students at or above NMS 100% 100% 100% 100% 100% 100% 98% 98% 100% 98% 97% 97% 97% 97% 97% – – – – –
St James College Brisbane – – – 51
Average score of the school – – – – – – – – – – – – – – – 537 512 536 529 540
Percentage (%) of students at or above NMS – – – – – – – – – – – – – – – 81% 66% 79% 79% 93%
St James Lutheran College Urraween 47 30 43 37
Average score of the school 398 382 386 412 369 479 449 482 492 460 539 490 527 514 515 589 536 571 579 580
Percentage (%) of students at or above NMS 93% 95% 95% 95% 93% 93% 93% 97% 100% 93% 98% 80% 95% 93% 95% 87% 81% 95% 84% 100%
St James Primary School (Coorparoo) Coorparoo 26 11 13 –
Average score of the school 451 403 404 448 424 557 440 505 540 493 560 509 541 568 559 – – – – –
Percentage (%) of students at or above NMS 100% 100% 100% 100% 100% 100% 82% 100% 100% 100% 100% 100% 92% 100% 100% – – – – –
KEY∧ to maintain privacy of individual student information, where there are fewer than five students tested results are not provided∗ no students in the year level sat the test due to absence, exemption or withdrawal– no students in the year levelNMS National Minimum Standard (for further information see www.nap.edu.au)
Queensland Curriculum & Assessment Authority
Page 113 of 149
NAPLAN 2014 Outcomes — All Queensland schools

Year level enrolments Year 3 Year 5 Year 7 Year 9
School Locality Yr 3 Yr 5 Yr 7 Yr 9 READ WRIT SPEL GP NMCY READ WRIT SPEL GP NMCY READ WRIT SPEL GP NMCY READ WRIT SPEL GP NMCY
St Joachim’s School (Holland Park) Holland Park 50 37 9 –
Average score of the school 438 397 399 430 411 519 494 501 524 482 597 524 532 526 564 – – – – –
Percentage (%) of students at or above NMS 100% 100% 94% 98% 98% 100% 100% 100% 100% 97% 100% 88% 88% 88% 100% – – – – –
St John Bosco’s School (Collinsville) Collinsville 15 9 2 –
Average score of the school 299 278 302 295 303 491 459 484 506 488 ∧ ∧ ∧ ∧ ∧ – – – – –
Percentage (%) of students at or above NMS 50% 64% 64% 71% 79% 75% 75% 100% 88% 88% ∧ ∧ ∧ ∧ ∧ – – – – –
St John Fisher College Bracken Ridge – – – 87
Average score of the school – – – – – – – – – – – – – – – 602 593 603 605 592
Percentage (%) of students at or above NMS – – – – – – – – – – – – – – – 98% 95% 98% 97% 99%
St John Vianney’s Primary School Manly 51 25 5 –
Average score of the school 431 424 415 453 449 502 468 533 542 490 ∧ ∧ ∧ ∧ ∧ – – – – –
Percentage (%) of students at or above NMS 98% 100% 100% 100% 100% 100% 96% 100% 100% 100% ∧ ∧ ∧ ∧ ∧ – – – – –
St John the Baptist Catholic Primary School Gladstone 72 76 30 –
Average score of the school 436 412 432 452 422 495 463 491 496 487 540 541 545 545 554 – – – – –
Percentage (%) of students at or above NMS 98% 96% 100% 98% 99% 97% 96% 99% 97% 99% 97% 97% 97% 97% 97% – – – – –
St John’s Anglican College Forest Lake 60 40 38 110
Average score of the school 448 410 442 466 435 514 487 501 526 526 571 526 555 566 573 596 581 610 600 614
Percentage (%) of students at or above NMS 95% 95% 95% 93% 95% 97% 97% 97% 100% 100% 100% 92% 100% 97% 100% 94% 93% 94% 95% 98%
St John’s Catholic Primary School
(Walkerston)
Walkerston 38 30 14 –
Average score of the school 415 392 394 408 398 479 443 473 474 462 564 529 561 580 566 – – – – –
Percentage (%) of students at or above NMS 92% 97% 97% 89% 95% 90% 93% 97% 97% 93% 86% 92% 100% 100% 86% – – – – –
St John’s College Nambour – – – 123
Average score of the school – – – – – – – – – – – – – – – 591 581 582 580 590
Percentage (%) of students at or above NMS – – – – – – – – – – – – – – – 95% 95% 93% 96% 98%
St John’s Lutheran Primary School
(Bundaberg)
Bundaberg 29 23 21 –
Average score of the school 416 403 412 450 408 526 471 502 525 510 558 545 527 572 550 – – – – –
Percentage (%) of students at or above NMS 79% 86% 90% 86% 86% 100% 95% 100% 100% 95% 100% 94% 100% 94% 100% – – – – –
St John’s Lutheran School Kingaroy 38 47 29 –
Average score of the school 445 423 406 476 432 540 486 528 536 512 546 501 555 540 564 – – – – –
Percentage (%) of students at or above NMS 100% 100% 100% 100% 100% 98% 98% 100% 98% 98% 96% 100% 100% 92% 96% – – – – –
St John’s School Roma 48 56 41 52
Average score of the school 381 360 389 382 376 467 433 468 464 454 563 532 546 562 548 587 558 591 578 613
Percentage (%) of students at or above NMS 79% 90% 94% 90% 93% 85% 74% 93% 89% 92% 98% 95% 95% 93% 100% 100% 85% 92% 96% 100%
KEY∧ to maintain privacy of individual student information, where there are fewer than five students tested results are not provided∗ no students in the year level sat the test due to absence, exemption or withdrawal– no students in the year levelNMS National Minimum Standard (for further information see www.nap.edu.au)
Queensland Curriculum & Assessment Authority
Page 114 of 149
NAPLAN 2014 Outcomes — All Queensland schools

Year level enrolments Year 3 Year 5 Year 7 Year 9
School Locality Yr 3 Yr 5 Yr 7 Yr 9 READ WRIT SPEL GP NMCY READ WRIT SPEL GP NMCY READ WRIT SPEL GP NMCY READ WRIT SPEL GP NMCY
St John’s School (Silkwood) Silkwood 10 11 7 –
Average score of the school 419 417 381 441 416 512 493 490 523 513 553 482 503 562 588 – – – – –
Percentage (%) of students at or above NMS 100% 100% 100% 100% 100% 100% 100% 100% 100% 100% 100% 71% 86% 100% 100% – – – – –
St Joseph’s Catholic Primary School
(Barcaldine)
Barcaldine 5 2 3 –
Average score of the school 435 418 409 464 421 ∧ ∧ ∧ ∧ ∧ ∧ ∧ ∧ ∧ ∧ – – – – –
Percentage (%) of students at or above NMS 100% 100% 100% 100% 100% ∧ ∧ ∧ ∧ ∧ ∧ ∧ ∧ ∧ ∧ – – – – –
St Joseph’s Catholic Primary School (Biloela) Biloela 32 40 19 –
Average score of the school 390 382 347 398 368 492 473 484 515 483 526 508 547 541 557 – – – – –
Percentage (%) of students at or above NMS 96% 97% 90% 97% 93% 94% 94% 100% 97% 91% 94% 76% 94% 94% 100% – – – – –
St Joseph’s Catholic Primary School
(Blackall)
Blackall 6 6 7 –
Average score of the school 424 361 391 471 418 488 ∧ ∧ ∧ 480 537 494 502 568 537 – – – – –
Percentage (%) of students at or above NMS 100% 83% 100% 100% 100% 100% ∧ ∧ ∧ 100% 100% 83% 83% 100% 100% – – – – –
St Joseph’s Catholic Primary School
(Bracken Ridge
Bracken Ridge 83 83 55 –
Average score of the school 425 394 405 422 387 511 471 514 524 488 556 531 563 549 538 – – – – –
Percentage (%) of students at or above NMS 99% 97% 97% 100% 100% 97% 95% 96% 97% 99% 98% 94% 94% 96% 98% – – – – –
St Joseph’s Catholic Primary School
(Bundaberg)
Bundaberg 28 19 15 –
Average score of the school 413 371 370 418 361 514 478 495 506 494 537 496 514 520 550 – – – – –
Percentage (%) of students at or above NMS 96% 96% 92% 100% 100% 100% 100% 100% 100% 100% 100% 93% 93% 87% 100% – – – – –
St Joseph’s Catholic Primary School
(Clermont)
Clermont 17 14 11 –
Average score of the school 405 413 382 403 393 521 462 503 507 491 557 515 537 551 540 – – – – –
Percentage (%) of students at or above NMS 88% 88% 88% 88% 88% 86% 79% 79% 86% 86% 91% 82% 82% 91% 91% – – – – –
St Joseph’s Catholic Primary School
(Mackay)
North Mackay 39 31 22 –
Average score of the school 388 371 367 367 376 485 437 478 491 471 527 499 503 527 521 – – – – –
Percentage (%) of students at or above NMS 86% 97% 89% 89% 97% 87% 73% 87% 93% 90% 100% 100% 86% 95% 100% – – – – –
St Joseph’s Catholic Primary School
(Rockhampton)
North Rockhampton 50 52 35 –
Average score of the school 372 339 366 383 359 467 442 479 469 454 526 487 524 537 510 – – – – –
Percentage (%) of students at or above NMS 96% 87% 92% 96% 96% 96% 86% 96% 96% 90% 94% 88% 91% 100% 91% – – – – –
KEY∧ to maintain privacy of individual student information, where there are fewer than five students tested results are not provided∗ no students in the year level sat the test due to absence, exemption or withdrawal– no students in the year levelNMS National Minimum Standard (for further information see www.nap.edu.au)
Queensland Curriculum & Assessment Authority
Page 115 of 149
NAPLAN 2014 Outcomes — All Queensland schools

Year level enrolments Year 3 Year 5 Year 7 Year 9
School Locality Yr 3 Yr 5 Yr 7 Yr 9 READ WRIT SPEL GP NMCY READ WRIT SPEL GP NMCY READ WRIT SPEL GP NMCY READ WRIT SPEL GP NMCY
St Joseph’s Catholic Primary School
(Wandal)
Wandal 26 25 25 –
Average score of the school 398 402 383 403 381 488 413 478 485 472 534 443 513 513 506 – – – – –
Percentage (%) of students at or above NMS 96% 96% 92% 92% 96% 92% 75% 92% 88% 92% 96% 68% 84% 84% 88% – – – – –
St Joseph’s College Gregory Terrace – 82 81 232
Average score of the school – – – – – 576 498 530 575 572 607 570 587 608 636 624 615 624 632 648
Percentage (%) of students at or above NMS – – – – – 100% 100% 100% 100% 100% 100% 99% 100% 100% 100% 98% 95% 98% 97% 100%
St Joseph’s College Toowoomba – – – 164
Average score of the school – – – – – – – – – – – – – – – 574 560 576 578 587
Percentage (%) of students at or above NMS – – – – – – – – – – – – – – – 94% 90% 94% 94% 99%
St Joseph’s Nudgee College Boondall – 128 86 232
Average score of the school – – – – – 524 484 518 526 522 553 520 551 561 563 583 564 578 572 606
Percentage (%) of students at or above NMS – – – – – 99% 98% 99% 100% 100% 98% 94% 95% 97% 99% 93% 82% 92% 93% 97%
St Joseph’s Nudgee Junior College
(Indooroopilly)
Indooroopilly – 116 121 –
Average score of the school – – – – – 527 475 503 514 515 572 524 544 555 572 – – – – –
Percentage (%) of students at or above NMS – – – – – 95% 92% 95% 96% 97% 97% 95% 96% 97% 97% – – – – –
St Joseph’s Primary School (Corinda) Corinda 62 53 30 –
Average score of the school 454 445 448 467 443 513 482 523 534 503 584 559 590 611 601 – – – – –
Percentage (%) of students at or above NMS 100% 100% 100% 98% 100% 100% 94% 100% 98% 96% 100% 100% 100% 100% 100% – – – – –
St Joseph’s Primary School (Kangaroo Point) Kangaroo Point 50 23 9 –
Average score of the school 448 410 412 441 416 516 479 491 481 483 576 550 593 617 601 – – – – –
Percentage (%) of students at or above NMS 96% 100% 94% 98% 100% 95% 91% 100% 91% 91% 100% 100% 100% 100% 100% – – – – –
St Joseph’s Primary School (Nambour) Nambour 58 59 54 –
Average score of the school 422 412 402 439 396 526 473 490 511 497 559 516 541 559 556 – – – – –
Percentage (%) of students at or above NMS 92% 98% 96% 96% 98% 96% 95% 96% 100% 100% 100% 98% 98% 100% 100% – – – – –
St Joseph’s School (Atherton) Atherton 25 25 18 –
Average score of the school 431 402 403 416 383 500 467 492 497 466 562 527 537 570 541 – – – – –
Percentage (%) of students at or above NMS 96% 100% 100% 100% 100% 96% 92% 96% 96% 92% 83% 83% 83% 78% 88% – – – – –
St Joseph’s School (Bardon) Bardon 78 31 17 –
Average score of the school 443 418 424 461 435 548 498 541 547 536 630 559 579 614 646 – – – – –
Percentage (%) of students at or above NMS 100% 100% 100% 100% 100% 100% 100% 100% 100% 97% 100% 94% 100% 100% 100% – – – – –
St Joseph’s School (Cairns) Parramatta Park 56 55 25 –
Average score of the school 411 386 391 423 402 508 455 500 505 506 535 527 561 535 541 – – – – –
Percentage (%) of students at or above NMS 91% 96% 91% 96% 96% 96% 85% 93% 95% 93% 96% 96% 96% 92% 100% – – – – –
KEY∧ to maintain privacy of individual student information, where there are fewer than five students tested results are not provided∗ no students in the year level sat the test due to absence, exemption or withdrawal– no students in the year levelNMS National Minimum Standard (for further information see www.nap.edu.au)
Queensland Curriculum & Assessment Authority
Page 116 of 149
NAPLAN 2014 Outcomes — All Queensland schools

Year level enrolments Year 3 Year 5 Year 7 Year 9
School Locality Yr 3 Yr 5 Yr 7 Yr 9 READ WRIT SPEL GP NMCY READ WRIT SPEL GP NMCY READ WRIT SPEL GP NMCY READ WRIT SPEL GP NMCY
St Joseph’s School (Childers) Childers 19 7 7 –
Average score of the school 392 345 392 387 377 504 480 477 524 481 544 506 546 506 524 – – – – –
Percentage (%) of students at or above NMS 100% 93% 100% 93% 93% 100% 100% 100% 100% 100% 100% 86% 100% 71% 100% – – – – –
St Joseph’s School (Chinchilla) Chinchilla 26 23 20 –
Average score of the school 410 402 383 446 410 464 430 460 454 439 528 485 502 513 532 – – – – –
Percentage (%) of students at or above NMS 84% 100% 92% 100% 100% 100% 83% 96% 83% 82% 95% 90% 90% 85% 95% – – – – –
St Joseph’s School (Cloncurry) Cloncurry 24 19 11 7
Average score of the school 406 356 396 395 361 543 495 520 514 537 524 515 503 537 533 563 520 524 528 551
Percentage (%) of students at or above NMS 92% 87% 100% 96% 100% 100% 100% 100% 100% 100% 82% 82% 82% 82% 100% 86% 71% 71% 71% 86%
St Joseph’s School (Gayndah) Gayndah 16 12 5 –
Average score of the school 364 372 382 334 347 473 443 444 448 458 533 465 525 529 581 – – – – –
Percentage (%) of students at or above NMS 81% 100% 100% 81% 88% 83% 91% 91% 82% 100% 100% 60% 100% 100% 80% – – – – –
St Joseph’s School (Ipswich North) North Ipswich 54 57 27 –
Average score of the school 375 368 349 376 367 484 454 467 488 465 558 485 535 540 550 – – – – –
Percentage (%) of students at or above NMS 84% 98% 86% 94% 92% 96% 95% 96% 96% 98% 100% 89% 96% 100% 100% – – – – –
St Joseph’s School (Millmerran) Millmerran 13 11 3 –
Average score of the school 394 396 419 399 418 497 442 516 497 464 ∧ ∧ ∧ ∧ ∧ – – – – –
Percentage (%) of students at or above NMS 100% 100% 100% 100% 100% 82% 82% 91% 100% 91% ∧ ∧ ∧ ∧ ∧ – – – – –
St Joseph’s School (Mount Isa) Mount Isa 45 49 39 –
Average score of the school 399 383 403 404 392 494 441 499 488 477 533 511 521 510 516 – – – – –
Percentage (%) of students at or above NMS 86% 93% 95% 93% 100% 90% 88% 94% 96% 96% 89% 84% 81% 81% 95% – – – – –
St Joseph’s School (Mundingburra) Mundingburra 55 57 44 –
Average score of the school 448 410 423 457 416 547 500 529 551 538 546 525 548 543 560 – – – – –
Percentage (%) of students at or above NMS 96% 98% 94% 98% 94% 96% 98% 96% 95% 98% 100% 98% 95% 100% 98% – – – – –
St Joseph’s School (Murgon) Murgon 18 18 8 –
Average score of the school 330 335 333 339 338 459 439 453 462 463 543 522 549 528 558 – – – – –
Percentage (%) of students at or above NMS 78% 89% 83% 78% 72% 89% 94% 89% 72% 78% 88% 88% 100% 88% 100% – – – – –
St Joseph’s School (North Ward) North Ward 49 53 40 –
Average score of the school 429 386 398 428 409 503 471 495 521 493 547 515 554 543 561 – – – – –
Percentage (%) of students at or above NMS 93% 98% 100% 98% 98% 96% 92% 96% 100% 96% 97% 92% 92% 97% 100% – – – – –
St Joseph’s School (Nundah) Nundah 33 16 11 –
Average score of the school 412 398 436 427 402 483 471 487 481 476 591 568 553 561 575 – – – – –
Percentage (%) of students at or above NMS 90% 100% 100% 97% 100% 87% 100% 86% 86% 93% 100% 100% 100% 100% 100% – – – – –
St Joseph’s School (Tara) Tara 6 3 4 –
Average score of the school ∧ ∧ ∧ ∧ ∧ ∗ ∗ ∗ ∗ ∗ ∧ ∧ ∧ ∧ ∧ – – – – –
Percentage (%) of students at or above NMS ∧ ∧ ∧ ∧ ∧ ∗ ∗ ∗ ∗ ∗ ∧ ∧ ∧ ∧ ∧ – – – – –
KEY∧ to maintain privacy of individual student information, where there are fewer than five students tested results are not provided∗ no students in the year level sat the test due to absence, exemption or withdrawal– no students in the year levelNMS National Minimum Standard (for further information see www.nap.edu.au)
Queensland Curriculum & Assessment Authority
Page 117 of 149
NAPLAN 2014 Outcomes — All Queensland schools

Year level enrolments Year 3 Year 5 Year 7 Year 9
School Locality Yr 3 Yr 5 Yr 7 Yr 9 READ WRIT SPEL GP NMCY READ WRIT SPEL GP NMCY READ WRIT SPEL GP NMCY READ WRIT SPEL GP NMCY
St Joseph’s School Stanthorpe 30 26 30 40
Average score of the school 429 426 421 453 433 531 476 502 509 515 546 512 558 543 562 599 583 608 594 592
Percentage (%) of students at or above NMS 97% 100% 100% 100% 100% 100% 100% 100% 100% 100% 97% 93% 97% 90% 97% 100% 97% 100% 100% 100%
St Joseph’s Tobruk Memorial School
(Beenleigh)
Beenleigh 60 61 31 –
Average score of the school 408 410 395 412 406 480 474 495 480 453 536 513 546 530 517 – – – – –
Percentage (%) of students at or above NMS 97% 98% 93% 97% 98% 93% 98% 95% 93% 95% 100% 97% 100% 97% 100% – – – – –
St Kevin’s School (Benowa) Benowa 86 78 68 –
Average score of the school 423 411 428 452 422 508 479 508 517 504 563 541 565 569 582 – – – – –
Percentage (%) of students at or above NMS 98% 96% 99% 99% 99% 100% 97% 99% 99% 99% 99% 100% 99% 100% 100% – – – – –
St Kevin’s School (Geebung) Geebung 47 34 25 –
Average score of the school 448 439 446 460 420 497 479 505 498 484 541 520 546 529 534 – – – – –
Percentage (%) of students at or above NMS 100% 100% 100% 100% 98% 94% 88% 97% 97% 100% 100% 100% 96% 100% 100% – – – – –
St Kieran’s School (Brighton) Brighton 57 39 12 –
Average score of the school 428 419 412 446 402 474 446 470 496 453 521 514 510 524 492 – – – – –
Percentage (%) of students at or above NMS 100% 98% 96% 100% 98% 97% 85% 92% 97% 97% 100% 100% 92% 92% 92% – – – – –
St Kieran’s School (Mount Isa) Mount Isa 22 19 13 –
Average score of the school 380 344 356 412 363 487 413 472 478 456 474 465 483 493 498 – – – – –
Percentage (%) of students at or above NMS 86% 86% 90% 95% 95% 94% 72% 89% 89% 95% 85% 85% 77% 77% 85% – – – – –
St Laurence’s College South Brisbane – 121 119 264
Average score of the school – – – – – 527 476 498 520 510 551 502 538 547 563 583 544 592 584 613
Percentage (%) of students at or above NMS – – – – – 99% 96% 96% 98% 99% 98% 96% 96% 98% 98% 92% 78% 95% 91% 100%
St Lawrence State School St Lawrence – 1 – –
Average score of the school – – – – – ∧ ∧ ∧ ∧ ∧ – – – – – – – – – –
Percentage (%) of students at or above NMS – – – – – ∧ ∧ ∧ ∧ ∧ – – – – – – – – – –
St Luke’s Anglican School Bundaberg 54 53 48 84
Average score of the school 449 435 436 470 421 518 474 500 529 495 550 523 539 551 554 600 564 602 599 608
Percentage (%) of students at or above NMS 100% 100% 100% 100% 100% 98% 96% 100% 98% 100% 96% 94% 100% 98% 96% 100% 85% 95% 94% 100%
St Luke’s Catholic Parish School (Capalaba) Capalaba 45 45 25 –
Average score of the school 421 398 397 431 398 504 456 497 496 484 524 512 509 513 514 – – – – –
Percentage (%) of students at or above NMS 100% 100% 100% 100% 100% 95% 86% 95% 93% 91% 100% 92% 96% 92% 100% – – – – –
St Margaret Mary’s College Hermit Park – – – 150
Average score of the school – – – – – – – – – – – – – – – 588 573 583 579 584
Percentage (%) of students at or above NMS – – – – – – – – – – – – – – – 99% 91% 97% 97% 100%
KEY∧ to maintain privacy of individual student information, where there are fewer than five students tested results are not provided∗ no students in the year level sat the test due to absence, exemption or withdrawal– no students in the year levelNMS National Minimum Standard (for further information see www.nap.edu.au)
Queensland Curriculum & Assessment Authority
Page 118 of 149
NAPLAN 2014 Outcomes — All Queensland schools

Year level enrolments Year 3 Year 5 Year 7 Year 9
School Locality Yr 3 Yr 5 Yr 7 Yr 9 READ WRIT SPEL GP NMCY READ WRIT SPEL GP NMCY READ WRIT SPEL GP NMCY READ WRIT SPEL GP NMCY
St Margaret’s Anglican Girls School Ascot 27 53 47 101
Average score of the school 469 437 446 498 440 547 512 519 567 529 587 558 566 617 608 620 609 619 623 621
Percentage (%) of students at or above NMS 100% 100% 96% 100% 100% 100% 100% 100% 100% 100% 100% 100% 100% 98% 100% 97% 96% 99% 99% 100%
St Maria Goretti School (Inglewood) Inglewood 4 2 2 –
Average score of the school ∧ ∧ ∧ ∧ ∧ ∧ ∧ ∧ ∧ ∧ ∧ ∧ ∧ ∧ ∧ – – – – –
Percentage (%) of students at or above NMS ∧ ∧ ∧ ∧ ∧ ∧ ∧ ∧ ∧ ∧ ∧ ∧ ∧ ∧ ∧ – – – – –
St Mark’s School (Inala) Inala 60 63 30 –
Average score of the school 399 354 406 385 371 469 426 503 467 460 519 489 550 519 541 – – – – –
Percentage (%) of students at or above NMS 97% 95% 93% 93% 97% 92% 73% 92% 87% 95% 89% 89% 93% 89% 100% – – – – –
St Martin’s School (Carina) Carina 110 56 39 –
Average score of the school 444 415 430 443 423 515 502 510 537 504 570 558 570 580 585 – – – – –
Percentage (%) of students at or above NMS 97% 100% 99% 100% 98% 96% 96% 94% 96% 98% 100% 100% 100% 97% 100% – – – – –
St Mary of the Cross School Windsor 5 8 2 –
Average score of the school 366 323 347 386 381 417 414 460 429 402 ∧ ∧ ∧ ∧ ∧ – – – – –
Percentage (%) of students at or above NMS 80% 100% 80% 100% 100% 86% 71% 86% 86% 86% ∧ ∧ ∧ ∧ ∧ – – – – –
St Mary’s Catholic College South Burnett 28 38 29 69
Average score of the school 391 367 362 367 352 485 419 472 466 463 533 491 519 524 537 570 523 571 560 564
Percentage (%) of students at or above NMS 93% 96% 93% 93% 85% 83% 84% 97% 95% 97% 100% 96% 92% 96% 96% 88% 75% 93% 88% 95%
St Mary’s Catholic College Woree – – – 153
Average score of the school – – – – – – – – – – – – – – – 575 540 580 573 586
Percentage (%) of students at or above NMS – – – – – – – – – – – – – – – 93% 85% 92% 91% 98%
St Mary’s Catholic Primary School
(Bundaberg)
Bundaberg 53 57 23 –
Average score of the school 379 351 361 398 364 497 452 487 496 478 555 520 557 549 571 – – – – –
Percentage (%) of students at or above NMS 87% 88% 88% 92% 88% 98% 96% 94% 100% 98% 100% 91% 100% 91% 100% – – – – –
St Mary’s Catholic Primary School (Mackay) Mackay South 47 51 28 –
Average score of the school 430 386 417 434 405 500 455 484 513 516 534 525 542 557 566 – – – – –
Percentage (%) of students at or above NMS 96% 100% 93% 98% 100% 98% 88% 98% 96% 98% 100% 96% 96% 96% 96% – – – – –
St Mary’s Catholic Primary School
(Rockhampton North)
North Rockhampton 49 51 20 –
Average score of the school 417 398 422 437 396 501 457 502 517 486 547 485 526 525 506 – – – – –
Percentage (%) of students at or above NMS 100% 100% 98% 98% 100% 90% 84% 94% 96% 94% 100% 89% 95% 89% 100% – – – – –
St Mary’s College Maryborough – – – 82
Average score of the school – – – – – – – – – – – – – – – 586 555 586 581 598
Percentage (%) of students at or above NMS – – – – – – – – – – – – – – – 89% 84% 89% 90% 98%
KEY∧ to maintain privacy of individual student information, where there are fewer than five students tested results are not provided∗ no students in the year level sat the test due to absence, exemption or withdrawal– no students in the year levelNMS National Minimum Standard (for further information see www.nap.edu.au)
Queensland Curriculum & Assessment Authority
Page 119 of 149
NAPLAN 2014 Outcomes — All Queensland schools
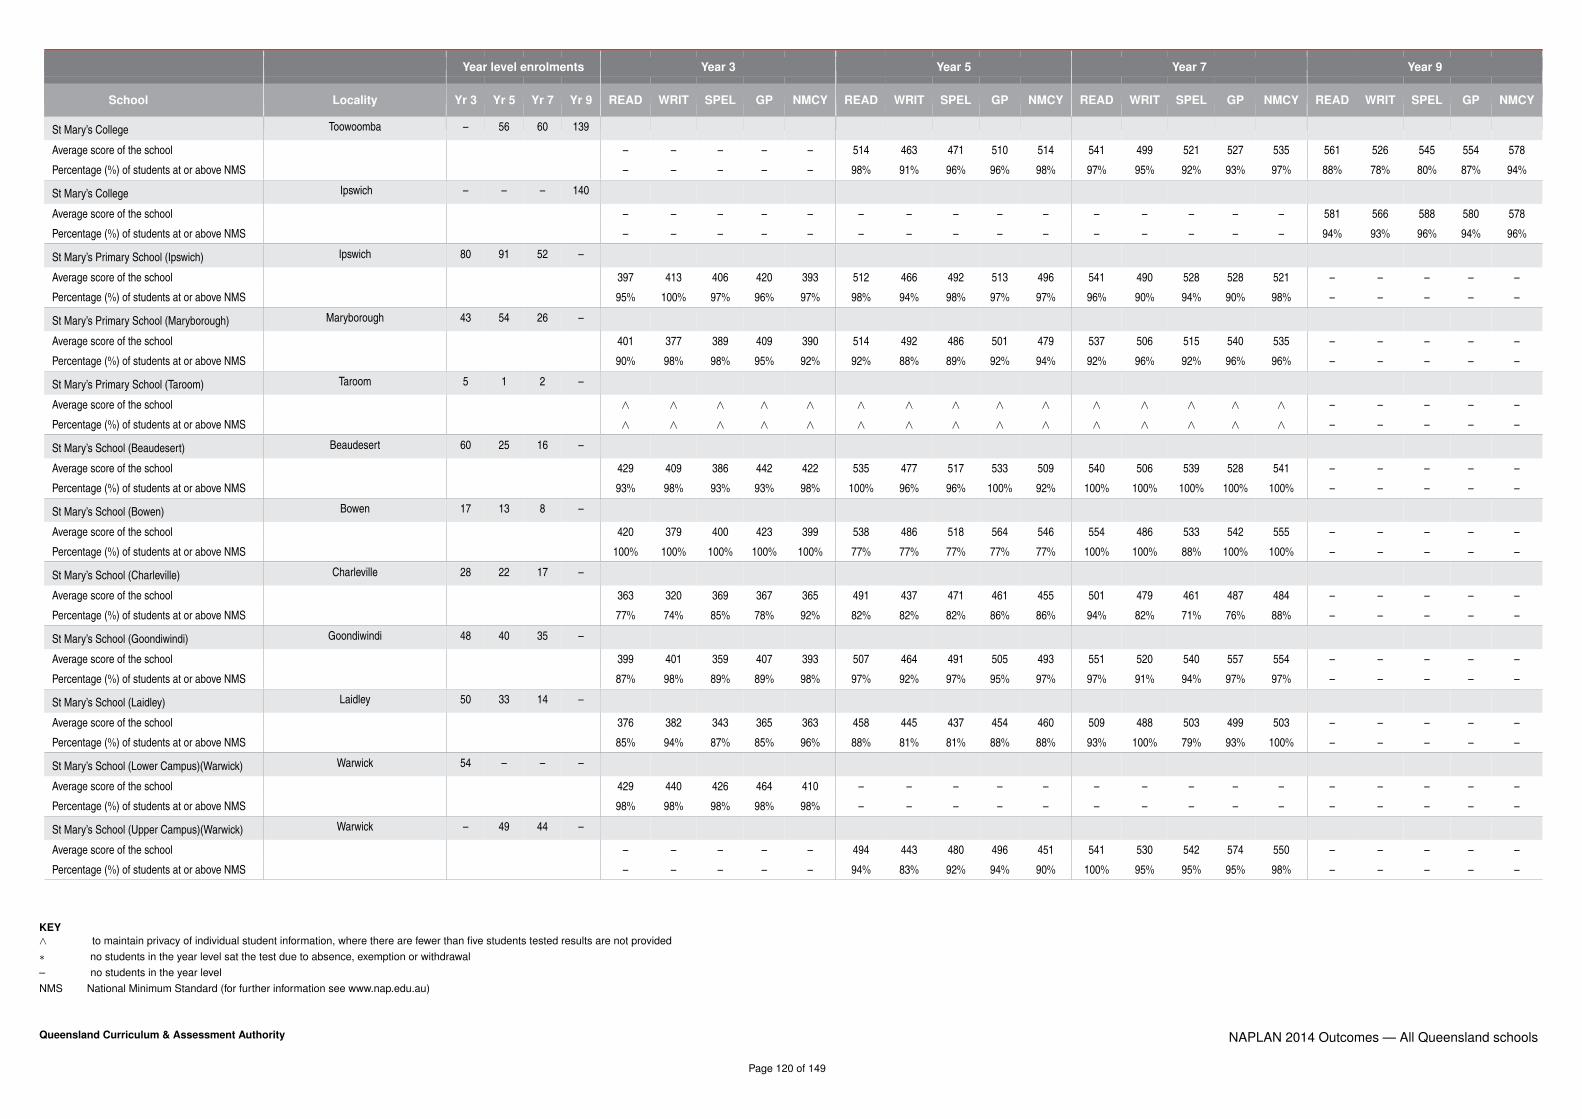
Year level enrolments Year 3 Year 5 Year 7 Year 9
School Locality Yr 3 Yr 5 Yr 7 Yr 9 READ WRIT SPEL GP NMCY READ WRIT SPEL GP NMCY READ WRIT SPEL GP NMCY READ WRIT SPEL GP NMCY
St Mary’s College Toowoomba – 56 60 139
Average score of the school – – – – – 514 463 471 510 514 541 499 521 527 535 561 526 545 554 578
Percentage (%) of students at or above NMS – – – – – 98% 91% 96% 96% 98% 97% 95% 92% 93% 97% 88% 78% 80% 87% 94%
St Mary’s College Ipswich – – – 140
Average score of the school – – – – – – – – – – – – – – – 581 566 588 580 578
Percentage (%) of students at or above NMS – – – – – – – – – – – – – – – 94% 93% 96% 94% 96%
St Mary’s Primary School (Ipswich) Ipswich 80 91 52 –
Average score of the school 397 413 406 420 393 512 466 492 513 496 541 490 528 528 521 – – – – –
Percentage (%) of students at or above NMS 95% 100% 97% 96% 97% 98% 94% 98% 97% 97% 96% 90% 94% 90% 98% – – – – –
St Mary’s Primary School (Maryborough) Maryborough 43 54 26 –
Average score of the school 401 377 389 409 390 514 492 486 501 479 537 506 515 540 535 – – – – –
Percentage (%) of students at or above NMS 90% 98% 98% 95% 92% 92% 88% 89% 92% 94% 92% 96% 92% 96% 96% – – – – –
St Mary’s Primary School (Taroom) Taroom 5 1 2 –
Average score of the school ∧ ∧ ∧ ∧ ∧ ∧ ∧ ∧ ∧ ∧ ∧ ∧ ∧ ∧ ∧ – – – – –
Percentage (%) of students at or above NMS ∧ ∧ ∧ ∧ ∧ ∧ ∧ ∧ ∧ ∧ ∧ ∧ ∧ ∧ ∧ – – – – –
St Mary’s School (Beaudesert) Beaudesert 60 25 16 –
Average score of the school 429 409 386 442 422 535 477 517 533 509 540 506 539 528 541 – – – – –
Percentage (%) of students at or above NMS 93% 98% 93% 93% 98% 100% 96% 96% 100% 92% 100% 100% 100% 100% 100% – – – – –
St Mary’s School (Bowen) Bowen 17 13 8 –
Average score of the school 420 379 400 423 399 538 486 518 564 546 554 486 533 542 555 – – – – –
Percentage (%) of students at or above NMS 100% 100% 100% 100% 100% 77% 77% 77% 77% 77% 100% 100% 88% 100% 100% – – – – –
St Mary’s School (Charleville) Charleville 28 22 17 –
Average score of the school 363 320 369 367 365 491 437 471 461 455 501 479 461 487 484 – – – – –
Percentage (%) of students at or above NMS 77% 74% 85% 78% 92% 82% 82% 82% 86% 86% 94% 82% 71% 76% 88% – – – – –
St Mary’s School (Goondiwindi) Goondiwindi 48 40 35 –
Average score of the school 399 401 359 407 393 507 464 491 505 493 551 520 540 557 554 – – – – –
Percentage (%) of students at or above NMS 87% 98% 89% 89% 98% 97% 92% 97% 95% 97% 97% 91% 94% 97% 97% – – – – –
St Mary’s School (Laidley) Laidley 50 33 14 –
Average score of the school 376 382 343 365 363 458 445 437 454 460 509 488 503 499 503 – – – – –
Percentage (%) of students at or above NMS 85% 94% 87% 85% 96% 88% 81% 81% 88% 88% 93% 100% 79% 93% 100% – – – – –
St Mary’s School (Lower Campus)(Warwick) Warwick 54 – – –
Average score of the school 429 440 426 464 410 – – – – – – – – – – – – – – –
Percentage (%) of students at or above NMS 98% 98% 98% 98% 98% – – – – – – – – – – – – – – –
St Mary’s School (Upper Campus)(Warwick) Warwick – 49 44 –
Average score of the school – – – – – 494 443 480 496 451 541 530 542 574 550 – – – – –
Percentage (%) of students at or above NMS – – – – – 94% 83% 92% 94% 90% 100% 95% 95% 95% 98% – – – – –
KEY∧ to maintain privacy of individual student information, where there are fewer than five students tested results are not provided∗ no students in the year level sat the test due to absence, exemption or withdrawal– no students in the year levelNMS National Minimum Standard (for further information see www.nap.edu.au)
Queensland Curriculum & Assessment Authority
Page 120 of 149
NAPLAN 2014 Outcomes — All Queensland schools

Year level enrolments Year 3 Year 5 Year 7 Year 9
School Locality Yr 3 Yr 5 Yr 7 Yr 9 READ WRIT SPEL GP NMCY READ WRIT SPEL GP NMCY READ WRIT SPEL GP NMCY READ WRIT SPEL GP NMCY
St Matthew’s School (Loganholme) Cornubia 77 85 52 –
Average score of the school 401 407 389 410 390 487 452 484 491 481 538 520 517 536 531 – – – – –
Percentage (%) of students at or above NMS 91% 97% 96% 97% 95% 92% 85% 94% 94% 96% 98% 96% 88% 96% 96% – – – – –
St Michael’s College Merrimac – – – 168
Average score of the school – – – – – – – – – – – – – – – 578 566 585 577 591
Percentage (%) of students at or above NMS – – – – – – – – – – – – – – – 97% 88% 97% 96% 100%
St Michael’s College (Caboolture) Caboolture 48 39 17 –
Average score of the school 412 394 395 412 397 516 452 486 510 489 557 549 555 544 540 – – – – –
Percentage (%) of students at or above NMS 95% 100% 100% 95% 98% 100% 89% 97% 100% 100% 100% 100% 100% 94% 100% – – – – –
St Michael’s School (Gordonvale) Gordonvale 28 36 20 –
Average score of the school 417 414 401 409 401 513 486 510 511 491 526 497 515 500 534 – – – – –
Percentage (%) of students at or above NMS 96% 100% 100% 100% 96% 94% 94% 97% 100% 97% 100% 95% 90% 80% 100% – – – – –
St Michael’s School (Palm Island) Palm Island 21 17 15 –
Average score of the school 265 213 229 257 270 332 252 322 346 343 408 307 362 401 439 – – – – –
Percentage (%) of students at or above NMS 32% 21% 26% 58% 47% 24% 12% 18% 29% 19% 33% 0% 20% 27% 73% – – – – –
St Monica’s College Cairns – – – 117
Average score of the school – – – – – – – – – – – – – – – 614 600 619 617 599
Percentage (%) of students at or above NMS – – – – – – – – – – – – – – – 100% 100% 100% 99% 100%
St Monica’s School (Oakey) Oakey 28 23 14 –
Average score of the school 381 390 371 400 375 493 418 495 502 480 532 491 529 530 554 – – – – –
Percentage (%) of students at or above NMS 86% 96% 96% 93% 96% 83% 74% 91% 100% 87% 93% 93% 100% 100% 100% – – – – –
St Oliver Plunkett School (Cannon Hill) Cannon Hill 85 55 22 –
Average score of the school 431 416 393 440 416 492 457 484 495 455 532 467 519 514 526 – – – – –
Percentage (%) of students at or above NMS 99% 100% 100% 99% 100% 95% 89% 93% 95% 89% 86% 82% 91% 77% 91% – – – – –
St Patrick’s Catholic Primary School
(Emerald)
Emerald 84 79 75 –
Average score of the school 389 381 383 408 388 494 473 483 497 490 546 514 541 554 567 – – – – –
Percentage (%) of students at or above NMS 96% 98% 93% 96% 99% 99% 93% 93% 95% 99% 100% 94% 97% 97% 99% – – – – –
St Patrick’s Catholic School (Bundaberg) Bundaberg West 57 54 45 –
Average score of the school 414 399 403 431 386 499 455 486 503 479 546 503 534 532 533 – – – – –
Percentage (%) of students at or above NMS 96% 98% 95% 100% 100% 98% 92% 98% 96% 96% 100% 95% 95% 98% 98% – – – – –
St Patrick’s College Gympie – – – 80
Average score of the school – – – – – – – – – – – – – – – 586 545 571 577 574
Percentage (%) of students at or above NMS – – – – – – – – – – – – – – – 95% 79% 92% 92% 95%
KEY∧ to maintain privacy of individual student information, where there are fewer than five students tested results are not provided∗ no students in the year level sat the test due to absence, exemption or withdrawal– no students in the year levelNMS National Minimum Standard (for further information see www.nap.edu.au)
Queensland Curriculum & Assessment Authority
Page 121 of 149
NAPLAN 2014 Outcomes — All Queensland schools

Year level enrolments Year 3 Year 5 Year 7 Year 9
School Locality Yr 3 Yr 5 Yr 7 Yr 9 READ WRIT SPEL GP NMCY READ WRIT SPEL GP NMCY READ WRIT SPEL GP NMCY READ WRIT SPEL GP NMCY
St Patrick’s College Shorncliffe – 130 94 184
Average score of the school – – – – – 512 466 501 505 493 547 514 539 542 550 593 555 588 575 611
Percentage (%) of students at or above NMS – – – – – 98% 94% 98% 97% 97% 97% 98% 96% 96% 100% 95% 89% 97% 96% 99%
St Patrick’s College Townsville – – – 72
Average score of the school – – – – – – – – – – – – – – – 538 504 548 527 534
Percentage (%) of students at or above NMS – – – – – – – – – – – – – – – 76% 66% 85% 69% 91%
St Patrick’s Primary School (Gympie) Gympie 64 74 48 –
Average score of the school 413 400 390 418 384 497 467 507 497 476 547 497 535 525 528 – – – – –
Percentage (%) of students at or above NMS 95% 98% 100% 98% 98% 90% 90% 96% 93% 93% 100% 90% 92% 90% 98% – – – – –
St Patrick’s Primary School (Mitchell) Mitchell 7 2 2 –
Average score of the school 258 247 279 305 279 ∧ ∗ ∗ ∗ ∧ ∧ ∧ ∧ ∧ ∧ – – – – –
Percentage (%) of students at or above NMS 40% 60% 60% 60% 40% ∧ ∗ ∗ ∗ ∧ ∧ ∧ ∧ ∧ ∧ – – – – –
St Patrick’s Primary School (Nanango) Nanango 11 8 16 –
Average score of the school 310 348 311 339 313 434 438 415 433 433 505 418 471 482 489 – – – – –
Percentage (%) of students at or above NMS 73% 100% 82% 82% 82% 63% 88% 75% 88% 63% 87% 60% 60% 87% 87% – – – – –
St Patrick’s School (Allora) Allora 13 12 7 –
Average score of the school 404 348 365 420 394 475 473 467 478 466 532 562 537 557 580 – – – – –
Percentage (%) of students at or above NMS 92% 100% 100% 100% 100% 100% 100% 100% 91% 100% 100% 100% 100% 100% 100% – – – – –
St Patrick’s School (St George) St George 35 25 14 –
Average score of the school 395 363 381 416 373 479 444 443 488 472 496 497 505 504 500 – – – – –
Percentage (%) of students at or above NMS 91% 82% 94% 91% 94% 96% 92% 88% 92% 100% 92% 92% 75% 75% 100% – – – – –
St Patrick’s School (Winton) Winton 5 5 7 –
Average score of the school ∧ ∧ ∧ ∧ ∧ ∧ ∧ ∧ ∧ ∧ 509 489 505 492 483 – – – – –
Percentage (%) of students at or above NMS ∧ ∧ ∧ ∧ ∧ ∧ ∧ ∧ ∧ ∧ 100% 100% 86% 71% 86% – – – – –
St Paul’s Catholic Primary School
(Gracemere)
Gracemere 44 37 18 –
Average score of the school 377 373 379 392 377 501 454 470 487 475 504 477 486 515 488 – – – – –
Percentage (%) of students at or above NMS 88% 95% 98% 98% 98% 97% 92% 95% 97% 97% 89% 89% 72% 83% 94% – – – – –
St Paul’s Lutheran Primary School
(Caboolture)
Caboolture 58 48 – –
Average score of the school 416 424 418 443 391 494 457 480 483 491 – – – – – – – – – –
Percentage (%) of students at or above NMS 93% 100% 98% 95% 100% 91% 87% 93% 89% 98% – – – – – – – – – –
St Paul’s School Bald Hills 59 77 98 169
Average score of the school 454 434 438 462 414 516 482 501 515 522 575 524 562 570 572 589 558 599 586 602
Percentage (%) of students at or above NMS 96% 97% 97% 98% 96% 96% 96% 97% 96% 99% 96% 96% 96% 97% 96% 95% 85% 96% 96% 99%
KEY∧ to maintain privacy of individual student information, where there are fewer than five students tested results are not provided∗ no students in the year level sat the test due to absence, exemption or withdrawal– no students in the year levelNMS National Minimum Standard (for further information see www.nap.edu.au)
Queensland Curriculum & Assessment Authority
Page 122 of 149
NAPLAN 2014 Outcomes — All Queensland schools

Year level enrolments Year 3 Year 5 Year 7 Year 9
School Locality Yr 3 Yr 5 Yr 7 Yr 9 READ WRIT SPEL GP NMCY READ WRIT SPEL GP NMCY READ WRIT SPEL GP NMCY READ WRIT SPEL GP NMCY
St Paul’s School (Woodridge) Woodridge 40 36 14 –
Average score of the school 335 324 355 342 316 428 427 466 443 421 453 430 436 447 470 – – – – –
Percentage (%) of students at or above NMS 75% 75% 75% 73% 69% 72% 69% 75% 69% 75% 50% 45% 55% 55% 90% – – – – –
St Peter Chanel Primary School (The Gap) The Gap 59 45 24 –
Average score of the school 465 411 438 459 428 524 470 501 525 486 565 524 545 568 582 – – – – –
Percentage (%) of students at or above NMS 98% 100% 100% 100% 100% 95% 91% 93% 93% 93% 100% 95% 96% 96% 100% – – – – –
St Peter Claver College Riverview – – – 192
Average score of the school – – – – – – – – – – – – – – – 571 529 571 557 570
Percentage (%) of students at or above NMS – – – – – – – – – – – – – – – 91% 72% 91% 88% 97%
St Peter’s Catholic Primary School
(Caboolture)
Caboolture 82 90 45 –
Average score of the school 405 412 392 420 391 508 502 490 509 496 577 537 535 572 560 – – – – –
Percentage (%) of students at or above NMS 92% 94% 92% 92% 94% 98% 97% 95% 93% 99% 100% 96% 91% 100% 100% – – – – –
St Peter’s Catholic Primary School
(Rockhampton)
Rockhampton 51 42 28 –
Average score of the school 403 372 390 393 386 506 454 481 504 495 545 520 519 532 551 – – – – –
Percentage (%) of students at or above NMS 90% 94% 98% 85% 98% 98% 93% 95% 93% 90% 96% 96% 88% 96% 96% – – – – –
St Peter’s Lutheran College Indooroopilly 75 108 110 253
Average score of the school 496 453 473 520 484 575 516 540 578 555 615 553 595 605 611 627 602 621 634 634
Percentage (%) of students at or above NMS 96% 97% 97% 97% 99% 100% 99% 100% 100% 100% 100% 98% 100% 98% 100% 98% 94% 98% 96% 100%
St Peter’s Primary School (Rochedale) Rochedale 66 49 30 –
Average score of the school 419 414 401 450 419 495 460 500 490 491 553 483 554 546 560 – – – – –
Percentage (%) of students at or above NMS 97% 98% 95% 100% 98% 92% 90% 94% 94% 96% 100% 89% 96% 89% 100% – – – – –
St Peter’s School (Halifax) Halifax 4 5 2 –
Average score of the school ∧ ∧ ∧ ∧ ∧ 443 423 467 418 415 ∧ ∧ ∧ ∧ ∧ – – – – –
Percentage (%) of students at or above NMS ∧ ∧ ∧ ∧ ∧ 80% 60% 100% 60% 80% ∧ ∧ ∧ ∧ ∧ – – – – –
St Peters Lutheran College - Springfield Springfield Central 44 24 15 28
Average score of the school 426 388 418 444 412 517 460 500 511 495 556 495 524 539 558 588 562 597 587 599
Percentage (%) of students at or above NMS 95% 95% 100% 100% 100% 100% 95% 100% 95% 100% 93% 86% 93% 93% 100% 100% 93% 93% 100% 100%
St Pius X School (Salisbury) Salisbury 19 19 16 –
Average score of the school 409 376 396 393 371 501 483 504 511 491 559 470 536 551 533 – – – – –
Percentage (%) of students at or above NMS 95% 95% 100% 95% 100% 94% 94% 100% 100% 100% 100% 88% 94% 88% 88% – – – – –
St Pius’ Primary School (Banyo) Banyo 52 23 9 –
Average score of the school 449 421 414 428 427 520 477 489 499 494 557 524 567 525 586 – – – – –
Percentage (%) of students at or above NMS 98% 100% 98% 98% 98% 100% 100% 100% 90% 100% 100% 89% 100% 89% 100% – – – – –
KEY∧ to maintain privacy of individual student information, where there are fewer than five students tested results are not provided∗ no students in the year level sat the test due to absence, exemption or withdrawal– no students in the year levelNMS National Minimum Standard (for further information see www.nap.edu.au)
Queensland Curriculum & Assessment Authority
Page 123 of 149
NAPLAN 2014 Outcomes — All Queensland schools

Year level enrolments Year 3 Year 5 Year 7 Year 9
School Locality Yr 3 Yr 5 Yr 7 Yr 9 READ WRIT SPEL GP NMCY READ WRIT SPEL GP NMCY READ WRIT SPEL GP NMCY READ WRIT SPEL GP NMCY
St Rita’s College Clayfield – – – 174
Average score of the school – – – – – – – – – – – – – – – 622 609 623 632 615
Percentage (%) of students at or above NMS – – – – – – – – – – – – – – – 99% 98% 100% 100% 100%
St Rita’s Primary School (Victoria Point) Victoria Point 72 78 47 –
Average score of the school 382 343 367 380 382 498 467 470 499 476 548 501 516 540 532 – – – – –
Percentage (%) of students at or above NMS 91% 90% 89% 90% 97% 95% 94% 87% 99% 96% 98% 87% 91% 100% 98% – – – – –
St Rita’s School (Babinda) Babinda 10 1 1 –
Average score of the school 400 375 350 369 386 ∧ ∧ ∧ ∧ ∧ ∧ ∧ ∧ ∧ ∧ – – – – –
Percentage (%) of students at or above NMS 80% 100% 80% 70% 100% ∧ ∧ ∧ ∧ ∧ ∧ ∧ ∧ ∧ ∧ – – – – –
St Rita’s School (South Johnstone) South Johnstone 15 11 5 –
Average score of the school 438 430 402 437 398 515 482 474 498 485 ∧ ∧ ∧ ∧ ∧ – – – – –
Percentage (%) of students at or above NMS 93% 93% 93% 93% 86% 100% 100% 91% 100% 100% ∧ ∧ ∧ ∧ ∧ – – – – –
St Saviour’s College Toowoomba – – – 35
Average score of the school – – – – – – – – – – – – – – – 571 543 583 578 555
Percentage (%) of students at or above NMS – – – – – – – – – – – – – – – 90% 87% 93% 93% 97%
St Saviour’s Primary School (Toowoomba) Toowoomba 58 46 42 –
Average score of the school 431 399 388 420 393 531 499 506 533 500 546 530 547 551 535 – – – – –
Percentage (%) of students at or above NMS 98% 100% 96% 95% 96% 91% 96% 98% 100% 98% 100% 95% 95% 98% 100% – – – – –
St Sebastian’s Primary School (Yeronga) Yeronga 46 24 11 –
Average score of the school 437 410 405 426 406 505 459 496 511 490 553 539 560 582 544 – – – – –
Percentage (%) of students at or above NMS 100% 100% 96% 100% 98% 92% 83% 96% 92% 92% 100% 100% 100% 100% 100% – – – – –
St Stephen’s Catholic College Mareeba – – – 103
Average score of the school – – – – – – – – – – – – – – – 595 561 593 591 597
Percentage (%) of students at or above NMS – – – – – – – – – – – – – – – 96% 86% 95% 93% 99%
St Stephen’s School Algester 73 59 30 –
Average score of the school 421 413 421 440 389 495 477 498 502 467 549 520 537 562 545 – – – – –
Percentage (%) of students at or above NMS 99% 99% 97% 100% 94% 96% 96% 96% 95% 93% 97% 97% 97% 100% 97% – – – – –
St Stephen’s School (Pittsworth) Pittsworth 11 18 9 –
Average score of the school 395 349 373 382 368 492 456 480 510 471 571 536 550 589 566 – – – – –
Percentage (%) of students at or above NMS 91% 100% 91% 100% 100% 78% 83% 83% 89% 89% 100% 100% 100% 100% 100% – – – – –
St Stephens Lutheran College Gladstone 19 22 14 5
Average score of the school 393 410 391 416 436 487 402 473 479 477 536 521 533 527 528 624 559 603 604 627
Percentage (%) of students at or above NMS 95% 100% 95% 100% 100% 84% 74% 89% 95% 95% 100% 100% 86% 86% 93% 100% 100% 100% 100% 100%
St Teresa’s Catholic College Noosaville – – – 170
Average score of the school – – – – – – – – – – – – – – – 580 565 576 573 578
Percentage (%) of students at or above NMS – – – – – – – – – – – – – – – 91% 86% 91% 93% 97%
KEY∧ to maintain privacy of individual student information, where there are fewer than five students tested results are not provided∗ no students in the year level sat the test due to absence, exemption or withdrawal– no students in the year levelNMS National Minimum Standard (for further information see www.nap.edu.au)
Queensland Curriculum & Assessment Authority
Page 124 of 149
NAPLAN 2014 Outcomes — All Queensland schools

Year level enrolments Year 3 Year 5 Year 7 Year 9
School Locality Yr 3 Yr 5 Yr 7 Yr 9 READ WRIT SPEL GP NMCY READ WRIT SPEL GP NMCY READ WRIT SPEL GP NMCY READ WRIT SPEL GP NMCY
St Teresa’s College Abergowrie – – – 28
Average score of the school – – – – – – – – – – – – – – – 464 385 453 447 489
Percentage (%) of students at or above NMS – – – – – – – – – – – – – – – 38% 4% 46% 31% 62%
St Teresa’s School (Ravenshoe) Ravenshoe 17 19 11 –
Average score of the school 346 376 356 370 342 468 397 444 448 464 572 486 554 567 556 – – – – –
Percentage (%) of students at or above NMS 88% 100% 88% 94% 94% 79% 74% 89% 79% 89% 100% 90% 100% 100% 100% – – – – –
St Therese’s Catholic Primary School
(Monto)
Monto 10 8 15 –
Average score of the school 344 397 360 388 357 394 394 440 412 477 534 494 506 528 530 – – – – –
Percentage (%) of students at or above NMS 100% 100% 89% 100% 89% 57% 57% 71% 57% 86% 100% 87% 80% 93% 100% – – – – –
St Therese’s School (Edmonton) Bentley Park 95 92 52 –
Average score of the school 435 404 411 431 408 488 445 472 495 493 536 522 542 537 562 – – – – –
Percentage (%) of students at or above NMS 95% 97% 99% 99% 97% 92% 89% 94% 93% 99% 98% 94% 98% 92% 100% – – – – –
St Thomas More College Sunnybank – – – 156
Average score of the school – – – – – – – – – – – – – – – 592 565 580 579 593
Percentage (%) of students at or above NMS – – – – – – – – – – – – – – – 99% 87% 92% 95% 99%
St Thomas More Primary School (Sunshine
Beach)
Sunshine Beach 102 112 60 –
Average score of the school 440 406 415 443 425 507 475 496 502 483 554 525 539 548 556 – – – – –
Percentage (%) of students at or above NMS 98% 97% 98% 99% 100% 97% 100% 99% 97% 99% 98% 98% 95% 100% 100% – – – – –
St Thomas More’s Primary School
(Toowoomba)
Toowoomba 55 52 33 –
Average score of the school 413 399 401 433 395 504 473 492 506 483 558 513 535 564 549 – – – – –
Percentage (%) of students at or above NMS 91% 100% 98% 98% 98% 94% 94% 96% 98% 98% 94% 91% 91% 91% 94% – – – – –
St Thomas’ School (Mareeba) Mareeba 67 54 41 –
Average score of the school 396 379 373 409 393 504 461 487 492 491 546 529 522 539 541 – – – – –
Percentage (%) of students at or above NMS 92% 94% 92% 97% 100% 96% 91% 94% 92% 96% 100% 90% 93% 98% 100% – – – – –
St Thomas’ School (Camp Hill) Camp Hill 53 38 40 –
Average score of the school 458 429 445 467 411 513 495 516 528 509 582 559 547 587 565 – – – – –
Percentage (%) of students at or above NMS 100% 100% 100% 100% 100% 95% 97% 100% 100% 97% 100% 98% 100% 100% 100% – – – – –
St Ursula’s College Yeppoon – – – 95
Average score of the school – – – – – – – – – – – – – – – 581 565 582 582 579
Percentage (%) of students at or above NMS – – – – – – – – – – – – – – – 95% 81% 97% 91% 98%
St Ursula’s College Toowoomba – – – 160
Average score of the school – – – – – – – – – – – – – – – 597 598 593 596 591
Percentage (%) of students at or above NMS – – – – – – – – – – – – – – – 97% 98% 98% 96% 99%
KEY∧ to maintain privacy of individual student information, where there are fewer than five students tested results are not provided∗ no students in the year level sat the test due to absence, exemption or withdrawal– no students in the year levelNMS National Minimum Standard (for further information see www.nap.edu.au)
Queensland Curriculum & Assessment Authority
Page 125 of 149
NAPLAN 2014 Outcomes — All Queensland schools

Year level enrolments Year 3 Year 5 Year 7 Year 9
School Locality Yr 3 Yr 5 Yr 7 Yr 9 READ WRIT SPEL GP NMCY READ WRIT SPEL GP NMCY READ WRIT SPEL GP NMCY READ WRIT SPEL GP NMCY
St Vincent’s Primary School (Surfers
Paradise)
Clear Island Waters 113 96 64 –
Average score of the school 426 408 420 446 408 514 483 503 518 504 552 516 553 549 553 – – – – –
Percentage (%) of students at or above NMS 97% 97% 99% 97% 97% 99% 95% 100% 100% 100% 100% 97% 98% 97% 100% – – – – –
St William’s Primary School (Grovely) Grovely 96 62 31 –
Average score of the school 434 432 421 440 420 512 486 491 513 497 528 511 512 530 520 – – – – –
Percentage (%) of students at or above NMS 98% 97% 98% 96% 99% 93% 93% 97% 95% 95% 96% 85% 82% 96% 96% – – – – –
Stafford Heights State School Stafford Heights 24 17 16 –
Average score of the school 418 393 378 385 376 457 440 484 474 469 519 475 504 519 515 – – – – –
Percentage (%) of students at or above NMS 100% 96% 96% 91% 100% 82% 82% 88% 94% 88% 94% 88% 81% 100% 100% – – – – –
Stafford State School Stafford 33 35 22 –
Average score of the school 373 335 370 369 360 474 422 464 468 479 494 460 507 493 510 – – – – –
Percentage (%) of students at or above NMS 84% 84% 88% 94% 90% 88% 71% 79% 85% 85% 77% 64% 77% 73% 95% – – – – –
Staines Memorial College Redbank Plains 36 22 22 38
Average score of the school 400 363 386 390 360 475 406 475 478 448 543 515 520 545 519 552 525 551 530 536
Percentage (%) of students at or above NMS 85% 94% 94% 94% 91% 84% 75% 100% 85% 85% 100% 100% 95% 100% 100% 91% 74% 83% 80% 97%
Stanthorpe State High School Stanthorpe – – – 105
Average score of the school – – – – – – – – – – – – – – – 554 513 554 544 552
Percentage (%) of students at or above NMS – – – – – – – – – – – – – – – 89% 68% 93% 81% 97%
Stanthorpe State School Stanthorpe 45 43 43 –
Average score of the school 401 369 381 391 382 490 439 482 487 467 540 496 515 535 533 – – – – –
Percentage (%) of students at or above NMS 90% 90% 88% 93% 93% 90% 83% 85% 85% 90% 89% 85% 87% 87% 92% – – – – –
Stanwell State School Stanwell 2 9 4 –
Average score of the school ∧ ∧ ∧ ∧ ∧ 491 446 523 532 511 ∧ ∧ ∧ ∧ ∧ – – – – –
Percentage (%) of students at or above NMS ∧ ∧ ∧ ∧ ∧ 78% 67% 89% 89% 78% ∧ ∧ ∧ ∧ ∧ – – – – –
Star of the Sea Catholic Primary School
(Gladstone)
Gladstone 56 48 46 –
Average score of the school 413 384 397 416 392 505 461 495 510 478 568 516 556 562 552 – – – – –
Percentage (%) of students at or above NMS 92% 96% 94% 96% 98% 98% 89% 94% 96% 96% 100% 93% 98% 100% 100% – – – – –
Star of the Sea Catholic School (Torquay) Torquay 58 56 40 –
Average score of the school 424 415 424 443 390 489 449 476 481 463 559 515 544 561 549 – – – – –
Percentage (%) of students at or above NMS 98% 98% 96% 100% 96% 96% 92% 96% 94% 91% 100% 100% 100% 100% 97% – – – – –
Star of the Sea Primary School (Cleveland) Cleveland 50 43 6 –
Average score of the school 423 374 374 402 390 507 485 505 500 467 519 495 482 505 504 – – – – –
Percentage (%) of students at or above NMS 94% 98% 96% 94% 98% 100% 93% 95% 98% 98% 67% 83% 67% 83% 100% – – – – –
KEY∧ to maintain privacy of individual student information, where there are fewer than five students tested results are not provided∗ no students in the year level sat the test due to absence, exemption or withdrawal– no students in the year levelNMS National Minimum Standard (for further information see www.nap.edu.au)
Queensland Curriculum & Assessment Authority
Page 126 of 149
NAPLAN 2014 Outcomes — All Queensland schools

Year level enrolments Year 3 Year 5 Year 7 Year 9
School Locality Yr 3 Yr 5 Yr 7 Yr 9 READ WRIT SPEL GP NMCY READ WRIT SPEL GP NMCY READ WRIT SPEL GP NMCY READ WRIT SPEL GP NMCY
Stella Maris School (Maroochydore) Maroochydore 115 113 55 –
Average score of the school 413 399 407 412 386 511 475 499 513 492 552 524 533 553 553 – – – – –
Percentage (%) of students at or above NMS 95% 96% 99% 98% 97% 97% 94% 97% 96% 96% 100% 94% 96% 94% 98% – – – – –
Stephen Island State School via Thursday Island 3 – 1 –
Average score of the school ∧ ∧ ∧ ∧ ∧ – – – – – ∧ ∧ ∧ ∧ ∧ – – – – –
Percentage (%) of students at or above NMS ∧ ∧ ∧ ∧ ∧ – – – – – ∧ ∧ ∧ ∧ ∧ – – – – –
Stonehenge State School Stonehenge 1 1 2 –
Average score of the school ∧ ∧ ∧ ∧ ∧ ∧ ∧ ∧ ∧ ∧ ∧ ∧ ∧ ∧ ∧ – – – – –
Percentage (%) of students at or above NMS ∧ ∧ ∧ ∧ ∧ ∧ ∧ ∧ ∧ ∧ ∧ ∧ ∧ ∧ ∧ – – – – –
Strathpine State School Strathpine 53 59 54 –
Average score of the school 371 348 368 383 344 461 426 470 479 452 522 495 526 520 531 – – – – –
Percentage (%) of students at or above NMS 92% 86% 92% 94% 94% 89% 71% 87% 89% 85% 98% 87% 87% 89% 98% – – – – –
Strathpine West State School Strathpine 87 74 28 –
Average score of the school 371 348 365 383 342 475 414 461 471 451 522 484 498 513 533 – – – – –
Percentage (%) of students at or above NMS 89% 90% 84% 90% 88% 92% 74% 84% 92% 88% 96% 69% 77% 81% 96% – – – – –
Stretton State College Stretton 147 165 103 171
Average score of the school 410 415 419 430 393 497 458 503 506 488 532 492 559 538 550 560 546 577 559 572
Percentage (%) of students at or above NMS 96% 97% 98% 98% 98% 94% 84% 94% 95% 94% 94% 83% 97% 96% 100% 89% 79% 93% 84% 96%
Sts Peter and Paul’s School (Bulimba) Bulimba 91 45 40 –
Average score of the school 467 440 445 476 442 533 495 525 541 537 586 560 589 617 610 – – – – –
Percentage (%) of students at or above NMS 99% 100% 100% 100% 100% 100% 98% 100% 100% 100% 100% 100% 100% 100% 100% – – – – –
Stuartholme School Toowong – – – 111
Average score of the school – – – – – – – – – – – – – – – 616 594 599 605 600
Percentage (%) of students at or above NMS – – – – – – – – – – – – – – – 96% 97% 97% 98% 100%
Sunbury State School Maryborough 38 36 31 –
Average score of the school 374 354 371 378 347 464 448 486 483 452 512 498 521 519 493 – – – – –
Percentage (%) of students at or above NMS 86% 86% 89% 89% 80% 86% 86% 91% 86% 89% 90% 82% 83% 90% 83% – – – – –
Suncoast Christian College Woombye 54 65 55 78
Average score of the school 433 431 419 441 424 518 483 487 509 496 546 495 538 545 560 599 572 582 594 590
Percentage (%) of students at or above NMS 100% 100% 100% 100% 98% 100% 98% 97% 98% 100% 100% 89% 96% 98% 100% 97% 92% 95% 97% 99%
Sunnybank Hills State School Sunnybank Hills 168 148 76 –
Average score of the school 463 449 475 520 458 544 520 550 575 554 584 584 587 592 612 – – – – –
Percentage (%) of students at or above NMS 99% 98% 99% 99% 99% 95% 96% 98% 97% 97% 100% 99% 97% 100% 99% – – – – –
Sunnybank Special School Sunnybank 3 2 1 2
Average score of the school ∗ ∗ ∗ ∗ ∗ ∗ ∗ ∗ ∗ ∗ ∗ ∗ ∗ ∗ ∗ ∗ ∗ ∗ ∗ ∗Percentage (%) of students at or above NMS ∗ ∗ ∗ ∗ ∗ ∗ ∗ ∗ ∗ ∗ ∗ ∗ ∗ ∗ ∗ ∗ ∗ ∗ ∗ ∗
KEY∧ to maintain privacy of individual student information, where there are fewer than five students tested results are not provided∗ no students in the year level sat the test due to absence, exemption or withdrawal– no students in the year levelNMS National Minimum Standard (for further information see www.nap.edu.au)
Queensland Curriculum & Assessment Authority
Page 127 of 149
NAPLAN 2014 Outcomes — All Queensland schools

Year level enrolments Year 3 Year 5 Year 7 Year 9
School Locality Yr 3 Yr 5 Yr 7 Yr 9 READ WRIT SPEL GP NMCY READ WRIT SPEL GP NMCY READ WRIT SPEL GP NMCY READ WRIT SPEL GP NMCY
Sunnybank State High School Sunnybank – – – 102
Average score of the school – – – – – – – – – – – – – – – 525 493 530 528 543
Percentage (%) of students at or above NMS – – – – – – – – – – – – – – – 71% 55% 71% 69% 83%
Sunnybank State School Sunnybank 44 38 24 –
Average score of the school 386 371 384 415 386 506 439 498 509 477 511 464 527 496 524 – – – – –
Percentage (%) of students at or above NMS 91% 93% 86% 93% 93% 72% 60% 71% 77% 81% 96% 75% 96% 96% 100% – – – – –
Sunset State School Sunset Mount Isa 47 39 21 –
Average score of the school 292 302 279 300 312 391 322 398 375 387 462 411 463 428 460 – – – – –
Percentage (%) of students at or above NMS 57% 72% 49% 70% 78% 56% 36% 58% 45% 48% 76% 53% 71% 53% 88% – – – – –
Sunshine Beach State High School Sunshine Beach – – – 217
Average score of the school – – – – – – – – – – – – – – – 574 547 566 565 581
Percentage (%) of students at or above NMS – – – – – – – – – – – – – – – 90% 83% 90% 88% 95%
Sunshine Beach State School Sunshine Beach 112 108 76 –
Average score of the school 434 413 398 452 422 534 500 509 528 508 558 525 538 541 559 – – – – –
Percentage (%) of students at or above NMS 97% 98% 98% 98% 98% 97% 98% 99% 100% 98% 100% 94% 96% 91% 99% – – – – –
Sunshine Coast Grammar School Forest Glen 78 85 87 92
Average score of the school 445 423 433 449 419 545 500 519 540 518 603 559 574 594 596 592 585 589 585 612
Percentage (%) of students at or above NMS 96% 100% 97% 99% 100% 98% 100% 98% 100% 99% 99% 100% 99% 98% 100% 96% 92% 96% 95% 100%
Surat State School Surat 10 4 2 4
Average score of the school 429 410 392 443 392 ∧ ∧ ∧ ∧ ∧ ∧ ∧ ∧ ∧ ∧ ∧ ∧ ∧ ∧ ∧Percentage (%) of students at or above NMS 100% 100% 100% 100% 100% ∧ ∧ ∧ ∧ ∧ ∧ ∧ ∧ ∧ ∧ ∧ ∧ ∧ ∧ ∧
Surfers Paradise State School Isle Of Capri 73 106 44 –
Average score of the school 429 403 417 443 412 510 477 504 505 483 523 487 532 521 549 – – – – –
Percentage (%) of students at or above NMS 88% 92% 90% 92% 89% 94% 91% 97% 93% 92% 90% 76% 80% 85% 90% – – – – –
Swayneville State School Sarina 18 13 8 –
Average score of the school 353 346 374 353 330 499 425 455 491 492 505 486 512 494 496 – – – – –
Percentage (%) of students at or above NMS 72% 83% 89% 72% 67% 85% 69% 77% 85% 85% 75% 88% 88% 75% 88% – – – – –
Taabinga State School Kingaroy 57 51 37 –
Average score of the school 390 351 406 384 369 497 417 470 488 477 528 483 513 541 536 – – – – –
Percentage (%) of students at or above NMS 90% 89% 92% 85% 90% 90% 78% 88% 86% 88% 94% 89% 92% 95% 97% – – – – –
Tagai State College Thursday Island – – – 66
Average score of the school – – – – – – – – – – – – – – – 498 430 532 488 504
Percentage (%) of students at or above NMS – – – – – – – – – – – – – – – 54% 24% 71% 48% 73%
KEY∧ to maintain privacy of individual student information, where there are fewer than five students tested results are not provided∗ no students in the year level sat the test due to absence, exemption or withdrawal– no students in the year levelNMS National Minimum Standard (for further information see www.nap.edu.au)
Queensland Curriculum & Assessment Authority
Page 128 of 149
NAPLAN 2014 Outcomes — All Queensland schools

Year level enrolments Year 3 Year 5 Year 7 Year 9
School Locality Yr 3 Yr 5 Yr 7 Yr 9 READ WRIT SPEL GP NMCY READ WRIT SPEL GP NMCY READ WRIT SPEL GP NMCY READ WRIT SPEL GP NMCY
Tagai State College - Darnley Island Campus via Thursday Island 6 5 2 –
Average score of the school 268 277 320 293 268 ∧ ∧ ∧ ∧ 364 ∧ ∧ ∧ ∧ ∧ – – – – –
Percentage (%) of students at or above NMS 50% 60% 67% 83% 50% ∧ ∧ ∧ ∧ 40% ∧ ∧ ∧ ∧ ∧ – – – – –
Tagai State College - St Pauls Campus via Thursday Island 12 4 2 –
Average score of the school 309 317 342 244 292 ∧ ∧ ∧ ∧ ∧ ∧ ∧ ∧ ∧ ∧ – – – – –
Percentage (%) of students at or above NMS 58% 75% 67% 33% 75% ∧ ∧ ∧ ∧ ∧ ∧ ∧ ∧ ∧ ∧ – – – – –
Tagai State College - Thursday Island
Primary Campus
Thursday Island 38 31 31 –
Average score of the school 341 354 380 340 346 380 367 451 404 387 458 409 484 432 448 – – – – –
Percentage (%) of students at or above NMS 86% 91% 91% 86% 89% 50% 42% 88% 69% 54% 73% 54% 73% 54% 72% – – – – –
Taigum State School Taigum 41 31 46 –
Average score of the school 370 379 408 390 361 459 437 480 483 465 508 495 546 520 514 – – – – –
Percentage (%) of students at or above NMS 83% 97% 91% 91% 89% 81% 68% 84% 76% 81% 93% 82% 92% 90% 98% – – – – –
Talara Primary College Currimundi 152 126 82 –
Average score of the school 424 395 410 439 406 499 451 475 500 487 539 513 537 545 542 – – – – –
Percentage (%) of students at or above NMS 95% 95% 95% 95% 96% 93% 87% 91% 95% 97% 99% 90% 93% 95% 100% – – – – –
Tallebudgera State School Tallebudgera 105 103 61 –
Average score of the school 433 414 417 458 440 503 464 483 507 497 576 540 553 579 595 – – – – –
Percentage (%) of students at or above NMS 99% 99% 99% 100% 99% 89% 91% 94% 94% 97% 98% 97% 98% 98% 98% – – – – –
Talwood State School Talwood 4 9 4 –
Average score of the school ∧ ∧ ∧ ∧ ∧ 502 456 454 479 480 ∧ ∧ ∧ ∧ ∧ – – – – –
Percentage (%) of students at or above NMS ∧ ∧ ∧ ∧ ∧ 88% 100% 75% 88% 100% ∧ ∧ ∧ ∧ ∧ – – – – –
Tambo State School Tambo 7 3 6 2
Average score of the school 386 373 378 398 345 ∧ ∧ ∧ ∧ ∧ 498 489 514 543 555 ∧ ∧ ∧ ∧ ∧Percentage (%) of students at or above NMS 100% 86% 100% 100% 100% ∧ ∧ ∧ ∧ ∧ 83% 100% 100% 100% 100% ∧ ∧ ∧ ∧ ∧
Tamborine Mountain College North Tamborine – – – 48
Average score of the school – – – – – – – – – – – – – – – 602 555 590 595 582
Percentage (%) of students at or above NMS – – – – – – – – – – – – – – – 97% 82% 94% 97% 100%
Tamborine Mountain State High School North Tamborine – – – 177
Average score of the school – – – – – – – – – – – – – – – 589 575 582 585 597
Percentage (%) of students at or above NMS – – – – – – – – – – – – – – – 98% 91% 94% 96% 99%
Tamborine Mountain State School North Tamborine 73 65 61 –
Average score of the school 427 399 409 446 406 533 479 497 515 491 565 505 542 548 536 – – – – –
Percentage (%) of students at or above NMS 98% 100% 98% 98% 100% 100% 98% 96% 98% 96% 98% 90% 92% 96% 96% – – – – –
KEY∧ to maintain privacy of individual student information, where there are fewer than five students tested results are not provided∗ no students in the year level sat the test due to absence, exemption or withdrawal– no students in the year levelNMS National Minimum Standard (for further information see www.nap.edu.au)
Queensland Curriculum & Assessment Authority
Page 129 of 149
NAPLAN 2014 Outcomes — All Queensland schools
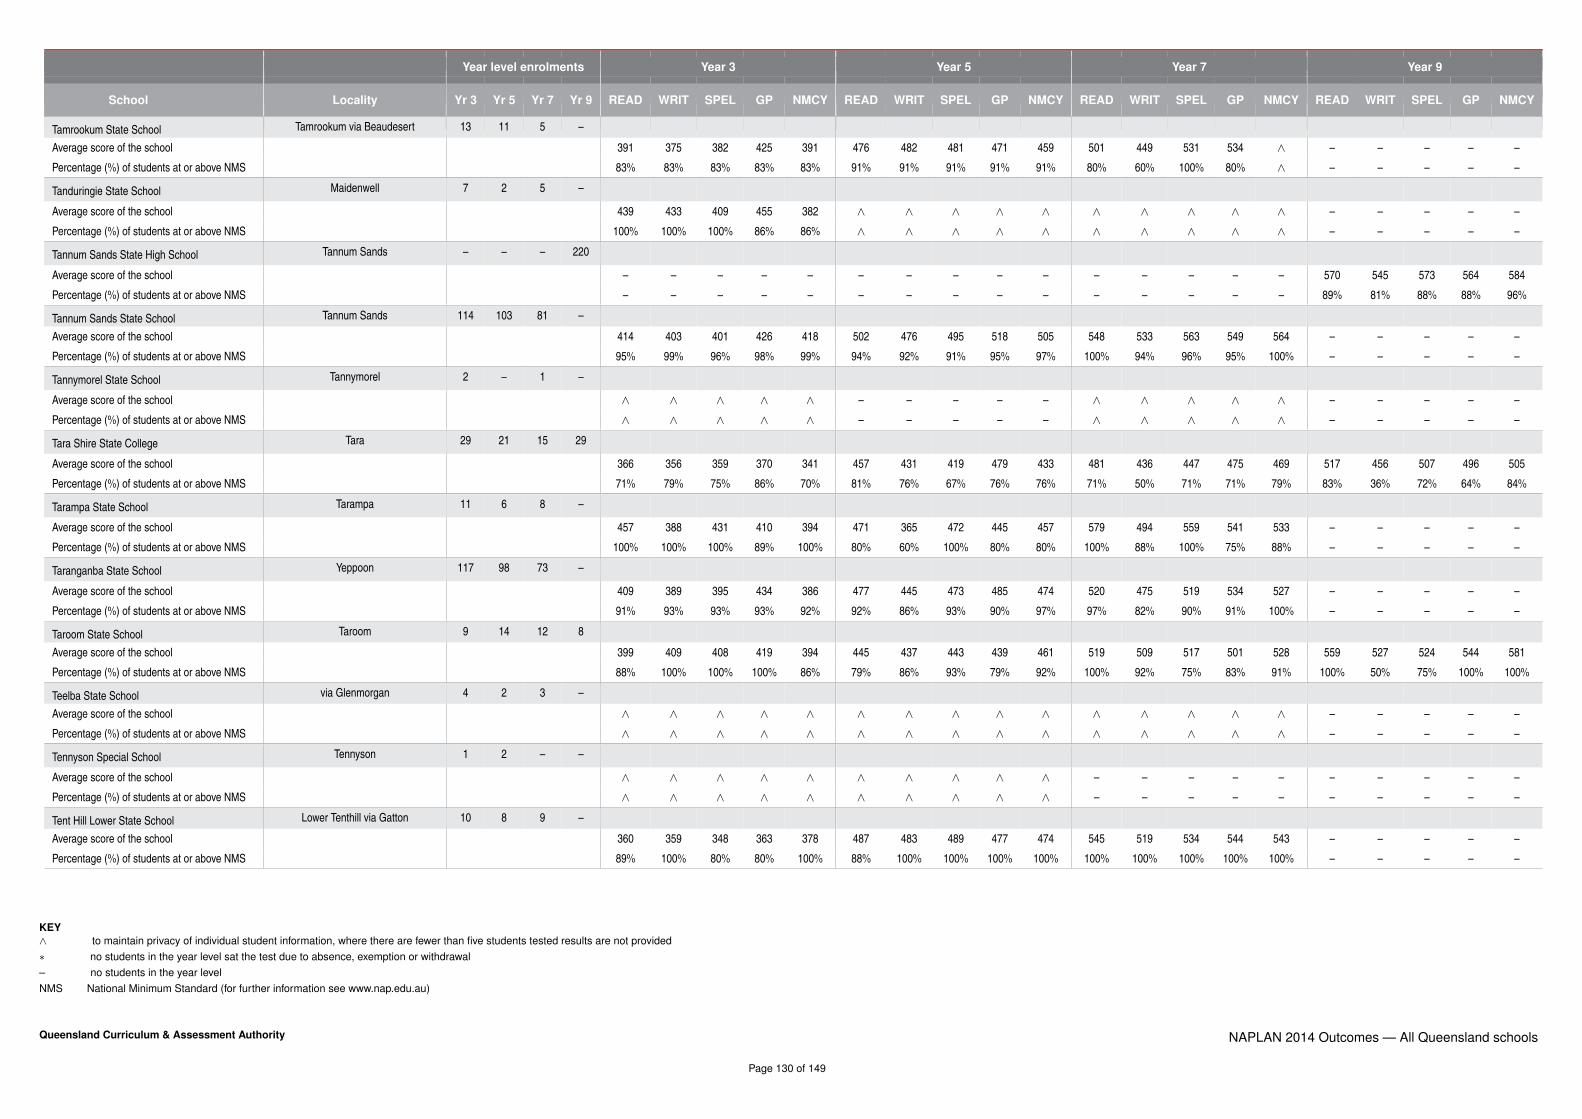
Year level enrolments Year 3 Year 5 Year 7 Year 9
School Locality Yr 3 Yr 5 Yr 7 Yr 9 READ WRIT SPEL GP NMCY READ WRIT SPEL GP NMCY READ WRIT SPEL GP NMCY READ WRIT SPEL GP NMCY
Tamrookum State School Tamrookum via Beaudesert 13 11 5 –
Average score of the school 391 375 382 425 391 476 482 481 471 459 501 449 531 534 ∧ – – – – –
Percentage (%) of students at or above NMS 83% 83% 83% 83% 83% 91% 91% 91% 91% 91% 80% 60% 100% 80% ∧ – – – – –
Tanduringie State School Maidenwell 7 2 5 –
Average score of the school 439 433 409 455 382 ∧ ∧ ∧ ∧ ∧ ∧ ∧ ∧ ∧ ∧ – – – – –
Percentage (%) of students at or above NMS 100% 100% 100% 86% 86% ∧ ∧ ∧ ∧ ∧ ∧ ∧ ∧ ∧ ∧ – – – – –
Tannum Sands State High School Tannum Sands – – – 220
Average score of the school – – – – – – – – – – – – – – – 570 545 573 564 584
Percentage (%) of students at or above NMS – – – – – – – – – – – – – – – 89% 81% 88% 88% 96%
Tannum Sands State School Tannum Sands 114 103 81 –
Average score of the school 414 403 401 426 418 502 476 495 518 505 548 533 563 549 564 – – – – –
Percentage (%) of students at or above NMS 95% 99% 96% 98% 99% 94% 92% 91% 95% 97% 100% 94% 96% 95% 100% – – – – –
Tannymorel State School Tannymorel 2 – 1 –
Average score of the school ∧ ∧ ∧ ∧ ∧ – – – – – ∧ ∧ ∧ ∧ ∧ – – – – –
Percentage (%) of students at or above NMS ∧ ∧ ∧ ∧ ∧ – – – – – ∧ ∧ ∧ ∧ ∧ – – – – –
Tara Shire State College Tara 29 21 15 29
Average score of the school 366 356 359 370 341 457 431 419 479 433 481 436 447 475 469 517 456 507 496 505
Percentage (%) of students at or above NMS 71% 79% 75% 86% 70% 81% 76% 67% 76% 76% 71% 50% 71% 71% 79% 83% 36% 72% 64% 84%
Tarampa State School Tarampa 11 6 8 –
Average score of the school 457 388 431 410 394 471 365 472 445 457 579 494 559 541 533 – – – – –
Percentage (%) of students at or above NMS 100% 100% 100% 89% 100% 80% 60% 100% 80% 80% 100% 88% 100% 75% 88% – – – – –
Taranganba State School Yeppoon 117 98 73 –
Average score of the school 409 389 395 434 386 477 445 473 485 474 520 475 519 534 527 – – – – –
Percentage (%) of students at or above NMS 91% 93% 93% 93% 92% 92% 86% 93% 90% 97% 97% 82% 90% 91% 100% – – – – –
Taroom State School Taroom 9 14 12 8
Average score of the school 399 409 408 419 394 445 437 443 439 461 519 509 517 501 528 559 527 524 544 581
Percentage (%) of students at or above NMS 88% 100% 100% 100% 86% 79% 86% 93% 79% 92% 100% 92% 75% 83% 91% 100% 50% 75% 100% 100%
Teelba State School via Glenmorgan 4 2 3 –
Average score of the school ∧ ∧ ∧ ∧ ∧ ∧ ∧ ∧ ∧ ∧ ∧ ∧ ∧ ∧ ∧ – – – – –
Percentage (%) of students at or above NMS ∧ ∧ ∧ ∧ ∧ ∧ ∧ ∧ ∧ ∧ ∧ ∧ ∧ ∧ ∧ – – – – –
Tennyson Special School Tennyson 1 2 – –
Average score of the school ∧ ∧ ∧ ∧ ∧ ∧ ∧ ∧ ∧ ∧ – – – – – – – – – –
Percentage (%) of students at or above NMS ∧ ∧ ∧ ∧ ∧ ∧ ∧ ∧ ∧ ∧ – – – – – – – – – –
Tent Hill Lower State School Lower Tenthill via Gatton 10 8 9 –
Average score of the school 360 359 348 363 378 487 483 489 477 474 545 519 534 544 543 – – – – –
Percentage (%) of students at or above NMS 89% 100% 80% 80% 100% 88% 100% 100% 100% 100% 100% 100% 100% 100% 100% – – – – –
KEY∧ to maintain privacy of individual student information, where there are fewer than five students tested results are not provided∗ no students in the year level sat the test due to absence, exemption or withdrawal– no students in the year levelNMS National Minimum Standard (for further information see www.nap.edu.au)
Queensland Curriculum & Assessment Authority
Page 130 of 149
NAPLAN 2014 Outcomes — All Queensland schools

Year level enrolments Year 3 Year 5 Year 7 Year 9
School Locality Yr 3 Yr 5 Yr 7 Yr 9 READ WRIT SPEL GP NMCY READ WRIT SPEL GP NMCY READ WRIT SPEL GP NMCY READ WRIT SPEL GP NMCY
Tewantin State School Tewantin 95 97 57 –
Average score of the school 396 376 381 411 394 520 458 494 523 517 553 518 517 542 546 – – – – –
Percentage (%) of students at or above NMS 89% 95% 95% 99% 95% 99% 95% 100% 99% 100% 98% 95% 88% 95% 96% – – – – –
Texas P-10 State School Texas 20 18 16 12
Average score of the school 419 416 402 413 397 453 445 467 462 436 530 433 529 516 521 584 552 572 571 549
Percentage (%) of students at or above NMS 90% 100% 95% 90% 95% 72% 83% 83% 83% 83% 100% 73% 87% 80% 93% 92% 83% 100% 92% 92%
Thabeban State School via Bundaberg 24 25 24 –
Average score of the school 354 311 345 361 337 455 398 430 464 488 484 425 475 488 505 – – – – –
Percentage (%) of students at or above NMS 71% 67% 81% 76% 82% 91% 70% 65% 74% 95% 77% 52% 70% 74% 86% – – – – –
Thallon State School Thallon 10 2 1 –
Average score of the school 410 418 381 410 396 ∧ ∧ ∧ ∧ ∧ ∗ ∗ ∗ ∗ ∗ – – – – –
Percentage (%) of students at or above NMS 100% 100% 100% 100% 100% ∧ ∧ ∧ ∧ ∧ ∗ ∗ ∗ ∗ ∗ – – – – –
Thangool State School Thangool 18 13 11 –
Average score of the school 433 405 409 419 404 519 475 524 509 478 555 506 535 577 547 – – – – –
Percentage (%) of students at or above NMS 100% 100% 100% 100% 100% 100% 92% 100% 100% 100% 100% 100% 90% 100% 100% – – – – –
Thargomindah State School Thargomindah 3 3 3 –
Average score of the school ∧ ∧ ∧ ∧ ∧ ∧ ∧ ∧ ∧ ∧ ∧ ∧ ∧ ∧ ∧ – – – – –
Percentage (%) of students at or above NMS ∧ ∧ ∧ ∧ ∧ ∧ ∧ ∧ ∧ ∧ ∧ ∧ ∧ ∧ ∧ – – – – –
The Cathedral College Rockhampton – – – 197
Average score of the school – – – – – – – – – – – – – – – 595 577 589 587 592
Percentage (%) of students at or above NMS – – – – – – – – – – – – – – – 98% 95% 95% 95% 99%
The Cathedral School Mundingburra 46 56 44 125
Average score of the school 471 429 422 467 457 520 478 491 516 514 556 508 542 565 557 592 560 576 582 595
Percentage (%) of students at or above NMS 100% 100% 100% 100% 100% 100% 96% 98% 100% 98% 98% 93% 98% 100% 100% 98% 85% 94% 96% 98%
The Caves State School The Caves 10 6 7 –
Average score of the school 418 423 398 435 408 ∧ ∧ ∧ ∧ ∧ 551 504 559 569 562 – – – – –
Percentage (%) of students at or above NMS 88% 100% 100% 100% 100% ∧ ∧ ∧ ∧ ∧ 100% 83% 100% 100% 100% – – – – –
The Centre Education Programme Kingston – – – 15
Average score of the school – – – – – – – – – – – – – – – ∧ ∧ ∧ ∧ ∗Percentage (%) of students at or above NMS – – – – – – – – – – – – – – – ∧ ∧ ∧ ∧ ∗
The Gap State High School The Gap – – 72 192
Average score of the school – – – – – – – – – – 584 538 553 591 594 616 560 598 610 610
Percentage (%) of students at or above NMS – – – – – – – – – – 94% 93% 96% 96% 97% 96% 85% 92% 94% 97%
The Gap State School The Gap 58 73 29 –
Average score of the school 468 405 425 480 445 524 483 508 527 504 595 541 571 600 588 – – – – –
Percentage (%) of students at or above NMS 96% 95% 100% 100% 100% 97% 100% 99% 97% 99% 100% 100% 100% 100% 100% – – – – –
KEY∧ to maintain privacy of individual student information, where there are fewer than five students tested results are not provided∗ no students in the year level sat the test due to absence, exemption or withdrawal– no students in the year levelNMS National Minimum Standard (for further information see www.nap.edu.au)
Queensland Curriculum & Assessment Authority
Page 131 of 149
NAPLAN 2014 Outcomes — All Queensland schools

Year level enrolments Year 3 Year 5 Year 7 Year 9
School Locality Yr 3 Yr 5 Yr 7 Yr 9 READ WRIT SPEL GP NMCY READ WRIT SPEL GP NMCY READ WRIT SPEL GP NMCY READ WRIT SPEL GP NMCY
The Glenleighden School Fig Tree Pocket 12 7 1 4
Average score of the school ∗ ∗ ∗ ∗ ∗ ∗ ∗ ∗ ∗ ∧ ∗ ∗ ∗ ∗ ∗ ∧ ∧ ∧ ∧ ∧Percentage (%) of students at or above NMS ∗ ∗ ∗ ∗ ∗ ∗ ∗ ∗ ∗ ∧ ∗ ∗ ∗ ∗ ∗ ∧ ∧ ∧ ∧ ∧
The Glennie School Toowoomba 32 50 43 118
Average score of the school 444 446 427 450 420 509 470 500 521 485 584 544 560 576 552 606 606 614 615 604
Percentage (%) of students at or above NMS 97% 97% 94% 97% 97% 96% 90% 98% 100% 98% 100% 98% 100% 95% 100% 98% 97% 99% 98% 99%
The Gums State School The Gums 1 5 – –
Average score of the school ∧ ∧ ∧ ∧ ∧ 465 429 450 506 463 – – – – – – – – – –
Percentage (%) of students at or above NMS ∧ ∧ ∧ ∧ ∧ 100% 100% 80% 100% 100% – – – – – – – – – –
The Hall State School Rockhampton 45 43 30 –
Average score of the school 378 352 351 369 344 429 383 425 427 413 504 471 519 487 517 – – – – –
Percentage (%) of students at or above NMS 87% 82% 80% 87% 91% 71% 55% 73% 68% 68% 85% 73% 85% 81% 100% – – – – –
The Kooralbyn International School Kooralbyn 18 14 14 34
Average score of the school 458 419 443 471 409 454 434 435 456 446 524 489 497 502 528 571 567 582 578 557
Percentage (%) of students at or above NMS 94% 94% 100% 94% 100% 92% 100% 75% 100% 92% 93% 93% 93% 86% 93% 97% 91% 94% 97% 100%
The Lakes College North Lakes 59 42 23 21
Average score of the school 455 424 435 474 409 510 451 509 515 499 584 524 573 583 568 598 592 601 598 589
Percentage (%) of students at or above NMS 97% 100% 100% 100% 100% 98% 80% 100% 100% 98% 100% 100% 100% 95% 95% 100% 94% 100% 88% 100%
The Rockhampton Grammar School Rockhampton 63 71 72 158
Average score of the school 449 421 436 486 441 530 491 517 548 507 578 520 556 580 595 595 566 590 593 624
Percentage (%) of students at or above NMS 100% 100% 100% 98% 98% 99% 100% 100% 100% 99% 100% 96% 99% 99% 100% 97% 90% 94% 94% 99%
The School of Total Education Warwick 7 8 2 10
Average score of the school 381 361 337 408 379 459 437 449 473 458 ∧ ∧ ∧ ∧ ∧ 555 517 568 569 586
Percentage (%) of students at or above NMS 100% 100% 80% 100% 80% 88% 100% 100% 100% 88% ∧ ∧ ∧ ∧ ∧ 100% 67% 100% 89% 100%
The Scots PGC College Warwick 26 25 21 48
Average score of the school 425 405 394 437 413 543 478 499 549 516 562 513 541 565 573 587 545 575 585 597
Percentage (%) of students at or above NMS 96% 96% 100% 100% 100% 100% 95% 95% 100% 100% 100% 100% 100% 95% 100% 89% 74% 91% 93% 100%
The Southport School Southport 78 82 109 150
Average score of the school 449 420 447 466 441 541 509 539 563 557 573 542 556 583 593 597 576 586 595 639
Percentage (%) of students at or above NMS 100% 96% 100% 100% 100% 100% 99% 100% 100% 99% 100% 97% 100% 100% 100% 99% 89% 96% 97% 100%
The Springfield Anglican College Springfield – – 49 80
Average score of the school – – – – – – – – – – 581 522 580 589 617 593 582 588 590 604
Percentage (%) of students at or above NMS – – – – – – – – – – 100% 98% 100% 100% 100% 94% 91% 94% 94% 99%
KEY∧ to maintain privacy of individual student information, where there are fewer than five students tested results are not provided∗ no students in the year level sat the test due to absence, exemption or withdrawal– no students in the year levelNMS National Minimum Standard (for further information see www.nap.edu.au)
Queensland Curriculum & Assessment Authority
Page 132 of 149
NAPLAN 2014 Outcomes — All Queensland schools

Year level enrolments Year 3 Year 5 Year 7 Year 9
School Locality Yr 3 Yr 5 Yr 7 Yr 9 READ WRIT SPEL GP NMCY READ WRIT SPEL GP NMCY READ WRIT SPEL GP NMCY READ WRIT SPEL GP NMCY
The Springfield Anglican College -
Springfield College Drive
Springfield 54 58 – –
Average score of the school 459 460 443 473 430 521 492 521 539 517 – – – – – – – – – –
Percentage (%) of students at or above NMS 94% 98% 98% 98% 98% 96% 91% 95% 95% 97% – – – – – – – – – –
The Summit State School The Summit 5 4 2 –
Average score of the school 384 405 370 394 369 ∧ ∧ ∧ ∧ ∧ ∧ ∧ ∧ ∧ ∧ – – – – –
Percentage (%) of students at or above NMS 100% 100% 80% 100% 100% ∧ ∧ ∧ ∧ ∧ ∧ ∧ ∧ ∧ ∧ – – – – –
The Willows State School Kirwan 149 149 90 –
Average score of the school 392 373 391 415 384 476 440 469 476 465 517 486 514 516 519 – – – – –
Percentage (%) of students at or above NMS 92% 90% 95% 97% 96% 84% 82% 88% 90% 91% 95% 85% 84% 89% 93% – – – – –
Theebine State School Theebine – 1 – –
Average score of the school – – – – – ∧ ∧ ∧ ∧ ∧ – – – – – – – – – –
Percentage (%) of students at or above NMS – – – – – ∧ ∧ ∧ ∧ ∧ – – – – – – – – – –
Theodore State School Theodore 17 16 5 6
Average score of the school 405 423 409 460 401 519 430 491 511 487 507 500 518 539 541 547 545 581 532 547
Percentage (%) of students at or above NMS 94% 100% 94% 100% 100% 100% 87% 93% 100% 100% 100% 100% 100% 100% 100% 83% 67% 83% 83% 100%
Thornlands State School Thornlands 101 104 14 –
Average score of the school 425 400 419 442 413 504 472 494 516 506 519 492 498 517 527 – – – – –
Percentage (%) of students at or above NMS 95% 99% 99% 100% 99% 96% 92% 94% 97% 97% 91% 100% 75% 83% 100% – – – – –
Thornton State School Thornton 7 3 2 –
Average score of the school 381 360 333 375 355 ∧ ∧ ∧ ∧ ∧ ∧ ∧ ∧ ∧ ∧ – – – – –
Percentage (%) of students at or above NMS 100% 100% 83% 100% 100% ∧ ∧ ∧ ∧ ∧ ∧ ∧ ∧ ∧ ∧ – – – – –
Thulimbah State School Thulimbah via Stanthorpe 6 4 1 –
Average score of the school 326 281 336 369 371 ∧ ∧ ∧ ∧ ∧ ∧ ∧ ∧ ∧ ∧ – – – – –
Percentage (%) of students at or above NMS 83% 50% 100% 100% 100% ∧ ∧ ∧ ∧ ∧ ∧ ∧ ∧ ∧ ∧ – – – – –
Thuringowa State High School Condon – – – 130
Average score of the school – – – – – – – – – – – – – – – 529 474 541 520 531
Percentage (%) of students at or above NMS – – – – – – – – – – – – – – – 73% 44% 77% 69% 85%
Tiaro State School Tiaro – 3 2 –
Average score of the school – – – – – ∧ ∧ ∧ ∧ ∧ ∧ ∧ ∧ ∧ ∧ – – – – –
Percentage (%) of students at or above NMS – – – – – ∧ ∧ ∧ ∧ ∧ ∧ ∧ ∧ ∧ ∧ – – – – –
Tieri State School Tieri 24 24 9 –
Average score of the school 383 354 367 408 367 456 424 441 462 442 568 524 574 587 537 – – – – –
Percentage (%) of students at or above NMS 86% 95% 95% 95% 100% 91% 78% 78% 96% 87% 100% 100% 100% 100% 100% – – – – –
Tin Can Bay State School Tin Can Bay 43 45 28 28
Average score of the school 381 369 347 398 371 484 452 481 488 478 519 460 529 517 536 552 511 545 552 560
Percentage (%) of students at or above NMS 95% 95% 83% 95% 97% 89% 92% 100% 97% 95% 81% 70% 96% 92% 100% 90% 67% 76% 90% 100%
KEY∧ to maintain privacy of individual student information, where there are fewer than five students tested results are not provided∗ no students in the year level sat the test due to absence, exemption or withdrawal– no students in the year levelNMS National Minimum Standard (for further information see www.nap.edu.au)
Queensland Curriculum & Assessment Authority
Page 133 of 149
NAPLAN 2014 Outcomes — All Queensland schools
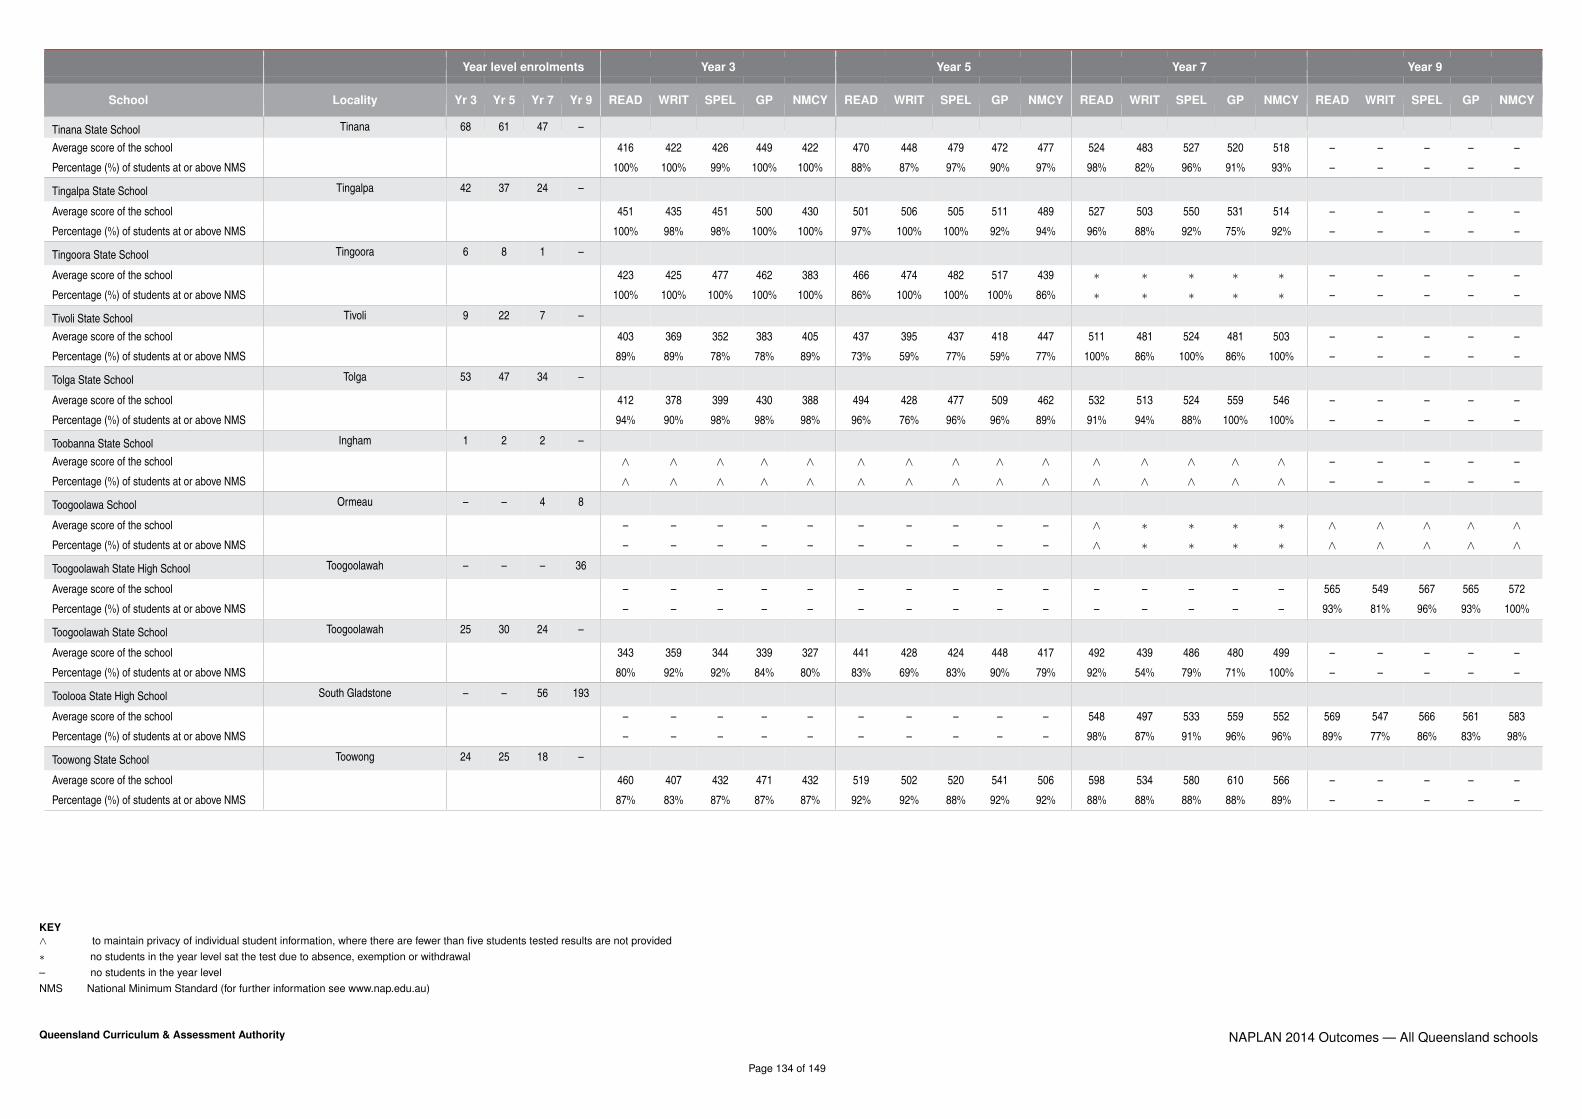
Year level enrolments Year 3 Year 5 Year 7 Year 9
School Locality Yr 3 Yr 5 Yr 7 Yr 9 READ WRIT SPEL GP NMCY READ WRIT SPEL GP NMCY READ WRIT SPEL GP NMCY READ WRIT SPEL GP NMCY
Tinana State School Tinana 68 61 47 –
Average score of the school 416 422 426 449 422 470 448 479 472 477 524 483 527 520 518 – – – – –
Percentage (%) of students at or above NMS 100% 100% 99% 100% 100% 88% 87% 97% 90% 97% 98% 82% 96% 91% 93% – – – – –
Tingalpa State School Tingalpa 42 37 24 –
Average score of the school 451 435 451 500 430 501 506 505 511 489 527 503 550 531 514 – – – – –
Percentage (%) of students at or above NMS 100% 98% 98% 100% 100% 97% 100% 100% 92% 94% 96% 88% 92% 75% 92% – – – – –
Tingoora State School Tingoora 6 8 1 –
Average score of the school 423 425 477 462 383 466 474 482 517 439 ∗ ∗ ∗ ∗ ∗ – – – – –
Percentage (%) of students at or above NMS 100% 100% 100% 100% 100% 86% 100% 100% 100% 86% ∗ ∗ ∗ ∗ ∗ – – – – –
Tivoli State School Tivoli 9 22 7 –
Average score of the school 403 369 352 383 405 437 395 437 418 447 511 481 524 481 503 – – – – –
Percentage (%) of students at or above NMS 89% 89% 78% 78% 89% 73% 59% 77% 59% 77% 100% 86% 100% 86% 100% – – – – –
Tolga State School Tolga 53 47 34 –
Average score of the school 412 378 399 430 388 494 428 477 509 462 532 513 524 559 546 – – – – –
Percentage (%) of students at or above NMS 94% 90% 98% 98% 98% 96% 76% 96% 96% 89% 91% 94% 88% 100% 100% – – – – –
Toobanna State School Ingham 1 2 2 –
Average score of the school ∧ ∧ ∧ ∧ ∧ ∧ ∧ ∧ ∧ ∧ ∧ ∧ ∧ ∧ ∧ – – – – –
Percentage (%) of students at or above NMS ∧ ∧ ∧ ∧ ∧ ∧ ∧ ∧ ∧ ∧ ∧ ∧ ∧ ∧ ∧ – – – – –
Toogoolawa School Ormeau – – 4 8
Average score of the school – – – – – – – – – – ∧ ∗ ∗ ∗ ∗ ∧ ∧ ∧ ∧ ∧Percentage (%) of students at or above NMS – – – – – – – – – – ∧ ∗ ∗ ∗ ∗ ∧ ∧ ∧ ∧ ∧
Toogoolawah State High School Toogoolawah – – – 36
Average score of the school – – – – – – – – – – – – – – – 565 549 567 565 572
Percentage (%) of students at or above NMS – – – – – – – – – – – – – – – 93% 81% 96% 93% 100%
Toogoolawah State School Toogoolawah 25 30 24 –
Average score of the school 343 359 344 339 327 441 428 424 448 417 492 439 486 480 499 – – – – –
Percentage (%) of students at or above NMS 80% 92% 92% 84% 80% 83% 69% 83% 90% 79% 92% 54% 79% 71% 100% – – – – –
Toolooa State High School South Gladstone – – 56 193
Average score of the school – – – – – – – – – – 548 497 533 559 552 569 547 566 561 583
Percentage (%) of students at or above NMS – – – – – – – – – – 98% 87% 91% 96% 96% 89% 77% 86% 83% 98%
Toowong State School Toowong 24 25 18 –
Average score of the school 460 407 432 471 432 519 502 520 541 506 598 534 580 610 566 – – – – –
Percentage (%) of students at or above NMS 87% 83% 87% 87% 87% 92% 92% 88% 92% 92% 88% 88% 88% 88% 89% – – – – –
KEY∧ to maintain privacy of individual student information, where there are fewer than five students tested results are not provided∗ no students in the year level sat the test due to absence, exemption or withdrawal– no students in the year levelNMS National Minimum Standard (for further information see www.nap.edu.au)
Queensland Curriculum & Assessment Authority
Page 134 of 149
NAPLAN 2014 Outcomes — All Queensland schools

Year level enrolments Year 3 Year 5 Year 7 Year 9
School Locality Yr 3 Yr 5 Yr 7 Yr 9 READ WRIT SPEL GP NMCY READ WRIT SPEL GP NMCY READ WRIT SPEL GP NMCY READ WRIT SPEL GP NMCY
Toowoomba Anglican College and
Preparatory School
Toowoomba 40 51 64 –
Average score of the school 444 413 427 475 427 530 481 495 514 525 562 532 549 568 581 – – – – –
Percentage (%) of students at or above NMS 97% 97% 97% 97% 93% 98% 92% 90% 94% 98% 94% 92% 94% 97% 98% – – – – –
Toowoomba Christian College Highfields 41 29 31 80
Average score of the school 444 409 422 465 431 507 463 496 518 485 551 528 565 570 572 589 576 590 596 581
Percentage (%) of students at or above NMS 100% 95% 97% 100% 100% 100% 96% 100% 100% 96% 100% 97% 97% 100% 100% 97% 93% 96% 96% 99%
Toowoomba East State School Toowoomba 119 121 69 –
Average score of the school 459 428 429 489 430 530 481 510 532 499 577 532 569 578 571 – – – – –
Percentage (%) of students at or above NMS 95% 97% 97% 97% 98% 93% 94% 96% 96% 94% 100% 91% 95% 95% 100% – – – – –
Toowoomba Grammar School Toowoomba 41 67 94 168
Average score of the school 458 409 459 470 460 532 481 502 515 528 572 515 530 574 575 590 575 579 585 623
Percentage (%) of students at or above NMS 98% 100% 100% 100% 100% 97% 97% 94% 97% 100% 100% 98% 96% 97% 100% 94% 89% 92% 95% 100%
Toowoomba North State School Toowoomba 22 29 11 –
Average score of the school 424 395 412 411 424 451 437 479 456 435 530 503 548 520 519 – – – – –
Percentage (%) of students at or above NMS 85% 100% 100% 100% 95% 86% 81% 96% 78% 86% 100% 100% 91% 100% 100% – – – – –
Toowoomba SHS - Wilsonton Campus Wilsonton – – – 153
Average score of the school – – – – – – – – – – – – – – – 545 501 548 539 554
Percentage (%) of students at or above NMS – – – – – – – – – – – – – – – 85% 57% 82% 83% 97%
Toowoomba State High School Toowoomba – – – 171
Average score of the school – – – – – – – – – – – – – – – 579 544 570 574 586
Percentage (%) of students at or above NMS – – – – – – – – – – – – – – – 94% 80% 92% 92% 99%
Torbanlea State School Torbanlea 50 54 31 –
Average score of the school 390 364 380 395 379 483 446 468 490 464 524 497 514 533 540 – – – – –
Percentage (%) of students at or above NMS 83% 89% 91% 91% 91% 89% 81% 87% 94% 89% 86% 82% 86% 82% 86% – – – – –
Torquay State School Torquay 69 57 47 –
Average score of the school 380 362 387 402 361 473 456 486 481 441 522 455 516 514 524 – – – – –
Percentage (%) of students at or above NMS 87% 92% 89% 90% 94% 94% 94% 98% 94% 86% 98% 83% 88% 88% 93% – – – – –
Townsville Central State School North Ward 37 35 25 –
Average score of the school 416 407 384 441 404 522 467 488 501 486 553 486 530 529 541 – – – – –
Percentage (%) of students at or above NMS 92% 97% 94% 92% 97% 94% 94% 97% 97% 100% 100% 92% 96% 96% 100% – – – – –
Townsville Christian College Garbutt 9 10 5 –
Average score of the school 400 372 427 430 396 ∧ ∧ ∧ ∧ ∧ ∧ ∧ ∧ ∧ ∧ – – – – –
Percentage (%) of students at or above NMS 86% 100% 100% 86% 100% ∧ ∧ ∧ ∧ ∧ ∧ ∧ ∧ ∧ ∧ – – – – –
KEY∧ to maintain privacy of individual student information, where there are fewer than five students tested results are not provided∗ no students in the year level sat the test due to absence, exemption or withdrawal– no students in the year levelNMS National Minimum Standard (for further information see www.nap.edu.au)
Queensland Curriculum & Assessment Authority
Page 135 of 149
NAPLAN 2014 Outcomes — All Queensland schools

Year level enrolments Year 3 Year 5 Year 7 Year 9
School Locality Yr 3 Yr 5 Yr 7 Yr 9 READ WRIT SPEL GP NMCY READ WRIT SPEL GP NMCY READ WRIT SPEL GP NMCY READ WRIT SPEL GP NMCY
Townsville Community Learning Centre Mundingburra 13 13 13 12
Average score of the school ∗ ∗ ∗ ∗ ∗ ∗ ∗ ∗ ∗ ∗ ∗ ∗ ∗ ∗ ∗ ∗ ∗ ∗ ∗ ∗Percentage (%) of students at or above NMS ∗ ∗ ∗ ∗ ∗ ∗ ∗ ∗ ∗ ∗ ∗ ∗ ∗ ∗ ∗ ∗ ∗ ∗ ∗ ∗
Townsville Grammar School Townsville – – 71 144
Average score of the school – – – – – – – – – – 591 558 573 592 602 627 579 608 619 647
Percentage (%) of students at or above NMS – – – – – – – – – – 99% 99% 99% 99% 99% 99% 89% 97% 96% 100%
Townsville Grammar School (Annandale
Campus)
Annandale 78 74 – –
Average score of the school 473 445 441 494 451 573 527 541 581 556 – – – – – – – – – –
Percentage (%) of students at or above NMS 100% 99% 99% 100% 100% 100% 100% 100% 99% 99% – – – – – – – – – –
Townsville South State School Townsville South 19 9 5 –
Average score of the school 361 368 342 358 353 525 494 482 533 463 ∧ ∧ ∧ ∧ ∧ – – – – –
Percentage (%) of students at or above NMS 76% 100% 82% 76% 94% 100% 100% 100% 100% 100% ∧ ∧ ∧ ∧ ∧ – – – – –
Townsville State High School Railway Estate – – – 183
Average score of the school – – – – – – – – – – – – – – – 541 490 546 526 540
Percentage (%) of students at or above NMS – – – – – – – – – – – – – – – 78% 54% 79% 73% 80%
Townsville West State School West End 30 16 8 –
Average score of the school 422 395 425 431 404 440 403 444 424 403 507 466 515 520 491 – – – – –
Percentage (%) of students at or above NMS 100% 96% 96% 100% 100% 82% 82% 82% 64% 64% 86% 86% 100% 86% 86% – – – – –
Townview State School Mount Isa 38 32 21 –
Average score of the school 324 315 314 329 303 429 353 439 438 413 484 444 459 463 490 – – – – –
Percentage (%) of students at or above NMS 68% 76% 73% 81% 71% 68% 41% 70% 73% 55% 80% 67% 62% 62% 90% – – – – –
Trebonne State School Trebonne 1 3 2 –
Average score of the school ∧ ∧ ∧ ∧ ∧ ∧ ∧ ∧ ∧ ∧ ∧ ∧ ∧ ∧ ∧ – – – – –
Percentage (%) of students at or above NMS ∧ ∧ ∧ ∧ ∧ ∧ ∧ ∧ ∧ ∧ ∧ ∧ ∧ ∧ ∧ – – – – –
Tresswell State School Springsure 3 – 1 –
Average score of the school ∧ ∧ ∧ ∧ ∧ – – – – – ∧ ∧ ∧ ∧ ∧ – – – – –
Percentage (%) of students at or above NMS ∧ ∧ ∧ ∧ ∧ – – – – – ∧ ∧ ∧ ∧ ∧ – – – – –
Trinity Anglican School White Rock 40 36 23 76
Average score of the school 431 402 402 428 401 526 492 500 519 502 571 539 540 567 580 606 584 603 600 606
Percentage (%) of students at or above NMS 95% 98% 98% 100% 97% 100% 97% 94% 100% 100% 96% 95% 95% 95% 95% 96% 91% 93% 96% 99%
Trinity Anglican School (Marlin Coast
Campus)
Kewarra Beach 47 36 19 –
Average score of the school 449 423 412 439 405 514 484 505 529 492 589 544 561 575 576 – – – – –
Percentage (%) of students at or above NMS 98% 100% 98% 93% 98% 94% 94% 97% 100% 97% 100% 95% 100% 100% 100% – – – – –
KEY∧ to maintain privacy of individual student information, where there are fewer than five students tested results are not provided∗ no students in the year level sat the test due to absence, exemption or withdrawal– no students in the year levelNMS National Minimum Standard (for further information see www.nap.edu.au)
Queensland Curriculum & Assessment Authority
Page 136 of 149
NAPLAN 2014 Outcomes — All Queensland schools
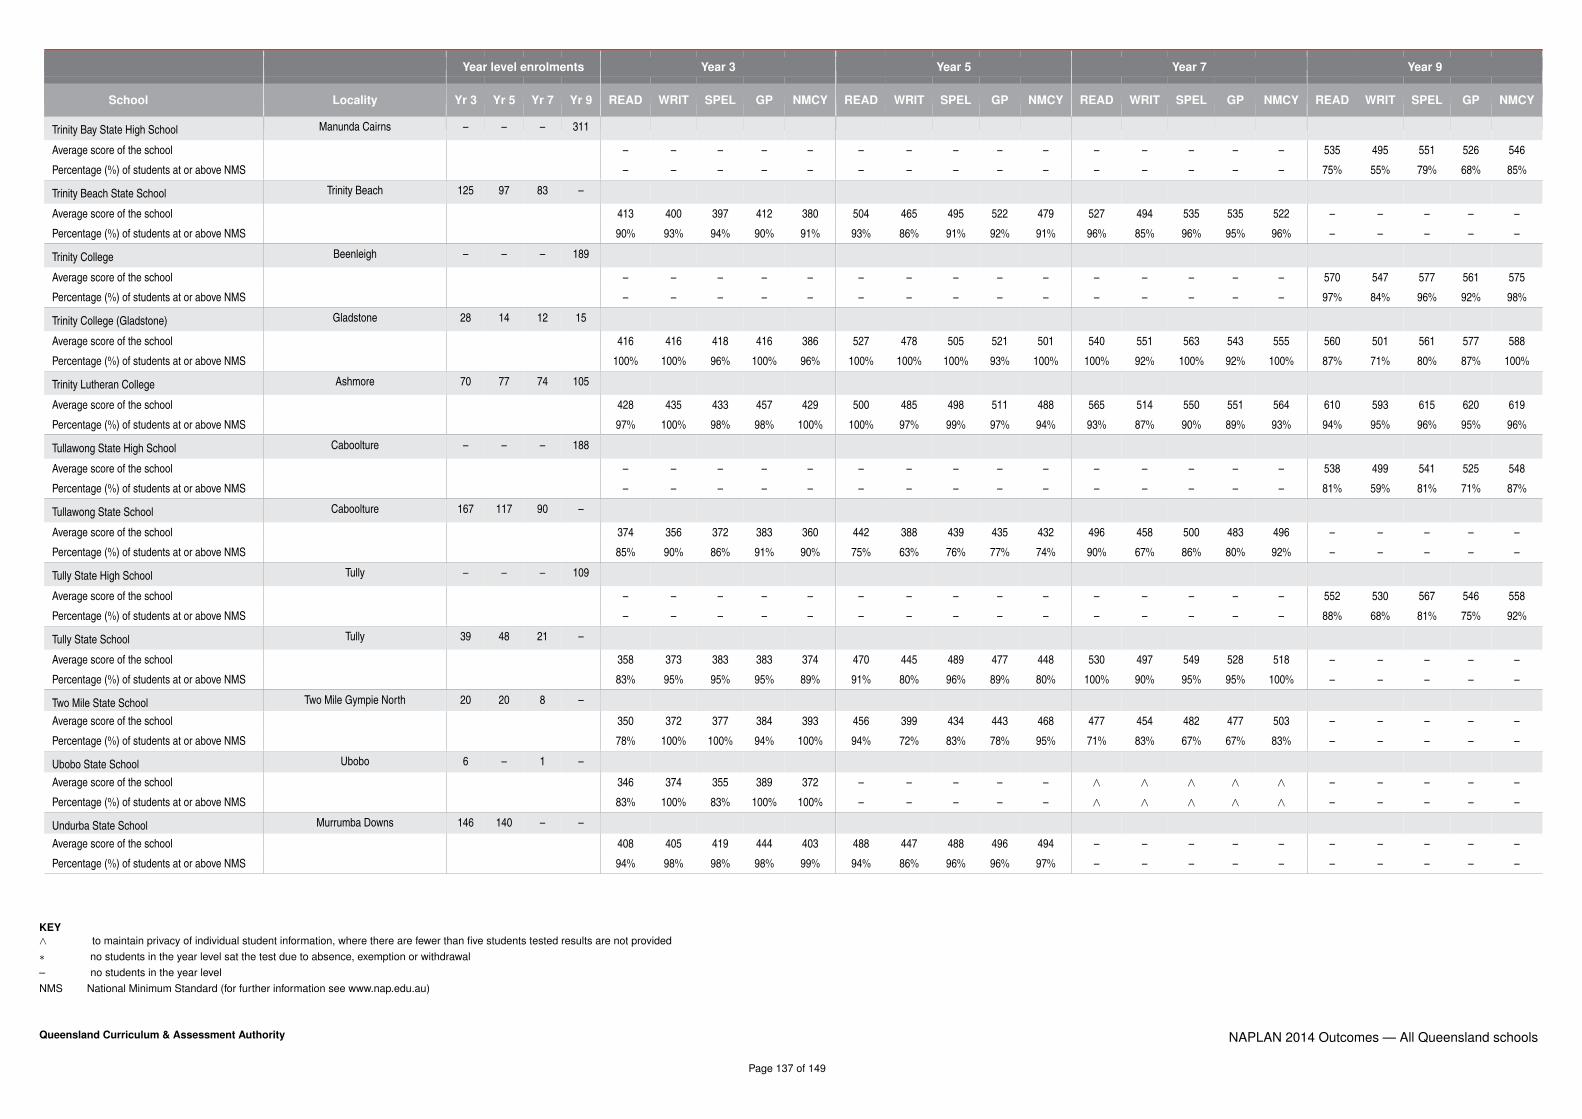
Year level enrolments Year 3 Year 5 Year 7 Year 9
School Locality Yr 3 Yr 5 Yr 7 Yr 9 READ WRIT SPEL GP NMCY READ WRIT SPEL GP NMCY READ WRIT SPEL GP NMCY READ WRIT SPEL GP NMCY
Trinity Bay State High School Manunda Cairns – – – 311
Average score of the school – – – – – – – – – – – – – – – 535 495 551 526 546
Percentage (%) of students at or above NMS – – – – – – – – – – – – – – – 75% 55% 79% 68% 85%
Trinity Beach State School Trinity Beach 125 97 83 –
Average score of the school 413 400 397 412 380 504 465 495 522 479 527 494 535 535 522 – – – – –
Percentage (%) of students at or above NMS 90% 93% 94% 90% 91% 93% 86% 91% 92% 91% 96% 85% 96% 95% 96% – – – – –
Trinity College Beenleigh – – – 189
Average score of the school – – – – – – – – – – – – – – – 570 547 577 561 575
Percentage (%) of students at or above NMS – – – – – – – – – – – – – – – 97% 84% 96% 92% 98%
Trinity College (Gladstone) Gladstone 28 14 12 15
Average score of the school 416 416 418 416 386 527 478 505 521 501 540 551 563 543 555 560 501 561 577 588
Percentage (%) of students at or above NMS 100% 100% 96% 100% 96% 100% 100% 100% 93% 100% 100% 92% 100% 92% 100% 87% 71% 80% 87% 100%
Trinity Lutheran College Ashmore 70 77 74 105
Average score of the school 428 435 433 457 429 500 485 498 511 488 565 514 550 551 564 610 593 615 620 619
Percentage (%) of students at or above NMS 97% 100% 98% 98% 100% 100% 97% 99% 97% 94% 93% 87% 90% 89% 93% 94% 95% 96% 95% 96%
Tullawong State High School Caboolture – – – 188
Average score of the school – – – – – – – – – – – – – – – 538 499 541 525 548
Percentage (%) of students at or above NMS – – – – – – – – – – – – – – – 81% 59% 81% 71% 87%
Tullawong State School Caboolture 167 117 90 –
Average score of the school 374 356 372 383 360 442 388 439 435 432 496 458 500 483 496 – – – – –
Percentage (%) of students at or above NMS 85% 90% 86% 91% 90% 75% 63% 76% 77% 74% 90% 67% 86% 80% 92% – – – – –
Tully State High School Tully – – – 109
Average score of the school – – – – – – – – – – – – – – – 552 530 567 546 558
Percentage (%) of students at or above NMS – – – – – – – – – – – – – – – 88% 68% 81% 75% 92%
Tully State School Tully 39 48 21 –
Average score of the school 358 373 383 383 374 470 445 489 477 448 530 497 549 528 518 – – – – –
Percentage (%) of students at or above NMS 83% 95% 95% 95% 89% 91% 80% 96% 89% 80% 100% 90% 95% 95% 100% – – – – –
Two Mile State School Two Mile Gympie North 20 20 8 –
Average score of the school 350 372 377 384 393 456 399 434 443 468 477 454 482 477 503 – – – – –
Percentage (%) of students at or above NMS 78% 100% 100% 94% 100% 94% 72% 83% 78% 95% 71% 83% 67% 67% 83% – – – – –
Ubobo State School Ubobo 6 – 1 –
Average score of the school 346 374 355 389 372 – – – – – ∧ ∧ ∧ ∧ ∧ – – – – –
Percentage (%) of students at or above NMS 83% 100% 83% 100% 100% – – – – – ∧ ∧ ∧ ∧ ∧ – – – – –
Undurba State School Murrumba Downs 146 140 – –
Average score of the school 408 405 419 444 403 488 447 488 496 494 – – – – – – – – – –
Percentage (%) of students at or above NMS 94% 98% 98% 98% 99% 94% 86% 96% 96% 97% – – – – – – – – – –
KEY∧ to maintain privacy of individual student information, where there are fewer than five students tested results are not provided∗ no students in the year level sat the test due to absence, exemption or withdrawal– no students in the year levelNMS National Minimum Standard (for further information see www.nap.edu.au)
Queensland Curriculum & Assessment Authority
Page 137 of 149
NAPLAN 2014 Outcomes — All Queensland schools

Year level enrolments Year 3 Year 5 Year 7 Year 9
School Locality Yr 3 Yr 5 Yr 7 Yr 9 READ WRIT SPEL GP NMCY READ WRIT SPEL GP NMCY READ WRIT SPEL GP NMCY READ WRIT SPEL GP NMCY
Unity College Caloundra West 83 76 73 136
Average score of the school 415 378 399 403 385 504 479 506 502 482 527 495 533 528 535 569 550 570 560 577
Percentage (%) of students at or above NMS 94% 93% 94% 96% 96% 99% 99% 97% 99% 97% 96% 93% 100% 96% 100% 90% 84% 93% 91% 98%
Upper Brookfield State School Upper Brookfield 7 10 9 –
Average score of the school 477 392 408 495 430 566 509 513 608 552 641 533 586 632 615 – – – – –
Percentage (%) of students at or above NMS 100% 86% 100% 100% 100% 100% 100% 100% 100% 100% 88% 88% 88% 88% 88% – – – – –
Upper Coomera State College Upper Coomera 124 140 131 241
Average score of the school 378 368 393 396 363 462 437 473 470 458 515 477 531 515 521 550 515 567 548 553
Percentage (%) of students at or above NMS 89% 90% 95% 93% 96% 89% 80% 89% 87% 92% 92% 81% 90% 93% 96% 91% 68% 93% 84% 95%
Upper Mount Gravatt State School Upper Mount Gravatt 58 52 29 –
Average score of the school 440 403 422 448 411 505 465 512 521 514 573 526 571 586 588 – – – – –
Percentage (%) of students at or above NMS 98% 98% 98% 98% 98% 98% 86% 92% 96% 96% 96% 96% 100% 93% 96% – – – – –
Urandangi State School via Mount Isa – – 1 –
Average score of the school – – – – – – – – – – ∧ ∧ ∧ ∧ ∧ – – – – –
Percentage (%) of students at or above NMS – – – – – – – – – – ∧ ∧ ∧ ∧ ∧ – – – – –
Urangan Point State School Urangan 55 46 20 –
Average score of the school 350 337 337 352 354 479 442 458 491 462 535 482 520 531 531 – – – – –
Percentage (%) of students at or above NMS 81% 90% 72% 79% 85% 98% 88% 86% 95% 86% 100% 75% 95% 90% 100% – – – – –
Urangan State High School Urangan – – – 320
Average score of the school – – – – – – – – – – – – – – – 554 512 559 551 555
Percentage (%) of students at or above NMS – – – – – – – – – – – – – – – 85% 75% 87% 85% 93%
Vale View State School Vale View 11 8 4 –
Average score of the school 410 403 423 422 381 537 468 468 534 517 ∧ ∧ ∧ ∧ ∧ – – – – –
Percentage (%) of students at or above NMS 90% 100% 100% 100% 100% 100% 100% 100% 100% 100% ∧ ∧ ∧ ∧ ∧ – – – – –
Valkyrie State School via Nebo 2 1 1 –
Average score of the school ∧ ∧ ∧ ∧ ∧ ∧ ∧ ∧ ∧ ∧ ∧ ∧ ∧ ∧ ∧ – – – – –
Percentage (%) of students at or above NMS ∧ ∧ ∧ ∧ ∧ ∧ ∧ ∧ ∧ ∧ ∧ ∧ ∧ ∧ ∧ – – – – –
Varsity College Varsity Lakes 231 219 158 316
Average score of the school 429 416 431 437 414 495 477 495 501 491 550 522 555 554 564 588 564 597 584 602
Percentage (%) of students at or above NMS 98% 96% 96% 96% 100% 97% 95% 96% 97% 97% 97% 94% 94% 96% 99% 97% 91% 95% 95% 99%
Veresdale Scrub State School Veresdale Scrub via Beaudesert Q 19 11 9 –
Average score of the school 420 401 435 422 398 506 455 474 505 488 490 437 465 487 480 – – – – –
Percentage (%) of students at or above NMS 100% 100% 100% 100% 100% 100% 88% 100% 100% 100% 88% 50% 75% 88% 88% – – – – –
Victoria Park State School Mackay 82 80 43 –
Average score of the school 389 371 373 395 374 488 451 482 485 474 543 484 540 532 548 – – – – –
Percentage (%) of students at or above NMS 92% 89% 90% 91% 91% 97% 84% 95% 97% 100% 97% 79% 87% 85% 97% – – – – –
KEY∧ to maintain privacy of individual student information, where there are fewer than five students tested results are not provided∗ no students in the year level sat the test due to absence, exemption or withdrawal– no students in the year levelNMS National Minimum Standard (for further information see www.nap.edu.au)
Queensland Curriculum & Assessment Authority
Page 138 of 149
NAPLAN 2014 Outcomes — All Queensland schools

Year level enrolments Year 3 Year 5 Year 7 Year 9
School Locality Yr 3 Yr 5 Yr 7 Yr 9 READ WRIT SPEL GP NMCY READ WRIT SPEL GP NMCY READ WRIT SPEL GP NMCY READ WRIT SPEL GP NMCY
Victoria Plantation State School Ingham 16 8 7 –
Average score of the school 401 387 384 419 385 561 503 524 545 532 543 510 551 522 513 – – – – –
Percentage (%) of students at or above NMS 100% 100% 94% 100% 100% 100% 88% 88% 88% 100% 100% 100% 100% 100% 100% – – – – –
Victoria Point State High School Victoria Point – – – 226
Average score of the school – – – – – – – – – – – – – – – 572 547 580 564 577
Percentage (%) of students at or above NMS – – – – – – – – – – – – – – – 90% 82% 93% 92% 97%
Victoria Point State School Victoria Point 71 76 50 –
Average score of the school 370 371 365 376 361 481 472 494 492 468 511 478 514 505 513 – – – – –
Percentage (%) of students at or above NMS 84% 91% 88% 91% 84% 91% 88% 87% 84% 88% 89% 85% 88% 90% 94% – – – – –
Victory College Gympie 27 29 37 33
Average score of the school 386 348 375 387 364 478 451 461 479 461 528 507 514 521 522 567 528 563 552 580
Percentage (%) of students at or above NMS 92% 92% 92% 92% 88% 88% 93% 89% 89% 96% 94% 97% 87% 90% 100% 90% 79% 87% 90% 96%
Vienna Woods State School Alexandra Hills 30 31 1 –
Average score of the school 395 362 360 407 371 466 441 484 472 450 ∧ ∧ ∧ ∧ ∧ – – – – –
Percentage (%) of students at or above NMS 89% 85% 85% 96% 89% 93% 87% 97% 83% 90% ∧ ∧ ∧ ∧ ∧ – – – – –
Villanova College Coorparoo – 141 112 166
Average score of the school – – – – – 527 484 514 529 512 563 531 544 572 593 602 565 591 596 615
Percentage (%) of students at or above NMS – – – – – 99% 97% 99% 100% 99% 100% 97% 100% 100% 100% 97% 91% 95% 95% 99%
Vincent State School Vincent 19 16 13 –
Average score of the school 299 287 289 285 341 376 314 389 395 382 509 418 480 471 479 – – – – –
Percentage (%) of students at or above NMS 50% 67% 53% 60% 86% 40% 50% 47% 53% 67% 92% 62% 69% 69% 77% – – – – –
Virginia State School Virginia 77 76 35 –
Average score of the school 419 416 430 454 409 485 453 482 481 469 529 486 528 529 554 – – – – –
Percentage (%) of students at or above NMS 92% 96% 96% 96% 97% 95% 86% 90% 95% 92% 97% 85% 88% 94% 97% – – – – –
Wadja Wadja High School Woorabinda – – – 12
Average score of the school – – – – – – – – – – – – – – – 445 250 382 437 430
Percentage (%) of students at or above NMS – – – – – – – – – – – – – – – 0% 0% 14% 14% 14%
Walkamin State School Walkamin 9 6 2 –
Average score of the school 478 458 458 462 396 447 465 442 443 466 ∧ ∧ ∧ ∧ ∧ – – – – –
Percentage (%) of students at or above NMS 100% 100% 100% 100% 100% 67% 83% 100% 83% 100% ∧ ∧ ∧ ∧ ∧ – – – – –
Walkerston State School Walkerston 56 44 28 –
Average score of the school 415 377 398 431 383 500 468 486 492 470 545 471 523 543 533 – – – – –
Percentage (%) of students at or above NMS 94% 91% 94% 92% 94% 91% 88% 88% 95% 90% 96% 81% 85% 92% 96% – – – – –
Walkervale State School Bundaberg 61 69 44 –
Average score of the school 345 333 348 356 346 459 419 452 473 459 520 475 499 511 528 – – – – –
Percentage (%) of students at or above NMS 75% 83% 83% 85% 91% 85% 76% 84% 85% 80% 98% 81% 85% 88% 90% – – – – –
KEY∧ to maintain privacy of individual student information, where there are fewer than five students tested results are not provided∗ no students in the year level sat the test due to absence, exemption or withdrawal– no students in the year levelNMS National Minimum Standard (for further information see www.nap.edu.au)
Queensland Curriculum & Assessment Authority
Page 139 of 149
NAPLAN 2014 Outcomes — All Queensland schools
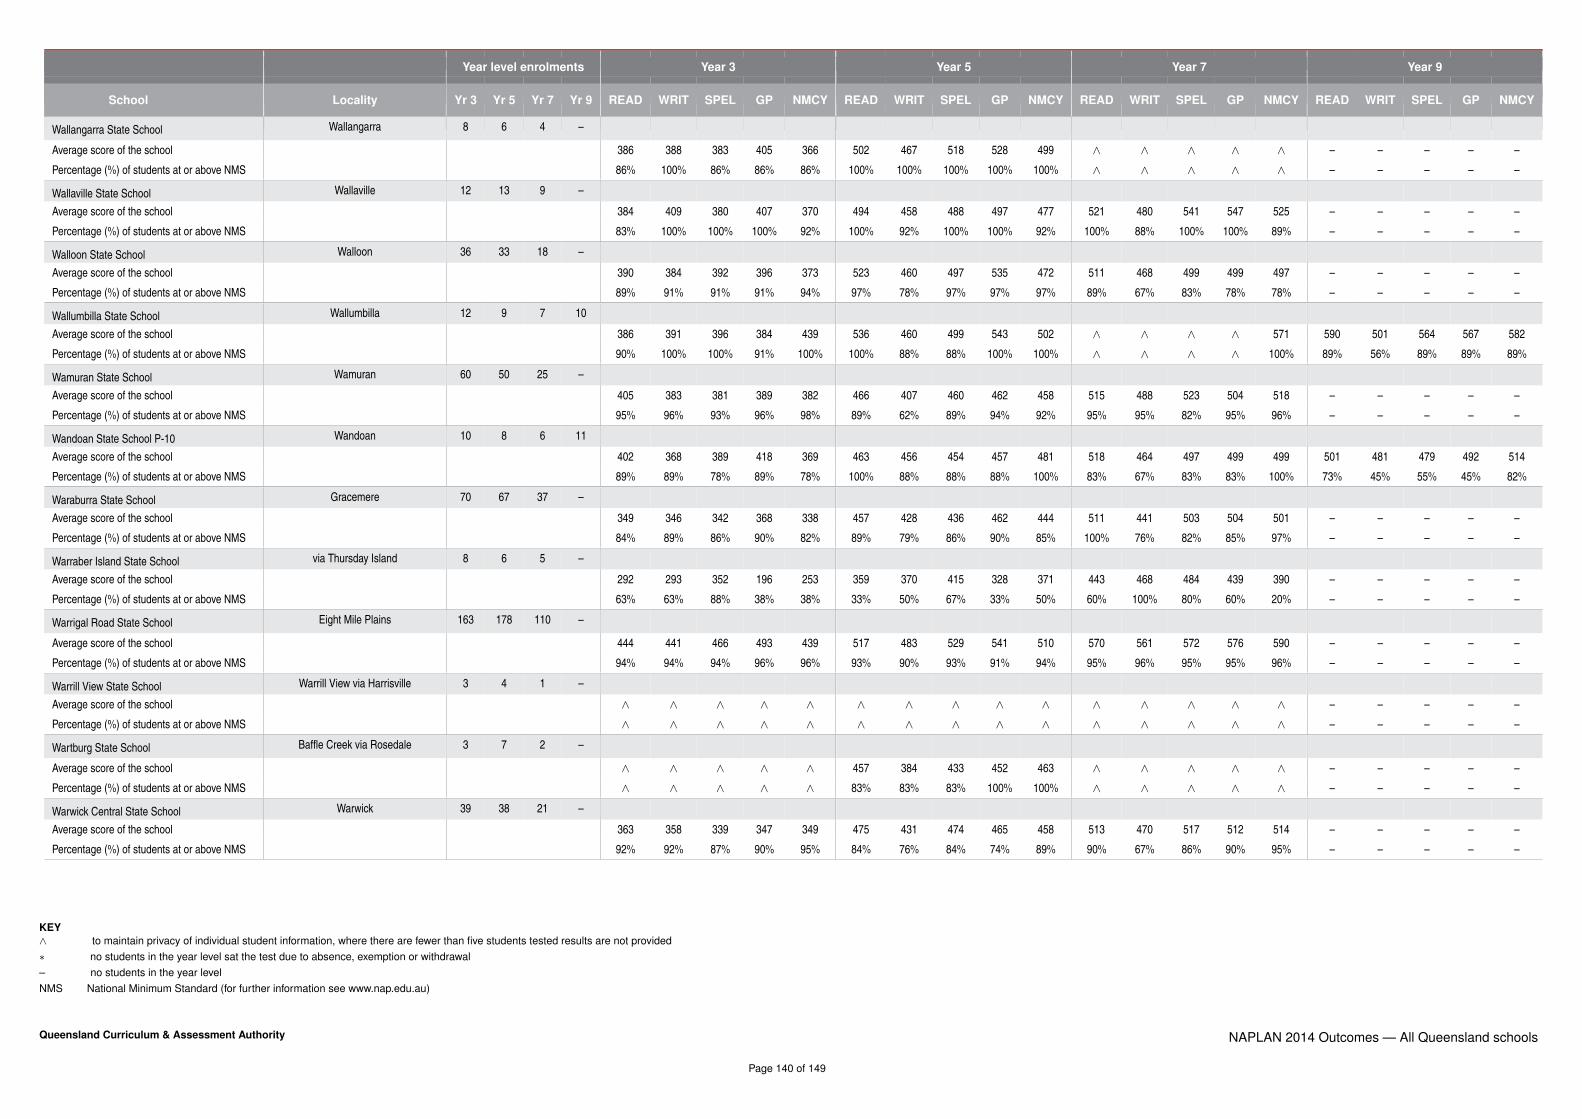
Year level enrolments Year 3 Year 5 Year 7 Year 9
School Locality Yr 3 Yr 5 Yr 7 Yr 9 READ WRIT SPEL GP NMCY READ WRIT SPEL GP NMCY READ WRIT SPEL GP NMCY READ WRIT SPEL GP NMCY
Wallangarra State School Wallangarra 8 6 4 –
Average score of the school 386 388 383 405 366 502 467 518 528 499 ∧ ∧ ∧ ∧ ∧ – – – – –
Percentage (%) of students at or above NMS 86% 100% 86% 86% 86% 100% 100% 100% 100% 100% ∧ ∧ ∧ ∧ ∧ – – – – –
Wallaville State School Wallaville 12 13 9 –
Average score of the school 384 409 380 407 370 494 458 488 497 477 521 480 541 547 525 – – – – –
Percentage (%) of students at or above NMS 83% 100% 100% 100% 92% 100% 92% 100% 100% 92% 100% 88% 100% 100% 89% – – – – –
Walloon State School Walloon 36 33 18 –
Average score of the school 390 384 392 396 373 523 460 497 535 472 511 468 499 499 497 – – – – –
Percentage (%) of students at or above NMS 89% 91% 91% 91% 94% 97% 78% 97% 97% 97% 89% 67% 83% 78% 78% – – – – –
Wallumbilla State School Wallumbilla 12 9 7 10
Average score of the school 386 391 396 384 439 536 460 499 543 502 ∧ ∧ ∧ ∧ 571 590 501 564 567 582
Percentage (%) of students at or above NMS 90% 100% 100% 91% 100% 100% 88% 88% 100% 100% ∧ ∧ ∧ ∧ 100% 89% 56% 89% 89% 89%
Wamuran State School Wamuran 60 50 25 –
Average score of the school 405 383 381 389 382 466 407 460 462 458 515 488 523 504 518 – – – – –
Percentage (%) of students at or above NMS 95% 96% 93% 96% 98% 89% 62% 89% 94% 92% 95% 95% 82% 95% 96% – – – – –
Wandoan State School P-10 Wandoan 10 8 6 11
Average score of the school 402 368 389 418 369 463 456 454 457 481 518 464 497 499 499 501 481 479 492 514
Percentage (%) of students at or above NMS 89% 89% 78% 89% 78% 100% 88% 88% 88% 100% 83% 67% 83% 83% 100% 73% 45% 55% 45% 82%
Waraburra State School Gracemere 70 67 37 –
Average score of the school 349 346 342 368 338 457 428 436 462 444 511 441 503 504 501 – – – – –
Percentage (%) of students at or above NMS 84% 89% 86% 90% 82% 89% 79% 86% 90% 85% 100% 76% 82% 85% 97% – – – – –
Warraber Island State School via Thursday Island 8 6 5 –
Average score of the school 292 293 352 196 253 359 370 415 328 371 443 468 484 439 390 – – – – –
Percentage (%) of students at or above NMS 63% 63% 88% 38% 38% 33% 50% 67% 33% 50% 60% 100% 80% 60% 20% – – – – –
Warrigal Road State School Eight Mile Plains 163 178 110 –
Average score of the school 444 441 466 493 439 517 483 529 541 510 570 561 572 576 590 – – – – –
Percentage (%) of students at or above NMS 94% 94% 94% 96% 96% 93% 90% 93% 91% 94% 95% 96% 95% 95% 96% – – – – –
Warrill View State School Warrill View via Harrisville 3 4 1 –
Average score of the school ∧ ∧ ∧ ∧ ∧ ∧ ∧ ∧ ∧ ∧ ∧ ∧ ∧ ∧ ∧ – – – – –
Percentage (%) of students at or above NMS ∧ ∧ ∧ ∧ ∧ ∧ ∧ ∧ ∧ ∧ ∧ ∧ ∧ ∧ ∧ – – – – –
Wartburg State School Baffle Creek via Rosedale 3 7 2 –
Average score of the school ∧ ∧ ∧ ∧ ∧ 457 384 433 452 463 ∧ ∧ ∧ ∧ ∧ – – – – –
Percentage (%) of students at or above NMS ∧ ∧ ∧ ∧ ∧ 83% 83% 83% 100% 100% ∧ ∧ ∧ ∧ ∧ – – – – –
Warwick Central State School Warwick 39 38 21 –
Average score of the school 363 358 339 347 349 475 431 474 465 458 513 470 517 512 514 – – – – –
Percentage (%) of students at or above NMS 92% 92% 87% 90% 95% 84% 76% 84% 74% 89% 90% 67% 86% 90% 95% – – – – –
KEY∧ to maintain privacy of individual student information, where there are fewer than five students tested results are not provided∗ no students in the year level sat the test due to absence, exemption or withdrawal– no students in the year levelNMS National Minimum Standard (for further information see www.nap.edu.au)
Queensland Curriculum & Assessment Authority
Page 140 of 149
NAPLAN 2014 Outcomes — All Queensland schools

Year level enrolments Year 3 Year 5 Year 7 Year 9
School Locality Yr 3 Yr 5 Yr 7 Yr 9 READ WRIT SPEL GP NMCY READ WRIT SPEL GP NMCY READ WRIT SPEL GP NMCY READ WRIT SPEL GP NMCY
Warwick Christian College Warwick 11 14 6 22
Average score of the school 405 348 386 424 393 512 489 509 538 491 557 545 605 613 543 571 449 553 552 557
Percentage (%) of students at or above NMS 91% 73% 100% 91% 91% 100% 93% 93% 100% 100% 100% 100% 100% 100% 100% 78% 56% 78% 67% 89%
Warwick East State School Warwick 28 24 22 –
Average score of the school 328 348 348 350 333 468 421 477 470 473 569 521 582 598 607 – – – – –
Percentage (%) of students at or above NMS 60% 76% 72% 64% 77% 90% 71% 90% 86% 85% 90% 86% 90% 86% 90% – – – – –
Warwick State High School Warwick – – – 176
Average score of the school – – – – – – – – – – – – – – – 548 521 547 539 548
Percentage (%) of students at or above NMS – – – – – – – – – – – – – – – 82% 66% 83% 77% 89%
Warwick West State School Warwick 69 78 56 –
Average score of the school 435 402 427 454 418 492 408 468 483 457 519 472 496 513 520 – – – – –
Percentage (%) of students at or above NMS 94% 88% 97% 96% 98% 90% 76% 89% 92% 85% 86% 75% 82% 89% 96% – – – – –
Waterford State School Waterford 88 80 56 –
Average score of the school 360 311 341 362 342 447 398 466 444 446 529 485 539 515 513 – – – – –
Percentage (%) of students at or above NMS 75% 70% 79% 83% 87% 77% 55% 79% 75% 78% 96% 86% 96% 85% 89% – – – – –
Waterford West State School Waterford West 83 73 60 –
Average score of the school 350 339 359 347 349 431 400 439 441 440 476 425 492 479 491 – – – – –
Percentage (%) of students at or above NMS 83% 85% 91% 83% 89% 84% 62% 82% 79% 87% 89% 68% 84% 82% 93% – – – – –
Watson Road State School Acacia Ridge 23 18 17 –
Average score of the school 318 290 322 336 304 418 404 456 412 423 476 419 466 473 472 – – – – –
Percentage (%) of students at or above NMS 55% 52% 52% 70% 55% 69% 78% 78% 67% 69% 80% 65% 65% 76% 94% – – – – –
Wavell Heights State School Wavell Heights 64 45 23 –
Average score of the school 421 400 421 440 399 483 456 475 490 477 517 521 537 525 538 – – – – –
Percentage (%) of students at or above NMS 95% 97% 97% 95% 97% 95% 84% 91% 91% 95% 85% 90% 86% 86% 100% – – – – –
Wavell State High School Wavell Heights – – – 279
Average score of the school – – – – – – – – – – – – – – – 580 549 593 575 587
Percentage (%) of students at or above NMS – – – – – – – – – – – – – – – 97% 88% 96% 93% 99%
Weir State School Kirwan Thuringowa 124 94 70 –
Average score of the school 366 344 365 363 352 448 407 443 443 430 517 471 523 509 496 – – – – –
Percentage (%) of students at or above NMS 87% 85% 89% 88% 90% 75% 69% 76% 76% 73% 91% 86% 88% 88% 88% – – – – –
Wellcamp State School Wellcamp via Toowoomba 6 10 5 –
Average score of the school 442 450 433 462 426 549 495 526 520 543 586 552 585 617 592 – – – – –
Percentage (%) of students at or above NMS 100% 100% 100% 100% 100% 100% 100% 100% 100% 100% 100% 100% 100% 100% 100% – – – – –
Wellers Hill State School Wellers Hill 122 96 50 –
Average score of the school 461 428 432 466 431 542 484 515 541 514 594 543 567 608 620 – – – – –
Percentage (%) of students at or above NMS 96% 96% 97% 97% 98% 99% 91% 99% 97% 98% 100% 98% 100% 100% 100% – – – – –
KEY∧ to maintain privacy of individual student information, where there are fewer than five students tested results are not provided∗ no students in the year level sat the test due to absence, exemption or withdrawal– no students in the year levelNMS National Minimum Standard (for further information see www.nap.edu.au)
Queensland Curriculum & Assessment Authority
Page 141 of 149
NAPLAN 2014 Outcomes — All Queensland schools

Year level enrolments Year 3 Year 5 Year 7 Year 9
School Locality Yr 3 Yr 5 Yr 7 Yr 9 READ WRIT SPEL GP NMCY READ WRIT SPEL GP NMCY READ WRIT SPEL GP NMCY READ WRIT SPEL GP NMCY
Wellington Point State High School Wellington Point – – – 218
Average score of the school – – – – – – – – – – – – – – – 556 526 561 540 560
Percentage (%) of students at or above NMS – – – – – – – – – – – – – – – 89% 74% 88% 82% 91%
Wellington Point State School Wellington Point 67 86 51 –
Average score of the school 418 401 403 434 410 511 458 493 505 480 540 504 535 540 526 – – – – –
Percentage (%) of students at or above NMS 100% 100% 98% 98% 100% 98% 94% 95% 98% 94% 94% 85% 93% 91% 93% – – – – –
West End State School West End 109 103 88 –
Average score of the school 466 429 451 476 432 534 473 524 537 520 583 542 565 576 594 – – – – –
Percentage (%) of students at or above NMS 99% 98% 97% 98% 97% 99% 92% 99% 100% 100% 100% 98% 97% 98% 99% – – – – –
West Moreton Anglican College Karrabin 70 79 81 143
Average score of the school 437 410 416 444 410 503 450 485 504 493 557 496 545 557 550 592 571 579 586 599
Percentage (%) of students at or above NMS 97% 100% 98% 97% 97% 97% 90% 95% 97% 97% 96% 85% 95% 91% 100% 100% 84% 93% 97% 100%
Western Cape College - Aurukun Secondary
Campus
Aurukun – – – 4
Average score of the school – – – – – – – – – – – – – – – ∗ ∗ ∗ ∗ ∗Percentage (%) of students at or above NMS – – – – – – – – – – – – – – – ∗ ∗ ∗ ∗ ∗
Western Cape College - Mapoon Weipa 4 2 – –
Average score of the school ∧ ∧ ∧ ∧ ∧ ∧ ∧ ∧ ∧ ∧ – – – – – – – – – –
Percentage (%) of students at or above NMS ∧ ∧ ∧ ∧ ∧ ∧ ∧ ∧ ∧ ∧ – – – – – – – – – –
Western Cape College - Weipa Weipa 78 83 56 86
Average score of the school 352 372 367 383 344 443 436 471 450 434 481 442 494 472 481 495 441 519 496 502
Percentage (%) of students at or above NMS 77% 88% 86% 88% 80% 80% 84% 93% 82% 80% 82% 58% 81% 77% 90% 61% 44% 73% 67% 84%
Western Suburbs State Special School Durack 16 13 12 13
Average score of the school ∗ ∗ ∗ ∗ ∗ ∗ ∗ ∗ ∗ ∗ ∗ ∗ ∗ ∗ ∗ ∗ ∗ ∗ ∗ ∗Percentage (%) of students at or above NMS ∗ ∗ ∗ ∗ ∗ ∗ ∗ ∗ ∗ ∗ ∗ ∗ ∗ ∗ ∗ ∗ ∗ ∗ ∗ ∗
Westmar State School Westmar Meandarra 1 1 1 –
Average score of the school ∧ ∧ ∧ ∧ ∧ ∧ ∧ ∧ ∧ ∧ ∧ ∧ ∧ ∧ ∧ – – – – –
Percentage (%) of students at or above NMS ∧ ∧ ∧ ∧ ∧ ∧ ∧ ∧ ∧ ∧ ∧ ∧ ∧ ∧ ∧ – – – – –
Westside Christian College Goodna – – – 91
Average score of the school – – – – – – – – – – – – – – – 589 563 605 590 610
Percentage (%) of students at or above NMS – – – – – – – – – – – – – – – 94% 89% 96% 91% 98%
Westside Christian College (Alice Street
Campus)
Goodna 59 58 30 –
Average score of the school 416 431 412 435 399 534 493 524 562 514 549 525 553 560 556 – – – – –
Percentage (%) of students at or above NMS 98% 100% 100% 98% 100% 98% 98% 98% 98% 100% 96% 96% 96% 96% 96% – – – – –
KEY∧ to maintain privacy of individual student information, where there are fewer than five students tested results are not provided∗ no students in the year level sat the test due to absence, exemption or withdrawal– no students in the year levelNMS National Minimum Standard (for further information see www.nap.edu.au)
Queensland Curriculum & Assessment Authority
Page 142 of 149
NAPLAN 2014 Outcomes — All Queensland schools
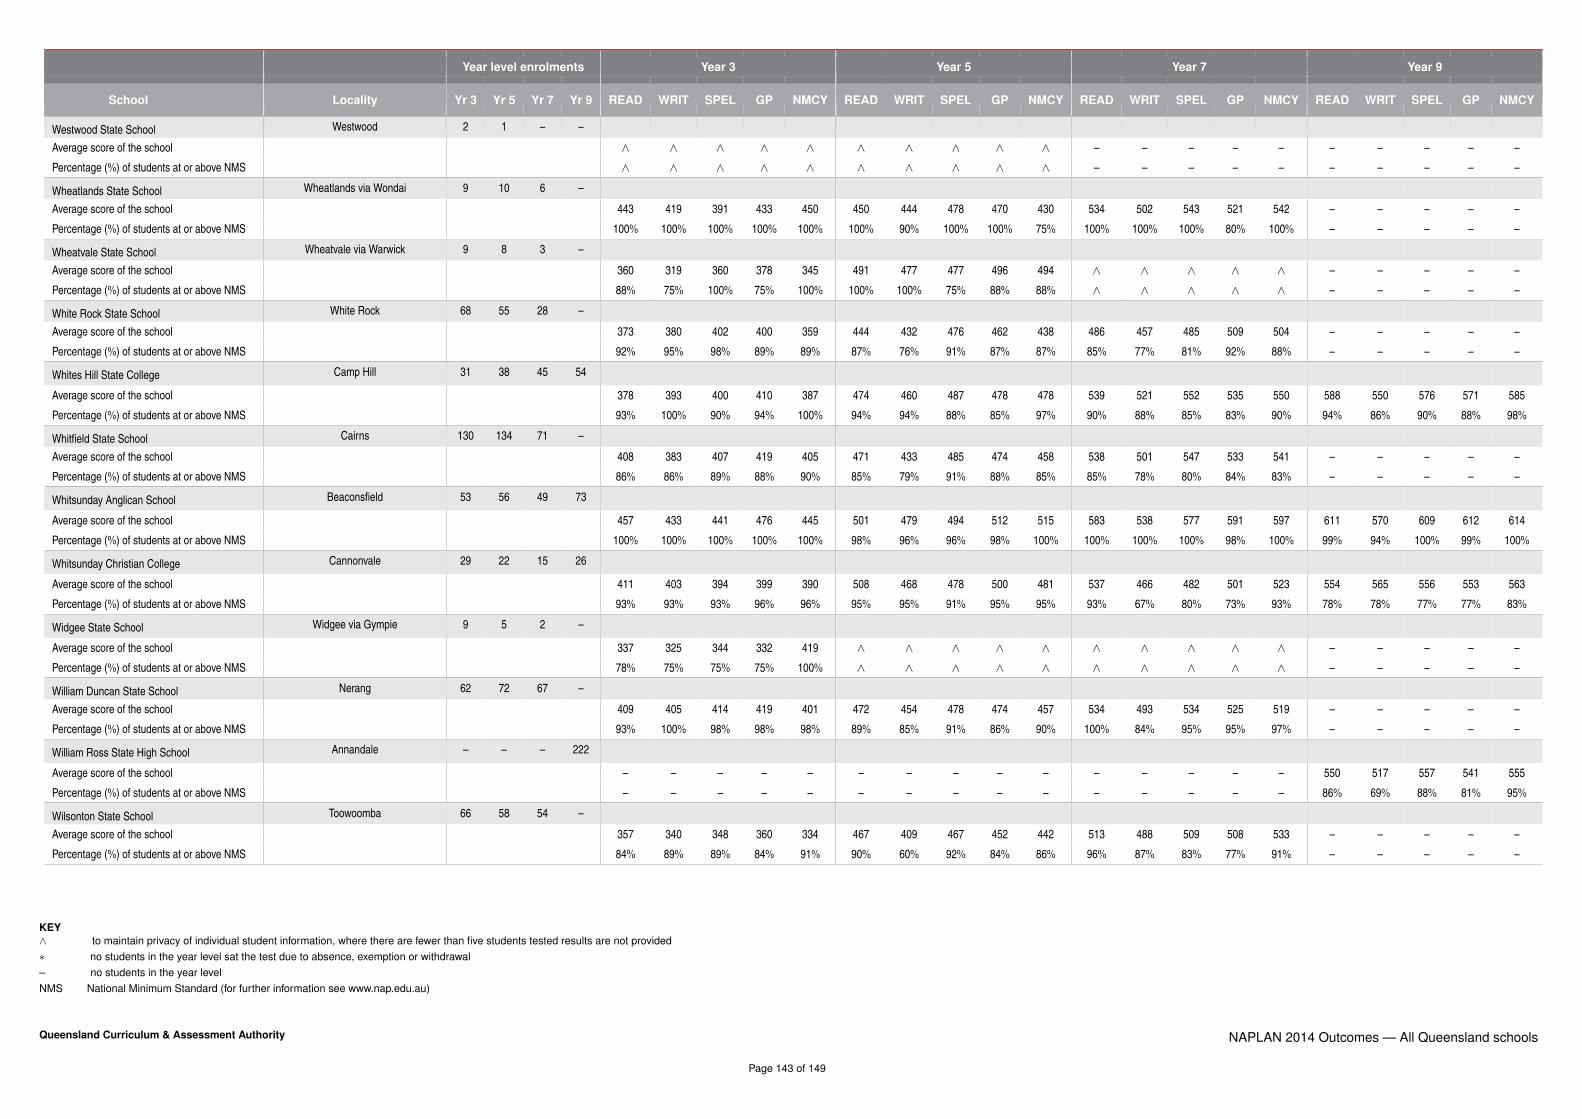
Year level enrolments Year 3 Year 5 Year 7 Year 9
School Locality Yr 3 Yr 5 Yr 7 Yr 9 READ WRIT SPEL GP NMCY READ WRIT SPEL GP NMCY READ WRIT SPEL GP NMCY READ WRIT SPEL GP NMCY
Westwood State School Westwood 2 1 – –
Average score of the school ∧ ∧ ∧ ∧ ∧ ∧ ∧ ∧ ∧ ∧ – – – – – – – – – –
Percentage (%) of students at or above NMS ∧ ∧ ∧ ∧ ∧ ∧ ∧ ∧ ∧ ∧ – – – – – – – – – –
Wheatlands State School Wheatlands via Wondai 9 10 6 –
Average score of the school 443 419 391 433 450 450 444 478 470 430 534 502 543 521 542 – – – – –
Percentage (%) of students at or above NMS 100% 100% 100% 100% 100% 100% 90% 100% 100% 75% 100% 100% 100% 80% 100% – – – – –
Wheatvale State School Wheatvale via Warwick 9 8 3 –
Average score of the school 360 319 360 378 345 491 477 477 496 494 ∧ ∧ ∧ ∧ ∧ – – – – –
Percentage (%) of students at or above NMS 88% 75% 100% 75% 100% 100% 100% 75% 88% 88% ∧ ∧ ∧ ∧ ∧ – – – – –
White Rock State School White Rock 68 55 28 –
Average score of the school 373 380 402 400 359 444 432 476 462 438 486 457 485 509 504 – – – – –
Percentage (%) of students at or above NMS 92% 95% 98% 89% 89% 87% 76% 91% 87% 87% 85% 77% 81% 92% 88% – – – – –
Whites Hill State College Camp Hill 31 38 45 54
Average score of the school 378 393 400 410 387 474 460 487 478 478 539 521 552 535 550 588 550 576 571 585
Percentage (%) of students at or above NMS 93% 100% 90% 94% 100% 94% 94% 88% 85% 97% 90% 88% 85% 83% 90% 94% 86% 90% 88% 98%
Whitfield State School Cairns 130 134 71 –
Average score of the school 408 383 407 419 405 471 433 485 474 458 538 501 547 533 541 – – – – –
Percentage (%) of students at or above NMS 86% 86% 89% 88% 90% 85% 79% 91% 88% 85% 85% 78% 80% 84% 83% – – – – –
Whitsunday Anglican School Beaconsfield 53 56 49 73
Average score of the school 457 433 441 476 445 501 479 494 512 515 583 538 577 591 597 611 570 609 612 614
Percentage (%) of students at or above NMS 100% 100% 100% 100% 100% 98% 96% 96% 98% 100% 100% 100% 100% 98% 100% 99% 94% 100% 99% 100%
Whitsunday Christian College Cannonvale 29 22 15 26
Average score of the school 411 403 394 399 390 508 468 478 500 481 537 466 482 501 523 554 565 556 553 563
Percentage (%) of students at or above NMS 93% 93% 93% 96% 96% 95% 95% 91% 95% 95% 93% 67% 80% 73% 93% 78% 78% 77% 77% 83%
Widgee State School Widgee via Gympie 9 5 2 –
Average score of the school 337 325 344 332 419 ∧ ∧ ∧ ∧ ∧ ∧ ∧ ∧ ∧ ∧ – – – – –
Percentage (%) of students at or above NMS 78% 75% 75% 75% 100% ∧ ∧ ∧ ∧ ∧ ∧ ∧ ∧ ∧ ∧ – – – – –
William Duncan State School Nerang 62 72 67 –
Average score of the school 409 405 414 419 401 472 454 478 474 457 534 493 534 525 519 – – – – –
Percentage (%) of students at or above NMS 93% 100% 98% 98% 98% 89% 85% 91% 86% 90% 100% 84% 95% 95% 97% – – – – –
William Ross State High School Annandale – – – 222
Average score of the school – – – – – – – – – – – – – – – 550 517 557 541 555
Percentage (%) of students at or above NMS – – – – – – – – – – – – – – – 86% 69% 88% 81% 95%
Wilsonton State School Toowoomba 66 58 54 –
Average score of the school 357 340 348 360 334 467 409 467 452 442 513 488 509 508 533 – – – – –
Percentage (%) of students at or above NMS 84% 89% 89% 84% 91% 90% 60% 92% 84% 86% 96% 87% 83% 77% 91% – – – – –
KEY∧ to maintain privacy of individual student information, where there are fewer than five students tested results are not provided∗ no students in the year level sat the test due to absence, exemption or withdrawal– no students in the year levelNMS National Minimum Standard (for further information see www.nap.edu.au)
Queensland Curriculum & Assessment Authority
Page 143 of 149
NAPLAN 2014 Outcomes — All Queensland schools
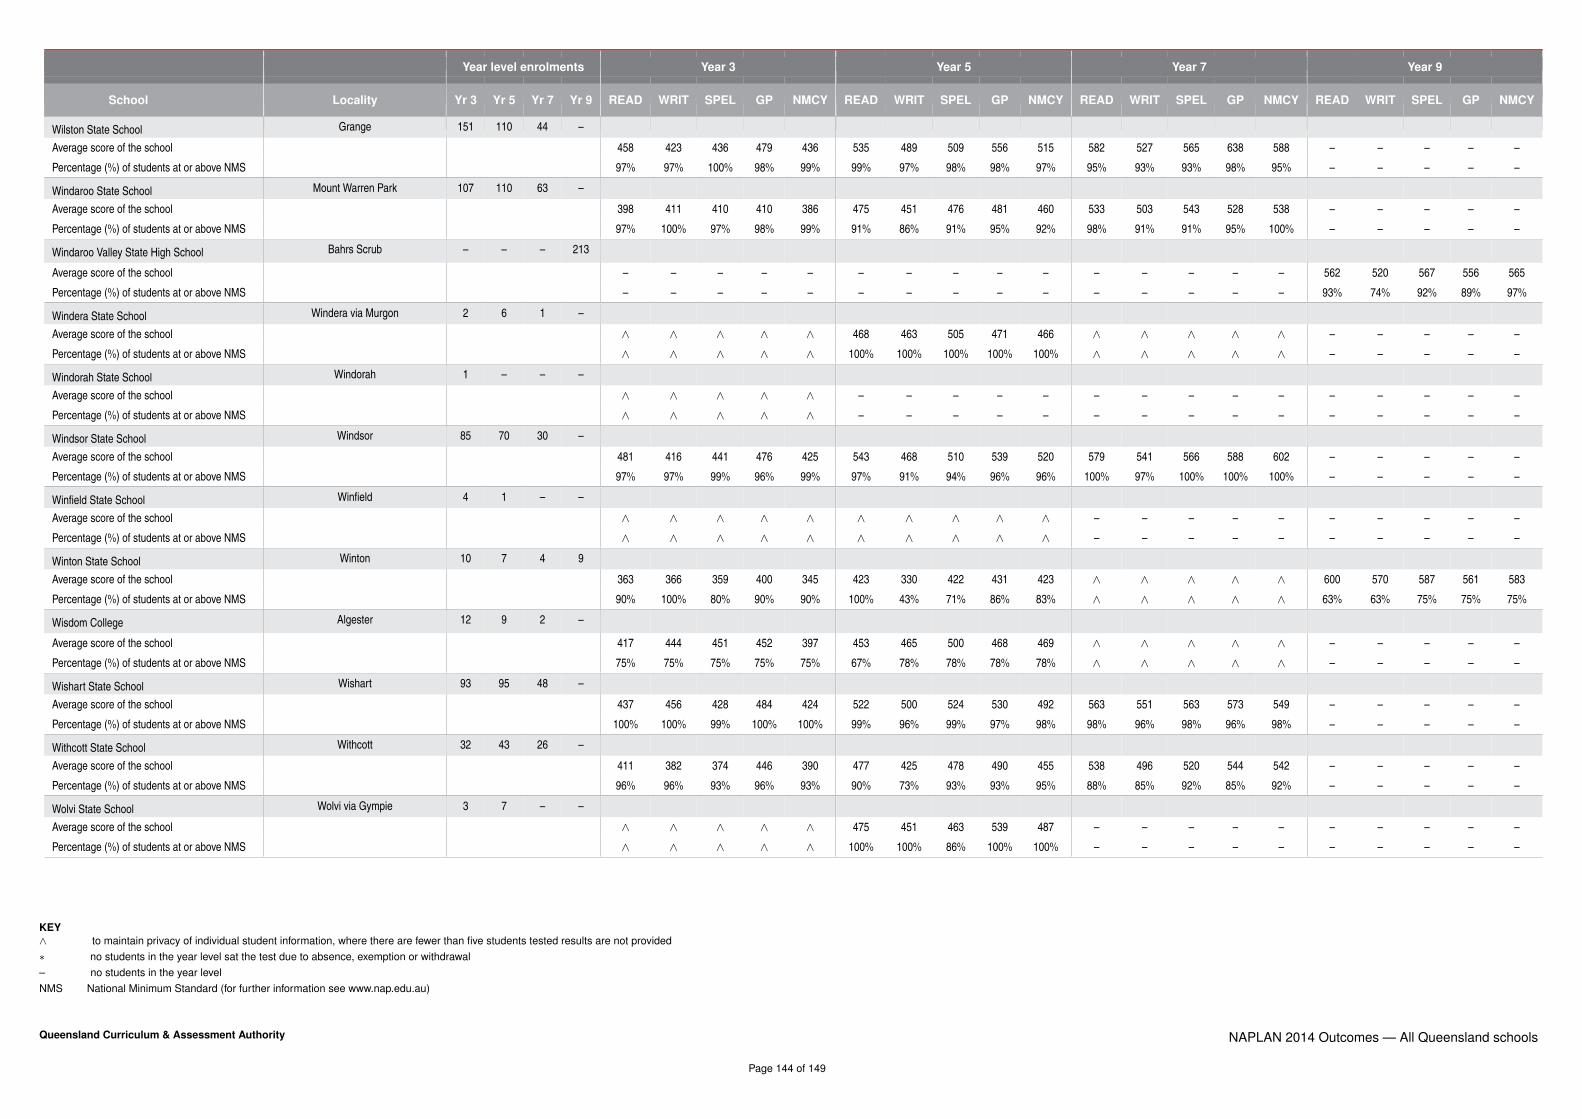
Year level enrolments Year 3 Year 5 Year 7 Year 9
School Locality Yr 3 Yr 5 Yr 7 Yr 9 READ WRIT SPEL GP NMCY READ WRIT SPEL GP NMCY READ WRIT SPEL GP NMCY READ WRIT SPEL GP NMCY
Wilston State School Grange 151 110 44 –
Average score of the school 458 423 436 479 436 535 489 509 556 515 582 527 565 638 588 – – – – –
Percentage (%) of students at or above NMS 97% 97% 100% 98% 99% 99% 97% 98% 98% 97% 95% 93% 93% 98% 95% – – – – –
Windaroo State School Mount Warren Park 107 110 63 –
Average score of the school 398 411 410 410 386 475 451 476 481 460 533 503 543 528 538 – – – – –
Percentage (%) of students at or above NMS 97% 100% 97% 98% 99% 91% 86% 91% 95% 92% 98% 91% 91% 95% 100% – – – – –
Windaroo Valley State High School Bahrs Scrub – – – 213
Average score of the school – – – – – – – – – – – – – – – 562 520 567 556 565
Percentage (%) of students at or above NMS – – – – – – – – – – – – – – – 93% 74% 92% 89% 97%
Windera State School Windera via Murgon 2 6 1 –
Average score of the school ∧ ∧ ∧ ∧ ∧ 468 463 505 471 466 ∧ ∧ ∧ ∧ ∧ – – – – –
Percentage (%) of students at or above NMS ∧ ∧ ∧ ∧ ∧ 100% 100% 100% 100% 100% ∧ ∧ ∧ ∧ ∧ – – – – –
Windorah State School Windorah 1 – – –
Average score of the school ∧ ∧ ∧ ∧ ∧ – – – – – – – – – – – – – – –
Percentage (%) of students at or above NMS ∧ ∧ ∧ ∧ ∧ – – – – – – – – – – – – – – –
Windsor State School Windsor 85 70 30 –
Average score of the school 481 416 441 476 425 543 468 510 539 520 579 541 566 588 602 – – – – –
Percentage (%) of students at or above NMS 97% 97% 99% 96% 99% 97% 91% 94% 96% 96% 100% 97% 100% 100% 100% – – – – –
Winfield State School Winfield 4 1 – –
Average score of the school ∧ ∧ ∧ ∧ ∧ ∧ ∧ ∧ ∧ ∧ – – – – – – – – – –
Percentage (%) of students at or above NMS ∧ ∧ ∧ ∧ ∧ ∧ ∧ ∧ ∧ ∧ – – – – – – – – – –
Winton State School Winton 10 7 4 9
Average score of the school 363 366 359 400 345 423 330 422 431 423 ∧ ∧ ∧ ∧ ∧ 600 570 587 561 583
Percentage (%) of students at or above NMS 90% 100% 80% 90% 90% 100% 43% 71% 86% 83% ∧ ∧ ∧ ∧ ∧ 63% 63% 75% 75% 75%
Wisdom College Algester 12 9 2 –
Average score of the school 417 444 451 452 397 453 465 500 468 469 ∧ ∧ ∧ ∧ ∧ – – – – –
Percentage (%) of students at or above NMS 75% 75% 75% 75% 75% 67% 78% 78% 78% 78% ∧ ∧ ∧ ∧ ∧ – – – – –
Wishart State School Wishart 93 95 48 –
Average score of the school 437 456 428 484 424 522 500 524 530 492 563 551 563 573 549 – – – – –
Percentage (%) of students at or above NMS 100% 100% 99% 100% 100% 99% 96% 99% 97% 98% 98% 96% 98% 96% 98% – – – – –
Withcott State School Withcott 32 43 26 –
Average score of the school 411 382 374 446 390 477 425 478 490 455 538 496 520 544 542 – – – – –
Percentage (%) of students at or above NMS 96% 96% 93% 96% 93% 90% 73% 93% 93% 95% 88% 85% 92% 85% 92% – – – – –
Wolvi State School Wolvi via Gympie 3 7 – –
Average score of the school ∧ ∧ ∧ ∧ ∧ 475 451 463 539 487 – – – – – – – – – –
Percentage (%) of students at or above NMS ∧ ∧ ∧ ∧ ∧ 100% 100% 86% 100% 100% – – – – – – – – – –
KEY∧ to maintain privacy of individual student information, where there are fewer than five students tested results are not provided∗ no students in the year level sat the test due to absence, exemption or withdrawal– no students in the year levelNMS National Minimum Standard (for further information see www.nap.edu.au)
Queensland Curriculum & Assessment Authority
Page 144 of 149
NAPLAN 2014 Outcomes — All Queensland schools

Year level enrolments Year 3 Year 5 Year 7 Year 9
School Locality Yr 3 Yr 5 Yr 7 Yr 9 READ WRIT SPEL GP NMCY READ WRIT SPEL GP NMCY READ WRIT SPEL GP NMCY READ WRIT SPEL GP NMCY
Wondai State School Wondai 14 15 11 9
Average score of the school 400 393 370 389 379 456 384 439 447 442 500 466 479 496 489 532 512 506 542 558
Percentage (%) of students at or above NMS 100% 100% 85% 100% 92% 79% 50% 71% 79% 86% 90% 80% 80% 90% 80% 78% 56% 56% 56% 100%
Wondall Heights State School Manly West 98 87 36 –
Average score of the school 430 395 407 452 401 494 450 480 498 470 540 503 532 545 536 – – – – –
Percentage (%) of students at or above NMS 93% 90% 88% 93% 89% 92% 80% 85% 93% 91% 89% 86% 89% 83% 86% – – – – –
Wonga Beach State School Wonga Beach 21 16 8 –
Average score of the school 447 410 443 456 441 485 445 483 500 493 547 574 529 554 538 – – – – –
Percentage (%) of students at or above NMS 95% 100% 95% 95% 100% 100% 93% 100% 100% 100% 100% 100% 88% 88% 100% – – – – –
WoodLinks State School Collingwood Park 57 35 22 –
Average score of the school 367 346 368 366 353 448 437 468 441 441 517 458 501 472 506 – – – – –
Percentage (%) of students at or above NMS 78% 84% 82% 92% 80% 82% 65% 82% 71% 73% 79% 70% 70% 60% 95% – – – – –
Woodcrest State College Springfield 104 107 75 182
Average score of the school 382 373 411 395 364 456 438 469 472 474 524 487 522 513 518 540 495 549 523 551
Percentage (%) of students at or above NMS 93% 93% 96% 92% 97% 89% 78% 88% 87% 92% 91% 78% 93% 85% 96% 81% 56% 80% 73% 92%
Woodford State School Woodford 41 42 41 51
Average score of the school 345 304 349 346 340 453 406 449 451 439 498 431 482 504 499 523 474 510 509 527
Percentage (%) of students at or above NMS 83% 74% 85% 85% 87% 79% 79% 89% 82% 82% 81% 62% 79% 92% 92% 74% 55% 74% 65% 88%
Woodhill State School Woodhill via Beaudesert 41 16 9 –
Average score of the school 384 380 391 399 367 468 441 476 486 463 537 509 518 530 553 – – – – –
Percentage (%) of students at or above NMS 88% 97% 97% 90% 95% 81% 69% 81% 94% 88% 100% 89% 78% 89% 89% – – – – –
Woodridge North State School Woodridge 68 58 54 –
Average score of the school 360 361 372 377 355 454 452 493 461 448 503 486 512 482 501 – – – – –
Percentage (%) of students at or above NMS 94% 91% 94% 90% 94% 92% 82% 94% 90% 88% 88% 84% 93% 84% 91% – – – – –
Woodridge State High School Woodridge – – – 185
Average score of the school – – – – – – – – – – – – – – – 499 481 512 495 512
Percentage (%) of students at or above NMS – – – – – – – – – – – – – – – 61% 47% 65% 56% 84%
Woodridge State School Logan Central 112 101 75 –
Average score of the school 348 344 351 349 337 443 452 457 446 460 500 474 493 485 490 – – – – –
Percentage (%) of students at or above NMS 86% 89% 89% 89% 91% 86% 85% 84% 85% 86% 92% 78% 80% 88% 91% – – – – –
Woodstock State School Woodstock 10 9 7 –
Average score of the school 392 383 392 423 364 478 455 481 462 448 557 543 549 570 534 – – – – –
Percentage (%) of students at or above NMS 100% 89% 100% 100% 100% 100% 100% 86% 86% 86% 100% 100% 83% 100% 100% – – – – –
Woody Point Special School Woody Point 11 2 – 2
Average score of the school ∗ ∗ ∗ ∗ ∗ ∗ ∗ ∗ ∗ ∗ – – – – – ∗ ∗ ∗ ∗ ∗Percentage (%) of students at or above NMS ∗ ∗ ∗ ∗ ∗ ∗ ∗ ∗ ∗ ∗ – – – – – ∗ ∗ ∗ ∗ ∗
KEY∧ to maintain privacy of individual student information, where there are fewer than five students tested results are not provided∗ no students in the year level sat the test due to absence, exemption or withdrawal– no students in the year levelNMS National Minimum Standard (for further information see www.nap.edu.au)
Queensland Curriculum & Assessment Authority
Page 145 of 149
NAPLAN 2014 Outcomes — All Queensland schools
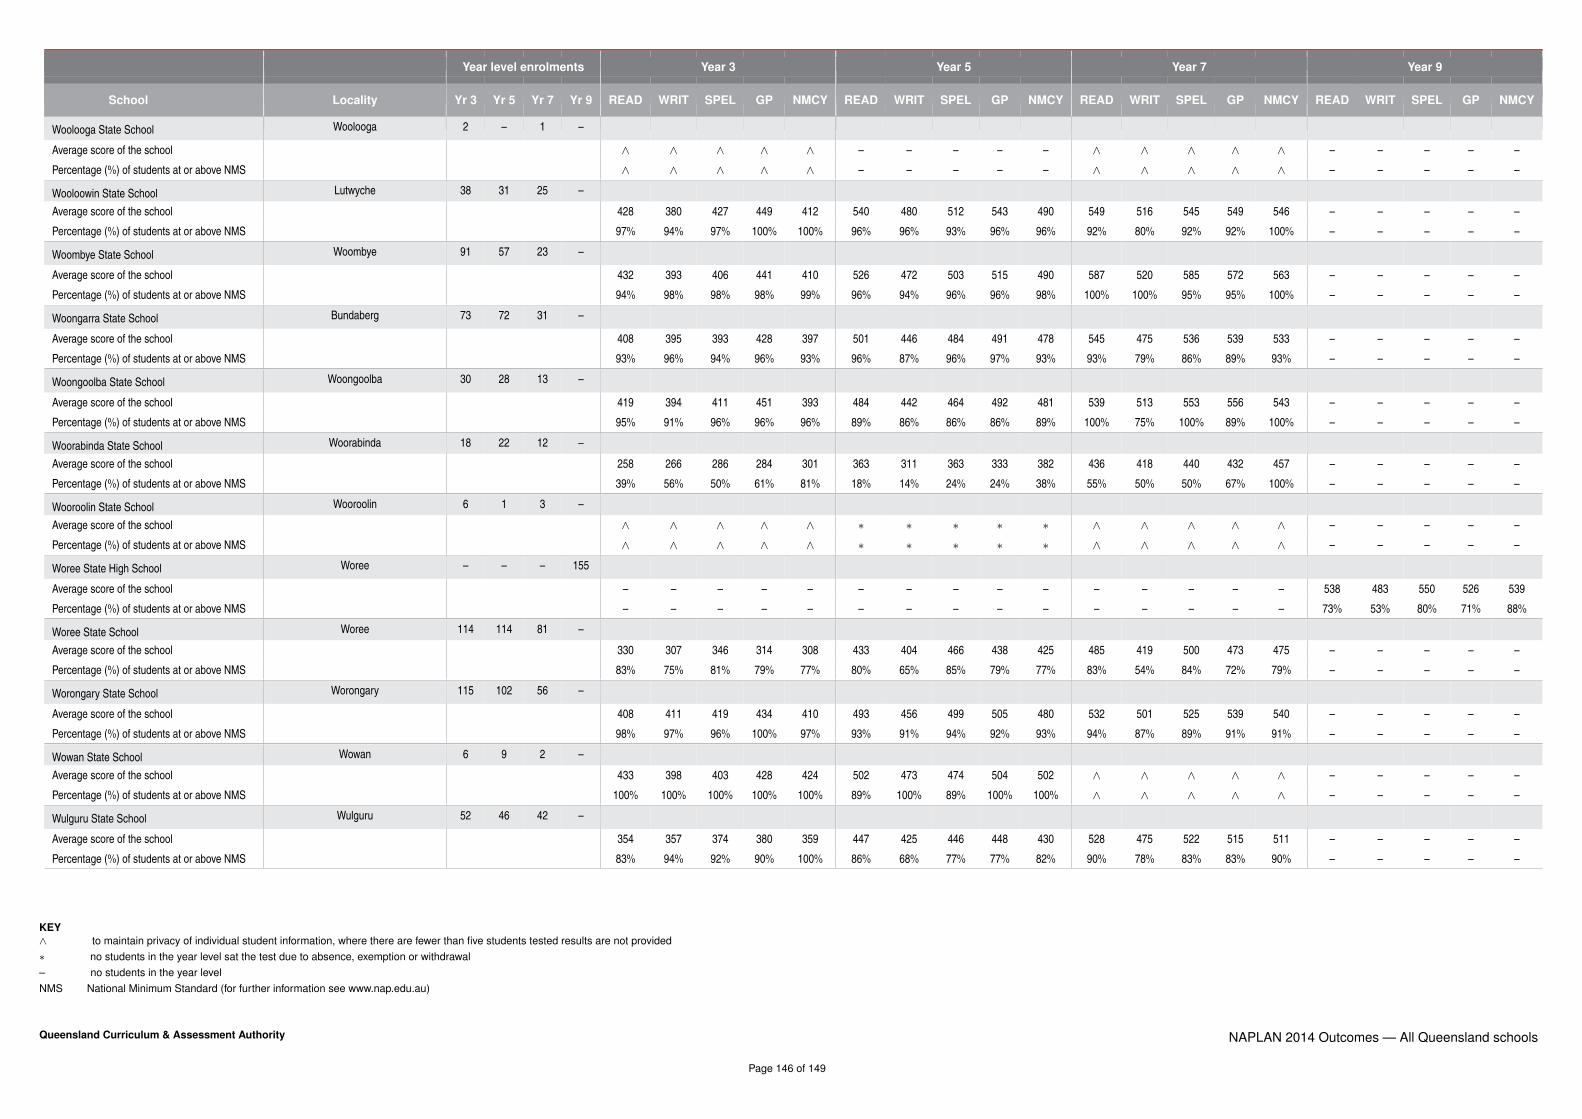
Year level enrolments Year 3 Year 5 Year 7 Year 9
School Locality Yr 3 Yr 5 Yr 7 Yr 9 READ WRIT SPEL GP NMCY READ WRIT SPEL GP NMCY READ WRIT SPEL GP NMCY READ WRIT SPEL GP NMCY
Woolooga State School Woolooga 2 – 1 –
Average score of the school ∧ ∧ ∧ ∧ ∧ – – – – – ∧ ∧ ∧ ∧ ∧ – – – – –
Percentage (%) of students at or above NMS ∧ ∧ ∧ ∧ ∧ – – – – – ∧ ∧ ∧ ∧ ∧ – – – – –
Wooloowin State School Lutwyche 38 31 25 –
Average score of the school 428 380 427 449 412 540 480 512 543 490 549 516 545 549 546 – – – – –
Percentage (%) of students at or above NMS 97% 94% 97% 100% 100% 96% 96% 93% 96% 96% 92% 80% 92% 92% 100% – – – – –
Woombye State School Woombye 91 57 23 –
Average score of the school 432 393 406 441 410 526 472 503 515 490 587 520 585 572 563 – – – – –
Percentage (%) of students at or above NMS 94% 98% 98% 98% 99% 96% 94% 96% 96% 98% 100% 100% 95% 95% 100% – – – – –
Woongarra State School Bundaberg 73 72 31 –
Average score of the school 408 395 393 428 397 501 446 484 491 478 545 475 536 539 533 – – – – –
Percentage (%) of students at or above NMS 93% 96% 94% 96% 93% 96% 87% 96% 97% 93% 93% 79% 86% 89% 93% – – – – –
Woongoolba State School Woongoolba 30 28 13 –
Average score of the school 419 394 411 451 393 484 442 464 492 481 539 513 553 556 543 – – – – –
Percentage (%) of students at or above NMS 95% 91% 96% 96% 96% 89% 86% 86% 86% 89% 100% 75% 100% 89% 100% – – – – –
Woorabinda State School Woorabinda 18 22 12 –
Average score of the school 258 266 286 284 301 363 311 363 333 382 436 418 440 432 457 – – – – –
Percentage (%) of students at or above NMS 39% 56% 50% 61% 81% 18% 14% 24% 24% 38% 55% 50% 50% 67% 100% – – – – –
Wooroolin State School Wooroolin 6 1 3 –
Average score of the school ∧ ∧ ∧ ∧ ∧ ∗ ∗ ∗ ∗ ∗ ∧ ∧ ∧ ∧ ∧ – – – – –
Percentage (%) of students at or above NMS ∧ ∧ ∧ ∧ ∧ ∗ ∗ ∗ ∗ ∗ ∧ ∧ ∧ ∧ ∧ – – – – –
Woree State High School Woree – – – 155
Average score of the school – – – – – – – – – – – – – – – 538 483 550 526 539
Percentage (%) of students at or above NMS – – – – – – – – – – – – – – – 73% 53% 80% 71% 88%
Woree State School Woree 114 114 81 –
Average score of the school 330 307 346 314 308 433 404 466 438 425 485 419 500 473 475 – – – – –
Percentage (%) of students at or above NMS 83% 75% 81% 79% 77% 80% 65% 85% 79% 77% 83% 54% 84% 72% 79% – – – – –
Worongary State School Worongary 115 102 56 –
Average score of the school 408 411 419 434 410 493 456 499 505 480 532 501 525 539 540 – – – – –
Percentage (%) of students at or above NMS 98% 97% 96% 100% 97% 93% 91% 94% 92% 93% 94% 87% 89% 91% 91% – – – – –
Wowan State School Wowan 6 9 2 –
Average score of the school 433 398 403 428 424 502 473 474 504 502 ∧ ∧ ∧ ∧ ∧ – – – – –
Percentage (%) of students at or above NMS 100% 100% 100% 100% 100% 89% 100% 89% 100% 100% ∧ ∧ ∧ ∧ ∧ – – – – –
Wulguru State School Wulguru 52 46 42 –
Average score of the school 354 357 374 380 359 447 425 446 448 430 528 475 522 515 511 – – – – –
Percentage (%) of students at or above NMS 83% 94% 92% 90% 100% 86% 68% 77% 77% 82% 90% 78% 83% 83% 90% – – – – –
KEY∧ to maintain privacy of individual student information, where there are fewer than five students tested results are not provided∗ no students in the year level sat the test due to absence, exemption or withdrawal– no students in the year levelNMS National Minimum Standard (for further information see www.nap.edu.au)
Queensland Curriculum & Assessment Authority
Page 146 of 149
NAPLAN 2014 Outcomes — All Queensland schools

Year level enrolments Year 3 Year 5 Year 7 Year 9
School Locality Yr 3 Yr 5 Yr 7 Yr 9 READ WRIT SPEL GP NMCY READ WRIT SPEL GP NMCY READ WRIT SPEL GP NMCY READ WRIT SPEL GP NMCY
Wyandra State School Wyandra 2 1 – –
Average score of the school ∧ ∧ ∧ ∧ ∧ ∧ ∧ ∧ ∧ ∧ – – – – – – – – – –
Percentage (%) of students at or above NMS ∧ ∧ ∧ ∧ ∧ ∧ ∧ ∧ ∧ ∧ – – – – – – – – – –
Wynnum State High School Manly – – – 174
Average score of the school – – – – – – – – – – – – – – – 553 533 565 549 571
Percentage (%) of students at or above NMS – – – – – – – – – – – – – – – 88% 78% 90% 83% 98%
Wynnum State School Wynnum 97 69 46 –
Average score of the school 399 386 387 409 383 483 432 466 479 474 531 480 504 509 522 – – – – –
Percentage (%) of students at or above NMS 87% 91% 89% 94% 91% 87% 74% 87% 86% 91% 85% 70% 80% 78% 80% – – – – –
Wynnum West State School Wynnum West 80 71 37 –
Average score of the school 397 367 390 396 376 501 447 497 518 484 520 486 524 514 519 – – – – –
Percentage (%) of students at or above NMS 81% 87% 87% 88% 85% 96% 82% 90% 94% 88% 92% 78% 94% 89% 94% – – – – –
Wyreema State School Wyreema 5 8 1 –
Average score of the school ∧ ∧ ∧ ∧ ∧ 511 485 512 507 499 ∗ ∗ ∗ ∗ ∗ – – – – –
Percentage (%) of students at or above NMS ∧ ∧ ∧ ∧ ∧ 100% 100% 100% 100% 100% ∗ ∗ ∗ ∗ ∗ – – – – –
Xavier Catholic College Hervey Bay 89 87 50 121
Average score of the school 411 391 396 402 393 479 461 476 493 471 540 487 531 521 523 553 537 569 557 567
Percentage (%) of students at or above NMS 95% 98% 97% 94% 99% 95% 91% 95% 96% 96% 98% 86% 93% 91% 96% 90% 82% 91% 92% 98%
YMCA Vocational School Kingston – – – 10
Average score of the school – – – – – – – – – – – – – – – 196 ∧ ∧ ∧ 247
Percentage (%) of students at or above NMS – – – – – – – – – – – – – – – 0% ∧ ∧ ∧ 0%
Yam Island State School via Thursday Island 8 8 3 –
Average score of the school 349 392 403 347 311 369 408 421 381 368 ∧ ∧ ∧ ∧ ∧ – – – – –
Percentage (%) of students at or above NMS 88% 100% 100% 88% 100% 38% 88% 75% 50% 25% ∧ ∧ ∧ ∧ ∧ – – – – –
Yandaran State School Yandaran 5 4 – –
Average score of the school ∧ ∧ ∧ ∧ ∧ ∧ ∧ ∧ ∧ ∧ – – – – – – – – – –
Percentage (%) of students at or above NMS ∧ ∧ ∧ ∧ ∧ ∧ ∧ ∧ ∧ ∧ – – – – – – – – – –
Yandina State School Yandina 25 30 – –
Average score of the school 373 364 354 359 364 521 456 483 487 487 – – – – – – – – – –
Percentage (%) of students at or above NMS 91% 100% 86% 91% 100% 100% 85% 96% 89% 96% – – – – – – – – – –
Yangan State School Yangan 15 12 2 –
Average score of the school 417 395 369 403 394 490 464 475 491 460 ∧ ∧ ∧ ∧ ∧ – – – – –
Percentage (%) of students at or above NMS 100% 100% 93% 93% 100% 91% 82% 91% 91% 90% ∧ ∧ ∧ ∧ ∧ – – – – –
Yarrabah State School Yarrabah 52 37 22 36
Average score of the school 299 319 348 306 286 387 396 467 400 375 415 368 471 416 427 453 389 468 443 473
Percentage (%) of students at or above NMS 70% 84% 80% 78% 63% 62% 65% 84% 65% 48% 58% 30% 75% 55% 47% 21% 0% 48% 20% 48%
KEY∧ to maintain privacy of individual student information, where there are fewer than five students tested results are not provided∗ no students in the year level sat the test due to absence, exemption or withdrawal– no students in the year levelNMS National Minimum Standard (for further information see www.nap.edu.au)
Queensland Curriculum & Assessment Authority
Page 147 of 149
NAPLAN 2014 Outcomes — All Queensland schools
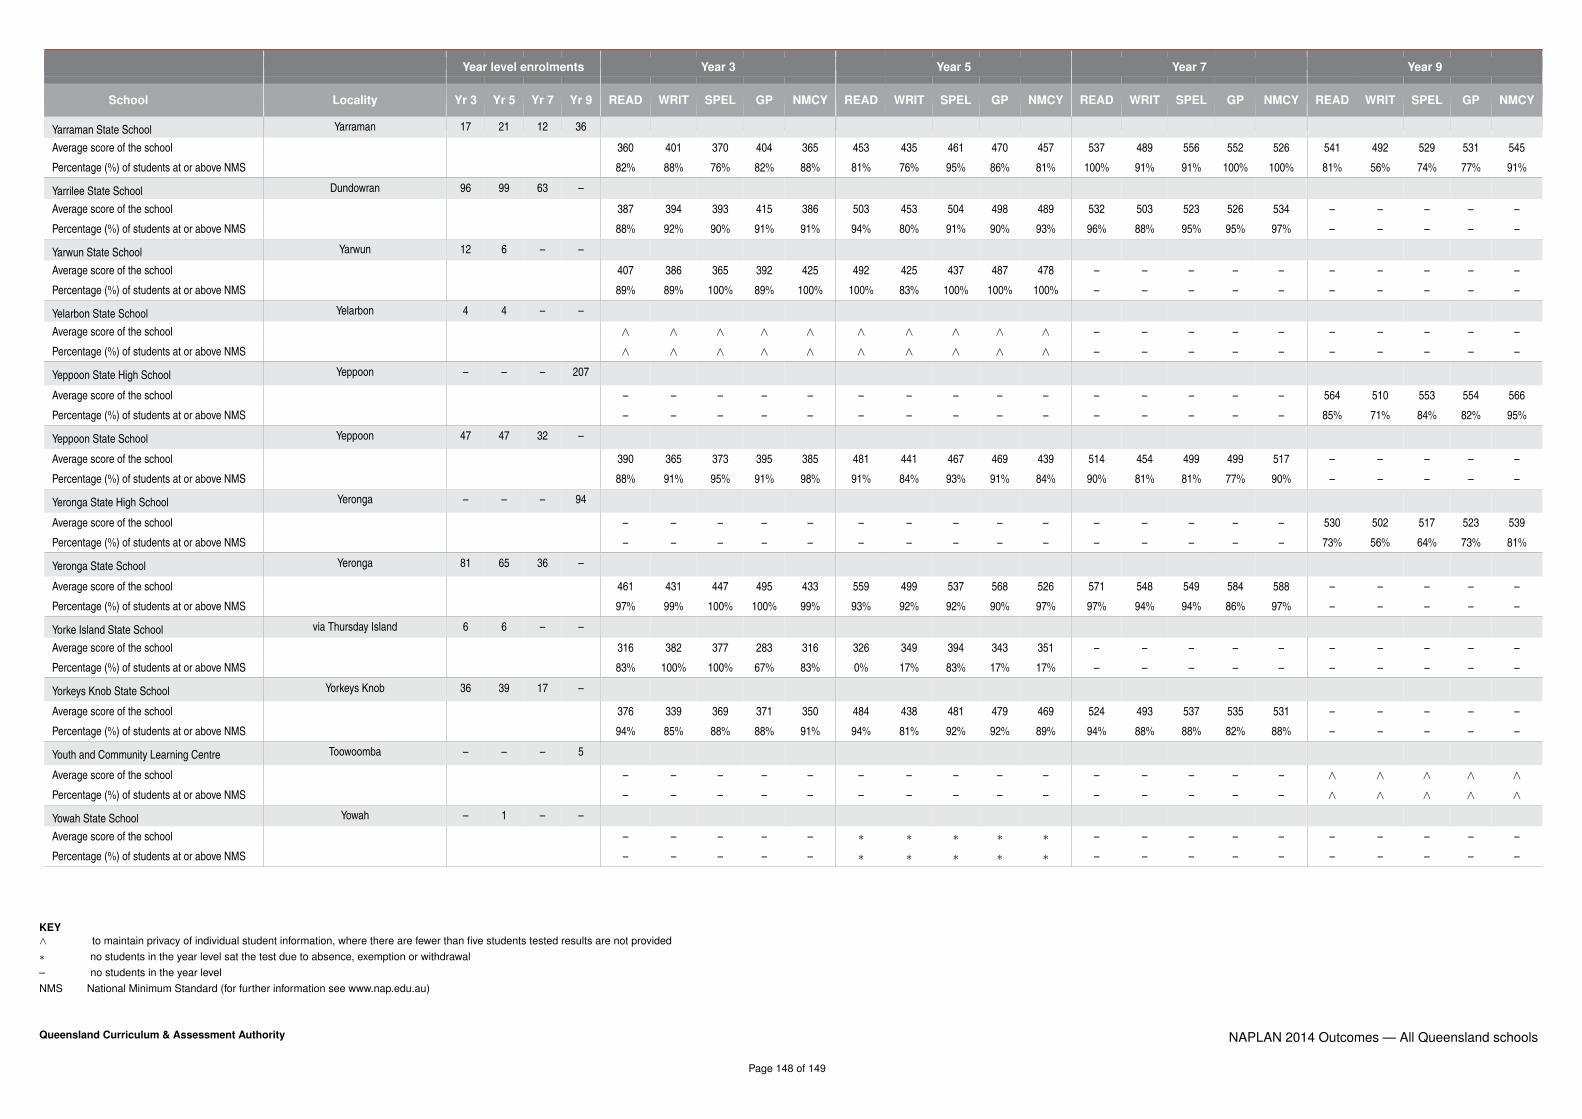
Year level enrolments Year 3 Year 5 Year 7 Year 9
School Locality Yr 3 Yr 5 Yr 7 Yr 9 READ WRIT SPEL GP NMCY READ WRIT SPEL GP NMCY READ WRIT SPEL GP NMCY READ WRIT SPEL GP NMCY
Yarraman State School Yarraman 17 21 12 36
Average score of the school 360 401 370 404 365 453 435 461 470 457 537 489 556 552 526 541 492 529 531 545
Percentage (%) of students at or above NMS 82% 88% 76% 82% 88% 81% 76% 95% 86% 81% 100% 91% 91% 100% 100% 81% 56% 74% 77% 91%
Yarrilee State School Dundowran 96 99 63 –
Average score of the school 387 394 393 415 386 503 453 504 498 489 532 503 523 526 534 – – – – –
Percentage (%) of students at or above NMS 88% 92% 90% 91% 91% 94% 80% 91% 90% 93% 96% 88% 95% 95% 97% – – – – –
Yarwun State School Yarwun 12 6 – –
Average score of the school 407 386 365 392 425 492 425 437 487 478 – – – – – – – – – –
Percentage (%) of students at or above NMS 89% 89% 100% 89% 100% 100% 83% 100% 100% 100% – – – – – – – – – –
Yelarbon State School Yelarbon 4 4 – –
Average score of the school ∧ ∧ ∧ ∧ ∧ ∧ ∧ ∧ ∧ ∧ – – – – – – – – – –
Percentage (%) of students at or above NMS ∧ ∧ ∧ ∧ ∧ ∧ ∧ ∧ ∧ ∧ – – – – – – – – – –
Yeppoon State High School Yeppoon – – – 207
Average score of the school – – – – – – – – – – – – – – – 564 510 553 554 566
Percentage (%) of students at or above NMS – – – – – – – – – – – – – – – 85% 71% 84% 82% 95%
Yeppoon State School Yeppoon 47 47 32 –
Average score of the school 390 365 373 395 385 481 441 467 469 439 514 454 499 499 517 – – – – –
Percentage (%) of students at or above NMS 88% 91% 95% 91% 98% 91% 84% 93% 91% 84% 90% 81% 81% 77% 90% – – – – –
Yeronga State High School Yeronga – – – 94
Average score of the school – – – – – – – – – – – – – – – 530 502 517 523 539
Percentage (%) of students at or above NMS – – – – – – – – – – – – – – – 73% 56% 64% 73% 81%
Yeronga State School Yeronga 81 65 36 –
Average score of the school 461 431 447 495 433 559 499 537 568 526 571 548 549 584 588 – – – – –
Percentage (%) of students at or above NMS 97% 99% 100% 100% 99% 93% 92% 92% 90% 97% 97% 94% 94% 86% 97% – – – – –
Yorke Island State School via Thursday Island 6 6 – –
Average score of the school 316 382 377 283 316 326 349 394 343 351 – – – – – – – – – –
Percentage (%) of students at or above NMS 83% 100% 100% 67% 83% 0% 17% 83% 17% 17% – – – – – – – – – –
Yorkeys Knob State School Yorkeys Knob 36 39 17 –
Average score of the school 376 339 369 371 350 484 438 481 479 469 524 493 537 535 531 – – – – –
Percentage (%) of students at or above NMS 94% 85% 88% 88% 91% 94% 81% 92% 92% 89% 94% 88% 88% 82% 88% – – – – –
Youth and Community Learning Centre Toowoomba – – – 5
Average score of the school – – – – – – – – – – – – – – – ∧ ∧ ∧ ∧ ∧Percentage (%) of students at or above NMS – – – – – – – – – – – – – – – ∧ ∧ ∧ ∧ ∧
Yowah State School Yowah – 1 – –
Average score of the school – – – – – ∗ ∗ ∗ ∗ ∗ – – – – – – – – – –
Percentage (%) of students at or above NMS – – – – – ∗ ∗ ∗ ∗ ∗ – – – – – – – – – –
KEY∧ to maintain privacy of individual student information, where there are fewer than five students tested results are not provided∗ no students in the year level sat the test due to absence, exemption or withdrawal– no students in the year levelNMS National Minimum Standard (for further information see www.nap.edu.au)
Queensland Curriculum & Assessment Authority
Page 148 of 149
NAPLAN 2014 Outcomes — All Queensland schools

Year level enrolments Year 3 Year 5 Year 7 Year 9
School Locality Yr 3 Yr 5 Yr 7 Yr 9 READ WRIT SPEL GP NMCY READ WRIT SPEL GP NMCY READ WRIT SPEL GP NMCY READ WRIT SPEL GP NMCY
Yugumbir State School Regents Park 158 141 78 –
Average score of the school 381 361 390 393 363 462 421 473 471 449 519 469 520 516 516 – – – – –
Percentage (%) of students at or above NMS 95% 91% 94% 97% 89% 87% 73% 89% 88% 87% 96% 84% 93% 90% 97% – – – – –
Yuleba State School Yuleba 2 4 1 –
Average score of the school ∧ ∧ ∧ ∧ ∧ ∧ ∧ ∧ ∧ ∧ ∧ ∧ ∧ ∧ ∧ – – – – –
Percentage (%) of students at or above NMS ∧ ∧ ∧ ∧ ∧ ∧ ∧ ∧ ∧ ∧ ∧ ∧ ∧ ∧ ∧ – – – – –
Yungaburra State School Yungaburra 33 25 24 –
Average score of the school 440 423 431 477 421 554 517 534 571 519 583 537 576 583 592 – – – – –
Percentage (%) of students at or above NMS 97% 100% 100% 100% 100% 100% 100% 96% 100% 100% 100% 95% 95% 100% 100% – – – – –
Zillmere State School Zillmere 14 11 4 –
Average score of the school 412 393 387 429 433 469 512 528 530 479 ∧ ∧ ∧ ∧ ∧ – – – – –
Percentage (%) of students at or above NMS 100% 100% 100% 100% 100% 100% 100% 100% 100% 100% ∧ ∧ ∧ ∧ ∧ – – – – –
KEY∧ to maintain privacy of individual student information, where there are fewer than five students tested results are not provided∗ no students in the year level sat the test due to absence, exemption or withdrawal– no students in the year levelNMS National Minimum Standard (for further information see www.nap.edu.au)
Queensland Curriculum & Assessment Authority
Page 149 of 149
NAPLAN 2014 Outcomes — All Queensland schools