Namibia and SADC Free Trade Area: Maximising Export ...
70
University of Cape Town i Namibia and SADC Free Trade Area: Maximising Export Opportunities? A Research Report Presented to The Graduate School of Business University of Cape Town In fulfilment of the requirements for the degree of Master in Commerce in Management Practice, Specialising in Trade Law and Policy By Joseph Halwoodi – HLWJOS002 Date: 25 September 2015 Supervisor: Paul Kalenga
Transcript of Namibia and SADC Free Trade Area: Maximising Export ...

Univers
ity of
Cap
e Tow
n
i
Namibia and SADC Free Trade Area: Maximising Export
Opportunities?
A Research Report
Presented to
The Graduate School of Business
University of Cape Town
In fulfilment of the requirements for the degree of
Master in Commerce in Management Practice,
Specialising in Trade Law and Policy
By
Joseph Halwoodi – HLWJOS002
Date: 25 September 2015
Supervisor: Paul Kalenga

The copyright of this thesis vests in the author. No quotation from it or information derived from it is to be published without full acknowledgement of the source. The thesis is to be used for private study or non-commercial research purposes only.
Published by the University of Cape Town (UCT) in terms of the non-exclusive license granted to UCT by the author.
Univers
ity of
Cap
e Tow
n

ii
ABSTRACT
The SADC Treaty 1992 established the Southern African Development Community (SADC) with the purpose of building
an integrated regional economic community. The approach taken is to conclude Protocols in each area of co-operation.
In the areas of economic and trade liberalization, a Protocol on Trade entered into force in 2000. The purpose of the
Protocol is to establish a free trade area (FTA). The SADC FTA was formally launched in August 2008, when twelve SADC
Member States phased out their tariffs covering substantial all intra-SADC trade.
Namibia has been part of the SADC FTA since its inception. This research study examines the SADC FTA and its
importance to Namibia by assessing the extent to which the SADC FTA has maximized export opportunities for Namibia
to the region. It also identifies existing constraints that Namibia’s exporters have been experiencing in accessing the
SADC market, and provides recommendations on how Namibia can further exploit market opportunities created by the
SADC FTA.
The study analysed Namibia’s export data to the SADC market for the period of 2000 to 2012. Secondary data obtained
through internet sources, books, publications, journals, and articles were also utilised to supplement the desktop
review. The study found that there has been an increase in exports to the SADC market, but mainly to South Africa,
Angola and Democratic Republic of the Congo (DRC). South Africa has remained a top export destination for Namibian
products to the region. However, this increased exports to South Africa cannot be attributed to intra-SADC tariff
liberalization. Trade between South Africa and Namibia has already been duty free because of their membership to the
Southern African Customs Union (SACU). Angola and DRC emerged as other major export destinations for Namibia,
although they are not party to the SADC FTA. Namibia exports still face MFN tariffs and non-tariff barriers to these
markets.
The study also found that most SADC countries participating in the FTA have backloaded the tariff liberalization of
sensitive products towards the end of the phase down periods (2012). Most of these sensitive products are those that
the region, including Namibia, has the capacity to produce. Therefore, the study concludes that Namibian exports to
the majority of SADC countries have not been maximized over the 2000 - 2012 period as sensitive products were still
facing tariff and non-tariff barriers. The increase in Namibian exports to South Africa, Angola and DRC, suggests that
there is a potential to increase exports to other SADC markets. There is also a potential to increase Namibia’s trade
with Angola and DRC, if these countries fully participate in the SADC FTA.
Namibian exporters are experiencing high transport cost, cumbersome customs procedures and other non-tariff
barriers, including on cement, dairy and milling products. More specifically, harmonization of customs procedures,
simplification of the SADC rules of origin, implementation of non-tariff barriers commitments, streamlining border
management issues including improvement of trade-related infrastructure provisions have high potential to unlock the
exports opportunities for Namibian products to the SADC region.
This is notwithstanding the fact that Namibia’s structure and pattern of trade place substantial constraints on the
expansion of regional exports. Namibia will need to diversify its productive base away from heavy dependence on
primary commodities in order to maximise export opportunities created by the SADC FTA. This study concludes that, to

iii
maximise the trade opportunity in the SADC FTA, tariff liberalization should be accompanied by measures to address
gaps in trade facilitation and productive competitiveness in the region. These findings pose important lessons for
Namibia’s trade policy in the context of the SADC regional integration process.
Keywords: exports, imports, Southern African Customs Union (SACU), and the Southern African Development
Community (SADC)

iv
TABLE OF CONTENTS
ABSTRACT .......................................................................................................................... II
TABLE OF CONTENTS .................................................................................................................... IV
LIST OF FIGURES .......................................................................................................................... V
LIST OF TABLES ......................................................................................................................... VI
ACRONYMS ........................................................................................................................ VII
PLAGIARISM DECLARATION .......................................................................................................... IX
ACKNOWLEDGMENTS .................................................................................................................... X
CHAPTER 1: INTRODUCTION .........................................................................................................11
1.1 Introduction and Background....................................................................................................................... 11
1.2 The research context .................................................................................................................................... 14
1.3 Methodology ......................................................................................................................................... 15
CHAPTER 2: LITERATURE REVIEW .................................................................................................17
2.2 Empirical Perspectives .................................................................................................................................. 20
CHAPTER 3: THE ECONOMY OF NAMIBIA AND SADC ........................................................................................ 27
3.1 Introduction ......................................................................................................................................... 27
3.2 The Economy of Namibia .............................................................................................................................. 27
3.3 The Economy of the SADC Region ................................................................................................................ 32
CHAPTER 4: THE SADC FTA IN PERSPECTIVE ...................................................................................................... 37
4.1 Introduction ......................................................................................................................................... 37
4.2 Tariff Liberalization in the SADC FTA ........................................................................................................... 39
CHAPTER 5: RESULTS OF THE STUDY .................................................................................................................. 49
CHAPTER 6: DISCUSSION .................................................................................................................................... 56
CHAPTER 7: CONCLUSION AND RECOMMENDATIONS ..................................................................59
7.1 Conclusions ......................................................................................................................................... 59
REFERENCES .........................................................................................................................63
APPENDIX A .........................................................................................................................66
Research Questionnaire on Namibia and SADC FTA: Maximizing Export ............................................................ 66
Opportunities ......................................................................................................................................... 66

v
LIST OF FIGURES
Figure 1: Membership of both SACU and SADC
Figure 2: Industries Contribution to GDP 2007 – 2014
Figure 3: Primary Sector Real Growth 2001-2012
Figure 4: Secondary sector real growth 2001-2012
Figure 5: Tertiary sector real growth 2001-2012
Figure 6: Total exports and imports comparison
Figure 7: Namibia’s exports to SADC
Figure 8: Namibia’s exports to SADC excluding South Africa

vi
LIST OF TABLES
Table 1: Proposed product categories and liberalization procedures
Table 2: Regional GDP countries share in SADC
Table 3: Sectors’ contribution to DGP
Table 4: Total aggregated SADC real (GDP) growth rates
Table 5: Summary of Bilateral/regional trade agreements
Table 6: SADC Offer without South Africa
Table 7: SADC Offer to South Africa
Table 8: Sensitive products by some SADC countries
Table 9: NTBs to trade reported by SADC Member States
Table 10: Trade Related Administrative NTBs
Table 11: Customs Documentation and Clearance Procedures
Table 12: Namibia’s total exports and imports
Table 13: Top 10 products Namibia exported (in N$) to SADC in 2000
Table 14: Top 10 products Namibia exported (in N$) to SADC in 2008
Table 15: Top 10 products Namibia exported (in N$) to SADC in 2012

vii
ACRONYMS
ACFTA ASEAN-China Free Trade Area
AGOA African Growth and Opportunity Act
ASEAN Association of Southeast Asian Nations
ATPA Andean Trade Preferences Act
CBI Caribbean Basin Initiative
CET Common External Tariff
CMA Common Monetary Area
CMT Committee of Ministers responsible for Trade
COMESA Common Market for Eastern and Southern Africa
CU Customs Union
DFQF Duty Free Quota Free
DRC Democratic Republic of Congo
EAC East African Community
EC European Commission
EFTA European Free Trade Area
EPA Economic Partnership Agreement
EU European Union
GATT General Agreement on Tariff and Trade
GDP Gross Domestic Product
GSP Generalised System of Preferences
FLS Frontline States
FTA Free Trade Area
HS Harmonized System
IPPR Institute for Public Policy and Research
IPRs Intellectual Property Rights
LDC Least Developed Country
MERCOSUR Common Market of the South
MFN Most Favoured Nation
MMTZ Malawi, Mozambique, Tanzania and Zambia
MS Member States
MTI Ministry of Trade and Industry
NAFTA North American Free Trade Area
NEPRU Namibia Economic Policy Research Unit
NES Not Elsewhere Specified
NPC National Planning Commission
NSA Namibia Statistics Agency
NTB Non-Tariff Barrier
NTF Namibia Trade Forum
OECD Organization of Economic Cooperation and Development

viii
PTA Preferential Trade Agreement
RECs Regional Economic Communities
RISDP Regional Indicative Strategic Development Plan
ROO Rules of Origin
SAA Stabilization and Association Agreement
SACU Southern African Customs Union
SACUA SACU Agreement
SADC Southern African Development Community
SADCC Southern African Development Coordinating Conference
SARS South African Revenue Service
SATH Southern Africa Trade Hub
SI Statutory Instrument
TBT Technical Barriers to Trade
TDCA Trade and Development Cooperation Agreement
TIFI Trade, Industry, Finance and Investment
TNF Trade Negotiations Forum
TP Trade Protocol
TPR Trade Policy Review
US United States
USAID United States Agency for International Development
WTO World Trade Organization
ZIMRA Zimbabwe Revenue Authority

ix
PLAGIARISM DECLARATION
1. I know that plagiarism is wrong. Plagiarism is to use another’s work and pretend that it is your own.
2. I have used a recognized convention for citation and referencing. Each significant contribution and quotation
from the works of other individuals has been attributed, cited and referenced.
3. I certify that this submission is all my own work.
4. I have not allowed and will not allow anyone to copy this essay with the intention of passing it off as their own
work.
Signature: Date: 25 September 2015 Signature Removed

x
ACKNOWLEDGMENTS
The information presented in this paper was a result of collaborative exercise with a large number of stakeholders. I
would therefore like to extend my appreciation to everyone who contributed to the drafting of this paper, in particular
my supervisor, Paul Kalenga for his guidance and invaluable advice. Without you, I would not have finalised my
dissertation. Thanks, a million Paul and God bless you always!
I wish to thank my wife Veronica, my children, Tulela and Tulonga who have brought joy to my life and have been
steady hands to steer me through my academic career. I owe much to them.
I am indebted to my friends Eliakim and Evaristus who supported me throughout my studies. Thank you both of you I
am very proud of what we have achieved together.
Finally, I would also like to thank the Namibian government institutions and the private sector for availing information
as well as their valuable inputs to this paper.

11
CHAPTER 1: INTRODUCTION
1.1 Introduction and Background
In 1992, the Windhoek Declaration and Treaty established the Southern African Development
Community (SADC) with the objective to promote sustainable economic growth and socio-
economic development in the region. As indicated in Figure 1 below, SADC consists of fifteen
Member States1. Amongst others, the Treaty covers aspects related to trade and economic
liberalisation. Article 5(2)d of the SADC Treaty provides for the development of policies aimed at
the progressive elimination of obstacles to the free movement of goods and services, capital,
labour as well as people among Member States. In addition, Articles 21 (3) and 22 provide for the
cooperation in a number of areas, including trade, industry, finance and investment and
conclusions of such Protocols as may be necessary in each area of cooperation.
Figure 1 shows the membership of both SACU and SADC
Source: WTO, 2007
In the areas of economic and trade liberalization, a Protocol on Trade was adopted and signed on
24 August 1996 by the Governments of Botswana, Lesotho, Malawi, Mauritius, Mozambique,
1The current membership of SADC is composed of Angola, Botswana, Democratic Republic of Congo (DRC), Lesotho,
Madagascar, Malawi, Mauritius, Mozambique, Namibia, Seychelles, South Africa, Swaziland, Tanzania, Zambia and
Zimbabwe.

12
Namibia, South Africa, Swaziland, the United Republic of Tanzania, Zambia and Zimbabwe.. This
protocol entered into force on 25 January 2000. The actual implementation of the Protocol
started on 1 September 2000 with the aim of establishing a Free Trade Area (FTA) by 2008.
Article 2 of the SADC Protocol on Trade outlines the objectives as follows:
To further liberalize intra-regional trade in goods and services on the basis of
fair, mutually equitable and beneficial trade arrangements, complemented by
Protocols in other areas;
To ensure efficient production within SADC reflecting the current and dynamic
comparative advantages of its Members;
To contribute towards the improvements of the climate for domestic cross-
border and foreign investment;
To enhance the economic development, diversification and industrialisation of
the Region; and
To establish a Free Trade Area in the SADC region
The Protocol on Trade and the Agreement Amending the Protocol were notified to the World
Trade Organization (WTO) on 2 August 2004 by the Parties under the provision of Article XXIV: 7
(a) of the General Agreement on Tariff and Trade (GATT) 1994. On 1 October 2004, the Council
for Trade in Goods adopted the terms of reference for the assessment of the Protocol and
circulated the text of the Protocol as well as the Amendment Protocol to members of the WTO
(WTO, 2007).
The scope and tariff liberalization modalities are set out in Part Two, Article 3 of the SADC
Protocol on Trade. Specifically, Article 3.1 (b) of the Protocol sets an eight-year timeframe after
entry into force of the Protocol, resulting into gradual elimination of barriers to trade. The aim is
to eliminate barriers to intra-SADC trade with the ultimate goal of establishing a free trade area.
The SADC FTA only came into effect in August 2008, enabling free trade of up to 85% tariff lines
obtaining a duty-free status. However, during the implementation process, some Member States
needed different timeframes to account for differences in levels of economic development, to
reach the FTA stage. SADC Member States, with the exception of Mozambique, submitted a tariff
schedule indicating that by January 2012 the implementation of the Protocol would be finalised.
Mozambique’s tariff phase down schedule would be completed by 2015.
13
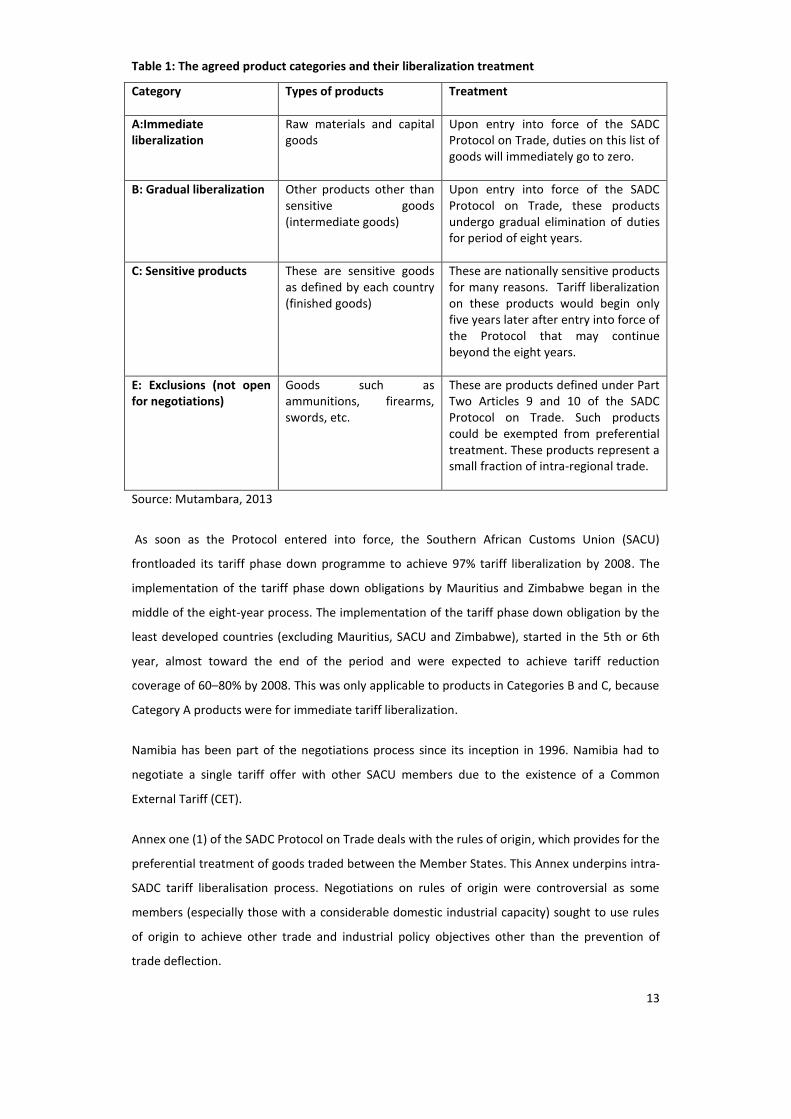
Table 1: The agreed product categories and their liberalization treatment
Category Types of products Treatment
A:Immediate liberalization
Raw materials and capital goods
Upon entry into force of the SADC Protocol on Trade, duties on this list of goods will immediately go to zero.
B: Gradual liberalization Other products other than sensitive goods (intermediate goods)
Upon entry into force of the SADC Protocol on Trade, these products undergo gradual elimination of duties for period of eight years.
C: Sensitive products These are sensitive goods as defined by each country (finished goods)
These are nationally sensitive products for many reasons. Tariff liberalization on these products would begin only five years later after entry into force of the Protocol that may continue beyond the eight years.
E: Exclusions (not open for negotiations)
Goods such as ammunitions, firearms, swords, etc.
These are products defined under Part Two Articles 9 and 10 of the SADC Protocol on Trade. Such products could be exempted from preferential treatment. These products represent a small fraction of intra-regional trade.
Source: Mutambara, 2013
As soon as the Protocol entered into force, the Southern African Customs Union (SACU)
frontloaded its tariff phase down programme to achieve 97% tariff liberalization by 2008. The
implementation of the tariff phase down obligations by Mauritius and Zimbabwe began in the
middle of the eight-year process. The implementation of the tariff phase down obligation by the
least developed countries (excluding Mauritius, SACU and Zimbabwe), started in the 5th or 6th
year, almost toward the end of the period and were expected to achieve tariff reduction
coverage of 60–80% by 2008. This was only applicable to products in Categories B and C, because
Category A products were for immediate tariff liberalization.
Namibia has been part of the negotiations process since its inception in 1996. Namibia had to
negotiate a single tariff offer with other SACU members due to the existence of a Common
External Tariff (CET).
Annex one (1) of the SADC Protocol on Trade deals with the rules of origin, which provides for the
preferential treatment of goods traded between the Member States. This Annex underpins intra-
SADC tariff liberalisation process. Negotiations on rules of origin were controversial as some
members (especially those with a considerable domestic industrial capacity) sought to use rules
of origin to achieve other trade and industrial policy objectives other than the prevention of
trade deflection.

14
Rules of origin are the key components of any preferential trade arrangements to ensure that
only goods originating from members of the integration arrangements qualify for tariff
preferences. In a free trade area, trade deflection can occur especially when a member of the
FTA belongs to a Customs Union that has a common external tariff. What it means is that joining
an FTA, would result in trade deflection as the new free trade agreement may cause a shift in
imports from cheaper countries to expensive countries.
In the case of SADC, rules were initially simple in nature and easy to apply. However, a major step
was taken to complicate SADC rules of origin by adding more details to follow a product-specific
approach or line-by-line rules of origin that are currently being applied in SADC similar to those in
the industrialized nations such as the European Union (EU) and those applied in the EU-South
Africa Free Trade Agreement. The majority of the SADC Member States view these rules of origin
as restrictive rules as they go outside the parameters of preventing transhipment from other
countries (third countries) to act as a protectionist measure aimed at protecting existing
domestic industries from increased intra-regional competition. For the products to qualify for
SADC tariff preferences, they should either:
undergone a single change of tariff heading, or
contain non-SADC imported materials worth no more than 65 percent of the
net cost of the good (a regional content of 35 percent of net cost) or
no more than 60 per cent of the ex-works price of the good (regional content of
40 percent).
These rules of origin make it difficult for Member States to source their input requirements from
low-cost sources, thereby restricting trade, increasing transaction costs and diminishing
producers’ flexibility and making SADC less attractive region for domestic and foreign investment
(Brenton, Flatters and Kalenga, 2005).
1.2 The research context
Namibia is part of the SADC FTA, but the extent to which this FTA has maximised Namibia export
opportunities is not known. In addition, there is little knowledge about the constraints that
Namibia’s exporters face in accessing the SADC market. The purpose of this research is to
examine the SADC FTA and its importance to Namibia by assessing the extent to which it has
maximized export opportunities for Namibia. It also identifies existing constraints that Namibia’s
exporters have been experiencing in accessing the SADC market and provides trade policy
recommendations for enhancing the country’s potential benefits from its participation in the
SADC trade integration process.

15
1.3 Methodology
The study employed a desktop review to analyse Namibia’s export data to the SADC market for
the period of 2000 to 2012. Data was obtained from the Namibia Statistics Agency (NSA) for the
period 2000 to 2012. Secondary data was sourced from internet sources, books, publications,
journals, articles and findings of annual Audit Reports of the implementation of the Protocol on
Trade (2007 to 2012). Import and export values are the key variables used in the study. The data
collected are reported in Namibian dollars (N$) throughout the period. The analysis is informed
by a qualitative investigation of Namibia’s export trade profile to SADC. The top ten products
exported to SADC were identified. In doing this, the author has not only found the most
significant products exported to the region, but also monitored the trend to see if intra-SADC
tariff liberalization has influenced export performance. In this case, the tariff phase downs of
other SADC countries have been looked at in relation to Namibia. Selected exporters in the top
exporting sectors to SADC were also interviewed.
As part of data collection, ten (10) questionnaires were distributed. The author conducted
interviews with key selected exporters in the top ten exporting sectors to the SADC region.
Responses were received from Namibia Manufacturing Association, Namibia Breweries, Meatco,
fishing companies such as Cadilu Fishing, Namsov, Merlus, and Seawork. Other information were
obtained though consultations with officials from Government ministries such as the Ministry of
Trade and Industry (MTI), Ministry of Finance (Customs and Excise Directorate), National Planning
Commission (NPC), Ministry of Home Affairs and Immigration, Ministry of Agriculture, Water and
Forestry and institutions like the Bank of Namibia, Institute for Public Policy Research (IPPR),
Namibia Economic Policy Research Unit (NEPRU) as well as the private sector representative such
as the Namibia Trade Forum, Namibia Agricultural Forum and the Namibia Chamber of
Commerce and Industry.
The study has been limited to the timeframe of 2000 to 2012. In exploring the data, the study
used a non-scientific approach as well as non-statistical methods in analysing the data. Thus, the
author relied upon the available literature through document reviews and face-to-face
interviews. The results of the questionnaires shows that the majority of the key products such as
fish, beer and beef exported to the region are destined for South African market and few
products (beer and fish) are exported to Angola, DRC, Mozambique, Tanzania, Zambia and
Zimbabwe. Exporters to these markets experience high tariff barriers especially in Angola and
DRC while non-tariff barriers, cumbersome customs, and administrative procedures are also
experienced at some borders.

16
The paper is not intended to analyse the economic effects of the SADC FTA to Namibia, but
simply highlight changes in trade volume between Namibia and SADC countries. This will help
draw some trade policy conclusions on Namibia’s further participation in the SADC FTA.
The research report is outlined as follows. Chapter 1 provides for an introduction and
background on the SADC FTA, focusing largely on the tariff liberalisation mechanism and rules of
origin; status of implementation; the research question and methodology to be utilised. Chapter
2 presents the literature review to provide a theoretical and empirical perspective on free trade
agreements and their rationale. This chapter also looks at empirical evidence on FTA
performance from global and regional perspectives. Chapter 3 provides a brief overview of the
economy of Namibia and that of the SADC region, highlighting the structure of production and
trade patterns and also the production and trade facilitation challenges. Chapter 4 highlights the
SADC FTA in perspective and status of implementation. Chapter 5 presents data analysis and the
results of the study. Chapter 6 presents the discussion while chapter 7 presents the conclusions
and makes trade policy recommendations.

17
CHAPTER 2: LITERATURE REVIEW
This chapter provides a theoretical and empirical perspective on free trade agreements and their
rationale. The chapter also looks at empirical evidence on the performance of FTAs from global
and regional perspectives, particularly looking at their impact on export expansion. It concludes
by assessing whether FTAs involving developing countries, especially in Africa, have produced
results similar to those of developed countries, particularly on export performance. It also
identifies constraints that limit the free flow of goods among members, particularly in developing
countries.
2.1 Theoretical Perspectives
Preferential trade agreements have been proliferating all over the world, largely driven by the
successful evolution of the European Union (EU) integration and the North American Free Trade
Agreement (NAFTA). Today, FTAs are regarded as effective trade policy tools to enhance trade
flows between member countries.
Salvatore (2007) refers to a free trade area (FTA) as the form of economic integration wherein all
barriers are removed on trade among members, but each nation retains its own barriers to trade
with non-members. In a free trade area, tariffs, import quotas and quantitative restrictions are
eliminated on most goods and services traded between member countries.
Buthelezi (2006) supports the above definition of a free trade area and reinforced the meaning
by demonstrating that in a free trade area, duties and restrictions to trade are eliminated on
goods that are traded between members of the free trade area. He further pointed out that
individual members of the FTA can retain their own duties against imports originating from a
non-member of the FTA. What it means is that members of the FTA enjoy preferential access to
each others ’markets on a duty free basis at the expense of non-FTA member countries. For this
preference to be protected, FTAs usually contain rules of origin to guard against imports trans-
shipped from a non-member of the FTA through an FTA member country, whose external
barriers to trade are low, to another country with higher barriers to trade. FTAs are supposed to
be consistent with Article XXIV of the General Agreement on Tariff and Trade (GATT) once they
have satisfied the elements of notification, trade coverage and levels of barriers to trade with
non-members of the FTA.
According to economic theory, the primary aim of a free trade area is to eliminate barriers to the
exchange of goods and services in order to promote trade resulting from specialization, division
of labour and more particularly through comparative advantage. The rationale of a free trade
area is informed by theoretical views about free trade. These theoretical views are expressed in

18
terms of static effects (trade creation and diversion) as originally introduced by Viner. The theory
of FTAs also suggests possible dynamic effects arising from the economies of scale, which can
result into investment formation, increased employment and technology transfer, etc. These
have since become important assessment tools of today’s free trade agreements.
Trade creation effects
In classical theory of international economic integration, Viner laid a foundation on the
assessment of the free trade agreements. The focus was on static effects of trade creation and
diversion.
Trade creation usually occurs when a member country, upon the formation of an integration
arrangements, the production of a particular product that does not have a comparative
advantage in the home country and in that area is substituted by the imports of cheaper products
from a partner country which has a comparative advantage. This means that the higher domestic
production cost in the home country is replaced by imports of lower cost of production from the
partner country, hence, moving to a less expensive supply source. Trade creation gains in the
home country are production effects or gains from specialization and consumption effects or
gains from exchange. The production effect enables the home country to experience a saving in
the real cost of products previously manufactured locally, as these are now being imported into
the home country from a partner country more cheaply. Consumption effect relates to the gains
that the home country experiences in consumer surplus as the substitution of higher cost goods
for lower -cost products enables local consumers to increase the consumption of products from a
partner country due to lower prices. In microeconomic theory, consumers are willing and able to
purchase more of a product at a lower price and less at higher price (Mutambara, 2013).
Mutambara (2013), notes that it is possible to observe economies of scale in the trade
integration arrangements as a result of cost reduction effect. The ability of a partner country to
capture the whole integrated market can lead to a fall in the union price. Similarly, the less
efficient country experiences trade creation gain and benefit despite losing its local industry.
From a theoretical perspective, trade creation is beneficial, but it is only possible when the FTA
respects, comparative advantage of its members.
Trade diversion effects
In trade integration arrangements, the trade diversion effects usually occur when such
arrangements push the home country to ignore the lower-cost suppliers elsewhere in the world
and focus on the higher-cost suppliers who are actually its trading partners. These suppliers enjoy
artificial advantage brought about by the preferential tariff arrangements that enable a shift in
19
product origin from a non-member whose resources costs are lower to a member country
producer whose resources costs are higher (Mutambara, 2013).
Salvatore (2007) notes that trade diversion hampers the international allocation of resources,
thereby worsening comparative advantage. The shift results in higher import costs for the home
country as it now faced with higher cost of goods imported previously from a cheaper foreign
source.
Comparative advantage theory states that a country should specialize in producing and exporting
only those goods and services, which it can produce more efficiently at lower cost. The
endowments of production factors such as labour, capital, land, skills,,, technology, power
resources, etc., increase comparative advantage. Free trade is therefore beneficial to all nations
participating in trade because each country can gain if it can specialize on the basis of its
comparative advantage.
A Ricardian model, as demonstrated by Martincus and Gomez (2010), estimates that a reduction
in barriers to trade results in a high volume of exported products. They found that vertical
specialization is induced by reductions in tariff duties. In their view, liberalization of trade
supports international fragmentation of production processes across borders, which make it
easier for products that were initially manufactured in one particular country to be progressively
manufactured in other countries and distributed to countries on the basis of their comparative
advantage. This results in massive trade increases of intermediate goods more than the finished
goods.
From a static theoretical perspective, a free trade agreement reduces barriers to members’
exports to each others’ markets, thereby maximizing partner’s export opportunities.
Dynamic effects
Dynamic effects as defined by Jaber (1970) refer to the possible ways in which economic
integration affects income growth rate as result of increase in the size of the market. Dynamic
effects include reduction in trade barriers to create a more stimulating and competitive
environment, which enables production efficiency and the realization of economies of scale. This
will not only enhance export opportunities within the free trade area but also to the rest of the
world Intra-industry specialization may increase as result of economies of scale in some
products and the larger market accessible to producers will attract investment into member
countries both from domestic and foreign sources (Mutambara, 2013).

20
However, dynamic effects are sometimes hard to quantify as opposed to static effects. For an
FTA to generate dynamic effects, it should go beyond removal of tariff barriers. The FTA should
address non-tariff barriers to trade; services and other new generation trade issues, such as trade
facilitation, investment, competition policy, etc., i.e., measures that address both border and
behind-the-border barriers to the free flow of goods and services.
2.2 Empirical Perspectives
A large literature exists on FTAs, particularly on regional trade agreements (RTAs). However,
there is no universal consensus on RTAs’ consequences on countries’ welfare, and in particular on
export performance. FTAs have in general produce mixed results. However, there are some
stylized facts that emerge from recent empirical literature which indicate that FTAs tend to boost
trade between their members.
The “natural trading partner hypothesis” suggests that positive welfare effects stem from RTAs
between countries with high trade volumes prior to the agreement ( Baier and Berstrand, 2007) .
As noted by Schiff and Wang (2004), many studies conducted on the formation of the regional
trade agreements conclude that if two countries are “natural trading partners”, they are likely to
gain more and increase trade volume between them. They further pointed out that based on this
hypothesis, members are likely to generate more trade creation and less trade diversion.
There are also empirical evidence that countries that have low transport cost due to short
distance and have experienced high trade volume prior to the formation of the RTA are likely to
be potential natural trading partners (Schiff and Wang, 2004).
From a global perspective, countries with free trade regimes boost exported growth and
experienced rapid increases in Gross Domestic Product (GDP). Greater expansion in the growth of
global trade in relation to global output has been experienced as a result of trade liberalization.
On average, global output has expanded over 7 per cent per year at a compounded rate. In
South-East Asia majority of countries have experienced growth rate above 10 per cent due to
expansion in the level of exports (Thirlwall, 2000).
Booth (2011), argued that since 2000, China’s export trade with Indonesia has increased
tremendously following the launch of the ASEAN–China Free Trade Agreement (ACFTA) in 2010.
He further pointed out that Indonesia’s exports to China are mainly made up of primary
commodities, whilst China’s exports to Indonesia are mainly dominated by manufactures, a
situation that created comparative advantage in both nations. The launch of the ACFTA created
export opportunities for the ASEAN countries to produce and export to the Chinese market.
21
As emphasised by Devadason (2010), intra-ASEAN exports increased as a result of China’s trade
relations with the region, mainly Singapore, Thailand and Malaysia. In his analysis, he found no
evidence that the level of imports from China by ASEAN nations as a result of the formation of
the ACFTA reduces the flow of intra-ASEAN exports.
Devadason (2010) sees this as an economic initiative, driven by economic cooperation elements
and established with a primary purpose of eliminating barriers to the free flow of goods. He
further pointed out that as part of the integration effort, “the ACFTA Agreement on Trade in
goods (TIG) was implemented in 2005 and covers tariff lines representing more than 95% of
ASEAN-China trade”. In his view, this was the biggest FTA, with a combined population of 1.7
billion people, Gross Domestic Product (GDP) of US$ 2 trillion and trade flows to the tune of US$
1.23 trillion.
Hover et al (1996) indicated that six members of the ASEAN created an ASEAN Free Trade Area
(AFTA) entered into force on 1st
January 1996 to abolish tariffs on all goods produced in ASEAN
members. The initial tariff liberalization programme indicated that tariffs duties on goods
manufactured by ASEAN members with at least 40 per cent local content were to be reduced to a
range between zero to five per cent over a period of fifteen years. Under the ASEAN scheme of
“Common Effective Preferential Tariff”, a scheme identified as a mechanism to speed up the
tariff reduction process, goods were categorised into fifteen groups to cover intra-ASEAN trade of
almost 40 per cent. It was envisaged that such a process would result in the ASEAN Free Trade
Area covering up to one hundred per cent of intra-ASEAN trade. The key argument behind the
formation of this FTA was essentially to promote intra-ASEAN trade, create programs aimed at
creating joint ventures between ASEAN member countries and encourage specialization in
industrial activities.
Chin and Stubbs (2011) pointed out that the formation of CAFTA agreement was mainly
motivated by China’s interests in securing natural resources and energy supplies that can be used
in stimulating China’s economic growth and facilitating access to regional markets for its
manufactured goods. As a result, tariffs have been dismantled on traded goods between China
and ASEAN countries covering 90 per cent of total trade.
According to Cherry (2012), the entering into force of a Free Trade Area (FTA) between the
European Union (EU) and the Republic of Korea in July 2011, provides for the liberalization of
barriers to trade and investment. The rationale behind the formation of this FTA was to extend
beyond the elimination of tariff barriers and to tackle a wide spectrum of Non-Tariff Barriers
(NTBs) that act as obstacles to the free flow of business activities as well as trade and investment
22
activities. This created export opportunities for the members emanated from regional and
bilateral trade agreements that have capacity to enhance trade and investment with the ultimate
goal of contributing towards economic growth and employment creation within the EU
configuration.
Cherry (2012) estimated that the launch of the EU-Korea FTA would create new trade
opportunities for the EU firms to the tune of €19.1 billion both in goods and services. The EU
firms were to benefit particularly in the areas such as pharmaceuticals, footwear, auto parts,
chemicals, steel and iron, medical equipment and spirits. In service industry sectors such as legal,
financial, environmental and telecommunications services and shipping, exporters from the EU
were to benefit massively from the €1.6 billion in tariff duties charged on their products every
year. The formation of this FTA was also expected to lead to abolition of NTBs such as
certification and technical standards so as to ensure predictability and better transparency on
issues of regulations such as Intellectual Property Rights (IPR).
Bastian (2011), noted that trade dynamics were experienced as EU granted independent trade
preferences to all the Western Balkans countries by permitting exports to penetrate the EU
market free from quantitative restrictions and customs duties. Albeit there were some
exceptions where duties were applicable, certain products such as wine, baby beef, sugar and
some fisheries products were allowed to enter the EU under preferential tariff quota
arrangements.
The evidence from the North American Free Trade Area (NAFTA) shows that all the non-tariff
barriers to trade in agricultural goods were eliminated between Mexico and the United States.
NAFTA is an agreement between the United States, Canada and Mexico. Implementation started
on 1 January 1994 when some duties were eliminated immediately, leaving others to be
eliminated over a period of 5 to 15 years. Since 2008, the elimination of barriers to agricultural
trade has facilitated strong integration in agricultural sectors in Canada, Mexico and the United
States, allowing export expansion of agricultural trade within the free trade area. This fuelled
industries in Mexico and Canada that relied on agricultural inputs from the United States to
expand their production and manufacturing base (www.fas.usda.gov).
Martincus and Gomez (2010) indicate that: “According to economic theory and recent empirical
evidence, improved market access through trade agreements is likely to favor export
diversification”. In their article on trade policy and export diversification, the formation of a Free
Trade Area between Colombia and the United States has increased exports of new goods to the
United States from Colombia due to the reduction in tariffs.

23
While many authors believe that many countries have formed free trade areas for the purposes
of dismantling tariffs and non-tariffs barriers to trade and investment, Tovar (2013) states that “if
the government’s objective is characterised by diminishing marginal political support, a free trade
area can lead to an increase in the tariffs imposed against non-member countries”.
From a regional perspective, since the beginning of decolonization in Africa, regionalism has been
the subject of the day especially in Sub-Sahara Africa. Many African countries have tried their
utmost to create regional groupings aimed at establishing free trade areas. These were seen as
brilliant steps ahead that gained political blessings from African Heads of State and Governments.
Surprisingly such ambitious efforts have not produced good results.
Intra-African trade figures are still the lowest compared to other continents. This is mostly
affected by lack or slow implementation of regional trade agreements designed to dismantle
tariffs and non-tariff barriers to trade in Africa. The majority of the African countries have signed
and ratified various trade agreements, but because of slow implementation and in some cases
lack of commitments, these agreements are as if they do not exist. Countries that have
integrated well into the global economy have experienced multiple effects through trade and
investment in the form of rapid economic growth over a sustained time period and as a result,
experienced poverty reduction. Some of the constraints to the free movement of goods and
services in the region include poor infrastructure development, poor connectivity, political and
security instability and trade barriers. On the infrastructure development, roads and railways in
some part of Africa tend to lead mostly to marine ports instead of linking countries over land,
making it hard to facilitate intra-Africa trade (UNECA, 2010).
While some studies showed that Regional Trade Agreements (RTA) in Africa have been powerful
in increasing Foreign Direct Investments (FDI) and trade promotion, a lot still needs to be done to
eliminate tariff and non-tariff barriers and improve infrastructure development. There is a need
to develop a Programme for Infrastructure Development in Africa (PIDA) to address
infrastructure deficiency. The existing RTAs need to be streamlined to provide better
opportunities for countries to foster and reap the benefits of regional trade and investment.
According recent studies, populations are deprived the gains from free trade areas if there is a lot
of protectionism and self-sufficiency. Ricardo (1772), in his theory of comparative advantage
shows that free trade creates gains that outweigh losses and, moreover, generates employment
opportunities instead of destroying them. He further demonstrates that countries specialize in
producing those goods and services in which they have comparative advantage. In other words,

24
countries specialise in the production of goods and services that they produce most efficiently or
at a lower cost in comparison to other countries.
According to Kureya and Madzingira (2011), the objective of the establishing of the SADC FTA is
to eliminate tariffs and non-tariff barriers to foster intra- regional trade. They further found that
Member States have reported massive increases in the use of transport corridors, creating a
competitive environment between Member states, reducing transport costs and fostering trade
flows.
Although the proliferation of FTAs over the years has been viewed as the most interesting
component in both regional and global trade agreements, the extent to which they achieve their
intended objectives are constrained by the presence of tariff and non-tariff barriers. From the
theoretical and empirical perspectives of the existing FTAs, the implementation of the ASEAN-
China FTA Agreement on trade in goods in 2005 has resulted in substantial trade flows created by
larger market integration. In the same way, NAFTA produced similar effects by dismantling all the
non-tariff barriers to trade in agricultural goods between Mexico and the United States. The
evidence shows that since 2008, the elimination of barriers to agricultural trade has facilitated
strong integration in agricultural sectors in Canada, Mexico and the United States allowing export
expansion of agricultural trade within the free trade area. This fuelled industries in Mexico and
Canada that relied on agricultural inputs from the United States to expand their production and
manufacturing base.
From the African regional perspective, many empirical studies indicated that free trade areas
involving developing countries, in particular African countries, have not produced the desired
results. Various factors have been identified as the major impediments to African countries’
integration objectives. Most African countries have small population and are characterized by
low incomes, weak production structures, as well as trade and diversification challenges in
production caused mainly by weak institutions and inappropriate policies. Some of the major
constraints that prevent Africa from reaping the full benefits of free trade areas include political
instability and conflict, the cost of doing business, lack of human skills development and
deficiencies in infrastructure. Within the African continent, 39 countries have less than 15 million
people while 21 countries have less than 5 million. This means that small populations aggravated
by low level of incomes constrain the size of Africa’s domestic markets. Incomes remain low with
the majority of the population in many countries living in poverty despite recently improved
growth rates in some countries. The per capita income in thirty-two countries is less than $500 a

25
year. Africa contains about 12 per cent of the global population yet its contribution to output is
just 2 per cent (ECA, 2004).
In the case of ECOWAS, the region is still faced with many challenges of persistent trade barriers.
Trade within the region is still on a small scale and in most cases is sustained by price variations
from country to country.
In the case of SADC, many challenges are still slowing down the integration agenda of the region.
The complicated rules of origin agreed in the SADC Protocol on Trade make life difficult for some
member countries to trade under the SADC rules of origin. Despite notable achievements of 85
per cent tariff lines that have attained a duty-free status, the region is still battling with the
persistent introduction of non-tariff measures by some member countries. This is against Article
6 of the Protocol on Trade, which calls for member countries to adopt policies and measures to
eliminate all existing forms of NTBs and refrain from introducing new NTBs.
The economy of the region is characterised by a high disparity in infrastructural and economic
development between member countries, overreliance on imports, mainly from South Africa,
and poor diversification of production. This has forced most SADC Member States to rely on
primary products for exports. A detailed structure of the economy of SADC is presented in
chapter three. For the purpose of this Chapter, the author concluded by highlighting key
constraints and challenges facing developing countries in Africa in their free trade area
arrangements.
From other regional economic grouping, the Economic Community of West African States
(ECOWAS) has integrated up to a stage of customs union. Both its FTA and Customs Union were
established jointly with the West African Economic and Monetary Union (UEMOA). ECOWAS set
financial compensation for four years with effect from 1 January 2004. “The amount of
compensation depends on the loss of customs revenue the State incurs by importing approved-
origin industrial products” using the following discounted rates:
• A 10 per cent decrease incurred in 2004;
• An 80 per cent decrease incurred in 2005;
• A 60 per cent decrease incurred in 2006;
• A 30 per cent decrease incurred in 2007; and
• A zero per cent decrease incurred, effective 1 January 2008.
Since State contributions determine the compensation budget, there is however little efficiency
in the mechanism. Goods that should undergo trade liberalization should first comply with rules

26
of origin, defined as goods of ECOWAS origin, comprising of local goods, goods sourced from its
Member countries and those that are produced from materials “other than live animals born and
raised in the country used alone or mixed with other materials, if their ratio in quantity is higher
or equal to 60 per cent of the raw materials used” with the exception of handmade items,
agriculture and livestock products. ECOWAS has signed agreements enabling the community to
facilitate cross-border trade. Despite this initiative, the region is still faced with many challenges
of persistent trade barriers. Trade within the region is still on a small scale and in most cases is
sustained by price variations from country to country (UNECA, 2010).
Rules of Origin (RoO) is usually a component to determine the origin of goods traded between
RTA members and tariff preferences is granted based on the origin of the good. RoO that require
substantial transformation is commonly recognized. Empirical evidence shows that RoO
undermine trade performance in a number of FTAs.
In the case of SADC, RoO undermines trade performance as they are designed to follow a
product-specific approach and act as protectionists to protect existing domestic industries from
increased intra-regional competition instead of fostering developments through trade
integration. This is making it difficult for Member States to source their input requirements
thereby restricting trade, increasing transaction costs and diminishing producers’ flexibility and
make SADC less attractive region for domestic and foreign investment (Brenton, Flatters and
Kalenga, 2005).
Empirical evidence also shows that some member countries especially in SADC with strong
domestic industrial capacity sought to use rules of origin to achieve other trade and industrial
policy objectives other than the prevention of trade deflection. This approach does not only limit
member countries’ ability to source cheap global inputs to expand local production and gain
preferential access to the region, but also undermine member countries’ comparative advantage.

27
CHAPTER 3: THE ECONOMY OF NAMIBIA AND SADC
3.1 Introduction
This chapter highlights the Namibian economy and that of the SADC region in terms of the
structure of production and trade patterns. It looks at the diversification challenges facing
Namibia and other SADC countries, mainly as related to primary commodity dependence and
trade facilitation bottlenecks. While the establishment of a free trade area is important for trade
expansion, there is need for it to be accompanied by an industrialization strategy for it to
maximise trade opportunities. An argument is made that the trade benefits to be accrued from
the SADC FTA requires the region to expand its productive capacity and address trade facilitation
challenges, including non-tariff barriers to trade, inadequate regulatory environment and
infrastructure deficit,
3.2 The Economy of Namibia
The economy of Namibia is dominated by an export-led primary sector and a large non-tradable
sector (government services). The structure of the Namibian economy has remained almost static
over the past decade. The structure of production and trade patterns has remained unchanged,
thus requiring structural transformation. Figure 2 below depicts GDP sectoral breakdown.
Figure 2: Industries contribution to GDP (2007 – 2014)
Source: National Accounts 2014, Namibia Statistics Agency
0.0%
10.0%
20.0%
30.0%
40.0%
50.0%
60.0%
70.0%
80.0%
90.0%
100.0%
2007 2008 2009 2010 2011 2012 2013 2014
Primary Secondary Tertiary

28
Over the years, the mining sector has been the key economic propeller for the Namibian
economy and its contribution to economic growth has been very significant. The economy is
dependent on the extraction of mineral resources such as diamonds, uranium, copper, lead, zinc
and gold. In the global ranking, Namibia has the sixth largest diamond industry in the world and
has become the fourth largest uranium producer in the world. Good growth rates of 6% on
average were experienced during the period 2003-2008, mainly driven by mining activities.
From 2007 to 2014, the contribution to GDP from the primary sector had decreased from about
24% to about 17%. On average, the economy recorded growth rate of 3.9% from 2007 to
2012.The decline is attributed to the effects of the global and economic crisis which was
transmitted to the Namibian economy through international trade activities.
Figure 3: Primary Sector Real Growth 2001-2012
Source: National Account 2012
The mining, agriculture and food processing and manufacturing sectors are the main export
earners for Namibia. In 2008, mining accounted for about 35% of total revenue, whilst agriculture
and food processing and manufacturing accounted for 24% and 39% respectively (CFA Consulting
Group, 2013). Although the mining sector is the key economic propeller for Namibia, its
contribution to employment creation is just about 2% of the labour force, despite representing
the country’s total export value of about 45%. In comparison, the agricultural sector plays a more
crucial role as far employment creation is concerned, employing about 30% of the workforce.
Agriculture is the most important source of income for the Namibian population (CFA Consulting
Group, 2013).

29
Source: National Accounts 2014, Namibia Statistics Agency
The agricultural sector has contributed a relatively small share to Namibian GDP in recent years,
with its share declining further in 2013 and 2014. Within the sector, Livestock farming has
accounted for an average of 2.7% of GDP since 2008, whereas crop farming has made up an
average of 1.9%.
Source: Meat Board of Namibia
Although livestock farming also includes small stock (goats, sheep) and pigs, cattle have tended
to account for the bulk of GDP from livestock. A look at the numbers of cattle slaughtered for
export and in local butchers, and the numbers exported live to South Africa and Angola, shows a
seasonal trend: slaughter for meat tends to peak in the middle months of the year, with live
exports occurring mainly at the end of each year. The livestock industry saw huge volatility in
recent years as a direct result of the severe drought of 2013. This drought forced farmers to sell
0.0%
1.0%
2.0%
3.0%
4.0%
5.0%
6.0%
7.0%
2007 2008 2009 2010 2011 2012 2013 2014
Sect
or
as a
Per
cen
tage
of
GD
P
Livestock Crop Farming Agriculture
0
5,000
10,000
15,000
20,000
25,000
30,000
35,000
Jan
-10
May
-10
Sep
-10
Jan
-11
May
-11
Sep
-11
Jan
-12
May
-12
Sep
-12
Jan
-13
May
-13
Sep
-13
Jan
-14
May
-14
Sep
-14
Jan
-15
Nu
mb
er o
f C
attl
e
Cattle, Export abattoirs and butchers
Cattle, South Africa & Angola

30
off cattle in large numbers, with live sales seeing a large boost in mid-2013. The massive sell-off
of cattle lowered stocks enough to keep livestock trade low in 2014. Veterinary restrictions put in
place by South Africa also prevented the export of any live cattle in May and June 2014. However,
generally, exports of beef to the European Union and South Africa are predominant and less to
neighbouring markets. Food processing is the main manufacturing activities in Namibia.
Figure 4 below shows the growth rate within the secondary sector during the period 2001-2012.
The secondary sector recorded robust growth of 5.9% in 2012, higher than the 3.3% recorded in
the previous year. This was mainly due to impressive growth in the manufacturing field which
recorded 12% growth in 2012. Manufacturing accounts for more than one third of the whole
contribution from the sector to GDP. Despite this, the performance of this sector has declined
since 2008, indicative of de-industrialization.
Figure 4: Secondary sector real growth 2001-2012
Source: National Account 2012
The secondary and tertiary sectors were the key drivers of growth from 2007 to 2012, registering
about 4.6% and 5.2% respectively, while the primary sector contracted by 4.6% due to external
shocks such as the global economic crisis, international oil prices, exchange rates and drought
(National Planning Commission , 2012).

31
Figure 5: Tertiary sector real growth 2001-2012
Source: National Accounts 2012
In the tertiary sector, good growth of 6.9% was experienced in 2012, compared to 4.5% in 2011.
Such growth was mainly driven by wholesale, repair and retail trade, business services, real
estate and financial intermediation.
Since 1990, the total GDP accruing from the services sector is about 55-60%. It is evident from
the above section that the services sector in Namibia is growing and can be an important export
earner. However, the SADC FTA has thus far focused on trade in goods rather than services. Yet,
for Namibia it holds export growth potential, especially in transport and logistics sectors, with
Walvis Bay as an important trade corridor to the landlocked neighbouring countries).
Most challenges facing Namibia are also common in many SADC Member States. In production,
Namibia experiences supply-side constraints as its ability to manufacture goods in large
quantities is limited by the size of its domestic economy. Over the years, the country has been
heavily dependent on the primary commodities for export putting pressure on the primary sector
which is composed of mining, agriculture and fishing. The sector has been the main economic
propeller for Namibia generating the highest GDP for the country. Other challenges facing
Namibia are in the diversification of export products. The heavy dependence on the extraction of
minerals for export as well agriculture and fishing activities provides limited opportunities for
Namibia to diversify its production base. Like many countries in SADC, Namibia also depends on
the importation of food items mainly from South Africa which accounts for more than 70% of the
Namibia’s total imports.
The extent to which Namibia can maximise export opportunities from the SADC FTA largely
depend on the expansion of its productive base, particularly its ability to participate in regional
value chains in goods and services as part of a broader diversification strategy. Namibia’s
participation in the SADC FTA provides it with opportunities to expand and diversify its export

32
markets. However, there is need for developing a deliberate strategy for participation in the
SADC integration process. This can include the following:
Developing a trade in services strategy in the context of SADC market integration agenda
particularly exploiting its geographic location as a transport and logistics hub for land-
locked neighbouring countries. This requires that Namibia develops a deliberate trade in
services strategy as part of the consolidation of the SADC FTA, with heavy emphasis on
transport, logistics and communication sectors.
Namibia is already expanding the Walvis Bay Container Terminal and established a
cooperative relationship with Botswana through granting a dry port facility to that
country. This is an ambition of becoming the logistics and distribution hub for land-
locked countries in southern Africa by linking them to markets in Europe and the
Americas through Walvis Bay Corridors, an integrated system of well-maintained tarred
roads and rail networks comprising the Trans Kalahari, Trans Caprivi, Trans-Cunene and
Trans-Oranje Corridors. However, all these efforts are not clearly articulated through its
participation in the SADC trade integration strategy.
Other services such as tourism, health, education can be potential avenue for
maximising the country’s export opportunities to the region.
Despite the smallness of the manufacturing sector it is an important export earning
sector which is already exporting manufactured goods such as cement, beverages and
processed foods to South Africa, Angola and DRC, hence a deliberate strategy to
diversify export markets towards the entire SADC region.
There is a need for deliberate strategy such as Namibia’ Industrial Policy to participate in
regional value chain as part of the overall efforts to tap into global value chains.
3.3 The Economy of the SADC Region
The Southern Africa Development Community is a region comprising of 15 member countries.
The following tables (Table 2 and 3) summarise the key development indicators for SADC.

33
Table 2: Regional GDP country share in SADC, 2013
Country Regional GDP share in SADC
Angola 13.6%
Botswana 2.7%
DRC 4.2%
Lesotho 0.4%
Madagascar 2.7%
Malawi 1.1%
Mauritius 1.9%
Mozambique 2.3%
Namibia 1.9%
Seychelles 0.2%
South Africa 55.5%
Swaziland 0.7%
Tanzania 7.1%
Zambia 3.9%
Zimbabwe 2.0%
Source: GiZ, 2014
The SADC economic growth differs from one country to another with a Gross Domestic Product
(GDP) per capita increased by 3% on average per year over the last 10 years. Looking at individual
countries, South Africa appears to be powerhouse of SADC with a regional GDP share of 55.5%,
followed by Angola with 13.6% and Tanzania with 7.1%. Other countries such as Lesotho,
Seychelles and Swaziland have all regional DGP share of less than 1%. There many reasons to this
including different levels of economic development of SADC Member States, different sizes,
connections to key international trade routes (some are landlocked others not) and different
economic interests. All these have an influence on the share of regional GDP of each country.

34
Table 3: Sectors’ contribution to GDP (%), 2013
Country Agriculture Industry Services
Angola 10.83 56.98 32.18
Botswana 2.54 36.91 60.55
DRC* 25.16 35.09 39.75
Lesotho 7.83 36.57 55.60
Madagascar* 29.11 16.00 54.89
Malawi 26.96 18.79 54.25
Mauritius 3.27 23.07 73.66
Mozambique 29.25 23.66 47.09
Namibia 7.07 29.64 63.29
Seychelles* 2.09 15.42 82.49
South Africa 2.39 27.58 70.03
Swaziland* 7.48 47.69 44.83
Tanzania 27.00 25.18 47.82
Zambia 17.68 37.25 45.07
Zimbabwe 12.38 31.29 56.33
SADC (Average) 14.07 30.74 55.19
Note: Countries with *, the data given is not from 2013, but for most recent year for example:
DRC (2009), Lesotho (2012), Madagascar (2009), Seychelles (2012) and Swaziland (2011).
Source: GiZ, 2014
Looking at the table above, regional growth is driven by the services sector in SADC as it
represents more than half of GDP followed by agriculture, which contributes about 15% of value
added to GDP. The industry sector contributes the remaining 31%. The importance of sectors
differ from country to country. For example, agriculture is an important sector for Madagascar
(29.11%), Mozambique (29.25%) and Tanzania (27.00%), whilst Angola, Botswana and Swaziland

35
regard industry as their important sector. For South Africa, Seychelles and Namibia, the services
sector is very crucial as their highest GDP is coming from this sector.
In terms of trade volume, SADC trade has doubled in absolute terms between 2000 to 2009.
Despite this, its total trade remains unchanged in relative terms at 15%. This implies there has
been an increase trade between SADC and the rest of the world almost in the same proportion
with overall world trade. Diversification of export basket in SADC still remains a challenge.
Agricultural produce, minerals and fuels are traditional exports products. South Africa remains an
exception as about 58.7% of imports into SADC and 46.2% of all exports from SADC countries are
destined for or originate from South Africa. South Africa dominates intra-SADC trade while
countries such as Namibia, Malawi, Lesotho, Malawi contribute less than 1% to intra-regional
trade
Following below is a table that depicts economic performance of the decade in the SADC region.
Table 4 below depicts the total aggregated SADC real (GDP) growth rates
Source: World Development Indicators, 2011 data from SADC CCBG Macroeconomic Information
(April 2012)
In 2011, the region’s growth rate on average has been about 5.2 per cent. The economy of the
region is characterised by a high disparity in infrastructural and economic development between
member countries, overreliance on imports, mainly from South Africa, and poor diversification of
production. This has made most SADC Member States rely on primary products for exports. The
danger associated with heavy dependence on primary commodities has been a worry for most
Member States in the event of declining demand for primary commodities, which ultimately
translates into falling prices.
Economic activity in the region experienced a downward trend in 2011, after having performed
better in 2010. The decline was attributed to the global economic slowdown and the economic
downturn in Europe, resulting in the decline in average GDP from 5.94 per cent in 2010 to about
5.07 per cent in 2011. Despite the decrease, all SADC countries experienced positive growth rates
in 2011, although smaller than in 2010, with the exception of Angola, Mozambique and South
Africa. In 2011, Zimbabwe registered an impressive growth rate of about 9.4 percent while
Mozambique recorded 7 per cent. The growth rate in Zimbabwe was driven by the mining,
agriculture and manufacturing sectors which contributed 36.7 percent, 11.2 per cent and 4.2 per
cent respectively. For Mozambique, growth was propelled by agriculture, financial services,
mining and transportation and communication services.
Year 2000 2001 2002 2003 2004 2005 2006 2007 2008 2009 2010 2011
GDP rate 3.46 2.69 2.68 2.98 4.89 4.80 6.16 6.74 4.00 2.20 5.23 5.14

Page 36 of 69
For Angola, the growth was mainly driven by the oil (48.9 per cent), agriculture (19.9 per cent) and
construction (9.3 per cent) sectors as well as trade related activities (7.9 per cent). Namibia’s growth rate of
3.8 per cent was spurred by secondary and services sectors recording growth of 4.4 per cent and 5.9 per cent
respectively. Construction, manufacturing, retail and wholesale trade were the key drivers of growth in the
secondary sector while transport and communication developments contributed to growth in the tertiary
sector. For South Africa sustained GDP growth of 3.1 per cent was mainly due to tertiary sector
developments... As regard to Zambia, agriculture activities and mining output were the key drivers of 6 per
cent growth in 2011, coupled by positive developments in sectors such as communication, construction,
transport and tourism backed up by the country’s economic policies aimed at fostering diversification and
competitiveness in economic activities (SADC Committee of Central Bank Governors, 2012).
During the period 2000-2011 as shown above, SADC experienced a decline in GDP growth especially in 2009
when GDP growth recorded only 2.20%.. For the entire period as indicated on table above, SADC average
growth is only 5.2%. In 2011 intra-regional trade registered a positive growth. The majority of SADC Member
States adopted a strong habit of commodity imports dependency due to their diversification challenges in
domestic production. As a result, export opportunities are limited, resulting in a few products being exported.
South Africa is the source of imports for most Member States making them heavily dependent on South
Africa. At the moment, intra-regional trade is dominated mainly by food items ensuring that South Africa
enjoys a positive trade balance with most Member States in SADC .This is not healthy in the long-run and
therefore there is a need to strengthen trade relations in order to deepen regional integration in SADC. To
foster intra-regional trade, there is a need for SADC Member States to increase investment aimed at
addressing diversification challenges.
3.3 Challenges facing SADC countries
The SADC region is composed of least developed countries, developing countries and one industrialised
country (South Africa) which accounts for more two-thirds of the region’s economy. The structure of
production and trade pattern is very weak and low with the exception of South Africa. The output in most
countries in the region is dominated by small industrial units, which in most cases produce for domestic and
regional consumption. The Small and Medium Enterprises (SMEs) are the ones leading the industrial base of
the SADC region of which the majority of them are operating in the informal sector.. Trade among Member
States without South Africa has also not produced good results. The level of diversification of export products
shows that after six years of the implementation of the SADC Protocol on Trade, the nature of the top ten
products traded is also most the same with the top five products in the same chronological order. Other
challenges include high cost of doing business and infrastructure deficits necessary to facilitate trade GiZ,
2013).

Page 37 of 69
CHAPTER 4: THE SADC FTA IN PERSPECTIVE
4.1 Introduction
Regional economic integration is an integral part of Namibia’s national development strategy. Namibia’s
Growth at Home implementation strategy for industrialization recognises the significance of regional
integration and market opportunities associated with it. The strategy amongst others focuses on promoting
the development of regional value chains in the industries that Namibia has both comparative and competitive
advantages. For example, promotion of value chains in the automotive industry focusing on spare parts and
accessories, which later will include steel and machines, is a key priority in the strategy. This will not only be
limited to merchandise trade, but also to include trade in services and logistic value chains where Namibia has
comparative advantages. The strategy also makes provisions for the development of value chains in the
context of special development initiatives with countries that have sympathetic role on the development
aspirations of Namibia such the South-South Cooperation with Brazil, Cuba and India, while in African with its
neighbouring countries such as Angola, Botswana, South Africa, Zambia and Zimbabwe. Other countries
include China and South Korea on the global arena (Namibia Growth at Home Strategy, 2013).
Namibia’s Vision 2030 document acknowledges and emphasises the importance of a change in production
structure, which has an impact to change the export structure of the country by building on the integrated
development pillars such as market integration, infrastructure development and industrial development that
have capacity and potential to foster industrialization. Industrialization is not only pursued at a national level,
but it also gaining prominence at regional level within the context of the Southern African Customs Union
(SACU) and the Southern African Development Community (SADC). There is also an increased awareness of
developing cross-border industrial cooperation with neighbouring countries on a bilateral basis, such as the
bilateral agreements between Namibia and Angola, and that Namibia and South Africa aimed at extending the
supply and value chains across borders in order to foster industrial development.
Owing to the country’s small domestic market and the importance of economies of scale in economic growth,
Namibia participates in regional and international trading arrangements such as the Southern African Customs
Union (SACU); the SADC Free Trade Area; the Tripartite Free Trade Area; the Economic Partnership Agreement
(EPA) with the European Union (EU), MERCUSOR; EFTA; and the envisaged Continental FTA. Namibia also
participates in preferential market access arrangements such as the Africa Growth and Opportunity Act
(AGOA).

Page 38 of 69
Table 5: bilateral regional/trade agreements between Namibia and other countries
Country/Region Type of Bilateral Trade Agreement
India Trade Agreement
Zimbabwe Preferential Trade Agreement
China Agreement on Trade and Economic Co-operation
Congo
Brazzaville
Trade Agreement
DRC Agreement on General Cooperation and creation of Namibia - Congolese Joint
Commission of Cooperation
Angola Agreement on Trade and Economic Co-operation
Ghana Agreement on Trade and Economic Technical Co-operation
Indonesia Trade and Economic Cooperation Agreement
Russia Agreement on Trade and Economic Co-operation
Malaysia Trade Agreement
Vietnam Trade Agreement
Nigeria Trade Agreement
Kenya Trade Agreement
Cuba Trade Agreement
Brazil Trade Agreement
SADC Free Trade Agreement
SACU Customs Union Agreement
European Union Economic Partnership Agreement (EPA)
SACU -
MERCUSOR
Preferential Trade Agreement
SACU - EFTA Free Trade Agreement
Tripartite FTA This is envisaged Free Trade Agreement and Namibia is participating
Continental FTA This is envisaged Free Trade Agreement and Namibia is participating
AGOA Preferential market access arrangements
Source: WTO SACU Trade Policy Review, 2009
The table above summarises the regional and bilateral trade agreements between Namibia and other
countries. Namibia maintains these agreements with various countries mostly on general cooperation in areas
such as trade and investment, capacity building and training, small and medium enterprises, information and
communication technology, mines, fisheries amongst others, and reiterates most-favoured nation principle in
its trade relations.

Page 39 of 69
The only preferential trade agreement Namibia maintains is with Zimbabwe signed in 1992. This agreement
provides for the reciprocal duty-free market access subject to rules of origin of 25% local content for produced
products and Namibia or Zimbabwe as an exporter should be the last place of this substantial production
(WTO, 2009).
Namibia has been part of the SADC FTA since its launch in August 2008. The SADC Protocol on Trade, which is
the legal instrument for the establishment of the SADC FTA, was signed on 24 August 1996 and entered into
force on 25 January 2000. The Protocol was later amended on 7 August 2000 and actual implementation
commenced on 1 September 2000.
Article 2 of the SADC Protocol on Trade outlines the objectives as follows:
To further liberalize intra-regional trade in goods and services on the basis of fair, mutually equitable
and beneficial trade arrangements, complemented by Protocols in other areas;
To ensure efficient production within SADC reflecting the current and dynamic comparative
advantages of its Members;
To contribute towards the improvements of the climate for domestic cross-border and foreign
investment;
To enhance the economic development, diversification and industrialisation of the Region; and
To establish a Free Trade Area in the SADC region
It is important to note that the purpose of the Protocol is not only to eliminate tariff and non-tariff barriers to
intra-SADC trade, but also as a vehicle to foster industrial development and competitiveness as well as trade
facilitation.
Currently only twelve out of 15 SADC Member States are participating in the SADC FTA. Angola, DRC and
Seychelles are not participating in the SADC FTA. Despite several calls by other SADC Member States, Angola
and DRC continue to be reluctant to open up their markets to regional imports, yet these are important
destinations for Namibia’s exports. Seychelles’ tariff phase down offer was approved in July 2014 but its
accession process is not yet finalized.
4.2 Tariff Liberalization in the SADC FTA
A phased elimination of tariffs and non-tariff barriers was set within a time frame of eight years from entry
into force, such that by 2008 about 80% of intra-SADC trade should be duty free. Tariff phase down was to be
completed by 2012, except for Mozambique whose phase down of tariffs on South African imports would be
complete by 2015.

Page 40 of 69
As part of SACU, with a common external tariff, Namibia’s tariff liberalization had to be done jointly with its
SACU partners. The SACU offer was frontloaded, meaning that SACU countries had to liberalize their tariffs
faster than their SADC partners such that by 2008 they completed their tariff phase down process. Other SADC
countries backloaded their tariffs, especially for sensitive products until 2012. Nevertheless, Namibia enjoyed
more market access to the SADC market than South Africa as SACU exports to the rest of SADC were treated
differently from those originating from South Africa. The SADC FTA is not 100% duty-free as there are excluded
products such that:
SACU countries have excluded 31 tariff lines on sugar and sugar products, used clothing and motor
vehicles parts;
Malawi has excluded 19 tariff lines on sugar, weapons and ammunition;
Mozambique has excluded 19 tariff lines on ivory, weapons and ammunition;
Tanzania has excluded 19 tariff lines on ivory and other restricted animal hides/materials, weapons
and ammunition, opium and propellant powder (explosive);
Zimbabwe has the largest exclusion on jet/specialised fuels, vehicles/parts; rear view mirrors; used
clothing, radioactive products, used tyres and precious metals; and
All SADC Member States have excluded Chapter 93 on weapons and ammunition.
Table 6 and 7 below summarise the tariff liberalization offers by SADC Member States during the
implementation of their tariff phase down obligations.
Table 6: SADC offer without South Africa (percent of tariff lines at zero)
Country offering preference #Tariff lines 2001 2005 2006 2007 2008 2012
Malawi 5 443 33,4 33,4 48,7 85,3 85,3 99,7
Mauritius 5 479 69,7 90,5 90,5 90,5 90,5 100
Mozambique 5 246 30,1 30,1 30,1 30,1 94 99,6
SACU 7 802 63,9 94,6 99,3 99,3 99,3 99,3
Tanzania 6 066 17,5 24,4 42,8 43,1 86,3 99,3
Zambia 6 066 54,2 54,2 95,9 95,9 95,9 100
Zimbabwe 7 167 30,7 30,7 72,2 72,2 89,8 98,7
Source: Hartzenberg and Kalenga (2015)

Page 41 of 69
Table 7: SADC offer to South Africa (percent of tariff lines at zero)
Country offering preference #Tariff lines 2001 2005 2006 2007 2008 2012
Malawi 5 443 33,4 33,4 34,8 34,8 84,9 99,7
Mauritius 5 479 69,4 69,7 69,7 90,5 90,5 100
Mozambique 5 246 28,1 28,1 28,1 28,1 92,6 92,6
Tanzania 6 215 15,7 15,7 15,7 15,9 84,6 99,3
Zambia 6 066 32,1 32,1 40 40 95,9 100
Zimbabwe 5 957 32,1 44 48,4 55,4 71,6 82,1
Source: Hartzenberg and Kalenga (2015)
Efforts to bring the three remaining members into the SADC FTA shows that since 2002, Angola has not made
any progress to participate in the SADC FTA, The DRC has made some progress resulting in the roadmap
towards its accession and in terms of that roadmap, its accession to the Protocol on Trade is January 2015.
However, sources from the Secretariat indicated that its roadmap has not yet implemented to date. For the
Seychelles, the tariff offer was approved in July 2014 by the Committee of Ministers responsible for trade and
the its accession process was to be finalised within a period of one year. Seychelles’ tariff offer consisted of
5673 tariff lines treated as follows:
4884 tariff lines (86 per cent) are for immediate liberalization;
103 tariff lines (2 per cent) are for gradual liberalization up to 8 years;
379 tariff lines (7 per cent) are for gradual liberalization up to 12 years; and
307 tariff lines (5 per cent) are excluded from tariff liberalization.
SADC Member States have made considerable progress in their implementation of tariff phase down
obligations with few exceptions due to derogations as shown below:
SACU completed its tariff phase down by 2008;
Madagascar, Mauritius and Zambia have implemented their tariff phase down obligations while
Mozambique has completed its tariff phase down commitments with other SADC Member States
except South Africa. The tariff phase down for South Africa will be completed by 2015;
Malawi has completed its tariff phase downs commitments to all SADC members with the exception
of South Africa.
The tariff phase down on some imports from South Africa is still to be finalised based on the
derogation granted;

Page 42 of 69
Tanzania has completed its tariff phase down on all products except for sugar and paper products,
which Tanzania unilaterally reinstated duties that were already at zero and derogation is currently
being sought; and
Zimbabwe was granted derogation from implementing its tariff phase down obligation on Category C
products (sensitive products) until 2012 and its tariff phase down obligation is to complete by 2014.
4.3 Products in the process of tariff liberalization
During the implementation of the SADC Protocol on Trade since 2000, Member States committed to the
process of tariff phase down programme to eliminate duties on products traded between them. Products
regarded sensitive are classified as (Category C) where gradual liberalization would take up to 12 years.
Despite this commitment, the majority of some non SACU SADC countries participating in the SADC FTA have
backloaded the tariff liberalization with a list of sensitive products towards the end of the phase down periods
(2012). Most of these sensitive products are those that the region, including Namibia, has the capacity to
produce and have potential for trade expansion. Sensitive products under the SADC Protocol on Trade consist
of about 2.8% of all agricultural products (cereals, clothing/cotton, textiles dairy products, sugar and motor
vehicle products) as depicted by the table below.
Table 8: Sensitive products by some SADC countries
Malawi South Africa Mozambique Zimbabwe
Arms and ammunition Dairy products Textiles Textiles
Sugar Wheat and meslin Apparel Footwear
Matches Sugar and sugar Sugar
confectionary
Textiles
Footwear
Vehicles
Source: Maringwa, 2009

Page 43 of 69
The fact that the world market is distorted, sugar is considered sensitive in most SADC sugar producing
countries and required a special dispensation due to the fluctuation of the prices in the world market. Due to
this sensitivity, most SADC countries applied trade policy instruments such tariff and non-tariff barriers to
protect sugar in the region. In terms of the agreement, the agreement makes provision for non-reciprocal duty
free market access for non-SACU SADC sugar producers to export sugar to the SACU market based on the
allocation of the quota. The garments/textiles as well wheat flour are also considered sensitive and therefore
required a different treatment under the SADC Protocol on Trade (Maringwa, 2009)
4.4 Rules of origin
The SADC rules of origin are contained in Annex I2 of the SADC Protocol on Trade, hereinafter referred to as
‘the Protocol’. The definitions3 and interpretation of the terms used in the Annex are contained in Rule I.
Substantive rules are covered under Rules 2 to 8, while Rules 9 to 12 contain customs procedures designed to
monitor and enforce the application of rules of origin. Appendix I of Annex II and Article 7 of the same
Protocol provide further information on the rules of origin. The Protocol sets out the fundamental
requirements for goods to be considered as originating from SADC if the product is “wholly obtained in one of
the Parties, or the non-originating materials incorporated in the product have undergone sufficient working or
processing in accordance with the conditions set out in Appendix I of Annex I; or the value of all non-
originating materials does not exceed ten per cent of the ex-works price of the good” (WTO, 2007).
Generally, SADC considered primary and agricultural products “to be wholly produced or obtained in the
region” after prolonged negotiations which resulted in the SADC rules of origin following a product-specific or
line by line approach which are expensive and restrictive. The multiple transformation rules have come to
replace the requirement of change of tariff heading while the requirements on the regional value addition of
35% were increased in order to reduce the acceptable levels of import content. After the amendment of the
SADC Protocol on Trade, rules of origin were totally different from the originally agreed rules and they had
“made-to-measure and product specific requirements”. One could compare these rules to those in developed
and industrialized nations such as the European Union (EU) and the 1999 EU – South Africa Trade and
Development Cooperation Agreement (TDCA).
2Annex I contains rules of origin for products to be traded between SADC Member States.
3The definition of terms include amongst others: ex-factory cost which means the value of the total inputs required to produce a
given product; Materials which means raw materials, semi-finished products, ingredients, parts and components used in the
production of goods; value added to mean the difference between the ex-factory cost of the finished product and the value of
the materials imported from outside the Member States and used in production.

Page 44 of 69
With regard to textiles and clothing, the initial agreement was that all the material used as inputs in the
production of textiles and clothing from yarn to fabric should be sourced from within the SADC Member States
to qualify for tariff preferences. In putting this agreement into force, SADC recognised the challenges faced by
Member States as a result of different levels of economic development and because of this, temporary
measures were put in place to allow countries that are classified as least developed countries (LDCs)4 to qualify
for a concession5. The concession was granted to these Member States on a temporary basis to allow them to
produce and trade textiles and clothing. In granting this concession, the agreement was that textiles and
clothing should be produced in these Member States without any limitation on where the raw materials such
as yarn and fabric are coming from. In other words, they were allowed to source their inputs from anywhere in
the world.
Negotiations on rules of origin were controversial as some members (especially those with a considerable
domestic industrial capacity) sought to use rules of origin to achieve other trade and industrial policy
objectives other than the prevention of trade deflection. Namibia’s participation in the SADC FTA has
experienced some sort of trade deflection due to her membership in SACU, which has a different set of
external tariffs.
The double stage transformation rule currently applicable to trade in textiles/garments and clothing in SADC
undermines the ability of Namibia to source cheap global inputs to expand local production and gain
preferential access to the region. For example the previous experience of Ramatex operations in Namibia
where textiles and clothing produced could not qualify for exports to SADC market and enjoy tariff preferences
due to the single stage transformation rule. For Namibia, with limited domestic industrial production capacity,
a single stage transformation rule that requires a country to source cheap inputs globally and perform one
stage transformation and export to SADC market would have created more export opportunities and
maximised trade gains. However, the experience of Ramatex operations in Namibia indicated that the current
double stage transformation rule has jeopardized Namibia’s opportunities to maximise its export to the region,
thereby diverting such exports to the US market.
4LDCs in this case are: Malawi, Mozambique, Tanzania and Zambia.
5Conditions for rules of origin are set out inAppendix V to Annex I of the Protocol for imports of textiles and clothing from
MMTZ into the SACU market.

Page 45 of 69
It is therefore important that the SADC FTA should be re-designed in the manner that rules of origin should be
simplified to accommodate each member country’s interest and more in particular respect each member’s
comparative advantage and not to adopt a one-fit-all approach.
4.5 Other constraints
Undoubtedly, tariffs have become widely known as one of the trade policy measures of many countries in the
world. Despite their importance as trade policy measures, their importance has been declining. This is due to
the formation of regional and multilateral trade agreements leading to trade liberalization. While tariffs have
been trending downwards due to the presence of regional trade arrangements between countries, Non-Tariff
Barriers (NTBs) put pressure and present obstacles to the free flow of goods. The SADC region is not immune
to this challenge as NTBs have been regarded as key constraints to increasing intra-regional trade in SADC.
Article 6 of the SADC Protocol on Trade provides for SADC Member States to “adopt policies and implement
measures to eliminate all existing forms of NTBs and refrain from imposing any new NTBs. NTBs are defined by
the Protocol to mean any barrier to trade other than import and export duties.” The Protocol has made further
provisions that are contained under Article 7 and 8 and calls for SADC to remove any barriers associated with
quantitative restrictions on import and export (USAID, 2012). In implementing these provisions, the following
types of NTBs have been identified by SADC as major NTBs for elimination:
Cumbersome customs documentation and procedures;
Cumbersome import and export licensing/permits;
Import and export quotas;
Unnecessary import bans and prohibitions;
Import charges not falling within the definition of import duties;
Restrictive single channel marketing;
Prohibitive transit charges;
Complicated VISA requirements;
Pre-shipment inspection; or
National food security restrictions.
The SADC Protocol on Trade has made some provisions for general exceptions on NTBs that can be introduced
by Member States aimed at promoting public policy objectives and those that are for security reasons. Such
provisions are envisaged under Article 9 and 10 of the SADC Protocol on Trade.
Article 9 states that: “Subject to the requirement that such measures are not applied in a manner which would
constitute a means of arbitrary or unjustifiable discrimination between Member States, or a disguised

Page 46 of 69
restriction on intra-SADC trade, nothing in Article 7 and 8 of this Protocol shall be construed as to prevent the
adoption or enforcement of any measures by a Member State”:
Necessary to protect public morals or to maintain public order;
Necessary to protect human, animal or plant life or health;
Necessary to secure compliance with laws and regulations which are consistent with the provisions of
the World Trade Organization (WTO);
Necessary to protect intellectual property rights, or to prevent deceptive trade practices;
Relating to transfer of gold, silver, precious and semi-precious stones, including precious and strategic
metals;
Imposed for the protection of national treasures of artistic, historic or archaeological value;
Necessary to prevent or relieve critical shortages of foodstuffs in any exporting Member State;
Relating to the conservation of exhaustible natural resources and the environment; or
Necessary to ensure compliance with existing obligations under international agreements.
In the same spirit, Article 10 of the SADC Protocol on Trade says that: “Nothing in this Protocol shall prevent
any Member States from taking measures which it considers necessary for the protection of its security
interests or for the purpose of maintaining peace and that the concerned Member State shall notify the
Committee of Ministers responsible for Trade (CMT) of any such measures”.
The 2012 Audit review shows that SADC Member States have made substantial progress in addressing the
Non-Tariff Barriers (NTBs) in the region. This was facilitated by the introduction of the On-line NTB Reporting
Mechanism System in SADC to detect and fast-track anything suspected to be a barrier to trade. The online
report on NTBs released in March 2011 by the World Bank made some estimates that NTBs impact negatively
on the SADC intra-regional trade.
Presented below is a summary of some Non-Tariff Barriers to trade reported by SADC Member States
concerning goods and potential trade affected.

Page 47 of 69
Table 9: NTBs to trade reported by SADC Member States
Rank NTB Goods Affected
Value of intra-SADC
trade (2008) USD
Millions (% of total non-
fuel intra-SADC trade)
1 Import Quotas Wheat, poultry, flour, tobacco, cement, sugar, maize, salt, eggs, fruit and vegetables, maize meal
1,013.15 (6.1%)
2 Import Permits and Licensing
Milk (sterilised, UHT), breads, eggs, sugar, fruits and vegetables, livestock, liquor, cooking oils, maize, oysters
892.85 (5.4%)
3 Single marketing channels
Wheat, meat, dairy, tea and tobacco, sugar 880.52 (5.3%)
4 Customs related Wine, electronic equipment, copper, concentrate, salt, cosmetics, medicines
853.61 (5.2%)
5 Import levies: Import permits and licensing
Milk (sterilised, UHT), pasta, sorghum, eggs, sugar, dairy, livestock, pork, poultry, liquor/beer, wheat
823.05 (5.0%)
6 Export taxes Dried beans, live animals, hides and skins, sugar, tobacco, maize, meat, wood, coffee
791.92 (4.8%)
7 Import bans Wheat, beer, poultry, wheat flour, meat products, maize, milk (sterilized, UHT)
523.97 (3.2%)
8 Rules of Origin Textiles and Clothing, palm oil, soap, cake decorations, rice, curry powder, wheat flour, semi-trailers
488.55 (3.0%)
9 Preferences denied Salt, fishmeal, pasta 61.79 (0.4%)
Source: Technical Report: 2012 Audit of the Implementation of the SADC Protocol on Trade
The following tables show category of NTBs that affect Namibia’s export performance.
Table 10:Trade Related Administrative NTBs
NT
B N
o.
Pro
duct
NT
B C
ate
gory
Report
ing C
ountr
y
Imposin
g C
ountr
y
Description o
f N
TB
Inte
rvention /
P
rioritized a
ction
Institu
tion
Responsib
le f
or
Addre
ssin
g N
TB
Com
ment
by
Imposin
g C
ountr
y
354 All Trade Related Administrative NTBs
Namibia ZambiaA deposit of USD50,000 in a non interestbearing government facility is required for Namibian companies to register a business in Zambia. This deposit is too excessive.
H x
M L
Impact
to B
usin
ess
Source: http//ntb.africonnect.com : COMESA-EAC-SADC NTBs Online system, SADC Secretariat, 13
April 2010

Page 48 of 69
Table 11: Customs Documentation and Clearance Procedures T
B N
o.
Pro
du
ct
NT
B C
ateg
ory
Rep
ortin
g
Co
un
try
Imp
os
ing
Co
un
try
Descrip
tio
n o
f
NT
B
Interven
tio
n/
Prio
rit
ized
Actio
n
Ins
tit
utio
n
Resp
on
sib
le f
or
Ad
dre
ssin
g N
TB
Co
mm
en
t b
y
Imp
os
ing
Co
un
try
H M L
245 All Pre-Shipment Inspection
Namibia Angola The acquisition of Pre-shipment inspection numbers and consequent inspection of shipments for exports to Angola make transport pre-planning quite difficult and cause lengthy delays for the transport industry.
x
253 All Clearance Procedures
Namibia Angola Clearance of goods by ONDJIVA customs at the Oshikango/Santa Clara border post is time consuming (Red Tape/ inefficient bureaucracy)
254 All Clearance Procedures
Namibia Angola Lack of harmonized procedures between Namibian and Angolan customs authorities make exports into Angola very difficult and generally frustrating.
x
257 All Customs Documentation
Namibia Zimbabwe
Imports from Zimbabwe are often delayed due to ever-changing customs document requirements by Zimbabwe customs officials at the Vic Falls border crossing.
x ZIMRA is not aware of any changes in 268 All Pre-
Shipment Inspection
Namibia Namibia
Inspections, sealing / tagging of cargo cause major delays.
x
Imp
act t
o
Bu
sin
ess
Source: http//ntb.africonnect.com , COMESA-EAC-SADC NTBs Online system, SADC Secretariat, 13 April 2010
Table 9 to 11 above show various forms of non-tariff barriers (NTBs) that affect Namibia export performance in
the SADC region. These NTBs range from those related to administrative to customs, documentation and
clearance procedures. There are however, others not listed in the table and have similar effects on the export
performance. Such NTBs are those related to immigration and transit, sanitary and phyto-sanitary measures as
well as payments procedures such that exporting for example to (Angola) requires Namibia’s exporters to
make electronic transfer and Angolan banking system is not properly functioning, a situation that created
unnecessary delays and frustrate exporters doing business in Angola.

Page 49 of 69
CHAPTER 5: RESULTS OF THE STUDY
5.1 Introduction
This section presents the results of the study. It focuses on Namibia’s trade performance with SADC countries
between 2000 and 2012. This is done first by identifying export trends to individual SADC Member States, and
secondly to measure the trend between 2000 and 2012. In analysing the data, comparison has been made on
the basis of the data collected to measure the trend observed between 2000 and 2007 compared to the period
from 2008 to 2012 to see whether the attainment of the SADC FTA in August 2008 has had any influence on
export trends.
The study examines the SADC FTA and its importance to Namibia by assessing the extent to which it has
maximized export opportunities for Namibia. It also identifies existing constraints that Namibia’s exporters
have been experiencing in accessing the SADC market and provides trade policy recommendations for
enhancing the country’s potential benefits from its participation in the SADC trade integration process.
To answer the research question, the study employed a desktop review to analyse Namibia’s export data to
the SADC market for the above-mentioned period. Data was obtained from the Namibia Statistics Agency
(NSA) for that period. Secondary data was sourced from internet sources, books, publications, journals, articles
and findings of annual Audit Reports of the implementation of the Protocol on Trade (2007 to 2012). Import
and export values are the key variables used in the study. The data collected are reported in Namibian dollars
(N$) throughout the period. The analysis is informed by a qualitative investigation of Namibia’s export trade
profile to SADC. The top ten products exported to SADC were identified. In doing this, the author has not only
found the most significant products exported to the region, but also monitored the trend to see if intra-SADC
tariff liberalization has influenced export performance. In this case, the tariff phase downs of other SADC
countries have been looked at in relation to Namibia. Selected exporters in the top exporting sectors to SADC
were also interviewed.
As part of data collection, ten (10) questionnaires were distributed. The author conducted interviews with key
selected exporters in the top ten exporting sectors to the SADC region. In exploring the data, the study used a
non-scientific approach as well as non-statistical methods in analysing the data. Thus, the author relied upon
the available literature through document reviews and face-to-face interviews. The results of the
questionnaires shows that the majority of the key products such as fish, beer and beef exported to the region
are destined for South African market and few products (beer and fish) are exported to Angola, DRC,
Mozambique, Tanzania, Zambia and Zimbabwe. Exporters to these markets experience high tariff barriers
especially in Angola and DRC while non-tariff barriers, cumbersome customs, and administrative procedures
are also experienced at some borders.

Page 50 of 69
5.2 Namibia’s trade performance with SADC
Table 12 below shows the comparison between total exports and imports by Namibia during the period 2000
to 2012. As can be seen on the chart, imports have been dominating throughout the period under
investigation. Although Namibia’s total exports to SADC Member States increased from 2000 to 2009, there
was a decline in total exports for Namibia between 2010 and 2011 before picking up again in 2012. The decline
in the level of exports is attributed to the effects of the global financial crisis which affected Namibia’s export
performance to the SADC region. Due to the small size and openness of the Namibian economy, these effects
were transmitted to Namibia through international trade. Observing the trends between exports and imports,
it is evident to conclude that despite the upward trend depicted by exports performance since 2000 to 2012,
Namibia still remains a net importer of goods from the SADC region.
Table 12: Namibia’s total exports and imports
YEAR TOTAL EXPORTS TOTAL IMPORTS
2000 3,056,206,548 8,506,991,3612001 3,188,897,395 9,346,201,8902002 5,533,826,993 10,067,726,2002003 6,753,256,653 13,635,860,9622004 6,167,394,431 13,881,758,5992005 6,809,685,908 14,263,581,7772006 8,581,221,221 17,958,498,0952007 11,991,242,756 24,525,591,3562008 18,664,079,388 29,553,188,9652009 19,092,742,820 37,060,636,9282010 13,229,228,626 34,322,595,9762011 13,761,265,508 37,223,002,6002012 17,645,830,077 44,747,142,928
Source: Namibia Statistics Agency (NSA), 2013
Table 12 shows that in 2000, Namibia imported goods to the tune of N$8,507 billion from SADC and exported
to SADC a total amount of N$ 3.056 billion. In 2012, total imports amounted to N$44,747 billion and exports
amounted to N$17,646 billion, representing a (82.7 percentage increase) in export performance from 2000 to
2012.

Page 51 of 69
Figure 6: Namibia’s total exports and imports
Source: Namibia Statistics Agency, 2013
Figure 7: Namibia’s exports to SADC
Namibia’s
exports to
0
5,000,000,000
10,000,000,000
15,000,000,000
20,000,000,000
25,000,000,000
30,000,000,000
35,000,000,000
40,000,000,000
45,000,000,000
50,000,000,000
20
00
20
01
20
02
20
03
20
04
20
05
20
06
20
07
20
08
20
09
20
10
20
11
20
12
Tota
l exp
orts
and
im
ports
in
N$
Years
TOTAL EXPORTS
TOTAL IMPORTS
0
2,000,000,000
4,000,000,000
6,000,000,000
8,000,000,000
10,000,000,000
12,000,000,000
14,000,000,000
Expo
rts in
N$
SADC countries
2000
2001
2002
2003
2004
2005
2006
2007
2008
2009
2010
2011
2012

Page 52 of 69
individual SADC Member States for the period 2000 to 2012 are presented in Figure 7 above. Namibia’s trade
is mostly concentrated on the Republic of South Africa. The South African market accounts for the biggest
exports for Namibia. Namibia’s total exports to South Africa increased from N$2,318 billion in 2000 to
N$7,699 in 2012, representing a (69.9 percentage increase). In 2008, Namibia’s trade with South Africa was
extremely very high, representing a total export figure of N$13,135 billion. This was the highest export figure
recorded for the period under review. Angola appears to be the second market for Namibia with export
increased from N$ 578 million in 2001 to N$ 4129 billion in 2012, representing a (86.0 percentage increase).
The Democratic Republic of the Congo (DRC) emerges as the third export market for Namibia. Export data for
DRC in 2000 to 2003 is not available, but there has been an increase in export from N$ 65 million in 2004 to N$
837 million in 2012, representing a (92.2 percentage increase). Angola and DRC are not members of the SADC
FTA and as such trade between Namibia and them is conducted on an MFN basis.
Various factors can explain this export performance between Namibia and South Africa. One of them is due to
Namibia’s membership in the Southern African Customs Union (SACU), in which goods circulate duty free.
Namibia also belong to the Common Monetary Area (CMA), thereby the South African currency is accepted as
a legal tender. The Namibian dollar is pegged to the South African rand on a one to one ratio. The currency
pegging arrangements have made it cheaper and more convenient for exporters in Namibia to export to South
Africa easily without the need to seek foreign currencies. Therefore, increased Namibian exports to South
Africa cannot be attributed to the SADC FTA, but largely to the existence of a duty-free relationship in the
context of SACU and other integration levels such as the CMA arrangement, geographical proximity and past
colonial linkages.
The exports trend to other SADC member countries shows a fluctuation in export performance with slow
export performance recorded with Madagascar and little bit with Mozambique, Zambia and Zimbabwe. This
general trend indicates that Namibia export opportunities to SADC has not been maximised despite member
countries participating in the SADC FTA.
From the data presented in Figure 7, which shows Namibia’s exports to individual SADC Member States, the
author observed that for the period 2000 to 2012, higher export figures were concentrated mainly on South
Africa. This means that if South Africa is included together with the rest of the SADC Member States, export
amounts to some countries have been insignificant.
Figure 8 shows export values to all countries excluding South Africa. This reveals clearly that Angola is
Namibia’s second market after South Africa, followed by DRC, Botswana and then some small amount of
exports to Zambia, Zimbabwe, Mozambique and Tanzania. High exports to Botswana were experienced in
2012 due to high export levels of diamonds by Namibia.

Page 53 of 69
Figure 8: Namibia’s exports to SADC excluding South Africa
Source: Compiled by author with data from Namibia Statistics Agency, 2013
5.3 Top Namibia export products to SADC
Table 13 to 15 below present the top ten (10) products Namibia exports to SADC market. Table 13 specifically
shows the top ten products that Namibia has been exporting to SADC before the attainment of the SADC FTA.
The SADC FTA was achieved in 2008 when 85% tariff lines became duty free. The implementation of the tariff
phase down programme was to be completed in 2012. Looking at the products exported before and after the
SADC FTA came into play, there is no significant change in the composition of export basket for Namibia as
products exported remained the same for the whole period. The only change observed is the change in
products position. For example, beer made from malt is the third key exported products from Namibia in 2000,
but in 2008 and 2012 is the second on the list in terms of export value. This implies that despite the attainment
of the SADC FTA in 2008, it has not been successful in diversifying Namibia’s export basket and foster the
country’s opportunities to maximise its exports.
Namibia's exports to SADC excluding SA
0
1
2
3
4
5
6
ANG
OLA
BOTS
WAN
A
DRC
LESO
THO
MAD
AGAS
CAR
MAU
RITI
US
MAL
AWI
MO
ZAM
BIQ
UE
SEYC
HEL
LES
SWAZ
ILAN
D
TAN
ZAN
IA
ZAM
BIA
ZIM
BABW
E
Billi
ons
Exp
ort
s in
N$
2000
2001
2002
2003
2004
2005
2006
2007
2008
2009
2010
2011
2012

Page 54 of 69
Table 13: Top 10 products Namibia exported (in N$) to SADC in 2000
HS Code Description 2000
490700 New stamps; stamp-impressed paper; cheque forms; banknotes, etc 681,932,497
710231 Non-industrial diamonds unworked or simply sawn, cleaved or bruted 295,150,931
220300 Beer made from malt 225,213,174
710813 Semi-manufactured gold (incl. gold plated with platinum), non-monetary 182,793,578
271000 Petroleum oils, etc, (excl. crude); preparations thereof, nes 126,715,515
220290 Other non-alcoholic beverages, nes 101,663,952
020230 Frozen boneless bovine meat 69,333,656
030420 Frozen fish fillets 59,330,358
160413 Prepared or preserved sardines, sardinella, brisling or sprats (excl.minced) 52,023,356
010410 Live sheep 47,070,253
Source: Namibia Statistics Agency, 2013
Table 14: Top 10 products Namibia exported (in N$) to SADC in 2008
HS Code HS 2008
49070010 Postage stamps, revenue stamps and banknotes 6,884,214,496
22030000 Beer made from malt 958,741,967
26080000 Zinc ores and concentrates 640,956,015
71081300 Semi-manufactured gold (incl. gold plated with platinum), non-monetary
505,302,452
87032390 other vehicles of a cylinder capacity exceeding 1500cmcb but not exc. 3000cmcb NESU
406,411,926
79011200 Zinc, not alloyed, <99.99% pure 400,470,075
01029000 Live bovine animals, other than pure-bred breeding 384,448,051
02023000 Frozen boneless bovine meat 376,606,028
02013000 Fresh or chilled boneless bovine meat 349,799,793
03037400 Fish, Frozen (excl.) - Frozen mackerel (Scomberscombrus, Scomberaustralasicus, Scomber)
327,631,144
Source: Namibia Statistics Agency, 2013

Page 55 of 69
Table 15: Top 10 products Namibia exported (in N$) to SADC in 2012
HS Code Description 2012
71023100 Non-industrial diamonds unworked or simply sawn, cleaved or bruted
2,576,111,823
22030090 Beer made from malt – Other 1,296,200,654
71081300 Semi-manufactured gold (incl. gold plated with platinum), non-monetary
1,010,312,054
03038900 Other frozen fish, nes 917,971,178
03035400 Frozen Mackerel (Scomberscombrus, Scomberaustralasicus Scomberjaponicus)
609,250,726
87032390 other vehicles of a cylinder capacity exceeding 1500cmcb but not exc. 3000cmcb NESU
594,005,267
02013000 Fresh or chilled boneless bovine meat 358,443,212
01022100 Live Cattle Pure-bred breeding animals 320,544,139
03036600 Frozen Hake (Merluxxius spp. Urophycisspp) 271,698,674
02041000 Fresh or chilled lamb carcasses and half carcasses 257,371,716
Source: Namibia Statistics Agency, 2013

Page 56 of 69
CHAPTER 6: DISCUSSION
This section discusses the results of the study. It also highlights the challenges that constrain Namibia to
maximise export opportunities created by the SADC FTA.
6.1 Namibia’s export performance
The study has revealed that Namibia’s exports to the SADC region has increased by 82.7% between 2000 and
2012. South Africa, Angola and DRC have remained the top three export destinations. However, this
development cannot be attributed to the SADC FTA. This is because the majority of the products exported by
Namibia are destined for the SACU market, mainly South Africa. South Africa accounts for the biggest amount,
representing about 69.9 percentage increase in exports from 2000 to 2012. The largest chunk to South Africa is
due to the nature of the Southern African Customs Union (SACU) arrangements that Namibia is a member.
Figure 7 further explains this evidence and the explanation presented in table 13 to 15 above.
The study has also revealed Namibia’s top ten export products to the region. These are postage stamps,
revenue stamps and banknotes, beer made from malt, frozen horse mackerel, frozen hake, non-industrial
diamonds unworked and semi-manufactured gold amongst others. Other products are presented in the table
13 to 15 above for further information. It is evident that the country’s export profile to the region has remain
relatively unchanged over the period under study. This means that the SADC FTA has not ignite Namibia’s
export diversification.
6.2 Tariff phase down process
The study revealed that since the implementation of the SADC Protocol on Trade in 2000, the majority of SADC
Member States made a commitment to liberalize intra-regional trade. This was achieved through the
implementation of the tariff phase-down programme over a period of 12 years (2000 to 2012) by those
Member States that are participating in the SADC FTA. Despite this commitment, the majority of non SACU
SADC countries have backloaded their tariff phase down schedules on sensitive products towards the end of
the phase down periods (2012). Most of these sensitive products are those that the region, including Namibia,
has the capacity to produce and have potential for trade expansion. Although the current membership of SADC
comprises 15 Member States, only 12 Member States are participating in the SADC FTA, leaving Angola, the
Democratic Republic of the Congo (DRC) and the Seychelles outside the SADC FTA.
6.3 Rules of origin
The study found that the application of SADC rules of origin follow a product-specific or line-by-line approach.
The study also reveals that negotiations on rules of origin were controversial as some members (especially
those with a considerable domestic industrial capacity) sought to use rules of origin to achieve other trade and
industrial policy objectives other than the prevention of trade deflection. Namibia’s participation in the SADC

Page 57 of 69
FTA has experienced some sort of trade deflection due to her membership in SACU, which has a different set
of external tariffs.
The study further shows that the double stage transformation rule currently applicable to trade in
textiles/garments and clothing in SADC undermines the ability of Namibia to source cheap global inputs to
expand local production and gain preferential access to the region. For example, the previous experience of
Ramatex operations in Namibia where textiles and clothing produced could not qualify for exports to SADC
market and enjoy tariff preferences due to the double stage transformation rule.
For Namibia, with limited domestic industrial production capacity, a single stage transformation rule that
requires a country to source cheap inputs globally and perform one stage transformation and export to SADC
market would have created more export opportunities and maximised trade gains. However, the experience of
Ramatex operations in Namibia indicated that the current double stage transformation rule has jeopardized
Namibia’s opportunities to maximise its export to the region, thereby diverting such exports to the US market.
6.4 Non-Tariff Barriers (NTBs)
The SADC region has made notable progress on the elimination of tariff barriers to intra-regional trade over
the past 12 years since the implementation of the SADC Protocol on Trade in 2000. The study found that
despite this good progress and effort by most Member States, the region is still experiencing a persistent
increase in the number of NTBs in one form or the other. These NTBs range from those related to
administrative to customs, documentation and clearance procedures. However, others have similar effects on
the export performance. Such NTBs are those related to immigration and transit, sanitary and phyto-sanitary
measures as well as payments procedures. Some NTBs are of agricultural nature applied on goods such as
sugar, maize, meat products (including chicken), dairy products, tea, timber products and seasonal vegetables.
The study reveals that these NTBs undermine trade expansion and export performance particularly for
Namibia to SADC.
6.5 Customs and trade facilitation
The study revealed that customs administration and procedures in SADC appear to be the main NTBs in the
Region as the way customs matters are handled differs from one country to another. Some countries have
proper and very efficient computerized systems in place linking traders and customs in the region, allowing the
clearance of goods in a few hours while others have very bureaucratic, manual and corrupt systems which are
inefficient as goods take weeks and months to clear. Some countries have however improved the
harmonization of documentation and increased the application of IT solutions as a result of the introduction of
automated systems such as ASYCUDA, the utilization of the SADC Certificate of Origin. These are some of the
success stories reported as far as customs procedures are concerned.

Page 58 of 69
6.6 Infrastructure deficit
Generally, infrastructure deficit may not be defined as an NTB but in the context of this study it is regarded as
a constraint to trade facilitation in the region. Having quality infrastructure in place is the best way to facilitate
trade and link SADC countries to each other. The literature review highlighted that weak infrastructure such as
poor road, rail, air and port facilities, especially in SADC, represent barriers to trade.Imani Development
Austral Pty Ltd (2004) indicates that the transport cost and time taken to transport goods ”to the land-locked
SADC countries (internal transport often costing as much or more than the cost of shipping a product from
overseas). Variable tolls, variable axle-loading regulations, different insurance and bond guarantee systems etc
all add to the burden of moving goods within the region”. Many countries in SADC prefer the use of trucks as a
mode of transport but in consideration of the distance, time and the destructive effects trucks have on roads,
it makes economic sense to integrate rail systems between all SADC members.
6.7 Inadequate industrial base
The study reveals that the structure of the Namibian economy has remained almost static over the past
decade. The structure of production and trade patterns has remained unchanged, thus requiring structural
transformation. In production, Namibia experiences supply-side constraints as its ability to manufacture goods
in large quantities is limited by the size of its domestic economy. Over the years, the country has been heavily
dependent on the primary commodities for export. The study reveals a number of challenges facing Namibia in
the diversification of export products. The heavy dependence on the extraction of minerals for export as well
agriculture and fishing activities provides limited opportunities for Namibia to diversify its production base.
The study further shows that the top ten (10) products Namibia exports to SADC are mainly primary products
which pose challenges in the country’s diversification of its export basket.
The study also found that the extent to which Namibia can maximise export opportunities from the SADC FTA
largely depend on the expansion of its productive base, particularly its ability to participate in regional value
chains in goods and services as part of a broader diversification strategy. Namibia’s participation in the SADC
FTA provides it with opportunities to expand and diversify its export markets.

Page 59 of 69
CHAPTER 7: CONCLUSION AND RECOMMENDATIONS
7.1 Conclusions
Undoubtedly, the available literature and empirical evidence revealed that the rationale for establishing a free
trade area is to eliminate tariff and non-tariff barriers to expand trade among members. FTAs create marginal
benefits measured in terms of trade creation or diversion. From a theoretical perspective, trade creation is
beneficial, but it is only possible when the FTA respects, comparative advantage of its members.
This study examined the SADC FTA and its importance to Namibia, particularly assessing the extent to which it
has maximized export opportunities for Namibia. It also identified a number existing constraints facing
Namibian’s exporters in accessing the SADC market. To examine whether the SADC FTA is of value to Namibia,
the study employed a desktop review to analyse Namibia’s export data to the SADC market for the period of
2000 to 2012. Secondary data was sourced from internet sources, books, publications, journals, articles and
findings of annual Audit Reports of the implementation of the Protocol on Trade (2007 to 2012.
The data collected are reported in Namibian dollars (N$) throughout the period. The analysis is informed by a
qualitative investigation of Namibia’s export trade profile to SADC. The top ten products exported to SADC
were identified. In doing this, the author has not only found the most significant products exported to the
region, but also monitored the trend to see if intra-SADC tariff liberalization has influenced export
performance. Selected exporters in the top exporting sectors to SADC were also interviewed. As part of data
collection, ten (10) questionnaires were distributed. The author conducted interviews with key selected
exporters in the top ten exporting sectors to the SADC region.
Noting that SADC comprises 15 Member States, and only 12 Member States are participating in the SADC FTA,
leaving Angola, the Democratic Republic of the Congo (DRC) and the Seychelles outside the SADC FTA. The
data analysis suggests that Namibia’s export performance is concentrated in SACU, mainly with South Africa.
Most of the top ten (10) products exported to the region are destined for South African market, with Angola
and DRC occupying the second and third places respectively. However, this trend to South Africa cannot be
attributed to the SADC FTA, but to the SACU arrangements. For Angola and DRC, it is also not because of the
SADC FTA as they are not participating in the FTA, but due to natural trade hypothesis.
The study revealed a number of obstacles undermining the ability of Namibia export performance to the
region. For example, the structure of the Namibian economy has remained almost static over the past decade.
The structure of production and trade patterns has remained unchanged, thus requiring structural
transformation. In production, Namibia experiences supply-side constraints as its ability to manufacture goods
in large quantities is limited by the size of its domestic economy. Over the years, the country has been heavily
dependent on the primary commodities for export as shown by the top ten products for exports. Challenges

Page 60 of 69
facing Namibia in the diversification of export products, heavy dependence on the extraction of minerals for
export as well agriculture and fishing activities provides limited opportunities for Namibia to diversify its
production base.
The design of the SADC FTA limits Namibia export opportunities, as it does not respect comparative
advantages of its members. For example, Namibia has limited domestic industrial production capacity, a single
stage transformation rule that requires a country to source cheap inputs globally and perform one stage
transformation and export to SADC market would have created more export opportunities and maximised
trade gains. However, the current double stage transformation rule has jeopardized Namibia’s opportunities to
maximise its export to the region, thereby diverting such exports to the other markets.
The study shows that even though there is FTA in place negotiations on rules of origin were controversial as
some members (especially those with a considerable domestic industrial capacity) sought to use rules of origin
to achieve other trade and industrial policy objectives other than the prevention of trade deflection. Namibia’s
participation in the SADC FTA has experienced some sort of trade deflection due to her membership in SACU,
which has a different set of external tariffs.
The non SACU SADC countries participating in the SADC FTA have backloaded the tariff liberalization with a list
of sensitive products towards the end of the phase down periods (2012). Most of these sensitive products are
those that the region, including Namibia, has the capacity to produce and have potential for trade expansion.
The list of sensitive products under the SADC Protocol on Trade consists of all agricultural products (cereals,
clothing/cotton, textiles dairy products, sugar and motor vehicle products).
It is evident that the SADC FTA has a potential to maximise Namibia’s export gains if Namibia could expand its
productive base, particularly its ability to participate in regional value chains in goods and services as part of a
broader diversification strategy.
7.2 Trade Policy Recommendations
While the SADC region celebrates a notable achievement of 85 per cent tariff lines that attained duty-free
status, there is still a need for Member States to adopt policies and implement measures to eliminate all
existing non-tariff barriers, as envisaged under Article 6 of the SADC Protocol on Trade. This is to ensure that
all Member States have access to each other markets without experiencing barriers to trade.
The study suggest that to maximise the trade potential of the FTA requires that tariff liberalization schedule
should be accompanied by measures to address trade facilitation and productive competitiveness challenges
in the trade integration arrangements. This has a potential to maximise export opportunities for members.

Page 61 of 69
This requires the redesign of the SADC FTA in the manner that respects comparative advantage of its members
by:
simplifying rules of origin that have been constraint to export performance;
adoption of a single stage transformation rule to enable countries like Namibia with limited domestic
industrial production capacity to source cheap inputs globally and perform one stage transformation
and export to SADC market; and
Address the NTBs introduced by other SADC members that undermine Namibia’s ability to expand its
export opportunities created by the SADC FTA.
There is also a need to develop a trade in services strategy in the context of SADC market integration agenda
particularly exploiting its geographic location as a transport and logistics hub for land-locked neighbouring
countries. A deliberate trade in services strategy as part of the consolidation of the SADC FTA, should focus on
transport, logistics and communication sectors. Namibia may also consider other services such as tourism,
health, education as they have potential to maximise the country’s export opportunities to the region.
Despite the smallness of the manufacturing sector it is an important export earning sector which is already
exporting manufactured goods such as cement, beverages and processed foods to South Africa, Angola and
DRC, hence a deliberate strategy to diversify export markets towards the entire SADC region. There is a need
for deliberate strategy such as Namibia’ Industrial Policy to participate in regional value chain as part of the
overall efforts to tap into global value chains.
Noting that Angola and DRC have not yet acceded to the SADC Protocol on Trade and therefore are not
participating in the SADC FTA, the study recommends that Namibia should engage these countries at a high
political level to join and fully participate in the SADC FTA.
The Republic of Angola and DRC offer the major export potential for Namibian products such as beer, cement,
dairy and milling products (for Angola) and frozen fish (in the case of DRC). Namibia’s political dialogue with
Angola should also be aimed at addressing those NTBs that the study found, such as high transport costs due
to poor road and infrastructure networks and cumbersome customs procedures which cause delays, along
with unpredictable and changing processes in Angola.
SADC Member States should address challenges associated with cumbersome customs procedures and other
non-tariff barriers on cement, dairy and milling products that Namibia exports. More specifically,
harmonization of customs procedures, simplification of the SADC rules of origin implementation of the Trade
Protocol provisions on NTBs, streamlining border management issues including improvement of trade-related
infrastructure provisions have high potential to unlock the exports opportunities for Namibian products to the
SADC region.

Page 62 of 69
There is also a potential to increase Namibia’s trade with Angola and DRC, if these countries fully participate in
the SADC FTA.
It also advisable for all SADC Member States to put in place interconnectivity and data exchange between
customs administrations and to implement electronic certificates of origin to facilitate the free movement of
goods.
Finally, it is recommended that Namibia should continue with her engagement in the negotiations process
towards the establishment of the Tripartite Free Trade Area as it may create a larger market for her export
opportunities.
Page 63 of 69
REFERENCES
Baier, S. L. & Berstrand, J, H. (2007). Do free trade agreements actually increase members’ international trade?
Journal of International Economics 71, 72–95. doi:10.1016/j.jinteco.2006.02.005
Bastian, J. (2011). Underwriting a recovery through exports? Opportunities in and obstacles for South East
Europe. Southeast European and Black Sea Studies, 11 (2), 117–132. doi:10.1080/14683857.2011.589160
Bowles, P., & MacLean, B. (1996). Understanding trade bloc formation: The case of the ASEAN free trade area.
Review of International Political Economy, 3 (2), 319–348. doi:10.1080/09692299608434358
Brenton, P., Flatters, F., & Kalenga, P. (2005). Rules origin and SADC: the case for change in the midterm review
of the SADC protocol on trade, African Region, Working Paper Series No:83
Cherry, J. (2012).Upgrading the “software”: the EU–Korea free trade agreement and sociocultural barriers to
trade and investment. The Pacific Review, 25 (2), 247–268. doi:10.1080/09512748.2012.658849
Chin, G., & Stubbs, R. (2011). China, regional institution-building and the China–ASEAN free trade area. Review
of International Political Economy, 18 (3), 277–298. doi:10.1080/09692291003762548
COMESA-EAC-SADC NTBs Online system, SADC Secretariat: http//www.ntb.africonnect.com, 13 April 2010
Cooper, W. H. (2012). Free trade agreements: impact on U.S. trade and implications for U.S. trade policy.
Congressional Research Service, 7-5700, RL31356
Devadason, E. S. (2010). ASEAN–China trade flows: moving forward with ACFTA. Journal of Contemporary
China, 19 (66), 653–674. doi:10.1080/10670564.2010.485403
German Development Institute (2011), Regional integration, economic development and global governance,
Edward Elgar Publishing Limited, UK
GFA Consulting Group, (2013).Implications for Namibia in the tripartite free trade agreement, Windhoek,
Namibia
GiZ (2014). Regional Economic Integration in SADC. Current Status of Key Economic Indicators – Regional
Economic Trends.
Immani Development Austral (2004). Regional trade facilitation programme
Kirk, R., & Stern, M. (2003).The new Southern African customs union agreement, Africa Region Working Paper
Series No. 57,June 2003.
Krishna, K. (2003).Understanding rules of origin. Pennsylvania State University and NBER

Page 64 of 69
Kureya, T., & Madzingira, N. (2011). Assessing the impact of free trade agreement (FTA) on the spread of HIV
and vice versa in the SADC region. Economic Commission for Africa. African Trade Policy Centre
Maringwa, J. (2009). Trade policy and trade flow analysis, SADC regional integration: what role has bilateral
trade agreements played in promoting intra-regional trade? Commonwealth Secretariat ‘Hub & Spokes’
Project
Martincus, C. V., & Gomez, S. M. (2010). Trade policy and export diversification: what should Colombia expect
from the FTA with the United States? The International Trade Journal, 24 (2), 100–148.
doi:10.1080/08853901003652344
Mutambara, T. F. (2013). Examining South Africa with the Southern African Development Community (SADC)
with the SADC free trade area in place, Rhodes University.
Rollo, J. (2011). The potential for deep integration between Australia and the European Union: what do the
trade statistics tell us? Australian Journal of International Affairs,65 (4), 394–409.
doi:10.1080/10357718.2011.586321
SADC Protocol on Trade (1996).
SADC Treaty (1992). Windhoek. Namibia
SADC (2012), Towards a Common Future
SADC (2010), SADC Plan for elimination on non-tariff barriers to trade
Salvatore, D. (2007). International economics, John Willey & Sons Inc, Fordham University, United States.
Schiff, M. & Wang, Y. (2004), North-South technology diffusion, regional integration, and the dynamics of the
“natural trading partners” hypothesis. Discussion Paper Series, IZA DP No. 1384
Thirlwall, A. P. (2000). Trade agreements, trade liberalization and economic growth: a selective survey. African
Development Review, 12 (2), 129–160.
Tovar, P. (2013). External tariffs under a free-trade area. The Journal of International Trade & Economic
Development, 1–26. doi:10.1080/09638199.2013.764920
Tovias, A., & Al-Khouri, R. (2004). An empirical estimation of the potential economic effects of a bilateral free
trade area agreement between Israel and Jordan in the context of the Euro-Mediterranean Partnership,. Israel
Affairs, 10 (3), 138–158. doi:10.1080/1353712042000242617

Page 65 of 69
Schott, J, J. (2006). Free trade agreements and US trade policy: a comparative analysis of us initiatives in Latin
America, the Asia-Pacific region, and the Middle East and North Africa. The international trade journal, XX (2).
DOI: 10.1080/08853900600620118
USAID (2012) Southern Africa Trade Hub, Technical Report: Audit of the Implementation of the SADC Protocol
on Trade, Gaborone, Botswana.
Waschik, R. (2005). Trade creation, trade diversion, and non-members of free trade areas. La Trobe University,
Victoria, Australia
World Trade Organization, (2007). Factual Presentation on Protocol on Trade in Southern African Development
Community, WT/REG/W/15/Add.1
World Trade Organization, (2009). Trade policy review. Report by the Secretariat Southern African Custom
Union, WT/TPR/S/222
http//www.fas.usda.gov/itp/policy/nafta/nafta.asp
Page 66 of 69
APPENDIX A
RESEARCH QUESTIONNAIRE ON NAMIBIA AND SADC FTA: MAXIMIZING EXPORT
OPPORTUNITIES
This is a research study conducted for the purpose of obtaining your views on the value of Namibia
participating in the SADC Free Trade Area (FTA). Responses will be analysed to determine whether Namibia is
able to maximize her export opportunities as a result of the achievement of the SADC FTA. Kindly note that
you do not need to write your name on the questionnaire because the results of the study will be treated
anonymously.
1. Are you male or female?
A. Male
B. Female
2. What is your age group?
A. 20-24
B. 25-29
C. 30-34
D. 35 and above
3. What is the nature of your business?
A. Import and Export
B. Transportation
C. Manufacturing
D. Agriculture
E. Tourism
F. Mining
G. Other……………………………………………………….
4. Within SADC, where do you export to?
A. Angola
B. Botswana
C. Democratic Republic of Congo (DRC)
D. Lesotho

Page 67 of 69
E. Madagascar
F. Malawi
G. Mauritius
H. Mozambique
I. Seychelles
J. South Africa
K. Swaziland
L. Tanzania
M. Zambia
N. Zimbabwe
5. Within SADC, where do you import from?
A. Angola
B. Botswana
C. Democratic Republic of Congo (DRC)
D. Lesotho
E. Madagascar
F. Malawi
G. Mauritius
H. Mozambique
I. Seychelles
J. South Africa
K. Swaziland
L. Tanzania
M. Zambia
N. Zimbabwe
6. Which countries within SADC do you trade with mostly?
A. Angola
B. Botswana
C. Democratic Republic of Congo (DRC)
D. Lesotho
E. Madagascar
F. Malawi
G. Mauritius
H. Mozambique

Page 68 of 69
I. Seychelles
J. South Africa
K. Swaziland
L. Tanzania
M. Zambia
N. Zimbabwe
7. The SADC FTA was attained in August 2008. Do you think there is an increase in trade since 2008?
A. Strongly Agree
B. Agree
C. Disagree
D. None of the above
8. What type of barriers are you facing?
A. Tariff Barriers
B. Non-Tariff Barriers (NTBs)
C. Barriers associated with Rules of Origin
D. Administration and Customs Procedures
E. Other
…………………………………………………………………………………………………………………………………………
………………………….
9. In your view, is there any value for Namibia’s participation in the SADC FTA?
A Yes
B No
10. What should be done for Namibia to benefit from then FTA?
………………………………………………………………………………………………………………………………………………………………
………………………………………………………………………………………………………………………………………………………………

Page 69 of 69
………………………………………………………………………………………………………………………………………………………………
………………………………………………………………
Thank you