Nairobi City County Assembly · Created Date: 20160202094511Z

NAIROBI CITY COUNTY GOVERNMENT
URBAN STREETS AND ROAD DESIGN MANUALFOR NON-MOTORIZED TRANSPORT
Draft Manual
March 9, 2020
Client ConsultantEng. Tom Opiyo9A Sifa Towers, Lenana Road, KilimaniP.O. Box 3103-00100 GPO, NairobiTel: +254 0723 [email protected]

1
Eng Tom Opiyo
9A Sifa Towers,Lenana Road, Kilimani
P.O. Box 3103-00100 GPO, Nairobi
Date: 9th March 2020
To:
The Kenya Alliance of Resident Associations (KARA)
P.O Box 1411-00100 GPO,
NAIROBI, Kenya
Dear Sirs,
DEVELOPMENT OF NAIROBI CITY COUNTY STREETS & ROAD DESIGNMANUAL FOR NON MOTORISED TRAFFIC
DRAFT DESIGN MANUAL
Please find attached the Draft Design Manual for the above referenced project for yourconsideration.
Yours faithfully,
Eng. Tom Opiyo
Consultant

1
DRAFT MANUAL

1
TABLE OF CONTENTSDRAFT MANUAL.................................................................................................................................... 1
1 INTRODUCTION........................................................................................................................... 7
1.1 Background ................................................................................................................................. 7
1.2 Purpose of the Manual .............................................................................................................. 7
1.3 The Rationale for Developing the Manual ............................................................................. 8
1.4 How to Use the Manual ............................................................................................................ 9
1.5 Structure of the Manual............................................................................................................. 9
2 PLANNING AND DESIGN CONCEPTS FOR NMT INFRASTRUCTURE ................ 10
2.1 Introduction .............................................................................................................................. 10
2.2 Design Principles for Urban Road Networks ...................................................................... 10
2.2.1 Introduction...................................................................................................................... 10
2.2.2 Function ............................................................................................................................ 10
2.2.3 Use ..................................................................................................................................... 11
2.2.4 Shape.................................................................................................................................. 11
2.3 The Role of Non-Motorized Transport................................................................................ 12
2.4 NMT User Requirements........................................................................................................ 12
2.4.1 Safety.................................................................................................................................. 12
2.4.2 Attractiveness ................................................................................................................... 13
2.4.3 Directness.......................................................................................................................... 13
2.4.4 Coherence ......................................................................................................................... 13
2.4.5 Comfort ............................................................................................................................. 13
2.5 Safe System Approach in Designing NMT Routes............................................................. 13
2.6 Non-Motorized Transport Paths ........................................................................................... 15
2.6.1 NMT Only Routes........................................................................................................... 16
2.6.2 Access Street ..................................................................................................................... 17
2.6.3 Service road....................................................................................................................... 17
2.6.4 Local collector .................................................................................................................. 18
2.6.5 Collector-distributor ........................................................................................................ 18
2.6.6 Urban Corridor................................................................................................................. 19
2.6.7 Determining the need for Segregation and Integration of NMT Paths .................. 19
Explanation of the shape of the diagram and the used values. ................................................. 20
2.7 Non-Motorized Transport Crossings.................................................................................... 21
2.7.1 Introduction...................................................................................................................... 21
2.7.2 Crossing requirement at Mid-Block Sections .............................................................. 22

2
3 PLANNING ASPECTS FOR NMT ........................................................................................... 23
3.1 Introduction .............................................................................................................................. 23
3.2 Objectives of NMT Traffic Volume Studies........................................................................ 23
3.3 Survey Field Work Preparations ............................................................................................ 23
3.3.1 Equipment and Material ................................................................................................. 23
3.3.2 Survey forms and instructions ....................................................................................... 24
3.3.3 Pilot survey........................................................................................................................ 24
3.3.4 Liaison with other agencies ............................................................................................ 24
3.3.5 Surveyor safety ................................................................................................................. 24
3.3.6 Material Requirements for Manual Counts .................................................................. 24
3.4 NMT Survey Methodology..................................................................................................... 25
3.4.1 Manual Counting.............................................................................................................. 25
1. Procedures for selecting Locations for Manual Counts ..................................................... 25
2. Methodology for Manual Counts........................................................................................... 26
3. Quality Control for Manual Counts ...................................................................................... 26
3.4.2 Pedestrian Crossing Observations................................................................................. 26
3.4.3 The Pedestrian Volume Count Study ........................................................................... 26
3.4.4 The Pedestrian Group Size Study.................................................................................. 27
3.4.5 Attitudinal Surveys........................................................................................................... 27
3.4.6 Video Surveys ................................................................................................................... 27
3.4.7 NMT Route Inventory Surveys ..................................................................................... 27
3.4.8 NMT Route Inspection and Identification Surveys.................................................... 27
3.4.9 House Hold Interview Surveys ...................................................................................... 29
3.4.10 NMT Road Side Interview Surveys............................................................................... 29
3.4.11 Traffic Volume Counts for NMT Facilities Design ................................................... 31
3.5 Data Processing and Error Checking.................................................................................... 31
3.6 NMT Data Analyses ................................................................................................................ 32
3.6.1 Introduction...................................................................................................................... 32
3.6.2 Pedestrian Crossing Observation .................................................................................. 33
3.6.3 Social Characteristics ....................................................................................................... 34
3.6.4 Prediction of demand in the design year ...................................................................... 34
3.6.5 The PV2 Criteria for Determining the Pedestrian Crossing Warrants...................... 34
4 DETAILED NMT DESIGN ASPECTS.................................................................................... 36
4.1 Provisions for Pedestrians ...................................................................................................... 36
4.2 Provisions for Pedestrians ...................................................................................................... 36
4.2.1 Pedestrian Space Requirements ..................................................................................... 36

3
4.2.2 Width Requirements for Walkways............................................................................... 36
4.2.3 Walkway Levels of Service ............................................................................................. 38
4.2.4 Space required by Shopping Pedestrians ...................................................................... 40
4.2.5 Waiting Time for Crossing ............................................................................................. 40
4.2.6 Recommended Crossing Options ................................................................................. 42
4.2.7 Guidelines for PLWDs ................................................................................................... 42
4.2.8 Phased Ramp .................................................................................................................... 43
4.2.9 Position of Obstacles on NMT Footpaths .................................................................. 44
4.2.10 Guard Rail Details............................................................................................................ 44
4.2.11 Guard Rails on Stairways ................................................................................................ 45
4.2.12 Accesses and Plot Entrances.......................................................................................... 46
4.3 Provisions for Cyclists ............................................................................................................. 47
4.3.1 Cyclists Space Requirements .......................................................................................... 47
4.3.2 Separate Bicycle Tracks................................................................................................... 47
4.3.3 Cyclist Lanes on Mixed traffic roads............................................................................. 48
4.3.4 Stopping Distance of Cyclists ........................................................................................ 48
4.3.5 Mixed pedestrian/cycle tracks........................................................................................ 48
4.3.6 Sight Distances for Pedestrians and Cyclists ............................................................... 49
4.4 Provisions for Hand Carts ...................................................................................................... 50
5 NMT PAVEMENTS...................................................................................................................... 51
6 TRAFFIC MANAGEMENT DURING CONSTRUCTION................................................ 53
6.1 Introduction .............................................................................................................................. 53
6.2 Pedestrians................................................................................................................................. 53
6.3 Cyclists ....................................................................................................................................... 55
7 NMT SUPPORT FACILITIES .................................................................................................... 56
7.1 Introduction .............................................................................................................................. 56
7.2 NMT Rest Facilities and Service Areas................................................................................. 56
7.2.1 Significance of Rest Facilities and Service Areas......................................................... 56
7.2.2 Planning NMT Rest Facilities and Service Areas........................................................ 56
7.2.3 Spacing Intervals for NMT Rest Facilities and Service Areas................................... 57
7.2.4 Safety and Security Requirements for NMT Rest Facilities and Service Areas ...... 57
7.3 NMT Rest Benches.................................................................................................................. 58
7.3.1 Locations of Rest Benches ............................................................................................. 58
7.3.2 Designing for Rest Benches ........................................................................................... 58
7.3.3 Rest Benches for the PLWD.......................................................................................... 59
7.4 Waste receptacles on NMT Paths.......................................................................................... 59

4
7.4.1 Locations of Waste Receptacles on NMT Paths......................................................... 59
7.4.2 Design of Waste Receptacles on NMT Paths ............................................................. 59
7.5 Water Fountains on NMT Paths ........................................................................................... 60
7.5.1 Locations of Fountains on NMT Paths ....................................................................... 60
7.5.2 Design of Water Fountains ............................................................................................ 61
7.6 Provisions for Trees on NMT Paths..................................................................................... 61
7.7 Safety Fences............................................................................................................................. 62
7.7.1 Pedestrian Fences............................................................................................................. 62
7.7.2 Bollard and Chain ............................................................................................................ 62
7.7.3 Fences for cyclists ............................................................................................................ 63
7.8 NMT Traffic Signage and Road Marking ............................................................................. 63
7.8.1 Signage............................................................................................................................... 63
7.9 Street Lighting........................................................................................................................... 66
7.9.1 Introduction...................................................................................................................... 66
7.9.2 Design Objectives of NMT Street Lighting................................................................. 66
7.9.3 Factors influencing lighting layout and design of a lighting installation. ................. 67
7.9.4 Location of lighting poles on NMT Paths ................................................................... 68
8 ECONOMIC JUSTIFICATION OF AN NMT FACILITIES .............................................. 70
8.1 Evaluating the Impacts of NMT............................................................................................ 70
8.2 Costs Savings ............................................................................................................................ 70
8.2.1 Roadway Cost Savings..................................................................................................... 70
8.2.2 Vehicle Cost Savings ....................................................................................................... 71
8.2.3 Parking Cost Savings ....................................................................................................... 71
8.2.4 Travel Time Costs............................................................................................................ 71
8.3 NMT User Benefits.................................................................................................................. 72
8.3.1 Congestion Reduction..................................................................................................... 72
8.3.2 Barrier Effect .................................................................................................................... 72
8.3.3 Accident Costs.................................................................................................................. 73
8.3.4 Energy Conservation....................................................................................................... 73
8.3.5 Pollution Reduction......................................................................................................... 73
8.3.6 Noise.................................................................................................................................. 74
8.3.7 Health and Fitness Benefits............................................................................................ 74
8.3.8 Improved Mobility for Non-Drivers ............................................................................ 74
8.3.9 Strategic Land Use Development Objectives .............................................................. 75
8.3.10 Economic Development................................................................................................. 75

5
9 TENDER DOCUMENTATION FOR NMT .......................................................................... 76
9.1 Introduction .............................................................................................................................. 76
9.2 Basic Layout of Tender Documentation .............................................................................. 76
9.2.1 Tender Advertisement Details ....................................................................................... 76
9.2.2 Returnable Documents ................................................................................................... 76
9.2.3 Agreements and Contract Data ..................................................................................... 76
9.2.4 Pricing Data ...................................................................................................................... 77
9.2.5 Scope of Work.................................................................................................................. 77
9.2.6 Site Information (Engineering and Construction Works Contracts Only) ............. 77
10 REFERENCES ............................................................................................................................... 78
APPENDICES ......................................................................................................................................... 81
APPENDIX 1: CLASSIFIED TRAFFIC COUNT FORM ............................................................. 82
APPENDIX 2: LIST OF ITEMS NEEDED FOR TRAFFIC SURVEYS ................................... 83
APPENDIX 3: ROUTE CHOICE QUESTIONAIRE.................................................................... 84
APPENDIX 4: NON-MOTORIZED TRAFFIC COUNT VOLUME COUNT FORM ......... 85
APPENDIX 5: COUNTER INSTRUCTIONS ................................................................................. 86
APPENDIX 6: PEDESTRIAN VOLUME COUNT FORM.......................................................... 88
APPENDIX 7: SUMMARY OF PEDESTRIAN MOVEMENTS................................................. 89
APPENDIX 8: PEDESTRIAN GROUP SIZE STUDY FORM ................................................... 90
APPENDIX 9 - DETAILED DESIGN ASPECTS .......................................................................... 91
LIST OF TABLESTable 2-1: Functional Classification of Urban Roads ....................................................................... 11Table 4-1: Link PLOS Criteria: Pedestrian Mode.................................................................. 39Table 4-2: Side walk performance evaluation using the circulation-area perspective .............. 39Table 4-5: Lane crossing situations and corresponding waiting times ..................................................... 40Table 4-6: 2x2 Lane crossing situations and corresponding waiting times............................................... 41Table 4-3:Stopping distance of cyclists ........................................................................................... 48Table 4-4:Sight distance requirements for pedestrians and cyclists for crossing .......................................... 49Table 7-1: Factorsinfluencingthelightinglayout ................................................................................. 67
LIST OF FIGURESFigure 2-1: Pillars of Safe System Approach .................................................................................. 14Figure 2-2: Wramborgs model for fatality vs. vehicle collision speeds ................................ 15Figure 2-3: NMT Only Routes................................................................................................... 16Figure 2-4: Access Street ........................................................................................................... 17Figure 2-5: Service road............................................................................................................. 17Figure 2-6: Local collector .......................................................................................................... 18Figure 2-7: Collector-distributor .................................................................................................. 18Figure 2-8: Urban Corridor ....................................................................................................... 19

6
Figure 3-1:Relationship between the volume of motor vehicles and the 85th percentile speeds ......................... 20Figure 3-2: PV2 Based Pedestrian Crossing Warrant Graph Source: (DoT, 1987)................................. 35Figure 4-1: Illustration on calculating effective sidewalk width. Source: HCM 2016 ........ 38Figure 4-2:Guidelines for PLWDs .............................................................................................. 43Figure 4-3:Phased Ramp ........................................................................................................... 44Figure 4-4:Position of Obstacles on NMT Footpaths ....................................................................... 44Figure 4-5:Position of Obstacles on NMT Footpaths ....................................................................... 45Figure 4-6: Guard Rails Alongside Stairways ................................................................................ 46Figure 4-7: Accesses and Plot Entrances ....................................................................................... 46Figure 5-1: NMT Pavement Options ........................................................................................... 52

7
1 INTRODUCTION
1.1 Background
The Nairobi City County Government (NCCG) in collaboration with the Kenya Alliance forResident Associations (KARA) and United Nations Environment Programme (UNEP)developed the Nairobi City County Non-Motorized Transport (NMT) Policy in 2015.
In 2019, the Ministry with assistance from the Institute for Transportation and Development(ITDP) developed the Street Design Manual for Urban Areas in Kenya thatcovers urban streetdesign for all modes of transport including motorised and non-motorised traffic. However, themanual falls short of providing specific traffic engineering interventions with due considerationfor context-sensitive aspects such as speeds, engineering dimensions and traffic volumes. Hence,there is still an urgent need to develop an NMT specific guideline that meets both user andsupplier requirements.
In this regard, KARA supported by the Business Advocacy Fund is again working with theNCCG and other stakeholders to develop aStreets and Road Design Manual for Nairobi with aspecific focus on NMT as part of the ongoing implementation of the NMT policy (NCCG,2015).
1.2 Purpose of the Manual
The purpose of the Streets and Road Design Manual for Nairobi with a specific focus on NMTisto providetraffic engineering practitioners, urban planners and other decision-makers with tools,principles and guidelines on the most important planning and physical design aspects of NMTstreet networks.
ThisManual provides information on considerations that should be given during planning anddesign aids for NMT (including checklists, design principles, selection criteria etc.), roadcross-section designs;road layout designs;pavement designs; traffic signing; public lighting and roadmarking designs. The design of NMT facilities are influenced by a range of locational aspectssuch as at intersections; mid-block sections; at crossings; at public transport interfaces; and,stand-alone sections.
The application of the recommendations of this guideline will ensure provision of safe,convenient, and comfortable walking and cycling facilities.In particular, it contains detailedprovisions in areas where there are a high number of conflicts between motorized and non-motorized modes of transport within urban areas.However, it should be noted that this manualwill complement rather than replace any existing manuals. It will not only ensure uniformity ofdesign but also ensure that they meet minimum user requirements of safety, directness,coherence, comfort and attractiveness.

8
1.3 The Rationale for Developing the Manual
In order to meet the intended purpose for use of this Manual, the following approach wasadopted in developing the NCCG Streets and Road Design Manual:
1. A review of important transport sector and road sub-sector policies, manuals andguidelines taking cognizance of specific industry practice and international best practicesregarding the design of NMT infrastructure, highlighting the challenges, good/badpractices and other aspects. The following key documents were reviewed:
1. Primary documents:
i. Integrated National Transport Policy of 2009 (currently being reviewed)ii. NCCG NMT Policy 2015iii. Street Design Manual for Urban Areas in Kenya 2019iv. Baseline Assessment of the NMT Facilities and Infrastructure in Nairobi
County (KARA, 2019)
2. Secondary documents:
i. Integrated Masterplan for Nairobi (NIUPLAN)ii. NMT Strategy and Plan for the City of Nairobi (EU, 2019)iii. Other Urban Design Manualsiv. International best practice manuals
2. Gap assessment was carried out on the current NMT policy requirements (such as theNairobi NMT policy and INTP) and existing manuals (such as the Draft Urban RoadsGuidelines, 2001, and the UN-HABITAT/ITDP Guidelines, 2018), to provisions inexisting international best practice manuals. The aim of the review was to ensure that thisManual compliments existing manuals by giving supplementary details for critical NMTinfrastructure lacking in existing design manuals.

9
1.4 How to Use the Manual
This Manual outlines the standards for planning, physical design and circulation aspects of thetransport network (e.g. lane widths and geometrics) and public realm (e.g. footpath design,shading, lighting, landscaping, vehicle cross-overs).
ThisManual is a succinct document that uses images, drawings and diagrams annotated withdimensions in the first instance, with text used as a further explanation where necessary. Itprovides typical design details for all street types within the identified street hierarchy. It alsoprovides guidance for context-specific standards to reinforce the character of the surroundings,such as Central Business District, residential, or industrialareas. While all necessary technicalinformation is provided, the manual also provides guidance and direction on the urban design ofthe public realm.
The standards apply to the whole of the right of way between property (plot) boundaries,encompassing the kerb-to-kerb street pavements, footpaths and landscaped areas within the rightof way.
1.5 Structure of the Manual
This Manual is structured into the following sections for ease of use:
Chapter 1: IntroductionChapter 2: Planning and Design Concepts for Non-Motorized Transport InfrastructureChapter 3: Planning Aspects for Non-Motorized Transport.Chapter 4: Detailed Design AspectsChapter 5: Non-Motorized Transport Pavement StructuresChapter 6: Traffic Management During Constructionof Non-Motorized Transport FacilitiesChapter 7: Non-Motorized Transport Support FacilitiesChapter 8: Economic Justification of NMT InfrastructureChapter 9: Tender Documentation for Non-Motorized Transport Works

10
2 PLANNING AND DESIGN CONCEPTS FOR NMTINFRASTRUCTURE
2.1 Introduction
NMT is a means of transport that include walking, cycling, the use of wheelbarrows and carts,animal transport (horses, camels, donkeys, mules, and oxen), animal-drawn carriages (such assledges), and tricycles for passenger and freight transport (GOK, 2012). NMT modes also includethe use of wheelchairs, skateboards, stroller’s mobility scooters and personal mobility devicessuch walking frames.
NMT provides many benefits to users and non-users alike, including travel choice and mobility,affordability, reduced road congestion, infrastructure savings, improved health, recreation andenjoyment, environmental protection, and economic development. Walking and cyclingimprovements are critical for creating more liveable communities. Therefore, the knowledge ofthe number and composition of NMT is vital for the planning and development of the NMTinfrastructure and its coexistence with the motorized traffic (MT).
For the purpose of this Manual, Non-motorized transport (NMT) would be limited topedestrians(both abled and disabled); cyclists; and, pushcarts (but no animal traction).
2.2 Design Principles for Urban Road Networks
2.2.1 IntroductionThe performance of a road network is dependent on a strong interrelationship between thefunction, shape (the actual physical form) and the use (traffic composition, user behaviour andactivities) of a road facility (De Langen & Tembele R., 2001). The shape of a road ensures that thedesired use and function of a road are realized. If the desired shape changes (for example, due tolack of maintenance), the Use of the road section/link will change (especially where there is lowenforcement oftraffic regulations), and consequently, the Function will change. Some of theconsequences are:
1. Deteriorated environment, for example, air and noise pollution, traffic accidents, poorquality of life, loss in property values;
2. A faster rate of infrastructure deterioration due to traffic overloading;3. Higher costs of transport due to congestion; and,4. Skewed provision of transport services.
2.2.2 Function
Roads have different levels of importance based on their function (i.e. the purpose for which it isintended to be used for). Some functions in the urban road network include access, transit(through-traffic), cycling, walking, public transport route shopping and other functions.However, some roads may have multiple functions leading to conflicting uses of the same road.Failure to create clear well-understood road functional levels can lead to incompatibility of the

11
different modes along the same road. The principle is usually to concentrate long-distancemotorized transit traffic within the urban arterials and major collector corridors and eliminatethem from local access roads and streets.
Roads in an urban area may besubdivided into different functional classes, as shown in Table 2-1below.
Table 2-1: Functional Classification of Urban Roads
Classification Function Traffic EstimatedWidth
Desired max.Speed
(km/h)
Access street Access to buildings andplots. Access functiondominant.
No MT traffic; NMT transit;Public Transport notallowed. Encourage mixedtraffic.
5.5 - 6 m NMT speed
Service road Access to buildings, plots,and connection to accessplots. Access functiondominant
Encourage mixed MT andCyclists, separatePedestrians.
6m 20
Local collector Links to homes, shops, etc.in the immediatesurroundings. Accessfunction still dominant;flow function gettingimportant.
MT transit, but low speeds;Encourage mixed MT andCyclists, separatePedestrians.
5-7m 20 - 30
Collector-distributor
Collecting and distributingtraffic between residentialspaces. Access functiongetting less significant; flowfunction is dominant.
Transit to and from citydistricts; no city-wide transit;MT transit, Mix Pedestrianand Cyclists but separatewith road Marking.
7-7.5m 30 – 50
UrbanCorridor
The local major roadnetwork. Collectingfunction is primary, safetyand large capacity atconstant driving speed areaimed at through separationof traffic categories. Flowfunction is dominant.
Citywide transit districts andto/from the outside city;MT transit, Separatecompletely Pedestrian andCyclists.
7.5m 50 – 80
Source: KRB RICS Manual and Consultants Inputs
2.2.3 UseThe desired USE of a road link/section refers to the desired traffic characteristics (traffic types,speeds, and volumes) and their behaviour.
2.2.4 ShapeThe SHAPE of a road refers to the geometric layout that is determined from the desired trafficcharacteristics (traffic types, speeds, and volumes) and the desired function that the road shouldserve in the network. It simply refers to the allocation of the road space to the various users,taking into consideration the desired functions of the road in the network.

12
The shape of the road is probably the most important aspect of the three design criteria, but itmust be kept in mind that it is decided from the desired function and use of the road. A balancebetween the three design criteria must be ensured at the design stage and should be restored inuse to ensure the provision of quality transport system.
2.3 The Role of Non-Motorized Transport
Non-motorized travel (particularly walking) plays a unique and important role in an efficienttransportation system. Walking and cycling are fundamental human activity that provides basicmobility and serve many other functions. NMT travel provides connections among variousmodes, destinations and activities. Buildings, parking lots, train stations, transit terminals andairports are all NMT environments that depend on walking and cycling for circulation andconnectivity. Most motorized trips involve non-motorized links. Motorists walk from parkedvehicles to their destinations. Most transit trips involve non-motorized links, so walking andcycling conditions determine the functional area of transit service. Air travellers walk fromvehicles to airports and within terminals. Improving non-motorized conditions thereforeimproves access to all other modes.Non-motorized travel can provide many benefits. Walking and cycling are inexpensive for usersand reduce costs such as congestion, parking subsidies, energy consumption and pollutionemissions. Communities designed for walking and cycling are compact (so many destinations arewithin convenient distance of each other), connected (with streets that allow direct travel),designed at a human scale, have attractive sidewalks and paths. This improves accessibility,affordability and community liveability.
2.4 NMT User Requirements
These are the basic requirements that enhance the usage of NMT facilities. They are key thingsthat influence decision making by the users in route choices, and choices between availablemodes in the trip making. They can be addressed at both the route planning stage (design) orduring the operations stage.
2.4.1 SafetyThe route should ensure the safety and convenience of NMT and other road users. For NMTusers, the safety risks increase with the increase in speeds and/or volumes of MT traffic. Anincrease in either speed (V1
85>30 km/h) or volume of MT increases (>1,500 pcu/24 hrs) thedanger to cyclists sharing the same space with MT increases. At low volumes and low speeds,cyclists can share the same road space with MT traffic. However, pedestrians should always beseparated.
V185 is the 85thpercentile-speed, which is the speed exceeded by only 15% of all vehicles using the road.

13
2.4.2 AttractivenessThe route surrounding environment should be conducive (clean, have trees that produce shade,road furniture, etc.) and ideally pass through interesting places such places like small publicparks, shops, markets, recreational facilities and restaurants.
2.4.3 DirectnessThe route should be as much as possible a direct connection between origins and destinations tokeep detour distances short. Infrequent stops and short waiting times to cross the MTcarriageway should be considered as features of directness. Lack of directness can be a cause ofroad accidents at crossings, due to dispersed crossing or persons taking high risks due to longdelays.
2.4.4 CoherenceThe route should be continuous with no missing links and bottlenecks and integrated with publictransport routes. The density of routes within the area is also a measure of coherence.
2.4.5 ComfortThe route features should minimize hindrances in achieving desired speeds and allow for rapidand comfortable movement. Provisions of facilities such as lamp and traffic signposts, kerbs andbumps across paths, etc. are of importance as they measure of levels of comfort for NMT users.
2.5 Safe System Approach in Designing NMT Routes
Safe System Approachis a systematic, multi-disciplinary and multi-sectoral approach whichaddresses the safety needs of all users; fatal and serious injury collision prevention, collisionprotection and mitigation and post-collision care and aligns with other policies for co-benefitssuch as health, occupational health and safety, sustainable development and poverty reduction.In a Safe System approach, mobility is a function of safety rather than vice versa. It involves theimplementation of system-wide measures that ensure, in the event of a collision, that the impactforces remain below the threshold likely to produce either death or serious injury.
Safe Systemrequires a proactive approach placing road safety in the mainstream of road trafficsystem planning, design and operation and use. Safe Systeminterventions address commonhuman errors and human tolerance to injury thresholds and in so doing aims to address the roadsafety needs of non-motorised as well as motorised road users, younger and older users, maleand female users.
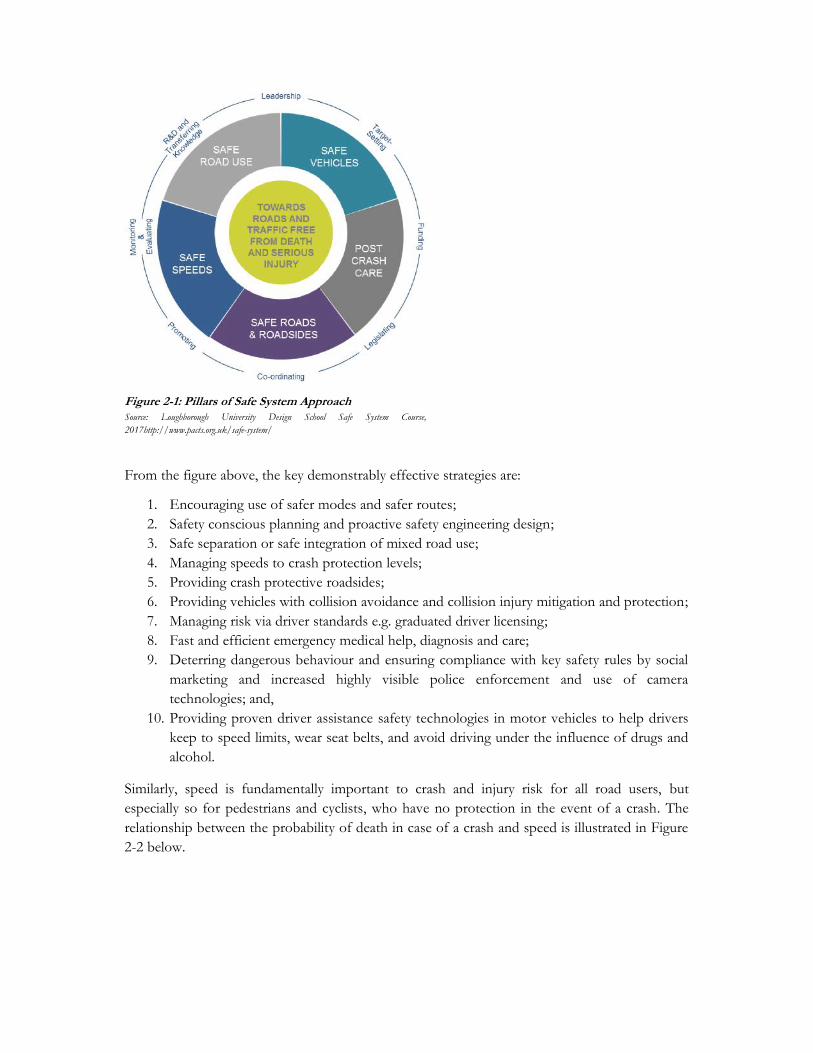
Safe System has five pillars of action i.e. Safe Road Use; Safe Vehicles; Safe Speeds; Safe Roadsand Roadsides; and Post-Crash Response& Care. The relationship is as illustrated in Figure 2-1below.
14
Figure 2-1: Pillars of Safe System ApproachSource: Loughborough University Design School Safe System Course,2017http://www.pacts.org.uk/safe-system/
From the figure above, the key demonstrably effective strategies are:
1. Encouraging use of safer modes and safer routes;2. Safety conscious planning and proactive safety engineering design;3. Safe separation or safe integration of mixed road use;4. Managing speeds to crash protection levels;5. Providing crash protective roadsides;6. Providing vehicles with collision avoidance and collision injury mitigation and protection;7. Managing risk via driver standards e.g. graduated driver licensing;8. Fast and efficient emergency medical help, diagnosis and care;9. Deterring dangerous behaviour and ensuring compliance with key safety rules by social
marketing and increased highly visible police enforcement and use of cameratechnologies; and,
10. Providing proven driver assistance safety technologies in motor vehicles to help driverskeep to speed limits, wear seat belts, and avoid driving under the influence of drugs andalcohol.
Similarly, speed is fundamentally important to crash and injury risk for all road users, butespecially so for pedestrians and cyclists, who have no protection in the event of a crash. Therelationship between the probability of death in case of a crash and speed is illustrated in Figure2-2 below.

15
Figure 2-2: Wramborgs model for fatality vs. vehicle collision speeds
Source: based on Wramborg (2005).
However, it is also clear that the Safe System performance of road infrastructure cannot bewholly achieved by controlling impact speeds and angles (i.e. geometry and layout) alone,especially where high speeds are desired to meet the mobility function. This means that moreemphasisshould be placed on minimizing the probability of road user conflicts. Road userseparation, minimization of a number of conflict points, and greater management of road usermovements can all be used to provide solutions to support the Safe System vision.
In a Safe System, therefore, pedestrian facilitiesshould be designed in a manner that ensures thatthe users are not killed or seriously injured should a crash occur. This requires the designer toappreciate and understand the interactions between the various elements and in particular thelikelihood of crashes.
A Safe System approach should ideally remove conflicts between motor vehicles and vulnerableroad users, such as cyclists and pedestrians. For example, an underpass provides an alternativecrossing of a busy road. Where conflicts cannot be avoided, the conflict between motor vehiclesand vulnerable road users’ needs to be designed or managed to reduce the incidence and severityof crashes, should they occur.
2.6 Non-Motorized Transport Paths
NMT paths are the distinct routes reserved for use by NMT users and provide an important partof the transport network as the first or last link in NMT trips, which utilizes other types oftransport.

16
Safety, attractiveness, directness, coherence and comfort are the governing criteria for the designand construction of NMT paths. For this reason, the paths are usually divided into four mainzones: the frontage zone, the NMT path, street furniture/kerb zone, and theenhancement/buffer zone. Each of these zones plays an important role in a well-functioningfootpath.
1. Frontage zone: The frontage zone describes the section of the sidewalk that functionsas an extension of the building, whether through entryways and doors or sidewalk cafesand sandwich boards. The frontage zone consists of both the structure and the facade ofthe building fronting the street, as well as the space immediately adjacent to the building.
2. NMT Path:The zone is the primary, accessible pathway that runs parallel to the street.The through zone ensures that pedestrians have a safe and adequate place to walk.
3. Street furniture/kerb zone:The street furniture zone is defined as the section of thesidewalk between the curb and the through zone in which street furniture and amenities,such as lighting, benches, newspaper kiosks, utility poles, tree pits, and bicycle parkingare provided.
4. Enhancement/buffer zone:the enhancement/buffer zone is the space immediatelynext to the sidewalk that may consist of a variety of different elements. These includebollard, drainage facilities, curb extensions, park lets, storm water management features,parking, bike racks, bike share stations, and curb side.
The figures below show the zones for various road classifications.
2.6.1 NMT Only Routes
Figure 2-3: NMT Only Routes

17
2.6.2 Access Street
Figure 2-4: Access Street
2.6.3 Service road
Figure 2-5: Service road
17
2.6.2 Access Street
Figure 2-4: Access Street
2.6.3 Service road
Figure 2-5: Service road
17
2.6.2 Access Street
Figure 2-4: Access Street
2.6.3 Service road
Figure 2-5: Service road

18
2.6.4 Local collector
Figure 2-6: Local collector
2.6.5 Collector-distributor
Figure 2-7: Collector-distributor

19
2.6.6 Urban Corridor
Figure 2-8: Urban Corridor
2.6.7 Determining the need for Segregation and Integration of NMT PathsThe speed and the intensity of the motor traffic are the main factors for the decision if and towhich extent different modes have to be segregated (by space or time:giving the incompatiblemodes their own territory) or integrated (allowed in the same space). Both intensity and speedinfluence the number of overtaking manoeuvres, while the speed of the motor traffic is the mainfactor in the danger of these manoeuvres.
Apart from the intensity and the speed of motor traffic on the concerning road section in thesecond instance also situational factors are jointly of importance, such as the parking situation,and the distance between intersections.
The figure below shows which kind of integration or segregation is necessary at whatcombinations of intensity and speed of the motor traffic. Note that the speed is indicated as theactual speed on the concerning road section not to be exceeded by more than 15% of the drivers(V85).

20
Figure 2-9:Relationship between the volume of motor vehicles and the 85th percentile speeds
Area1:V85< 30 km/h. All modes can be integrated (mixed). The only reason to consider bicycletracks or bicycle lanes is for the sake of continuity of design on connecting bicycleroutes.
Area 6: Speed and/or density of traffic flow make it an absolute necessity to segregate bicyclesandmotor traffic. Separated bicycle tracks are the only option.
Area4:Some form of separation is needed, but visual separation (bicycle lanes) can beacceptable as well.
Area3: In general,a profile without segregation is acceptable, but dependingon circumstances bicycletracks or bicycle lanes can be desirable. (see below)
Area5: Bicycle tracks are desirable, but as densities are low,a mixed profile is acceptable.
However, we advise against bicycle lanes.
Area2: This situation is merely theoretical.
Explanation of the shape of the diagram and the used values.At speeds below 30 km/h overtaking manoeuvres cause little danger. Disadvantages ofsegregation (less manoeuvrability) will cancel the advantages (protection) easily.
The curve between A and B shows above which combinations of intensity and speed (some kindof) segregation is necessary. (This could be either visual segregation, i.e.a bicycle lane, or physicalsegregation, i.e. a bicycle track). The curve represents the following conditions: - If 15% of allmotor traffic has a speed of 80 km/h or more (85% of motor traffic has a speed up to 80 km/h),segregation becomes absolutely necessary, even if intensities are low. The differences in speedmake it impossible for motorists to react adequately to the presence of cyclists on the road.
The combination of the intensity of 10.000 private car equivalents or more of which 15% has aspeed of 30 km/h or more also makes it necessary to segregate motor traffic and bicycle traffic.

21
We assume that intensity and speed equally contribute to the insecurity of cyclists. If sosegregation becomes necessary if the product of intensity and speed is above a certain constantvalue. The curve which indicates when segregation becomes necessary has the mathematic shapeof a hyperbola.
The curve between A and C shows above which combinations of intensities and speeds of themotor traffic bicycle lanes are an insufficient solution. Concerning the applicability of bicyclelanes, the speed of motorists has more impact than concerning the question of whether someform of segregation is needed. This is because the risk of a severe accident on a road sectionwith bicycle lanes increases rapidly at higher speeds. Cyclists who, for whatever reason, leave thebicycle lane, are not expected on the carriageway by motorists. Therefore, they won't react intime to avoid an accident. On roads with integrated modes,the car drivers will anticipate more tocyclists.
The conditions are:1. When 15% of the motorists have a speed of 60 km/h or above, bicycle lanes are advised
against.2. When 15% of the motorists have a speed of 30/h or more in combination with an
intensity of 10.000 private car equivalents, bicycle lanes are advised against as well.
The chance that the bicycle lane will be abused is too big, and it becomes too difficult for acyclist to leave the bicycle lanes because of the many cars.
The shape of the curve is based on the assumption that for visual segregation the relationbetween speed and safety is much stronger than the relation between intensity and safety.
Balance of interests for Segregation and IntegrationInprinciple, the approaches of integration and segregation can be complementary to each other.
1. Segregation of modes (by means of tracks, flyovers and tunnels) should be applied wherereduction of speed of fast driving cars is not possible or desirable;
2. Reduction of speed (by physical measures) is necessary where different modes have to sharethe same infrastructure (where segregation is undesirable or impossible); and,
3. Simplifying manoeuvres are helpful in situations where modes inevitably meet each other, inorder to make it easier to deal with the situation and to reduce the severances of conflictsand collisions. This again implies speed reduction at these sites.
2.7 Non-Motorized Transport Crossings
2.7.1 Introduction
Ideally, the widths of the MT carriageway at major NMT crossings should not exceed 6 m. On dualcarriageways, medians are necessary. Where NMT-routes cross a single carriageway middle islandscan be provided. The widths of NMT crossings shall be 3m wide on side roads, or 4m wide whenthe crossings are to be shared by both pedestrians and cyclists (HCM 2010).
Each flat-topped raised zebra crossing shall be provided with 3 or 4 No. – 150 mm diameterbollards on each end (next to road shoulders) to ensure that motorists do not avoid travelling

22
over the hump, or gain entry into the pedestrian/cycle track. The bollards shall be placed at1.5/2.0-m centers.
The approaches to all crossings have been made clear and comfortable to "invite" pedestrians andcyclists to use them. In some cases, pedestrians will be channelized to the crossings using steelrailings.
From the study of accident data, it was noted that the occurrence of most accidents can beattributed to poor visibility of the pedestrians, and poor judgment of the vehicle distances andspeeds by the motorists. To improve on this situation, it is proposed that the major crossings bewell-lit at night, by the installation/repair of street lights, speed bumps be constructed beforepedestrian crossings and signals to be placed on crossings along the dual carriage ways
2.7.2 Crossing requirement at Mid-Block Sections
NMT crossings are the various mid-block sections used by the NMT users to cross the roads.Proper design of NMT crossings helps to reduce the risks of accidents. Designers need to abideby the following criteria when designing and retrofitting intersections and crossings:
1. Provide safe and accessible crossings at appropriate intervals depending on the streetfunction and pedestrian’s flows;
2. Reduce crossing distances where pedestrians cross a maximum of two lanes beforereaching a refuge (sidewalk or median)
3. Use of appropriate traffic control and signals where more than two lanes exist and MTtraffic speeds and volumes high;
4. Reduce motor vehicle speeds at mid-block using traffic calming measures, such as raisedflat-topped speed humps.
5. On unidirectional (single) motorized lanes, provide designated crossing points for NMTusers, including proper signage on the direction of flow of vehicles;
6. Provide at-grade crosswalks as much as possible instead of over-bridges and subways, inaccordance with the function of the road;
7. Provide crosswalks (raised zebra crossings) of at least 2 m width at all intersections(signalized and uncontrolled) and at frequent intervals in midblock locations. At locationswith either high motor vehicle speeds or heavy pedestrian volumes, such crossings willbe elevated to the height of the adjacent footpath (100 – 150mm) with ramps formotorized vehicles to mount the crosswalk;
8. Provide continuous medians with at least 1 m clear width that are mountable bypedestrians on all streets with carriageway widths of over 5.5 m per direction;
9. Pedestrian crossings will not have steps. Crossings will have appropriately sloped levelchanges, providing seamless access for all users. Adequate waiting areas at officialcrossing locations will be provided; and,
10. Redesign intersections to accommodate NMT volumes safely by minimizing crossingdistances, reducing motor vehicle speeds, simplifying signal cycles, or through othermeans.
23
3 PLANNING ASPECTS FOR NMT
3.1 Introduction
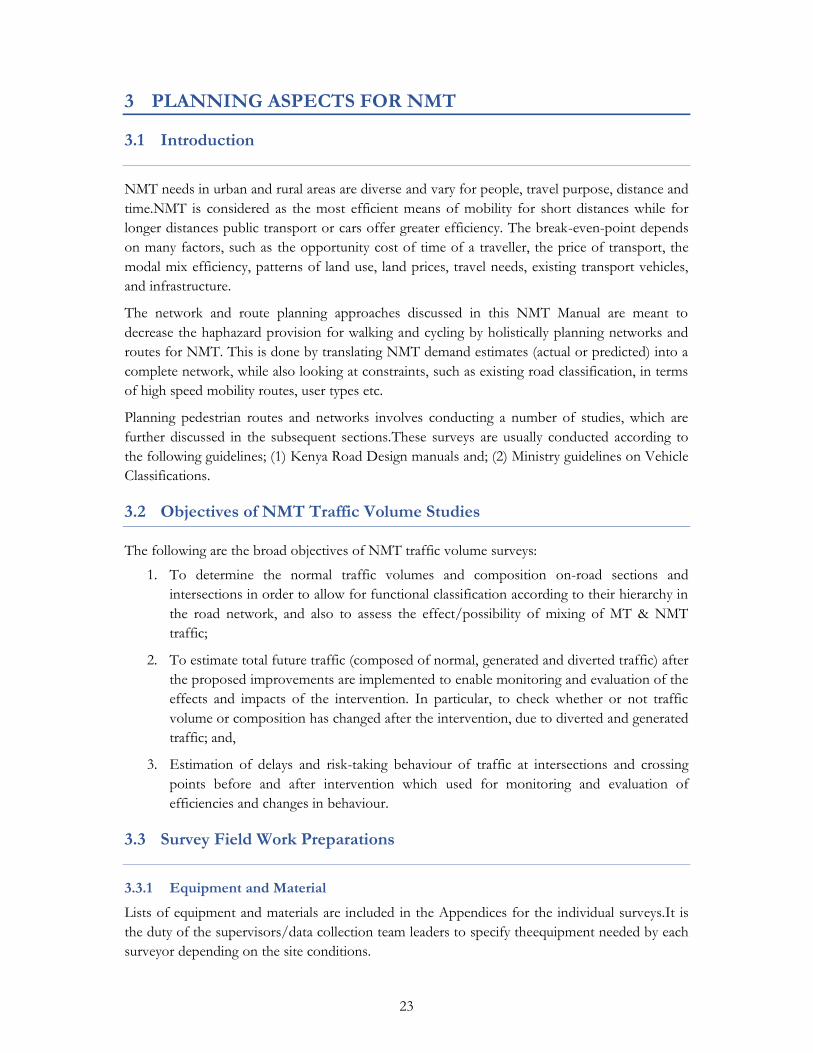
NMT needs in urban and rural areas are diverse and vary for people, travel purpose, distance andtime.NMT is considered as the most efficient means of mobility for short distances while forlonger distances public transport or cars offer greater efficiency. The break-even-point dependson many factors, such as the opportunity cost of time of a traveller, the price of transport, themodal mix efficiency, patterns of land use, land prices, travel needs, existing transport vehicles,and infrastructure.
The network and route planning approaches discussed in this NMT Manual are meant todecrease the haphazard provision for walking and cycling by holistically planning networks androutes for NMT. This is done by translating NMT demand estimates (actual or predicted) into acomplete network, while also looking at constraints, such as existing road classification, in termsof high speed mobility routes, user types etc.
Planning pedestrian routes and networks involves conducting a number of studies, which arefurther discussed in the subsequent sections.These surveys are usually conducted according tothe following guidelines; (1) Kenya Road Design manuals and; (2) Ministry guidelines on VehicleClassifications.
3.2 Objectives of NMT Traffic Volume Studies
The following are the broad objectives of NMT traffic volume surveys:
1. To determine the normal traffic volumes and composition on-road sections andintersections in order to allow for functional classification according to their hierarchy inthe road network, and also to assess the effect/possibility of mixing of MT & NMTtraffic;
2. To estimate total future traffic (composed of normal, generated and diverted traffic) afterthe proposed improvements are implemented to enable monitoring and evaluation of theeffects and impacts of the intervention. In particular, to check whether or not trafficvolume or composition has changed after the intervention, due to diverted and generatedtraffic; and,
3. Estimation of delays and risk-taking behaviour of traffic at intersections and crossingpoints before and after intervention which used for monitoring and evaluation ofefficiencies and changes in behaviour.
3.3 Survey Field Work Preparations
3.3.1 Equipment and MaterialLists of equipment and materials are included in the Appendices for the individual surveys.It isthe duty of the supervisors/data collection team leaders to specify theequipment needed by eachsurveyor depending on the site conditions.

24
3.3.2 Survey forms and instructionsSurvey form designs should be simple, with enough space torecord the data easily even underbusy field conditions. Marginsat left, right, and bottom of the form should be large enoughtoallow it to be clipped to a board, and filing holes to be punched,without obscuringinformation. Heading information shouldinclude the project title, survey type, and blank spacesfor theSurveyor to enter the exact location (e.g. road name), a sketchplan showing the site andlocation of the surveyor (withmeasurements to an accuracy of 50m), date and time,Surveyor'sname, weather conditions during the survey, and anyother information concerning unusualtraffic conditions.
Each Surveyor and Supervisor must have clear, detailedwritten instructions and training for eachsurvey form and eachsurvey task. This will include a detailed description of eachindividual taskand how the survey form(s) should be filled in,with examples. It should be impressed upon themthat everysingle item of header information must be completed on everysheet. To avoidambiguity, it should also be emphasized that nobox or column is ever left blank; value zero isshown by thefigure zero (not a dash), and suitable abbreviations are used for`not available' (n/a),or `not applicable' (n/app). The appendicescontain instructions and blank forms for each of thesurveysdescribed in the following chapters.
3.3.3 Pilot surveyPilot surveys are full-field tests of a survey method,preferably at the location of the main surveyitself. Though theyare sometimes omitted for reasons of economy, experience hasshown thatpilot surveys are a vital part of ensuring acceptabledata quality. They can also help plan samplesize and surveyduration, thus ensuring the most effective use of available timeand money. If thepilot is well prepared and proves to besuccessful, the pilot survey data may become part of themaindata set.
3.3.4 Liaison with other agenciesThe approval of the authorities may be required for any activityon the various study locations,and their permanent presence may be necessaryfor some types of survey. However, as far aspossible, the authoritiesmust be made aware that there should be no unusual policepresence oractivity in the survey area which could affect thetraffic characteristics being measured in thesurvey (for example,additional enforcement of speed limits).
3.3.5 Surveyor safetyAny work close to moving traffic has potential dangers. Allsurvey staff should have suitableinsurance cover, and eachindividual should be given a verbal briefing on trafficsafetyprecautions. There may be legal obligations on the part of the surveyorganisers in respectof safety; these must be established andadhered to.
3.3.6 Material Requirements for Manual CountsThe traffic data enumerators should be provided with traffic counting equipment’s, data sheet(s)and written instructions prior to the count. Others include writing materials and reflectivedresses. NMT count forms and Counter Instructions are provided in the Appendix
25
3.4 NMT Survey Methodology
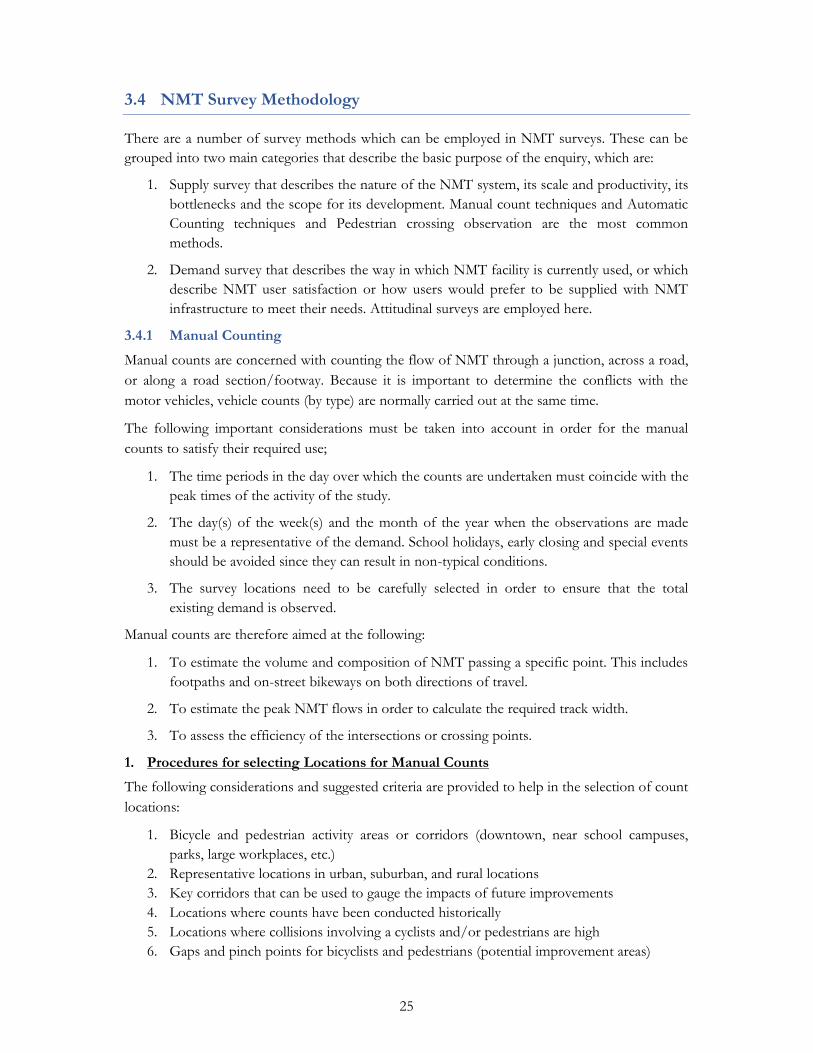
There are a number of survey methods which can be employed in NMT surveys. These can begrouped into two main categories that describe the basic purpose of the enquiry, which are:
1. Supply survey that describes the nature of the NMT system, its scale and productivity, itsbottlenecks and the scope for its development. Manual count techniques and AutomaticCounting techniques and Pedestrian crossing observation are the most commonmethods.
2. Demand survey that describes the way in which NMT facility is currently used, or whichdescribe NMT user satisfaction or how users would prefer to be supplied with NMTinfrastructure to meet their needs. Attitudinal surveys are employed here.
3.4.1 Manual CountingManual counts are concerned with counting the flow of NMT through a junction, across a road,or along a road section/footway. Because it is important to determine the conflicts with themotor vehicles, vehicle counts (by type) are normally carried out at the same time.
The following important considerations must be taken into account in order for the manualcounts to satisfy their required use;
1. The time periods in the day over which the counts are undertaken must coincide with thepeak times of the activity of the study.
2. The day(s) of the week(s) and the month of the year when the observations are mademust be a representative of the demand. School holidays, early closing and special eventsshould be avoided since they can result in non-typical conditions.
3. The survey locations need to be carefully selected in order to ensure that the totalexisting demand is observed.
Manual counts are therefore aimed at the following:
1. To estimate the volume and composition of NMT passing a specific point. This includesfootpaths and on-street bikeways on both directions of travel.
2. To estimate the peak NMT flows in order to calculate the required track width.
3. To assess the efficiency of the intersections or crossing points.
1. Procedures for selecting Locations for Manual CountsThe following considerations and suggested criteria are provided to help in the selection of countlocations:
1. Bicycle and pedestrian activity areas or corridors (downtown, near school campuses,parks, large workplaces, etc.)
2. Representative locations in urban, suburban, and rural locations3. Key corridors that can be used to gauge the impacts of future improvements4. Locations where counts have been conducted historically5. Locations where collisions involving a cyclists and/or pedestrians are high6. Gaps and pinch points for bicyclists and pedestrians (potential improvement areas)

26
2. Methodology for Manual CountsThe counting is conducted for a period of one week of daily counting. NMT counts are normallyconducted during daytime, but could as well be conducted in the night depending on theobjectives of the counts. A time interval of 15 minutes between counts is recommended forurban studies; rural counts could have intervals of about 30 minutes. A person who passes by apoint more than once is counted each time they pass by the point.
Along road sections, one observer for each side of the road counts bicycles in the normal flowdirection, and all pedestrians and carts on that side of the road irrespective of their direction. Onroundabouts, it is more important to count the number of pedestrians, cyclists and carts thatcross each intersection arm (without for pedestrians separately counting from which side onecrosses; cyclist and carts will generally cross in one direction only). For normal intersections, onlycount the total number per category of NMT approaching from each side, withoutdiscriminating in which direction they leave the intersection.
3. Quality Control for Manual CountsThe Count Coordinator and any location supervisors should conduct a random review ofcounters during the count period to ensure they are on-duty and tabulating informationcorrectly. Count results that vary significantly from one-time period to the next or that areunusually consistent may need to be explained sufficiently to the Count Coordinator’ssatisfaction, or discarded.
3.4.2 Pedestrian Crossing ObservationsThe pedestrian crossing observation yields the following information on the pedestrians:
1. Road crossing time is important in computing the mean walking speeds and theavailability of adequate gaps in the traffic stream to enable safe crossing by pedestrians
2. Crossing behaviour of individual or group crossing are vital as they indicate theavailability of crossing facilities and accident risks as perceived by pedestrians
3. Pedestrian crossing trajectory could be right angle or diagonal depending on theavailability of crossing gaps and vehicle speeds on that section
4. Pedestrian crossing spot could be within 20m, between 20 to 100m from crossing pointor at the Crossing point (RZC/painted). This information need to be recorded as well
5. Information on Age and Gender of Pedestrians may also be taken for comparativestudies and subsequent social analysis.
All this information is collected using a structured questionnaire, prepared according to thequality of data required. The crossing time are obtained using stop-watches. The following twostudies are conducted as described in sub-section above to obtain the specified pedestriancharacteristics:
3.4.3 The Pedestrian Volume Count StudyThe Pedestrian Volume Count Study is used to determine the volume of pedestrians crossing thestreets at signalized or non-signalized intersections. This study is used predominately forMinimum Pedestrian Volume Warrant for signals installation.

27
3.4.4 The Pedestrian Group Size StudyThe purpose of the Pedestrian Group Size Study is to determine adequate gap time required forthe 85th percentile group size of pedestrians to cross a street of specified width at a given time.The form for this study is shown in Appendices
3.4.5 Attitudinal SurveysAttitudinal surveys are meant to capture the social characteristics of the non-motorized traffic.Apart from the age grouping, the social characteristics obtained from these surveys include;Modal safety, Gender aspects, Fare differences and fare competitions, Income levels of NMTusers, Trip frequencies, Comfort of NMT modes, Competition between the NMT modes andthe MT modes and Poverty levels.
3.4.6 Video SurveysCameras are set up at the selected sites and video recordings taken of the pedestrian and cyclistmovement, together with their interaction with vehicles where appropriate, during the selectedobservation periods. A suitable elevated vantage point for the camera is important.
This survey produces a permanent record of pedestrians and cyclist’s movements and theirinteraction with the vehicles. In addition, a record of delays and behaviour patterns (e.g. thereluctance of the elderly to cross the road) is also obtained.
3.4.7 NMT Route Inventory SurveysRoute inventory forms the core of the NMT planning activities. The inventory is used to assessthe continuity, conflicts, completeness, appropriateness and forms one of the primary inputs intothe planning processes.
A condition assessment should be carried out as part of the outputs to identify currentconditions, degrees of separation and potential conflicts with other forms of transport etc. Thisis combined with usage data, such as NMT volumes, to identify projects and systemimprovements.
Route inventory surveys are usually carried out by high quality satellite and aerial photographs ofthe area and through visual assessment to determine the prevailing physical and operationalconditions of the road network. The key information collected during the surveys include but arenot limited to; (1) Available road reserve; (2) Features in the cross-section; (3) Pavementconditions; (4) Spaces allocated to the various users; (5) Speeds and volumes of traffic; (6) Safetyand security issues; (7) Problems encountered by the users etc.
Generally, the route inventory exercise is to assess the SHAPE, USE, and FUNCTION of eachroad/route link in the urban road transport network.
3.4.8 NMT Route Inspection and Identification SurveysExisting NMT routes can be identified from topographical maps and through visual assessmentto identify potential attractive (desired) route locations that would improve the NMT routesnetwork while walking in network.
The main objectives of this survey are: (1) To identify the location/spots with mobility problemsalong the NMT route in order to come up with a diagnosis of the problems, in terms of their

28
importance and urgency, (2) Make a first list of the intervention options for the NMT problemsidentified.
Procedure for Conducting NMT Route Inspection and Identification1. Walk the entire route and make thorough observations of all route sections,
intersections, and special points, find out where most people walk/cycle within thebroad area of the determined route (within 200-300m) on either side of the routeas sketched on the map.
2. Write down the observations, and take pictures of all important points on theNMT path and note down exactly the position/place, orientation and time ofphotography.
3. Conduct OD surveys i.e. Interview the NMT road users to determine their journeyorigins and destinations.
4. Measure important widths and dimensions such as width of the pedestrian route,crossing distance, length of a section where pavement improvement may berequired, width of junctions etc.
5. If the observations above give no clear results, conduct a few precise NMT countsalong a screen-line, whereby you try to count all the pedestrians/cyclists that crossthat line at any given point.
6. Observe where important number of people cross the line then count the numbersat all these points throughout the working day. This shows you which routealignment alternatives in practice are the most important ones.
7. After completion of the inspection, write down a summary report that lists all theimportant problems that were found during the inspection.
Processing of OD Outputs of NMT Route Inspection and Identification1. Draw NMT Origin Destination line pattern. Draw lines that connect the main
origin and destination of trips on a map (use O/D pattern map and the map withtrip attractor locations). For long trips using public transport, only lines to the busterminals remain on the map of the pedestrian routes.
2. Select NMT roads that match the O/D lines. Search for those roads or knownNMT shortcut routes that form the continuous route that closely follow thestraight lines.
3. Identify gaps. If resulting first main route network sketch shows strange gaps(where no connection is shown between important routes) look at what might bethe reason, and may be adopt the sketch.
4. Important Note: The distance between two NMT routes in the outer area of thecity should not exceed 2 km for cyclists and 1 km for pedestrians. In high-densityareas the distances (off-sets) are 1 km and 0.5 km respectively.
5. Check with maps of accidents, barriers and MT volume. Look at the networksketch compared to the topographical maps of traffic accidents, MT volumes etc.

29
and indicate on the map where the potentially dangerous or difficult points existson the map. Also, mark other points where a route is expected to lack essentialcomfort and attractiveness (these points should be checked carefully during thefield inspection).
6. Label the NMT routes (as though they were public transport routes) and make amap showing all routes. Define the starting point and the end point of each route.
3.4.9 House Hold Interview SurveysThe main objectives ofhousehold surveys are to; (1) to obtain a sufficient precise overview of allNMT aspects of urban travel demand and travel pattern; (2) to obtain a statistically reliableestimate of the current trip patterns of NMT between the origins and destinations zones. Asample size of 1% of the total population is usually recommended. Some of the uses of NMThousehold interview survey data include;
1. Monitoring of performance and costs of the urban NMT travel system.
2. Developing travel demand models and behaviour of NMT users.
3. Forecasting future developments of the current NMT travel demand pattern usingexplanatory/ independent variables (e.g. age composition of the population,employment, household income, future travel costs and land use) in combination withthe travel demand elasticity of the base year.
4. As a compliment to NMT traffic volume count especially where:i. The NMT traffic volume counts do not covers all trips the trips in the main road
system.ii. In situations where cars are highly expensive relative to the average income.
3.4.10 NMT Road Side Interview SurveysThis is done to supplement household survey and is to obtain information from people whomight not have been interviewed in their houses or place of work. It can also be undertakenalone for collecting information from the regular users of the transportation facilities. Theinformation required includes modal choice, NMT route choice, level of income, accident andsafety details, transport costs and level of comfort and perceived intervention measures, and soon. Some of the frequently asked questions as below.
3.4.10.1 Cyclist PassengerSome of the questions that can asked are:
1. Origin/Destination/Journey purpose: Ask for the origin, destination and the purpose forthe journey is made.
2. Modal/Route choice: Ask why he preferred to use the bicycle and that particular route asopposed to the other available alternative modes of transport and routes.
3. Trip information/Journey time and cost:i. How frequent does he make this journey by this mode and along this route.

30
ii. How far is his house/origin from the cycle stage and his destination fromwhere the bicycle shall drop him? How long is the distance to be covered onthe bicycle?
iii. How long (time) does he walk from his house to the cyclist stage, time spentseated on the bicycle and the time it takes to walk from where the bicycleleaves him to his final destination.
iv. What is his occupation, his average income and how much does he spent forthis type of journey.
4. Perceived intervention measures: What does he feel/thinks about this mode of transportand what he suggests should be done to improve its level of comfort and convenience.
3.4.10.2 Cyclist OperatorSome of the questions that can asked are:
1. Bicycle ownership and operational costs:i. Is the bicycle yours/hired from individual, organization.ii. How much do you spent in a week in routine maintenance, spare parts
replacements, tyres etc.
2. Trips nature and fare: Which route do you operate and why? Describe your trips in termsof origin and destination, average distance covered, fare charged and time taken. Howmany trips do you make in an average day?
3. Accidents and safety: Ask for dangerous points in terms of collisions (accident spots).Describe the nature of collisions e.g. Bicycle-pedestrian, Bicycle-vehicle etc. Thecasualty/injuries and damage to the bicycle). Possible causes, times and frequency ofoccurrence.
4. Present level of discomfort/perceived intervention measures. What does he feel ispresently not a good measure? What does he want to be done to improve the workingconditions in terms of comfort, security and infrastructure?
3.4.10.3 PedestrianSome of the information that could be sought are listed below:
1. The Origin, destination and purpose of the journey.
2. Modal and NMT route choice.
3. Trip description in terms of distance covered, time taken, how long he takes at hisdestination before coming back (in case he makes a return journey). The frequency ofmaking such trips.
4. Income and transport costs: Occupation and estimated level of income, how much hespends in transport.
5. Safety: Which points along the preferred route he finds unsafe, why and at what time.
6. Present level of comfort and proposed future intervention measures
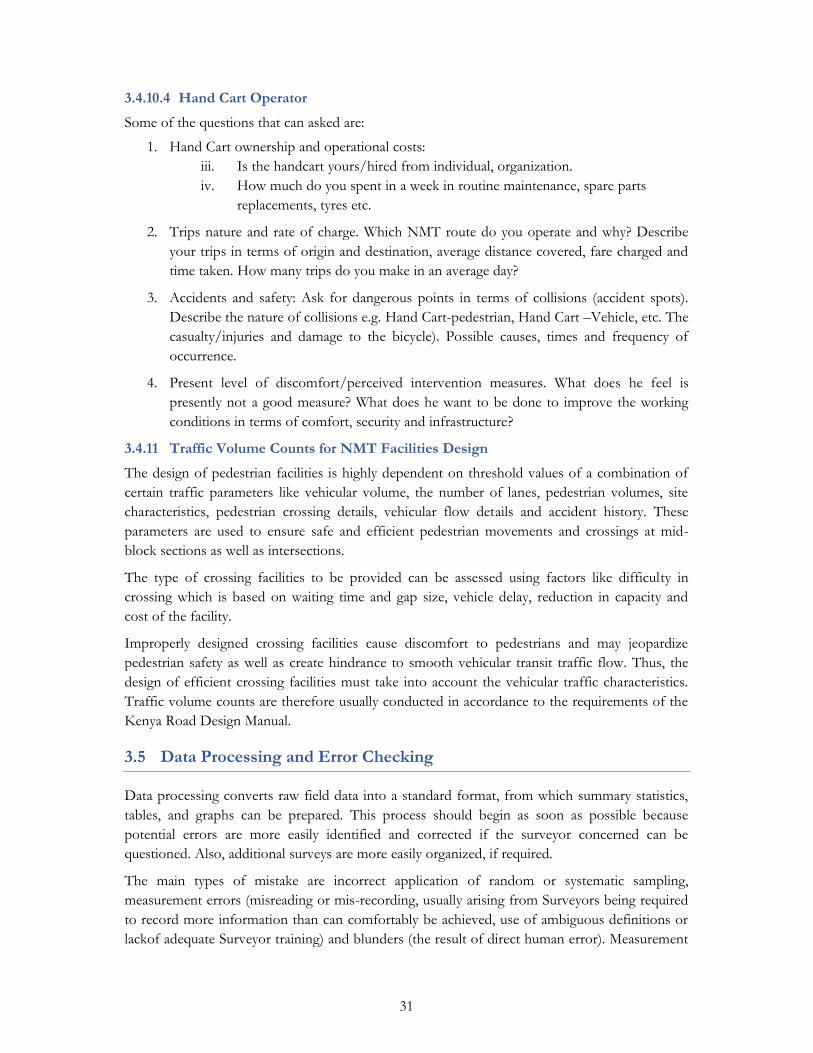
31
3.4.10.4 Hand Cart OperatorSome of the questions that can asked are:
1. Hand Cart ownership and operational costs:iii. Is the handcart yours/hired from individual, organization.iv. How much do you spent in a week in routine maintenance, spare parts
replacements, tyres etc.
2. Trips nature and rate of charge. Which NMT route do you operate and why? Describeyour trips in terms of origin and destination, average distance covered, fare charged andtime taken. How many trips do you make in an average day?
3. Accidents and safety: Ask for dangerous points in terms of collisions (accident spots).Describe the nature of collisions e.g. Hand Cart-pedestrian, Hand Cart –Vehicle, etc. Thecasualty/injuries and damage to the bicycle). Possible causes, times and frequency ofoccurrence.
4. Present level of discomfort/perceived intervention measures. What does he feel ispresently not a good measure? What does he want to be done to improve the workingconditions in terms of comfort, security and infrastructure?
3.4.11 Traffic Volume Counts for NMT Facilities DesignThe design of pedestrian facilities is highly dependent on threshold values of a combination ofcertain traffic parameters like vehicular volume, the number of lanes, pedestrian volumes, sitecharacteristics, pedestrian crossing details, vehicular flow details and accident history. Theseparameters are used to ensure safe and efficient pedestrian movements and crossings at mid-block sections as well as intersections.
The type of crossing facilities to be provided can be assessed using factors like difficulty incrossing which is based on waiting time and gap size, vehicle delay, reduction in capacity andcost of the facility.
Improperly designed crossing facilities cause discomfort to pedestrians and may jeopardizepedestrian safety as well as create hindrance to smooth vehicular transit traffic flow. Thus, thedesign of efficient crossing facilities must take into account the vehicular traffic characteristics.Traffic volume counts are therefore usually conducted in accordance to the requirements of theKenya Road Design Manual.
3.5 Data Processing and Error Checking
Data processing converts raw field data into a standard format, from which summary statistics,tables, and graphs can be prepared. This process should begin as soon as possible becausepotential errors are more easily identified and corrected if the surveyor concerned can bequestioned. Also, additional surveys are more easily organized, if required.
The main types of mistake are incorrect application of random or systematic sampling,measurement errors (misreading or mis-recording, usually arising from Surveyors being requiredto record more information than can comfortably be achieved, use of ambiguous definitions orlackof adequate Surveyor training) and blunders (the result of direct human error). Measurement

32
errors are often difficult to detect later. Serious blunders are usually detectable if proper datachecking procedures are followed. However, every attempt should be made to avoidmeasurement errors and blunders from the start, as many errors cannot be identified once thedata are collected.
The designer should look for unusual values or patterns in lists, tables, diagrams, and graphs.Discussion of unusual results with the Supervisors is often very productive. There are no fixedrules, but an investigation could be carried out as follows:
1. Consider what reasons could have caused the fluctuation, for example, an effect such asthat shown in the log.
2. Consider whether the surveyor forgot to change time periods every 15 minutes, resultingin periods being longer or shorter than 15 minutes.
3. The surveyor should be questioned about this and the original survey forms examined. Ifthis was the cause, the effect could be reduced by combining 15 minute periods into, say,one hour periods instead.
4. Compare existing data from other surveys, to see if the effect was present at adjacentlocations at the same time; at the same location, at the same time; at the same locationand time on different days.
5. If no other data exist, carry out an additional (short)check survey at the same locationand time of day.
6. If no clear conclusion emerges, a judgment must be made on whether the data should beincluded in the analysis.
When an error is suspected in an individual measurement, it should be corrected or discarded. Itshould be corrected only if the correct value is known with reasonable certainty. It is importantnot to throw away data lust because it might be in error: stronger evidence is needed. In moststudies, a few extreme values will not materially affect the results. However, in studies interestedmainly in extreme values (for example, observance of speed limits) the treatment of extremevalues needs to be rather more thorough, and include a visual assessment of a histogram of allthe data.
Data processing resource needs (excluding analysis) vary considerably between different types ofsurveys. As a rule of thumb, processing time can take about twice the time of field datacollection. Computers do not necessarily speed up procedures as much as might be expected,though the direct entry of observations into a hand-held computer clearly has the promise ofmuch-reduced processing time.
3.6 NMT Data Analyses
3.6.1 IntroductionThe analysis seeks to draw conclusions relevant to the study objectives from the datacharacteristics and trends established in the surreys. Statistical techniques can be used to indicate,for example, whether there is a relationship between variables under examination or whether asignificant difference has resulted from a particular road treatment. However, the analysiscannot, of itself, say anything about causes; why does one variable respond to a change inanother or why a particular treatment has had some success? It is the job of the traffic engineer

33
to design surveys that will yield data that can be used to test and quantify a hypothesis. Todemonstrate, for example, that higher speeds result from a road-widening the survey must bedesigned to screen out all possible alternative factors (different traffic flows, weather conditions,etc.). The use of control surrey data may be a powerful tool in this analytical process.
3.6.2 Pedestrian Crossing Observation85th Percentile Pedestrian Group Size
The cumulative total number of groups is computed and then multiplied by 0.85 to obtain the85th percentile group size.
Adequate Gap Time
Having calculated the 85th percentile group size, the adequate gap time (G) required for crossingthe street can be found by using the following equation by Millennium MUTCD.
2*13
N
s
WG
Where:
G = Adequate gap time in seconds
W = Width of street in meters. If there is a raised median 1.2m wide or greater, thenW equals the exposed walking distance from curb to median. If W is different foreach direction of travel, then G will be different.
(N-1) = Pedestrian clearance time in seconds
N = Number of rows in 85th percentile group size
s = Use 1.1m/s for normal pedestrian traffic walking speed. The study personnel should conducta walking speed study if the location's pedestrian characteristics are differentfrom normal pedestrian areas (disabled, elderly, children, etc.).
3 = Perception and reaction time in seconds
2 = Time interval between rows in seconds
There is a natural tendency for pedestrians to group together before crossing a street as they waitfor a break or gap in the traffic stream. Thus rows of pedestrians walking abreast form to crossthe street. It has been shown empirically that a row generally will consist of five pedestrians,resulting in the values of "N" provided on the Pedestrian Group Size form.
The following information may also be analyzed and presented depending on the quality of datadesired:
1. Age and pedestrian crossing behavior2. Gender and pedestrian crossing behavior3. Walking level of service4. Volume to capacity ration footpaths

34
3.6.3 Social CharacteristicsThe attitudinal surveys as presented above would result in various analyses. However, thefollowing are the most desirable data presentation for NMT social characteristic surveys:
1. The Problems/Challenges Faced by NMT Users2. NMT Mode-Income Linkages3. NMT infrastructure conditions on survey sites4. Operating conditions experienced by NMT modes5. NMT trip distributions and route choice
3.6.4 Prediction of demand in the design yearOnce an estimate of the existing demand has been obtained it is necessary to predict what thedemand is likely to be at some future date. This is carried out in two stages. The first stage isconcerned with deciding on an appropriate target or design year.
This will depend on the particular local circumstances and planning context, but for pedestrianand cyclist facility planning, a 10-year target figure beyond the end of the planning period is oftenconsidered to be appropriate.
The second stage involves predicting the probable level of change in walking and cycling demandto the design year. In considering this it should be stressed that this is not a precise process sincethe future demand cannot be estimated using carefully researched and formulated mathematicalexpressions. All that can be hoped for is that the estimated flows will be sufficiently close tothose which will finally occur so that the correct decision on the provision of facilities will havebeen taken.
A number of local factors will influence future changes in demand, and these local influences willneed to be isolated, and their importance ascertained, using local planning knowledge andjudgment, together with any relevant inputs from recently conducted attitude surveys. Some ofthe main factors to be considered are:
1. Planned and anticipated changes in land use developments over the design period, andhence possible changes in the number of generated trips being made which fall withinthe distance ranges normally covered by walking and cycling
2. Possible changes in the level and cost of public transport provision, together withconstraints on car usage
3. Changes in the age structure and socio-economic status of the local residents and theeffect of this on car ownership and car usage
4. Anticipated changes in local attitudes towards walking and cycling as viable/accept-ablemodes of travel.
Although, as has been said, the prediction is a difficult and imprecise exercise, it is one that hasto be attempted if an acceptable basis is to be established for justifying the need for anyparticular set of design proposals.
3.6.5 The PV2 Criteria for Determining the Pedestrian Crossing WarrantsPedestrian crossings are important for accessing land developments adjacent to the road.Improperly designed crossing facilities cause discomfort to pedestrians and may jeopardize

35
pedestrian safety as well as create hindrance to smooth vehicular transit traffic flow. Thus, thedesign of efficient crossing facilities considering the flow of both pedestrians and vehicles is ofutmost importance.
The PV2 criteria can be used in the design of pedestrian crossing facilities and states that the typeof crossing facility proposed is dependent on the volumes of vehicular traffic (V) as well as thevolumes of pedestrian traffic (P) as shown in Figure 3-1(Jain & Rastogi, 2016).
Figure 3-1: PV2 Based Pedestrian Crossing Warrant GraphSource: (DoT, 1987)
For a unit increase in ‘P’, there will be a unit increase in PV2, but for a unit increase in ‘V’, therewill be an exponential increase in the PV2 value. The square of ‘V’ in the PV2 criteria ensurespriority to the number of pedestrians in the PV2 criteria. For a small increment in the number ofvehicles ‘V’, there will be a drastic increase in the PV2 value, which will indicate difficulty incrossing the road and the need to provide or improvement of the crossing facility.

36
4 DETAILED NMT DESIGN ASPECTS
4.1 Provisions for Pedestrians
This section gives some important detailed design aspects for pedestrians, cyclists and handcarts, mainly covering space requirements along routes and at crossings. The layouts are given inAppendix 10.
4.2 Provisions for Pedestrians
4.2.1 PedestrianSpace RequirementsThis section provides information regarding maximum limits of reach and minimum dimensionsnecessary to accommodate most pedestriansconsidering that it is not possible to identify alldesign situations, basic reach, geometric parameters, and operating envelopes. Theseguidelineshave been established to assist in the appropriate design of somecomponents of thestreet system and facilities provided for or used by pedestriansto allow for both mobility andaccess.However, designer should not simply design for these maximum limits and minimumdimensions but should ensure that the design provides the highest level of service to pedestrians,and where practicable, accommodate a variety of uses in pedestrian areas. The design envelopesshould include the type of pedestrian activity and local considerations that impact on placementof street furniture or capacity. These facilities should support the pedestrianin carrying out theirdaily tasks, and effectively result in the individual being able to be part of society.
4.2.2 Width Requirements for WalkwaysIn principle, pedestrians are sensitive to the amount of space separating them from otherpedestrians and obstacles as they walk along the sidewalk. The figure below shows the physicalspace requirements for various pedestrians and hand drawn cart.
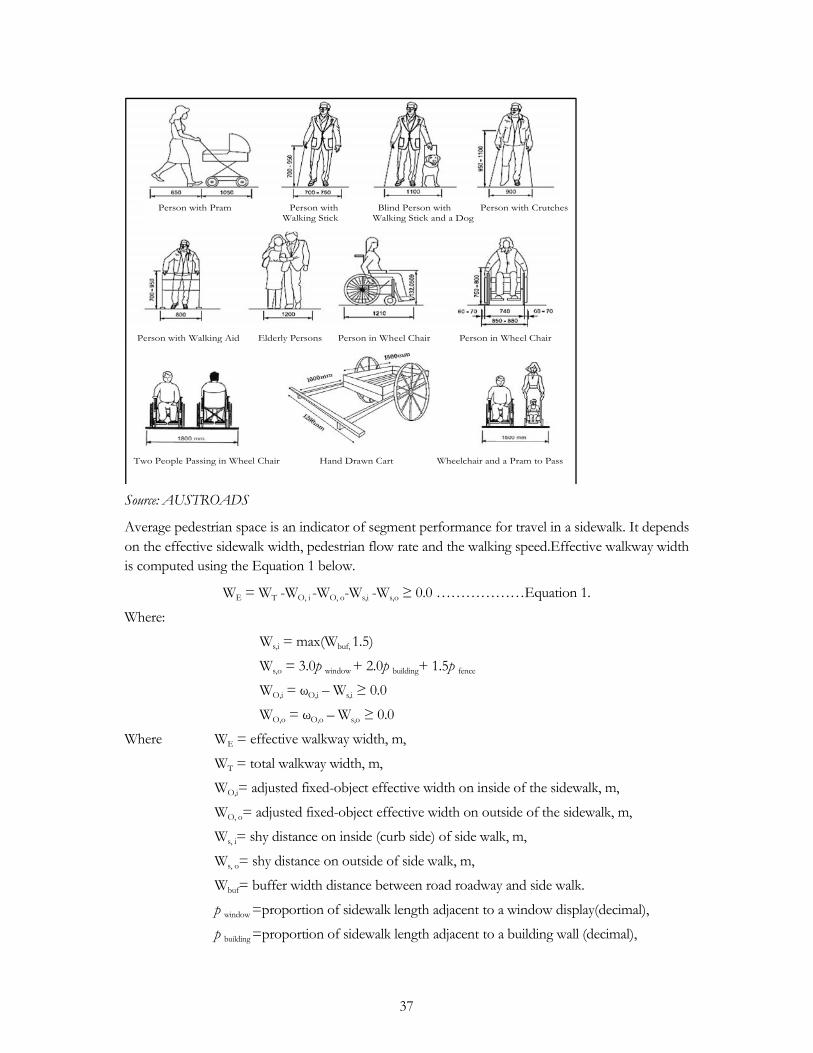
37
Source: AUSTROADS
Average pedestrian space is an indicator of segment performance for travel in a sidewalk. It dependson the effective sidewalk width, pedestrian flow rate and the walking speed.Effective walkway widthis computed using the Equation 1 below.
WE = WT -WO, i -WO, o-Ws,i -Ws,o ≥ 0.0 ………………Equation 1.
Where:
Ws,i = max(Wbuf, 1.5)
Ws,o = 3.0р window + 2.0р building+ 1.5р fence
WO,i = ωO,i – Ws,i ≥ 0.0
WO,o = ωO,o – Ws,o ≥ 0.0
Where WE = effective walkway width, m,
WT = total walkway width, m,
WO,i= adjusted fixed-object effective width on inside of the sidewalk, m,
WO, o= adjusted fixed-object effective width on outside of the sidewalk, m,
Ws, i= shy distance on inside (curb side) of side walk, m,
Ws, o= shy distance on outside of side walk, m,
Wbuf= buffer width distance between road roadway and side walk.
р window =proportion of sidewalk length adjacent to a window display(decimal),
р building =proportion of sidewalk length adjacent to a building wall (decimal),
Person with Pram Person with Blind Person with Person with CrutchesWalking Stick Walking Stick and a Dog
Person with Walking Aid Elderly Persons Person in Wheel Chair Person in Wheel Chair
Two People Passing in Wheel Chair Hand Drawn Cart Wheelchair and a Pram to Pass

38
р fence= proportion of sidewalk length adjacent to a fence or a low wall(decimal),
ωO,i= effective width of fixed objects on inside of sidewalk (m), and
ωO,o = effective width of fixed objects on outside of sidewalk (m),
The relationship between the variables in these equations is illustrated in the diagram below:
Figure 4-1: Illustration on calculating effective sidewalk width.Source: HCM 2016
4.2.3 Walkway Levels of ServiceThe performance of NMT facilities should be evaluated using the Pedestrian Level of Service(PLOS) criteria in the Highway Capacity Manual (HCM 2010). The PLOS criteria in the HCMmathematically combines the factors that affect the quality of service provided to NMT users into ascore. The factors include: the pedestrian flow per unit width of sidewalk (Vp); the average walkingspeed (Sp); and the pedestrian space (Ap). These are calculated as shown below.
The pedestrian flow per unit width of sidewalk is factor of the effective width and is computed byusing Equation 1 below, the variable is an Vp input variable.= ……………………..Equation 1
Where = Pedestrian Flow Rate per Unit Width, m,
υ ped = pedestrian flow rate in both directions of sidewalk (p/h),and
WE = effective walkway width, m,
The average walking speed, Sp, is computed using Equation2 below. This equation is derived fromthe relationship between the flow rate per unit width and the free-flow pedestrian walking speed.
Sp = (1 - 0.00078 υp2)Spf ≥ 0.5Spf ………Equation 2
Where, SP = pedestrian walking speed (m/s)Spf= free-flow pedestrian walking speed (m/s)υ p=pedestrian flow per unit width (p/m/min).
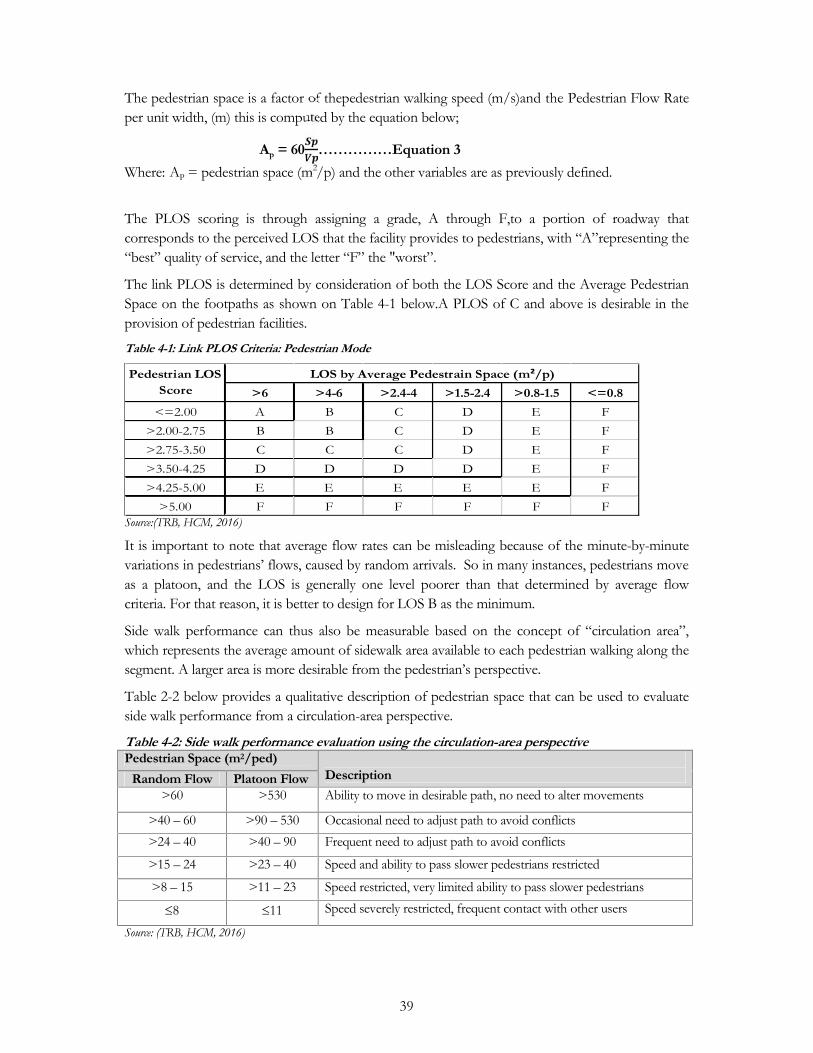
39
The pedestrian space is a factor of thepedestrian walking speed (m/s)and the Pedestrian Flow Rateper unit width, (m) this is computed by the equation below;
Ap = 60 ……………Equation 3Where: AP = pedestrian space (m2/p) and the other variables are as previously defined.
The PLOS scoring is through assigning a grade, A through F,to a portion of roadway thatcorresponds to the perceived LOS that the facility provides to pedestrians, with “A”representing the“best” quality of service, and the letter “F” the "worst”.
The link PLOS is determined by consideration of both the LOS Score and the Average PedestrianSpace on the footpaths as shown on Table 4-1 below.A PLOS of C and above is desirable in theprovision of pedestrian facilities.
Table 4-1: Link PLOS Criteria: Pedestrian Mode
Source:(TRB, HCM, 2016)
It is important to note that average flow rates can be misleading because of the minute-by-minutevariations in pedestrians’ flows, caused by random arrivals. So in many instances, pedestrians moveas a platoon, and the LOS is generally one level poorer than that determined by average flowcriteria. For that reason, it is better to design for LOS B as the minimum.
Side walk performance can thus also be measurable based on the concept of “circulation area”,which represents the average amount of sidewalk area available to each pedestrian walking along thesegment. A larger area is more desirable from the pedestrian’s perspective.
Table 2-2 below provides a qualitative description of pedestrian space that can be used to evaluateside walk performance from a circulation-area perspective.
Table 4-2: Side walk performance evaluation using the circulation-area perspectivePedestrian Space (m2/ped)
DescriptionRandom Flow Platoon Flow>60 >530 Ability to move in desirable path, no need to alter movements
>40 – 60 >90 – 530 Occasional need to adjust path to avoid conflicts>24 – 40 >40 – 90 Frequent need to adjust path to avoid conflicts
>15 – 24 >23 – 40 Speed and ability to pass slower pedestrians restricted
>8 – 15 >11 – 23 Speed restricted, very limited ability to pass slower pedestrians
8 11 Speed severely restricted, frequent contact with other users
Source: (TRB, HCM, 2016)
>6 >4-6 >2.4-4 >1.5-2.4 >0.8-1.5 <=0.8<=2.00 A B C D E F
>2.00-2.75 B B C D E F>2.75-3.50 C C C D E F>3.50-4.25 D D D D E F>4.25-5.00 E E E E E F
>5.00 F F F F F F
LOS by Average Pedestrain Space (m²/p)Pedestrian LOSScore

40
4.2.4 Space required by Shopping PedestriansA minimum of 1-metre along a line of shops or kiosks must be available for the visitors of theshops, in addition to the area of the walkways taken up by displays of the shops, kiosks or pavementdisplay traders.
For pedestrian movements in areas of busy road trading or in a shopping street, the residualwalkway width of transit movement is estimated by reducing the actual width with;
1. The width of the kiosks plus 1-metre in front of the kiosks; and,2. Width of the average portion of the walkways occupied by the displays in front of the shops
and 1- metre in front of the display.
4.2.5 Waiting Time for CrossingIt is possible to estimate the average waiting times of pedestrians before they find a gap in thevehicle stream that is long enough to allow safe crossing (simulation model). Tables 4-6 and 4-7Source: (De Langen & Tembele R., 2001) summarize the pedestrian waiting times (random vehicleflow, no traffic lights) based on assumptions about the vehicle arrival pattern in the vehiclestream.
Table 4-3: Lane crossing situations and corresponding waiting timesCase: 1 2 3 4MT traffic lanes 2×1 2×1 2×1 2×1
Facility at roadshoulder
Open, no cover Open, no cover Protected waiting Protected waiting
Facility in median none none none ISLANDCrossing distance 8 meters 8 meters 6 meters 2×3 metersCrossing time 10 seconds
Slow pedestrians8 secondsQuick pedestrian
6 SecondsQuick pedestrians
2×4 secondsSlow pedestrian
Vehicle flow per hour= 1 + 2 Waiting time(seconds)
Waiting time(seconds)
Waiting time(seconds)
Waiting time(seconds)
Q = 500 14 8 4 2Q = 1,000 96 39 15 3Q = 1,500 * * 65 5Q = 2,000 * * * 9* = more than 120 seconds, i.e. almost impassable

41
Table 4-4: 2x2 Lane crossing situations and corresponding waiting timesCase: 5 6 7 8MT traffic lanes 2×2 2×2 2×2 2×2Facility at roadshoulder
Protected waiting Protected waiting Protected waiting Protected waiting
Facility in median none none Central median Central medianand extra islands
Crossing distance 12 meters 12 meters 2×6 meters 4×3 metersCrossing time 16 seconds
Slow pedestrians12 secondsQuick pedestrian
2×8 SecondsQuick pedestrians
4×4 secondsSlow pedestrian
Vehicle flow per hour= 1 + 2 Waiting time(seconds)
Waiting time(seconds)
Waiting time(seconds)
Waiting time(seconds)
Q = 500 * * 16 3Q = 1,000 * * 80 6Q = 1,500 * * * 11Q = 2,000 * * * 18* = more than 120 seconds, i.e. almost impassable
From the tables, it is evident that without dedicated crossing facilities even at modest trafficintensities (1,000 vehicles per hour) it takes a long time before a safe crossing gap occurs. Apedestrian crossing a two lane road at normal walking speed has to wait an average of 15secondsif the crossing distance is 6 m and 39 s if the crossing distance is 8 m. If s/he has to cross a 2×2-lane road without a median (crossing distance 12 m), it is already impossible to find a safe gapwithin 120 s at a traffic volume of 1,000 vehicles/hour.
In both cases (2×1 lane and 2×2 lanes), the effect of providing a crossing island is enormous.Because the island reduces the crossing distance by a factor 2 and at the same time reduces thetraffic volume of the stream that has to be crossed with a factor of 2 as well, the waiting timegoes down steeply. By providing a median and two extra crossing islands (between the two lanesin each direction), the average waiting time for crossing is only 18 s at a total traffic intensity of4,000vehicles/hour. Without the extra islands and the median it is completely impossible tocross such a road safely.
There is no direct relationship between the waiting time for a safe moment to cross and the riskof traffic accidents. The risk of traffic accidents increases with increased waiting time becausepeople get anxious and take greater risks. However, the most important risk factor is themaneuvering error of the driver. These can also happen in the case of traffic islands. It istherefore important that in combination with the application of traffic islands the speeds of theMT are also moderated. In that manner, the crossing safety of urban roads can besubstantiallyimproved.
For the safe use of the pedestrian crossing islands, it is desirable that the vehicle speed at thecrossing point is below 50 km/hr, but if that cannot be achieved by the design of the traffic lanedeviation past the island, additional low speed humps will be necessary.

42
4.2.6 Recommended Crossing OptionsThe combination of the waiting time aspect and the crossing safety aspect leads torecommending the choice of crossing facilities on urban collector roads and corridors roads asillustrated below.
Road Classification Recommended Crossing Options
Access Roads andService Roads
All traffic types are mixed, and no crossing facilities needed
Local road collector The systematic use of raised zebra crossing is recommended at mid-sectionlocation where NMT routes cross and at bus bay locations. On otherspots, where the volume of crossing pedestrian is low but speed reductionis desirable, use speed humps. At intersections with other local collectorsanother option is a raised platform intersection (the slopes 15 m before thecenter-line of the intersection, pedestrians cross directly behind the slopeson the intersection).
District collector Pedestrian crossing islands and raised zebra crossings can be used. There isa preference for pedestrian crossing islands in those cases where aninterrupted flow of transit traffic is desirable.
Urban corridor Uninterrupted transit traffic flow has priority, though at controlled speeds.Use pedestrian crossing islands on intersections, with and without trafficlight control, as well as at mid-section (‘‘mid-block’’) locations.
4.2.7 Guidelines for PLWDsA guideline is a linking together of ‘natural’ elements which the visually impaired are able to usefor orientation, there should be fairly straight and easy to detect for example a building frontageline, a lawn edge, fences, walls, a raising in or along the side of the road surfacing or perceptiblechanges in odd paving materials. A kerb cannot usually serve as a type of guideline due to therisk of stumbling and falling onto the main carriageway.Ensure that present features used as guidelines for orientation (building frontages, fences, gardenwalls etc.) are kept free of obstruction. Avoid breaks in the uninterrupted ‘natural’ guidelines asmuch as possible. Where there are long breaks in the guideline (between buildings, exits orirregular indentations) this may be compensated for by possibly introducing other orientationpoints or continuing the line as illustrated in the Figure 4-2 below.

43
• a = guideline (building frontage, fence or lawn edge• b = guidance line (where guideline is not continuous)• g = 0.60 mFigure 4-2:Guidelines for PLWDs
4.2.8 Phased RampPhased ramps and landings should be constructed alongside stairways promote common usewith, and mobility of disabled people. A series of gradients with the same degree of slope ispreferable or the gradient should be almost negligible.
Coloured marking need to be applied at the start and end of ramp for the benefit of the poorsighted.Where possible, introduce non-slip surfacing on phased ramps or other similar safetymeasures. Guardrails need to be included along the sides of ramps and should be positioned in away that each slope and landing is linked perpendicular to the next, and where the start and endat an angle of 0º or 90º in relation to the normal direction of movement The figure 4-3 belowgives an illustration.
a ≤ 1.50 m b ≤ 0.50 m c ≤ 1.00 m
d = 1.20 m e = 1.50 m f = 1:20 (1:10)

44
Figure 4-3:Phased Ramp
4.2.9 Position of Obstacles on NMT FootpathsAlthough obstacles should be avoided on NMT paths, they serve as protectors of NMT supportfacilities. They also assist disabled people to improve their mobility and participate in traffic.Obstacles on routes used by the visually impaired should be easily detectable and present nohindrance to traffic. The height of obstacles should be such that these are easily detectable (thisparticularly goes for block shaped plant pots, benches and advertising display cases).Overhanging branches, which might cause an obstruction, need to be trimmed, protruding partson marker posts need also to be harmonized. It is preferable to have obstacles, which arecontinuous in form down to the level of the footpath. If this is not the case, then warning marksneed to be applied.
b= 1.5(0.9) m c= 1.20m
Figure 4-4:Position of Obstacles on NMT Footpaths
4.2.10 Guard Rail DetailsFor the optimum ease of grip, a form of rail should be applied which is easy to hold onto (e.g.with rounded edges) important for the visually impaired, people with balance problems and theelderly). They should be constructed in a tabular profile with wood or a steel strip and shouldnot let to come to an abrupt end (run into wall or continue into the ground. Guardrails shouldbe resistant to transverse forces and be provided with a plastic covering which contrasts sharplywith the surroundings. The following figure shows a basic outlay with the minimum dimensionrequirements.

45
a = 0.06 (0.04) m b ≥ 0.06 m c = 0.041 m
d = 0.04 to 0.045 m e = 0.05 m f = 0.008 m
Figure 4-5:Position of Obstacles on NMT Footpaths
4.2.11 Guard Rails on StairwaysGuardrails should be constructed alongside stairways and around landings, to improve on safetyand comfort of walking. The construction of should be designed in such a way that climbing onor falling sideways from the stairway is rendered impossible.
The specifications for with normal use guardrails should be applied at start and end of stairwayswith a horizontal overlap of at least 0.45 m plus have vertical sections run to the ground level;the guardrail should not impede the movements of other pedestrians. An easy to grip guardrail isnot only important for disabled people but also for the other pedestrians, particularly so for theelderly.
The figure below gives an illustration on how the guardrails should be constructed.
b ≥ 0.70 m (width of riser) c ≥ 0.45 m
c ≥ 0.45 m d = 0.60 m (yellow rubber mat)

46
d = 0.60 m (yellow rubber mat) b ≥ 0.70 m (width of riser)
e ≤ 0.10 m h = 0.85 to 0.90 m;
= 1.00 m, on open sides of landingsFigure 4-6: Guard Rails Alongside Stairways
4.2.12 Accesses and Plot EntrancesThe general principle is: the pedestrians on the walkway have priority over traffic that enters theplot. This must be clear in the design of entrances.
The recommended entrance width is 3.0 m with the smallest turning radius needed to allowaccess to the type of vehicle involved. A single lane should be used. For entrances to largebusiness compounds or factories, with a lot of traffic, separate in and out lanes arerecommended.
The entrance should be ata right angle with the carriageway (T-shape), to enforce a low entry andexit speeds. Y-shape entrances and exits, for example fuel stations or parking lots, must beprovided with speed humps to eliminate high vehicle speeds.
Parking in an entrance, thus blocking the walkway, must be prohibited. A design isrecommended with enough space between a gate and a walkway to store a waiting vehicle beforethe gate opens. The gate should be set back compared to the fence.
It is recommended that the same walkway pavement is continued in the entrance. However,higher road base compaction is required in the entrance and a higher pavement strength.
The walkway should be flat past the entrance. If the walkway and the carriageway have adifferent height, the entrance must slope upwards to walkway height, best with concrete slopingblocks, which further enforce low vehicle speed in the entrance.
Below is an example layout of a fuel station entrance crossing a walk way.
Figure 4-7: Accesses and Plot Entrances

47
4.3 Provisions for Cyclists
4.3.1 Cyclists Space RequirementsThe minimum required pavement width for a single bicycle is 75cm; with a minimum tolerance forsway of 12.5 cm on each side; and, a vertical clearance above the ground of 35 cm on each side(shown in the figure below). The comfortable width is therefore 1m.
However, a 1m wide track does not allow overtaking of one cyclist by another. To enableovertaking a width of at least 2m is recommended to allow for overtaking and for two cyclists tocycle next to each other.
Source: (De Langen & Tembele R., 2001)
4.3.2 Separate Bicycle TracksThe maximum capacity of a single lane cycle track in case of saturated flow of cyclists is given inthe table below.
Bicycle Track CapacityType of Flow Cycling Speed (km/hr) Capacity per lane/hour (Bicycles) Level of Service
Undisturbed Flow 15 - 20 600 GoodSlightly Disturbed 10 - 14 1,500 AcceptableDisturbed 8 - 10 3,000 BadHighly Congested <8 2,000 Very BadSource: (TRB, HCM, 2016)
The estimates in the table are however applicable to short sections, but should not be used ascapacity estimate for long bicycle routes, as in those situations, the capacity is determined by thedistances between intersections. However, for bicycles it is easier to increase the capacity at theintersections by widening the tracks.
For design purposes, it is recommended to assume a peak capacity of a bicycle route on a singlelane (1.0m wide) separated track of 1,000cyclists/hour; and 2,000 cyclists/hour for 2-metre-widetracks (both bicycle movement in one direction only).

48
The minimum recommended width of a one directional separated bicycle track is 2m. This isrecommended in order to carter for both bicycles carrying goods and normal bicycles. For anormal cyclist, the ability to overtake a slow goods transporting bicycle is important. For peakbicycle volumes of more than 2,000 cyclists/hour a wider track is needed.
4.3.3 Cyclist Lanes on Mixed traffic roadsMixing of cycle tracks with motorized traffic is recommended only when motorized speeds donot exceed 30km/hr. The corresponding lane width required is therefore 1.5m i.e. 0.15mclearance kerb; 0.75m space for cyclists; 0.5m clearance to MT lanes; and 0.1m for the dividinglane marking.
In practice, a 1.50m width allows cyclists to overtake each other without hindering the car orminibuses on the MT lane if there are few Heavy Goods Vehicles. In case of a high bicycledensity, or many goods bicycles, a 2m wide bicycle lane on a wide carriageway road will be better,and have approximately the capacity mentioned above for a 2m wide separated track as long asthe lane is free from obstacles.
4.3.4 Stopping Distance of CyclistsDuring their trip, cyclists must adapt their speed to the available sight distance, to avoid thedangerous situation of not being able to stop on time. The stopping distance is the distancecovered during the perception-reaction time plus that while braking.
Using the perception-reaction time of a cyclist as 2 seconds and the deceleration rate of thebicycles as 1.5 m/sec, the stopping distances for various speeds are summarized in table 4-3..
Table 4-5:Stopping distance of cyclistsBicycle Speed(km/hr)
Bicycle Stopping Distance (reaction +braking)(meters)
10 8
15 14
20 21
25 30Source: (TRB, HCM, 2016)
4.3.5 Mixed pedestrian/cycle tracksThere are no good estimates available for the number of cyclists and pedestrians that can beaccommodated simultaneously on a mixed pedestrian/cycle (NMT only) track. The minimumrecommended width of a predominantly one way mixed walk/cycle track is 3 metres, widening atintersection to 2m for cyclists and 2m for pedestrians, with a separation between the two. For abi-directional mixed NMT only track with an important cycling function, 4 metres isrecommended.
Mixing of pedestrian and cyclists on the same track is less desirable when most bicycle trafficconsists of long distance trips (5-15km, journey to work). The desired top speed of the cyclists inthis case is 25-30km/hr. Such a speed does not combine well with walking speeds.

49
4.3.6 Sight Distances for Pedestrians and CyclistsThe sight distances between pedestrians, and MT at intersections and at crossing points must beenough to allow both sides a correct judgement of each other’s presence and intendedmovement in order to estimate the distance and speed of each other to avoid collisions. In thetable below, the required sight distances are given depending on the crossing distance and thespeed of the vehicles on the main carriageway.
Table 4-6:Sight distance requirements for pedestrians and cyclists for crossingCrossingDistance(m)
Time needed forCrossing(s)
Approach Speed ofMT (v85)(km/hr)
Sight Distance for Cyclists andPedestrians along MT Lane(m)
5 ±4.5 30
50
70
40
65
100
6 ±4.9 30
50
70
44
70
110
7 ±5.3 30
50
70
47
75
120
8 ±5.6 30
50
70
50
80
125Source: (De Langen & Tembele R., 2001)
As can be seen, the influence of the crossing speed of the pedestrians (or of the crossingdistance) is much lower than the influence of the vehicle speed.
The speed of a pedestrian crossing a road depends on age, health, loads and hindrance by otherpedestrians. Crossing speeds are between 3 km/hr (slow), 4.5 km/hr (normal) and 6km/hr(fast/running). Cyclists that start from standstill are not faster than pedestrians are. A crossingspeed of 4.0 - 4.5 km/hr. can be adopted. For carts operating on a walkway, the same speed canbe used.Along cycling routes, it is desirable to provide a sight distance that corresponds to the stoppingdistance of a cycling speed of 15km/hr, i.e. 14 m. On long sections, it is better to assure aminimum sight distance of 25 m. This is particularly important in the case of small track or lanedeflections past obstacles and billboards.
The design speed of the bicycle determines the desired turning circle. To allow a cyclist tomaintain a constant speed of 20 km/hr, a turning radius of 10 m is required. For a speed of 15km/hr, a radius of 7 m is required. The minimum corner radius for a cycle track corner can beused as a ‘speed inhibitor’ (not too often). The minimum corner radius for a cycle track is 4.0 m(a lower radius makes cyclists lose their balance.

50
4.4 Provisions for Hand Carts
Movement of large pushcarts with the wheelbase of a car on the MT carriageway of collectorroads and corridors creates a lot of delay and unsafe traffic conditions. In urban corridors, cartsshould only be allowed on service and access roads. On collector roads, they should not beallowed on the carriageway, but on walkways.
In view of theirspeed (being operated by pedestrians), cart movements should be combined withpedestrian movements. Mixing carts and bicycles on separate cycle tracks or on cycle lanes isundesirable, in view of their difference in speed and width.If cart traffic is mixed withpedestrians or cyclists, the width should be increased to at least 3m, and turning radii at changesof direction should be large.

51
5 NMT PAVEMENTS
The following basic types of surfacing options are usually considered:1. Asphalt Concrete: This is an ideal pavement material for cycle tracks because it offers low
rolling resistance, and is very comfortable to cyclists. However, a poor road foundation or lackof maintenance can lead to an uncomfortable ride. The cost of constructing asphalt concrete isrelatively lower when compared with concrete-based surfacing. However, acceptableworkmanship is difficult to achieve with labour intensive construction methods. Further,moderately skilled labour is required, and imported resources are needed.
2. Surface Dressing: This type of surfacing is cheaper than asphalt concrete, but requires skilledcontractors. It offers high rolling resistance to cyclist movement and loose chippings reducestability and the safety of the cyclist during braking (skidding). Chances of punctures are alsogreatly increased.
3. Concrete: Concrete surfacing almost requires no maintenance, but special attention should bepaid to shrinkage and expansion joints. They are high cost and not suitable above a subgrade oflow load-bearing capacity. When subsidence occurs, the concrete can break up and cannot berepaired.
4. Concrete Paving Slabs: They offer much less comfort than a closed pavement of asphaltconcrete or concrete. Although widely used in countries like the Netherlands for NMT facilities,they have a number of undesirable properties. Subsidence and loose fitting slabs regularly occur.Side kerbs are required to prevent edge damage and longitudinal joints. Thin slabs (<60mmthickness) slide out of place too easily and are broken more quickly when ridden over. Lastly,good drainage is very important, otherwise water can easily permeate the joints causing the sandlayer below the slabs to be washed away, thus loosening the slabs. Another disadvantage withthe slabs is that they can easily be stolen where there is no social security.
5. Concrete Paving Blocks: Quite similar to concrete paving slabs, but are much stronger intension, and therefore do not easily break due to traffic loads. They have lower maintenancecosts and are not very attractive to thieves because of the difficulty in handling. Constructioncosts are higher than asphalt surfacing, but local materials and labour are heavily employed. Theblocks are less comfortable than asphalt surfacing, but this can be reduced considerably withproper construction and maintenance. The blocks can tolerate subgrade deformations withoutshowing fatigue on the surface, and allows easy access to underground services. Anotheradvantage with the blocks (and slabs) is that they can be obtained in various colours. This isuseful in differentiating the use of the NMT pavements from those of MT (which are largelyasphalt concrete). Clear differentiation of pavements also aids in separation of pedestrian andcycle tracks, and aids easy enforcement of traffic regulations. Lastly, they can be used assubstitute for road marking paints.
The chart below shows the proposed pavement options for NMT paths.

52
Figure 5-1: NMT Pavement Options
Surface: Surface Dressing Surface: Surface Dressing Surface: Interlocking Cobblestone Surface: Surface:
Base: Base: Base: Base: Gravel Material of Minimum CBR of 30% Base:
Sub-base - Sub-base Sub-base - Sub-base Sub-base
SD SD 80 60 35150 125 50 50 100
100 150 100
SD SD 60 60
125 100 50 50
100
SD SD 100
100 100 50
SD SD
100 100
- -
GCS/Cement Improved
ACSand Regulating Layer
Paving Slab
Gravel Material of MaximumCBR of 30% (G30)
Hydraulically Improved Gravel ofMinimum CBR of 60% (HI G60)
Sand Regulating LayerHydraulically Improved Gravel ofMinimum CBR of 60% (HI G60)
Sand Regulating Layer
-

53
6 TRAFFIC MANAGEMENT DURING CONSTRUCTION
6.1 Introduction
Pedestrians and cyclists are classified as vulnerable road users. Construction works thatimpactthe road, road shoulder, bike lanes, crossings or pathways are likely to impact on these users.Whereworks affect vulnerable road users, the following measures should be considered:
1) Road features that are hazardous to cyclists should be treated. This may includetransverse and longitudinal changes in pavement level, changes in surface condition andhazards on the road.
2) Pedestrian and cyclists should not be led into direct conflict with the worksite or trafficmoving around the worksite.
3) Where pedestrians and cyclists are diverted onto an existing roadway, the new path shallbe separated from vehicular traffic by an appropriate traffic control method (e.g.delineation, barriers, warning signs)
4) Cyclists may be directed into lanes carrying traffic if the traffic conditions are suitable formixed traffic.
5) Safe and obstruction free temporary paths shall be provided where footpaths, bicyclelanes and/or roadsused by public transport are blocked by the work.
Worksite sections can be described as follows:1) Advance warning area: where the advance warning signs are erected to warn and inform
of changes to walkway and road conditions ahead and to give pedestrians and cycliststime to adjust their movement patterns.
2) Taper area: where both motorized and non-motorized traffic is guided past the workarea, usually by means of cones or bollards set out in a taper. Barriers or railings may alsobe provided for the pedestrians.
3) Safety buffer area: the unoccupied space between the taper and work areas. Safety bufferareas are designed to compensate for driver error and protect pedestrians and workers byallowing errant vehicles to slow down and stop prior to the work area. This area alsoprotects road users from hazards in the work area, such as work vehicles and equipment.The length of the safety buffer area should be based on the speed limit of the road.
4) Work area: where the work is being undertaken and is occupied by workers, plant andmaterial.
5) Termination area: where traffic has cleared the work area and at the end of which normalconditions resume.
Signs should indicate the nature of the hazard or work. Once an appropriate sign is chosen, itslocation needs to be incorporated into the worksite’s traffic management plan.
6.2 Pedestrians
Pedestrians, particularly school children, the elderly, vision, mobility, hearing impaired or peoplewithcognitive limitations are supposed to be catered for in work areas. Their safety at or adjacentto roadwork sites is an importantconsideration when planning. Where footpaths or shared paths

54
are impacted by roadworks,alternative facilities shall be provided such as: footpaths; pedestriancrossings; and refuges.
Whenever possible, design works should be planned such that existing pedestrian facilities arenot impacted. It is acknowledgedhowever that this is not always possible and alternate provisionsneed to be made.
If permanent pedestrian controls (e.g. signals, signs) are not in place, a traffic managementworkershould be used to safely direct pedestrians to appropriate crossing points and assist withcrossing theroad.
Desirably, if footpaths or pedestrian crossings have been partially closed or temporarilyrelocated, atemporary footpath should be provided with minimum width of 1.8 m to allow for allpedestrians includingthose with mobility aids or on the same scale and to the same width as anyfacilities for pedestrian thatexisted prior to the works. This width should also be applied to anytemporary ramps (e.g. kerb ramps).
If these widths are not practicable, alternative routes shall be provided with a firm smoothsurface andno trip hazards in the following order of preference:1) On the side of a road reserve away from traffic;2) Between the work area and road but not in a traffic lane;3) Onto the road either in a lane used for parking or a delineated and protected section of an
existing traffic lane;4) Across the road to a footpath on the opposite side with delineation at crossing points and
kerb ramps. Consideration is required for persons with impaired vision, mobility, hearing orcognitive limitations. Only use this option if an appropriate crossing facility can be provided;and,
5) A traffic controller to safely guide pedestrians around the operation. Only use this option ifthere is no safe temporary path available.
Appropriate surfacing shall be provided for prams, strollers, wheelchairs or any other mobilityaids. Temporary paths shall be illuminated at night to the level of lighting previously available onthe original footpath or crossing, whichever is the lesser level.Safety fences or traffic cones shallbe installed with cone bars at unattended worksites or wherepedestrians may gain access.
If falling debris is a risk and there is no alternative footpath available, a structure may need tobeprovided to protect pedestrians and a traffic controller provided to guide pedestrians safelypast thehazard.
Temporary crossings shall be provided as near as practicable to pedestrian routes with the samelevelof functionality as the crossings they replace. This includes signals and provisions for peoplewith vision,mobility, hearing or cognitive limitations. If a temporary crossing becomes unusableor the pavement markings are obliterated, cover anyremaining indication of the crossing andinstall barricades/safety fences on both sides of the road toprevent access crossing. Analternative crossing system shall be provided instead. If the roadway is converted from one-wayto two-way and pedestrian crossings are required, considerthe following:
1) Containment fences and pedestrian mazes should be considered to restrict wherepedestrians cross the road. Ensure that containment fences do not put pedestrians at riskby impacting on visibility between vehicles and pedestrians, including children.

55
2) Traffic controllers may be required to provide guidance at pedestrian crossings.3) LOOK BOTH WAYS and TWO-WAY TRAFFIC signs shall be placed facing
approaching pedestrians on both sides of the crossing.4) The crossing shall be limited to a maximum of two lanes. If this is not practicable,
provide a central refuge for pedestrians.
Where pedestrians have been diverted onto an existing roadway:1) The pedestrian path shall be separated from other traffic with plastic mesh fencing.2) A minimum clearance of 1.2 m should be provided from the plastic mesh fencing to the
nearest traffic lane for speeds up to 60 km/h. If this clearance is not practicable, thespeed shall not exceed a maximum of 40 km/h. A temporary speed limit can be imposedif required.
3) If speed is 70 km/h or more, a road safety barrier system shall be used instead of theplastic mesh fencing. Pedestrians shall be clear of the deflection zone behind road safetybarriers.
6.3 Cyclists
Cyclists are similarly vulnerable road users at or around worksites and their safety is an importantconsiderationwhen planning. Where shared roads, paths or bicycle paths are impacted byroadworks, it isnecessary to provide alternate facilities. If a bicycle path exists that will beimpacted by roadworks, thepreferred approach is to maintain an alternative path not on a sharedroad. The following considerations should be made whendesigning facilities for cyclists:
1) Whether cyclists are currently sharing traffic lanes, using bike lanes or shoulders, orriding on pathways.
2) Relevant warning signs should be used to warn cyclists of any changes.3) If the existing bicycle path is on-road and affected by works, a temporary bicycle path to
a similar standard should be provided elsewhere.4) Alternative paths off-road are desirable
If there is insufficient width for a temporary bicycle path same width as the existing bicycle lane,mergecyclists into an existing traffic lane or shoulder. This should include:
1) appropriate approval as required by the road authority in place2) delineation3) additional signage should be placed to alert road users of merging cyclists. This signage
shall be placed at the relevant stopping distance in advance of the closed section of thebicycle lane.
4) consideration of differing speeds and behaviours between cyclists and other road users.Cyclists tend to move slower and in a different manner to other road users.
5) separating cyclists from other road users by time, if the existing traffic lane is narrow orrough, by allowing other road users to manoeuvre past the worksite first and cyclistssecond. Traffic controllers shall be provided to ensure that no other road users followbehind cyclists until they have cleared the area. Multiple traffic controllers will berequired, one for traffic and one for cyclists.

56
6) a temporary speed limit for road users applied to provide safe entry of cyclists intotrafficlanes.
7 NMT SUPPORT FACILITIES
7.1 Introduction
NMT support facilities comprise of objects and amenities used to facilitate transportation andthe proper use of land adjacent to the NMT paths these include; service centres, road furniture,rest areas and recreation facilities. Proper integration helps to decrease the number of accidentscaused by fatigue, provide sheltering for short breaks and long-term stops, to reduce the excesstravel time and, of course, to improve the overall travel comfort.
There are four main basic criteria involved in arriving at the appropriate choices of NMTsupport facilities considering they should be socioeconomically feasible and environmentallyfriendly and safe:
1. Function - seeing how necessary an item is and how it can serve its purpose;2. Siting and Layout - deciding where each item should be placed;3. Form and Appearance - making sure there is continuity or at least a linkage between the
designs of different items; and,4. Durability - considering the expected usage and cost.
7.2 NMT Rest Facilities and Service Areas
7.2.1 Significance of Rest Facilities and Service AreasNMT Rest Facilities and Service Areas create the settings for resting, sitting, nature calls, eating,and social encounters with others. Such settings may be of great importance to the elderly,disabled, those with limited mobility, and adults who have small children to rest beforecontinuing with their trip.
In addition to their functional aspect, items of urban furniture such as benches and tables inparks and squares can also be socially significant as they give these sites a comforting andappealing appearance and draw people in together.
7.2.2 Planning NMT Rest Facilities and Service AreasIn order to design for NMT Rest Facilities and Service Areas, one must first plan, establish anddefine the type of space under consideration i.e. whether it is a park, a street, a plaza, awaterfront, a recreational area, a mall, etc. The initial defining questions are:1. Who are the potential users;2. For what purpose and at what times will it be used; and,3. How will it serve users when they arrive there.

57
Typically, installations where the furnishings have been planned and coordinated as part of abroader design concept are more successful than those are where they have been selectedpiecemeal without taking account of users’ needs, the architectural character or weatherconditions at the site.
7.2.3 Spacing Intervals for NMT Rest Facilities and Service AreasSpacing between NMT support facilities depends on the specific type of the rest facility, thevolume and mix of traffic and the demand for the opportunities. As a general rule, guidance onthe appropriate spacing may be obtained from an analysis of travel times.
However, it is important to ensure that the distance between similar facilities, in terms of timetravelled, is not excessive, considering that NMT users are anticipated to interact with thesefacilities in some form every three (3) kilometers along transit or commuter routes. The objectiveis to provide for an opportunity to stop at this interval to address fatigue.
On dual carriageways, it is recommended that rest areas, are located at mid-point locations onboth sides of the carriageway, offering equal stopping opportunities in advance of sites servicingopposing traffic.
Where duplicate rest areas are not available (due to insufficient funding or demand), facilitiesshould be staggered in the direction of approaching traffic to discourage cross medianmovements and to deter drivers from parking on shoulders and walking across the carriagewayto access facilities.
On major, undivided roads, it is recommended that rest areas, cyclists parking bays and stoppingareas be provided on both sides of the road. This is particularly important in order to eliminatethe tendency to cross the road across oncoming traffic to enter a rest area on the opposite sideof the road and similarly to re-join the walkway or traffic stream on the opposite side.
To the extent possible, rest areas should be located to promote the use of town facilities wherethey are provided and accessible on a given route. These may include toilet and shower amenitiesand the purchase of refreshments.
In planning the location of new and the upgrading of existing rest areas, the status and physicalcharacteristics of the environment of a potential or existing site must be examined. Issuesassociated with topography, landmarks or scenic viewpoints and environmental qualities shouldbe considered.
7.2.4 Safety and Security Requirements for NMT Rest Facilities and Service Areas
NMT Rest Facilities and Service Areas must be constructed of safe materials and designed toprevent injury, without sharp edges or exposed fasteners. They are usually either attached to theground with anchor bolts (for example, using surface mounting, i.e. attaching a bench to aconcrete slab), or embedded in the ground. Naturally, the technique used for mounting shouldbe decided in advance, so the furniture can be designed and made accordingly.

58
The type of furniture and its arrangement should also take into account visibility and sightlines,lighting, and accessibility issues that may be faced by women, children, the elderly and thedisabled. Areas which are unsafe or pose risks should be designed taking these factors intoconsideration.
7.3 NMT Rest Benches
7.3.1 Locations of Rest Benches
The best locations for benches are places where there is heavy pedestrian use such as retailshopping corridors, transit stops, plazas, and spaces outside cultural institutions. Poor locationsare areas where there is little activity, such as in front of offices that close early or buildingswithout windows, and in spaces hidden from view or far away from active areas.
In high-activity areas, there should be access to seating every 60m or every 50m if there is intenseactivity. There should also be rest facilities at regular intervals of 100-200m, with the needs of thedisabled kept in mind. They should be separated from the walking path by a space of 30-60cm,and with the seats level and having a maximum lengthwise slope of 4%; if the slope is greater,the ground should be built up to create a level surface.
7.3.2 Designing for Rest Benches
In designing benches, considerations of comfort are important, but the level of comfortprovided depends on how they will be used: on a shopping street, for example, people may stopbriefly to rest, so comfort is less important than it is, say, in a park, where people may spend halfa day in seating areas. In general, the selection or design of benches should take into account allrelevant conditions of use.
The design options for a site can be increased if the types and heights of seating (stairs, benches,seat walls, etc.) are varied:
1) The length of seating elements should be 60cm per person;2) For benches, the recommended height of the seating surface is 42.5cm, with a width of
35 - 40cm and the back rest extending for 50cm;3) Benches with arm and back rests provide support to users’ bodies; to provide
appropriate back support for users, the back rests should be 32.5 - 37.5cm in height;4) Between the seating surface and the back rest there should be a 95° - 100° angle, and the
seating surface should slope back at an angle of 10°;5) Walls to be used as seat walls should be 37.5 - 60cm in height (42.5cm is recommended);
and,6) The depth of a seat wall should be at least 37.5cm if access is only available from one
side, or 75cm (90cm is recommended) if it is available from both sides.
59
7.3.3 Rest Benches for the PLWD
For users with disabilities, some seating should be located near public toilets and other places ofinterest. In general, rest areas with benches should allow:
1) At least 1m of adjoining space to accommodate wheelchairs for the same reason;2) Table surface heights should be within the range 0.75 - 0.90m; and,3) The minimum height under the table should be 0.6m.
7.4 Waste receptacles on NMT Paths
7.4.1 Locations of Waste Receptacles on NMT Paths
The most common error in placing waste receptacles is putting them wherever there is an emptyspace, instead of in places where people will use them. If they are not placed appropriately, theywill remain empty while the surrounding area becomes littered. This is because people resistchanging their habitual walking path to find a trash bin, so the proper placement of these itemsof furniture is crucial.
The number of waste receptacles to be provided depends on how many people use an area, howmuch litter is produced in the area, and on how efficient maintenance and sanitation programsare. Their location should not detract from the utility of the road and footpaths. In these areas,discreet cigarette stubbers should be provided instead of ashtrays.
7.4.2 Design of Waste Receptacles on NMT Paths
Waste receptacles should have certain qualities, of which the most important is that they shouldclearly look like places for discarding litter. If they blend in with the environment too well theywill become unrecognizable. While they should certainly be compatible with other streetfurniture and with the local architecture, their function and purpose must be clearly recognizable.
7.4.2.1 Ease of Use
An important quality of a good waste receptacle is ease of use. The following characteristics arethe most desirable:
1) Disposal of waste should be possible without having to touch the receptacle or open adoor to use it. Trash bins are most easily accessible when they are about 100cm in heightwith the receptacle at most 40cm from the outer edge;
2) The opening of the receptacle should be large enough for litter to be put in, dependingon the context. In parks, for example, people may dispose of larger items, so the openingshould be bigger. In general, it should be at least 25cm wide, so a folded newspaper ortake-out food container can be put into it. If the opening is too small, items can be stuckin it and litter will be strewn in the vicinity of the receptacle; and,
3) The opening should also be at most 90cm above the ground to facilitate use by thedisabled.

60
7.4.2.2 Size and Dimensions
The size of the receptacle should be determined by its expected use and how often it will beemptied. Well-organized public spaces have several smaller receptacles that are emptied often,rather than one large receptacle that is only emptied at long intervals. Some considerationsinclude:
1) In most areas, containers with a volume of 114 - 190 litres are sufficient. Wheelie bins aresuitable for areas where there is a high volume of trash, if they can be emptied easily bycollection equipment;
2) In shopping centres, 120 litre wheelie bins with a framed cover over the top arerecommended; and,
3) In town and district parks, 240 litre or 120 litre wheelie bins should be provided,depending on user needs.
7.4.2.3 Materials and Build Quality
Waste receptacles should:
1) Be sturdy and robust to bear the forces of activities such as vandalism, minor accidentsor being leaned on by passers-by or heavy discarded objectsbeside or on top of them.
2) Be durable and resistant materials able to contain all kinds of chemical and flammablematerials, and resilient to rust and stains.
3) If they are attached to street lights they should not obstruct the flow of pedestrians, andshould be painted in contrasting colours to assist those with low vision.
7.4.2.4 Maintenance and Waste Collection
It is important to know how often waste receptacles will be emptied. In areas where thereceptacles are being inspected regularly, they can be lined with plastic bags. If it is expected thatthe receptacles will be emptied daily, they may be lidless; otherwise there may be a need for themto have a hinged lid resistant to outdoor weather conditions. Lids are also important forreceptacles outdoors, to prevent the garbage from getting wet. In addition to having the wastefrom them collected, the receptacles themselves should also be cleaned from time to time.
7.5 Water Fountains on NMT Paths
7.5.1 Locations of Fountains on NMT Paths
In open outdoor spaces, water taps or drinking fountains should be available in dense urbanareas to mitigate fatigue during high temperature seasons. These should be provided at amaximum of three (3) kilometer intervals, at the rest areas and appropriate commuter locations.This will allow pedestrians and cyclists to ensure proper hydration as well as improved hygiene.

61
7.5.2 Design of Water Fountains
Drinking fountains should be designed on a scale appropriate to their setting. These fountainsshould be accessible to children and people in wheelchairs, as well as standing adults, includingthose on crutches or using walkers, and the water control should be simple, with little strengthrequired. A well-designed fountain may have a water tap on the side for filling containers, orwashing hands.
Some design considerations include:
1) Suitable materials should be used such as stone, concrete, brick and metals such ascopper, bronze, cast iron and steel.
2) Easy access for Persons Living with Disabilities. A height of 85 - 95cm allows sufficientspace for them to be approached by users of wheelchairs, which are usually 85cm inheight;
3) The approach should be on a hard surface;4) The basin should be cantilevered 20 - 30cm outwards from the wall or support stand,
with the drinking spigot or bubbler mounted on the outer edge of the basin.5) Operation of the fountain should be by a lever-type handle located on the side or rim of
the basin, with foot pedals considered as an additional option.
7.6 Provisions for Trees on NMT Paths
Trees enhance city streets both functionally and aesthetically, provide shade and also have thepotential to slow traffic speeds by influencing driver perception.
Requirements for tree spacing depend upon a number of key factors and should be tailored to:
1) The chosen species – local varieties suitably adapted to the tropical climate;2) The standard (or desired) tree dimensions – large enough to provide shade but not
obstruct movement; Height to lowest branches should be more than 2 m. Tree trunk width of approximately 30 cm The crown (branches and leaves) should not extend into the roadway at height
below 3 m.3) Fixed property lines and setback from kerbs – in the case of a street with a limited road
corridor; and,4) Integration with street lights and other road furniture – they should not impede the
function of any other features.

62
7.7 Safety Fences
Fencingis usedto contributetosafetrafficmovement,controlentrytoroadreservationsorcrossingof roadwaysbyvehicles,pedestriansoranimals.Theyarealsousedto restrictaccesstospecificareasin ordertoprotect peoplefromhazardswithinthearea,ortosecureinfrastructureorplantwithinanarea.
Standarddrawingsof varioustypesof fences are availablethataresuitedtoparticularpurposesanddesignersshouldreferto them inpreparingaroaddesign. Theyshouldbedesignedsothattheydo notconstituteahazardfor both motor vehicles and NMTtraffic.
7.7.1 Pedestrian FencesPedestrianbarriersandfencesareusedalongroadsoratpedestrianfacilitieswherethereis a serioushazardadjacenttotheroadorfacility.Typicalhazardsmayincludeahigh-speedroadorrailway,a steepdrop-offorexcavation,largeopendrainsordeepwater.Hazardousareasalsoincludelocationswherethere isan unacceptablenumber(orrisk) of crashesinvolvingpedestrianscrossingtheroadandtheapproaches tosignalizedintersectionsandpedestriancrossings.Wherethe use of fencesorsimilarstructures are proposed inassociationwithapathprovidedforpedestrians and/orcycliststheyshould:
1. be high enough to discourage pedestrians from climbing over the top;2. be located and of a height and construction that will not obstruct sight lines between
motor vehicle drivers and path users or between motor vehicle drivers;3. not have horizontal rails that could impale a vehicle, other road users or pedestrians, such
as post and rail fencing constructed of galvanised pipe or timber;4. not have protrusions that could snag cyclists or the pedals of cycles as they pass;5. not have horizontal fence rails that can act as a ladder for children;6. not have gaps wide enough (in a ‘full barrier’ fence) to enable children to climb through7. be finished with no sharp edges or protrusions which could be a danger to those who use
the railing for support or guidance;8. finish the fencing or barrier in a colour in contrast to its surroundings is appropriate to
assist its identification by people with impaired vision; and,9. not be constructed of material (particularly fence railings) likely to have (or develop) burrs,
splinters, sharp or rough edges or surfaces. In general, steel fences are preferred.
Thereareseveraltypesof pedestrianbarriers,including:1. numerous varieties of architectural metal railings;2. concrete, brick, timber or other fabricated (low) walls as used in many off-road situations;3. chain-link, weld mesh or other commercially available fencing; and,4. bollards and other forms of posts supporting a chain separator.
7.7.2 Bollard and ChainThebollardandchainissometimesusedtoprovideadelineationbetweentheroadtrafficandpedestrianactivity,particularlyaroundshoppingfacilities.Thechain(insteadof arail)treatmentaddressesthe

63
trafficsafetyconcernsof usinghorizontalrailsof timberandmetaland issometimespreferredforaestheticreasons.However,thebollardandchainbarrierhasdisadvantagesinthat:
1. It can result in multiple projectiles from a single hit:2. People with impaired vision and who use a cane and/or a sound reflection device for
guidance can be confused by the post and chain arrangement; and,3. It is not particularly effective in providing a barrier to restrict pedestrian movement.
7.7.3 Fences for cyclistsTheinstallationof afenceatthesideof apathusedbycyclistsisdesirablewhere:
1. There is a steep slope or large drop located in close proximity to the path:2. The path is adjacent to an arterial road and it is necessary to separate cyclists from motor
vehicles:3. A bridge or culvert exists along a path:4. A hazard exists adjacent to a particular cyclist facility: and,5. Cyclists’ desire lines of travel may mean that they choose a different path at an
intersection, between paths or around a path terminal.
Thewidthof pathsand lanesshouldalsoaccountforthepresenceof fences and therequiredclearances should be detailed.Thefollowingtypesof fenceshouldnotbe usedincloseproximitytobicyclelanesorpaths.Theyshouldbe locatedatleast1m from theedgeof bicyclefacilitiesandpreferablyshouldbemuchfurtheraway:It is alsoveryimportanttoprovidefencesthatcaterforpeoplewhohaveimpairedmobility,particularlyonrampsandbridges.An example could beapedestrian/cyclistbridgewithadditionalrailsforpeople whousewheelchairs.
7.8 NMT Traffic Signage and Road Marking
7.8.1 SignageThese systems play a number of important roles: they provide information and directions forusers to find their way around along a route or within a site, help maintain the areas image andcoherence, and encourage safe and convenient movement.
Usually, signage should include advance warning signs for major and minor rest areas 2 to 5 kmprior to the rest opportunity. These signs generally contain the name of the rest area, list thefacilities offered and should indicate the distance to the next (or similar) rest area.Signagepractices should also indicate the existence of facilities for disabled persons, and where suchfacilities are provided.
Within major and minor rest areas, signage should be used to inform users of available services,and the appropriateroutes to be used for pedestrian access to the various destinations. It is alsodesirable that clear signage be provided to direct motorists to the major roads as well as localroads that may serve the rest area.

64
7.8.1.1 Location
The location of signs significantly reinforces their message. Besides conventional signboards,maps, kiosks, and other elements may also function as signs; and placing signs at other siteamenities like benches, cafes, restrooms and intersections can help create mini-destinations inlarger open spaces.
Signage can be used for various purposes: for example, directional signs can help people keeptheir bearings and give them a sense of security; and in parks where there are large natural areasor no specific destinations, micro-spaces can be created with a sign, a picnic table, a guide board,or other amenities, facilitating social encounters and enabling communication in the event of anemergency. If the areas where signage is used incorporate other activities, these areas can enablevisitors to fulfil various needs in one place, and also create a tranquil environment.
7.8.1.2 Design
When users know where they are in a space and know how to get to where they want to go, theyfeel safer. Instead of using restrictive signs warning that something “is prohibited,” a moreconstructive approach should be used. Signage should be positive and informative, and givepeople the confidence to act on their own. Signage can also be used to educate people on safetyissues and to encourage them to report on any dubious activities they may see.
Poor signage can be confusing rather than illuminating, therefore signs should be posted atcritical points and at intersections, grouped on one support for clarity and ease of maintenanceand should include on-route directional and cautionary signs for cyclists, pedestrians and otherNMT users.
The design and placement of signs for pedestrian use must take into account such matters astheir visibility, the size and proportions of the writing, and the relation between the writing andits background. Directional signs should be visible from a distance of at least 20m. For clearvisibility, the sign should not be further away than 45m or closer than 5m. The writing on signsshould be complemented by standard graphic symbols to help users easily identify the intendedmessage. International symbols should particularly be utilized in outdoor areas used by foreignvisitors.
Different materials can be used for signage. Signs with wooden elements are cost effective andsustainable, but they are not resistant to theft and damage. Metals can become bent and rustedwithout proper maintenance, and plastics can be broken or cut. The most damage-resistantmaterials for support elements are concrete and stone.
All signage should be accessible, and durable in the long term (at least 7-10 years). In areas wherethere is a risk of vandalism, signs on two supports should be used rather than on single supports.Signs should be easily replaceable in case of damage and the care of signage should not beneglected.
The octagon is used only for stop signs, information signs should be rectangular, warning signstriangular, and prohibitive or warning signs circular.
There should be a strong colour contrast between the text and its background, and between thesign and the surface or background against which it is seen. Black text on a white background,for example, provides a good colour contrast. Clashing colours, such as green text on a red

65
background, should be avoided. The surface behind the sign should contrast with the sign tomake it stand out. If this is not feasible, the background within the sign should be increased insize.
There are four basic kinds of signs:Regulatory;Warning;Informational; and,Educational.
Regulatory signs
These are used for traffic control, and include stop and yield, right-of-way, speed limit andexclusion signs. Directional signs, occasionally posted in natural areas in particular, help peoplekeep their bearings and feel located and secure. They make use of landmarks and other places ofinterest and are required to indicate changes in direction.
Warning signs
These signs indicate existing or potentially dangerous conditions. They are usually found nearintersections, bridges and crossings, and can also indicate changes in the gradient or surfaceconditions. Warning signs should make use of all the languages in areas where more than onelanguage is commonly spoken, and should be posted at all entrances to limited, controlled, andexclusion areas. The wording should clearly indicate restricted areas, and the signs should beposted at intervals of less than 30m.
Informational signs
They inform visitors about a route or path, thus in this way they serve as outreach tools. Maps atpoints along pathways can help increase users’ knowledge, curiosity and interest about the area.They help visitors guide themselves, and also highlight places of interest. Maps should not becluttered with too much or unnecessary information and they should clearly define importantpoints.
Educational signs
These signs are a pleasurable way to get people interested in unique features of a route.Educational signage should be created with the types of audiences, their interests, and theirreasons for visiting the route in mind.
7.8.1.3 Lettering
The size of the letters used on signs should be proportional to the reading distance:
1) The character width-to-height ratio should be between 3:5 and 1:1;2) The character stroke width-to-height ratio should be between 1:5 and 1:10;3) The letters and graphic symbols should be raised at least 1mm from the background, so
the visually impaired can read them by touching them; and,4) The smallest letter type should at least 15 mm, and there should be normal spacing
between words and letters.

66
7.8.1.4 Disabilities
The symbol for amenities for the disabled is composed of a wheelchair figure with a squarebackground or border. The figure is distinguished from the background by contrasting colours,most commonly white for the figure and blue for the background, and the wheelchair figureshould always be seen as facing right.
Signs should be accessible to wheelchair users.Permanently fixed street furniture will also clearlyprovide more wayfinding cues for the visually impaired than landmarks. Signs should not beplaced behind glass because reflection may hinder visibility. Signs placed on the pedestrian pathof travel are obstructive so they should be detectable.There is no need for large numbers ofdirectional signs; these should be placed at main intersections and points and where there arechanges in direction or level.
Some considerations for persons living with disabilities include:
1) Signals at crossings may be supplemented with audible or tactile messages to facilitatecrossing for all users, including the visually impaired.However, audible pedestrian signalsshould be used cautiously, because they can create a noise problem;
2) Fixed signs indicating street names should be placed at a maximum height of 2.50m;3) Maps and information panels at entrances, along roads, and on public structures should
be set at a height of 0.9-1.8m;4) Wall-mounted signs should be installed with the centre line 1.4-1.60m from the finished
floor level;5) Overhanging signs should allow a minimum clearance of 2m; and,6) Orientation signs and push buttons in lifts should have a text in Braille or in relief for the
visually impaired.
7.9 Street Lighting
7.9.1 IntroductionRoadlightingofpedestrian and cyclist paths should be designed to achieve sufficientillumination that enables safe movement by NMT users.Goodroadlightingsimilarlyprovidesbenefitstomotoristsarisingfromreducedcrashrisk andimprovedtrafficoperation.Secondarybenefitstothe NMTusersaccruethroughimprovedsecurityof property,lowercrimeratesandenhancementofcommercial, businessandsocial/recreationenvironmentsaswellasminimizingphysicalhazardsforpedestrians.
7.9.2 Design Objectives of NMT Street LightingWhile designing for street lighting it is important to:
1. Developdesignis consistentwiththeoperatingcharacteristicsandthesurroundsof theroad;2. Achieve ahighdegreeof safetybothintermsof thelightingprovidedandtheplacementof
polesand masts(i.e.clearancestotrafficlanes);3. Ensure easeof installationandaccessibility;

67
4. Provideforeaseof maintenanceandbothasafeworkplaceandconditionsformaintenanceworkers; and,
5. Minimizecapital,operationalandmaintenancecosts,withoutcompromisingroadsafetyrequirements.
7.9.3 Factors influencing lighting layout and design of a lighting installation.
Table 7-1: FactorsinfluencingthelightinglayoutFactor CommentNature ofabuttingdevelopment
Affectsthe lightinglayoutintermsofluminairearrangementandmountingheightsandaspects,suchasglarecontrolandspillage oflightintosensitive areas.
Safety Lightingpolesmust notbeplacedsotheybecomeroadsidehazards.Polelocationneedstoconsidervehiclemovementsandlikelihoodoferrantvehicledepartures(e.g. the outsideofcurves),proximityto intersection departuretravelpaths,roundaboutcentreislands.Frangiblepolesshouldalwaysbeconsidered,andif notpossible, poles shouldbeshieldedwith appropriatebarrier systems.Road cross-section Influencesthelightingarrangements(singlesided,opposite route,centralorstaggeredetc.).
Widthandrelative levelsofthecarriageways
Influencesthe arrangement ofluminairesandmountingheight.
Nature ofthehorizontalandverticalalignment
The spacingofluminairesmayneedtobevaried oncurvesandcrestsforoptimum performanceoftheinstallation.
Formandlocation ofintersections
Intersectionsare criticallocationsthatmayrequirespecialtreatments, poles,luminaires andmountingheighttoachievetheobjectivesandthestandards.
Locationofbus/tramstops andotherpointsof concentrationofpedestrian movementacrosstheroad
The positioningofluminairesrelativetothesepointswillbeimportantinachievingthedesiredstandardsoftrafficsafetyandpedestriansecurity.
Locationofaccessesandundergroundservices
Driveways/entrances,medianandseparatoropenings(inmulti-carriagewayroads)and undergroundserviceslimitthepositionoflightingpolesandthechoiceof poletypes.
Operatingspeedofroad Thiswill influencethelocationofthesetbackofthepole.Consultthelocalroadagency forrequirements.
Locationoftreesand impactofnewgrowth, both existing orproposednew planting
There must beacoordinateddesign betweenthelandscapingandthelighting. Considerationmustbe givento matureheightoftrees,mature canopy size andheight, effectofpruning,needforpruning,nature offoliage,choiceofdeciduousorevergreen andthe effectofintermediatestagesofgrowth,andaccessfor maintenancepersonnel.
Widthofnaturestripandfootpath,andmedians,separatorsandtrafficislandsinwhich,polesmay be located
Thesewill influencethechoiceof poletypeandoutreach.

68
Factor CommentLocationandnatureofoverheadpower distribution
Thismayinfluencethechoiceof lighting arrangements,e.g.useof existingpower poles to supportluminaires.Thenatureofthepowerlinesmaylimitthemountingheightand positionoflightingpoles, particularlyfrangibletypepoles.Refertolocalelectricalregulationsforminimumdistancetopower lines.
Locationandformofany localareatraffic managementdevices
Wheretrafficmanagementdevicessuchasspeedhumpsandslowpointsareinstalled on localroads(e.g.whereCategoryPlightingisappropriate),thesewillrequire specialattentiontoensuresatisfactoryvisibility.
Landscaping Wherelandscapingisto beprovided,adequateclearancemustbemaintained aroundpolestoallowaccessbymaintenancepersonnel and equipment.Landscapingaroundroadlightinginstalledinroundaboutsmustconsideraccessbythetype ofmaintenancevehiclesthatwillberequiredtoservicethefacility(e.g.extendable platformvehicles)to avoiddestructionof landscapingandpromote healthandsafety requirements.The locationandheightofplantsmustnotinterferewiththeoverheadlighting oraerial power supply,castundesirable shadowsontheroador causenon-uniformilluminationoftheroadwayduringthe dayor night.
Structures/specialfeatures These includevariablemessagesignstructures,breakdownbays,tunnel portalsignage,truckstops,contraflow,rest areas,and telephones.
Roundabouts Largeroundaboutswithdrainage andlandscapinghinderplatformmaintenancevehiclesfromsafelyaccessingislandstoreachluminairesonhighmast arms.
7.9.4 Location of lighting poles on NMT PathsLightingpolesshould be locatedwithintheclear zone of a road considering the following:
1. Forthestraightandcurvedkerbedroads,at least1.5m from theverticalfaceofthekerboredgeof carriageway(includingshoulderswhetherornottheyaresealed);
2. Wheretherearenokerbs,notlessthan3.0m from theedgeof theNMT paths. Inurbanareas,thespaceallocationsforpublicutilityserviceswillaffectthesedimensionsandpolesshouldbelocatedin accordancewithroadagencyrequirements;
3. Wherethereisabarrier(includingawireropebarrier),adistanceatleastequaltothedynamicdeflection ofthebarrier,butnolessthan1.0mfrom therearof thebarrier(i.e.directionawayfromtheroad);
4. The working width for high vehicles that might impact the barrier must also beconsidered; and,
5. Lighting poles should never be located in a road shoulder (whether sealed orunsealed), which is that designated portion of the at-grade surface contiguous with theedge of the traffic lane.

69

70
8 ECONOMIC JUSTIFICATION OF AN NMT FACILITIES
8.1 Evaluating the Impacts of NMT
The objective of NMT Facilities economic evaluation is to assess the viability of the proposedproject in terms of the costs and benefits likely to accrue to the users. The predominant cost isthe cost of construction, together with maintenance and operation costs. All costs and benefitsare valued in monetary terms. The costs are expressed in economic prices to reflect the trueresource cost to the economy. The economic feasibility of a project is established when thebenefits are more than the costs.
Benefits to NMT users accrue when dedicated infrastructure is created for NMT. The mostsignificant benefits in the short term are the reduction in fatal/serious injury accidents andtimesaving to pedestrians, cyclists, and handcarts due to improvement in walking and cyclespeeds. The long-term benefits are more complex and related to behavioral changes. Theseinclude an increase in the use of NMT, with persons shifting from motorized to non-motorizedmodes of transport, fuel savings, and reduced emissions.
Net user impacts can be monetized using the Rule-of-Half, which is an economic theory thatsuggests that the net change in consumer surplus from a price change that reduces vehicle travelequals half the monetary change. This takes into account the tradeoffs consumers make betweenfactors such as money, time, convenience and mobility.
The subsequent sections describe the various impacts to consider when evaluating NMTfacilities and elaborate on how they can be quantified and monetized (measured in monetaryunits). It includes generic estimates values while considering that the actual benefits will varydepending on specific conditions and adjusting them where appropriate to reflect a particularsituation and planning perspective.
8.2 Costs Savings
8.2.1 Roadway Cost SavingsRoadway construction and maintenance costs are a function of vehicle size, weight, speed, and,studded tire use. These costs average about 4$ per mile for automobiles, with higher costs forheavier vehicles. Motorized transportation also requires various traffic services, such as policing,signals and emergency response.
NMT users impose minimal roadway wear, and their traffic service costs tend to be lower thanfor motor vehicle traffic since they travel slower (reducing potential conflicts) and impose lessrisk on others. Sidewalks and paths are relatively inexpensive to build and maintain.
Estimated Benefits: Shifts from driving to walking or cycling are estimated to provide roadwayfacility and traffic service cost savings of 5$ per mile for urban driving and 3$ per mile for ruraldriving.(FHWA 1997)

71
8.2.2 Vehicle Cost SavingsDirect automobile operating costs (fuel and tire wear, tolls and parking fees) average about10$per mile, plus another 10$ per mile in mileage-based repair, depreciation, incrementalinsurance costs. Vehicle operating costs tend to be about 50% higher for short urban trips, dueto cold starts (before the vehicle engine has warmed up), and congestion. Fixed vehicle costs(costs that vehicle owners pay regardless of how much a vehicle is driven) average about $5 perday.
A $50 pair of shoes typically last 1,000 miles of walking (about one year of normal use), or 5$ permile walked. A $750 bicycle ridden 3,500 annually requires about $100 annual maintenance andlasts 10 years, an average cost of 5¢ per mile cycled. These costs are subtracted from the vehiclecosts to determine net vehicle savings. NMT user use food for fuel, (a 150-pound personwalking a mile burns an additional 80 calories, the energy in about one slice of bread, and cyclinga mile burns half that), and most people enjoy eating and consume too many calories, and so thisenergy consumption is generally a benefit rather than a cost.
Estimated Benefits: Shifts from driving to non-motorized travel provide savings that areestimated to average 25$ per mile under urban-peak conditions, 20$ per mile under urban off-peak conditions, and 15$ per mile under rural conditions. Greater savings are possible whennon-motorized travel improvements allow a household to own fewer cars.(Litman, 2009).
8.2.3 Parking Cost SavingsTypical urban parking facility cost estimates range from $50 to $100 per month. Bicycle parkingcosts are much less or not charged at all. Up to 20 bicycles can be stored in the space requiredfor one automobile, and bicycles are often stored in otherwise unused areas. Pedestrians requireno parking facilities (except umbrella stands).
In the short run, reduced automobile trips may simply result in unoccupied parking spaces, butover the long run, most parking facilities have significant opportunity costs: reduced parkingdemand allows property owners to avoid expanding parking capacity or they can be rent, sell orconvert parking facilities to other users.
Estimated Benefits: Parking costs are not generally affected by trip length, so this cost ismeasured per trip rather than per mile. Shifting from automobile to non-motorized travel isestimated to provide parking savings of $2.00 per urban-peak trip (a typical commute with $4.00per day parking costs), $1.00 per urban off-peak trip, and $0.50 per rural trip.(Litman, 2009).
8.2.4 Travel Time CostsAlthough NMT competes favourably in door-to-door travel times with automobiles for sometrips, it is generally slower. This implies increased time costs. However, actual costs varysignificantly depending on conditions and individual preferences. Time costs are two to threetimes higher under undesirable conditions but can be much lower, (time spent walking or cyclingcan be considered a benefit rather than a cost) under favourable conditions. If somebody whoprefers to drive is forced to walk, their time costs may increase significantly, particularly ifwalking conditions are poor. On the other hand, additional travel time for NMT results frompositive incentives such as improved travel conditions or positive incentives is a user benefitrather than a cost since people only shift if they consider themselves better off overall.

72
Estimated Impacts: Various methods can be used to measure the value of changes in traveltime, including consumer surplus analysis. Travel time has generally valued a one-third to one-half of prevailing wages, with higher rates for walking in undesirable conditions and lower orzero cost value under favourable conditions. When shifts from motorized to non-motorizedtravel result from positive incentives, additional travel time can be considered to have no cost ormay be considered a benefit by users. (Litman, 2009).
8.3 NMT User Benefits
8.3.1 Congestion ReductionTraffic congestion external costs consist of the incremental travel time, vehicle operating costs,stress and pollution emissions that each vehicle imposes on other road users. To analyse NMTcongestion impacts, road conditions are divided into four classes:
1. Uncongested roads and separated NMT paths. NMT users on uncongested roads causeno traffic congestion.
2. Congested roads with space for NMT. NMT users on a road shoulder with a wide curblane or a bike lane contributes little traffic congestion except at intersections where turningmanoeuvres may be delayed.
3. Narrow, congested roads with low-speed traffic. NMT users on a narrow, congestedroad when the rider can safely keep up with traffic contribute slightly less to congestion thanan average car, due to a bicycle’s smaller size.
4. Narrow, congested roads with moderate to high-speed traffic. NMT users on a narrow,congested road can contribute to traffic congestion; depending on how easily fasterMotorized traffic can pass.
Congestion is reduced when motorists shift to NMT under the first three conditions. Only undercondition 4 does a shift fail to reduce congestion.
NMT users generally impose minimal congestion except at intersections or if roads lacksidewalks and traffic lanes are narrow does increase walking cause vehicle traffic delay, and theseimpacts are generally minimal.
Estimated Benefits: Congestion reduction benefits per reduced automobile-mile are estimatedto be worth an average of 25$ per mile under urban peak conditions and 2$ per mile under urbanoff-peak conditions. No congestion benefit is assumed for rural travel.(Litman 2009; TTI 2007).
8.3.2 Barrier EffectThe barrier effect (also called severance) refers to delays, discomfort and lack of access thatvehicle traffic imposes on non-motorized modes. The barrier effect is equivalent to trafficcongestion costs and reflects the degradation of the non-motorized travel environment. Inaddition to travel delays, vehicle traffic imposes crash risk and pollution on non-motorizedtravellers. This imposes indirect costs by reducing non-drivers’ accessibility, which tends to beinequitable, and forces people to shift from non-motorized to motorized travel, which increasesvarious external costs. The barrier factor is calculated in two ways;
1. Based on traffic volumes, average speed, the share of trucks, the number of pedestriancrossings, and the length of the roadway under study.

73
2. Based on demand for crossing is calculated (assuming no barrier existed) based onresidential, commercial, recreation, and municipal destinations within walking and bicyclingdistance.
Estimated Benefits: Estimations indicate that the barrier effect averages 0.5$ to 1.5$ pervehicle mile under urban conditions. (Litman 2009).
8.3.3 Accident CostsNMT users have higher per-mile accident casualty rates than automobile travel. The incrementalrisk of a shift from driving to non-motorized modes is much lower due to the following factors;
1. Non-motorized travel imposes minimal risk to other road users.2. High NMT users’ crash and casualty rates result because people with particular risk factors
tend to use these modes, including children and people with disabilities. A responsible adultwho shifts from driving to non-motorized travel and takes basic precautions such asobserving traffic rules and wearing a helmet tends to experience less than average risk.
3. MT users tend to be more cautious where they expect to encounter NMT users.4. Increased NMT use may spur communities to invest more resources in non-motorized
safety.5. Non-motorized trips tend to be shorter than motorized trips, so total per capita mileage
declines. A local walking trip often substitutes a long automobile trip, and people who relyprimarily on non-motorized modes tend to travel significantly less than people who rely onautomobile transportation, due to differences in their travel and location decisions.
Estimated Benefits: Net benefits of a shift from MT to NMT are estimated to average 5$ perurban peak mile, 4$ per urban off-peak mile, and 3$ per rural mile. Although people who shiftfrom motorized to non-motorized modes may experience some increased accident risk, this canbe minimized if mobility management programs include appropriate safety education and facilityimprovements, and can be offset overall by reductions in risk to others, and increased caution bydrivers. (WHO 2008):
8.3.4 Energy ConservationConsumption of natural resources, such as petroleum, can impose various external costs; includemacroeconomic impacts and national security risks from dependence on imported petroleum,environmental damages, climate change impacts, and the loss of resources available for futuregenerations. The external costs of petroleum consumption are estimated to be 1-4$ per vehicle-mile for an average automobile. These impacts tend to be higher for short trips, due to coldstarts, and under congested, urban travel conditions.
Estimated Benefits: Energy conservation benefits of a shift from driving to walking or cyclingare estimated to average 5$ per urban peak mile, 4$ per urban off-peak mile, and 3$ per ruralmile.(NRC, 2001).
8.3.5 Pollution ReductionWalking and cycling produce no air pollution. Per mile emission, reductions are large becausethey usually replace short, cold-start trips for which internal combustion engines have highemission rates, so each 1% of automobile travel replaced by walking or cycling decreases motorvehicle emissions by 2% to 4% (Komanoff and Roelofs, 1993).

74
Estimated Benefits: Automobile air pollution costs are estimated to average 1$ to 12$ perautomobile mile, with relatively high values under congested urban conditions (Small and Kazimi,1995; McCubbin and Delucchi, 1996). Many monetized estimates include only a limited portion oftotal air pollution costs (for example, many ignore particulate pollution and air toxics), so arelatively high value is appropriate. A conservative estimate is 10$ per mile for urban-peakdriving, 5¢ for urban off-peak and 1¢ for rural driving.
8.3.6 NoiseVehicle noise imposes disturbance and discomfort. Estimates of noise costs range from 0.2$ to5$per vehicle mile, depending on location and type of vehicle (Litman, 2009).
Noise costs are greatest in dense urban areas where exposure is greatest (i.e. people are locatedclose to roads).
Estimated Benefits: Noise reduction benefits from automobile travel shifted to non-motorized modes are estimated to average 3$ per mile for urban-peak driving, 2$ for urban off-peak and 1$ for rural driving. (Litman, 2009).
8.3.7 Health and Fitness BenefitsNon-motorized travel involves physical exercise, which can provide substantial health benefits.Inadequate physical exercise and excessive body weight are increasing problems that results in avariety of medical problems, including cardiovascular diseases, bone and joint injuries, anddiabetes. About ten times as many people die from these medical problems than from trafficaccidents.
Estimated Benefits: Walking and cycling can provide large health benefits, probably exceedingexternal accident reduction benefits. In other words, these benefits probably exceed 5$ per mileof MT and are shifted to NMT modes.(AJHP 2004; “Health and Fitness,” VTPI 2004).
8.3.8 Improved Mobility for Non-DriversWalking and cycling help provide basic mobility, that is, they provide access to activities thatsociety considers essential or important, such as medical services, education, employment, basiccommercial and social activities. This provides benefits both to users and to society overall, byimproving people’s opportunities to participate in economic and social activities.
Estimated Benefits: Although these benefits are large, they are difficult to quantify. Oneapproach is to use transit subsidies as an indicator. Transit subsidies average about 60$ transitpassenger-mile, about half of which is justified to provide basic mobility for non-drivers (theother half are intended to attract motorists to transit in order to reduce traffic congestion,parking and pollution problems).
This indicates that basic mobility is worth more than 30$ per passenger-mile to society. To thedegree that walking and cycling provide basic mobility, their benefits should becomparable.(“Transportation Diversity,” Litman, 2004).

75
8.3.9 Strategic Land Use Development ObjectivesNon-motorized transportation can help achieve various strategic land use planning objectives byreducing the amount of land that must be paved for roads and parking facilities and encouragingmore compact development patterns.
Estimated Benefits: Shifting from sprawl to smart growth land-use patterns can providethousands of dollars in total annual per capita net benefits from public and consumer costsavings, increased economic productivity and improved environmental quality. (Litman, 1995;“Land Use Evaluation,” VTPI, 2004).
8.3.10 Economic DevelopmentImproved NMT conditions and shifts from motorized to non-motorized modes can increaseeconomic productivity and increase nearby property values and help attract residents andindustries that value environmental quality, physical fitness, and outdoor recreation by increasingshopping opportunities.
Estimated Benefits: Improved non-motorized facilities can increase nearby property values.Because reduced automobile travel saves about 20$ per mile in vehicle costs, every million milesreduced adds about two regional jobs and increases regional income by about $45,000. (Litmanand Laube, 1998; “TDM and Economic Development,” VTPI, 2004).

76
9 TENDERDOCUMENTATION FOR NMT
9.1 Introduction
An effective bid management and tender process for NMT facilities provides a positive evaluationapproach that leads to the appointment of appropriate suppliers and ensures a mutually beneficialrelationship between the employer and the supplier.Generally, a balanced and highly efficient bid andtender management process improves the quality of the supply chain while reducing costs and managingrisks.
A tender document is a submission made by a prospective supplier in response to an invitation to tender.It makes an offer for the supply of goods or services. The general format of tender documentation is asspecified in the Kenya Road Design Manuals. The various guidelines give details on how to compile thedocuments to ensure uniformity in the documentation, and certainty and fairness in the procurementprocess. However, in many cases, the client bodies also develop their own pro-forma tender documentsand related guidelines and include details of their own special conditions of a contract, administration andrelated requirements.
It is important to updatethe documents regularly to accommodate possible issues that occur over time andto provide as much information to allow the contractor to price the works fairly and to understand the siteconditions and related risks in the price. NMT tender documents usually have the following contents:
1. Tender requirements, conditions, rules and adjudication process2. Conditions of contract3. Specifications4. Schedule of quantities5. Forms showing compliance with tender requirements.6. Forms of offer and acceptance
9.2 Basic Layout of Tender Documentation
9.2.1 Tender Advertisement Details1. Tender Notice and Invitation to Tender: Alerts tenderers to the nature of the supplies,
services,engineering and construction works required by the client. Should contain sufficientinformation to enable tenderers to respond appropriately.
2. Tender Data:States what the applicable conditions of tender are, and provides the variables forstandardised conditions of tender, such as the required insurances and tender validity periods.
9.2.2 Returnable Documents1. List of Returnable Documents:Ensures that everything the client requires a tenderer to submit
with thetender is included in, or returned with, the tender submission.2. Returnable Schedules: Contains documents that the tenderer is required to complete
forevaluating tenders and other schedules, which upon acceptance become part of thesubsequent contract.
9.2.3 Agreements and Contract Data1. Form of Offer and Acceptance:Formalises the legal process of offer and acceptance.
77
2. Contract Data:States the applicable conditions of contract and associated contract specific datathat collectively describe the risks, liabilities and obligations of the contracting parties and theprocedures for the administration of the contract.
9.2.4 Pricing Data3. Pricing Instructions:Provides the criteria and assumptions, which are assumed for the contract
that thetenderer has to take into account when developing the prices.4. Pricing Schedule:Records the contractor's prices for providing supplies, services, engineering and
construction works, which are described elsewhere in a specification within the Scope of Worksection of the contract.
9.2.5 Scope of WorkSpecifies and describes the supplies, services, engineering and construction works to be provided. Anyother requirements and constraints, relating to the manner in which the contractual work is to beperformed, must also be described in this section.
1. Standard Amendments to the Standard Specifications contains amendments to thespecifications aspublished the Specification Authorities
2. Project Specification includes amendments to the Standard Specifications, and additionalspecificationsspecifically applicable to the contract.
3. Other Project Requirements, such as:Environmental Management Plan,Broad Based BlackEconomic Empowerment and Occupation, Health and Safety.
9.2.6 Site Information (Engineering andConstruction Works Contracts Only)This part includes a description of the site as at the time of tender with a view to assist the tenderer to planand price the Works.

78
10 REFERENCES
1. Dutch Manual Approach Segregation and Integration. (Tom Godefrooij, Fietsersbond, 2000).2. Nairobi NMT Streets for walking & cycling manual. (ITDP, 2018)3. Nairobi Non-motorized transport policy. (NCCG, 2015)4. Pedestrian Level of Service - Ray A Moe, Kathleen Bracke5. Preliminary report: A Baseline Assessment of the NMT Facilities and Infrastructure in
Nairobi County. (KARA, 2019)6. Productive and Liveable Cities – Guideline for Pedestrian and Bicycle Traffic in African
Cities. (De Langen & Tembele R., 2001)7. Recommendations for traffic provisions in built-up areas. (ASVV CROW, 1998).8. Road Design Guidelines for Urban Roads (2nd Draft). (KUTIP, 2001).9. Sign up for the Bike: Design Manual for a cycle-friendly infrastructure. (CROW, 1993)10. Streets for walking & cycling: Designing for safety, accessibility, and comfort in African
cities. (UN-HABITAT/ITDP, 2018).
11. Institutional Support to the Kenyan Transport Sector: NMT Strategy and Plan for theCity of Nairobi. EU / MOTIHUD&PW, 2019.
12. Tefft (2011). Impact Speed and a Pedestrian’s Risk of Severe Injury or Death,Foundation forTraffic Safety, Washington DC. September 2011.
13. Wramborg (2005). A New Approach to a Safe and Sustainable Road Structure andStreetDesign for Urban Areas, Proc. Road Safety on four Continents, Warsaw Poland.July 2005
14. AASHTO (2001) A Policy on Geometric Design of Highways and Streets, 4th Edition,American Association of State Highway and Transportation Officials
15. Bonsall P.W and C.A. O’ Flaherty (1997) Observational traffic surveys: TransportationPlanning and Traffic Engineering, In: O’Flaherty, C.A. (ed.), Oxford: ElsevierButterworth-Heinemann
16. Falck-Jensen K, J. Kildebogaard and R. Robinson (2004) Traffic, Road Engineering forDevelopment, 2nd Edition, In: Robinson, R. and B. Thagesen (Eds), London and NewYork: Spon Press
17. Florida Department of Transportation (2000) Manual on Uniform Traffic Studies,Manual Number 750-020-007s, Traffic Engineering Office, Florida, USA
18. Fricker, Jon D. and R.K. Whitford (2004) Fundamentals of Transportation Engineering,NJ, USA: Pearson Education, Inc
19. Howe J D G F., (1972) Review of rural traffic-counting methods in developing countries.Laboratory Report LR427, Crowthorne: TRRL Limited.
20. Kadyali L.R. and N.B. Lal (2006) Principles and Practices of Highway Engineering,Including Expressways and Airport Engineering, Khanna Publishers, Delhi, India
21. Knud Rask Overgaard (2004) Planning methods, Road Engineering for Development,2nd Edition, In: Robinson, R. and B. Thagesen (Eds), London and New York: SponPress

79
22. Lebo, J and D Schelling (2001) Design and appraisal of rural transport infrastructure:Ensuring basic access for rural communities, World Bank, Washington, DC.
23. Ministry of Transport (2008) Legal Notice No 188 – traffic (Amendment) Rules, KenyaGazette Supplement No. 65, The Traffic Act.
24. Litman, T. (2009) Generated Traffic and Induced Travel, Implications for TransportPlanning, Victoria Transport Policy Institute, Victoria, Canada
25. Ministry of Roads (1987): Road Design Manual Part III, Materials and Pavement Designof New Roads, Ministry of Transport and Communication, Roads department, Nairobi,Kenya
26. Ministry of Roads (1979) Road Design Manual Part I, Geometric Design of Rural Roads,Ministry of Works, Roads department, Nairobi, Kenya
27. Ministry of Works, Transport and Communications, (2003) Guideline No.9: The TrafficData Collection and Analysis, Botswana
28. Ministry of Works, Transport and Communications, (2000) Guideline No.4: The AxleLoad Surveys, Botswana
29. Roger M. (2003) Highway Engineering, Department of Civil and Structural Engineering,Dublin Institute of Technology, Ireland: Blackwell Publishing
30. Rolt J (2004) Structural design of asphalt pavements, Road Engineering forDevelopment, 2nd Edition, In: Robinson, R. and B. Thagesen (Eds), London and NewYork: Spon Press
31. Rolt J (1981) Optimum axle loads of commercial vehicles in developing countries,Laboratory Report LR1002. Crowthorne: TRRL Limited
32. SATCC (2001) Draft Code of Practice for the Design of Road Pavements, Division ofRoads and Transport Technology, CSIR
33. Slinn, M, P. Guest and P. Matthews (2005) Traffic Engineering Design, Principles andPractice, Elsevier, Butterworth Heinemann
34. TRL (2005) Overseas Road Note 5: A guide to road project appraisal, TRL Ltd.,Crowthorne, UK
35. TRL (2004), Overseas Road Note 40: A guide to axle load surveys and traffic counts fordetermining traffic loading on pavements, TRL Ltd., Crowthorne, UK
36. TRL (1993), Overseas Road Note 31: A guide to the structural design of bitumen-surfaced roads in tropical and sub-tropical countries, TRL Ltd., Crowthorne, UK.
37. AASHTO (1990), Policy on Geometric Design for Streets and Highways, AmericanAssociation of State Highway and Transportation Officials (www.aashto.org).
38. AJHP (2003), “Special Issue: Health Promoting Community Design,” American Journalof
39. Health Promotion (www.healthpromotionjournal.com), Vol. 18, No. 1, Sept./Oct. 2003.
40. European Transport Pricing Initiatives (www.transport-pricing.net) includes variousefforts to develop more fair and efficient pricing, including ExternE (www.externe.info)TRACE (www.hcg.nl/projects/trace/trace1.htm) and UNITE(www.its.leeds.ac.uk/projects/unite).
41. Fietsberaad (2008), Cycling in the Netherlands, Ministry of Transport, Public Works andWater Management, The Netherland; at

80
www.fietsberaad.nl/library/repository/bestanden/Cycling%20in%20the%20Netherlands%20VenW.pdf.
42. John Forester (1983), Bicycle Transportation, MIT Press (www.mitpress.mit.edu
43. Larry Frank (2004), “Obesity Relationships with Community Design, Physical Activityand Time Spent in Cars,” American Journal of Preventive Medicine (www.ajpm-online.net), Vol. 27, No. 2, June, 2004, pp. 87-97.
44. Lawrence Frank, Sarah Kavage and Todd Litman (2006), Promoting Public HealthThrough Smart Growth: Building Healthier Communities Through Transportation AndLand Use Policies, Smart Growth BC(www.smartgrowth.bc.ca); atwww.vtpi.org/sgbc_health.pdf.
45. Thomas Gotschi and Kevin Mills (2008), Active Transportation for America: A Case forIncreased Federal Investment in Bicycling and Walking, Rail-To-Trails Conservancy(www.railstotrails.org); at www.railstotrails.org/ATFA.
46. Todd Litman (2009), Transportation Cost and Benefit Analysis Guidebook, VTPI(www.vtpi.org). Todd Litman and Steven Fitzroy (2006), Safe Travels: EvaluatingMobility Management Traffic
47. Safety Impacts, VTPI (www.vtpi.org).
48. Todd Litman, et al (2000), Pedestrian and Bicycle Planning: Guide to Best Practices,VTPI (www.vtpi.org).
49. William R. Loudon, Mandi Roberts and Sarah Kavage (2007), Testing the Effectivenessof Bicycle and Pedestrian Access Improvements in Reducing Commute Vehicle Trips,Transportation Research Board Annual Meeting (www.trb.org).
50. M. Shayler, et.al, Bikes Not Fumes: The Emission And Health Benefits Of A Modal ShiftFrom xxxx
51. SQW (2007), Valuing the Benefits of Cycling: A Report to Cycling England, CyclingEngland, UK Department for Transport (www.dft.gov.uk); atwww.dft.gov.uk/cyclingengland/site/wp- content/uploads/2008/08/valuing-the-benefits-of-cycling-full.pdf.
52. Pedestrian Space in SoHo, Transportation Alternatives (www.transalt.org); atwww.transalt.org/files/newsroom/reports/soho_curbing_cars.pdf.
53. TTI (2007),Urban Mobility Study and Mobility Measures, Texas Transportation Institute(http://mobility.tamu.edu/ums).
54. Richard Untermann and Anne Vernez Moudon, Street Design; Reassessing the Safety,
55. Sociability, and Economics of Streets, University of Washington, Urban Planning(Seattle), 1989. U.S. Census (2007), American Community Survey, US Census Bureau(www.census.gov).
56. VTPI (2004), Online TDM Encyclopedia, Victoria Transport Policy Institute(www.vtpi.org).
57. Malcolm Wardlaw, Stepping Stones to a Better Cycling Future. British CTC/CCNConference, Chesterfield, England, 13th October 2001;www.bicyclinglife.com/library/steppingstones.htm.
58. Meghan Winters and Adam Cooper (2008), What Makes a Neighbourhood Bikeable,Cycling In Cities, University of British Columbia (www.cher.ubc.ca/cyclingincities); atwww.cher.ubc.ca/cyclingincities/pdf/WhatMakesNeighbourhoodsBikeable.pdf.

81
APPENDICES

82
APPENDIX 1: CLASSIFIED TRAFFIC COUNT FORM
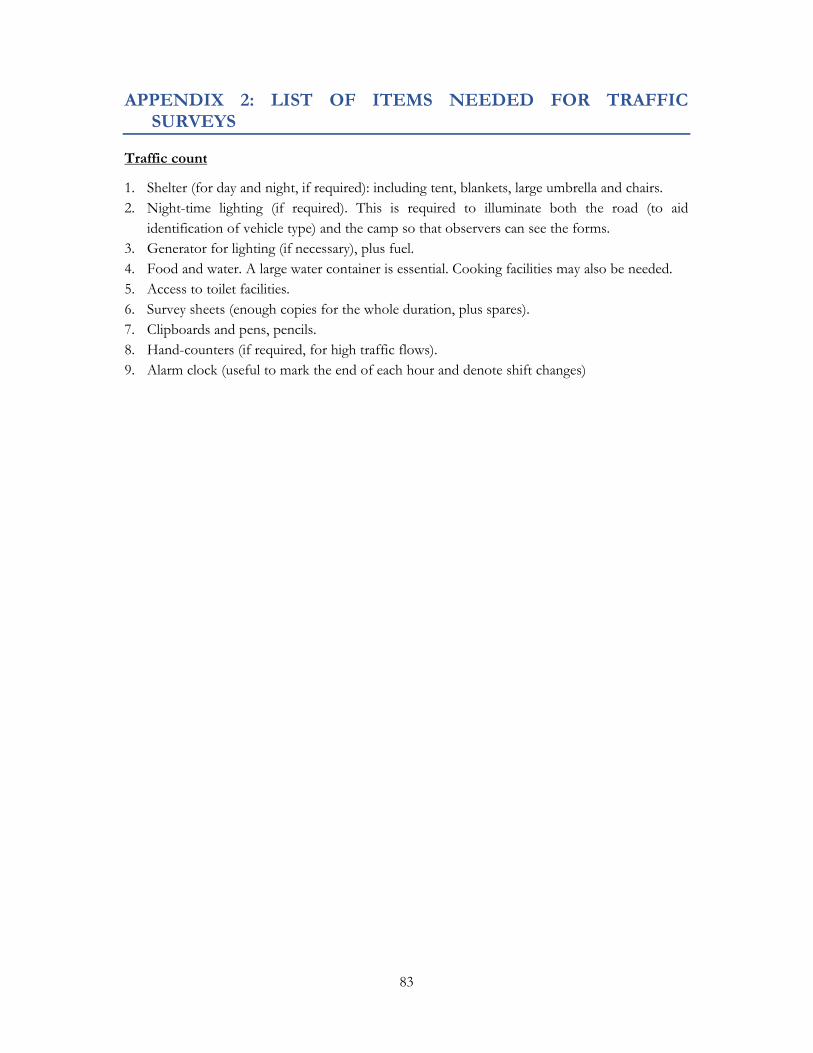
83
APPENDIX 2: LIST OF ITEMS NEEDED FOR TRAFFICSURVEYS
Traffic count
1. Shelter (for day and night, if required): including tent, blankets, large umbrella and chairs.2. Night-time lighting (if required). This is required to illuminate both the road (to aid
identification of vehicle type) and the camp so that observers can see the forms.3. Generator for lighting (if necessary), plus fuel.4. Food and water. A large water container is essential. Cooking facilities may also be needed.5. Access to toilet facilities.6. Survey sheets (enough copies for the whole duration, plus spares).7. Clipboards and pens, pencils.8. Hand-counters (if required, for high traffic flows).9. Alarm clock (useful to mark the end of each hour and denote shift changes)

84
APPENDIX 3: ROUTE CHOICE QUESTIONAIRE
Q1) Route from ………………………………… to………………………………….
Q2) How often do you make such trips?(1.) Once per week (2.) Once per month (3.) Once in a fortnight (4.) Quite often (
5.)Once in a while
Q3) Why do you prefer this route?(1.) It is much shorter (2.) The route condition is better (3.) It is secure (no bandits) (4.) Don’t
know
Q4) Which alternative routes are available to you?From…………………………………………..to………………………………………

85
APPENDIX 4: NON-MOTORIZED TRAFFIC COUNT VOLUME COUNTFORM

86
APPENDIX 5: COUNTER INSTRUCTIONS
INSTRUCTIONS FOR BICYCLE AND PEDESTRIAN COUNTERS
1) Day and Dates: These should be clear enough.
2) Time(s): Weekday: 6:00-9:00am or 4:00-6:00pm
Weekend: 12:00-2:00 pm
3) Count Supervisor: ____ (local contact/agency) Phone No.
4) Enclosures: You should have the following in this packet:1) a map showing your count location2) a count form
3) a business-reply envelop to return the completed forms
5) Other Items Needed: Please make sure to bring:1) a pen / pencil2) Something to write on (clipboard, portfolio, etc.)3) some sort of timekeeping device (cell phone, watch)4) weather-appropriate clothing, water
6) Introduction: This is a routine count taken throughout the Nairobi Metropolitan Region.Data collected from these counts will be used to monitor success in increasing bicycle andpedestrian travel as identified in the Nairobi Area Regional Bicycle and Pedestrian Plan.
7) Assignments: Each location will have at least one counter. Depending on the number ofcounters, some locations may have more than one counter. In these cases, please use only onecount form per location. Since the locations with multiple counters are expected to be busier, itwill work best if one person counts and the other person fill out the forms.
8) Conducting the Count: You have been provided with one copy of the count form. Please,make sure to coordinate the correct time period with the correct box, as we want to measurevariation in travel method over time. Also, please make sure to write your name and location oneach form.
9) The count itself is very simple: place a hatch mark on the form for each passing cyclist,pedestrian, or other non-motorized transit. People in wheelchairs are to be counted aspedestrians. Count the people walking their bicycles as bicyclists. People on rollerblades,skateboards, scooters, and other non-motorized transport devices are to be counted as “Other”.
10) Whom do you count? Only count those cyclists passing your post in the direction(s)indicated on your map! This includes anyone who is walking their bicycle past your post. Do notcount passersby on nearby streets unless specifically instructed to do so, as this could result indouble-counting.
11) Returning the Count Forms: Please submit to............................................................. .
ATTN: ................................................................................ .

87
12) Other Information: The accuracy of the count depends largely on the coverage of all pointsduring the entire morning and evening commute. Please make sure to get your location 15minutes or more ahead of count time!
If you have any problems or know that you won’t be able to make it, please call your countsupervisor ASAP (see top for phone numbers). They or one of their colleagues will be comingaround to check on you during the counts.

88
APPENDIX 6: PEDESTRIAN VOLUME COUNT FORM

89
APPENDIX 7: SUMMARY OF PEDESTRIAN MOVEMENTS

90
APPENDIX 8: PEDESTRIAN GROUP SIZE STUDY FORM

91
APPENDIX 9 - DETAILED DESIGN ASPECTS
Provision for PedestriansDetermining the Width Requirement for Pedestrian Walkways
Area of application Dimensioning On both sides of a street except possibly
where there is building on only one side,then not on the side without building (ifthere is little pedestrian traffic on that side,then a narrow walkway strip may suffice: thisstrip will be on the same level as the maincarriageway with no physical partition fromit)
b ≥2.0 m depending on: total available road width volume of pedestrian traffic desired quality (at 2.0 m wide pedestrians
walking two abreast easily leave enoughspace for passing on the footpath)
≥ 1.80 m, where narrowed for more than10 m
≥ 1.50 m, where narrowed for less than10 m
≥ 1.0 m, at narrowing for ‘hard’ points(lampposts, traffic signposts etc.)
Must have an obstruction free minimumclearance height of 2.20 m (including thingslike sun shades, advertising boards, lightingand traffic signs)
Construction With footpath running immediately adjacent to road, apply a difference in elevation of 0.08 to
0.10 m from the carriageway In principle, the kerb should be (nearly) vertical (to deter parking and driving on footpaths) If there is no difference in level, then a traffic sign may be necessaryPositive aspects Negative aspects Sufficient room for maneuver for disabled
people, or people carrying heavy bags orpushing prams etc.

92
Pedestrian Ramps
Area of application Dimensioning An intersection of an important pedestrian
route and a major road, where crossings atgrade would be inadequate.
A pedestrian route where the change ingradient is significant ≥ 1:20
Ramp- Clearance height of ≥ 2.00 m (4.50 m
above the road)- Gradient ≤ 1:20- Width ≥ 2.50 m
Construction Start and ends of gradient walkways should be positioned directly in the direction of the
slope Guard rails on both sides Alarm indications Non-slip surface Preference for combination with cycling routes.Combination options Should always be constructed where there is a stairway,

93
Positive aspects Negative aspects Conflict free intersection Feeling of social safety (in comparison to
deepened pedestrian underpasses)
Quite a large difference in height to benegotiated
Pedestrians are fully exposed (e.g. adverseweather, high winds etc.)
Provision for CyclistsRefuge Cycle Tracks
Area of application Dimensioning
conflict types , and
combined turning lane formotorized traffic
cycle tracks along intersecting road or alongroad sections on the opposite side of anintersection
[streets with an important or moderatetraffic function]
As crossing facility
b1 ≥ 1.75 (1.00) m b2 ≥ 2.50 (1.75) m b3 ≥ b2 c ≥ 1.00 (0.50) m; if used as a crossing
provision, then preferably ≥3.00 m l1 = 10 x c l2 ≥ 5.00 m l3 ≥ 5.00 m W ≥ 3.50 m R ≥ 4.00 m
Construction General:
- Road marking,- With advance signing,- Equal priority status for cycle tracks and main carriageway
At traffic control system:- Preference for conflict free control,
One-way on cycle track
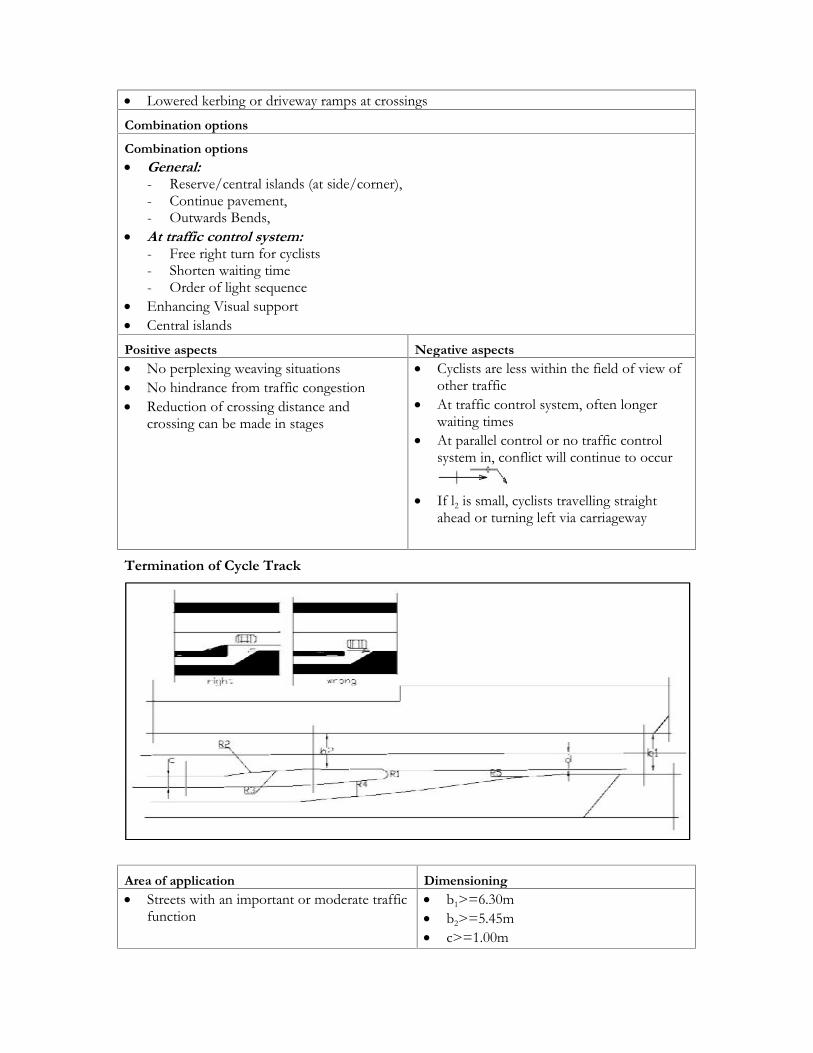
94
Lowered kerbing or driveway ramps at crossingsCombination optionsCombination options General:
- Reserve/central islands (at side/corner),- Continue pavement,- Outwards Bends,
At traffic control system:- Free right turn for cyclists- Shorten waiting time- Order of light sequence
Enhancing Visual support Central islandsPositive aspects Negative aspects No perplexing weaving situations No hindrance from traffic congestion Reduction of crossing distance and
crossing can be made in stages
Cyclists are less within the field of view ofother traffic
At traffic control system, often longerwaiting times
At parallel control or no traffic controlsystem in, conflict will continue to occur
If l2 is small, cyclists travelling straightahead or turning left via carriageway
Termination of Cycle Track
Area of application Dimensioning Streets with an important or moderate traffic
function b1>=6.30m b2>=5.45m c>=1.00m

95
d=1.00m R1>=0.50m R2>=200.00m R3=100.00m R4=200.00m R5=100.00m L>=15.00m
ConstructionGeneral: One-way traffic on cycle trackPositive aspects Negative aspects Physical protection at the backs of cyclists Cyclists are clearly positioned within the field
of view of other traffic
Heavy goods traffic travelling on thesame side as the cycle track may beforced out towards the middle of theroad due to the effect of the partitionshoulder narrowing the carriageway.
Slightly Outward Bending Cycle Track
Area of application Dimensioning
(1) conflict types ,
and
(2) conflict types ,
and c1 = 2.00 to 5.00m In streets with an important traffic function
b ≥ 2.50 (1.75) m, in (1) ≥ 3.50 (3.00) m, in (2) c1 see 11.4/1,2 c2 = 5.00 to 8.00 m l1 = 10x(c2-c1) l2 ≥ 5.00m R ≥ 4.00 m R1 ≥ 12.00 m
Construction
General: In (2) a traffic control system is preferable No high vegetation Equal priority status for cycle tracks and main carriageway Road marking, Advance signing,
At traffic control system: Preference for conflict free control,
Combination options

96
General: Reserves (transverse/ corner), Refuge cycle tracks, Continue pavementWith traffic control system: Free right turn, Shortened waiting time,
Positive aspects Negative aspects Stacking area for cyclists turning left where
there are cycle tracks on all sides Stacking area for vehicles in conflict
Large-scale intersection Long way round for (left turning) cyclists
in (1) With parallel traffic controllers or no
traffic control system in (1), cyclists will
be vulnerable to conflict If there is no conflict free control in (2),
conflicts will continue to occur withoncoming traffic
Bicycle parking facility without anti-theft provision I
Area of application Dimensioning On public roads and in bicycle parking
facilities, where the risk of theft isconsidered as being fairly small
Type 1: in areas which may need to becleared for other purposes
Type 2: where space is at a premium, e.g.integral parking facilities
Type 3: where parking facility has aminimum width
Type 1: paving stone format 0.15 x 0.60 mor 0.30 x 0.60 m
Type 2 and 4: centre to centre distance 0.40(0.35) m
Type 3: centre to centre distance 0.70(0.60) m
Far enough away from the edge of roadcarriageways ≥ (0.55 m) to reduce risk ofdamage from parking cars

97
Type 4: suitable for racing bicycles in e.g.recreation areas
Construction All types are available in various colours Type 1: concrete. The groove is tapered making the paving stone suitable for various widths
of tyre. Can be applied horizontally when built into masonry. Also comes in a model suitablefor application at an angle of less than 30º
Type 2: galvanized steel. Many different models of this construction with varying quality,available as an inclined and two sided lamp, cheap at approximately The high-low version ofthis model can be awkward for cyclists with a risk of damaging cycles. A minimum centre tocentre distance of 0.35 m between wheel braces is recommended
Type 3: galvanized steel, in varying standards of quality, available on concrete base and aswheel- brace set in wall. Having clamps at one level is more user friendly. A minimumclearance centre to centre distance of 0.60 to 0.70 m between wheel clamps is recommended.
Type 4: galvanized steel in high-low models, two sided also available. Not really user friendlyand only to be applied when space is at a premium.
Positive aspects Negative aspects cheap bicycles are parked in an orderly manner with tiered racks optimum use is made of
available space systems all on one level are more user
friendly racks or stands take up relatively little space type 1: presents no obstruction so the
space may be used for other purposes with the high-low system, more bicycles
can be parked on the same area of a publichighway than when there is no provision ofparking facilities
bicycle wheels with the high-low system handlebars may
get snagged in brake cables resulting inpossible damage
not all systems are suitable for all types ofbicycles
system may be susceptible to damage byvandals
sometimes racks or stands take up aninordinate amount of space
type 1: may become clogged with sand ordirt rendering it inoperative
Bicycle parking facility with anti-theft provision included II

98
Area of application Dimensioning On public roads and in bicycle parking
facilities, where there is perceived to besome risk of theft
High-low system where space is in shortsupply
Concrete base for foundation 0.30 x 0.30 x0.20 m
Type 5 and 6: comes in many possible sizes Type 7: centre to centre 0.35 to 0.40 m Type 8: centre to centre 0.60 to 0.70 m
Construction Type 5: galvanized construction set in concrete base. Suitable for 2 bicycles, fixed to rack
using the cyclists’ own chain, clasp or cable lock. Type 6: galvanized construction set in concrete base. Also available with underground
coupling of sub-base construction. Suitable for 2 bicycles, fixed to rack using the cyclists’own chain, clasp or cable lock.
Type 7: galvanized steel with plastic cover. Available set in concrete base as well as in high-low type arrangement, fixed to rack using the cyclist’s own chain, clasp or cable lock.
Type 8: galvanized steel, upper adjustable part may also be specially coated. Set in concretebase, it is available in one and two sided models.
Positive aspects Negative aspects Protection against theft Uncomplicated facilities where bicycles can
be left simply resting against a rack orstand is liked most by cyclists
bicycles are parked in an orderly manner with the high-low system, more bicycles
can be parked on the same area of spacethan when there is no provision forbicycles at all
racks or stands take up relatively little space
Anti-theft systems are not always fully usedas these are not very user friendly
Some anti-theft systems can only be usedwith certain types of lock
some of the systems may result in damageto bicycle e.g. bicycle wheels
with the high-low system handlebars mayget snagged in brake cables resulting inpossible damage
not all systems are suitable for all types ofbicycles
system may be susceptible to damage byvandals
type 7: chance this may get quite dirty
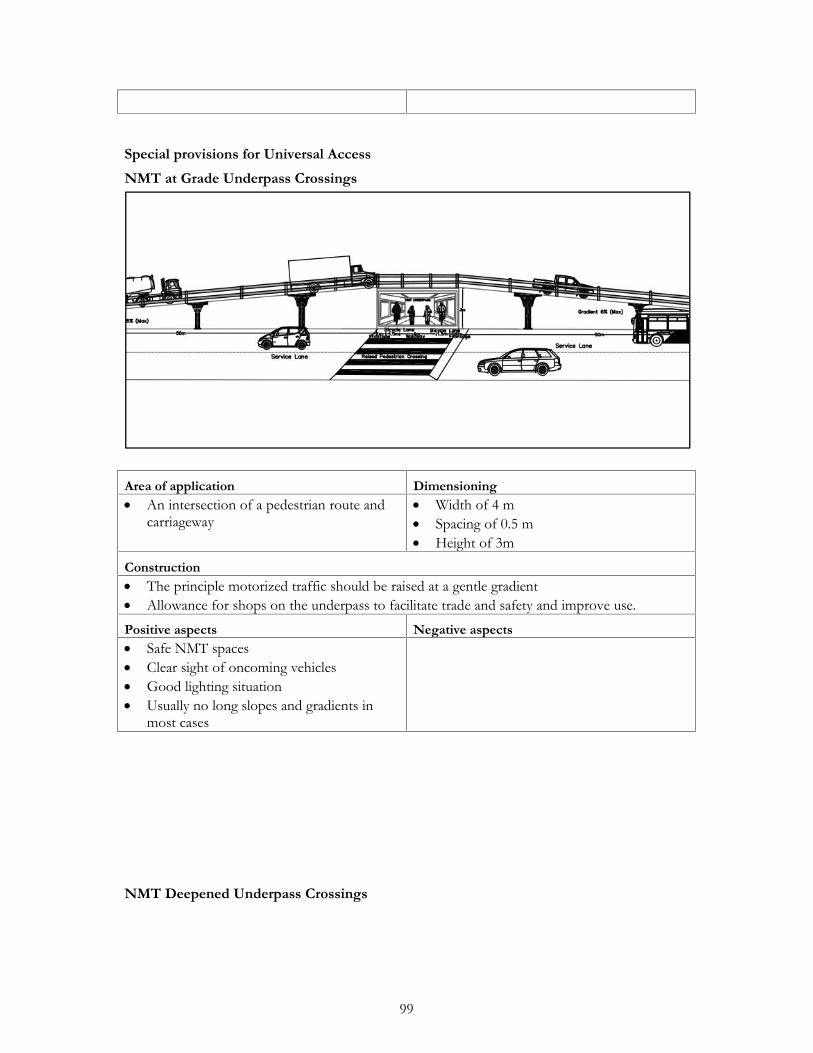
99
Special provisions for Universal AccessNMT at Grade Underpass Crossings
Area of application Dimensioning An intersection of a pedestrian route and
carriageway Width of 4 m Spacing of 0.5 m Height of 3m
Construction The principle motorized traffic should be raised at a gentle gradient Allowance for shops on the underpass to facilitate trade and safety and improve use.Positive aspects Negative aspects Safe NMT spaces Clear sight of oncoming vehicles Good lighting situation Usually no long slopes and gradients in
most cases
NMT Deepened Underpass Crossings

100
Area of application Dimensioning An intersection of an important pedestrian
route and major road, where crossings atgrade would be inadequate.
Underpass- Clearance height of ≥ 2.50m- Gradient ≤ 1:20- Width 2.50 to 3.00 m
Construction The principle motorized traffic should be approximately 2 m higher than the pedestrian
underpass level A viaduct in the road or an open-box construction for pedestrians are possible alternatives. If carriageways are separated there is also the option of allowing extra light into the
underpass through a central opening.Combination options stairway,
Positive aspects Negative aspects Conflict free intersection Several approach routes are possible Clear sight through underpass Good lighting situation Short gradients Usually no problems with groundwater
In existing situation a phased constructionis necessary
Crossing via Traffic Island
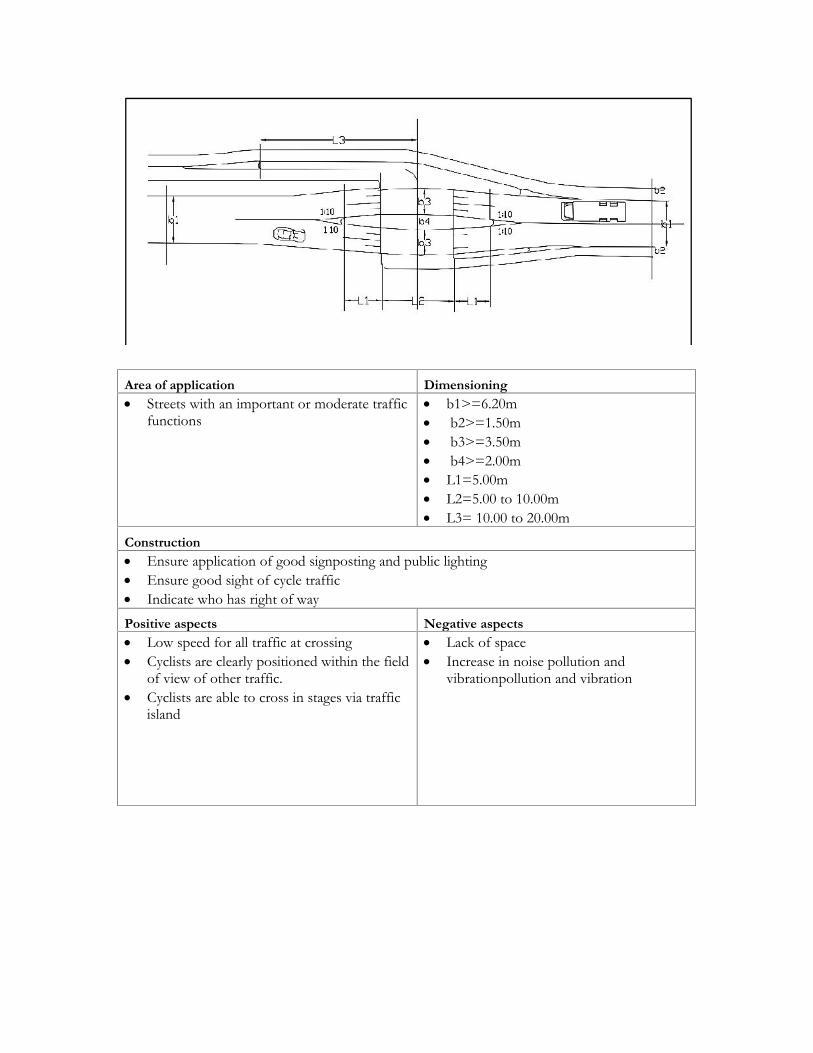
101
Area of application Dimensioning Streets with an important or moderate traffic
functions b1>=6.20m b2>=1.50m b3>=3.50m b4>=2.00m L1=5.00m L2=5.00 to 10.00m L3= 10.00 to 20.00m
Construction Ensure application of good signposting and public lighting Ensure good sight of cycle traffic Indicate who has right of wayPositive aspects Negative aspects Low speed for all traffic at crossing Cyclists are clearly positioned within the field
of view of other traffic. Cyclists are able to cross in stages via traffic
island
Lack of space Increase in noise pollution and
vibrationpollution and vibration
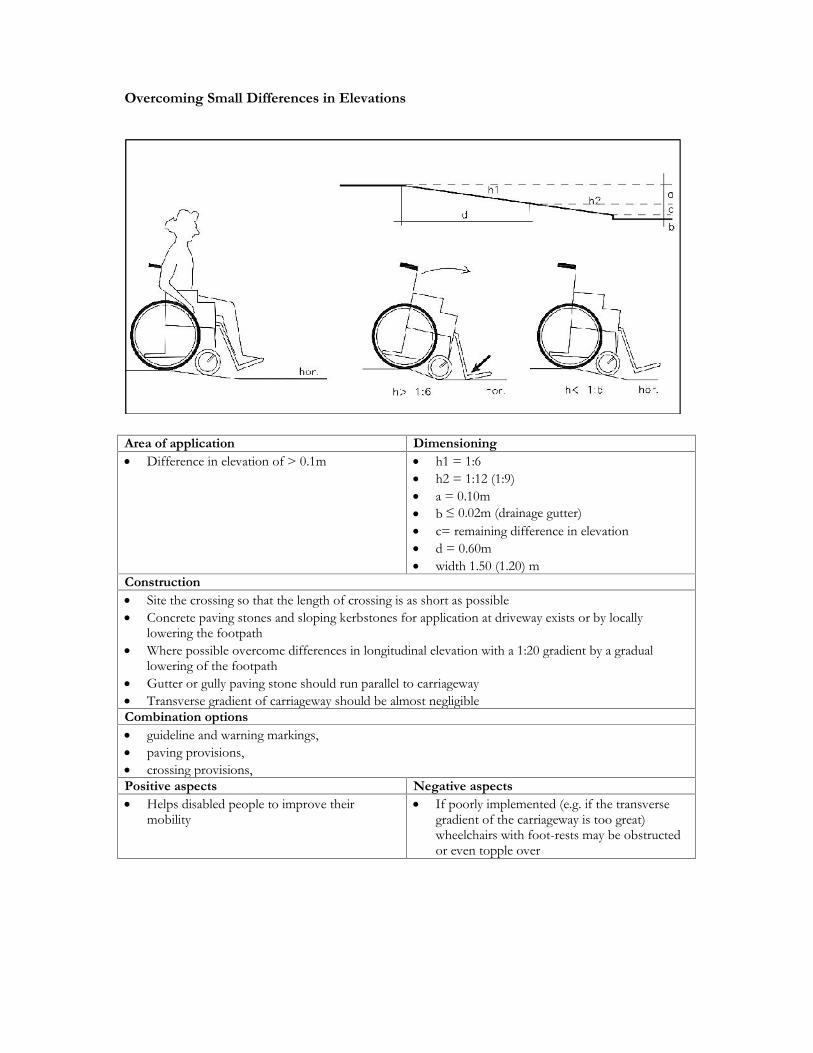
102
Overcoming Small Differences in Elevations
Area of application Dimensioning Difference in elevation of > 0.1m h1 = 1:6
h2 = 1:12 (1:9) a = 0.10m b ≤ 0.02m (drainage gutter) c= remaining difference in elevation d = 0.60m width 1.50 (1.20) m
Construction Site the crossing so that the length of crossing is as short as possible Concrete paving stones and sloping kerbstones for application at driveway exists or by locally
lowering the footpath Where possible overcome differences in longitudinal elevation with a 1:20 gradient by a gradual
lowering of the footpath Gutter or gully paving stone should run parallel to carriageway Transverse gradient of carriageway should be almost negligibleCombination options guideline and warning markings, paving provisions, crossing provisions,Positive aspects Negative aspects Helps disabled people to improve their
mobility If poorly implemented (e.g. if the transverse
gradient of the carriageway is too great)wheelchairs with foot-rests may be obstructedor even topple over

103
Overcoming Large Differences in Elevations
Area of application Dimensioning Large differences in elevation Difference in elevation:
≤ 0.10 m = 1:10 > 0.10 m = 1.20 (1:10)
Construction Traverse gradient should be almost negligible A series of gradients with the same degree of slope is preferable
Combination options guideline and warning markings, paving provisions, crossing provisions,
Positive aspects Negative aspects Helps disabled people to improve their
mobility If poorly implemented (e.g. if the transverse
gradient of the carriageway is too great)wheelchairs with foot-rests may be obstructedor even topple over
If poorly implemented (e.g. if the transversegradient of the carriageway is too great)wheelchairs with foot-rests may be obstructedor even topple over
Takes up a lot of space

104
Guidelines for PLWDs
Area of application Dimensioning On walking routes used by the visually
impaired. a = guideline (building frontage, fence or lawn
edge b = guidance line (where guideline is not
continuous) g = 0.60 m
Construction A kerb cannot usually serve as a type of guideline due to the risk of stumbling and falling onto the
main carriageway Guidelines should be fairly straight and easy to detect (lawn edges, grass verges, continuous fencing) Ensure that present features used as guidelines for orientation (building frontages, fences, garden
walls etc.) are kept free of obstruction Avoid breaks in the uninterrupted ‘natural’ guidelines as much as possible Where there are long breaks in the guideline (between buildings, exits or irregular indentations) this
may be compensated for by possibly introducing other orientation points or continuing the line
Combination options Guidance lines,
Positive aspects Negative aspects Helps disabled people to improve their
mobility and participate in traffic Natural guidelines which mark obstacles can
also be important to other road users Using or creating natural guidelines is always
cheaper than constructing ‘artificial’ guidelines
With indentations in building frontages andfence lines an erratic guideline is created
Temporary obstacles such as shopfrontadvertising boards or waste bins may adverselyinfluence the effectiveness of natural guidelines
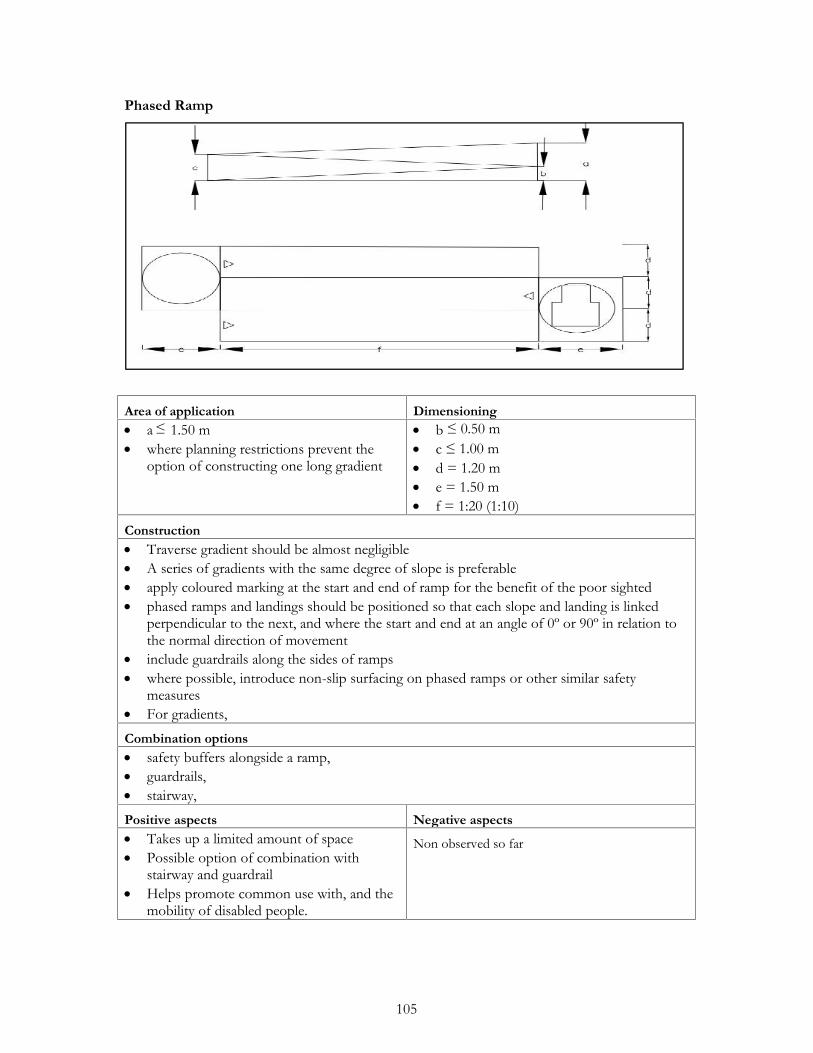
105
Phased Ramp
Area of application Dimensioning a ≤ 1.50 m where planning restrictions prevent the
option of constructing one long gradient
b ≤ 0.50 m c ≤ 1.00 m d = 1.20 m e = 1.50 m f = 1:20 (1:10)
Construction Traverse gradient should be almost negligible A series of gradients with the same degree of slope is preferable apply coloured marking at the start and end of ramp for the benefit of the poor sighted phased ramps and landings should be positioned so that each slope and landing is linked
perpendicular to the next, and where the start and end at an angle of 0º or 90º in relation tothe normal direction of movement
include guardrails along the sides of ramps where possible, introduce non-slip surfacing on phased ramps or other similar safety
measures For gradients,Combination options safety buffers alongside a ramp, guardrails, stairway,Positive aspects Negative aspects Takes up a limited amount of space Possible option of combination with
stairway and guardrail Helps promote common use with, and the
mobility of disabled people.
Non observed so far

106
Position of Obstacles on NMT Footpaths
Area of application Dimensioning On footpaths and in pedestrianized areas
with a view to allowing unobstructedpassage.
c= 0.76 (0.60) m d<= 0.60m (including dense
planting as children may play hideand seek here.
e= 0.10 to 0.15m (raised kerbing) f=>2.20m fences, hedges and walls a maximum
height of o.60m
Construction Obstacles on routes used by the visually impaired should be easily detectable and present no
hindrance to traffic. Height of obstacles should be such that these are easily detectable (this particularly goes for
block shaped plant pots, benches and advertising display cases). It is preferable to have obstacles which are continuous in form down to the level of the
footpath (3); if this is not the case then apply warning marking Trim overhanging branches, which might present an obstruction. Do not have any protruding parts on marker posts.Combination options Positioning of obstacles, Obstacle marking, Guidance lines, Guidelines,Positive aspects Negative aspects

107
Helps disabled people to improve theirmobility and participate in traffic
Large-scale intersection Long way round for (left turning)
cyclists in (1) With parallel traffic controllers or no
traffic control system in (1), cyclists will
be vulnerable to conflict If there is no conflict free control in (2),
conflicts will continue to occur withoncoming traffic
Safety Buffers – alongside a ramp
Area of application Dimensioning (1) with difference in elevation up to 0.25
m (2) with difference in elevation from 0.25
to 1.50 m
b = 1.50 (1.20) m= 1.80 m if the possibility of passing is required c ≥ 0.10 (0.04) m
Construction If slope is steeper than 1:20, apply a stairway next to the gradient Transverse gradient should be horizontal A stairway next to a ramp helps improve the mobility of people with walking difficulties For ramps,
Combination options guardrails, stairway,
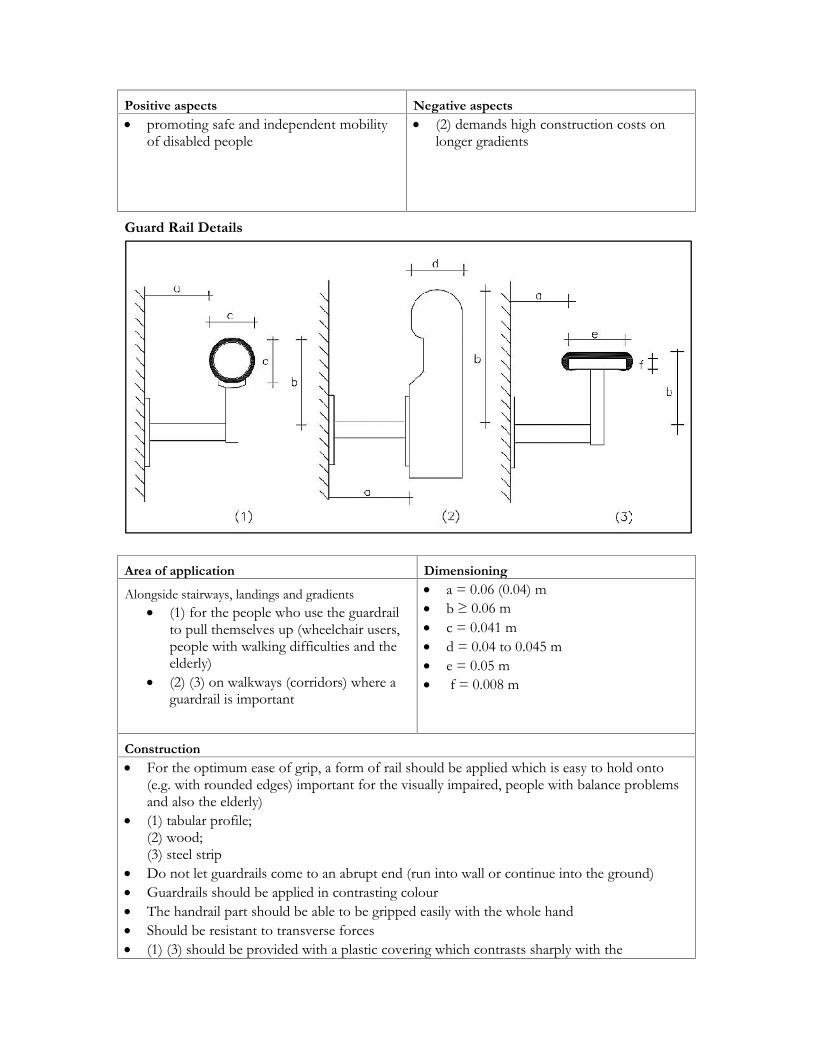
108
Positive aspects Negative aspects promoting safe and independent mobility
of disabled people (2) demands high construction costs on
longer gradients
Guard Rail Details
Area of application DimensioningAlongside stairways, landings and gradients (1) for the people who use the guardrail
to pull themselves up (wheelchair users,people with walking difficulties and theelderly)
(2) (3) on walkways (corridors) where aguardrail is important
a = 0.06 (0.04) m b ≥ 0.06 m c = 0.041 m d = 0.04 to 0.045 m e = 0.05 m f = 0.008 m
Construction For the optimum ease of grip, a form of rail should be applied which is easy to hold onto
(e.g. with rounded edges) important for the visually impaired, people with balance problemsand also the elderly)
(1) tabular profile;(2) wood;(3) steel strip
Do not let guardrails come to an abrupt end (run into wall or continue into the ground) Guardrails should be applied in contrasting colour The handrail part should be able to be gripped easily with the whole hand Should be resistant to transverse forces (1) (3) should be provided with a plastic covering which contrasts sharply with the

109
surroundingsCombination options information in Braille or relief printing may be applied to aid the visually impaired in a
corridor (or concourse) opposite the ends of a stairway guardrails on gradients, guardrails on stairways,Positive aspects Improvement in the use of guardrails for the elderly pedestrians and the disabled
Guard Rails alongside Stairways
Area of application Dimensioning
Alongside stairways and around landings, for reasonsof safety and comfort of walking
b ≥ 0.70 m (width of riser) c ≥ 0.45 m d = 0.60 m (yellow rubber mat) e ≤ 0.10 m h = 0.85 to 0.90 m; = 1.00 m, on open sides of landings
Construction Sturdy and hard wearing with normal use guardrails should be applied at start and end of
stairways with a horizontal overlap of at least 0.45 m plus have vertical sections run to theground level; the guardrail should not impede the movements of other pedestrians
The construction of guardrails on the open side of stairways should be designed in such away that climbing on or falling sideways from the stairway is rendered impossible
For design of guardrailPositive aspects

110
An easy to grip guardrail is not only important for disabled people but also for the otherpedestrians, particularly so for the elderly
Guard Rails alongside a Ramp
Area of application Dimensioning Gradients with a difference in
elevation of ≥0.25 m a = 0.85 to 0.90 m for the benefit of the visually
impaired (0.75 m for wheelchair users and 0.60 m forchildren etc.)
b ≤ 0.10 m for the benefit of the visually impairedusing a white stick
c ≥ 0.45 m at the start and end of gradients; verticalsections of guardrail should run into the ground
Construction Sturdy and hard wearing with normal use Apply guardrails along both sides of ramps for the benefit of the wheelchair users Clearly mark the start and end of ramps with a 0,10 m wide white or yellow line across the
entire width of the path for the benefit of the visually impaired For gradients, For guardrail designs,
Combination options safety buffers on gradients,
Positive aspects Negative aspects Improve access and use of
gradients for the disabled None