
NAC SE IFIL RESEARCH MEMORANDUM - NASA · NAC SE IFIL RESEARCH MEMORANDUM ... DRAG OF A PROJECTILE...
19
Copy coNFiDEMTiAL RM A54H23a NAC SE IFIL RESEARCH MEMORANDUM INVESTIGATION OF THE LIFT, CENTER OF PRESSURE, AND DRAG OF A PROJECTILE AT A MACH NUMBER OF 8.6 AND A REYNOLDS NUMBER OF 17 MILLION By Thomas N. Canning Ames Aeronautical Laboratory Moffett Field, JvOaTrf I . 1) 2 CLASSIFIED DOCUMENT This material contains information affecting the National Defense of the United States within the meaning of the espionage laws Title 18, U.S.C., Secs. 793 and 794, the transmission or revelation of which In any manner to an unauthorized person is prohibited by law. NATIONAL ADVISORY COMMITTEE FOR AERONAUTICS WASHINGTON ber 19, 1954 ,,QENTIAL https://ntrs.nasa.gov/search.jsp?R=19930088487 2018-06-22T01:27:50+00:00Z
Transcript of NAC SE IFIL RESEARCH MEMORANDUM - NASA · NAC SE IFIL RESEARCH MEMORANDUM ... DRAG OF A PROJECTILE...

Copy
coNFiDEMTiAL RM A54H23a
NAC SE IFIL
RESEARCH MEMORANDUM INVESTIGATION OF THE LIFT, CENTER OF PRESSURE, AND
DRAG OF A PROJECTILE AT A MACH NUMBER OF 8.6
AND A REYNOLDS NUMBER OF 17 MILLION
By Thomas N. Canning
Ames Aeronautical Laboratory Moffett Field,
JvOaTrf I . 1) 2
CLASSIFIED DOCUMENT
This material contains information affecting the National Defense of the United States within the meaning of the espionage laws Title 18, U.S.C., Secs. 793 and 794, the transmission or revelation of which In any manner to an unauthorized person is prohibited by law.
NATIONAL ADVISORY COMMITTEE FOR AERONAUTICS
WASHINGTON ber 19, 1954
,,QENTIAL
https://ntrs.nasa.gov/search.jsp?R=19930088487 2018-06-22T01:27:50+00:00Z
NACA RM A54H23a CONFIDENTIAL
NATIONAL ADVISORY COMMITTEE FOR AERONAUTICS
RESEARCH MEMORANDUM
INVESTIGATION OF THE LIFT, CENTER OF PRESSURE, AND
DRAG OF A PROJECTILE AT A MACH NUMBER OF 8.6
AND A REYNOLDS NUMBER OF 17 MILLION
By Thomas N. Canning
WJ6 15
Models of a high-speed projectile configuration were tested in free flight to determine the lift-curve slope, center of pressure, and drag at Mach numbers near 8.6 and at a Reynolds number of 17 million. These results were compared with predictions based on available theory and experimental results. The drag of a similar cone model was also measured.
INTRODUCTION
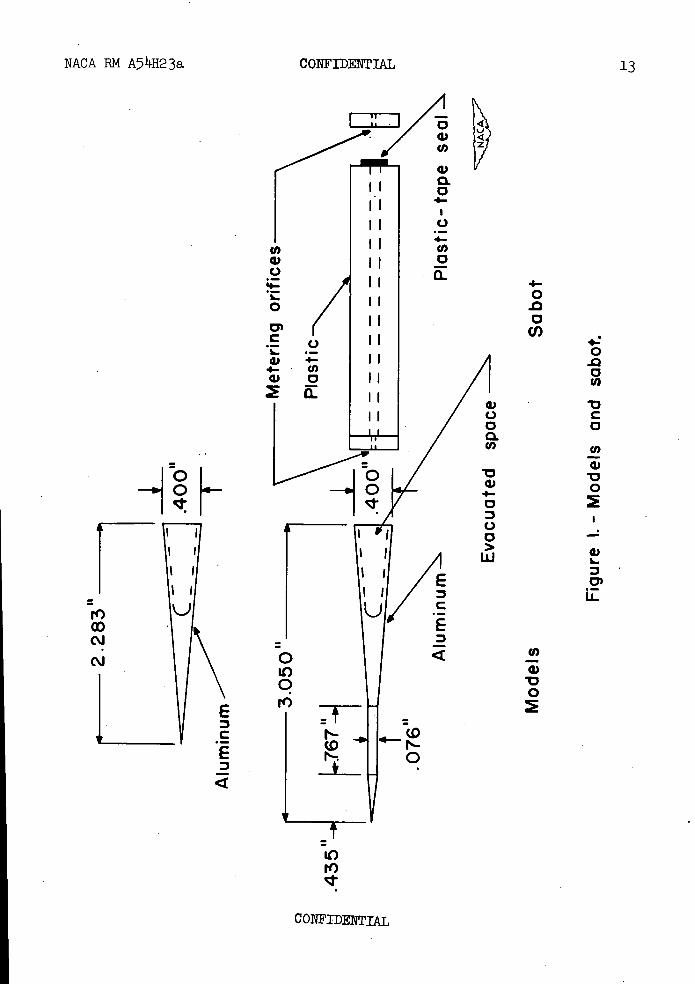
The aerodynamic consequences of improving the static longitudinal stability of a 70 half-angle cone by adding a short spike of heavy mate-rial onto the nose are considered in this paper. The resulting shape (see fig. 1) was enough different from a cone that some changes in aero-dynamic properties were expected. The lift on the added cylinder was expected to increase the lift at angle of attack and to cancel some of the gain in stability by moving the center of pressure forward. It was also expected that there would be at least a small region of quasi two-dimensional flow just behind the spike which might alter the lift, center of pressure, and drag. The presence of the shock wave at the spike base was expected to promote boundary-layer transition. The net effects of these changes were of sufficient interest that the present experimental investigation was undertaken. Tests were made to determine lift, drag, and center of pressure of the projectile. The drag of unmodified cones was also measured for comparison.
Since the speeds of interest for this body were in the high super-sonic Mach number range, the tests were run at the highest Mach number compatible with model strength considerations. The tests were made at speeds near M = 8.6 in the Ames supersonic free-flight wind tunnel at a
CONFIDENTIAL
2 CONFIDENTIAL NACA RN A74H23a
Reynolds number of over 17 million, based on model length. In this facil-ity the models are fired upstream through the test section of an M = 2.0 supersonic wind tunnel to attain high relative airspeed.
SYMBOLS
a projection in the x,z plane of the instantaneous accelera-tion of model center of gravity normal to the tunnel center line, ft/sec2
CD drag coefficient,Sq0
drag coefficient at a = 0 i_Jo
CL lift coefficient corresponding to mean vector sum of a. and. 3 R in test interval
dCL C lift-curve slope, -'per radian
Cm pitching-moment coefficient about model center of gravity, pitching moment
Si q0
- C -- pi- tching-moment-curve slope, -a---, per radian
D drag, lb
E,F constants defining variation of a. with time
e base of Naperian logarithms
f frequency of pitching motion, cps
I principal moment of inertia about lateral axis through model center of gravity, ft-lb sec
k damping constant, sec-1
L lift, lb
model length, ft
N test Mach number
in model mass, slugs
CONFIDENTIAL

NACA RM A541123a. CONFIDENTIAL 3
Q double integral with respect to time of the angle-of-attack function, sec2
q0 free-stream dynamic pressure, lb/sq ft
R Reynolds number based on model length and free-stream conditions
S frontal area of model, sq ft
t time, sec
w projection in x-z plane of the instantaneous velocity of model center of gravity normal to tunnel center line, ft/sec
Xcg,Xcp distance from model nose to center of gravity and center of pressure, respectively, ft
x,y,z orthogonal coordinate system using tunnel center line as x axis, ft
a angle of attack of model relative to local flight path, radians
aR mean value of vector sum of a and 13 during test interval, radians
f3 angle of sideslip of model relative to local flight path, radians
2tf, radians/sec
Subscripts
1234 stations in wind tunnel
APPARATUS AND TECHNIQUES
Wind Tunnel
The tests were conducted in the Ames supersonic free-flight wind tunnel. This facility is a short ballistic range inside a variable-pressure, supersonic, blowdown wind tunnel. While the tunnel was operat-ing at a Mach number of 2.0, the models were fired upstream through the 17-foot-long test section at 7600 feet per second from a gun located in the diffuser. The aerodynamic data were obtained from a history of the
CONFIDENTIAL
S CONFIDENTIAL NACA EM A54H23a
model motion, asrecorded by seven shadowgraph stations (four parallel to the x,z plane and three parallel to the x,y plane) and a chrono-graph. The data from the four-station group are used to study the motion of the models as if the model motion were confined to the x,z plane. Details of the data analysis and a discussion of measures taken to account for motion outside the x,z plane are included in the section entitled "Data Reduction." Details of tunnel operation are given in reference 1.
Models
The models (fig. 1) were machined from 77 ST-6 aluminum bar stock. For the projectile the basic 70 half-angle cone was altered by addinga cylinder of one third the length, and of 0.19 the base diameter of the original cone. The cylinder and nose cone would presumably be made of heavy material in a full-size missile to promote stability. The models for the present tests were bored out at the base to provide the same effect. A conical hole with rounded bottom was bored in each projectile model to place the center of gravity at about the 71-percent point aft of the nose. This resulted in a wall thickness of about 0. 037 inch, which permitted the model to be accelerated about 400,000 gravities in the gun without deformation. The nose cones were finished carefully and the bluntest one fired was 0.003 inch flat at the tip; most tips were less than 0.001 inch flat.
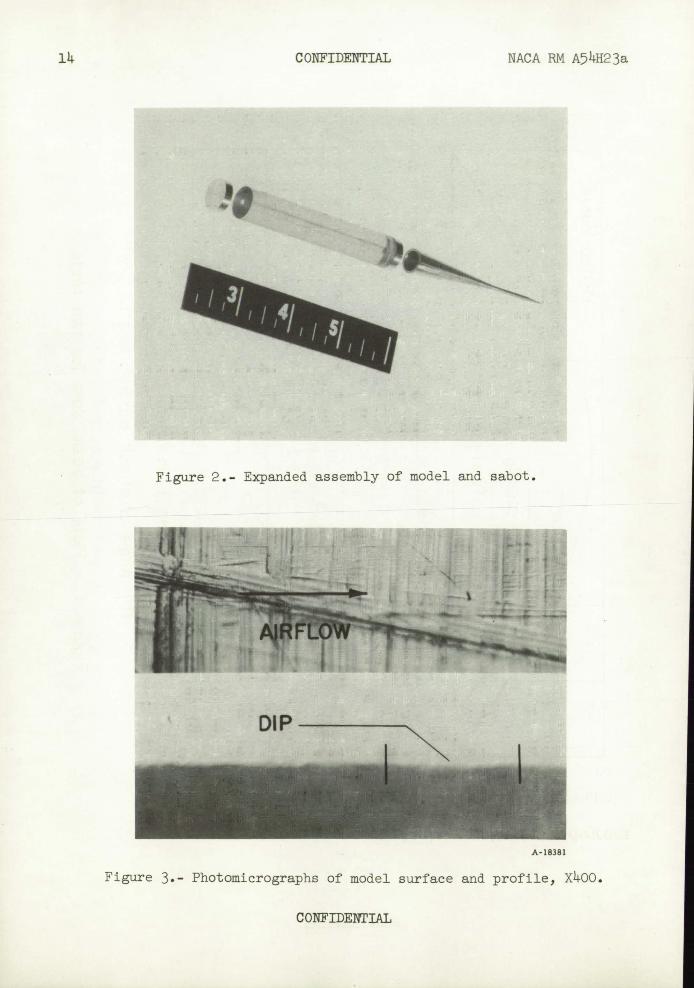
The surface finish was produced by a fine finishing cut and a little hand sanding in the lathe. No effort was made to improve the surfaces further and they were satin-like in appearance. Several model surfaces were examined in order to evaluate the equivalent roughness at large scale. A photograph of a typical model is given in figure 2, and photo-micrographs of a model surface and profile are given in figure 3. The pictures are representative of the worst conditions noted; for example, the dip, which is indicated in the profile picture is 0.0001 inch deep by 0.0030 inch long. This profile is believed to be representative of the test models, but no extensive examination of model surfaces was made. The models were fired from a high performance .7 0 caliber gun and were held on the sabot by evacuating the space in the base of the model as indicated in figure 1. The high-pressure powder gases in the gun chamber penetrated the plastic-tape seal, and a small amount of gas flowed into the evacuated model. The resistance to acceleration held the model firmly in place until the sabot was free of the gun. At this moment the powder-gas pressure in the model forced separation from the sabot face.
CONFIDENTIAL
NACA EM A54H23a CONFIDENTIAL 5
Data Reduction
The lift-curve slope, center of pressure, and drag were calculated from the record of model motion as a function of time. The component of the resultant aerodynamic force parallel to the z axis, that is, the lift, was obtained by measuring the acceleration along this direction; the center of pressure was found from the natural pitching frequency and the lift-curve slope; and the drag was determined by measuring the axial deceleration. Details of the-lift and center-of-pressure calculations are presented below; the details of drag calculation, which is more readily visualized, are given in reference 1. For the purpose of data reduction, linear aerodynamic characteristics are assumed. The effect of nonline-arity is treated approximately.
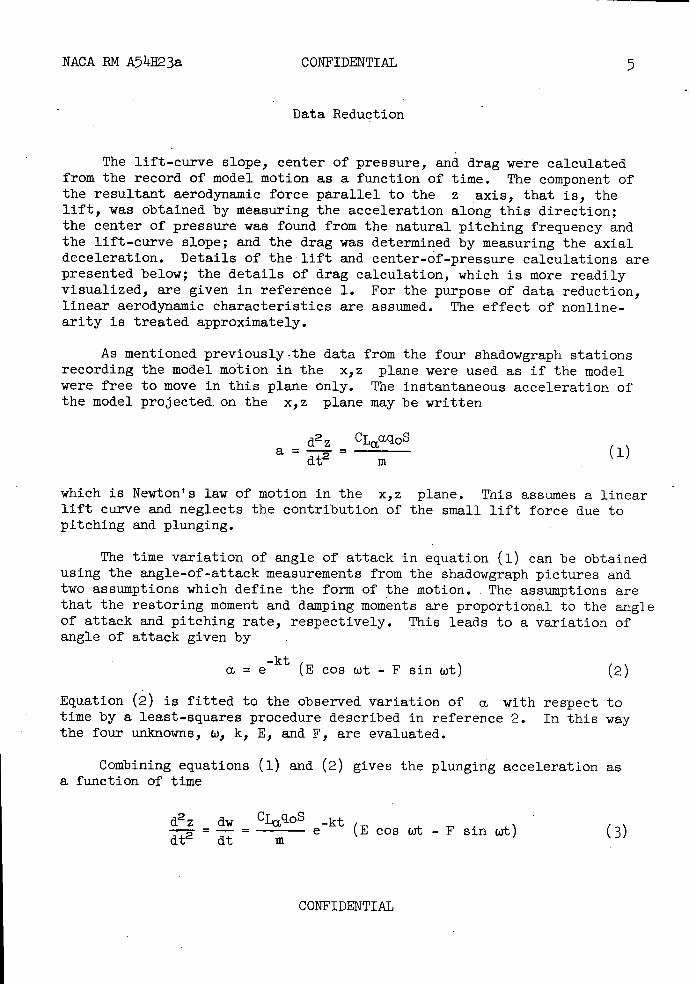
As mentioned previously .the data from the four shadowgraph stations recording the model motion in the x,z plane were used as if the model were free to move in this plane only. The instantaneous acceleration of the model projected. on the x,z plane may be written
d 2 CLctqoS a=—=
(1) m
which is Newton's law of motion in the x,z plane. This assumes a linear lift curve and neglects the contribution of the small lift force due to pitching and plunging.
The time variation of angle of attack in equation (1) can be obtained using the angle-of-attack measurements from the shadowgraph pictures and two assumptions which define the form of the motion. The assumptions are that the restoring moment and damping moments are proportional to the angle of attack and pitching rate, respectively. This leads to a variation of angle of attack given by
- a.=e
kt (Ecoswt - Fsinwt)
Equation (2) is fitted to the observed variation of a, with respect to time by a least-squares procedure described in reference 2. In this way the four unknowns, w, k, E, and F, are evaluated.
Combining equations (1) and (2) gives the plunging acceleration as a function of time
d2 z - dw - C]q0S -kt 7t2dt
e (E cos t_F sin wt) (3)
(2)
CONFIDENTIAL

6 CONFIDENTIAL NACA RM A511}123a
Integrating with respect to t gives the following equation for vertical
velocity, w
w == vi + CrqoS ft
(E cos wt - F sin t) dt (1k)
in which w1 is the component of the model velocity along the z axis at the first station. A second integration gives the equation of verti-cal position relative to the initial point z 1 . The integrals are evalu-ated between limits corresponding to the times and positions in two shad-owgraph stations.
q0S
it,
t2 t2 z2 = zi + w1 (t2 -
+
Cj in
c1
e_kt (E cos wt - F sin wt) dtdt
(5a)
The integral on the right can be evaluated since the integrand and limits are known. For brevity, it will be designated 12•
Cq0S() Z2 = Zi + w1 (t2 - t 1 ) +
inQ12
In equation (5b) the unknowns areand w 1 ; thç iJ_ elim-
inatedbyusing data from a third station:
= z1 + w1 (t3 - t 1 ) + Cjq0S
(5c)
solving equations (5b) and (5c) simultaneously yields the following expres-
sion for Cj:
t2 - ti Z2 - Z - (z3 - z
t2 - ti
i) t3 - t1 (6) LM = Qi - Q13
3 -
In order to determine the center-of-pressure position, it was also necessary to measure the pitching-moment-Curve slope, C, for use in the equation relating lift- and moment-curve slopes:
XCg - Xcp 1 CLa=C (7)
CONFIDENTIAL
NACA RM A541123a CONFIDENTIAL 7
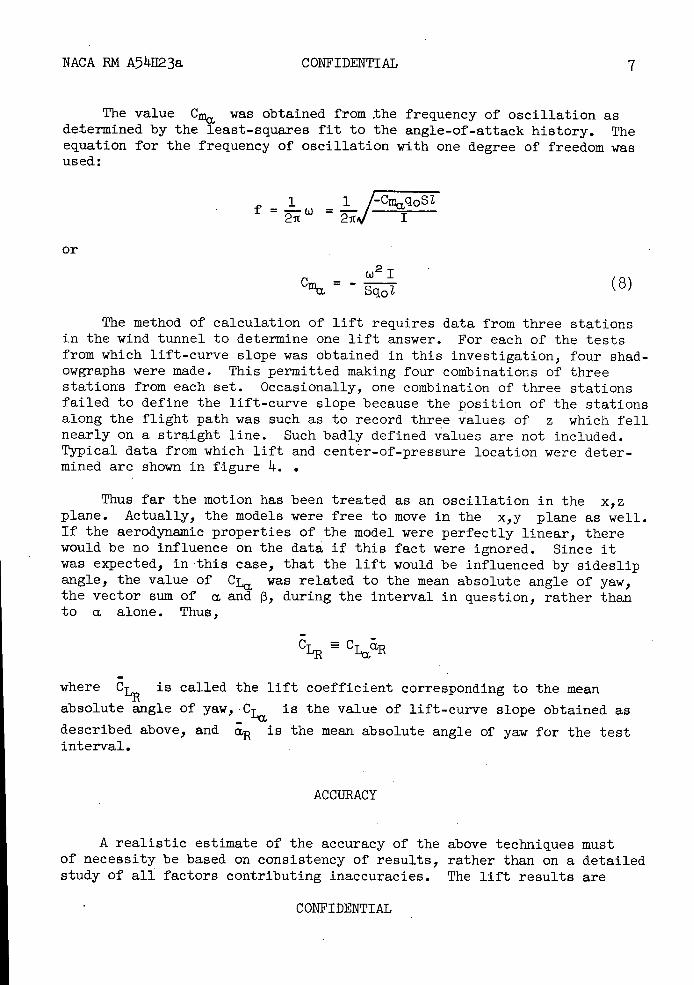
The value Cm was obtained from the frequency of oscillation as determined by the least-squares fit to the angle-of-attack history. The equation for the frequency of oscillation with one degree of freedom was used:
= !;_w 1F-CrnqoSZ
2ii I
2
CW
= Sq01
The method of calculation of lift requires data from three stations in the wind tunnel to determine one lift answer. For each of the tests from which lift-curve slope was obtained in this investigation, four shad-owgraphs were made. This permitted making four combinations of three stations from each set. Occasionally, one combination of three stations failed to define the lift-curve slope because the position of the stations along the flight path was such as to record three values of z which fell nearly on a straight line. Such badly defined values are not included. Typical data from which lift and center-of-pressure location were deter-mined are shown in figure 4.
Thus far the motion has been treated as an oscillation in the x,z plane. Actually, the models were free to move in the x,y plane as well. If the aerodynamic properties of the model were perfectly linear, there would be no Influence on the data if this fact were ignored. Since it was expected, in this case, that the lift would be influenced by sideslip angle, the value of CL, was related to the mean absolute angle of yaw, the vector sum of a and 3, during the interval in question, rather than to c alone. Thus,
°LR CãR
where C is called the lift coefficient corresponding to the mean
absolute angle of yaw, •C is the value of lift-curve slope obtained as
described above, and Is the mean absolute angle of yaw for the test interval.
ACCURACY
A realistic estimate of the accuracy of the above techniques must of necessitybe based on consistency of results, rather than on a detailed study of all factors contributing inaccuracies. The lift results are
(8)
CONFIDENTIAL
8 CONFIDENTIAL NACA RM A54H23a
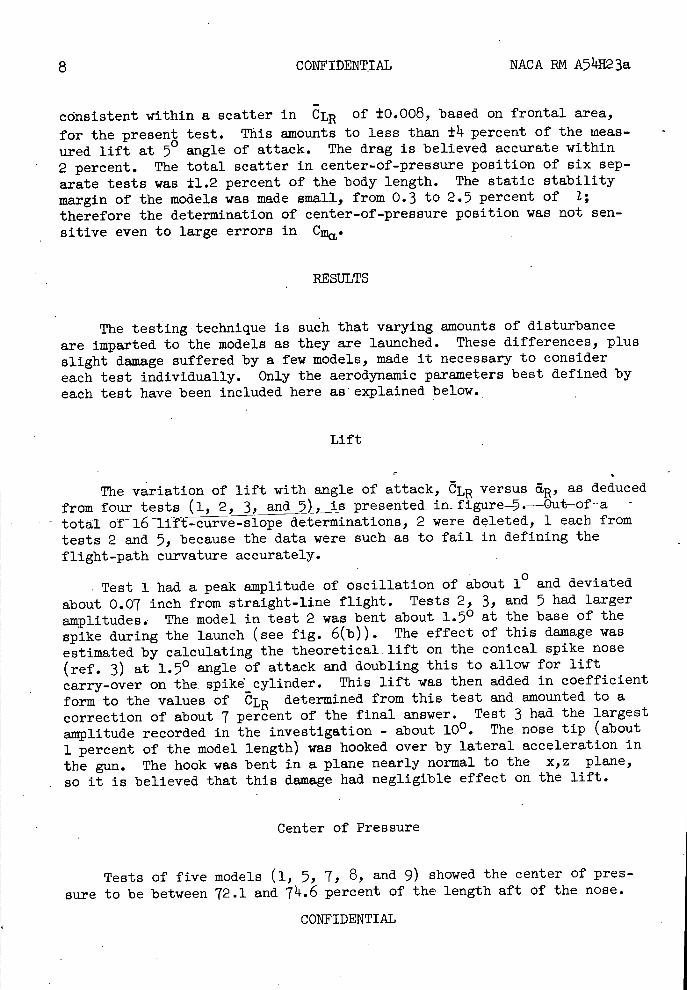
consistent within a scatter in CLE of ±0.008, based on frontal area,
for the present test. This amounts to less than ±1 percent of the meas-ured lift at 50 angle of attack. The drag is believed accurate within 2 percent. The total scatter in center-of-pressure position of six sep-arate tests was ±1.2 percent of the body length. The static stability margin of the models was made small, from 0.3 to 2.5 percent of 1; therefore the determination of center-of-pressure position was not sen-sitive even to large errors in C.
RESULTS
The testing technique is such that varying amounts of disturbance are imparted to the models as they are launched. These differences, plus slight damage suffered by a few models, made it necessary to consider each test individually. Only the aerodynamic parameters best defined by each test have been included here as explained below.
Lift
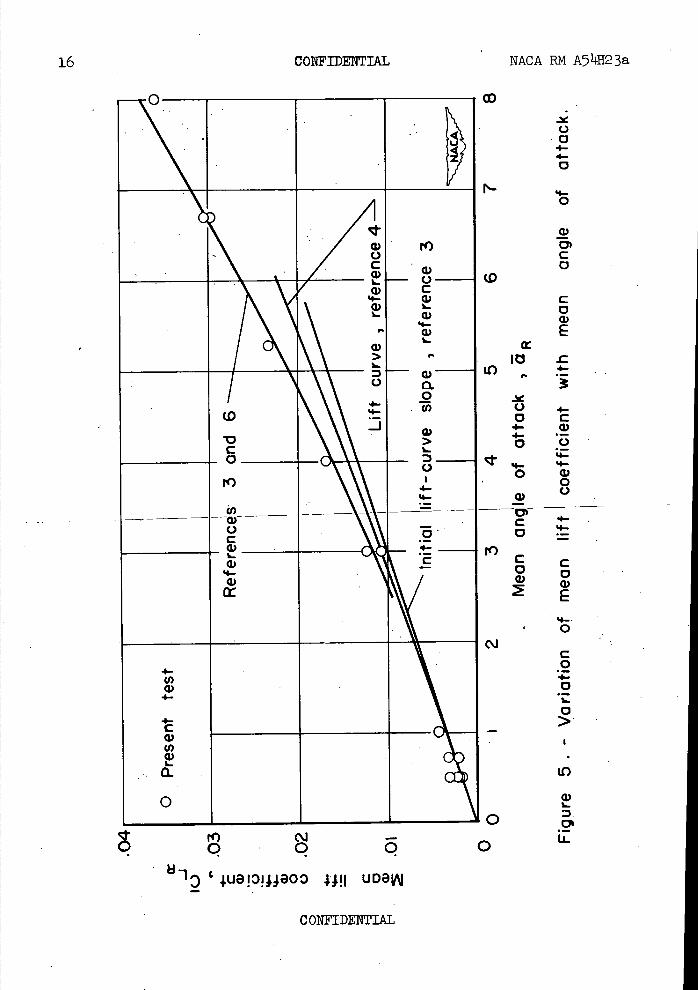
The variation of lift with angle of attack, LR versus &R, as deduced from four tests (1, 2, 3, and 5), is presented. in- figure-5 .--Ou-t---ofa -
total -of- 16 - --- -curve-slope determinations, 2 were deleted, 1 each from tests 2 and 5, because the data were such as to fail in defining the flight-path curvature accurately.
Test 1 had0
a peak amplitude of oscillation of about 1 and deviated
about 0.07 inch from straight-line flight. Tests 2, 3, and 5 had larger amplitudes. The model in test 2 was bent about 1.5 0 at the base of the spike during the launch (see fig. 6(b)). The effect of this damage was estimated by calculating the theoretical lift on the conical spike nose (ref. 3) at 1.50 angle of attack and doubling this to allow for lift carry-over on the.spikd cylinder. This lift was then added in coefficient form to the values of CLR determined from this test and amounted to a correction of about 7 percent of the final answer. Test 3 had the largest amplitude recorded in the investigation - about 100 . The nose tip (about 1 percent of the model length) was hooked over by lateral acceleration in the gun. The hook was bent in a plane nearly normal to the x,z plane, so it is believed that this damage had negligible effect on the lift.
Center of Pressure
Tests of five models (1, 5, 7, 8, and 9) showed the center of pres-sure to be between 72.1 and 74.6 percent of the length aft of the nose.
CONFIDENTIAL

NACA RM A74H23a CONFIDENTIAL 9
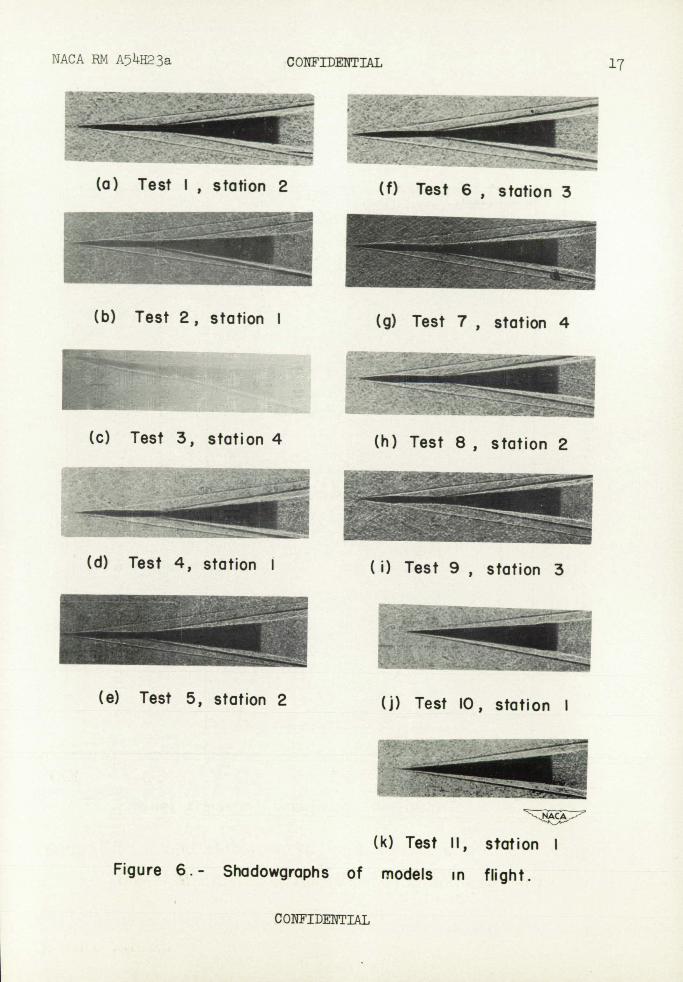
For all of these tests the oscillatory motion was fairly well defined and the models were not visibly damaged (see fig. 6).
Drag
Five tests were obtained with accurate enough time-distance measure-ments for determining drag (1, 4, 5, 6, and 7). These results are plot-ted in figure 7 as a function of the average position of boundary-layer transition along the model as observed in the shadowgraphs. The drag due to lift of these models was estimated and subtracted as outlined in reference 1.
The principal evidences of turbulent boundary-layer flow are eddies visible in shadowgraphs and small waves sent out by these eddies. A region of turbulent flow may be seen near the base of the model in figure 6(j). This patch of turbulent flow is being swept downstream at about half the free-stream velocity as evidenced by the angle of the weak shock wave emanating from it. Scrutiny of all the pictures from a test permitted the estimation of transition position. In the case of test 6 no laminar flow was seen aft of the spike cylinder. It is believed that transition did, in fact, occur at the nose due to some slight damage not visible in the shadowgraphs. In view of the difficulty of seeing boundary-layer turbulence near the nose, the point for this testis plotted as if tran -sition occurred at the spike base.
The drag tests of two unmodified cones are also reported in this figure. The lower Reynolds number of these two tests resulted from using shorter models and testing at slightly lower tunnel pressure for testing convenience.
DISCUSSION
The initial lift-curve slope predicted using reference 3 is indicated in figure 5 and is seen to underestimate the lift appreciably at angles of attack greater than 30• A somewhat better model of the flow at angle of attack is given by impact theory (ref. Ii. ) which predicts increasing lift-curve slope with increasing angle of attack. This predicted varia-tion is plotted in figure 5; there is still a large gap between experiment and theory.
The nonlinearities indicated in impact theory may be evaluated dif-ferently using the crossflow concept proposed in reference 5 and further developed in reference 6. If the crossflow contribution is added to the continuation of the initial lift-curve-slope line of figure 5, the sum agrees quite well with the experiment. This crossflow-lift increment was
CONFIDENTIAL

10 CONFIDENTIAL NACA RN A54H23a
calculated on the basis of 70 percent of the supercritical drag coeffi-cient of a circular cylinder being developed on an expanding body at angles of attack above 2.50. This value, 70 percent, was chosen on the basis of results given in reference 6 for the nose of an ogive cylinder. The agreement, perhaps better than might reasonably be expected, still indicates the possibility of accurate lift calculation by presently avail-able methods.
The effect of the spike on the lift appears to be small. Its frontal area, less than 14 percent of the model base area, would indicate that even if the lift carry-over from the nose were equal to the nose lift, the total lift would be increased by only 4 percent. The spike apparently did not affect the lift on the main body to any great degree, as was indicated by the success in calculating the total lift.
The center-of-pressure position was estimated theoretically, ignoring the lift developed by the spike cylinder and assuming that the pressures on the aftercone were not affected by the presence of the cylinder. The resulting center of pressure, essentially the center of plan-form area of the conical portions, is predicted to be 74.2 percent of 1 aft of the nose. The median experimental value of 73.3 percent agrees well with this prediction. If the lift carry-over from the nose cone onto the cylinder is assumed equal to the nose-cone lift and acts at one third the cylinder length aft of the nose cone, the predicted location is 73.4 percent 1 aft of the nose. It is expected that at large -angles of at ck,—the center of pre ssure--moves--forwardsttght1i slnàé the spike-cylinder lift variation is expected to be more nonlinear than that for the conical portions.
The estimates of the zero-lift drag of the projectile were based on references 1, 7, and 8 for wave drag and reference 9 for skin friction. The base pressure was assumed to be 10 percent of free-stream static pressure, based on extrapolation of the data of reference 10. The wave drag estimated by use of reference 14-0was about 20 percent below that pre-dicted by use of reference 7 for a 5 cone. The value from reference 7 only is presented in figure 7.
The theoretical drag build-up for both configurations is presented in figure 7. The skin friction was calculated using local conditions and the effect of heat transfer was included. The data of reference 9, and subsequent data, as yet unpublished, obtained by the same technique, were used in these calculations.
The effect of heat transfer was to increase the skin friction by some 35 percent over that which would have existed without heat flow, according to reference 9. In order to see if the wall to free-stream temperature ratio was the same as for the tests of reference 9, estimates were made of the maximum temperature rise the model could have experienced. Before firing, the model temperature was around 51400 R and the free-stream static temperature was 300 0 R. At N = 8.6 the recovery temperature was
CONFIDENTIAL

NACA EM A541123a CONFIDENTIAL 11
around 43000 R, and the flight duration was 0.008 second. At the outset, it is useful to note that even if the entire model surface were to be raised to the melting point, 111200 H, the temperature difference causing heat transfer would be reduced by only 23 percent. That this extreme temperature rise did not, in fact, occur is evidenced by the perfect con-dition of models observed at the last shadowgraph station.
Calculations of the maximum possible temperature rise of the model based on the appendix of reference 11 indicated a temperature rise on the spike cylinder, just behind the nose cone, of 30 0 R and 10000 R at the apex. Thus the temperature rise on 97 percent of the wetted area was less than 300 R and the maximum temperature rise at the nose, as indicated by its survival, was less than 8800 R. Thus it is seen that the wall to stream temperature relation of the skin-friction tests also applies to the present test.
Two calculations of the local Mach number and dynamic pressure, on which the skin-friction calculations were based, were made. The first was based on reference 7 and ignored the effect of the spike on the flow over the main body. The second was based on reference 7 for the nose cone, and shock-expansion theory, reference 8, for the remainder of the body. The pressure distributions and skin-friction results from these two cal-culations were nearly identical, indicating no important effect of the cylinder on the pressure distribution on the remainder of the body at small incidence.
As is indicated in figure 7 1 boundary-layer transition generally occurred well downstream of the spike base. In many cases the flow was laminar over the entire body length, but it never remained so throughout an entire flight. Thus it appears that at the present test conditions of high Mach number and large heat-transfer rate into the model surface, a laminar boundary layer is extremely stable.
CONCLUDING REMARKS
Presently available theories may be used for engineering estimates of lift, center-of-pressure location, and wave drag of the projectile and the drag of the 70 half-apex-angle cone from which the projectile shape was derived. The lift for the projectile at angles of attack around 30 and above is noticeably greater than predicted by linear theory.
A good estimate of friction drag was made on the basis of presently available data which include the effect of heat transfer.
Ames Aeronautical Laboratory National Advisory Committee for Aeronautics
Moffett Field, Calif., Aug. 23, 19711-
CONFIDENTIAL

IP CONFIDENTIAL NACA RN A54H23a
REFERENCES
1. Seiff, Alvin, James, Canton S., Canning, Thomas N., and Boissevain, Alfred G.: The Panes Supersonic Free-Flight Wind Tunnel. NACA RN A52A24, 1972.
2. Shinbrot, Marvin: A Least Squares Curve Fitting Method with Applica-tions to the Calculation of Stability Coefficients From Transient-Response Data. NACA TN 2 341 , 1971.
3. Staff of the Computing Section, Center of Analysis, under the direc-tion of Zdenek Kopal: Tables of Supersonic Flow Around Yawing Cones. M.I.T. Dept. of Electrical Engineering. Center of Analysis. Tech.
Rep. 3, 1947-
ii-. Gnimminger, G., Williams, E. P., and Young, G. B. W.: Lift on Inclined Bodies of Revolution in Hypersonic Flow. Jour. Aero. Sci., vol. 17, no. 11, Nov. 1970 , pp. 677-690.
5. Allen, H. Julian: Estimation of the Forces and Moments Acting on Inclined Bodies of Revolution of High Fineness Ratio. NACA RN A9126, 1949.
6. Perkins, Edward W., and Jorgensen, Leland H.: Comparison of Experi-mental and Theoretical Normal-Force Dist tions( Including
on an Ogive-Cylinder Body at Mach Number 1.98. NACA RN A54H2 3, 195.
7. Staff of the Computing Section, Center of Analysis, under the direc-tion of Zdenek Kopal: Tables of Supersonic Flow Around Cones. M.I.T. Dept. of Electrical Engineering. Center of Analysis. Tech. Rep. 1, 1947.
8. Eggers, A. J., Jr., and Savin, Raymond C.: Approximate Methods for Calculating the Flow About Nonlifting Bodies of Revolution at High SupersonicAirspeeds. NACA TN 2 779, 1971.
9. Seiff, Alvin: Examination of the Existing Data on the Heat Transfer of Turbulent Boundary Layers at Supersonic Speeds From the Point of View of Reynolds Analogy. NACA TN 3284, 195.
10. Kurzweg, H. H.: Interrelationship Between Boundary Layer and Base Pressure. Jour. Aero. Sci., vol. 18, no. 11, Nov. 1951, pp..73_748.
11. Jedlicka, James R., Wilkins, Max E., and Seiff, Alvin: Experimental Determination of Boundary-Layer Transition on a Body of Revolution at M = 3.5. NACA RN A53L18 1 19514.
CONFIDENTIAL
4-0
-a a U)
4-0 .0 0
C,)
a) 4-0
C.) 0 >
LU
C.) 0 a. U) U)
V 0
a)
LL
V C C
NACA FM A5 1412 3a CONFIDENTIAL 13
lo -lOm--I. \ I!
\' I!
\' 'I ' II
(s.' N
E C E Zi
(I) a) C.)
0
C.)
a) 4-4- • U) a) 0
d EL
0 I') 0 F') _
F.-(0
/a) 0/c,)
0. II I•I III 2 II II 0
U)
a-
I
E C E
al
(0 N-0
141 V
Tj
a) •0 0
X.
It) F')
CONFIDENTIAL
CONFIDENTIAL NACA Pdd A74H23a
If
Figure 2.- Expanded assembly of model and sabot.
DIP"N
A-18381
Figure 3.- Photomicrographs of model surface and profile, X400.
CONFIDENTIAL

0 c%J 0 c.J
seeThep
M 30 440 10 9I6UV
4
i)
—>
C-)
a)
4-U-
N-
C,; 4-U) a)
(0 . 4-- 4-
0
U) a)
4-
4-
:i
C U) 0
01 C
CJ .0a)
01 LL
NACA RN A5 4}123a CONFIDENTIAL 15
PT
4-N- U)
a) 4-
U) a)
w4-U)
-c
C u' .2
4-C• o
•E f - G)
4- >
C 0
I--C) 0 4-.
C
0
0 co It 0
Seqou! 'Z '.UO!4!SOd ID3109A
saJ69p' Z$9O4D jo a6U'
LL I /
4/ L__
C
0 •- 4-
Hi
CONFIDENTIAL
16 NACA RN A54H23a
CD-x C) 0 4-4-0
N-0
ci
C 0
(0
CONFIDENTIAL
r() N - 0 Q q q
el-12 '4ua!o!Jaoo 44!l UD3J
0 0
I0 LU
C) 0 4-4-0
0
0) -01
C 0
0 U)
N
C 0 W E
-c 4-
4-C W C) 4-.4-a) 0 C.)
4-9-
C 0 a) E
0
C 0
0
0 >
IL.)
a)
U-
U
V ./- Cc
rlo
cr
CONFIDENTIAL
NACA RN A7+H2 3a CONFIDENTIAL 17
(a) Test I , station 2 (f) Test 6 , station 3
- : ....-.------.- -
......
(b) Test 2, station I
(g) Test 7 , station 4
--I
(c) Test 3, station 4
:•. .
(d) Test 4, station I
(e) Test 5, station 2
(h) Test 8 , station 2
(i) Test 9 , station 3
__Now
(j) Test 10, station I
NACA
(k) Test II, station I
Figure 6.- Shadowgraphs of models in flight.
CONFIDETTLAL

18 coiFIDE:N'rIkL NACA RM A714B23a
— — - ––
- -o
a a – a__a_a . a a a —
Model Experiment Theory- 0
Projectile , R 17 x 10 6 0
Cone ,R=9x106
=IIIIIII II 0 20 40 60 80 100
Transition position , percent length'
.07
.06
.05
0 I,
4-C.
0 4-.4-
0.03
0 0
.02
WE
:ii
Figure 7. Variation of drag of projectile and a 50 cone
with position of transition location. M 8.6.
COI'IFIDEI'ITIAL
NACA-Langley - 11-19-54 - 425