Email Marketing Practices Top Online Internet Retailers Silverpop

A special report sponsored by

nrf.com/stores stores July 2016 S3
n top 100 retailers
Who, What, Why and hoWthe top 100 retailers are ranked by
52/53-week annual retail sales. In almost all instances, sales used to rank companies are for retail activity in the United states only; footnotes are provided when this is not the case. to arrive at U.s. retail sales figures, a variety of estimation techniques are applied based on publicly disclosed information. for this reason, the figures presented do not always match the com-panies’ official public filing reports.
company revenues from non-retailing operating segments are removed unless otherwise noted; system-wide sales are provided when the operation is a fran-chise.
In keeping with the methodology used in previous years, the rankings eliminate fuel sales at locations designated as having a gasoline/fueling station as its primary business.
What constitutes a segment Power Player? Any retailer with 2015 U.s. sales equal to or greater than 10 percent of the sales of the category leader.
Acknowledgements & methodology
Apex supply chain technologies’ AnyWhere solutions help you thrive in real-time retail with self-serve lockers for secure click-and-collect order pickup and cashless vending. Apex Axcess Automated Locker systems automate the management of handheld electronic devices in your distribution center. Both technologies are powered by our trajectory cloud platform to integrate with your existing systems and provide real-time insights to help you deliver a seamless customer experience.
olapic is the first earned content platform designed to help brands tap real consumer images and videos to create more personalized and powerful consumer experiences, at scale. We work with hundreds of global brands to collect, curate and permission content through a combination of machine learning and human intelligence, activate it across the entire marketing and e-commerce stack, and analyze the impact on revenue, performance, and engagement. to learn more, visit olapic.com.
We are the retail and shopper specialists. We are a leading retail and shopper insight, consulting and analytics and technology business, part of Kantar Group, the data investment management division of WPP. We work with leading brand manufacturers and retailers to help them sell more effectively and profitably. At Kantar retail, we track and forecast over 1,000 retailers globally and have purchase data on over 200 million shoppers. Among our market-leading reports are the annual Poweranking survey and the Digital Power study. Kantar retail works with over 400 clients and has 26 offices in 15 markets around the globe.

n top 100 retailers
S4 stores July 2016 nrf.com/stores
Have a comment
about this year's
top 100 retailers?
tweet us at
@storesmedia
and use
#storestop100
to join the
conversation!
Bonus power player content and charts are available at nrf.com/stores
toP 100 retAILersOpen to opportunities, clear-headed merchants are driving innovation by daVId P. SChULZ
Call it the “amazon effect.” Retailers, long fixated on physical location and inventory, are now focusing time, energy and capital on the processes of selling and distributing goods.
Physical stores are still formidable at selling merchandise, owning about 90 percent of mar-ket share. Bricks-and-mortar’s share of total sales has been in decline for the better part of two decades, though, and “will continue to lose sales until the distinction between [physi-cal shopping and digital commerce] becomes indistinguishable,” says Bryan Gildenberg, chief knowledge officer at Kantar Retail.
Consumers appear to favor services and experiences over merchandise: Kantar re-search indicates that by 2020, consumers will be spending $2 on services for every $1 they spend on “stuff,” Gildenberg says.
Also putting pressure on physical stores are digital retail marketplaces such as eBay, Etsy, Google Shopping and Amazon’s own Market-place that enable smaller merchants to reach broader swaths of consumers. Such online marketplaces, the Internet itself and mobile commerce have enabled marketing opportuni-ties for manufacturers, wholesalers and im-porters, creating vertical pipelines that bypass retailers altogether.
Social media platforms have been agents of change in so many ways that it is surprising they haven’t made more impact. Pinterest and Instagram have added “buy” buttons, but so-cial commerce has yet to gain any real traction.
“Few retailers say that social media networks are a great customer acquisition tool,” says Sucharita Mulpuru, principal analyst for For-rester Research, which tracks digital retailing. “There is so much content on Pinterest and Instagram and other discovery engines, so any individual piece of content gets very little vis-ibility and even less conversion.”
In the near-term, “Social media will remain
more marketing, but the line between market and selling will become blurry,” Gildenberg says. “It is relatively easy to move from social marketing to social selling.”
ExPLoRIng oPtIonS
In addition to enhancing omnichannel efforts, many retailers are rethinking merchandise of-
ferings, which consumers to target (and how best to reach them) and the ideal number of stores.
Nothing illustrates this better than the efforts (continued on page S6)
toys “R” Us 58
Best Buy 12

nrf.com/stores stores July 2016 S5
a relatively stolid sector in the retail industry, the automotive aftermarket segment was roiled
during the past year by a major bidding war between activist investor Carl icahn and Japanese-
owned tire and rubber company Bridgestone. the prize: philadelphia-based pep Boys.
though pep Boys was not performing particularly well, it is the only major player in all four
segments of auto aftermarket retailing: do-it-yourself, do-it-for-me, replacement tires and buy-
for-resale. pep Boys boasts some 800 stores in 35 states and puerto rico with more than 7,500
service bays. the bidding war was sparked last october when Bridge-
stone retail operations announced an $835 million offer for publicly
held pep Boys. after several escalating offers, the deal was clinched by
the end of the year when icahn’s publicly held icahn enterprises said it
was willing to lay out just over $1 billion for pep Boys, which joins the
270-location auto plus chain icahn acquired in June 2015.
last year the U.s. Department of transportation said consumers were
keeping their cars and other vehicles 18 months longer than they did
in 2007, when the average age of a
family vehicle was 10 years.
“the fact that these oldest
vehicles are growing in number is a
great trend for the aftermarket repair business,” iHs automo-
tive notes. “in fact, by 2020, there will be approximately 76
million vehicles in operation that are 16 years or older, up
from 35 million in 2002.”
PoWer PLAyers
auto
aftermarket
autoZone $8,483,000 $1,700 3.8% 5,082
o’reilly automotive 7,967,000 1,700 7.5 4,571
advance auto parts 4,116,000 1,000 n.A. 4,257
pep Boys 2,038,000 2,500 n.A. 809
tBC Corp. / tire Kingdom 1,919,000 900 n.A. 2,118
source: Kantar retailIncludes online sales related to respective retailers.
Company 2015 USa Sales per Comp-store USa Retail Sales Store Change % Stores (000) (000) Sales
Big Lots 75
Lowe’s 10
19
68 Belk 95
Publix 14
sponsored by

n top 100 retailers
S6 stores July 2016 nrf.com/stores
being made up and down the list of STORES’ Top 100 Retailers. No. 1 Wal-Mart Stores is investing $2 billion in e-commerce technology and logistics over the next several years. Plans include using its network of warehouses and perhaps selected stores to fulfill online orders delivered by regional carriers.
Walmart has tapped Federal Express to deliv-er small parcels to its online customers; its buy online, pick up in store service has doubled over the last year and is now available in more than 30 markets.
No. 2 Kroger is spending a large chunk of its $4 billion-plus capital budget to expand its ClickList program, launched less than two years ago. Now operating in more than a dozen markets, ClickList allows consumers to order goods online with curbside pickup at the closest store. Kroger is also testing a service in the Denver area where shoppers can order on-line for home delivery.
Department stores continue to feel pressure
in their ubiquitous mall settings, though No. 15 Macy’s is making great strides online: Web sales grew 15 percent last year to approxi-mately $6 billion.
“The customer wants personalization, not necessarily in-store, but online,” Karen Hoguet, Macy’s chief financial officer, told investors a few weeks ago. Mobile commerce is a growing part of Macy’s digital retail effort, with sales made via mobile devices more than doubling last year.
“I very strongly believe that consumers are not only going to shop online, they’re going to start their journey on their phones, they’re going to enter our stores, they’re going to interact with our sales associates, learn more about product, try product on, feel the fabric,” Macy’s CEO Terry Lundgren told Fortune magazine last fall. “They may not buy it in store that day, but without that store interac-tion, it’s likely the sale would not occur.”
Suffering along with a lot of other apparel (continued on page S8)
Kantar retail projects small-format value will be the fastest-growing bricks-and-mortar seg-
ment over the next five years, expanding 6.6 percent annually through 2020.
segment leaders Dollar General and Dollar tree, which is currently digesting its acquisition
of Family Dollar stores, have been adding more coolers and freezers to their stores to better
compete with traditional supermarkets. “Dollar stores’ consumable goods now represent over
two-thirds of their total sKUs,” says richard J. George, professor emeritus of food marketing at
st. Joseph’s University’s Haub school of Business. “the dollar store phenomenon will
only continue to grow.”
George’s research indicates that 38 percent of Millennials shop for groceries in
dollar stores. He also says that in the post-recession era of value shopping, “frugal
fatigue” hasn’t occurred in food shopping. in the first quarter of this year, both Dollar
General and Dollar tree saw same-store sales increase 2.2 percent.
Dollar General expects to grow to 20,000 stores by 2020, and is focusing its mer-
chandising efforts on traditional supermarket categories like perishables and health
and beauty care. in June the company opened its 13th distribution center, located
near san antonio, texas, to serve 800 stores in that state as well as louisiana and New
Mexico. Dollar General has introduced a smaller (roughly 6,000 square feet) format
for deeper penetration into densely populated urban areas. after a pilot program
involving 30 stores, the company plans to open approximately 80 more this year.
“sales productivity and returns based on the early results are very encouraging,” says todd Va-
sos, Dollar General’s chief executive. “By eliminating less-pro-
ductive product segments and adding or expanding product
departments to meet the needs of our urban customers, we
believe this smaller-format store will allow us to have a higher
capture rate per site selection.”
While Big lots is larger than most of the players in this
category, with stores averaging 30,000 square feet, their size is
not large enough for inclusion in the Mass Merchants category.
PoWer PLAyers
small-format
value
dollar tree 23
Dollar General $20,369,000 $1,600 2.8% 12,483
Dollar tree 19,943,000 1,500 2.5 13,626
Big lots 5,191,000 3,600 1.8 1,449
Fred’s 2,121,000 3,300 0.0 642
source: Kantar retailIncludes online sales related to respective retailers.
Company 2015 USa Sales per Comp-store USa Retail Sales Store Change % Stores (000) (000) Sales
(continued from page S4)
1

nrf.com/stores stores July 2016 S7
2016 top 1oo retailers
* Walgreens acquisition of rite Aid pending approval, to be reflected in fy2016** revenues reported for the 53-week reporting periodn.A. not available or not applicablenotes on methodology:UsA = 50 states and District of columbia. sales in Puerto rico, the U.s. Virgin Islands and Guam have been estimated and removed if reported as part of the U.s. business segment for that company.All retail sales estimates exclude wholesale and non-retail services (not sold at stores) but include online retail sales.fuel sales are included, except where revenues of fuel exceed 50% of average store revenues; in this case sales are reported exclusive of fuel sales.All figures are estimates based on Kantar retail research and company reports.
1 Wal-Mart Stores Bentonville, Ark. $353,108,000 2.8% $500,138,000 71% 5,182 1%
2 the Kroger Co. cincinnati 103,878,000 0.8 103,878,000 100 3,747 0
3 Costco Issaquah, Wash. 83,545,000 4.8 116,671,000 72 476 3
4 the home depot Atlanta 79,297,000 6.9 88,621,000 89 1,965 0
5 Walgreens Boots alliance* Deerfield, Ill. 76,604,000 6.0 92,670,000 83 8,052 0
6 target minneapolis 73,226,000 0.8 73,226,000 100 1,774 -1
7 CVS health Woonsocket, r.I. 72,151,000 6.2 73,546,000 98 9,659 23
8 amazon.com seattle 61,619,000 23.1 104,060,000 59 n.A. n.A.
9 albertsons Boise, Idaho 58,443,000 4.8 58,443,000 100 2,311 -5
10 Lowe’s Companies mooresville, n.c. 57,486,000 4.9 59,051,000 97 1,805 1
11 Mcdonald’s oak Brook, Ill. 35,837,000 1.1 82,714,000 43 14,259 -1
12 Best Buy richfield, minn. 35,148,000 4.0 39,455,000 89 1,412 -2
13 apple Stores / itunes cupertino, calif. 34,949,000 23.1 41,020,000 85 268 3
14 Publix Super Markets Lakeland, fla. 32,633,000 6.8 32,633,000 100 1,314 1
15 Macy’s cincinnati 27,002,000 -3.7 27,079,000 100 868 6
16 Rite aid camp Hill, Pa. 26,866,000 1.3 26,866,000 100 4,561 0
17 ahold USa / Royal ahold** carlisle, Pa. 26,350,000 1.4 47,044,000 56 788 3
18 tJx framingham, mass. 23,557,000 8.0 31,020,000 76 2,662 4
19 aldi Batavia, Ill. 22,781,000 7.9 99,558,000 23 1,903 6
20 Sears holdings Hoffman estates, Ill. 22,129,000 -14.1 23,019,000 96 1,611 -3
21 h-E-B grocery san Antonio, texas 20,523,000 3.6 21,931,000 94 313 -1
22 dollar general Goodlettsville, tenn. 20,369,000 7.7 20,369,000 100 12,483 6
23 dollar tree chesapeake, Va. 19,930,000 137.6 20,168,000 99 13,626 164
24 yUM! Brands Louisville, Ky. 19,363,000 -1.8 54,051,000 36 17,392 0
25 Kohl’s menomonee falls, Wis. 19,204,000 1.0 19,204,000 100 1,164 0
Rank Company headquarters/ 2015 USa Sales Worldwide USa % 2015 growth U.S. headquarters Retail Sales growth Retail Sales Worldwide Stores (’15 v ’14) (000) (’15 v ’14) (000) Sales
sponsored by

n top 100 retailers
S8 stores July 2016 nrf.com/stores
sellers, No. 37 Gap Inc. is exploring selling its clothing via Amazon. “To not be consider-ing Amazon and others would be, in my view, delusional,” Gap CEO Art Peck told investors
recently. “We are always considering all of the oppor-tunities beyond our tradi-tional mix of channels and stores. Amazon is certainly one, and there are others as well.”
Gap uses third-party plat-forms to sell goods in China and Europe; those efforts are nothing on the scale that would likely come through
a collaboration with Amazon, where approxi-mately a third of all U.S. retail e-commerce transactions take place.
“To not acknowledge that and what it means to our strategy would be to have our head in the sand,” Peck said, “and we do not have our head in the sand.”
‘RELEntLESS’ CoMPEtItIon
a mazon is doing so much on so many fronts, it is not surprising that store-based
retailers are having a difficult time keeping up. Amazon continues to be “relentlessly innovat-ing,” says Gildenberg. “Amazon Prime is a legitimate game changer.”
Five years ago, about 10 percent of U.S. households had a Prime subscriber; that figure is now somewhere north of 30 percent, Gild-enberg says. In addition, more than two-thirds of Prime users say they tend to check Amazon before buying anything, anywhere.
At the annual shareholders meeting this spring, CEO Jeff Bezos indicated that many more benefits are in store for Prime members. “Our goal with Amazon Prime, make no mis-take, is to make sure that if you are not a Prime member, you are being irresponsible,” he said.
Amazon is pressuring all its retail rivals — online and off — by intensely expanding its distribution network. This benefits the third-party merchants selling on Amazon Market-
amazon 8
it may be the result of increased activity in the housing market, but home goods retailers are
on a roll. New home sales posted double-digit increases this spring and there’s still “a shortage of
shelter,” says ivy Zelman, chief executive of Zelman associates.
“the U.s. is at a 30-year low of inventory available for sale,” she says. “We are predict-
ing double-digit housing starts growth this year, next year and in 2018.”
Home goods retailers are benefitting as people change residences and add furniture,
housewares and home décor when they do. Wall street stock touter Jim Cramer credits
retailer HomeGoods for the increase in parent tJX Cos.’ stock this year. HomeGoods regis-
tered a billion-dollar sales quarter in the first three months of this year, boosted in part by
9 percent same-store sales gains.
HomeGoods is the bricks-and-mortar counterpart to Wayfair, which sells home furnish-
ings and décor items online at sharp discount prices. in May, Wayfair announced the open-
ing of the Wayfair Next research and development laboratory “dedicated to accelerating
the shift to online shopping by improving the visualization of
products through first-party technologies.” the company says it
is exploring novel 3D scanning techniques to digitize Wayfair’s
vast catalog for use with augmented reality, virtual reality and 2D
rendering.
the new Wayfair Next lab hosts a virtual reality experience
described as a hands-on demonstration that allows users to trans-
form a room by customizing the model, material, color and layout
of furnishings and décor.
“technology innovation has always set us apart from every
other player in the home space,” says steve Conine, co-founder
and co-chairman of Wayfair. “Wayfair Next represents our com-
mitment to constantly raising the bar to create the best possible
shopping experience for the home, adapted to how consumers
shop today and in the future.”
PoWer PLAyers
home goods
(continued from page S6)
Bed Bath & Beyond* $11,820,000 $8,300 1.0% 1,431
ikea North america svcs. 4,759,000 116,100 n.A. 41
Williams-sonoma 4,757,000 8,100 3.7 589
tJX (HomeGoods)** 3,871,000 7,400 5.0 520
Wayfair 1,943,000 n.A. n.A. n.A.
pier 1 imports 1,805,000 1,800 0.7 985
overstock.com 1,658,000 n.A. n.A. n.A.
Nebraska Furniture Mart 1,399,000 349,700 n.A. 4
source: Kantar retailIncludes online sales related to respective retailers.sales per store metrics excludes sales of online retailers that do not have stores.* Bed Bath & Beyond excludes Harmon.** tJX equals HomeGoods banner only and estimated value of home goods category at tJmaxx.
Company 2015 USa Sales per Comp-store USa Retail Sales Store Change % Stores (000) (000) Sales
(continued on page S10)

nrf.com/stores stores July 2016 S9
2016 top 1oo retailers
** revenues reported for the 53-week reporting periodn.A. not available or not applicablenotes on methodology:UsA = 50 states and District of columbia. sales in Puerto rico, the U.s. Virgin Islands and Guam have been estimated and removed if reported as part of the U.s. business segment for that company.All retail sales estimates exclude wholesale and non-retail services (not sold at stores) but include online retail sales.fuel sales are included, except where revenues of fuel exceed 50% of average store revenues; in this case sales are reported exclusive of fuel sales.All figures are estimates based on Kantar retail research and company reports.
26 delhaize america salisbury, n.c. $17,461,000 2.3% 29,169,000 60% 1,288 -5%
27 Verizon Wireless new york 16,924,000 54.4 $16,924,000 100 7,145 2
28 Meijer Grand rapids, mich. 15,963,000 1.7 15,963,000 100 222 4
29 Wakefern / ShopRite Keasbey, n.J. 15,400,000 4.8 15,400,000 100 337 2
30 ace hardware oak Brook, Ill. 15,343,000 7.3 16,677,000 92 4,311 1
31 Whole Foods Market Austin, texas 14,849,000 8.7 15,409,000 96 412 8
32 BJ’s Wholesale Club Westborough, mass. 14,406,000 5.2 14,406,000 100 211 2
33 Starbucks seattle 14,124,000 12.8 19,163,000 74 12,521 5
34 nordstrom seattle 13,972,000 5.4 14,098,000 99 312 10
35 7-Eleven Dallas 13,957,000 4.3 93,082,000 15 8,363 3
36 Subway milford, conn. 13,901,000 3.8 26,699,000 52 27,464 1
37 a&t Wireless Dallas 13,868,000 7.0 13,868,000 100 2,099 -3
38 gap san francisco 12,604,000 -3.6 16,629,000 76 2,403 -3
39 J.C. Penney Co. Plano, texas 12,548,000 3.0 12,625,000 99 1,014 -5
40 Ross Stores Pleasanton, calif. 11,930,000 8.1 11,940,000 100 1,446 6
41 Bed Bath & Beyond Union, n.J. 11,919,000 1.8 12,104,000 98 1,482 1
42 SUPERVaLU eden Prairie, minn. 11,647,000 1.3 11,647,000 100 1,586 2
43 L Brands columbus, ohio 10,967,000 6.5 11,721,000 94 2,721 1
44 Burger King Worldwide miami 10,342,000 21.4 25,823,000 40 7,776 9
45 Menard eau claire, Wis. 10,217,000 3.6 10,217,000 100 294 2
46 Bi-Lo Jacksonville, fla. 10,054,000 -1.6 10,054,000 100 756 -5
47 Wendy’s** Dublin, ohio 8,949,000 0.7 9,504,000 94 5,722 0
48 health Mart Systems omaha, neb. 8,669,000 6.9 11,541,000 75 3,996 10
49 autoZone memphis, tenn. 8,483,000 8.8 9,867,000 86 5,082 3
50 hy-Vee W. Des moines, Iowa 8,254,000 4.3 $8,254,000 100 242 3
Rank Company headquarters/ 2015 USa Sales Worldwide USa % 2015 growth U.S. headquarters Retail Sales growth Retail Sales Worldwide Stores (’15 v ’14) (000) (’15 v ’14) (000) Sales
sponsored by

n top 100 retailers
S10 stores July 2016 nrf.com/stores
place as well as Amazon itself when delivering its own merchandise to customers.
The company has more than 160 distribu-tion facilities scattered across the country, 42 of which are Prime Now hubs near metropoli-tan areas that handle two-hours-or-less deliv-eries, according to supply chain and logistics consulting firm MWPVL.
Amazon also has 20 fulfillment centers and re-distribution centers in the works, along with four sorting centers, MWPVL says, and already offers one-hour delivery service to Prime Now mem-bers in 30 metropolitan areas worldwide.
Other initiatives include expansion of its Amazon Fresh grocery delivery service to Boston. The $299-a-year Prime Fresh service is also available in Amazon’s home base of Seattle, parts of California and New Jersey, and the Philadelphia and New York City met-ropolitan areas.
Groceries are such an important merchandise category for Amazon that the company “will be a Top 10 player” in the approximately $795
billion U.S. food and beverage grocery market by 2019, according to analysts at Cowen and Co., a Wall Street financial services firm.
“We are encouraged by Amazon’s growing footprint in this category, which we see as ripe for potential disruption given [Millennials] increasingly purchasing food and beverage grocery items via digital channels,” wrote lead analyst John Blackledge.
The company has confirmed that it is launch-ing a chain of bricks-and-mortar stores to sell books and proprietary electronics such as the Kindle and Fire tablets. The 7,400-square-foot flagship is in Seattle’s University Village shop-ping center; a second store about half that size is located in San Diego.
Apparel is also getting a higher profile: Ama-zon’s original Apparel and Accessories store featured goods from the likes of Nordstrom, Gap, Lands’ End and Foot Locker, all of which subsequently left Amazon Marketplace to sell online through their own websites. The rebranded Amazon Fashion now features such
Much is happening in the apparel sector, not a lot of it positive for some familiar names found
in malls across america. “apparel [retailing] is structurally changing,” says Bryan Gildenberg,
chief knowledge officer with Kantar retail. “tJX is now the biggest apparel seller in the country
— more apparel than Macy’s, more than Walmart, more than any other specialty chain.”
tJX, parent of tJ Maxx and Marshall’s, rang up corporate sales
growth of 6 percent last year. after posting a 7 percent same-store
sales increase in the first quarter of this year, Ceo ernie Herrman
declared, “We are convinced that we are growing our customer
base and gaining market share.” Herrman, who replaced longtime
leader Carol Meyrowitz earlier this year, credits strong marketing
efforts for boosting positive results.
Urban outfitters is fashion-
oriented but still pays atten-
tion to nuts and bolts, meta-
phorically speaking. the quirky
retailer — which operates eponymous stores as well as the
anthropologie and Free people chains — has invested in tech-
nology infrastructure and enhancing inventory management.
Merchandise turns over about 6.5 times annually and stays in
inventory just over 56 days; averages for its peers are around
4.9 turns and closer to 80 days in inventory.
the technology effort has focused equally on in-store and
digital commerce. “our brands were early direct-to-consumer
adopters,” says richard payne, Uo’s chairman and chief execu-
tive. “While we continue to invest more in electronic shopping
capabilities, we also strongly believe that bricks is synergistic
with clicks, and that a well-conceived and executed store strat-
egy is a powerful competitive advantage.”
PoWer PLAyers
general apparel
tJX * $18,107,000 $8,500 5.0% 2,142
Gap 12,604,000 5,200 -4.0 2,403
ross stores 11,930,000 8,300 4.0 1,446
Burlington Coat Factory 5,036,000 9,100 0.7 555
H&M 3,938,000 9,500 n.A. 415
american eagle outfitters 3,076,000 3,400 7.0 904
abercrombie & Fitch Co. 3,030,000 4,000 -3.0 752
the Men’s Wearhouse 2,996,000 1,900 4.9 1,603
ralph lauren Corp. 2,773,000 9,200 n.A. 300
Urban outfitters 2,713,000 5,500 2.0 492
J.Crew Group 2,416,000 4,600 -8.2 520
Forever 21 2,365,000 4,700 n.A. 500
express 2,243,000 3,500 6.0 636
source: Kantar retailIncludes online sales related to respective retailers.* tJX excludes sales related to HomeGoods banner and estimated value of home goods category at tJmaxx.
Company 2015 USa Sales per Comp-store USa Retail Sales Store Change % Stores (000) (000) Sales
(continued on page S12)
(continued from page S8)
nrf.com/stores stores July 2016 S11
2016 top 1oo retailers
** revenues reported for the 53-week reporting periodn.A. not available or not applicablenotes on methodology:UsA = 50 states and District of columbia. sales in Puerto rico, the U.s. Virgin Islands and Guam have been estimated and removed if reported as part of the U.s. business segment for that company.All retail sales estimates exclude wholesale and non-retail services (not sold at stores) but include online retail sales.fuel sales are included, except where revenues of fuel exceed 50% of average store revenues; in this case sales are reported exclusive of fuel sales.All figures are estimates based on Kantar retail research and company reports.
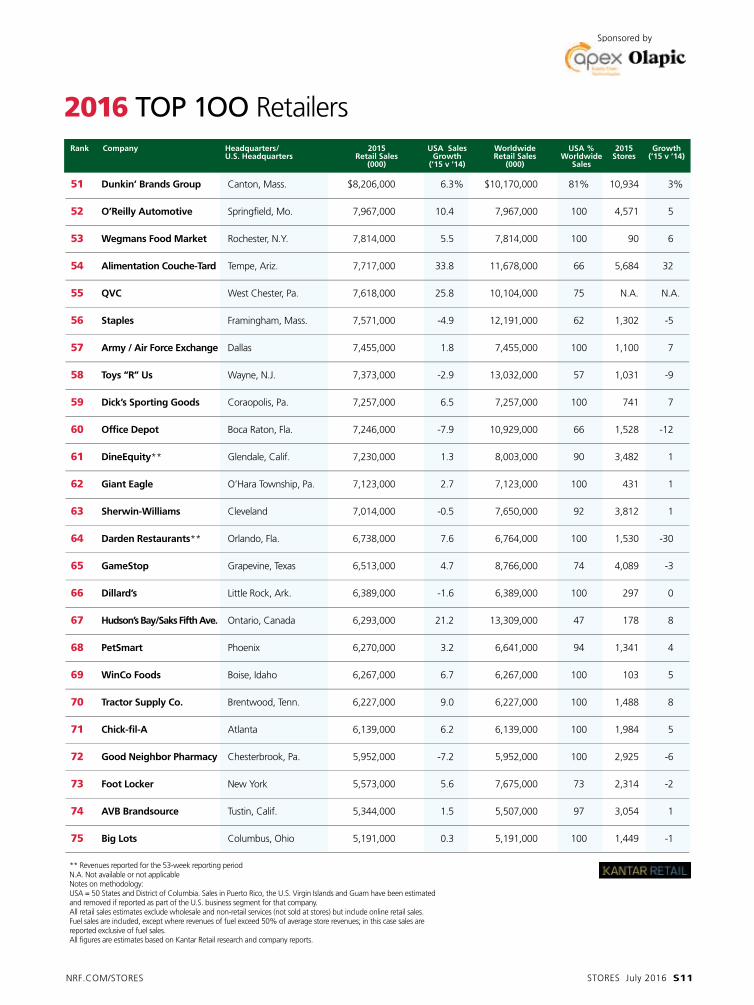
51 dunkin’ Brands group canton, mass. $8,206,000 6.3% $10,170,000 81% 10,934 3%
52 o’Reilly automotive springfield, mo. 7,967,000 10.4 7,967,000 100 4,571 5
53 Wegmans Food Market rochester, n.y. 7,814,000 5.5 7,814,000 100 90 6
54 alimentation Couche-tard tempe, Ariz. 7,717,000 33.8 11,678,000 66 5,684 32
55 QVC West chester, Pa. 7,618,000 25.8 10,104,000 75 n.A. n.A.
56 Staples framingham, mass. 7,571,000 -4.9 12,191,000 62 1,302 -5
57 army / air Force Exchange Dallas 7,455,000 1.8 7,455,000 100 1,100 7
58 toys “R” Us Wayne, n.J. 7,373,000 -2.9 13,032,000 57 1,031 -9
59 dick’s Sporting goods coraopolis, Pa. 7,257,000 6.5 7,257,000 100 741 7
60 office depot Boca raton, fla. 7,246,000 -7.9 10,929,000 66 1,528 -12
61 dineEquity** Glendale, calif. 7,230,000 1.3 8,003,000 90 3,482 1
62 giant Eagle o’Hara township, Pa. 7,123,000 2.7 7,123,000 100 431 1
63 Sherwin-Williams cleveland 7,014,000 -0.5 7,650,000 92 3,812 1
64 darden Restaurants** orlando, fla. 6,738,000 7.6 6,764,000 100 1,530 -30
65 gameStop Grapevine, texas 6,513,000 4.7 8,766,000 74 4,089 -3
66 dillard’s Little rock, Ark. 6,389,000 -1.6 6,389,000 100 297 0
67 hudson’s Bay/Saks Fifth ave. ontario, canada 6,293,000 21.2 13,309,000 47 178 8
68 PetSmart Phoenix 6,270,000 3.2 6,641,000 94 1,341 4
69 WinCo Foods Boise, Idaho 6,267,000 6.7 6,267,000 100 103 5
70 tractor Supply Co. Brentwood, tenn. 6,227,000 9.0 6,227,000 100 1,488 8
71 Chick-fil-a Atlanta 6,139,000 6.2 6,139,000 100 1,984 5
72 good neighbor Pharmacy chesterbrook, Pa. 5,952,000 -7.2 5,952,000 100 2,925 -6
73 Foot Locker new york 5,573,000 5.6 7,675,000 73 2,314 -2
74 aVB Brandsource tustin, calif. 5,344,000 1.5 5,507,000 97 3,054 1
75 Big Lots columbus, ohio 5,191,000 0.3 5,191,000 100 1,449 -1
Rank Company headquarters/ 2015 USa Sales Worldwide USa % 2015 growth U.S. headquarters Retail Sales growth Retail Sales Worldwide Stores (’15 v ’14) (000) (’15 v ’14) (000) Sales
sponsored by
n top 100 retailers
S12 stores July 2016 nrf.com/stores
brands as Kate Spade, Calvin Klein, Lacoste, Levi Strauss and Nicole Miller selling directly through Amazon.
Amazon.com’s apparel offerings — both its own inventory and that of third-party mer-chants — grew 91 percent last year, according to investment bank R.W. Baird. Cowen and Co. forecasts Amazon’s total apparel sales will reach $27.8 billion next year and $52 billion by 2020.
“Do I think Amazon will overtake Macy’s in 2017?” asks Marshal Cohen of industry-track-er NPD Group. “No. Will it be close? Yes.”
In March, Amazon launched a live daily fashion show called Style Code Live, similar in format to segments offered by television and Internet home-shopping retailers. A venture announced this spring to offer luxury mer-chandise from elite designers includes a link to fashion retailer Moda Operandi’s site, so the goods won’t be sold directly via Amazon’s site.
“Structural changes” in the apparel industry are affecting everyone from specialty chains to promotional stores to traditional department stores, Gildenberg says. “The range of partici-
pants is completely different from 10 years ago.”The turmoil in apparel retailing manifests
itself in the negative year-over-year sales perfor-mances of such apparel-dependent retailers as Macy’s, Gap and No. 67 Dillard’s, while Target (No. 6), Kohl’s (No. 24) and Ascena Retail Group (No. 87) saw gains of 1 percent or less.
SPECIaLIZEd LEadERS
anumber of Top 100 retailers operate in specialized niches with few head-to-head
rivals or with fragmented competition from smaller regional chains. Chief among these, based on current performance, is No. 71 Trac-tor Supply Co. with nearly 1,500 locations. Coming off a year in which sales increased 9 percent, Tractor Supply opened 2016 with a 10.2 percent sales boost in the first quarter.
The company is forecasting that sales could reach or surpass $7 billion this year with same-store sales gains in the 3.5 to 5 percent range. Tractor Supply plans to open between 115 and 120 new stores this year, as it continues to con-vert Del’s Feed and Farm Supply stores to the TSC banner.
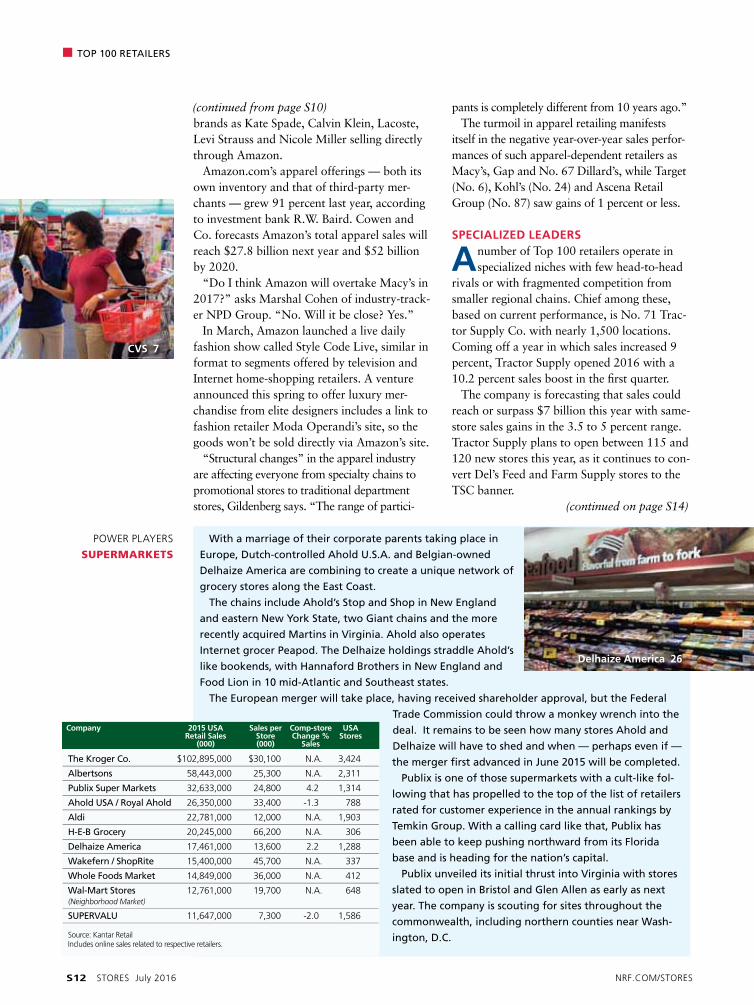
With a marriage of their corporate parents taking place in
europe, Dutch-controlled ahold U.s.a. and Belgian-owned
Delhaize america are combining to create a unique network of
grocery stores along the east Coast.
the chains include ahold’s stop and shop in New england
and eastern New York state, two Giant chains and the more
recently acquired Martins in Virginia. ahold also operates
internet grocer peapod. the Delhaize holdings straddle ahold’s
like bookends, with Hannaford Brothers in New england and
Food lion in 10 mid-atlantic and southeast states.
the european merger will take place, having received shareholder approval, but the Federal
trade Commission could throw a monkey wrench into the
deal. it remains to be seen how many stores ahold and
Delhaize will have to shed and when — perhaps even if —
the merger first advanced in June 2015 will be completed.
publix is one of those supermarkets with a cult-like fol-
lowing that has propelled to the top of the list of retailers
rated for customer experience in the annual rankings by
temkin Group. With a calling card like that, publix has
been able to keep pushing northward from its Florida
base and is heading for the nation’s capital.
publix unveiled its initial thrust into Virginia with stores
slated to open in Bristol and Glen allen as early as next
year. the company is scouting for sites throughout the
commonwealth, including northern counties near Wash-
ington, D.C.
PoWer PLAyers
supermarkets
CVS 7
delhaize america 26
the Kroger Co. $102,895,000 $30,100 n.A. 3,424
albertsons 58,443,000 25,300 n.A. 2,311
publix super Markets 32,633,000 24,800 4.2 1,314
ahold Usa / royal ahold 26,350,000 33,400 -1.3 788
aldi 22,781,000 12,000 n.A. 1,903
H-e-B Grocery 20,245,000 66,200 n.A. 306
Delhaize america 17,461,000 13,600 2.2 1,288
Wakefern / shoprite 15,400,000 45,700 n.A. 337
Whole Foods Market 14,849,000 36,000 n.A. 412
Wal-Mart stores 12,761,000 19,700 n.A. 648 (neighborhood market)
sUperValU 11,647,000 7,300 -2.0 1,586
source: Kantar retailIncludes online sales related to respective retailers.
Company 2015 USa Sales per Comp-store USa Retail Sales Store Change % Stores (000) (000) Sales
(continued on page S14)
(continued from page S10)

2016 top 1oo retailers
n.A. not available or not applicablenotes on methodology:UsA = 50 states and District of columbia. sales in Puerto rico, the U.s. Virgin Islands and Guam have been estimated and removed if reported as part of the U.s. business segment for that company.All retail sales estimates exclude wholesale and non-retail services (not sold at stores) but include online retail sales.fuel sales are included, except where revenues of fuel exceed 50% of average store revenues; in this case sales are reported exclusive of fuel sales.All figures are estimates based on Kantar retail research and company reports.
76 Burlington Coat Factory Burlington, n.J. $5,036,000 5.8% $5,099,000 99% 555 5%
77 Jack in the Box san Diego 5,030,000 5.2 5,030,000 100 2,910 1
78 neiman Marcus Dallas 4,972,000 2.8 5,095,000 98 91 5
79 Signet Jewelers Akron, ohio 4,964,000 -5.5 5,947,000 83 2,909 1
80 Panera Bread Company st. Louis, mo. 4,959,000 6.4 4,959,000 100 1,972 5
81 Speedway enon, ohio 4,879,000 8.5 4,879,000 100 2,766 1
82 domino’s Pizza Ann Arbor, mich. 4,810,000 16.9 9,901,000 49 5,200 3
83 Ikea north america Svcs. conshohocken, Pa. 4,759,000 5.7 41,432,000 11 41 2
84 defense Commiss. agency fort Lee, Va. 4,758,000 -2.7 4,758,000 100 177 -1
85 Williams-Sonoma san francisco 4,757,000 5.2 4,913,000 97 589 2
86 ascena Retail group suffern, n.y. 4,721,000 0.0 4,843,000 97 3,820 0
87 Save Mart Supermarkets modesto, calif. 4,719,000 0.7 4,719,000 100 227 1
88 academy Ltd. Katy, texas 4,513,000 16.9 4,513,000 100 209 10
89 true Value Co. chicago 4,500,000 3.2 4,618,000 97 4,466 0
90 Michaels Stores Irving, texas 4,479,000 4.7 4,919,000 91 1,186 1
91 Chipotle Mexican grill Denver 4,450,000 9.4 4,501,000 99 1,987 13
92 Exxon Mobil Corp. Irving, texas 4,371,000 2.7 11,108,000 39 3,356 -1
93 Sonic oklahoma city, okla. 4,367,000 8.3 4,367,000 100 3,526 0
94 Shell oil Company Houston 4,313,000 1.4 6,651,000 65 4,667 -1
95 Belk charlotte, n.c. 4,175,000 1.6 4,175,000 100 296 0
96 advance auto Parts roanoke, Va. 4,116,000 -2.1 4,144,000 99 4,257 5
97 Barnes & noble new york 4,035,000 -31.4 4,035,000 100 638 -53
98 Roundy’s Supermarkets milwaukee, Wis. 4,007,000 4.0 4,007,000 100 151 2
99 Stater Bros. holdings san Bernardino, calif. 3,971,000 1.6 3,971,000 100 167 0
100 h&M new york 3,938,000 47.5 28,492,000 14 415 17
Rank Company headquarters/ 2015 USa Sales Worldwide USa % 2015 growth U.S. headquarters Retail Sales growth Retail Sales Worldwide Stores (’15 v ’14) (000) (’15 v ’14) (000) Sales
nrf.com/stores stores July 2016 S13
sponsored by

n top 100 retailers
S14 stores July 2016 nrf.com/stores
Longtime Top 100 stalwart PetSmart is a strong player in a segment driven, in part, by a rising demand for senior, weight manage-ment and special needs pet products, which approached $4 billion last year, according to Packaged Facts.
There was not much change at the top of the chart, with the first seven retailers holding the same positions they did in 2015. Lowe’s dropped two places to 10th, with Amazon moving up a notch to eighth and Albertsons — bulked up with supermarket acquisitions — vaulting into the No. 9 slot.
Aldi, the German-owned limited assortment grocer, jumped from No. 36 last year to No. 19, bumping Texas-based grocer H.E. Butt out of the top 20.
Among the changes to this year’s rankings is listing non-U.S.-based retailers by their home country headquarters locations, though rankings continue to be based on U.S. sales. Because some companies make leap-year ac-counting adjustments, some fiscal years include a 53rd week of sales. Kantar’s numbers reflect
the figures used by companies in their regula-tory filings.
There has also been some tweaking of the Power Player groups, with pure-play e-com-merce merchants now listed with the bricks-and-mortar retailers that have similar mer-chandise offerings. Amazon, with its broadline assortments, is listed with mass merchants, warehouse clubs and supercenter operators; Overstock.com joins home goods retailers. To qualify for the power player rankings, a re-tailer must have merchandise sales equal to or greater than 10 percent of the category leader.
As a congregation, this year’s group of power players generated sales of more than $1.9 tril-lion while operating 306,011 physical stores. Of those bricks-and-mortar retailers, the high-est sales per store were generated by the mass merchant-warehouse club-supercenter group, followed in order by supermarkets, department stores and the hardware/home improvement group.
david P. Schulz has been writing for StoRES since 1982
and is the author of several non-fiction books.
(continued from page S12)
premature or not, it seems the obituaries for players in this segment are dusted off with every
quarterly earnings report: off-price retailers and superstores, combined with online and mail-
order shopping, are knocking the stuffing out of department stores.
to be sure, first-quarter results weren’t rosy: JCpenney’s sales were down 0.4 percent, Nord-
strom’s were off 1.7 percent, followed by Kohl’s (-3.9 percent), Macy’s (-5.6 percent)
and sears Holdings (-8.3 percent). But these venerated industry stalwarts aren’t ready
to fold the tent and steal away silently.
“We are absolutely not pulling back our commitment to digital and omnichannel
retailing. Mobile remains a very high priority and we continue to invest,” Macy’s CFo
Karen Hoguet said to investors and analysts recently.
“We are continuing to see double-digit year-over-year sales increases in online sales.
While we have already somewhat downsized our fleet of stores, we continue to see
value and opportunity in physical locations that sync with desktops, websites, apps and
mobile in giving customers choices and meeting demand in new and different ways.”
one strategy is to offer merchandise not readily available
anywhere else. “one of the things we’re all focusing on is
having more exclusive merchandise that you could only get at
Macy’s and you can’t price-compare easily,” Hoguet said, “but
also giving the customer just a better experience so that she’s
more likely to come in and buy from us at regular price.”
While Macy’s wasn’t very optimistic about the outlook for its
department stores through the end of this year, the company
did say it was going to try to offset that by accelerating the
expansion of its Backstage off-price stores. Fitch ratings views
Macy’s as well-positioned in the mid-tier department store
space as it continues to benefit from the My Macy’s localiza-
tion initiative, omnichannel and other growth strategies.
PoWer PLAyers
department
stores
15
Macy’s $26,755,000 $33,800 -2.5% 791
Kohl’s 19,204,000 16,500 0.7 1,164
Nordstrom 13,972,000 44,800 2.7 312
sears Holdings 12,619,000 18,100 -9.2 696
J.C. penney Co. 12,548,000 12,400 4.5 1,014
Dillard’s 6,389,000 21,500 -2.0 297
Hudson’s Bay / saks Fifth ave. 6,293,000 35,400 n.A. 178
Neiman Marcus 4,972,000 54,600 5.3 91
Belk 4,175,000 14,100 n.A. 296
the Bon-ton stores 2,718,000 10,200 -1.3 267
source: Kantar retailIncludes online sales related to respective retailers.
Company 2015 USa Sales per Comp-store USa Retail Sales Store Change % Stores (000) (000) Sales

nrf.com/stores stores July 2016 S15
all-day breakfasts boosted some fast food chains, as did the bundled promotions of the
four-or-five items for $4 or $5 variety. But a fickle public looked elsewhere to satisfy its hunger
once the weather started turning warmer, with customer traffic increases slowing to less than 1
percent, according to some industry trackers.
For the restaurant industry as a whole, year-
to-date comparable sales growth peaked in
February at 3 percent. things aren’t very hot at
pizza joints, either, where deliveries slid from
$11.9 billion in 2004 to $9.7 billion last year,
reports statista.
“Dramatic increases in labor costs have a sig-
nificant effect on the restaurant industry, where
profit margins are pennies on the dollar and
labor makes up about a third of total expenses,”
says andrew puzder, chief executive of CKe res-
taurants. “as a result, restaurants are looking to
reduce costs while maintaining service and food
quality.”
CKe is the corporate parent of the Carl’s Jr.
and Hardee’s chains, where the complex menus
make automation implementation more dif-
ficult, puzder says.
another power player, Chipotle Mexican Grill,
faces an entirely different challenge: winning
back customers and public favor after a series of
food-related illnesses hit the company, which prides itself on fresh and natural ingredients.
“it will take some time to rebuild trust with customers,” co-Ceo steve ells says. there is some
evidence that is already happening: Negative vibes about Chipotle hit their low point in Febru-
ary and are now trending positive, according to YouGov Brandindex, which measures consumer
attitudes toward companies and brands. Wall street analysts anticipate Chipotle’s comparable
sales should turn positive by the fourth quarter.
McDonald’s $35,837,000 $2,500 0.5% 14,259
YUM! Brands 19,363,000 1,100 n.A. 17,392
starbucks 14,124,000 1,100 7.0 12,521
subway 13,901,000 500 n.A. 27,464
Burger King Worldwide 10,342,000 1,300 n.A. 7,776
Wendy’s 8,949,000 1,600 3.3 5,722
Dunkin’ Brands Group 8,206,000 800 1.4 10,934
Dineequity 7,230,000 2,100 n.A. 3,482
Darden restaurants 6,738,000 4,400 n.A. 1,530
Chick-fil-a 6,139,000 3,100 n.A. 1,984
Jack in the Box 5,030,000 1,700 n.A. 2,910
panera Bread Company 4,959,000 2,500 n.A. 1,972
Domino’s pizza 4,810,000 900 n.A. 5,200
Chipotle Mexican Grill 4,450,000 2,200 n.A. 1,987
sonic 4,367,000 1,200 7.3 3,526
Bloomin’ Brands 3,849,000 3,000 0.5 1,283
CKe restaurants 3,713,000 1,200 n.A. 2,991
Brinker international 3,652,000 2,800 n.A. 1,308
source: Kantar retailIncludes online sales related to respective retailers.
Company 2015 USa Sales per Comp-store USa Retail Sales Store Change % Stores (000) (000) Sales
PoWer PLAyers
restaurants
sponsored by