
MyRIAD v1 - tamesoftware.co.uk User manual V1.3.pdf · For each incident type the real-life...
45
MyRIAD v1.3 Motorway Reliability Incidents And Delays User Manual
Transcript of MyRIAD v1 - tamesoftware.co.uk User manual V1.3.pdf · For each incident type the real-life...

MyRIAD v1.3
Motorway Reliability Incidents And Delays
User Manual

Issue and revision record Revision Date Originator Checker Approver Description
A B
22/07/2016 28/07/2016
G Lovett G Lovett
S Sirivadidurage S Sirivadidurage
S Sirivadidurage S Sirivadidurage
Draft Incorporating comments
Information class: Standard
This document is issued for the party which commissioned it and for specific purposes connected with the above-captioned project only. It should not be relied upon by any other party or used for any other purpose.
We accept no responsibility for the consequences of this document being relied upon by any other party, or being used for any other purpose, or containing any error or omission which is due to an error or omission in data supplied to us by other parties.
This document contains confidential information and proprietary intellectual property. It should not be shown to other parties without consent from us and from the party which commissioned it.

MyRIAD User manual V1.3.docx 1
Table of Contents 1. Introduction 2
2. Theory and Applications 4
3. Using MyRIAD for individual Assessment Years 9
4. MyRIAD Results for Individual Assessment Years 20
5. MyRIAD Results for the Appraisal Period 21
6. Enquiries 23
References 24
Appendix A – Incident Parameters 25
Appendix B – Speed-flow Curves and DTDV Curve Parameters 28
Appendix C – Software Specification 31
Appendix D – Network Definition Guidance 38

MyRIAD User manual V1.3.docx 2
1. Introduction
Background
1.1. MyRIAD stands for Motorway Reliability Incidents and Delays. It is a software tool which can
be used to assess the journey time reliability impacts of interventions or schemes affecting
inter-urban motorways.
1.2. Journey time reliability relates to the predictability of travel times. The less variability there is
in journey times between an origin and destination, the more predictable or “reliable” the
journey time becomes – and vice versa. Apart from the voluntary choice of speed available to
the driver, the factors affecting journey time variability are incidents and congestion. MyRIAD
can be used to measure the change in journey time variability arising from interventions which
affect incident rates and/or congestion.
1.3. The Department for Transport (DfT) sets out the requirements for the appraisal of transport
schemes it funds on WebTAG (Web based Transport Analysis Guidance). Unit A1.3 of
WebTAG sets out methodologies for assessing the reliability impacts of transport schemes,
including the monetisation of those impacts as part of a cost benefit analysis of a proposed
scheme.
1.4. Previously, the reliability impacts of inter-urban motorway schemes were quantified and
monetised using DfT’s INCA (INcident Cost benefit Analysis) software. INCA was an Excel
spreadsheet-based application which implemented the methodology set out in WebTAG A1.3
in relation to assessing the reliability impacts of interventions on motorways.
1.5. INCA was improved incrementally over several releases of the software to incorporate the
latest research, to allow for additional effects, and to increase the number of routes and links
in the network. The last version of INCA (v4.2) was released in December 2012.
1.6. The maintenance and development of INCA was passed from the DfT to the then Highways
Agency (HA) from April 2013. The HA has developed MyRIADv1.0 which replaced INCA.
MyRIADv1.3 is developed by Mott MacDonald on behalf of Highways England and should
now be used as part of all relevant Highways England scheme appraisals.
1.7. MyRIAD is essentially a revised and renamed version of INCA. The revisions made have been
primarily aimed at overcoming some of the limitations associated with the previous version of
INCA. In particular, MyRIAD now includes the following improvements:
increases significantly the maximum number of links and routes;

MyRIAD User manual V1.3.docx 3
disaggregates benefits by trip purpose; and
reduces input requirements.
1.8. In all other respects, MyRIAD is essentially the same as INCA and will produce the same
results. MyRIAD will however continue to be developed, particularly with regard to expanding
its applicability to non-motorway standard inter-urban roads.
1.9. An important change to note between INCA and MyRIAD is that the Run MyRIAD macro
(Figure 1) must be run following data input (any subsequent changes to data entry will
require the macro to be re-run).
Figure 1 Run MyRIAD Macro Button
1.10. This User Manual explains the types of interventions to which MyRIAD is applicable, the
WebTAG methodology as implemented in MyRIAD and how to use MyRIAD.
Basic Requirements for Running MyRIAD
1.11. MyRIAD is an Excel 2010 file and can be used on any Windows PC with Excel installed.
1.12. The macro security in Excel should be set to Enable in order to allow all functions of the
spreadsheet (from the from Office Button choose Options->Trust Centre Settings->Macro
Settings). When MyRIAD is opened the user will see a security warning saying that it contains
macros. The user should choose the Enable Macros option otherwise MyRIAD will not work
properly.
1.13. As MyRIAD is an Excel spreadsheet, the user should be aware of potential Excel-specific
problems when editing data. The user is advised to avoid dragging data between cells as it
can corrupt cell references in the MyRIAD calculations. However, copying and pasting of data
can be used in the majority of cases.

MyRIAD User manual V1.3.docx 4
2. Theory and Applications
Travel Time Variability
2.1. Journey times of individual vehicles fluctuate around an average journey time for a particular
time period. This variability in journey times arises primarily from two sources:
(1) Variations in journey time between different time periods and days, caused by
different traffic conditions, known and anticipated factors such as long term road-
works; and
(2) Variations of travel time at a specific time of day caused by unexpected traffic
congestion and unforeseen incidents which reduce capacity, such as weather
conditions, accidents and breakdowns.
2.2. Variations in travel time under (1) are predictable and feed into average travel time
assessment frameworks such as COBA (COst Benefit Analysis) and TUBA (Transport User
Benefit Appraisal). Variations in travel time as classified under (2) are unpredictable for
individual journeys, although their mean and distributions can be predicted. They are not
measured in COBA or TUBA economic evaluation, and are the subject of the variability
appraisal.
2.3. A journey departing at a particular time and day is considered as having a mean journey time,
its variability is then represented by a distribution of times about the mean. This distribution
can be characterised by one or more parameters. As discussed in WebTAG A1.3, the
preferred measure of variability is the standard deviation of travel times around this mean.
2.4. In the UK, the standard deviation of travel time is used to measure changes in travel time
variability. The standard deviation is a measure of how actual travel times (at the same time
of day and the same day of the week) are distributed around the average, with increasing
standard deviation associated with increasing variability.
n
k
knxx
1
212
where is the standard deviation of travel time
kx is the kth observed travel time
x is the mean travel time
n is the number of travel time measurements

MyRIAD User manual V1.3.docx 5
2.5. The calculation of Travel Time Variability (TTV) at journey level involves all variability
components affecting a journey. These are:
Incident variability on all links
Day-to-day variability on all links, i.e. variability not caused by incidents but by
fluctuations in demand, weather, etc.
2.6. For each incident type the real-life build-up periods and numbers of lanes closed are
distributed around the mean values. In order to calculate TTV, the standard deviation of travel
time for whole journeys is established by:
(a) Calculating the variance of travel time for a typical single incident of each type for each
individual link for each flow group; and multiplying this by the appropriate probability;
(b) Calculating the variance caused by day to day variability for each link and flow group, as
a function of average travel time;
(c) Calculating from (a) and (b) the variance, and hence the standard deviation, of travel
times for all routes through the network (as defined by the user).
2.7. Variances may be summed over a series of links and incident types, assuming the probability
of incidents on one link/type is independent of the probability on other links/types. Standard
deviations may not be summed in that way.
Variability over journeys
2.8. A link improvement which reduces journey time variability is more beneficial the shorter the
journey, and is therefore valued higher. This is because any reduction in variability on the
scheme link would be a higher proportion of the variability across the entire journey for shorter
trips. Separate travellers on the same scheme link will therefore experience different levels of
variability benefits from the same improvement.
222s
l
l
Where 2 is the variance of the entire journey
2l is the variance on non-scheme links
2s is the variance on the scheme link
2.9. The benefits of reductions in variability on scheme links are, therefore, dependent on the
variability on non-scheme links. Reliability calculations require a representation of entire
journeys. This is achieved by modelling feeder links which represent that part of the journey
not taking place on scheme links.

MyRIAD User manual V1.3.docx 6
2.10. To calculate total cost TTV (in time units) the standard deviations for each route are multiplied
by the route flow. The route flow is one of the user-defined inputs to MyRIAD. It will be reduced
for any flow groups where link flows exceed 95% of capacity.
2.11. Further details of the TTV calculations can be found in Appendix B.
Monetising changes in variability
2.12. For the purposes of economic appraisal, it is necessary to apply a monetary value to the
standard deviation of travel time. Using the “reliability ratio” it is possible to relate the value of
one minute of standard deviation to one minute of average travel time (where the latter is
defined by the values of time given in WebTAG data book). For car travel the reliability ratio
is 0.4, meaning that one minute of standard deviation has the same value as 0.4 minutes of
average travel time. A higher ratio of 0.6 is used for goods vehicle reliability:
Value of Standard Deviation of Travel Time = Reliability Ratio x Value of Average Travel Time
2.13. The difference between the TTV costs in the Do Minimum (DM) and the Do Something (DS)
produces the TTV benefits.
Incident Delay
2.14. The incident delay methodology is based on deterministic queuing theory which means that
the maximum delay for an incident occurs to a vehicle that passes the incident location when
the incident is just cleared from the motorway/carriageway, and that the average delay for
vehicles passing the incident location is half the maximum delay. This assumes that demand
is constant during the incident.
2.15. However, flows vary by time-of-day and day-of-week. As incident delay is a function of flow it
is necessary to estimate delays for the different flow conditions. To achieve this, flows are
classified into flow groups, and the delays arising from typical incidents are calculated for each
of these flow groups. MyRIAD models five flow groups (AM and PM Peak, Inter-peak, Off-
peak / night-time and weekend).
2.16. To calculate the delays caused by an incident, it is assumed that:
(a) The demand flow is constant for the whole of the build-up and queue decline periods;
(b) The incident delays are measured relative to the time at which a vehicle would have
passed the incident location;
(c) The modelled incident delay per vehicle should not exceed a locally determined maximum;
(d) Incidents have no effect beyond the end of the link.

MyRIAD User manual V1.3.docx 7
2.17. These assumptions are likely to have more effect for incidents which cause long delays. To
limit the effect of assumption (a), demand flow is split into flow groups as already indicated.
2.18. Where they represent relatively short time periods, longer incidents could spill over into an
adjacent flow group. Fortunately, for all but the busiest flow groups, spill-over effects between
flow groups are likely to have no net effect on the likelihood of any individual vehicle within
each flow group being affected by an incident. MyRIAD does not implement a proper spill-
over mechanism. To compensate for this all link flows are capped at 95% of capacity to ensure
that queues do not grow indefinitely.
2.19. Incident delay in MyRIAD is calculated according to the relationships given in Appendix B.
The calculation is over all links, all flow groups, and all incident types. The difference between
DM and DS gives the value of the delay benefits from the scheme. This is converted to
monetary values by application of WebTAG values of time.
2.20. Further details of the delay calculations can be found in Appendix B.
The effect of diversion on delays
2.21. The delays which occur on road sections are dependent on the proportion of traffic diverting
to avoid the incident, which in turn is dependent upon the overall duration of the incident, the
length of the backed up queue and the availability of alternative routes and reliable
information. Thus the total level of this diversion will depend on:
(a) The availability and attractiveness of alternative routes;
(b) The flow on the main carriageway and the proportion of capacity reduction;
(c) The duration of the incident; and
(d) The average or maximum delay per vehicle caused by the incident.
2.22. The diversion mechanism in MyRIAD is that recommended in TRL (2004). The diversion
proportion relationship is given in Appendix B and has been developed from observed data.
2.23. The traffic diverting is capped at 90% of excess demand (i.e. the difference between flow and
incident-reduced capacity).
2.24. Very few drivers will divert until the queue has reached a suitable junction. Therefore, the
diversion rate is likely to build up gradually as queues lengthen and will subsequently be
limited by the capacity of any available diversion route for that or earlier diversion
opportunities. The TRL formula increases the diversion proportions for longer queues and is
intended to represent the net effect of all the diversion opportunities. It is assumed that

MyRIAD User manual V1.3.docx 8
diverted traffic experiences the same delay as the traffic that remains on the main
carriageway.
2.25. The user can specify the maximum diversion proportion. The default is 1.0, to represent the
condition where 100% of traffic will divert if required.
MyRIAD Applications
2.26. There are several types of intervention which can be assessed using MyRIAD. These can
have effects which affect all, or just some, of the different components of reliability. For
instance, a scheme which affects both the number of accidents and level of congestion will
have an impact on all three components of reliability: incident related travel time variability
and incident delays (from the change in accidents) and also day-to-day travel time variability
(from the change in congestion). Interventions in this category include conventional widening
and managed motorway. There are other interventions which will affect only one or two of the
components of reliability such as Motorway Incident Detection and Automatic Signalling
(MIDAS), Controlled Motorway and Closed-circuit television (CCTV).
2.27. Table 1 below lists the types of interventions which can be appraised using MyRIAD, together
with the typical effects of those schemes that give rise to reliability impacts and the
components of reliability that are affected by each.
Type of Intervention Typical Effects Reliability Impact of Typical Effect
1.14. Comprehensive CCTV 1.15. Reduce incident durations 1.16. Reduce incident delays and variability
1.17. MIDAS 1.18. Reduce accidents 1.19. Reduce incident delays and variability
1.20. Controlled Motorway 1.21. Reduce Accidents 1.22. Reduce flow breakdown
1.23. Reduce incident delays and variability 1.24. Reduce day-to-day variability
1.25. Managed Motorway (All Lane Running - ALR) (incorporating Controlled Motorway)
1.26. Permanent Loss of Hard Shoulder (HS)
1.27. Reduce flow breakdown 1.28. Increase Capacity
1.29. Increase incident delays and variability Reduce day-to-day variability
1.30. Reduce day-to-day variability
1.31. Motorway Widening 1.32. (incorporating Controlled
Motorway)
1.33. Reduce Accidents Reduce flow breakdown
1.34. Increase Capacity
1.35. Reduce incident delays and variability Reduce day-to-day variability
1.36. Reduce day-to-day variability
Table 1 MyRIAD Applications
2.28. The HA uses Interim Advice Notes (IANs) to publish urgent supplementary appraisal guidance
on certain subjects. IAN 160 deals with the appraisal of technology schemes and should be
referred to when assessing CCTV, MIDAS and Controlled Motorway schemes. In particular,
IAN 160 describes the magnitude of the typical effects of CCTV, MIDAS and Controlled
Motorway which give rise to reliability impacts, including different combinations of the three
types of scheme. It also describes how to assess reliability impacts using MyRIAD.

MyRIAD User manual V1.3.docx 9
2.29. IAN 164 is the equivalent document to IAN 160 for MM-ALR. At present, this document refers
the reader to the Highways England’s TAME Group for advice in relation to using MyRIAD for
assessing the reliability impacts described in Table 1. Users of MyRIAD assessing these types
of scheme should therefore contact the TAME Group before proceeding with an assessment
of MM-ALR.
3. Using MyRIAD for individual Assessment Years
3.1. MyRIAD will model the reliability impacts of a proposed intervention for individual assessment
years falling within a scheme’s appraisal period eg opening year and 15 years after opening.
This allows changes in traffic flows during the appraisal period to be accounted for ie traffic
growth. MyRIAD requires a minimum of two assessment years, but can accommodate
appraisals with up to six forecast years.
3.2. Each assessment year requires a single year MyRIAD Main workbook to be completed. The
results produced by the individual single year workbooks will then be combined to give results
for the whole appraisal period by completing the MyRIAD Master workbook (see Chapter 5).
3.3. Five MyRIAD worksheets need to be completed in the single year MyRIAD workbook created
for each assessment year:
Link and Route Information
Flow Groups
Incident Parameters
Values of time
Speed-flow and DTDV Curves.
3.4. Only traffic flows should change between individual assessment years. These are entered
into the Link and Route Information worksheet which should therefore be the only worksheet
which needs to be completed for every assessment year. The remaining four worksheets will
apply to all assessment years, so it should be possible to complete one single year workbook
and copy it for each assessment year, changing only the traffic flows on the Link and Route
Information worksheet for each year.
Link and Route Information Worksheet
3.5. Include assessment year for which a particular MyRIAD run is required
3.6. The following global parameters are required. The protected cells are either not required or
filled in by MyRIAD automatically.

MyRIAD User manual V1.3.docx 10
Maximum Diversion Proportion (represents maximum proportion of traffic that may
divert away from the scheme following an incident)
Directions for Calculation of Benefits (This specifies whether benefits should be
calculated for one direction or for both directions. One-way benefits are half of the two-
way benefits)
Average Delay Threshold (Min) and Average Delay Threshold Factor (the average
delay threshold and threshold factor are used to dampen extreme calculations in delay
calculations. The proportion of delay above the defined threshold is multiplied by the
threshold factor. For example, if the threshold factor is set to zero then delay per
vehicle is restricted to the defined delay threshold. It is recommended that the default
values are not changed)
Heavy Vehicle PCU Factor
3.7. The link information occupies columns A to M of the Link and Route Information worksheet.
Each line represents a single link. The number of links in MyRIAD is only limited by the number
of lines in the spreadsheet. In Excel 2010 this is 1,048,576. Realistically, this is unlikely to be
exceeded.
3.8. The following information is required for each motorway link (a link is defined as the length of
carriageway from the centre of one junction to the centre of an adjacent junction) in the
network:
Link Name
Link Type (0 = Feeder, 1 = Network)
Length (km)
AADT – Assessment year two-way AADT
%HGVs (OGV1 + OGV2) for peak- and non-peak time periods
Proportion of traffic generated (Generated traffic is the additional traffic flow on the link
in the DS compared with the DM and includes reassigned and additional traffic
predicted by the variable demand model. It is relevant for schemes that increase the
capacity of the link eg widening or managed motorway. The generated traffic is entered
as a proportion of the total DM flow. Generated traffic should only be input for scheme
links.)
Capacity per lane
Road type in DM and DS (Table 2)

MyRIAD User manual V1.3.docx 11
Number Link Type
1 D2M Without MIDAS, Without CCTV, Without VMS
2 D3M Without MIDAS, Without CCTV, Without VMS
3 D4M Without MIDAS, Without CCTV, Without VMS
4 D2M Without MIDAS, Without CCTV, With VMS
5 D3M Without MIDAS, Without CCTV, With VMS
6 D4M Without MIDAS, Without CCTV, With VMS
7 D2M Without MIDAS, With CCTV, Without VMS
8 D3M Without MIDAS, With CCTV, Without VMS
9 D4M Without MIDAS, With CCTV, Without VMS
10 D2M Without MIDAS, With CCTV, With VMS
11 D3M Without MIDAS, With CCTV, With VMS
12 D4M Without MIDAS, With CCTV, With VMS
13 D2M With MIDAS, Without CCTV, With VMS
14 D3M With MIDAS, Without CCTV, With VMS
15 D4M With MIDAS, Without CCTV, With VMS
16 D2M With MIDAS, With CCTV, With VMS
17 D3M With MIDAS, With CCTV, With VMS
18 D4M With MIDAS, With CCTV, With VMS
19 D3CM With MIDAS, With CCTV, With VMS
20 D4CM With MIDAS, With CCTV, With VMS
21 MM3-ALR With MIDAS, With CCTV, With VMS
22 MM4-ALR With MIDAS, With CCTV, With VMS
23 D2AP, Without MIDAS, Without CCTV, Without VMS
24 D2AP, With MIDAS, Without CCTV, With VMS
25 D2AP, With MIDAS, With CCTV, With VMS
26 D3AP, Without MIDAS, Without CCTV, Without VMS
27 D3AP, With MIDAS, Without CCTV, With VMS
28 D3AP, With MIDAS, With CCTV, With VMS
Table 2 MyRIAD Road Types
3.9. Network links refer to all real links in the network not identified as feeder links. Feeder links
represent notional composite links (in length or capacity) which connect to the network links
and are used to represent the journey lengths of trips which feed into the network links. Each
feeder link represents a different journey length so that the different journey lengths of vehicles
using the network links are fully represented. Further advice in relation to the construction of
a MyRIAD network is contained in Appendix D. Network links and feeder links are treated the
same way for the purposes of calculating delays and travel time variability.

MyRIAD User manual V1.3.docx 12
Table 3 MyRIAD Link Data Inputs
3.10. For motorway schemes that increase capacity, traffic flows will be forecast flows from a traffic
model for each assessment year. Further guidance on network structure and extracting traffic
matrices from traffic models is presented in Appendix D.
3.11. For CCTV, MIDAS and Controlled Motorway where models are not used, traffic flows will be
observed flows factored to assessment year flows using simple growth factors (see IAN 160).
3.12. Route information is input immediately after the link table (from Column N onwards). Route
flows (the number of vehicles traversing the entire route) are specified in Row 16 above each
route. These are input as AADT. Route names are specified in Row 17 of the Link and Route
Information spreadsheet. The links used by each route are then identified by a ‘1’ in the cell
located in the route column and the link’s row. Currently, MyRIAD is limited by the number of
columns in Excel; up to 243 routes can be specified when using Excel 2003 and up to 16,371
routes in Excel 2007 onwards (however this is set to 500 routes in this version to overcome
possible instability issues). Information on how to construct MyRIAD networks and specify
routes is contained in Appendix D.
Table 4 MyRIAD Route Data Inputs

MyRIAD User manual V1.3.docx 13
Flow Groups Worksheet
3.13. Reliability impacts will vary throughout the day depending upon the level of traffic flow. The
level of daily traffic flow will also vary between weekdays and weekends. It is therefore
necessary to use flow groups which combine hours of the year with similar traffic flows. Up to
five flow groups can be specified in MyRIAD (these can be used to represent AM peak, PM
peak, Inter-peak, Off-peak / Night-time, Weekend). The number of hours per year in each
Flow Group is required as well as a Flow Group factor [Flow Group Average Hourly Flow /
AADT]. This value is applied to the link AADT to calculate hourly flows for each flow group.
3.14. Local flow group factors should be input and used in preference to the default values. Default
factors should only be used where local count data suggests a similar profile to the default
values. MyRIAD results can be sensitive to flow profiles and so every effort should be made
to calculate local flow group factors. Where local values are used, annual hours should add
up to 8760 and the number of days to 365 unless the scheme is only operational part of the
time.
3.15. The flow-group specific generated traffic multiplier is multiplied by the link-specific proportion
of generated traffic defined in the Link and Route Information worksheet. A value of 0 implies
no generated traffic, regardless of the proportion of traffic generated in the link data. The
default value of 1 implies full application of the link specific values in the affected flow group(s).
The multiplier enables MyRIAD to identify the volume of generated traffic in each flow group.
Table 5 MyRIAD Flow Group Factors Worksheet

MyRIAD User manual V1.3.docx 14
Incident Parameters Worksheet
3.16. An incident is defined as any event that causes a temporary blockage of the running lanes,
and therefore a reduction in capacity: those incidents confined to the hard shoulder do not
affect traffic and are not relevant to the reliability assessment. Within MyRIAD, twelve different
types of incident are considered:
1 Single Lane Accident
2 Multi Lane Accident
3 Non-HGV Breakdown
4 HGV Breakdown
5 Minor Debris
6 Non-Fire HGV
7 HGV Fire
8 Load Shedding
9 Spillage
10 Single Lane Emergency Roadworks
11 Multi Lane Emergency Roadworks
12 Animal
Table 6 MyRIAD Incident Types
3.17. MyRIAD uses the road-type specified in the Link and Route Information worksheet to
automatically assign default incident parameters to each link. The parameters are listed in
column A of the worksheet and include, inter alia, the rate of occurrence of each of the
twelve incident types per million veh/km.
Table 7 MyRIAD Incident Parameters worksheet

MyRIAD User manual V1.3.docx 15
3.18. Appendix A lists the default incident parameters provided on the worksheet for the following
road types: D2M, D3M, D4M (with and without MIDAS / CCTV), D3CM, D4CM, MM-ALR,
D3AP and D2AP.
DMDS Accident Factors
3.19. The accident incident rates used in the DS scenario are not the same as those specified in
Table 7. The DS accident incident rates are calculated by applying the appropriate IAN 160
reduction factor to the DM accident incident rates, shown in the DMDS Accident Factors sheet.
3.20. DM-DS accident factors have been specified for all possible DM-DS scenarios. However,
some of these scenarios make no sense, such as removing technology or removing lanes. In
such circumstances these factors have been included for the purpose of having a complete
matrix only.
3.21. Some factors have been set as 1 as the accident reduction factors are not known for those
scenarios. As a result, the accident rates in the DS will be the same as those used in the DM.
This is the case for all-purpose to motorway scenarios, as well as D2AP-D3AP.
3.22. The accident factors for ALR link types must be obtained from TAME, and entered into the
appropriate cells in link type columns 21 and 22 of the matrix.
Table 8 MyRIAD DMDS Accident Factors worksheet

MyRIAD User manual V1.3.docx 16
Values of Time Worksheet
3.23. This worksheet calculates a local value of travel time and travel time variability for use in the
monetisation of the reliability and delay impacts. An average value per vehicle is calculated
for each flow group which takes account of the different values of time of different vehicle
types and the composition of vehicle types on the network for the flow group. The vehicle
types considered are working cars (business), non-working cars (non-business), LGV, OGV
and PSV.
3.24. Table E1 contains default parameters for splitting heavy vehicles into OGV/PSV and light
vehicles into cars/LGV. These are applied to the proportions of light and heavy vehicles using
the network in each flow group to obtain the network wide proportions of four vehicle types in
each flow group (cars, LGV, OGV and PSV). The proportion of cars is then split into working
and non-working cars by applying the TUBA working time proportions.
3.25. The heavy / light vehicle splits are national averages and should only be changed if there are
significantly different values available for the MyRIAD network. It should also be noted that
the proportions of light and heavy vehicles using the network in each flow group is derived
from the heavy vehicle proportions entered on the Link and Route Information worksheet.
3.26. Table E2 contains the default values of time for the five vehicle types in 2010 market prices
and values from the forthcoming 2016 Summer WebTAG data book. There should be no need
to change these values.
3.27. Average values of time are obtained by multiplying the values of time for each vehicle type by
the corresponding proportion of that vehicle type on the network in Table E3. Summing the
results across all vehicle types gives the average value of time per vehicle in each flow group
as shown on the bottom row of Table E4.
3.28. The values in Table E5 of the worksheet are equal to the values in Table E4 multiplied by the
reliability ratio of 0.4 for non-goods vehicles and 0.6 for goods vehicles. Summing the results
across all vehicle types gives the average value of travel time variability per vehicle in each
flow group as shown on the bottom row of Table E5.

MyRIAD User manual V1.3.docx 17
Table 9 MyRIAD Values of Time worksheet
Speed Flow and DTDV Worksheet
3.29. Managed motorway and widening schemes will increase the capacity of the carriageway. This
will change average speeds and journey times which will in turn have an impact on the day-
to-day variability component of reliability. The purpose of this worksheet is to define the
variables which will be used by MyRIAD to calculate the impact. For some interventions which
do not increase capacity (CCTV and MIDAS), MyRIAD will not predict any change in day-to-
day variability (DTDV). However MyRIAD will predict DTDV benefits for Controlled Motorways
even if it doesn’t increase capacity since DTDV coefficients are different between normal and
Controlled Motorways.
Speed Flow Curve
3.30. The speed-flow curve is used to determine the average speed on a link with the flows provided
on the Link and Route Information Sheet. This information is required to enable application of
the DTDV curve to estimate day-to day variability.
3.31. The shape of the speed-flow curves is fully compatible with COBA speed-flow curves and
take the form shown in Figure 2:

MyRIAD User manual V1.3.docx 18
Figure 2 Indicative speed-flow curve used by MyRIAD
3.32. The curve is piece-wise linear, with up to five breakpoints. Beyond the last breakpoint the
speed flow curve is extrapolated from the last and penultimate breakpoints until it reaches the
minimum allowed speed. The same speed-flow curve applies to all vehicles on the link.
However, a maximum allowed speed for heavy vehicles is defined. If the speed calculated
using the curve exceeds this value, then the heavy vehicle speed is set to the maximum
allowed.
3.33. The following data must be defined for each road type:
Road type name, note that there is a direct correspondence between these road
names and those defined in Table 2 hence Road Type labels should not be changed.
Free flow speed for light vehicles in km/h (V0)
First breakpoint: flow in vehs/hr and speed in km/h (Q1,V1)
Minimum speed in km/h (Vmin)
Maximum speed for heavy vehicles in km/h
Up to four additional breakpoints may be defined [(Q2,V2) to (Q5,V5)].
Note that flows in this worksheet are defined as one-way vehs/hr and not vehs/lane/hr.
3.34. Default curves are provided in Appendix A for D4M, D3M, D2M, D3AP and D2AP. The D4M
curve should be used for MM4-ALR and D4CM, and the D3M curve should be used for MM3-
ALR and D3CM.
3.35. Note that the speed flow curve is used only in the calculation of journey time per km for input
to the DTDV function. It has no other uses. In particular, it is not used to calculate benefits
Flow (vehs/hr)
Speed (km/h)
Vmin
V0
Q1,V
1 Q2,V
2 Q3,V
3
Q4,V
4
Q5,V
5

MyRIAD User manual V1.3.docx 19
due to changes in average travel times – these are Transport Economic Efficiency impacts
which are subject to separate assessment.
Day-to-day Variability Curves
3.36. The DTDV coefficients are used in a function of the following form:
Standard deviation of journey time (in seconds per km) = a + bx + cx2 + dx3
where x is the mean journey time per km, as calculated from the speed-flow curve.
3.37. Default values for the coefficients are provided in Table 10 (more information can be found in
Appendix B) for D4M, D4CM, D3M, D2M, D3AP and D2AP. The coefficients are from DTDV
Analysis, Mott MacDonald 2016. D3CM links use the D3M DTDV curve. It should be noted
that road types in this table are not disaggregated into whether or not there is MIDAS or CCTV
because this technology makes no difference to the speed-flow or DTDV coefficients.
Table 10 MyRIAD Speed-flow and DTDV Curves worksheet

MyRIAD User manual V1.3.docx 20
4. MyRIAD Results for Individual Assessment Years
4.1. The results of the reliability assessment for the assessment year are contained in the Model
Year Results worksheet. The results include the total reliability benefit for the assessment
year and for each of its two components (travel time variability and incident delays). There are
also further tables which show:
Incident Delay and TTV benefits by flow group
Incident Delay benefits by type of incident
Incident Delay and TTV benefits by trip purpose (Business and Commuting/Other)
Incident delays by type of incident for DM and DS
4.2. TTV benefits include benefits from both incident related and day-to-day variability. However,
because of the non-linearities in the calculations, it is not possible to unambiguously split the
total variability benefits between each incident type and DTDV so only total variability benefits
are shown.
4.3. All monetary values in the results worksheet are presented without application of discounting
or value of time growth. This is carried out in the “MyRIAD Master” workbook that calculates
benefits over the whole appraisal period.
4.4. MyRIAD individual assessment year spreadsheets also contain graphs containing total
benefits by flow group and delay benefits by incident type.
Table 11 Single Year Results Worksheet

MyRIAD User manual V1.3.docx 21
5. MyRIAD Results for the Appraisal Period
5.1. To obtain results for the whole appraisal period, the user should complete the MyRIAD Master
workbook to combine the results for individual assessment years. Between two and six
forecast years can be combined in the Master workbook.
5.2. Although most Highways England road schemes are assessed over 60 years, some schemes,
namely CCTV, MIDAS and Controlled Motorway, are assessed over 30 years. MyRIAD allows
the user to specify the length of the appraisal period in the Master workbook between 30 and
60 years.
5.3. Results from the single year MyRIAD workbooks are interpolated to obtain results for the years
in between assessment years and extrapolated for the years beyond the last assessment year
to cover the specified appraisal period. The results for each year are then discounted and
added together to provide results for the full appraisal period in 2010 market prices,
discounted to 2010.
5.4. The following information is required in the MyRIAD Master workbook:
Scenario name
Appraisal period (30 to 60 years)
Current year – this is the year when the appraisal is being carried out
Location of MyRIAD individual assessment year workbooks – these are input by double
clicking in the appropriate cell and locating the file in the ‘Save As’ box. The assessment
year also needs to be specified.
From these inputs, the MyRIAD Master workbook calculates total benefits which represent
the sum of Incident Delay and TTV benefits for the specified appraisal period in 2010 market
prices, discounted to 2010. It is worth reiterating that incident delay time saving benefits have
the same values of time (VOT) as other travel time savings. Growth in the value of time is also
applied in the same manner as for other travel time savings.
The MyRIAD Master workbook also contains a summary of benefits with tables showing:
Incident Delay and TTV benefits by flow group
Incident Delay by type of incident
Incident Delay and TTV benefits by trip purpose (Business and Commuting/Other)

MyRIAD User manual V1.3.docx 22
Incident Delay and TTV benefits by flow group in each assessment year
Table 12 MyRIAD Master Outputs
5.5. It should be noted that, according to WebTAG, monetised reliability impacts are not to be
included in the Analysis of Monetised Costs and Benefits table which is used to calculate a
scheme’s Benefit-Cost Ratio (BCR). They should however be included in the Appraisal
Summary Table disaggregated between business and commuter / other users.

MyRIAD User manual V1.3.docx 23
6. Enquiries
6.1. If you have any questions or comments, find that something is not working the way it should,
or require additional functionality, please contact:

MyRIAD User manual V1.3.docx 24
References
INCA Manual Version 1.1 (DTLR / Mott MacDonald, 2002)
Published Research Report 030 Updating and validating parameters for incident appraisal
model INCA (TRL, 2004)
DTDV Analysis (Mott MacDonald, 2016)
MyRIAD Incident Parameter Estimation (Mott MacDonald, 2016)
INCA User Manual Version 4.1 (DfT / Mott MacDonald, 2009)
INCA Software Version 4.1 (DfT / Mott MacDonald, 2009)
Transport Analysis Guidance: WebTAG https://www.gov.uk/guidance/transport-analysis-
guidance-webtag
MyRIAD User manual V1.3.docx 25
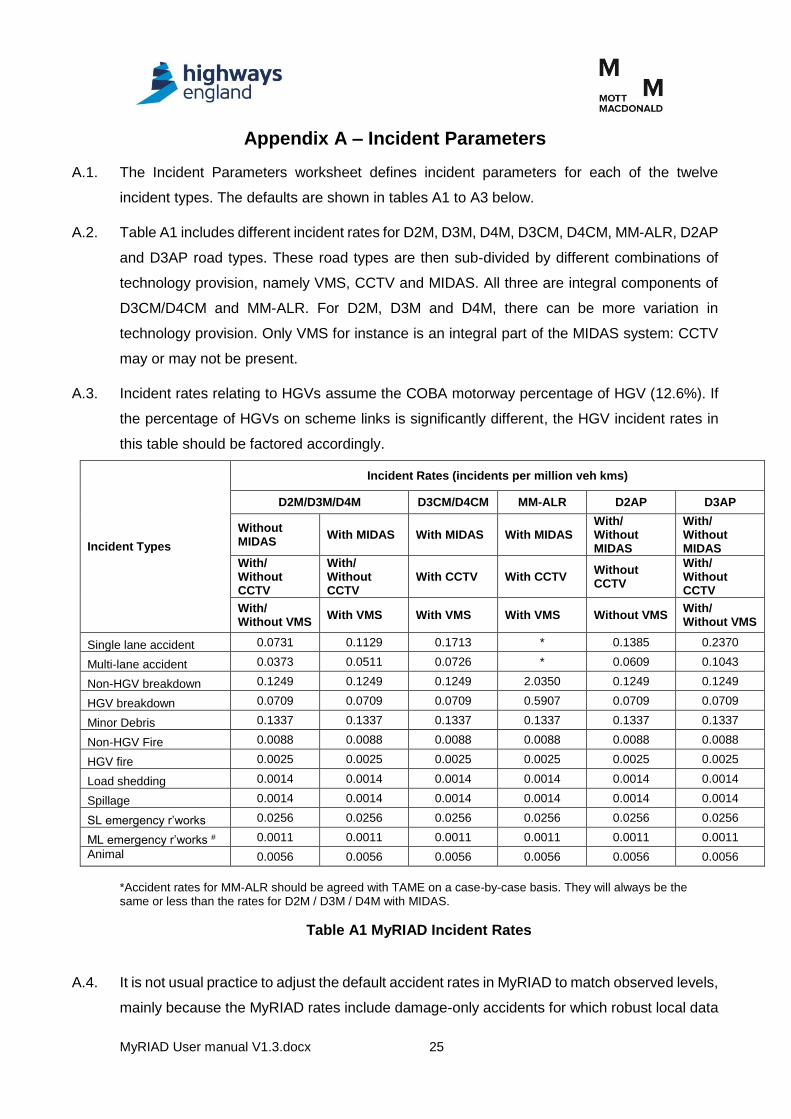
Appendix A – Incident Parameters
A.1. The Incident Parameters worksheet defines incident parameters for each of the twelve
incident types. The defaults are shown in tables A1 to A3 below.
A.2. Table A1 includes different incident rates for D2M, D3M, D4M, D3CM, D4CM, MM-ALR, D2AP
and D3AP road types. These road types are then sub-divided by different combinations of
technology provision, namely VMS, CCTV and MIDAS. All three are integral components of
D3CM/D4CM and MM-ALR. For D2M, D3M and D4M, there can be more variation in
technology provision. Only VMS for instance is an integral part of the MIDAS system: CCTV
may or may not be present.
A.3. Incident rates relating to HGVs assume the COBA motorway percentage of HGV (12.6%). If
the percentage of HGVs on scheme links is significantly different, the HGV incident rates in
this table should be factored accordingly.
Incident Types
Incident Rates (incidents per million veh kms)
D2M/D3M/D4M D3CM/D4CM MM-ALR D2AP D3AP
Without MIDAS
With MIDAS With MIDAS With MIDAS With/ Without MIDAS
With/ Without MIDAS
With/ Without CCTV
With/ Without CCTV
With CCTV With CCTV Without CCTV
With/ Without CCTV
With/ Without VMS
With VMS With VMS With VMS Without VMS With/ Without VMS
Single lane accident 0.0731 0.1129 0.1713 * 0.1385 0.2370
Multi-lane accident 0.0373 0.0511 0.0726 * 0.0609 0.1043
Non-HGV breakdown 0.1249 0.1249 0.1249 2.0350 0.1249 0.1249
HGV breakdown 0.0709 0.0709 0.0709 0.5907 0.0709 0.0709
Minor Debris 0.1337 0.1337 0.1337 0.1337 0.1337 0.1337
Non-HGV Fire 0.0088 0.0088 0.0088 0.0088 0.0088 0.0088
HGV fire 0.0025 0.0025 0.0025 0.0025 0.0025 0.0025
Load shedding 0.0014 0.0014 0.0014 0.0014 0.0014 0.0014
Spillage 0.0014 0.0014 0.0014 0.0014 0.0014 0.0014
SL emergency r’works 0.0256 0.0256 0.0256 0.0256 0.0256 0.0256
ML emergency r’works # 0.0011 0.0011 0.0011 0.0011 0.0011 0.0011
Animal 0.0056 0.0056 0.0056 0.0056 0.0056 0.0056
*Accident rates for MM-ALR should be agreed with TAME on a case-by-case basis. They will always be the same or less than the rates for D2M / D3M / D4M with MIDAS.
Table A1 MyRIAD Incident Rates
A.4. It is not usual practice to adjust the default accident rates in MyRIAD to match observed levels,
mainly because the MyRIAD rates include damage-only accidents for which robust local data

MyRIAD User manual V1.3.docx 26
is unlikely to be available. However, it may be advisable to make some adjustment if local
injury accident rates are significantly different from the national average for motorways (upon
which MyRIAD is based). In these cases the following procedure should be followed:
(a) Calculate the local accident rate (PIAs per million vehicle kms). Call this A1.
(b) Identify the national average accident rate (PIAs per million vehicle kms). Call this A2.
The following are the national PIA rates from COBALT. Note that the rates for
motorways have been disaggregated by technology provision using MyRIAD accident
rates. The calculation shown below is the ratio of the MyRIAD rate by technology
provision to the MyRIAD rate for all motorways, multiplied by the national average
COBALT PIA rate for all motorways.
𝐷2𝑀/𝐷3𝑀/𝐷4𝑀 𝑊𝑖𝑡ℎ𝑜𝑢𝑡 𝑀𝐼𝐷𝐴𝑆 = (0.0731 + 0.0373
0.1050 + 0.0461) × 0.064 = 0.047
𝐷2𝑀/𝐷3𝑀/𝐷4𝑀 𝑊𝑖𝑡ℎ 𝑀𝐼𝐷𝐴𝑆 = (0.1129 + 0.0511
0.1050 + 0.0461) × 0.064 = 0.069
𝐷3𝐶𝑀/𝐷4𝐶𝑀 = (0.1713 + 0.0726
0.1050 + 0.0461) × 0.064 = 0.104
𝐷2𝐴𝑃 𝑊𝑖𝑡ℎ 𝑜𝑟 𝑊𝑖𝑡ℎ𝑜𝑢𝑡 𝑀𝐼𝐷𝐴𝑆 = 0.059
𝐷3𝐴𝑃 𝑊𝑖𝑡ℎ 𝑜𝑟 𝑊𝑖𝑡ℎ𝑜𝑢𝑡 𝑀𝐼𝐷𝐴𝑆 = 0.101
(c) On the Incident Parameters Worksheet of MyRIAD, multiply the incident rates for
‘Single lane accident’ and ‘Multi-lane accident’ by the local accident adjustment factor
(A1/A2). This should be done for the Do Minimum road types.
Do not adjust the rates for any other incidents.

MyRIAD User manual V1.3.docx 27
Incident Category
Motorway Mean Incident (Build-up)
Duration (mins)
All-Purpose Mean Incident (Build-up)
Duration (mins)
RMS Duration
Weighting
Variance Weighting
Without CCTV
With CCTV
Without CCTV
With CCTV
Single lane accident 52.3 51.2 77.0 75.4 1.29 1.74
Multi-lane accident 115.9 113.6 173.5 170.1 1.29 1.81
Non-HGV breakdown 29.2 29.2 42.0 42.0 1.40 2.12
HGV breakdown 40.3 40.3 85.3 85.3 1.20 1.55
Debris 14.9 14.9 37.3 37.3 1.26 1.65
Non-HGV Fire 51.0 46.0 92.0 87.0 1.21 1.65
HGV fire 161.4 156.4 284.1 279.1 1.46 1.86
Load shedding 22.6 17.6 170.9 165.9 1.37 2.05
Spillage 52.0 47.0 112.3 107.3 1.56 2.30
SL emergency Roadworks 29.7 29.7 70.3 70.3 4.81 11.73
ML emergency Roadworks 29.5 29.5 70.3 70.3 1.10 2.12
Animal 8.9 8.9 32.7 32.7 1.21 1.49
Table A2 MyRIAD Incident Durations and Variance Weightings
Incident Category All Road
Types (Two lanes)
All Road Types (Three
lanes or more)
Single lane accident 1.00 1.00
Multi-lane accident 1.99* 2.52
Non-HGV breakdown 1.07 1.07
HGV breakdown 1.07 1.07
Debris 1.13 1.13
Non-HGV Fire 1.34 1.61
HGV fire 1.66 2.15
Load shedding 1.38 2.07
Spillage 1.14 1.71
SL emergency Roadworks 1.00 1.00
ML emergency Roadworks 1.99* 2.03
Animal 1.32 1.32 *For two-lane road-types, the number of lanes blocked is limited to two. However, to avoid division by 0 in the delay calculations, this is set to 1.99 in the incident parameters.
Table A3 MyRIAD Average number of lanes closed

MyRIAD User manual V1.3.docx 28
Appendix B – Speed-flow curves and DTDV Curve Parameters
B.1. Speed-flow curves are based on COBA curves with zero hilliness and bendiness. The
parameters will need to be adjusted if either of these is significant.
B.2. The D3M and D4M speed-flow curves are also assumed to apply to D3CM and D4CM
respectively (three and four lane controlled motorways). MM4-ALR assessments should use
the D4M curve, and the MM3-ALR assessments should use the D3M curve.
B.3. Certain rules apply to the definition of breakpoints for speed flow curves:
At least one breakpoint must be defined;
For each breakpoint speed and flow must both be defined, or both left blank;
The flow at each breakpoint must be greater than that at the previous
breakpoint;
The speed at each breakpoint must be less than or equal to that at the previous
breakpoint.
Breakpoint Parameter D4M / D4CM
D3M / D3CM
D2M D2AP D3AP
Free flow speed (lights) (km/h) (VL0) 118 118 118 108 115
Breakpoint 1 Flow (total vehs/hr) (Q1) 4800 3600 2400 2160 3240
Speed (km/h) (V1) 110.8 110.8 104.8 101.52 108.52
Breakpoint 2 Flow (total vehs/hr) (Q2) 12776 9582 6388 5586 6379
Speed (km/h) (V2) 45 45 45 45 45
Breakpoint 3 Flow (total vehs/hr) (Q3)
Speed (km/h) (V3)
Breakpoint 4 Flow (total vehs/hr) (Q4)
Speed (km/h) (V4)
Breakpoint 5 Flow (total vehs/hr) (Q5)
Speed (km/h) (V5)
Minimum speed (km/h) 45 45 45 45 45
Maximum speed heavies (km/h) 90 90 90 90 90
Table B1 Default speed-flow curves in MyRIAD
B.4. The estimation of DTDV Curves is explained in the Mott MacDonald reports MyRIAD Incident
Parameter Estimation (Mott MacDonald, 2016) and DTDV Analysis (Mott MacDonald, 2016).

MyRIAD User manual V1.3.docx 29
B.5. DTDV curves were estimated from observed data and are only valid over the range of journey
times for which there were observations. These ranges are as follows:
D2M: journey times up to 80 sec/km (=45 km/h)
D3M: journey times up to 80 sec/km (=45 km/h)
D4M: journey times up to 80 sec/km (=45 km/h)
D4CM: journey times up to 80 sec/km (=45km/h)
D2AP: journey times up to 80 sec/km (=45km/h)
D3AP: journey times up to 80 sec/km (=45km/h)
B.6. The default speed-flow curves all have a minimum speed of 45km/h, or 80 seconds per km.
This means that they will always return journey times within the observed range for D2M,
D3M, D4M, D4CM, D2AP and D3AP.
B.7. D3CM links are assumed to have the same DTDV curves as D3M.
B.8. MM3-ALR links are assumed to have the same DTDV curves as D3CM (which uses the same
curve as D3M).
B.9. MM4-ALR links are assumed to have the same DTDV curves as D4CM.
Coefficient D2M D3M D4M D4CM D2AP D3AP
a-coefficient 289.899 212.239 30.769 -55.612 -32.873 -117.039
b-coefficient -21.405 -15.974 -1.402 1.235 0.683 3.684
c-coefficient 5.008 x 10⁻¹ 3.779 x 10⁻¹ 1.005 x 10⁻¹ 2.249 x 10⁻² 0 0
d-coefficient -3.537 x 10⁻³ -2.643 x 10-
3 -9.340 x 10-
4 -3.13 x 10⁻⁴ 2.049 x 10⁻⁴ 2.947 x 10⁻⁴
Table B2 Default DTDV coefficients in MyRIAD
B.10. As a consequence of the cubic function used to calculate DTDV, the resulting curves can be
hump-shaped ie variability increases with journey time, reaches a maximum value, then
decreases. This decrease tends to happen beyond the observed range of the data. As a
safeguard, the calculated variability in this ‘decreasing’ region is replaced with the maximum
value. This is shown in Figure B1. The dotted line shows the standard deviation in the
decreasing region, as calculated by the cubic function. The solid line shows the standard
deviation that is actually used in MyRIAD.

MyRIAD User manual V1.3.docx 30
Figure B1 Preventing decreasing variability with increasing journey time
0
10
20
30
40
50
0 10 20 30 40 50 60 70 80
Std
Dev
Del
ay p
er k
m (
s)
Mean Journey Time per km (s)
D4M unmodified D4M as implemented

MyRIAD User manual V1.3.docx 31
Appendix C – Software Specification
C.1. MyRIAD uses a series of VBA Macros to calculate DM and DS incident delays and journey time
variability. These Macros are hidden from the user and are run in sequence when MyRIAD is run
for a single year assessment. This section provides an overview of the calculations performed by
MyRIAD. The figure below summarises the process for the do-minimum and do-something
scenarios.
Figure C2 Preventing decreasing variability with increasing journey time
Populate tables with incident parameters from Incident Parameters Worksheet
Produce pro-forma incident parameter and results tables
Calculate link capacities during normal operation
Calculate link delays and variances by incident type
Combine link variances and delays for each incident type to
calculate the total delay and variance for the
link
Calculate link capacities during each incident type
Apply monetary values to changes in variability and
delay
Populate results tables
Combine link variances across routes

MyRIAD User manual V1.3.docx 32
I. Prepare_Results_Table – Generates two tables with fields ready for inputting (a) incident
parameters and (b) subsequent calculations with the 12 different incident types across the
top and incident parameters along the side.
II. Get_Incident_Parameters – Populates the incident parameters table produced above with
values from MyRIAD’s IncidentParameters sheet
C.2. Incident-related delays and variability on a link is calculated using the module GenericIncident.
This includes the Main sub-routine that, when run, calls (runs) the following sub-routines:
I. Normal_Operation_Link_Capacity – Calculates link capacity during normal operation.
II. With_Incident – Is called for each incident type and calculates the variance and delay by
incident type for a link.
III. Total_Variability_and_Delay – Combines the link variances and delays for each incident
type to calculate the total delay and variance for the link.
C.3. These sub-routines record the values calculated for various parameters and used in subsequent
calculations in an Excel spreadsheet. These calculations are explained in more detail below.
I. Normal_Operation_Link_Capacity Sub-routine (link capacity during normal operation)
Hourly capacity per lane is calculated using the formula
))%2()%1((
)()(
HGVHGV
PCUsCapacityLaneVehiclesCapacityLane
Where Lane Capacity (Vehicles) is the hourly one-way capacity per lane in vehicles
Lane Capacity (PCUs) is the default hourly capacity per lane in pcus. This is 2300 in MyRIAD but
can be changed by the user
%HGV is the percentage of HGVs on the link
Hourly capacity per one-way link is calculated using the formula:
tyLaneCapaciNLANEHourVehLinkCapacity )/(
Where Capacity Link (Veh/Hour) is the hourly one-way capacity per link in vehicles
NLANE is the number of lanes in each direction

MyRIAD User manual V1.3.docx 33
Capacity per hour is converted into capacity per minutes by dividing by 60.
60
)()/(
HourLinkCapacityMinVehCLinkCapacity
Where Capacity Link, C, (Veh/Min) is the one-way capacity per minute per link in vehicles
Link flow (demand) is calculated using the formula
2
_)/(
FactorHourAADTGrowthTrafficAADTHourVehDemand
Where Demand (Veh/Hour) is the hourly one-way demand per link in vehicles in the assessment year
AADT is the Average Annual Daily Traffic (Two-way)
Traffic Growth is the forecast growth between the base year and the assessment year
AADT_Factor Hour is the factor applied to the AADT to calculate the hourly flow.
Flow per hour is converted into flow per minute by dividing by 60.
60
)/()/(
HourVehDemandMinVehDDemand
Where Demand, D, (Veh/Min) is the flow per minute
The ratio of flow to capacity on the link is calculated using the formula
Capacity
DemandRFC
Where RFC is the ratio of flow to capacity.
RFC in MyRIAD is limited to 0.95. If RFC is greater than 0.95, D is capped to 0.95 RFC
CRFCMinVehDDemand )/(
II. With_Incident Sub-routine (calculates variance and delay by incident type)
a. Link Capacity
The link capacity with an incident is calculated using the formula
NLANE
BLCFCALCNLANECCapacityIncident )('
Where Incident Capacity, C’, (Veh/Min) is the link capacity per minute with the incident
ALC# is the average lanes closed during the incident

MyRIAD User manual V1.3.docx 34
BLCF# is the Build-up lane capacity factor and specifies what proportion of the normal lane capacity is available during the build-up phase of the queue during an incident. This reflects the fact that even when a lane is fully open, it will not usually be operating at full capacity during the incident.
# indicates an incident-related parameter for which MyRIAD defaults are normally used
b. Proportion of Traffic Diverting
The delays which occur on the sections affected by an incident are dependent on the proportion
of traffic diverting to avoid the incident. The proportion of traffic diverting is calculated according
to the formula
D
CDBDPoportionDiversion
'004168.0Pr
Where Diversion Proportion, DP, is the proportion of traffic diverted (Diverted traffic is capped at 90% of
excess demand)
B# is the build-up duration of the incident in minutes
If RFC is greater than 0.95 with the incident, then capped demand on the affected link (less
diverted traffic) is
DPDDDiversionwithDemandCapped 1'
Where Capped Demand with Diversion (Veh/min), D’, is the demand on the effected link less diverted
traffic
Otherwise, capped demand becomes
DPDDDiversionwithDemandCapped 195.0'
c. Duration of Incident
Incident durations are calculated using MyRIAD incident parameters
WeightingDurationRMSDurationupBuildBDurationIncidentWeighted
Where Weighted Incident Duration (mins), B, is calculated from the mean incident duration and the
duration weighting
Build-up Duration# (mins) is the average duration of an incident in minutes. It is the time
between the occurrence of an incident, and the time when all obstructions are removed.
RMS Duration Weighting# is applied so that average delay of an incident is closer to the
average delay from all incidents in the class.
C
CDBMinsTPeriodTransition
'')(

MyRIAD User manual V1.3.docx 35
Where Transition Period, T, is the time between the incident being cleared and the time that the last
vehicle which joined the queue prior to the incident being cleared would have passed the point
where the incident occurred if the first in first out principle (FIFO) had been observed
'
'')(arg
DC
CDBDeDurationDisch
Where Discharge Duration, D, is the time between the end of the transition period and the time when
the queue would be cleared
DBMinsDurationTotal )(
'
'')(
C
CDkShortfallCapacity
d. Delay
DP
CDTk
CTBCB
MinsDelayTotal1
1
2
11
'
)(
2
Where Total Delay is the total delay to all vehicles affected by the incident
DPCDCBDelayedVehicles
1
1'
Where Vehicles Delayed is the number of vehicles delayed by the incident
DelayedVehicles
DelayTotalADelayAverage 0
Where Average Delay (Mins), A0, is the average delay per vehicle
In order to prevent unrealistic queuing and delays, if average delay per vehicle exceeds a user
defined maximum threshold, a capping formula is applied.
fAfAA t 01 1 where: A0 > At; Otherwise A1 = A0
Where A1 is the average delay with threshold reduction applied
At# is the average delay threshold (MyRIAD default is 30 minutes)
f# is the average delay threshold factor (MyRIAD default is 0)

MyRIAD User manual V1.3.docx 36
DelayedVehiclesAMinsDelayTotal 11 )(
Total Delay1 is therefore the delay associated with each occurrence of a particular incident type.
In order to calculate the total delay per annum associated with each incident, the Distance
Travelled is first calculated.
1000000
60'tan
ionFactorAnnualisatDLinkLengthmvkmAnnualdceTravelleDis
Where mvkm is million vehicle kilometres
Link Length (km) is the length of the link being assessed in kilometres
Annualisation Factor is the number of hours within a specific flow group
This is combined with the incident rate to produce the number of incidents.
dceTravelleDisRateIncidentIncidentsofNumber tan
Finally, the annual delay associated with each incident type is calculated by combining the
number of incidents with the total delay associated each incident
1DelayTotalIncidentsofNumberMinutesDelayAnnual
e. Variance
The travel time variance associated with each incident is calculated using the maximum delay
per vehicle. According to deterministic queuing theory, this is twice the average delay per vehicle.
12AMinsvehicleperDelayMaximum
WeightingVarianceVehicleperDelayMaximum
3
22
Where σ2 (minutes per vehicle) is the travel time variance caused by each incident type
Variance Weighting# takes into account the distribution of incident durations within an incident
type
III. Total_Variability_and_Delay Sub-routine (Calculates total delays and variance)
a. Total Delay
The total delay on a link across all incident types is calculated by summing the total delay for all
incidents.

MyRIAD User manual V1.3.docx 37
12
1
1
i
DelayTotalDelayTotal where i=1 is incident type 1
Where Total Delay is the delay per vehicle in the flow group across all incidents
b. Total Variability
The total variability on a link is calculated using the probability of an incident in each flow group.
60)(Pr
FactorionAnnualisat
DurationTotalIncidentsofNumberPIncidentofobability
Where Probability of Incident, P, is the probability of a particular incident in a flow group
The product of the probability and variance for each incident type is then summed to calculate the
total variance on a link.
12
1
2
i
PVarianceTotal where i=1 is incident type 1
Where Total Variance is the variance per vehicle in the flow group across all incidents

MyRIAD User manual V1.3.docx 38
Appendix D – Network Definition Guidance
D.1. This guidance has been developed to improve and standardise the process of preparing MyRIAD
input data and constructing MyRIAD networks.
D.2. This guidance is developed based on a traffic model developed using the SATURN traffic
modelling software suite. Hence for simplicity, some of the methods for deriving data from the
model are described by the use of SATURN related processes. However, data can be equally
derived using other traffic modelling software.
Trip Matrix Development
D.3. The following methodology is suggested for developing the trip matrices for input into MyRIAD.
Figure D1 shows a schematic diagram for a typical MyRIAD network, which has been simplified
to three scheme links (SL1, SL2, SL3), four junctions (A, B, C, D) and five feeder links (FL1 to
FL5). The purpose of the feeder links is to model routes for the trips on the scheme links.
Figure D1 Indicative MyRIAD diagram
D.4. One of the advantages of the MyRIAD method is that its networks do not have to bear any
resemblance to its real life counterpart. This network structure takes advantage of this flexibility.
Note that there is no need to have feeder links at the beginning and end of each route in the
MyRIAD network. Each route represents a possible route through the scheme links (eg A to B, A
to C, A to D etc). Each route receives traffic from a set of feeder links with each feeder link
representing a certain trip length (see Figure D2 below for route set up).
A
SL1 SL2
FL1
FL5
FL2
FL3
FL4
SL3
C D B
1
2

MyRIAD User manual V1.3.docx 39
Figure D2 Indicative MyRIAD route set up

MyRIAD User manual V1.3.docx 40
D.5. To obtain the trip matrices for the Do-Minimum scenario (for the network shown in Figure D1), the
following method is suggested:
Produce a series of trip matrices for all OD points (Figure D3) on the scheme link network
as per Fig D2. A matrix is produced for each 5km distance band (or other suitable interval)
for each model time period using the Do Minimum models.
From To
A B C D
A 1 1 1
B 2 1 1
C 2 2 1
D 2 2 2
Figure D3 Indicative Matrix of Movements
The matrices for each distance band are summed across time periods and then converted
to all day matrices to give AADT matrices for each distance band.
The length of each feeder link is either the mid-point of the distance band or, if fewer
feeder links are required, then the distance bands can be combined by taking the mean
distance of a number of the bands weighted by trip totals in each band.
Effect of Feeder Links
D.6. It is also worth highlighting that the characteristics of feeder links, and the level of variability
assumed for them, can have a large influence on the total variability benefits on the route. This is
true even if the feeder links don’t change between the DM and DS. This is illustrated by the graph
in Figure D4 below. In this example the standard deviation (SD) on the scheme link reduces from
100 seconds to 80 seconds between the DM and DS, i.e. a reduction of 20 seconds. However,
the reduction in the route SD also depends on the variability on the feeder link. If this is zero then
the route SD reduces by 20 seconds, but as the variability on the feeder link increases the
difference between DM and DS variability gets smaller.

MyRIAD User manual V1.3.docx 41
Figure D4 Effect of Feeder Link TTV on Route TTV Benefits
D.7. The graph shows how the benefit per trip (on the y-axis) decreases as the variability on the feeder
link increases (shown on the x-axis). A short distance trip will tend to have a lower standard
deviation on the feeder link compared to a long distance trip hence, according to the graph below,
will receive a greater benefit from the same scheme.
D.8. This means that the variability benefits are very sensitive to the characteristics of the feeder links,
in terms of their flow, length and incident characteristics. The network structure described above
should therefore be considered in all cases. But even if this guidance is followed there will still be
a degree of uncertainty associated with the variability benefits reported by MyRIAD.
D.9. Feeder links do not have any effect on the delay benefit calculation, which can therefore be
considered more robust.
D.10. It is recommended that MyRIAD models should have a V/C of 0.6 for feeder links. This ensures
that route TTV benefits are not unrealistically affected by traffic flows on individual feeder links.
To achieve this users need to select same road type in both the DM and DS for feeder links (this
provides number of lanes in each direction) as well as ensuring two-way AADT on feeder links is
set to give a V/C of 0.6 (ie Total Feeder Link AADT = 0.6 x Number of Lanes x Capacity per Lane
in AADT).

MyRIAD User manual V1.3.docx 42
Assessing Parallel Routes
D.11. When a scheme is built it is likely to attract traffic from alternative routes. While the traffic on the
scheme links is likely to increase with the introduction of the scheme, the traffic on parallel routes
is likely to decrease. To capture the benefits of a reduction in traffic on parallel routes, it is
suggested that a separate MyRIAD run be carried out for affected parallel routes, then the benefits
combined with the scheme link MyRIAD benefits. It is assumed that the traffic on the scheme
and on the parallel routes are independent for this assessment and that the scheme does not
result in traffic diverting to use just part of the scheme.
D.12. For assessing parallel routes, the following methodology for developing scheme link assessments
should be used.
D.13. Parallel routes can initially be identified by comparing the differences in modelled traffic flows
between Do-Something and Do-Minimum scenarios for future forecast years. If this is the case,
the SATRAP facility in SATURN can be used to quantify the use of parallel routes.
D.14. For this, a select link trip matrix for the scheme links in Do-Something scenario is required. Using
SATRAP, assign this matrix on to the model which has the Do-Something matrix assigned onto
the Do-Minimum network, to identify the parallel routes – that is the routes likely to be followed by
traffic which would use the scheme links post-implementation but which do not do so pre-
implementation because of capacity constraints. Parallel routes should only be considered if an
alternative route contributes over 250 vehicles in any peak-hour.
Combining diversion links
D.15. QDIV (QUADRO DIVersion) is part of QUADRO software, which calculates the combined
speed/flow relationship for a number of links, either in series or in parallel. Please refer to Volume
14 Section 1, Part 7 QDIV of DMRB manual for further information on QDIV.
D.16. As a parallel route might consist of links with different carriageway characteristics the use of QDIV
is suggested to identify a single speed-flow curve that is relevant to the entire parallel route(s), or
for parts of the parallel route forming a single modelled link within MyRIAD.
D.17. QDIV requires the following data:
16 hour flows (one-way)
Number of lanes
Link Length
Carriageway width
HGV % and

MyRIAD User manual V1.3.docx 43
Maximum link speed.
D.18. Most of this data can be obtained directly from information held within the SATURN traffic model,
although it will usually be necessary to derive the 16 hour flows from the individual time period
results, and look up the number of lanes from link speed-flow curve data. Aerial photographs,
available on the internet, can be used to confirm the number of lanes and speed limits. Care
should be taken, though, in using internet resources as the images viewed may not be up-to-date.
A maximum of 10 links can be combined into a single speed-flow curve with QDIV.
D.19. Once produced using QDIV, the speed flow curve should be coded in MyRIAD in the ‘SpeedFlow
and DTDV’ worksheet. Only a maximum of four user-derived speed flow curves can be specified.
MyRIAD assessment for parallel routes
D.20. The input for the MyRIAD assessment of parallel routes should be carried out in a similar way to
scheme links, however the following points should be considered:
The link type should be coded as 1;
The link will be the overall length of the diversion routes, or part of it if the route is
specified as more than one link;
The proportion of traffic generated should be specified as a negative value, as the
parallel route is likely to experience a reduction in traffic;
The road type for parallel routes should match the corresponding bespoke speed-flow
curves developed using either QDIV or a similar method. The road type should be the
same for both Do-Minimum and Do-Something scenarios.
The incident parameters for both Do-Minimum and Do-Something scenarios should be
the same;
If the parallel route is not a D3M route, the incident rates for dual-carriageways should
be obtained from TAME.
The calculated speed flow curves for parallel routes should be specified.