Munich Personal RePEc Archive - mpra.ub.uni-muenchen.de · rate and the incidence of poverty in...
23
Munich Personal RePEc Archive Lumping Together Democracy and Dictatorship: Has Macro Dynamics of Poverty Remained Steady in Pakistan Dawood Mamoon and Fozia Hyat and Shahid Hassan World Economic Survey 1 July 2018 Online at https://mpra.ub.uni-muenchen.de/87672/ MPRA Paper No. 87672, posted 2 July 2018 04:18 UTC
Transcript of Munich Personal RePEc Archive - mpra.ub.uni-muenchen.de · rate and the incidence of poverty in...
MPRAMunich Personal RePEc Archive
Lumping Together Democracy andDictatorship: Has Macro Dynamics ofPoverty Remained Steady in Pakistan
Dawood Mamoon and Fozia Hyat and Shahid Hassan
World Economic Survey
1 July 2018
Online at https://mpra.ub.uni-muenchen.de/87672/MPRA Paper No. 87672, posted 2 July 2018 04:18 UTC

Lumping Together Democracy and Dictatorship:
Has Macro Dynamics of Poverty Remained Steady in Pakistan
By
Dawood Mamoon (World Economic Survey)
And
Fozia Hyat (Punjab Economic Research Institute)
And
Shahid Hassan (University of Management and Technology)
Abstract
In this study we check the relationship between macroeconomics variables with poverty. We select head count ratio proxy of poverty as dependent variable and GDP, unemployment rate, literacy rate, rural population and worker remittances as independent variables. For the analysis of the data we take time series data from 1987-2011 and established the long run and short run relationship between dependent and independent variables. First of all we check the normality of the data by descriptive statistics, further we check the stationarity of the data by applying ADF test. For long run relationship between dependent and independent variables we applied FMOLS techniques and relationship in short run checked by EMC methods. Results of the data shows, macroeconomic variables especially literacy rate and rural population has major factors that disturb poverty level in Pakistan. GDP have negative and insignificant impact on poverty. Literacy rate have positive and significantly related with poverty. Worker remittances have negative and significant impact on poverty, while rural population has negative and significant impact on poverty. Unemployment has positive and insignificant impact on poverty in Pakistan.
Keywords: Poverty, Macro Economy, Capability
1. Introduction:
The debate on poverty reduction is quite important for economic policy makers as per the implementation of poverty reduction strategies. Income centric definition of poverty starts with the assumptions, that the well-being of families is primarily and positively related to their ability to consume goods and services. According to this view, more consumption leads to greater welfare. This reasoning suggests that a family is poor if its consumption possibilities are low according to some established standard.
Poverty is measured by two ways according to the definition of social security Administration (SSA), Absolute poverty and relative poverty. Whereas absolute poverty definition indicates progress toward raising the income of all citizens above a minimum level, while relative approaches measure the degree to which inequality in the income distribution has changed.
Relative poverty is relevant for all countries in the world while absolute poverty is mostly related to South Asia and Sub- Saharan Africa. In contrast to the income measures of poverty, human capability approach to poverty is most important for current issues of Pakistan. Human poverty relates with the deficiencies of education, health, level of employment and worker remittances.
Fluctuation in economic activities causes change in prices of goods and services. Change in prices not only influences the level of real income, who are full time work but all those badly affected who are already unemployed or under employment. Likewise the rate of growth in the economy influences the level of employment. If the economy is growing too slowly to provide jobs for those entering the labor force, then the number of people unemployed will increased some of those who are working will be employed only part time or considerable below their capacity to work.
Long period with high rates of unemployment and short run reductions in the level of employment have direct effect on the frequencies of poverty. Some people are poor and find it difficult to climb above the poverty level because of discrimination in employment practices.
Education has become more necessary step for higher occupations and the income. In general, those individuals with lower levels of educational achievement are more likely to be unemployed, work fewer hours per year and have lower incomes. The main cause of poverty of under developed countries is that, levels of literacy are low, there are heavy dropout rates and the system of education is highly irrelevant and syllabuses are out dated. When people not educated then they used old techniques of production and out dated equipment. In such situation productive of labor remain low and overall production level fall, meanwhile poverty rapidly increase in under developed countries day by day.
Pakistan ranks 54thin the list of 226 countries for having a young population. Although the belief is widely held that poor families have more children. This higher birth rate is largely due to the lack of information and resources to carry out effective family planning. Different studies have
shown that educated parents is among most important factors that influence educational attainment of children. Poor quality schools come with areas of concentrated poverty and dropout rate is much greater in poor families.
Muhammad Sabir et al (2012) pointed out that Pakistan can reduce poverty in the long run by change in macroeconomic variables (GDP growth, population growth, minor crops, major crops).
Michael Romer et al (1997) in his study established the correlation between poverty and economic growth. Results of the data show that economic growth is one of the best ways for poverty reduction. Study explained that those countries grow quickly, that lead to greater poverty alleviation.
Poverty of rural areas is higher than other areas in Pakistan. In rural areas poverty had increased by 36.3% during 1991 compared to urban poverty that is 22.6%. Resultantly inequality increased in both areas in this period that further exacerbated poverty. The authorities in Pakistan and foreign donors agree that a 7 to 8 percent growth is necessary to take care of the jobless and to reduce poverty. It is argued that more than 70% of the country’s work force is employed in agriculture and informal sectors, where there are no labor laws, minimum wage or any job security. These workers are mostly illiterate. In other words, if the economy is in a position to provide jobs to everyone, that can reduce poverty or at least reduce absolute poverty in Pakistan. In this study we find the relationship between macroeconomics variables such as GDP, literacy rate, unemployment, rural population and worker remittances with poverty in Pakistan.
1.2. Hypothesis:
H1: Stephen (2011), Njang (2010) , Zamurrad et al (2011) found significant and inverse relationship between education and poverty. In this study we also assume that literacy rate negatively related with poverty.
H0: literacy rate positively related with poverty reduction.
H2: Sabir et al (2010), Stephan Klasen (2007), Seema Malik et al (2005), Khalid Zaman et al (2011) in their studies showed positive relation between poverty and population. In this study we assume that population is positively and significantly related with poverty.
H0: population positively related with poverty
H3: Talat Anwar (2010), Romer et al (1997), FOSU (2010) , Bigsten et al (2000), Ali et al(1999) in their study found that economic growth is negatively and significantly related with poverty .Our hypothesis in this study is that economic growth negatively related with poverty.
H0: Economic growth has negative relation with poverty.
H4: Shafiq et al (2012), javeed et al (2012), Acharya(2012), Adams JR et al (2005), Asiedu et.al (2009), presented inverse and significant relation between worker remittances and poverty. We assume that worker remittances negatively relate with poverty in Pakistan.
H0: worker remittance negatively related with poverty in Pakistan
2. Literature Review:
2.1. Literacy and poverty:
Baker Adewale Stephen(2011) in his study “A critical appraisal of the linkage between literacy rate and the incidence of poverty in Nigeria” discussed the relationship between literacy rate and poverty level In developing countries during the 1975-2008 by using the co-integration test. Result of this study showed significant relationship between literacy rate and poverty level in Nigeria. Result showed that literacy rate did not contribute meaningfully for poverty alleviation in Nigeria.
Pervaiz Zamurrad et al (2011) in his study “The role of education and income in poverty elevation” A cross country analysis investigate the relationship between education, income and poverty. He used panel data for 40 developing countries for the period 1999-2007. In this study generalized least square technique and results of the model shows that income growth positively related with poverty elevation but income distribution did not play a key role in poverty elevation while education significant contributes poverty elevation.
Aloysius Mam Njan(2010) in his study “The effects of educational attainment on poverty reduction in Cameroon”. He used annual data of household survey that is conducted by National Institute of Statistics. Results showed that education have negatively related with poverty level. It means that higher educational level decline poverty rate.
Muhammad Afzal et al (2011) in his study “Relationship among Education, Poverty and Economic growth in Pakistan: An Econometric Analysis” investigate the relationship between education, poverty and economic growth. By using the Toda-Yamamoto Augmented Granger Causality (TYAGC) test checked the causality between education and economic growth and between poverty and education. For the purpose time series data used during 1971-72 to 2009-10. Both the short run and long run results show positive and significant effects.
2.2. Population and poverty:
Hazoor Muhammad Sabiret al (2010) in his study “The Impact of different macroeconomics variables on poverty in Pakistan” investigated the relationship between the different
macroeconomic variables and poverty with the help of multiple regression techniques. There exist long run relationship between the variables inflation, GDP growth, population growth, major crops, minor crops, livestock and poverty over the period 1981-2010.The results showed that GDP growth rate, income, majorcrops, minor crops and livestock had negative impact on poverty while inflation and population growth rate had positive impact on poverty.
Stephan Klasen(2007) in his study “ The impact of population growth on economic growth and poverty reduction in Uganda” discussed the relationship between population and poverty reduction in Uganda during the 1960-2000 period by using the cross sectional regression method. Result of this study showed that strong impact of educated female on fertility rate. Results showed that those women do not have educated the desired number of children 5.9, those women whose education primary that’s desired number of children 4.8 and secondary education have 3.8.
Seema Malik et al(2005) in his study “A review of the relationship between poverty, population growth and environment” investigate the relationship of these variables. He used the annual data during the period 1950-2000. Results show that during the past 50 years, Asia experienced decline birth rat but in Pakistan population growth rate have high that caused of poverty.
Khalid Zaman et al (2011) exploring the link between poverty, pollution and population in Pakistan for the year 1995-2009. He used head count ratio as proxy for poverty as dependent variables and population, CO2 proxy of pollution and time as independent variables. All variables were measured in log form. For empirical analyses OLS and least square dummy variables method were used. The results showed that population and air pollution has a significant effect on poverty.
Satya R. et al (2002) in his study “Population growth and poverty measurement” discussed that absolute number of poor disturb the poverty rate. In this paper appealing poverty measures structures. These measures related to naturally of standard measures and are well-mannered and applicable in empirical and policy work.
2.3. Economic growth and poverty:
Talat Anwar (2010) in his study “Role of growth and inequality is explaining changes in poverty in Pakistan” investigates the relationship between role of growth, unequal income distribution and poverty with the help of poverty decomposition methodology. There exist long run relationship between the variables, growth, unequal income distribution and poverty over the period 1998-1999 to 2001-2002. Results of the 1998-1999 to 2001-2002 showed that growth components contributed adversely to the rise in poverty over this period and redistribution components has benefited only the urban areas and adversely affected the poor in rural areas.
Michael Romer et al (1997) in his study “Does Economic Growth reduce Poverty” established the relationship between growth and poverty. He used the annual data 1970-1996. Results of the data show that economic growth is one best ways for poverty reduction. Study explained that those countries grow quickly, leading to greater poverty alleviation.
AugustinK wasi FOSU (2010) in his study “Growth, Inequality and Poverty reduction in developing countries” investigate the relationship between these variables. For this purpose he used the period 1981-1995 and 1996-2005. He estimates elasticity for the 80 underdeveloped countries. Elasticity of these countries informs us that reduction in poverty is response to increasing growth.
Arne Bigsten et al (2000) in his study “Growth, Income and poverty” discussed the relationship between economic growth, income distribution and poverty. He used the annual data from 1987-1998. Results show negative relation between economic growth and poverty. The main point of this study “without growth in per capita income, poverty always remains in poor countries”.
Salman Syed Ali et al(1999)in his study “Dynamics of growth, poverty and inequality in Pakistan” established the relationship between growth, poverty and income. For this purpose data were used 1963-1964 to 1993-1994 and apply OLS and Cochran-orcutt iterative methods. Results of the data shows that in rural areas poverty reduces by adopt growth oriented policies and these policies applicable when inequalities reduce. In urban area growth is more important and inequalities policies would be applicable after the growth policies.
2.4. Unemployment and poverty:
Tokumbo Simbowale (2005) in his study “Macro econometric analysis of growth, unemployment and poverty in Nigeria” discussed the impact of macroeconomic policies on poverty in Nigeria during the period 1970-2000. For the analysis of data they used three regression equation methods. Results of the model show that for poverty alleviation and unemployment reduction, economic growth had a necessary but not a sufficient condition.
Harry A .Sackey et al () in his study “Human resources underutilization in an era of poverty reduction : An analysis of unemployment and under employment in Ghana” discussed that unemployment are major problem in urban area then rural Ghana area. He established the relationship between human resources underutilization and its determinants. Data will be conducted by Ghana statistical services during the period of 1992-1999. Research shows positive relationship between unemployment rat and poverty reduction. This sturdy stressed upon that unemployment determine stressed that lack of education small farm sizes have major determinants of unemployment.
Rizwan ul Islam (2004) in his study “the Nexus of economic growth employment and poverty reduction” established the relationship between growth poverty and employment. He selected (Bangladesh, Bolivia, Ethiopia India Indonesia Uganda and Vietnam ) countries , Cross country analysis will be developed and result of the data shows that growth related with poverty reduction with different outcomes such as growth rate improve b creating labour market, and development in employment level.
Mozam Mahmood (2005) in his study poverty reduction in Pakistan the strategic impact of macro and employment policies discussed the poverty reduction strategies in Pakistan. In this paper explained that in Pakistan labour market situation unemployment levels and rate of total employment are not useful. While employment rate is determined supply of labour market not a demand for labor.
2.5. Remittances and Poverty:
Muhammad shafiq et al (2012) in his studies “the role of foreign remittances and economic growth in poverty alleviation. Discuss the effect of foreign remittances and economic growth on poverty in Pakistan. Annual time series data were used during 1978 to 2010. Jhonson Juselius co-integration test was applied and results shows of the both period short run and long run. Results give explanation that foreign remittances and economic growth have negative impact on poverty reduction in the long run.
Muhammad javeed et al (2012) in his studies “impact of remittances on economic growth and poverty” discuss the impact of remittances on economic growth and poverty reduction in Pakistan. Data collected from the period of 1973 to 2010. ARDL approach would be applied and results of the data shows that remittances have a strong and statistical significant impact on poverty reduction.
Chakra P.Acharya(2012) in his study “the impact of remittances on poverty and inequality: A micro-simulation study for Nepal”.He used the data of living standards measurement survey (LSMS)of Nepal and results shows that remittances decreases the head count poverty 2.3% in first round and 7.6% in second round.
Richard Adams JR et al (2005) in his study D international migration and remittances reduce poverty in developing courtiers?” established the relationship between migration remittances and poverty in developing countries. In this paper data collected related to migration, remittances and poverty from 71 developing countries of the year 1980. Results show that migration and remittances significantly reduce poverty in developing countries.
Elizabeth Asiedu et.al (2009) in his study” Remittances and poverty in Ghana” discussed the impact of remittances on poverty reduction in Ghana. He used cross sectional data from Ghana living standards survey and pseudo anal data .Results of this paper shows that foreign remittance reduce poverty so much higher than domestic remittances.
3. Methodology and Results:
3.1. Data Sources:
In this study we used time series data on poverty, literacy rate, rural population, unemployment rate and worker remittances. We used 33 years data from 1987-2011. Data have been collected from Pakistan economic survey, State Bank of Pakistan and World Bank data.
3.2. Model Specification:
To check the relationship between variables we used suitable functional form such as;
Y= α1+ α2 X1 + α3X2 + α4X3 + α5X4 + α6X5 +µ
Where
Y= povhr=Head count ratio proxy for poverty
X1=gdp= Gross Domestic product
X2= lit= Literacy rate
X3= unem= Unemployment rate
X4= rul= rural population
X5= remit=Worker remittances
µ = error term
α, α2, α3, α4, α5, α6 are parameters of the model
Variables Definition:
Poverty:
Poverty become major issues of underdeveloped countries like Pakistan. So we take head count ratio as a proxy of poverty. Head count ratio can be measured by taking the proportion of population by national poverty line. In this study we established the relationship of poverty with economic growth, education, population, worker remittance and unemployment by using the annual data from 1978-2011 in case of Pakistan.
Economic Growth:
In this study we use GDP per capita income as a proxy of economic growth. In this study we established the linked between poverty and economic growth by taking time series data from 1978-2011. In the estimation of the results, shows the relation positive or negative in both variables.
Unemployment:
In this study we take unemployment rate (percentage of GDP) variable. We obtain unemployment rate, Total number of unemployed worker divided on total labor force. Study promotes the relationship between poverty and unemployment and develops the linkage that jobs providing is a key factor for poverty reduction. Many researchers investigate the relationship of both variables indifferent ways. So study results show that unemployment and poverty have positive or relations’ in long run and short run.
Education:
In this study we take literacy rate as a percent of GDP, as a proxy of education. Many studies provided strong relationship between poverty reduction and literacy rate. Present study investigates that trade off or no trade off relation exists in education and poverty in case of Pakistan by using the period 1978-1980.
Remittances:
In this study we show the impact of remittances on poverty. We take worker remittance as a percent of GDP. In general all economists or researchers agreed on this point that remittances reduce poverty. By using the annual data from 1978-2011, we estimate that remittances have positively or negatively related with poverty.
Population:
In this study we take rural population as a proxy of population. Population is also a major problem of underdeveloped countries like Pakistan. In this study we established the relationship between rural population and poverty by using the annual data from 1978-2011.
3.3. Methodology:
To solve the research problems of this paper we used different econometric methods and techniques.
To check the relationship between existing variables we used Fully Modified Ordinary Least Square (FMOLS) technique. This method shows how different macro-economic variables reduce
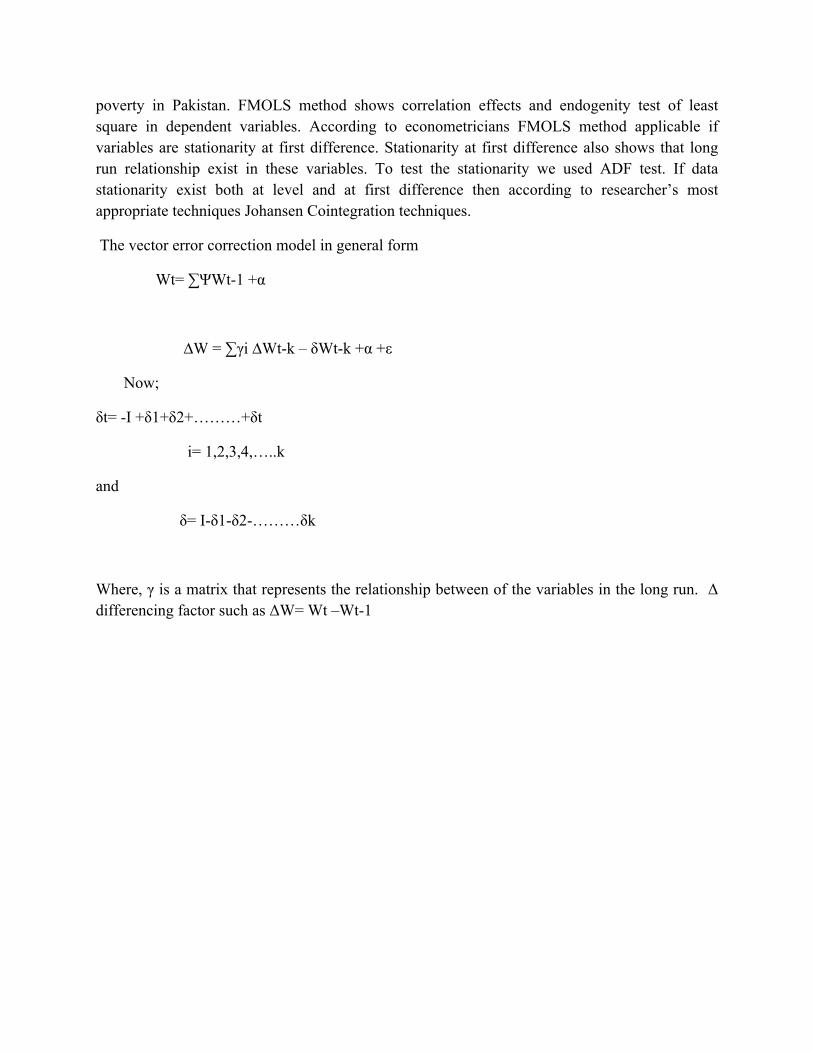
poverty in Pakistan. FMOLS method shows correlation effects and endogenity test of least square in dependent variables. According to econometricians FMOLS method applicable if variables are stationarity at first difference. Stationarity at first difference also shows that long run relationship exist in these variables. To test the stationarity we used ADF test. If data stationarity exist both at level and at first difference then according to researcher’s most appropriate techniques Johansen Cointegration techniques.
The vector error correction model in general form
Wt= ∑ΨWt-1 +α
∆W = ∑γi ∆Wt-k – δWt-k +α +ε
Now;
δt= -I +δ1+δ2+………+δt
i= 1,2,3,4,…..k
and
δ= I-δ1-δ2-………δk
Where, γ is a matrix that represents the relationship between of the variables in the long run. Δ differencing factor such as ΔW= Wt –Wt-1
3.4. Empirical Findings:
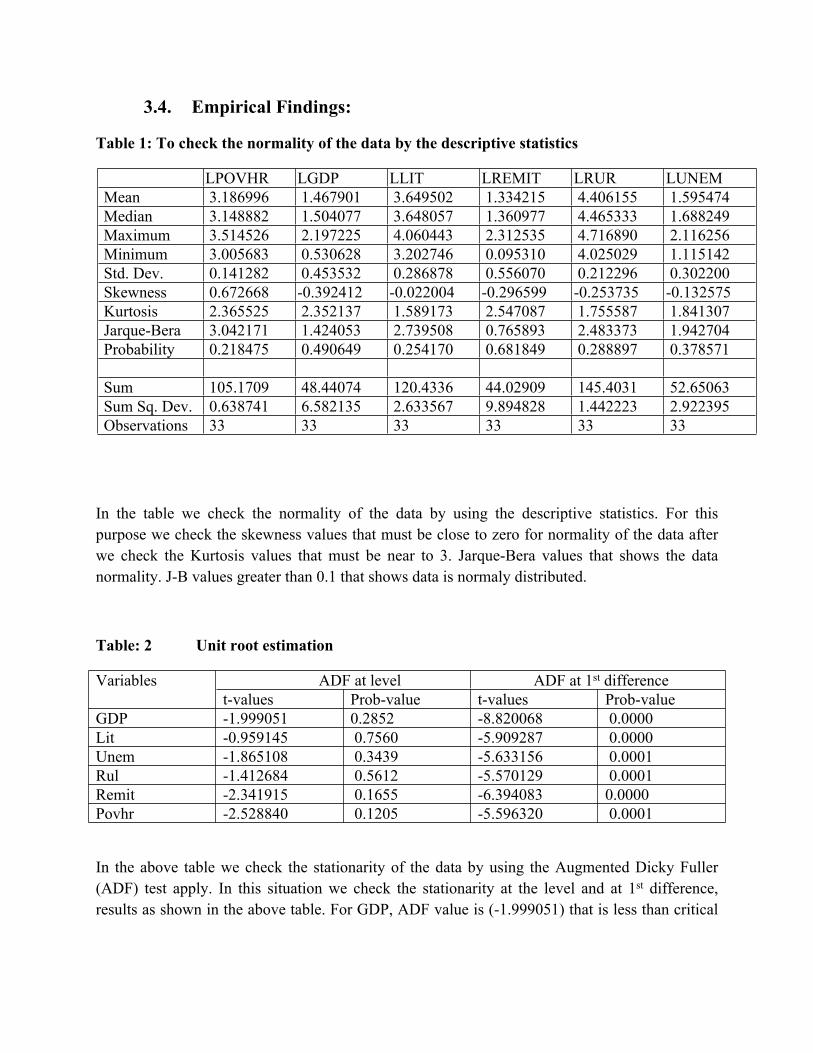
Table 1: To check the normality of the data by the descriptive statistics
LPOVHR LGDP LLIT LREMIT LRUR LUNEM Mean 3.186996 1.467901 3.649502 1.334215 4.406155 1.595474 Median 3.148882 1.504077 3.648057 1.360977 4.465333 1.688249 Maximum 3.514526 2.197225 4.060443 2.312535 4.716890 2.116256 Minimum 3.005683 0.530628 3.202746 0.095310 4.025029 1.115142 Std. Dev. 0.141282 0.453532 0.286878 0.556070 0.212296 0.302200 Skewness 0.672668 -0.392412 -0.022004 -0.296599 -0.253735 -0.132575 Kurtosis 2.365525 2.352137 1.589173 2.547087 1.755587 1.841307 Jarque-Bera 3.042171 1.424053 2.739508 0.765893 2.483373 1.942704 Probability 0.218475 0.490649 0.254170 0.681849 0.288897 0.378571
Sum 105.1709 48.44074 120.4336 44.02909 145.4031 52.65063 Sum Sq. Dev. 0.638741 6.582135 2.633567 9.894828 1.442223 2.922395 Observations 33 33 33 33 33 33
In the table we check the normality of the data by using the descriptive statistics. For this purpose we check the skewness values that must be close to zero for normality of the data after we check the Kurtosis values that must be near to 3. Jarque-Bera values that shows the data normality. J-B values greater than 0.1 that shows data is normaly distributed.
Table: 2 Unit root estimation
ADF at level ADF at 1st differenceVariablest-values Prob-value t-values Prob-value
GDP -1.999051 0.2852 -8.820068 0.0000Lit -0.959145 0.7560 -5.909287 0.0000Unem -1.865108 0.3439 -5.633156 0.0001Rul -1.412684 0.5612 -5.570129 0.0001Remit -2.341915 0.1655 -6.394083 0.0000Povhr -2.528840 0.1205 -5.596320 0.0001
In the above table we check the stationarity of the data by using the Augmented Dicky Fuller (ADF) test apply. In this situation we check the stationarity at the level and at 1st difference, results as shown in the above table. For GDP, ADF value is (-1.999051) that is less than critical

values (-3.737853,-2.991878,-2.63554) at 1%, 5%, 10%. After applying unit root test at level and at 1st difference, all variables is insignificant at level and significant at 1st difference.
If ADF statistics value is greater than critical value we reject the hypothesis and if ADF test statistics value is less than critical value then we accept the hypothesis. For this purpose we used lag values, that make better fit of the model though level of degrees of freedom reduce. For the best fit of the model and selection of the lag length depends upon the values of Akaike Information Criteria (AIC) and Schwarz- Bayesian Criteria (SBC). For this purpose we test the VAR lag selection Criteria as shown in table 3 after checking the stationarity at level and at 1st difference in table 2.
Table: 3 VAR Lag Order Selection Criteria
VAR Lag Order Selection CriteriaEndogenous variables: LPOVHR LGDP LLIT LREMIT LRUR LUNEM
Lag LogL LR FPE AIC SC HQ
0 52.68207 NA 1.61e-09 -3.219453 -2.936564 -3.1308561 179.3138 192.1308* 3.29e-12* -9.469914* -7.489693* -8.849733*2 206.3294 29.81037 8.71e-12 -8.850304 -5.172749 -7.698540
* indicates lag order selected by the criterion LR: sequential modified LR test statistic (each test at 5% level) FPE: Final prediction error AIC: Akaike information criterion SC: Schwarz information criterion HQ: Hannan-Quinn information criterion

We used lag length 1 because minimum value of Akaike Information Criteria (AIC) is achieved. To check the long period relationship between the variables we used J-J test.
Table 4 Johansen First Information Maximum Likelihood Test for Co-integration:
Hypothesis
TraceStatistic
5% Critical Value
Prob- value
Hypothesis Max-Eigen statistics
5% CriticalValue
Prob- value
P=0 134.7280 95.75366 0.0000 P=0 53.10604 40.07757 0.0010At most 1 81.62194 69.81889 0.0043 At most 1 31.70994 33.87687 0.0887At most 2 49.91201 47.85613 0.0316 At most 2 21.54940 27.58434 0.2444At most 3 28.36261 29.79707 0.0725 At most 3 16.41248 21.13162 0.2017At most 4 11.95013 15.49471 0.1593 At most 4 7.545357 14.26460 0.4268At most 5 4.404775 3.841466 0.0358 At most 5 4.404775 3.841466 0.0358Trace test indicates 1 cointegratingeqn(s) at the 0.05 level
**MacKinnon-Haug-Michelis (1999) p-values
In the above table we apply J-J test results in which we take poverty as a dependent variable. For showing the long run relationship between variables such as GDP, Unemployment rate, literature, worker remittances and poverty in Pakistan we used max-Eigen values. In J-J test we used the trace test values and Max-Eigen values with their critical values. If calculate values is greater than critical values then test is significant. As result of the above table shows that a value of Max-Eigen (53.10604) is greater than critical value 40.07757. So we reject the null hypothesis at 5% level of significance and so on. The trace test value 134.7280 that are greater than critical values 95.75366 at 5% level of significance. So we reject the null hypothesis that is P≤ 0 and so on.
Table 5: Long run Correlations
Dependent Variable: LPOVHR
VariableCoefficient Std. Error t-Statistic Prob.
LGDP 0.045558 0.051200 0.889802 0.3814LLIT 1.073058 0.372695 2.879183 0.0077
LREMIT-0.073825 0.039173 -1.884565 0.0703
LRUR-1.744646 0.499374 -3.493665 0.0017
LUNEM 0.070862 0.132771 0.533718 0.5979C 6.876613 0.976801 7.039931 0.0000
R-squared 0.472555 Mean dependent var 3.186996Adjusted R-squared 0.374880 S.D. dependent var 0.141282
S.E. of regression 0.111704 Akaike info criterion-1.382961
Sum squared resid 0.336901 Schwarz criterion-1.110869
Log likelihood 28.81886 F-statistic 4.838030Durbin-Watson stat 2.049879 Prob(F-statistic) 0.002751
The above table values explain that macroeconomics variables are highly correlated with poverty in Pakistan. Economic growth is insignificantly related with poverty in Pakistan. Literacy rate is positively and significantly correlated with poverty. Worker remittances is important factor in this study as it has also negative and significant effect on poverty. Above results shows that 1% increases in remittances will reduce poverty by 0.0738%. Rural population is another important factor in this study. According to results 1% increases in rural population will reduce 1.774% poverty in Pakistan. This result suggests poverty is more of an Urban phenomenon and investments in agriculture would reduce poverty. Unemployment is positively related with poverty. Its mean when rate of unemployment increase that increase the level of poverty in Pakistan.1% unemployment increase leads to increase in poverty by 0.0708%.
To determine the relationship of the variables in the short run we use equation as,
ΔY= α1+ α2Δ X1 + α3ΔX2 + α4ΔX3 + α5ΔX4 + α6ΔX5 +ξ

Where,
ΔY= povhr= change in poverty
ΔX1=gdp= change in Gross Domestic product
ΔX2= lit= change in Literacy rate
ΔX3= unem= change in Unemployment rate
Δ X4= rul= change in rural population
ΔX5= remit= change in Worker remittances
ξ = error term
Table 6: Short run Correlations
Dependent Variable: DPOVHRMethod: Least Squares
Variable CoefficientStd. Error t-Statistic Prob.
DGDP -0.130904 0.157981 -0.828601 0.4155DLIT 0.312723 0.399414 0.782955 0.4413DREMIT -0.318794 0.280419 -1.136847 0.2668DRUR 0.000672 0.151495 0.004433 0.9965DUNEM 0.255397 0.508039 0.502712 0.6197RES 7.855159 4.161911 1.887392 0.0713C(-1) -0.605142 0.613372 -0.986583 0.3337
R-squared 0.171062 Mean dependent var -0.282903Adjusted R-squared -0.036172 S.D. dependent var 1.989340S.E. of regression 2.025000 Akaike info criterion 4.444696Sum squared resid 98.41498 Schwarz criterion 4.768499Log likelihood -61.89278 Hannan-Quinn criter. 4.550248Durbin-Watson stat 1.807769
To check the relationship between variables in the short run we apply Error Correction Model (ECM) techniques. Economic growth negatively and significantly related with poverty. It means 1% percent increase in GDP that reduce poverty by 0.13%. Literacy rate is positively and

insignificantly correlated with poverty. Above results shows that 1% increase in remittances will reduce poverty by 0.318%. Rural population is an important factor in this study. Rural population has positive and insignificant impact on poverty reduction. According to results 1% increases in rural population will increase 0.00067% poverty in Pakistan. Unemployment is positively and insignificantly related with poverty. Its mean when rate of unemployment increase that increase the level of poverty in Pakistan. 1% unemployment increase that increase poverty by 0.255%. Unemployment
4. Conclusion and Recommendations
On the basis of the study results, some recommendations are suggested to policy makers for poverty reduction in Pakistan. These may be help to government in policies formulation.
Government should adopt those strategies that obtain the sustainable economic growth. Government should also pay main attention on those sectors that are labor intensive like agriculture sector because Pakistan is labor abundant country. They should improve skills of labors as well as implement laws that lead to labor income increase which in turn reduces poverty in Pakistan. Literacy sector is main factor for poverty reduction. So investment by Government in education sector through public private partnerships make economic policies sustainable for poor people. Improving student academic abilities and their technical skills also improves poverty profile of the country. Such policies would help reduce unemployment that has positive impact on poverty reduction in Pakistan.
References:
Afzal, M., Malik, M. E., Begum, I., & Sarwar, K. (2011). Relationship among Education,
Poverty and Economic growth in Pakistan: An Econometric Analysis. Journal Of Elementary
Education , 23-45.
Ali, S. S., & Tahir, S. (1999). “Dynamics of growth, poverty and inequality in Pakistan”. The
Pakistan Development Review , 837-858.
Anwar, T. (2010). Role of growth and inequality is explaining changes in poverty in Pakistan”.
Pakistan Development Review , 1-17.
Bigsten, A., & Levin, J. (2000). “Growth, Income and poverty. Department Of Economics
Goteberg University .
FOSU, A. K. (2010). Does Economic Growth reduces Poverty. UN University-World Institute
For Development , 1-58.
Islam, R. U. (2004). the Nexus of economic growth employment and poverty reduction.
International Labour Office Geneva , 1-39.
Khan, S., & Lavison, D. (2007). “ The impact of population growth on economic growth and
poverty reduction in Uganda. Ideas .
Mallik, S., & Ghani, N. (2005). A review of the relationship between poverty, population growth
and environment. Pakistan Development Review , 597-614.
Njomg, a. M. (2010). The effects of educational attainment on poverty reduction in Cameroon”.
Journal Of Education Administration And Plolicy Studies , 1-8.
Osinubi, T. S. (2005). Macro econometric analysis of growth, unemployment and poverty in
Nigeria”. Pakistan Economic And Social Review , 249-269.
Roemer, M., & Gugerty, M. K. (1997). “Does Economic Growth reduces Poverty. Harwar
Institute For International Development , 1-33.
Sabir, H. M., & Tahir, S. H. (2012). “The Impact of different macroeconomics variables on
poverty in Pakistan. Interdisciplinary Journal Of Contemporary Research In Business , 1-12.

Sackey, H. A., & Osei, B. (2006). Human resources underutilization in an era of poverty
reduction : An analysis of unemployment and under employment in Ghana”. Africa Development
Review , 221-247.
Zamurrad, P., & Kamal, U. A. (2011). The role of education and income in poverty elevation”.
The Lahore Journal Of Economics , 143-172.
Acharya, C., & Leon-Gonzalez, R. (2012). The Impact of Remittance on Poverty and
Inequality:A Micro-Simulation Study for Nepal. National Graduate Institute for Policy
Studies, 1-32.
ADAMS JR., R., & PAGE, J. (2005). Do International Migration and Remittances Reduce
Poverty in Developing Countries? World Developmen, 1645-1669.
Gyimah-Brempong, K., & Asiedu, E. (2009). Remittances and Poverty in Ghana. African
Economic Conference (AEC), 1-35.
Javid , M., Arif, U., & Qayyum, D. A. (2012). IMPACT OF REMITTANCES ON ECONOMIC
GROWTH AND POVERT. Academic Research International, 1-15.

Mahmood, M. (2005). Poverty reduction in Pakistan:. Policy Integration Department, 1-50.
Stephen, B. A. (2011). “A critical appraisal of the linkage between literacy rate and the incidence
of poverty in Nigeria. Journal of Emerging Trends in education research and policies
studies, 450-456.
Zaman, K., Shah, I. A., & Khan, M. M. (2011). Exploring the Link between Poverty-Pollution-
Population (3Ps). Journal of Economics and Sustainable Development, 27-50.

Trend of the Variables:
20
22
24
26
28
30
32
34
1980 1985 1990 1995 2000 2005 2010
POVHR
24
28
32
36
40
44
48
52
56
60
1980 1985 1990 1995 2000 2005 2010
LIT
1
2
3
4
5
6
7
8
9
10
1980 1985 1990 1995 2000 2005 2010
GDP
0
2
4
6
8
10
12
1980 1985 1990 1995 2000 2005 2010
REMIT
50
60
70
80
90
100
110
120
1980 1985 1990 1995 2000 2005 2010
RUR
3
4
5
6
7
8
9
1980 1985 1990 1995 2000 2005 2010
UNEM
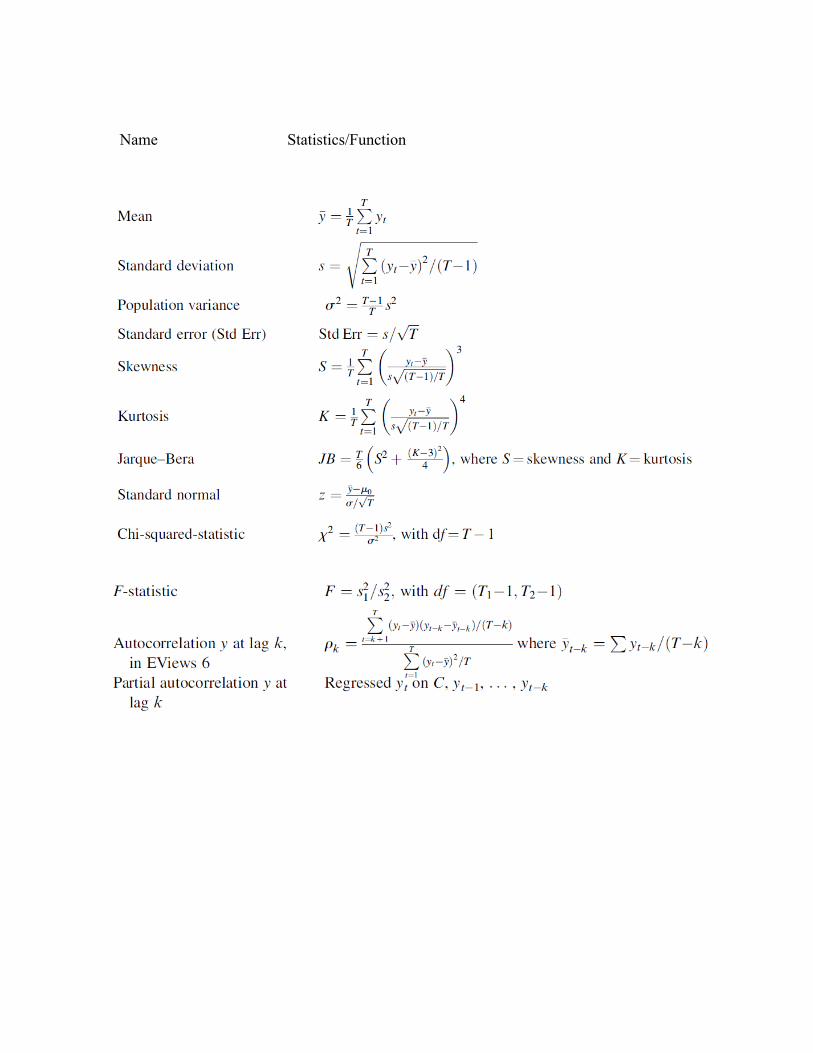
Name Statistics/Function


![UNICEF Equity Focus: From Data to Policy FormulationVULNERABLE GROUP Poverty in Malaysia 1957 2017 GDP per capita RM816 RM42,199 Poverty rate 50% 0.4% (2016) U5 mortality rate [‘000]](https://static.fdocuments.us/doc/165x107/604a4bfd7934f369de0026e7/unicef-equity-focus-from-data-to-policy-formulation-vulnerable-group-poverty-in.jpg)