Mumbai office trends_to_watch_for_in_2015
3
1 Research & Forecast Report | January 2015 | Colliers International Transaction volumes pick up towards the end of the year e first three quarters of the year remained quite dull for the Mumbai commercial office market with falling absorption and negligible new supply. However, the market revived towards the end of the year as transaction volumes picked up in 4Q 2014. Despite a revival in demand, the total absorption of 3.12 million sq ft in 2014 was 44% lower than the 5.6 million sq ft absorption witnessed in 2013. e average deal size declined significantly this year and approximately 60% of the transactions fell in the range of 5,000 to 20,000 sq ft. e primary reason for this decline is limited participation of cost-conscious IT/ITeS companies and cautious occupier sentiment in view of the economic slowdown witnessed in the previous years. Many corporations put their investment decisions on hold, waiting to see how the city’s economic scenario shapes up, especially in light of the new policies expected to be set by the new state government. BFSI, with a 39% share, continued to be the dominant sector leasing office space in Mumbai, followed by engineering (15%) and IT/ITeS (8%). Western suburbs, including locations like Andheri East, Goregaon and Malad, remained the most preferred location among occupiers and had about a 32% share of the total absorption, followed by ane (19%) and BKC (18%). New supply added to the Mumbai market during 2014 was 3.3 million sq ft. is is well below the 5 year average of new annual supply of 8 million sq ft. Approximately 7.4 million sq ft of vacant Grade A office space is available for lease or sale in the Mumbai office market. Overall vacancy levels Rental Values *Indicative Grade A rents in INR per sq ft per month **Nariman Point, Ballard Estate & Fort Research & Forecast Report Mumbai | Office January 2015 MICRO MARKETS RENTAL VALUE* % CHANGE QoQ YoY CBD** 200 - 230 0% -12% Worli/Prabhadevi 185 - 225 1% 2% Lower Parel 145 - 190 5% 4% BKC 225 - 320 0% 0% Kalina 150 - 200 0% -9% Goregaon / JVLR 100 - 110 0% 10% Andheri East 80 - 130 0% -3% Malad 80 – 100 0% 5% Powai 110 - 130 0% 9% Navi Mumbai 45 - 90 0% 22% Thane / LBS 50 - 100 0% 13% City Office Barometer INDICATORS 2014 2015 Vacancy Absorption Construction Rental Value Capital Value
-
Upload
colliers-international -
Category
Documents
-
view
65 -
download
0
Transcript of Mumbai office trends_to_watch_for_in_2015

1 Research & Forecast Report | January 2015 | Colliers International
Transaction volumes pick up towards the end of the yearThe first three quarters of the year remained quite dull for the Mumbai commercial office market with falling absorption and negligible new supply. However, the market revived towards the end of the year as transaction volumes picked up in 4Q 2014. Despite a revival in demand, the total absorption of 3.12 million sq ft in 2014 was 44% lower than the 5.6 million sq ft absorption witnessed in 2013.
The average deal size declined significantly this year and approximately 60% of the transactions fell in the range of 5,000 to 20,000 sq ft. The primary reason for this decline is limited participation of cost-conscious IT/ITeS companies and cautious occupier sentiment in view of the economic slowdown witnessed in the previous years. Many corporations put their investment decisions on hold, waiting to see how the city’s economic scenario shapes up, especially in light of the new policies expected to be set by the new state government.
BFSI, with a 39% share, continued to be the dominant sector leasing office space in Mumbai, followed by engineering (15%) and IT/ITeS (8%). Western suburbs, including locations like Andheri East, Goregaon and Malad, remained the most preferred location among occupiers and had about a 32% share of the total absorption, followed by Thane (19%) and BKC (18%).
New supply added to the Mumbai market during 2014 was 3.3 million sq ft. This is well below the 5 year average of new annual supply of 8 million sq ft. Approximately 7.4 million sq ft of vacant Grade A office space is available for lease or sale in the Mumbai office market. Overall vacancy levels
Rental Values
*Indicative Grade A rents in INR per sq ft per month**Nariman Point, Ballard Estate & Fort
Research & Forecast Report
Mumbai | OfficeJanuary 2015
MICRO MARKETS RENTALVALUE*
% CHANGEQoQ YoY
CBD** 200 - 230 0% -12%
Worli/Prabhadevi 185 - 225 1% 2%
Lower Parel 145 - 190 5% 4%
BKC 225 - 320 0% 0%
Kalina 150 - 200 0% -9%
Goregaon / JVLR 100 - 110 0% 10%
Andheri East 80 - 130 0% -3%
Malad 80 – 100 0% 5%
Powai 110 - 130 0% 9%
Navi Mumbai 45 - 90 0% 22%
Thane / LBS 50 - 100 0% 13%
City Office Barometer
INDICATORS 2014 2015
Vacancy
Absorption
Construction
Rental Value
Capital Value

2 Research & Forecast Report | January 2015 | Colliers International
Source: Colliers International
have fallen to 14% in 2014 from 14.5% in 2013. There is around 11 million sq ft of new Grade A office space forecast to be completed in 2015; however, most the supply is expected to hit the market towards the end of 2015.
While capital values have remained largely stable across all micro-markets, the overall rents witnessed a 4% YoY increase in 2014 despite lower absorption levels due to limited new supply and lack of quality office space.
In 2014, the city got a major infrastructure boost, as Mumbai’s much awaited first Metro Rail started operations this year connecting Versova, Andheri and Ghatkopar on an 11.4 km stretch, providing swift connectivity. Apart from this, the state government has also increased the ready reckoner rates for residential and commercial properties by up to 20% in 26 posh zones.
Trends to watch for in 2015:
The office market of Mumbai has started showing strong fundamentals, which is evident from the revived occupier interest. With the new state government in place and positive vibes from the centre in terms of favourable policies for the city’s real estate and major infrastructure projects, the city is likely to augur well in 2015. Over the next six months, we anticipate a rise in commercial demand in this market with tenants seeking quality office space. Given the lack of supply and increasing demand, we also expect a positive outlook for landlords, while in the second half of 2015, approximately 11 million sq ft office supply is expected to hit the market, which will help keep rents stable during the year.
Notes:
1. Office Market: The major business locations in Mumbai are the CBD (Nariman Point, Fort and Ballard Estate), Central Mumbai (Worli, Lower Parel and Parel), Bandra Kurla
Complex (BKC) and Andheri Kurla stretch. Powai, Malad and Vashi are the preferred IT/ ITES destinations, while Airoli at Navi Mumbai and Lal Bahadur Shastri Marg are
emerging as new office and IT/ITES submakets.
2. Rents/Capital Value: Market average of indicative asking price for Grade A office space.
3. Available Supply: Total Grade A office space being marketed for sale or lease in surveyed quarter.
4. City Barometer: Represents increase, decrease or stable scenario; as compared to previous quarter.
5. All the figures in the report is based on market information as on 25th December 2014.
Top 5 Transactions of 2014
Key Under Construction Projects
CLIENT BUILDING NAME AREA (SF) LOCATION LEASE / SALE
Edelweiss Capital Kohinoor City 133,000 Kurla Sale
Willis Insurance India i-Think Techno Campus 130,000 Thane Lease
DHL India Silver Utopia 100,000 Andheri East Lease
Pfizer India The Capital 90,000 BKC Lease
Poddar International School Hamilton 90,000 Thane Lease
BUILDING NAME DEVELOPER AREA (SF) LOCATION POSSESSION
Godrej BKC Godrej Properties 1,020,000 BKC 2015
Seawood Grand Central Tower I & II L & T Infrastructure 1,350,000 Navi Mumbai 2015
Lodha Codename Business Class Lodha Group 1,260,000 Thane 2015
New Supply, Absorption And Vacancy Trends
Average Rental And Capital Value Trend300
250
30,000
25,000
20,000
15,000
10,000
5,000
0
200
150
100
50
0
12 30%
25%
20%
15%
10%
5%
0%
10
8
6
4
2
02010 2011 2012 2013 2014 2015F 2016F
2008
2009
2010
2011
2012
2013
2014
2015
2016
Forecast
New Supply (In Mln sqft) Absorption(In Mln sqft) Vacancy(In %)
Rent
al V
alue
s IN
R Pe
r sq
ft P
er M
onth
Capi
tal V
alue
s IN
R Pe
r sq
ft
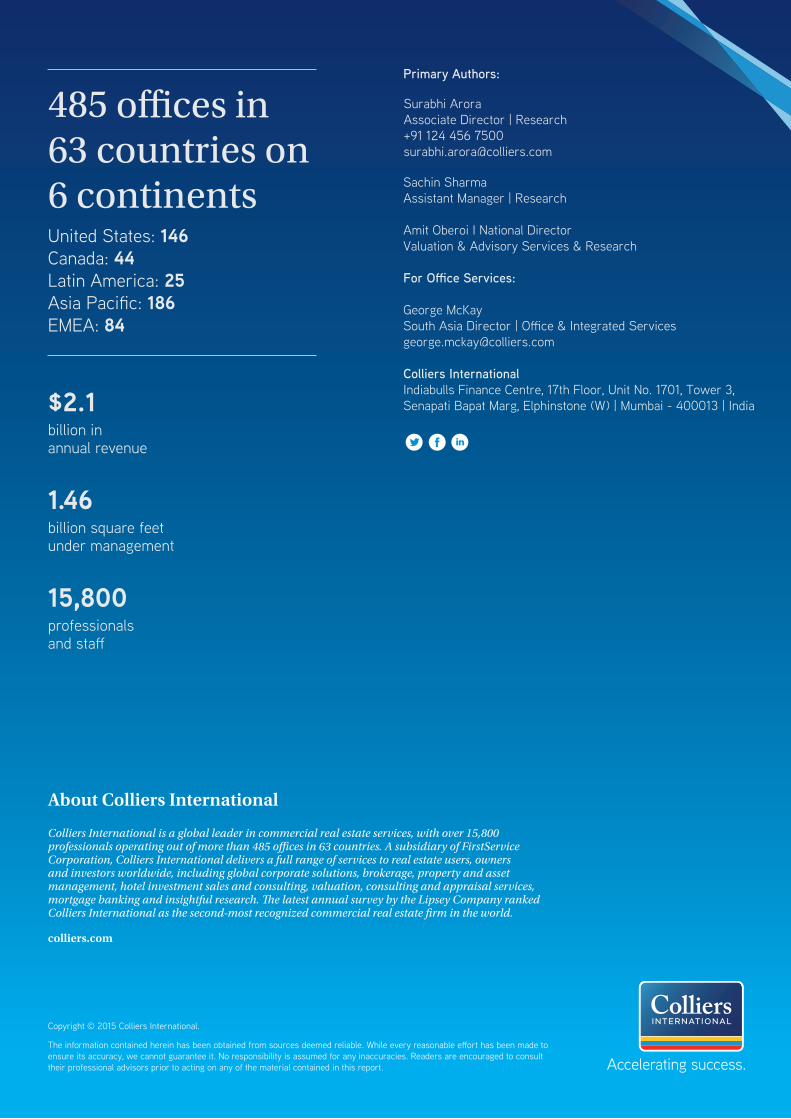
About Colliers International
colliers.com
63 countries on 6 continentsUnited States: 146 Canada: 44 Latin America: 25
186 EMEA: 84
$2.1billion in annual revenue
1.46billion square feet under management
15,800professionals
Primary Authors:
Surabhi Arora Associate Director | Research +91 124 456 [email protected]
Sachin Sharma Assistant Manager | Research
Amit Oberoi I National DirectorValuation & Advisory Services & Research
For O�ce Services:
George McKaySouth Asia Director | O�ce & Integrated [email protected]
Colliers InternationalIndiabulls Finance Centre, 17th Floor, Unit No. 1701, Tower 3,Senapati Bapat Marg, Elphinstone (W) | Mumbai - 400013 | India
485