City Report Mumbai Office Market Q3 2009
16
CITY REPORT MUMBAI OFFICE MARKET Q3 2009
-
Upload
guesta5a31d -
Category
Real Estate
-
view
2.703 -
download
2
description
Transcript of City Report Mumbai Office Market Q3 2009
CITY REPORTMUMBAI OFFICE MARKET
Q3 2009

CITY REPORTMUMBAI OFFICE MARKET - Q3 2009
Summary p. 3
Macroeconomic Context p. 4
Mumbai Office Market p. 5
Central Business District (CBD) p. 6
Extended Central Business District (ECBD) p. 7
Alternate Central Business District (Alternate CBD) p. 8
Secondary Business District (SBD) p. 9
Periphery Business District (PBD) p. 10
Key Projects
p. 12Capital Values
p. 13Key Transactions
p. 14
Summary
Prime Rents p. 11
Glossary p. 15
3I I
SUMMARY
In Mumbai, the demand for commercial space in the third quarter (July - September), marginally increased over the second quarter. There is a general perception among corporate occupiers that rents have “bottomed out”. The take up improved significantly especially in the suburbs, though there is an increasing supply being added in the market. The vacancy rates in CBD area of Nariman point continue to increase further and now is forcing the owners to become more flexible in their commercial terms. The fund flow situation of large real estate developers improved dramatically as they were able to successfully raise capital via Qualified Institutional Placement’s (QIP) and other alternate investment vehicles promoted by international capital market advisors. However the small and medium scale developers are still facing liquidity issues and have therefore delayed the the construction of their projects by at least 6 months.
A lot of opportunistic buying is on the anvil as domestic and NRI investors are now finding the valuations a bit interesting. These investors are seeking net returns in excess of 12% per annum. There are also many fence sitters , still, who feel that there is a scope for 5-10% of further correction, by the end of December. Most of the development companies, are only offering properties for lease and are not releasing any commercial office space for sale. Since there is an availability of 10 million sq.ft. of new, modern supply of office space in Mumbai, our assessment is there will be downward pressure on rents and capital values at least for the next 6 months.
Cautious investing is on the anvil, albeit increasing supply
CITY REPORTMUMBAI OFFICE MARKET - Q3 2009

DLF Limited 16,498.6 17,509.4 -6% 3,960 4,397.4 -10%
India Bulls 2,965.9 3,245.3 -9% 711.3 719 -1%
Peninsula Land 1,687.2 1,154 46% 728.7 328.5 122%
Pheonix 263.9 247.9 6% 175.4 153.3 14%
MahindraLifespaces 635.2 472.6 34% 173.4 104.2 66%
Ackruti City 782.9 409 91% 297.9 100.2 197%
13-A
ug-0
713
-Sep
t-07
13-O
ct-0
713
-Nov
-07
13-D
ec-0
713
-Jan
-08
13-F
eb-0
813
-Mar
-08
13-A
pr-0
813
-May
-08
13-J
un-0
813
-Jul
-08
13-A
ug-0
813
-Sep
t-08
13-O
ct-0
813
-Nov
-08
13-D
ec-0
813
-Jan
-09
13-F
eb-0
913
-Mar
-09
13-A
pr-0
913
-May
-09
13-J
un-0
913
-Jul
-09
13-A
ug-0
913
-Sep
t-09
0
5,000
10,000
15,000
20,000
25,000
-4%-2%0%
4%
8%10%12%
2%
6%
14%
05-J
ul-0
8
05-A
ug-0
8
05-S
ept-
08
05-O
ct-0
8
05-N
ov-0
8
05-D
ec-0
8
05-J
an-0
9
05-F
eb-0
9
05-M
ar-0
9
05-A
pr-0
9
05-M
ay-0
9
05-J
un-0
9
05-J
ul-0
9
05-A
ug-0
9
05-S
ept-
09
4I I
MACROECONOMIC CONTEXT
GDP growth rate beat all estimates. Records 7.9%
India recorded a GDP growth of 7.9 % in the quarter – July –September of 2009, which is more than estimated rate of 6.1%. In fact, this is the highest growth in GDP rate ever since 1996. The key factors are increase in domestic consumption, global recovery and abundant liquidity in the system. The manufacturing and service sector grew by more than 9% . Despite the weak credit demand, the banking and financial sector also showed a healthy growth. The agriculture sector showed the highest growth, however the perception among the industry leaders is that the harvest shortfall will get captured in the next quarter and therefore the overall GDP will be lower for the next quarter. There is also a perception that the central bank is now poised to increase the Cash Reserve Rate (CRR) Ratio and Reverse Repo Rate as the inflation is expected to breach central bank's comfort level by January 2010. The finance ministry has also made a statement that it will review the situation in February 2010. Major business chambers feel there's a need for the government to continue with the existing monetary and fiscal policies to sustain the process of economic recovery.
The high GDP rate indicate that the government policy measures have been successful in reversing the impact of the global slowdown. It is expected that the recovery will be sustainable, as investment and consumption are showing an upswing, and with policy guidance a growth rate of 7% can be achieved in the current financial year.
Wholesale Price Index (WPI)
Sensex Nifty
Sensex & Nifty
CITY REPORTMUMBAI OFFICE MARKET - Q3 2009
Source: Confederation of Indian Industries
Source: Confederation of Indian Industries
Source: Confederation of Indian Industries
Gross Domestic Product (GDP)
Q12008
Q22008
Q32008
Q42008
Q12009
Q22009
0.00%
2.00%
4.00%
6.00%
8.00%
10.00%
12.00%
10.10%
9.30%9.70%
9.20%9.30%
8.80% 8.80%
7.90%7.60%
5.30%5.80%
6.10%
Q32006
Q42006
Q12007
Q22007
Q32007
Q42007
Q32009
7.90%
Real Estate Most of the real estate development companies showed high growth rate both in sales and profits. This is fuelled by lowering of interest rates on home loans by banks & financial institutions and further lowering of property prices. Most of the growth is due to higher sales in residential developments and also due to sale of land which have resulted in windfall profits for certain companies in this quarter. In the stock markets, the stocks of major listed real estate development companies saw a surge both in terms of price and volumes. It is expected that the demand for commercial real estate development will pick up across the country, in the next two quarters both in terms of sales and leasing.
in certain cases,
Major Real EstateCompanies in
India
Sales (In INR / In Million) Profits (In INR / In Million)Q3 09 Q2 09 Q on Q
Change %Q3 09 Q2 09 Q on Q
Change %
Unitech 5,094.9 5,149 -1% 1,778.6 1,577.7 13%
Sobha Developers 2,236 1,771 26% 275 127 117%
ParsvnathDevelopers 1,684.7 1,137.2 48% 614.3 138.1 345%
Omaxe Limited 2,239.2 1,189.1 88% 225.1 149.7 50%
Ananthraj 871.3 824.8 6% 712.7 689.3 3%
Ansal Properties 1,768.4 1,367.4 29% 316 103.2 206%
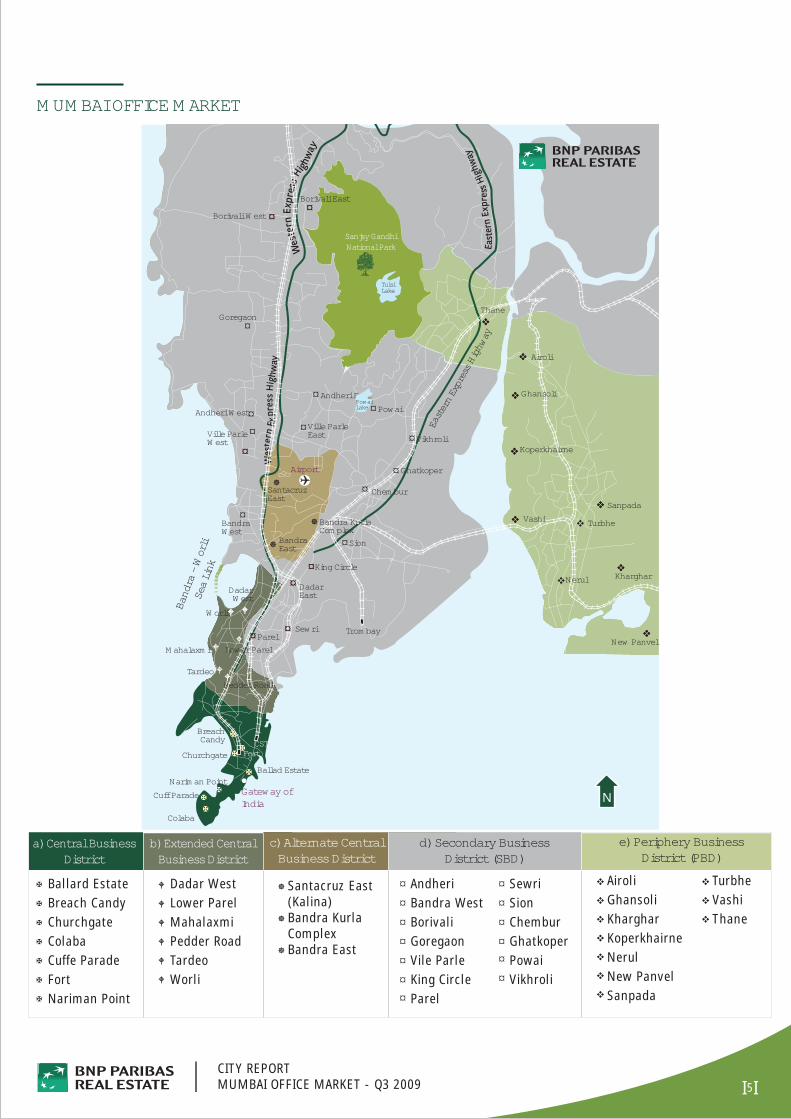
MUMBAI OFFICE MARKET
5I I
Ballard EstateBreach CandyChurchgateColabaCuffe ParadeFortNariman Point
X
X
X
X
X
X
X
Dadar WestLower ParelMahalaxmiPedder RoadTardeoWorli
W
W
W
W
W
W
]
]
]
Santacruz East (Kalina)Bandra KurlaComplexBandra East
a) Central BusinessDistrict
c) Alternate CentralBusiness District
d) Secondary District (SBD)
Businessb) Extended CentralBusiness District
Band
ra -
Wor
liSe
a Li
nk
X
¤
X
X
XX
X
¤
¤¤
¤
¤
v
v
v
v
v
Sanjay GandhiNational Park
¤
v
v
v
WW
yawhgiH sserpxE nretsaE
X
W
]
¤
v
X
X
XX
X
W
W
WW
W¤
¤¤
]
¤
¤¤¤
¤
¤
¤¤
¤
¤
¤
v
v
v
v v
v
v
v
Airport
Colaba
Cuff Parade Gateway ofIndia
Ballad Estate
Churchgate
BreachCandy
XNariman Point
Fort
DadarWest
Lower ParelMahalaxmi
Pedder RoadTardeo
Worli
SantacruzEast
BandraEast
]Bandra KurlaComplex
Andheri East
Andheri West
BandraWest
Borivali East
Borivali West
Goregaon
¤Ville ParleEastVille Parle
West
DadarEast
King Circle
ParelSewri
Sion
Chembur
Vikhroli
Airoli
Ghansoli
Kharghar
Koperkhairne
vNerul
New Panvel
Sanpada
TurbheVashi
Thane
e) Periphery BusinessDistrict (PBD)
AiroliGhansoliKhargharKoperkhairneNerulNew PanvelSanpada
v
v
v
v
v
v
v
TurbheVashiThane
v
v
v
N
¤Powai
¤Ghatkoper
SewriSionChemburGhatkoperPowaiVikhroli
¤¤¤¤¤¤
CITY REPORTMUMBAI OFFICE MARKET - Q3 2009
AndheriBandra WestBorivaliGoregaonVile ParleKing CircleParel
¤¤¤¤¤¤¤
PowaiLake
TulsiLake
Trombay
CST

6I I
CENTRAL BUSINESS DISTRICT (CBD)
In the CBD area, no fresh suppy was added. However a few old buildings are being refurbished and repositioned as the new Grade- A supply. One such example is Express Towers in Nariman point, located at walking distance from Trident – Oberoi Hotel. The letting rates have now stabilised, though the owners have become more flexible in offering long term leases (9 years). There is an opportunistic demand from small and medium investors to own offices between 3,000- 10,000 sq.ft. in the Nariman point/ Fort/ Cuffe Parade area. However, no fresh supply is recorded in this area. There is a demand for office space in excess of 50,000 sq.ft. from 4-5 corporates in the banking and financial services industry.
Q22008
Q32008
Q42008
Q12009
Q22009
—
10,000
20,000
30,000
40,000
50,000
60,000
Nariman Point Ballard Estate
Cuffe Parade Fort
Capi
tal V
alue
s (in
Rs
/ sq.
ft)
CITY REPORTMUMBAI OFFICE MARKET - Q3 2009
Repositioning of old stock has started to happen
70,000
Q22008
Q32008
Q42008
Q12009
Q22009
0
100
200
300
400
500
Nariman Point Ballard Estate
Cuffe Parade Fort
600
Rent
al V
alue
s (in
Rs
/ sq.
ft /
mon
th)
Q32009
Q32009
Ballard Estate 450 400 300 275 250
Nariman Point 500 450 375 350 325Fort 300 250 170 150 150
Cuffe Parade 350 280 250 225 200
Q22008
Q32008
Q42008
Q12009
Q22009
RENTALS OVER THE PAST 6 QUARTERS
Source: BNP Paribas Real Estate, India
Q32009
250
325150
200
Q22008
Q32008
Q42008
Q12009
Q22009
Ballard Estate 45,000 42,000 38,000 35,000 35,000
Nariman Point 60,000 50,000 45,000 40,000 40,000Fort 30,000 27,500 25,000 22,500 22,500
Cuffe Parade 35,000 32,000 32,000 30,000 30,000
CAPITAL VALUES OVER THE PAST 6 QUARTERS
Source: BNP Paribas Real Estate, India
Q32009
35,000
40,00022,500
30,000
EXTENDED CENTRAL BUSINESS DISTRICT(ECBD)
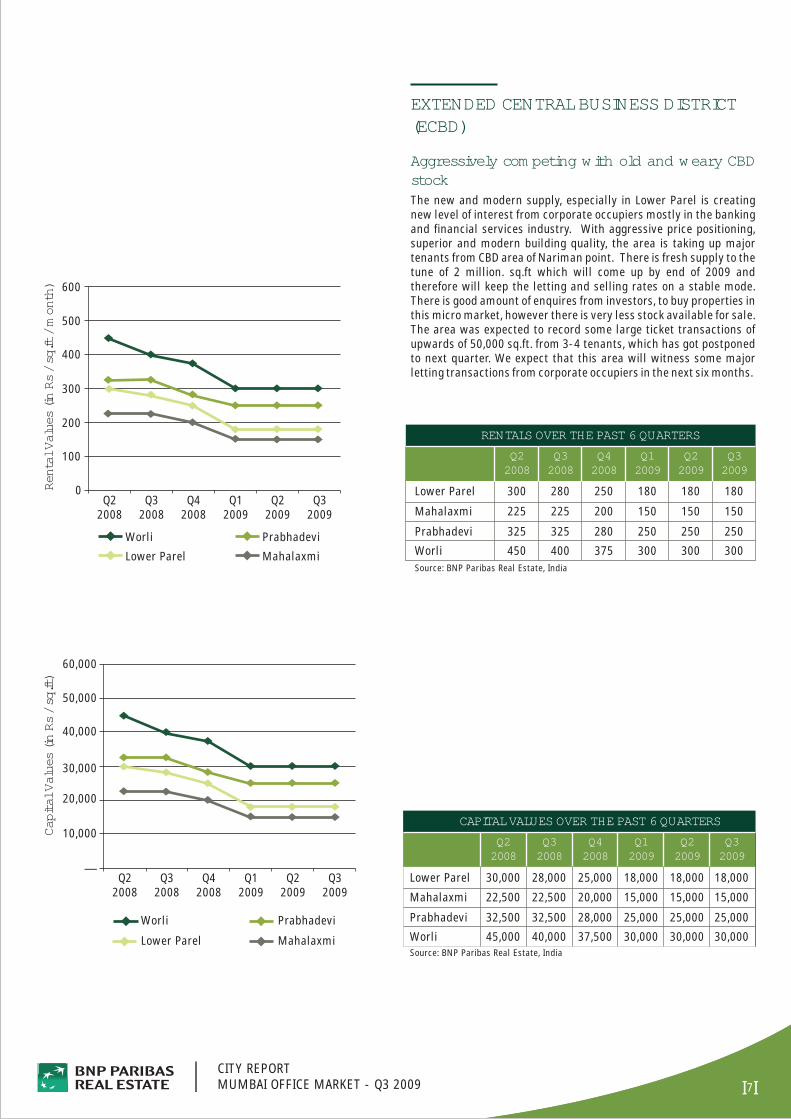
The new and modern supply, especially in Lower Parel is creating new level of interest from corporate occupiers mostly in the banking and financial services industry. With aggressive price positioning, superior and modern building quality, the area is taking up major tenants from CBD area of Nariman point. There is fresh supply to the tune of 2 million. sq.ft which will come up by end of 2009 and therefore will keep the letting and selling rates on a stable mode. There is good amount of enquires from investors, to buy properties in this micro market, however there is very less stock available for sale. The area was expected to record some large ticket transactions of upwards of 50,000 sq.ft. from 3-4 tenants, which has got postponed to next quarter. We expect that this area will witness some major letting transactions from corporate occupiers in the next six months.
7I ICITY REPORTMUMBAI OFFICE MARKET - Q3 2009
Aggressively competing with old and weary CBD stock
Rent
al V
alue
s (in
Rs
/ sq.
ft /
mon
th)
Q22008
Q32008
Q42008
Q12009
Q22009
0
100
200
300
400
Worli Prabhadevi
Lower Parel Mahalaxmi
500
600
Q32009
Capi
tal V
alue
s (in
Rs
/ sq.
ft)
Q22008
Q32008
Q42008
Q12009
Q22009
—
10,000
30,000
40,000
Worli Prabhadevi
Lower Parel Mahalaxmi
50,000
60,000
20,000
Q32009
Mahalaxmi 225 225 200 150
Lower Parel 300 280 250 180
Worli 450 400 375 300 300
Prabhadevi 325 325 280 250 250
150
180
Q22008
Q32008
Q42008
Q12009
Q22009
RENTALS OVER THE PAST 6 QUARTERS
Source: BNP Paribas Real Estate, India
Q32009
300
250
150
180
Q22008
Q32008
Q42008
Q12009
Q22009
Mahalaxmi 22,500 22,500 20,000 15,000
Lower Parel 30,000 28,000 25,000 18,000
Worli 45,000 40,000 37,500 30,000 30,000
Prabhadevi 32,500 32,500 28,000 25,000 25,000
15,000
18,000
CAPITAL VALUES OVER THE PAST 6 QUARTERS
Source: BNP Paribas Real Estate, India
Q32009
30,000
25,000
15,000
18,000
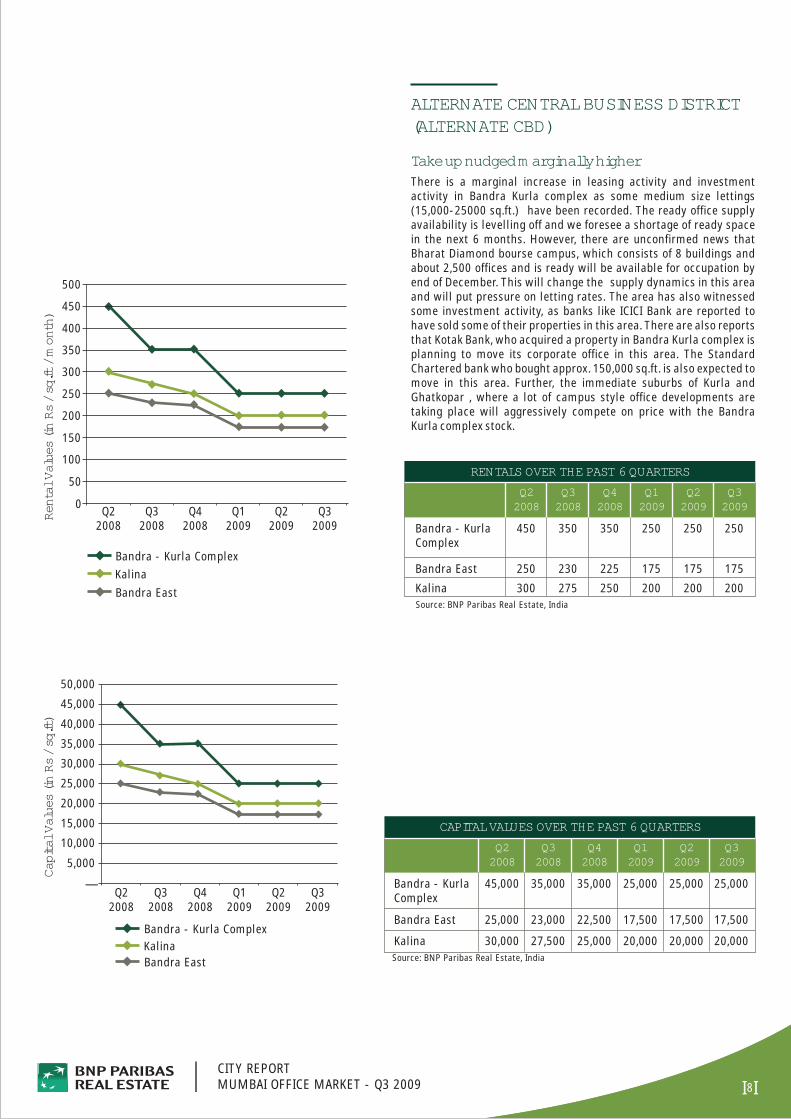
ALTERNATE CENTRAL BUSINESS DISTRICT(ALTERNATE CBD)
There is a marginal increase in leasing activity and investment activity in Bandra Kurla complex as some medium size lettings (15,000-25000 sq.ft.) have been recorded. The ready office supply availability is levelling off and we foresee a shortage of ready space in the next 6 months. However, there are unconfirmed news that Bharat Diamond bourse campus, which consists of 8 buildings and about 2,500 offices and is ready will be available for occupation by end of December. This will change the supply dynamics in this area and will put pressure on letting rates. The area has also witnessed some investment activity, as banks like ICICI Bank are reported to have sold some of their properties in this area. There are also reports that Kotak Bank, who acquired a property in Bandra Kurla complex is planning to move its corporate office in this area. The Standard Chartered bank who bought approx. 150,000 sq.ft. is also expected to move in this area. Further, the immediate suburbs of Kurla and Ghatkopar , where a lot of campus style office developments are taking place will aggressively compete on price with the Bandra Kurla complex stock.
8I I
Capi
tal V
alue
s (in
Rs
/ sq.
ft)
Q22008
Q32008
Q42008
Q12009
Q22009
—
5,000
20,000
25,000
40,000
10,000
15,000
30,000
35,000
Bandra - Kurla ComplexKalinaBandra East
CITY REPORTMUMBAI OFFICE MARKET - Q3 2009
Take up nudged marginally higher
50,000
45,000
Q32009
Bandra - Kurla ComplexKalinaBandra East
Rent
al V
alue
s (in
Rs
/ sq.
ft /
mon
th)
Q22008
Q32008
Q42008
Q12009
Q22009
0
50
100
150
200
250
300
350
400
450
500
Q32009
Q22008
Q32008
Q42008
Q12009
Q22009
Bandra - KurlaComplex
450 350 350 250 250
Bandra East 250 230 225 175 175
Kalina 300 275 250 200 200
RENTALS OVER THE PAST 6 QUARTERS
Source: BNP Paribas Real Estate, India
Q32009
250
175
200
Bandra - KurlaComplex
45,000 35,000 35,000 25,000 25,000
Bandra East 25,000 23,000 22,500 17,500 17,500
Kalina 30,000 27,500 25,000 20,000 20,000
Q22008
Q32008
Q42008
Q12009
Q22009
CAPITAL VALUES OVER THE PAST 6 QUARTERS
Source: BNP Paribas Real Estate, India
Q32009
25,000
17,500
20,000
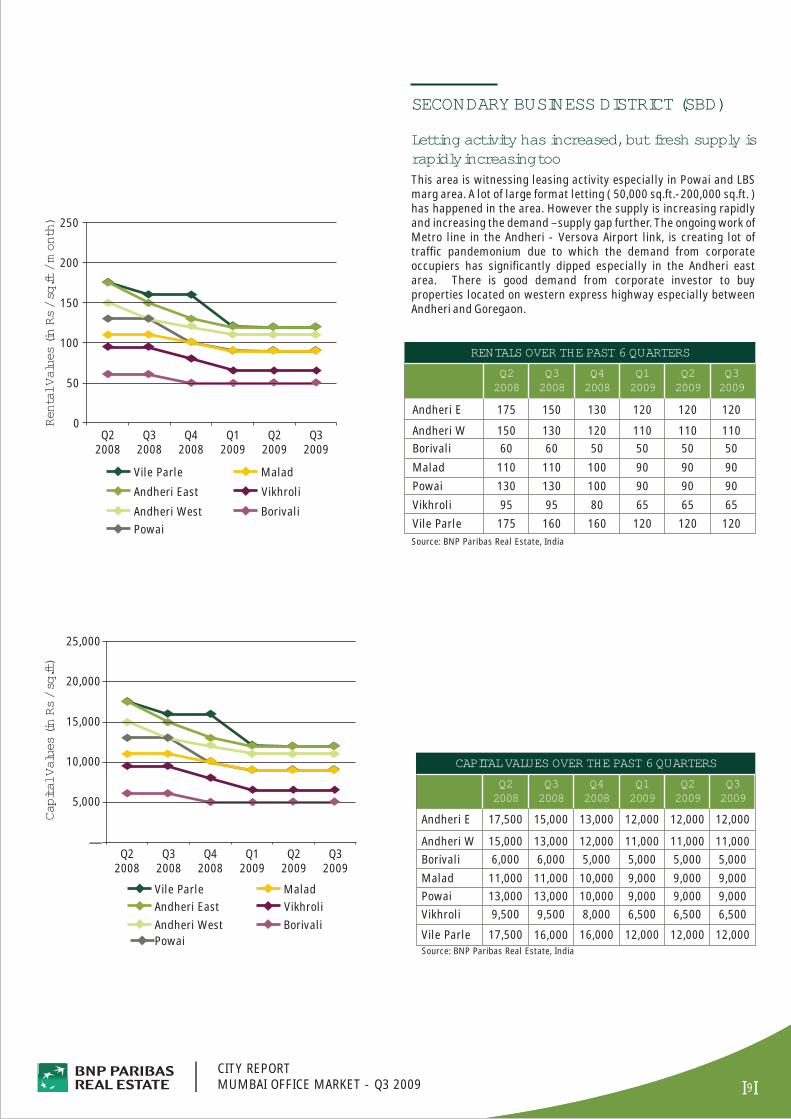
SECONDARY BUSINESS DISTRICT (SBD)
This area is witnessing leasing activity especially in Powai and LBS marg area. A lot of large format letting ( 50,000 sq.ft.-200,000 sq.ft. ) has happened in the area. However the supply is increasing rapidly and increasing the demand –supply gap further. The ongoing work of Metro line in the Andheri - Versova Airport link, is creating lot of traffic pandemonium due to which the demand from corporate occupiers has significantly dipped especially in the Andheri east area. There is good demand from corporate investor to buy properties located on western express highway especially between Andheri and Goregaon.
9I ICITY REPORTMUMBAI OFFICE MARKET - Q3 2009
Letting activity has increased, but fresh supply is rapidly increasing too
Capi
tal V
alue
s (in
Rs
/ sq.
ft)
—
5,000
25,000
20,000
Vile ParleAndheri EastAndheri WestPowai
MaladVikhroliBorivali
10,000
15,000
Q22008
Q32008
Q42008
Q12009
Q22009
Q32009
Rent
al V
alue
s (in
Rs
/ sq.
ft /
mon
th)
Q22008
Q32008
Q42008
Q12009
Q22009
0
100
150
200
Vile Parle
Andheri East
Andheri WestPowai
Malad
Vikhroli
Borivali
50
250
Q32009
Q22008
Q32008
Q42008
Q12009
Q22009
Vile Parle 175 160 160 120 120
Andheri W 150 130 120 110 110
Andheri E 175 150 130 120 120
Powai 130 130 100 90 90Vikhroli 95 95 80 65
Malad 110 110 100 90Borivali 60 60 50 50
65
9050
RENTALS OVER THE PAST 6 QUARTERS
Source: BNP Paribas Real Estate, India
Q32009
120
110
120
9065
9050
Vile Parle 17,500 16,000 16,000 12,000 12,000
Andheri W 15,000 13,000 12,000 11,000 11,000
Andheri E 17,500 15,000 13,000 12,000 12,000
Powai 13,000 13,000 10,000 9,000 9,000Vikhroli 9,500 9,500 8,000 6,500 6,500
Malad 11,000 11,000 10,000 9,000 9,000Borivali 6,000 6,000 5,000 5,000 5,000
Q22008
Q32008
Q42008
Q12009
Q22009
CAPITAL VALUES OVER THE PAST 6 QUARTERS
Source: BNP Paribas Real Estate, India
Q32009
12,000
11,000
12,000
9,0006,500
9,0005,000
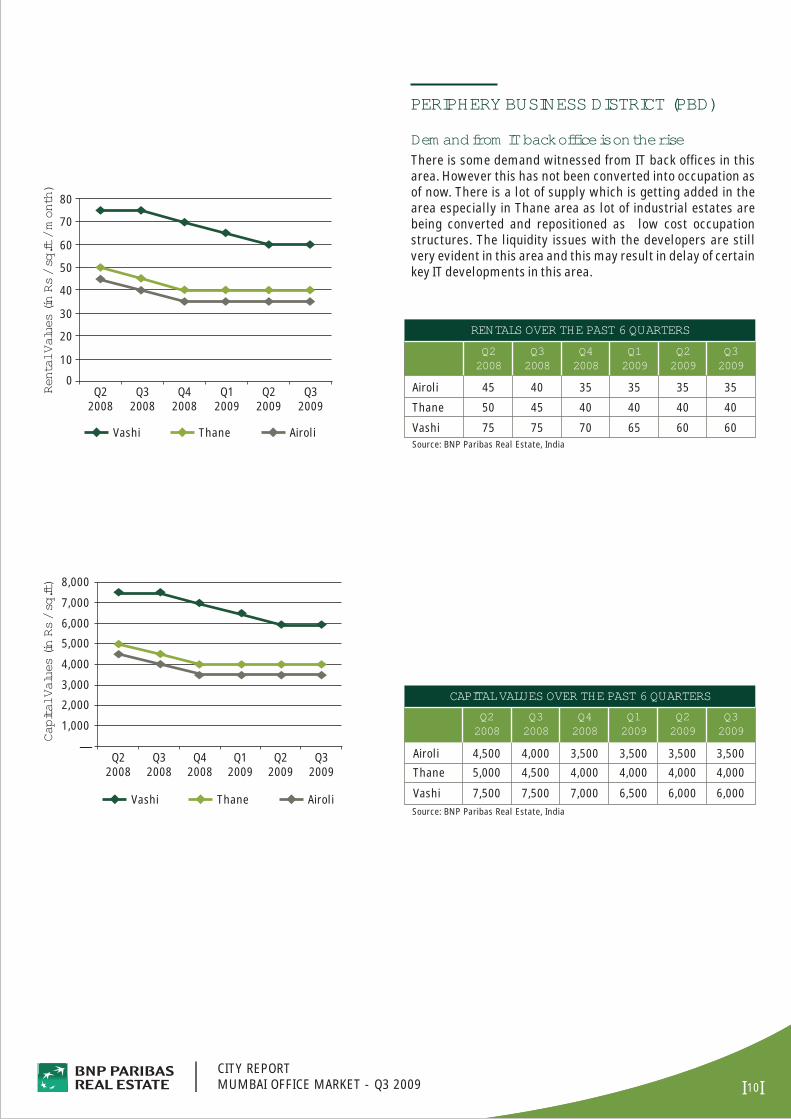
PERIPHERY BUSINESS DISTRICT (PBD)
There is some demand witnessed from IT back offices in this area. However this has not been converted into occupation as of now. There is a lot of supply which is getting added in the area especially in Thane area as lot of industrial estates are being converted and repositioned as low cost occupation structures. The liquidity issues with the developers are still very evident in this area and this may result in delay of certain key IT developments in this area.
10I ICITY REPORTMUMBAI OFFICE MARKET - Q3 2009
Demand from IT back office is on the rise
Q22008
Q32008
Q42008
Q12009
Q22009
0
10
20
30
40
50
60
70
80
Vashi Thane Airoli
Rent
al V
alue
s (in
Rs
/ sq.
ft /
mon
th)
Q32009
Q22008
Q32008
Q42008
Q12009
Q22009
—
1,000
2,000
3,000
4,000
5,000
6,000
7,000
8,000
Capi
tal V
alue
s (in
Rs
/ sq.
ft)
Vashi Thane Airoli
Q32009
Thane 50 45 40 40 40
Airoli 45 40 35 35 35
Vashi 75 75 70 65 60
Q22008
Q32008
Q42008
Q12009
Q22009
RENTALS OVER THE PAST 6 QUARTERS
Source: BNP Paribas Real Estate, India
Q32009
40
35
60
Thane 5,000 4,500 4,000 4,000 4,000
Airoli 4,500 4,000 3,500 3,500 3,500
Vashi 7,500 7,500 7,000 6,500 6,000
Q22008
Q32008
Q42008
Q12009
Q22009
CAPITAL VALUES OVER THE PAST 6 QUARTERS
Source: BNP Paribas Real Estate, India
Q32009
4,000
3,500
6,000
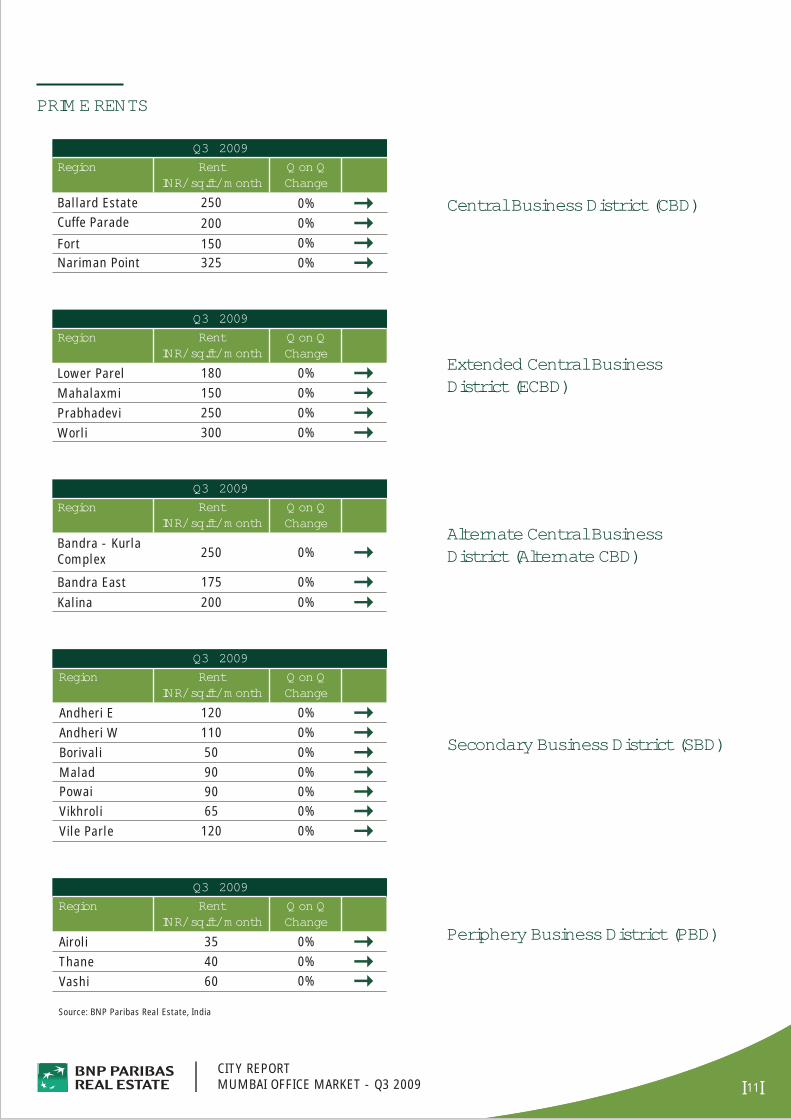
PRIME RENTS
Central Business District (CBD)
Extended Central BusinessDistrict (ECBD)
Alternate Central BusinessDistrict (Alternate CBD)
11I I
Secondary Business District (SBD)
Periphery Business District (PBD)
CITY REPORTMUMBAI OFFICE MARKET - Q3 2009
RentINR/ sq.ft/ month
Ballard Estate 250
Nariman Point 325Fort 150
Cuffe Parade 200
Region Q on QChange
Q3 2009
Mahalaxmi 150 0%Lower Parel 180
Worli 300Prabhadevi 250 0%
Region RentINR/ sq.ft/ month
0%
0%
Q on QChange
Q3 2009
Bandra - KurlaComplex 250 0%
Bandra East 175 0%Kalina 200 0%
Region RentINR/ sq.ft/ month
Q on QChange
Q3 2009
Vile Parle 120 0%
Andheri W 110Andheri E 120
Powai 90
Region
Vikhroli 65
Malad 90Borivali 50
RentINR/ sq.ft/ month
0%0%
0%
0%0%
0%
Q on QChange
Q3 2009
Thane 40 0%Airoli 35 0%
Vashi 60
Region RentINR/ sq.ft/ month
Q on QChange
Q3 2009
Source: BNP Paribas Real Estate, India
0%0%
0%
0%
0%

CAPITAL VALUES
Central Business District (CBD)
Extended Central BusinessDistrict (ECBD)
Alternate Central BusinessDistrict (Alternate CBD)
12I I
Secondary Business District (SBD)
Periphery Business District (PBD)
CITY REPORTMUMBAI OFFICE MARKET - Q3 2009
Thane 4,000 0%Airoli 3,500 0%
Vashi 6,000
Region Q on QChange
CAPITAL Q3 2009
Vile Parle 12,000 0%
Andheri W 11,000Andheri E 12,000
Powai 9,000Vikhroli 6,500
Malad 9,000Borivali 5,000
0%0%
0%
0%0%
0%
Region Q on QChange
CAPITAL Q3 2009
Bandra - KurlaComplex 25,000 0%
Bandra East 17,500 0%Kalina 20,000 0%
Region Q on QChange
CAPITAL Q3 2009
Mahalaxmi 15,000 0%Lower Parel 18,000
Worli 30,000Prabhadevi 25,000 0%
0%
0%
Region Q on QChange
CAPITAL Q3 2009
Ballard Estate 35,000 0%
Nariman Point 40,000 0%Fort 22,500 0%Cuffe Parade 30,000 0%
RegionCAPITAL Q3 2009
INR / sq.ft Q on QChange
INR / sq.ft
INR / sq.ft
INR / sq.ft
INR / sq.ft
Source: BNP Paribas Real Estate, India
0%
13I I
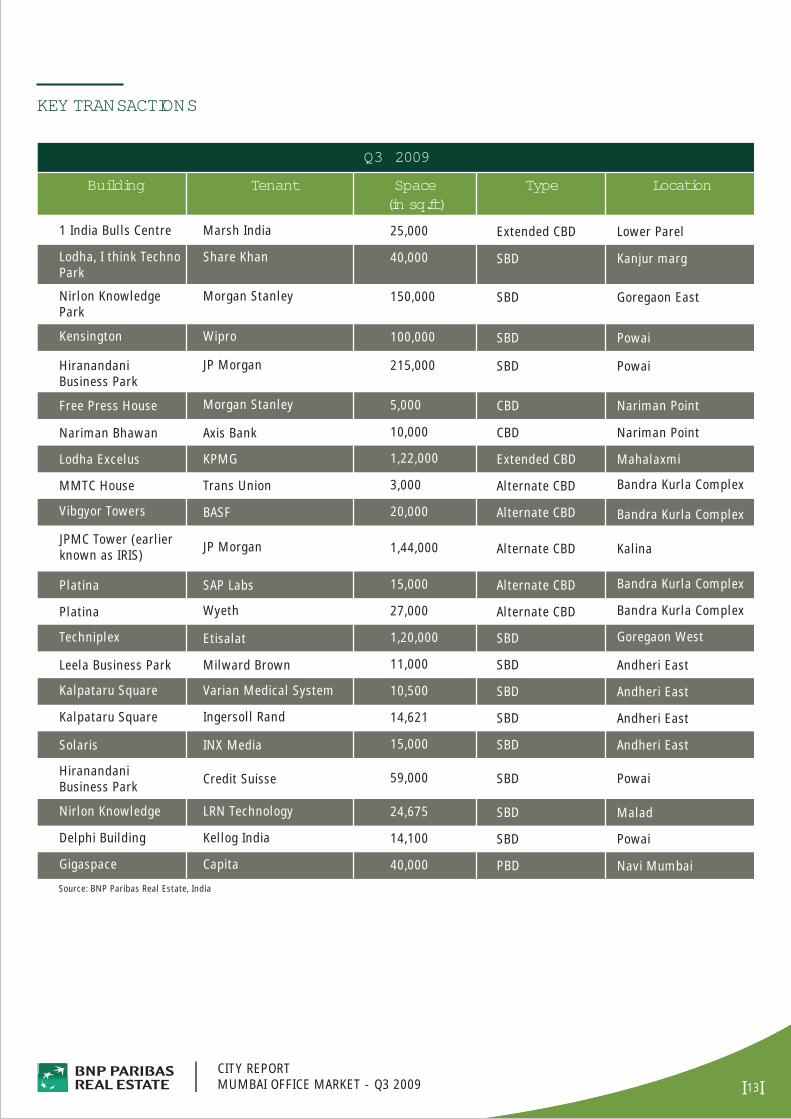
KEY TRANSACTIONS
Building Tenant Space(in sq.ft)
Type Location
CITY REPORTMUMBAI OFFICE MARKET - Q3 2009
Q3 2009
Nariman Bhawan Axis Bank 10,000 CBD Nariman Point
MMTC House Trans Union 3,000 Alternate CBD
JPMC Tower (earlierknown as IRIS) JP Morgan 1,44,000 Alternate CBD Kalina
Bandra Kurla Complex
Platina Wyeth 27,000 Alternate CBD Bandra Kurla Complex
Leela Business Park Milward Brown 11,000 SBD Andheri East
Kalpataru Square Ingersoll Rand 14,621 SBD Andheri East
HiranandaniBusiness Park Credit Suisse 59,000 SBD Powai
Delphi Building Kellog India 14,100 SBD Powai
Free Press House Morgan Stanley 5,000 CBD Nariman Point
Lodha Excelus KPMG 1,22,000 Extended CBD Mahalaxmi
Vibgyor Towers BASF 20,000 Alternate CBD Bandra Kurla Complex
Platina SAP Labs 15,000 Alternate CBD Bandra Kurla Complex
Techniplex Etisalat 1,20,000 SBD Goregaon West
Kalpataru Square Varian Medical System 10,500 SBD Andheri East
Solaris INX Media 15,000 SBD Andheri East
Nirlon Knowledge LRN Technology 24,675 SBD Malad
Gigaspace Capita 40,000 PBD Navi Mumbai
Source: BNP Paribas Real Estate, India
1 India Bulls Centre Marsh India 25,000 Lower Parel
Lodha, I think TechnoPark
Share Khan 40,000 Kanjur marg
Nirlon KnowledgePark
Morgan Stanley 150,000 Goregaon East
Kensington Wipro 100,000 Powai
JP Morgan 215,000 Powai
Extended CBD
SBD
SBD
SBD
SBD
HiranandaniBusiness Park
14I I
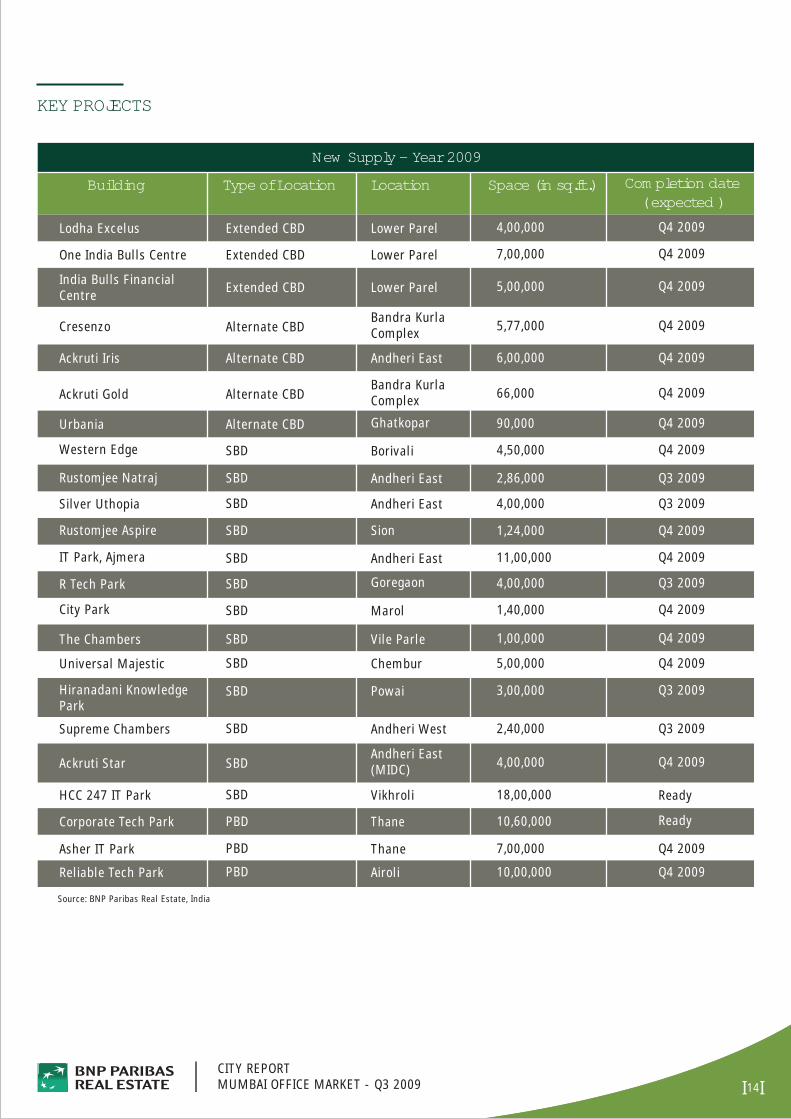
KEY PROJECTS
Building Type of Location Location Space (in sq.ft.) Completion date( expected )
CITY REPORTMUMBAI OFFICE MARKET - Q3 2009
New Supply – Year 2009
Lodha Excelus Extended CBD Lower Parel 4,00,000 Q4 2009
One India Bulls Centre Lower Parel Q4 2009Extended CBD 7,00,000
India Bulls FinancialCentre Extended CBD Lower Parel 5,00,000 Q4 2009
Cresenzo Alternate CBDBandra KurlaComplex 5,77,000 Q4 2009
Ackruti Star SBDAndheri East(MIDC) 4,00,000 Q4 2009
Ackruti Iris Alternate CBD Andheri East 6,00,000 Q4 2009
Rustomjee Aspire SBD Sion 1,24,000 Q4 2009
Supreme Chambers SBD Andheri West 2,40,000 Q3 2009
Bandra KurlaComplexAckruti Gold Alternate CBD 66,000 Q4 2009
Hiranadani KnowledgePark
SBD Powai 3,00,000 Q3 2009
Western Edge SBD Borivali 4,50,000 Q4 2009
Silver Uthopia SBD Andheri East 4,00,000 Q3 2009
IT Park, Ajmera SBD Andheri East 11,00,000 Q4 2009
City Park SBD Marol 1,40,000 Q4 2009
Universal Majestic SBD Chembur 5,00,000 Q4 2009
Asher IT Park PBD Thane 7,00,000 Q4 2009
Source: BNP Paribas Real Estate, India
Urbania Alternate CBD Ghatkopar 90,000 Q4 2009
Rustomjee Natraj SBD Andheri East 2,86,000 Q3 2009
R Tech Park SBD Goregaon 4,00,000 Q3 2009
The Chambers SBD Vile Parle 1,00,000 Q4 2009
Reliable Tech Park PBD Airoli 10,00,000 Q4 2009
Corporate Tech Park PBD Thane Ready
HCC 247 IT Park SBD Vikhroli Ready18,00,000
10,60,000

GLOSSARYQ3:
Absorption:
Bare Shell:
BPO:
BUA:
CBD:
ECBD:
ACBD:
SBD:
PBD:
Completed Stock:
DU:
EPIP:
FAR:
Grade A:
Ground Coverage:
Hard Option:
INR:
Rs:
PBD:
Pre-lease:
Speculative Stock:
Stock:
Supply:
Tier I Cities:
Tier II Cities:
Transaction Volumes:
Vacancy:
Warm Shell:
Q on Q:
y-o-y:
IT:
ITES:
NCR:
ORR:
Repo Rate:
Reverse Repo Rate:
SEC A, B, C & D Socio:
Sq.ft:
Stamp Duty:
Quarter 3 of the financial year
Occupied Stock (n) – Occupied Stock (n-1); Where “n” is the specified period (quarter, year etc.)
Premises consisting of basic structure with lifts, power supply to junction box, water supply line, toilets
Business Process Outsourcing
Built up area
Central Business District
Extended Central Business District
Alternate Central Business District
Secondary Business District
Periphery Business District
Either the building has received occupancy certificate or the client has moved in and occupied space and started working in a particular premises
Dwelling Unit
Export Promotion Industrial Park
Floor Area Ratio (BUA/ Plot Area)
Space Office Space with efficiency in excess of 75%, floor plate in excess of 15,000 sq. ft., Car Parking ratio of atleast 1 per 1000 sq. ft., Floor-to-ceiling height in excess of 3.75 m, Power provision of 1.25KVA per 100 sq. ft. with 100% power-backup wherever applicable and professionally managed facilities
It is the total covered area on ground by the built component and is expressed as a percentage of the plot area
Real estate space reserved by the lessee for future occupation within a particular time frame and at a pre-decided rental
Indian National Rupees
Rupees
Peripheral Business District
Space committed for lease before completion of construction
The stock which can be leased and excludes Built-to-Suit (BTS) and Campus facilities.
Cumulative Supply
New construction in a particular specified period
NCR, Mumbai and Bangalore
Chennai, Hyderabad, Pune, Kolkata
Total number of transaction in a particular specified period
Total vacant space in the completed stock
Premises consisting of power backup, high side A.C., common area fit outs and fitted out toilets
Quarter on Quarter
year-on-year (All growth figures in this report are y-o-y unless otherwise mentioned
Information Technology
Information Technology Enabled Services (includes various services ranging from call centres, claims processing, medical transcription, e-CRM, SCM to back-office operations such as accounting, data processing, and data mining)
National Capital Region (includes urban agglomeration of Delhi, Gurgaon, Faridabad, Noida, Gaziabad etc.)
Outer Ring Road
Rate that an eligible depository institution (such as a bank) is charged to borrow short term funds directly from the central bank through the discount window
Interest rate that a bank earns for lending money to the Reserve Bank of India in exchange for government securities
Economic Classification; SEC A represents the highest propensity to spend and SEC D represents the lowest propensity to spend.
Square Feet
Form of tax charged on instruments (written documents) requiring a physical stamp (for government legality) to be attached to or impressed.
NRI:
New:
Non Resident Indian.
Building built within the last 5 years.
Major Refurbishment:
Recent:
Renovated:
Modern:
Old:
CCI (Cost of construction index):
Demand:
For the occupier:
New Supply:
Completed new supply:
Planning permission granted:
Planning permission submitted:
Pre-letting:
Headline rent:
Average headline rent:
Underlying rent:
Prime rents:
Top rent:
Second hand premises:
Renovated:
Very good condition:
Existing state of repair:
To be renovated:
Supply available within 1 year:
Take-up:
Vacancy rate:
Building which has undergone structural alteration less than 5 years ago, subject to planning permission.
Building less than 10 years old.
Building which has undergone renovation work not requiring for planning permission less than 5 years ago.
High-performance building over 10 years old.
Low-performance building over 10 years old.
Index that makes quarterly measurements of construction prices for new house building. It is the price after VAT paid by the owner to construction companies. It excludes land-related prices and costs (site development, special foundations, etc.), fees and financial costs.
A search for premises expressed to BNP Paribas Real Estate. The analysis pertains only to the flow of new demand expressed.
Operation undertaken by an occupier for its own purposes.
Any new building and/or heavily refurbished building that adds to the existing stocks. These are analysed according to progress.
Buildings on which construction work is finished.
Under construction: Buildings on which construction has effectively begun. Prior demolition work is not taken into account.
Authorisation to build obtained, generally booked after settlement of third party claims.
Planning permission requested, being processed.
Transaction by an occupier more than 6 months before the delivery of the building.
Annual rent per square meter, featured on the lease, and expressed excluding taxes and charges. Does not include attached premises such as parking areas, archives, staff canteens, etc. If the rental is progressive, the value applied is the average for the first 3 years or the fixed term of the lease.
Weighted average of rented area. The average featured is a moving average over 3 quarters, to smooth out the changes.
Annual rent per square meter expressed free of tax and charges and excluding advantages agreed by the owners (rent incentive building works, etc).
Represents the top headline rent (excluding non significant transactions) for an office unit:- of standard size, of the highest quality and specification, in the best location in each market.
Represents the top headline rent for an office unit. It is not necessarily a prime rent.
Premises that have been previously occupied by an occupier for vacant for more than 5 years.
Premises that have been renovated for the new occupier.
High-performance premises of high quality.
Low-performance premises that can be rented as they are.
Low performance premises that need renovation.
All premises and buildings available within 1 year including the supply available immediately, new supply that has not been pre-let and second hand supply that will be vacated definitively (notable terminated leases).
Rental or sale of a property asset, finalised by the signature of a lease or a bill of sale including turnkey transactions and owner-occupier. The transaction is only taken into account once any existing conditional clauses have been lifted.
Ration measuring the relationship between the supply immediately available and the existing stock.
BNP Paribas Real Estate cannot be held responsible if, despites its best efforts, the information contained in the present report turns out to be inaccurate or incomplete. This report is released by BNP Paribas Real Estate and the information in it is dedicated to the exclusive use of its clients. The report and the information contained in it may not be copied or reproduced without prior permission from BNP Paribas Real Estate.
15I ICITY REPORTMUMBAI OFFICE MARKET - Q3 2009

ALBANIADanosBoulevard Deshmoret e KombitTwin Towers - Tower 211th FloorTiranaTel: +355-4-2280488Fax: +355-4-2280192
AUSTRIADr. Max Huber & PartnerDr. Karl-Lueger-Platz 51010 WienTel: +43-1-513 29 39 0Fax: +43-1-513 29 39 14
BULGARIADanos28, Hristo Botev BoulevardSofiaTel: +359-2-9532314Fax: +359-2-9532399
CANADACresa PartnersTel: +1-212-758 3131Fax: +1-212-980 1977
USA787 Seventh Avenue31st FloorNew York City, NY 10019Tel: +1-917-472 4970Fax: +1-212-471 8100
GREECEDanos1, Eratosthenous Str.11635 AthensTel: +30-210 7 567 567Fax: +30-210 7 567 267
JAPANRISA Partners5F Akasaka Intercity 1-11-44Akasaka, Minato-ku107-0052 TokyoTel: +81-3-5573 8011Fax: +81-3-5573 8012
PORTUGALFenaluAv. Eng. Duarte PachecoTorre 2Piso 10, Sala 6/71070-102 LisboaTel: +351-21-3833106Fax: +351-21-3833107
NETHERLANDSHolland Realty PartnersJ.J. Viottastraat 33, 1071 JPAmsterdam,Postbus 96691006 GD AmsterdamTel: +31-20-305 97 20Fax: +31-20-305 97 21
NORTHERN IRELANDWhelan Property Consultants44 Upper Arthur StreetBelfast Bt1 4GJTel: +44-28-9044 1000Fax: +44-28-9033 2266
POLANDKancelaria BrochockiKrakowskie Przedmiescie 1400325 WarsawTel: +48-22-826 14 14Fax: +48-22-828 15 45
Bangalore403, The Estate,121, Dickenson Road,Bangalore - 560 042Tel: +91 80 4050 8888Fax: +91 80 4050 8899
Contact: Anuj [email protected]
Mumbai704, Level 7, MMTC House, C-22,Bandra Kurla Complex, Bandra (E),Mumbai - 400 051Tel: +91 22 6138 8088Fax: +91 22 6138 8089
Contact: Raja [email protected]
DelhiLevel 4, Wing B, Statesman House,Barakhamba Road,New Delhi - 110 001Tel: +91 11 3044 6406Fax: +91 11 3044 6507
Contact: Arjun S. [email protected]
INDIA
LOCATIONS ALLIANCESRUSSIAAstera10, b.2 Nikolskaya Str.Moscow, 109012Tel/Fax: +7-495-925 00 05
SERBIADanos6, Vladimira Popovica StreetBelgrade 11000Tel: +381-11-2600 603Fax: +381-11-2601 571
UKRAINEAstera2a Konstantinovskaya Street04071, KievTel: +38-044-501 50 10Fax: +38-044-501 50 11
USACresa Partners100 Park Avenue, 24th FloorNew York, NY 10017Tel: +1-212-758 3131Fax: +1-212-980 1977
BAHRAINBahrain Financial HarbourWest Tower16th FloorP.O. Box 5253ManamaTel: +971-505 573 055Fax: +973-17 536 506
BELGIUMBlue TowerAvenue Louise 326B14 Louizalaan1050 BrusselsTel: +32-2-646 49 49Fax: +32-2-646 46 50
DUBAIEmmar SquareBuilding No. 1, 7th FloorP.O. Box 7233Dubai, UAETel: +971-505 573 055Fax: +971-44 257 817
FRANCE13 boulevard du Fort de Vaux75017 ParisTel: +33-1-55 65 20 04Fax: +33-1-55 65 20 00
GERMANYGoetheplatz 460311 Frankfurt am MainTel: +49-69-2 98 99 0Fax: +49-69-29 29 14
IRELAND40 Fitzwilliam PlaceDublin 2Tel: +353-1-66 11 233Fax: +353-1-67 89 981
ITALYCorsa Italia, 15/A20122 MilanTel: +39-02-58 33 141Fax: +39-02-58 33 14 39
JERSEY4th Floor, Conway HouseConway StreetSt HelierJersey Je2 3NTTel: +44-15 34-62 90 01Fax: +44-15 34-62 90 11
ABUDHABIAl Bateen AreaPlot No. 144, W-11New Al Bateen MunicipalityStreet 32P.O. Box 2742Abu Dhabi, UAETel: +971-505 573 055Fax: +971-44 257 817
LUXEMBOURGEBBC, Route de Trèves 6Bloc D2633 SenningerbergTel: +352-34 94 84Fax: +352-34 94 73
ROMANIAUnion International Center11 Ion Campineanu StreetSector 1Bucharest 010031Tel: +40-21-312 7000Fax: +40-21-312 7001
SPAINMaría de Molina, 5428006 MadridTel: +34-91-454 96 00Fax: +34-91-454 97 65
UNITED KINGDOM90 Chancery LaneLondon WC2A 1EUTel: +44-20-7338 4000Fax: +44-20-7430 2628
USA787 Seventh Avenue31st FloorNew York City, NY 10019Tel: +1-917-472 4970Fax: +1-212-471 8100
www.realestate.bnpparibas.com