MULTIMODAL RAIN ONITORING VALUATION OF C … · 2018-10-16 · José Fernando Barros Castro Correia...
157
MULTIMODAL BRAIN MONITORING AND EVALUATION OF CEREBROVASCULAR REACTIVITY AFTER SEVERE HEAD INJURY MARIA CELESTE PINHEIRO DIAS FERREIRA THIS DISSERTATION IS SUBMITTED FOR THE DEGREE OF DOCTOR OF PHILOSOPHY AND EUROPEAN DOCTORATE DOCTORAL PROGRAMME IN NEUROSCIENCES FACULTY OF MEDICINE, UNIVERSITY OF PORTO SUPERVISOR JOSÉ ARTUR OSÓRIO DE CARVALHO PAIVA ASSOCIATE PROFESSOR OF THE DEPARTMENT OF MEDICINE FACULTY OF MEDICINE, UNIVERSITY OF PORTO, PORTUGAL CO-SUPERVISOR MAREK CZOSNYKA PROFESSOR OF BRAIN PHYSICS DEPARTMENT OF CLINICAL NEUROSCIENCES, UNIVERSITY OF CAMBRIDGE, UK INSTITUTE OF ELECTRONIC SYSTEMS WARSAW UNIVERSITY OF TECHNOLOGY, POLAND PORTO | 2015
Transcript of MULTIMODAL RAIN ONITORING VALUATION OF C … · 2018-10-16 · José Fernando Barros Castro Correia...

MULTIMODAL BRAIN MONITORING AND EVALUATION OF CEREBROVASCULAR
REACTIVITY AFTER SEVERE HEAD INJURY
MARIA CELESTE PINHEIRO DIAS FERREIRA
THIS DISSERTATION IS SUBMITTED FOR THE DEGREE OF
DOCTOR OF PHILOSOPHY AND EUROPEAN DOCTORATE DOCTORAL PROGRAMME IN NEUROSCIENCESFACULTY OF MEDICINE, UNIVERSITY OF PORTO
SUPERVISOR JOSÉ ARTUR OSÓRIO DE CARVALHO PAIVA ASSOCIATE PROFESSOR OF THE DEPARTMENT OF MEDICINE
FACULTY OF MEDICINE, UNIVERSITY OF PORTO, PORTUGAL
CO-SUPERVISOR MAREK CZOSNYKA PROFESSOR OF BRAIN PHYSICS
DEPARTMENT OF CLINICAL NEUROSCIENCES, UNIVERSITY OF CAMBRIDGE, UK INSTITUTE OF ELECTRONIC SYSTEMS
WARSAW UNIVERSITY OF TECHNOLOGY, POLAND
PORTO | 2015

ii
This dissertation is the result of my own work and includes nothing which is the outcome of
work done in collaboration except where specifically indicated in the text.
This dissertation does not exceed the word limit of 60’000 words.
Artigo 48º, § 3º - “A Faculdade não responde pelas doutrinas expendidas na dissertação.”
Regulamento da Faculdade de Medicina da Universidade do Porto.
Decreto-Lei n. º 19337 de 29 de Janeiro de 1931
Multimodal Brain Monitoring and Evaluation of Cerebrovascular Reactivity After Severe Head InjuryCeleste Diasdo autor
2015
título
autoredição
isbn ano
978-989-20-5529-9

iii
“philosophy tells us how to proceed when we want to find out what may be true,
or is most likely to be true, where it is impossible to know with certainty what is
true. The art of rational conjecture is very useful in two different ways. First: often
the most difficult step in the discovery of what is true is thinking of a hypothesis
which may be true; when once the hypothesis has been thought of, it can be
tested, but it may require a man of genius to think of it. Second: we often have to
act in spite of uncertainty, because delay would be dangerous or fatal; in such a
case, it is useful to possess an art by which we can judge what is probable.”
in The Art of Rational Conjecture, Bertrand Russell

iv
LIST OF PROFESSORSHIPS AT THE FACULTY OF MEDICINE, UNIVERSITY OF PORTO
CORPO CATEDRÁTICO DA FACULDADE DE MEDICINA, UNIVERSIDADE DO PORTO
FACULTY PROFESSORS
PROFESSORES EFETIVOS
EMERITUS / RETIRED PROFESSORS
PROFESSORES JUBILADOS / APOSENTADOS
Manuel Alberto Coimbra Sobrinho Simões
Maria Amélia Duarte Ferreira
José Agostinho Marques Lopes
Patrício Manuel Vieira Araújo Soares Silva
Daniel Filipe Lima Moura
Alberto Manuel Barros da Silva
José Manuel Lopes Teixeira Amarante
José Henrique Dias Pinto de Barros
Maria Fátima Machado Henriques Carneiro
Isabel Maria Amorim Pereira Ramos
Deolinda Maria Valente Alves Lima Teixeira
Maria Dulce Cordeiro Madeira
Altamiro Manuel Rodrigues Costa Pereira
Rui Manuel Almeida Mota Cardoso
António Carlos Freitas Ribeiro Saraiva
José Carlos Neves da Cunha Areias
Manuel Jesus Falcão Pestana Vasconcelos
João Francisco M. A. Lima Bernardes
Maria Leonor Martins Soares David
Rui Manuel Marques Nunes
José Eduardo Torres Eckenroth Guimarães
Francisco Fernando Rocha Gonçalves
José Manuel Pereira Dias de Castro Lopes
António Albino Coelho M. Abrantes Teixeira
Joaquim Adelino C. Ferreira Leite Moreira
Raquel Ângela Silva Soares Lino
Abel Vitorino Trigo Cabral
Alexandre Alberto Guerra Sousa Pinto
Álvaro Jerónimo Leal Machado de Aguiar
Amândio Gomes Sampaio Tavares
António Augusto Lopes Vaz
António Carvalho Almeida Coimbra
António Fernandes Oliveira B. Ribeiro Braga
António Germano Silva Pina Leal
António José Pacheco Palha
António Manuel Sampaio de Araújo Teixeira
Belmiro dos Santos Patrício
Cândido Alves Hipólito Reis
Carlos Rodrigo Magalhães Ramalhão
Cassiano Pena de Abreu e Lima
Daniel Santos Pinto Serrão
Eduardo J. Cunha Rodrigues Pereira
Fernando Tavarela Veloso
Francisco de Sousa LéHenrique José F. G. Lecour de Menezes
Jorge Manuel Mergulhão Castro Tavares
José Carvalho de Oliveira
José Fernando Barros Castro Correia
José Luís Medina Vieira
José Manuel Costa Mesquita Guimarães
Levi Eugénio Ribeiro Guerra
Luís Alberto Martins Gomes de Almeida
Manuel António Caldeira Pais Clemente
Manuel Augusto Cardoso de Oliveira
Manuel Machado Rodrigues Gomes
Manuel Maria Paula Barbosa
Maria da Conceição F. Marques Magalhães
Maria Isabel Amorim de Azevedo
Mário José Cerqueira Gomes Braga
Serafim Correia Pinto Guimarães
Valdemar Miguel Botelho dos Santos
Walter Friedrich Alfred Osswald

v
Evaluation Committee / Constituição do Júri
PRESIDENT / PRESIDENTE
MEMBERS / VOGAIS
Doutora Maria Amélia Duarte FerreiraDiretora da Faculdade de Medicina, Universidade do Porto
Doctor Ari ErcoleLecturer and Consultant, Cambridge University Hospitals NHS Foundantion Trust, United Kingdom
Doutor Victor César Ferreira de Moura GonçalvesProfessor Auxiliar Convidado, Faculdade de Medicina, Universidade de Lisboa
Doutora Maria Cristina GranjaProfessora Auxiliar Convidada, Departamento de Ciencias Biomédicas e Medicina, Universidade do Algarve
Doutora Deolinda Maria Valente Alves Lima TeixeiraProfessora Caterática, Faculdade de Medicina, Universidade do Porto
Doutor Rui Manuel Cardoso VazProfessor Catedrático Convidado, Faculdade de Medicina, Universidade do Porto
Doutor José Artur Osório de Carvalho PaivaProfessor Associado Convidado, Faculdade de Medicina, Universidade do Porto

vi
Ao Henrique
Aos meus filhos, Catarina e Tiago
Aos meus Pais
À minha Família

vii
To Henrique
To Catarina e Tiago
To my Parents
To my Family

viii
AGRADECIMENTOS
Em primeiro lugar, agradeço a todos os pacientes e seus familiares que aceitaram participar neste
estudo.
De modo especial e com muita honra, gostaria de agradecer aos meus supervisores Prof. José
Artur Paiva e Prof. Marek Czosnyka. Estou muito reconhecida pelo tempo inestimável que eles dedicaram a este projeto de doutoramento. É difícil expressar a minha gratidão por todas as suas
contribuições que tornaram esta experiência produtiva e estimulante. Sem o seu apoio e
orientação constantes, seria impossível concretizar este trabalho.
Sem a amizade e enorme ajuda dos meus colegas da Unidade de Cuidados Neurocríticos, Eduarda
Pereira, Elisabete Monteiro, Isabel Maia, Silvina Barbosa, Sofia Silva e Teresa Honrado, este estudo
nunca poderia ter sido concluído. Gostaria também de agradecer o apoio que recebi dos outros
meus colegas do Serviço de Medicina Intensiva, do Serviço de Neurocirurgia e do Serviço de
Neurorradiologia.
Agradeço reconhecidamente a todos os enfermeiros e técnicos da Unidade de Cuidados
Neurocríticos pela sua motivação e compromisso com este projeto.
Ao Prof. António Cerejo o meu obrigado especial pelas discussões frutíferas e preocupações
clínicas que partilhamos e pelos muitos planos e ideias que em conjunto temos vindo a realizar.
Um agradecimento com amizade para os membros do Group of Brain Physiscs, University of Cambridge, UK, especialmente Dr Peter Smielewski, Dra Zofia Czosnyka, Marcel Aries, Corien
Weersink, Xiuyun Liu, Georgios Varsos, Joseph Donnelly e Christian Zweifel. Gostaria também de
agradecer ao Prof. John Pickard cuja experiência e conhecimento foi uma fonte de motivação.
Agradeço também aos colegas do Departamento de Matemática da Universidade do Porto,
particularmente à Prof. Ana Paula Rocha, Prof. Ana Rita Gaio, Prof. Óscar Felgueiras e Maria João
Silva pelo seu conhecimento especializado e colaboração na análise estatística.
Para os engenheiros de software Albano Sousa, Telmo Fonseca, Ricardo Sal e Carla Ávila um obrigado especial pela sua boa vontade e apoio, que foi fundamental para resolver os problemas
da área da informática e engenharia biomédica.
Finalmente, gostaria de agradecer à minha Família pelo carinho, compreensão, paciência e
apoio moral. Henrique, Catarina e Tiago, vocês são a minha força. Eu amo-vos.

ix
ACKNOWLEDGEMENTS
Firstly, I would like to thank all the patients and their relatives who have consented to participate in
this study.
Most importantly with great honour, I wish to thank my supervisors Prof. José Artur Paiva and
Prof. Marek Czosnyka. I appreciate the priceless time they dedicated to this project. It is difficult to
overstate my gratitude for all their contributions to make my PhD experience productive and
stimulating. Without their constant support and guidance it would be impossible to materialise this
work.
Without the friendship and enormous help of my colleagues from the Neurocritical Care Unit,
Eduarda Pereira, Elisabete Monteiro, Isabel Maia, Silvina Barbosa, Sofia Silva e Teresa Honrado this
study could never have been completed. I would also like to acknowledge the support that I have
received from the other colleagues from the Intensive Care Department, Department of
Neurosurgery and Department of Neuroradiology.
I am also extremely grateful to all the nurses and technical staff at the Neurocritical Care
Unit for their motivation and commitment with this project.
I am indebted to Prof. António Cerejo, with whom I shared fruitful discussions and clinical concerns
and with whom many plans and ideas came to be realised.
A friendly thank to the colleagues from the Brain Physics Group, University of Cambridge, UKespecially Dr Peter Smielewski, Dr Zofia Czosnyka, Marcel Aries, Corien Weersink, Xiuyun Liu,
Georgios Varsos, Joseph Donnelly and Christian Zweifel. I would also like to thank Prof. John
Pickard whose experience and background was a source of motivation.
I am also indebted to the colleagues from the Mathematical Department of University of Porto,
especially Prof. Ana Paula Rocha, Prof. Ana Rita Gaio, Prof. Óscar Felgueiras and Maria João Silva
for their expert knowledge and collaboration in statistics.
To the software engineers Albano Sousa, Telmo Fonseca, Ricardo Sal and Carla Ávila a special thank for their willingness and support which was invaluable in helping me to solve informatics
and biomedical engineering problems.
Finally, I would like to thank my Family for their affection, understanding, patience and moral
support. Henrique, Catarina and Tiago you are my strength. I love you.
10 TABLE OF CONTENTS
TABLE OF CONTENTS
RESUMO ....................................................................................................................... 14
SUMMARY ..................................................................................................................... 15
LIST OF PUBLICATIONS .................................................................................................. 16
ABBREVIATIONS ............................................................................................................ 18
LIST OF FIGURES ........................................................................................................... 20
LIST OF TABLES ............................................................................................................ 21
LIST OF DEFINITIONS ..................................................................................................... 22
AIM AND HYPOTHESES .................................................................................................. 23
Traumatic Brain Injury Hospital Admission in Portugal.......................................... 24
Hypothesis 1 ........................................................................................................ 24
Monitoring of Cerebrovascular Phenomena in TBI Patients .................................. 24
Hypothesis 2 ........................................................................................................ 24
Hypothesis 3 ........................................................................................................ 24
Cerebral Autoregulation and Optimal CPP ........................................................... 25
Hypothesis 4 ........................................................................................................ 25
Autoregulation and Systemic Pathophysiology after TBI ....................................... 25
Hypothesis 5 ........................................................................................................ 25
INTRODUCTION.............................................................................................................. 27
Traumatic Brain Injury .............................................................................................. 29
Neurocritical Care and Multimodal Brain Monitoring ................................................. 31
Intracranial Pressure and Cerebral Perfusion Pressure ......................................... 32
Intracranial Pressure ............................................................................................ 33
Cerebral Perfusion Pressure ................................................................................ 36
Cerebral Oxygenation ............................................................................................ 37
Brain Tissue Oxygenation .................................................................................... 37
Cerebral Oximetry with NIRS................................................................................ 37
Cerebral Blood Flow with Thermal-Diffusion Flowmetry ......................................... 38
Pressure and Volume Dynamics .............................................................................. 40
Brain Compliance and Pressure Volume Relationship ........................................... 40
Cerebral Blood Flow and Cerebrovascular Reactivity .............................................. 42
Cerebral Blood Flow .............................................................................................. 42
Cerebrovascular Reactivity .................................................................................... 43
Autoregulation ...................................................................................................... 43
Vasoreactivity ....................................................................................................... 44
Assessment of Cerebrovascular Reactivity .............................................................. 47

TABLE OF CONTENTS 11
Indices of Cerebrovascular Reactivity with Time-Domain Monitoring .................... 48
Optimal Cerebral Perfusion Pressure.................................................................... 51
MATERIAL, METHODS AND DATA ANALYSIS ..................................................................... 53
Patients .................................................................................................................... 55
Inclusion criteria .................................................................................................... 55
Exclusion criteria .................................................................................................. 55
Sample Population................................................................................................ 55
Neurocritical Care Unit and Patient Management ..................................................... 57
Neurocritical Care Unit .......................................................................................... 57
General Patient Management ............................................................................... 57
CPP Management ................................................................................................ 59
Intracranial Hypertension Management ................................................................ 60
Monitoring Parameters, Sensors, Equipment, and Software ..................................... 60
Basic Vital Signs Monitoring ................................................................................. 60
Standard Brain Monitoring .................................................................................... 60
Advanced Brain Monitoring ................................................................................... 61
Data Capture and Software .................................................................................. 63
Derived Parameters and Continuous Indices of Autoregulation ............................ 63
Data Analysis ........................................................................................................... 64
ICM+ Data Analysis .............................................................................................. 64
Statistical Analysis ................................................................................................ 65
PUBLICATIONS ............................................................................................................... 67
Traumatic Brain Injury in Portugal: trends in hospital admissions from 2000 to 2010
............................................................................................................................. 69
Multimodal Brain Monitoring in Neurocritical Care Practice ................................... 79
Pressures, Flow, and Brain Oxygenation During Plateau Waves of Intracranial
Pressure ............................................................................................................... 87
Post-Traumatic Multimodal Brain Monitoring: Response to Hypertonic Saline ...... 99
Optimal Cerebral Perfusion Pressure Management at Bedside: a single centre pilot
study ................................................................................................................... 111
Kidney-Brain Link in Traumatic Brain Injury Patients? A preliminary report ......... 125
CONCLUSIONS ............................................................................................................. 137
DIRECTION OF FUTURE RESEARCH ............................................................................... 143
LIST OF REFERENCES .................................................................................................. 147


13
RESUMO
SUMMARY

14 RESUMO
RESUMO
A moderna organização das Unidades de Cuidados Neurocríticos, equipadas com
monitorização complexa e aplicações informáticas de recolha e integração de dados,
proporciona um ambiente ímpar na área da bioinformática e uma oportunidade única para
estudar in vivo os mecanismos fisiopatológicos da lesão cerebral aguda e os efeitos de
tratamento, como num laboratório clínico. A Monitorização Cerebral Multimodal, com técnicas
avançadas de avaliação da reatividade cerebrovascular, da oxigenação e química cerebral e do
fluxo sanguíneo cerebral (FSC) permite a definição em tempo real de alvos fisiológicos usados
para individualizar terapêutica e contribuir para melhorar o prognóstico do Traumatismo Cranio-
Encefálico (TCE).
Esta complexidade requer abordagem multidisciplinar e, portanto, esta tese contém três
dimensões: populacional, metodológica e clínica.
O estudo populacional de 10 anos de admissão hospitalar por TCE confirmou a observação
empírica que a lesão cerebral traumática continua a ser um problema de saúde relevante em
Portugal. Apesar da diminuição global das admissões hospitalares por TCE, as tendências
observadas na idade média dos doentes, na necessidade de cuidados intensivos, nos
procedimentos neurocirúrgicos e na taxa de mortalidade, todas cresceram.
A dimensão metodológica abrangeu a revisão sistemática da monitorização cerebral, a
aprendizagem da bioinformática aplicada ao neurointensivismo e a aplicação da avaliação da
reatividade cerebrovascular em tempo real, como base da implementação da infraestrutura
técnica e do desenvolvimento do protocolo de tratamento e investigação. A formação e
motivação da Equipa da Unidade para compreender o algoritmo da pressão de perfusão
cerebral (PPC) ótima e o empenho na sua correta aplicação foram cruciais para a condução da
investigação clínica.
A dimensão clínica incluiu um estudo piloto prospetivo onde se investigou a relevância da
monitorização cerebral multimodal para determinar o alvo da "PPC ótima" e reconhecer
precocemente os fenómenos cerebrais e sistémicos responsáveis por lesão secundária. A
avaliação da autorregulação cerebral mostrou-se útil para identificar a PPC ótima e o
manuseamento guiado por este valor associou-se a melhoria de resultados. A redução de FSC
e a perturbação da autorregulação que ocorreram durante surtos de hipertensão intracraniana
foram rapidamente recuperados com manuseamento adequado. Ademais, interessantes e
novas questões surgiram sobre a autorregulação cerebral e renal que parecem estar ligadas
entre si e relacionadas com o prognóstico dos doentes com TCE.

15 SUMMARY
SUMMARY
The organization of a modern Neurocritical Care Unit with complex monitoring and computerized
data collection provides a unique environment of neural bioinformatics and an opportunity to
study pathophysiological mechanisms of acute brain lesion and the effect of treatment, as in a
clinical laboratory. Multimodal Brain Monitoring with advanced techniques assessing
cerebrovascular reactivity, brain oxygenation and chemistry and cerebral blood flow allow real-
time definition of physiologic end points that may be used to customize goal-directed therapy
and contribute to improve outcome from severe traumatic brain injury (TBI).
This complexity requires multidisciplinary approach, therefore the thesis has three dimensions:
population, methodological and clinical.
The 10-years retrospective population study of TBI hospital admissions in Portugal confirmed the
empirical observation that head injury continues to be a relevant health problem. Though
incidence of traumatic brain injury admissions have decreased, trends of numbers describing
patient’s age, indication for intensive care treatment, neurosurgical procedures and mortality rate,
all have increased.
The methodological section includes a systematic review of brain monitoring, neurocritical care
bioinformatics and cerebrovascular reactivity evaluation at bedside in order to assemble the technical
infrastructure and develop the management protocol. Neurocritical Care Unit staff motivation in
learning the optimal cerebral perfusion pressure (CPP) algorithm and its commitment to its accurate
application was crucial to conduct the clinical research.
The clinical section included a prospective study where the relevance of multimodal brain
monitoring, targeting "optimal CPP" and early recognition of brain and systemic phenomenon
responsible for secondary injury was investigated. Assessment of cerebral autoregulation proved
useful to identify an optimal CPP and patient’s management at this CPP was associated with better
outcome. The reduction of cerebral blood flow and autoregulation impairment that occurred during
surges of intracranial hypertension showed rapid recovery after adequate treatment.
Furthermore, new questions have emerged about potential brain and kidney
autoregulation link. We managed to demonstrate that better cerebral autoregulation was significantly
correlated with augmented renal clearance in TBI patients and associated with better outcome.

16 LIST OF PUBLICATIONS
LIST OF PUBLICATIONS
Research papers that have been published or have been accepted for publication
as first author:
Dias C, Rocha M, Pereira E, Cerejo, A. Traumatic Brain Injury in Portugal – trends in
hospital admissions from 2000 to 2010. Acta Med Port 2014, 27 (3), 349-56.
Dias C, Maia I, Cerejo A, Varsos G, Smielewski P, Paiva J-A, Czosnyka M. Pressures, Flow,
and Brain Oxygenation During Plateau Waves of Intracranial Pressure. Neurocritical Care
2014, Aug; 21(1):124-132.
Dias C. Multimodal Brain Monitoring in Neurocritical Care Practice. IJCNMH 2014; 1(Suppl.
1):45-9.
Dias C, Silva, MJ, Pereira E, Silva S, Cerejo A, Smielewski P, Rocha AP, Gaio, AR, Paiva,
J-A, Czosnyka, M. Post-traumatic multimodal brain monitoring: response to hypertonic
saline. J Neurotrauma 2014 Nov 15; 31(22):1872-80.
Dias C, Silva MJ, Pereira E, Monteiro E, Maia I, Barbosa S, Honrado T, Cerejo A, Aries M,
Smielewski P, Paiva J-A, Czosnyka M. Optimal CPP management at bedside: a single
centre pilot study. Neurocritical Care 2015, Jan 8. [Epub ahead of print]
Dias C, Gaio, AR, Monteiro E, Barbosa S, Cerejo A, Donnelly J, Felgueiras O, Smielewski
P, Paiva J-A, Czosnyka, M. Kidney-Brain Link in Traumatic Brain Injury Patients? A
preliminary report. Neurocritical Care 2015, Apr; 22(2):192-201.
Related Manuscripts that have been published as co-author:
Zweifel C, Dias C, Smielewski P, Czosnyka M. Continuous time-domain monitoring of
cerebral autoregulation in neurocritical care. Medical Engineering & Physics 2014 May;
36(5):638–45.
Donnelly J, Czosnyka M, Sudhan N, Varsos GV, Nasr N, Jalloh I, Liu X, Dias C, Sekhon
MS, Carpenter KL, Menon DK, Hutchinson PJ, Smielewski P. Increased Blood Glucose is
Related to Disturbed Cerebrovascular Pressure Reactivity After Traumatic Brain Injury.
Neurocritical care, 2014; 1-6.

17 LIST OF PUBLICATIONS
Weersink C, Aries M, Dias C, Liu X, Kolias A, Donnelly J, Czosnyka M, van Dijk JMC,
Regtien J, Menon DK, Hutchinson PJ, Smielewski P. "Clinical and physiological events that contribute to the success rate of finding 'Optimal CPP' in severe brain trauma patients". Accepted for publication in Critical Care Medicine, 2015 May 07.
Book Chapter:
Marek Czosnyka and Celeste Dias. Role of Pressure Reactivity Index in Neuro Critical Care
(Chapter 21). In Neuroanesthesia and Cerebro-Spinal Protection. Uchino, Hiroyuki,
Ushijima, Kazuo, Ikeda, Yukio (Eds.) Springer. ISBN 978-4-431-54489-0 (in press).
Abstracts:
Abstract and oral presentation at the 18th Meeting of European Society of Neurosonology
and Cerebral Hemodynamics and 3rd Meeting of Cerebral Autoregulation Network, Porto
2013. Dias, C, Pereira E, Cerejo A, Paiva J-A, Czosnyka M. Prx - a tool to evaluate
autoregulation and decide the optimal CPP management at bedside in a neurocritical care
unit. Cerebrovasc Dis 2013; 35 Suppl 2: O12.
Abstract and oral presentation at the meeting of the European Society of Intensive Care
Medicine, Paris, October 2013: Dias C,Pereira E, Cerejo A, Paiva J-A, Czosnyka M.
Intensive Care Medicine 39 Suppl 2: 0025.
Abstract and oral presentation at the 15th International Conference on Intracranial
Pressure, Singapore, November 2013. Dias C, Maia I, Cerejo A, Smielewski P, Paiva J-A,
Czosnyka M. Pressures, Flow and Brain Oxygenation during Plateau Waves of Intracranial
Pressure. Abstract book O29.
Abstract and e-poster presentation at the meeting of the Neurocritical Care Society, Seattle,
September 2014. Dias C, Silva MJ, Pereira E, Maia I, Barbosa S, Silva S, Honrado T, Cerejo
A, Aries M, Smielewski P, Paiva J-A, Czosnyka M. Optimal Cerebral Perfusion Pressure
management at bedside: medical and nursing compliance to CPP target based on
continuous evaluation of autoregulation. Abstract book 255.
Abstract and e-poster presentation at the meeting of the Neurocritical Care Society, Seattle,
September 2014. Dias C, Gaio AR, Moreira E, Barbosa S, Cerejo A, Donnelly J, Felgueiras
O, Smielewski P, Paiva J-A, Czosnyka M. Kidney-Brain link in Traumatic Brain Injury
Patients ? Abstract book 254.

ABBREVIATIONS 18
ABBREVIATIONS
ABP
AVDO2
BOLD-MRI
CaO2
CBF
CBFx
CBV
CSF
CI
CMRO2
CO
COx
CPP
CPPopt
CT
CVR
DRG
ETCO2
GCS
GOS
HTS
ICD-9
ICP
INE
IQR
ISS
LLA
MAP
MR
MRI
NCCU
NIRS
ORx
ARTERIAL BLOOD PRESSURE
ARTERIOVENOUS OXYGEN TENSION DIFFERENCE
BLOOD OXYGEN LEVEL DEPENDENT-MRI
ARTERIAL OXYGEN CONTENT
CEREBRAL BLOOD FLOW
CEREBRAL BLOOD FLOW REACTIVITY INDEX
CEREBRAL BLOOD VOLUME
CEREBRAL SPINAL FLUID
CONFIDENCE INTERVAL
CEREBRAL METABOLIC RATE FOR OXYGEN
CEREBRAL OXIMETRY
CEREBRAL OXIMETRY REACTIVITY INDEX
CEREBRAL PERFUSION PRESSURE
OPTIMAL CEREBRAL PERFUSION PRESSURE
COMPUTED TOMOGRAPHY
CEREBRAL VASCULAR RESISTANCE
DIAGNOSIS RELATED GROUP
END-TIDAL CO2
GLASGOW COMA SCORE
GLASGOW OUTCOME SCALE
HYPERTONIC SALINE
INTERNATIONAL CLASSIFICATION OF DISEASES
INTRACRANIAL PRESSURE
INSTITUTO NACIONAL DE ESTATISTICA
INTERQUARTILE RANGE
INJURY SEVERITY SCORE
LOWER LIMIT OF AUTOREGULATION
MEAN ARTERIAL BLOOD PRESSURE
MORTALITY RATE
MAGNETIC RESONANCE IMAGING
NEUROCRITICAL CARE UNIT
NEAR INFRARED SPECTROSCOPY
OXYGEN REACTIVITY INDEX

19 ABBREVIATIONS
ORxs
PaO2
PaCO2
PAx
PET
PbtO2
PRx
RAP
SAPS II
SD
TBI
TCE
TDF
TRISS
ULA
WHO
Xe-CT
YPLL
OXYGEN REACTIVITY INDEX SHORT
ARTERIAL OXYGEN TENSION
ARTERIAL CARBON DIOXIDE TENSION
PULSE AMPLITUDE INDEX
POSITRON EMISSION TOMOGRAPHY SCAN
BRAIN TISSUE OXYGEN TENSION
PRESSURE REACTIVITY INDEX
INDEX OF CEREBROSPINAL COMPENSATORY RESERVE
SIMPLIFIED ACUTE PHYSIOLOGY SCORE II
STANDARD DEVIATION
TRAUMATIC BRAIN INJURY
TRAUMATISMO CRANIO-ENCEFÁLICO
THERMAL-DIFFUSION FLOWMETRY
TRAUMA AND INJURY SEVERITY SCORE
UPPER LIMIT OF AUTOREGULATION
WORLD HEALTH ORGANIZATION
XENON-ENHANCED CT FOR CBF EVALUATION
YEARS OF POTENTIAL LIFE LOST

LIST OF FIGURES 20
LIST OF FIGURES
Figure 1 – Years of potential life lost (YPLL) and mortality rate (MR) due to traffic accidents per
100,000 in Portugal from 2002 to 2012.. .......................................................................................... 29
Figure 2 – Total number of hospital admissions due to TBI from 2000 to 2010. .............................. 30
Figure 3 - Neurocritical Care Unit and multimodal brain monitoring in Centro Hospitalar São João
from 1989 to 2014. ............................................................................................................................ 32
Figure 4 - Intracranial Pressure pulse waveform and pulsatile components.................................... 34
Figure 5 - Examples of slow waves of intracranial pressure. ........................................................... 35
Figure 6 - The normal exponential intracranial pressure-volume curve. .......................................... 40
Figure 7 - Brain compensatory reserve and pressure-volume curve. .............................................. 41
Figure 8 – Pressure / flow curve with autoregulation plateau. .......................................................... 42
Figure 9 – Cerebral blood flow, cerebrovascular resistance and arteriolar diameter variation with
cerebral perfusion pressure. ............................................................................................................. 44
Figure 10 - Response of cerebral blood flow and cerebral blood volume to arterial carbon dioxide
tension, arterial oxygen tension and oxygen arterial content. .......................................................... 45
Figure 11– Autoregulation and vasoreactivity relationship. .............................................................. 46
Figure 12– Example of moving linear correlation for PRx (pressure reactivity index)
calculation. ........................................................................................................................................ 48
Figure 13 - Continuous monitoring of autoregulation and definition of individual lower limit of
autoregulation and upper limit of autoregulation to target optimal CPP during NCCU
management. .................................................................................................................................... 49
Figure 14 - U-shaped curve distribution of cerebrovascular reactivity indices PRx, ORxs, COx and
CBFx plotted against CPP for an individual patient. ........................................................................ 52
Figure 15 - Visual continuous metrics of the distance between real cerebral perfusion pressure and
optimal CPP and time histogram of CPP. ......................................................................................... 52
Figure 16 - Neurocritical Care Unit (NCCU) protocol for Traumatic Brain Injury and Intracranial
Hypertension Management. ............................................................................................................. 58
Figure 17- Screenshot of ICM+ software panel with 4h-trend charts for visual decision of optimal
cerebral perfusion pressure according to PRx (CPPopt). ................................................................ 59
Figure 18 – Basic vital signs and multimodal brain monitoring set. ................................................. 61
Figure 19 – Screenshot with raw data of multimodal brain monitoring. ........................................... 64
Figure 20 - ICM+ software screenshot with raw data of multiple brain parameters and results from
“quick stats tool”. ............................................................................................................................... 65

21 LIST OF TABLES
LIST OF TABLES
Table 1 - Classification of Intracranial Pressure (ICP) waveforms. .................................................. 34
Table 2 - Overview of indirect (I) and direct (D) methods for cerebral blood flow (CBF)
assessment ....................................................................................................................................... 47
Table 3 – Vasoactive stimulus most frequently used to assess cerebrovascular reactivity ............. 48
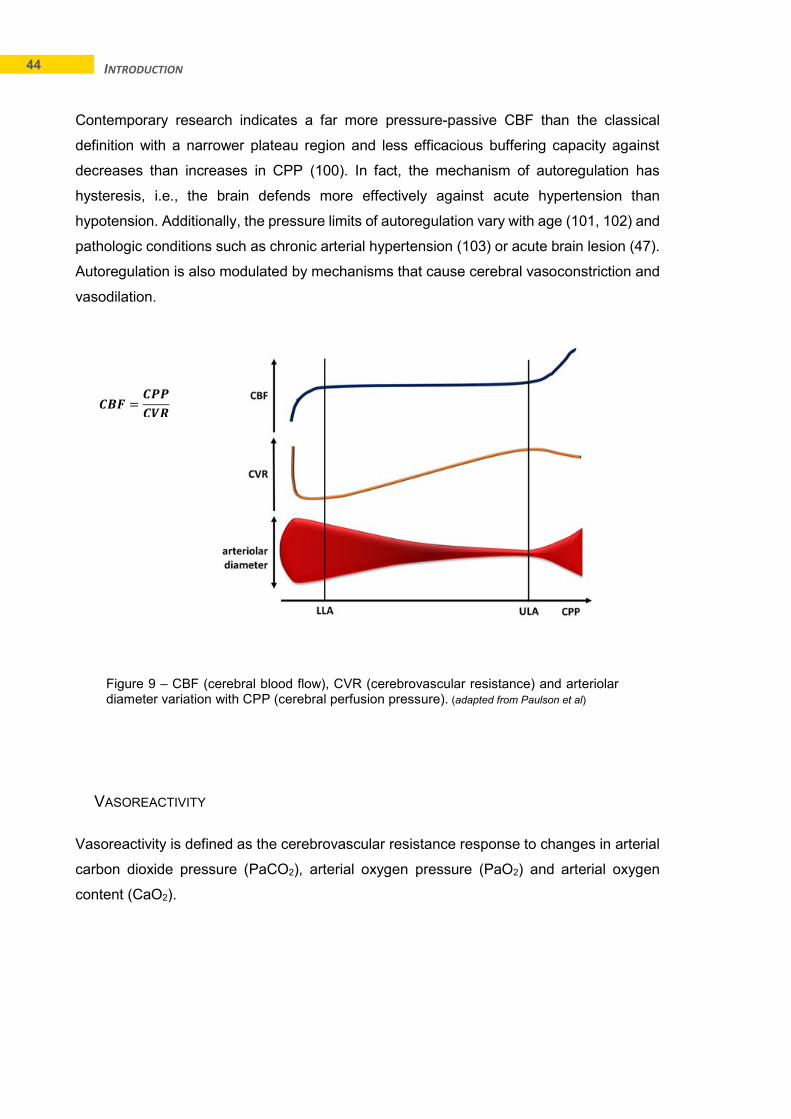
Table 4 – Demographic data of patients included in the clinical investigation. ................................. 56

LIST OF DEFINITIONS 22
LIST OF DEFINITIONS
Autoregulation The intrinsic capacity of the cerebral vasculature to
provide constant cerebral blood flow by changing cerebral
vascular resistance, over a wide range of cerebral
perfusion pressure.
Cerebral Perfusion Pressure The driving force of blood flow through the
cerebrovascular bed. In clinical practice, it is calculated as
the difference between mean arterial blood pressure and
mean intracranial pressure.
Optimal CPP (CPPopt) Value of cerebral perfusion pressure according to the best
achievable state of autoregulation calculated with PRx.
Cerebrovascular Reactivity Changes in cerebral vascular resistance in response to
vasodilatory or vasoconstrictive stimuli such as arterial
pressure, partial pressure of arterial blood gases, or due
to drug effects.
Pressure Reactivity The response of the diameter of blood vessels to a change
in transmural pressure.

23
AIM AND HYPOTHESES
24 AIM AND HYPOTHESES
AIM AND HYPOTHESES
The main aim of this research project was to evaluate the impact of optimal CPP-oriented
clinical management of acute brain lesion with multimodal brain monitoring. To accomplish
this objective we studied patients with severe traumatic brain injury admitted to the
neurocritical care unit and requiring standard and advanced neuromonitoring.
Working hypotheses tested in the course of my PhD project are divided into three
dimensions: population, methodological and clinical.
TRAUMATIC BRAIN INJURY HOSPITAL ADMISSION IN PORTUGAL
The evolution of epidemiological dimensions of adult TBI patients admitted in Portuguese
hospitals during the last decade is very poorly known. In fact, reliable characterization of
healthcare resource utilization due to TBI, including ICU admission, neurosurgical
procedures and their impact on mortality or morbidity are scarce. Nevertheless, TBI
continues to be considered as “a silent epidemic” with a considerable socio-economic
impact and being a major cause of morbi-mortality, often leading to permanent disability.
HYPOTHESIS 1: Hospital health care resource utilization due to adult traumatic brain
injury in the last decade in Portugal is changing but TBI still remains an important health
problem.
MONITORING OF CEREBROVASCULAR PHENOMENA IN TBI PATIENTS
Intracranial hypertension, which frequently occurs after TBI, is one of the most damaging
aspects of acute brain lesion and is independently associated with poor outcome.
Intracranial hypertension may develop due to vascular or nonvascular mechanisms. The
nonvascular mechanisms include oedema, increased mass lesion and increased resistance
to cerebral spinal fluid outflow. The vascular mechanisms include active cerebral
vasodilation (such as plateau waves), passive distension in the absence of autoregulation
and venous outflow obstruction. Intracranial hypertension is accompanied by worsening of
brain compliance and cerebral metabolic and haemodynamic disturbances evolving to
progressive secondary injury. Monitoring of these secondary insults may be helpful in
patients with TBI.
HYPOTHESIS 2: During spontaneous cerebrovascular phenomena such as plateau
waves of intracranial pressure specific changes in cerebral hemodynamic indices occur.
HYPOTHESIS 3: Management of intracranial hypertension with hypertonic saline can
be monitored and explained with multimodal brain monitoring.

25 AIM AND HYPOTHESES
CEREBRAL AUTOREGULATION AND OPTIMAL CPP
Autoregulation is frequently disturbed after TBI. There are several approaches suitable for
continuous determination of autoregulation at bedside, but the cerebrovascular pressure
reactivity index (PRx) is the best validated one. Based on the fact that intact autoregulation
is associated with favourable outcome, it would probably be beneficial to follow the
individual autoregulatory curve calculated at bedside and to manage CPP according to
the best achievable state of autoregulation (optimal CPP) estimated with PRx.
HYPOTHESIS 4: Optimal CPP management is possible to be conducted prospectively at
bedside using pressure reactivity index analysis, and shows a potential to improve
outcome following TBI.
AUTOREGULATION AND SYSTEMIC PATHOPHYSIOLOGY AFTER TBI
The injured brain is more vulnerable to ischemic conditions such as hypotension and
hypoxia that could lead to increased neurological damage. On the contrary, neural and
humoral control of physiological systems in the body is affected by TBI. There are
observable changes in the physiological functioning of the brain and body following TBI
involving cerebral autoregulation, autonomic nervous system and cardiovascular,
pulmonary and renal systems. Understanding the systemic effects of brain injury may
provide some unique and distinctive perspectives as to the effective management after
TBI.
HYPOTHESIS 5: Disturbance of cerebral autoregulation is associated with systemic
pathophysiology especially with kidney function.


27
INTRODUCTION


29 INTRODUCTION
TRAUMATIC BRAIN INJURY
Traumatic Brain Injury (TBI) or Head Injury are defined as brain and head injuries caused
by external trauma (1). Together, they are a major cause of mortality and permanent
disability, often considered as a silent epidemic (2), responsible for relevant consumption
of health care resources (3).
The annual incidence of TBI is estimated at up to 500 per 100,000 in the U.S. and Europe.
Over 200 per 100,000 individuals are admitted to hospitals each year in Europe (4).
According to epidemiological surveillance the nature of TBI is changing over time. The
World Health Organization (WHO) predicts that deaths from road traffic incidents (primarily
due to TBI) will double between 2000 and 2020 in low- and middle income countries
(WHO/OMS, 2009) and that in developed countries the occurrence of TBI will mainly
increase in people aged over 60 years.
In Portugal, the incidence of TBI is difficult to ascertain, but between 1996 and 1997,
according to Santos, ME et al, was 137 per 100,000 (5). From national statistical data
published in the webpage of Instituto Nacional de Estatistica (INE), one can read that the
years of potential life lost (YPLL) as well as mortality rate (MR) due to traffic accidents are
decreasing (Figure 1).
Figure 1 - Years of potential life lost (YPLL) and mortality rate (MR) due to traffic accidents per 100,000 in Portugal from 2002 to 2012 (from INE public statistical data).
0
5
10
15
20
25
0
10000
20000
30000
40000
50000
60000
2002 2003 2004 2005 2006 2007 2008 2009 2010 2011 2012
MR per 100,000YPLL
YPLL - traffic accidents
MR per 100,00 - traffic accidents

30 INTRODUCTION
We retrospectively studied health records included in the National Diagnosis Related
Groups (DRG) Database of adult patients admitted to Portuguese hospitals with ICD-9
(International Classification of Diseases) diagnostic codes of TBI from 2000 to 2010. Based
on a large cohort with a broad study period, we concluded that overall hospital admissions
due to TBI decreased, but since 2007 stabilized on average around 5525 cases per year.
The type of patients and the external cause of TBI has also shifted from younger to older
people and from traffic accidents to falls. Moreover, moderate / severe TBI, hospital
mortality and ICU admission percentages slightly increased over time (Figure 2).
The results of this study were published in Acta Medica Portuguesa, (Publication I).
Figure 2 – A. Total number of hospital admissions due to TBI from 2000 to 2010 (grey bars), hospital mortality (grey line) and Intensive Care admission percentages (black line). B. Severity of TBI hospital admissions from 2000 to 2010 (mild - light grey area, moderate to severe – grey area and unknown – dark grey area) and percentage of hospital mortality and ICU admission (grey line and black line,respectively) (from National DRG statistical data).
31 INTRODUCTION
NEUROCRITICAL CARE AND MULTIMODAL BRAIN MONITORING
Severe TBI is a very dynamic process that requires a continuum of acute care. From this
point of view neurocritical care management starts in the pre-hospital period, at the scene
of the accident, extends through the emergency department, the radiology department, and
the operating room before patients are admitted to the Intensive Care Unit (6).
The importance of management of primary lesion and the early identification of secondary
insults after TBI is well established and the aim of the intensive care management is to
anticipate, prevent and treat timely. The phrase “TIME IS BRAIN” emphasizes the vulnerability
of the human brain and the urgency of therapeutic interventions (7).
Neurocritical care is an evolving subspecialty of intensive care medicine (8).A dedicated
multidisciplinary team of health professionals: nursing, supervision of ICU care by
neurointensivists and involvement of senior neurosurgeons, together with implementation
of protocols incorporating recommendations is likely to have a positive impact on patient
management and outcome (9). Guidelines for management of TBI have contributed to
significant changes in practice (10, 11). Conversely, neurocritical care progressed from
primary control of intracranial pressure (ICP) and maintenance of cerebral perfusion
pressure (CPP) to a multidimensional approach of neuronal rescue and protection based
on clinical evaluation, laboratory findings, imaging studies and continuous multimodal brain
monitoring (12). To prevent further damage to vulnerable brain, especially during the early
posttraumatic phase, specific knowledge is essential. An in-depth understanding of linked
pathophysiologic cascades must be accompanied by dedicated neuromonitoring.
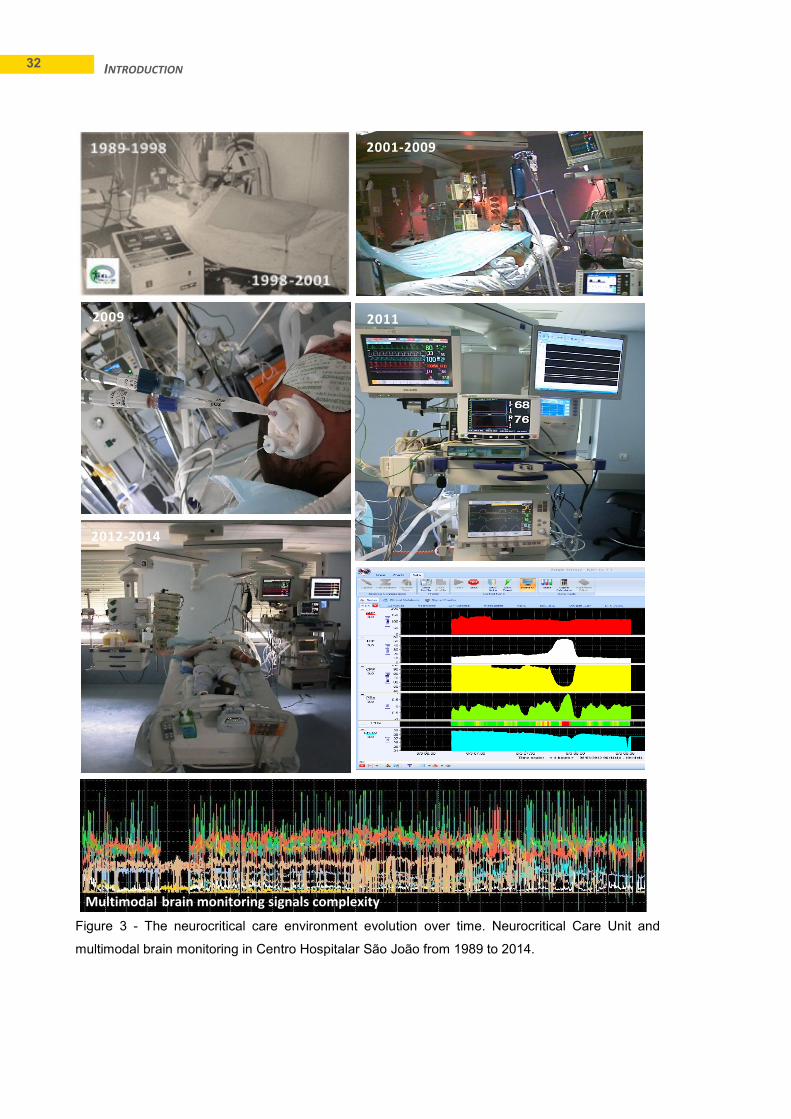
The organization of modern neurointensive care units with complex monitoring and
computerized data collection provides a unique environment of neurocritical care
bioinformatics (13, 14) and an opportunity to study pathophysiological mechanisms of acute
brain lesion and the effect of treatment, as in a clinical laboratory (Figure 3).
32 INTRODUCTION
2001-2009
2011 2009
2012-2014
Multimodal brain monitoring signals complexity
Figure 3 - The neurocritical care environment evolution over time. Neurocritical Care Unit and
multimodal brain monitoring in Centro Hospitalar São João from 1989 to 2014.
33 INTRODUCTION
INTRACRANIAL PRESSURE AND CEREBRAL PERFUSION PRESSURE
INTRACRANIAL PRESSURE
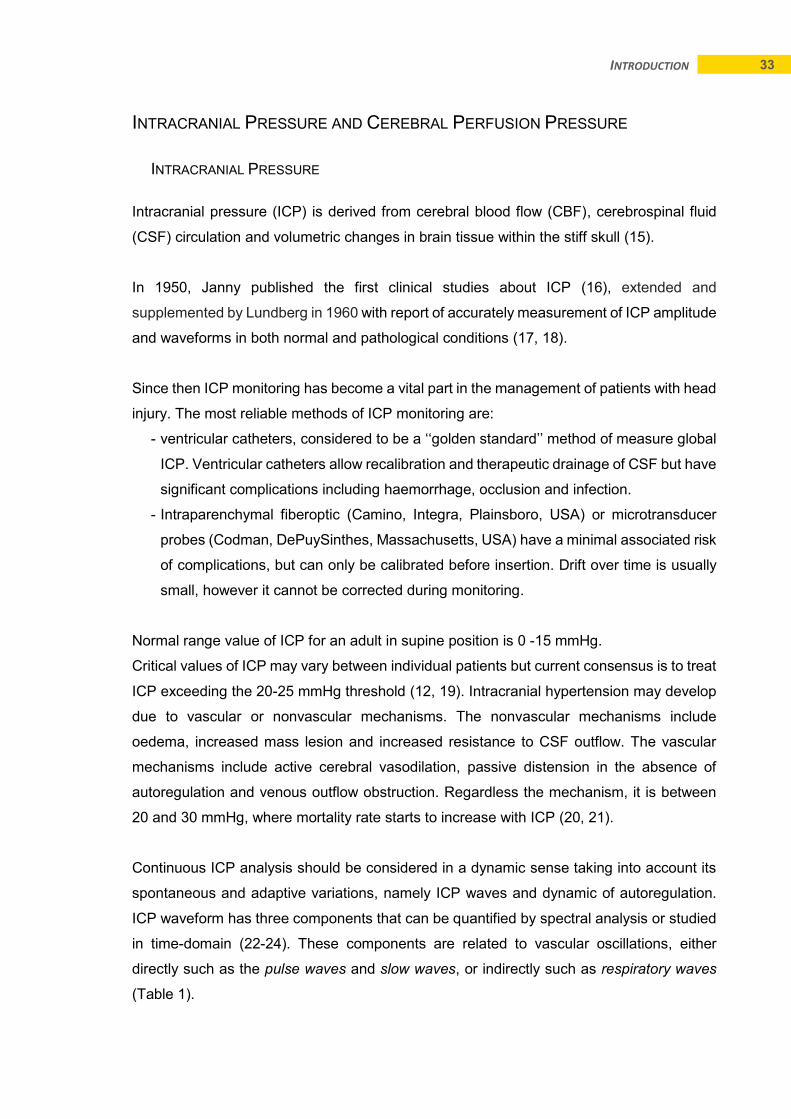
Intracranial pressure (ICP) is derived from cerebral blood flow (CBF), cerebrospinal fluid
(CSF) circulation and volumetric changes in brain tissue within the stiff skull (15).
In 1950, Janny published the first clinical studies about ICP (16), extended and
supplemented by Lundberg in 1960 with report of accurately measurement of ICP amplitude
and waveforms in both normal and pathological conditions (17, 18).
Since then ICP monitoring has become a vital part in the management of patients with head
injury. The most reliable methods of ICP monitoring are:
- ventricular catheters, considered to be a ‘‘golden standard’’ method of measure global
ICP. Ventricular catheters allow recalibration and therapeutic drainage of CSF but have
significant complications including haemorrhage, occlusion and infection.
- Intraparenchymal fiberoptic (Camino, Integra, Plainsboro, USA) or microtransducer
probes (Codman, DePuySinthes, Massachusetts, USA) have a minimal associated risk
of complications, but can only be calibrated before insertion. Drift over time is usually
small, however it cannot be corrected during monitoring.
Normal range value of ICP for an adult in supine position is 0 -15 mmHg.
Critical values of ICP may vary between individual patients but current consensus is to treat
ICP exceeding the 20-25 mmHg threshold (12, 19). Intracranial hypertension may develop
due to vascular or nonvascular mechanisms. The nonvascular mechanisms include
oedema, increased mass lesion and increased resistance to CSF outflow. The vascular
mechanisms include active cerebral vasodilation, passive distension in the absence of
autoregulation and venous outflow obstruction. Regardless the mechanism, it is between
20 and 30 mmHg, where mortality rate starts to increase with ICP (20, 21).
Continuous ICP analysis should be considered in a dynamic sense taking into account its
spontaneous and adaptive variations, namely ICP waves and dynamic of autoregulation.
ICP waveform has three components that can be quantified by spectral analysis or studied
in time-domain (22-24). These components are related to vascular oscillations, either
directly such as the pulse waves and slow waves, or indirectly such as respiratory waves
(Table 1).
34 INTRODUCTION
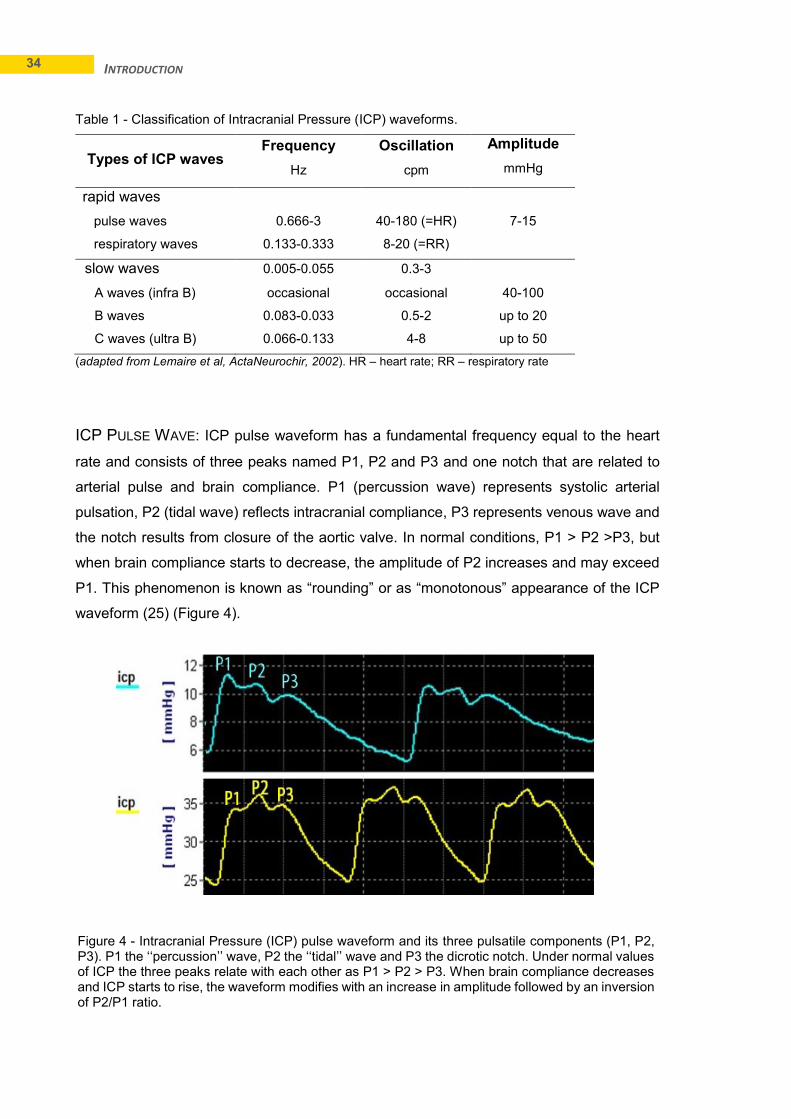
Table 1 - Classification of Intracranial Pressure (ICP) waveforms.
Types of ICP waves Frequency
Hz
Oscillation
cpm
Amplitude
mmHg
rapid waves
pulse waves 0.666-3 40-180 (=HR) 7-15
respiratory waves 0.133-0.333 8-20 (=RR)
slow waves 0.005-0.055 0.3-3
A waves (infra B) occasional occasional 40-100
B waves 0.083-0.033 0.5-2 up to 20
C waves (ultra B) 0.066-0.133 4-8 up to 50
(adapted from Lemaire et al, ActaNeurochir, 2002). HR – heart rate; RR – respiratory rate
ICP PULSE WAVE: ICP pulse waveform has a fundamental frequency equal to the heart
rate and consists of three peaks named P1, P2 and P3 and one notch that are related to
arterial pulse and brain compliance. P1 (percussion wave) represents systolic arterial
pulsation, P2 (tidal wave) reflects intracranial compliance, P3 represents venous wave and
the notch results from closure of the aortic valve. In normal conditions, P1 > P2 >P3, but
when brain compliance starts to decrease, the amplitude of P2 increases and may exceed
P1. This phenomenon is known as “rounding” or as “monotonous” appearance of the ICP
waveform (25) (Figure 4).
Figure 4 - Intracranial Pressure (ICP) pulse waveform and its three pulsatile components (P1, P2, P3). P1 the ‘‘percussion’’ wave, P2 the ‘‘tidal’’ wave and P3 the dicrotic notch. Under normal values of ICP the three peaks relate with each other as P1 > P2 > P3. When brain compliance decreases and ICP starts to rise, the waveform modifies with an increase in amplitude followed by an inversion of P2/P1 ratio.
35 INTRODUCTION
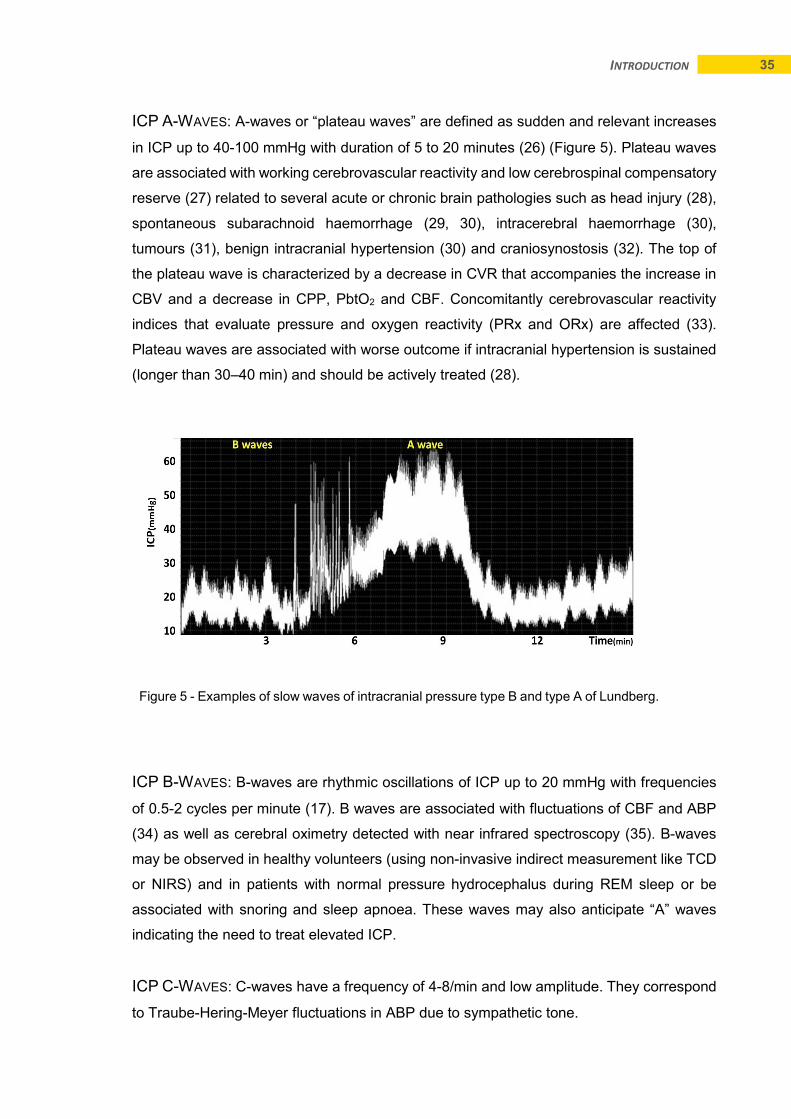
ICP A-WAVES: A-waves or “plateau waves” are defined as sudden and relevant increases
in ICP up to 40-100 mmHg with duration of 5 to 20 minutes (26) (Figure 5). Plateau waves
are associated with working cerebrovascular reactivity and low cerebrospinal compensatory
reserve (27) related to several acute or chronic brain pathologies such as head injury (28),
spontaneous subarachnoid haemorrhage (29, 30), intracerebral haemorrhage (30),
tumours (31), benign intracranial hypertension (30) and craniosynostosis (32). The top of
the plateau wave is characterized by a decrease in CVR that accompanies the increase in
CBV and a decrease in CPP, PbtO2 and CBF. Concomitantly cerebrovascular reactivity
indices that evaluate pressure and oxygen reactivity (PRx and ORx) are affected (33).
Plateau waves are associated with worse outcome if intracranial hypertension is sustained
(longer than 30–40 min) and should be actively treated (28).
ICP B-WAVES: B-waves are rhythmic oscillations of ICP up to 20 mmHg with frequencies
of 0.5-2 cycles per minute (17). B waves are associated with fluctuations of CBF and ABP
(34) as well as cerebral oximetry detected with near infrared spectroscopy (35). B-waves
may be observed in healthy volunteers (using non-invasive indirect measurement like TCD
or NIRS) and in patients with normal pressure hydrocephalus during REM sleep or be
associated with snoring and sleep apnoea. These waves may also anticipate “A” waves
indicating the need to treat elevated ICP.
ICP C-WAVES: C-waves have a frequency of 4-8/min and low amplitude. They correspond
to Traube-Hering-Meyer fluctuations in ABP due to sympathetic tone.
Figure 5 - Examples of slow waves of intracranial pressure type B and type A of Lundberg.

36 INTRODUCTION
CEREBRAL PERFUSION PRESSURE
Perfusion pressure of an organ is the difference between the arterial input and venous
output pressures that drive flow. Cerebral perfusion pressure is defined as the difference
between the mean arterial blood pressure at head level and the mean venous pressure of
cortical or bridging veins. In pathological conditions ICP exceeds venous pressure and
therefore the driving force of intracranial flow becomes the difference between mean arterial
pressure and intracranial pressure.
CPP=MAP-ICP
Consensus Guidelines for the management of severe traumatic brain injury recommend
management of CPP between 50-70 mmHg (10, 36).
However, CPP target values have changed over time. Management strategies based on
population CPP-target (Rosner concept) (37) have not demonstrated clinical outcome
benefit (21, 38) and the alternative approach based on volume-target (Lund concept) (39)
might increase the risk of brain ischemia (40, 41).
There are several reasons which may explain this CPP target uncertainty:
- age (42) and previous disease state (43, 44)
- type of acute brain lesion and time course of the disease (45-50)
- ICP higher values and lower limit of CBF autoregulation (51)
- different methodologies of ABP measurement, namely transducer level related to head
up elevation (52-54)
- lack of class I evidence to inform the optimal CPP target for any type of acute brain lesion.
Adequate individual CPP targets are therefore difficult to define and one of the leading
controversies in neurocritical care today concerns the optimal CPP goal.
Detailed information about optimal CPP and CPPopt-target therapy concept are
described in a section below.

37 INTRODUCTION
CEREBRAL OXYGENATION
Management of acute brain injury centred on basic control of ICP and CPP does not prevent
cerebral hypoxia in some patients (55). Cerebral oxygenation monitoring evaluates the
balance between oxygen delivery and consumption (56) and oxygen guided management
could lead to improve neurologic outcome (57). There are several invasive and non-invasive
continuous methods of monitoring local or regional brain oxygenation.
BRAIN TISSUE OXYGENATION
Direct measurement of local PbtO2 with an intraparenchymal probe is the golden
standard for continuous oxygen monitoring in NCCU. Licox (Integra Neuroscience,
Plainsboro, USA), a closed polarographic Clark-type electrode that measures oxygen
content around 15 mm3 of tissue, has been widely used.
Because of brain blood flow and metabolism heterogeneity, normal values depend on
the location of the probe. Hence, probes are recommended to be placed in the white
matter and post insertion head-CT confirmation is needed to interpret readings.
The normal range is 25-50 mmHg and PbtO2 < 15mmHg is considered the critical
threshold for hypoxia (58). The interaction between blood oxygen tension and CBF is an
important determinant of PbtO2. In fact, PbtO2 seems to reflect the cumulative
value of CBF and the arteriovenous difference in oxygen tension (59, 60).
Brain hypoxia (PbtO2 < 10-15 mmHg) is associated with worse outcome and increases
the likelihood of death after severe TBI (61, 62).
Algorithms of PbtO2-directed therapy should incorporate the management of the
several causes of tissue hypoxia (hypoxic, anaemic, ischemic, cytopathic and
hypermetabolic) (63, 64).
CEREBRAL OXIMETRY WITH NIRS
Cerebral oximetry provides continuous, non-invasive real-time monitoring of changes in
regional oxygen saturation of brain tissue by near-infrared spectroscopy (NIRS) technology
(65). Near-infrared light at the wavelength range 660-940 nm passes through skin and skull
and is absorbed by biological chromophores like Hb and HbO2 (66). NIRS allows
measurements of changes in oxyhemoglobin, deoxyhemoglobin, blood volume, and oxygen
availability within the monitored tissue (67). There are several non-invasive cerebral

38 INTRODUCTION
oximetry devices and in this work we used INVOS 5100C (Covidien, Mansfield, USA) that
is widely applied in clinical practice. It uses cutaneous sensors with diodes that emit infrared
light at two wavelengths (730 and 810 nm) and a proximal and distal detectors that permit
separate data processing of shallow and deep optical signals. The device uses
mathematical algorithms and the final value yields a regional venous-weighted percent
saturation that represents the balance between frontal cortical O2 supply and consumption
(68). Normal range values is 55-75%. NIRS-derived cerebral oximetry monitoring provides
a non-invasive surrogate marker of CBF allowing assessment of autoregulation and
calculation of optimal CPP (69-71).
CEREBRAL BLOOD FLOW WITH THERMAL-DIFFUSION FLOWMETRY
Continuous direct bedside monitoring of CBF would be helpful to manage acute brain injury
and is a long-standing goal in neurocritical care. The normal range for CBF in the white
matter is 18-25 ml/100g/min (72, 73). Classic research with animal stroke models has
shown that there are CBF thresholds associated with the cessation of electrocortical activity
(18ml/100g/min), cellular membrane failure (10ml/100g/min), and rapid transition to
infarction (5ml/100g/min) (74).
Thermal-diffusion flowmetry (TDF) with QFlow 500 probe (Hemedex, Cambridge, USA) is
based on thermal conductivity and provides a quantitative measurement of regional CBF.
The probe is inserted in the white matter 25 mm below the dura and CBF is calculated
around 8 mm3 of brain tissue. Automatic recalibration of the system occurs within a pre-set
time interval (from 2 min to 2 hours) to quantify current thermal properties of the tissue and
thus resulting in a 2-5 min interruption of data continuity. No studies have evaluated the
CBF thresholds obtained from TDF. However, based on values cited in the literature, it is
reasonable to assume an ischemic threshold of 15–18 ml/100g/min.
Regional CBF values obtained with TDF are in good agreement with Laser Doppler
flowmetry (the gold-standard technique for instantaneous, continuous, and real-time
measurements of regional CBF) and Xe-CT (72). Persistent low TDF-CBF values in the
early post injury period is associated with poor clinical outcome in TBI (75). TDF-CBF
monitoring values have demonstrated good real-time response of CBF related to vessel
occlusion (76), cerebral autoregulation and vasoreactivity (77). Nevertheless, TDF-CBF has
several limitations related to baseline shifts of CBF and instability of the thermal field of the

39 INTRODUCTION
tissue that may occur and influence the accuracy of the measurement method (78, 79).
Continuous monitoring of CBF and CPP allows calculation of flow-related autoregulation
and estimation of optimal CPP (80).
The relevance of multimodal brain monitoring in clinical practice was reviewed
and published in the International Journal of Clinical Neurosciences and Mental Health,
(Publication II).

40 INTRODUCTION
PRESSURE AND VOLUME DYNAMICS
BRAIN COMPLIANCE AND PRESSURE VOLUME RELATIONSHIP
Adult intracranial space is composed of three components: approximately 80-85% brain
parenchyma, 7-10% cerebral spinal fluid (CSF) and 5-8% cerebral blood volume in
vascular network. The Monro-Kellie doctrine states that this global volume within the rigid
skull is constant and generates the intracranial pressure (ICP). Changes in any one
component are compensated by equivalent changes of another; otherwise ICP will
increase. The pressure-volume relationship (P/V), first described by Langfitt in 1966
(81, 82), is an exponential curve that describes brain elastance and compliance (83)
(Figure 6).
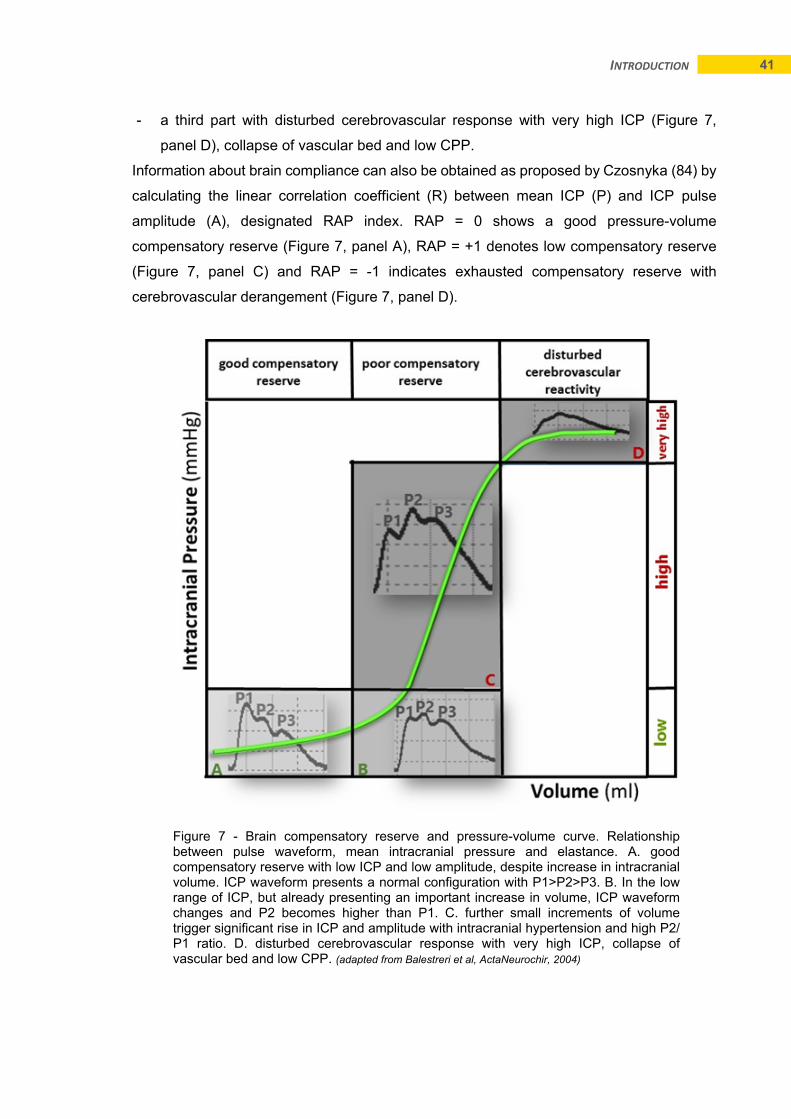
Compensatory reserve of craniospinal space described by pressure-volume curve has three
parts (Figure 7):
- a first part with good compensatory reserve with low ICP and low amplitude, despite
increase in intracranial volume. ICP waveform presents a normal configuration with
P1>P2>P3 (Figure 7, panel A).
- a second part with poor compensatory reserve where the relationship between volume
and pressure is nonlinear. In the low range of ICP, but already presenting an
important increase in volume (Figure 7, panel B), ICP waveform changes and P2
becomes higher than P1. At this point, (Figure 7, panel C) further small increments of
volume trigger significant rise in ICP and amplitude with intracranial hypertension and
high P2/P1 ratio.
Figure 6 - The normal exponential
intracranial pressure-volume curve first introduced by Langfitt. At normal intracranial pressure levels, the increase in volume (dV) leads to a small increase in pressure (dP) and hence lower amplitude (lower waveform). With increases in intracranial pressure, the concurrent reduction in intracranial compliance leads to a dramatic increase in pressure even with a small increase in volume (upper waveform). (adapted from Marmarou et al, JNS 1975)
41 INTRODUCTION
- a third part with disturbed cerebrovascular response with very high ICP (Figure 7,
panel D), collapse of vascular bed and low CPP.
Information about brain compliance can also be obtained as proposed by Czosnyka (84) by
calculating the linear correlation coefficient (R) between mean ICP (P) and ICP pulse
amplitude (A), designated RAP index. RAP = 0 shows a good pressure-volume
compensatory reserve (Figure 7, panel A), RAP = +1 denotes low compensatory reserve
(Figure 7, panel C) and RAP = -1 indicates exhausted compensatory reserve with
cerebrovascular derangement (Figure 7, panel D).
Figure 7 - Brain compensatory reserve and pressure-volume curve. Relationship between pulse waveform, mean intracranial pressure and elastance. A. good compensatory reserve with low ICP and low amplitude, despite increase in intracranial volume. ICP waveform presents a normal configuration with P1>P2>P3. B. In the low range of ICP, but already presenting an important increase in volume, ICP waveform changes and P2 becomes higher than P1. C. further small increments of volume trigger significant rise in ICP and amplitude with intracranial hypertension and high P2/P1 ratio. D. disturbed cerebrovascular response with very high ICP, collapse of vascular bed and low CPP. (adapted from Balestreri et al, ActaNeurochir, 2004)

42 INTRODUCTION
CEREBRAL BLOOD FLOW AND CEREBROVASCULAR REACTIVITY
CEREBRAL BLOOD FLOW
Preservation of adequate cerebral blood flow is vital to normal brain functioning. The brain
has a high metabolic rate and accounts for almost 20% of total body oxygen consumption
and 25% of glucose utilization. It has no metabolic storage and is unable to maintain its
integrity through anaerobic metabolism. Therefore, it depends on a constant blood flow of
nearly 15% of cardiac output (56).
In the nineteenth century, Theodor Meynert hypothesized for the first time that the partial
hyperaemia seen in cortical areas was an indication of their partial awaking – functional
hyperaemia. In spite of this observation, the modern era of CBF knowledge started in the
sixties with the work of Niels Lassen and David Ingvar (Figure 8) (85, 86). These studies
relate anatomical vascular structure with function and intrinsic and extrinsic regulation (87).
Global CBF is approximately 50 ml/min/100g of tissue, but local CBF varies from 50-75
ml/min/100g in gray matter to 25-45 ml/min/100g in white matter. Under normal
circumstances, CBF remains almost constant and makes instantly adjustments to neuronal
metabolic demands. Strong evidence of neuronal function and vascular coupling has been
obtained with in vivo methods (88-90). This need for continuous and adapted flow to
Figure 8 – Pressure / flow curve with autoregulation plateau, first described by Lassen in 1959. The relationship between pressures, flow and volume helps to understand the intracranial fluids dynamics of blood and cerebrospinal fluid overtime.
43 INTRODUCTION
demands is regulated by a variety of mechanisms of cerebrovascular reactivity, which
remains incompletely understood:
- neurovascular coupling due to metabolic demands (91)
- autoregulation due to changes in cerebral perfusion pressure and cerebrovascular
resistance (60, 92, 93)
- vasoreactivity related to carbon dioxide, pH and blood oxygen content (94, 95)
- intrinsic and extrinsic autonomic nerve activity (96)
- vasoactive humoral factors produced by endothelium, neurons and glial cells, namely
adenosine, oxygen and nitrogen reactive species, purines, ions such as potassium,
prostanoids and some neurotransmitters
- reactivity to drugs such as acetazolamide.
CEREBROVASCULAR REACTIVITY
Cerebrovascular reactivity reflects the changes in cerebral vascular resistance in response
to vasodilatory or vasoconstrictive stimuli such as arterial pressure, partial pressure of
arterial blood gases, or due to drug effects. Understanding the normal mechanisms of
cerebrovascular reactivity that regulate cerebral blood flow (CBF) and the modifications
induced by acute brain lesion and medical interventions is fundamental to the adequate
management of neurocritical patients.
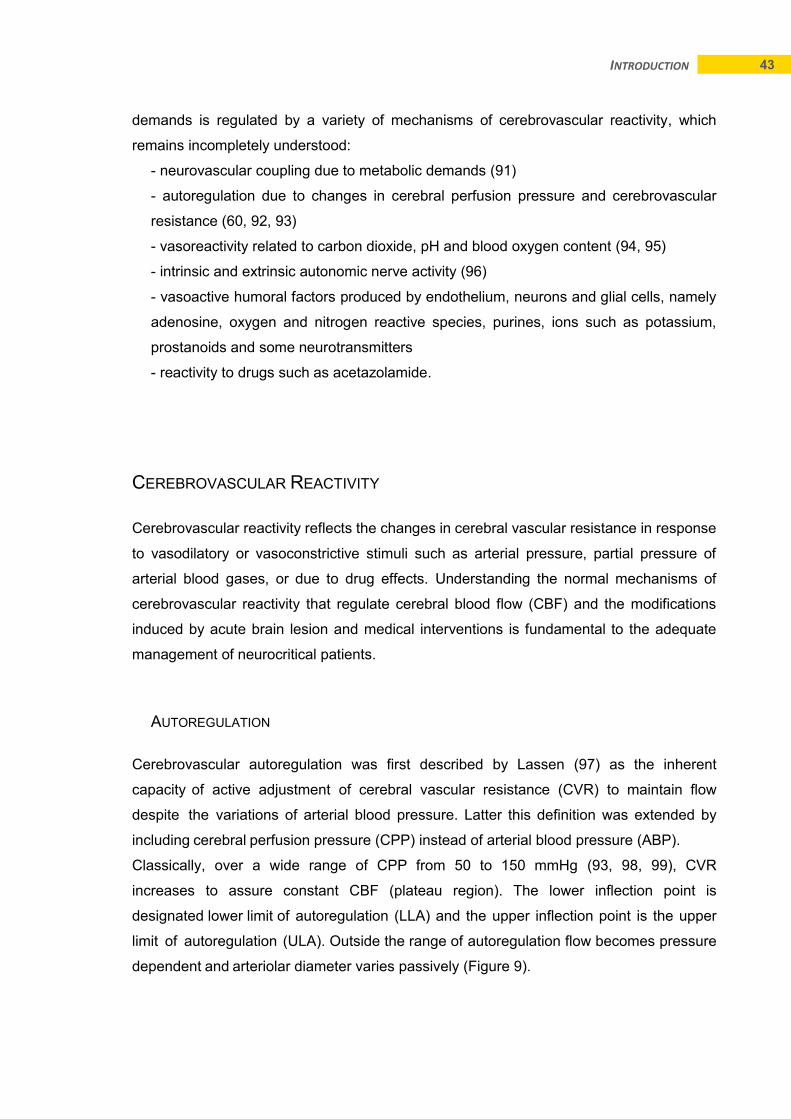
AUTOREGULATION
Cerebrovascular autoregulation was first described by Lassen (97) as the inherent
capacity of active adjustment of cerebral vascular resistance (CVR) to maintain flow
despite the variations of arterial blood pressure. Latter this definition was extended by
including cerebral perfusion pressure (CPP) instead of arterial blood pressure (ABP).
Classically, over a wide range of CPP from 50 to 150 mmHg (93, 98, 99), CVR
increases to assure constant CBF (plateau region). The lower inflection point is
designated lower limit of autoregulation (LLA) and the upper inflection point is the upper
limit of autoregulation (ULA). Outside the range of autoregulation flow becomes pressure
dependent and arteriolar diameter varies passively (Figure 9).
44 INTRODUCTION
Contemporary research indicates a far more pressure-passive CBF than the classical
definition with a narrower plateau region and less efficacious buffering capacity against
decreases than increases in CPP (100). In fact, the mechanism of autoregulation has
hysteresis, i.e., the brain defends more effectively against acute hypertension than
hypotension. Additionally, the pressure limits of autoregulation vary with age (101, 102) and
pathologic conditions such as chronic arterial hypertension (103) or acute brain lesion (47).
Autoregulation is also modulated by mechanisms that cause cerebral vasoconstriction and
vasodilation.
VASOREACTIVITY
Vasoreactivity is defined as the cerebrovascular resistance response to changes in arterial
carbon dioxide pressure (PaCO2), arterial oxygen pressure (PaO2) and arterial oxygen
content (CaO2).
𝑪𝑩𝑭 =𝑪𝑷𝑷
𝑪𝑽𝑹
Figure 9 – CBF (cerebral blood flow), CVR (cerebrovascular resistance) and arteriolar diameter variation with CPP (cerebral perfusion pressure). (adapted from Paulson et al)

45 INTRODUCTION
CO2 – VASOREACTIVITY: Hypercapnia produces vasodilation, increases cerebral blood
volume (CBV) and decreases CVR, whereas hypocapnia produces vasoconstriction. Both
large intracranial and pial arteries respond to CO2 oscillations: large vessels are the “first-
line” defence of CBF and small subarachnoid pial vessels modulate regional blood flow.
Within a PaCO2 range from 20 to 100 mmHg a change in 1 mmHg of PaCO2 induces a 4%
average change in CBF (104) (Figure 10).
O2- VASOREACTIVITY: CBF increases with PaO2 below 50 mmHg but response to oxygen
is controlled by CaO2 rather than PaO2. Inverse relationship between blood haematocrit and
CBF seems to be a function of oxygen delivery (105).
Cerebrovascular reactivity to hypoxia is dependent on basal PaCO2: decreases with
hypocapnia and increases with hypercapnia.
Vasoreactivity and autoregulation are not independent mechanisms: progressive
hypotension impairs the response of cerebral circulation to changes in PaCO2 and
progressive increase in PaCO2 narrows the autoregulatory CPP range. In the figure 11 we
present an example of recovery of autoregulation evaluated at bedside with cerebrovascular
Figure 10 - Left chart: comparison of the response of cerebral blood flow (CBF green line; ml/min/100g) and cerebral blood volume (CBV red line; ml/100g) to arterial carbon dioxide tension (PaCO2). Right chart: comparison of the response of cerebral blood flow to arterial oxygen tension (PaO2; dark blue line) and oxygen arterial content (CaO2; light blue line).

46 INTRODUCTION
pressure reactivity (PRx) after mild hyperventilation and without changing CPP. Further
detailed information about PRx is presented in next sections.
Disturbed autoregulation may coexist with intact CO2-vasoreactivity (dissociated
vasoparalysis) and in some acute disease states, autoregulation may be regained by
induced hypocapnia (106).
Figure 11– Autoregulation evaluated with pressure reactivity index (PRx) recovered after mild hyperventilation, maintaining cerebral perfusion pressure. PRx red bar means autoregulation impairment and PRx green bar means working autoregulation. ABP (arterial blood pressure; red area), CPP (cerebral perfusion pressure; yellow line), ICP (intracranial pressure; white line), ETCO2 (endtidal carbon dioxide; blue line).

47 INTRODUCTION
ASSESSMENT OF CEREBROVASCULAR REACTIVITY
Cerebrovascular reactivity assessment may be performed applying different methods of
measuring or estimating CBF (non-invasive vs invasive, global vs regional vs local) and
using different stimulus (fluctuations of arterial blood pressure, metabolic changes and IV
injection of drugs). Evaluation of cerebrovascular reactivity may be intermittent or
continuous. Cerebrovascular reactivity may also be measured as static vs dynamic. While
the static method evaluates relative blood flow changes in response to a steady-state
change in the CPP, the dynamic method measures the response during a rapid change in
CPP or ABP. The ratio of the change in cerebral blood flow in response to a change in the
vasoactive stimulus defines the static rate (105). It is most frequently evaluated with non-
invasive global intermittent methods of quantifying CBF such as Xe133 CT-scan, CT
perfusion, BOLD-MRI or PET-scan. The dynamic rate of cerebrovascular reactivity is
evaluated with continuous methods of quantifying CBF (thermal-dilution flowmetry) or
surrogates (CPP, PbtO2, cerebral oximetry with NIRS or TCD) and calculated with time-
domain (moving correlation coefficient) (107, 108) or frequency-domain (transfer function
analysis) (109) algorithms.
An overview of the methods that can be applied for CBF assessment and the type of
vasoactive stimulus most frequently used are presented in Table 2 and Table 3,
respectively.
Table 2 - Overview of indirect (I) and direct (D) methods for cerebral blood flow (CBF) assessment
CBF assessment
Mostly continuous Intermittent
Invasive
global I:cerebral perfusion pressure (CPP)
local I:brain tissue oxygenation (PbtO2)
D:thermal-dilution flowmetry (td-CBF) I:Microdialysis
Non-invasive
global
D:Xe133 CT-scan
D:CT perfusion
I:BOLD-MRI
D:PET
regional I:cerebral oximetry (CO) with NIRS
I:Transcranial Doppler

48 INTRODUCTION
Table 3 – Vasoactive stimulus most frequently used to assess cerebrovascular reactivity.
Vasoactive stimulus*
ABP or CPP changes Metabolic changes IV Drugs
spontaneous ABP or CPP fluctuations
carotid compression
thigh cuff release
lower body negative pressure
hand grip
inspired CO2
breath-holding
cognitive tasks
acetazolamide
*(110-112).
INDICES OF CEREBROVASCULAR REACTIVITY WITH TIME-DOMAIN MONITORING
For the present thesis we studied cerebral autoregulation using continuous assessment of
cerebrovascular reactivity with time-domain analysis and moving correlation algorithms (71,
108, 113, 114). For calculation of continuous indices of autoregulation the stimulus signals
used were spontaneous fluctuations of ABP or CPP and the comparator signals were ICP
for PRx, ICP amplitude for PAx, PbtO2 for ORx, CO for COx and TDF-CBF for CBFx. Briefly,
all signals were time averaged using a window of 10 seconds and afterwards the moving
linear correlation coefficient between stimulus signal and comparator signal was calculated
using a 5 min-window with an update every 10 seconds (Figure 12).
Figure 12– Example of moving linear correlation window of 5 min (300 sec) for arterial blood pressure (ABP) and intracranial pressure (ICP) with an update every 10 seconds and time series plot of the correlation coefficient (PRx; pressure reactivity index).

49 INTRODUCTION
In a reactive vascular system, these indices are supposed to be close to zero or negative,
while positive values close to one signify impaired reactivity.
PRESSURE REACTIVITY INDEX: PRX uses ICP as a surrogate of cerebral vascular
resistance changes and hence CBF fluctuations in response to ABP changes (107, 108,
115). In 1997 it was introduced for the first time, using a computer-based approach to
continuously calculate and monitor PRx (108). Cerebrovascular pressure reactivity does
not necessarily reflect cerebral autoregulation but correlates well with indices of
autoregulation based on transcranial Doppler ultrasonography (116) and in PET studies
(117, 118). A positive time averaged (period longer than 30 minutes) above 0.25 signifies
passive reactive vascular bed, while a PRx < 0 indicates normal autoregulation (20). The
prognostic significance of PRx in TBI has been demonstrated in several studies, in which
abnormal PRx was clearly associated with high ICP, low CPP, low GCS on admission and
poor outcome at 6 months (119-121). PRx may be used to continuous monitoring of
autoregulation and define individual lower limit of autoregulation (LLA) and upper limit of
autoregulation (ULA), helping target optimal CPP (122, 123) (Figure 13).
Figure 13 - Intracranial pressure (ICP), cerebral perfusion pressure (CPP), and pressure reactivity index (PRx). Continuous monitoring of autoregulation and definition of individual lower limit of autoregulation (LLA) and upper limit of autoregulation (ULA) to target optimal CPP during NCCU management.

50 INTRODUCTION
Retrospective studies show that PRx is a strong independent predictor of outcome and
favourable outcome reaches its peak when CPP is maintained close to optimal CPP (124).
Although the retrospective data in support of individualized, PRx-guided optimal CPP
therapy are convincing and were referenced in the latest Guidelines for the Management of
Severe Traumatic Brain Injury (36) and in the recent Consensus Conference on
Multimodality Monitoring in Neurocritical Care (12), prospective data are lacking. Multicentre
clinical trials are now being planned to assess the potential benefit of PRx-guided optimal
CPP therapy in traumatic brain injury patients.
PRESSURE AMPLITUDE INDEX: The PAx is defined as the moving correlation coefficient
between ABP and ICP pulse amplitude (125). The pulse amplitude conveys relevant
information about intracranial vascular tone and compliance which are functions of
cerebrovascular reactivity (126). The PAx also differentiated between fatal and non-fatal
outcomes and can be used to determine optimal CPP. It has been shown that PAx is
potentially a more robust estimator of cerebrovascular reactivity at lower values of ICP than
PRx, namely when the brain is very compliant, as after decompressive craniectomy or open
ventricular drainage (127).
OXYGEN REACTIVITY INDEX: The brain tissue oxygen tension (PbtO2) can be used to create
an autoregulation index because its values may be interpreted as a surrogate of local CBF
(78), in spite it also reflects the arteriovenous difference in oxygen tension. The oxygen
reactivity index (ORx) is the moving correlation coefficient between PbtO2 and CPP (113,
128). The reports about correlation between PRx, ORx and outcome for patients with head
injury show discordant results either with positive correlation (113) or with no relevant
correlation (129). However, these published papers use different methodologies of
measuring PbtO2 with different dynamic properties and, therefore, ORx values of different
probes should not be interchanged and analysed as equivalent (130, 131).
CEREBRAL OXIMETRY REACTIVITY INDEX: The cerebral oximetry (CO) measured by
cerebral haemoglobin oxygenation saturation (rSO2) with transcranial NIRS may be used
as a continuous non-invasive surrogate of CBF. Modern NIRS machines can detect
spontaneous low-frequency oscillations (slow waves) and CO can be used for the
continuous assessment of cerebral autoregulation. The COx (other authors also call it TOx)
is a moving linear correlation coefficient between CPP and spontaneous slow waves of
cerebral oximetry measured by NIRS (71, 123). COx (and TOx) can detect impaired
cerebral autoregulation (69).

51 INTRODUCTION
CEREBRAL BLOOD FLOW REACTIVITY INDEX: Similarly to the other indices, flow reactivity
index (CBFx) may be continuously calculated using the values of CBF measured with
thermal-diffusion probe. The CBFx (or FRx) is a moving linear correlation coefficient
between CPP and TDF-CBF (114).
The following section presents the methods of calculation of cerebrovascular reactivity
indexes in greater detail.
OPTIMAL CEREBRAL PERFUSION PRESSURE
In the past decades more emphasis has been directed toward CPP thresholds in
TBI patients. Injured brain may present signs of ischemia if CPP remains below 50 mmHg
and in contrast raising the CPP above 70 mmHg may be associated with hyperaemia.
Current TBI management protocols are based on a combination of CPP-oriented (37),
ICP-oriented (132) and/or oxygenation-oriented therapy (64) but this approach
is likely an oversimplification of the complex secondary pathophysiology. Autoregulation
indices based on ICP (PRx), mean blood flow velocity (Mx), brain tissue oxygenation
(ORx, ORxs), cerebral oximetry (TOx, COx) and cerebral blood flow (CBFx) may be
helpful in defining optimal therapeutic strategies (133). These descriptors of autoregulation
exhibit a U-shaped curve when plotted against CPP (108), in which the nadir of the
descriptor distribution represents the reference point for autoregulation and the arms of the
parabolic curve denote deviation from ‘best autoregulation’ possibly leading to ischemic or
hyperaemic CBF(Figure 14).
In 2002, Steiner et al. demonstrated that it is possible to calculate an “optimal” CPP
value (CPPopt) at bedside using continuous evaluation of PRx (122). The CPPopt
corresponds to the CPP value at which PRx reaches its lowest (optimal) value in an
individual patient and over time. Furthermore, Steiner et al. based on their findings
proposed a protocol for an autoregulation-oriented management of severe TBI patients
with optimization of CPP.
More recently, in 2012 Aries et al. published a retrospective analysis of long-term
monitoring data of TBI patients using an improved and automatic CPPopt
calculation with a homogeneous software methodology (ICM+:
www.neurosurg.cam.ac.uk/icmplus) (Figure 15). The new algorithm incorporated
automatic updating of CPP using continuous monitoring of PRx. The U-shaped
curve fitted a 4h-long moving window updated every minute. The CPPopt value was
presented as a dynamically changing variable and was continuously calculated for more
than 80% of time. Continuous metrics of the distance between real CPP and CPPopt was

52 INTRODUCTION
associated to outcome: too low CPP increased mortality, too high CPP increased
disability and CPP around CPPopt related to favourable outcome (134).
The concept of “optimal CPP” therapy was prospectively applied during the
clinical investigation for this dissertation and an article with the description of the
methodology and results was recently accepted for publication for Neurocritical Care
Journal (Publication V).
Figure 14 - U-shaped curve distribution of cerebrovascular reactivity indices PRx (pressure reactivity index), ORxs (oxygen reactivity index), COx (cerebral oximetry index) and CBFx (cerebral blood flow index) plotted against CPP (cerebral perfusion pressure) for an individual patient.
Figure 15 - Visual continuous metrics of the distance between real cerebral perfusion pressure (CPP; white dots) and optimal CPP (CPPopt; red dots) (upper chart). Time histogram of CPP (red area CPP below CPPopt, orange area CPP-CPPopt = 5 mmHg and yellow area CPP-CPPopt > 5mmHg (lower chart).

53
MATERIAL, METHODS AND DATA ANALYSIS


55 MATERIAL, METHODS AND DATA ANALYSIS
MATERIAL, METHODS AND DATA ANALYSIS
Local Research Ethics Committee has accepted research protocol and written informed
consent was obtained from the next of kin.
PATIENTS
INCLUSION CRITERIA
- Adult patients with severe TBI (GCS ≥ 8) admitted to the NCCU of the Intensive Care
Department of Centro Hospitalar São João, between July 2011 and January 2013 with
clinical indication for standard and advanced multimodal brain monitoring.
EXCLUSION CRITERIA
- Pregnancy or inability to obtain written informed consent.
- Lack of equipment available for advanced brain monitoring with PbtO2 and CBF.
SAMPLE POPULATION
The study population included 18 consecutive patients (16 males, 89%) with mean age of
42 (SD 16) years old. The median baseline GCS was 6 (IQR3) and 3 patients with GCS >
8 had subsequent deterioration requiring intensive care treatment. The mean SAPS II was
45 with predicted mortality of 36%. Mean length of stay (LOS) in the NCCU and hospital
was 26 (SD 12) and 53 days (SD 37) respectively. Mortality rate at 28 days was 17% (3
patients) and median GOS (135) at 6 month was 3.
The initial CT-scan Marshall score (136) distribution was: 6 patients with diffuse injury type
II, 3 patients with diffuse injury type III, 4 patients with diffuse injury type IV and 5 patients
with non-evacuated lesions.
Before NCCU admission 4 patients were submitted to craniotomy for hematoma drainage,
3 patients needed early decompression and 3 had non-neurosurgical procedures. During
NCCU stay, 1 patient had an extraventricular drainage and 2 more patients went for late
decompression due to refractory intracranial hypertension. The total time (hours)
for standard and advanced multimodal brain monitoring with median and (IQR) was: ICP
and CPP 5521h (283;169), CO 4229h (214;137), PbtO2 4048h (203;129) and CBF 2339h
(119;107). More detailed clinical information is available in Table 4.
56 MATERIAL, METHODS AND DATA ANALYSIS
Table 4 – Demographic data of patients included in the clinical investigation.
Abbreviations: GCS (Glasgow Coma Score), SDH (subdural hematoma), EVD (external ventricular drainage), ECMO (extracorporeal membrane oxygenation), MOF (multiple organ failure), GOS (Glasgow outcome scale), ICP (intracranial pressure), PbtO2 (brain tissue oxygen tension), CO (cerebral oximetry), TDF-CBF (thermal diffusion cerebral blood flow)

57 MATERIAL, METHODS AND DATA ANALYSIS
NEUROCRITICAL CARE UNIT AND PATIENT MANAGEMENT
NEUROCRITICAL CARE UNIT
Patients were managed in the Neurocritical Care Unit (NCCU) of the Intensive Care
Department at Centro Hospitalar São João. The modern NCCU is located in the 8th floor
since 2009 and has two main clinical areas for intensive and high-dependency care. The
purpose-built unit has allocated 10 beds for the intensive care area and 6 for the high-
dependency area and provides 24 hour clinical coverage.
The NCCU is staffed with intensivists with different backgrounds (Anaesthesia, Internal
Medicine and Infectious Diseases) and nurses who are specially trained and understand
the complexities of caring for patients with neurological injuries. Our treatment team also
includes psychologists, physical therapists, and nutritionists. The NCCU team is completed
by a dedicated neurosurgery consultant and attending neurology and neuroradiology.
The NCCU is equipped with state-of-the-art bedside equipment for intensive care, with
multimodal brain monitoring (ICP, CPP, PbtO2, CO and TDF-CBF), clinical data
management system (B-ICU®) and neuromonitoring integration data system (ICM+®).
Over 800 patients are treated each year on the NCCU. More than 95% have neurological
or neurosurgical related diagnoses (major trauma, isolated head and spinal trauma,
subarachnoid and intracerebral haemorrhage, acute severe ischemic stroke, uncontrolled
epilepsy, central nervous system infection and neurosurgical postoperative care).
GENERAL PATIENT MANAGEMENT
All patients were managed with NCCU protocol driven therapy aimed at maintaining ICP <
20 mmHg and guided CPP management (Figure 16).
During the study period patients were sedated with continuous infusions of propofol and/or
midazolam and fentanyl to achieve a Richmond Agitation-Sedation Scale (RASS) score
between zero and -5 (137) and adequate analgesia. Artificial ventilation was applied with
lung protective criteria, PaCO2 levels between 35-40 mmHg and normoxia. At our NCCU,
patients are treated with 30º head up elevation and CPP is continuously calculated with
ABP transducer located at heart level (53).
When possible, we guided CPP management using the bedside optimal CPP values
calculated with ICM+ according to pressure reactivity index (CPPopt). If CPPopt was not
available, we kept CPP between 50-70 mmHg in accordance to Brain Trauma Foundation
Guidelines (36).

58 MATERIAL, METHODS AND DATA ANALYSIS
Normothermia, correction of electrolyte and glucose imbalance and control of seizures were
also standard elements of treatment.
Figure 16 - Neurocritical Care Unit (NCCU) protocol for Traumatic Brain Injury and Intracranial Hypertension Management. Optimal Cerebral Perfusion Pressure (CPPopt) evaluated continuously at bedside with cerebrovascular reactivity index and Intracranial Pressure (ICP) control below 20 mmHg are primary targets. __________________
Abbreviations: EKG (electrocardiogram), SpO2 (pulse oximetry), ETCO2 (endtidal carbon dioxide), ABP (arterial blood pressure), CVP (central venous pressure), ICP (intracranial pressure), ICM+ (multimodal brain monitoring software), NIRS (cerebral oximetry with near infrared light), PbtO2 (brain tissue oxygen pressure), TDF-CBF (thermal diffusion cerebral blood flow), EEG (electroencephalogram), BIS (bispectral index), CPP (cerebral perfusion pressure), CPPopt (optimal CPP), PaO2 (arterial oxygen pressure), PaCO2 (arterial carbon dioxide pressure), Temp (temperature), RASS (Richmond agitation-sedation scale), BPS (behavioural pain scale), Na+ (serum sodium), CT (computerized tomography), CSF (cerebral spinal fluid).

59 MATERIAL, METHODS AND DATA ANALYSIS
CPP MANAGEMENT
CPPopt was determined in individual patients as described by the recent published method
of Aries et al (134). The software generates automatically a curve with CPPopt value that
is continuously displayed at the bedside and both are updated every minute. In addition, we
formulated three extra criteria before accepting the suggested automatic displayed CPPopt
value: (a) at least 75% of time good recordings of ABP and ICP values had to be available
in the 4 hr calculation window, (b) average PRx values had to be < 0.25 the past 4hrs
(defined as a period with intact cerebrovascular pressure reactivity) (20) and (c) dedicate
the staff to study the CPPopt curve and overrule the automatic CPPopt value and take the
CPP value with most negative PRx value covered by the curve. U-shaped, ascending and
descending curves were accepted in case the overall PRx<0.25. An illustrative example is
shown in Figure 17. To achieve higher CPPopt values CPP augmentation was managed
with fluids and/or norepinephrine infusion according to hemodynamic assessment and to
lower CPPopt values vasopressor therapy was decreased, intracranial hypertension treated
or sedation increased.
Figure 17- Screenshot of ICM+® software panel with 4h-trend charts for visual decision of optimal cerebral perfusion pressure according to pressure reactivity index (CPPopt). First chart: CPP (cerebral perfusion pressure) and ICP (intracranial pressure); second chart: pressure reactivity index (PRx); third chart: PRx/CPP plot for evaluating CPPopt and fourth chart: percentage of 4h time spent within CPP interval. Criteria of decision for CPPopt: (first chart) 4h-trend with more than 75% of reliable CPP and ICP data; (second chart) PRx < 0.25; (third chart) CPP curve with PRx < 0.25 and CPPopt defined 82.5 mmHg; (fourth chart) CPP targeted according to CPPopt.

60 MATERIAL, METHODS AND DATA ANALYSIS
INTRACRANIAL HYPERTENSION MANAGEMENT
Episodes of intracranial hypertension (ICP > 20 mmHg) were treated initially with first-tier
therapy (deep sedation, paralysis, normothermia, mild hyperventilation and when possible
cerebral spinal fluid drainage after insertion of extra ventricular drain). In cases of plateau
waves of ICP diagnosis we preferably applied a short hyperventilation period to stop the
vasodilatory cascade. If ICP remained above 20 mmHg for more than 20 minutes,
osmotherapy was administered (20% mannitol or 20% hypertonic saline bolus) (138-142).
Refractory intracranial hypertension was managed with second-tier therapy (hypothermia,
profound hyperventilation and surgical decompression) (143, 144) (Figure 16).
MONITORING PARAMETERS, SENSORS, EQUIPMENT, AND SOFTWARE
BASIC VITAL SIGNS MONITORING
ELECTROCARDIOGRAPHY, PULSE OXIMETRY WITH PLETYSMOGRAPHY, NASOPHARYNGEAL
TEMPERATURE, MICRO-STREAM END-TIDAL CO2 and arterial blood pressure were
continuously monitored with Philips Intellivue MP70 multiparameter monitor (Philips medical
systems, Eindhoven, the Netherlands).
ARTERIAL BLOOD PRESSURE: invasive arterial blood pressure was monitored from radial,
brachial or femoral artery with arterial catheters (Arterial Leader-cath, Vygon, Ecouen,
France) using a pressure monitoring kit (Combitrans single pressure monitoring kits,
BBraun, Melsungen, Germany). Mean arterial blood pressure was continuous calculated
(ABP=(sABP+2*dABP)/3)) and displayed by the Philips MP70 monitor. ABP units: mmHg.
STANDARD BRAIN MONITORING
INTRACRANIAL PRESSURE: intracranial pressure was monitored using intraparenchymal
probes with a single bolt (Codman microsensor ICP transducer, DePuySinthes,
Massachusetts, USA) and ICP EXPRESS® Monitoring System (Codman, DePuySinthes,
Massachusetts, USA). ICP pressure and pulse waveform was transferred to Philips monitor
with Codman-Philips pressure cable.

61 MATERIAL, METHODS AND DATA ANALYSIS
CEREBRAL PERFUSION PRESSURE: cerebral perfusion pressure was continuously
calculated (CPP=ABP-ICP) and displayed by the Philips MP70 monitor. CPP units mmHg.
ADVANCED BRAIN MONITORING
We used a triple lumen bolt (Licox CMP Triple Lumen Monitoring System, Integra
Neurosciences, Plainsboro, USA) for intraparenchymal probes to monitor partial pressure
of brain tissue oxygenation, brain temperature and cerebral blood flow with thermal-diffusion
flowmetry (Figure 18).
BRAIN TISSUE OXYGENATION: brain tissue oxygenation was assessed using a flexible
polarographic Clarke-type microcatheter (Licox oxygen catheter micro-probe model
CC1.SB, Integra, Plainsboro, USA). PbtO2 probes have 0.8mm in diameter and a sensitive
region approximately of 5 mm in length and 13 mm2of tissue section. Calibration data is
Figure 18 – Basic Vital Signs and Multimodal Brain Monitoring Set.
62 MATERIAL, METHODS AND DATA ANALYSIS
stored on a smart card supplied with each PbtO2 probe. After insertion, the probe run-in
time may be up to 2 hours. The insertion depth of the probe was 30 mm (from dura level to
catheter tip). PbtO2 units: mmHg.
BRAIN TEMPERATURE: brain temperature micro probe is a type K thermocouple catheter
with 0.8 mm diameter (Licox temperature probe C8.B, Integra, Plainsboro, USA).
Temperature measurement accuracy at 37ºC is ±0.2ºC The brain temperature must be
supplied to the Licox monitor because PbtO2 is automatically adjusted for temperature
(probe PbtO2 sensitivity change with temperature is approximately 4% per ºC). Temperature
units: ºC. The Licox CMP Monitor (Integra, Plainsboro, USA), used for oxygen and
temperature measurements, displays a digital reading but data were sent to the ICM+
software.
THERMAL-DIFFUSION FLOWMETRY OF CBF: the TDF-CBF sensor consists of a flexible
polyurethane catheter of 0.9 mm diameter with a thermistor embedded at the distal tip and
a temperature sensor located 8 mm proximal (QFlow 500 Bowman flow sensor, Hemedex,
Cambridge, USA). Regional cerebral blood flow is quantified within the 8 mm diameter
thermal field generated by the active thermistor which is heated approximately 2ºC above
baseline. The power required to stabilize the thermal field is proportional to the thermal
dissipation and therefore to the regional CBF. The sensor should be located
intraparenchymal, in the white mater, approximately 25-30 mm below the dura.
The Bowman Perfusion Monitor displays CBF values, brain temperature and delta and
tissue thermal conductivity value (K Value). CBF units: ml/100g/min.
All intraparenchymal probes were inserted in the white matter in a region at risk of ischemia
(penumbra area around contusions or diffuse axonal injury) and their location was
confirmed with CT scan.
CEREBRAL OXIMETRY: cerebral haemoglobin oxygenation index (rSO2) named as cerebral
oximetry was monitored with bilateral near-infrared spectroscopy sensors with dual
wavelength design (adult cerebral sensors, Covidien, Mansfield, USA) positioned at the
forehead and with INVOS 5100C equipment, (Covidien, Mansfield, USA). CO units: %.

63 MATERIAL, METHODS AND DATA ANALYSIS
DATA CAPTURE AND SOFTWARE
ICM+® SOFTWARE: data were collected digitally using ICM+ software developed by Dr. P.
Smielewski and Prof. M. Czosnyka (Cambridge Enterprise, UK,
http://www.neurosurg.cam.ac.uk/icmplus) (108, 145-147). Serial communication protocol
(RS232), either with direct connection to COM ports or using USB-to-Serial Converter
(Aten UC232A), was used to acquire waveforms of ICP, ABP, ECG, CO2 from Phillips
MP70 Intellivue monitors, brain tissue oxygenation (PbtO2) and temperature from Licox
monitors, near infrared spectroscopy cerebral haemoglobin oxygenation index (rSO2)
from INVOS monitors, and cerebral blood flow (TDF-CBF) from Hemedex monitors at
their respective sampling rates offered by the monitors (ranging from 0.2 Hz for rSO2, to
125Hz for pressures, and 500Hz for ECG waves). All the data samples were
synchronised to the computer time, and resampled to 250 Hz prior to further processing.
DERIVED PARAMETERS AND CONTINUOUS INDICES OF AUTOREGULATION
MEAN VALUES: all data mean values were continuously calculated using an average filter
with a window of 10 seconds.
PRX - PRESSURE REACTIVITY INDEX: PRx was determined based on Czosnyka et al method
(108) by observing the response of ICP to slow spontaneous fluctuations in ABP. The
calculations were performed with 10 s averages of ABP and ICP over a 10s-moving window
of 5 min length.
PAX – PULSE AMPLITUDE INDEX: was calculated using 10 s averages of ABP and
corresponding pulse amplitude of ICP over a 10s-moving window of 5 min length (125).
ORX AND ORXS- OXYGEN REACTIVITY INDEX: The ORx is the moving correlation coefficient
between CPP and PbtO2. We used a time window of 60 min as described by Jaeger et al
(113), but for the purpose of this work we also defined a ‘‘short’’ version of this index, termed
ORxs, calculated over a period of 5 min and 10s-moving window. With this new calculation
we intended to study brain oxygenation reactivity within the same time window resolution of
the other indices and compare both oxygen response dynamics.

64 MATERIAL, METHODS AND DATA ANALYSIS
COX - CEREBRAL OXIMETRY INDEX: The NIRS-derived cerebral oxygenation, COx was
calculated as the 10s-moving coefficient correlation between CPP and CO (bilateral brain
regional saturation average) over 5 min window (71).
CBFX – CEREBRAL BLOOD FLOW INDEX: The CBFx is a moving correlation between CPP
and CBF, with window length of 5 min moving every 10 s (114).
DATA ANALYSIS
ICM+ DATA ANALYSIS
All ICM+ files with monitoring data from patients were visually studied both raw data files
(Figure 19) and main data files. PRx and CPPopt was continuously calculated at bedside
with the automatic algorithm described in previous paragraphs but the other
cerebrovascular reactivity indexes and related CPP values were calculated offline. To
achieve this objective all the raw data files were reanalysed with a new ICM+ profile
incorporating the required calculations.
Figure 19 – Example of a screenshot with raw data of left and right cerebral oximetry (rSO2l and rSO2r), intracranial pressure (ICP), electrocardiogram (ECG), arterial blood pressure (ABP), endtidal carbon dioxide (CO2), cerebral blood flow (CBF), brain tissue oxygen pressure (PbtO2) and brain temperature during a period of 1h and 39 min.
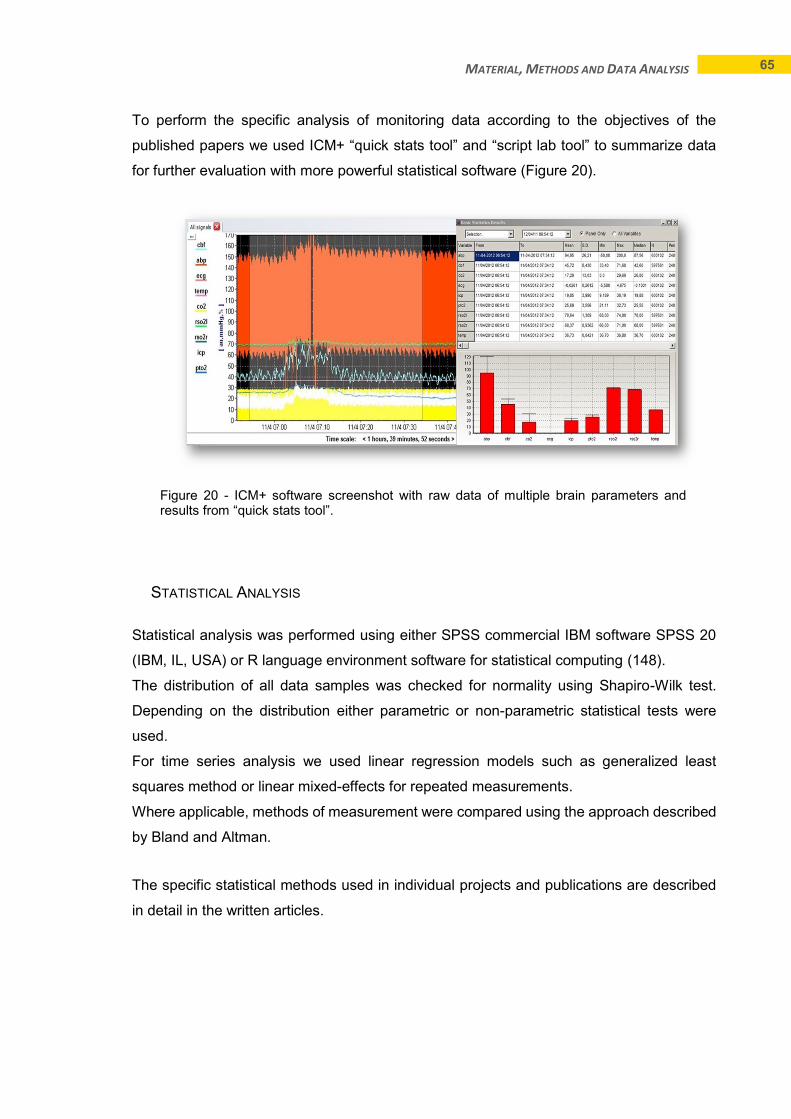
65 MATERIAL, METHODS AND DATA ANALYSIS
To perform the specific analysis of monitoring data according to the objectives of the
published papers we used ICM+ “quick stats tool” and “script lab tool” to summarize data
for further evaluation with more powerful statistical software (Figure 20).
STATISTICAL ANALYSIS
Statistical analysis was performed using either SPSS commercial IBM software SPSS 20
(IBM, IL, USA) or R language environment software for statistical computing (148).
The distribution of all data samples was checked for normality using Shapiro-Wilk test.
Depending on the distribution either parametric or non-parametric statistical tests were
used.
For time series analysis we used linear regression models such as generalized least
squares method or linear mixed-effects for repeated measurements.
Where applicable, methods of measurement were compared using the approach described
by Bland and Altman.
The specific statistical methods used in individual projects and publications are described
in detail in the written articles.
Figure 20 - ICM+ software screenshot with raw data of multiple brain parameters and results from “quick stats tool”.


67
PUBLICATIONS


69 PUBLICATION I
TRAUMATIC BRAIN INJURY IN PORTUGAL:
TRENDS IN HOSPITAL ADMISSIONS FROM 2000 TO 2010
Dias, C, Rocha, J, Pereira, E, Cerejo, A
Acta Med Port 2014 May-Jun;27 (3):349-356


AR
TIG
O O
RIG
INA
L
Revista Científica da Ordem dos Médicos www.actamedicaportuguesa.com 349
Traumatic Brain Injury in Portugal: Trends in Hospital Admissions from 2000 to 2010
Traumatismo Crânio-Encefálico em Portugal: Tendências em Doentes Internados de 2000 a 2010
1. Intensive Care Department. Neurocritical Care Unit. Hospital São João. University of Porto. Porto. Portugal.2. Neurology Department. Hospital Escala. Braga. Portugal. 3. Neurosurgery Department. Hospital São João. University of Porto. Porto. Portugal.Recebido: 03 de Outubro de 2013 - Aceite: 02 de Fevereiro de 2014 | Copyright © Ordem dos Médicos 2014
Celeste DIAS1, João ROCHA2, Eduarda PEREIRA1, António CEREJO3
Acta Med Port 2014 May-Jun;27(3):349-356
RESUMOIntrodução: O traumatismo crânio-encefálico tem um impacto sócio-económico considerável, sendo uma importante causa de mobi-mortalidade, frequentemente causador de incapacidade permanente. Procuramos caracterizar a utilização dos recursos de saúde de adultos com traumatismo crânio-encefálico em Portugal entre 2000-2010.Material e Métodos: Estudo retrospectivo de registos de adultos com código ICD9 de traumatismo crânio-encefálico incluídos na Base-de-Dados Nacional de Grupos Diagnósticos Homogéneos de 2000-2010. Realizamos uma análise estatística descritiva e aval-iamos as tendências durante a década. Resultados: Analisamos 72 865 admissões em 111 hospitais, 64,1% do sexo masculino, idade média de 57,9 ± 21,8 anos (18-107). Encontramos uma diminuição no número de traumatismo crânio-encefálico em pacientes jovens e um aumento nos mais velhos. O número de acidentes de trânsito diminuiu e o número de quedas aumentou. Houve um aumento de traumatismos crânio-encefálicos moderados-graves internados: 47,2% em 2000 / 80% em 2010. O número de admissões em Cuidados Intensivos quase duplicou (15,8% vs 29,5%), assim como o número de procedimentos neurocirúrgicos efectuados (8,2% vs 15,2%). A mortalidade total aumentou de 7,1% para 10,6%.Discussão: A diminuição do traumatismo crânio-encefálico observada pode estar associada com as campanhas de prevenção rodoviária, melhoria da rede rodoviária e políticas de saúde. O aumento da mortalidade poderá ser explicado pelo melhor atendimento pré-hospitalar, permitindo que casos mais graves cheguem ao hospital com vida e, embora tratados com mais frequência em Cuidados Intensivos e exigindo procedimentos neurocirúrgicos, vêm a falecer. Por outo lado, o aumento da idade dos doentes presumivelmente com maiores co-morbilidades associadas ao envelhecimento também estará a contribuir para a maior mortalidade.Conclusão: O traumatismo crânio-encefálico em Portugal está a mudar. Embora as admissões hospitalares por traumatismo crânio-encefálico tenham diminuído, a mortalidade aumentou.Palavras-chave: Unidades de Cuidados Intensivos; Traumatismos Crânio-Encefálico; Hospitalização; Portugal.
ABSTRACTIntroduction: Traumatic brain injury has a considerable socio-economic impact, being a major cause of morbi-mortality, often with permanent disability. We sought to characterize health resource utilization of adult traumatic brain injury patients in Portugal between 2000 and 2010.Material and Methods: Retrospective study of medical records of adult patients with ICD9 diagnostic code of traumatic brain injury included in the National Diagnosis Related Groups Database from 2000–2010. Descriptive statistical analysis was performed and trends during the decade were evaluated.Results: We analysed 72 865 admissions to 111 hospitals, 64.1% males, mean age 57.9 ± 21.8 years (18-107). We found a decrease in number of traumatic brain injury in younger patients and an increase in older ones. The number of traffic accidents decreased and the number of falls increased. There was an increase of moderate to severe traumatic brain injury admissions: 47.2% in 2000 / 80% in 2010. Patients admitted in Intensive Care have nearly doubled (15.8% vs 29.5%) as well as the number submitted to neurosurgical procedures (8.2% vs 15.2%). Total mortality increased from 7.1% to 10.6%.Discussion: The decrease of traumatic brain injury may be associated with the trauma prevention campaigns, road network improve-ment and health politics. The increase in mortality may be related to better pre-hospital care, enabling more severe cases to arrive in-hospital alive, and although treated more frequently in Intensive Care and requiring more neurosurgical procedures, they end up having higher mortality. Also this may be due to an increase in patients’ age and worse pre-morbid status.Conclusion: Traumatic brain injury in Portugal is changing. Although hospital admissions due to global traumatic brain injury have decreased, mortality rate has increased.Keywords: Intensive Care Units; Brain Injuries; Hospitalization; Portugal.
INTRODUCTIONTraumatic head injury and traumatic brain injury (TBI)
are defined as head and brain injuries caused by external trauma.1 Together, they are a major cause of consumption of health services as well as for mortality, morbidity and per-manent disability,2 often considered a silent epidemic with a considerable socio-economic impact world-wide.3 A sys-
tematic review of TBI epidemiology of 14 European coun-tries from 1980-2003, derived an aggregate hospitalized plus fatal TBI incidence rate of about 235/ 100 000 person-years,4 but there were large variations in the reports.5
Over the past 20 years a remarkable progress in the management of TBI, especially in critical care units, has
anos35
35 anos a promover as ciências biomédicas
ACTA M
ÉDIC
A PO
RTUG
UESA
1979 - 2014
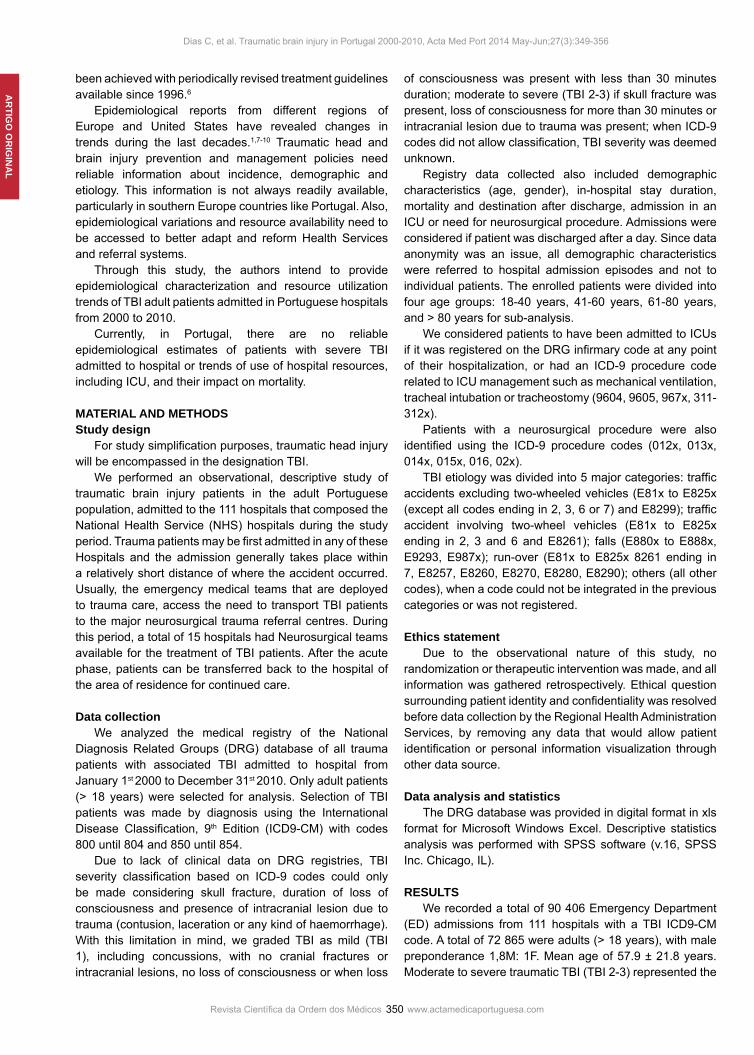
AR
TIGO
OR
IGIN
AL
350Revista Científica da Ordem dos Médicos www.actamedicaportuguesa.com
Dias C, et al. Traumatic brain injury in Portugal 2000-2010, Acta Med Port 2014 May-Jun;27(3):349-356
been achieved with periodically revised treatment guidelines available since 1996.6 Epidemiological reports from different regions of Europe and United States have revealed changes in trends during the last decades.1,7-10 Traumatic head and brain injury prevention and management policies need reliable information about incidence, demographic and etiology. This information is not always readily available, particularly in southern Europe countries like Portugal. Also, epidemiological variations and resource availability need to be accessed to better adapt and reform Health Services and referral systems. Through this study, the authors intend to provide epidemiological characterization and resource utilization trends of TBI adult patients admitted in Portuguese hospitals from 2000 to 2010. Currently, in Portugal, there are no reliable epidemiological estimates of patients with severe TBI admitted to hospital or trends of use of hospital resources, including ICU, and their impact on mortality.
MATERIAL AND METHODSStudy design For study simplification purposes, traumatic head injury will be encompassed in the designation TBI. We performed an observational, descriptive study of traumatic brain injury patients in the adult Portuguese population, admitted to the 111 hospitals that composed the National Health Service (NHS) hospitals during the study period. Trauma patients may be first admitted in any of these Hospitals and the admission generally takes place within a relatively short distance of where the accident occurred. Usually, the emergency medical teams that are deployed to trauma care, access the need to transport TBI patients to the major neurosurgical trauma referral centres. During this period, a total of 15 hospitals had Neurosurgical teams available for the treatment of TBI patients. After the acute phase, patients can be transferred back to the hospital of the area of residence for continued care.
Data collection We analyzed the medical registry of the National Diagnosis Related Groups (DRG) database of all trauma patients with associated TBI admitted to hospital from January 1st 2000 to December 31st 2010. Only adult patients (> 18 years) were selected for analysis. Selection of TBI patients was made by diagnosis using the International Disease Classification, 9th Edition (ICD9-CM) with codes 800 until 804 and 850 until 854. Due to lack of clinical data on DRG registries, TBI severity classification based on ICD-9 codes could only be made considering skull fracture, duration of loss of consciousness and presence of intracranial lesion due to trauma (contusion, laceration or any kind of haemorrhage). With this limitation in mind, we graded TBI as mild (TBI 1), including concussions, with no cranial fractures or intracranial lesions, no loss of consciousness or when loss
of consciousness was present with less than 30 minutes duration; moderate to severe (TBI 2-3) if skull fracture was present, loss of consciousness for more than 30 minutes or intracranial lesion due to trauma was present; when ICD-9 codes did not allow classification, TBI severity was deemed unknown. Registry data collected also included demographic characteristics (age, gender), in-hospital stay duration, mortality and destination after discharge, admission in an ICU or need for neurosurgical procedure. Admissions were considered if patient was discharged after a day. Since data anonymity was an issue, all demographic characteristics were referred to hospital admission episodes and not to individual patients. The enrolled patients were divided into four age groups: 18-40 years, 41-60 years, 61-80 years, and > 80 years for sub-analysis. We considered patients to have been admitted to ICUs if it was registered on the DRG infirmary code at any point of their hospitalization, or had an ICD-9 procedure code related to ICU management such as mechanical ventilation, tracheal intubation or tracheostomy (9604, 9605, 967x, 311-312x). Patients with a neurosurgical procedure were also identified using the ICD-9 procedure codes (012x, 013x, 014x, 015x, 016, 02x). TBI etiology was divided into 5 major categories: traffic accidents excluding two-wheeled vehicles (E81x to E825x (except all codes ending in 2, 3, 6 or 7) and E8299); traffic accident involving two-wheel vehicles (E81x to E825x ending in 2, 3 and 6 and E8261); falls (E880x to E888x, E9293, E987x); run-over (E81x to E825x 8261 ending in 7, E8257, E8260, E8270, E8280, E8290); others (all other codes), when a code could not be integrated in the previous categories or was not registered.
Ethics statement Due to the observational nature of this study, no randomization or therapeutic intervention was made, and all information was gathered retrospectively. Ethical question surrounding patient identity and confidentiality was resolved before data collection by the Regional Health Administration Services, by removing any data that would allow patient identification or personal information visualization through other data source.
Data analysis and statistics The DRG database was provided in digital format in xls format for Microsoft Windows Excel. Descriptive statistics analysis was performed with SPSS software (v.16, SPSS Inc. Chicago, IL).
RESULTS We recorded a total of 90 406 Emergency Department (ED) admissions from 111 hospitals with a TBI ICD9-CM code. A total of 72 865 were adults (> 18 years), with male preponderance 1,8M: 1F. Mean age of 57.9 ± 21.8 years. Moderate to severe traumatic TBI (TBI 2-3) represented the

AR
TIG
O O
RIG
INA
L
Revista Científica da Ordem dos Médicos www.actamedicaportuguesa.com 351
Dias C, et al. Traumatic brain injury in Portugal 2000-2010, Acta Med Port 2014 May-Jun;27(3):349-356
majority of patients, with 1/5 of patients with insufficient data as to grade severity. In-hospital admission of more than one day represented 78.8% of all patients. Total mortality rate was of 6375 (8.7%) and more than half of patients were discharged home. Almost 25% of patients were admitted to ICUs and 12.3% had a neurosurgical procedure performed (Table 1).
Demographic dataThroughout the decade, there has been a sustained
decrease in the number of total TBI admissions (Fig. 1). Mean age has continuously risen, from 52.2 years in 2000 to 65.1 years in 2010 (Table 2), maintaining a male preponderance above 60% (data not shown).
TBI severity and external causes During the study period, there has been a clear tendency for severity increase as shown by the progressive reduction of registered mild TBI (TBI 1) and a marked growth of moderate to severe TBI (TBI 2-3) rates. Cases
Table 1 - General characterization of patients and hospital admissions
TBI hospital admissions (> 18 years)Total 72865 Male 46709 (64.1%)
Age – mean ± SD and range (years) 57.9 ± 21.8 18-107 yr
TBI severity Mild TBI (TBI 1) 12112 (16.6%)
Moderate to severe TBI (TBI 2-3) 45991 (63.1%)
Unknown 14762 (20.3%)
Hospital length of stay (total) - mean ± SD and range (days) 9.3 ± 19.1 (0-1048)
Hospital length of stay (TBI 2-3) - mean±SD and range (days) 12.4 ± 22.4 (0-1048)
ICU admissions (total) 17964 (24.7%)Neurosurgical procedures (total) 8988 (12.3%)
Mortality 6375 (8.7%)
Home discharge 42431 (58.2%)
Other institutions 23136 (31.8%)
Other/unknown 923 (1.3%)
Figure 1 - Variation of TBI hospital admissions by age group from 2000 to 2010.
TBI (n)3500
3000
3000
2500
2000
2000
329718-40 yr2178
18-40 years 41-60 years 61-80 years > 80 years
41-60 yr
258061-80 yr
1012> 80 yr
9067Total
2001
29581943
2760
1054
8715
2002
25721802
2491
1069
7934
2003
19651462
2245
1005
6677
2004
16931360
1960
957
5970
2005
15831412
2228
1068
6291
2006
15381395
2118
1057
6108
2007
11351232
1977
1095
5439
2008
10411145
2002
1249
5437
2009
8861097
2150
1397
5530
2010
8851140
2179
1493
5697
1500
1000
500
time (years)
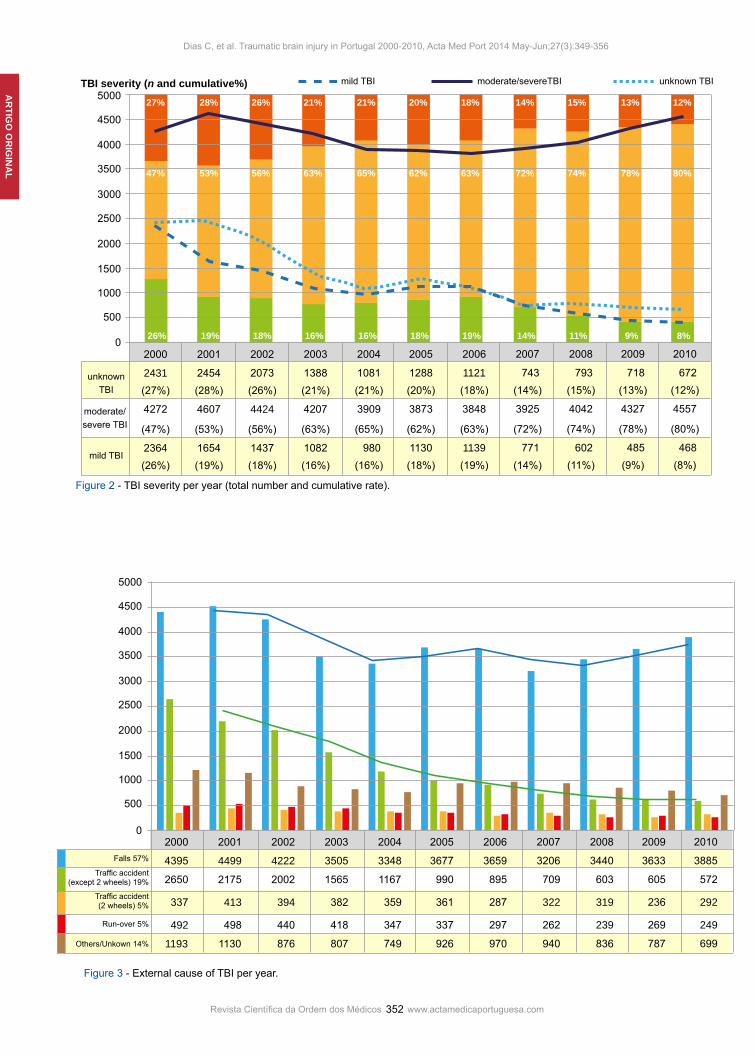
AR
TIGO
OR
IGIN
AL
352Revista Científica da Ordem dos Médicos www.actamedicaportuguesa.com
Dias C, et al. Traumatic brain injury in Portugal 2000-2010, Acta Med Port 2014 May-Jun;27(3):349-356
Figure 2 - TBI severity per year (total number and cumulative rate).
TBI severity (n and cumulative%)5000
4500
3000
3500
4000
2500
2000
2000
2431unknownTBI (27%)
27% 28% 26% 21%
mild TBI unknown TBImoderate/severeTBI
21% 20% 18% 14% 15% 13% 12%
4272moderate/severe TBI (47%)
47% 53% 56% 63% 65% 62% 63% 72% 74% 78% 80%
2364(26%)
26% 19% 18% 16% 16% 18% 19% 14% 11% 9% 8%
mild TBI
2001
2454(28%)
4607
(53%)
1654(19%)
2002
2073(26%)
4424
(56%)
1437(18%)
2003
1388(21%)
4207
(63%)
1082(16%)
2004
1081(21%)
3909
(65%)
980(16%)
2005
1288(20%)
3873
(62%)
1130(18%)
2006
1121(18%)
3848
(63%)
1139(19%)
2007
743(14%)
3925
(72%)
771(14%)
2008
793(15%)
4042
(74%)
602(11%)
2009
718(13%)
4327
(78%)
485(9%)
2010
672(12%)
4557
(80%)
468(8%)
1500
1000
500
0
Figure 3 - External cause of TBI per year.
5000
4500
3000
3500
4000
2500
2000
2000
4395Falls 57%
Traffic accident (except 2 wheels) 19%
Traffic accident(2 wheels) 5%
Run-over 5%
Others/Unkown 14%
2650
337
492
1193
2001
4499
2175
413
498
1130
2002
4222
2002
394
440
876
2003
3505
1565
382
418
807
2004
3348
1167
359
347
749
2005
3677
990
361
337
926
2006
3659
895
287
297
970
2007
3206
709
322
262
940
2008
3440
603
319
239
836
2009
3633
605
236
269
787
2010
3885
572
292
249
699
1500
1000
500
0

AR
TIG
O O
RIG
INA
L
Revista Científica da Ordem dos Médicos www.actamedicaportuguesa.com 353
Dias C, et al. Traumatic brain injury in Portugal 2000-2010, Acta Med Port 2014 May-Jun;27(3):349-356
impossible to be classified through registry (unknown TBI) have diminished considerably (Fig. 2). Considering external causes of TBI, falls were the most frequent cause of TBI throughout the years and the only etiology to register a considerable increase in frequency in recent years. Two-wheeled traffic accident maintained around a 5% frequency but a considerable and continuous decrease was noticed in all other causes, especially in traffic accidents. Unclassified causes of TBI also decreased throughout the study period (Fig. 3).
Management and mortality As previously mentioned, total in-hospital admissions have decreased (Fig. 1), but duration of hospitalization, ratio of ICU treated patients and patients submitted to neurosurgical procedures has almost doubled (Table 2). Total mortality rate in ICU treated patients was 21.9% and in patients submitted to neurosurgical procedure was 16.7% (data not shown in table). Mortality according to TBI severity was 1.1% (130 patients) for TBI 1, 12.9% (5 951 patients) for TBI 2-3 and 2.0% (294 patients) in the unknown severity class (data not shown). A slight increase in total mortality rates was noticed throughout the years (Table 2).
Analysis by age group On age sub-analysis TBI was more frequent in the 61-80 group, followed by 18-40, 41-60 and older than 80 years. Male preponderance is only inverted in patients older than 80 years. Hospitalization duration is also higher in the 61-80 group and TBI severity seems to increase in the eldest groups, as happens with mortality. Traffic accidents decreased in older age groups and falls have a considerably higher expression, being the main cause of TBI in patients > 80 years. Rate of ICU admissions decreased with age, but were never under 20%. Inversely, neurosurgical procedures
are increasingly performed in older age groups. The rate of home discharge also increased with age (Table 3). The age distribution along the decade is shown in Fig. 1, with an important decrease in TBI numbers in younger age groups and an increase in the elder.
DISCUSSIONTBI in-hospital admissions - Demographics The results of our study clearly show that TBI in Portugal is evolving and there are some identified trends that may be important for Health Services planning and organization. We report a clear decrease in total number of TBI in hospital admissions, confirming trends already demonstrated in other European countries.5,8 Male preponderance is maintained throughout the decade as expected when comparing other population based studies.2,5,11 An exception to this was found in the age group > 80 years-old. Here we find a female preponderance, perhaps due to higher life expectancy of women and, therefore, a larger contribution in the composition of older age groups.12
Mean age of our population (57.9 years) was higher than reported in other European studies, although most of them only included severe TBI patients.5,7,9 This fact may be explained because mean age was calculated taking into account all hospital admissions without excluding readmissions or hospital transfers, since ethical criteria did not allow us to identify duplications in the data base. We point out that ageing of Portuguese population during the last decade, with an important demographic pyramid inversion13 may have also contributed to this finding. Finally, by including all grades of TBI and excluding pediatric population, mean age was biased to higher values. Although an incidence analysis was not possible in our study, reports of a trend inversion, with increased incidence in older age groups and decrease in younger ones has also
Table 2 - TBI demographics and management (Hospital length of stay, ICU admission and neurosurgical procedures) and mortality per year
Year Gender (Male) Mean Age ± SD (yr)
Hospital lenght of stay (days ± SD)
ICU admission
Neurosurgicalprocedure
Total Mortality and rate
2000 596 (65.7%) 52.2 ± 21.8 6.6.±.12.1 1432 (15.8%) 742 (8.2%) 641 (7.1%)
2001 5752 (66.0%) 53.7 ± 22.0 7.9 ± 16.9 1846 (21.2%) 779 (8.9%) 602 (6.9%)
2002 5174 (65.2%) 54.6 ± 22.0 7.8 ± 17.3 1880 (23.7%) 647 (8.2%) 632 (8%)
2003 4365 (65.4%) 56.4 ± 22.0 9.3 ± 17.0 1790 (26.8%) 746 (11.2%) 617 (9.2%)
2004 3937 (65.9%) 56.9 ± 21.8 9.8 ± 23.6 1543 (25.8%) 846 (14.2%) 572 (9.6%)
2005 3993 (63.5%) 58.5 ± 21.5 9.3 ± 19.6 1579 (25.1%) 851 (13.5%) 523 (8.3%)
2006 3763 (61.6%) 58.6 ± 21.4 9.3 ± 18.5 1449 (23.7%) 805 (13.2%) 519 (8.5%)
2007 3436 (63.2%) 61.0 ± 20.9 11.3 ± 22.6 1581 (29.1%) 921 (16.9%) 530 (9.7%)
2008 3399 (62.5%) 62.6 ± 20.9 11.2 ± 21.4 1572 (28.9%) 910 (16.7%) 551 (10.1%)
2009 3442 (62.2%) 64.6 ± 20.3 11.6 ± 20.6 1613 (29.2%) 874 (15.8%) 583 (10.5%)
2010 3487 (61.2%) 65.1 ± 20.0 11.1 ± 22.4 1679 (29.5%) 867 (15.2%) 605 (10.6%)
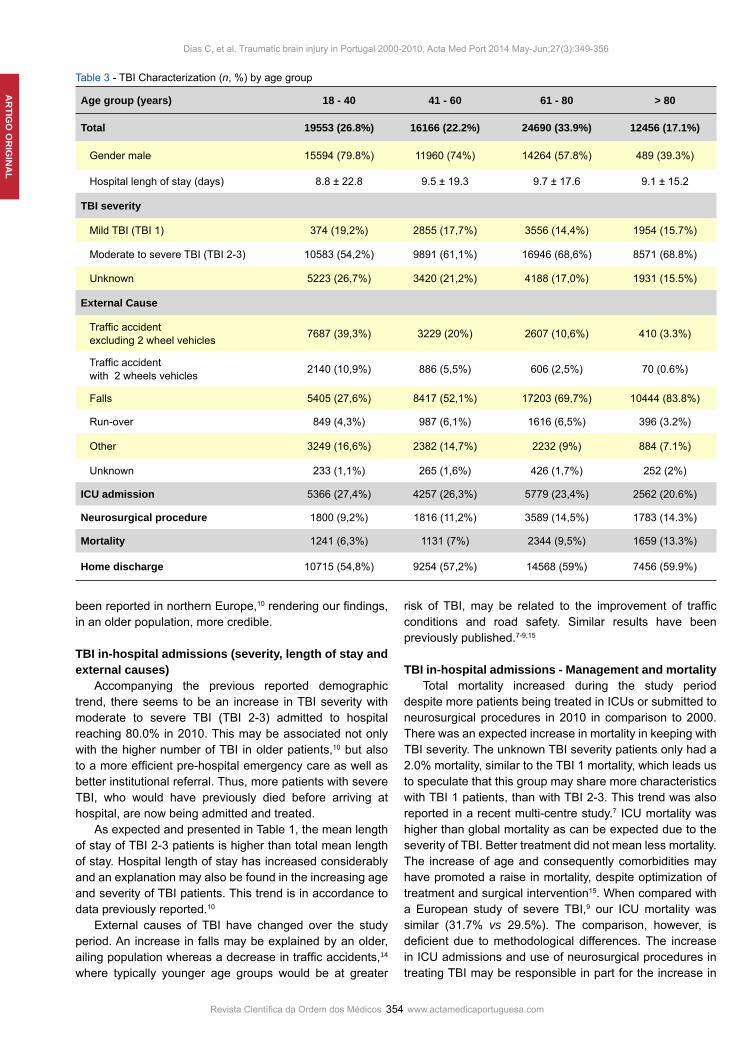
AR
TIGO
OR
IGIN
AL
354Revista Científica da Ordem dos Médicos www.actamedicaportuguesa.com
been reported in northern Europe,10 rendering our findings, in an older population, more credible.
TBI in-hospital admissions (severity, length of stay and external causes) Accompanying the previous reported demographic trend, there seems to be an increase in TBI severity with moderate to severe TBI (TBI 2-3) admitted to hospital reaching 80.0% in 2010. This may be associated not only with the higher number of TBI in older patients,10 but also to a more efficient pre-hospital emergency care as well as better institutional referral. Thus, more patients with severe TBI, who would have previously died before arriving at hospital, are now being admitted and treated. As expected and presented in Table 1, the mean length of stay of TBI 2-3 patients is higher than total mean length of stay. Hospital length of stay has increased considerably and an explanation may also be found in the increasing age and severity of TBI patients. This trend is in accordance to data previously reported.10
External causes of TBI have changed over the study period. An increase in falls may be explained by an older, ailing population whereas a decrease in traffic accidents,14 where typically younger age groups would be at greater
risk of TBI, may be related to the improvement of traffic conditions and road safety. Similar results have been previously published.7-9,15
TBI in-hospital admissions - Management and mortality Total mortality increased during the study period despite more patients being treated in ICUs or submitted to neurosurgical procedures in 2010 in comparison to 2000. There was an expected increase in mortality in keeping with TBI severity. The unknown TBI severity patients only had a 2.0% mortality, similar to the TBI 1 mortality, which leads us to speculate that this group may share more characteristics with TBI 1 patients, than with TBI 2-3. This trend was also reported in a recent multi-centre study.7 ICU mortality was higher than global mortality as can be expected due to the severity of TBI. Better treatment did not mean less mortality. The increase of age and consequently comorbidities may have promoted a raise in mortality, despite optimization of treatment and surgical intervention15. When compared with a European study of severe TBI,9 our ICU mortality was similar (31.7% vs 29.5%). The comparison, however, is deficient due to methodological differences. The increase in ICU admissions and use of neurosurgical procedures in treating TBI may be responsible in part for the increase in
Dias C, et al. Traumatic brain injury in Portugal 2000-2010, Acta Med Port 2014 May-Jun;27(3):349-356
Table 3 - TBI Characterization (n, %) by age group
Age group (years) 18 - 40 41 - 60 61 - 80 > 80
Total 19553 (26.8%) 16166 (22.2%) 24690 (33.9%) 12456 (17.1%)
Gender male 15594 (79.8%) 11960 (74%) 14264 (57.8%) 489 (39.3%)
Hospital lengh of stay (days) 8.8 ± 22.8 9.5 ± 19.3 9.7 ± 17.6 9.1 ± 15.2
TBI severity
Mild TBI (TBI 1) 374 (19,2%) 2855 (17,7%) 3556 (14,4%) 1954 (15.7%)
Moderate to severe TBI (TBI 2-3) 10583 (54,2%) 9891 (61,1%) 16946 (68,6%) 8571 (68.8%)
Unknown 5223 (26,7%) 3420 (21,2%) 4188 (17,0%) 1931 (15.5%)
External Cause
Traffic accident excluding 2 wheel vehicles 7687 (39,3%) 3229 (20%) 2607 (10,6%) 410 (3.3%)
Traffic accident with 2 wheels vehicles 2140 (10,9%) 886 (5,5%) 606 (2,5%) 70 (0.6%)
Falls 5405 (27,6%) 8417 (52,1%) 17203 (69,7%) 10444 (83.8%)
Run-over 849 (4,3%) 987 (6,1%) 1616 (6,5%) 396 (3.2%)
Other 3249 (16,6%) 2382 (14,7%) 2232 (9%) 884 (7.1%)
Unknown 233 (1,1%) 265 (1,6%) 426 (1,7%) 252 (2%)
ICU admission 5366 (27,4%) 4257 (26,3%) 5779 (23,4%) 2562 (20.6%)
Neurosurgical procedure 1800 (9,2%) 1816 (11,2%) 3589 (14,5%) 1783 (14.3%)
Mortality 1241 (6,3%) 1131 (7%) 2344 (9,5%) 1659 (13.3%)
Home discharge 10715 (54,8%) 9254 (57,2%) 14568 (59%) 7456 (59.9%)

AR
TIG
O O
RIG
INA
L
Revista Científica da Ordem dos Médicos www.actamedicaportuguesa.com 355
Dias C, et al. Traumatic brain injury in Portugal 2000-2010, Acta Med Port 2014 May-Jun;27(3):349-356
length of hospital stay noted during the period evaluated. Although mortality increased throughout this period, current treatment options, including implementation of clinical practice guidelines, have proven to benefit survival and outcome.6 So, presumably, severe TBI patients that survive do so in better conditions and longer. Also contributing to this may be the technological developments in health services encountered in the first decade of this century and the rise in their consumption. As severity of TBI patients admitted to hospital increases, so does the availability of these resources, permitting treatment of patients in a more differentiated environment. In our analysis there was a slight reduction in ICU admissions with older age. The majority of ICUs are not dedicated solely to neurologic patients; thus, the investment in older TBI patients may be secondary when comparing younger patients with other ICU manageable conditions. Rates of neurosurgical procedures, however, increased with age. A possible explanation may be found not only in the higher availability of resources but also by the increasing severity of TBI demanding surgical intervention. Finally, although severity and mortality is higher in older patients, the proportion of home discharge increases with age. This could be partly justified by a probability of a worse functional recovery after the injury.
Final remarks To date, this is one of the few studies that provides an analysis of the evolution of TBI in Portugal, and indeed it identified trends in the population composition and TBI etiology, as well as revealing an increase in the number of patients treated with more intensive and invasive modalities. The authors stress the large cohort, including data from 111 hospitals in a period of 11 years. The importance of this database revision is concerned about reporting epidemiologic evidence that is lacking, especially in southern European countries. In spite of this, some limitations to the analysis must be addressed. First, this is an observational study with retrospective analysis of the DRG database that collects coded information of clinical records. The diagnostic and procedural information was based on ICD-9 codes, which can have several levels of detail, depending on the quality of information provided to the encoder and the number of encoders involved; during the 11 years thousands of encoders were involved in the process. Nevertheless, across the years, we noticed a reduction in the number of ‘unknown severity’ when classifying TBI that may be associated with an improvement in the quality of registry. It has been reported that codification errors tend to under identify moderate to severe cases of TBI.16 In our study, with ICD-9, it seems that the opposite happened. We may argue that some multiple trauma patients may have mild TBI or concussion that was neglected by the encoder faced with other more severe diagnosis. Also, patients that recur to ED due to accidents or other events may also have
minor head injuries that are under-reported. Since we didn’t have access to validated severity score scales, our severity grading system was oriented by the clinical characteristics encoded, including intracranial injury, presence of bone fracture and duration of loss of consciousness and was based on other international grading scales. Bearing all these considerations in mind, the data collected must be analysed cautiously. Our interpretation was based on the trends over the years and not on absolute frequencies. Most studies address only severe TBI or are single-hospital based thus limiting the understanding of the epidemiology of this ‘silent epidemic’.3 In an effort to provide a more complete and real picture of TBI in Portugal, our study attempted to include all adult patients admitted to all hospitals of the Portuguese National Health Services during the first decade of the 21st century.
CONCLUSION In conclusion, our work was based on a large cohort with a broad study period, and provided information that until now was missing. During the decade 2000-2010, TBI hospital admissions have decreased in frequency but mean age increased. Trends in etiology of TBI are shifting from traffic accidents to falls, manifesting the need to pay special attention to older age groups and implementing preventive measures to reduce TBI. Primary prevention of road accidents seems to be working, but we need to improve global accessibility for old people. Utilization of ICU resources and neurosurgical procedures is more widespread but mortality rates have also grown. During the study period, mortality rates have increased, possibly due to the increase of TBI severity, but also Portuguese pre-hospital care improved resulting in previously lethal cases arriving alive at Hospital and, although treated more frequently in ICUs and requiring more neurosurgical procedures, still they end up having higher mortality. In the future, a better quality of registry and codification may lead to collection of data that will permit not only evaluation of trends but also to determine precise frequency, incidence and severity needed to better adjust resources to our population.
ACKNOWLEDGMENT The authors wish to thank the collaboration of the Health Systems Central Administration and Northern Regional Health Administration for providing us with the data in which this study was based.
CONFLICTS OF INTERESTNone stated.
FUNDING SOURCESNo funding was provided to conduct this study.

AR
TIGO
OR
IGIN
AL
356Revista Científica da Ordem dos Médicos www.actamedicaportuguesa.com
Dias C, et al. Traumatic brain injury in Portugal 2000-2010, Acta Med Port 2014 May-Jun;27(3):349-356
REFERENCES1. Ragnarsson KT. Traumatic brain injury research since the 1998 NIH
Consensus Conference: accomplishments and unmet goals. J Head Trauma Rehabil. 2006;21:379–87.
2. Corso P, Finkelstein E, Miller T, Fiebelkorn I, Zaloshnja E. Incidence and lifetime costs of injuries in the United States. Inj Prev. 2006;12:212–8.
3. Goldstein M. Traumatic brain injury: a silent epidemic. Ann Neurol. 1990;27:327.
4. Tagliaferri F, Compagnone C, Korsic M, Servadei F, Kraus J. A systematic review of brain injury epidemiology in Europe. Acta Neurochir. 2006;148:255-68.
5. Andelic N, Anke A, Skandsen T, Sigurdardottir S, Sandhaug M, Ader T, et al. Incidence of hospital-admitted severe traumatic brain injury and in-hospital fatality in Norway: A National Cohort Study. Neuroepidemiology. 2012;38:259–67.
6. Haddad SH, Arabi YM. Critical care management of severe traumatic brain injury in adults. Scand J Trauma Resusc Emerg Med. 2012;20:12.
7. Andriessen TM, Horn J, Franschman G, van der Naalt J, Haitsma I, Jacobs B, et al. Epidemiology, severity classification, and outcome of moderate and severe traumatic brain injury: a prospective multicentre study. J Neurotrauma. 2011;28:2019–31.
8. Masson F, Thicoipe M, Aye P, Mokni T, Senjean P, Schmitt V, et al. Epidemiology of severe brain injuries: a prospective population-based study. J Trauma. 2001;51:481-9.
9. Rosso A, Brazinova A, Janciak I, Wilbacher I, Rusnak M, Mauritz W. Severe traumatic brain injury in Austria II: epidemiology of hospital
admissions. Wien Klin Wochenschr. 2007;119:29-34.10. Koskinen S, Alaranta H. Traumatic brain injury in Finland 1991–2005:
a nationwide register study of hospitalized and fatal TBI. Brain Inj. 2008;22:205–14.
11. Leibson CL, Brown AW, Ransom JE, Diehl NN, Perkins PK, Mandrekar J, et al. Incidence of traumatic brain injury across the full disease spectrum: a population-based medical record review study. Epidemiology. 2011;22:836–44.
12. PORDATA.pt. Base de Dados Portugal Contemporâneo; [Accessed 2013 Feb 25]. Available at: http://pordata.pt/Europa/Esperanca+de+vida+a+nascenca+total+e+por+sexo-1260.
13. PORDATA.pt. Base de Dados Portugal Contemporâneo; [Accessed 2013 Feb 25]. Available at: http://pordata.pt/Europa/Populacao+residente+idade+media-2265.
14. PORDATA.pt. Base de Dados Portugal Contemporâneo; [Accessed 2013 Feb 25]. Available at: http://pordata.pt/Portugal/Acidentes+de+viacao+com+vitimas++feridos+e+mortoss+++Continente-326.
15. Flaada JT, Leibson CL, Mandrekar JN, Diehl N, Perkins PK, Brown AW, et al. Relative risk of mortality after traumatic brain injury: a population-based study of the role of age and injury severity. J Neurotrauma. 2007;24:435-45.
16. Shore AD, McCarthy ML, Serpi T, Gertner M. Validity of administrative data for characterizing traumatic brain injury-related hospitalizations. Brain Inj. 2005;19:613-21.

79 PUBLICATION II
MULTIMODAL BRAIN MONITORING IN NEUROCRITICAL CARE PRACTICE
Dias, C
IJCNMH 2014; 1(Suppl. 1):S08

Multimodal brain monitoring in neurocritical care practice
REVIEW
Celeste Dias1
1Neurocritical Care Unit, Intensive Care Department, Hospital São João, Faculty of Medicine, University of Porto, Porto, Portugal
Correspondence: Celeste Dias
Neurocritical Care Unit, Hospital São João
Alameda Professor Hernani Monteiro
4200-319 Porto, Portugal
Email adress: [email protected]
Abstract
The management of severe acute neurological patients is a constant medical challenge due to its complexity and dynamic evolution. Multimodal brain monitoring is an important tool for clinical decision at bedside. The datasets collected by the several brain monitors help to understand the physiological events of acute lesion and to define patient-specific therapeutic targets. We changed from pure neurological clinical evaluation to an era of structure and image definition associated with instrumental monitoring of pressure, flow, oxygenation, and metabolism. At each time, we want to assure perfect coupling between energy deliver and consumption, in order to ensure adequate cerebral blood flow and metabolism, avoid secondary lesion, and preserve normal tissue.
Continuous monitoring of intracranial pressure, cerebral perfusion pressure, and cerebrovascular reactivity with tran-scranial Doppler, allows us to predict cerebral blood flow. However, adequate blood flow means not only quantity but also quality. To study and avoid tissue hypoxia we start to use methods for evaluation of oxygen extraction, such as ox-ygen jugular saturation, cerebral transcutaneous oximetry or measurement of oxygen pressure with intraparenchymal probes. To better understand metabolic cascade we use cerebral microdialysis to monitor tissue metabolites such as glucose, lactate/pyruvate, glycerol or cytokines involved in the acute lesion. Multimodal brain monitoring in neurocriti-cal care practice helps neurointensivists to better understand the pathophysiology of acute brain lesion and accomplish the challenge of healing the brain and rescue lives.
Keywords: Multimodal brain monitoring, Intracranial pressure, Cerebral oximetry, Cerebral oxygenation, Cerebral blood flow, Cerebral microdialysis, Cerebrovascular reactivity indexes, Neurocritical care.
Citation: Dias, C. Multimodal brain monitoring in neurocritical care practice. IJCNMH 2014; 1(Suppl. 1):S08
Received: 01 Sep 2013; Accepted: 29 Oct 2013; Published: 09 May 2014
© 2014 Dias. This is an open access article distributed under the Creative Commons Attribution License, which permits unrestricted use, distribution, and reproduction in any medium, provided the original work is properly cited.
Open Access Publication Available at http://ijcnmh.arc-publishing.org
INTERNATIONAL JOURNAL OF
AND
CLINICAL NEUROSCIENCESMENTAL HEALTH
Special Issue on Neurosonology and Cerebral Hemodynamics

Multimodal brain monitoring in neurocritical care2
ARC Publishing
Introduction
The main purpose of neurocritical care is to fight brain cell death, giving adequate flow, oxygen, and glucose in order to promote neuronal, endothelial, and glial cell recovery to ensure neuronal function. Although clinical evaluation of comatose patients is still one of the foundations of clinical neuroscience, the neurological findings of adverse events appear too late in time. Multimodal brain monitoring may give crucial, real-time information about the dynamic evo-lution of brain lesion, allowing to avoid secondary inju-ry, recognize adverse events, and improve individualized management of severe acute neurological patients admit-ted to Neurocritical Care Units (NCCU) [1].
Basic neuromonitoring
Intracranial pressure, cerebral perfusion pressure, and autoregulationIntracranial pressure (ICP) is derived from cerebral blood flow (CBF) and cerebrospinal fluid (CSF) circulation within the stiff skull [2]. The most reliable methods of ICP monitoring are ventricular catheters and intraparen-chymal probes. An intraventricular drain connected to an external pressure transducer is still considered to be a ‘‘golden standard’’ method of measure global ICP. Ventric-ular catheters allow recalibration and therapeutic drain-age of CSF but have significant complications, including hemorrhage, occlusion and infection. Intraparenchymal fiberoptic or microtransducer probes have a minimal as-sociated risk of complications, but can be calibrated only before insertion although the sensitivity drift over time is very small. Critical values of ICP may vary between indi-vidual patients but current consensus is to treat ICP ex-ceeding the 20 mmHg threshold [3].
International guidelines for traumatic brain injury (TBI) recommend that ICP should be monitored in pa-tients with Glasgow Coma Scale (GCS) score <8, with an abnormal head CT scan; or patients with GCS score <8 with a normal head CT scan if two or more of the follow-ing characteristics are present: age over 40 years, systolic blood pressure <90 mmHg or motor posturing [4, 5]. Re-cently, Chesnut et al. [6] published the results of the first randomized trial of ICP monitoring in patients with severe TBI. Six months after injury, patient groups had similar scores on functional status and cumulative mortality. For intensivists the strongest clinical implication of this trial is that we need to understand that the true value of ICP is more than a number and should become part of a multi-modality approach to targeted therapy [7, 8].
ICP beat-to-beat waveform consists of three compo-nents named P1, P2, and P3 that are related to arterial pulse and brain compliance (Figure 1). P2 over P1 is a sensitive (99%) but not specific (1-17%) predictor of ICP subsequent increase [9]. Continuous ICP and arterial blood pressure monitoring allow calculation of cerebral perfusion pres-
sure (CPP=ABP-ICP). CPP is the driving force of CBF and the principal determinant of cerebrovascular reactivity to pressure, named cerebral autoregulation. The normal cere-bral arterial bed actively reacts to small fluctuations in arte-rial blood pressure in order to maintain constant CBF over a wide range of CPPs (from approximately 50–150 mmHg). When reactivity is normal the changes in ABP produce an inverse change in cerebral blood volume and hence ICP, but when reactivity is disturbed, changes in ABP are passively transmitted to ICP. Computational methods for continuous assessment of cerebral autoregulation were introduced more than a decade ago and they evaluate dy-namic relationships between slow waves of ABP or CPP and ICP or flow velocity [10]. Examples of these methods are moving correlation coefficient, phase shift, or trans-mission (either in time- or frequency-domain).
The pressure reactivity index (PRx) is calculated as the moving correlation coefficient between 30 consecutive, 10 seconds averaged data points of ICP and ABP [11, 12]. A positive PRx (>0.2) signifies passive reactive vascular bed, while a PRx <0.2 means normal autoregulation. PRx may be used to continuous monitoring of autoregulation and define individual lower limit of autoregulation (LLA) and upper limit of autoregulation (ULA), helping target opti-mal CPP [13, 14] (Figure 2). Retrospective studies show that favorable outcome reaches its peak when CPP is main-tained close to optimal CPP [15].
Oxygenation and cerebral blood flowBrain resuscitation based on basic control of ICP and CPP does not prevent cerebral hypoxia in some patients [16]. Cerebral oxygenation monitoring evaluates the balance between oxygen delivery and consumption [17] and oxy-gen guided management could lead to improved neurolog-ic outcome [18]. There are several invasive and non-inva-sive continuous methods of monitoring regional or global brain oxygenation and avoid secondary lesion due to hy-poxia (jugular venous bulb oximetry, brain tissue oxygen-ation, and transcutaneous cerebral oximetry with near in-frared spectroscopy).
Brain tissue oxygen pressureBrain tissue oxygenation pressure (PbtO2) represents the interaction between plasma oxygen tension and CBF [19]. Direct measurement of local PbtO2 with an intraparenchy-mal probe is becoming the gold standard for oxygen mon-itoring in NCCU. PbtO2 probes are placed in the white matter and post-insertion head CT confirmation is needed to interpret readings. The normal range is 25-50 mmHg and PbtO2 <15 mmHg is considered the critical threshold for hypoxia [20, 21]. Algorithms of PbtO2-directed thera-py should incorporate the management of the several caus-es of tissue hypoxia (hypoxic, anemic, ischemic, cytopathic, and hypermetabolic) [22] (Table 1). Similarly to PRx, the index of tissue oxygen reactivity (ORx), calculated as the correlation coefficient between PbtO2 and CPP, can be
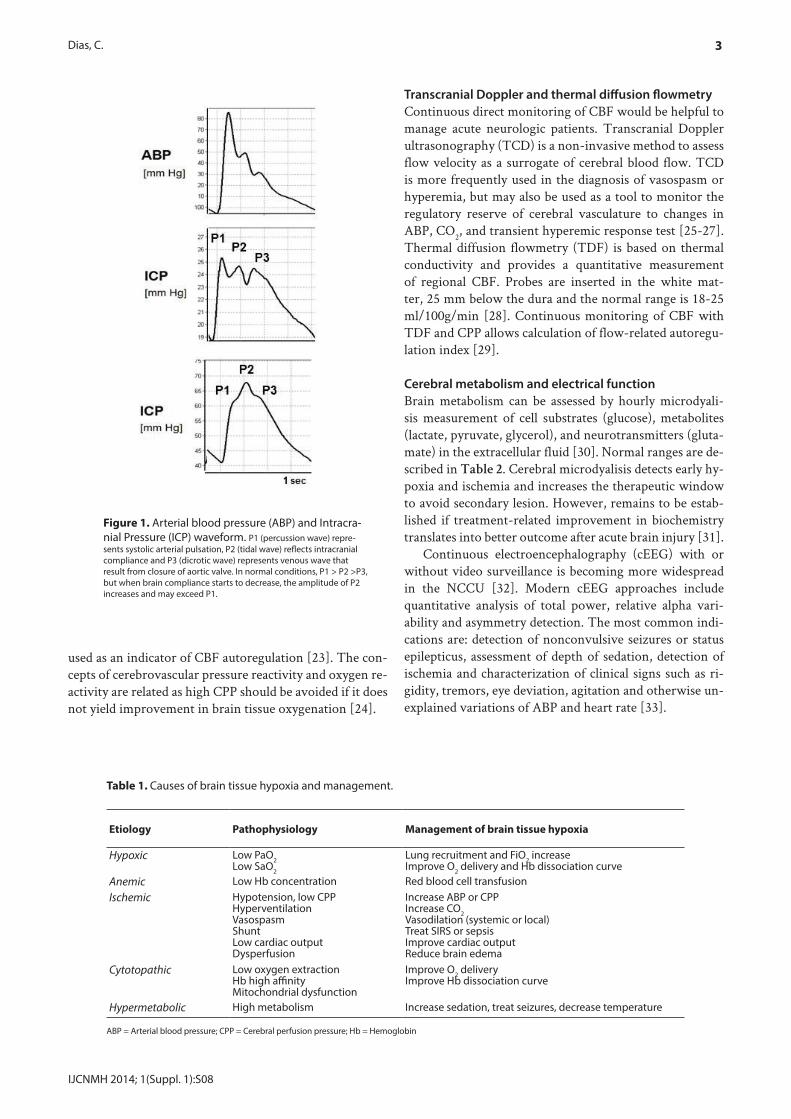
3Dias, C.
IJCNMH 2014; 1(Suppl. 1):S08
Figure 1. Arterial blood pressure (ABP) and Intracra-nial Pressure (ICP) waveform. P1 (percussion wave) repre-sents systolic arterial pulsation, P2 (tidal wave) reflects intracranial compliance and P3 (dicrotic wave) represents venous wave that result from closure of aortic valve. In normal conditions, P1 > P2 >P3, but when brain compliance starts to decrease, the amplitude of P2 increases and may exceed P1.
used as an indicator of CBF autoregulation [23]. The con-cepts of cerebrovascular pressure reactivity and oxygen re-activity are related as high CPP should be avoided if it does not yield improvement in brain tissue oxygenation [24].
Transcranial Doppler and thermal diffusion flowmetryContinuous direct monitoring of CBF would be helpful to manage acute neurologic patients. Transcranial Doppler ultrasonography (TCD) is a non-invasive method to assess flow velocity as a surrogate of cerebral blood flow. TCD is more frequently used in the diagnosis of vasospasm or hyperemia, but may also be used as a tool to monitor the regulatory reserve of cerebral vasculature to changes in ABP, CO2, and transient hyperemic response test [25-27].Thermal diffusion flowmetry (TDF) is based on thermal conductivity and provides a quantitative measurement of regional CBF. Probes are inserted in the white mat-ter, 25 mm below the dura and the normal range is 18-25 ml/100g/min [28]. Continuous monitoring of CBF with TDF and CPP allows calculation of flow-related autoregu-lation index [29].
Cerebral metabolism and electrical functionBrain metabolism can be assessed by hourly microdyali-sis measurement of cell substrates (glucose), metabolites (lactate, pyruvate, glycerol), and neurotransmitters (gluta-mate) in the extracellular fluid [30]. Normal ranges are de-scribed in Table 2. Cerebral microdyalisis detects early hy-poxia and ischemia and increases the therapeutic window to avoid secondary lesion. However, remains to be estab-lished if treatment-related improvement in biochemistry translates into better outcome after acute brain injury [31].
Continuous electroencephalography (cEEG) with or without video surveillance is becoming more widespread in the NCCU [32]. Modern cEEG approaches include quantitative analysis of total power, relative alpha vari-ability and asymmetry detection. The most common indi-cations are: detection of nonconvulsive seizures or status epilepticus, assessment of depth of sedation, detection of ischemia and characterization of clinical signs such as ri-gidity, tremors, eye deviation, agitation and otherwise un-explained variations of ABP and heart rate [33].
Table 1. Causes of brain tissue hypoxia and management.
Etiology Pathophysiology Management of brain tissue hypoxia
Hypoxic Low PaO2Low SaO2
Lung recruitment and FiO2 increaseImprove O2 delivery and Hb dissociation curve
Anemic Low Hb concentration Red blood cell transfusionIschemic Hypotension, low CPP
HyperventilationVasospasmShuntLow cardiac outputDysperfusion
Increase ABP or CPPIncrease CO2Vasodilation (systemic or local)Treat SIRS or sepsisImprove cardiac outputReduce brain edema
Cytotopathic Low oxygen extractionHb high affinityMitochondrial dysfunction
Improve O2 deliveryImprove Hb dissociation curve
Hypermetabolic High metabolism Increase sedation, treat seizures, decrease temperature
ABP = Arterial blood pressure; CPP = Cerebral perfusion pressure; Hb = Hemoglobin

Multimodal brain monitoring in neurocritical care4
ARC Publishing
Conclusion
Multimodal brain monitoring increases the therapeutic window and helps to target treatment avoiding excess or lack of interventions, decreasing cerebral secondary le-sions, and systemic complications. Clinical information systems and integrated brain monitoring graphical trends show that pathologic readings precedes clinical deteriora-tion and therefore are an important tool to support pro-active medical decision in daily neurocritical care practice.
Abbreviations
ABP: Arterial blood pressure; CBF: Cerebral blood flow; cEEG: Contin-uous electroencephalography; CSF: Cerebrospinal fluid; CPP: Cerebral perfusion pressure; GCS: Glasgow coma scale; ICP: Intracranial pres-sure; LLA: Lower limit of autoregulation; NCCU: Neurocritical care units; ORx: Oxygen reactivity index; PbtO2: Brain tissue oxygenation pressure; PRx: Pressure reactivity index; TBI: Traumatic brain injury; TCD: Transcranial Doppler ultrasonography; TDF: Thermal diffusion flowmetry; ULA: Upper limit of autoregulation
Figure 2. Intracranial pressure (ICP), cerebral perfusion pressure (CPP), and pressure reactivity index (PRx). Continuous monitoring of auto-regulation and definition of individual lower limit of autoregulation (LLA) and upper limit of autoregulation (ULA) to target optimal CPP during ICU management.
Table 2. Cerebral microdialysis normal range of biomarkers and metabolism failure interpretation.
Microdialysis concentration Normal range Monitoring interpretation
Glucose 1.5-2.0 mmol/l Hypoglycemia, cerebral hyperglycolysisHypoxia, ischemia,
Lactate / Pyruvate ratio >20-25 Cellular redox state, hypoglicemiaHypoxia, ischemia
Glycerol >100 μmol/l Cell membrane degradationHypoxia, ischemia
Glutamate >15-20 μmol/l ExcitotoxicityHypoxia, ischemia
Competing interests
The authors declare no conflict of interest.
References
1. Zygun D. Can we demonstrate the efficacy of monitoring? Eur J Anaesthesiol Suppl 2008; 42:94-7.
2. Czosnyka M, Pickard JD. Monitoring and interpretation of intracra-nial pressure. Journal of Neurology, Neurosurgery, and Psychiatry 2004; 75(6):813-21.
3. Bratton SL, Chestnut RM, Ghajar J, McConnell Hammond FF, Harris OA, Hartl R, et al. Guidelines for the management of severe traumatic brain injury. VIII. Intracranial pressure thresholds. J Neurotrauma 2007; 24 Suppl 1:S55-8.
4. Narayan RK, Kishore PR, Becker DP, Ward JD, Enas GG, Green-berg RP, et al. Intracranial pressure: to monitor or not to monitor? A review of our experience with severe head injury. J Neurosurg 1982; 56(5):650-9.
5. Brain Trauma F, American Association of Neurological S, Congress of Neurological S, Joint Section on N, Critical Care AC, Bratton SL, et al. Guidelines for the management of severe traumatic brain

5Dias, C.
IJCNMH 2014; 1(Suppl. 1):S08
20. Brain Trauma F, American Association of Neurological S, Congress of Neurological S, Joint Section on N, Critical Care AC, Bratton SL, et al. Guidelines for the management of severe traumatic brain injury. X. Brain oxygen monitoring and thresholds. J Neurotrauma 2007; 24 Suppl 1:S65-70.
21. Maloney-Wilensky E, Le Roux P. The physiology behind direct brain oxygen monitors and practical aspects of their use. Childs Nerv Syst 2010; 26(4):419-30.
22. Siggaard-Andersen O, Ulrich A, Gothgen IH. Classes of tissue hypoxia. Acta Anaesthesiol Scand Suppl 1995; 107:137-42.
23. Radolovich DK, Czosnyka M, Timofeev I, Lavinio A, Hutchinson P, Gupta A, et al. Reactivity of brain tissue oxygen to change in cerebral perfusion pressure in head injured patients. Neurocritical care 2009; 10(3):274-9.
24. Jaeger M, Dengl M, Meixensberger J, Schuhmann MU. Effects of cerebrovascular pressure reactivity-guided optimization of cerebral perfusion pressure on brain tissue oxygenation after traumatic brain injury. Crit Care Med 2010; 38(5):1343-7.
25. Steiger HJ, Aaslid R, Stooss R, Seiler RW. Transcranial Dop-pler monitoring in head injury: relations between type of injury, flow velocities, vasoreactivity, and outcome. Neurosurgery 1994; 34(1):79-85; discussion -6.
26. Yoshihara M, Bandoh K, Marmarou A. Cerebrovascular carbon dioxide reactivity assessed by intracranial pressure dynamics in severely head injured patients. J Neurosurg 1995; 82(3):386-93.
27. Smielewski P, Czosnyka M, Kirkpatrick P, Pickard JD. Evaluation of the transient hyperemic response test in head-injured patients. J Neurosurg 1997; 86(5):773-8.
28. Vajkoczy P, Horn P, Thome C, Munch E, Schmiedek P. Regional cerebral blood flow monitoring in the diagnosis of delayed ischemia following aneurysmal subarachnoid hemorrhage. J Neurosurg 2003; 98(6):1227-34.
29. Hecht N, Fiss I, Wolf S, Barth M, Vajkoczy P, Woitzik J. Modified flow- and oxygen-related autoregulation indices for continuous monitoring of cerebral autoregulation. J Neurosci Methods 2011; 201(2):399-403.
30. Bellander BM, Cantais E, Enblad P, Hutchinson P, Nordstrom CH, Robertson C, et al. Consensus meeting on microdialysis in neuroin-tensive care. Intensive Care Med 2004; 30(12):2166-9.
31. Timofeev I, Czosnyka M, Carpenter KL, Nortje J, Kirkpatrick PJ, Al-Rawi PG, et al. Interaction between brain chemistry and phys-iology after traumatic brain injury: impact of autoregulation and microdialysis catheter location. J Neurotrauma 2011; 28(6):849-60.
32. Wartenberg KE, Mayer SA. Multimodal brain monitoring in the neurological intensive care unit: where does continuous EEG fit in? Journal of clinical neurophysiology : official publication of the American Electroencephalographic Society 2005; 22(2):124-7.
33. Wittman JJ, Jr., Hirsch LJ. Continuous electroencephalogram moni-toring in the critically ill. Neurocritical care 2005; 2(3):330-41.
injury. VI. Indications for intracranial pressure monitoring. J Neu-rotrauma 2007; 24 Suppl 1:S37-44.
6. Chesnut RM, Temkin N, Carney N, Dikmen S, Rondina C, Videtta W, et al. A trial of intracranial-pressure monitoring in trau-matic brain injury. The New England journal of medicine 2012; 367(26):2471-81.
7. Czosnyka M, Smielewski P, Timofeev I, Lavinio A, Guazzo E, Hutchinson P, et al. Intracranial pressure: more than a number. Neurosurgical Focus 2007; 22(5):E10.
8. Chesnut RM. Intracranial pressure monitoring: headstone or a new head start. The BEST TRIP trial in perspective. Intensive Care Med 2013; 39(4):771-4.
9. Chesnut RM. Intracranial Pressure. In: Roux PDL, Levine J, Kofke WA, editors. Monitoring in Neurocritical Care: Elsevier Saunders; 2013. p. 338-47.
10. Czosnyka M, Brady K, Reinhard M, Smielewski P, Steiner LA. Monitoring of cerebrovascular autoregulation: facts, myths, and missing links. Neurocritical care 2009; 10(3):373-86.
11. Czosnyka M, Smielewski P, Kirkpatrick P, Laing RJ, Menon D, Pickard JD. Continuous assessment of the cerebral vasomotor reac-tivity in head injury. Neurosurgery 1997; 41(1):11-7; discussion 7-9.
12. Czosnyka M, Pickard JD. Monitoring and interpretation of intracra-nial pressure. J Neurol Neurosurg Psychiatry 2004; 75(6):813-21.
13. Steiner LA, Czosnyka M, Piechnik SK, Smielewski P, Chatfield D, Menon DK, et al. Continuous monitoring of cerebrovascular pres-sure reactivity allows determination of optimal cerebral perfusion pressure in patients with traumatic brain injury. Crit Care Med 2002; 30(4):733-8.
14. Brady KM, Lee JK, Kibler KK, Easley RB, Koehler RC, Shaffner DH. Continuous measurement of autoregulation by spontaneous fluctuations in cerebral perfusion pressure: comparison of 3 meth-ods. Stroke 2008; 39(9):2531-7.
15. Lazaridis C, Smielewski P, Steiner LA, Brady KM, Hutchinson P,Pickard JD, et al. Optimal cerebral perfusion pressure: are we ready for it? Neurol Res 2013; 35(2):138-48.
16. Stiefel MF, Udoetuk JD, Spiotta AM, Gracias VH, Goldberg A, Maloney-Wilensky E, et al. Conventional neurocritical care and cerebral oxygenation after traumatic brain injury. J Neurosurg 2006; 105(4):568-75.
17. Zauner A, Daugherty WP, Bullock MR, Warner DS. Brain Oxy-genation and Energy Metabolism: PART I—Biological Function and Pathophysiology. Neurosurgery 2002; 51:289-302.
18. Tran-Dinh A, Depret F, Vigue B. [Brain tissue oxygen pressure,for what, for whom?]. Ann Fr Anesth Reanim 2012; 31(6):e137-43. Pression tissulaire cerebrale en oxygene : pour quoi faire et pour qui ?
19. Rosenthal G, Hemphill JC, 3rd, Sorani M, Martin C, Morabito D, Obrist WD, et al. Brain tissue oxygen tension is more indicative of oxygen diffusion than oxygen delivery and metabolism in patients with traumatic brain injury. Crit Care Med 2008; 36(6):1917-24.


87 PUBLICATION III
PRESSURES, FLOW, AND BRAIN OXYGENATION
DURING PLATEAU WAVES OF INTRACRANIAL PRESSURE
Dias, C, Maia, I, Cerejo, A, Varsos G, Smielewski, P, Paiva, J-A, Czosnyka, M
Neurocrit Care (2014) 21:124–132


ORIGINAL ARTICLE
Pressures, Flow, and Brain Oxygenation During Plateau Wavesof Intracranial Pressure
Celeste Dias • Isabel Maia • Antonio Cerejo • Georgios Varsos •
Peter Smielewski • Jose-Artur Paiva • Marek Czosnyka
� Springer Science+Business Media New York 2013
Abstract
Background Plateau waves are common in traumatic brain
injury. They constitute abrupt increases of intracranial pressure
(ICP) above 40 mmHg associated with a decrease in cerebral
perfusion pressure (CPP). The aim of this study was to describe
plateau waves characteristics with multimodal brain monitor-
ing in head injured patients admitted in neurocritical care.
Methods Prospective observational study in 18 multiple
trauma patients with head injury admitted to Neurocritical
Care Unit of Hospital Sao Joao in Porto. Multimodal systemic
and brain monitoring of primary variables [heart rate, arterial
blood pressure, ICP, CPP, pulse amplitude, end tidal CO2,
brain temperature, brain tissue oxygenation pressure, cerebral
oximetry (CO) with transcutaneous near-infrared spectroscopy
and cerebral blood flow (CBF)] and secondary variables rela-
ted to cerebral compensatory reserve and cerebrovascular
reactivity were supported by dedicated software ICM+ (www.
neurosurg.cam.ac.uk/icmplus). The compiled data were ana-
lyzed in patients who developed plateau waves.
Results In this study we identified 59 plateau waves that
occurred in 44 % of the patients (8/18). During plateau
waves CBF, cerebrovascular resistance, CO, and brain tissue
oxygenation decreased. The duration and magnitude of
plateau waves were greater in patients with working
cerebrovascular reactivity. After the end of plateau wave, a
hyperemic response was recorded in 64 % of cases with
increase in CBF and brain oxygenation. The magnitude of
hyperemia was associated with better autoregulation status
and low oxygenation levels at baseline.
Conclusions Multimodal brain monitoring facilitates
identification and understanding of intrinsic vascular brain
phenomenon, such as plateau waves, and may help the
adequate management of acute head injury at bed side.
Keywords Multimodal brain monitoring �Intracranial pressure � Plateau waves �Cerebral perfusion pressure � Cerebrovascular reactivity �Head injury
Introduction
‘‘Sudden rises in intracranial pressure’’ (ICP) were first
described by Janny in 1950 [1] but the term ‘‘plateau waves’’
or ‘‘A waves’’ was introduced by Lundberg in 1960 [2].
Plateau waves were defined as sudden and relevant increases
in ICP up to 40–100 mmHg with duration of 5–20 min [3].
However, the duration of plateau waves should not be con-
sidered as a strict criterion particularly that in many centers
elevations of ICP are actively treated. Plateau waves are
associated with working cerebrovascular reactivity [3] and
low cerebrospinal compensatory reserve [4] related to several
acute or chronic brain pathologies such as head injury [5],
spontaneous subarachnoid hemorrhage [6, 7], intracerebral
hemorrhage [7], tumors [8], benign intracranial hypertension
[7], and craniosynostosis [9].
These tidal ICP elevations are accompanied by a
decrease in cerebral perfusion pressure (CPP = MAP–
ICP), which in turn may decrease brain blood flow and
C. Dias (&) � I. Maia � J.-A. Paiva
Intensive Care Department, Neurocritical Care Unit, Hospital
Sao Joao, Porto, Portugal
e-mail: [email protected]
A. Cerejo
Neurosurgery Department, Hospital Sao Joao, Porto, Portugal
G. Varsos � P. Smielewski � M. Czosnyka
Division of Neurosurgery, Department of Clinical
Neurosciences, Addenbrooke’s Hospital, Cambridge, UK
123
Neurocrit Care
DOI 10.1007/s12028-013-9918-y
Author's personal copy
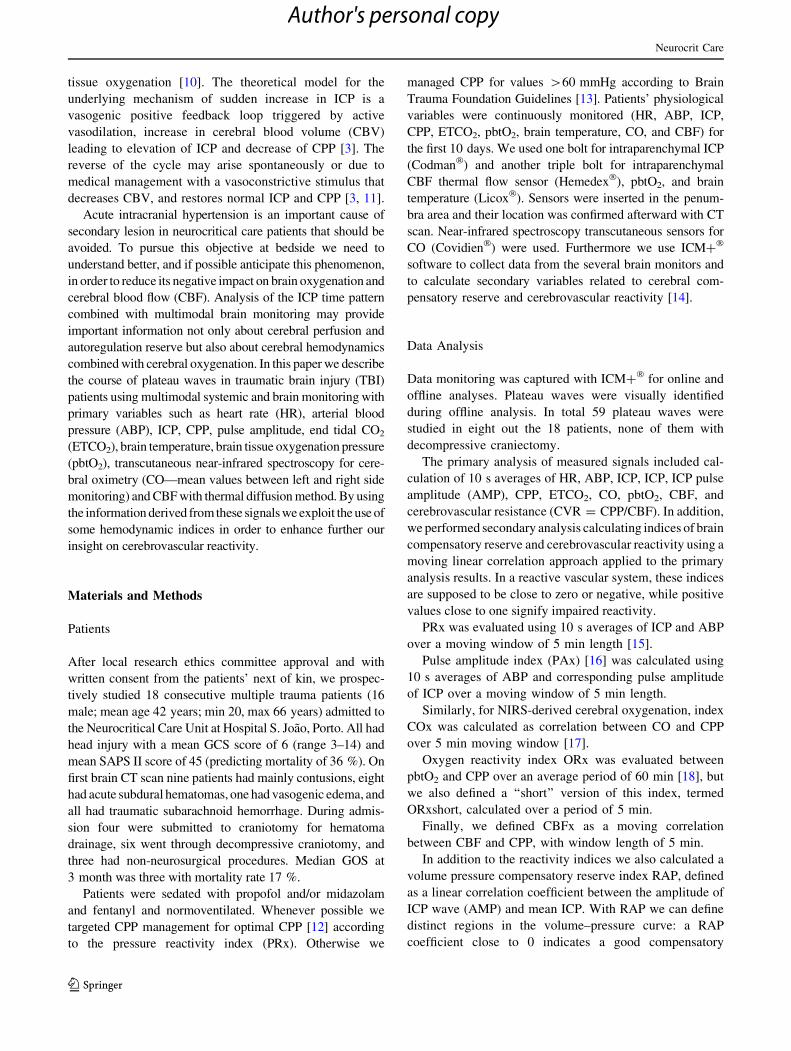
tissue oxygenation [10]. The theoretical model for the
underlying mechanism of sudden increase in ICP is a
vasogenic positive feedback loop triggered by active
vasodilation, increase in cerebral blood volume (CBV)
leading to elevation of ICP and decrease of CPP [3]. The
reverse of the cycle may arise spontaneously or due to
medical management with a vasoconstrictive stimulus that
decreases CBV, and restores normal ICP and CPP [3, 11].
Acute intracranial hypertension is an important cause of
secondary lesion in neurocritical care patients that should be
avoided. To pursue this objective at bedside we need to
understand better, and if possible anticipate this phenomenon,
in order to reduce its negative impact on brain oxygenation and
cerebral blood flow (CBF). Analysis of the ICP time pattern
combined with multimodal brain monitoring may provide
important information not only about cerebral perfusion and
autoregulation reserve but also about cerebral hemodynamics
combined with cerebral oxygenation. In this paper we describe
the course of plateau waves in traumatic brain injury (TBI)
patients using multimodal systemic and brain monitoring with
primary variables such as heart rate (HR), arterial blood
pressure (ABP), ICP, CPP, pulse amplitude, end tidal CO2
(ETCO2), brain temperature, brain tissue oxygenation pressure
(pbtO2), transcutaneous near-infrared spectroscopy for cere-
bral oximetry (CO—mean values between left and right side
monitoring) and CBF with thermal diffusion method. By using
the information derived fromthese signals we exploit the use of
some hemodynamic indices in order to enhance further our
insight on cerebrovascular reactivity.
Materials and Methods
Patients
After local research ethics committee approval and with
written consent from the patients’ next of kin, we prospec-
tively studied 18 consecutive multiple trauma patients (16
male; mean age 42 years; min 20, max 66 years) admitted to
the Neurocritical Care Unit at Hospital S. Joao, Porto. All had
head injury with a mean GCS score of 6 (range 3–14) and
mean SAPS II score of 45 (predicting mortality of 36 %). On
first brain CT scan nine patients had mainly contusions, eight
had acute subdural hematomas, one had vasogenic edema, and
all had traumatic subarachnoid hemorrhage. During admis-
sion four were submitted to craniotomy for hematoma
drainage, six went through decompressive craniotomy, and
three had non-neurosurgical procedures. Median GOS at
3 month was three with mortality rate 17 %.
Patients were sedated with propofol and/or midazolam
and fentanyl and normoventilated. Whenever possible we
targeted CPP management for optimal CPP [12] according
to the pressure reactivity index (PRx). Otherwise we
managed CPP for values >60 mmHg according to Brain
Trauma Foundation Guidelines [13]. Patients’ physiological
variables were continuously monitored (HR, ABP, ICP,
CPP, ETCO2, pbtO2, brain temperature, CO, and CBF) for
the first 10 days. We used one bolt for intraparenchymal ICP
(Codman�) and another triple bolt for intraparenchymal
CBF thermal flow sensor (Hemedex�), pbtO2, and brain
temperature (Licox�). Sensors were inserted in the penum-
bra area and their location was confirmed afterward with CT
scan. Near-infrared spectroscopy transcutaneous sensors for
CO (Covidien�) were used. Furthermore we use ICM+�
software to collect data from the several brain monitors and
to calculate secondary variables related to cerebral com-
pensatory reserve and cerebrovascular reactivity [14].
Data Analysis
Data monitoring was captured with ICM+� for online and
offline analyses. Plateau waves were visually identified
during offline analysis. In total 59 plateau waves were
studied in eight out the 18 patients, none of them with
decompressive craniectomy.
The primary analysis of measured signals included cal-
culation of 10 s averages of HR, ABP, ICP, ICP, ICP pulse
amplitude (AMP), CPP, ETCO2, CO, pbtO2, CBF, and
cerebrovascular resistance (CVR = CPP/CBF). In addition,
we performed secondary analysis calculating indices of brain
compensatory reserve and cerebrovascular reactivity using a
moving linear correlation approach applied to the primary
analysis results. In a reactive vascular system, these indices
are supposed to be close to zero or negative, while positive
values close to one signify impaired reactivity.
PRx was evaluated using 10 s averages of ICP and ABP
over a moving window of 5 min length [15].
Pulse amplitude index (PAx) [16] was calculated using
10 s averages of ABP and corresponding pulse amplitude
of ICP over a moving window of 5 min length.
Similarly, for NIRS-derived cerebral oxygenation, index
COx was calculated as correlation between CO and CPP
over 5 min moving window [17].
Oxygen reactivity index ORx was evaluated between
pbtO2 and CPP over an average period of 60 min [18], but
we also defined a ‘‘short’’ version of this index, termed
ORxshort, calculated over a period of 5 min.
Finally, we defined CBFx as a moving correlation
between CBF and CPP, with window length of 5 min.
In addition to the reactivity indices we also calculated a
volume pressure compensatory reserve index RAP, defined
as a linear correlation coefficient between the amplitude of
ICP wave (AMP) and mean ICP. With RAP we can define
distinct regions in the volume–pressure curve: a RAP
coefficient close to 0 indicates a good compensatory
Neurocrit Care
123
Author's personal copy

reserve with linear relationship between volume and pres-
sure. RAP index around 1 indicates poor compensatory
reserve with exponential relationship between volume and
ICP. RAP negative at high ICP values indicates exhausted
compensatory reserve [4].
To describe the plateau waves we applied time averages
of the primary and secondary variables during the plateau
phase, within a 30 min interval before the onset and two
consecutive 30 min intervals after the wave (just after—
first 30 min and later—second 30 min).
In addition, observations of the shape of pulse waveform
of ICP were performed. ICP beat-to-beat waveform consists
of three components that reflect various aspects of the
cerebral vascular bed. The first peak (P1) is the ‘‘percus-
sion’’ wave and is due to arterial pressure being transmitted
from the choroid plexus to the ventricle. The second wave
(P2), known as the ‘‘tidal’’ wave, is related to brain com-
pliance. The origin of third peak P3 (not always clearly
observed) is still a subject for disputes. It is believed to
coincide with the closure of the aortic valve and represents
Table 1 Fundamental (measured) variables and p values between baseline, during and after plateau waves (two consecutive 30-min period
intervals)
Baseline Plateau Just after Later
ICP (mean ± SD) 17.39 ± 5.3 47.27 ± 6.47 16.92 ± 6.85 15.51 ± 7.46
p values ***p NS NS
p values from plateau to after ***p = 0 ***p = 0
ABP (mean ± SD) 107.85 ± 12.93 108.21 ± 13.97 109.76 ± 12.90 108.56 ± 13.01
p values NS NS
p values from plateau to after NS NS
CPP (mean ± SD) 90.72 ± 11.37 61.13 ± 14 93.12 ± 13.29 93.18 ± 12.67
p values ***p = 0 NS NS
p values from plateau to after ***p = 0 ***p = 0
AMP (mean ± SD) 2.7 ± 1.25 6.9 ± 2.65 2.92 ± 1.42 2.59 ± 1.08
p values ***p = 0 NS NS
p values from plateau to after ***p = 0 ***p = 0
CBF (mean ± SD) 31.64 ± 30.92 26.18 ± 24.53 41.15 ± 28.31 33.67 ± 33.55
p values from baseline NS NS NS
p values from plateau to after *p = 0.03 NS
CVR (mean ± SD) 4.88 ± 2.78 3.97 ± 2.35 3.64 ± 2.49 5.23 ± 3.80
p values NS *p = 0.02 NS
p values from plateau to after NS NS
CO (mean ± SD) 53.01 ± 8.45 50.06 ± 12.78 50.79 ± 13.11 51.38 ± 10.51
p values p = 0.021 NS NS
p values from plateau to after NS NS
PbtO2 (mean ± SD) 21.38 ± 7.95 16.66 ± 8.67 20.44 ± 7.34 20.68 ± 8.01
p values **p = 0.0004 NS NS
p values from plateau to after **p = 0.002 *p = 0.009
ETCO2 (mean ± SD) 28.12 ± 3.54 29.93 ± 4.15 28.89 ± 3.56 28.26 ± 3.87
p values **p = 0.00042 NS NS
p values from plateau to after NS *p = 0.001
HR (mean ± SD) 78.18 ± 17.97 79.9 ± 15.74 79.51 ± 17.90 78.75 ± 18.84
p values NS NS NS
p values from plateau to after NS NS
TEMP (mean ± SD) 37.43 ± 0.84 37.4 ± 0.82 37.28 ± 0.85 37.26 ± 0. 90
p values NS NS NS
p values from plateau to after *p = 0.01 *p = 0.031
Quoted p values are not corrected for multiple comparisons
ICP intracranial pressure, ABP arterial blood pressure, CPP cerebral perfusion pressure, AMP amplitude of ICP, CBF cerebral blood flow, CVR
cerebral vascular resistance, CO cerebral oximetry, pbtO2 pressure of brain tissue oxygenation, ETCO2 endtidal CO2, HR heart rate, Temp brain
temperature, NS non-significant
Neurocrit Care
123
Author's personal copy

the dicrotic notch [19]. Under normal conditions of low ICP,
the three peaks relate to each other as P1 > P2 > P3.
When brain compliance decreases and ICP starts to rise the
ICP pulse waveform morphology gradually changes and the
P2/P1 ratio eventually becomes greater than 1.0.
Statistical Analysis
The analyses were performed using commercial IBM soft-
ware SPSS 20�. Data were expressed as mean values, range,
and standard deviation (mean ± SD). Normal distribution
was established with Shapiro–Wilk test. Repeated measures
ANOVA were applied to test the significance of the results
comparing baseline values with values obtained during and
after plateau waves, between and within subjects. When
appropriate, non-parametric Kruskal–Wallis test was used to
investigate statistical relationships between the studied
variables. Tests were considered statistically significant for
p values <0.05.
Results
Plateau Waves and Primary Brain Multimodal
Variables
In this study plateau waves occurred in 44 % of the
patients. Averaged values of primary variables describing
plateau waves are summarized in Table 1. During A
waves, HR and ABP remained almost constant as ICP rose
from mean baseline of 17.39 ± 5.3 to a mean value of
47.27 ± 6.47. The mean time of ICP values above 40 was
9 min with a range of 2–31 min. During this time, at the
top of the plateau wave, mean ICP pulse amplitude (AMP)
increased and CPP decreased (p < 0.0001). CBF and
cerebrovascular resistance decreased and brain oxygena-
tion decreased significantly (p = 0.0004) to values below
20 mmHg. Simultaneously, brain hypoxia was detected by
CO although with less significant value (p = 0.021). We
also saw a small increase in ETCO2 between baseline and
plateau wave, although highly significant (p = 0.00042),
which may be responsible for triggering the vasodilatory
cascade. Example of shape of plateau wave using multi-
modal monitoring setup is presented in Fig. 1.
Cerebral Hyperemia After Plateau Waves
After the end of plateau waves, as ICP decreased and CPP
recovered, a hyperemic response in 64 % of cases with a
statistically significant increase in CBF (p = 0.03) and
decrease of CVR (p = 0.02) was noticed (see Fig 1).
In the hyperemic response after plateau waves CBF
increased higher (above 7 ml/min/100 g) if baseline PbtO2
was less than 20 (23 ± 7 vs. 16 ± 7 mmHg; p = 0.004,
Kruskal–Wallis test). Also higher hyperemia was noted
Fig. 1 Example of multimodal brain monitoring recording during plateau wave. Rise in ICP courses with relatively stable systemic variables
such as ABP and HR but is accompanied of an important decrease in CPP, CBF, CO, and pbtO2
Neurocrit Care
123
Author's personal copy

with lower baseline PRx (0.01 ± 0.21 vs. -0.26 ± 0.23;
p = 0.002). During hyperemic response, brain oxygenation
improved with a slow and sustained increase (p = 0.002)
and the same tendency was seen in CO, although non-
significant. We also noticed a marginal decrease in brain
temperature (p = 0.01) after plateau wave.
Table 2 Compensatory volume–pressure reserve and cerebrovascular reactivity indices and p values between baseline, during and after plateau
waves (two consecutive 30-min period intervals)
Baseline Plateau Just after Later
RAP (mean ± SD) 0.57 ± 0.18 0.65 ± 0.21 0.59 ± 0.19 0.55 ± 0.22
p values NS NS NS
PRx (mean ± SD) -0.05 ± 0.27 0.16 ± 0.50 0,02 ± 0.26 0.02 ± 0.31
p values *p = 0.02 NS NS
PAx (mean ± SD) 0.12 ± 0.30 0.15 ± 0.35 0.16 ± 0.23 0.14 ± 0.24
p values NS NS NS
CBFx (mean ± SD) 0.62 ± 0.26 -0.31 ± 0.39 0.69 ± 0.24 0.006 ± 0.19
p values NS NS NS
COx (mean ± SD) 0.04 ± 0.09 -0.09 ± 0.26 0.03 ± 0.13 0.03 ± 0.13
p values NS NS NS
ORx (mean ± SD) 0.15 ± 0.26 0.26 ± 0.33 0.31 ± 0.31 0.30 ± 0.32
p values NS *p = 0.02 **p = 0.03
ORxShort (mean ± SD) -0.01 ± 0.15 0.13 ± 0.4 0.07 ± 0.17 0.01 ± 0.17
p values **p = 0.04 **p = 0.004 NS
Quoted p values are not corrected for multiple comparisons
RAP RAP index between AMP and ICP, PRx pressure reactivity index, PAx pulse amplitude index, CBFx cerebral blood flow reactivity index,
COx cerebral oximetry reactivity index, ORx and ORxshort oxygen reactivity index, NS non-significant
Fig. 2 Plateau wave and cerebral vascular reactivity indexes. During
the increase of ICP, PRx changes abruptly from -0.5 to values above
0.5 demonstrating impairment of autoregulation. Oxygenation
indexes cerebral oximetry index (COx) and oxygen reactivity index
(ORxshort) also reveal derangement of oxygen availability to brain
tissue. Cerebral blood flow reactivity index (CBFx) shows blood flow
instability with important risk of cerebral ischemia
Neurocrit Care
123
Author's personal copy

Association with Cerebrovascular Reactivity
and Compensatory Volume–Pressure Reserve
Figure 2 represents an example of plateau wave and sec-
ondary variables. As ICP suddenly increases, all indices
present important modifications. With the exception of
CBFx and COx all other indices (PRx, PAx, ORx, and
ORxshort) change reflected deterioration of autoregulation,
vascular reactivity, and oxygenation. During plateau waves
RAP, a measure of impairment of compensatory volume–
pressure reserve, increases but without statistically signif-
icance. Cerebrovascular reactivity indices deteriorate with
frequent impairment of autoregulation related to a signifi-
cant increase in PRx (p = 0.02). ORxshort also increased
significantly (p = 0.04) during plateau wave warning of
potential brain hypoxia. The index recovers to its baseline
values but after some delay (the ‘‘just after’’ values were
still significantly increased, at p < 0.004). ORx, due to its
longer calculation time window (1 h), does not reflect
adequately such rapid modifications in cerebral vascular
reactivity. CBFx and COx show no significant modification
in the majority of patients (Table 2).
Observation of ICP Pulse Waveform During Plateau
Waves
Figure 3 shows an example of change in ICP waveform
morphology at baseline (Fig. 3a, P1 > P2 > P3) and
Fig. 3 a ICP beat-to-beat waveform and the three pulsatile compo-
nents. P1 the ‘‘percussion’’ wave, P2 the ‘‘tidal’’ wave, and P3 the
dicrotic notch. Under normal values of ICP the three peaks relate with
each other as P1 > P2 > P3. b When brain compliance decreases
and ICP starts to rise, the waveform modifies with an increase in
amplitude followed by an inversion of P2/P1 ratio
Neurocrit Care
123
Author's personal copy

during plateau waves (Fig 3b P1 < P2 > P3). During
plateau waves increase in ICP pulse amplitude is highly
correlated with the mean value of ICP (r = 0.9932), as
demonstrated by an example shown in Fig. 4.
Plateau Waves Magnitude and Duration
As the duration of plateau waves increased from 5 to
30 min we detected a negative correlation with PRx
(r = -0.46; p < 0.003) which means that the better the
autoregulation the longer the duration of plateau waves
(Fig. 5a). Using multiple regression analysis we defined a
model that explains the magnitude of ICP based on average
values of cerebrovascular indexes from the wave plateau
period:
Increase in ICP = 8:3O� ORxþ 0:37� CO� 8� PRx
þ 49
The lower PRx with the better oxygenation parameters
(CO and ORx) the higher magnitude of ICP (Fig. 5b).
Discussion
Plateau waves are frequent cerebrovascular phenomena in
TBI, which are not usually associated with worse outcome,
unless they are longer than 30 min [5]. Nevertheless, TBI
with sustained intracranial hypertension or low oxygena-
tion have poor prognosis [20].
Multimodal brain monitoring and computerized analysis
help in early detection of secondary insults at the bedside. It
also adds value to retrospective observation in offline analysis,
namely during intracranial hypertension [21]. Rises in ICP
above 40 mmHg with different causes may appear in TBI
patients [22]. It is important to understand their etiology and
pathophysiology in order to apply the most adequate treat-
ment. In this study multimodal brain monitoring helped to
distinguish and describe plateau waves as sudden rises in ICP
triggered by vasodilatory events, such as small oscillations of
ABP, brain oxygenation, or arterial CO2. This vasodilatory
cascade leading to an increase in CBV has combined effects
on CPP, cerebral oxygenation, and CBF. With our monitoring
setup, we were able to detect significant compromise of CPP,
decrease of cerebral vascular resistance, CBF, and brain
oxygenation. Autoregulation, normally intact before the onset
of the plateau wave, was lost during the crest of the wave, as
indicated by the PRx. The same pattern was followed by the
other cerebrovascular reactivity indexes related to oxygena-
tion reactivity index ORxshort. Plateau waves are not benign
phenomena and, at the lower limit of autoregulation (LLA),
there is a risk of zero flow due to the collapse of brain vessels
[23]. This is particularly relevant in the situations of
Fig. 4 Correlation between absolute values of ICP during plateau wave and ICP pulse amplitude
Neurocrit Care
123
Author's personal copy
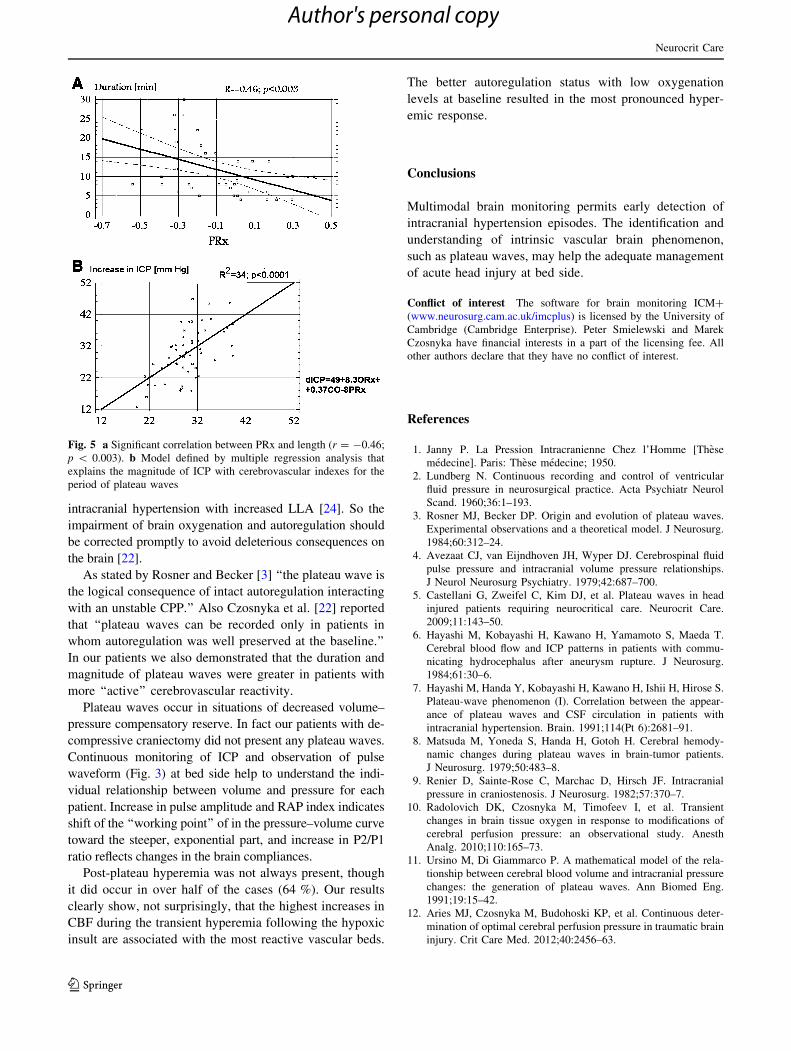
intracranial hypertension with increased LLA [24]. So the
impairment of brain oxygenation and autoregulation should
be corrected promptly to avoid deleterious consequences on
the brain [22].
As stated by Rosner and Becker [3] ‘‘the plateau wave is
the logical consequence of intact autoregulation interacting
with an unstable CPP.’’ Also Czosnyka et al. [22] reported
that ‘‘plateau waves can be recorded only in patients in
whom autoregulation was well preserved at the baseline.’’
In our patients we also demonstrated that the duration and
magnitude of plateau waves were greater in patients with
more ‘‘active’’ cerebrovascular reactivity.
Plateau waves occur in situations of decreased volume–
pressure compensatory reserve. In fact our patients with de-
compressive craniectomy did not present any plateau waves.
Continuous monitoring of ICP and observation of pulse
waveform (Fig. 3) at bed side help to understand the indi-
vidual relationship between volume and pressure for each
patient. Increase in pulse amplitude and RAP index indicates
shift of the ‘‘working point’’ of in the pressure–volume curve
toward the steeper, exponential part, and increase in P2/P1
ratio reflects changes in the brain compliances.
Post-plateau hyperemia was not always present, though
it did occur in over half of the cases (64 %). Our results
clearly show, not surprisingly, that the highest increases in
CBF during the transient hyperemia following the hypoxic
insult are associated with the most reactive vascular beds.
The better autoregulation status with low oxygenation
levels at baseline resulted in the most pronounced hyper-
emic response.
Conclusions
Multimodal brain monitoring permits early detection of
intracranial hypertension episodes. The identification and
understanding of intrinsic vascular brain phenomenon,
such as plateau waves, may help the adequate management
of acute head injury at bed side.
Conflict of interest The software for brain monitoring ICM+
(www.neurosurg.cam.ac.uk/imcplus) is licensed by the University of
Cambridge (Cambridge Enterprise). Peter Smielewski and Marek
Czosnyka have financial interests in a part of the licensing fee. All
other authors declare that they have no conflict of interest.
References
1. Janny P. La Pression Intracranienne Chez l’Homme [These
medecine]. Paris: These medecine; 1950.
2. Lundberg N. Continuous recording and control of ventricular
fluid pressure in neurosurgical practice. Acta Psychiatr Neurol
Scand. 1960;36:1–193.
3. Rosner MJ, Becker DP. Origin and evolution of plateau waves.
Experimental observations and a theoretical model. J Neurosurg.
1984;60:312–24.
4. Avezaat CJ, van Eijndhoven JH, Wyper DJ. Cerebrospinal fluid
pulse pressure and intracranial volume pressure relationships.
J Neurol Neurosurg Psychiatry. 1979;42:687–700.
5. Castellani G, Zweifel C, Kim DJ, et al. Plateau waves in head
injured patients requiring neurocritical care. Neurocrit Care.
2009;11:143–50.
6. Hayashi M, Kobayashi H, Kawano H, Yamamoto S, Maeda T.
Cerebral blood flow and ICP patterns in patients with commu-
nicating hydrocephalus after aneurysm rupture. J Neurosurg.
1984;61:30–6.
7. Hayashi M, Handa Y, Kobayashi H, Kawano H, Ishii H, Hirose S.
Plateau-wave phenomenon (I). Correlation between the appear-
ance of plateau waves and CSF circulation in patients with
intracranial hypertension. Brain. 1991;114(Pt 6):2681–91.
8. Matsuda M, Yoneda S, Handa H, Gotoh H. Cerebral hemody-
namic changes during plateau waves in brain-tumor patients.
J Neurosurg. 1979;50:483–8.
9. Renier D, Sainte-Rose C, Marchac D, Hirsch JF. Intracranial
pressure in craniostenosis. J Neurosurg. 1982;57:370–7.
10. Radolovich DK, Czosnyka M, Timofeev I, et al. Transient
changes in brain tissue oxygen in response to modifications of
cerebral perfusion pressure: an observational study. Anesth
Analg. 2010;110:165–73.
11. Ursino M, Di Giammarco P. A mathematical model of the rela-
tionship between cerebral blood volume and intracranial pressure
changes: the generation of plateau waves. Ann Biomed Eng.
1991;19:15–42.
12. Aries MJ, Czosnyka M, Budohoski KP, et al. Continuous deter-
mination of optimal cerebral perfusion pressure in traumatic brain
injury. Crit Care Med. 2012;40:2456–63.
Fig. 5 a Significant correlation between PRx and length (r = -0.46;
p < 0.003). b Model defined by multiple regression analysis that
explains the magnitude of ICP with cerebrovascular indexes for the
period of plateau waves
Neurocrit Care
123
Author's personal copy

13. Brain Trauma Foundation, American Association of Neurological
Surgeons, Congress of Neurological Surgeons, et al. Guidelines
for the management of severe traumatic brain injury. IX. Cerebral
perfusion thresholds. J Neurotrauma. 2007;24(Suppl 1):59–64.
14. Smielewski P, Czosnyka M, Steiner L, Belestri M, Piechnik S,
Pickard JD. ICM+: software for on-line analysis of bedside
monitoring data after severe head trauma. Acta Neurochir Suppl.
2005;95:43–9.
15. Czosnyka M, Smielewski P, Kirkpatrick P, Laing RJ, Menon D,
Pickard JD. Continuous assessment of the cerebral vasomotor reac-
tivity in head injury. Neurosurgery. 1997;41:11–7 discussion 7–9.
16. Aries MJ, Czosnyka M, Budohoski KP, et al. Continuous moni-
toring of cerebrovascular reactivity using pulse waveform of
intracranial pressure. Neurocrit Care. 2012;17:67–76.
17. Brady KM, Lee JK, Kibler KK, et al. Continuous time-domain
analysis of cerebrovascular autoregulation using near-infrared
spectroscopy. Stroke. 2007;38:2818–25.
18. Jaeger M, Schuhmann MU, Soehle M, Meixensberger J. Con-
tinuous assessment of cerebrovascular autoregulation after
traumatic brain injury using brain tissue oxygen pressure reac-
tivity. Crit Care Med. 2006;34:1783–8.
19. Citerio G, Andrews PJ. Intracranial pressure. Part two: clinical
applications and technology. Intensive Care Med. 2004;30:1882–5.
20. Balestreri M, Czosnyka M, Hutchinson P, et al. Impact of intra-
cranial pressure and cerebral perfusion pressure on severe disability
and mortality after head injury. Neurocrit Care. 2006;4:8–13.
21. Budohoski KP, Zweifel C, Kasprowicz M, et al. What comes
first? The dynamics of cerebral oxygenation and blood flow in
response to changes in arterial pressure and intracranial pressure
after head injury. Br J Anaesth. 2012;108:89–99.
22. Czosnyka M, Smielewski P, Piechnik S, et al. Hemodynamic
characterization of intracranial pressure plateau waves in head-
injury patients. J Neurosurg. 1999;91:11–9.
23. Varsos GV, Richards H, Kasprowicz M, et al. Critical closing
pressure determined with a model of cerebrovascular impedance.
J Cereb Blood Flow Metab. 2013;33:235–43.
24. Brady KM, Lee JK, Kibler KK, et al. The lower limit of cerebral
blood flow autoregulation is increased with elevated intracranial
pressure. Anesth Analg. 2009;108:1278–83.
Neurocrit Care
123
Author's personal copy


99 PUBLICATION IV
POST-TRAUMATIC MULTIMODAL BRAIN MONITORING:
RESPONSE TO HYPERTONIC SALINE
Dias, C, Silva, MJ, Pereira, E, Silva, S, Cerejo, A, Smielewski, P, Rocha, AP, Gaio, AR,
Paiva, J-A, Czosnyka, M
J Neurotrauma. 2014 Sep 11. [Epub ahead of print]


Original Research
Post-Traumatic Multimodal Brain Monitoring:Response to Hypertonic Saline
Celeste Dias,1 Maria Joao Silva,2 Eduarda Pereira,1 Sofia Silva,1 Antonio Cerejo,3 Peter Smielewski,4
Ana Paula Rocha,2 A. Rita Gaio,2 Jose-Artur Paiva,1 and Marek Czosnyka4
Abstract
Emerging evidence suggests that hypertonic saline (HTS) is efficient in decreasing intracranial pressure (ICP). However
there is no consensus about its interaction with brain hemodynamics and oxygenation. In this study, we investigated brain
response to HTS bolus with multimodal monitoring after severe traumatic brain injury (TBI). We included 18 consecutive
TBI patients during 10 days after neurocritical care unit admission. Continuous brain monitoring applied included ICP,
tissue oxygenation (PtO2) and cerebral blood flow (CBF). Cerebral perfusion pressure (CPP), cerebrovascular resistance
(CVR), and reactivity indices related to pressure (PRx) and flow (CBFx) were calculated. ICM + software was used to
collect and analyze monitoring data. Eleven of 18 (61%) patients developed 99 episodes of intracranial hypertension (IHT)
greater than 20 mm Hg that were managed with 20% HTS bolus. Analysis over time was performed with linear mixed-
effects regression modelling. After HTS bolus, ICP and CPP improved over time ( p < 0.001) following a quadratic model.
From baseline to 120 min, ICP had a mean decrease of 6.2 mm Hg and CPP a mean increase of 3.1 mmHg. Mean increase
in CBF was 7.8 mL/min/100 g ( p < 0.001) and mean decrease in CVR reached 0.4 mm Hg*min*100 g/mL ( p = 0.01). Both
changes preceded pressures improvement. PtO2 exhibited a marginal increase and no significant models for time be-
haviour could be fitted. PRx and CBFx were best described by a linear decreasing model showing autoregulation recover
after HTS ( p = 0.01 and p = 0.04 respectively). During evaluation, CO2 remained constant and sodium level did not exhibit
significant variation. In conclusion, management of IHT with 20% HTS significantly improves cerebral hemodynamics
and cerebrovascular reactivity with recovery of CBF appearing before rise in CPP and decrease in ICP. In spite of cerebral
hemodynamic improvement, no significant changes in brain oxygenation were identified.
Key words: Cerebral blood flow; cerebral perfusion pressure; cerebrovascular reactivity; hypertonic saline; intracranial
pressure.
Introduction
Recent Best Trip trial1
gave us a lesson that end-hour
instant value monitored intracranial pressure (ICP) cannot
improve average mortality after traumatic brain injury (TBI),
which stayed at the same dreadfully high level of 40% as without
monitoring. This may illustrate that more sophisticated methods of
ICP analysis (starting from simple time averaging) should be
considered to support management—as suggested later by the first
author of the study.2 Intracranial hypertension (IHT) is a common
cause of secondary lesions after TBI3,4 and may be potentially life
threatening.5,6
The crisis associated with high ICP in TBI patients depends on
multiple intrinsic and extrinsic factors frequently interdependent.
The time course of the disease7 and individual response to acute
brain injury contribute to duration and magnitude of ICP peaks.
Uncontrolled intracranial hypertension leads to ischemia, brain
shift, and herniation. The main objective of treatment is to reduce
ICP, recover cerebral perfusion pressure, and improve cerebral
blood flow and brain oxygenation. In neurocritical care units,
adequate treatment of IHT at bedside is a complex issue. Clinical
decisions are supported by the analysis of head computed to-
mography (CT) and multimodal brain monitoring. In practice this
high complexity is often simplified by ‘‘ICP Management Pro-
tocols’’8–11 that specify appropriate types and levels of inter-
ventions according to the underlying cause and the patient
response to treatment. Among all the specific interventions, hy-
perosmolar therapy is recommended12 as a non-surgical measure
to manage high ICP due to brain edema either with mannitol or
hypertonic saline.13
1Department of Intensive Care, 3Department of Neurosurgery, University Hospital Sao Joao, Porto, Portugal.2Department of Mathematics, University of Porto, Portugal.4Department of Clinical Neurosciences, Addenbrooke’s Hospital, Cambridge, UK.
JOURNAL OF NEUROTRAUMA XX:1–9 (Month XX, 2014)ª Mary Ann Liebert, Inc.DOI: 10.1089/neu.2014.3376
1
NEU-2014-3376-ver9-Dias_1P
Type: Research Article
NEU-2014-3376-ver9-Dias_1P.3d 08/23/14 12:50pm Page 1

Emerging evidence suggests that small boluses of high con-
centrations of hypertonic saline (HTS) are very effective in de-
creasing ICP and increasing cerebral perfusion pressure (CPP).14–16
However, mechanisms of action of this drug are still unclear, its
targets controversial,17 and there is no consensus about its effects
on brain microcirculatory hemodynamics, and oxygenation,18–20
particularly associated within normal brain or peri-contusional
penumbra.21 In this study, we examined the effect of 20% HTS
bolus to treat recurrent IHT on brain hemodynamics through
multimodal brain monitoring in the penumbra area.
Methods
Patients
After local ethics committee approval and written consent fromthe next of kin, 18 consecutive adult multiple trauma patients withsevere traumatic brain injury admitted to the Neurocritical Unit(NCCU) at Porto University, Hospital Sao Joao, a Level I traumacenter, were eligible.
At NCCU admission, all patients had a Glasgow Coma Scale(GCS) score of less than 8 and were sedated with continuous in-fusion of propofol and/or midazolam and fentanyl and ventilatedwith mild hypocapnia (partial pressure of carbon dioxide [PaCO2]between 32–35 mm Hg). At our NCCU, patients are treated with30� head up elevation and CPP is continuously calculated witharterial blood pressure (ABP) transducer located at heart level.When possible we targeted CPP management for optimal CPP 22
looking for autoregulation following pressure reactivity index(PRx) based on a 4 h window time. Otherwise, we managed CPP forvalues > 60 mm Hg according to Brain Trauma FoundationGuidelines. 23 None of the patients were younger than 18, pregnant,or not exhibiting clinical indication for invasive ICP monitoring.
Monitoring
Patients were monitored with heart rate (HR), invasive ABP,ICP, CPP, end-tidal CO2 (ETCO2), brain tissue oxygenation (PtO2),brain temperature, and cerebral blood flow (CBF) for the first tendays. We used one bolt for intraparenchymal ICP (Codman�) andanother triple bolt for intraparenchymal CBF thermal flow sensor(Hemedex�), PtO2, and brain temperature probes (Licox�). Sen-sors were inserted in the penumbra area and their location wasconfirmed with CT scan. Data acquired from vital signal monitor(Philips�) and brain monitors were continuously collected usingICM + � software to calculate secondary variables related to cere-brovascular reactivity, like PRx and optimal CPP.24
Prior to bolus infusion blood gas analysis was collected tomeasure pH, PaCO2, partial pressure of oxygen (PaO2), and sodium(Na + ). High sodium levels were actively controlled by giving freewater through nasogastric or nasojejunal tube according to a targetinterval of 140–155 mEq/L.
Procedure
We looked for IHT episodes that occurred during the first 10days after NCCU admission and that were treated with 20% HTSbolus. IHT was defined as ICP above 20 mm Hg for no more than20 min, in the absence of external stimulus and after correction ofpH, PaCO2, PaO2, ABP, and body temperature, according to BrainTrauma Foundation Guidelines.25 Patients with outbreaks of IHTthat is not corrected by the first-tier measures cited were thentreated with bolus of 0.5 mL/kg of 20% HTS infused for 30 min.
Data analysis
Primary endpoint for data analysis was the effect of 20% HTSbolus on brain hemodynamics evaluated with multimodal brain
monitoring variables. For a secondary endpoint, we checked for thevariations of ETCO2 and sodium levels for each bolus during theten days of the study.
We analyzed 99 bolus of HTS administered to 11 patients out ofthe 18 consecutive patients enrolled. Seven patients were excludedbecause they did not receive HTS during the observation period. Toanalyze the effect of HTS, we first calculated primary variableswith a 10-sec average of HR, ABP, ICP, ICP pulse amplitude(AMP), CPP, ETCO2, PtO2, CBF and cerebrovascular resistance(CVR = CPP/CBF). Additionally, we computed moving Pearsoncorrelation coefficient between 30 consecutive 10-sec averages(5 min), to calculate indices of brain compensatory reserve andcerebrovascular reactivity: pressure reactivity index (PRx: ABPcorrelated with ICP), and cerebral blood flow index (CBFx: CBFcorrelated with CPP).
Time averages of all the above mentioned variables were calculatedat baseline (60 min previous to drug infusion) and during 210 min afterthe start of the drug, divided into regular non-overlapping intervalsof 30 min. A total of eight consecutive time points were defined(t1– 60 min baseline, t2 – first 30 min corresponding to drug infusion,t3 to t8 – remaining 30 consecutive min).
Modelling and statistical analysis
Linear mixed-effects (regression) models (LMEM) was used.26
The observations were grouped according to two levels, namely theindividual and the bolus within the individual. This two-levelstructure was needed as variability was found not only among
Table 1. Patient Demographics and Clinical
Characteristics of 11 Patients With 99 Episodes
of Intracranial Hypertension After Traumatic Brain
Injury Admitted to the Neurocritical Care Unit (NCCU)*
Characteristicsn/% or mean – SD or median(range; interquartile range)
n (patients) 11Age (years) 40 – 11Sex (men) 9/82%Glasgow Coma Score 6 (3–12; 4)Mean APACHE/predictedmortality rate
18.3 – 5.4/32%
Mean ISS/TRISS Predictedmortality rate
42 – 17.0/49%
Marshall Classification category of 1st head-CT:II 3/27%III 2/18%IV 4/36%VI 2/18%
Types of main traumatic brain injuryContusions 4/36%Extra-axial hematomas 4/36%Diffuse axonal injury 3/27%
NCCU length of stay (total269 days)
24 – 9
Hospital mortality at 28 days 27%Median Glasgow OutcomeScale at 6 months
3 (1–5; 3)
HTS bolus per patient 6 (1–31; 6)a
*Second line therapy of high intracranial pressure was accomplishedwith infusion of 0.5 mL/kg of 20% hypertonic saline.
aonly 20% of the administrations were above 11 bolus per individual.SD, standard deviation; APACHE, Acute Physiology and Chronic Health
Evaluation; ISS, Injury Severity Score; TRISS, Trauma Score and the InjurySeverity Score; CT, computed tomography; HTS, hypertonic saline.
2 DIAS ET AL.
NEU-2014-3376-ver9-Dias_1P.3d 08/23/14 12:50pm Page 2
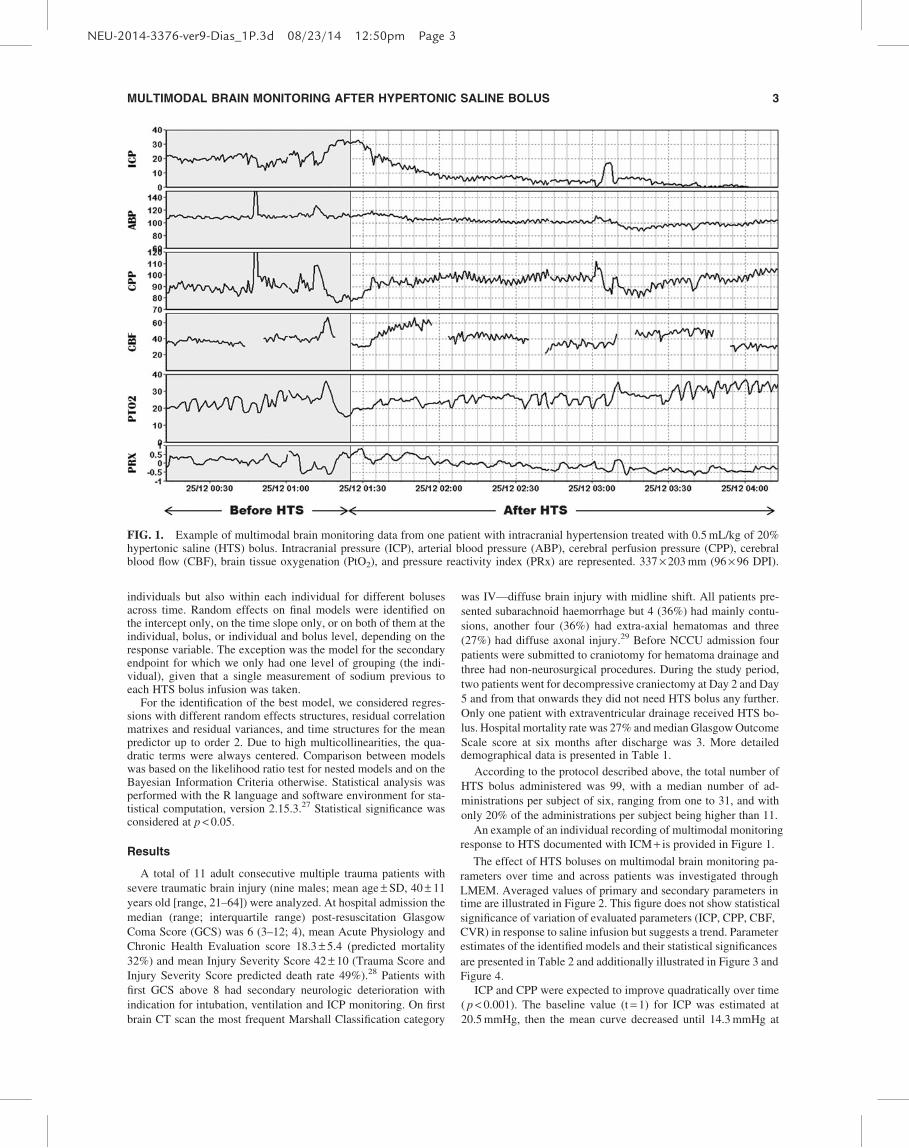
individuals but also within each individual for different bolusesacross time. Random effects on final models were identified onthe intercept only, on the time slope only, or on both of them at theindividual, bolus, or individual and bolus level, depending on theresponse variable. The exception was the model for the secondaryendpoint for which we only had one level of grouping (the indi-vidual), given that a single measurement of sodium previous toeach HTS bolus infusion was taken.
For the identification of the best model, we considered regres-sions with different random effects structures, residual correlationmatrixes and residual variances, and time structures for the meanpredictor up to order 2. Due to high multicollinearities, the qua-dratic terms were always centered. Comparison between modelswas based on the likelihood ratio test for nested models and on theBayesian Information Criteria otherwise. Statistical analysis wasperformed with the R language and software environment for sta-tistical computation, version 2.15.3.27 Statistical significance wasconsidered at p < 0.05.
Results
A total of 11 adult consecutive multiple trauma patients with
severe traumatic brain injury (nine males; mean age – SD, 40 – 11
years old [range, 21–64]) were analyzed. At hospital admission the
median (range; interquartile range) post-resuscitation Glasgow
Coma Score (GCS) was 6 (3–12; 4), mean Acute Physiology and
Chronic Health Evaluation score 18.3 – 5.4 (predicted mortality
32%) and mean Injury Severity Score 42 – 10 (Trauma Score and
Injury Severity Score predicted death rate 49%).28 Patients with
first GCS above 8 had secondary neurologic deterioration with
indication for intubation, ventilation and ICP monitoring. On first
brain CT scan the most frequent Marshall Classification category
was IV—diffuse brain injury with midline shift. All patients pre-
sented subarachnoid haemorrhage but 4 (36%) had mainly contu-
sions, another four (36%) had extra-axial hematomas and three
(27%) had diffuse axonal injury.29 Before NCCU admission four
patients were submitted to craniotomy for hematoma drainage and
three had non-neurosurgical procedures. During the study period,
two patients went for decompressive craniectomy at Day 2 and Day
5 and from that onwards they did not need HTS bolus any further.
Only one patient with extraventricular drainage received HTS bo-
lus. Hospital mortality rate was 27% and median Glasgow Outcome
Scale score at six months after discharge was 3. More detaileddemographical data is presented in Table 1.
According to the protocol described above, the total number of
HTS bolus administered was 99, with a median number of ad-
ministrations per subject of six, ranging from one to 31, and with
only 20% of the administrations per subject being higher than 11.
An example of an individual recording of multimodal monitoring
response to HTS documented with ICM + is provided in Figure 1. The effect of HTS boluses on multimodal brain monitoring pa-
rameters over time and across patients was investigated through
LMEM. Averaged values of primary and secondary parameters intime are illustrated in Figure 2. This figure does not show statistical
significance of variation of evaluated parameters (ICP, CPP, CBF,
CVR) in response to saline infusion but suggests a trend. Parameter
estimates of the identified models and their statistical significances
are presented in Table 2 and additionally illustrated in Figure 3 and
Figure 4.
ICP and CPP were expected to improve quadratically over time
( p < 0.001). The baseline value (t = 1) for ICP was estimated at
20.5 mmHg, then the mean curve decreased until 14.3 mmHg at
FIG. 1. Example of multimodal brain monitoring data from one patient with intracranial hypertension treated with 0.5 mL/kg of 20%hypertonic saline (HTS) bolus. Intracranial pressure (ICP), arterial blood pressure (ABP), cerebral perfusion pressure (CPP), cerebralblood flow (CBF), brain tissue oxygenation (PtO2), and pressure reactivity index (PRx) are represented. 337 · 203 mm (96 · 96 DPI).
MULTIMODAL BRAIN MONITORING AFTER HYPERTONIC SALINE BOLUS 3
NEU-2014-3376-ver9-Dias_1P.3d 08/23/14 12:50pm Page 3

FIG. 2. 95% Confidence intervals for mean values of intracranial pressure (ICP), cerebral perfusion pressure (CPP), cerebralblood flow (CBF), cerebrovascular resistance (CVR), pressure reactivity index (PRx) and cerebral blood flow index(CBFx) at baseline and along time (210 min) after 20% hypertonic saline bolus (0.5 mL/kg).
Table 2. Estimates (and p Values Whenever Adequate) of the Considered Models for Intracranial Pressure (ICP),
Cerebral Perfusion Pressure (CPP), Cerebral Blood Flow (CBF), Cerebrovascular Resistance (CVR),
Brain Tissue Oxygenation (PtO2), Pressure Reactivity Index (PRx), Cerebral Blood Flow Index (CBFx),
Endtidal CO2 (ETCO2) and Serum Sodium
Random-effects (SD)
Variables
Fixed-effects At ID level At bolus level
Intr p value time p value (time-4.5)^2 p value Intr Time Intr Time
ICP 16.89 0.00 - 0.53 0.05 0.34 0.00 . 0.796 1.936 .CPP 87.33 0.07 0.18 0.00 - 0.20 0.00 8.880 . 5.372 .CBF 42.29 0.00 0.39 0.27 - 0.52 0.00 16.715 . 15.251 .CVR 3.33 0.00 0.02 0.55 0.04 0.01 1.893 . 1.324 .PtO2 24.05 0.00 - 0.07 0.25 . . 6.179 . 4.765 .
PRx 0.09 0.31 - 0.01 0.01 . . 0.274 . 0.181 .CBFx 0.09 0.00 - 0.01 0.04 . . . . 0.075 .
ETCO2 29.36 0.00 0.00 0.96 . . 4.004 . 1.512 .Sodium 149.14 0.00 - 0.31 0.21 . . 0.003 . . .
ICP (mm Hg); CPP (mm Hg); CBF (mL/min/100 g); CVR (mm Hg*min*100 g/mL); PtO2 (mm Hg); ETCO2 (mm Hg); Sodium (mEq/L)Intr: Intercept (time-4.5)^2: quadratic term in time had to be centered (around its sample mean) in order to avoid high multicollinearities.SD, standard deviation; ID,
4 DIAS ET AL.
NEU-2014-3376-ver9-Dias_1P.3d 08/23/14 12:50pm Page 4

128 min and afterwards, increased again reaching a final value of
16.8 mm Hg. Simultaneously, we identified a significant decrease
in ICP pulse amplitude ( p < 0.0001) and a modification in ICP pulse
waveform morphology with a decrease in P2/P1 ratio. Spearman’s
correlation assessed the relationship between maximum baseline
ICP levels and magnitude of ICP responses to HTS infusion. Re-
sults revealed that infusions at greater baseline ICP values lead to
more significant responses (rs = 0.29, p < 0.05). Regarding CPP, the
expected (mean) curve was convex with a baseline value of
85.1 mm Hg, a maximum value of 88.2 mm Hg attained at 119 min
and a final value of 86.3 mm Hg (Fig. 3). Time for maximum CVR
and CBF response was shorter than that for CPP. In fact, CVR
decreased significantly from an initial value of 3.8 mm
Hg*min*100 g/mL to 3.4 mm Hg*min*100 g/mL at 97.5 min, then
increased 0.6 mm Hg*min*100 g/mL until the end ( p = 0.01). CBF
baseline values started at 36.3 mL/min/100 g, then significantly
increased to 44.1 mL/min/100 g at 117 min after the HTS bolus and
ended up at a value of 39.0 mL/min/100 g ( p < 0,001) (Fig. 3).
FIG. 3. Estimated mean models for intracranial pressure (ICP), cerebral perfusion pressure (CPP), cerebral blood flow (CBF),cerebrovascular resistance (CVR) and scattergram of all individual values in response to 20% hypertonic saline bolus (0.5 mL/kg). Atotal of 8 consecutive time points were defined (60 min interval for baseline, first 30 min corresponding to drug infusion time, andremaining nonoverlapping consecutive 30 min intervals). CVR decreases to a minimum value of 3.4 mm Hg*min*100 g/mL at 97.5 min.CBF reaches the maximum value of 44.1 mL/min/100 g at 117 min. CPP increases to a maximum value of 88.2 mm Hg at 118 min andfinally ICP decreases to the minimum value of 14.3 mm Hg at 128 min.
MULTIMODAL BRAIN MONITORING AFTER HYPERTONIC SALINE BOLUS 5
NEU-2014-3376-ver9-Dias_1P.3d 08/23/14 12:51pm Page 5

Cerebral vasodilation and improvement of CBF preceded by more
than 2 min the increase of CPP and by 9 min the decrease of ICP. In
the first 90 min the augmentation of CBF reached more than
7.5 mL/min/100 g.
No significant models with linear or quadratic time dependen-
cies could be fitted to PtO2 values.
The time behavior of secondary variables, cerebrovascular
pressure reactivity index (PRx) and cerebral blood flow index
(CBFx), was best described by decreasing linear models. Both
slopes were statistically significant (PRx, p = 0.01; CBFx, p = 0.04).
Autoregulation evaluated with PRx index and CBFx indexes im-
paired during IHT and recovered after HTS bolus staying below
0.2, as represented in figure 4 with empirical 25th and 75th per-
centiles curves.
During HTS infusion, ETCO2 did not suffer any significant
variation ( p = 0.96).
We used 0.5 mL/kg of 20% HTS that corresponds to 6844 mOsm/
Kg and a total amount of 8000 mg of sodium every 40 mL bolus.
With repeated bolus, the majority of patients developed hyperna-
tremia with sodium levels between 146–155 mEq/L, but no statisti-
cally significant difference was found when sodium peak values
were compared with baseline values ( p = 0.21).
Discussion
Effects of hypertonic saline on pressures (ICP and CPP)and cerebrovascular reactivity (PRx and CBFx)
The ICP-lowering effect of HTS has been demonstrated conclu-
sively in previous studies13–15; however, little is known on the effect
of HTS on cerebrovascular reactivity. HTS bolus to treat intracranial
hypertension aims to reduce brain edema and maintain cerebral
perfusion pressure. The osmotic gradient between intravascular and
extravascular compartments draws water out of the brain tissue,
decreasing total brain volume and preserving intravascular volume.
Administration of 20% HTS triggered a relevant decrease in elevated
ICP starting immediately after the first 30 min (end of infusion),
although the reduction of ICP was more pronounced at 120 min.
Mean CPP improved and this improvement lasted for more than 3 h,
which may be explained by HTS osmotic effects on the brain and
systemic hemodynamics.30 We also observed a modification in ICP
pulse waveform along with a decrease in ICP pulse amplitude. To-
gether, all these changes may reveal the sum of effects of HTS on
brain total water content, cerebral blood volume and brain compli-
ance31 Temporary autoregulation impairment related to intracranial
hypertension, significantly recovered after HTS infusion as evalu-
ated with cerebrovascular reactivity indices PRx and CBFx.
Effects of hypertonic saline on cerebral blood flow
In this study, cerebral vascular resistance and cerebral blood
flow changes started during the first 30 min, while HTS bolus was
still being infused. HTS acts as a relaxant on smooth muscle,32
causing an early reduction in cerebrovascular resistance. The
subsequent increase in CBF also may be explained by the rapid
onset of plasma volume expansion induced by the hypertonic so-
lution.16,33,34 HTS also improves CBF by its rheological effects on
red cells and capillary bed.35–37 We stress the brain hemodynamic
properties of HTS as a relevant observation.38 This increase in CBF
−1.
0−
0.5
0.0
0.5
1.0
time (min)
PR
x
baseline 60 90 150 210−
1.0
−0.
50.
00.
51.
0time (min)
CB
Fx
baseline 60 90 150 210
FIG. 4. Mean expected values and correspondent 95% confidence intervals (bold and dotted lines, respectively) and empirical 25thand 75th percentiles (segmented lines) for cerebrovascular pressure reactivity index (PRx) and cerebral blood flow index (CBFx) inresponse to 20% hypertonic saline (HTS) bolus (0.5 mL/kg). A total of 8 consecutive time points were defined (60 min interval forbaseline, first 30 min corresponding to drug infusion time, and remaining nonoverlapping consecutive 30 min intervals). Both PRx andCBFx slopes were statistically significant (PRx, p = 0.01; CBFx, p = 0.04). On average, autoregulation evaluated with PRx and CBFxshowed a slight but steady improvement after HTS infusion.
6 DIAS ET AL.
NEU-2014-3376-ver9-Dias_1P.3d 08/23/14 12:51pm Page 6

may become even more important and vital when ICP is very high
and CPP is below the lower limit of autoregulation approaching
critical closing pressure with a high risk of zero flow.39
Effects of hypertonic saline on cerebral oxygenation
In spite of the positive effect on brain flow and perfusion, brain
tissue oxygenation showed no significant change. We also failed
to demonstrate any relationship between trends in pressures or
flow and brain oxygen levels. Rockswold and colleauges showed
that the effect of HTS treatment on PtO2, although positive, was
not as robust as other brain monitoring parameters.19 It is widely
accepted that fast changes in PtO2 can be interpreted as a surrogate
measure of changes in CBF. In this study, the apparent uncoupling
between CBF and PtO2 may be explained by multifactorial causes
considering high baseline level of PtO2, probes position and HTS
effect on peri-focal tissue. Several studies showed the heteroge-
neity in response of brain tissue oxygenation to different insults in
normal brain and penumbra area.40–43 On the other hand, hyper-
tonic solution decreases total brain water content and total brain
volume44 but may be unable to reduce edema in injured tissue and
may even increase the water content within contusion areas.21,43
Therefore, overall ICP decreases, but pericontusional conditions
may remain unchanged or even get worse, causing dysperfusion
hypoxia45 due to the larger distance between capillaries and
cells.41,42,46
Effects of hypertonic saline and serum sodium levels
Paredes-Andrade and colleagues showed that HTS administra-
tion is as effective in reducing intracranial hypertension at high
serum as at normal levels.47 Other authors stated that higher sodium
levels correlated with lower ICP.48 In our sample, natremia state
did not influence significantly HTS response. Still, the optimal
natremic state for patients with traumatic brain injury is not defined
and remains a controversial issue.49,50
Study limitations and insights for future investigations
In our study, we prospectively analyzed 99 repetitive intracranial
hypertension events treated with HTS bolus, although data were
obtained from only 11 patients with unbalanced needs for HTS
therapy. Due to sample size restrictions, the models evaluated only
the net effect of time at most through quadratic models. Because of
the current standard protocol of management of intracranial hy-
pertension at our institution, HTS administration was done as a
second-tier therapy to treat IHT. In spite of first-tier treatment
standardization, this approach may influence baseline values of
cerebral blood flow and oxygenation.
Further research is required to clarify the influence of probes
position on regional brain monitoring data, best optimal adminis-
tration regimen of HTS, and treatment targets adapted to individual
patient’s brain and systemic monitoring pattern, as well as its im-
pact on morbidity and mortality.
Conclusion
Despite failing to demonstrate a significant increase in brain
regional oxygenation, management of intracranial hypertension
with 20% HTS bolus recovered autoregulation evaluated with ce-
rebrovascular reactivity indexes and improved cerebral hemody-
namics, increasing cerebral blood flow before the rise in perfusion
pressure and decrease in intracranial pressure.
Author Disclosure Statement
Ana Rita Gaio and Ana Paula Rocha were partially funded by the
European Regional Development Fund through the program
COMPETE and by the Portuguese Government through the FCT -
Fundacao para a Ciencia e a Tecnologia under the project PEst-C/
MAT/UI0144/2013.
The software for brain monitoring ICM + (www.neurosurg.cam
.ac.uk/imcplus) is licensed by University of Cambridge (Cambridge Enterprise). Peter Smielewski and Marek Czosnyka have financial interests in a part of the licensing fee. For the other authors, no
conflicting financial interests exist.
APPENDIX
The Choice of the Statistical Methodology
The rationale followed in our statistical analysis was to reduce
the number of hypothesis tests to its minimum and to try to model
all the phenomena at once, thus avoiding inflation of the signifi-
cance level while modeling variability and correlations simulta-
neously within the fitting process. The data came from a
longitudinal prospective study. Therefore, the most adequate
methods for the statistical analysis were those from longitudinal
analysis. Our design had the additional complexity of having two
sources of possible variation—namely, the individual and the bo-
lus. Indeed, variability and nonzero correlations were detected
among different individuals and different boluses within the same
individual by our mixed effects models.
In our situation, no underlying pathophysiologic formula be-
tween the variables of interest was previously known, to the best of
our knowledge. As such, we started the modeling from the simplest
possible model—the linear one. Whenever possible, we went one
step higher and studied quadratic time dependencies. Comparison
across models following standard statistical principles (the likeli-
hood ratio test or the Bayesian Information Criterion, as appro-
priate) were afterwards performed.
References
1. Chesnut, R.M., Temkin, N., Carney, N., Dikmen, S., Rondina, C.,Videtta, W., Petroni, G., Lujan, S., Pridgeon, J., Barber, J., Machamer,J., Chaddock, K., Celix, J.M., Cherner, M., and Hendrix, T. (2012). Atrial of intracranial-pressure monitoring in traumatic brain injury. N.Engl. J. Med. 367, 2471–2481.
2. Chesnut, R.M. (2013). Intracranial pressure monitoring: headstone ora new head start. The BEST TRIP trial in perspective. Intensive CareMed. 39, 771–774.
3. Muehlschlegel, S., Carandang, R., Ouillette, C., Hall, W., Anderson,F., and Goldberg, R. (2013). Frequency and impact of intensive careunit complications on moderate-severe traumatic brain injury: earlyresults of the Outcome Prognostication in Traumatic Brain Injury(OPTIMISM) Study. Neurocrit. Care 18, 318–331.
4. Juul, N., Morris, G.F., Marshall, S.B., and Marshall, L.F. (2000). In-tracranial hypertension and cerebral perfusion pressure: influence on neu-rological deterioration and outcome in severe head injury. The ExecutiveCommittee of the International Selfotel Trial. J. Neurosurg. 92, 1–6.
5. Balestreri, M., Czosnyka, M., Hutchinson, P., Steiner, L.A., Hiler, M.,Smielewski, P., and Pickard, J.D. (2006). Impact of intracranialpressure and cerebral perfusion pressure on severe disability andmortality after head injury. Neurocrit. Care 4, 8–13.
6. Sheth, K.N., Stein, D.M., Aarabi, B., Hu, P., Kufera, J.A., Scalea,T.M., and Hanley, D.F. (2013). Intracranial pressure dose and out-come in traumatic brain injury. Neurocrit. Care 18, 26–32.
7. Stein, D.M., Brenner, M., Hu, P.F., Yang, S., Hall, E.C., Stansbury,L.G., Menaker, J., and Scalea, T.M. (2013). Timing of intracranialhypertension following severe traumatic brain injury. Neurocrit. Care18, 332–340.
MULTIMODAL BRAIN MONITORING AFTER HYPERTONIC SALINE BOLUS 7
NEU-2014-3376-ver9-Dias_1P.3d 08/23/14 12:51pm Page 7
8. Orban, J.C. and Ichai, C. (2007). [Hierarchical strategy for treatingelevated intracranial pressure in severe traumatic brain injury]. Ann.Fr. Anesth. Reanim. 26, 440–444.
9. Rangel-Castillo, L., Gopinath, S., and Claudia S. Robertson (2008). Man-agement of Intracranial Hypertension. Neurology Clinics 26, 521–541.
10. Latorre, J.G. and Greer, D.M. (2009). Management of acute intra-cranial hypertension: a review. Neurologist 15, 193–207.
11. Bourdeaux, C. and Brown, J. (2010). Sodium bicarbonate lowers intra-cranial pressure after traumatic brain injury. Neurocrit. Care, 13, 24–28.
12. Bratton, S.L., Chestnut, R.M., Ghajar, J., McConnell Hammond, F.F.,Harris, O.A., Hartl, R., Manley, G.T., Nemecek, A., Newell, D.W.,Rosenthal, G., Schouten, J., Shutter, L., Timmons, S.D., Ullman, J.S.,Videtta, W., Wilberger, J.E., and Wright, D.W. (2007). Guidelines forthe management of severe traumatic brain injury. II. Hyperosmolartherapy. J. Neurotrauma 24 Suppl 1, S14–S20.
13. Diringer, M.N. (2013). New trends in hyperosmolar therapy? Curr.Opin. Crit. Care 19, 77–82.
14. Mortazavi, M.M., Romeo, A.K., Deep, A., Griessenauer, C.J., Shoja,M.M., Tubbs, R.S., and Fisher, W. (2012). Hypertonic saline fortreating raised intracranial pressure: literature review with meta-analysis. J. Neurosurg. 116, 210–221.
15. Lazaridis, C., Neyens, R., Bodle, J., and DeSantis, S.M. (2013). High-osmolarity saline in neurocritical care: systematic review and meta-analysis. Crit. Care Med. 41, 1353–1360.
16. Tseng, M.Y., Al-Rawi, P.G., Czosnyka, M., Hutchinson, P.J.,Richards, H., Pickard, J.D., and Kirkpatrick, P.J. (2007). Enhancementof cerebral blood flow using systemic hypertonic saline therapy im-proves outcome in patients with poor-grade spontaneous subarachnoidhemorrhage. J. Neurosurg. 107, 274–282.
17. White, H., Cook, D., and Venkatesh, B. (2008). The role of hyper-tonic saline in neurotrauma. Eur. J. Anaesthesiol. Suppl 42, 104–109.
18. Scalfani, M.T., Dhar, R., Zazulia, A.R., Videen, T.O., and Diringer,M.N. (2012). Effect of osmotic agents on regional cerebral blood flowin traumatic brain injury. J. Crit. Care 27, 526 e527–512.
19. Rockswold, G.L., Solid, C.A., Paredes-Andrade, E., Rockswold, S.B.,Jancik, J.T., and Quickel, R.R. (2009). Hypertonic saline and its effecton intracranial pressure, cerebral perfusion pressure, and brain tissueoxygen. Neurosurgery 65, 1035–1041.
20. Oddo, M., Levine, J.M., Frangos, S., Carrera, E., Maloney-Wilensky,E., Pascual, J.L., Kofke, W.A., Mayer, S.A., and LeRoux, P.D. (2009).Effect of mannitol and hypertonic saline on cerebral oxygena-tion in patients with severe traumatic brain injury and refractory in-tracranial hypertension. J. Neurol. Neurosurg. Psychiatry 80, 916–920.
21. Lescot, T., Degos, V., Zouaoui, A., Preteux, F., Coriat, P., and Puy-basset, L. (2006). Opposed effects of hypertonic saline on contusionsand noncontused brain tissue in patients with severe traumatic braininjury. Crit. Care Med. 34, 3029–3033.
22. Aries, M.J., Czosnyka, M., Budohoski, K.P., Steiner, L.A., Lavinio,A., Kolias, A.G., Hutchinson, P.J., Brady, K.M., Menon, D.K., Pick-ard, J.D., and Smielewski, P. (2012). Continuous determination ofoptimal cerebral perfusion pressure in traumatic brain injury. Crit.Care Med. 40, 2456–2463.
23. Brain Trauma Foundation; American Association of NeurologicalSurgeons; Congress of Neurological Surgeons; Joint Section onNeurotrauma and Critical Care, AANS/CNS, Bratton, S.L., Chestnut,R.M., Ghajar, J., McConnell Hammond, F.F., Harris, O.A., Hartl, R.,Manley, G.T., Nemecek, A., Newell, D.W., Rosenthal, G., Schouten,J., Shutter, L., Timmons, S.D., Ullman, J.S., Videtta, W., Wilberger,J.E., and Wright, D.W. (2007). Guidelines for the management ofsevere traumatic brain injury. IX. Cerebral perfusion thresholds. J.Neurotrauma 24 Suppl 1, S59–S64.
24. Smielewski, P., Lavinio, A., Timofeev, I., Radolovich, D., Perkes, I.,Pickard, J.D., and Czosnyka, M. (2008). ICM + , a flexible platform forinvestigations of cerebrospinal dynamics in clinical practice. ActaNeurochir. Suppl 102, 145–151.
25. Brain Trauma, F., American Association of Neurological, S., Congressof Neurological, S., Joint Section on, N., Critical Care, A.C., Bratton,S.L., Chestnut, R.M., Ghajar, J., McConnell Hammond, F.F., Harris,O.A., Hartl, R., Manley, G.T., Nemecek, A., Newell, D.W., Rosenthal,G., Schouten, J., Shutter, L., Timmons, S.D., Ullman, J.S., Videtta,W., Wilberger, J.E., and Wright, D.W. (2007). Guidelines for themanagement of severe traumatic brain injury. VIII. Intracranial pres-sure thresholds. J. Neurotrauma 24 Suppl 1, S55–58.
26. Pinheiro, J. and Bates, D. (2000). Mixed-Effects Models in S and S-PLUS. Springer New York: New York.
27. R Development Core Team. (2011). R: A Language and Environmentfor Statistical Computing. The R Foundation for Statistical Comput-ing: Vienna, Austria.
28. Boyd, C.R., Tolson, M.A., and Copes, W.S. (1987). Evaluating traumacare: the TRISS method. Trauma Score and the Injury Severity Score.J. Trauma 27, 370–378.
29. Saatman, K.E., Duhaime, A.C., Bullock, R., Maas, A.I., Valadka, A.,and Manley, G.T.; Workshop Scientific Team and Advisory PanelMembers. (2008). Classification of traumatic brain injury for targetedtherapies. J. Neurotrauma 25, 719–738.
30. Strandvik, G.F. (2009). Hypertonic saline in critical care: a review ofthe literature and guidelines for use in hypotensive states and raisedintracranial pressure. Anaesthesia 64, 990–1003.
31. Suarez, J.I. (2004). Hypertonic saline for cerebral edema and elevatedintracranial pressure. Cleve. Clin. J. Med. 71 Suppl 1, S9–S13.
32. Roquilly, A., Mahe, P.J., Latte, D.D., Loutrel, O., Champin, P., DiFalco, C., Courbe, A., Buffenoir, K., Hamel, O., Lejus, C., Sebille, V.,and Asehnoune, K. (2011). Continuous controlled-infusion of hyper-tonic saline solution in traumatic brain-injured patients: a 9-year ret-rospective study. Crit. Care 15, R260.
33. Wolf, M.B. (1971). Plasma volume dynamics after hypertonic fluidinfusions in nephrectomized dogs. Am. J. Physiol. 221, 1392–1395.
34. Berger, S., Schurer, L., Hartl, R., Messmer, K., and Baethmann, A.(1995). Reduction of post-traumatic intracranial hypertension by hy-pertonic/hyperoncotic saline/dextran and hypertonic mannitol. Neu-rosurgery 37, 98–107.
35. Shackford, S.R., Zhuang, J., and Schmoker, J. (1992). Intravenous fluidtonicity: effect on intracranial pressure, cerebral blood flow, and cere-bral oxygen delivery in focal brain injury. J. Neurosurg. 76, 91–98.
36. Mazzoni, M.C., Borgstrom, P., Intaglietta, M., and Arfors, K.E.(1990). Capillary narrowing in hemorrhagic shock is rectified by hy-perosmotic saline-dextran reinfusion. Circ. Shock 31, 407–418.
37. Hinson, H.E., Stein, D., and Sheth, K.N. (2013). Hypertonic saline andmannitoltherapyincriticalcareneurology.J.IntensiveCareMed.28,3–11.
38. Tseng, M.Y., Al-Rawi, P.G., Pickard, J.D., Rasulo, F.A., and Kirk-patrick, P.J. (2003). Effect of hypertonic saline on cerebral blood flowin poor-grade patients with subarachnoid hemorrhage. Stroke 34,1389–1396.
39. Varsos, G.V., de Riva, N., Smielewski, P., Pickard, J.D., Brady, K.M.,Reinhard, M., Avolio, A., and Czosnyka, M. (2013). Critical closingpressure during intracranial pressure plateau waves. Neurocrit Care.18, 341–348.
40. Sarrafzadeh, A.S., Kiening, K.L., Bardt, T.F., Schneider, G.H., Un-terberg, A.W., and Lanksch, W.R. (1998). Cerebral oxygenation incontusioned vs. nonlesioned brain tissue: monitoring of PtiO2 withLicox and Paratrend. Acta Neurochir. Suppl 71, 186–189.
41. Sahuquillo, J., Amoros, S., Santos, A., Poca, M.A., Panzardo, H.,Dominguez, L., and Pedraza, S. (2000). Does an increase in cerebralperfusion pressure always mean a better oxygenated brain? A study inhead-injured patients. Acta Neurochir. Suppl 76, 457–462.
42. Gupta, A.K., Hutchinson, P.J., Fryer, T., Al-Rawi, P.G., Parry, D.A.,Minhas, P.S., Kett-White, R., Kirkpatrick, P.J., Mathews, J.C.,Downey, S., Aigbirhio, F., Clark, J., Pickard, J.D., and Menon, D.K.(2002). Measurement of brain tissue oxygenation performed usingpositron emission tomography scanning to validate a novel monitoringmethod. J. Neurosurg. 96, 263–268.
43. Gupta, A.K., Hutchinson, P.J., Al-Rawi, P., Gupta, S., Swart, M.,Kirkpatrick, P.J., Menon, D.K., and Datta, A.K. (1999). Measuringbrain tissue oxygenation compared with jugular venous oxygen satu-ration for monitoring cerebral oxygenation after traumatic brain in-jury. Anesth. Analg. 88, 549–553.
44. Toung, T.J., Nyquist, P., and Mirski, M.A. (2008). Effect of hyper-tonic saline concentration on cerebral and visceral organ water in anuninjured rodent model. Crit. Care Med. 36, 256–261.
45. Siggaard-Andersen, O., Ulrich, A., and Gothgen, I.H. (1995). Classesof tissue hypoxia. Acta Anaesthesiol. Scand. Suppl 107, 137–142.
46. Wisner, D.H., Schuster, L., and Quinn, C. (1990). Hypertonic salineresuscitation of head injury: effects on cerebral water content. J.Trauma 30, 75–78.
47. Paredes-Andrade, E., Solid, C.A., Rockswold, S.B., Odland, R.M., andRockswold, G.L. (2012). Hypertonic saline reduces intracranial hy-pertension in the presence of high serum and cerebrospinal fluid os-molalities. Neurocrit. Care 17, 204–210.
48. Qureshi, A.I., Suarez, J.I., Bhardwaj, A., Mirski, M., Schnitzer, M.S.,Hanley, D.F., and Ulatowski, J.A. (1998). Use of hypertonic (3%)
8 DIAS ET AL.
NEU-2014-3376-ver9-Dias_1P.3d 08/23/14 12:51pm Page 8

saline/acetate infusion in the treatment of cerebral edema: Effect onintracranial pressure and lateral displacement of the brain. Crit. CareMed. 26, 440–446.
49. Wells, D.L., Swanson, J.M., Wood, G.C., Magnotti, L.J., Boucher,B.A., Croce, M.A., Harrison, C.G., Muhlbauer, M.S., and Fabian, T.C.(2012). The relationship between serum sodium and intracranialpressure when using hypertonic saline to target mild hypernatremia inpatients with head trauma. Crit. Care 16, R193.
50. Aiyagari, V., Deibert, E., and Diringer, M.N. (2006). Hypernatremiain the neurologic intensive care unit: how high is too high? J. Crit.Care 21, 163–172.
Address correspondence to:
Celeste Dias, MD
Neurocritical Care Unit, Intensive Care Department
University Hospital Sao Joao, Porto, Portugal
Neurocritical Care Unit, Hospital Sao Joao
Alameda Hernani Monteiro, piso 8
4200-319 Porto, Portugal
E-mail: [email protected]
MULTIMODAL BRAIN MONITORING AFTER HYPERTONIC SALINE BOLUS 9
NEU-2014-3376-ver9-Dias_1P.3d 08/23/14 12:51pm Page 9


111 PUBLICATION V
OPTIMAL CEREBRAL PERFUSION PRESSURE MANAGEMENT AT BEDSIDE:
A SINGLE CENTRE PILOT STUDY
Dias, C, Silva, MJ, Pereira, E, Monteiro E, Maia, I, Barbosa, S, Silva, S,
Honrado, T, Cerejo, A, Aries, M, Smielewski, P, Paiva, J-A, Czosnyka, M
Neurocrit Care. Jan 2015. [Epub ahead of print]


ORIGINAL ARTICLE
Optimal Cerebral Perfusion Pressure Management at Bedside:A Single-Center Pilot Study
Celeste Dias • Maria Joao Silva • Eduarda Pereira • Elisabete Monteiro •
Isabel Maia • Silvina Barbosa • Sofia Silva • Teresa Honrado • Antonio Cerejo •
Marcel J. H. Aries • Peter Smielewski • Jose-Artur Paiva • Marek Czosnyka
� Springer Science+Business Media New York 2015
Abstract
Background Guidelines recommend cerebral perfusion
pressure (CPP) values of 50–70 mmHg and intracranial
pressure lower than 20 mmHg for the management of acute
traumatic brain injury (TBI). However, adequate individual
targets are still poorly addressed, since patients have dif-
ferent perfusion thresholds. Bedside assessment of cerebral
autoregulation may help to optimize individual CPP-gui-
ded treatment.
Objective To assess staff compliance and outcome
impact of a new method of autoregulation-guided treatment
(CPPopt) based on continuous evaluation of cerebrovas-
cular reactivity (PRx).
Methods Prospective pilot study of severe TBI adult
patients managed with continuous multimodal brain mon-
itoring in a single Neurocritical Care Unit (NCCU). Every
minute CPPopt was automatically estimated, based on the
previous 4-h window, as the CPP with the lowest PRx
indicating the best cerebrovascular pressure reactivity.
Patients were managed with CPPopt targets whenever
possible and otherwise CPP was managed following gen-
eral/international guidelines. In addition, other offline
CPPopt estimates were calculated using cerebral oximetry
(COx-CPPopt), brain tissue oxygenation (ORxs-CPPopt),
and cerebral blood flow (CBFx-CPPopt).
Results Eighteen patients with a total multimodal brain
monitoring time of 5,520 h were enrolled. During the total
monitoring period, 11 patients (61 %) had a CPPopt U-shaped
curve, 5 patients (28 %) had either ascending or descending
curves, and only 2 patients (11 %) had no fitted curve. Real
CPP correlated significantly with calculated CPPopt
(r = 0.83, p < 0.0001). Preserved autoregulation was asso-
ciated with greater Glasgow coma score on admission
(p = 0.01) and better outcome (p = 0.01). We demonstrated
that patients with the larger discrepancy (>10 mm Hg)
between real CPP and CPPopt more likely have had adverse
outcome (p = 0.04). Comparison between CPPopt and the
other estimates revealed similar limits of precision. The lowest
bias (-0.1 mmHg) was obtained with COx-CPPopt (NIRS).
Conclusion Targeted individual CPP management at the
bedside using cerebrovascular pressure reactivity seems
feasible. Large deviation from CPPopt seems to be associ-
ated with adverse outcome. The COx-CPPopt methodology
using non-invasive CO (NIRS) warrants further evaluation.
Keywords Traumatic brain injury �Multimodal brain monitoring �Cerebral perfusion pressure �Cerebrovascular pressure reactivity �Optimal cerebral perfusion pressure
C. Dias (&) � E. Pereira � E. Monteiro � I. Maia � S. Barbosa �S. Silva � T. Honrado � J.-A. Paiva
Neurocritical Care Unit, Intensive Care Department, Hospital
Sao Joao, Porto, Portugal
e-mail: [email protected]
M. J. Silva
Diabetes & Nutritional Sciences Division, King’s College,
London, UK
A. Cerejo
Neurosurgery Department, Hospital Sao Joao, Porto, Portugal
M. J. H. Aries
Intensive Care/Critical Care Unit, Universitair Medisch
Centrum, Groningen, The Netherlands
P. Smielewski � M. Czosnyka
Division of Neurosurgery, Department of Clinical
Neurosciences, Addenbrooke’s Hospital, Cambridge, UK
123
Neurocrit Care
DOI 10.1007/s12028-014-0103-8

Introduction
Traumatic brain injury (TBI) is a major cause of death and
disability among young individuals and worse outcome is
associated with ongoing secondary insults [1, 2]. Current
Brain Trauma Foundation (BTF) guidelines regarding the
management of patients after TBI include the reduction of
intracranial pressure (ICP) below 20 mmHg [3] and
maintenance of cerebral perfusion pressure (CPP) between
50 and 70 mmHg [4]. Worldwide, several TBI manage-
ment protocols are based on a combination of CPP-oriented
[5] and ICP-oriented [6] therapy. Although the idea of
avoiding global hypo- and hyper-brain perfusion was an
important step in the management of TBI patients, this
approach is likely an oversimplification of the complex
secondary pathophysiology. Fixed thresholds may be not
compatible with broad heterogeneity of post-TBI brain
damage (contusion, hematoma, subarachnoid hemorrhage,
and diffuse axonal injury) [7]. The first author of the BEST
TRIP trial [8] commented in another article that ‘‘the
strongest clinical implication of the results is that we
shouldn’t abandon ICP monitoring but to refine its role in
TBI management’’ and emphasized the need to develop
‘‘clinical methods for interpreting ICP in the setting of
individual patient care’’ [9].
Cerebral autoregulation of cerebral blood flow (CBF) is
pivotal to the maintenance of normal brain function [10,
11]. Impaired autoregulation leads to secondary damage
and is an independent predictor of fatal outcome following
TBI [12]. The goal of ‘real-time’ continuous cerebral
autoregulation monitoring is to enable the early detection
of potentially harmful events before they cause irreversible
damage [13]. Modern computer signal processing of
waveforms obtained from multimodal brain monitoring
allows calculation of cerebrovascular reactivity indices and
therefore evaluation of trends of cerebral autoregulation at
bedside [12]. Autoregulation indices based on ICP (PRx)
but also other variables included in multimodal brain
monitoring scheme: brain tissue oxygenation (ORxs),
cerebral oximetry (COx), and cerebral blood flow (CBFx)
may be all helpful in defining optimal therapeutic strate-
gies [14]. Recent clinical TBI studies demonstrated that an
‘‘optimal’’ CPP can be calculated at bedside retrospec-
tively, based on continuous evaluation of PRx [12, 15–17].
This flexible target value was called CPPopt and may
differ individually, and vary over time. Importantly,
deviation for this calculated value was associated with bad
outcome [17–21]. Since the end of 2011, we have intro-
duced a pragmatic TBI treatment protocol in our academic
NCCU that uses CPPopt instead of the fixed range of CPP
advised by the BTF guidelines.
The main aim of this pilot study was to investigate the
feasibility of a pragmatic method of CPPopt-guided therapy
in severe TBI patients with multimodal brain monitoring. In
addition, we evaluated the impact of this new approach on
mortality figures. As a secondary aim, we assessed the
agreement between online CPPopt (PRx) calculated at
bedside and new offline CPPopt estimates retrospectively
calculated based on ORxs, COx, and CBFx indices.
Materials and Methods
Type of Study
Retrospective analysis of monitoring records of prospective
data collected from a cohort of consecutive severe TBI
patients and clinical indication for multimodal brain
monitoring. Exclusion criteria included age less than
18 years old and pregnancy. The local research ethics
committee approved the protocol and anonymized data
collection. Written informed consent from the next of kin
was obtained.
Patients
Eighteen consecutive adult multiple-trauma patients with
severe TBI admitted to the NCCU at Hospital Sao Joao,
Porto, Portugal were included in the period between July
2011 and January 2013. Postresuscitation Glasgow Coma
Scale (GCS) was used to determine baseline neurological
status. Overall disease severity and mortality prediction on
admission was calculated with Simplified Acute Physiol-
ogy Score II (SAPS II). Brain CT characteristics of TBI
were classified with the Marshall score [22]. Outcome at
6 months after hospital discharge was assessed with
Glasgow Outcome Scale (GOS = 1 death, GOS = 2 per-
sistent vegetative state, GOS = 3 severe disability,
GOS = 4 moderate disability, GOS = 5 good recovery)
[23].
Multimodal Brain Monitoring
Patients were continuously monitored with ECG, heart
rate (HR), invasive arterial blood pressure (ABP), pulse
oximetry (SpO2), end-tidal CO2 (ETCO2), ICP, CPP,
bilateral transcutaneous cerebral oximetry with near-
infrared spectroscopy (NIRS), brain tissue oxygenation
(PbtO2), and cerebral blood flow (CBF). Real-time cere-
brovascular pressure reactivity index (PRx) and CPPopt
were calculated and displayed at the bedside. We worked
with Philips Intellivue MP70 multiparameter monitor
(Philips medical systems, Eindhoven, the Netherlands) to
acquire systemic variables and calculation of CPP, NIRS
sensors for cerebral oximetry (CO in %) with INVOS
5100C (Covidien, Mansfield, USA), intraparenchymal ICP
Neurocrit Care
123

probe with bolt from Codman (DePuySinthes, Massa-
chusetts, USA) and a second triple bolt for
intraparenchymal CBF thermal QFlow 500 Bowman flow
sensor (CBF in ml/min/100 g) from Hemedex (Hemedex,
Cambridge, USA), and PbtO2 (in mmHg) and brain
temperature (in �C) sensors with Licox (Integra, Plains-
boro, USA). We used ICM+ software, version 8.0 (http://
www.neurosurg.cam.ac.uk/pages/ICM) to collect data
(200 Hz) and to calculate autoregulation estimate (PRx)
and associated variable (CPPopt) [24].
Real-Time Bedside Calculation
Ten seconds averages of the physiological variables HR,
ABP, ICP, CPP, CO, PbtO2, and CBF were calculated. PRx
was calculated as the Pearson correlation coefficient using
10 s averages of ICP and ABP over a moving window of
5 min length with 80 % overlap [25]. CPPopt was deter-
mined in individual patients as described by the recent-
published method of Aries et al. [17]. A parabolic curve is
fitted automatically to the processed CPP-PRx error bar
plot using the past 4 h of ICP/ABP data to construct the
CPPopt curve. Besides a curve, the software generates
automatically a CPPopt value that is continuously dis-
played at the bedside and both are updated every minute.
Our institutional protocol indicated that this value was used
to guide CPP in each individual patient at short-term
intervals. In addition to the method of Aries et al., we
formulated three extra criteria before accepting the sug-
gested automatic-displayed CPPopt value: (a) at least 75 %
of time good recordings of ABP and ICP values had to be
available in the 4-h calculation window, (b) average PRx
values had to be <0.25 the past 4 h (defined as a period
with intact cerebrovascular pressure reactivity) [26], and
(c) dedicate the staff to study the CPPopt curve and over-
rule the automatic CPPopt value and take the CPP value
with the most negative PRx value covered by the curve.
U-shaped, ascending, and descending curves were accepted
in case the overall PRx < 0.25. An illustrative example is
shown in Fig. 1.
Algorithm of TBI Management
During the study period, all patients were sedated with
continuous infusions of propofol and/or midazolam and
fentanyl to achieve a Richmond Agitation–Sedation Scale
(RASS) score between zero and -5 [27] and adequate
analgesia. Artificial ventilation was applied with lung
protective criteria, PaCO2 levels between 35 and
40 mmHg, and PaO2 > 90 mmHg. At our NCCU, patients
are treated with 30� head up elevation and CPP is contin-
uously calculated with ABP transducer located at heart
level [28].
CPP Management
When possible, we guided CPP management using the
bedside CPPopt values. When CPPopt was not available,
we kept CPP between 50 and 70 mmHg in accordance to
BTF Guidelines [29]. See examples presented in Fig. 2.
To achieve higher CPPopt values, volume expansion in
combination with norepinephrine were used at the dis-
cretion of the physician in charge; lower CPPopt values
with decreasing vasopressor therapy, treating intracranial
hypertension or increasing sedation.
Intracranial Hypertension Management
ICP above 20 mmHg was treated initially with first-tier
therapy (deep sedation, paralysis, normothermia, mild
hyperventilation, and when possible cerebral spinal fluid
drainage after insertion of extra ventricular drain). If ICP
remained above 20 mmHg for more than 20 min, osmo-
therapy was administered (mannitol or hypertonic saline
bolus). In cases of refractory intracranial hypertension,
second-tier therapy (hypothermia, profound hyperventila-
tion, and surgical decompression) was applied [30]. Further
details of the NCCU protocol are presented in the
‘‘Appendix’’ section (Fig. 5).
Retrospective Post Hoc Offline Calculations
Retrospectively, using raw data stored on the hard disk,
we calculated analogically to the PRx index, 5 min
moving correlation coefficients between CPP and PbtO2
(short oxygen reactivity index (ORxs)), CO (cerebral
oximetry index (COx)), and CBF (CBFx) with 80 %
overlap. Similarly, using the CPPopt curve-fitting
approach, we calculated offline CPPopt according to
ORxs (ORxs-CPPopt), COx (COx-CPPopt), and CBFx
(CBFx-CPPopt).
Statistical and data analysis
We used the R language and environment software for
statistical computing [31]. Continuous variables were
expressed as mean values with standard deviations
(mean ± SD) or medians and interquartile range
(med ± IQR). Discrete variables were presented as counts
or percentage. We calculated the total monitoring time for
all monitoring variables, the percentage of time during
which cerebral vasoreactivity was impaired (defined as
PRx > 0.25) [26], percentage of time CPPopt was calcu-
lated, and finally the percentage of time during which CPP
was below and above CPPopt. Outcome was dichotomized
into GOS C 3 and GOS < 3.
Neurocrit Care
123

Normal distribution of all variables was tested with the
Shapiro–Wilk test. The non-parametrical statistical method
Mann–Whitney–Wilcoxon was applied to calculate differ-
ences between continuous variables with non-normal
distribution or unequal variance.
To evaluate the feasibility of our pragmatic CPPopt-
guided protocol, we calculated the correlation between
averaged patients’ real CPP and the automatic CPPopt and
the limits of agreement using the approach suggested by
Bland and Altman [32]. We defined that in case the dif-
ference between the averaged flexible CPP target (CPPopt)
and averaged patients’ CPP (real CPP) was within
5 mmHg; a satisfactory and clinically significant result was
reached.
For our secondary aim, we compared the CPPopt value
evaluated with PRx and the ones with the three other
cerebrovascular reactivity indexes (COx-CPPopt, CBFx-
CPPopt, and ORxs-CPPopt) using the Bland–Altman
method. We defined a difference of 5 mmHg as evidence
of good agreement between multi-modality results [15, 17].
Tests were considered statistically significant for two-sided
p values <0.05.
Results
Demographic Data
The study population included 18 patients (16 males,
89 %) with mean age of 42 (SD 16) years old. The median
baseline GCS was 6 (IQR 3) and 3 patients with GCS > 8
had subsequent deterioration requiring intensive care
treatment. The mean SAPSII was 45 with predicted mor-
tality of 36 %. Mean length of stay (LOS) in the NCCU
and hospital was 26 (SD 12) and 53 days (SD 37),
respectively. Mortality rate at 28 days was 17 % and
median GOS at 6 month was 3. More detailed clinical
information is available in ‘‘Appendix’’ section.
Monitoring Data of Whole Period
The total monitoring time with median and IQR numbers in
brackets was for ICP and CPP 5521 h (283;169), for CO
4229 h (214;137), for PbtO2 4048 h (203;129), and for
CBF 2339 h (119;107). Mean values for the physiological
variables were ICP 13 (SD 4) mmHg, ABP 99 (SD 6)
Fig. 1 Screenshot of ICM+� panel with 4-h-trend charts for visual
decision of optimal cerebral perfusion pressure according to pressure
reactivity index (CPPopt). First chart: cerebral perfusion pressure
(CPP) and intracranial pressure (ICP); second chart: pressure
reactivity index (PRx); third chart: PRx/CPP plot for evaluating
CPPopt; and fourth chart: percentage of 4-h time spent within CPP
interval. Criteria of decision for optimal CPP based on visual analysis
of ICM+ cbarts: (first chart) 4-h-trend with more than 75 % of
reliable CPP and ICP data; (second chart) PRx < 0.25; (third chart)
CPP curve with PRx < 0.25 and CPPopt defined as 82.5mmHg;
(fourth chart) CPP targeted according to CPPopt
Neurocrit Care
123

Fig. 2 Three screenshots of
ICM+� panel with 4-h-trend
charts for visual decision of
optimal cerebral perfusion
pressure according to pressure
reactivity index (CPPopt). First
chart cerebral perfusion
pressure (CPP) and intracranial
pressure (ICP); second chart
pressure reactivity index (PRx);
third chart PRx/CPP plot for
evaluating CPPopt; fourth chart
percentage of 4-h time spent
within CPP interval. a Patient
with PRx > 0.25 reflecting
autoregulation impairment. CPP
was targeted according to Brain
Trauma Foundation guidelines.
b Patient with PRx < 0.25 and
descending curve. CPP was
target to the highest value of
CPP/PRx plot (97.5 mmHg).
c Patient with PRx < 0.25 and
ascending curve. CPP was
targeted to the lowest value of
CPP/PRx plot (92.5 mmHg)
Neurocrit Care
123

mmHg, CPP 86 (SD 5) mmHg, CO 56 (SD 19) %, PbtO2
25 (SD 8) mmHg, and CBF 39 (SD 21) ml/min/100 g.
For CPPopt calculations, the following mean values were
obtained: CPPopt 88 (SD 7) mmHg and the percentage of
time CPPopt calculation that was available was CPPopt
59 % (IQR 13 %). Eleven patients (61 %) had a CPPopt
U-shaped curve, 5 patients (28 %) had either ascending or
descending curves, and in 2 patients (11 %) no fitted curve
could be defined looking at the total monitoring period.
The mean values of CPP calculated with the other
indices were COx-CPPopt 88 (SD 7) mmHg, ORxs-CPPopt
85 (SD 6) mmHg, and CBFx-CPPopt 85 (SD 6) mmHg.
The percentages of time CPPopt calculation, according to
these indices that were available were 29 % (IQR 17 %)
for ORxs-CPP, 22 % (IQR 29 %) for COx-CPP, and 23 %
(IQR 19 %) for CBFx-CPP.
PRx and Autoregulation
When we separated the patients into those with pre-
served cerebrovascular pressure reactivity (PRx < 0.25,
n = 15) and those with impaired cerebrovascular reac-
tivity (PRx > 0.25, n = 3), the mean PRx in the first
group was -0.04 (SD 0.13) and in the second group was
0.29 (SD 0.04). The median percentage of time patients
in the preserved group spent with impaired cerebrovas-
cular pressure reactivity was 24 % (IQR 16 %) compared
to 55 % (IQR 3 %) in the impaired group (p = 0.007).
Patients in the preserved group had significantly higher
GOS compared to the ones with impaired cerebrovas-
cular reactivity (p = 0.01). There were no differences in
age, SAPSII, and Marshall scores, but patients with
overall preserved cerebrovascular pressure reactivity
presented with significantly higher GCS (p = 0.01)
(Table 1).
CPPopt and Outcome
The median fraction of time spent with impaired cerebro-
vascular pressure reactivity (% of time PRx > 0.25) was
greater in patients with adverse outcome (GOS < 3)
(median 54 % vs 24 %, p = 0.06). Mean real CPP in
patients with GOS < 3 was significantly lower than
CPPopt when compared to mean real CPP in those with
GOS C 3 (87 mmHg vs 103 mmHg, respectively,
p = 0.04). In the group with adverse outcome, the median
difference between real CPP and CPPopt was -6.6 mmHg
(IQR 5.3), compared to the median difference of
-1.0 mmHg (IQR 5.8) in the group with GOS C 3
(p = 0.04) (Fig. 3).
Table 1 Demographic characteristics, monitoring variables, and cerebrovascular pressure reactivity (CV reactivity) status of enrolled patients
CV reactivity
preserved PRx < 0.25
CV reactivity
impaired PRx > 0.25
p value Total
No. patients (%) 15 (83 %) 3 (17 %) – 18
Age years (mean ± SD) 40 ± 16 52 ± 11 0.173 42 ± 16
SAPS II (mean ± SD) 42 ± 10 48 ± 8 0.172 45 ± 10
GCS median (IQR) 7 (4) 4 (2) 0.014 6 (3)
CT Marshall score median (IQR) 3 (3) 4 (2) 0.806 4 (4)
GOS at 6 monts median (IQR) 4 (1) 1 (1) 0.014 3 (2)
ABP mmHg (mean ± SD) 98.7 ± 6.6 97.4 ± 3.5 0.678 98.5 ± 6.1
ICP mmHg (mean ± SD) 12.1 ± 3.7 12.4 ± 5.7 0.912 12.1 ± 3.9
CPP mmHg (mean ± SD) 86.2 ± 5.3 85.0 ± 4.6 0.906 86.0 ± 5.1
PbtO2 mmHg (mean ± SD) 25.6 ± 7.8 23.2 ± 6.2 0.427 25.1 ± 7.5
CO % (mean ± SD) 57.8 ± 8.2 48.0 ± 6.5 0.300 56 ± 8.6
CBF ml/100 g/min (mean ± SD) 39.0 ± 20.9 36.3 ± 22.2 0.953 38.5 ± 20.5
ETCO2 mmHg (mean ± SD) 30.1 ± 3.0 31.7 ± 1.2 0.109 30.4 ± 2.8
PRx (mean ± SD) -0.04 ± 0.13 0.29 ± 0.04 0.003 0.01 ± 0.17
CPPopt mmHg (mean ± SD) 87.5 ± 7.7 91.7 ± 5.2 0.374 88.2 ± 7.4
% time PRx > 0.25 median (IQR) 23.4 (15.5) 55.4 (2.8) 0.007 25.4 (29.3)
Bold values are statistically significant
SAPS II Simplified Acute Physiology Score II, GCS Glasgow coma score, GOS Glasgow outcome score, CT Marshall score first head CT
classification, ABP mean arterial blood pressure, ICP intracranial pressure, CPP cerebral perfusion pressure, PbtO2 brain tissue oxygenation, CO
cerebral oximetry, CBF cerebral blood flow, ETCO2 endtidal CO2, PRx pressure reactivity index, CPPopt optimal CPP according to PRx, and %
time PRx > 0.25 percentage of time with PRx > 0.25, IQR interquartile range, SD standard deviation
p value for Mann–Whitney U test
Neurocrit Care
123
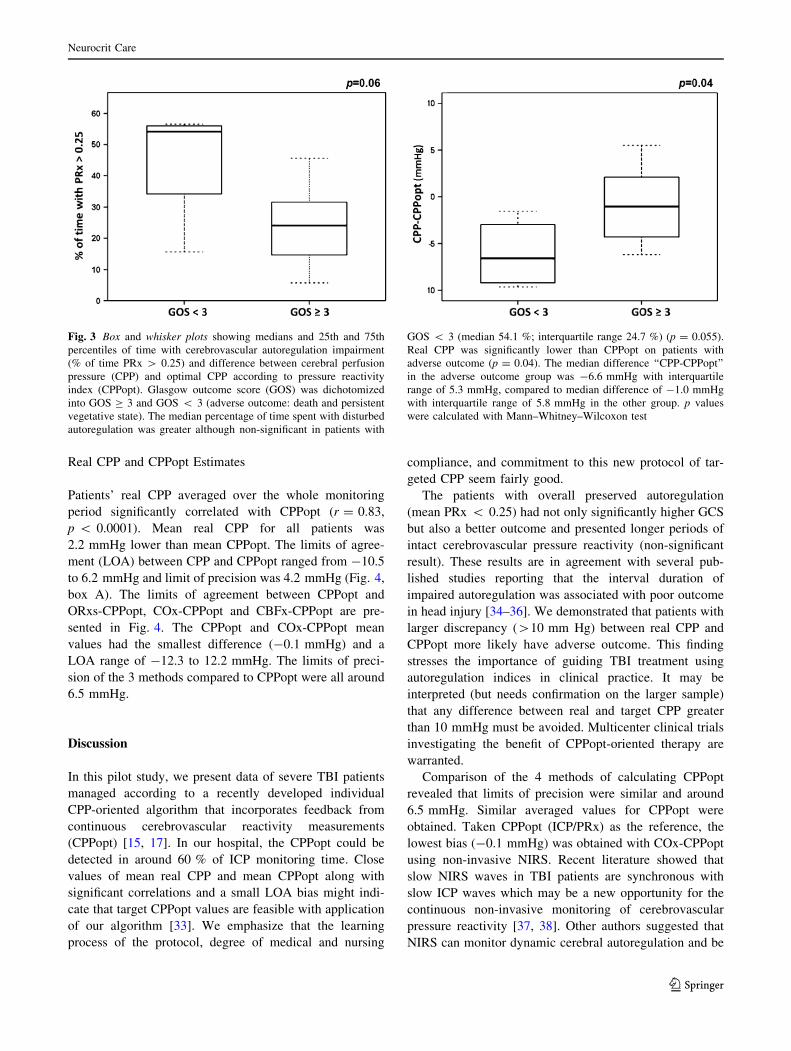
Real CPP and CPPopt Estimates
Patients’ real CPP averaged over the whole monitoring
period significantly correlated with CPPopt (r = 0.83,
p < 0.0001). Mean real CPP for all patients was
2.2 mmHg lower than mean CPPopt. The limits of agree-
ment (LOA) between CPP and CPPopt ranged from -10.5
to 6.2 mmHg and limit of precision was 4.2 mmHg (Fig. 4,
box A). The limits of agreement between CPPopt and
ORxs-CPPopt, COx-CPPopt and CBFx-CPPopt are pre-
sented in Fig. 4. The CPPopt and COx-CPPopt mean
values had the smallest difference (-0.1 mmHg) and a
LOA range of -12.3 to 12.2 mmHg. The limits of preci-
sion of the 3 methods compared to CPPopt were all around
6.5 mmHg.
Discussion
In this pilot study, we present data of severe TBI patients
managed according to a recently developed individual
CPP-oriented algorithm that incorporates feedback from
continuous cerebrovascular reactivity measurements
(CPPopt) [15, 17]. In our hospital, the CPPopt could be
detected in around 60 % of ICP monitoring time. Close
values of mean real CPP and mean CPPopt along with
significant correlations and a small LOA bias might indi-
cate that target CPPopt values are feasible with application
of our algorithm [33]. We emphasize that the learning
process of the protocol, degree of medical and nursing
compliance, and commitment to this new protocol of tar-
geted CPP seem fairly good.
The patients with overall preserved autoregulation
(mean PRx < 0.25) had not only significantly higher GCS
but also a better outcome and presented longer periods of
intact cerebrovascular pressure reactivity (non-significant
result). These results are in agreement with several pub-
lished studies reporting that the interval duration of
impaired autoregulation was associated with poor outcome
in head injury [34–36]. We demonstrated that patients with
larger discrepancy (>10 mm Hg) between real CPP and
CPPopt more likely have adverse outcome. This finding
stresses the importance of guiding TBI treatment using
autoregulation indices in clinical practice. It may be
interpreted (but needs confirmation on the larger sample)
that any difference between real and target CPP greater
than 10 mmHg must be avoided. Multicenter clinical trials
investigating the benefit of CPPopt-oriented therapy are
warranted.
Comparison of the 4 methods of calculating CPPopt
revealed that limits of precision were similar and around
6.5 mmHg. Similar averaged values for CPPopt were
obtained. Taken CPPopt (ICP/PRx) as the reference, the
lowest bias (-0.1 mmHg) was obtained with COx-CPPopt
using non-invasive NIRS. Recent literature showed that
slow NIRS waves in TBI patients are synchronous with
slow ICP waves which may be a new opportunity for the
continuous non-invasive monitoring of cerebrovascular
pressure reactivity [37, 38]. Other authors suggested that
NIRS can monitor dynamic cerebral autoregulation and be
Fig. 3 Box and whisker plots showing medians and 25th and 75th
percentiles of time with cerebrovascular autoregulation impairment
(% of time PRx > 0.25) and difference between cerebral perfusion
pressure (CPP) and optimal CPP according to pressure reactivity
index (CPPopt). Glasgow outcome score (GOS) was dichotomized
into GOS C 3 and GOS < 3 (adverse outcome: death and persistent
vegetative state). The median percentage of time spent with disturbed
autoregulation was greater although non-significant in patients with
GOS < 3 (median 54.1 %; interquartile range 24.7 %) (p = 0.055).
Real CPP was significantly lower than CPPopt on patients with
adverse outcome (p = 0.04). The median difference ‘‘CPP-CPPopt’’
in the adverse outcome group was -6.6 mmHg with interquartile
range of 5.3 mmHg, compared to median difference of -1.0 mmHg
with interquartile range of 5.8 mmHg in the other group. p values
were calculated with Mann–Whitney–Wilcoxon test
Neurocrit Care
123

used for autoregulation-guided therapy [39–42]. However,
CPPopt calculation with non-invasive CO (NIRS) needs
further evaluation.
Study Limitations
This study is single center and has a small sample size.
Still, it is a prospective pilot study of CPPopt-oriented
therapy in TBI patients, which results allow authors to
envisage further assessment in larger cohorts, with time
series analysis and finer discrimination of outcome. The
CPPopt window of the ICM+ is updated every minute
and the team tried to follow the target value as close as
possible. However, the patient’s records did not have
information about how often the CPP was modified by
the staff, and therefore, staff compliance to the algorithm
was assessed only with indirect information about CPP,
CPPopt, the difference between them, and the percentage
of time autoregulation was disturbed. At our NCCU,
CPP is continuously calculated with ABP transducer
located and calibrated at heart level, and consequently,
CPP calculated values have to be interpreted according
to head elevation of 308 (the difference in CPP for ABP
measured at heart level is 11 mmHg) [28]. Thus, the
obtained mean CPP value of 86.0 ± 5.1 mmHg should
be probably adjusted to 75 mmHg. Additionally, in 2
patients, we were unable to define all period CPPopt.
One possible cause for failing to define it was the nar-
row range of CPP variation. However, the most frequent
cause for intermittent CPPopt failure was periodic
intervals of autoregulation impairment with positive
values of PRx. As stressed by Lazaridis et al. [43]
Fig. 4 Bland Altman plot for the comparison of mean paired cerebral
perfusion pressure (CPP) and optimal CPP (CPPopt) plotted against
their mean difference. Limits of agreement range between the lower
and upper 95 % confidence interval (CI) and limits of precision
within one standard deviation (SD) of the mean. a CPP and CPPopt
(CPP evaluated with cerebrovascular pressure reactivity index). The
CPP and CPPopt average bias was -2.2 mmHg (-10.5 to
+6.2 mmHg). Limit of precision 4.2 mmHg. b CPPopt and COx-
CPPopt (cerebral oximetry index). The CPPopt and COx-CPPopt
average bias was -0.1 (-12.3 to +12.2 mmHg). Limit of precision
6.3 mmHg. c CPPopt and ORxs-CPPopt (oxygen reactivity index
short). The optCPPprx and optCPPorxs average bias was +3.7 mmHg
(-9.3 to 16.8 mmHg). Limit of precision 6.7 mmHg. d CPPopt and
CBFx-CPPopt (cerebral blood flow index). The CPPopt and CBFx-
CPPopt average bias was 4.5 mmHg (-7.4 to 16.3 mmHg). Limit of
precision 6.0 mmHg
Neurocrit Care
123

autoregulation is not an ‘‘all or nothing’’ phenomenon
with a very dynamic nature, not only across patients but
also within patients over time. Indeed, in our study, even
patients with preserved autoregulation had PRx > 0.25
approximately during 25 % of monitoring time.
Conclusion
The results of this pilot study with severe TBI patients
showed that targeted CPP management at bedside with
evaluation of cerebrovascular pressure reactivity seems
overall feasible. Patients managed at averaged real CPP
close to CPPopt seem to have better outcome. The meth-
odology for CPPopt calculation with non-invasive CO
(NIRS) warrants further evaluation.
Acknowledgments Authors would especially like to thank all the
NCCU Nursing staff for their motivation in learning the optimal CPP
algorithm and for the commitment to its correct application.
Conflict of interest The software for brain monitoring ICM+
(www.neurosurg.cam.ac.uk/imcplus) is licensed by the University of
Cambridge (Cambridge Enterprise). Peter Smielewski and Marek
Czosnyka have financial interests in a part of the licensing fee. All
other authors declare that they have no conflict of interest.
Appendix
The initial CT-scan Marshall classification distribution was
6 patients with diffuse injury type II, 3 patients with diffuse
injury type III, 4 patients with diffuse injury type IV, and 5
Fig. 5 Neurocritical Care Unit (NCCU) protocol for Traumatic Brain
Injury and Intracranial Hypertension Management. Optimal Cerebral
Perfusion Pressure (CPPopt) evaluated continuously at bedside with
cerebrovascular reactivity index and Intracranial Pressure (ICP)
control below 20 mmHg are primary targets. EKG electrocardiogram,
SpO2 pulse oximetry, ETCO2 endtidal carbon dioxide, ABP arterial
blood pressure, CVP central venous pressure, ICP intracranial
pressure, ICM+ multimodal brain monitoring software, NIRS cerebral
oximetry with near-infrared light, PbtO2 brain tissue oxygen pressure,
TDF-CBF thermal diffusion cerebral blood flow, EEG electroen-
cephalogram, BIS bispectral index, CPP cerebral perfusion pressure,
CPPopt optimal CPP, PaO2 arterial oxygen pressure, PaCO2 arterial
carbon dioxide pressure, Temp temperature, RASS Richmond agita-
tion–sedation scale, BPS behavioral pain scale, Na+ serum sodium,
CT computerized tomography, CSF cerebral spinal fluid
Neurocrit Care
123

patients with non-evacuated lesions. Before NCCU
admission, 4 patients were submitted to craniotomy for
hematoma drainage, 3 patients needed early decompres-
sion, and 3 had non-neurosurgical procedures. During
NCCU stay, 1 patient had an extraventricular drainage and
2 more patients went for late decompression due to
refractory intracranial hypertension.
NCCU protocol for Traumatic Brain Injury and
Intracranial Hypertension Management is presented in
Fig. 5.
References
1. Stahel PF, Smith WR, Moore EE. Hypoxia and hypotension, the
‘‘lethal duo’’ in traumatic brain injury: implications for prehos-
pital care. Intensive Care Med. 2008;34:402–4.
2. Jeremitsky E, Omert L, Dunham CM, Protetch J, Rodriguez A.
Harbingers of poor outcome the day after severe brain injury:
hypothermia, hypoxia, and hypoperfusion. J Trauma. 2003;54:
312–9.
3. Bratton SL, Chestnut RM, Ghajar J, et al. Guidelines for
the management of severe traumatic brain injury. VIII. Intra-
cranial pressure thresholds. J Neurotrauma. 2007;24(Suppl 1):
S55–8.
4. Trauma F, American Association of Neurological S, Congress of
Neurological S, et al. Guidelines for the management of severe
traumatic brain injury. IX. Cerebral perfusion thresholds. J Neu-
rotrauma. 2007;24(Suppl 1):S59–64.
5. Rosner MJ, Rosner SD, Johnson AH. Cerebral perfusion pressure:
management protocol and clinical results. J Neurosurg.
1995;83:949–62.
6. Grande PO. The Lund concept for the treatment of patients with
severe traumatic brain injury. J Neurosurg Anesthesiol.
2011;23:358–62.
7. Saatman KE, Duhaime AC, Bullock R, et al. Classification of
traumatic brain injury for targeted therapies. J Neurotrauma.
2008;25:719–38.
8. Chesnut RM. Intracranial pressure monitoring: headstone or a
new head start. The BEST TRIP trial in perspective. Intensive
Care Med. 2013;39:771–4.
9. Chesnut RM, Temkin N, Carney N, et al. A trial of intracranial-
pressure monitoring in traumatic brain injury. N Engl J Med.
2012;367:2471–81.
10. Tzeng YC, Ainslie PN. Blood pressure regulation IX: cerebral
autoregulation under blood pressure challenges. Eur J Appl
Physiol. 2013. doi:10.1007/s00421-013-2667-y.
11. Paulson OB, Strandgaard S, Edvinsson L. Cerebral autoregula-
tion. Cerebrovasc Brain Metab Rev. 1990;2:161–92.
12. Czosnyka M, Brady K, Reinhard M, Smielewski P, Steiner LA.
Monitoring of cerebrovascular autoregulation: facts, myths, and
missing links. Neurocrit Care. 2009;10:373–86.
13. Rangel-Castilla L, Gasco J, Nauta HJ, Okonkwo DO, Robertson
CS. Cerebral pressure autoregulation in traumatic brain injury.
Neurosurg Focus. 2008;25:E7.
14. Zweifel C, Dias C, Smielewski P, Czosnyka M. Continuous time-
domain monitoring of cerebral autoregulation in neurocritical
care. Med Eng Phys. 2014;36:638–45.
15. Steiner LA, Czosnyka M, Piechnik SK, et al. Continuous moni-
toring of cerebrovascular pressure reactivity allows determination
of optimal cerebral perfusion pressure in patients with traumatic
brain injury. Crit Care Med. 2002;30:733–8.
16. Zweifel C, Lavinio A, Steiner LA, et al. Continuous monitoring
of cerebrovascular pressure reactivity in patients with head
injury. Neurosurg Focus. 2008;25:E2.
17. Aries MJ, Czosnyka M, Budohoski KP, et al. Continuous deter-
mination of optimal cerebral perfusion pressure in traumatic brain
injury. Crit Care Med. 2012;40:2456–63.
18. Rasulo FA, Girardini A, Lavinio A, et al. Are optimal cerebral
perfusion pressure and cerebrovascular autoregulation related to
long-term outcome in patients with aneurysmal subarachnoid
hemorrhage? J Neurosurg Anesthesiol. 2012;24:3–8.
19. Diedler J, Sykora M, Rupp A, et al. Impaired cerebral vasomotor
activity in spontaneous intracerebral hemorrhage. Stroke.
2009;40:815–9.
20. Jaeger M, Schuhmann MU, Soehle M, Meixensberger J. Con-
tinuous assessment of cerebrovascular autoregulation after
traumatic brain injury using brain tissue oxygen pressure reac-
tivity. Crit Care Med. 2006;34:1783–8.
21. Jaeger M, Schuhmann MU, Soehle M, Nagel C, Meixensberger J.
Continuous monitoring of cerebrovascular autoregulation after
subarachnoid hemorrhage by brain tissue oxygen pressure reac-
tivity and its relation to delayed cerebral infarction. Stroke.
2007;38:981–6.
22. Maas AI, Hukkelhoven CW, Marshall LF, Steyerberg EW. Predic-
tion of outcome in traumatic brain injury with computed
tomographic characteristics: a comparison between the computed
tomographic classification and combinations of computed tomo-
graphic predictors. Neurosurgery. 2005;57:1173–82 discussion -82.
23. Jennett B. Assessment of outcome after severe brain damage: a
practical scale. The Lancet. 1975;305:480–4.
24. Smielewski P, Czosnyka M, Steiner L, Belestri M, Piechnik S,
Pickard JD. ICM+: software for on-line analysis of bedside
monitoring data after severe head trauma. Acta Neurochir Suppl.
2005;95:43–9.
25. Czosnyka M, Smielewski P, Kirkpatrick P, Laing RJ, Menon D,
Pickard JD. Continuous assessment of the cerebral vasomotor
reactivity in head injury. Neurosurgery. 1997;41:11–7 discussion
7-9.
26. Sorrentino E, Diedler J, Kasprowicz M, et al. Critical thresholds
for cerebrovascular reactivity after traumatic brain injury. Neur-
ocrit Care. 2012;16:258–66.
27. Sessler CN, Gosnell MS, Grap MJ, et al. The Richmond Agita-
tion-Sedation Scale: validity and reliability in adult intensive care
unit patients. Am J Respir Crit Care Med. 2002;166:1338–44.
28. Rao V, Klepstad P, Losvik OK, Solheim O. Confusion with
cerebral perfusion pressure in a literature review of current
guidelines and survey of clinical practise. Scand J Trauma Resusc
Emerg Med. 2013;21:78.
29. Bratton SL, Chestnut RM, Ghajar J, et al. Guidelines for the
management of severe traumatic brain injury. IX. Cerebral per-
fusion thresholds. J Neurotrauma. 2007;24(Suppl 1):S59–64.
30. Stocchetti N, Maas AI. Traumatic intracranial hypertension.
N Engl J Med. 2014;370:2121–30.
31. Team RDC. R: a language and environment for statistical com-
puting. Vienna: R Foundation for Statistical Computing; 2012.
32. Bland JM, Altman DG. Statistical methods for assessing agree-
ment between two methods of clinical measurement. Lancet.
1986;8476:307–10.
33. Cecconi M, Rhodes A, Poloniecki J, Della Rocca G, Grounds
RM. Bench-to-bedside review: the importance of the precision of
the reference technique in method comparison studies–with
specific reference to the measurement of cardiac output. Crit
Care. 2009;13:201.
34. Czosnyka M, Smielewski P, Kirkpatrick P, Piechnik S, Laing R,
Pickard JD. Continuous monitoring of cerebrovascular pressure-
reactivity in head injury. Acta Neurochir Suppl. 1998;71:74–7.
Neurocrit Care
123
35. Lang EW, Lagopoulos J, Griffith J, et al. Cerebral vasomotor
reactivity testing in head injury: the link between pressure and
flow. J Neurol Neurosurg Psychiatry. 2003;74:1053–9.
36. Budohoski KP, Czosnyka M, de Riva N, et al. The relationship
between cerebral blood flow autoregulation and cerebrovascular
pressure reactivity after traumatic brain injury. Neurosurgery.
2012;71:652–60 discussion 60-1.
37. Zweifel C, Castellani G, Czosnyka M, et al. Noninvasive moni-
toring of cerebrovascular reactivity with near infrared spectroscopy
in head-injured patients. J Neurotrauma. 2010;27:1951–8.
38. Weerakkody RA, Czosnyka M, Zweifel C, et al. Slow vasogenic
fluctuations of intracranial pressure and cerebral near infrared
spectroscopy—an observational study. Acta Neurochir (Wien).
2010;152:1763–9.
39. Steiner LA, Pfister D, Strebel SP, Radolovich D, Smielewski P,
Czosnyka M. Near-infrared spectroscopy can monitor dynamic
cerebral autoregulation in adults. Neurocrit Care. 2009;10:122–8.
40. Brady KM, Lee JK, Kibler KK, et al. Continuous time-domain
analysis of cerebrovascular autoregulation using near-infrared
spectroscopy. Stroke. 2007;38:2818–25.
41. Brady K, Joshi B, Zweifel C, et al. Real-time continuous moni-
toring of cerebral blood flow autoregulation using near-infrared
spectroscopy in patients undergoing cardiopulmonary bypass.
Stroke. 2010;41:1951–6.
42. Diedler J, Zweifel C, Budohoski KP, et al. The limitations of
near-infrared spectroscopy to assess cerebrovascular reactivity:
the role of slow frequency oscillations. Anesth Analg.
2011;113:849–57.
43. Lazaridis C, Smielewski P, Steiner LA, et al. Optimal cerebral
perfusion pressure: are we ready for it? Neurol Res.
2013;35:138–48.
Neurocrit Care
123


125 PUBLICATION VI
KIDNEY-BRAIN LINK IN TRAUMATIC BRAIN INJURY PATIENTS?
A PRELIMINARY REPORT
Dias, C, Gaio, AR, Monteiro E, Barbosa, S, Cerejo, A, Donnelly, J, Felgueiras, O,
Smielewski, P, Paiva, J-A, Czosnyka, M
Neurocrit Care. 2014 Oct 2. [Epub ahead of print]

ORIGINAL ARTICLE
Kidney-Brain Link in Traumatic Brain Injury Patients?A preliminary report
Celeste Dias • A. Rita Gaio • Elisabete Monteiro • Silvina Barbosa •
Antonio Cerejo • Joseph Donnelly • Oscar Felgueiras • Peter Smielewski •
Jose-Artur Paiva • Marek Czosnyka
� Springer Science+Business Media New York 2014
Abstract
Background Kidney hyperfiltration with augmented renal
clearance is frequently observed in patients with traumatic
brain injury. The aim of this study is to report preliminary
findings about the relationship between brain autoregula-
tion impairment, estimated kidney glomerular filtration rate
and outcome in critically ill patients after severe traumatic
brain injury.
Methods Data collected from a cohort of 18 consecutive
patients with severe traumatic brain injury managed with
ICP monitoring in a Neurocritical Care Unit, were retro-
spectively analyzed. Early morning blood tests were
performed for routine chemistry assessments and we ana-
lyzed creatinine and estimated creatinine clearance,
osmolarity, and sodium. Daily norepinephrine dose, protein
intake, and water balance were documented. Time average
of brain monitoring data (intracranial pressure, cerebral
perfusion pressure, and cerebrovascular reactivity pressure
index—PRx) were calculated for 6 h before blood sample
tests. Patient outcome was evaluated using Glasgow out-
come scale at 6-month follow-up, considering nonfatal
outcome if GOS C3 and fatal outcome if GOS <3. Mul-
tiple linear regression models were used to study the crude
and adjusted effects of the above variables on PRx
throughout time.
Results A total of 199 complete daily observations from
18 adult consecutive multiple trauma patients with severe
traumatic brain injury were analyzed. At hospital
admission, the median post-resuscitation Glasgow coma
score was 6 (range 3–12), mean SAPSII score was 44.65
with predicted mortality of 36 %. Hospital mortality rate
was 27 % and median GOS at 6 month after discharge was
3. Creatinine clearance (CrCl) was found to have a nega-
tive correlation with PRx (Pearson correlation—0.82), with
statistically significant crude (p < 0.001) and adjusted
(p = 0.001) effects. For each increase of 10 ml/min in
CrCl (estimated either by the Cockcroft–Gault or by
Modification of Diet in Renal Disease Study equations) a
mean decrease in PRx of approximately 0.01 was expected.
Amongst possible confounders only norepinephrine was
shown to have a significant effect. Mean PRx value for
outcome fatal status was greater than mean PRx for non-
fatal status (p < 0.05), regardless of the model used for
the CrCl estimation.
Conclusions Better cerebral autoregulation evaluated
with cerebrovascular PRx is significantly correlated with
augmented renal clearance in TBI patients and associates
with better outcome.
Keywords Traumatic brain injury �Cerebrovascular pressure reactivity index � Creatinine �Renal clearance � Outcome
Introduction
Autoregulation of blood flow is the inherent capacity of
vascular bed to maintain constant perfusion despite the
variations of arterial blood pressure (ABP) and intracranial
pressure (ICP), and is an important mechanism to maintain
cerebral [1] and kidney [2] blood flow relatively constant.
The brain and kidney are highly perfused organs with a low
vascular resistance, and hence are exposed to high-volume
C. Dias (&) � A. R. Gaio � E. Monteiro � S. Barbosa �A. Cerejo � J. Donnelly � O. Felgueiras � P. Smielewski �J.-A. Paiva � M. Czosnyka
Intensive Care Department, Neurocritical Care Unit,
Hospital Sao Joao, Porto, Portugal
e-mail: [email protected]
123
Neurocrit Care
DOI 10.1007/s12028-014-0045-1
Author's personal copy
blood flow throughout the cardiac cycle [3]. As O’Rourke
and Safar described [4] ‘‘These 2 organs throb with each
beat of the heart, and their venous efflux, like that of the
lungs, retains pulsations transmitted through the capillary
network. The brain and kidney are susceptible to influences
upstream that may increase fluctuations of pressure and
flow, whereas small vessels in other organs are protected
by relatively intense vasoconstriction upstream’’. The
hemodynamic parallelism between vascular beds of brain
and kidney are described by other authors, acknowledging
a putative cerebrorenal connection [5, 6]. Finally, brain and
kidney play an important role in maintaining homeostasis
by adjusting sodium, fluid tonicity, and water balance [7].
Cerebrovascular autoregulation and kidney function are
frequently impaired in patients with traumatic brain injury
(TBI) [8]. Conversely, increased glomerular filtration rate
with augmented renal clearance (ARC) and polyuria are
also frequently observed in patients with TBI [9, 10].
Systemic inflammation after trauma [11], cytokine cascade
triggered by brain lesion [12], aggressive fluid resuscita-
tion, use of hypertonic solutions and vasopressor support
may promote organ blood flow disruption and excretory
function disturbance. The aim of this study is to report
preliminary findings about the relationship between brain
autoregulation impairment, estimated kidney glomerular
filtration rate, and outcome in critically ill patients after
severe TBI.
Methods
Patients and Monitoring
We retrospectively performed an analysis of data collected
for a prospective cohort of 18 consecutive patients admit-
ted to the Neurocritical Care Unit (NCCU) of the Hospital
S. Joao, Porto, with multiple trauma and severe TBI and
clinical indication for ICP monitoring. In the NCCU, all
patients were sedated with infusions of propofol and/or
midazolam and had continuous analgesia with fentanyl.
Mechanical ventilation was performed to achieve normo-
capnia (PaCO2 35–40 mmHg) and normal oxygenation
(PaO2 > 90 mmHg), with lung protective criteria.
Patients were continuously monitored for heart rate (HR),
invasive ABP, end-tidal CO2 (ETCO2), ICP, and cerebral
perfusion pressure (CPP). An intraparenchymal ICP probe
with bolt from Codman� was used and CPP was continu-
ously calculated with ABP transducer located at heart level
with patients at 308 head-up elevation. Data acquired from
vital signal monitor (Philips�) and ICP monitor were
continuously recorded using ICM + � software [13]. Pri-
mary analysis of data monitoring waveforms of ABP, ICP,
and CPP was done using time-averaged values of 10-s
intervals. Cerebrovascular pressure reactivity index (PRx)
was calculated using 10-s averages of ICP and ABP over a
moving window of 5-min length [14] as correlation coef-
ficient between ICP and ABP. Optimal CPP [15] for
autoregulation was calculated following PRx based on a
4 h window time. Whenever possible we targeted man-
agement for optimal CPP (optCPP) and when optimal CPP
could not be found we managed CPP for values
>60 mmHg according to Brain Trauma Foundation
Guidelines [16]. To achieve optCPP goal, volume expan-
sion and norepinephrine were used when necessary.
Exclusion criteria were age less than 18 years old,
pregnancy, or no clinical indication for invasive ICP
monitoring. Local ethics committee approval and written
consent from the next-of-kin were obtained.
Procedure
The study period elapsed while the patients had an indi-
cation to be monitored with ICP. Daily early morning
blood tests were performed for routine chemistry assess-
ments, namely Osm—osmolarity, Na + -sodium and Cr—
creatinine. As this trial was not designed specifically to
examine creatinine clearance (CrCl) in the TBI population,
we estimated glomerular filtration rate (GFR) using the
Cockcroft–Gault formula (CrCl-CG = (140-age)*body
weight/(plasma Cr*72)(*0,85 if female)) [17] and abbre-
viated Modification of Diet in Renal Disease Study
Equation (CrCl-MDRD = (175*(plasma creatinine-1.154)*
(age-0.203)(*0.742 if female; *1.21 if black))) [18]. We also
recorded daily norepinephrine dose, protein intake, and
water balance.
Time-averaged brain monitoring data was calculated for
6 h before blood sample tests.
Patient outcome was evaluated using Glasgow Outcome
Scale (1—death, 2—persistent vegetative state, 3—severe
disability, 4—moderate disability, and 5—good recovery)
[19] at 6 months after hospital discharge. We classified
outcome as a nonfatal status if GOS C 3 and as a fatal
status if GOS <3.
Data Analysis
We analyzed 199 complete daily observations from the 18
patients, regarding ABP, ICP, CPP, PRx, creatinine, CrCl,
norepinephrine dose, protein intake, water balance,
sodium, and osmolarity. For one of the individuals, 38
daily observations were available but only the first 23
complete daily observations were retrieved. This cut-off
value was essentially established by two criteria: proximity
to the highest number of complete daily observations from
the other individuals in the sample, and representativeness
of the mean of its remaining observations. For the
Neurocrit Care
123
Author's personal copy

remaining patients, the number of complete daily values
ranged from 3 to 18.
Modeling and Statistical Analysis
Simple univariate regression analysis between whole time-
averaged CrCl and PRx was first performed. PRx and CrCl
were compared in patients with fatal and nonfatal status.
To further investigate correlations, multiple linear
regression models studied the crude and adjusted effect of
CrCl on PRx throughout time. Due to sample size con-
straints, adjustment was considered for norepinephrine,
sodium, protein intake, water balance, and outcome. The
generalized least squares method with normally distributed
and correlated errors was applied. The best variance–
covariance matrix was having an intra-individual time
autocorrelation structure of order 1. The method choice
was due to the nature of the study: for a given subject, the
variables of interest were collected daily for a sequence of
several days while ICP was being monitored.
The condition of preserved renal function with creati-
nine <1.3 mg/dl was also investigated (2 male subjects
who developed kidney failure with fatal status having 11
complete observations were removed), with the same
confounding variables and structure of the variance–
covariance matrix.
In all models, graphical analyses were used to assess
normality and homoscedasticity of model residuals and no
compromising features were detected. Intra-individual and
inter-individual variations were also considered by linear
mixed-effects models, with observations grouped at the
individual level. The obtained models were discarded as
less than 4 % of the response variation was explained by
the random effects.
Comparison between models was based on the likeli-
hood ratio test for nested models and on the Bayesian
information criterion (BIC) otherwise. Statistical analyses
were performed with the R language and software envi-
ronment for statistical computation, version 2.15.3 [20].
Statistical significance was considered at p < 0.05.
Results
A total of 18 adult consecutive multiple trauma patients
with severe TBI (16 (89 %) males) with mean age
41.7 ± 15.6 years old (range 20–66) were analyzed. At
hospital admission the median post-resuscitation Glasgow
coma score (GCS) was 6 (range 3–12), and mean SAPSII
score was 44.65 with predicted mortality of 36 %. Patients
with first GCS above 8 had secondary neurologic deterio-
ration with indication for intubation, ventilation, and ICP
monitoring. Hospital mortality rate was 27 % and median
GOS at 6 months after discharge was 3. Monitoring time
for ICP, CPP, and PRx totalized 6028 h. ICP presented a
median value of 11.6 mmHg with a minimum of
1.5 mmHg and a maximum of 44.1 mmHg. CPP varied
between 66.1 mmHg and 110.2 mmHg with a median
value of 85.3 mmHg. These values should be interpreted
taking into account the position of ABP transducer and bed
angle as described in the methods [21]. PRx oscillated
between -0.7 and 0.84 with a median value of 0.0. Serum
creatinine had a median value of 0.6 mg/dl with a mini-
mum of 0.2 mg/dl and a maximum value of 1.7 mg/dl.
Estimated CrCl-CG fluctuated between 62 ml/min and
471 ml/min with a median value of 199 ml/min, while
estimated CrCl-MDRD varied between 32 ml/min and
519 ml/min with a median value of 173 ml/min. None of
the patients had any antecedent of chronic kidney disease
and only two patients developed altered kidney function
with creatinine >1.20 mg/dl during NCCU admission.
ARC or kidney hyperfiltration was defined as CrCl above
130 ml/min. For CrCl estimates, ARC was observed in 16
(88 %) patients, corresponding to 166 (83 %) estimated
values of CrCl-CG, and ARC was found in 15 (83 %)
patients, corresponding to 137 (69 %) estimated values for
CrCl-MDRD. Scattergram and mean values of creatinine,
CrCls estimates, and cerebrovascular PRx for each patient
are presented in Fig. 1. Serum sodium varied from 129 to
179 mg/dl with a median of 144 mg/dl. Median norepi-
nephrine total daily dose was 32.3 mg ranging from 0 to
145 mg. A complete description of these variables is pre-
sented in Table 1.
Univariate regression between mean patient values of
PRx and CrCl-CG (respectively CrCl-MDRD) shows a
strong negative and significant association. R = -0.81
(resp. -0.73), p < 0.0001; i.e., higher CrCl is associated
with better cerebrovascular reactivity. See Fig. 2.
Amongst norepinephrine, sodium, protein intake, water
balance, and outcome, the longitudinal crude effect of
clearance creatinine on PRx was only found to be signifi-
cantly altered by norepinephrine and outcome. The
obtained estimates are presented in Table 2. Crude effects
were studied with the structure of the variance–covariance
matrix that was used in the adjusted-effects model.
Obtained 95 % confidence intervals for the correlation
parameter and the residual standard error of the adjusted
model were (0.2546, 0.5376) and (0.2161, 0.2733).
Both CrCl calculated values were found to have sig-
nificantly negative (and similar) crude and adjusted effects
in the model (Table 2). The model estimated PRx to have a
0.01 mean decrease for each increase of 10 ml/min in CrCl.
The effect of fatal/nonfatal status outcome found in the
model was statistically similar for the two CrCl calcula-
tions: it decreased by 39 % after being adjusted for CrCl-
CG and NE, and 32 % for CrCl-MDRD and NE. Regarding
Neurocrit Care
123
Author's personal copy

Fig. 1 Individual sample values of creatinine, creatinine clearance
estimates calculated with Cockroft-Gault equation (CCl-CG) and
modification of diet in renal disease study equation (CrCl-MDRD),
and cerebrovascular pressure reactivity index (PRx). Patients are
identified from 1 to 18 on the x-axis and solid lines connect mean
values. Subjects with Glasgow outcome scale <3 are labeled 2, 5, 12,
and 17
Neurocrit Care
123
Author's personal copy
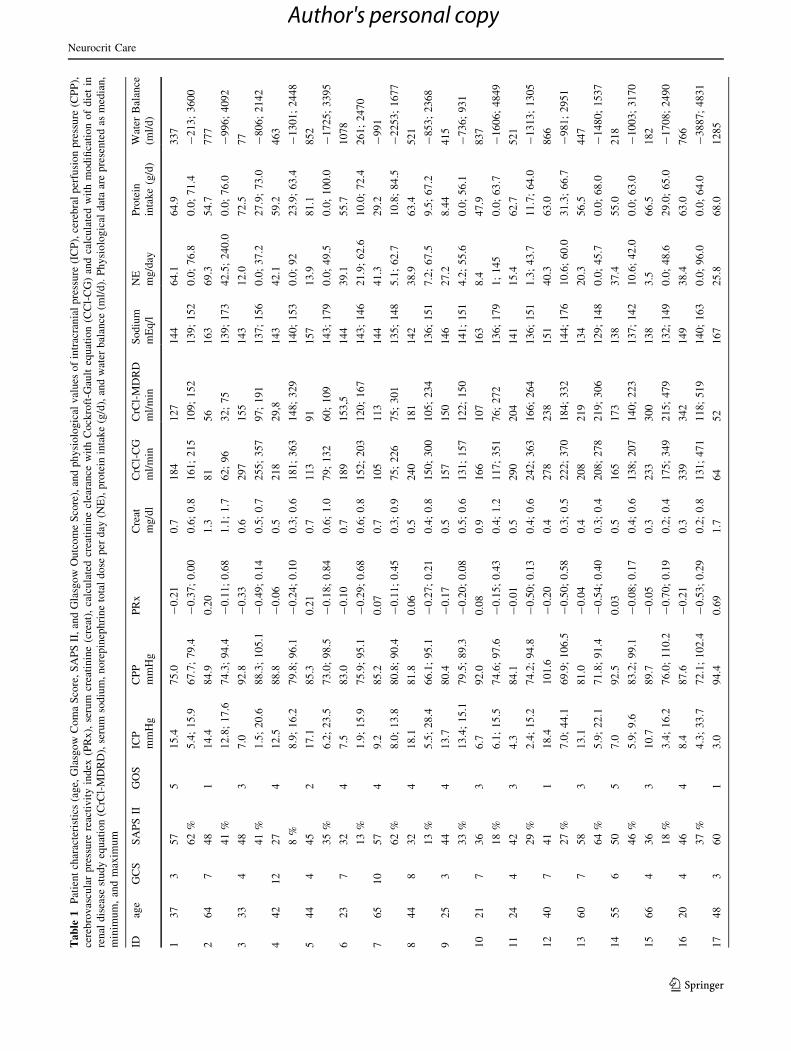
Ta
ble
1P
atie
nt
char
acte
rist
ics
(ag
e,G
lasg
ow
Co
ma
Sco
re,
SA
PS
II,
and
Gla
sgo
wO
utc
om
eS
core
),an
dp
hy
sio
log
ical
val
ues
of
intr
acra
nia
lp
ress
ure
(IC
P),
cere
bra
lp
erfu
sio
np
ress
ure
(CP
P),
cere
bro
vas
cula
rp
ress
ure
reac
tiv
ity
ind
ex(P
Rx
),se
rum
crea
tin
ine
(cre
at),
calc
ula
ted
crea
tin
ine
clea
ran
cew
ith
Co
ckro
ft-G
ault
equ
atio
n(C
Cl-
CG
)an
dca
lcu
late
dw
ith
mo
difi
cati
on
of
die
tin
ren
ald
isea
sest
ud
yeq
uat
ion
(CrC
l-M
DR
D),
seru
mso
diu
m,
no
rep
inep
hri
ne
tota
ld
ose
per
day
(NE
),p
rote
inin
tak
e(g
/d),
and
wat
erb
alan
ce(m
l/d
).P
hy
sio
log
ical
dat
aar
ep
rese
nte
das
med
ian
,
min
imu
m,
and
max
imu
m
IDag
eG
CS
SA
PS
IIG
OS
ICP
mm
Hg
CP
P
mm
Hg
PR
xC
reat
mg
/dl
CrC
l-C
G
ml/
min
CrC
l-M
DR
D
ml/
min
So
diu
m
mE
q/l
NE
mg
/day
Pro
tein
inta
ke
(g/d
)
Wat
erB
alan
ce
(ml/
d)
13
73
57
51
5.4
75
.0-
0.2
10
.71
84
12
71
44
64
.16
4.9
33
7
62
%5
.4;
15
.96
7.7
;7
9.4
-0
.37
;0
.00
0.6
;0
.81
61
;2
15
10
9;
15
21
39
;1
52
0.0
;7
6.8
0.0
;7
1.4
-2
13
;3
60
0
26
47
48
11
4.4
84
.90
.20
1.3
81
56
16
36
9.3
54
.77
77
41
%1
2.8
;1
7.6
74
.3;
94
.4-
0.1
1;
0.6
81
.1;
1.7
62
;9
63
2;
75
13
9;
17
34
2.5
;2
40
.00
.0;
76
.0-
99
6;
40
92
33
34
48
37
.09
2.8
-0
.33
0.6
29
71
55
14
31
2.0
72
.57
7
41
%1
.5;
20
.68
8.3
;1
05
.1-
0.4
9;
0.1
40
.5;
0.7
25
5;
35
79
7;
19
11
37
;1
56
0.0
;3
7.2
27
.9;
73
.0-
80
6;
21
42
44
21
22
74
12
.58
8.8
-0
.06
0.5
21
82
9,8
14
34
2.1
59
.24
63
8%
8.9
;1
6.2
79
.8;
96
.1-
0.2
4;
0.1
00
.3;
0.6
18
1;
36
31
48
;3
29
14
0;
15
30
.0;
92
23
.9;
63
.4-
13
01
;2
44
8
54
44
45
21
7.1
85
.30
.21
0.7
11
39
11
57
13
.98
1.1
85
2
35
%6
.2;
23
.57
3.0
;9
8.5
-0
.18
;0
.84
0.6
;1
.07
9;
13
26
0;
10
91
43
;1
79
0.0
;4
9.5
0.0
;1
00
.0-
17
25
;3
39
5
62
37
32
47
.58
3.0
-0
.10
0.7
18
91
53
,51
44
39
.15
5.7
10
78
13
%1
.9;
15
.97
5.9
;9
5.1
-0
.29
;0
.68
0.6
;0
.81
52
;2
03
12
0;
16
71
43
;1
46
21
.9;
62
.61
0.0
;7
2.4
26
1;
24
70
76
51
05
74
9.2
85
.20
.07
0.7
10
51
13
14
44
1.3
29
.2-
99
1
62
%8
.0;
13
.88
0.8
;9
0.4
-0
.11
;0
.45
0.3
;0
.97
5;
22
67
5;
30
11
35
;1
48
5.1
;6
2.7
10
.8;
84
.5-
22
53
;1
67
7
84
48
32
41
8.1
81
.80
.06
0.5
24
01
81
14
23
8.9
63
.45
21
13
%5
.5;
28
.46
6.1
;9
5.1
-0
.27
;0
.21
0.4
;0
.81
50
;3
00
10
5;
23
41
36
;1
51
7.2
;6
7.5
9.5
;6
7.2
-8
53
;2
36
8
92
53
44
41
3.7
80
.4-
0.1
70
.51
57
15
01
46
27
.28
.44
41
5
33
%1
3.4
;1
5.1
79
.5;
89
.3-
0.2
0;
0.0
80
.5;
0.6
13
1;
15
71
22
;1
50
14
1;
15
14
.2;
55
.60
.0;
56
.1-
73
6;
93
1
10
21
73
63
6.7
92
.00
.08
0.9
16
61
07
16
38
.44
7.9
83
7
18
%6
.1;
15
.57
4.6
;9
7.6
-0
.15
;0
.43
0.4
;1
.21
17
;3
51
76
;2
72
13
6;
17
91
;1
45
0.0
;6
3.7
-1
60
6;
48
49
11
24
44
23
4.3
84
.1-
0.0
10
.52
90
20
41
41
15
.46
2.7
52
1
29
%2
.4;
15
.27
4.2
;9
4.8
-0
.50
;0
.13
0.4
;0
.62
42
;3
63
16
6;
26
41
36
;1
51
1.3
;4
3.7
11
.7;
64
.0-
13
13
;1
30
5
12
40
74
11
18
.41
01
.6-
0.2
00
.42
78
23
81
51
40
.36
3.0
86
6
27
%7
.0;
44
.16
9.9
;1
06
.5-
0.5
0;
0.5
80
.3;
0.5
22
2;
37
01
84
;3
32
14
4;
17
61
0.6
;6
0.0
31
.3;
66
.7-
98
1;
29
51
13
60
75
83
13
.18
1.0
-0
.04
0.4
20
82
19
13
42
0.3
56
.54
47
64
%5
.9;
22
.17
1.8
;9
1.4
-0
.54
;0
.40
0.3
;0
.42
08
;2
78
21
9;
30
61
29
;1
48
0.0
;4
5.7
0.0
;6
8.0
-1
48
0;
15
37
14
55
65
05
7.0
92
.50
.03
0.5
16
51
73
13
83
7.4
55
.02
18
46
%5
.9;
9.6
83
.2;
99
.1-
0.0
8;
0.1
70
.4;
0.6
13
8;
20
71
40
;2
23
13
7;
14
21
0.6
;4
2.0
0.0
;6
3.0
-1
00
3;
31
70
15
66
43
63
10
.78
9.7
-0
.05
0.3
23
33
00
13
83
.56
6.5
18
2
18
%3
.4;
16
.27
6.0
;1
10
.2-
0.7
0;
0.1
90
.2;
0.4
17
5;
34
92
15
;4
79
13
2;
14
90
.0;
48
.62
9.0
;6
5.0
-1
70
8;
24
90
16
20
44
64
8.4
87
.6-
0.2
10
.33
39
34
21
49
38
.46
3.0
76
6
37
%4
.3;
33
.77
2.1
;1
02
.4-
0.5
3;
0.2
90
.2;
0.8
13
1;
47
11
18
;5
19
14
0;
16
30
.0;
96
.00
.0;
64
.0-
38
87
;4
83
1
17
48
36
01
3.0
94
.40
.69
1.7
64
52
16
72
5.8
68
.01
28
5
Neurocrit Care
123
Author's personal copy

CrCl-CG estimates, the expected PRx value for fatal status
outcome was 0.1533 greater than the expected PRx for
nonfatal status (p = 0.023); whereas for CrCl-MDRD
estimates, the expected PRx value for fatal status outcome
was 0.1727 greater than the expected PRx for nonfatal
status (p = 0.014). The breakdown of PRx along CrCl
values, both CG and MDRD, are presented in Fig. 3, for
each outcome status. Crude and adjusted effects for the
variables that were excluded from the final model due to
non-significance, namely sodium, protein intake, and water
balance, are presented in Table 2. Amongst these variables,
sodium was the only one showing a significant crude effect
(p = 0.03, 0.61, and 0.33, respectively).
The effect of CrCl on PRx was also studied on indi-
viduals with sustained normal renal function (16 patients
out of 18). Amongst possible confounders such as norepi-
nephrine, outcome, sodium, protein intake, and water
balance, only norepinephrine was shown to have a signif-
icant effect. The obtained estimates are also presented in
Table 2. The 95 % confidence intervals for the correlation
parameter and residual standard error of the adjusted model
were (0.2606, 0.5384) and (0.2148, 0.2729), respectively.
Discussion
Kidney hyperfiltration appears to be a frequent finding in
critically ill [22], particularly in trauma patients [10]. At
present, most ICU’s worldwide, still use daily serum cre-
atinine as the endogenous substance to estimate kidney
function, due to its high specificity and low cost, in spite of
low sensitivity [23]. However, there is an increasing evi-
dence that GFR should be measured daily even in patients
with normal kidney function [24]. Until now, the impli-
cations of ARC have focused on drug pharmacokinetics
and elimination [22, 25–29].
In this paper we documented strong correlation between
PRx as a measure of cerebrovascular reactivity, estimated
CrCl and outcome in a small group of severe TBI patients.
We also searched for the relationship between the conse-
quences of TBI management with CPP manipulation using
norepinephrine and hypertonic solutions looking at serum
sodium levels and osmolarity. Both procedures were
associated with augmented estimated CrCl. Such strong
association between PRx and CrCl is rather a logical
pathophysiological phenomenon that may be explained on
the basis of differential input impedance in the brain and
kidney compared with other systemic vascular beds. As
clinicians, we understand the relevance of intact autoreg-
ulation both for preservation of brain and kidney function.
The innovation of our study is balanced on relationship
between these two parameters and their effect on outcome.
These results may be in accordance with the dualTa
ble
1co
nti
nu
ed
IDag
eG
CS
SA
PS
IIG
OS
ICP
mm
Hg
CP
P
mm
Hg
PR
xC
reat
mg
/dl
CrC
l-C
G
ml/
min
CrC
l-M
DR
D
ml/
min
So
diu
m
mE
q/l
NE
mg
/day
Pro
tein
inta
ke
(g/d
)
Wat
erB
alan
ce
(ml/
d)
68
%2
.0;
6.5
84
.6;
99
.10
.29
;0
.75
1.1
;1
.76
4;
10
24
3;
75
16
0;
17
62
5.2
;6
4.5
0.0
;7
4.0
37
1;
22
84
18
40
11
31
31
4.0
84
.2-
0.1
40
.62
11
15
81
39
19
.35
1.5
-3
3
12
%1
0.9
;1
5.0
83
.8;
87
.5-
0.1
8;
-0
.05
0.6
;0
.71
79
;2
19
12
5;
19
81
32
;1
48
14
.2;
25
.84
.0;
73
.0-
89
7;
20
58
Neurocrit Care
123
Author's personal copy

physiological mechanism of renal autoregulation which is
based on the myogenic response to pressure and the tub-
uloglomerular feedback to flow [30]. In fact, renal
autoregulation minimizes the impact of changes in ABP on
sodium excretion. However, Udy et al. [9] showed that
augmented CrCl found in TBI patients receiving active
management of CPP persists even after discontinuation of
such therapy. Fluid overload and daily protein intake were
also considered in this study and revealed no significant
difference.
Although this study was not primarily designed to
examine kidney function in the TBI population, the find-
ings obtained from the included cases call attention to a
striking association between good cerebrovascular pressure
reactivity and kidney hyperfiltration.
The mechanisms behind this phenomenon in this pop-
ulation ask for reflection and further investigation. First,
the common effect of CPP management on brain and
kidney autoregulation. As Udy et al. [9] and also Albanese
et al. [31] stated during active management of CPP (using
norepinephrine and hypertonic solutions) that augmented
CrCls are common. Second, brain injury itself associated
with loss of autoregulation may contribute to kidney
autoregulation impairment [2, 19] and dysfunction leading
to a decrease in CrCls, with more susceptibility to develop
acute kidney injury. Schiller et al. [32] suggested that ‘‘the
brain and the kidney present a common and unique way to
react to fluctuations in blood pressure and flow due to
similar small-resistance vascular beds. …Thus, information
about microvascular damage in one organ may provide
information about damage in the other organ’’. Also, Ono
et al. [33] monitored brain autoregulation using cerebral
oximetry index (COx) with near-infrared spectroscopy and
showed that ‘‘excursions of mean ABP below the lower
limit of CBF autoregulation during cardiopulmonary
bypass were independently associated with acute kidney
injury’’. Moreover, a third serum unknown element might
be present (cytokines, neurotransmitters, brain and kidney
renin-angiotensin systems, vasopressin, autonomic neuro-
nal control) and play an important role in the crosstalk
between brain and kidney [3, 11, 34]. In fact, Nongnuch
et al. [6] in its paper ‘‘Brain-kidney crosstalk’’ call atten-
tion to inflammatory state and increased sympathetic
nervous system activity as common pathways between
acute kidney injury and acute brain injury. On the other
hand, recent findings about autoregulation of cerebral
blood flow and nephrectomy [35], and systemic and brain
renin-angiotensin systems [36–38] may give some subtle
links about biochemical interplay between brain and kid-
ney. Understanding the underlying pathophysiological
mechanisms between brain and kidney autoregulation and
the practical implications of this relationship remains to be
established with further studies. From experimental study
[39], we can learn that kidney autoregulation evaluated
with NIRS (RVx) is probably more fragile than brain
because kidney blood flow becomes pressure passive
before cerebral blood flow. Whether this amazingly strong
CrCl-PRx association reported in our small series of TBI
patients is an epiphenomenon of this observation, remains
to be investigated.
Study Limitations and Insights for Future Investigations
Limitations of the present study are related to the small
cohort and to the fact that it was not specifically designed
to examine GFR. The small number of patients did not
allow to consider multivariate analysis, including severity
Fig. 2 Mean predicted cerebrovascular pressure reactivity index
(PRx) and 95 % confidence interval for different creatinine clearance
(CrCl) values, determined by (A) the Cockcroft-Gault equation (CrCl-
CG) and by (B) MDRD modification of diet in renal disease study
equation (CrCl-MDRD). Points represent time-averaged observations
from the 18 sampled patients during the whole period of intracranial
pressure (ICP) monitoring with PRx calculation at the Neurocritical
Care Unit
Neurocrit Care
123
Author's personal copy

Ta
ble
2(A
)E
stim
ates
for
the
cru
de
and
adju
sted
effe
cts
of
the
two
calc
ula
ted
val
ues
of
crea
tin
ine
clea
ran
ce(C
rCl)
.C
rCl
(ml/
min
)w
ith
Co
ckcr
oft
-Gau
ltfo
rmu
la(C
rCl-
CG
)an
dm
od
ified
die
t
ren
ald
isea
seeq
uat
ion
(CrC
l-M
DR
D),
ou
tco
me
at6
mo
nth
saf
ter
ho
spit
ald
isch
arg
e(G
OS
C3
asth
ere
fere
nce
cate
go
ryan
dcl
assi
fied
asn
on
fata
lst
atu
s)an
dn
ore
pin
eph
rin
e(N
E)
on
the
cere
bro
vas
cula
rp
ress
ure
reac
tiv
ity
ind
ex(P
Rx
)fo
ral
lp
atie
nts
(B)
Est
imat
esfo
rth
ecr
ud
ean
dad
just
edef
fect
so
fC
rCl-
CG
and
CrC
l-M
DR
Dan
dN
Eo
nP
Rx
inp
atie
nts
wit
hn
orm
alk
idn
ey
fun
ctio
n
(A)
Var
iab
les
for
all
pat
ien
tsC
rud
eef
fect
sp
val
ue
Ad
just
edef
fect
sC
rCl-
CG
mo
del
pv
alu
eA
dju
sted
effe
cts
CrC
l-M
DR
Dm
od
elp
val
ue
Inte
rcep
t–
–0
.08
80
0.3
01
-0
.00
05
0.9
94
1
CrC
l-C
G2
0.0
01
5<
0.0
00
12
0.0
01
00
.00
1–
–
CrC
l-M
DR
D2
0.0
01
1<
0.0
00
1–
–2
0.0
00
70
.01
5
GO
S6
m0
.25
31
0.0
00
30
.15
33
0.0
23
0.1
72
70
.01
4
No
rep
inep
hri
ne
0.0
03
40
.00
01
0.0
02
30
.00
50
.00
25
0.0
03
So
diu
m0
.00
54
0.0
30
6-
0.0
00
60
.80
2-
0.0
00
50
.85
6
Pro
tein
Inta
ke
0.0
00
50
.60
98
0.0
01
00
.29
10
.00
08
0.3
94
Wat
erB
alan
ce/1
00
a-
0.0
01
20
.32
71
-0
.00
20
0.0
99
-0
.00
18
0.1
26
(B)
Var
iab
les
for
pat
ien
tsw
ith
no
rmal
kid
ney
fun
ctio
nC
rud
eef
fect
sp
val
ue
Ad
just
edef
fect
sC
rCl-
CG
mo
del
pv
alu
eA
dju
sted
effe
cts
CrC
l-M
DR
Dm
od
elp
val
ue
Inte
rcep
t–
–0
.16
58
0.0
32
0.0
77
90
.23
0
CrC
l-C
G-
0.0
01
20
.00
01
-0
.00
11
0.0
01
––
CrC
l-M
DR
D-
0.0
00
90
.00
17
––
-0
.00
08
0.0
06
No
rep
inep
hri
ne
0.0
01
20
.00
28
0.0
01
00
.01
00
.00
11
0.0
08
Pan
elA
Cru
de
and
adju
sted
effe
cts
of
sod
ium
,p
rote
inin
tak
e,an
dw
ater
bal
ance
are
also
pre
sen
ted
:so
diu
mw
asth
eo
nly
var
iab
lesh
ow
ing
asi
gn
ifica
nt
cru
de
effe
ct(p
=0
.03
);al
lad
just
ed
effe
cts
fail
edto
be
stat
isti
call
ysi
gn
ifica
nt.
Ob
tain
ed9
5%
con
fid
ence
inte
rval
sfo
rth
eco
rrel
atio
np
aram
eter
and
resi
du
alst
and
ard
erro
ro
fth
ead
just
edm
od
els
wer
e(0
.26
16
,0
.54
60
)an
d
(0.2
20
8,
0.2
79
4)
for
the
CrC
l-C
Gm
od
elan
d(0
.30
16
,0
.57
06
)an
d(0
.22
55
,0
.28
65
)fo
rth
eC
rCl-
MD
RD
mo
del
,re
spec
tiv
ely
Pan
elB
Ob
tain
ed9
5%
con
fid
ence
inte
rval
sfo
rth
eco
rrel
atio
nst
ruct
ure
par
amet
eran
dre
sid
ual
stan
dar
der
ror
of
the
adju
sted
mo
del
sw
ere
(0.2
60
6,
0.5
38
4)
and
(0.2
14
8,
0.2
72
9)
for
the
CrC
l-C
Gm
od
elan
d(0
.30
16
,0
.56
69
)an
d(0
.21
97
,0
.28
06
)fo
rth
eC
rCl-
MD
RD
mo
del
,re
spec
tiv
ely
aW
ater
bal
ance
was
div
ided
by
10
0o
nly
for
scal
ing
pu
rpo
ses
Sig
nifi
can
tv
alu
esar
ep
rese
nte
din
bo
ld
Neurocrit Care
123
Author's personal copy

of TBI, or concomitant systemic injuries. To counteract
limitations of under- and overestimation of the real value of
CrCl, we used two (Cockcroft and MDRD) of the recom-
mended equations by the National Kidney Foundation [40].
For the near future, we are preparing a more detailed and
adjusted study to confirm these results. Further investiga-
tions are necessary to evaluate the exact importance and
the clinical implications of these findings in the manage-
ment of TBI patients.
Conclusion
Better cerebral autoregulation evaluated with cerebrovas-
cular PRx is statistically, significantly associated with ARC
observed in TBI patients and also better outcome.
Acknowledgments The software for brain monitoring ICM +
(www.neurosurg.cam.ac.uk/imcplus) is licensed by the University of
Cambridge (Cambridge Enterprise). Peter Smielewski and Marek
Czosnyka have financial interests in a part of the licensing fee. Rita
Gaio and Oscar Felgueiras were partially funded by the European
Regional Development Fund through the program COMPETE and by
the Portuguese Government through the FCT—Fundacao para a Ci-
encia e a Tecnologia under the project PEst-C/MAT/UI0144/2013.
Joseph Donnelly is supported by a Woolf Fisher Scholarship.
Conflict of interest All other authors declare that they have no
conflict of interest
References
1. Lassen NA. Autoregulation of cerebral blood flow. Circ Res.
1964;15(Suppl):201–4.
Fig. 3 Expected behavior for the pressure reactivity index (PRx) and
95 % confidence interval for the mean prediction, according to
creatinine clearance (CrCl) estimates determined by the Cockcroft-
Gault equation (CrCl-CG) and by the MDRD modification of diet in
renal disease study equation (CrCl-MDRD), for different outcomes
and for a norepinephrine (NE) dose fixed at its sample mean value
(31.4 mg/day). Outcome was defined with Glasgow outcome score
(GOS) at 6 months after hospital discharge (A1 and A2—GOS <3
and B1 and B2—GOS C3). The models estimated PRx to have very
similar mean decreases (0.010 for CrCl-CG and 0.007 for CrCl-
MDRD, respectively) for each increase of 10 ml/min in CrCl. The
expected PRx value for GOS <3 was 0.1533 (resp. 0.1727) greater
than the expected PRx for GOS C3 (p = 0.024; resp. p = 0.015). The
points represent the observed values
Neurocrit Care
123
Author's personal copy

2. Just A. Mechanisms of renal blood flow autoregulation: dynamics
and contributions. Am J Physiol Regul Integr Comp Physiol.
2007;292:R1–17.
3. Mogi M, Horiuchi M. Clinical interaction between brain and
kidney in small vessel disease. Cardiol Res Pract. 2011;2011:
306189.
4. O’Rourke MF, Safar ME. Relationship between aortic stiffening
and microvascular disease in brain and kidney: cause and logic of
therapy. Hypertension. 2005;46:200–4.
5. Ito S, Nagasawa T, Abe M, Mori T. Strain vessel hypothesis: a
viewpoint for linkage of albuminuria and cerebro-cardiovascular
risk. Hypertens Res. 2009;32:115–21.
6. Nongnuch A, Panorchan K, Davenport A. Brain-kidney crosstalk.
Crit Care. 2014;18:1–11.
7. Davenport A. The brain and the kidney-organ cross talk and
interactions. Blood Purif. 2008;26:526–36.
8. Li N, Zhao W-G, Zhang W-F. Acute kidney injury in patients
with severe traumatic brain injury: implementation of the acute
kidney injury network stage system. Neurocrit Care. 2011;14:
377–81.
9. Udy A, Boots R, Senthuran S, et al. Augmented creatinine
clearance in traumatic brain injury. Anesth Analg. 2010;111:
1505–10.
10. Minville V, Asehnoune K, Ruiz S, et al. Increased creatinine
clearance in polytrauma patients with normal serum creatinine: a
retrospective observational study. Crit Care. 2011;15:R49.
11. Lenz A, Franklin GA, Cheadle WG. Systemic inflammation after
trauma. Injury. 2007;38:1336–45.
12. Ott L, McClain CJ, Gillespie M, Young B. Cytokines and met-
abolic dysfunction after severe head injury. J Neurotrauma.
1994;11:447–72.
13. Smielewski P, Czosnyka M, Steiner L, Belestri M, Piechnik S,
Pickard JD. ICM+: software for on-line analysis of bedside
monitoring data after severe head trauma. Acta Neurochir Suppl.
2005;95:43–9.
14. Czosnyka M, Smielewski P, Kirkpatrick P, Laing RJ, Menon D,
Pickard JD. Continuous assessment of the cerebral vasomotor
reactivity in head injury. Neurosurgery. 1997;41:11–7 discussion
7-9.
15. Aries MJ, Czosnyka M, Budohoski KP, et al. Continuous deter-
mination of optimal cerebral perfusion pressure in traumatic brain
injury. Crit Care Med. 2012;40:2456–63.
16. Brain Trauma F, American Association of Neurological S, Con-
gress of Neurological S, et al. Guidelines for the management of
severe traumatic brain injury. IX. Cerebral perfusion thresholds.
J Neurotrauma. 2007;24(1):S59–64.
17. Cockcroft DW, Gault MH. Prediction of creatinine clearance
from serum creatinine. Nephron. 1976;16:31–41.
18. Levey AS, Coresh J, Greene T, et al. Using standardized serum
creatinine values in the modification of diet in renal disease study
equation for estimating glomerular filtration rate. Ann Intern
Med. 2006;145:247–54.
19. Jennett B, Bond M. Assessment of outcome after severe brain
damage: a practical scale. The Lancet. 1975;305:480–4.
20. R: A Language and Environment for Statistical Computing. 2012.
at http://www.R-project.org.
21. Rao V, Klepstad P, Losvik O, Solheim O. Confusion with cere-
bral perfusion pressure in a literature review of current guidelines
and survey of clinical practise. Scand J Trauma Resusc Emerg
Med. 2013;21:78.
22. Udy AA, Baptista JP, Lim NL, et al. Augmented renal clearance
in the ICU: results of a multicenter observational study of renal
function in critically ill patients with normal plasma creatinine
concentrations*. Crit Care Med. 2014;42:520–7.
23. Delanaye P, Cavalier E, Maillard N, et al. Creatinine: past and
present. Ann Biol Clin. 2010;68:531–43.
24. Baptista JP, Udy AA, Sousa E, et al. A comparison of estimates
of glomerular filtration in critically ill patients with augmented
renal clearance. Crit Care. 2011;15:R139.
25. Udy AA, Roberts JA, Lipman J. Implications of augmented renal
clearance in critically ill patients. Nat Rev Nephrol. 2011;7:
539–43.
26. Udy AA, Roberts JA, Boots RJ, Paterson DL, Lipman J. Aug-
mented renal clearance: implications for antibacterial dosing in
the critically ill. Clin Pharmacokinet. 2010;49:1–16.
27. Shorr AF, Zilberberg MD. Augmented renal clearance: an aug-
mented definition of appropriate antibiotic therapy?*. Crit Care
Med. 2014;42:728–9.
28. Baptista JP, Sousa E, Martins PJ, Pimentel JM. Augmented renal
clearance in septic patients and implications for vancomycin
optimisation. Int J Antimicrob Agents. 2012;39:420–3.
29. Minkute R, Briedis V, Steponaviciute R, Vitkauskiene A, Maci-
ulaitis R. Augmented renal clearance—an evolving risk factor to
consider during the treatment with vancomycin. J Clin Pharm
Ther. 2013;38:462–7.
30. Loutzenhiser R, Griffin K, Williamson G, Bidani A. Renal
autoregulation new perspectives regarding the protective and
regulatory roles of the underlying mechanisms. Am J Physiol
Regul Integr Comp Physiol. 2006;290:1153–67.
31. Albanese J, Leone M, Garnier F, Bourgoin A, Antonini F, Martin
C. Renal effects of norepinephrine in septic and nonseptic
patients. Chest. 2004;126:534–9.
32. Schiller A, Covic A. Kidney and brain-a renal perspective of ‘Les
Liaisons Dangereuses’. Nephrol Dial Transplant. 2010;25:1370–3.
33. Ono M, Arnaoutakis GJ, Fine DM, et al. Blood pressure excur-
sions below the cerebral autoregulation threshold during cardiac
surgery are associated with acute kidney injury. Crit Care Med.
2013;41:464–71.
34. Oshima K, Mogi M, Horiuchi M. Therapeutic approach for
neuronal disease by regulating renin-angiotensin system. Curr
Hypertens Rev. 2013;9:99–107.
35. Pedersen TF, Paulson O, Nielsen AH, Strandgaard S. Effect of
nephrectomy and captopril on autoregulation of cerebral blood flow
in rats. Am J Physiol Heart Circ Physiol. 2003;285:H1097–104.
36. Nishimura Y, Ito T, Hoe K-L, Saavedra JM. Chronic peripheral
administration of the angiotensin II AT1 receptor antagonist
Candesartan blocks brain AT1 receptors. Brain Res. 2000;871:
29–38.
37. Sigurdsson ST, Paulson OB, Hoj Nielsen A, Strandgaard S.
Bradykinin antagonist counteracts the acute effect of both
angiotensin-converting enzyme inhibition and of angiotensin
receptor blockade on the lower limit of autoregulation of cerebral
blood flow. J Cereb Blood Flow Metab. 2014;34:467–71.
38. Gao J, Marc Y, Iturrioz X, Leroux V, Balavoine F, Llorens-
Cortes C. A new strategy for treating hypertension by blocking
the activity of the brain renin-angiotensin system with amino-
peptidase a inhibitors. Clin Sci (Lond). 2014;127:135–48.
39. Rhee CJ, Kibler KK, Easley RB, et al. Renovascular reactivitymeasured by near-infrared spectroscopy. J Appl Physiol. 2012;113:
307–14.
40. Jones GRD, Lim E-M. The national kidney foundation guideline
on estimation of the glomerular filtration rate. Clin Biochem Rev.
2003;24:95–8.
Neurocrit Care
123
Author's personal copy

137
CONCLUSIONS


CONCLUSIONS 139
CONCLUSIONS
The scientific contribution of this thesis takes the form of the six published
papers presented in the publication section which basically highlight the
importance of multimodal brain monitoring and cerebral autoregulation assessment
at bedside in patients after TBI.
Dedicated Neurocritical Care Unit progressed from primary control of intracranial
pressure and maintenance of cerebral perfusion pressure to a multidimensional
approach of neuronal rescue and protection with high complexity and fast dynamic
evolution.
The management of severe acute neurological patients is a constant
medical challenge based on clinical evaluation, laboratory findings, imaging
studies and continuous multimodal brain monitoring. The data collected by the
several systemic and brain monitors with the help of advanced statistical and
mathematical tools are now being applied providing clinicians better understanding
of the pathophysiological events and helping to define individual patient-
specific therapeutic targets. Neurocritical care bioinformatics may help
neurointensivists to accomplish the challenge of healing the brain and rescuing lives.
Hypothesis 1: Hospital health care resource utilization due to adult traumatic brain injury in the last decade in Portugal is changing but TBI still remains an important health problem.
TBI in Portugal is still an important public health problem but its population characteristics
and health resource utilization has evolved in the last decades. Retrospective analysis of
the Portuguese DRG-database since 2000 to 2010 showed a clear decrease in total
number of hospital admissions of adult patients with TBI as primary diagnosis. Mean age
is increasing but male preponderance is maintained, except in the age group above 80
years-old. External causes of TBI have changed over the study period with arise in falls
and a reduction in traffic accidents. There seems to be an increase in TBI severity and
accordingly an increase of hospital length of stay. As severity of TBI patients admitted to
hospital increases, so does the availability of intensive care and surgical resources,
allowing treatment of patients in a more differentiated environment. Nevertheless,
mortality did not decline and is still very high.
“Traumatic Brain Injury in Portugal is changing”
140 CONCLUSIONS
Acute intracranial hypertension is an important cause of secondary lesion in
neurocritical care patients that should be avoided. At bedside we need to
understand and if possible anticipate this phenomenon, with the aim of
reducing its negative impact on brain oxygenation and cerebral
blood flow. The ICP analysis of pulsatile waveform and time pattern
combined with multimodal brain monitoring may provide important
information not only about cerebral perfusion and autoregulation reserve
but also about cerebral hemodynamics combined with cerebral oxygenation.
The crisis associated with high ICP in TBI patients depends on multiple
intrinsic and extrinsic factors frequently interdependent. During our clinical
research we featured the influence on cerebrovascular reactivity of ICP peaks
and response to intracranial hypertension management.
Plateau waves were frequent phenomena in TBI patients with preserved
autoregulation but decreased volume–pressure compensatory reserve. At the top
of the plateau wave, we showed both significant decrease of CPP and increase of
mean ICP pulse amplitude. CBF and CVR decreased and brain oxygenation
decreased significantly to values below 20 mmHg. Cerebrovascular reactivity
indices (PRx, PAx and ORxs) change reflected impairment of autoregulation
during the crest of the wave. Moreover the data showed that the power of the
vasodilatory cascade and consequently the magnitude of plateau wave were
associated with lower PRx and higher oxygenation parameters. Plateau waves are
not benign phenomena and, at the lower limit of autoregulation, there is a risk of
zero flow due to the collapse of brain vessels. So, accurate identification and
understanding of plateau waves, may help the adequate management of acute TBI at
bedside.
Hypothesis 3: Management of intracranial hypertension with hypertonic saline can
be monitored and explained with multimodal brain monitoring.
An analysis of the temporal profile of brain monitoring parameters response to
repeated bolus of 20% hypertonic saline during intracranial hypertension showed a
significant improvement of cerebral hemodynamics (CBF and CVR) and
cerebrovascular reactivity (PRx and CBFx).
“Hypertonic saline is a powerful tool for intracranial hypertension”
“ICP is more than a number”
Hypothesis 2: During spontaneous cerebrovascular phenomena such as plateau waves of intracranial pressure specific changes in cerebral hemodynamic indices occur.

CONCLUSIONS 141
The goal of ‘real-time’ continuous cerebral autoregulation monitoring is to enable the early
detection of potentially harmful events before they cause irreversible damage. "Optimal
CPP" can be calculated at bedside retrospectively, based on continuous evaluation of
PRx. A prospective pilot study was designed to evaluate the primary results and to
investigate the applicability of an algorithm of CPPopt-guided therapy in severe TBI
patients. In our hospital the CPPopt could be detected in around 60% of ICP monitoring
time. The median fraction of time spent with impaired cerebrovascular pressure reactivity
(% of time PRx >0.25) was greater in patients with adverse outcome (GOS≤2). We also
demonstrated that this group of patients presented significant larger discrepancy (> 10
mmHg) between real CPP and CPPopt. This finding stresses the importance (but also
urges confirmation with multicentre randomized controlled trial) of guiding TBI
treatment using autoregulation indices in clinical practice.
As a secondary aim we assessed the agreement between CPPopt (PRx) and
offline calculations of CPPopt estimates based on ORxs, COx and CBFx indices.
Real CPP averaged over the whole monitoring period significantly correlated
with CPPopt. Comparison of the 4 methods of calculating CPPopt revealed that the
lowest bias (-0.1 mmHg) was obtained with COx-CPPopt using non-invasive NIRS.
Hypothesis 5: Disturbance of cerebral autoregulation is associated with systemic
pathophysiology especially with kidney function.
Immediately after traumatic injury to the brain an abrupt neurometabolic cascade triggers
an energy crisis. Changes in cerebral blood flow (hypo- and hyperperfusion), impairment
of cerebrovascular autoregulation, cerebral metabolic dysfunction and inadequate
cerebral oxygenation are followed by systemic inflammatory response syndrome with
hemodynamic, respiratory, renal, metabolic and water-electrolyte imbalance
consequences.
“Cerebral-systemic links and brain-kidney crosstalk”
Hypothesis 4: Optimal CPP management is possible to be conducted prospectively at bedside using pressure reactivity index analysis, and shows a potential to improve outcome following TBI.
“Optimal CPP: are we ready for it?”
Recovery of CBF appeared almost ten minutes before the normalization of ICP, though
no significant changes in brain oxygenation were identified. We stress cerebrovascular
and hemodynamic properties of hypertonic saline as a relevant clinical observation.
Univariate regression analysis between mean PRx and creatinine clearance showed a
strong negative and very significant association.
In fact, cerebrovascular autoregulation and kidney function are frequently impaired in
patients with TBI and conversely, increased glomerular filtration rate with augmented renal
clearance and polyuria are also frequently observed in this group of patients. Importantly,
our finding suggests that better cerebral autoregulation evaluated with cerebrovascular
pressure reactivity index (PRx) is statistical significantly associated with augmented renal
clearance observed in TBI patients and also with better outcome.
142 CONCLUSIONS
In conclusion, despite limited sample of patients, the harvested data provide an ample
evidence that multimodal brain monitoring with continuous evaluation of cerebral
autoregulation at bedside is a significant contributor to optimize management of TBI
patients and has a potential to improve outcome after traumatic brain injury.

143
DIRECTION OF FUTURE RESEARCH


145 DIRECTION OF FUTURE RESEARCH
DIRECTION OF FUTURE RESEARCH
PATHOPHYSIOLOGY PERSPECTIVES
We have a lack of solid data on the cellular mechanisms of autoregulation impairment after
traumatic brain injury and its relationship with different subtypes of lesions. Further
investigation dedicated to target the pathophysiological processes of traumatic
dysautoregulation and discovery of new molecular pathways may lead to the development
of new therapeutic drugs to restore autoregulation and improve outcome.
Our knowledge of the complex mechanisms that interplay between normal brain and kidney
function or after traumatic brain injury is still very incomplete. Inflammatory state, increased
sympathetic nervous system activity and systemic and brain renin-angiotensin systems may
be common pathways between acute brain injury and acute kidney injury. Understanding
the underlying pathophysiological mechanisms between brain and kidney autoregulation
and the practical implications of this relationship remains to be established with further
studies.
CLINICAL PERSPECTIVES
Cerebral pressure-volume-flow-time relationship analysis at bedside is still very incipient
and urges for new monitoring tools to help daily clinical practice.
Retrospective analysis of CPPopt-guided therapy showed improvement of outcome after
diverse acute brain lesions. Our prospective pilot study, though with a small number of
patients, also showed that management at averaged real CPP close to CPPopt seem to
provide better outcome. Nevertheless, this concept has never been tested prospectively in
a randomized controlled manner. It was recently announced that a protocol for a multicentre
prospective feasibility study for autoregulation CPP-oriented management is being
discussed.


147
LIST OF REFERENCES

149 LIST OF REFERENCES
LIST OF REFERENCES
1. Ragnarsson KT. Traumatic Brain Injury Research Since the 1998 NIH ConsensusConference: Accomplishments and Unmet Goals. J Head Trauma Rehabil. 2006;21(5):379-87. 2. Goldstein M. Traumatic brain injury: A silent epidemic. Annals of Neurology.1990;27(3):327-327. 3. Corso P, Finkelstein E, Miller T, Fiebelkorn I, Zaloshnja E. Incidence and lifetime costsof injuries in the United States. Injury Prevention. 2006;12(4):212-8. 4. Maas AH, Menon DK, Lingsma HF, Pineda JA, Sandel ME, Manley GT. Re-Orientation of Clinical Research in Traumatic Brain Injury: Report of an International Workshop on Comparative Effectiveness Research. J Neurotrauma. 2012;29:32-46. 5. Santos ME, De Sousa L, Castro-Caldas A. [Epidemiology of craniocerebral trauma inPortugal]. Acta Med Port. 2003;16(2):71-6. 6. Haddad SH, Arabi YM. Critical care management of severe traumatic brain injury inadults. Scandinavian journal of trauma, resuscitation and emergency medicine. 2012;20:12. 7. Saver JL. Time is brain--quantified. Stroke. 2006;37(1):263-6.8. Menon DK. Neurocritical care turf label, organizational construct or clinical asset.Current Opinion in Critical Care. 2004;10:91-3. 9. Smith M. Neurocritical care: has it come of age? British Journal of Anaesthesia.2004;93(6):753-5. 10. Maas AI, Dearden M, Teasdale GM, Braakman R, Cohadon F, Iannotti F, et al. EBIC-guidelines for management of severe head injury in adults. European Brain Injury Consortium. Acta Neurochir (Wien). 1997;139(4):286-94. 11. Foundation BT. Guidelines for the management of severe head injury. Brain TraumaFoundation, American Association of Neurological Surgeons, Joint Section on Neurotrauma and Critical Care. J Neurotrauma. 1996;13(11):641-734. 12. Le Roux P, Menon DK, Citerio G, Vespa P, Bader MK, Brophy GM, et al. Consensussummary statement of the International Multidisciplinary Consensus Conference on Multimodality Monitoring in Neurocritical Care : a statement for healthcare professionals from the Neurocritical Care Society and the European Society of Intensive Care Medicine. Intensive Care Med. 2014;40(9):1189-209. 13. Hemphill JC, Andrews P, De Georgia M. Multimodal monitoring and neurocritical carebioinformatics. Nature reviews Neurology. 2011;7(8):451-60. 14. Le Roux P. Physiological monitoring of the severe traumatic brain injury patient in theintensive care unit. Curr Neurol Neurosci Rep. 2013;13(3):331. 15. Czosnyka M, Pickard JD. Monitoring and interpretation of intracranial pressure. JNeurol Neurosurg Psychiatry. 2004;75(6):813-21. 16. Janny P. La Pression Intracranienne Chez l’Homme [Thèse médecine]. Paris: Thèsemédecine; 1950. 17. Lundberg N. Continuous recording and control of ventricular fluid pressure inneurosurgical practice. Acta Psychiatr Neurol Scand. 1960;36(Suppl 149). 18. Lundberg N. Monitoring of intracranial pressure. Proceedings of the Royal Society ofMedicine. 1972;65(1):19-22. 19. Marmarou A, Saad A, Aygok G, Rigsbee M. Contribution of raised ICP andhypotension to CPP reduction in severe brain injury: correlation to outcome. Acta Neurochir Suppl. 2005;95:277-80. 20. Sorrentino E, Diedler J, Kasprowicz M, Budohoski KP, Haubrich C, Smielewski P, etal. Critical thresholds for cerebrovascular reactivity after traumatic brain injury. Neurocrit Care. 2012;16(2):258-66. 21. Juul N, Morris GF, Marshall SB, Marshall LF. Intracranial hypertension and cerebralperfusion pressure: influence on neurological deterioration and outcome in severe head injury. J Neurosurg. 2000;92(1):1-6.

150 LIST OF REFERENCES
22. Lemaire JJ. [Slow pressure waves during intracranial hypertension]. Annalesfrancaises d'anesthesie et de reanimation. 1997;16(4):394-8. 23. Lemaire JJ, Khalil T, Cervenansky F, Gindre G, Boire JY, Bazin JE, et al. Slowpressure waves in the cranial enclosure. Acta Neurochir (Wien). 2002;144(3):243-54. 24. Wagshul ME, Eide PK, Madsen JR. The pulsating brain: A review of experimental andclinical studies of intracranial pulsatility. Fluids and barriers of the CNS. 2011;8(1):5. 25. Contant CF, Jr., Robertson CS, Crouch J, Gopinath SP, Narayan RK, Grossman RG.Intracranial pressure waveform indices in transient and refractory intracranial hypertension. J Neurosci Methods. 1995;57(1):15-25. 26. Rosner MJ, Becker DP. Origin and evolution of plateau waves. Experimentalobservations and a theoretical model. J Neurosurg. 1984;60(2):312-24. 27. Avezaat. Cerebrospinal fluid pulse pressure and intracranial volume pressurerelationships. J Neurology, Neurosurgery Psychiatry. 1979(42):687-70 0. 28. Castellani G, Zweifel C, Kim DJ, Carrera E, Radolovich DK, Smielewski P, et al.Plateau waves in head injured patients requiring neurocritical care. Neurocrit Care. 2009;11(2):143-50. 29. Hayashi M, Kobayashi H, Kawano H, Yamamoto S, Maeda T. Cerebral blood flowand ICP patterns in patients with communicating hydrocephalus after aneurysm rupture. J Neurosurg. 1984;61(1):30-6. 30. Hayashi M, Handa Y, Kobayashi H, Kawano H, Ishii H, Hirose S. Plateau-wavephenomenon (I). Correlation between the appearance of plateau waves and CSF circulation in patients with intracranial hypertension. Brain. 1991;114 ( Pt 6):2681-91. 31. Matsuda M, Yoneda S, Handa H, Gotoh H. Cerebral hemodynamic changes duringplateau waves in brain-tumor patients. J Neurosurg. 1979;50(4):483-8. 32. Renier D, Sainte-Rose C, Marchac D, Hirsch JF. Intracranial pressure incraniostenosis. J Neurosurg. 1982;57(3):370-7. 33. Lang EW, Kasprowicz M, Smielewski P, Pickard J, Czosnyka M. Changes in CerebralPartial Oxygen Pressure and Cerebrovascular Reactivity During Intracranial Pressure Plateau Waves. Neurocrit Care. 2014. 34. Droste DW, Krauss JK. Intracranial pressure B-waves precede corresponding arterialblood pressure oscillations in patients with suspected normal pressure hydrocephalus. Neurol Res. 1999;21(7):627-30. 35. Weerakkody RA, Czosnyka M, Zweifel C, Castellani G, Smielewski P, Keong N, et al.Slow vasogenic fluctuations of intracranial pressure and cerebral near infrared spectroscopy--an observational study. Acta Neurochir (Wien). 2010;152(10):1763-9. 36. Bratton SL, Chestnut RM, Ghajar J, McConnell Hammond FF, Harris OA, Hartl R, etal. Guidelines for the management of severe traumatic brain injury. IX. Cerebral perfusion thresholds. J Neurotrauma. 2007;24 Suppl 1:S59-64. 37. Rosner MJ, Rosner SD, Johnson AH. Cerebral perfusion pressure: managementprotocol and clinical results. J Neurosurg. 1995;83(6):949-62. 38. Robertson C, Valadka A, Hannay H, Contant C, Gopinath S, Cormio M, et al.Prevention of secondary ischemic insults after severe head injury. Crit Care Med. 1999;27:2086 - 95. 39. Grande PO. The "Lund Concept" for the treatment of severe head trauma--physiological principles and clinical application. Intensive Care Med. 2006;32(10):1475-84. 40. Howells T, Elf K, Jones PA, Ronne-Engstrom E, Piper I, Nilsson P, et al. Pressurereactivity as a guide in the treatment of cerebral perfusion pressure in patients with brain trauma. J Neurosurg. 2005;102(2):311-7. 41. Muzevic D, Splavski B. The Lund concept for severe traumatic brain injury. CochraneDatabase Syst Rev. 2013;12:Cd010193. 42. Bennett TD, Bratton SL. Age-specific cerebral perfusion pressure thresholds. PediatrCrit Care Med. 2014;15(1):86-7.

151 LIST OF REFERENCES
43. Joshi B, Ono M, Brown C, Brady K, Easley RB, Yenokyan G, et al. Predicting thelimits of cerebral autoregulation during cardiopulmonary bypass. Anesth Analg. 2012;114(3):503-10. 44. Fu CH, Yang CC, Kuo TB. Effects of different classes of antihypertensive drugs oncerebral hemodynamics in elderly hypertensive patients. Am J Hypertens. 2005;18(12 Pt 1):1621-5. 45. Andrews PJ. Cerebral perfusion pressure and brain ischaemia: can one size fit all?Crit Care. 2005;9(6):638-9. 46. Diedler J, Santos E, Poli S, Sykora M. Optimal cerebral perfusion pressure in patientswith intracerebral hemorrhage: an observational case series. Crit Care. 2014;18(2):R51. 47. Budohoski KP, Czosnyka M, Kirkpatrick PJ, Smielewski P, Steiner LA, Pickard JD.Clinical relevance of cerebral autoregulation following subarachnoid haemorrhage. Nature reviews Neurology. 2013;9(3):152-63. 48. Vespa P. What is the optimal threshold for cerebral perfusion pressure followingtraumatic brain injury? Neurosurg Focus. 2003;15(6):E4. 49. Helbok R, Olson D, Le Roux P, Vespa P. Intracranial Pressure and Cerebral PerfusionPressure Monitoring in Non-TBI Patients: Special Considerations. Neurocrit Care. 2014:1-10. 50. Johnson U, Lewen A, Ronne-Engstrom E, Howells T, Enblad P. Should theNeurointensive Care Management of Traumatic Brain Injury Patients be Individualized According to Autoregulation Status and Injury Subtype? Neurocrit Care. 2014;21(2):259-65. 51. Brady KM, Lee JK, Kibler KK, Easley RB, Koehler RC, Czosnyka M, et al. The lowerlimit of cerebral blood flow autoregulation is increased with elevated intracranial pressure. Anesth Analg. 2009;108(4):1278-83. 52. Rosner MJ, Coley IB. Cerebral perfusion pressure, intracranial pressure, and headelevation. J Neurosurg. 1986;65(5):636-41. 53. Rao V, Klepstad P, Losvik OK, Solheim O. Confusion with cerebral perfusion pressurein a literature review of current guidelines and survey of clinical practise. Scandinavian journal of trauma, resuscitation and emergency medicine. 2013;21(1):78. 54. Kosty JA, Leroux PD, Levine J, Park S, Kumar MA, Frangos S, et al. Brief report: acomparison of clinical and research practices in measuring cerebral perfusion pressure: a literature review and practitioner survey. Anesth Analg. 2013;117(3):694-8. 55. Stiefel MF, Udoetuk JD, Spiotta AM, Gracias VH, Goldberg A, Maloney-Wilensky E,et al. Conventional neurocritical care and cerebral oxygenation after traumatic brain injury. J Neurosurgery. 2006;105(4):568-75. 56. Zauner A, Daugherty WP, Bullock MR, Warner DS. Brain Oxygenation and EnergyMetabolism: PART I—Biological Function and Pathophysiology. Neurosurgery. 2002;51:289-302. 57. Tran-Dinh A, Depret F, Vigue B. [Brain tissue oxygen pressure, for what, for whom?].Ann Fr Anesth Reanim. 2012;31(6):e137-43. 58. Bratton SL, Chestnut RM, Ghajar J, McConnell Hammond FF, Harris OA, Hartl R, etal. Guidelines for the management of severe traumatic brain injury. X. Brain oxygen monitoring and thresholds. J Neurotrauma. 2007;24 Suppl 1:S65-70. 59. Maloney-Wilensky E, Le Roux P. The physiology behind direct brain oxygen monitorsand practical aspects of their use. Childs Nerv Syst. 2010;26(4):419-30. 60. Rosenthal G, Hemphill JC, 3rd, Sorani M, Martin C, Morabito D, Obrist WD, et al.Brain tissue oxygen tension is more indicative of oxygen diffusion than oxygen delivery and metabolism in patients with traumatic brain injury. Critical Care Med. 2008;36(6):1917- 24. 61. Maloney-Wilensky E, Gracias V, Itkin A, Hoffman K, Bloom S, Yang W, et al. Braintissue oxygen and outcome after severe traumatic brain injury: a systematic review. Crit Care Med. 2009;37(6):2057-63.

152 LIST OF REFERENCES
62. Valadka AB, Gopinath SP, Contant CF, Uzura M, Robertson CS. Relationship of braintissue PO2 to outcome after severe head injury. Critical Care Med. 1998;26(9):1576- 81.
63. Siggaard-Andersen O, Ulrich A, Gothgen IH. Classes of tissue hypoxia. ActaAnaesthesiol Scand Suppl. 1995;107:137-42. 64. Meixensberger J, Jaeger M, Vath A, Dings J, Kunze E, Roosen K. Brain tissue oxygenguided treatment supplementing ICP/CPP therapy after traumatic brain injury. J Neurol Neurosurg Psychiatry. 2003;74(6):760-4. 65. Moerman A, Wouters P. Near-infrared spectroscopy (NIRS) monitoring incontemporary anesthesia and critical care. Acta Anaesthesiol Belg. 2010;61(4):185-94. 66. Fischer GW, Silvay G. Cerebral oximetry in cardiac and major vascular surgery. HSRProceedings in intensive care & cardiovascular anesthesia. 2010;2(4):249-56.67. Taussky P, O'Neal B, Daugherty WP, Luke S, Thorpe D, Pooley RA, et al. Validationof frontal near-infrared spectroscopy as noninvasive bedside monitoring for regional cerebral blood flow in brain-injured patients. Neurosurg Focus. 2012;32(2):E2. 68. Denault A, Deschamps A, Murkin JM. A proposed algorithm for the intraoperative useof cerebral near-infrared spectroscopy. Semin Cardiothorac Vasc Anesth. 2007;11(4):274-81. 69. Steiner LA, Pfister D, Strebel SP, Radolovich D, Smielewski P, Czosnyka M. Near-infrared spectroscopy can monitor dynamic cerebral autoregulation in adults. Neurocrit Care. 2009;10(1):122-8. 70. Zweifel C, Lavinio A, Steiner LA, Radolovich D, Smielewski P, Timofeev I, et al.Continuous monitoring of cerebrovascular pressure reactivity in patients with head injury. Neurosurg Focus. 2008;25(4):E2. 71. Brady KM, Lee JK, Kibler KK, Smielewski P, Czosnyka M, Easley RB, et al.Continuous time-domain analysis of cerebrovascular autoregulation using near-infrared spectroscopy. Stroke. 2007;38(10):2818-25. 72. Vajkoczy P, Roth H, Horn P, Lucke T, Thome C, Hubner U, et al. Continuousmonitoring of regional cerebral blood flow: experimental and clinical validation of a novel thermal diffusion microprobe. J Neurosurgery. 2000;93(2):265-74.73. Vajkoczy P, Horn P, Thome C, Munch E, Schmiedek P. Regional cerebral blood flowmonitoring in the diagnosis of delayed ischemia following aneurysmal subarachnoid hemorrhage. J Neurosurg. 2003;98(6):1227-34. 74. Astrup J, Siesjo BK, Symon L. Thresholds in cerebral ischemia - the ischemicpenumbra. Stroke. 1981;12(6):723-5. 75. Sioutos PJ, Orozco JA, Carter LP, Weinand ME, Hamilton AJ, Williams FC.Continuous regional cerebral cortical blood flow monitoring in head-injured patients. Neurosurgery. 1995;36(5):943-9; discussion 9-50. 76. Thome C, Vajkoczy P, Horn P, Bauhuf C, Hubner U, Schmiedek P. Continuousmonitoring of regional cerebral blood flow during temporary arterial occlusion in aneurysm surgery. J Neurosurg. 2001;95(3):402-11. 77. Rosenthal G, Sanchez-Mejia RO, Phan N, Hemphill JC, 3rd, Martin C, Manley GT.Incorporating a parenchymal thermal diffusion cerebral blood flow probe in bedside assessment of cerebral autoregulation and vasoreactivity in patients with severe traumatic brain injury. J Neurosurg. 2011;114(1):62-70.78. Jaeger M, Soehle M, Schuhmann MU, Winkler D, Meixensberger J. Correlation ofcontinuously monitored regional cerebral blood flow and brain tissue oxygen. Acta neurochirurgica. 2005;147(1):51-6; discussion 6. 79. Miller C, Armonda R. Monitoring of Cerebral Blood Flow and Ischemia in the CriticallyIll. Neurocrit Care. 2014:1-8. 80. Hecht N, Fiss I, Wolf S, Barth M, Vajkoczy P, Woitzik J. Modified flow- and oxygen-related autoregulation indices for continuous monitoring of cerebral autoregulation. J Neurosci Methods. 2011;201(2):399-403.

153 LIST OF REFERENCES
81. Langfitt TW, Weinstein JD, Kassell NF, Simeone FA. Transmission of IncreasedIntracranial Pressure. I. Within the craniospinal axis. J Neurosurg. 1964;21:989-97. 82. Langfitt TW, Weinstein JD, Kassell NF, Gagliardi LJ. Transmission of IncreasedIntracranial Pressure. II. Within the supratentorial space. J Neurosurg. 1964;21:998-1005. 83. Marmarou A, Shulman K, LaMorgese J. Compartmental analysis of compliance andoutflow resistance of the cerebrospinal fluid system. J Neurosurg. 1975;43(5):523-34. 84. Czosnyka M, Price DJ, Williamson M. Monitoring of cerebrospinal dynamics usingcontinuous analysis of intracranial pressure and cerebral perfusion pressure in head injury. Acta Neurochir (Wien). 1994;126(2-4):113-9. 85. Meyer JS, Gotoh F. Interaction of cerebral hemodynamics and metabolism.Neurology. 1961;11(4):46-65. 86. Iadecola C. Neurovascular regulation in the normal brain and in Alzheimer's disease.Nat Rev Neurosci. 2004;5(5):347-60. 87. Iadecola C. Intrinsic and Extrinsic Neural Regulation of the Cerebral Circulation. In:Schmiedek P, Einhäupl K, Kirsch C-M, editors. Stimulated Cerebral Blood Flow: Springer Berlin Heidelberg; 1992. p. 19-36. 88. Sokoloff L. Relationships among local functional activity, energy metabolism, andblood flow in the central nervous system. Federation proceedings. 1981;40(8):2311-6. 89. Sokoloff L. The deoxyglucose method for the measurement of local glucose utilizationand the mapping of local functional activity in the central nervous system. Int Rev Neurobiol. 1981;22:287-333. 90. Azevedo E, Rosengarten B, Santos R, Freitas J, Kaps M. Interplay of cerebralautoregulation and neurovascular coupling evaluated by functional TCD in different orthostatic conditions. J Neurol. 2007;254(2):236-41. 91. Busija DW, Heistad DD. Factors involved in the physiological regulation of thecerebral circulation. Reviews of physiology, biochemistry and pharmacology. 1984;101:161-211. 92. Rasulo FA, Balestreri M, Matta B. Assessment of cerebral pressure autoregulation.Current Opinion in Anesthesiology. 2002;15(5):483-8. 93. Paulson OB, Strandgaard S, Edvinsson L. Cerebral autoregulation. CerebrovascBrain Metab Rev. 1990;2(2):161-92. 94. Bouma GJ, Muizelaar JP. Cerebral blood flow, cerebral blood volume, andcerebrovascular reactivity after severe head injury. J Neurotrauma. 1992;9 Suppl 1:S333-48. 95. Muizelaar JP, Marmarou A, Ward JD, Kontos HA, Choi SC, Becker DP, et al. Adverseeffects of prolonged hyperventilation in patients with severe head injury: a randomized clinical trial. J Neurosurg. 1991;75(5):731-9. 96. Azevedo E, Castro P, Santos R, Freitas J, Coelho T, Rosengarten B, et al. Autonomicdysfunction affects cerebral neurovascular coupling. Clin Auton Res. 2011;21(6):395-403. 97. Lassen NA. Cerebral blood flow and oxygen consumption in man. Physiol Rev.1959;39(2):183-238. 98. Strandgaard S, MacKenzie ET, Sengupta D, Rowan JO, Lassen NA, Harper AM.Upper limit of autoregulation of cerebral blood flow in the baboon. Circ Res. 1974;34(4):435-40. 99. Jones JV, Fitch W, MacKenzie ET, Strandgaard S, Harper AM. Lower limit of cerebralblood flow autoregulation in experimental renovascular hypertension in the baboon. Circ Res. 1976;39(4):555-7. 100. Ainslie PN, Brassard P. Why is the neural control of cerebral autoregulation so controversial? F1000prime reports. 2014;6:14. 101. Vutskits L. Cerebral blood flow in the neonate. Paediatr Anaesth. 2014;24(1):22-9. 102. Allen BB, Chiu YL, Gerber LM, Ghajar J, Greenfield JP. Age-specific cerebral perfusion pressure thresholds and survival in children and adolescents with severe traumatic brain injury*. Pediatr Crit Care Med. 2014;15(1):62-70.

154 LIST OF REFERENCES
103. Tzeng YC, Ainslie PN. Blood pressure regulation IX: cerebral autoregulation under blood pressure challenges. Eur J Appl Physiol. 2014;114(3):545-59. 104. LASSEN NA. Control of Cerebral Circulation in Health and Disease. Circ Res. 1974;34(6):749-60. 105. Willie CK, Tzeng YC, Fisher JA, Ainslie PN. Integrative regulation of human brain blood flow. J Physiol. 2014;592(Pt 5):841-59. 106. Enevoldsen EM, Jensen FT. Autoregulation and CO2 responses of cerebral blood flow in patients with acute severe head injury. J Neurosurg. 1978;48(5):689-703. 107. Czosnyka M, Smielewski P, Kirkpatrick P, Menon DK, Pickard JD. Monitoring of cerebral autoregulation in head-injured patients. Stroke. 1996;27(10):1829-34. 108. Czosnyka M, Smielewski P, Kirkpatrick P, Laing RJ, Menon D, Pickard JD. Continuous assessment of the cerebral vasomotor reactivity in head injury. Neurosurgery. 1997;41(1):11-7; discussion 7-9. 109. Zhang R, Zuckerman JH, Giller CA, Levine BD. Transfer function analysis of dynamic cerebral autoregulation in humans. J Physiol. 1998; 274:H233-H41. 110. Fierstra J, Sobczyk O, Battisti-Charbonney A, Mandell DM, Poublanc J, CrawleyAP, et al. Measuring cerebrovascular reactivity: What stimulus to use? JPhysiology. 2013. 111. Aaslid R, Lindegaard KF, Sorteberg W, Nornes H. Cerebral autoregulation dynamics in humans. Stroke. 1989;20(1):45-52. 112. Giller CA. A bedside test for cerebral autoregulation using transcranial Doppler ultrasound. Acta Neurochirurgica. 1991;108(1-2):7-14. 113. Jaeger M, Schuhmann MU, Soehle M, Meixensberger J. Continuous assessment of cerebrovascular autoregulation after traumatic brain injury using brain tissue oxygen pressure reactivity. Crit Care Med. 2006;34(6):1783-8. 114. Barth M, Woitzik J, Weiss C, Muench E, Diepers M, Schmiedek P, et al. Correlation of clinical outcome with pressure-, oxygen-, and flow-related indices of cerebrovascular reactivity in patients following aneurysmal SAH. Neurocrit Care. 2010;12(2):234-43. 115. Czosnyka M, Piechnik S, Richards HK, Kirkpatrick P, Smielewski P, Pickard JD. Contribution of mathematical modelling to the interpretation of bedside tests of cerebrovascular autoregulation. J Neurol Neurosurg Psychiatry. 1997;63(6):721-31. 116. Budohoski KP, Czosnyka M, de Riva N, Smielewski P, Pickard JD, Menon DK, et al. The relationship between cerebral blood flow autoregulation and cerebrovascular pressure reactivity after traumatic brain injury. Neurosurgery. 2012;71(3):652-60; discussion 60-1. 117. Steiner LA, Coles JP, Johnston AJ, Chatfield DA, Smielewski P, Fryer TD, et al. Assessment of cerebrovascular autoregulation in head-injured patients: a validation study. Stroke. 2003;34(10):2404-9. 118. Steiner LA, Coles JP, Czosnyka M, Minhas PS, Fryer TD, Aigbirhio FI, et al. Cerebrovascular pressure reactivity is related to global cerebral oxygen metabolism after head injury. J Neurol Neurosurg Psychiatry. 2003;74(6):765-70. 119. Czosnyka M, Smielewski P, Kirkpatrick P, Piechnik S, Laing R, Pickard JD. Continuous monitoring of cerebrovascular pressure-reactivity in head injury. Acta Neurochir Suppl. 1998;71:74-7. 120. Czosnyka M, Hutchinson PJ, Balestreri M, Hiler M, Smielewski P, Pickard JD. Monitoring and interpretation of intracranial pressure after head injury. Acta Neurochir Suppl. 2006;96:114-8. 121. Balestreri M, Czosnyka M, Hutchinson P, Steiner L, Hiler M, Smieleweski P, et al. Impact of Intracranial Pressure and Cerebral Perfusion Pressure on Severe Disability and Mortality After Head Injury. Neurocrit Care. 2006;04:8-13. 122. Steiner LA, Czosnyka M, Piechnik SK, Smielewski P, Chatfield D, Menon DK, et al. Continuous monitoring of cerebrovascular pressure reactivity allows determination of optimal cerebral perfusion pressure in patients with traumatic brain injury. Crit Care Med. 2002;30(4):733-8.

155 LIST OF REFERENCES
123. Brady KM, Lee JK, Kibler KK, Easley RB, Koehler RC, Shaffner DH. Continuous measurement of autoregulation by spontaneous fluctuations in cerebral perfusion pressure: comparison of 3 methods. Stroke. 2008;39(9):2531-7. 124. Lazaridis C, Smielewski P, Steiner LA, Brady KM, Hutchinson P, Pickard JD, et al. Optimal cerebral perfusion pressure: are we ready for it? Neurol Res. 2013;35(2):138-48. 125. Radolovich DK, Aries MJ, Castellani G, Corona A, Lavinio A, Smielewski P, et al. Pulsatile intracranial pressure and cerebral autoregulation after traumatic brain injury. Neurocrit Care. 2011;15(3):379-86. 126. Carrera E, Kim DJ, Castellani G, Zweifel C, Czosnyka Z, Kasparowicz M, et al. What shapes pulse amplitude of intracranial pressure? J Neurotrauma. 2010;27(2):317-24. 127. Aries MJ, Czosnyka M, Budohoski KP, Kolias AG, Radolovich DK, Lavinio A, et al. Continuous monitoring of cerebrovascular reactivity using pulse waveform of intracranial pressure. Neurocrit Care. 2012;17(1):67-76. 128. Soehle M, Jaeger M, Meixensberger J. Online assessment of brain tissue oxygen autoregulation in traumatic brain injury and subarachnoid hemorrhage. Neurological Res. 2003;25(4):411-7. 129. Radolovich DK, Czosnyka M, Timofeev I, Lavinio A, Hutchinson P, Gupta A, et al. Reactivity of brain tissue oxygen to change in cerebral perfusion pressure in head injured patients. Neurocrit Care. 2009;10(3):274-9. 130. Jaeger M. Different indices to assess cerebrovascular autoregulation have different dynamic properties. Neurocrit Care. 2010;13(1):163-5. 131. Dengler J, Frenzel C, Vajkoczy P, Wolf S, Horn P. Cerebral tissue oxygenation measured by two different probes: challenges and interpretation. Intensive Care Med. 2011;37(11):1809-15. 132. Grande PO. The Lund concept for the treatment of patients with severe traumatic brain injury. J Neurosurg Anesthesiol. 2011;23(4):358-62. 133. Zweifel C, Dias C, Smielewski P, Czosnyka M. Continuous time-domain monitoring of cerebral autoregulation in neurocritical care. Med Eng Phys. 2014;36(5):638-45. 134. Aries MJ, Czosnyka M, Budohoski KP, Steiner LA, Lavinio A, Kolias AG, et al. Continuous determination of optimal cerebral perfusion pressure in traumatic brain injury. Crit Care Med. 2012;40(8):2456-63. 135. Jennett B. Assessment of Outcome After Severe Brain Damage: a Practical Scale. The Lancet. 1975;305(7905):480-4. 136. Maas AI, Hukkelhoven CW, Marshall LF, Steyerberg EW. Prediction of outcome in traumatic brain injury with computed tomographic characteristics: a comparison between the computed tomographic classification and combinations of computed tomographic predictors. Neurosurgery. 2005;57(6):1173-82; discussion -82. 137. Sessler CN, Gosnell MS, Grap MJ, Brophy GM, O'Neal PV, Keane KA, et al. The Richmond Agitation-Sedation Scale: validity and reliability in adult intensive care unit patients. Am J Respir Crit Care Med. 2002;166(10):1338-44. 138. Kheirbek T, Pascual JL. Hypertonic saline for the treatment of intracranial hypertension. Curr Neurol Neurosci Rep. 2014;14(9):482. 139. Diringer MN. New trends in hyperosmolar therapy? Curr Opin Crit Care. 2013;19(2):77-82. 140. Wang LC, Papangelou A, Lin C, Mirski MA, Gottschalk A, Toung TJ. Comparison of Equivolume, Equiosmolar Solutions of Mannitol and Hypertonic Saline with or without Furosemide on Brain Water Content in Normal Rats. Anesthesiology. 2013;118(4):903-13. 141. Scalfani MT, Dhar R, Zazulia AR, Videen TO, Diringer MN. Effect of osmotic agents on regional cerebral blood flow in traumatic brain injury. J Crit Care. 2012;27(5):526 e7-12. 142. Bhardwaj A. Osmotherapy in neurocritical care. Curr Neurol Neurosci Rep. 2007;7(6):513-21. 143. Stocchetti N, Maas AI. Traumatic intracranial hypertension. N Engl J Med. 2014;370(22):2121-30.

156 LIST OF REFERENCES
144. Li LM, Timofeev I, Czosnyka M, Hutchinson PJ. Review article: the surgical approach to the management of increased intracranial pressure after traumatic brain injury. Anesth Analg. 2010;111(3):736-48. 145. Czosnyka M, Whitehouse H, Smielewski P, Kirkpatrick P, Guazzo EP, Pickard JD. Computer supported multimodal bed-side monitoring for neuro intensive care. Int J Clin Monit Comput. 1994;11(4):223-32.146. Smielewski P, Czosnyka M, Zabolotny W, Kirkpatrick P, Richards H, Pickard JD. A computing system for the clinical and experimental investigation of cerebrovascular reactivity. Int J Clin Monit Comput. 1997;14(3):185-98. 147. Smielewski P, Czosnyka M, Steiner L, Belestri M, Piechnik S, Pickard JD. ICM+: software for on-line analysis of bedside monitoring data after severe head trauma. Acta Neurochir Suppl. 2005;95:43-9. 148. Team RDC. R: A Language and Environment for Statistical Computing. Vienna, Austria: R Foundation for Statistical Computing; 2012.

“Quando você quer alguma coisa, todo o Universo conspira para que você realize o seu desejo.”
“When you really want something all the universe conspires in helping you to achieve it.”
in “O Alquimista”, Paulo Coelho