Marcus & Millichap / IPA Multifamily Forum: New England 2017 - Speaker Slides
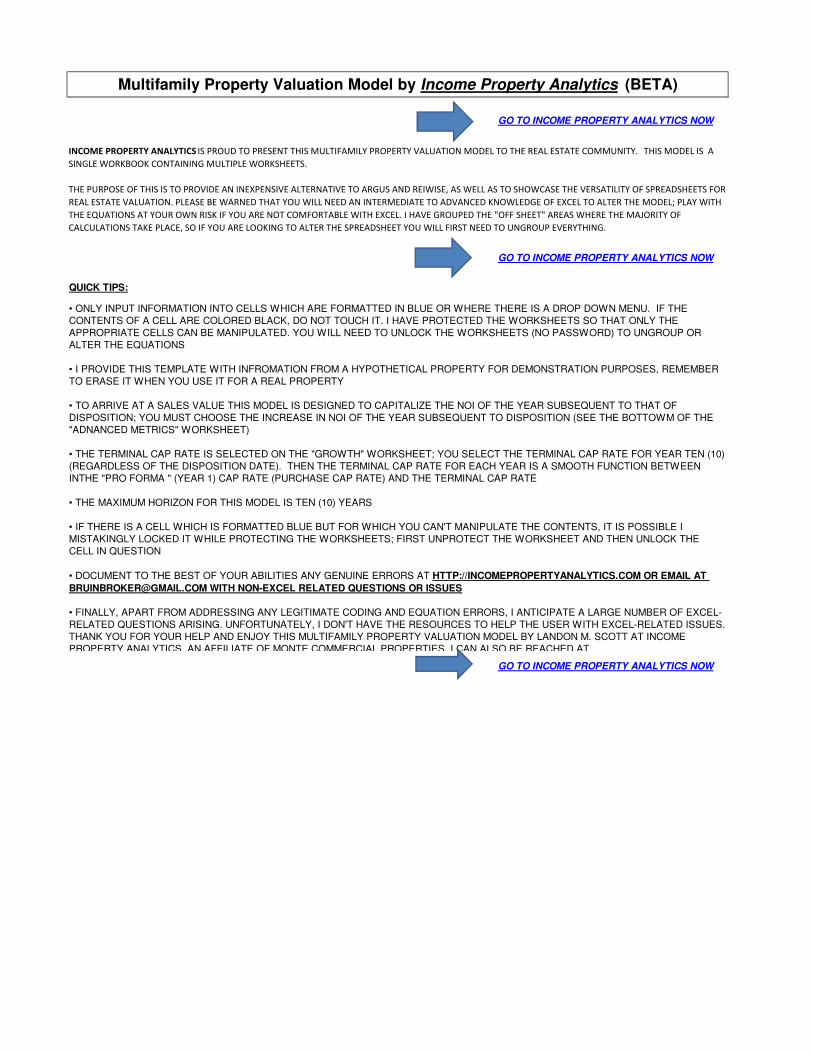
QUICK TIPS:
• ONLY INPUT INFORMATION INTO CELLS WHICH ARE FORMATTED IN BLUE OR WHERE THERE IS A DROP DOWN MENU. IF THE CONTENTS OF A CELL ARE COLORED BLACK, DO NOT TOUCH IT. I HAVE PROTECTED THE WORKSHEETS SO THAT ONLY THE APPROPRIATE CELLS CAN BE MANIPULATED. YOU WILL NEED TO UNLOCK THE WORKSHEETS (NO PASSWORD) TO UNGROUP OR ALTER THE EQUATIONS
• I PROVIDE THIS TEMPLATE WITH INFROMATION FROM A HYPOTHETICAL PROPERTY FOR DEMONSTRATION PURPOSES, REMEMBER TO ERASE IT WHEN YOU USE IT FOR A REAL PROPERTY
• TO ARRIVE AT A SALES VALUE THIS MODEL IS DESIGNED TO CAPITALIZE THE NOI OF THE YEAR SUBSEQUENT TO THAT OF DISPOSITION; YOU MUST CHOOSE THE INCREASE IN NOI OF THE YEAR SUBSEQUENT TO DISPOSITION (SEE THE BOTTOWM OF THE "ADNANCED METRICS" WORKSHEET)
• THE TERMINAL CAP RATE IS SELECTED ON THE "GROWTH" WORKSHEET; YOU SELECT THE TERMINAL CAP RATE FOR YEAR TEN (10) (REGARDLESS OF THE DISPOSITION DATE). THEN THE TERMINAL CAP RATE FOR EACH YEAR IS A SMOOTH FUNCTION BETWEEN INTHE "PRO FORMA " (YEAR 1) CAP RATE (PURCHASE CAP RATE) AND THE TERMINAL CAP RATE
• THE MAXIMUM HORIZON FOR THIS MODEL IS TEN (10) YEARS
• IF THERE IS A CELL WHICH IS FORMATTED BLUE BUT FOR WHICH YOU CAN'T MANIPULATE THE CONTENTS, IT IS POSSIBLE I MISTAKINGLY LOCKED IT WHILE PROTECTING THE WORKSHEETS; FIRST UNPROTECT THE WORKSHEET AND THEN UNLOCK THE CELL IN QUESTION
• DOCUMENT TO THE BEST OF YOUR ABILITIES ANY GENUINE ERRORS AT HTTP://INCOMEPROPERTYANALYTICS.COM OR EMAIL AT
[email protected] WITH NON-EXCEL RELATED QUESTIONS OR ISSUES
• FINALLY, APART FROM ADDRESSING ANY LEGITIMATE CODING AND EQUATION ERRORS, I ANTICIPATE A LARGE NUMBER OF EXCEL-RELATED QUESTIONS ARISING. UNFORTUNATELY, I DON'T HAVE THE RESOURCES TO HELP THE USER WITH EXCEL-RELATED ISSUES. THANK YOU FOR YOUR HELP AND ENJOY THIS MULTIFAMILY PROPERTY VALUATION MODEL BY LANDON M. SCOTT AT INCOME PROPERTY ANALYTICS, AN AFFILIATE OF MONTE COMMERCIAL PROPERTIES. I CAN ALSO BE REACHED AT
GO TO INCOME PROPERTY ANALYTICS NOW
GO TO INCOME PROPERTY ANALYTICS NOW
GO TO INCOME PROPERTY ANALYTICS NOW
Multifamily Property Valuation Model by Income Property Analytics (BETA)
INCOME PROPERTY ANALYTICS IS PROUD TO PRESENT THIS MULTIFAMILY PROPERTY VALUATION MODEL TO THE REAL ESTATE COMMUNITY. THIS MODEL IS A
SINGLE WORKBOOK CONTAINING MULTIPLE WORKSHEETS.
THE PURPOSE OF THIS IS TO PROVIDE AN INEXPENSIVE ALTERNATIVE TO ARGUS AND REIWISE, AS WELL AS TO SHOWCASE THE VERSATILITY OF SPREADSHEETS FOR
REAL ESTATE VALUATION. PLEASE BE WARNED THAT YOU WILL NEED AN INTERMEDIATE TO ADVANCED KNOWLEDGE OF EXCEL TO ALTER THE MODEL; PLAY WITH
THE EQUATIONS AT YOUR OWN RISK IF YOU ARE NOT COMFORTABLE WITH EXCEL. I HAVE GROUPED THE "OFF SHEET" AREAS WHERE THE MAJORITY OF
CALCULATIONS TAKE PLACE, SO IF YOU ARE LOOKING TO ALTER THE SPREADSHEET YOU WILL FIRST NEED TO UNGROUP EVERYTHING.
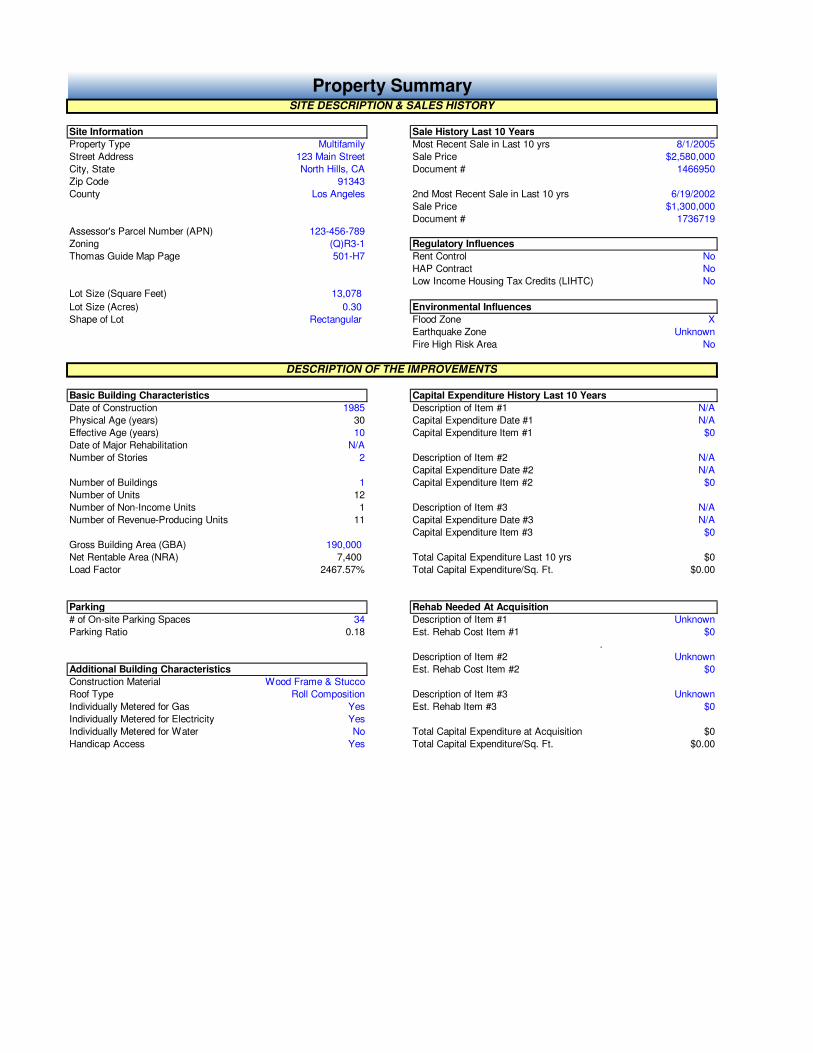
Site Information Sale History Last 10 Years
Property Type Multifamily Most Recent Sale in Last 10 yrs 8/1/2005
Street Address 123 Main Street Sale Price $2,580,000
City, State North Hills, CA Document # 1466950
Zip Code 91343
County Los Angeles 2nd Most Recent Sale in Last 10 yrs 6/19/2002
Sale Price $1,300,000
Document # 1736719
Assessor's Parcel Number (APN) 123-456-789
Zoning (Q)R3-1 Regulatory Influences
Thomas Guide Map Page 501-H7 Rent Control No
HAP Contract No
Low Income Housing Tax Credits (LIHTC) No
Lot Size (Square Feet) 13,078
Lot Size (Acres) 0.30 Environmental Influences
Shape of Lot Rectangular Flood Zone X
Earthquake Zone Unknown
Fire High Risk Area No
Basic Building Characteristics Capital Expenditure History Last 10 Years
Date of Construction 1985 Description of Item #1 N/A
Physical Age (years) 30 Capital Expenditure Date #1 N/A
Effective Age (years) 10 Capital Expenditure Item #1 $0
Date of Major Rehabilitation N/A
Number of Stories 2 Description of Item #2 N/A
Capital Expenditure Date #2 N/A
Number of Buildings 1 Capital Expenditure Item #2 $0
Number of Units 12
Number of Non-Income Units 1 Description of Item #3 N/A
Number of Revenue-Producing Units 11 Capital Expenditure Date #3 N/A
Capital Expenditure Item #3 $0
Gross Building Area (GBA) 190,000
Net Rentable Area (NRA) 7,400 Total Capital Expenditure Last 10 yrs $0
Load Factor 2467.57% Total Capital Expenditure/Sq. Ft. $0.00
Parking Rehab Needed At Acquisition
# of On-site Parking Spaces 34 Description of Item #1 Unknown
Parking Ratio 0.18 Est. Rehab Cost Item #1 $0
.
Description of Item #2 Unknown
Additional Building Characteristics Est. Rehab Cost Item #2 $0
Construction Material Wood Frame & Stucco
Roof Type Roll Composition Description of Item #3 Unknown
Individually Metered for Gas Yes Est. Rehab Item #3 $0
Individually Metered for Electricity Yes
Individually Metered for Water No Total Capital Expenditure at Acquisition $0
Handicap Access Yes Total Capital Expenditure/Sq. Ft. $0.00
Property SummarySITE DESCRIPTION & SALES HISTORY
DESCRIPTION OF THE IMPROVEMENTS
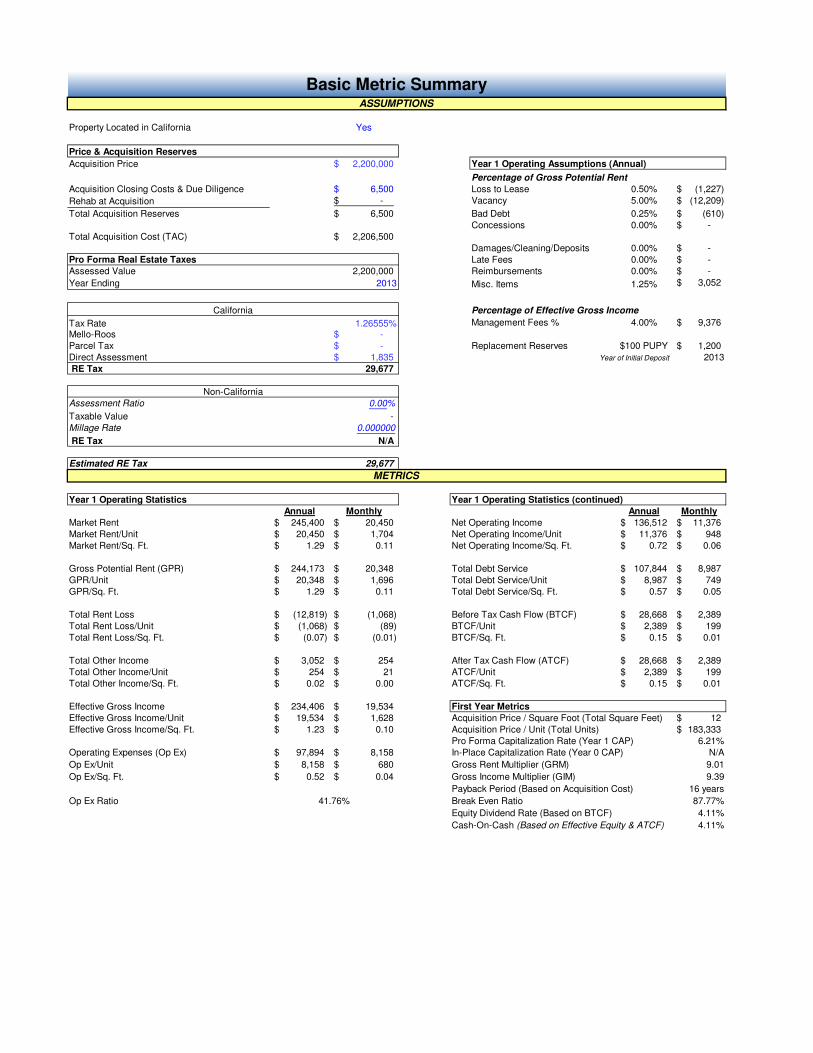
Property Located in California Yes
Price & Acquisition Reserves
Acquisition Price 2,200,000$ Year 1 Operating Assumptions (Annual)
Percentage of Gross Potential Rent
Acquisition Closing Costs & Due Diligence 6,500$ Loss to Lease 0.50% (1,227)$
Rehab at Acquisition -$ Vacancy 5.00% (12,209)$
Total Acquisition Reserves 6,500$ Bad Debt 0.25% (610)$
Concessions 0.00% -$
Total Acquisition Cost (TAC) 2,206,500$
Damages/Cleaning/Deposits 0.00% -$
Pro Forma Real Estate Taxes Late Fees 0.00% -$
Assessed Value 2,200,000 Reimbursements 0.00% -$
Year Ending 2013 Misc. Items 1.25% 3,052$
Percentage of Effective Gross Income
Tax Rate 1.26555% Management Fees % 4.00% 9,376$
Mello-Roos -$
Parcel Tax -$ Replacement Reserves $100 PUPY 1,200$
Direct Assessment 1,835$ Year of Initial Deposit 2013
RE Tax 29,677
Assessment Ratio 0.00%
Taxable Value -
Millage Rate 0.000000
RE Tax N/A
Estimated RE Tax 29,677
Year 1 Operating Statistics Year 1 Operating Statistics (continued)
Annual Monthly Annual Monthly
Market Rent 245,400$ 20,450$ Net Operating Income 136,512$ 11,376$
Market Rent/Unit 20,450$ 1,704$ Net Operating Income/Unit 11,376$ 948$
Market Rent/Sq. Ft. 1.29$ 0.11$ Net Operating Income/Sq. Ft. 0.72$ 0.06$
Gross Potential Rent (GPR) 244,173$ 20,348$ Total Debt Service 107,844$ 8,987$
GPR/Unit 20,348$ 1,696$ Total Debt Service/Unit 8,987$ 749$
GPR/Sq. Ft. 1.29$ 0.11$ Total Debt Service/Sq. Ft. 0.57$ 0.05$
Total Rent Loss (12,819)$ (1,068)$ Before Tax Cash Flow (BTCF) 28,668$ 2,389$
Total Rent Loss/Unit (1,068)$ (89)$ BTCF/Unit 2,389$ 199$
Total Rent Loss/Sq. Ft. (0.07)$ (0.01)$ BTCF/Sq. Ft. 0.15$ 0.01$
Total Other Income 3,052$ 254$ After Tax Cash Flow (ATCF) 28,668$ 2,389$
Total Other Income/Unit 254$ 21$ ATCF/Unit 2,389$ 199$
Total Other Income/Sq. Ft. 0.02$ 0.00$ ATCF/Sq. Ft. 0.15$ 0.01$
Effective Gross Income 234,406$ 19,534$ First Year Metrics
Effective Gross Income/Unit 19,534$ 1,628$ Acquisition Price / Square Foot (Total Square Feet) 12$
Effective Gross Income/Sq. Ft. 1.23$ 0.10$ Acquisition Price / Unit (Total Units) 183,333$
Pro Forma Capitalization Rate (Year 1 CAP) 6.21%
Operating Expenses (Op Ex) 97,894$ 8,158$ In-Place Capitalization Rate (Year 0 CAP) N/A
Op Ex/Unit 8,158$ 680$ Gross Rent Multiplier (GRM) 9.01
Op Ex/Sq. Ft. 0.52$ 0.04$ Gross Income Multiplier (GIM) 9.39
Payback Period (Based on Acquisition Cost) 16 years
Op Ex Ratio Break Even Ratio 87.77%
Equity Dividend Rate (Based on BTCF) 4.11%
Cash-On-Cash (Based on Effective Equity & ATCF) 4.11%
41.76%
Basic Metric SummaryASSUMPTIONS
METRICS
California
Non-California

Timing Depreciation Analysis
Acquisition Date Jan. 2013 Value of Improvements % of Property Value
Disposition Date Dec. 2022 1,500,000$ 68%
Investment Hold Period (years) 10
Acquisition Price 2,200,000$
Total Capital Expenditures at Acquisition -$
Financing Depreciable Amount 1,495,581$
Loan #1
Fixed or Variable interest rate? Fixed Years of Depreciation Straight Line 27.5 yrs
Loan-to-Value (LTV) 70.00% Annual Depreciation (Full Year) 54,385$
Loan Amount 1,540,000$ Depreciation Allowed in Acquisition Year 52,150$
Loan Points/Origination Fee 2.00%
Total Amount Funded 1,509,200$ Total Recapture at Time of Disposition -$
Fixed Interest Rate (If applicable) 5.75% Total Recapture Tax at Time of Disposition 541,613$
Amortization (months) / Due in (months) 360 months 120 months
Prepayment Penalties 2.00% Tax Rates
End of Yield Maintenance Dec. 2022 Include? Rate
Start Date Jan. 2013 Federal Income Tax Rate No 35.00%
Maturity Date Jan. 2023 Federal Capital Gains Tax Rate No 15.00%
Federal Recapture Tax Rate No 25.00%
Loan #2
Fixed or Variable interest rate? Fixed State Tax Rate (CA) No 9.33%
Loan-to-Value (LTV) 0.00%
Loan Amount -$ Discount Rate & Reinvestment Rate
Loan Points/Origination Fee 2.00% Vanguard's REIT Index Fund, 10 year performance 12.35%
Total Amount Funded -$ (Benchmark for Risk Premium)
Fixed Interest Rate (If applicable) 2.00% 1 year CD as quoted by BankRate.com 0.75%
Amortization (months) / Due in (months) 360 months 120 months (Benchmark for Reinvestment Rate)
Prepayment Penalties 0.00%
End of Yield Maintenance Dec. 2022 10 Year Treasury Note 1.86%
Start Date Jan. 2013 Risk Premium 6.64%
Maturity Date N/A Discount Rate (Used for NPV & MIRR) 8.50%
Reinvestment/Savings Rate (Used for MIRR) 1.00%
Sources (Includes All Junior Financing) Performance Analysis
Debt 1,540,000$ Acquisition Price 2,200,000$
Equity Invested 660,000$
Estimated Acquisition Price 2,200,000$ Acquisition Closing Costs & Due Diligence 6,500$
Rehab at Acquisition -$
LTV % 70.00% Total Acquisition Reserves 6,500$
Loan Amount 1,540,000$ Total Acquisition Cost (TAC) 2,206,500$
Loan Points/Origination Fee (30,800)$
Total Debt Financing 1,509,200$ Net Present Value (NPV) (239,224)$
Equity Investment 660,000$ Internal Rates of Return
Loan Points/Origination Fee 30,800$ IRR MIRR
Acquisition Reserves (Includes Closing & Rehab Costs) 6,500$ 10 Year (Unleveraged) 7.08% 5.64%
Total Out of Pocket 697,300$ 10 Year (Leveraged) 8.40% 7.12%
10 Year After-Tax (Leveraged) 8.40% 7.12%
Total Annual Debt Service Payment 107,844$
Consolidated Loan Constant 7.003%
Consolidated Debt Service Coverage (Year 1) 1.27 Partition of Cash Flows
(Unleveraged) Amount %
Effective Cost of Debt (Includes Points & PPP) PV of Pre-Sale Cash Flows 967,416$ 49.18%
Loan #1 6.45% PV of Net Sale Proceeds 999,860$ 50.82%
Loan #2 N/A Total PV of Cash Flows 1,967,276$ 100.00%
Loan #3 N/A
(After-Tax, Leveraged) Amount %
PV of Pre-Sale Cash Flows 259,812$ 38.08%
Dec. 2022 PV of Net Sale Proceeds 422,389$ 61.92%
Average % Increase in NOI 1.98% Total PV of Cash Flows 682,202$ 100.00%
% Increase in Sale Year NOI (to capitalize Sale Year + 1 NOI) 3.00%
Terminal Cap Rate (year 10 ) 7.00% Effective Duration (Macaulay Duration)
Estimated Sales Price 2,395,943$ Actual Duration of Cash Flows 10 yrs
Effective Duration 7.54 yrs
Transaction Costs (% of Sales Price) 5.50%
Other Closing Costs ($) 3,500$
Junior Loan
Senior Loan
Residual Value & Disposition
ASSUMPTIONS
Advanced Metric Summary
METRICS

Loan #1 Loan #2 Loan #3
Loan Amount 1,540,000 Start 1/1/2013 Loan Amount 0 Start 1/1/2013 Loan Amount 0 Start 1/1/2013Fixed Rate 5.75% Maturity 1/1/2023 Rate 2.00% Maturity N/A Rate 0.00% Maturity N/AFixed Pmt (mo) 8,987.02 Fixed Pmt (mo) 0.00 Fixed Pmt (mo) 0.00Amortization 360 mos. Amortization 360 mos. Amortization 360 mos.Due In 120 mos. Due In 120 mos. Due In 120 mos.Principal Reduction 120 mos. Principal Reduction Principal Reduction
Annual Summary - Loan #1 Annual Summary - Loan #2 Annual Summary - Loan #3
Payments 1st Year 107,844$ Payments 1st Year - Payments 1st Year - Loan Constant 1st Year 7.00% Loan Constant 1st Year 0.00% Loan Constant 1st Year 0.00%Interest Only for Period? No Interest Only for Period? No Interest Only for Period? No
If yes, what is the applicable Interest Only rate? 0.00% If yes, what is the applicable Interest Only rate? If yes, what is the applicable Interest Only rate?If yes, when does amortization resume? If yes, when does amortization resume? If yes, when does amortization resume?
Variable Rate for Period?* No Variable Rate for Period? No Variable Rate for Period? NoIf yes, when does fixed/Interest Only rate resume? If yes, when does fixed/Interest Only rate resume? If yes, when does fixed/Interest Only rate resume?
Amortization - Loan #1 Amortization - Loan #2 Amortization - Loan #3
Pmt. # Month Pmt. Interest Principal Balance Pmt. # Month Pmt. Interest Principal Balance Pmt. # Month Pmt. Interest Principal Balance 001 Jan. '13 8,987$ 7,379$ 1,608$ 1,538,392$ 001 Jan. '13 -$ -$ -$ -$ 001 Jan. '13 -$ -$ -$ -$ 002 Feb. '13 8,987$ 7,371$ 1,616$ 1,536,777$ 002 Feb. '13 -$ -$ -$ -$ 002 Feb. '13 -$ -$ -$ -$ 003 Mar. '13 8,987$ 7,364$ 1,623$ 1,535,153$ 003 Mar. '13 -$ -$ -$ -$ 003 Mar. '13 -$ -$ -$ -$ 004 Apr. '13 8,987$ 7,356$ 1,631$ 1,533,522$ 004 Apr. '13 -$ -$ -$ -$ 004 Apr. '13 -$ -$ -$ -$ 005 May. '13 8,987$ 7,348$ 1,639$ 1,531,883$ 005 May. '13 -$ -$ -$ -$ 005 May. '13 -$ -$ -$ -$ 006 Jun. '13 8,987$ 7,340$ 1,647$ 1,530,237$ 006 Jun. '13 -$ -$ -$ -$ 006 Jun. '13 -$ -$ -$ -$ 007 Jul. '13 8,987$ 7,332$ 1,655$ 1,528,582$ 007 Jul. '13 -$ -$ -$ -$ 007 Jul. '13 -$ -$ -$ -$ 008 Aug. '13 8,987$ 7,324$ 1,663$ 1,526,919$ 008 Aug. '13 -$ -$ -$ -$ 008 Aug. '13 -$ -$ -$ -$ 009 Sep. '13 8,987$ 7,316$ 1,671$ 1,525,249$ 009 Sep. '13 -$ -$ -$ -$ 009 Sep. '13 -$ -$ -$ -$ 010 Oct. '13 8,987$ 7,308$ 1,679$ 1,523,570$ 010 Oct. '13 -$ -$ -$ -$ 010 Oct. '13 -$ -$ -$ -$ 011 Nov. '13 8,987$ 7,300$ 1,687$ 1,521,884$ 011 Nov. '13 -$ -$ -$ -$ 011 Nov. '13 -$ -$ -$ -$ 012 Dec. '13 8,987$ 7,292$ 1,695$ 1,520,189$ 012 Dec. '13 -$ -$ -$ -$ 012 Dec. '13 -$ -$ -$ -$ 013 Jan. '14 8,987$ 7,284$ 1,703$ 1,518,486$ 013 Jan. '14 -$ -$ -$ -$ 013 Jan. '14 -$ -$ -$ -$ 014 Feb. '14 8,987$ 7,276$ 1,711$ 1,516,775$ 014 Feb. '14 -$ -$ -$ -$ 014 Feb. '14 -$ -$ -$ -$ 015 Mar. '14 8,987$ 7,268$ 1,719$ 1,515,056$ 015 Mar. '14 -$ -$ -$ -$ 015 Mar. '14 -$ -$ -$ -$ 016 Apr. '14 8,987$ 7,260$ 1,727$ 1,513,329$ 016 Apr. '14 -$ -$ -$ -$ 016 Apr. '14 -$ -$ -$ -$ 017 May. '14 8,987$ 7,251$ 1,736$ 1,511,593$ 017 May. '14 -$ -$ -$ -$ 017 May. '14 -$ -$ -$ -$ 018 Jun. '14 8,987$ 7,243$ 1,744$ 1,509,849$ 018 Jun. '14 -$ -$ -$ -$ 018 Jun. '14 -$ -$ -$ -$ 019 Jul. '14 8,987$ 7,235$ 1,752$ 1,508,097$ 019 Jul. '14 -$ -$ -$ -$ 019 Jul. '14 -$ -$ -$ -$ 020 Aug. '14 8,987$ 7,226$ 1,761$ 1,506,336$ 020 Aug. '14 -$ -$ -$ -$ 020 Aug. '14 -$ -$ -$ -$ 021 Sep. '14 8,987$ 7,218$ 1,769$ 1,504,567$ 021 Sep. '14 -$ -$ -$ -$ 021 Sep. '14 -$ -$ -$ -$ 022 Oct. '14 8,987$ 7,209$ 1,778$ 1,502,789$ 022 Oct. '14 -$ -$ -$ -$ 022 Oct. '14 -$ -$ -$ -$ 023 Nov. '14 8,987$ 7,201$ 1,786$ 1,501,003$ 023 Nov. '14 -$ -$ -$ -$ 023 Nov. '14 -$ -$ -$ -$ 024 Dec. '14 8,987$ 7,192$ 1,795$ 1,499,208$ 024 Dec. '14 -$ -$ -$ -$ 024 Dec. '14 -$ -$ -$ -$ 025 Jan. '15 8,987$ 7,184$ 1,803$ 1,497,405$ 025 Jan. '15 -$ -$ -$ -$ 025 Jan. '15 -$ -$ -$ -$ 026 Feb. '15 8,987$ 7,175$ 1,812$ 1,495,593$ 026 Feb. '15 -$ -$ -$ -$ 026 Feb. '15 -$ -$ -$ -$ 027 Mar. '15 8,987$ 7,166$ 1,821$ 1,493,773$ 027 Mar. '15 -$ -$ -$ -$ 027 Mar. '15 -$ -$ -$ -$ 028 Apr. '15 8,987$ 7,158$ 1,829$ 1,491,943$ 028 Apr. '15 -$ -$ -$ -$ 028 Apr. '15 -$ -$ -$ -$ 029 May. '15 8,987$ 7,149$ 1,838$ 1,490,105$ 029 May. '15 -$ -$ -$ -$ 029 May. '15 -$ -$ -$ -$ 030 Jun. '15 8,987$ 7,140$ 1,847$ 1,488,258$ 030 Jun. '15 -$ -$ -$ -$ 030 Jun. '15 -$ -$ -$ -$ 031 Jul. '15 8,987$ 7,131$ 1,856$ 1,486,402$ 031 Jul. '15 -$ -$ -$ -$ 031 Jul. '15 -$ -$ -$ -$ 032 Aug. '15 8,987$ 7,122$ 1,865$ 1,484,538$ 032 Aug. '15 -$ -$ -$ -$ 032 Aug. '15 -$ -$ -$ -$ 033 Sep. '15 8,987$ 7,113$ 1,874$ 1,482,664$ 033 Sep. '15 -$ -$ -$ -$ 033 Sep. '15 -$ -$ -$ -$ 034 Oct. '15 8,987$ 7,104$ 1,883$ 1,480,781$ 034 Oct. '15 -$ -$ -$ -$ 034 Oct. '15 -$ -$ -$ -$ 035 Nov. '15 8,987$ 7,095$ 1,892$ 1,478,890$ 035 Nov. '15 -$ -$ -$ -$ 035 Nov. '15 -$ -$ -$ -$ 036 Dec. '15 8,987$ 7,086$ 1,901$ 1,476,989$ 036 Dec. '15 -$ -$ -$ -$ 036 Dec. '15 -$ -$ -$ -$ 037 Jan. '16 8,987$ 7,077$ 1,910$ 1,475,079$ 037 Jan. '16 -$ -$ -$ -$ 037 Jan. '16 -$ -$ -$ -$ 038 Feb. '16 8,987$ 7,068$ 1,919$ 1,473,160$ 038 Feb. '16 -$ -$ -$ -$ 038 Feb. '16 -$ -$ -$ -$ 039 Mar. '16 8,987$ 7,059$ 1,928$ 1,471,232$ 039 Mar. '16 -$ -$ -$ -$ 039 Mar. '16 -$ -$ -$ -$ 040 Apr. '16 8,987$ 7,050$ 1,937$ 1,469,295$ 040 Apr. '16 -$ -$ -$ -$ 040 Apr. '16 -$ -$ -$ -$ 041 May. '16 8,987$ 7,040$ 1,947$ 1,467,348$ 041 May. '16 -$ -$ -$ -$ 041 May. '16 -$ -$ -$ -$ 042 Jun. '16 8,987$ 7,031$ 1,956$ 1,465,392$ 042 Jun. '16 -$ -$ -$ -$ 042 Jun. '16 -$ -$ -$ -$ 043 Jul. '16 8,987$ 7,022$ 1,965$ 1,463,427$ 043 Jul. '16 -$ -$ -$ -$ 043 Jul. '16 -$ -$ -$ -$ 044 Aug. '16 8,987$ 7,012$ 1,975$ 1,461,452$ 044 Aug. '16 -$ -$ -$ -$ 044 Aug. '16 -$ -$ -$ -$ 045 Sep. '16 8,987$ 7,003$ 1,984$ 1,459,468$ 045 Sep. '16 -$ -$ -$ -$ 045 Sep. '16 -$ -$ -$ -$ 046 Oct. '16 8,987$ 6,993$ 1,994$ 1,457,474$ 046 Oct. '16 -$ -$ -$ -$ 046 Oct. '16 -$ -$ -$ -$ 047 Nov. '16 8,987$ 6,984$ 2,003$ 1,455,471$ 047 Nov. '16 -$ -$ -$ -$ 047 Nov. '16 -$ -$ -$ -$ 048 Dec. '16 8,987$ 6,974$ 2,013$ 1,453,458$ 048 Dec. '16 -$ -$ -$ -$ 048 Dec. '16 -$ -$ -$ -$ 049 Jan. '17 8,987$ 6,964$ 2,023$ 1,451,436$ 049 Jan. '17 -$ -$ -$ -$ 049 Jan. '17 -$ -$ -$ -$ 050 Feb. '17 8,987$ 6,955$ 2,032$ 1,449,403$ 050 Feb. '17 -$ -$ -$ -$ 050 Feb. '17 -$ -$ -$ -$
Financing
* variable rates forecast found on "Growth" worksheet; If both "Interest Only" and
"Variable" are indicated, the variable rates will be used. If no resume date is
selected for "Interest Only" or "Variable" rate period, it is assumed the note is
interest only and/or variable till maturity
* variable rates forecast found on "Growth" worksheet; If both "Interest Only" and
"Variable" are indicated, the variable rates will be used. If no resume date is
selected for "Interest Only" or "Variable" rate period, it is assumed the note is
interest only and/or variable till maturity
* variable rates forecast found on "Growth" worksheet; If both "Interest Only" and
"Variable" are indicated, the variable rates will be used. If no resume date is
selected for "Interest Only" or "Variable" rate period, it is assumed the note is
interest only and/or variable till maturity
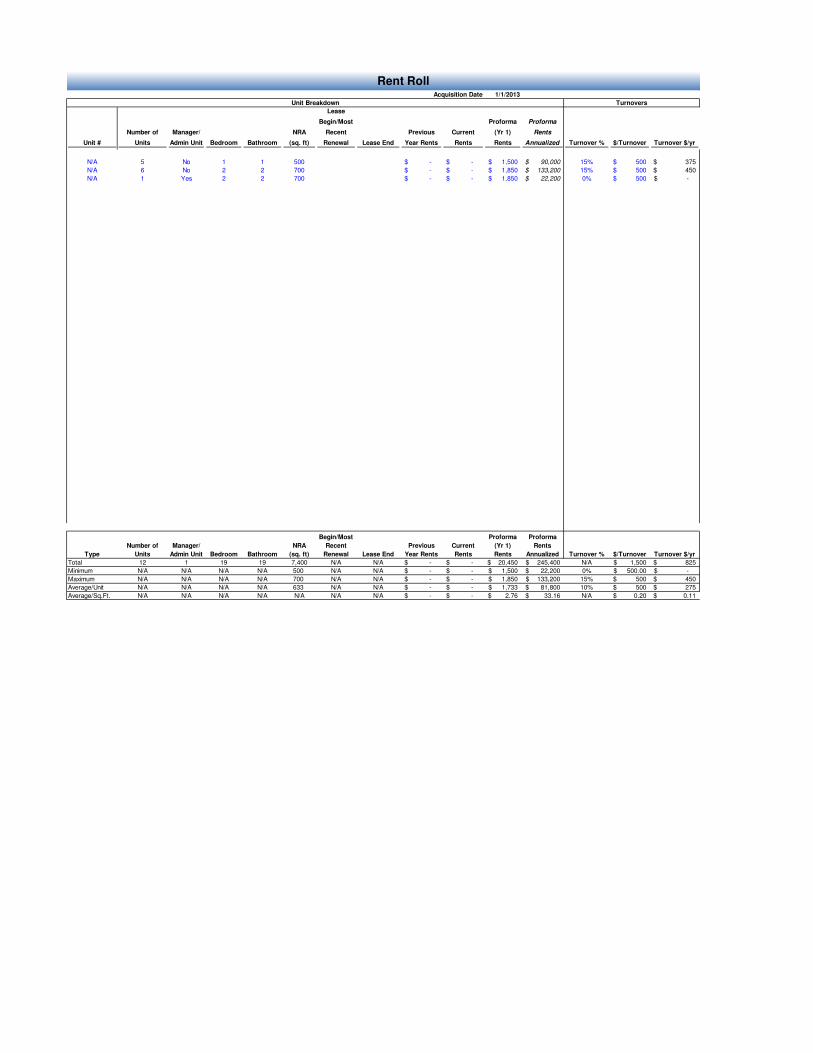
Acquisition Date 1/1/2013
Unit #
Number of
Units
Manager/
Admin Unit Bedroom Bathroom
NRA
(sq. ft)
Lease
Begin/Most
Recent
Renewal Lease End
Previous
Year Rents
Current
Rents
Proforma
(Yr 1)
Rents
Proforma
Rents
Annualized Turnover % $/Turnover Turnover $/yr
N/A 5 No 1 1 500 -$ -$ 1,500$ 90,000$ 15% 500$ 375$
N/A 6 No 2 2 700 -$ -$ 1,850$ 133,200$ 15% 500$ 450$
N/A 1 Yes 2 2 700 -$ -$ 1,850$ 22,200$ 0% 500$ -$
Type
Number of
Units
Manager/
Admin Unit Bedroom Bathroom
NRA
(sq. ft)
Lease
Begin/Most
Recent
Renewal Lease End
Previous
Year Rents
Current
Rents
Proforma
(Yr 1)
Rents
Proforma
Rents
Annualized Turnover % $/Turnover Turnover $/yr
Total 12 1 19 19 7,400 N/A N/A -$ -$ 20,450$ 245,400$ N/A 1,500$ 825$
Minimum N/A N/A N/A N/A 500 N/A N/A -$ -$ 1,500$ 22,200$ 0% 500.00$ -$
Maximum N/A N/A N/A N/A 700 N/A N/A -$ -$ 1,850$ 133,200$ 15% 500$ 450$
Average/Unit N/A N/A N/A N/A 633 N/A N/A -$ -$ 1,733$ 81,800$ 10% 500$ 275$
Average/Sq.Ft. N/A N/A N/A N/A N/A N/A N/A -$ -$ 2.76$ 33.16$ N/A 0.20$ 0.11$
Rent Roll
Unit Breakdown Turnovers

Pro Forma Payroll
Maintenance
Grounds/Custodial 0 -$ 0 -$ -$ Maint. Supervisor 0 -$ 0 -$ -$
Maint. Assistant 0 -$ 0 -$ -$
Total 0 N/A N/A -$ -$
Administrative
Manager 1 10.00$ 50 500$ 6,000$
Manager's Unit 1 N/A N/A 1,850$ 22,200$
Assistant Manager 0 -$ 0 -$ -$
Leasing Commission N/A N/A N/A N/A N/A
Total 2 N/A 50 2,350$ 28,200$
Total Employees 2
Total Wages 2,350$ 28,200$
Benefits & Insurance 7.50% 176$ 2,115$
Total Payroll 2,526$ 30,315$
Payroll
# of
employees
Hourly
Wage
Hours/
Month
Monthly
Expense
Annual
Expense

Acquisition Date: Jan. 2013
Sale Date: Dec. 2022
Previous Year Available No Previous Year Available No Current Year Available No
Number of Units: 12
Previous Year Previous Year Current Year* Pro Forma (Yr 1)* Figures Annualized
Results from Operations 2010 Per Unit Note 2011 Per Unit Note 2012 Per Unit Note
Pro Forma
% 2013 Per Unit Note
Market Rent -$ - -$ - -$ - 2 245,400$ 20,450 3
Loss to Lease % 0.5%
Loss to Lease -$ - -$ - -$ - 0.50% (1,227)$ (102)
Gross Potential Rent -$ - -$ - -$ - 244,173$ 20,348
Vacancy Loss % 5.0%
Vacancy -$ - -$ - -$ - 5.00% (12,209)$ (1,017)
Other Rental Loss % 0.25%
Bad Debt -$ - -$ - -$ - 0.25% (610)$ (51)
Concessions -$ - -$ - -$ - 0.00% -$ -
Total Rent Loss -$ - -$ - -$ - 0.25% (12,819)$ (1,068)
Damages/Cleaning/Forfeited Deposits -$ -$ -$ - 0.00% -$ -
Late Fees -$ - -$ - -$ - 0.00% -$ -
Reimbursements -$ - -$ - -$ - 0.00% -$ -
Misc. Items -$ - -$ - -$ - 1.25% 3,052$ 254
Total Other Income -$ - -$ - -$ - 1.25% 3,052$ 254
EGI -$ - -$ - -$ - 234,406$ 19,534
Mgt. Fee -$ - -$ - -$ - 4.00% 9,376$ 781
Payroll (Includes Manager's Unit, if any) -$ - -$ - -$ - 28,200$ 2,350
Payroll Taxes & Benefits -$ - -$ - -$ - 7.50% 2,115$ 176
Bookkeeping & Accounting -$ - -$ - -$ - 500$ 42
Legal & Professional -$ - -$ - -$ - -$ -
Office Supplies & Other -$ - -$ - -$ - 500$ 42
Total Administrative -$ - -$ - -$ - 1,000$ 83
Turnover -$ - -$ - -$ - 825$ 69
Plumbing / HVAC -$ - -$ - -$ - -$ -
Janitorial -$ - -$ - -$ - -$ -
Landscaping -$ - -$ - -$ - 1,250$ 104
Pest Control -$ - -$ - -$ - 1,000$ 83
Fire & Safety -$ - -$ - -$ - 500$ 42
Other Maintenance -$ - -$ - -$ - 1,000$ 83
Security -$ - -$ - -$ - -$ -
Total Repairs & Maintenance -$ - -$ - -$ - 4,575$ 381
- - - -
Promotional & Advertising -$ - -$ - -$ - -$ -
Electricity (vacant and/or common) -$ - -$ - -$ - 7,500$ 625
Gas (vacant and/or common) -$ - -$ - -$ - 750$ 63
Water -$ - -$ - -$ - 8,000$ 667
Sewer -$ - -$ - -$ - -$ -
Cable -$ - -$ - -$ - -$ -
Garbage Collection -$ - -$ - -$ - 1,000$ 83.33
Total Utilities -$ - -$ - -$ - 17,250$ 1,438
Real Estate Taxes -$ - -$ - -$ - 29,677$ 2,473
Property Insurance -$ - -$ - -$ - 4,500$ 375
Operating Expenses -$ - -$ - -$ - 96,694$ 8,058
Replacement Reserves -$ - -$ - -$ - $100 PUPY 1,200$ 100
Total Expenses -$ - -$ - -$ - 97,894$ 8,158
Total Expenses as % of EGI - - - 41.8% 0
NOI - - - - - - 136,512 11,376
Income & Expenses

Note #
1 Example Comment…..
2 Second Example Comment….
3
4
5
6
7
8
9
10
Income & Expenses - Notes
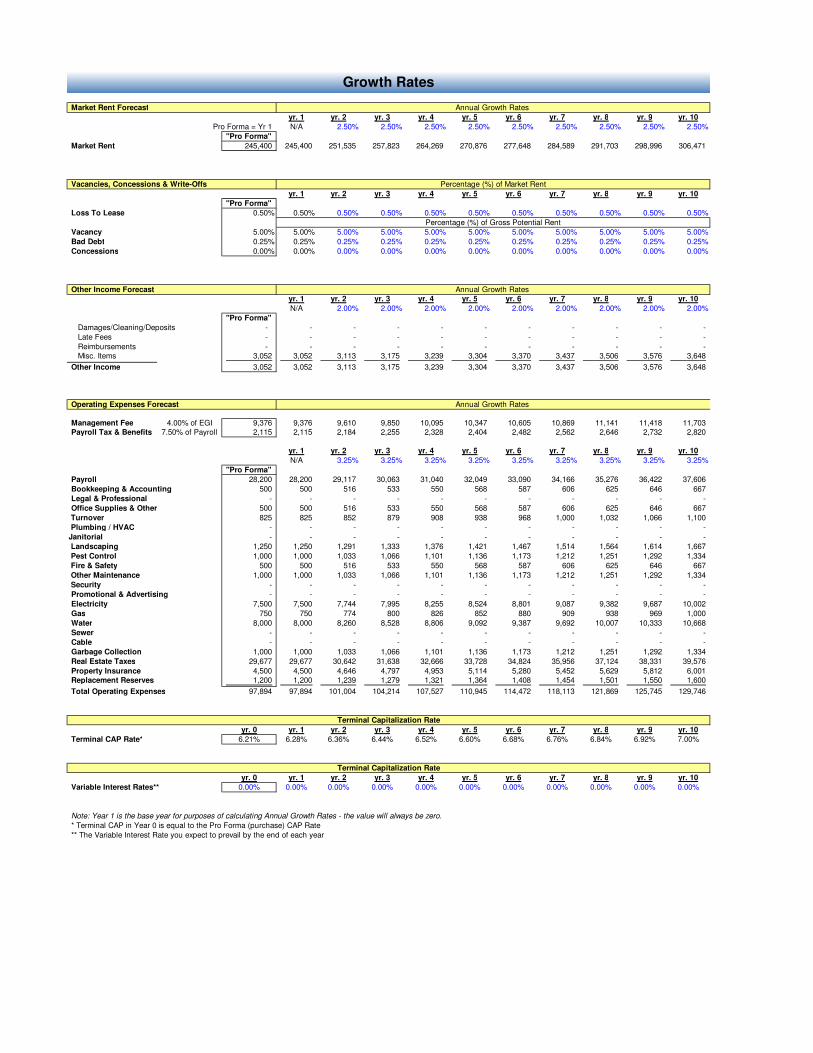
Market Rent Forecast
yr. 1 yr. 2 yr. 3 yr. 4 yr. 5 yr. 6 yr. 7 yr. 8 yr. 9 yr. 10
Pro Forma = Yr 1 N/A 2.50% 2.50% 2.50% 2.50% 2.50% 2.50% 2.50% 2.50% 2.50%
"Pro Forma"
Market Rent 245,400 245,400 251,535 257,823 264,269 270,876 277,648 284,589 291,703 298,996 306,471
Vacancies, Concessions & Write-Offs
yr. 1 yr. 2 yr. 3 yr. 4 yr. 5 yr. 6 yr. 7 yr. 8 yr. 9 yr. 10
"Pro Forma"
Loss To Lease 0.50% 0.50% 0.50% 0.50% 0.50% 0.50% 0.50% 0.50% 0.50% 0.50% 0.50%
Vacancy 5.00% 5.00% 5.00% 5.00% 5.00% 5.00% 5.00% 5.00% 5.00% 5.00% 5.00%
Bad Debt 0.25% 0.25% 0.25% 0.25% 0.25% 0.25% 0.25% 0.25% 0.25% 0.25% 0.25%
Concessions 0.00% 0.00% 0.00% 0.00% 0.00% 0.00% 0.00% 0.00% 0.00% 0.00% 0.00%
Other Income Forecastyr. 1 yr. 2 yr. 3 yr. 4 yr. 5 yr. 6 yr. 7 yr. 8 yr. 9 yr. 10
N/A 2.00% 2.00% 2.00% 2.00% 2.00% 2.00% 2.00% 2.00% 2.00%
"Pro Forma"
Damages/Cleaning/Deposits - - - - - - - - - - -
Late Fees - - - - - - - - - - -
Reimbursements - - - - - - - - - - - Misc. Items 3,052 3,052 3,113 3,175 3,239 3,304 3,370 3,437 3,506 3,576 3,648
Other Income 3,052 3,052 3,113 3,175 3,239 3,304 3,370 3,437 3,506 3,576 3,648
Operating Expenses Forecast
Management Fee 4.00% of EGI 9,376 9,376 9,610 9,850 10,095 10,347 10,605 10,869 11,141 11,418 11,703 Payroll Tax & Benefits 7.50% of Payroll 2,115 2,115 2,184 2,255 2,328 2,404 2,482 2,562 2,646 2,732 2,820
yr. 1 yr. 2 yr. 3 yr. 4 yr. 5 yr. 6 yr. 7 yr. 8 yr. 9 yr. 10
N/A 3.25% 3.25% 3.25% 3.25% 3.25% 3.25% 3.25% 3.25% 3.25%
"Pro Forma"
Payroll 28,200 28,200 29,117 30,063 31,040 32,049 33,090 34,166 35,276 36,422 37,606
Bookkeeping & Accounting 500 500 516 533 550 568 587 606 625 646 667
Legal & Professional - - - - - - - - - - -
Office Supplies & Other 500 500 516 533 550 568 587 606 625 646 667
Turnover 825 825 852 879 908 938 968 1,000 1,032 1,066 1,100
Plumbing / HVAC - - - - - - - - - - -
Janitorial - - - - - - - - - - -
Landscaping 1,250 1,250 1,291 1,333 1,376 1,421 1,467 1,514 1,564 1,614 1,667
Pest Control 1,000 1,000 1,033 1,066 1,101 1,136 1,173 1,212 1,251 1,292 1,334
Fire & Safety 500 500 516 533 550 568 587 606 625 646 667
Other Maintenance 1,000 1,000 1,033 1,066 1,101 1,136 1,173 1,212 1,251 1,292 1,334
Security - - - - - - - - - - -
Promotional & Advertising - - - - - - - - - - -
Electricity 7,500 7,500 7,744 7,995 8,255 8,524 8,801 9,087 9,382 9,687 10,002
Gas 750 750 774 800 826 852 880 909 938 969 1,000
Water 8,000 8,000 8,260 8,528 8,806 9,092 9,387 9,692 10,007 10,333 10,668
Sewer - - - - - - - - - - -
Cable - - - - - - - - - - -
Garbage Collection 1,000 1,000 1,033 1,066 1,101 1,136 1,173 1,212 1,251 1,292 1,334
Real Estate Taxes 29,677 29,677 30,642 31,638 32,666 33,728 34,824 35,956 37,124 38,331 39,576
Property Insurance 4,500 4,500 4,646 4,797 4,953 5,114 5,280 5,452 5,629 5,812 6,001 Replacement Reserves 1,200 1,200 1,239 1,279 1,321 1,364 1,408 1,454 1,501 1,550 1,600
Total Operating Expenses 97,894 97,894 101,004 104,214 107,527 110,945 114,472 118,113 121,869 125,745 129,746
yr. 0 yr. 1 yr. 2 yr. 3 yr. 4 yr. 5 yr. 6 yr. 7 yr. 8 yr. 9 yr. 10
Terminal CAP Rate* 6.21% 6.28% 6.36% 6.44% 6.52% 6.60% 6.68% 6.76% 6.84% 6.92% 7.00%
yr. 0 yr. 1 yr. 2 yr. 3 yr. 4 yr. 5 yr. 6 yr. 7 yr. 8 yr. 9 yr. 10
Variable Interest Rates** 0.00% 0.00% 0.00% 0.00% 0.00% 0.00% 0.00% 0.00% 0.00% 0.00% 0.00%
Note: Year 1 is the base year for purposes of calculating Annual Growth Rates - the value will always be zero.
* Terminal CAP in Year 0 is equal to the Pro Forma (purchase) CAP Rate
** The Variable Interest Rate you expect to prevail by the end of each year
Terminal Capitalization Rate
Growth Rates
Terminal Capitalization Rate
Annual Growth Rates
Percentage (%) of Gross Potential Rent
Annual Growth Rates
Percentage (%) of Market Rent
Annual Growth Rates
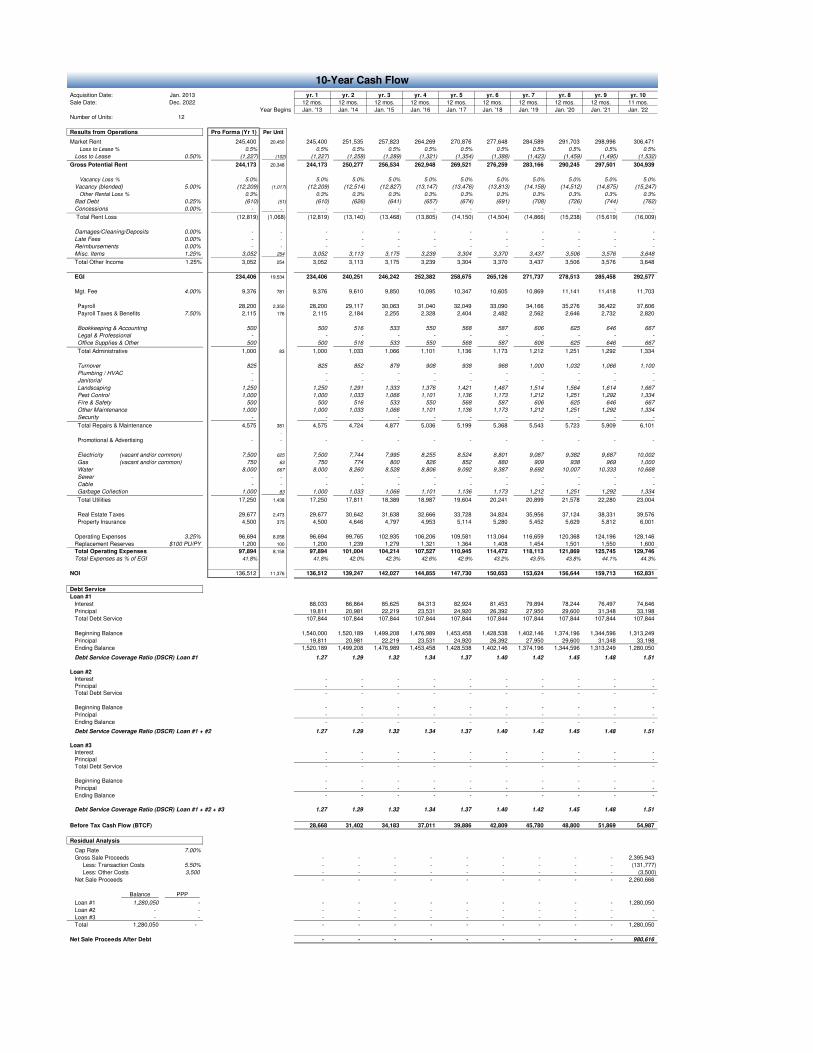
Acquisition Date: Jan. 2013 yr. 1 yr. 2 yr. 3 yr. 4 yr. 5 yr. 6 yr. 7 yr. 8 yr. 9 yr. 10
Sale Date: Dec. 2022 12 mos. 12 mos. 12 mos. 12 mos. 12 mos. 12 mos. 12 mos. 12 mos. 12 mos. 11 mos.
Year Begins Jan. '13 Jan. '14 Jan. '15 Jan. '16 Jan. '17 Jan. '18 Jan. '19 Jan. '20 Jan. '21 Jan. '22
Number of Units: 12
Results from Operations Pro Forma (Yr 1) Per Unit
Market Rent 245,400 20,450 245,400 251,535 257,823 264,269 270,876 277,648 284,589 291,703 298,996 306,471
Loss to Lease % 0.5% 0.5% 0.5% 0.5% 0.5% 0.5% 0.5% 0.5% 0.5% 0.5% 0.5%
Loss to Lease 0.50% (1,227) (102) (1,227) (1,258) (1,289) (1,321) (1,354) (1,388) (1,423) (1,459) (1,495) (1,532)
Gross Potential Rent 244,173 20,348 244,173 250,277 256,534 262,948 269,521 276,259 283,166 290,245 297,501 304,939
Vacancy Loss % 5.0% 5.0% 5.0% 5.0% 5.0% 5.0% 5.0% 5.0% 5.0% 5.0% 5.0%
Vacancy (blended) 5.00% (12,209) (1,017) (12,209) (12,514) (12,827) (13,147) (13,476) (13,813) (14,158) (14,512) (14,875) (15,247)
Other Rental Loss % 0.3% 0.3% 0.3% 0.3% 0.3% 0.3% 0.3% 0.3% 0.3% 0.3% 0.3%
Bad Debt 0.25% (610) (51) (610) (626) (641) (657) (674) (691) (708) (726) (744) (762)
Concessions 0.00% - - - - - - - - - - - -
Total Rent Loss (12,819) (1,068) (12,819) (13,140) (13,468) (13,805) (14,150) (14,504) (14,866) (15,238) (15,619) (16,009)
Damages/Cleaning/Deposits 0.00% - - - - - - - - - - - -
Late Fees 0.00% - - - - - - - - - - - -
Reimbursements 0.00% - - - - - - - - - - - -
Misc. Items 1.25% 3,052 254 3,052 3,113 3,175 3,239 3,304 3,370 3,437 3,506 3,576 3,648
Total Other Income 1.25% 3,052 254 3,052 3,113 3,175 3,239 3,304 3,370 3,437 3,506 3,576 3,648
EGI 234,406 19,534 234,406 240,251 246,242 252,382 258,675 265,126 271,737 278,513 285,458 292,577
Mgt. Fee 4.00% 9,376 781 9,376 9,610 9,850 10,095 10,347 10,605 10,869 11,141 11,418 11,703
Payroll 28,200 2,350 28,200 29,117 30,063 31,040 32,049 33,090 34,166 35,276 36,422 37,606
Payroll Taxes & Benefits 7.50% 2,115 176 2,115 2,184 2,255 2,328 2,404 2,482 2,562 2,646 2,732 2,820
Bookkeeping & Accounting 500 500 516 533 550 568 587 606 625 646 667
Legal & Professional - - - - - - - - - - -
Office Supplies & Other 500 500 516 533 550 568 587 606 625 646 667
Total Administrative 1,000 83 1,000 1,033 1,066 1,101 1,136 1,173 1,212 1,251 1,292 1,334
Turnover 825 825 852 879 908 938 968 1,000 1,032 1,066 1,100
Plumbing / HVAC - - - - - - - - - - -
Janitorial - - - - - - - - - - -
Landscaping 1,250 1,250 1,291 1,333 1,376 1,421 1,467 1,514 1,564 1,614 1,667
Pest Control 1,000 1,000 1,033 1,066 1,101 1,136 1,173 1,212 1,251 1,292 1,334
Fire & Safety 500 500 516 533 550 568 587 606 625 646 667
Other Maintenance 1,000 1,000 1,033 1,066 1,101 1,136 1,173 1,212 1,251 1,292 1,334
Security - - - - - - - - - - -
Total Repairs & Maintenance 4,575 381 4,575 4,724 4,877 5,036 5,199 5,368 5,543 5,723 5,909 6,101
-
Promotional & Advertising - - - - - - - - - - - -
Electricity (vacant and/or common) 7,500 625 7,500 7,744 7,995 8,255 8,524 8,801 9,087 9,382 9,687 10,002
Gas (vacant and/or common) 750 63 750 774 800 826 852 880 909 938 969 1,000
Water 8,000 667 8,000 8,260 8,528 8,806 9,092 9,387 9,692 10,007 10,333 10,668
Sewer - - - - - - - - - - - -
Cable - - - - - - - - - - - -
Garbage Collection 1,000 83 1,000 1,033 1,066 1,101 1,136 1,173 1,212 1,251 1,292 1,334
Total Utilities 17,250 1,438 17,250 17,811 18,389 18,987 19,604 20,241 20,899 21,578 22,280 23,004
Real Estate Taxes 29,677 2,473 29,677 30,642 31,638 32,666 33,728 34,824 35,956 37,124 38,331 39,576
Property Insurance 4,500 375 4,500 4,646 4,797 4,953 5,114 5,280 5,452 5,629 5,812 6,001
Operating Expenses 3.25% 96,694 8,058 96,694 99,765 102,935 106,206 109,581 113,064 116,659 120,368 124,196 128,146
Replacement Reserves $100 PU/PY 1,200 100 1,200 1,239 1,279 1,321 1,364 1,408 1,454 1,501 1,550 1,600
Total Operating Expenses 97,894 8,158 97,894 101,004 104,214 107,527 110,945 114,472 118,113 121,869 125,745 129,746
Total Expenses as % of EGI 41.8% 41.8% 42.0% 42.3% 42.6% 42.9% 43.2% 43.5% 43.8% 44.1% 44.3%
NOI 136,512 11,376 136,512 139,247 142,027 144,855 147,730 150,653 153,624 156,644 159,713 162,831
Debt Service
Loan #1
Interest 88,033 86,864 85,625 84,313 82,924 81,453 79,894 78,244 76,497 74,646
Principal 19,811 20,981 22,219 23,531 24,920 26,392 27,950 29,600 31,348 33,198
Total Debt Service 107,844 107,844 107,844 107,844 107,844 107,844 107,844 107,844 107,844 107,844
Beginning Balance 1,540,000 1,520,189 1,499,208 1,476,989 1,453,458 1,428,538 1,402,146 1,374,196 1,344,596 1,313,249
Principal 19,811 20,981 22,219 23,531 24,920 26,392 27,950 29,600 31,348 33,198
Ending Balance 1,520,189 1,499,208 1,476,989 1,453,458 1,428,538 1,402,146 1,374,196 1,344,596 1,313,249 1,280,050
Debt Service Coverage Ratio (DSCR) Loan #1 1.27 1.29 1.32 1.34 1.37 1.40 1.42 1.45 1.48 1.51
Loan #2Interest - - - - - - - - - - Principal - - - - - - - - - - Total Debt Service - - - - - - - - - -
Beginning Balance - - - - - - - - - -
Principal - - - - - - - - - -
Ending Balance - - - - - - - - - -
Debt Service Coverage Ratio (DSCR) Loan #1 + #2 1.27 1.29 1.32 1.34 1.37 1.40 1.42 1.45 1.48 1.51
Loan #3Interest - - - - - - - - - - Principal - - - - - - - - - - Total Debt Service - - - - - - - - - -
Beginning Balance - - - - - - - - - -
Principal - - - - - - - - - -
Ending Balance - - - - - - - - - -
Debt Service Coverage Ratio (DSCR) Loan #1 + #2 + #3 1.27 1.29 1.32 1.34 1.37 1.40 1.42 1.45 1.48 1.51
Before Tax Cash Flow (BTCF) 28,668 31,402 34,183 37,011 39,886 42,809 45,780 48,800 51,869 54,987
Residual Analysis
Cap Rate 7.00%
Gross Sale Proceeds - - - - - - - - - 2,395,943
Less: Transaction Costs 5.50% - - - - - - - - - (131,777)
Less: Other Costs 3,500 - - - - - - - - - (3,500)
Net Sale Proceeds - - - - - - - - - 2,260,666
Balance PPP
Loan #1 1,280,050 - - - - - - - - - - 1,280,050
Loan #2 - - - - - - - - - - - -
Loan #3 - - - - - - - - - - - -
Total 1,280,050 - - - - - - - - - - 1,280,050
Net Sale Proceeds After Debt - - - - - - - - - 980,616
10-Year Cash Flow

Equity Invested = 2,206,500 Total Debt = -
yr. 1 yr. 2 yr. 3 yr. 4 yr. 5 yr. 6 yr. 7 yr. 8 yr. 9 yr. 10
Year Begins Jan. '13 Jan. '14 Jan. '15 Jan. '16 Jan. '17 Jan. '18 Jan. '19 Jan. '20 Jan. '21 Jan. '22
2.0% 2.0% 2.0% 2.0% 2.0% 2.0% 2.0% 2.0% 2.0%
(A) NOI 136,512 139,247 142,027 144,855 147,730 150,653 153,624 156,644 159,713 162,831
Terminal Cap Rate 6.28% 6.36% 6.44% 6.52% 6.60% 6.68% 6.76% 6.84% 6.92% 7.00%
Gross Sale Proceeds 2,215,681 2,231,702 2,248,055 2,264,736 2,281,740 2,299,062 2,316,695 2,334,635 2,352,877 2,395,943
Total Cost of Sale (125,362) (126,244) (127,143) (128,061) (128,996) (129,948) (130,918) (131,905) (132,908) (135,277)
(B) Net Sale Proceeds 2,090,319 2,105,458 2,120,912 2,136,676 2,152,745 2,169,113 2,185,777 2,202,730 2,219,968 2,260,666
Total Distributable (A+B) 2,226,831 2,244,705 2,262,939 2,281,531 2,300,475 2,319,766 2,339,401 2,359,374 2,379,681 2,423,497
All Cash yr. 0 yr. 1 yr. 2 yr. 3 yr. 4 yr. 5 yr. 6 yr. 7 yr. 8 yr. 9 yr. 10
Year of Sale IRR Dec. '12 Jan. '13 Jan. '14 Jan. '15 Jan. '16 Jan. '17 Jan. '18 Jan. '19 Jan. '20 Jan. '21 Jan. '22
yr. 1 0.95% (2,206,500) 2,226,831 - - - - - - - - -
yr. 2 4.12% (2,206,500) 136,512 2,244,705 - - - - - - - -
yr. 3 5.23% (2,206,500) 136,512 139,247 2,262,939 - - - - - - -
yr. 4 5.81% (2,206,500) 136,512 139,247 142,027 2,281,531 - - - - - -
yr. 5 6.17% (2,206,500) 136,512 139,247 142,027 144,855 2,300,475 - - - - -
yr. 6 6.43% (2,206,500) 136,512 139,247 142,027 144,855 147,730 2,319,766 - - - -
yr. 7 6.62% (2,206,500) 136,512 139,247 142,027 144,855 147,730 150,653 2,339,401 - - -
yr. 8 6.77% (2,206,500) 136,512 139,247 142,027 144,855 147,730 150,653 153,624 2,359,374 - -
yr. 9 6.90% (2,206,500) 136,512 139,247 142,027 144,855 147,730 150,653 153,624 156,644 2,379,681 -
yr. 10 7.08% (2,206,500) 136,512 139,247 142,027 144,855 147,730 150,653 153,624 156,644 159,713 2,423,497
Equity Invested = 697,300 Total Debt = 1,509,200
yr. 1 yr. 2 yr. 3 yr. 4 yr. 5 yr. 6 yr. 7 yr. 8 yr. 9 yr. 10
Year Begins Jan. '13 Jan. '14 Jan. '15 Jan. '16 Jan. '17 Jan. '18 Jan. '19 Jan. '20 Jan. '21 Jan. '22
NOI 136,512 139,247 142,027 144,855 147,730 150,653 153,624 156,644 159,713 162,831
Total Debt Service (107,844) (107,844) (107,844) (107,844) (107,844) (107,844) (107,844) (107,844) (107,844) (107,844)
(C) 28,668 31,402 34,183 37,011 39,886 42,809 45,780 48,800 51,869 54,987
Gross Sale Proceeds 2,215,681 2,231,702 2,248,055 2,264,736 2,281,740 2,299,062 2,316,695 2,334,635 2,352,877 2,395,943
Total Cost of Sale (125,362) (126,244) (127,143) (128,061) (128,996) (129,948) (130,918) (131,905) (132,908) (135,277)
Total Balance Outstanding (1,520,189) (1,499,208) (1,476,989) (1,453,458) (1,428,538) (1,402,146) (1,374,196) (1,344,596) (1,313,249) (1,280,050)
Total Prepayment Penalties (30,404) (29,984) (29,540) (29,069) (28,571) (28,043) (27,484) (26,892) (26,265) (25,601)
(D) 539,726 576,265 614,383 654,149 695,636 738,924 784,097 831,242 880,455 955,015
Total Before-Tax Distributable (C+D) 568,394 607,668 648,566 691,160 735,522 781,733 829,877 880,042 932,323 1,010,002
Leveraged yr. 0 yr. 1 yr. 2 yr. 3 yr. 4 yr. 5 yr. 6 yr. 7 yr. 8 yr. 9 yr. 10
Year of Sale IRR Dec. '12 Jan. '13 Jan. '14 Jan. '15 Jan. '16 Jan. '17 Jan. '18 Jan. '19 Jan. '20 Jan. '21 Jan. '22
yr. 1 -18.86% (697,300) 568,394 - - - - - - - - -
yr. 2 -4.67% (697,300) 28,668 607,668 - - - - - - - -
yr. 3 0.58% (697,300) 28,668 31,402 648,566 - - - - - - -
yr. 4 3.29% (697,300) 28,668 31,402 34,183 691,160 - - - - - -
yr. 5 4.93% (697,300) 28,668 31,402 34,183 37,011 735,522 - - - - -
yr. 6 6.04% (697,300) 28,668 31,402 34,183 37,011 39,886 781,733 - - - -
yr. 7 6.82% (697,300) 28,668 31,402 34,183 37,011 39,886 42,809 829,877 - - -
yr. 8 7.40% (697,300) 28,668 31,402 34,183 37,011 39,886 42,809 45,780 880,042 - -
yr. 9 7.84% (697,300) 28,668 31,402 34,183 37,011 39,886 42,809 45,780 48,800 932,323 -
yr. 10 8.40% (697,300) 28,668 31,402 34,183 37,011 39,886 42,809 45,780 48,800 51,869 1,010,002
Pre-Tax IRR
POTENTIAL RETURN ON INVESTMENT AT END OF EACH YEAR
POTENTIAL RETURN ON INVESTMENT AT END OF EACH YEAR
POTENTIAL RETURN FROM INVESTMENT AT END OF EACH YEAR
POTENTIAL RETURN FROM INVESTMENT AT END OF EACH YEAR
UNLEVERAGED ("ALL CASH") INTERNAL RATE OF RETURN
LEVERAGED INTERNAL RATE OF RETURN
Before Tax Cash Flow (BTCF)
Net Sale Proceeds

Loan #1 Loan #2 Loan #3
Amortization Period (yrs) 30 yrs 30 yrs 30 yrs
$10,267 $0 $0
$20,533 $0 $0
$30,800 $0 $0
yr. 1 yr. 2 yr. 3 yr. 4 yr. 5 yr. 6 yr. 7 yr. 8 yr. 9 yr. 10
Jan. '13 Jan. '14 Jan. '15 Jan. '16 Jan. '17 Jan. '18 Jan. '19 Jan. '20 Jan. '21 Jan. '22
NOI 136,512 139,247 142,027 144,855 147,730 150,653 153,624 156,644 159,713 162,831
Less: Interest Expenses (88,033) (86,864) (85,625) (84,313) (82,924) (81,453) (79,894) (78,244) (76,497) (74,646)
Less: Amortized Loan Points (1,027) (1,027) (1,027) (1,027) (1,027) (1,027) (1,027) (1,027) (1,027) (1,027)
Less: Depreciation (52,150) (54,385) (54,385) (54,385) (54,385) (54,385) (54,385) (54,385) (54,385) (54,385)
(4,697) (3,028) 991 5,131 9,395 13,789 18,318 22,988 27,805 32,774
Cumulative Carryforward Loss (348) (206) - - - - - - - -
Taxable Base (After Carryforward) - - 991 5,131 9,395 13,789 18,318 22,988 27,805 32,774
- - - - - - - - - -
NOI 136,512 139,247 142,027 144,855 147,730 150,653 153,624 156,644 159,713 162,831
Less: Debt Service (107,844) (107,844) (107,844) (107,844) (107,844) (107,844) (107,844) (107,844) (107,844) (107,844)
28,668 31,402 34,183 37,011 39,886 42,809 45,780 48,800 51,869 54,987
Less: Income Taxes - - - - - - - - - -
28,668 31,402 34,183 37,011 39,886 42,809 45,780 48,800 51,869 54,987
yr. 1 yr. 2 yr. 3 yr. 4 yr. 5 yr. 6 yr. 7 yr. 8 yr. 9 yr. 10
Jan. '13 Jan. '14 Jan. '15 Jan. '16 Jan. '17 Jan. '18 Jan. '19 Jan. '20 Jan. '21 Jan. '22
52,150 106,535 160,919 215,304 269,689 324,074 378,458 432,843 487,228 541,613
(A) - - - - - - - - - -
2,200,000 2,200,000 2,200,000 2,200,000 2,200,000 2,200,000 2,200,000 2,200,000 2,200,000 2,200,000
Plus: Acquisition Cost 6,500 6,500 6,500 6,500 6,500 6,500 6,500 6,500 6,500 6,500
Plus: Capital Expenditures - - - - - - - - - -
2,206,500 2,206,500 2,206,500 2,206,500 2,206,500 2,206,500 2,206,500 2,206,500 2,206,500 2,206,500
Less: Cummulative Depreciation (52,150) (106,535) (160,919) (215,304) (269,689) (324,074) (378,458) (432,843) (487,228) (541,613)
2,154,350 2,099,965 2,045,581 1,991,196 1,936,811 1,882,426 1,828,042 1,773,657 1,719,272 1,664,887
2,215,681 2,231,702 2,248,055 2,264,736 2,281,740 2,299,062 2,316,695 2,334,635 2,352,877 2,395,943
Less: Total Cost of Sale (125,362) (126,244) (127,143) (128,061) (128,996) (129,948) (130,918) (131,905) (132,908) (135,277)
Less: Unamortized Loan Points (29,773) (28,747) (27,720) (26,693) (25,667) (24,640) (23,613) (22,587) (21,560) (20,533)
Less: Accumulated Loss (348) (206) - - - - - - - -
Less: Adjusted Basis (2,154,350) (2,099,965) (2,045,581) (1,991,196) (1,936,811) (1,882,426) (1,828,042) (1,773,657) (1,719,272) (1,664,887)
(94,152) (23,460) 47,611 118,787 190,267 262,047 334,122 406,487 479,136 575,246
(B) - - - - - - - - - -
Taxable Gain/ (Loss) (94,152) (23,460) 47,611 118,787 190,267 262,047 334,122 406,487 479,136 575,246
Less: Recapture (52,150) (106,535) (160,919) (215,304) (269,689) (324,074) (378,458) (432,843) (487,228) (541,613)
(146,302) (129,995) (113,308) (96,517) (79,422) (62,027) (44,337) (26,357) (8,092) 33,633
(C) - - - - - - - - - -
- - - - - - - - - -
Equity Invested = 697,300
Total Debt = 1,509,200
yr. 1 yr. 2 yr. 3 yr. 4 yr. 5 yr. 6 yr. 7 yr. 8 yr. 9 yr. 10
Year Begins Jan. '13 Jan. '14 Jan. '15 Jan. '16 Jan. '17 Jan. '18 Jan. '19 Jan. '20 Jan. '21 Jan. '22
(D) 28,668 31,402 34,183 37,011 39,886 42,809 45,780 48,800 51,869 54,987
Gross Sale Proceeds 2,215,681 2,231,702 2,248,055 2,264,736 2,281,740 2,299,062 2,316,695 2,334,635 2,352,877 2,395,943
Total Cost of Sale (125,362) (126,244) (127,143) (128,061) (128,996) (129,948) (130,918) (131,905) (132,908) (135,277)
Net Sale Proceeds 2,090,319 2,105,458 2,120,912 2,136,676 2,152,745 2,169,113 2,185,777 2,202,730 2,219,968 2,260,666
Total Balance Outstanding (1,520,189) (1,499,208) (1,476,989) (1,453,458) (1,428,538) (1,402,146) (1,374,196) (1,344,596) (1,313,249) (1,280,050)
Total Prepayment Penalties (30,404) (29,984) (29,540) (29,069) (28,571) (28,043) (27,484) (26,892) (26,265) (25,601)
State Capital Gains Tax - - - - - - - - - -
Federal Recapture Tax - - - - - - - - - -
Federal Capital Gains Taxes - - - - - - - - - -
539,726 576,265 614,383 654,149 695,636 738,924 784,097 831,242 880,455 955,015
(E) 568,394 607,668 648,566 691,160 735,522 781,733 829,877 880,042 932,323 1,010,002
Leveraged yr. 0 yr. 1 yr. 2 yr. 3 yr. 4 yr. 5 yr. 6 yr. 7 yr. 8 yr. 9 yr. 10
Year of Sale ATIRR Dec. '12 Jan. '13 Jan. '14 Jan. '15 Jan. '16 Jan. '17 Jan. '18 Jan. '19 Jan. '20 Jan. '21 Jan. '22
yr. 1 -18.86% (697,300) 568,394 - - - - - - - - -
yr. 2 -4.67% (697,300) 28,668 607,668 - - - - - - - -
yr. 3 0.58% (697,300) 28,668 31,402 648,566 - - - - - - -
yr. 4 3.29% (697,300) 28,668 31,402 34,183 691,160 - - - - - -
yr. 5 4.93% (697,300) 28,668 31,402 34,183 37,011 735,522 - - - - -
yr. 6 6.04% (697,300) 28,668 31,402 34,183 37,011 39,886 781,733 - - - -
yr. 7 6.82% (697,300) 28,668 31,402 34,183 37,011 39,886 42,809 829,877 - - -
yr. 8 7.40% (697,300) 28,668 31,402 34,183 37,011 39,886 42,809 45,780 880,042 - -
yr. 9 7.84% (697,300) 28,668 31,402 34,183 37,011 39,886 42,809 45,780 48,800 932,323 -
yr. 10 8.40% (697,300) 28,668 31,402 34,183 37,011 39,886 42,809 45,780 48,800 51,869 1,010,002
Amortization of Loan Points
Total Amortized Loan Points
Total Unamortized Loan Points
Total Amortizable Loan Points
Recapture Taxes @ 0.0%
Income Taxes @ 0.0%
INCOME TAXES FROM OPERATIONS
Cummulative Depreciation / Recapture
After Tax Cash Flow (ATCF)
Taxable Base (Before Carryforward)
Before Tax Cash Flow (BTCF)
Income Tax Calculations
State Capital Gains Taxes @ 0.0%
After-Tax IRR *
POTENTIAL RETURN ON INVESTMENT AT END OF EACH YEAR
AFTER-TAX INTERNAL RATE OF RETURN (ATIRR)
After-Tax Cash Flow (ATCF)
CAPITAL GAINS FROM DISPOSITION & RECAPUTRE OF DEPRECIATION
Total Taxes Due at Sale (A+B+C)
Fed. Capital Gains Taxes @ 0.0%
Adjusted Basis
Acquisition Price
Sales Value
Taxable Gain/ (Loss)
After-Tax Sale Proceeds
Total After-Tax Distributable (D+E)
POTENTIAL RETURN FROM INVESTMENT AT END OF EACH YEAR
Capital Gain/ (Loss)
Basis

Graphic Representation (1 of 4)
yr. 1 yr. 2 yr. 3 yr. 4 yr. 5 yr. 6 yr. 7 yr. 8 yr. 9 yr. 10
IRR 0.95% 4.12% 5.23% 5.81% 6.17% 6.43% 6.62% 6.77% 6.90% 7.08%
Lev. IRR -18.86% -4.67% 0.58% 3.29% 4.93% 6.04% 6.82% 7.40% 7.84% 8.40%
ATIRR -18.86% -4.67% 0.58% 3.29% 4.93% 6.04% 6.82% 7.40% 7.84% 8.40%
0.0%
1.0%
2.0%
3.0%
4.0%
5.0%
6.0%
7.0%
8.0%
9.0%
Aft
er-
Ta
x IR
R
Holding Period
Internal Rates of Return
$50,000
$100,000
$150,000
$200,000
$250,000
$300,000
$350,000
yr. 1 yr. 2 yr. 3 yr. 4 yr. 5 yr. 6 yr. 7 yr. 8 yr. 9 yr. 10
Income vs. Expenses
Effectove Gross Income
Expenses + Debt Service
Net Operating Income
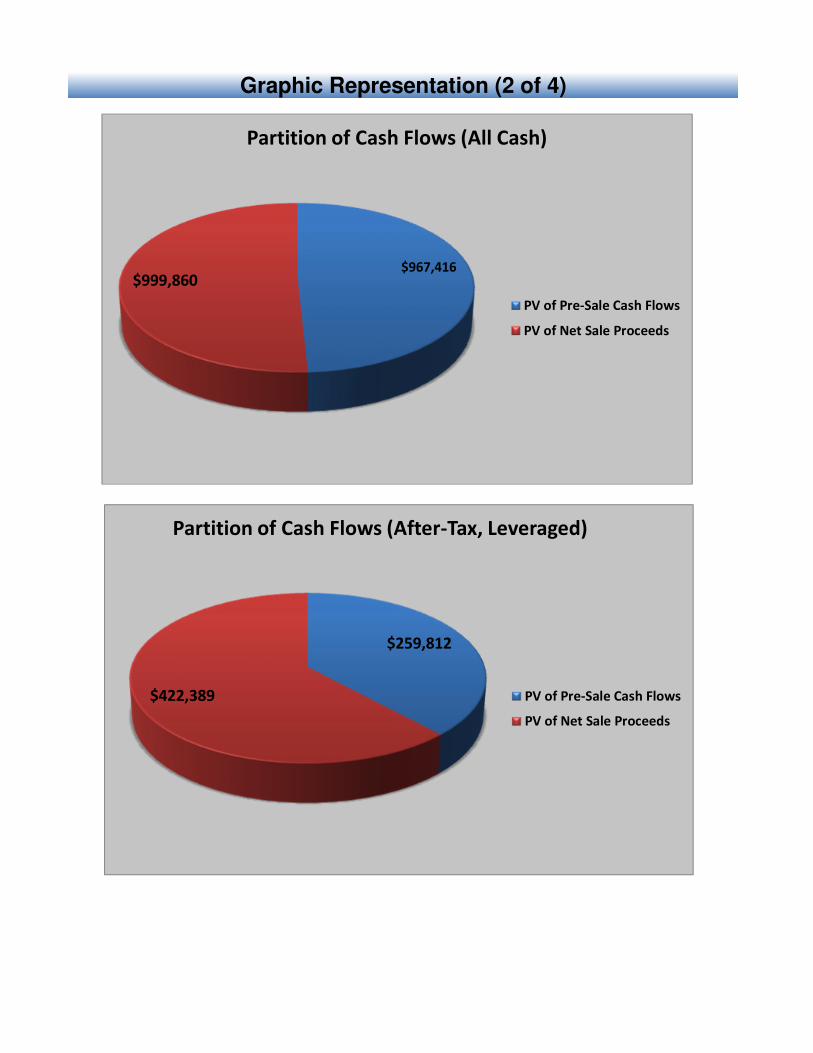
Graphic Representation (2 of 4)
$967,416 $999,860
Partition of Cash Flows (All Cash)
PV of Pre-Sale Cash Flows
PV of Net Sale Proceeds
$259,812
$422,389
Partition of Cash Flows (After-Tax, Leveraged)
PV of Pre-Sale Cash Flows
PV of Net Sale Proceeds

Graphic Representation (3 of 4)
1.10
1.15
1.20
1.25
1.30
1.35
1.40
1.45
1.50
1.55
$-
$200,000
$400,000
$600,000
$800,000
$1,000,000
$1,200,000
$1,400,000
$1,600,000
yr. 1 yr. 2 yr. 3 yr. 4 yr. 5 yr. 6 yr. 7 yr. 8 yr. 9 yr. 10
Debt Coverage RatioEquity vs Debt
Total Equity
Principal
Balance
Debt Coverage
(DCR)
4.60%
4.80%
5.00%
5.20%
5.40%
5.60%
5.80%
6.00%
$120,000
$125,000
$130,000
$135,000
$140,000
$145,000
$150,000
$155,000
$160,000
$165,000
yr. 1 yr. 2 yr. 3 yr. 4 yr. 5 yr. 6 yr. 7 yr. 8 yr. 9 yr. 10
Net Operating Income & Rent Loss
Net
Operating
Income
Vacancy %
Total Rent
Loss %

Graphic Representation (4 of 4)
0.2
0.25
0.3
0.35
0.4
0.45
0.5
0.55
0.6
0.65
$-
$50,000
$100,000
$150,000
$200,000
$250,000
2010 2011 2012 Pro Forma (Yr 1)
Historic vs Projected
Effective
Gross
Income
Total
Expenses
Net
Operating
Income
Expense
Ratio (% of
EGI)
0.00%
1.00%
2.00%
3.00%
4.00%
5.00%
6.00%
7.00%
8.00%
$2,000,000
$2,050,000
$2,100,000
$2,150,000
$2,200,000
$2,250,000
$2,300,000
$2,350,000
$2,400,000
$2,450,000
yr. 1 yr. 2 yr. 3 yr. 4 yr. 5 yr. 6 yr. 7 yr. 8 yr. 9 yr. 10
Drivers of Value & Gross Sale Projections
Gross Sale
Proceeds
Rent
Growth %
Expense
Growth %
Terminal
CAP %