Multi-Criteria Decision Support for Cost Assessment ...
16
6 Multi-Criteria Decision Support for Cost Assessment Techniques in Shipbuilding Industry Jean-David Caprace, ANAST ULg, Liège/Belgium, [email protected] Philippe Rigo, ANAST ULg, Liège/Belgium, [email protected] Abstract Cost is perhaps the most influential factor in the outcome of a product or service within many of today’s industries. Cost assessment during the early stage of ship design is crucial. It influences the go, no-go decision concerning a new development. Cost assessment occurs at various stages of ship design development. Economic evaluation as early as possible, in the design phase, is therefore crucial to find the best price–function compromise for the ship projects. This paper presents a Multi Criteria Decision Aid (MCDA) method in order to select an appropriate cost assessment method at each stage of the ship design. In order to compare the cost performance between all alternatives, the evaluation of each alternative is performed by PROMETHEE. 1 Introduction Cost is perhaps the most influential factor in the outcome of a product or service within many for today’s industries. More often than not, reducing cost is essential for survival. To compete and qualify, companies are increasingly required to improve their quality, flexibility, product variety, and novelty while consistently maintaining or reducing their costs, Roy and Kerr (2003). In short, customers expect higher quality at an ever-decreasing cost. Not surprisingly, cost reduction initiatives are essential within today’s highly competitive market place. Concurrent engineering is one of these initiatives. Since cost has become such an important factor of success, project development needs to be carefully considered and planned. It is essential that the cost of a new project development is understood before it actually begins. It could mean the difference between success and failure. Cost assessments during the early stages of ship development are crucial. They influence the go, no- go decision concerning a new development, Roy and Kerr (2003). If an estimate is too high, it could mean the loss of a business, for the benefit of a competitor. If the estimate is too low, it could mean the company is unable to produce the ship and make a reasonable profit. An ability to perform effective, detailed, and reliable ship cost assessment could finally create a change in the way the shipyard is able to negotiate its contracts, Miroyannis (2006). Moreover, the importance of a good cost assessment particularly at the early level of design can be crucial when comparing different design proposals. A greater understanding of the factors that drive costs can hopefully lead to a decrease in cost overruns for two reasons: 1. designers will be in a better position to quickly perform trade off studies and therefore develop a better understanding of how their designs affect cost, 2. with an ability to perform reliable cost assessments at the preliminary level, the shipyards will be able to negotiate more favorable contract terms that could decrease costs. 2 State of cost assessment in shipbuilding industry To succeed commercially, shipyards must be able to accurately assess costs. Cost assessment is necessary for the bid process, for change orders, and for trade-off studies. Numerous cost assessment approaches exist. They are based on extrapolations from previously-built ships, detailed parameters, and integrated physics-based analyses. The option for the production cost assessment differs in the required information (input data). The less information is needed, the earlier a method can be used in the design process. The more information is used, the finer differences between design alternatives can be analyzed, Bertram et al. (2005).
Transcript of Multi-Criteria Decision Support for Cost Assessment ...
6
Multi-Criteria Decision Support for Cost Assessment Techniques in
Shipbuilding Industry
Jean-David Caprace, ANAST ULg, Liège/Belgium, [email protected] Philippe Rigo, ANAST ULg, Liège/Belgium, [email protected]
Abstract
Cost is perhaps the most influential factor in the outcome of a product or service within many of today’s industries. Cost assessment during the early stage of ship design is crucial. It influences the go, no-go decision concerning a new development. Cost assessment occurs at various stages of ship design development. Economic evaluation as early as possible, in the design phase, is therefore crucial to find the best price–function compromise for the ship projects. This paper presents a Multi Criteria Decision Aid (MCDA) method in order to select an appropriate cost assessment method at each stage of the ship design. In order to compare the cost performance between all alternatives, the evaluation of each alternative is performed by PROMETHEE.
1 Introduction
Cost is perhaps the most influential factor in the outcome of a product or service within many for today’s industries. More often than not, reducing cost is essential for survival. To compete and qualify, companies are increasingly required to improve their quality, flexibility, product variety, and novelty while consistently maintaining or reducing their costs, Roy and Kerr (2003). In short, customers expect higher quality at an ever-decreasing cost. Not surprisingly, cost reduction initiatives are essential within today’s highly competitive market place. Concurrent engineering is one of these initiatives. Since cost has become such an important factor of success, project development needs to be carefully considered and planned. It is essential that the cost of a new project development is understood before it actually begins. It could mean the difference between success and failure. Cost assessments during the early stages of ship development are crucial. They influence the go, no-go decision concerning a new development, Roy and Kerr (2003). If an estimate is too high, it could mean the loss of a business, for the benefit of a competitor. If the estimate is too low, it could mean the company is unable to produce the ship and make a reasonable profit. An ability to perform effective, detailed, and reliable ship cost assessment could finally create a change in the way the shipyard is able to negotiate its contracts, Miroyannis (2006). Moreover, the importance of a good cost assessment particularly at the early level of design can be crucial when comparing different design proposals. A greater understanding of the factors that drive costs can hopefully lead to a decrease in cost overruns for two reasons:
1. designers will be in a better position to quickly perform trade off studies and therefore develop a better understanding of how their designs affect cost,
2. with an ability to perform reliable cost assessments at the preliminary level, the shipyards will be able to negotiate more favorable contract terms that could decrease costs.
2 State of cost assessment in shipbuilding industry
To succeed commercially, shipyards must be able to accurately assess costs. Cost assessment is necessary for the bid process, for change orders, and for trade-off studies. Numerous cost assessment approaches exist. They are based on extrapolations from previously-built ships, detailed parameters, and integrated physics-based analyses. The option for the production cost assessment differs in the required information (input data). The less information is needed, the earlier a method can be used in the design process. The more information is used, the finer differences between design alternatives can be analyzed, Bertram et al. (2005).

7
The methods for estimating production cost are classified into:
• Top-Down (macro, cost-down or historical, weight-based) approaches (empirical, statistical and close-form equations, etc.), see Fig. 1 (a)
• Bottom-Up (micro, cost-up or engineering analysis, process-based) approaches (direct rational assessment), see Fig. 1 (b)
(a) Top-down (b) Bottom-up Fig. 1: Top-down and bottom-up methodology
2.1 Top-Down approaches
The top-down approach is a parametric cost assessment methodology which uses empirical relationships between product parameters and costs as a means to estimate the cost of new ships, Geiger and Dilts (1996). In this case, top-down method means that the ship cost is predicted from its higher level specifications, instead of its detailed design which may not be available at the time of estimation. Parametric relationships are estimated by using statistical regression techniques from a historical cost database. A parametric estimating system can then be continuously refined and re-calibrated. The top-down approach, also called weight based approach, determines the production cost from global parameters such as the ship type and size, weight of the hull, the block coefficient, ship area, complexity, etc. The relations between cost and global parameters are found by evaluation of previous ships, Barentine (1996). Thus, the top-down approach is only applicable if the new design is similar to these previous ships. Also, the cost estimation factors in the approach reflect past practices and experience. Cost reductions resulting from newly adopted and developing shipbuilding technologies and production methods are not reflected in the existing historical based cost estimating techniques, Christensen et al. (1992). Advanced shipbuilding technologies typically involve a modular, product oriented approach which cuts across elements of the existing Ship Work Breakdown Structure (SWBS). Moreover, these weight based cost assessment approach do not reflect improvements that may occur in the production process, Ennis et al. (1998). For instance, if a new welding technique is used which takes 25% less man-hours per meter of weld; no change would be reflected in cost, because there is no change in the weight of the ship. Therefore, if a change in design or production process has no impact on weight, then the cost assessment will not change. However this approach is often used by facility in a very early design stages due to the fact that it is easier to apply, gets “results” faster and does not require much design details. Weight is often used as the primary driving factor for cost assessment as it encapsulates the amount of material and to some extent work associated with an item. Weight is an important characteristic to establish early in the design of any vessel and there are several parametric rules such as shown by Careyette (1977), Kerlen, (1985), Schneekluth and Bertram (1998), Deschamps and Trumbule (2004), Ross and Aasen (2005), which can be used to estimate weight based on such minimal information as the main dimensions and hull form coefficients.
2.2 Bottom-Up approaches
The traditional costs assessments using system-based, weight-driven cost models are not always sensitive to changes in production processes and advanced manufacturing techniques, Ennis et al.

8
(1998). Thus the need exist for a cost model that can better relate to design and construction product and process issues, to enable cost conscious decision making and more affordable ships. The alternative method to compute the product cost is called bottom-up approach. This engineering analysis cost assessment approach breaks the project into smaller and smaller interim products until the most basic product (e.g. plate) is described. All costs of machining, tracking, coating, assembling this product, along with its associated interim products, into the next more mature interim product are estimated. The estimated cost of each layer interim product is summed with all preceding layers, thus obtaining an aggregated cost that reflects an engineering analysis of the building process, Geiger and Dilts (1996), Barentine (1996). In fact, the bottom-up approach breaks down the project into elements of work and builds up a cost estimate in a detailed engineering analysis. Moe and Lund (1968), Wolfram (1979), Southern (1980), Winkle and Baird (1986), Rigo (2001), Sasaki (2003) and Ross (2004), developed simplified cost models based on direct calculation using quantities and unitary cost to assess the global production cost. Welding position, accessibility, etc. can be considered using additional corrections. The major advantage of that technique is that it specifically considers the actual work content of the product and provides a realistic cost estimate for the construction effort. The bottom-up approach requires more effort and detailed information than the top-down approach, but unlike the top-down approach, the bottom-up approach captures also differences in design details and are thus suitable for scantling and shape optimizations, Caprace et al. (2006) and Bole (2006). Changing the local hull geometry influences the number of frames which require bending, the effort in plate bending, and the degree of weld automation which depends on the curvature of the weld joints. All these effects are reflected by an appropriate decomposition of the total work process into its individual components. At present, this approach is not available in most shipyards; neither are historical databases from which it could be developed. It is then necessary to develop an appropriate approach, and collect the required data. An advanced optimization application in this field is the work of ANAST for ship structures using the LBR5 system Rigo et al. (2005) and Toderan et al. (2007). This is possibly the only such system that has been applied in shipyard work.
2.3 Life cycle approaches
In order to improve the design of products and reduce design changes, cost, and time to market, Life Cycle Engineering (LCE) has emerged as an effective approach to address these issues in today’s competitive global market. As over 70% of the total Life Cycle Cost (LCC) of a product is committed at the early design stage, Eyres (2001), designers can substantially reduce the LCC of products by giving due consideration to the life cycle implications of their design decisions. People are always concerned about product cost, which encompasses the entire product life from conception to disposal. Manufacturers usually consider only how to reduce the cost of materials acquisition, production, and logistics. In order to survive in the competitive market environment, manufacturers now have to consider reducing the cost of the entire life cycle of a product, called the LCC, Seo et al. (2002). Landamore et al. (2007), Gratsos and Zachariadis (2007), Turan et al. (2009) has recently implemented methods for the investigation of economic and environmental costs within a marine system. The LCC assessment approach is a promising future holistic methodology in order to maintain the effectiveness of ships during their overall life.
3 Cost estimation method selection
3.1 Different cost assessment methods
Cost assessment occurs at various stages of ship design development. Economic evaluation as early as possible, in the design phase, is therefore crucial to find the best price–function compromise for the projects or product. However, economic evaluation during the design phase is not easy. It is very different from assessment when the product/process design is complete and detailed which allows the
9
cost of all optimization choices to be taken into account. In the design phase, the project or product is never completely defined. It is necessary in this phase to implement rapid and more or less accurate cost estimation methods (depending on available data) allowing the designer to select one solution in preference to another on economic grounds. In general, cost-estimating approaches can be broadly classified as intuitive, parametric or statistical techniques, and analytical models. However, the most accurate cost estimates are made using the analytical approach. Among the many methods for cost estimating, at the design stage, are those based on knowledge bases, features, operations, weight, material, physical relationships, and similarity laws, Shehab and Abdalla (2002). In this section, we present the information available to select the most appropriate cost assessment methods among the following ones:
• Intuitive method (IM) or Expert opinion • Case based reasoning (CBR) or Analogy analysis • Parametric method (PM) or Statistical analysis • Feature-Based Costing (FBC) • Fuzzy logic method (FLM) • Neural networks method (NNM) • Simulation method (SM)
3.1.1 Intuitive Method (IM) – Expert opinion
The role of the cost engineer in the design process is to provide models which are capable of establishing a cost value from data available at the different design stages. Cost estimation is often regarded as a mysterious art as it is somewhat more of a statistical discipline compared with the other engineering activities. Establishing a cost estimate at any stage of the design requires a high degree of appreciation of the processes which occur in both design and construction process, Bole (2006). Detailed costing may require knowledge of how long it takes certain construction processes to be conducted, for example, joining a stiffener to plate taking into account size, material and welding technique, while costing for a concept design will require, for example, knowledge of how the utilization of different spaces of the ship impacts on cost. IM is based on the experience and the opinion of the estimator. The cost engineer requires both a good database of historic information on previous ships and good contacts with industrial partners to forecast how technical and financial changes may impact on construction costs. Once this information is established, the cost engineer uses expertise to identify the cost estimation models which correlate well with both the type of vessel and capabilities of the shipyard and experience to enhance confidence in the result predicted by the model. The result of the expert opinion analysis is always dependent on the estimator’s knowledge. It can prove to be very effective but it can also be misleading. Generally, low estimates are generated by persons whose interests are served by low estimates and high estimates are generated by persons whose interest is served by high estimates. It may be seen that the competitiveness of a shipyard may be encapsulated in the cost engineer’s knowledge.
3.1.2 Case Based Reasoning (CBR) – Analogy analysis
This method uses a direct comparison between two similar products or sub-products and is based on the experience and knowledge of the designer. The effectiveness of this method depends largely upon the ability of the designer to identify differences between the intended and existing systems. Although most of the applications of this method are based on the judgment of a designer, some well-developed applications are using CBR, Rehman and Guenov (1998), Duverlie and Castelain (1999). The implicit assumption is that similar products have similar costs. By comparing products and adjusting for differences it is possible to achieve a valid and useable assessment. The method requires the means of
10
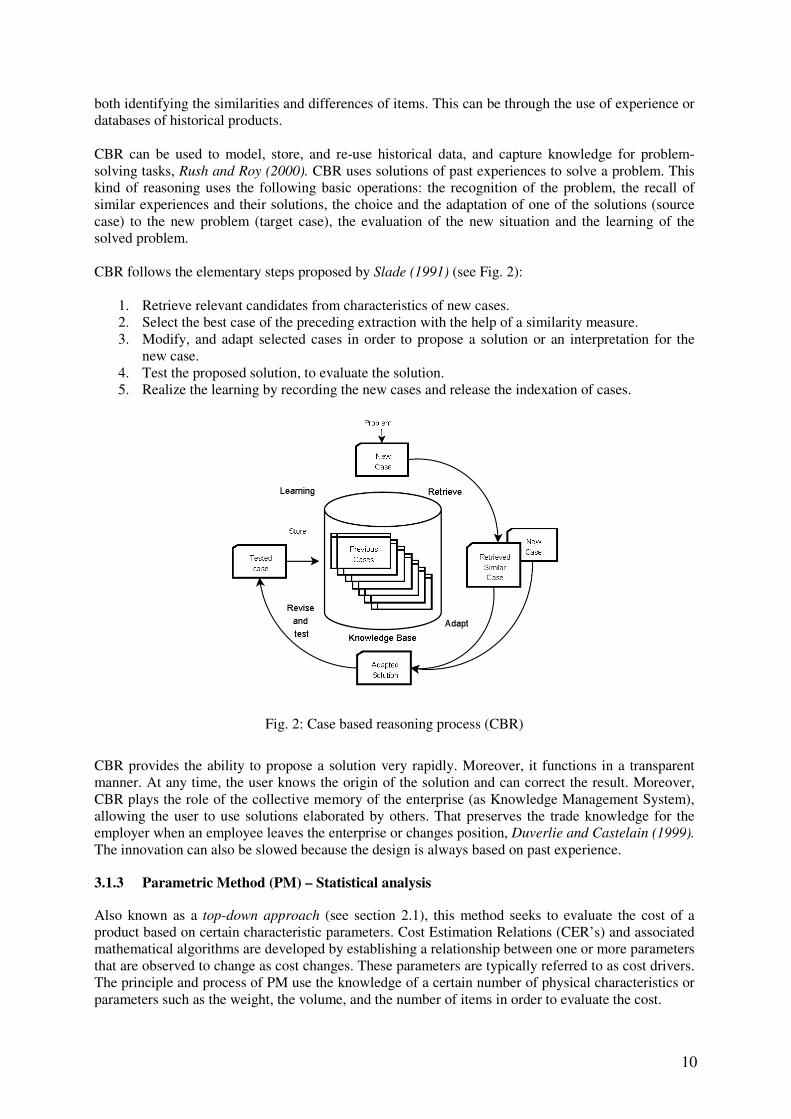
both identifying the similarities and differences of items. This can be through the use of experience or databases of historical products. CBR can be used to model, store, and re-use historical data, and capture knowledge for problem-solving tasks, Rush and Roy (2000). CBR uses solutions of past experiences to solve a problem. This kind of reasoning uses the following basic operations: the recognition of the problem, the recall of similar experiences and their solutions, the choice and the adaptation of one of the solutions (source case) to the new problem (target case), the evaluation of the new situation and the learning of the solved problem. CBR follows the elementary steps proposed by Slade (1991) (see Fig. 2):
1. Retrieve relevant candidates from characteristics of new cases. 2. Select the best case of the preceding extraction with the help of a similarity measure. 3. Modify, and adapt selected cases in order to propose a solution or an interpretation for the
new case. 4. Test the proposed solution, to evaluate the solution. 5. Realize the learning by recording the new cases and release the indexation of cases.
Fig. 2: Case based reasoning process (CBR)
CBR provides the ability to propose a solution very rapidly. Moreover, it functions in a transparent manner. At any time, the user knows the origin of the solution and can correct the result. Moreover, CBR plays the role of the collective memory of the enterprise (as Knowledge Management System), allowing the user to use solutions elaborated by others. That preserves the trade knowledge for the employer when an employee leaves the enterprise or changes position, Duverlie and Castelain (1999). The innovation can also be slowed because the design is always based on past experience.
3.1.3 Parametric Method (PM) – Statistical analysis
Also known as a top-down approach (see section 2.1), this method seeks to evaluate the cost of a product based on certain characteristic parameters. Cost Estimation Relations (CER’s) and associated mathematical algorithms are developed by establishing a relationship between one or more parameters that are observed to change as cost changes. These parameters are typically referred to as cost drivers. The principle and process of PM use the knowledge of a certain number of physical characteristics or parameters such as the weight, the volume, and the number of items in order to evaluate the cost.

11
To illustrate this concept more clearly the following example is presented. Typically, for ship development, weight relates to the cost of production. That is, as the weight of the ship increases, so does the cost of producing it. What’s more, this particular relationship is often described as linear, as illustrated in Fig. 3. In this hypothetical example the points of the graph represent the relationship of cost to weight for different ships. The line traversing the points represents a linear relationship i.e. as the weight increases so does the cost. Using relatively simple algebra it is possible to derive a mathematical relation between the cost and the weight. For the below graph the equation, y = a.x+b is used to describe the line of best fit between the points. With the relationship described it is then possible to use the formula to predict the cost of a future ship based on its weight alone. Within the field of cost estimating this relationship is known as a Cost Estimating Relationship (CER) or Cost Estimate Formulae (CEF).
Fig. 3: Simple linear cost estimating relationship
The primary advantage of parametric cost assessment is that the data reflect changing cost conditions. Parametric method estimating can be used throughout the product life cycle. However, it is mainly used during the early stages of design and for trade studies. The parametric method is very useful because of its rapidity of execution. It can be criticized for working like a "black box": that is to say that from the specifications the only results we obtain are different costs, Duverlie and Castelain (1999). We do not know the origin of these costs, which can discourage users. During the design step, not all information is available.
3.1.4 Feature-Based Costing (FBC)
FBC is a methodology for estimating the cost of a product based on the analysis of a series of its elementary characteristics, called product features. Products can essentially be described as a number of associated features such as holes, inner contour, outer contour, welding length, welding position, cutouts, bevels, etc. It follows that each product feature has cost implications during production, since the more features a product has the more manufacturing and planning it will require. The growth of CAD/CAM technology and that of 3D modeling tools have largely influenced the development of FBC, Giudice et al. (2006). With this approach, it is possible to evaluate the consequences that choosing to include or exclude the feature will have not only on the costs of a single component, but also on the system of costs of the entire life cycle of a product consisting of several components. This approach, also called bottom-up approach (see section 2.2), allows the evaluation of cost from a decomposition of the required work into elementary tasks and relies on detailed engineering analysis and calculations. To apply this approach, the cost analyst needs detailed design and configuration information for system components and accounting information for all materials, equipment, and labor. This method finds its application when costing information for workshop processes is readily

12
available. Given sufficient design detail, this method can make very accurate cost estimates, Roy and Kerr (2003). However, it is very time-consuming and does require detailed knowledge about the product being designed and the relevant processes. One of the prerequisites of this approach is that the product model needs to be detailed enough to allow materials and production labor to be established. This means that the structural definition, systems and equipment need to be defined and may rule out this approach being used in the earliest stages of design, Bole (2006). However, as ship design tools improve, it is becoming easier to add preliminary production details at the start of design so that production considerations can be incorporated in the design process. Consequently, this technique may be employed shortly after the initiation of a design project. This approach will capture enough detail to allow the effectiveness of production processes to be evaluated and potentially optimized, Giudice et al. (2006), Rush and Roy (2000), Bole (2006). In the past, extracting the information from the design to perform this kind of analysis would have been very laborious because the cost engineer would have to measure production details directly from plans. However, with modern ship product modeling software, the identification of parts and junctions can be automated providing the cost engineer with a full breakdown.
3.1.5 Fuzzy Logic Method (FLM)
FLM is an essentially pragmatic, effective and generic approach, Chevrie and Guely (1998). It allows systematization of empirical knowledge, which is hard to control. The theory of fuzzy sets offers a suitable method that is easy to implement in real time applications, and enables knowledge of designers and operators to be transcribed into dynamic control systems. While most conventional methods of cost estimation are deterministic in nature, the design process is characterized by intrinsic uncertainties. Fuzzy logic has been used to address the issue of uncertainty in some ship design applications, Parsons et al. (1999) and Shehab and Abdalla (2002). In this approach, a mapping between the characteristic parameters of a design and the cost function is achieved through a set of if-then rules that incorporate fuzzy logic in terms of varied degrees of membership of the parameters in the cost function. A vital condition for the use of fuzzy rules is the existence of human expertise and know-how. Fuzzy rule bases cannot provide a solution when no-one knows how the system operates or people are unable to manually control it. When such know-how exists and can be transcribed in the form of fuzzy rules, fuzzy logic simplifies its implementation, and operation is then easily understood by the user. If human expertise exists, then fuzzy rules can be used, particularly when system knowledge is tainted by imperfections, when the system is complex and hard to model and when the method used requires a global view of some of its aspects.
3.1.6 Neural Networks Method (NNM)
NNM are a form of artificial intelligence that are used to simulate human thought processes and thus can be used as a method of linking historic cost information with a proposed design model, Smith and Mason (1996). For cost estimating purposes, Roy and Kerr (2003), Seo et al. (2002) and Caprace et al. (2007), the basic idea of using NNM is to make a computer program learn the effect of product-related attributes to cost. That is, to provide data to a computer so that it can learn which product attributes mostly influence the final cost. This is achieved by training the system with data from past case examples. The ANN then approximates the functional relationship between the attribute values and the cost during the training. Once trained, the attribute values of a product under development are supplied to the network, which applies the approximated function obtained from the training data and computes a prospective cost.
13
Neural models can be developed and used for estimating all stages of a product life cycle provided the data is available for training. A great advantage that a neural network has compared to parametric costing is that it is able to detect hidden relationships among data. Another important characteristic of ANN is that it can learn from their training experience. Learning provides an adaptive capability that can extract nonlinear parametric relationships from the input and the output vectors. It is probably the most accurate Data Mining (DM) method among the available data driven prediction techniques. Unfortunately, from the point of view of interpretability it is perceived as a "black box". This is no good if customers require a detailed list of the reasons and assumptions behind the cost estimate. Neural networks require a large learning DB in order to be effective, which would not suit industries that produce limited product ranges. In addition, the DB needs to be comprised of similar products, and new products need to be of a similar nature, to get an effective cost estimate. Thus, neural networks cannot cope easily with novelty or innovation. The last issue involves a tradeoff between over training and under training. Optimum training will capture the essential information in the training data without being overly sensitive to noise.
3.1.7 Simulation method (SM)
Production simulation or Virtual Manufacturing (VM) enables the modeling and simulation of production systems and processes to ensure, in advance of the start of production, that they operate at peak efficiency. Simulation is a key new technology of the millennium with considerable expected growth rates per year, Steinhauer (2003) and Bair (2009). Simulation can be used in very different fields with a lot of different methods. The most common method used to model the production and fabrication of product is called Discrete Event Simulation (DES). DES only takes points in time (events) into consideration. Such events may, for example, be a part entering a station or leaving it, or moving on to another machine. Nowadays, DES tools like Plant Simulation or CATIA with DELMIA helps shipyards to increase the efficiency and the workshop productivity, and to give computer-supported answers to the major questions: when and where to produce what and with which resources depending on the availability and restrictions of resources and materials. One of the major advantages of the production simulation is that it is possible to integrate the operating rules of each workshop and simulate the complex interactions between the different actors (human and material resources, transportation, machinery and tools, etc.). The production simulation is particularly effective to tackle phenomena such as the surface management, transport management, flow management (identification of bottlenecks), management of failures and hazards, etc. that a simple analytic workload simulation cannot integrate. The cost assessment of a product starting from simulation model is a quite easy task. Indeed, all individual process times of the manufacturing tasks are a result of the simulation and linked to various resources. To assess the cost of the process, we can just multiply the utilization time of each resource by his dedicated cost rate (Euros/hour).
3.2 Selection of cost assessment method
In the design phase, all the information is not available at the moment of the economic evaluation, and that speed of evaluation is an important element (the main activity in design is not to make the cost assessment). Depending on the stage of analysis, the level of detail expected, and the extent of information

14
available, different cost modeling techniques can be employed for the estimation of cost in design, Iqbal and Hansen (2006) and Duverlie and Castelain (1999). These methods cannot be used during the whole life cycle (see Table II). Some methods are better than others depending on the context and design maturity (see Table I). When the data is available, all methods could be used. But different estimation methods provide different projections of the anticipated costs. The projected differences in cost could have a significant impact on the overall viability of a project or the selection of the optimum design for a product or process.
Table I: Advantages and limitations of cost assessment methods
Method Advantages Drawbacks and limitations
IM • Quick to produce
• Flexible
• Susceptible to bias
• Unstructured
• Different experts use different mechanisms
CBR • Can propose a solution rapidly
• Plays the role of collective
• Very good logic visibility
• Avoid previously committed errors
• Stores the knowledge of the company
• Need a reliable case base
• Doesn’t handle innovative solutions
PM • Makes clear the influence of parameters on cost
• Repeatable and objective
• Quick to produce
• Parameters not included maybe important
• Simplistic
• Logic not visible (black box)
FBC • Enables integration of CAD/CAM with cost information
• Could be automated
• Clear link between design choice and cost
• Require large resources to implement
• No consensus on what features are
FLM • Very good logic visibility
• Integration of the imperfection of the model (fuzzy sets)
• Need of human expertise and know-how
• Doesn’t handle innovative solutions
NNM • Accurate estimates possible
• Can be updated and retrained (adaptative capability)
• Logic not visible (black box)
• Complex
• Require a large and reliable historical database
• Doesn’t handle innovative solutions
SM • Good logic visibility (GUI)
• Can easily vary the product and organizational parameters
• Requires time and very important resources
• Model building requires special training & experience
3.2.1 Multi Criteria decision analysis
In the majority of practical design decision problems no alternative exists, which is the best in all criteria. In fact, each alternative offers both strengths and weaknesses, which must be counterbalanced. Therefore, Multi-Criteria Analysis (MCA) also called Multiple Criteria Decision Making (MCDM) approaches have been developed to support structuring the problem, formalizing the trade-offs between the alternatives and fostering the transparency of the decision. Multi-criteria analysis is an especially important approach for the interpretation of the results of a comparative analysis of technological alternatives and for addressing the relevance of the different parameters of interest. Although MCDM models have been used in many applications in engineering science, Chareonsuk et al. (1997) and Treitz et al. (2005), only a very few of such models can be found in the field of shipbuilding industry. We choose the PROMETHEE method (Preference Ranking Organization METHod for Enrichment Evaluations) in order to perform the MCDM of the cost assessment techniques. PROMETHEE is designed by Brans et al. (1988) and is one of the best outranking methods for multiple criteria problems. The method and its applications have been described in more details in the paper Brans and Mareschal (1992). The PROMETHEE method gives the ranking of the alternatives for the model, once all the parameters and the values are presented.

15
3.2.1.1 Definition of alternatives
The outcome of any decision making model depends on the information at its disposal and the type of this information may vary according to the context in which one is operating, therefore it is useful for decision making models to consider all the information as a whole. In MCDM the decision procedure is normally carried out by choosing between different elements that the decision maker has to examine and to assess using a set of criteria. These elements are called alternatives. For this study, the different alternatives have already been described in section 3.1. Among them we have the Intuitive Method (IM), the Case Based Reasoning (CBR), the Parametric Method (PM), Feature-Based Costing (FBC), the Fuzzy logic method (FLM), the Neural Networks Method (NNM) and the Simulation method (SM).
3.2.1.2 Definition of criterion
The criterion represents the tools which enable alternatives to be compared from a specific point of view. It must be remembered that the selection of criteria is of prime importance in the resolution of a given problem, meaning that it is vital to identify a coherent family of criteria. The number of criteria is heavily dependent on the availability of both quantitative and qualitative information and data. Tables II and III show the 17 criteria selected for this study. These criteria were gathered into 6 families (design applicability, accuracy, data needs, usability and cost) as listed in Table IV.
Table II: Cost assessment methods versus design stages (� applicable; hardly applicable)
IM CBR PM FBC FLM NNM SM
Innovation � � � � Trade Studies � � � � � Early Design Stage � � � � Basic Design Stage � � � � � � Detailed Design Stage � � � Production � �
Table III : Effectiveness of various types of cost assessment methods
Methods Logic
Visibility
Reusable for
other
applications
Accuracy Ability to reflect
Production changes
Ability to reflect
Design changes
IM No No Low Possible Possible CBR Yes No Fair No Possible PM No No Fair No Possible FBC Yes No Very High Yes Yes FLM Yes Yes High Possible Possible NNM No Yes High Yes No SM Yes Yes Very High Yes Yes
Methods Historical
Data need
Cost DB
Size
Development
Cost
Computation
Time
Ease of
Use
Compatibility
with other
software
IM No Low Low Quick Moderate Low CBR Yes Some Large Moderate Moderate Possible PM Yes Some Low Quick High Possible FBC No Large Very Large Slow High High FLM No Low Moderate Quick Moderate High NNM Yes Large Moderate Quick Moderate High SM No Large Very Large Moderate Low High

16
3.2.1.3 Definition of weights and scenarios
The results of multi-criteria analysis hinge on the weightings allocated and thresholds set. The weights express the importance of each criterion and obviously may deeply influence the final outcome of the entire calculation procedure. For some authors, the problem of how to determine the weights to assign is still unresolved since the different outranking methods do not lay down any standard procedure or guidelines for determining them. In this study, 5 scenarios with 5 different weight vectors were formulated to circumvent this problem, Table IV:
1. The first scenario W1, representing the base-case, was calculated attributing equal weights to all family of criterion.
2. The second scenario W2 was calculated attributing the focus on cost (35%), usability (30%) and accuracy (16%).
3. The third scenario W3 was calculated attributing the focus on accuracy (35%), usability (30%) and design applicability (16%).
4. The fourth scenario W4 was calculated attributing the focus on design applicability (40%), cost (30%) and usability (20%).
5. In order to finalize the set of scenarios that should be employed while evaluating the cost assessment methods, suitable survey were designed and dispatched to a large number of shipyards, ship owners and research centers. Based on majority opinion, the weight to be adopted for the evaluation of cost assessment methods in scenario W5 have been defined focusing on usability (36%), accuracy (29%) and cost (18%).
Table IV: Definition of scenarios
Family Criteria Scenarios
W1 W2 W3 W4 W5 Design Applicability Trade studies 3% 20% 2% 9% 3% 15% 7% 14% 2% 9% 3% 2% 3% 7% 2% 3% 2% 3% 7% 2% 3% 2% 3% 7% 2% 3% 2% 3% 7% 2% 3% 2% 3% 7% 2% Accuracy Accuracy 7% 20% 8% 16% 20% 35% 3% 5% 11% 29% Ability to reflect prod.
changes 7% 4% 8% 1% 5%
Ability to reflect design changes
7% 4% 8% 1% 14%
Data Needs Historical data need 10% 20% 5% 10% 5% 10% 3% 5% 3% 8% Cost DB size 10% 5% 5% 3% 5% Usability Logic visibility 5% 20% 10% 30% 10% 30% 6% 20% 11% 36% Reusable for other app. 5% 5% 5% 4% 12% Ease of use 5% 10% 10% 6% 11% Compatibility with other
software’s 5% 5% 5% 4% 3%
Cost Development cost 10% 20% 20% 35% 7% 10% 20% 30% 6% 18% Computation time 10% 15% 3% 10% 12%
3.2.1.4 Results
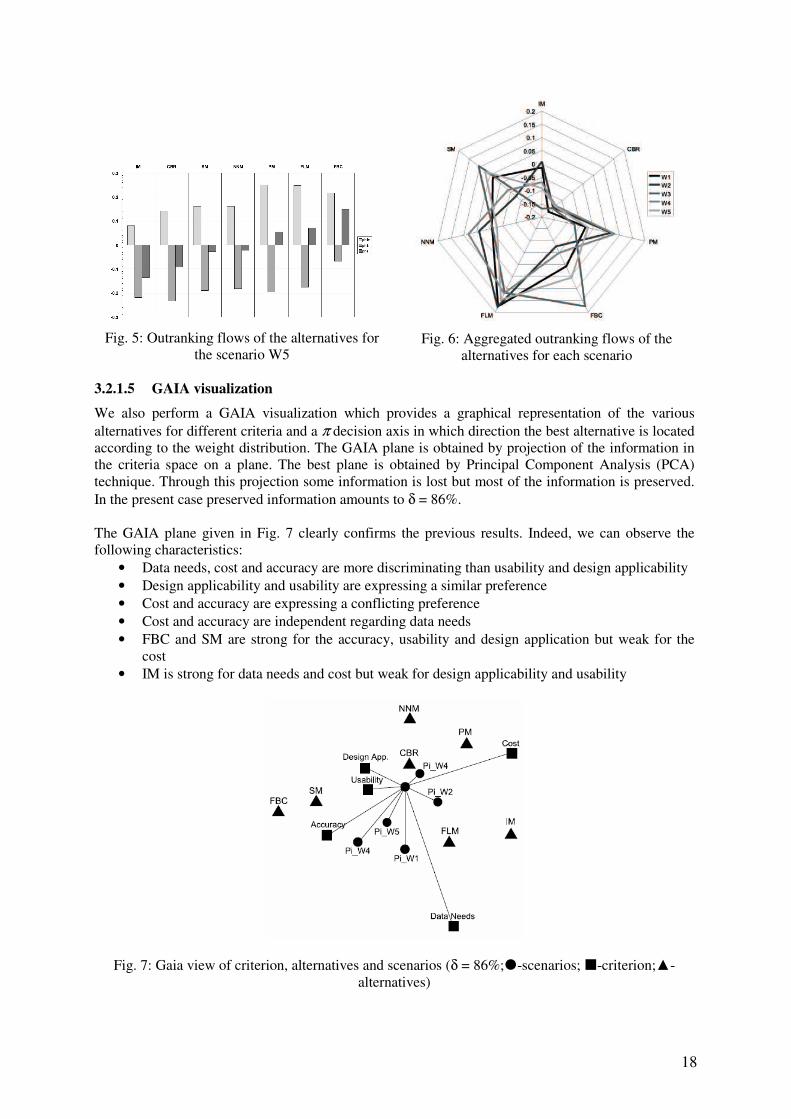
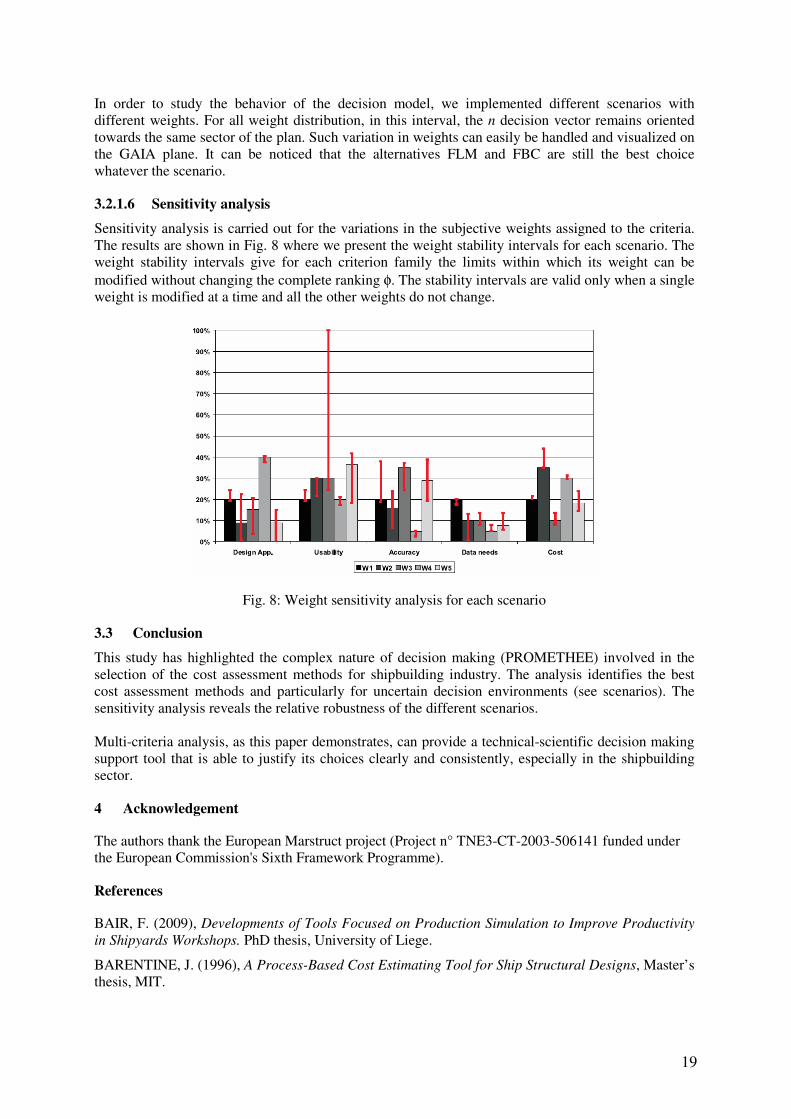
Fig. 5 presents the results regarding preferences (positive outranking flow φ+, negative outranking flow φ- and global outranking flow φ) of the various alternatives expressed numerically for the scenario W5. The higher the global outranking flows the better the alternative is. The small φ- flow for the alternative FLM indicates, that is has a strong performance on most criteria, whereas the small φ+ flow of alternative CBR is a sign that this alternative is weak in most attribute values whatever the scenario. This result is confirmed by the spider diagram of the net flows of each criterion (see Fig. 4) which shows that FLM is the strongest alternative (maximization of the spider surface) and CBR is the weakest alternative (minimization of the spider surface). Hence, also a change of the weight of the different criteria will show the FLM as the outstanding alternative, Fig. 6. However, this assessment technique requires absolutely the existence of human expertise and know-how. Thus, we can not use it in all application cases.

17
(a) IM (b) CBR
(c) PM (d) FBC
(e) FLM (f) NNM
(g) SM Fig. 4: Spider representation of ranking matrix for each alternative
18
Fig. 5: Outranking flows of the alternatives for the scenario W5
Fig. 6: Aggregated outranking flows of the alternatives for each scenario
3.2.1.5 GAIA visualization
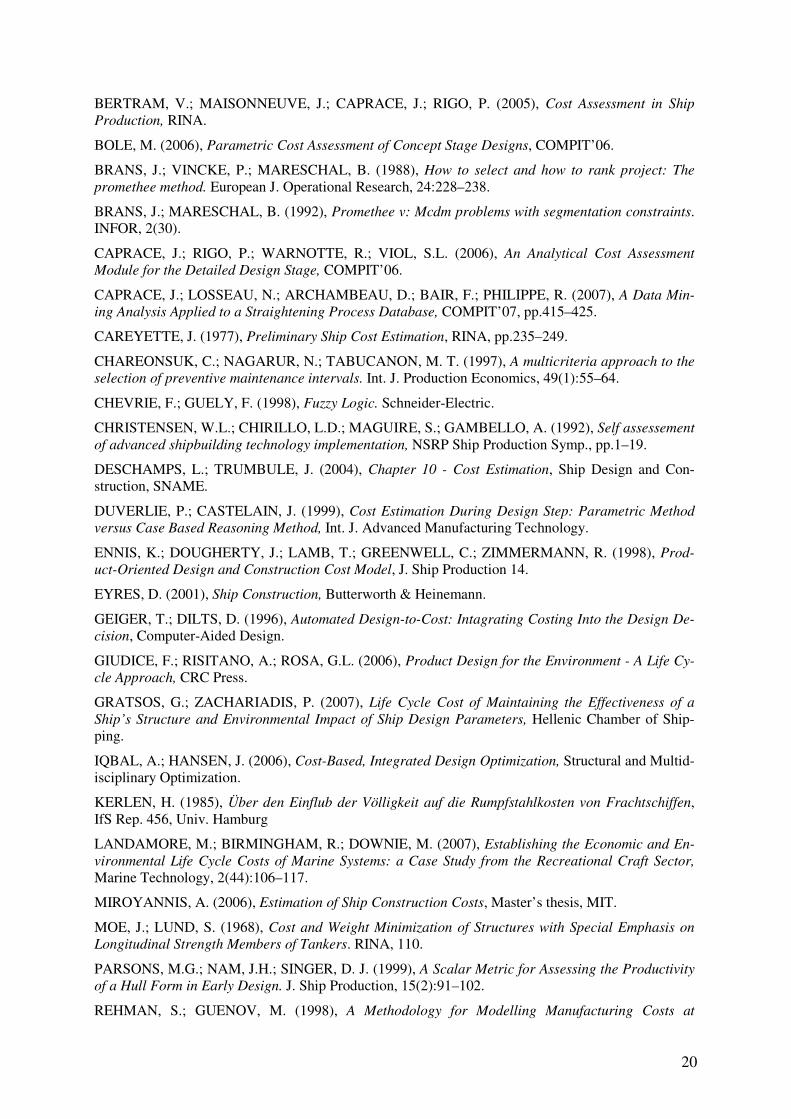
We also perform a GAIA visualization which provides a graphical representation of the various alternatives for different criteria and a π decision axis in which direction the best alternative is located according to the weight distribution. The GAIA plane is obtained by projection of the information in the criteria space on a plane. The best plane is obtained by Principal Component Analysis (PCA) technique. Through this projection some information is lost but most of the information is preserved. In the present case preserved information amounts to δ = 86%. The GAIA plane given in Fig. 7 clearly confirms the previous results. Indeed, we can observe the following characteristics:
• Data needs, cost and accuracy are more discriminating than usability and design applicability • Design applicability and usability are expressing a similar preference • Cost and accuracy are expressing a conflicting preference • Cost and accuracy are independent regarding data needs • FBC and SM are strong for the accuracy, usability and design application but weak for the
cost • IM is strong for data needs and cost but weak for design applicability and usability
Fig. 7: Gaia view of criterion, alternatives and scenarios (δ = 86%;�-scenarios; �-criterion;▲-
alternatives)
19
In order to study the behavior of the decision model, we implemented different scenarios with different weights. For all weight distribution, in this interval, the n decision vector remains oriented towards the same sector of the plan. Such variation in weights can easily be handled and visualized on the GAIA plane. It can be noticed that the alternatives FLM and FBC are still the best choice whatever the scenario.
3.2.1.6 Sensitivity analysis
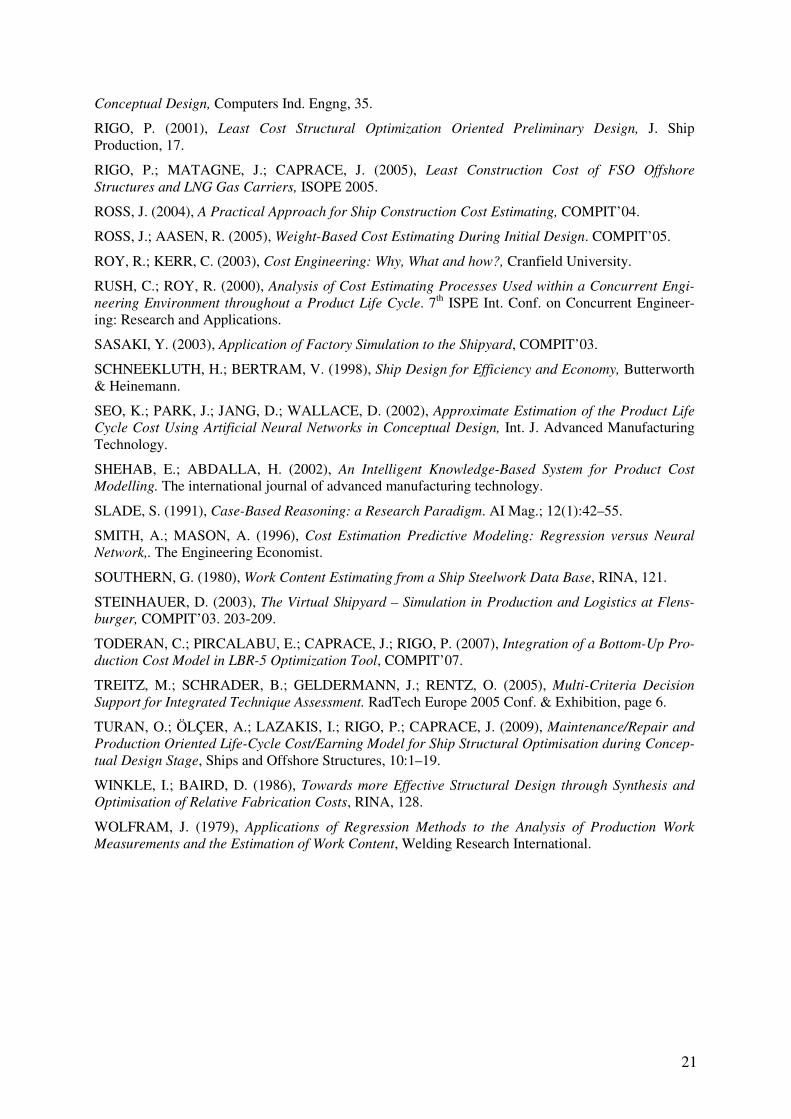
Sensitivity analysis is carried out for the variations in the subjective weights assigned to the criteria. The results are shown in Fig. 8 where we present the weight stability intervals for each scenario. The weight stability intervals give for each criterion family the limits within which its weight can be modified without changing the complete ranking φ. The stability intervals are valid only when a single weight is modified at a time and all the other weights do not change.
Fig. 8: Weight sensitivity analysis for each scenario
3.3 Conclusion
This study has highlighted the complex nature of decision making (PROMETHEE) involved in the selection of the cost assessment methods for shipbuilding industry. The analysis identifies the best cost assessment methods and particularly for uncertain decision environments (see scenarios). The sensitivity analysis reveals the relative robustness of the different scenarios. Multi-criteria analysis, as this paper demonstrates, can provide a technical-scientific decision making support tool that is able to justify its choices clearly and consistently, especially in the shipbuilding sector.
4 Acknowledgement
The authors thank the European Marstruct project (Project n° TNE3-CT-2003-506141 funded under the European Commission's Sixth Framework Programme).
References
BAIR, F. (2009), Developments of Tools Focused on Production Simulation to Improve Productivity in Shipyards Workshops. PhD thesis, University of Liege.
BARENTINE, J. (1996), A Process-Based Cost Estimating Tool for Ship Structural Designs, Master’s thesis, MIT.
20
BERTRAM, V.; MAISONNEUVE, J.; CAPRACE, J.; RIGO, P. (2005), Cost Assessment in Ship Production, RINA.
BOLE, M. (2006), Parametric Cost Assessment of Concept Stage Designs, COMPIT’06.
BRANS, J.; VINCKE, P.; MARESCHAL, B. (1988), How to select and how to rank project: The promethee method. European J. Operational Research, 24:228–238.
BRANS, J.; MARESCHAL, B. (1992), Promethee v: Mcdm problems with segmentation constraints. INFOR, 2(30).
CAPRACE, J.; RIGO, P.; WARNOTTE, R.; VIOL, S.L. (2006), An Analytical Cost Assessment Module for the Detailed Design Stage, COMPIT’06.
CAPRACE, J.; LOSSEAU, N.; ARCHAMBEAU, D.; BAIR, F.; PHILIPPE, R. (2007), A Data Min-ing Analysis Applied to a Straightening Process Database, COMPIT’07, pp.415–425.
CAREYETTE, J. (1977), Preliminary Ship Cost Estimation, RINA, pp.235–249.
CHAREONSUK, C.; NAGARUR, N.; TABUCANON, M. T. (1997), A multicriteria approach to the selection of preventive maintenance intervals. Int. J. Production Economics, 49(1):55–64.
CHEVRIE, F.; GUELY, F. (1998), Fuzzy Logic. Schneider-Electric.
CHRISTENSEN, W.L.; CHIRILLO, L.D.; MAGUIRE, S.; GAMBELLO, A. (1992), Self assessement of advanced shipbuilding technology implementation, NSRP Ship Production Symp., pp.1–19.
DESCHAMPS, L.; TRUMBULE, J. (2004), Chapter 10 - Cost Estimation, Ship Design and Con-struction, SNAME.
DUVERLIE, P.; CASTELAIN, J. (1999), Cost Estimation During Design Step: Parametric Method versus Case Based Reasoning Method, Int. J. Advanced Manufacturing Technology.
ENNIS, K.; DOUGHERTY, J.; LAMB, T.; GREENWELL, C.; ZIMMERMANN, R. (1998), Prod-uct-Oriented Design and Construction Cost Model, J. Ship Production 14.
EYRES, D. (2001), Ship Construction, Butterworth & Heinemann.
GEIGER, T.; DILTS, D. (1996), Automated Design-to-Cost: Intagrating Costing Into the Design De-cision, Computer-Aided Design.
GIUDICE, F.; RISITANO, A.; ROSA, G.L. (2006), Product Design for the Environment - A Life Cy-cle Approach, CRC Press.
GRATSOS, G.; ZACHARIADIS, P. (2007), Life Cycle Cost of Maintaining the Effectiveness of a Ship’s Structure and Environmental Impact of Ship Design Parameters, Hellenic Chamber of Ship-ping.
IQBAL, A.; HANSEN, J. (2006), Cost-Based, Integrated Design Optimization, Structural and Multid-isciplinary Optimization.
KERLEN, H. (1985), Über den Einflub der Völligkeit auf die Rumpfstahlkosten von Frachtschiffen, IfS Rep. 456, Univ. Hamburg
LANDAMORE, M.; BIRMINGHAM, R.; DOWNIE, M. (2007), Establishing the Economic and En-vironmental Life Cycle Costs of Marine Systems: a Case Study from the Recreational Craft Sector, Marine Technology, 2(44):106–117.
MIROYANNIS, A. (2006), Estimation of Ship Construction Costs, Master’s thesis, MIT.
MOE, J.; LUND, S. (1968), Cost and Weight Minimization of Structures with Special Emphasis on Longitudinal Strength Members of Tankers. RINA, 110.
PARSONS, M.G.; NAM, J.H.; SINGER, D. J. (1999), A Scalar Metric for Assessing the Productivity of a Hull Form in Early Design. J. Ship Production, 15(2):91–102.
REHMAN, S.; GUENOV, M. (1998), A Methodology for Modelling Manufacturing Costs at
21
Conceptual Design, Computers Ind. Engng, 35.
RIGO, P. (2001), Least Cost Structural Optimization Oriented Preliminary Design, J. Ship Production, 17.
RIGO, P.; MATAGNE, J.; CAPRACE, J. (2005), Least Construction Cost of FSO Offshore Structures and LNG Gas Carriers, ISOPE 2005.
ROSS, J. (2004), A Practical Approach for Ship Construction Cost Estimating, COMPIT’04.
ROSS, J.; AASEN, R. (2005), Weight-Based Cost Estimating During Initial Design. COMPIT’05.
ROY, R.; KERR, C. (2003), Cost Engineering: Why, What and how?, Cranfield University.
RUSH, C.; ROY, R. (2000), Analysis of Cost Estimating Processes Used within a Concurrent Engi-neering Environment throughout a Product Life Cycle. 7th ISPE Int. Conf. on Concurrent Engineer-ing: Research and Applications.
SASAKI, Y. (2003), Application of Factory Simulation to the Shipyard, COMPIT’03.
SCHNEEKLUTH, H.; BERTRAM, V. (1998), Ship Design for Efficiency and Economy, Butterworth & Heinemann.
SEO, K.; PARK, J.; JANG, D.; WALLACE, D. (2002), Approximate Estimation of the Product Life Cycle Cost Using Artificial Neural Networks in Conceptual Design, Int. J. Advanced Manufacturing Technology.
SHEHAB, E.; ABDALLA, H. (2002), An Intelligent Knowledge-Based System for Product Cost Modelling. The international journal of advanced manufacturing technology.
SLADE, S. (1991), Case-Based Reasoning: a Research Paradigm. AI Mag.; 12(1):42–55.
SMITH, A.; MASON, A. (1996), Cost Estimation Predictive Modeling: Regression versus Neural Network,. The Engineering Economist.
SOUTHERN, G. (1980), Work Content Estimating from a Ship Steelwork Data Base, RINA, 121.
STEINHAUER, D. (2003), The Virtual Shipyard – Simulation in Production and Logistics at Flens-burger, COMPIT’03. 203-209.
TODERAN, C.; PIRCALABU, E.; CAPRACE, J.; RIGO, P. (2007), Integration of a Bottom-Up Pro-duction Cost Model in LBR-5 Optimization Tool, COMPIT’07.
TREITZ, M.; SCHRADER, B.; GELDERMANN, J.; RENTZ, O. (2005), Multi-Criteria Decision Support for Integrated Technique Assessment. RadTech Europe 2005 Conf. & Exhibition, page 6.
TURAN, O.; ÖLÇER, A.; LAZAKIS, I.; RIGO, P.; CAPRACE, J. (2009), Maintenance/Repair and Production Oriented Life-Cycle Cost/Earning Model for Ship Structural Optimisation during Concep-tual Design Stage, Ships and Offshore Structures, 10:1–19.
WINKLE, I.; BAIRD, D. (1986), Towards more Effective Structural Design through Synthesis and Optimisation of Relative Fabrication Costs, RINA, 128.
WOLFRAM, J. (1979), Applications of Regression Methods to the Analysis of Production Work Measurements and the Estimation of Work Content, Welding Research International.