A Sustainability-Based Multi-Criteria Decision Approach ...
75
ISSN 1566-6379 67 ©ACPIL Reference this paper: Duan, S.X., 2019. A Sustainability-Based Multi-Criteria Decision Approach for Information Systems Project Selection. The Electronic Journal of Information Systems Evaluation, 22(2), pp. 67-77, available online at www.ejise.com A Sustainability-Based Multi-Criteria Decision Approach for Information Systems Project Selection Sophia Xiaoxia Duan School of Business IT and Logistics, RMIT University, Melbourne VIC 3000, Australia [email protected] DOI: 10.34190/EJISE.19.22.2.001 Abstract: An effective approach for evaluating and selecting information systems (IS) projects in project management from a sustainability perspective is highly desirable in contemporary organisations with sustainable objectives. Such an approach, however, is absent from the literature. This paper presents a multi-criteria analysis approach for effectively evaluating and selecting IS projects for project management in organisations based on their sustainability performance under environmental, economic, and social dimensions. Such an approach considers the subjective and uncertain nature of the IS project selection process using linguistic variables approximated by fuzzy numbers and effectively aggregates the subjective assessments for determining the overall sustainable performance of individual IS projects across all the selection criteria and their associated sub-criteria. The proposed multi-criteria decision-making approach provides organisations with a proactive mechanism for effectively evaluating and selecting IS projects from a sustainability perspective. An IS project selection problem is presented to demonstrate the effectiveness of the approach. Keywords: multi-criteria decision analysis, fuzzy theory, project selection, sustainability performance, information systems, project management 1. Introduction Sustainability is becoming increasingly important to every organisation due to the rapidly growing world population, the increasing industrial production activities which heavily rely on the consumption of non- renewable resources and the rapid development of emerging economies (Silvius and Schipper, 2014). Organisations worldwide are under growing pressure to meet government environmental regulations and compliance standards, to mitigate the environmental impact of their operations, and to address the environmental concerns of various stakeholders while simultaneously increasing their profitability and improving their competitiveness (Huemann and Silvius, 2017). Project-based organisations undertake projects to achieve their business objectives (Project Management Institute, 2013). To effectively achieve the organisational sustainability objective in a dynamic environment, the evaluation and selection of appropriate projects for development needs with the consideration of sustainability are critical to the organisation (Sanchez, 2015). Much research has been done on sustainability and project management, but few studies focus on the intersection of these two topics (Marcelino-Sadaba, Gonzalez-Jaen and Perez-Ezcurdia, 2015; Huemann and Silvius, 2017). The existing studies that integrate these two themes focus on the evaluation of the environmental impact of projects, particularly construction and engineering projects (Huemann and Silvius, 2017). Limited research has been conducted on evaluating the sustainability performance of information systems (IS) projects in organisations. This creates an enormous gap in research as to how to incorporate the sustainability assessment in the process of evaluating and selecting IS projects. Evaluating and selecting IS projects are important processes in modern organisations (Marnewick, 2017; Zou, Duan and Deng, 2019). This is because industrial production, service provisioning, and business administration are all heavily dependent on the smooth operations of IS which are expensive to develop, complex to use, and difficult to maintain (Deng and Wibowo, 2008). The availability of numerous IS projects, the increasing complexities of these projects, and the pressure to make timely decisions in a dynamic environment further complicate the IS project evaluation and selection process (Yeh et al., 2010; Dutra, Ribeiro and DeCarvalho, 2014). Evaluating the performance of IS projects is complex and challenging. It often involves multiple evaluation criteria and subjective and imprecise assessments. Much research has been done on the development of
Transcript of A Sustainability-Based Multi-Criteria Decision Approach ...
ISSN 1566-6379 67 ©ACPIL
Reference this paper: Duan, S.X., 2019. A Sustainability-Based Multi-Criteria Decision Approach for Information Systems Project Selection. The Electronic Journal of Information Systems Evaluation, 22(2), pp. 67-77, available online at www.ejise.com
A Sustainability-Based Multi-Criteria Decision Approach for Information Systems Project Selection
Sophia Xiaoxia Duan
School of Business IT and Logistics, RMIT University, Melbourne VIC 3000, Australia
[email protected] DOI: 10.34190/EJISE.19.22.2.001 Abstract: An effective approach for evaluating and selecting information systems (IS) projects in project management from a sustainability perspective is highly desirable in contemporary organisations with sustainable objectives. Such an approach, however, is absent from the literature. This paper presents a multi-criteria analysis approach for effectively evaluating and selecting IS projects for project management in organisations based on their sustainability performance under environmental, economic, and social dimensions. Such an approach considers the subjective and uncertain nature of the IS project selection process using linguistic variables approximated by fuzzy numbers and effectively aggregates the subjective assessments for determining the overall sustainable performance of individual IS projects across all the selection criteria and their associated sub-criteria. The proposed multi-criteria decision-making approach provides organisations with a proactive mechanism for effectively evaluating and selecting IS projects from a sustainability perspective. An IS project selection problem is presented to demonstrate the effectiveness of the approach. Keywords: multi-criteria decision analysis, fuzzy theory, project selection, sustainability performance, information systems, project management
1. Introduction
Sustainability is becoming increasingly important to every organisation due to the rapidly growing world population, the increasing industrial production activities which heavily rely on the consumption of non-renewable resources and the rapid development of emerging economies (Silvius and Schipper, 2014). Organisations worldwide are under growing pressure to meet government environmental regulations and compliance standards, to mitigate the environmental impact of their operations, and to address the environmental concerns of various stakeholders while simultaneously increasing their profitability and improving their competitiveness (Huemann and Silvius, 2017). Project-based organisations undertake projects to achieve their business objectives (Project Management Institute, 2013). To effectively achieve the organisational sustainability objective in a dynamic environment, the evaluation and selection of appropriate projects for development needs with the consideration of sustainability are critical to the organisation (Sanchez, 2015). Much research has been done on sustainability and project management, but few studies focus on the intersection of these two topics (Marcelino-Sadaba, Gonzalez-Jaen and Perez-Ezcurdia, 2015; Huemann and Silvius, 2017). The existing studies that integrate these two themes focus on the evaluation of the environmental impact of projects, particularly construction and engineering projects (Huemann and Silvius, 2017). Limited research has been conducted on evaluating the sustainability performance of information systems (IS) projects in organisations. This creates an enormous gap in research as to how to incorporate the sustainability assessment in the process of evaluating and selecting IS projects. Evaluating and selecting IS projects are important processes in modern organisations (Marnewick, 2017; Zou, Duan and Deng, 2019). This is because industrial production, service provisioning, and business administration are all heavily dependent on the smooth operations of IS which are expensive to develop, complex to use, and difficult to maintain (Deng and Wibowo, 2008). The availability of numerous IS projects, the increasing complexities of these projects, and the pressure to make timely decisions in a dynamic environment further complicate the IS project evaluation and selection process (Yeh et al., 2010; Dutra, Ribeiro and DeCarvalho, 2014). Evaluating the performance of IS projects is complex and challenging. It often involves multiple evaluation criteria and subjective and imprecise assessments. Much research has been done on the development of
The Electronic Journal of Information Systems Evaluation Volume 22 Issue 2 2019
www.ejise.com 68 ©ACPIL
appropriate multi-criteria approaches for evaluating the performance of traditional IS projects. Deng and Wibowo (2008), for example, develop an intelligent decision support system for facilitating the adoption of the most appropriate multi-criteria analysis approach in solving the IS project evaluation and selection problem. Yeh et al. (2010) propose a fuzzy multi-criteria group decision-making approach for solving the IS projects selection problem. Lee and Kim (2001) present an integrated multi-criteria approach using Delphi, an analytic network process concept and zero-one goal programming for solving the IS project selection problem. Wei, Liang and Wang (2007) approach the IS project selection problem by proposing a comprehensive framework comprising three main phasesねthe strategic objective analysis phase, the system analysis phase, and the group decision-making phase. Dutra, Ribeiro and DeCarvalho (2014) propose an economic-probabilistic model for solving the IS project evaluation and selection problem. The above studies show that the development of a multi-criteria approach for evaluating the performance of IS projects is of great practical benefit. Existing studies, however, are not satisfactory due to the inadequacy of handling the subjectiveness and imprecision inherent in the evaluation process and the computational effort required (Duan, Deng and Corbitt, 2010). Furthermore, these approaches have not specifically considered the sustainability performance assessment of the IS projects. Thus, the development of an approach capable of addressing the above shortcomings is desirable. This paper presents a multi-criteria analysis approach for effectively evaluating the sustainability performance of IS projects in organisations. Such an approach considers the subjectiveness and uncertainty in the IS project selection process using linguistic variables approximated by fuzzy numbers and effectively aggregates the subjective assessments for determining the overall sustainable performance of individual IS projects across all the selection criteria and their associated sub-criteria. As a result, the most appropriate IS project which meets the sustainability requirements of the organisation can be ranked and selected. In what follows, Section 2 presents an overview of the IS project sustainability evaluation problem, leading to the identification of the sustainability criteria and their associated sub-criteria. Section 3 presents a multi-criteria analysis approach for evaluating the sustainability performance of IS projects. Section 4 gives an example for demonstrating the applicability of the approach. Section 5 discusses the contribution of this research, followed by the conclusion in Section 6.
2. Sustainability Performance Evaluation of IS Projects
Sustainability is concerned with development that meets the needs of the present without compromising the ability of future generations to meet their own needs (WCED, 1987). The concept of sustainability is widely accepted as one based on the integration of economic, environmental, and social goals, known as the triple-bottom-line (Huemann and Silvius, 2017). Many companies have adopted sustainability through their mission statement and strategy. IS projects are the vehicles for implementing such principles in an organisation (Marnewick 2017; Zou, Duan and Deng, 2019). To effectively achieve the organisational sustainability objectives in a dynamic environment, the balance and incorporation of the three sustainability dimensions into the IS project evaluation and selection process ensures adherence to the sustainability principles of the organisation. Much research has been done to identify the factors and criteria for evaluating the sustainability performance of IS projects in project management from different perspectives (Huemann and Silvius, 2017; Marnewick, 2017). These studies, however, evaluate the sustainability performance of the IS projects without adequately considering the triple-bottom-line (Martens and Carvalho, 2017). For example, Chen, Boudreau and Watson (2008) assess the sustainability performance of IS projects from the environmental perspective using criteria including eco-efficiency, eco-equity and eco-effectiveness. Watson, Boudreau and Chen (2010) evaluate the IS projects sustainability performance from the environmental perspective for a comprehensive energy informatics framework. These studies concentrate on evaluating the sustainability performance of IS projects from environmental perspectives. The rationale of these studies is that well-designed IS projects can effectively reduce the negative impact of the organisational operations on the environment and remove potential health hazards that otherwise would have resulted from implementing the chosen IS projects (Silvius and Schipper, 2014). Such studies provide insights on evaluating the sustainability performance of IS projects
Sophia Xiaoxia Duan
www.ejise.com 69 ISSN 1566-6379
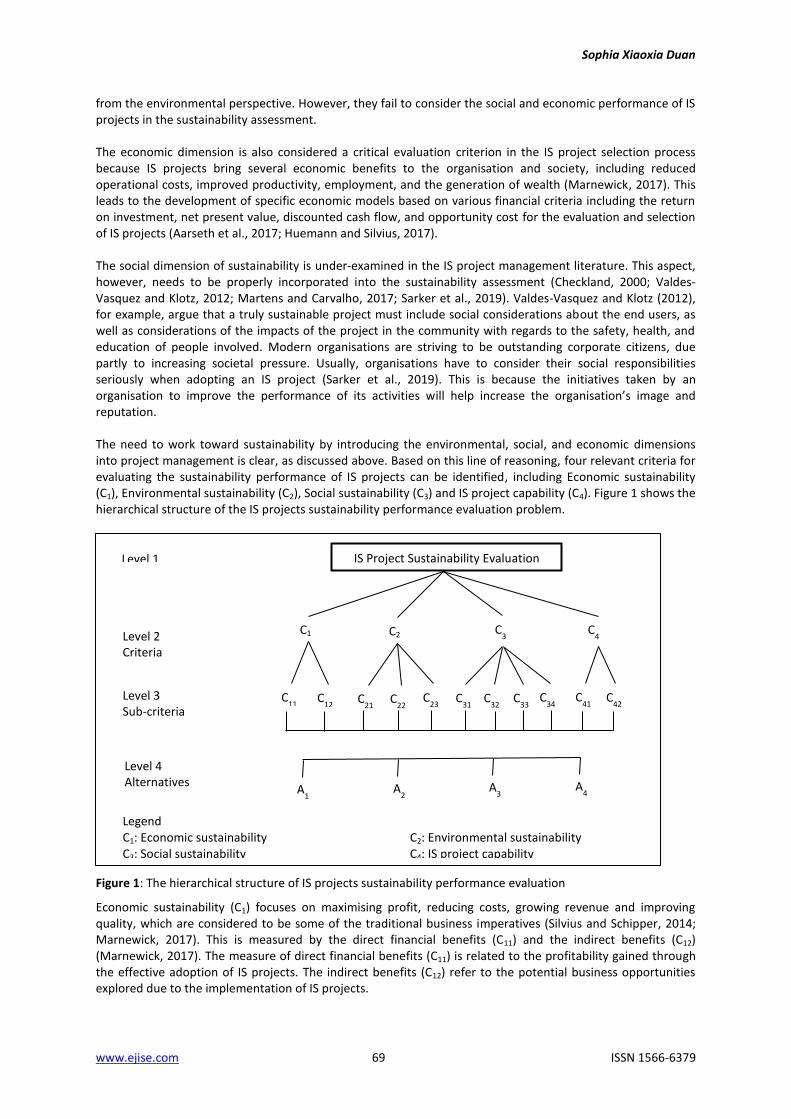
from the environmental perspective. However, they fail to consider the social and economic performance of IS projects in the sustainability assessment. The economic dimension is also considered a critical evaluation criterion in the IS project selection process because IS projects bring several economic benefits to the organisation and society, including reduced operational costs, improved productivity, employment, and the generation of wealth (Marnewick, 2017). This leads to the development of specific economic models based on various financial criteria including the return on investment, net present value, discounted cash flow, and opportunity cost for the evaluation and selection of IS projects (Aarseth et al., 2017; Huemann and Silvius, 2017). The social dimension of sustainability is under-examined in the IS project management literature. This aspect, however, needs to be properly incorporated into the sustainability assessment (Checkland, 2000; Valdes-Vasquez and Klotz, 2012; Martens and Carvalho, 2017; Sarker et al., 2019). Valdes-Vasquez and Klotz (2012), for example, argue that a truly sustainable project must include social considerations about the end users, as well as considerations of the impacts of the project in the community with regards to the safety, health, and education of people involved. Modern organisations are striving to be outstanding corporate citizens, due partly to increasing societal pressure. Usually, organisations have to consider their social responsibilities seriously when adopting an IS project (Sarker et al., 2019). This is because the initiatives taken by an organisation to improve the performance of its activities will help increase the organis;デキラミげゲ image and reputation. The need to work toward sustainability by introducing the environmental, social, and economic dimensions into project management is clear, as discussed above. Based on this line of reasoning, four relevant criteria for evaluating the sustainability performance of IS projects can be identified, including Economic sustainability (C1), Environmental sustainability (C2), Social sustainability (C3) and IS project capability (C4). Figure 1 shows the hierarchical structure of the IS projects sustainability performance evaluation problem.
Figure 1: The hierarchical structure of IS projects sustainability performance evaluation
Economic sustainability (C1) focuses on maximising profit, reducing costs, growing revenue and improving quality, which are considered to be some of the traditional business imperatives (Silvius and Schipper, 2014; Marnewick, 2017). This is measured by the direct financial benefits (C11) and the indirect benefits (C12) (Marnewick, 2017). The measure of direct financial benefits (C11) is related to the profitability gained through the effective adoption of IS projects. The indirect benefits (C12) refer to the potential business opportunities explored due to the implementation of IS projects.
IS Project Sustainability Evaluation Level 1
C1 C2 C3 C
4
C11
C12
C21
C22
C23
C31
C32
C33
C34
C41
C42
Level 2 Criteria
A1 A
2 A
3 A
4
Level 3 Sub-criteria
Level 4 Alternatives
Legend C1: Economic sustainability C2: Environmental sustainability C3: Social sustainability C4: IS project capability

The Electronic Journal of Information Systems Evaluation Volume 22 Issue 2 2019
www.ejise.com 70 ©ACPIL
Environmental sustainability (C2) is concerned with the physical environment that people inhabit (Silvius and Schipper, 2014; Sanchez, 2015). This is assessed by procurement (C21), energy (C22), and waste (C23) (Sanchez, 2015). Procurement (C21) is related to the selection of suppliers and the sourcing of project materials to help deliver the project more sustainably. Energy (C22) focuses on IS project-specific policies regarding energy consumption. This includes the energy consumption of individual team members and the equipment used during the project. Waste (C23) concerns with the way that waste is dealt with during the implementation of IS projects in the organisation. Social sustainability (C3) refers to the communities in which organisations operate, as well as the employees of an organisation, which means organisations should take cognisance of the communities in which they operate and of their employees (Checkland, 2000; Marnewick, 2017). This is measured by labour practices in the workplace (C31), human rights (C32), public acceptability (C33), and corporate reputation (C34) (Marnewick, 2017). The measure of labour practices in the workplace (C31) is related to health and safety, training and education, values and ethics, and organisational learning in the workplace. Human rights (C32) reflects the non-discrimination and freedom of association culture within the organisation. Public acceptability (C33) refers to the general attitude toward the IS projects of the organisation. Corporate reputation (C34) concerns the ゲデ;ニWエラノSWヴゲげ ゲ;デキゲa;Iデキラミ ノW┗Wノs regarding the IS projects in the organisation. The IS project capability (C4) is related to features and functionalities of the IS project (Deng and Wibowo 2008; Yeh et al., 2010). This is measured by the IS project system functionality (C41) and the system flexibility (C42) (Yeh et al., 2010). The IS project system functionality (C41) is related to the unique features and functions of the IS project that help achieve its claimed business objectives. The system flexibility (C42) refers to the ability of the system to respond to potential internal or external changes affecting its value delivery in a timely and cost-effective manner. With the sustainability criteria and sub-criteria identified above, all available IS projects have to be comprehensively evaluated to determine their overall performance across all the sustainability evaluation criteria so that the most appropriate IS projects can be selected. To effectively solve this problem, the next section presents a fuzzy multi-criteria approach for evaluating the sustainability performance of IS projects.
3. A Multi-Criteria Analysis Approach
Multi-criteria analysis approaches are proven to be effective in tackling problems involving evaluating and selecting alternatives from a finite number of options with multiple and often conflicting criteria (Duan, Deng and Corbitt, 2010; Chen and Hwang, 2012). The multi-dimensional nature of the IS projects sustainability evaluation process justifies the use of the multi-criteria analysis methodology. The Technique for Order of Preference by Similarity to Ideal Solution (TOPSIS) is a popular multi-criteria analysis approach for solving various multi-criteria analysis problems in fields such as politics, economics, social science and management science (Chen and Hwang, 2012). The underlying rationale of this approach is that the most preferred alternative should have the shortest distance from the positive ideal solution and at the same time have the longest distance from the negative ideal solution. The popularity of TOPSIS in addressing various practical problems is due to its simplicity and comprehensibility in concept and efficiency in calculation (Deng, Yeh and Willis, 2000). Subjectiveness and imprecision are always present in e-market evaluation and selection due to the presence of (a) incomplete information (b) conflicting evidence, (c) ambiguous information, and (d) subjective information (Yeh et al., 2010; Chen and Hwang, 2012). To solve the IS projects sustainability evaluation and selection problem, this section extends the TOPSIS approach to effectively model the subjectiveness and imprecision inherent in the human decision-making process using linguistic variables approximated by fuzzy numbers. A typical IS projects sustainability evaluation problem can be characterised by (a) the available IS projects for evaluation and selection, denoted as alternatives Ai ふキЭヱが ヲが ぐが ミぶ and (b) the multiple sustainability evaluation and selection criteria Cj ふテ Э ヱが ヲが ぐが マぶ and their associated sub-criteria Cjk ふニ Э ヱが ヲが ぐが ヮj) as shown in Figure 1. The IS projects sustainability evaluation process involves (a) assessing the performance ratings of each IS project with respect to the sustainability criteria and sub-criteria as xij ふキ Э ヱが ヲが ぐが ミが テ Э ヱが ヲが ぐが マぶ, (b) determining the relative importance of the sustainability criteria as criteria weights W = (w1, w2, ..., wj) and

Sophia Xiaoxia Duan
www.ejise.com 71 ISSN 1566-6379
their associated sub-criteria as sub-criteria weights Wj = (wj1, wj2, ..., wjk), and (c) aggregating the performance ratings and sustainability criteria weights to determine the overall performance of individual IS projects on which the selection decision can be made. To model the subjectiveness and imprecision of the IS projects sustainability evaluation and selection process, linguistic variables approximated by triangular fuzzy numbers are used to represent the decision-マ;ニWヴげゲ subjective assessments of the sustainability criteria weightings and alternative performance ratings. Triangular fuzzy numbers are usually denoted as (a, b, c) in which b represents the most possible assessment value, and a and c represent the lower and upper bounds or the fuzziness of the assessment (Deng, Yeh and Willis, 2000). Table 1 shows the approximate distribution of the linguistic variables Performance and Importance (Duan, Deng and Corbitt, 2010) for measuring the alternative performance rating and criteria weightings respectively in the IS projects evaluation and selection process.
Table 1: Linguistic variables and their corresponding triangular fuzzy numbers
Performance Importance
Linguistic Variable Fuzzy Numbers Linguistic Variable Fuzzy Numbers
Very Poor (VP) (0.0, 0.0, 0.3) Very Low (VL) (0.0, 0.0, 0.3)
Poor (P) (0.1, 0.3, 0.5) Low (L) (0.1, 0.3, 0.5)
Fair (F) (0.3, 0.5, 0.7) Medium (M) (0.3, 0.5, 0.7)
Good (G) (0.5, 0.7, 0.9) High (H) (0.5, 0.7, 0.9)
Very Good (VG) (0.7, 1.0, 1.0) Very High (VH) (0.7, 1.0, 1.0)
Using the linguistic variable Performance as defined in Table 1, the fuzzy decision matrix for the IS projects sustainability evaluation and selection problem can be determined as
nmnn
m
m
xxx
xxx
xxx
X
...
............
...
...
21
22221
11211
(1) Where xij represents the decision-マ;ニWヴげゲ ;ゲゲWゲゲマWミデ ラa デエW ゲ┌ゲデ;キミ;Hキノキデ┞ ヮWヴaラヴマ;ミIW ヴ;デキミェ ラa ;ノデWヴミ;デキ┗W Ai with respect to the sustainability criteria Cj, which is to be given by the decision-maker using linguistic variables or aggregated from a lower-level decision matrix for its associated sub-criteria. If sub-criteria Cjk exist for Cj, a lower-level fuzzy decision matrix can be determined in (2), where yjk is the decision-マ;ニWヴげゲ ;ゲゲWゲゲマWミデ ラa デエW ヮWヴaラヴマ;ミIW ヴ;デキミェ ラa ;ノデWヴミ;デキ┗W Ai with respect to sub-criteria Cjk of the criteria Cj.
jjj
j
nppp
n
n
C
yyy
yyy
yyy
Y
...
............
...
...
21
22212
12111
(2) The weighting vectors for the sustainability evaluation criteria Cj and sub-criteria Cjk can then be given in (3) and (4) by the decision-maker using the linguistic variable Importance defined in Table 1.

The Electronic Journal of Information Systems Evaluation Volume 22 Issue 2 2019
www.ejise.com 72 ©ACPIL
W = (w1, w2, ..., wj) (3) Wj = (wj1, wj2, ..., wjk) (4) With the formulation of the lower-level fuzzy decision matrix for the sustainability criteria Cj in (2), and the weight vector in (4) for its associated sub-criteria Cjk, the decision vector ふ┝ヱテが ┝ヲテが ぐが ┝ミテぶ across all the alternatives with respect to criteria Cj in (1) can be determined by
jp
k
jk
Cjj
njjj
w
YWxxx
1
21 )...,,,(
(5) With the IS projects sustainability evaluation and selection problem described as above, the overall objective for solving the IS projects sustainability evaluation and selection problem is to rank all the alternative IS projects by giving each of them an overall performance rating with respect to all sustainability criteria and their associated sub-criteria. The process of determining the overall performance of each alternative IS project across all the sustainability criteria and their associated sub-criteria starts with calculating the overall weighted performance matrix of all the alternatives with respect to multiple sustainability evaluation and selection criteria by multiplying the criteria weights wj and the alternative performance rating xij, shown as follows:
nmmnn
mm
mm
xwxwxw
xwxwxw
xwxwxw
Z
...
............
...
...
2211
2222211
1122111
(6)
To avoid the complex and unreliable process of comparing fuzzy utilities often required in fuzzy multi-criteria analysis (Yeh et al., 2010), the defuzzification method determined by (7) based on the geometric centre of a fuzzy number, is applied to the weighted fuzzy performance matrix in (6) (Chen and Hwang, 2012).
ijijj
ijijj
Sxw
Sxw
ij
dxx
dxxx
r
(7)
Sij in (7) is the support of fuzzy number wjxij in (6). For a triangular fuzzy number (a, b, c), (7) is simplified as (8)
3
cbarij
(8)
A weighted performance matrix in a crisp value format can then be obtained as
nmnn
m
m
rrr
rrr
rrr
R
...
............
...
...
21
22221
11211
(9)

Sophia Xiaoxia Duan
www.ejise.com 73 ISSN 1566-6379
To rank the alternatives based on (9), the TOPSIS method is applied. To facilitate the use of the TOPSIS method, the concept of the positive-ideal and the negative-ideal solution is used. The positive-ideal solution A
+
and the negative-ideal solution A-, which represent the best possible and worst possible results among the
alternatives respectively across all sustainability criteria, can be determined by
A+ = ( r1
+, r2
+, ..., rm
+ ), A
- = ( r1
-, r2
-, ..., rm
- ) (10)
Where
rj+
= max ( r1j, r2j, ..., rnj ), rj- = min ( r1j, r2j, ..., rnj ) (11)
From (10) to (11), the distance between alternative Ai and the positive-ideal solution and between alternative Ai and the negative-ideal solution can be calculated respectively by
m
j
jiji
m
j
ijji )r(rd)r(rd1
2
1
2 ;
(12) A preferred alternative should have the shortest distance from the positive ideal solution and the longest distance from the negative ideal solution. As a result, an overall performance index for alternative Ai across all criteria can be determined by
ii
ii
dd
dP i = 1, 2, ..., n (13)
The larger the performance index, the more preferred the alternative. The sustainability based multi-criteria decision approach presented above can be summarised as follows:
1. Step 1: Obtain the fuzzy decision matrix assessed by the decision-maker, as expressed in (1). 2. Step 2: Obtain the fuzzy performance rating of alternatives with respect to criteria and sub-criteria
assessed by the decision-maker, as expressed in (2). 3. Step 3: Obtain the fuzzy weighting vector assessed by the decision-maker, as expressed in
(3) and (4). 4. Step 4: Determine the weighted fuzzy performance matrix by multiplying the overall fuzzy decision
matrix and the overall fuzzy weighting vector, as expressed in (6). 5. Step 5: Transfer the weighted fuzzy performance matrix into a crisp value format, as expressed in
(9). 6. Step 6: Determine the positive-ideal solution and the negative-ideal solution using (10) and (11). 7. Step 7: Calculate the distance between each alternative to the positive-ideal solution and the
negative-ideal solution using (12). 8. Step 8: Determine the overall preference value for each alternative using (13). 9. Step 9: Rank the alternatives in descending order of their preference value.
4. An Example
To demonstrate the applicability and effectiveness of the sustainability-based multi-criteria selection approach presented in the previous sections, an IS project selection problem at a high-tech manufacturing company is presented. This company plans to implement an IS project to improve operational efficiency. There are four alternatives (A1, A2, A3, A4) from which the company needs to select the most appropriate one. Meanwhile, this high-tech manufacturing company is trying to incorporate sustainability principles into its operation due to pressure from the government and trading partners. Sustainable development is incorporated in the mission statement and strategic objectives of the organisation. As a result, the organisation wants to ensure that such principles are followed when evaluating and selecting IS projects. To start with the IS projects sustainability evaluation and selection process, the performance of each IS project with respect to the sustainability evaluation and selection sub-criteria of each criterion is determined by
The Electronic Journal of Information Systems Evaluation Volume 22 Issue 2 2019
www.ejise.com 74 ©ACPIL
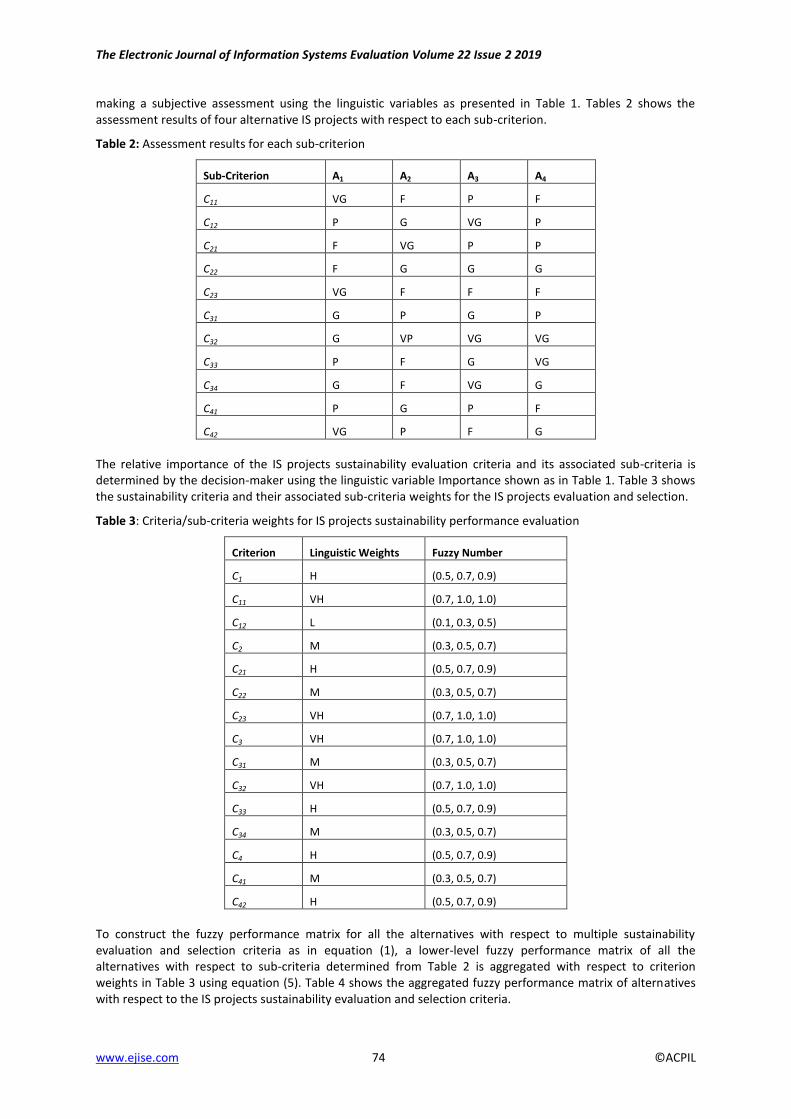
making a subjective assessment using the linguistic variables as presented in Table 1. Tables 2 shows the assessment results of four alternative IS projects with respect to each sub-criterion.
Table 2: Assessment results for each sub-criterion
Sub-Criterion A1 A2 A3 A4
C11 VG F P F
C12 P G VG P
C21 F VG P P
C22 F G G G
C23 VG F F F
C31 G P G P
C32 G VP VG VG
C33 P F G VG
C34 G F VG G
C41 P G P F
C42 VG P F G
The relative importance of the IS projects sustainability evaluation criteria and its associated sub-criteria is determined by the decision-maker using the linguistic variable Importance shown as in Table 1. Table 3 shows the sustainability criteria and their associated sub-criteria weights for the IS projects evaluation and selection.
Table 3: Criteria/sub-criteria weights for IS projects sustainability performance evaluation
Criterion Linguistic Weights Fuzzy Number
C1 H (0.5, 0.7, 0.9)
C11 VH (0.7, 1.0, 1.0)
C12 L (0.1, 0.3, 0.5)
C2 M (0.3, 0.5, 0.7)
C21 H (0.5, 0.7, 0.9)
C22 M (0.3, 0.5, 0.7)
C23 VH (0.7, 1.0, 1.0)
C3 VH (0.7, 1.0, 1.0)
C31 M (0.3, 0.5, 0.7)
C32 VH (0.7, 1.0, 1.0)
C33 H (0.5, 0.7, 0.9)
C34 M (0.3, 0.5, 0.7)
C4 H (0.5, 0.7, 0.9)
C41 M (0.3, 0.5, 0.7)
C42 H (0.5, 0.7, 0.9)
To construct the fuzzy performance matrix for all the alternatives with respect to multiple sustainability evaluation and selection criteria as in equation (1), a lower-level fuzzy performance matrix of all the alternatives with respect to sub-criteria determined from Table 2 is aggregated with respect to criterion weights in Table 3 using equation (5). Table 4 shows the aggregated fuzzy performance matrix of alternatives with respect to the IS projects sustainability evaluation and selection criteria.

Sophia Xiaoxia Duan
www.ejise.com 75 ISSN 1566-6379
Table 4: Fuzzy decision matrix for IS projects sustainability performance evaluation
C1 C2 C3 C4
A1 (0.33, 0.84, 1.56) (0.28, 0.73, 1.41) (0.21, 0.60, 1.45) (0.24, 0.71, 1.56)
A2 (0.17, 0.55, 1.44) (0.27, 0.70, 1.49) (0.08, 0.28, 0.98) (0.13, 0.47, 1.35)
A3 (0.09, 0.46, 1.25) (0.16, 0.48, 1.19) (0.33, 0.87, 1.74) (0.11, 0.42, 1.23)
A4 (0.15, 0.45, 1.19) (0.16, 0.48, 1.19) (0.31, 0.81, 1.60) (0.21, 0.62, 1.63)
The overall weighted IS projects sustainability performance matrix of all the alternatives with respect to IS projects sustainability evaluation and selection criteria is then calculated using Table 3 and Table 4, based on equation (6). The fuzzy numbers in the overall weighted performance matrix are further converted into comparable crisp numbers, following equation (8). The results are shown in Table 5.
Table 5: Weighted performance matrix in crisp numbers
C1 C2 C3 C4
A1 0.72 0.48 0.73 0.67
A2 0.59 0.49 0.44 0.53
A3 0.50 0.37 0.95 0.48
A4 0.49 0.37 0.88 0.67
Following the approach illustrated in equation (9) to equation (13), an overall performance index for each IS project across all sustainability criteria can be calculated, as shown in Table 6.
Table 6: Performance index and ranking for IS projects sustainability performance evaluation
IS projects Distance Performance Index
Rank A+ A- Pi
A1 0.22 0.43 0.66 1
A2 0.54 0.16 0.23 4
A3 0.31 0.51 0.62 3
A4 0.27 0.48 0.64 2
It is clear that project A1 is the preferred choice as it has the highest performance index.
5. Discussion
Evaluating the performance of alternative IS projects from a sustainability perspective is complex and challenging as it involves using multiple evaluation criteria that feature subjective and imprecise assessments. The above example has demonstrated the applicability of the proposed multi-criteria decision-making approach for evaluating and selecting IS projects from the sustainability perspective. Using the identified sustainability-based evaluation criteria and sub-criteria in Figure 1, the available IS projects can be comprehensively evaluated, and their overall performance across all evaluation criteria and sub-criteria can be determined. This leads to the selection of the most appropriate IS project from the sustainability perspective. This study makes a significant theoretical and practical contribution to IS project sustainability performance evaluation research. IS projects perform an important role in the sustainability development of an organisation in modern society (Marnewick, 2017; Zou, Duan and Deng, 2019). Limited research, however, has been conducted on evaluating IS projects from the sustainability perspective in the process of selecting specific IS projects for development in organisations. Theoretically this research fills this gap by proposing an effective multi-criteria approach for assessing the sustainability performance of IS projects.

The Electronic Journal of Information Systems Evaluation Volume 22 Issue 2 2019
www.ejise.com 76 ©ACPIL
Practically, this research offers decision-makers an effective approach for evaluating and selecting IS projects for achieving organisational sustainability objectives. Such an approach effectively incorporates three sustainability dimensions into the IS project selection process, while considering specific characteristics of individual IS projects. Meanwhile, this approach reduces the cognitive demands of the evaluation process on the decision-maker while accounting for the subjectiveness and uncertainty inherent in the IS project selection process.
6. Conclusion
This paper has presented a multi-criteria analysis approach for effectively evaluating the sustainability performance of IS projects under conditions of uncertainty in an organisation. Using an example, the proposed multi-criteria analysis approach has demonstrated a number of advantages for dealing with the problem of evaluating the sustainability performance of alternative IS projects, including the capability to adequately handle multiple and usually conflicting sustainability criteria, and the ability to deal with the subjectiveness and imprecision inherent in the IS projects performance evaluation problem. The approach is found to be effective and efficient, due to the comprehensive underlying concepts and straightforward computation process. A limitation of this research is that it only considered one decision-maker in the IS project performance evaluation process. Future research can be carried out to better deal with this issue through formulating such a decision problem as a group decision-making problem.
References
Aarseth, W., Ahola, T., Aaltonen, K., Okland, A., and Andersen, B. 2017. Project sustainability strategies: a systematic literature review. International Journal of Project Management, 35(6), pp. 1071-1083.
Checkland, P. 2000. Soft systems methodology: a thirty-year retrospective. Systems Research and Behavioral Science, 17(S1), S11-S58.
Chen, S. J., and Hwang, C.L. 2012. Fuzzy multiple attribute decision making: methods and applications. Berlin: Springer Science and Business Media.
Chen, A. J., Boudreau, M. C., and Watson, R. T. 2008. Information systems and ecological sustainability. Journal of Systems and Information Technology, 10(3), pp. 186-201.
Deng, H., and Wibowo, S. 2008. Intelligent decision support for evaluating and selecting information systems projects, Engineering Letters, 16(3), pp. 412-418.
Deng, H., Yeh, C. H., and Willis, R. J. 2000. Inter-company comparison using modified TOPSIS with objective weights, Computers and Operations Research, 27(10), pp. 963-973.
Duan, X., Deng, H., and Corbitt, B. 2010. A multi criteria analysis approach for the evaluation and selection of electronic market in electronic business in small and medium enterprises, Lecture Notes in Computer Science, 6318, pp. 128-137.
Dutra, C. C., Ribeiro, J. L. D., and DeCarvalho, M. M. 2014. An economic probabilistic model for project selection and prioritization, International Journal of Project Management, 32(6), pp. 1042-1055.
Huemann, M., and Silvius, G. 2017. Projects to create the future: managing projects meets sustainable development, International Journal of Project Management. 35(6), pp. 1066-1070.
Lee, J. W., and Kim, S. H. 2001. An integrated approach for interdependent information system project selection, International Journal of Project Management, 19(2), pp. 111-118.
Marcelino-Sadaba, S., Gonzalez-Jaen, L. F., and Perez-Ezcurdia, A. 2015. Using project management as a way to sustainability; from a comprehensive review to a framework definition, Journal of Cleaner Production, 99, pp. 1-16.
Marnewick, C. 2017. Information system pヴラテWIデげゲ sustainability capability levels, International Journal of Project Management. 35(6), pp. 1151-1166.
Martens, M. L. and Carvalho, M. M., 2017. Key factors of sustainability in project management context: A survey exploring the project managers' perspective. International Journal of Project Management, 35(6), 1084-1102.
Project Management Institute, 2013. A Guide to the Project Management Body of Knowledge (PMBOK Guide), 5th ed. Newtown Square, PA.
Sanchez, M. A. 2015. Integrating sustainability issues into project management, Journal of Cleaner Production, 96, pp. 319-330.
Sarker, S., Chatterjee, S., Xiao, X., and Elbanna, A. (forthcoming). The sociotechnical of cohesion for the IS discipline: its historical legacy and its continued relevance, MISQ.
Silvius, A. J., and Schipper, R. P. 2014. Sustainability in project management: a literature review and impact analysis, Social Business, 4(1), pp. 63-96.
Singh, R. K., Murty, H. R., Gupta, S. K., and Dikshit, A. K. 2012. An overview of sustainability assessment methodologies, Ecological Indicators, 15(1), pp. 281-299.

Sophia Xiaoxia Duan
www.ejise.com 77 ISSN 1566-6379
Valdes-, R., and Klotz, L. E. 2012. Social sustainability considerations during planning and design: framework of processes for construction projects, Journal of Construction Engineering and Management, 139(1), pp. 80-89.
Watson, R. T., Boudreau, M. C., and Chen, A. J. 2010. Information systems and environmentally sustainable development: energy informatics and new directions for the IS community. MIS quarterly, 34(1).
Wei, C. C., Liang, G. S., and Wang, M. J. J. 2007. A comprehensive supply chain management project selection framework under fuzzy environment, International Journal of Project Management, 25(6), pp. 627-636.
World Commission on Environment and Development. 1987. Our common future, Oxford, New York: Oxford University Press.
Yeh, C. H., Deng, H., Wibowo, S., and Xu, Y. 2010. Fuzzy multicriteria support for information systems project selection, International Journal of Fuzzy Systems, 12(2), pp. 170-174.
Zou, A., Duan, S. X., and Deng, H. 2019. Multicriteria decision making for evaluating and selecting information systems projects: a sustainability perspective. Sustainability, 11(2), p. 347.
ISSN 1566-6379 78 ©ACPIL
Reference this paper: Munyoka, W., 2019. Exploring the Factors Influencing E-Government use: Empirical Evidence from Zimbabwe. The Electronic Journal of Information Systems Evaluation, 22(2), pp. 78-91, available online at www.ejise.com
Exploring the Factors Influencing e-Government use: Empirical Evidence from Zimbabwe
Willard Munyoka
Department of Business Information Systems, University of Venda, South Africa
[email protected] DOI: 10.34190/EJISE.19.22.2.002 Abstract: The proliferation of e-government adoption in developing nations is anticipated to radically progress governance and transform government-to-citizen interactions and general administrative operations. More so, the benefits and level of e-government adoption in the public sector have been echoed world over; but remains subdued in the context of developing nations. This study investigates the effect of effort expectancy, price value, service quality, optimism bias and HWエ;┗キラ┌ヴ;ノ キミデWミデキラミ ラミ Iキデキ┣Wミゲげ SWIキゲキラミゲ デラ ┌ゲW W-government systems in Zimbabwe. Informed by the extended Unified Theory of Acceptance and Use of Technology (UTAUT2) as a theoretical lens, a research model for this study was adapted and tested using quantitative data collected from a survey of 489 respondents in Zimbabwe. Using confirmatory factor analysis and structural equation modelling, the proposed model was validated, thus, the major contribution of this research. Findings of this study may be of value in policy formulation and restructuring by practitioners on e-government matters. Thus, the results shade a light to some of the key drivers and inhibitors of e-government adoption in developing nations. Despite achieving its aim, this study has its limitations which constitute the future research direction.
Keywords: E-government Systems, Use Behaviour, G2C, UTAUT2, Structural Equations Modelling, AMOS, Zimbabwe
1. Introduction
Electronic government (hereafter, e-government) refers to the use of information communication and technologies (henceforth, ICTs) by government agencies to facilitate wider access to government services, increase public accountability, reduce unnecessary bureaucracy and bottlenecks in governance, provide efficient and effective public services via online to citizens, businesses, other government agencies and employees (Palvia and Sharma, 2007). In the context of this study e-government systems refers to online government portals used by government agencies to offers public services to all its stakeholders (Bwalya, 2018). Online interactions between government agencies and its stakeholders can be classified into four broad models: government-to-citizen (G2C), government-to-business (G2B), government-to-government (G2G) and government-to-employees (G2E) (Kalamatianou and Malamateniou, 2017). Whilst most previous studies on these domains for developing nations looked at e-government readiness, developments and challenges (Nkohkwo and Islam, 2013), policy formulation, alignment and implementation (Mawela, Ochara and Twinomurinzi, 2017, Ruhode, 2016; Munyoka and Manzira, 2013) and adoption (Jain and Akakandelwa, 2014; Mutula and Olasina, 2014), Bwalya (2018) has articulated the need for more studies investigating the utilisation and impact of e-government on citizens in Africa. The adoption of e-government systems by the public sector across many developing countries are well documented (United Nations, 2018; Verkijika and De Wet, 2018). More so, the potential of e-government to unlock new avenues of service provision and unearthing extraordinary solutions for the vast of socio-economic challenges confronting developing nations are undisputed (United Nations, 2018; Kyem, 2016). However, previous scholars (Verkijika and De Wet, 2018; Yonazi, Sol and Albert Boonstra, 2010) identifies that most e-government systems in most developing countries are rolled-out by government without input from citizens. According to Schuppan (2009 these government-driven initiatives epitomise the failing point of most e-government systems in Africa as citizens tend to shun them. Citizen-centric (Rana, Dwivedi, and Williams, 2013) and citizen-driven (Bwalya, 2018; Munyoka and Maharaj, 2017a; Otieno and Omwenga, 2016) approaches are some of the plausible modern trends to roll-out e-government systems in the 21
st century with
a high probability of acceptance and utilization by citizens. The focus of this study is on the G2C domain, investigating the effect of effort expectancy, price value, service ケ┌;ノキデ┞が ラヮデキマキゲマ Hキ;ゲ ;ミS HWエ;┗キラ┌ヴ;ノ キミデWミデキラミ ラミ Iキデキ┣Wミゲげ SWIキゲキラミゲ デラ ┌ゲW W-government systems in Zimbabwe. In the context of this study, e-government is an umbrella term referring to any electronic system

Willard Munyoka
www.ejise.com 79 ISSN 1566-6379
used by citizens to access government services and include mobile-government, smart-government and electronic-government. Zimbabwe is a developing nation located in Sothern Africa and a member of the Southern Afric;ミ DW┗WノラヮマWミデ Cラママ┌ミキデ┞ ふ“ADCぶ ┘キデエ さIラマヮノW┝ S┞ミ;マキIゲ ヴララデWS キミ ヮラノキデキIゲが WIラミラマ┞ ;ミS social settingsざ ふR┌エラSWが ヲヰヱヶが ヮく ヱぶく MラヴWラ┗Wヴが )キマH;H┘W キゲ ┌ミSWヴェラキミェ エキェエ I;ゲエ shortage, high inflation, long queues for most commodities (including fuel, gas and some food items) and with most of the remaining operating industries shutting down. These conditions make Zimbabwe an interesting country to investigate; especially on how citizens perceive e-government as a preferred mode for accessing government services. Similarly, Munyoka and Maharaj (2019) posit that it will be exciting to establish how citizens react to government calls on using e-government systems in a country like Zimbabwe that is characterised with information censorship, reported security breaches and dwindling citizen trust on the governance processes. On another note, this study acknowledges that there are numerous studies (Verkijika and De Wet, 2018; Kyem, 2016; Munyoka and Maharaj, 2017a) that have addressed many other factors affecting e-government adoption and use by citizens in Southern Africa. To start with, e-government by itself is a complex governance issue, often driven by the political-will and agendas aimed at achieving socio-economic development for a nation. Therefore, it is essential to understand how e-government systems come into being: firstly, through the supply-driven initiatives and secondly through people-driven endeavours. Supply-driven e-government projects are spearheaded by governments and sometimes with the assistance of international donor agencies with minimum citizen involvement in the decision-making process (Hafkin, 2009) and often associated with high failure rate, low acceptance and adoption by citizens. In contrast, people-driven e-government agenda values citizen input and participation ヴWェ;ヴSキミェ け┘エ;デげ ゲWヴ┗キIWゲ ;ヴW ヴラノノWS-out (OECD, 2013). Recent trends (United Nations, 2018) suggest that e-government should be aimed at addressing the sustainable agenda of the broader society to have a great impact. In most developing nations, Zimbabwe included, e-government adoption and use are generally voluntary and as such governments should understand the factors driving and iマヮWSキミェ Iキデキ┣Wミゲげ Waaラヴデゲ (Kyem, 2016, Munyoka and Maharaj, 2017a). However, the prevailing economic conditions in Zimbabwe like cash shortage compel citizens to use mobile banking and e-payment to transact their daily services and payments. Drawing from the UTAUT2 model, デエキゲ ゲデ┌S┞ キゲ ェ┌キSWS H┞ デエW ケ┌Wゲデキラミ けエラ┘ ゲキェミキaキI;ミデ キゲ W;Iエ ラa デエW aキ┗W a;Iデラヴゲ キミ キミaノ┌WミIキミェ ラミWげゲ SWIキゲキラミゲ デラ ┌ゲW W-ェラ┗WヴミマWミデ ゲ┞ゲデWマゲ キミ )キマH;H┘Wいげ Therefore, this study seeks:
To establish the effect of effort expectancy on Iキデキ┣Wミゲげ HWエ;┗キラ┌ヴ;ノ キミデWミデキラミ
Tラ Wゲデ;Hノキゲエ デエW WaaWIデ ラa ヮヴキIW ┗;ノ┌W ラミ Iキデキ┣Wミゲげ HWエ;┗キラ┌ヴ;ノ キミデWミデキラミ
To establish the effect of service quality of e-ェラ┗WヴミマWミデ ゲ┞ゲデWマゲ ラミ Iキデキ┣Wミゲげ HWエ;┗キラ┌ヴ;ノ キミデWミデキラミ
Tラ Wゲデ;Hノキゲエ デエW WaaWIデ ラa Iキデキ┣Wミゲげ HWエ;┗キラ┌ヴ;ノ intention on use behaviour
Tラ Wゲデ;Hノキゲエ デエW WaaWIデ ラa ラヮデキマキゲマ Hキ;ゲ ラミ Iキデキ┣Wミゲげ ┌ゲW HWエ;┗キラ┌ヴ ラミ W-government systems This study, therefore, provides essential theoretical grounding and a conceptual framework that could be used by policy and decision makers to identify the weaknesses and strengths of e-government development in Zimbabwe and other developing nations with similar socio-economic settings. The rest of this paper is structured as follows: Section 2 presents the theoretical grounding and the conceptual framework for this study together with the eight suppositions; Section 3 presents the research methodology; The analysis and presentation of results are then presented, followed by the discussion, implications and limitations of the study, and suggestion for future research directions.
2. Research Model
2.1 The Extended Unified Theory of Acceptance and Use of Technology (UTAUT2)
This study is underpinned by the UTAUT2 (Venkatesh, Thong and Xu, 2012) マラSWノ ┘エキIエ IラミIWヮデ┌;ノキゲW ┌ゲWヴゲげ behavioural intention to use technological innovation (i.e. e-government system). Venkatesh, Thong and Xu (2012) suggests デエ;デ ; ┌ゲWヴゲげ HWエ;┗キラ┌ヴ キミデWミデキラミ デラ ;Sラヮデ ;ミ┞ デWIエミラノラェキI;ノ キミミラ┗;デキラミ キゲ キミaノ┌WミIWS H┞ ゲW┗Wミ determinant factors (performance expectancy, effort expectancy, social influence, facilitating conditions, エWSラミキI マラデキ┗;デキラミが ヮヴキIW ┗;ノ┌W ;ミS ラミWげゲ エ;Hキデゲぶく TエW マラSWノ キSWミデキaキWゲ デエヴWW マラSWヴ;デキミェ ┗;ヴキ;HノWゲ ふ;ェWが gender and experience) to the seven determinant variables. The UTAUT2 model is a culmination of eight pre┗キラ┌ゲ HWエ;┗キラ┌ヴ;ノ ;ミS デWIエミラノラェ┞ ;IIWヮデ;ミIW マラSWノゲ aラヴ ヮヴWSキIデキミェ ラミWげゲ HWエ;┗キラ┌ヴ;ノ キミデWミデキラミ デラ ;Sラヮデ technology innovations. However, despite its wide usage in technology acceptance studies, some scholars (Alshehri et al., 2012; Fan and Yang, 2015) argues that the UTAUT2 model does not consider other pertinent

The Electronic Journal of Information Systems Evaluation Volume 22 Issue 2 2019
www.ejise.com 80 ©ACPIL
factors ゲ┌Iエ ;ゲ ゲWヴ┗キIW ケ┌;ノキデ┞ ;ミS ラヮデキマキゲマ Hキ;ゲ ;aaWIデキミェ Iキデキ┣Wミゲげ キミデWミデキラミs to adopt and use ICTs. As suggested by Venkatesh, Thong and Xu (2012), researchers have the freedom to adapt the UTAUT2 model through the addition or removal of constructs to suit different setups に thus, its strength and suitability for use in this study. Therefore, this study adapts the UTAUT2 model by incorporating service quality and optimism bias into the proposed conceptual model (see Figure 1). However, the other UTAUT2 determinant variables (facilitating conditions, performance expectancy, social influence, hedonic motivation and habits) and moderating factors (gender, age and experience) has been extensively investigated elsewhere (Qasem and Zolait, 2016; Munyoka and Maharaj, 2017a; Otieno and Omwenga, 2016) and (Munyoka and Maharaj, 2017b) respectively. Therefore, they are out of the scope of this study. According to Venkatesh, Thong and Xu (2012), the seven determinant factors of the UTAUT2 model can be defined as:
1. Effort expectancy (EE) measures how easy it is to use the system. 2. Performance expectancy (PE) マW;ゲ┌ヴWゲ デエW ┌ゲWヴげゲ ヮWヴIWヮデキラミ デエ;デ ┌ゲキミェ デエW ゲ┞ゲデWマ ┘キノノ HW
personally beneficial. 3. Facilitating Conditions (FC) マW;ゲ┌ヴWゲ デエW ┌ゲWヴげゲ HWノキWa デエ;デ W┝キゲデキミェ ラヴェ;ミキゲ;デキラミ;ノ キミaヴ;ゲデヴ┌Iデ┌ヴW I;ミ
support the use of the proposed system. 4. Social Influence (SI) マW;ゲ┌ヴWゲ デエW キミaノ┌WミIW ラa ラデエWヴゲ ラミ デエW ┌ゲWヴげゲ キミデWミデキラミ デラ ┌ゲW デエW ゲ┞ゲデWマく 5. Hedonic Motivation (HM) refers to the pleasure derived from the use of technology. 6. Price Value (PV) refers to the cost and price structures of accessing an online service. 7. Habits (H) measures the tendency of an individual to spontaneously perform certain behaviour after
learning something.
2.2 Conceptual Model
Figure 1 presents the proposed research model for this study incorporating three constructs variables (effort W┝ヮWIデ;ミI┞が ヮヴキIW ┗;ノ┌W ;ミS ゲWヴ┗キIW ケ┌;ノキデ┞ ふ“Qぶぶ ;aaWIデキミェ ; ヮWヴゲラミげゲ HWエ;┗キラ┌ヴ;ノ キミデWミデキラミ ふBIぶ ;ミS デエヴWW constructs (behavioural intention, service quality and optimism bias (OB)) affecting use behaviour (USE) on e-ェラ┗WヴミマWミデ ゲ┞ゲデWマゲく Oヮデキマキゲマ Hキ;ゲ マW;ゲ┌ヴWゲ ; ┌ゲWヴげゲ ヮヴWSキゲヮラゲキデキラミ デラ┘;ヴSゲ ┌ゲキミェ ; ゲ┞ゲデWマ SWゲヮキデW エキゲっエWヴ prior experiences (Carter et al., 2012). Service quality is the combined quality features associated with e-government websites, services offered, and the accuracy, completeness, timeliness, conciseness, and relevancy of the information provided (Sharma, 2015).
Figure 1: Research model
Based on the proposed model (Figure 1), the following hypotheses underpin this study: H10: Eaaラヴデ W┝ヮWIデ;ミI┞ SラWゲ ミラデ キミaノ┌WミIW ラミWげゲ HWエ;┗キラ┌ヴ;ノ キミデWミデキラミ デラ ;Sラヮデ W-government systems H1a: Eaaラヴデ W┝ヮWIデ;ミI┞ キミaノ┌WミIWゲ ラミWげゲ HWエ;┗キラ┌ヴ;ノ intention to adopt e-government systems H20: PヴキIW ┗;ノ┌W ;ゲゲラIキ;デWS ┘キデエ キミデWヴミWデ ;IIWゲゲ SラWゲ ミラデ キミaノ┌WミIW ラミWげゲ HWエ;┗キラ┌ヴ;ノ キミデWミデキラミ デラ ;Sラヮデ W-
government systems.

Willard Munyoka
www.ejise.com 81 ISSN 1566-6379
H2a: PヴキIW ┗;ノ┌W ;ゲゲラIキ;デWS ┘キデエ キミデWヴミWデ ;IIWゲゲ キミaノ┌WミIWゲ ラミWげゲ HWエ;┗キラ┌ヴ;ノ キミデWミデキラミ デo adopt e-government systems.
H30: Quality of services on e-ェラ┗WヴミマWミデ ゲ┞ゲデWマゲ SラWゲ ミラデ キミaノ┌WミIW ラミWげゲ HWエ;┗キラ┌ヴ;ノ キミデWミデキラミ デラ ;Sラヮデ such systems.
H3a: Quality of services on e-ェラ┗WヴミマWミデ ゲ┞ゲデWマゲ キミaノ┌WミIWゲ ラミWげゲ HWエ;┗キラ┌ヴ;ノ キミデWミデキラミ デラ ;Sラヮデ ゲ┌Iエ systems.
H40: Q┌;ノキデ┞ ラa ゲWヴ┗キIWゲ SラWゲ ミラデ キミaノ┌WミIW ラミWげゲ SWIキゲキラミ デラ ┌ゲW W-government systems. H4a: Q┌;ノキデ┞ ラa ゲWヴ┗キIWゲ キミaノ┌WミIWゲ ラミWげゲ SWIキゲキラミ デラ ┌ゲW W-government systems. H50: Cキデキ┣Wミゲげ HWエ;┗キラ┌ヴ;ノ キミデWミデキラミ デラ ┌ゲW W-government services does not lead to the continued
utilisation of e-government systems. H5a: Cキデキ┣Wミゲげ HWエ;┗キラ┌ヴ;ノ キミデWミデキラミ デラ ┌ゲW W-government services leads to the continued utilisation of e-
government systems. H60: Oヮデキマキゲマ Hキ;ゲ SラWゲ ミラデ キミaノ┌WミIW ラミWげゲ ┌ゲW HWエ;┗キラ┌ヴ キミ W-government systems. H6a: Optimism bias influences ラミWげゲ ┌ゲW HWエ;┗キラ┌ヴ キミ W-government systems.
H7: Effort expectancy influences use behaviour mediated by behavioural intention. H8: Price value influences use behaviour mediated by behavioural intention.
3. Research methodology
This study adopts a quantitative research approach; which involves the execution of the hypothetico-deductive approach. Creswell (2014) suggest that a quantitative research approach is the best approach for any research aimed at generalisation. Hence, its suitability and use in this study. Moreover, this approach is consistent with prior studies on e-government adoption that adapted the UTAUT model (Venkatesh et al., 2016; Al-Qeisi et al., 2015; Ami-Narh and Williams, 2012). The next sections discuss the procedures adopted in this study for instrument design, sample design, pilot study, data gathering and analysis procedures, and ethical considerations.
3.1 Instrument Design
The survey questionnaire for this study was designed based on the research model proposed in Figure 1. The constructs of the survey instrument were adapted from prior studies on technology acceptance studies and the United Nations e-government survey database and adapted to the context of this study. The survey questionnaire of this study had two major sections. Section A solicited for demographic-related information of the participants (i.e. gender, age, level of education and occupational status). Section B of the questionnaire focused on information pertaining to the dependent variables (behavioural intention and use behaviour) and independent variables (effort expectancy, price value, service quality and optimism bias) of this study. All construct items used a five-point Likert scale ranging from strongly disagree to strongly agree.
3.2 Sample Design
TエW デ;ヴェWデ ヮラヮ┌ノ;デキラミ aラヴ デエキゲ ゲデ┌S┞ ┘WヴW IラミaキミWS デラ キミSキ┗キS┌;ノ Iキデキ┣Wミゲげ ヮWヴIWヮデキラミゲ ;ミS ノキ┗WS W┝ヮWヴキWミIWゲ with e-government systems in Zimbabwe. The study used a respondent-driven sampling (RDS) strategy to collect quantitative data from 600 e-government user participants from five provinces (Harare Province, Mashonaland East, Mashonaland Central, Masvingo and Matabeleland South) in Zimbabwe. Heckathorn (1997) RDS is a chain-referral, link-tracing network sampling method used in situations where traditional sampling methods do not yield desired results i.e. in hard-to-find, invisible and marginalised population. Data for this study were collected over six months starting from September 2017 to February 2018. The RDS was done in three phases as suggested by Heckathorn (1997). In the first formative phase, the adequacy and networking of the population was assessed. Diversified set informants (i.e. seeds) were purposively identifies with the assistance of local government agencies. Survey questionnaires and coupons were designed and ready for distribution. The coupons had a unique number (used to track each participant), name and contact details of the researcher, purpose of the study, written in the vernacular language used in each specific region and blank space for the respondent to write his/her contact details. In the second recruitment phase, 3 informants (constituted of traditional chiefs, Econet shop-operators, school headmasters, municipality front officers, university deans) were identified as seeds for each province. Each seed identifies 3 to 5 other informants (Heckathorn, 2002) who were using e-government systems, were ready to participate and give them coupons. The goal of the recruitment phase was to create a long and

The Electronic Journal of Information Systems Evaluation Volume 22 Issue 2 2019
www.ejise.com 82 ©ACPIL
representative referral chain (けwaveげぶ so that the final sample was independent of the seeds and reflective of the entire recruiting network population. The third analysis phase establishes weights according to the size of the sub-networks created by each of the initial 15 seeds across the five provinces. Wave1 recruited 55 participants, 165 participants in wave2, 495 in wave3, and 105 in wave4. At this point, each subsequent wave was generating fewer informants than the previous stage, thus reaching the equilibrium point. The sampling process was stopped since it was now representative (Salganik, 2006). In line with Jラエミゲデラミ ;ミS “;Hキミげゲ (2010, p. 40) suggestion, it is at the equilibrium point that the sample composition becomes independent of the seeds done at various waves and キミ デエ;デ ┘;┞が さラ┗WヴIラマキミェ ;ミ┞ Hキ;ゲWゲ キミデヴラS┌IWS by the non-ヴ;ミSラマ ゲWノWIデキラミ ラa ゲWWSゲくざ In total 600 participants were generated, and the survey questionnaires were self-administered by the researcher using the participant contact details provided on the coupons and the social network size per province.
3.3 Pilot Study
Prior to conducting the main study, a pilot study was administered to twelve randomly selected respondents in three different cities in Zimbabwe. The primary objective for administering this pilot study was to ascertain whether the respondents would comprehend the questions and instructions given on the survey instrument. The minor aspects raised by the respondents pertaining to spelling and grammatical and instructional errors were incorporated into the final survey questionnaire.
3.4 Data Gathering and Analysis Procedures
A self-administered survey questionnaire was the primary instrument used for data gathering in this study. In total, 489 usable questionnaires were received out of the possible 600 distributed, giving an 81.5% response rate. The overall response rate for this study is considered more than adequate, especially given that the recommended acceptable response rate for a survey is 30% (Sekaran and Bougie, 2016). IBM Statistical Package for Social Sciences (SPSS) latest version was used to perform simple data analysis like descriptive statistics to gain an in-depth understanding of the data, in-line with each construct. Further data cleaning and screening procedures were carried out to test for univariate normality using Kolmogorov-Smirnov and Shapiro-Wilk tests, ;ミS デラ デWゲデ aラヴ Iラママラミ マWデエラSゲ Hキ;ゲ ┌ゲキミェ H;ヴマ;ミげゲ ゲキミェノW a;Iデラヴ デWゲデく IBM Aマラゲ ┗Wヴゲキラミ ヲヶ aラヴ Windows was used to test the hypotheses for this study using structural equation modelling (SEM). SEM is a statistical analysis technique that makes use of confirmatory factor analysis (CFA) to establish the fit of the proposed research model. In this study, CFA using SEM was done in three phases in-ノキミW ┘キデエ H;キヴげゲ Wデ ;ノく (2018) suggestion. In the first phase, tests for the measurement model to establish discriminant and convergent validity of the constructs were done. The second phase involved establishing the overall fit of the structural model using several fit indices. The third and final phase involved path coefficients and hypotheses testing.
3.5 Ethical Considerations
Prior to the pilot study and data gathering, ethical clearance was sought and obtained. Moreover, all protocols and code of ethics stipulated by the ethical clearance were followed. Before completing the survey questionnaire, all respondents were asked to sign an informed consent letter stipulating that their participation in this study was voluntary with no financial rewards, that whatever information they provided was treated as confidential and was going to be solely used for academic purpose. A cover letter and coupons were also presented to respondents outlining the purpose of this study.
4. Data Analysis and Results
4.1 Descriptive Statistics
Table 1 presents the profile of the 489 respondents. Most of the respondents were male (53.8%), whilst the dominant age group ranges between 25 and 34 years. Moreover, many of the respondents (28.1%) possessed a first university degree; while the largest percentage (42.9%) was unemployed. This finding concurs with Bhebhe, Bhebhe and Bhebhe (2016) who reported that most of the working age group (18 - 65) in Zimbabwe were either self-employed or unemployed.

Willard Munyoka
www.ejise.com 83 ISSN 1566-6379
Table 1: Profile of Respondents
Moderator Factor Moderator Variable Frequency Percentage
Gender Female 230 46.2
Male 268 53.8
Age
15-24 98 19.6
25-34 156 31.4
35-44 127 25.5
45-54 72 14.5
55-64 39 7.8
Above 65 6 1.2
Education Qualifications
Others 79 15.9
Certificate 103 20.7
Diploma 121 24.3
Degree 140 28.1
Masters 46 9.2
Doctorate 9 1.8
Occupational-Status
Unemployed 210 42.9
Employed 39 8.0
Self-Employed 178 36.4
Student 51 10.4
Other 11 2.2
4.2 Data Cleaning and Screening Procedures
Prior to data analysis, all incomplete or wrongly completed questionnaires were screened-out leaving 489 suitable for data analysis. Alshehri (2012) suggest that before doing any advanced statistical analysis like regression analysis or structural equation modelling, data should first be tested for homogeneity to establish data distribution for all the variables in-line with the normal distribution. In this study, Kolmogorov-Smirnov and Shapiro-Wilk tests for normality were conducted to test the skewness and kurtosis of the data sets. Figure 2 illustrates the distribution of the mean and standard deviation of the service quality dataset. The histogram shows that the data on the service quality was shifted to the left, i.e. positively skewed に thus, not following the normal Gaussian distribution (with residual scores concentrated on the 2.72 mean score). Likewise, the behavioural intention construct was also negatively skewed and was normalised.
Figure 2: Histogram on Service Quality data set

The Electronic Journal of Information Systems Evaluation Volume 22 Issue 2 2019
www.ejise.com 84 ©ACPIL
To resolve this anomaly in data distribution, box-plots (Figure 3) were generated to identify the outliers i.e. 92, 265 and 276 for SQ, and 369 for BI. As an advanced statistical analysis, SEM should meet multivariate normal distribution for the data, since non-normal data distributions may distort the goodness of fit indices and the overall results (Karakaya-Ozyer and Aksu-Dunya, 2018). To deal with the identified outliers and in-line with Aguinis, Gottfredson and Jooげゲ (2013) suggestion, the researcher created rules in the IBM SPSS to exclude the キSWミデキaキWS ラ┌デノキWヴゲ aラヴ デエW デ┘ラ Iラミゲデヴ┌Iデゲ ラa “Q ;ミS BIが キくWく さBI а Э ンヶΓざ デラ W┝Iノ┌SW ;ノノ マW;ゲ┌ヴWゲ ;Hラ┗W ンヶΓ aラヴ the behavioural intention from further analysis.
Figure 3: Boxplots for the datasets
Table 2 illustrates the results for normality tests done on all the measured items using the Kolmogorov-Smirnov (K-S test) and the Shapiro-Wilk test after the identified non-normal datasets (see Figure 3) were filtered out. Thus, all the measured items were significant (p-value = 0.000) for both the K-S and Shapiro-Wilk tests (Table 2).
Table 2: Normality Test for all the measured items
Kolmogorov-Smirnova Shapiro-Wilk
Measured Items Statistic df Sig. Statistic df Sig.
EE .141 300 .000 .898 300 .000
PV .135 289 .000 .904 289 .000
SQ .139 299 .000 .967 299 .000
BI .140 299 .000 .967 299 .000
OB .138 293 .000 .968 293 .000
USE .147 311 .000 .968 311 .000
a. Lilliefors Significance Correction Where,
EE = Effort Expectancy; PV = Price Value; SQ = Service Quality; BI = Behavioural Intention; OB = Optimism Bias; USE = Actual use of e-government system
The independent and dependent variables for this study were measured using the same survey questionnaire ;ミS デエ┌ゲが デエWヴW ┘;ゲ ; ヮラデWミデキ;ノ aラヴ Iラママラミ マWデエラSゲ Hキ;ゲく H;ヴマ;ミげゲ ゲキミェノW a;Iデラヴ デWゲデ ┘;ゲ ┌ゲWS デラ デWゲデ aラヴ common methods bias by determining if the first principal component explains less than 50% of the total variance (Mudzana and Maharaj, 2017). Findings of this study show that only 12.572% of the total variance was explained when the first component was extracted. Thus, a significant amount of variance was explained by the unextracted factors. Therefore, common methods bias was not an issue in this study and no further steps were taken to address it.

Willard Munyoka
www.ejise.com 85 ISSN 1566-6379
4.3 Reliability Analysis
TエW CヴラミH;Iエげゲ ふヱΓヵヱぶ Alpha reliability results for this study (Table 3) shows that the study instrument achieved the right internal construct reliability scores with all values above the recommended cut off value of 0.70.
Table 3ぎ CヴラミH;Iエげゲ Aノヮエ; RWノキ;Hキノキデ┞ RWゲ┌ノデゲ
Constructs No. of
items
CヴラミH;Iエげゲ
Aノヮエ; ふüぶ Comments (based on Hairげゲ et al. (2018)
reliability scales)
Effort Expectancy (EE) 4 0.712 High Reliability
Price Value (PV) 4 0.807 High Reliability
Quality of Services (QS) 5 0.863 High Reliability
Behavioural Intention (BI) 3 0.702 High Reliability
Optimism Bias (OB) 4 0.823 High Reliability
Use Behaviour (USE) 3 0.891 High Reliability
4.4 Measurement Model
Structural Equation Modelling (SEM) using IBM AMOS was used to establish the measurement model (testing discriminant and convergent validity of the measurement scales) and to determine how the model fits the collected data. Two tests; construct reliability and average variance extracted (AVE) were used to assess the convergent validity of the constructs. AVE measures the level of variance captured by a construct versus the level due to measurement error and values above 0.70 are considered very good, whereas, the levels between 0.50 and 0.69 are considered good (Henseler, Ringle and Sarstedt, 2015). AVE values for all the constructs (EE = .657; PV = .701; QS = .689; BI = .771; OB = .815; USE = .791) were above the minimum recommended threshold value of 0.50. Thus, confirming that the constructs of the proposed model explained more than 50% of variances of the construct items. Discriminant validity (Hair et al., 2018) was carried out in this study to establish and ensure that each construct of the study instrument was empirically unique from the rest of the other constructs and characterises phenomena of interest in the structural equation model. AlKhatib (2013) suggest a rigorous method for determining discriminant validity in which the absolute values of correlations between the constructs are compared with the square root of the AVE for that specific construct. The rule of thumb according to AlKhatib (2013) is that the square root of the AVE for that specific construct should always be greater than the AVE and all the correlations with all the other constructs. Table 4 indicates that the square roots (ゆ) for all constructs were greater than the associated correlations for all the other constructs; thus, there were no concerns with the discriminant validity. Based on this finding, it can be deduced that CFA results provided acceptable discriminant and convergent validity for the construct scales of the questionnaire.
Table 4: Standardised Construct Correlation Matrix
EE PV QS OB BI USE
EE .81ゆ
PV .631**
.84ゆ
QS .077 .341* .83
ゆ
OB .068 .135**
.191* .90
ゆ
BI -.089 .261**
.168* .039 .88
ゆ
USE .356**
.482**
.270* .641
** .699
** .89
ゆ
**. Correlation is significant at the 0.01 level (2-tailed). *. Correlation is significant at the 0.05 level (2-tailed). ゆ. Square Roots of AVE for each construct
4.5 Structural Model
The major goal of applying structural equation modelling is to establish the overall fit of the structural model. As suggested by Hair et al. (2018) this study used several fit indices to establish the overall fit of the structural model; Chi-“ケ┌;ヴW ふ‐2
), goodness-of-fit index (GFI), normed-fit index (NFI), comparative fit index (CFI), index of fit (IFI), Tucker-Lewis index (TLI), adjusted-goodness-of-fit index (AGFI) and the root-mean-square-error of

The Electronic Journal of Information Systems Evaluation Volume 22 Issue 2 2019
www.ejise.com 86 ©ACPIL
approximation (RMSEA). The overall value of the Chi-“ケ┌;ヴW ふ‐2) for the final structural model was 431.12 with
247 degrees of freedom and with a significant p-value = 0.001. Table 5 shows that after several iterations, all indices for the final structural model were above the minimum recommended values に thus demonstrating a good fit of the proposed research model.
Table 5: Summary of Overall Fit Indices for the Structural Model
Absolute Fit Index Recommended cut-off value
First Structural Model Final Structural Model
p p-value < 0.05 0.04 0.001
‐2 N/a 463.57 431.12
‐2/df 1 < df < 3 1.69 1.71
Df Sa д ヰ 230 247
GFI д ヰくΓヰ 0.892 0.920
AGFI д ヰくΒヰ 0.890 0.901
CFI д ヰくΓヰ 0.900 0.904
NFI д ヰくΓヰ 0.961 0.978
IFI д ヰくΓヵ 0.948 0.969
TLI д ヰくΓヵ 0.950 0.959
RMSEA < 0. 08 (good fit) or < 0.05 (excellent fit)
0.068 0.043
4.6 Path Coefficients and Hypotheses Testing
Table 6 ヮヴWゲWミデゲ ; ゲ┌ママ;ヴ┞ ラa デエW エ┞ヮラデエWゲWゲ デWゲデキミェく AIIラヴSキミェ デラ H;キヴげゲ Wデ ;ノく ふヲヰヱΒぶ デエW ヮ;ヴ;マWデWヴ coefficient value is statistically significant (at p а ヰくヰヵ ノW┗Wノぶ ┘エWミ キデげゲ IヴキデキI;ノ ヴ;デキラ ふCくRくぶっデ-value for a standardised regression weight is greater than 1.96. Table 6 shows that hypotheses (H10, H2a, H30, H4a, H5a, H6a, and H8) had all their critical ratios above 1.96 with significant levels below 0.05. Therefore, hypotheses (H1a, H20, H3a, H40, H50, H60, and H7) were rejected for not meeting this criterion.
Table 6: Summary of Hypotheses Testing
Hypothesis
Number
Hypothesis
Path Estimate S. E C.R ɴ p-value
Hypothesis
Supported by
Findings?
H10 EE т BI .64 .15 4.27 .69 *** yes
H2a PV т BI .61 .20 3.05 .73 *** yes
H30 QS т BI .56 .22 2.55 .71 .03* yes
H4a QS т U“E .50 .09 5.55 .70 *** yes
H5a BI т U“E .46 .07 6.60 .89 *** yes
H6a OB т U“E .88 .19 4.63 .77 .01** yes
H7 EE т BI т U“E .33 .31 1.08 .24 .062 no
H8 PV т BI т U“E .65 .11 5.91 .87 *** yes
Note: Estimate = standard regression weights; S.E. = standard error; C.R. = critical ratio/t-value; p-value = significance level. *p < .05; ** p < .01; *** p < .001
Therefore, based on the findings in Table 6, the following interpretations can be presented: H10: PWヴIWキ┗WS W;ゲW ラa ┌ゲW エ;S ミラ WaaWIデ ラミ Iキデキ┣Wミゲげ HWエ;┗キラ┌ヴ;ノ キミデWミデキラミ デラ ┌ゲW W-government systems. H2a: As the cost of accessing the internet increases adoption propensity decreases. H30: Quality of services on e-government systems had no effect on oneげゲ デWミSWミIキWゲ デラ ;Sラヮデ ゲ┌Iエ ゲ┞ゲデWマゲく H4a: Better quality of services lead to increased use. H5a: An increase in behavioural intention leads to increased use. H6a: Greater optimism bias leads to increased use.
Willard Munyoka
www.ejise.com 87 ISSN 1566-6379
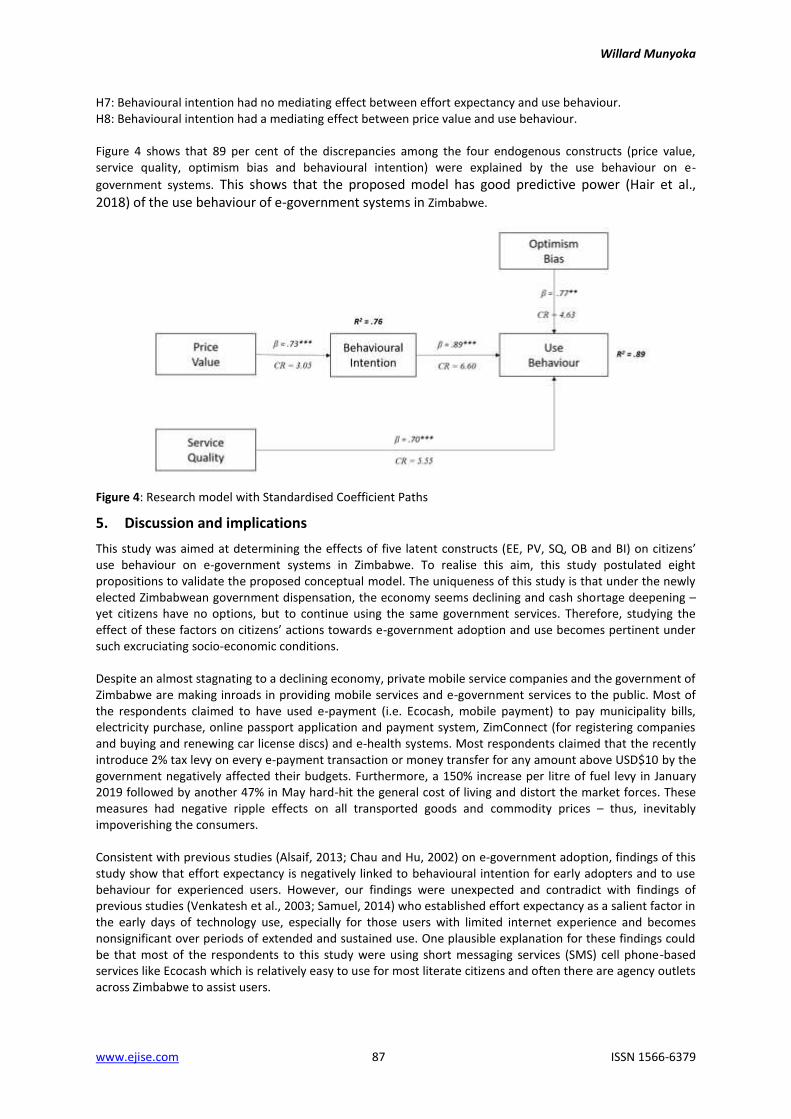
H7: Behavioural intention had no mediating effect between effort expectancy and use behaviour. H8: Behavioural intention had a mediating effect between price value and use behaviour. Figure 4 shows that 89 per cent of the discrepancies among the four endogenous constructs (price value, service quality, optimism bias and behavioural intention) were explained by the use behaviour on e-
government systems. This shows that the proposed model has good predictive power (Hair et al., 2018) of the use behaviour of e-government systems in Zimbabwe.
Figure 4: Research model with Standardised Coefficient Paths
5. Discussion and implications
This study was aimed at determining the effects of five latent constructs (EE, PV, SQ, OB and BIぶ ラミ Iキデキ┣Wミゲげ use behaviour on e-government systems in Zimbabwe. To realise this aim, this study postulated eight propositions to validate the proposed conceptual model. The uniqueness of this study is that under the newly elected Zimbabwean government dispensation, the economy seems declining and cash shortage deepening に yet citizens have no options, but to continue using the same government services. Therefore, studying the WaaWIデ ラa デエWゲW a;Iデラヴゲ ラミ Iキデキ┣Wミゲげ ;Iデキラミゲ デラ┘;ヴSゲ W-government adoption and use becomes pertinent under such excruciating socio-economic conditions. Despite an almost stagnating to a declining economy, private mobile service companies and the government of Zimbabwe are making inroads in providing mobile services and e-government services to the public. Most of the respondents claimed to have used e-payment (i.e. Ecocash, mobile payment) to pay municipality bills, electricity purchase, online passport application and payment system, ZimConnect (for registering companies and buying and renewing car license discs) and e-health systems. Most respondents claimed that the recently introduce 2% tax levy on every e-payment transaction or money transfer for any amount above USD$10 by the government negatively affected their budgets. Furthermore, a 150% increase per litre of fuel levy in January 2019 followed by another 47% in May hard-hit the general cost of living and distort the market forces. These measures had negative ripple effects on all transported goods and commodity prices に thus, inevitably impoverishing the consumers. Consistent with previous studies (Alsaif, 2013; Chau and Hu, 2002) on e-government adoption, findings of this study show that effort expectancy is negatively linked to behavioural intention for early adopters and to use behaviour for experienced users. However, our findings were unexpected and contradict with findings of previous studies (Venkatesh et al., 2003; Samuel, 2014) who established effort expectancy as a salient factor in the early days of technology use, especially for those users with limited internet experience and becomes nonsignificant over periods of extended and sustained use. One plausible explanation for these findings could be that most of the respondents to this study were using short messaging services (SMS) cell phone-based services like Ecocash which is relatively easy to use for most literate citizens and often there are agency outlets across Zimbabwe to assist users.
The Electronic Journal of Information Systems Evaluation Volume 22 Issue 2 2019
www.ejise.com 88 ©ACPIL
This study revealed that citizens regarded price value (costs) associated with internet charges and recharging of mobile data bundles and airtime as crucial determinants of both behavioural intention and use behaviour. These findings were expected, especially against the background that Zimbabwe is currently experiencing high inflation, high unemployment levels and the recently introduced 2% tax levy for every online payment transaction or transfer above USD$10. Moreover, the dire cash shortage in Zimbabwe meant that most citizens are compelled to use e-payment systems to pay for government services. Under such conditions, citizens value their money, thus, why the price value construct had a positive and significant effect on e-government users. This finding concurs with findings of Venkatesh, Thong and Xu (2012) who established that in the consumer context users are sensitive to prices of products and services; and hence will be more cost-conscious. The quality of features and services associated with e-government websites, i.e. the accuracy, completeness, timeliness, conciseness, and relevancy of the information provided were found to be pertinent elements that encouraged citizens to use e-government systems. A significant positive relationship between service quality and use behaviour was established in this study. Most of the respondents felt enticed to use e-government websites with current information that is easily accessible. This finding reaffirms results of prior research (Sá, Rocha and Cota, 2016; Fan and Yang, 2015; Detlor et al., 2013) that accentuates the incorporation of quality web features as paramount for stimulating the use of e-government systems. However, this study could not establish any correlation between service quality and behavioural intention. A possible explanation for this is drawn from Alshehri et al. (2012) who suggests that quality of services on e-government systems is pertinent to citizens who already have some experience in using such systems (as they have a basis of comparison between prior experiences and expectations) and less relevant to those with no knowledge. The behavioural intention had a positive and significant effect on use behaviour. Citizens who perceive e-government systems as valuable were more motivated to use such systems. Findings of this study are consistent with the UTAUT theoretical argument and previous studies (Alkhatib, 2013; Venkatesh et al., 2003) which confirmed behavioural intention as a strong predictor of use behaviour. Findings of this study confirmed optimism bias as having a positive and significant effect on use behaviour. Despite having some scanty issues with the quality of services and high service charges per e-government transaction, citizens who regarded themselves as technologically savvy compared to the average users remains motivated to use such systems. The results of this study reaffirm the empirical findings by Carlin (2016). A plausible explanation for such results is that as users become competent, familiar with using and reliant on using e-government systems, they will be inclined to keep on using such systems. Moreover, considering the prevailing shortage of cash in circulation, most citizens have no option but to use e-payment system for government services.
5.1 Implications
This study has implications in three spheres. Firstly, the study contributes to the existing corpus of literature on e-government adoption by adapting the UTAUT model and applying it to the Zimbabwean context with its rich and complex socio-economic set-up: thus, empirically contributing to theory building and testing. The findings of this study reaffirm as true some of the previously theorised technology acceptance and use relationships (Venkatesh et al., 2012; Ami-Narh and Williams, 2012) by shedding more light on some critical factors affecting and contribute to the successful adoption and use of e-government in Zimbabwe and other developing countries with similar socio-economic conditions. The author argues that to date there are very few studies (Maharaj and Munyoka, 2019; Manenji and Marufu, 2016) done that empirically test the utilisation of e-government systems by citizens in the context of Zimbabwe. Therefore, this study is expected to elevate the discourse of e-government adoption and utilisation by citizens in developing nations by adding new constructs like service quality and optimism bias which never existed in the original technology acceptance and use models and not covered by most prior studies (Furusa and Coleman, 2018; Rajah, 2015). Secondly, regarding practical implications, the findings of this study could have implications for ICT and e-government policy formulation and implementation. In fact, at policy formulation and system design stages, users should be engaged for input regarding what they would prefer on the systems and what frustrates them in other existing e-government systems to increase user acceptance. Similarly, to increase adoption and use of e-government systems, designers of these systems should provide quality services. This could be done, for example by ensuring that manual and online forms are similar. These notions are in accord with Mellouli, Bentahar and Bidan (2016) who suggests that without mechanisms in place to felicitate e-government
Willard Munyoka
www.ejise.com 89 ISSN 1566-6379
adoption, quality of services on e-government systems would benefit the minority of citizens and thus, making e-government a mode for digital and socio-economic divide. Thirdly, to access e-government, one should have access to the internet. Yet, the cost of accessing the internet is quite expensive for most of the unemployed Zimbabweans. Therefore, this study recommends that policy formulators and decision-makers on ICT, internet costs and finance should consider the prevailing economic climate when determining the price structures of such services. Overcharging the price for accessing the internet and e-government services may negatively ;aaWIデ Iキデキ┣Wミゲげ ;デデキデ┌SWゲ ;ミS I;ヮ;Iキデ┞ デラ┘;ヴSゲ ┌ゲキミェ ゲ┌Iエ ゲWヴ┗キIWゲく
5.2 Limitations and Future Research Direction
Despite having achieved its aim and made contributions to both theory and practice; this study has its limitations that should be considered for future research. On the methodological frontier, the conceptual マラSWノ IラミゲキSWヴWS デエW WaaWIデ ラa ラミノ┞ aキ┗W Iラミゲデヴ┌Iデゲ ラミ Iキデキ┣Wミゲげ ┌ゲW HWエ;┗キラ┌ヴ ラミ W-government systems in the context of Zimbabwe. Going forward, more constructs and moderating variables like age, gender and experience in use should be investigated and a comparison made with other countries with similar socio-economic conditions to enable the generalisation of the findings. Therefore, care should be taken when trying to generalise the findings of this study to other developing nations. The use of respondent-driven sampling (RDS) strategy in identifying e-government users was exciting, yet it also presented some challenges regarding how to motivate the informants to participate since participation was voluntary and without financial incentives. Thus, this approach works best for non-governmental organisations which often offers financial and material rewards to induce participation as opposed to purely non-incentivised academic surveys like the current study. Whilst the quantitative research approach adopted in this study provides a comprehensive statistical analysis using structural equation modelling, a mixed methods research approach could have provided a more pragmatic approach and a voice from the respondents regarding e-government adoption in Zimbabwe.
6. Conclusions
This study examined the effect of five variables (effort expectancy, price value, service quality, optimism bias ;ミS HWエ;┗キラ┌ヴ;ノ キミデWミデキラミぶ ラミ ヮ;ヴデキIキヮ;ミデゲげ ┌ゲW HWエ;┗キラ┌ヴ ラミ W-government in Zimbabwe. This research draws from the UTAUT2 model to advance a conceptual model used to establish the effect of these five latent variables on1 e-government systems. A field survey for testing the proposed model was conducted in Zimbabwe from 489 respondents. This study attempted to bridge existing theoretical, methodological and practice gaps in e-government in Zimbabwe. The results showed that price value associated with internet access and charges on e-ェラ┗WヴミマWミデ デヴ;ミゲ;Iデキラミゲ エ;S ; ヮラゲキデキ┗W ゲキェミキaキI;ミデ WaaWIデ ラミ Hラデエ Iキデキ┣Wミゲげ HWエ;┗キラ┌ヴ;ノ intention to adopt and use behaviour on e-government systems. Moreover, optimism bias exhibited one of the strongest effects on use behaviour after the behavioural intention. To encourage e-government adoption, the government should ensure that the information and services provided on e-government websites are accurate, complete, timely, concise and relevant to users. The findings show that effort expectancy had no significant effect on both behavioural intention and use behaviour on e-government in the Zimbabwean IラミデW┝デく Aミ ┌ミSWヴゲデ;ミSキミェ ラa デエWゲW a;Iデラヴゲ ;ミS デエWキヴ キマヮ;Iデ ラミ Iキデキ┣Wミゲげ ┌ゲW HWエ;┗キラ┌ヴ キゲ Iヴ┌Iキ;ノ デラ ヮラノキI┞ makers, administrators and practitioners when rolling out e-government systems in-line with citizensげ requirements. Accordingly, such an approach goes a long way towards e-government acceptance by users. The prevailing economic, social, political, and cultural circumstances in Zimbabwe are unique to its settings and as such caution should be taken in generalising findings of this study to other developing nations. Moreover, the proposed conceptual framework provides a theoretical lens and a vantage point for tackling the research question and the eight hypotheses, without necessarily considering all the possible factors affecting e-government adoption in Zimbabwe. Going forward, more latent variables could be considered, and the context of study broadened to other Southern African countries with similar socio-economic conditions to enable generalisation.
References
Aguinis, H., Gottfredson, R.K. and Joo, H., 2013. Best-practice recommendations for defining, identifying, and handling outliers. Organizational Research Methods, 16(2), pp.270-301.
AlKhatib, H., 2013. E-government systems success and user acceptance in developing countries: The role of perceived support quality. PhD. Brunel Business School.
Ami-Narh, J.T. and Williams, P.A.H., 2012. A revised UTAUT model to investigate E-health acceptance of health professionals in Africa. Journal of Emerging Trends in Computing and Information Sciences, 3(10), pp. 1383-1391.

The Electronic Journal of Information Systems Evaluation Volume 22 Issue 2 2019
www.ejise.com 90 ©ACPIL
Al-Qeisi, K., Dennis, C., Hegazy, A. and Abbad, M., 2015. How Viable Is the UTAUT Model in a Non-Western Context? International Business Research, 8(2), pp. 204-219.
Alshehri, M.A., 2012. Using the UTAUT Model to Determine Factors Affecting Acceptance and Use of E-Government Services in the United Kingdom of Saudi Arabia. PhD. Griffith University.
Alshehri, M., Drew, S., Alhussain, T. and Alghamdi. R.A., 2012. The Effects of Website Quality on Adoption of E-Government Service: An Empirical Study Applying the UTAUT Model Using SEM. 23
rd Australasian Conference on Information
Systems, Geelong, Australia, 3-5 Dec 2012. Deakin University. Alsaif, M., ヲヰヱンく F;Iデラヴゲ ;aaWIデキミェ Iキデキ┣Wミゲげ ;Sラヮデキラミ ラa W-government moderated by socio-cultural values in Saudi Arabia.
PhD. University of Birmingham. Bhebhe, T.B., Bhebhe, R.K. and Bhebhe, B.S., 2016. An investigation into the causes of unemployment among youths in the
city of Harare. Global Journal of Arts, Humanities and Social Sciences, 4(2), pp. 90-102 Bwalya, K.J., 2018, Decolonisation of e-Government Research and Practice: Exploring Contextual Issues and Opportunities in
Africa, pp. iに330, AOSIS, Cape Town. Carlin, J.P., 2016. Detect, disrupt, deter: A whole-of-government approach to national security cyber threats. Harvard
National Security Journal, 7, pp. 391に436. Carter, L., Schaupp, L.C., Hobbs, J. and Campbell, R., 2012. E-government utilization: understanding the impact of
reputation and risk. International Journal of Electronic Government Research, 8(1), pp. 83-97. Chau, P.Y.K. and Hu, P.J.H., 2002. Information Technology Acceptance by Individual Professionals: A Model Comparison
Approach. Decision Sciences, 32(4), pp. 699-719. Creswell, J.W., 2014. Research design: Qualitative, quantitative and mixed methods approaches, 4
th ed. London: SAGE
Publications Cronbach, L.J., 1951. Coefficient Alpha and the internal structure of tests. Psychometrika, 16(3), pp. 297-334. Detlor, B., Hupfer, M.E., Ruhi, U. and Zhao, L., 2013. Information Quality and Community Municipal Portal Use. Government
Information Quarterly, 30(1), pp. 23-32. Fan, J. and Yang, W., 2015. Study on E-Government Services Quality: The Integration of Online and Offline Services. Journal
of Industrial Engineering and Management, 8(3), pp. 693-718. Furusa, S.S. and Coleman, A., 2018. Factors influencing e-health implementation by medical doctors in public hospitals in
Zimbabwe. South African Journal of Information Management, 20(1), pp.1-9. Heckathorn, D.D., 2002. Respondent-driven sampling II: deriving valid population estimates from Chain-Referral samples of
hidden populations. Sociological Problems, 49(1), pp. 11-34. Heckathorn, D.D., 1997. Respondent-driven sampling: A new approach to the study of hidden populations. Sociological
Problems, 44(2), pp. 174-199. Hafkin, N.J., 2009. E-government in Africa: An overview of progress made and challenges ahead. In Prepared for the
UNDESA/UNPAN workshop on the electronic/mobile government in Africa: Building Capacity in Knowledge
Management through Partnership. United Nations Economic Commission for Africa (pp. 17-19). Hair, J. F., Black, W. C., Babin, B. J. and Anderson, R. E., 2018. Multivariate data analysis. 8
th ed. Harlow: Pearson Publishers.
Henseler, J., Ringle, C.M. and Sarstedt, M., 2015. A new criterion for assessing discriminant validity in variance-based structural equation modelling. Journal of the Academy of Marketing Science, 43(1), pp. 115-135.
Jain, P. and Akakandelwa, A., 2014. Adoption of e-government in Africa: challenges and recommendations. In Digital Access
and E-Government: Perspectives from Developing and Emerging Countries (pp. 101-124). IGI Global. Johnston, L.G. and Sabin, K., 2010. Sampling hard-to-reach populations with respondent-driven sampling. Methodological
innovations online, 5(2), pp.38-48. Kalamatianou, M.A. and Malamateniou, F., 2017. An Extended UTAUT2 Model for e-Government Project Evaluation. In the
Eleventh International Conference on Digital Society and eGovernment. Nice, France, 19 に 23 March 2017. IARIA: USA Karakaya-Ozyer, K. and Aksu-Dunya, B., 2018. A review of structural equation modelling applications in Turkish educational
science literature. International Journal of Research in Education and Science, 4(1), pp. 279-291 Kyem, P.A.K., 2016. Mobile Phone Expansion and Opportunities for E-Governance in sub-Saharan Africa. The Electronic
Journal of Information Systems in Developing Countries, 75(6), pp. 1-15. Manenji, T. and Marufu, B., 2016. The impact of adopting e-government as a mechanism to enhance accountability as well
as transparent conduct within public institutions. Scholedge International Journal of Business Policy and
Governance, 3(7), pp.84-101. Mawela, T., Ochara, N.M. and Twinomurinzi, H., 2016. E-Government Implementation: A Reflection on South African
Municipalities. South African Computer Journal, 29(1), pp. 147に171. Mellouli, M., Bentahar, O. and Bidan, M., 2016. Trust and e-government acceptance: The case of Tunisian on-line tax filing.
The Electronic Journal Information Systems Evaluation, 19(3), pp. 197-212. Mudzana, T. and Maharaj, M., 2017. Toward an Understanding of Business Intelligence Systems Success: A South African
Study. The Electronic Journal Information Systems Evaluation, 20(1), pp. 24-38. Munyoka, W. and Maharaj, M.S., 2019. Privacy, security, trust, risk and optimism bias in e-government use: The case of
two Southern African Development Community countries. SA Journal of Information Management, 21(1), pp. 1-9. Munyoka, W. and Maharaj. M., 2017a. Understanding eGovernment Utilisation within the SADC, IST-Africa 2017
Conference Proceedings, Windhoek, Namibia, 31 May-2 June 2017. IEEE M┌ミ┞ラニ;が Wくが ;ミS M;エ;ヴ;テく Mく ヲヰヱΑHく TエW WaaWIデ ラa UTAUTヲ マラSWヴ;デラヴ a;Iデラヴゲ ラミ Iキデキ┣Wミゲげ キミデWミデキラミ デラ ;Sラヮデ W-
government: the case of two SADC countries. Problems and Perspectives in Management, 15(1), pp. 115-123.

Willard Munyoka
www.ejise.com 91 ISSN 1566-6379
Munyoka, W. and Manzira, M.F., 2013. Alignment of e-Government Policy Formulation with Practical Implementation: The Case of Sub-Saharan. International Journal of Social, Behavioural, Educational, Economic, Business and Industrial
Engineering, 7(12), pp. 3034-3039. Mutula, S.M. and Olasina, G., 2014. E-government strategies in Sub-Saharan Africa: Failures and successes. In Digital Access
and E-Government: Perspectives from Developing and Emerging Countries (pp. 297-312). IGI Global. Nkohkwo, Q.N. and Islam, M.S., 2013. Challenges to the Successful Implementation of e-Government Initiatives in Sub-
Saharan Africa: A Literature Review. Electronic Journal of e-Government, 11(2), pp. 253-253. Organisation for Economic Co-operation and Development (OECD), 2013. Principles on Digital Government Strategies:
Bringing Governments Closer to Citizens and Businesses. (GOV/PGC/EGOV, 2013). Bern: OECD. Otieno, I. and Omwenga, E., 2016. Citizen-Centric Critical Success Factors for the Implementation of E-Government: A Case
Study of Kenya Huduma Centres. Journal of Emerging Trends in Computing and Information Sciences, 7(2), pp. 102-109.
Qasem, M., and Zolait, A.U. 2016. Determinants of Behavioural Intentions towards Using E-Government Services in the Kingdom of Bahrain. International Journal of Computing and Digital Systems, 5(4), pp. 345-355.
Palvia, S.C.J. and Sharma, S.S., 2007. E-government and e-governance: definitions/domain framework and status around the world. In 5
th International Conference on E-governance. Foundations of E-Government, Hyderabad, India, 28に30
December 2007. ACM New York: USA. Rajah, N., 2015. E-Government in Zimbabwe: An Overview of Progress Made and Challenges Ahead. Journal of Global
Research in Computer Science, 6(12), pp. 11-16. Rana, N.P., Dwivedi, Y.K. and Williams, M.D., 2013. Evaluating Alternative Theoretical Models for Examining Citizen Centric
Adoption of E-Government. Transforming Government: People, Process and Policy. 7(1), pp. 27に49. Ruhode, E., 2016. E-Gラ┗WヴミマWミデ aラヴ DW┗WノラヮマWミデぎ A TエWマ;デキI Aミ;ノ┞ゲキゲ ラa )キマH;H┘Wげゲ Iミaラヴマ;デキラn and Communication
Technology Policy Documents. The Electronic Journal of Information Systems in Developing Countries, 73(7), pp. 1-15. Sá, F., Rocha, Á. and Cota, M.P., 2016. From the quality of traditional services to the quality of local e-government online
services: A literature review. Government Information Quarterly, 33(1), pp. 149-160. Salganik, M.J., 2006. Variance estimation, design effects, and sample size calculations for respondent-driven
sampling. Journal of Urban Health, 83(1), pp.98-112. Samuel, O., 2014. Human factor issues in the use of e-government services among Ghanaian middle age population:
Improving usability of existing and future government virtual interactive systems design. Journal of Information
Engineering and Applications, 4(4), pp. 85-106 Schuppan. T., 2009. E-Government in developing countries: Experiences from sub-Saharan Africa. Government Information
Quarterly, 26, pp. 118に127. Sekaran, U. and Bougie, R., 2016. Research Methods for Business: A Skill Building Approach. 5
th Ed. New Jersey: John Wiley
and Sons. Sharma, S.K., 2015. Adoption of e-government services: The role of service quality dimensions and demographic
variables. Transforming Government: People, Process and Policy, 9(2), pp.207-222. United Nations. 2018. E-Government Survey 2018, gearing e-government to support transformation towards sustainable
and resilient societies, New York, USA Venkatesh, V., Thong, J.Y.L., Chan, F.K.Y. and Hu, P.J.H., ヲヰヱヶく M;ミ;ェキミェ Cキデキ┣Wミゲげ UミIWヴデ;キミデ┞ キミ E-Government Services:
The Mediating and Moderating Roles of Transparency and Trust. Information Systems Research, 27(1), pp. 87-111. Venkatesh, V., Thong, J.Y.L. and Xu, X., 2012. Consumer Acceptance and Use of Information Technology: Extending the
Unified Theory of Acceptance and Use of Technology. MIS Quarterly, 36(1), pp. 157-178. Venkatesh, V., Morris, M.G., Davis, G.B. and Davis, F.D., 2003. User acceptance of information technology: toward a unified
view. MIS Quarterly, 27(3), pp. 425-478. Verkijika, S.F. and De Wet, L., 2018. E-Government Development in Sub-Saharan Africa. Electronic Commerce Research and
Applications, 30, pp. 83-93. Yonazi, J., Sol, H. and Albert Boonstra, A., 2010. Exploring Issues Underlying Citizen Adoption of eGovernment Initiatives in
Developing Countries: The Case of Tanzania. Electronic Journal of e-Government, 8(2), pp. 176-188.

ISSN 1566-6379 92 ©ACPIL
Reference this paper: Michel, S., Michaud-Trévinal, A., and Cocula, F., 2019. Net Impacts in Front Office IS: a First Operationalization of Delone and McLean Model in the Banking Sector. The Electronic Journal of
Information Systems Evaluation, 22(2), pp. 92-112, available online at www.ejise.com
Net Impacts in Front Office IS: a First Operationalization of Delone and McLean Model in the Banking Sector
Sylvie Michel1, Aurélia Michaud-Trévinal
2 and François Cocula
1
1Univ. Bordeaux, IRGO,
2La Rochelle Université, CeReGe,
[email protected] [email protected] [email protected] DOI: 10.34190/EJISE.19.22.2.003 Abstract: The variable Net Impacts, a key variable in the models for information systems evaluation, is rarely operationalized according to a rigorous method and never for the banking sector. DeLone and McLean (2016) note that the challenge of developing measures to evaluate information systems is still relevant. The measurement and conceptualization of variables in real contexts is both very important and relatively absent in the literature. This research aims at operationalizing the Net Impacts construct resulting from DeLone and McLean's (2016) evaluation model for information systems, in the specific context of retail banks. It also aims at highlighting the socio-demographic variables influencing this construct. This original work conducted with 763 people applies the Churchill paradigm (1979) to provide a reliable and valid measure of Net Impacts, inspired by the Balanced Score Card. The main result of the research concerns the empirical validation of the measure of Net Impacts. This tool consists of three categories, relating to customer satisfaction, productivity and risk and ten items, which take into account the user but also include customer perception. This three-dimensional construct shows how the information system supports the user in a wide spectrum of work. Also, by showing that in the banking field, only the function occupied by the user influences the perception of the impact of IS, we contribute to a better knowledge of the variables related to the evaluation of IS. Thus, this instrument represents a strategic tool for monitoring and guiding efforts to increase performance. The proposed instrument is very easy for CIOs and managers to use in order to evaluate their information systems with users. Keywords: Business value of IT, productivity, customer satisfaction, control, Balanced Scorecard, Banking sector, DeLone and McLean model, Structural equation modelling.
1. Introduction
The use of computers for professional practice is now an integral part of everyday work life in organizations. Not surprisingly, the use and success of computer-based information systems has received extensive attention aヴラマ ヴWゲW;ヴIエWヴゲく Aゲ W;ヴノ┞ ;ゲ デエW ヱΓΑヰげゲが ヴWゲW;ヴIエWヴゲ デヴキWS デラ エキェエノキェエデ デエW ノキミニゲ HWデ┘WWミ ヮWヴaラヴマ;ミIW and IS by clearing several paths. Some have tried to show that the IS is a factor of greater productivity (Lucas, 1975; Turner, 1985; Markus and Soh, 1993; Strassman, 1997, Pashkevich and Haftor, 2014; Bui, et al., 2018). Others have tried to highlight the impact of IS on internal processes, the value chain or the creation of a competitive advantage (Parsons, 1983; Ives and Learmonth, 1984; Porter and Millar, 1985; Sethi and King, 1994; Brynjolfsson and Hitt, 1996; Drnevich and Croson, 2013; Bhatt, Wang and Rodger, 2017). Still, others attempt to understand the impact of IS on organizational performance through the notion of alignment between IS and other variables such as strategy, corporate structure or environment (Ein-Dor and Segev, 1978; 1989; Henderson and Venkatraman, 1999; Shao, 2019). Much research has been devoted to IS evaluation and to IS satisfaction (Chin and Lee, 2000; Mahmood, et al., 2000; Au, Ngai and Cheng, 2002; Vaezi, et al., 2016; Padinha ;ミS OげNWキノノが ヲヰヱヶき L;┘ゲラミ-Body, et al., 2017). The heterogeneity and number of constructs used to evaluate IS or its contribution to performance are therefore very numerous. On the basis of this heterogeneity of research, DeLone and McLean (1992, 2003, and 2016) proposed a synthesis in the form of a generic model that unifies the literature. They presented the Information System Success Model (ISSM), which is now widely accepted throughout the scientific community as one of the main models for evaluating IS. The Net Impacts variable is one of the main variables in the IS evaluation models (DeLone and McLean, 2003, 2016). These authors believe that IS-related impacts can be measured at several levels - individual, organizational and societal - and recommend that all these impacts be grouped into a single variable, net impact. Thus, following Gable, Sedera and Chan (2008), DeLone and McLean (2016) argue that the challenge of

Sylvie Michel, Aurélia Michaud-Trévinal and François Cocula
www.ejise.com 93 ISSN 1566-6379
developing measures to evaluate information systems is still relevant. In their view, the measurement and conceptualization of variables in real contexts remains particularly complex and little discussed in the literature. The present research, which focuses on the banking sector, aims to respond to the challenges raised at both managerial and academic levels. Indeed, it is crucial for banks to know how account officers perceive IS impacts. For example, nearly 1.1 billion euros is the amount that BNP Paribas Bank is looking to invest to support the transformation of its Information System (IS) over the period 2017-2019. Banks, pioneers since the 1980s in terms of investment in their information systems, keep investing massively in these systems today, because in the information age, front-office banking systems are perceived as the major strategic element of value creation and competitiveness. Also, the evaluation of information systems remains one of their major managerial problems. How can the front office banking information system be evaluated, taking into account its specificities? How can the front office banking IS be evaluated based on the perception of the main user, the account officer? As IS has particularly influenced the way employees execute tasks, provide customer service, and communicate with one another, research is needed to identify, analyze and elaborate on the underlying dimensions of Net Impacts. Furthermore, Petter, DeLone and McLean (2012) point out that in the current era, customer focus is at the center of corporate strategy, and banks are no exception. In the banking field, it is the role of account officers to create value, supported by IS: the client-IS-account officer triad is essential (Retour, Dubois and Bobillier-Chaumon, 2006). The use, appropriation and perception of users in evaluating the IS are at the same time research themes and managerial questions (Borena and Negash, 2016; Baker, Cohanier and Leo, 2017). Yet, our literature review shows that Net Impacts variable has only rarely been operationalized and never for the banking sector. So, the net impact construct needs much further development from researchers. The objective of this article is therefore to operationalize the Net Impacts construct from DeLone and McLean (1992, 2003, and 2016) in the banking sector, with front office users. To this end, we extend our literature review to a set of tools to assess the Net Impacts, whether or not they are directly related, at the outset, to the ISSM model. Using the Churchill paradigm (1979), we propose a reliable and valid measure of Net Impacts construct from DeLone and McLean (1992, 2003, 2016), inspired by the Balanced Scorecard (BSC), composed of three dimensions (productivity, customer satisfaction, control) and ten items. The demographic characteristics of users are taken into account as variables of influence to determine a typical profile. As this research was carried out in the banking sector with front office IT managers, the instrument could be an operational strategic tool to monitor and guide efforts to increase IT performance. Our paper first presents the literature review regarding the Net Impacts construct (part 2). Then, after having specified our methodological choices (part 3), we outline the procedure for creating the instrument: we start by specifying the field of construction and in particular the BSC approach, which allows us to generate a sample of items, and then present the steps to purify and validate our measuring instrument (part 4). Finally, we conclude and discuss research findings and perspectives (Part 5).
2. Literature Review : the Net Impacts construct
When attempting to evaluate IS, there are two main questions: Q1) which is the dependent variable, i.e. the level of evaluation or its impact on the organization? and Q2) how to measure this performance?
2.1 The concept of Net Impacts
Since the 1970s, researchers have sought to highlight the links between performance and IS by exploring various paths (Michel and Cocula, 2014c). Based on the heterogeneity of research, DeLone and McLean (1992) proposed a synthesis of the existing studies in the form of a generic model unifying the literature. They presented the Information System Success Model (ISSM) which is now widely recognized in the scientific community as one of the main models for IS evaluation. Yet, companies make little use of it. They refer instead to standards such as ITIL, COBIT or CMMI to ensure IS quality, monitoring of procedures or the level of IS maturity, and even its governance. ISSM, initially composed of five variables, is multidimensional, i.e. it recognizes the success of IS as a constructed process that must include both temporal and causal influences. More specifically, in this model,

The Electronic Journal of Information Systems Evaluation Volume 22 Issue 2 2019
www.ejise.com 94 ©ACPIL
system quality and information quality affect both IS use and user satisfaction, which in turn are the antecedents of individual impact. User satisfaction can affect use, but also, conversely, use can affect user satisfaction. Individual impacts lead to organizational impacts. In their 1992 model, DeLone and McLean use a taxonomic approach to define two levels of impact: individual and organizational. These authors proposed a new version of their model in 2003 with the aim of responding to a number of criticisms (Ballantine, et al., 1998) such as the non-operationalization of variables and the absence of empirical studies. They also responded to criticisms concerning the process-related and/or causal nature of the model, as well as the choice of variables and the links between them (dependent or independent variables). Thus, their new model includes three main changes (DeLone and McLean, 2003). First, they add as an independent variable, at the technical level, service quality provided to users. Next, they modify the variable "use" by splitting it into two sub-variables which are "intention to use" and "actual use. Finally, they believe that impacts can be measured at several levels: individual, organizational, and even societal. They prefer to group all impacts into one, called "net benefits". Ultimately, the choice of the level of impact should be determined by the researcher using the model in accordance with the context and objectives of the evaluation. More recently, in their 2016 book, DeLone and McLean both recall the foundations of their multidimensional model and take stock of recent trends in IS evaluation. Two major changes from the 2003 model are proposed by these two authors. First, the variable "net benefits" is renamed Net Impacts. The researchers justify this change by referring to the positive aspect of the notion of profit. However, an IS can yield results that positively or negatively influence both the intention to use and user satisfaction. Second, a new feedback is introduced into their model. This presupposes that with the experience accumulated during IS use, problems and possible improvements are highlighted by users. This leads to maintenance demands that influence IS quality, data quality and service quality. In this new version (Figure 1) the authors still do not propose the operationalization of their variables and invite researchers to do so by adapting the constructs to the studied contexts.
Figure 1: IS Success Model, Updated DeLone and McLean 2003 IS Success Model (modified). (2016)
2.2 Approaches to Measuring Net Impacts:
A review of the literature suggests several approaches to measure Net Impacts of IS. Numerous researchers have focused on specific aspects of Net Impacts, such as organizational impact (Mirani and Lederer, 1998; Bradley, Pridmore and Byrd, 2006; Acheampong and Moyaid, 2016), individual impacts (Sedera, Gable and, & Chan, 2004; Gable, Sedera and Chan, 2008; Bravo, Santana and Rodon, 2015), individual and organizational impacts (Sedera, Eden and McLean, 2013; Alshardan, Goodwin, and Rampersad, 2016), job performance (Torkzadeh and Doll, 1999; Sun and Teng, 2017; Ul-Ain, Vaia, and DeLone, 2019), collaborative performance (Andriessen, 2012; Hsu, et al., 2012), balanced scorecard approach (Martinsons, et al., 1999; Chang and King, 2005; Lee, Chen and Chang, 2008; Chen, et al., 2015 ; Hou, 2016; Motwani and Sharma, 2016 ;. Laumer, Maier, and Weitzel, 2017). Their critical examination guides us in the choice of dimensions and certain items to be taken into account.

Sylvie Michel, Aurélia Michaud-Trévinal and François Cocula
www.ejise.com 95 ISSN 1566-6379
In this way, one of these approaches, proposed by Mirani and Lederer (1998), focuses on the organizational benefits of IS projects. The authors propose a measurement of organizational impacts and suggest three categories: strategic benefits that are measured by competitive advantage, alignment and customer relations; information benefit measured by information access, information quality and information flexibility; and finally transactional benefits measured by communications efficiency, system development efficiency and business efficiency. Similarly, Bradley, Pridmore and Byrd (2006), in an attempt to contextualize the ISSM, propose three levels of impacts related to the use of the SI: strategic, tactical and operational. These instruments are not suitable for our research because these organizational impact assessments, determined by IS projects, seem to us to be too focused on application developers and not enough on end users, or even decision makers. We aim to assess the perception of Net Impacts among retail bank account officers. Moreover, the informational impacts dimension is already present in ISSM, through the variable "quality of information", which is considered in the ISSM as a determinant of Net Impacts and not as one of its dimensions. In a second approach, that of Torkzadeh and Doll (1999), starts out from the observation, accepted by both the literature and managers, that IS success can be measured by its impact on the work of end users. The authors develop an instrument with four dimensions. The first is task productivity, i.e. the extent to which an application increases the user result per unit of time (3 items). The second dimension is task innovation, which reports on the extent to which an application helps users to create or find new ideas for their work (3 items). The third is customer satisfaction, which measures the extent to which an application helps the user create value for the internal or external customer (3 items). Finally, the last one looks at management control, which examines to what extent an application helps to regulate the work process and performance (3 items). Doll, Kラ┌aデWヴラゲ ;ミS Tラヴニ┣;SWエ ふヲヰヰヵぶ ヮヴラ┗キSW ; ゲデ;デキゲデキI;ノ Iラミaキヴマ;デキラミ ラa デエキゲ キミゲデヴ┌マWミデげゲ ┗;ノキSキデ┞く Hラ┘W┗Wヴが キデ does not appear to be entirely appropriate for our field of research either. Indeed, while the user satisfaction and productivity task dimensions appear to be very relevant to the banking sector, the innovation task and management control dimensions are not appropriate for measuring the impacts of banking information systems, since these tasks are not devolved to account officers. Another interesting approach is the BSC, an instrument originally developed by Kaplan and Norton (1992) and adapted to the generic assessment of IS (Martinsons and Davison, 1999; Milis and Mercken, 2004; Chang and King, 2005; Epstein and Rejc, 2005; Fang and Lin, 2006; Ebrahimi, et al, 2013, Lee, Chen and Chang, 2008), and also adapted to much more specific evaluations such as ERPs (Rosemann and Wieses, 1999; Chand, et al., 2005; Fang and Lin, 2006; Motwani and Sharma, 2016), investment in information technology (Ahmad, 2014; Wu and Chen, 2014), or software in SaaS (Lee, Park and Lim, 2013), IS governance (Van Gremberge and De Haes, 2005), CRM (Kim, Suh and Hwang, 2003), e-commerce (DeLone and McLean, 2004), Business intelligence (Hou, 2016). The BSC model is based on the idea that performance should be assessed from four main perspectives: financial, customer, internal business, and innovation and learning. The name of this instrument indicates the authors' willingness to strike a "balance" between the long and the short term, between financial and non-financial measures, between internal and external perspectives. Initially, the authors presented the BSC as a tool for clarifying and communicating strategy and gradually developed it into a basis for strategic management (Kaplan and Norton, 1992). Martinsons and Davison (1999) propose a model based on the conceptual framework of the BSC, in order to evaluate either a particular application, an IS department, or IS as a whole. They brought significant changes to the outlook, but also to the measurements with respect to the Kaplan and Norton (1992) instrument. In this adaptation of the BSC to IS, the main perspectives are as follows: User orientation perspective: the main question is whether the services provided by the IS meet the needs of users; the objectives are to establish and maintain a good image and reputation with users so that the IS (and the IS department) is perceived as the preferred service provider, it can be used to exploit the opportunities related to IS, and it satisfies the needs of users. Internal process perspective: the mission is to deliver IT services efficiently and effectively. It is therefore necessary to anticipate users' requests, to be efficient in terms of application development and planning, application maintenance, malfunction management, and acquisition of new technologies in the field of hardware and software.
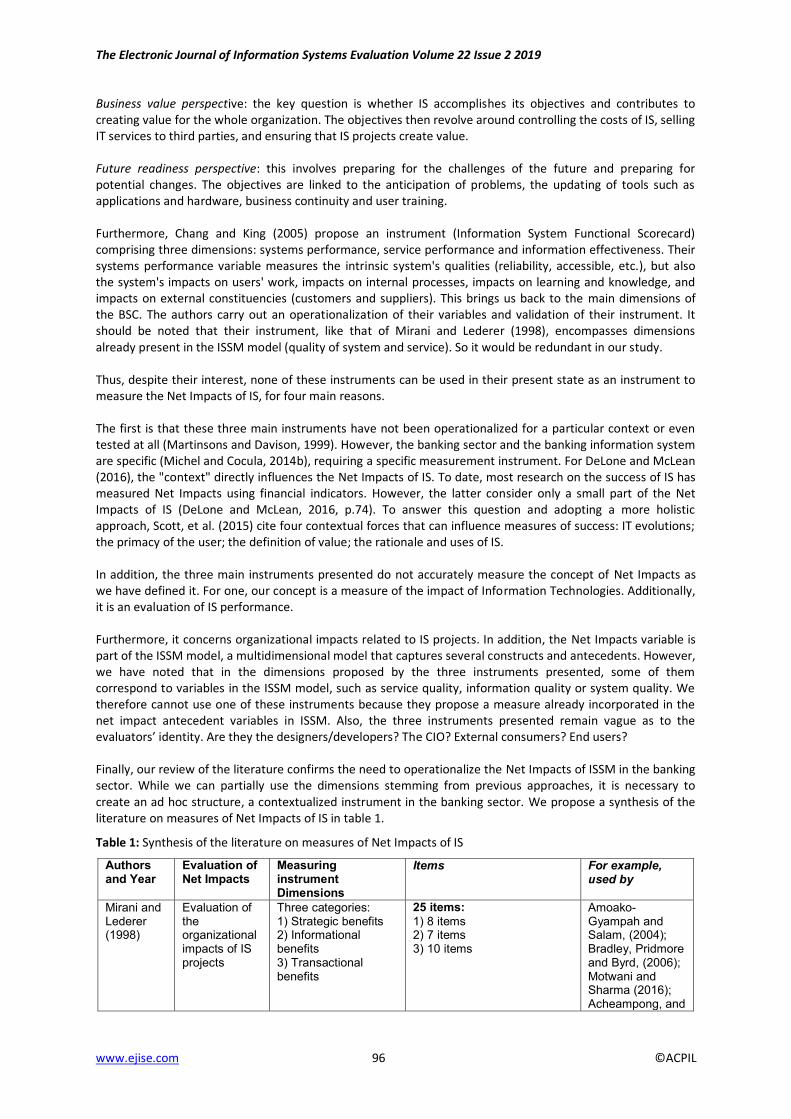
The Electronic Journal of Information Systems Evaluation Volume 22 Issue 2 2019
www.ejise.com 96 ©ACPIL
Business value perspective: the key question is whether IS accomplishes its objectives and contributes to creating value for the whole organization. The objectives then revolve around controlling the costs of IS, selling IT services to third parties, and ensuring that IS projects create value.
Future readiness perspective: this involves preparing for the challenges of the future and preparing for potential changes. The objectives are linked to the anticipation of problems, the updating of tools such as applications and hardware, business continuity and user training. Furthermore, Chang and King (2005) propose an instrument (Information System Functional Scorecard) comprising three dimensions: systems performance, service performance and information effectiveness. Their systems performance variable measures the intrinsic system's qualities (reliability, accessible, etc.), but also the system's impacts on users' work, impacts on internal processes, impacts on learning and knowledge, and impacts on external constituencies (customers and suppliers). This brings us back to the main dimensions of the BSC. The authors carry out an operationalization of their variables and validation of their instrument. It should be noted that their instrument, like that of Mirani and Lederer (1998), encompasses dimensions already present in the ISSM model (quality of system and service). So it would be redundant in our study. Thus, despite their interest, none of these instruments can be used in their present state as an instrument to measure the Net Impacts of IS, for four main reasons. The first is that these three main instruments have not been operationalized for a particular context or even tested at all (Martinsons and Davison, 1999). However, the banking sector and the banking information system are specific (Michel and Cocula, 2014b), requiring a specific measurement instrument. For DeLone and McLean (2016), the "context" directly influences the Net Impacts of IS. To date, most research on the success of IS has measured Net Impacts using financial indicators. However, the latter consider only a small part of the Net Impacts of IS (DeLone and McLean, 2016, p.74). To answer this question and adopting a more holistic approach, Scott, et al. (2015) cite four contextual forces that can influence measures of success: IT evolutions; the primacy of the user; the definition of value; the rationale and uses of IS. In addition, the three main instruments presented do not accurately measure the concept of Net Impacts as we have defined it. For one, our concept is a measure of the impact of Information Technologies. Additionally, it is an evaluation of IS performance. Furthermore, it concerns organizational impacts related to IS projects. In addition, the Net Impacts variable is part of the ISSM model, a multidimensional model that captures several constructs and antecedents. However, we have noted that in the dimensions proposed by the three instruments presented, some of them correspond to variables in the ISSM model, such as service quality, information quality or system quality. We therefore cannot use one of these instruments because they propose a measure already incorporated in the net impact antecedent variables in ISSM. Also, the three instruments presented remain vague as to the W┗;ノ┌;デラヴゲげ キSWミデキデ┞く AヴW デエW┞ デエW SWゲキェミWヴゲっSW┗WノラヮWヴゲい Tエe CIO? External consumers? End users? Finally, our review of the literature confirms the need to operationalize the Net Impacts of ISSM in the banking sector. While we can partially use the dimensions stemming from previous approaches, it is necessary to create an ad hoc structure, a contextualized instrument in the banking sector. We propose a synthesis of the literature on measures of Net Impacts of IS in table 1.
Table 1: Synthesis of the literature on measures of Net Impacts of IS
Authors and Year
Evaluation of Net Impacts
Measuring instrument Dimensions
Items For example, used by
Mirani and Lederer (1998)
Evaluation of the organizational impacts of IS projects
Three categories: 1) Strategic benefits 2) Informational benefits 3) Transactional benefits
25 items:
1) 8 items 2) 7 items 3) 10 items
Amoako-Gyampah and Salam, (2004); Bradley, Pridmore and Byrd, (2006); Motwani and Sharma (2016); Acheampong, and

Sylvie Michel, Aurélia Michaud-Trévinal and François Cocula
www.ejise.com 97 ISSN 1566-6379
Authors and Year
Evaluation of Net Impacts
Measuring instrument Dimensions
Items For example, used by
Moyaid, (2016)
Torkzadeh and Doll (1999)
Perceived impact of Information Technology on the work of end users.
Four categories: 1. Task productivity 2. Task innovation 3. Customer satisfaction 4. Management control
12 items: 1) 3 items 2) 3 items 3) 3 items 4) 3 items Items and structure confirmed by Doll et al. (2005)
Ul-Ain, Vaia, and DeLone, (2019); Sun and Teng. (2017)
Martinsons et al. (1999)
Balanced Scorecard model applied to IS (untested model)
Four categories: 1) Business value perspective 2) User orientation perspective 3) Internal process perspective 4) Future readiness perspective
The dimensions are broken down: 1) Business Value: Cost control (4 items); Sales to third parties (1 item), Business value of an IT project (8 items), Risks (7 items); Value of an IS department (3 items) 2) User: Be the preferred supplier for applications and operations building and maintaining relationships with the user community; satisfying end-user needs 3) Internal process: Planning (1 items); Development (4 items); Operations (2 items) 4) Readiness perspective: IT specialists capabilities (4 items); Perceived satisfaction of IS employees (2 items); Portfolio of applications (4 items); Research on emerging technologies (2 items)
Lee, Chen and Chang, (2008); Wu, and Chen, (2014); Hou, (2016); Motwani and Sharma, (2016)
Chang and King (2005)
Evaluating the performance of IS through a functional BSC
Three categories: 1) System performance (6 sub-dimensions) 2) Information effectiveness (7 sub dimensions) 3) Service performance (5 sub-dimensions)
67 items:
1) 31 items 2) 20 items 3) 16 items
Chen, et al., (2015); Laumer, Maier and Weitzel (2017)
Sedera, Eden and McLean (2013)
Individual and/or organizational impact
1) Individual impact 2) Organizational impact
1) 4 items 2) 8 items
Alshardan, Goodwin and Rampersad, (2016), Bravo, Santana and Rodon, (2015)
3. Methodology
The data used to test our hypotheses were collected from the principal French retail banks. We decided to operationalize the variables and to test our model with account officer users of front office IS. We detail below the context of empirical research and the data collection
3.1 Conceptualization of the construct: the Churchill paradigm
The definition of constructs plays a fundamental role in science (MacKenzie, 2003). The development of a coherent, robust and generalizable theory requires well-defined constructs; otherwise, the credibility of the results is called into question (Summers, 2001). Several studies have investigated the various approaches to measurement (e. g. Lee and Hooley, 2005; Salzberger and Koller, 2013). We have chosen to use the

The Electronic Journal of Information Systems Evaluation Volume 22 Issue 2 2019
www.ejise.com 98 ©ACPIL
methodological approach developed by Churchill (1979) called the "Churchill paradigm", which is part of the classical theory of scores. The model presented here is a second-order model. We seek to accurately evaluate each dimension of the constructed Net Impacts in a rigorous way, so that managers can also measure each dimension separately. These are considered latent variables that have reflexive relationships to the items. It is therefore a type II construct, i.e. a first-order multi-dimensional reflexive and second-order formative construct. That is why we have chosen to use the Churchill paradigm to operationalize this construct.
3.2 Context of the empirical research
Five of the six biggest banks in France agreed to be partners in our study. We started with an exploratory phase by conducting interviews in these banks. We had the opportunity to "test" the work stations of the different actors (reception, individual account officer, etc.) of the five banks and to interview account officers, agency directors, some CIOs and organizational managers. We can say that the account officer is a professional whose main activity is primarily to provide clients with advice on the banking services offered. Business is fast-changing, notably due to competitive pressure, but also to the arrival of new technologies such as multichannel and internet banking. Competitive pressure is manifested by a stronger emphasis on short-term objectives. It is necessary to increase net banking income for each family of customers, build customer loyalty, direct them to the right communication channel, etc. From an adviser, the customer service representative has become a salesperson (Des Garets, Paquerot and Sueur, 2009). This change in the profession is accompanied by an evolution of skills. Today, account officers must be able to describe a large number of products (banking or otherwise, such as home services, insurance services, mobile telephony) and manage a very large portfolio of clients. It should also be noted that the multi-channel capability has changed the job of customer account officer. It has reduced the number of opportunities for client-advisor meetings (Des Garets, Paquerot and Sueur, 2009). In this respect, the account officer plays a key role. They are subject to strong competitive pressure, with sales targets driven upwards by the hierarchy, and must constantly adapt to the new behaviour of bank users. As part of their activities, the account officer relies on and interacts with the front-office IS. Their working environment is therefore organized around a computer workstation, composed of several application layers representing their "business environment", an intranet and sometimes Internet access which is more or less limited depending on the establishment. Depending on the bank, the presentation of the desktop (i.e. access to the various functionalities) is of course different. However, it is possible to establish a typology of the workstation, in that it is personalized according to the function occupied. Thus, each account officer has a space on his workstation that is adapted to the various business lines, enabling him to manage customer relations both operationally and analytically, for example contract management, customer knowledge history (civil status, savings, products, appointment history, etc.). It is also in this business area that sales representatives can find all information relating to products, markets, regulations and arguments. The account officers also have an intranet reporting on the social life of the company and providing access to certain support functions (HR online service, etc.) and a messaging service and agenda.
3.3 Data collection
In line with the recommendations of Churchill (1979), most of the items used in this study have been taken from the literature. In addition, in order to fill the gaps in the literature concerning the constructs specific to banking IS, interviews were held with retails bank account officers and branch manager.
3.3.1 A qualitative exploratory phase
Series of interviews composed the qualitative exploratory phase. Open interviews were conducted with the CIOs of three banks in order to gain an insight into the general functioning of the banking system and cultural norms. Then, thirteen semi-structured キミデWヴ┗キW┘ゲ ラa aラ┌ヴ SキaaWヴWミデ H;ミニゲげ ┌ゲWヴゲ ┘WヴW IラミS┌IデWd (table 2). The objective was to learn about the uses of the SI, expectations, obstacles, motivation, etc. The analysis of the semi-structured interviews was carried out in two stages. First, we compiled an analysis grid and then all interviews were transcribed and analyzed with Alceste software. This lexical analysis software makes it possible to identify the main lexical worlds relative to the perception of SI success and the strongest significant structures.

Sylvie Michel, Aurélia Michaud-Trévinal and François Cocula
www.ejise.com 99 ISSN 1566-6379
Table 2: Number and profession of users interviewed
Interviewees’ professions Number of interviewees
Head of bank branch 5
Bank reception consultant 3
Account officer for private customers 3
Account officer for professional customers 2
TOTAL 13
In addition with a literature review, analysis of the interviews enabled us to generate a sample of items.
3.3.2 Quantitative data collection
Two rounds of data collection were performed by means of an online questionnaire sent to two retail banks. For both data collections, we had a comprehensive sampling frame (at the regional level) and also had all mail addresses. So we set up an online survey, sent by e-mail to the whole sample. We posted our questionnaire on a website and invited respondents to visit the site. For the first round, the questionnaire was sent to the entire set of email addresses in the sales network: 571 persons in all. We obtained a return rate of 36.6% (209 responses). This first round of data collection took place over a period of one week, followed by an exploratory factor analysis. For the second round of data collection, we had access to the entire set of branch email addresses: 550 persons. The questionnaire was available online for a period of two weeks, with two reminders, coordinated by the Quality Manager. The return rate was 36.7%, i.e. 202 responses (192 responses). We performed a confirmatory factor analysis and were able to test our hypotheses using this second collection of data. Table 3 summarizes the different stages of our approach stemming from the Churchill paradigm (1979).
Table 3: Research Steps: Measuring Instrument Development and Validation Processes - adapted from Churchill (1979) and MacKenzie, Podsakoff and Podsakoff (2011)
Steps of the process Methods used
Step 1: Specify the domain of the construct
Literature review on the construct Net Impacts. Identification of three main approaches.
Step 2: Generate a sample of items and ensure content validity
Qualitative studies: - 13 semi-directive interviews (lexical analysis with Alceste
software) - Validation with experts of the 19 items generated; ֲ Proposal of a construct consisting of 14 items and 4
dimensions.
Step 3: Data collection Self-administered online questionnaire from 571 bank agents. Return rate 36%.
(n = 271)
Step 4: Specify and purify the
measurement model First purification of the measuring instrument (exploratory Cronbach alpha and principal component factorial analyses)
Step 5: Data collection
- Return to literature; - Second data collection using an online questionnaire
from 550 agents of another bank. Return rate 37%. (n = 192)
Step 6: Validation of the measuring
instrument (new sample)
- Validation of the measuring instrument: (confirmatory factor analysis)
- Convergent validity and discriminatory validity; - Second order construct with formative indicators:
multicollinearity test, verification of the three dimensions, nomological validity.

The Electronic Journal of Information Systems Evaluation Volume 22 Issue 2 2019
www.ejise.com 100 ©ACPIL
4. Development of the construct and validation of the measurement instrument
In this part, we first present the results of the exploratory and confirmatory factor analyses performed on the construct and realized with SPSS and AMOS.
4.1 Generation of a sample of items
We operationalize the construct in the context of the front office Information System of these large retail banks. Once the construct scope has been delineated through the literature review, the next step is to generate items that can describe the whole concept (MacKenzie, Podsakoff and Podsakoff, 2011). In order to operationalize the Net Impacts construct of front office banking, we have chosen as the main theoretical framework the dimensions proposed by both the BSC and the Torkzadeh and Doll (1999) instrument. This theoretical basis has been enriched by the results of our qualitative exploratory analysis.
4.1.1 Results of qualitative analysis
The first element emerging from these interviews is that the IS is perceived as a tool that business managers must be able to use to improve relations with clients. Far from being seen as a tool interposed between them and the client thus reinforcing a transactional approach, the IS is clearly perceived as confirming the relational approach during appointments. The second point to note is that while the IS is seen as an indispensable, relevant, useful and value-creating tool, expectations appear to exceed achievements. Next, four main themes emerge from our qualitative analysis of the perceived Net Impacts. The analysis of the interviews revealed impacts related to productivity, learning impacts, customer satisfaction impacts, strategic and even organizational impacts, mainly linked to risk controls (limitation of operational risks or compliance with procedures and regulations).
4.1.2 Questionnaire development
For the precise formulation of the items, we drew on the literature and the results of the qualitative analysis, which enabled us to propose 19 items. Our set of items was submitted to five researchers and two CIOs from the banking sector. Five items were deleted, mainly because of their wording, which was redundant in relation to others, or because of their low interest, according to experts. Some of them were modified and rewritten. We therefore retain a set of fourteen items to measure the net perceived impacts, classified into four main dimensions (detailed in table 5 below): a "customer satisfaction perspective" dimension consisting of three items; a "productivity perspective" dimension (internal process) consisting of seven items; a "learning perspective" dimension consisting of one item; and a "control perspective" dimension consisting of three items. In addition, one of the objectives is to determine whether socio-demographic differences between users have an influence on the assessment they make. Highlighting a user profile with a better perception is also a theoretical objective of this work (Petter, DeLone and McLean, 2013). This questionnaire was thus completed by five socio-SWマラェヴ;ヮエキI キSWミデキaキI;デキラミ ケ┌Wゲデキラミゲ IラミIWヴミキミェ デエW ヴWゲヮラミSWミデゲげ ;ェW ふヲヰ-29 years old, 30-39, 40-49, 50-59, 60 years old and over), gender (women or men), occupation (reception, account officer for private customers, account officer for professional customers, wealth management account officer, branch manager), level of education (National Diploma, Baccalaureate, second-year university level, fourth-┞W;ヴ ┌ミキ┗Wヴゲキデ┞ ノW┗Wノが M;ゲデWヴげゲ degree level) and seniority in the bank (less than one year, from 1 year to 2 years, from 3 years to 5 years, from 6 years to 10 years, more than 10 years). All questions were formulated in the form of a five-position Likert scale.
Table 5: Dimensions and items of Net Impacts
Dimensions Items /(code bracketed) Adapted from literature or new ones
customer satisfaction perspective dimension
1. My information system improves customer satisfaction. (Isatclt)
Torkzadeh and Doll (1999); Grover and Davenport (2001); Van Grembergen, Saull and De Haes (2003); Kim, Suh and Hwang, (2003); Chand et al. (2005); Epstein and Rejc, (2005); Fang and Lin (2006), Hou, (2015)
2. My information system improves customer service. (Iservclt)
Torkzadeh and Doll (1999); Grover and Davenport (2001); Van Grembergen, Saull and De Haes (2003); Kim, Suh and Hwang, (2003); Lee, Park and Lim, (2013); Hou, (2015)
3. My information system allows me to convey a better image to clients. (Iimage)
NEW
productivity 4. My information system saves me Mirani and Lederer (1998); Torkzadeh and Doll

Sylvie Michel, Aurélia Michaud-Trévinal and François Cocula
www.ejise.com 101 ISSN 1566-6379
Dimensions Items /(code bracketed) Adapted from literature or new ones
perspective" dimension (internal process
time. (Itps) (1999); Murphy and Simon (2002); Van Grembergen, Saull and De Haes (2003); Chand et al. (2005); Fang and Lin (2006); Lee, Park and Lim, (2013); Ahmad (2014), Sun and Teng (2017)
5. My information system simplifies my work. (Isimplw)
Chang and King (2005); Fang and Lin (2006)
6. My information system allows me to make better decisions. (Idec)
Mirani and Lederer (1998); Murphy and Simon (2002); Chang and King (2005); Chand et al. (2005), Alshardan, Goodwin and Rampersad. (2016).
7. My information system improves my quality of life at work. (Iqualviw)
Chang and King (2005); Van Grembergen, Saull and De Haes (2003)
8. My information system improves the quality of my work. (Iqualw)
Goodhue and Thompson (1995); Torkzadeh and Doll (1999); Murphy and Simon (2002); Van Grembergen, Saull and De Haes (2003); Chang and King (2005); Ahmad (2014); Hou, (2015)
9. My information system improves communication within my company. (Icomm)
Chang and King (2005); Ahmad (2014)
10. My information system allows me to organize myself better. (Iorg)
Van Grembergen, Saull and De Haes (2003); Chang and King (2005); Chand et al. (2005)
learning perspective" dimension
11. My information system allows me to learn. (Iappr)
Van Grembergen et al. (2003); Chang and King (2005); Lee, Park and Lim, (2013); Ahmad (2014), Alshardan, Goodwin and Rampersad, (2016).
"control perspective" dimension
12. My information system allows me to increase my company's net banking income. (Ipnb)
Chang and King (2005)
13. My information system enables me to better control operational risk. (Irisqop)
NEW
14. My information system makes it easier to comply with regulations. (Irglmt)
NEW
Before collecting the data, it is recommended to specify the measurement model (MacKenzie, Podsakoff and Podsakoff, 2011) to ensure that it is well adapted to a multi-dimensional construct, as the constructs are not reflective or formative in nature. In this research, the model used is a formative model; the analyzed construct is composed of several dimensions, each representing a facet of the construct. Social scientists are encouraged to use such models, which allow the analysis of complex constructs in second-order variables (Bèzes, 2014). Formative models explain more variance than reflective models, which increases their predictive power (Finn and Wang, 2014). The conceptualized Net Impacts model is formalized in Figure 2 below.
Figure 2: Conceptual Model of Net Impacts

The Electronic Journal of Information Systems Evaluation Volume 22 Issue 2 2019
www.ejise.com 102 ©ACPIL
Secondly, we verify the reliability and validity of this instrument by conducting an exploratory factor analysis, with SPPS software.
4.2 Exploratory analysis of the scale
At this stage, an initial data collection is necessary to purify our measuring instrument represented by our questionnaire. A second data collection will be necessary to ensure the reliability and validity of our measurement instrument. These are steps 3, 4 and 5 of the Churchill paradigm (1979). These two collections of quantitative data were compiled using an online questionnaire. The breakdown of employees in the network by function is reproduced in Appendix A. We conducted two exploratory factorial principal component analyses (AFEs) on our two data collections, as they are intended to identify the underlying explanatory dimensions of the results obtained on a scale. Our data are metric and factorizable. The Kaiser, Meyer, Olkin (KMO) and Bartlett's sphericity tests are positive and very satisfactory for both data collections (0.875 / 0.864) and allow us to verify the ability of the data to be factorized. The correlation anti-image matrix provides indices all greater than 0.60. The reliability of our scale is good with a Cronbach alpha of 0.888 and 0.887 respectively for the two data collections. The exploratory factorial analysis on the second data collection provides us with the same structure: two main dimensions that are productivity and control, and only one item with a somewhat low quality of representation (Iorg) which will be excluded in this second exploratory factorial analysis. We obtain a constructed structure consisting of ten items and two dimensions. The variance explained by these two dimensions (ten items) is acceptable (greater than 60%).
Table 5: Main results of exploratory factorial analyses in principal components, Net Impacts
4.3 Validation and confirmation of the measurement scale
Our goal is now to confirm our measurement instrument (step 6 of the Churchill paradigm). Factor analysis can be used in a confirmatory logic to test predefined assumptions. It aims to compare assumptions about latent variables and their indicators with empirical data. Confirmatory analyses are based on models of structural equations that include observable variables (statements of scales), latent variables (theoretical constructs) and the difference between the two, i.e., error (Bentler and Bonett, 1980; Brown and Cudeck, 1993).
Net Impacts
Items Quality of representation Factorial Contribution Alpha
Dimension 1 Dimension 2
Collection 1 Collection 2 Collection 1 Collection 2 Collection 1 Collection 2
Isimplw 0,694 0,555 0,832 0,720 0,888 / 0,887
0,881 / 0,886
Iqualw 0,656 0,764 0,725
Itps 0,555 0,621 0,742 0,786
Iqualviw 0,551 0,579 0,741 0,688
Iorg 0,5 0,496
Iimage 0,524 0,591 0,655 0,759
Isatclt 0,559 0,56 0,613 0,728
Idec 0,569 0,531 0,572 0,553
Iservclt 0,528 0,545 0,544 0,698
Irisqop 0,708 0,774 0,846 0,873 0,759 / 0,721
Irglmt 0,715 0,715 0,842 0,813
Valeur propre 5,097 /4,98 1,51/1,16 KMO = 0,875 / 0,864
B;ヴデノWデデげゲ Test : Significatif Varimax P= 0,000
Variance explained in %
46,33 /49,8 13,73 / 11,645
N= 209 / N= 192
60 / 61,534

Sylvie Michel, Aurélia Michaud-Trévinal and François Cocula
www.ejise.com 103 ISSN 1566-6379
4.3.1 Adjustment of the global model
For the adjustment of the global model, three sets of indexes were analyzed: absolute, incremental and parsimony indexes. The results are presented in tabular form for comparison purposes. We started testing the structure of the two models. We tested the model provided by the first exploratory factorial analysis consisting of two dimensions and eleven items (model 1 - AFE 1). We also tested the same two-dimensional model (and one less item) corresponding to the results provided by the exploratory factor analysis on the second data collection (model 2 - AFE 2). We decided to integrate a dimension not proposed by exploratory factor analysis, for several reasons. First, the two-dimensional structure resulting from the exploratory factor analysis was not confirmed by the confirmatory factor analysis. Insufficient results in terms of adjusting the global model led us to specify these models again. Next, this two-dimensional structure does not correspond to the vision of the literature, especially the one that is similar to the BSC, which proposes four dimensions. Also, this two-dimensional structure, which encompasses customer satisfaction and productivity in the same dimension, does not correspond to what we discovered during the interviews or to the results of the qualitative analyses produced by the Alceste software. In this case, the literature (for example Evrard, et al., 2009) suggests that we should not "blindly" follow the statistical results, but rather that we get a little out of them. This is what we have done, integrating one dimension, that is, dividing the first dimension proposed by the factorial analysis (one dimension relating to satisfaction and one to productivity) into two. Content validity is more important than other validities. This led us to propose a third dimension. We therefore continued the comparison with a three-dimensional model and eleven items (model 3). We also tested a model 4 composed of three dimensions and ten items (Idec). In Model 4, we chose to remove the item with the lowest factor contribution (Idec: 0.553), close to the lower limit (0.5).
Table 6: Summary of the indexes of the model Net Impacts adjustment, 4 models tested
Summary of the indexes of
adjustment Model 1 2 dimensions, 11 items, AFE 1
Model 2 2 dimensions, 10 items, AFE 2
Model 3 3 dimensions, 11 items
Model 4 3 dimensions, 10 items (except Idec)
Absolute measurement indexes - Chi-square/dl(< 2) 3,06 3,6 2,6 2,3 - GFI and AGFI 0,887 / 0,886 0,881 / 0,807 0,910 / 0,854 0,933 / 0,885 - Gamma1 and Gamma2 (> 0,9) 0,92 / 0,877 0,901 / 0,853 0,943 / 0,908 0,963 / 0,937 - RMSEA (<0,10) 0,105 0,121 0,09 0,077
Incremental adjustment indexes - NFI and CFI (> 0,9) 0,869 / 0,906 0,861 / 0,893 0,891 / 0,928 0,916 / 0,949 - Non-standardized index Bentler and Bonnet (> 0,9)
0,880 0,859 0,903 0,928
Parsimony indexes - PNFI (highest value) 0,679 0,66 0,664 0,651 - AIC (lowest value) 0,934 0,878 0,836 0,634
Model No. 4, composed of three dimensions and ten items, presents the best fit of the global model. Chi-square is significant at a probability level of less than 1%. The GFI is 0.933 which is above the acceptance threshold. Thus, the probability that the theoretical model will adjust correctly to the empirical data is verified. All incremental indices are greater than 0.9. This suggests that these indices support the acceptance of the theoretical model. Finally, regarding parsimonious adjustment measures, the AIC and PNFI indices are acceptable. The three dimensions are: Dimension 1: productivity, 5 items (time saving, work simplification, quality of life at work, quality of work, organization) Dimension 2: Customer satisfaction, 3 items (satisfaction, customer service, image) Dimension 3: control, 2 items (operational risk, settlement).
4.3.2 Adjusting the measurement model
The adjustment of the measurement model for this factor structure should now be analyzed. It is necessary to check the fit of each construct with its indicators. The first step will be a statistical review of the factor IラミデヴキH┌デキラミゲ ラa デエW キミSキI;デラヴゲく “デ┌SWミデげゲ T-test must be greater than 1.96 at the 5% significance level for each

The Electronic Journal of Information Systems Evaluation Volume 22 Issue 2 2019
www.ejise.com 104 ©ACPIL
factor contribution. The following table 7, presenting the estimates of the parameters, indicates that each t-test is well above 1.96, verifying the link from each indicator to its construct. In a second step, we evaluate the reliability of internal consistency and the variance explained. Jöreskog's rhô, a coefficient of the reliability of internal consistency, is based on a measure of the factor contributions of items. One of the advantages of this indicator is that it is insensitive to the number of items. Above the 0.70 threshold, the reliability of the construction is considered good, which is the case.
Table 7: Summary of criteria for adjustment of the measurement model, Net Impacts
Adjustment criteria Model 4; 3 dimensions, 10 items
Validity of the construct a;Iデラヴキ;ノ ┘Wキェエデ ふд ヰがヵぶ ;ミS TWゲデ デ (> 1,96)
0,74 (t= 19,9) 0,75 (t= 18,4) 0,76 (t= 19,1) 0,68 (t= 18,9) 0,70 (t= 17) 0,78 (t= 22,8) 0,83 (t= 28,6) 0,66 (t= 14,5) 0,65 (t= 10,1) 0,86 (t= 12,8)
Reliability Coefficient of internal consistency ふJワヴWゲニラェげゲ ヾ б ヰがヶぶ
D1: 0,80 D2: 0,85 D3: 0,73
Convergent validity >0,50 D1: 0,58 D2: 0,54 D3: 0,58
Discriminant validity D1: 0,58 > (0,586) 2
Yes D2: 0,54 > (0,477)
2 Yes
D3: 0,58 < (0,812) 2
No
Dimension three (D3) has a slightly weak discriminating validity, but we decide to retain this dimension for its conceptual importance. The results of the confirmatory step allow us to validate the hypothesis that Net Impacts is a multidimensional construct with three dimensions. Thus, the finalized conceptual model of Net Impacts is summarized in Figure 3 below.
Figure 3: Final Conceptual Model of Net Impacts
4.4 Results
The first result concerns the construct itself and the percentages of answers obtained through our questionnaire. The second important result relates to socio-demographic variables. We proposed and validated an instrument, inspired by the BSC and following the Churchill paradigm, which measures the Net Impacts perceived by account officers using the front office banking IS. This tool consists of three categories, relating to customer satisfaction (3 items), productivity (5 items) and risk (2 items).

Sylvie Michel, Aurélia Michaud-Trévinal and François Cocula
www.ejise.com 105 ISSN 1566-6379
4.5 The influence of socio-demographic variables
To test the links between the socio-demographic variables of the model and the variable Net Impacts, we carried out ANOVAs. Indeed, the analysis of variance allows us to examine and interpret differences in averages observed between several groups for the same variable. ANOVAs are used to treat differences in means of a quantitative dependent variable when the independent variable has more than two modalities. The analysis of variance is therefore used to test the null hypothesis of equal averages. To evaluate the results of variance analyses, the F-test using a Fisher-Snedecor law is used. The Levene test is used to test this null hypothesis that variances are equal in the groups. We try to accept this hypothesis, i.e., to obtain significance greater than 5%. The ANOVA results show that only the occupied function influences the variable Net Impacts. To carry out this test, we grouped the functions of account officers to distinguish them from those of branch manager (see Appendix C). The results show that, on average, managers have a better appreciation of their IS.
Figure 4: Influence of socio-demographic characteristics on the variable Net Impacts
5. Discussion and implications
The review of the literature pointed out that the variable Net Impacts, a key variable in the models for IS evaluation, was rarely operationalized according to a rigorous method and never for the banking sector. We then proposed a construct, namely Net Impacts, contextualized in the banking field, applying the steps of the Churchill paradigm for a more rigorous construction of our scale of measurement. Qualitative studies based on semi-directive interviews, the results of which were compared with the literature, enabled us to generate a sample of items. We then started a quantitative phase to test the validity and reliability of this instrument, with exploratory but also confirmatory factorial analyses. The data collection was carried out by means of two questionnaires put on line consecutively in two large banks, targeting account officers. This instrument consists of three categories: a dimension relating to the perception of productivity gains (5 items); a dimension linked to the improvement of customer satisfaction (3 items); and a dimension linked to the improvement of risk control (2 items). Reliable and valid, this instrument can be used in a very concrete way to measure and improve the perception of Net Impacts among banking executives. Three main theoretical contributions can be highlighted. The first is to respond both to a lack of literature and a demand for it, namely operationalizing the key constructs of IS evaluation models with particular attention to context (DeLone and McLean, 2003, 2016). Our research enables us to accurately measure the Net Impacts of front-office IS in the banking sector. In addition, the literature, including Petter, DeLone and McLean (2013) using the DeLone and McLean (1992, 2003) models, underlines the lack of comprehensive and integrative research on variables influencing IS success. Our research is part of this objective to consolidate the literature on independent variables affecting the success of IS. By showing that in the banking field only the function occupied by the user influences the perception of the impact of IS, we contribute to a better knowledge of the variables related to the evaluation of IS.

The Electronic Journal of Information Systems Evaluation Volume 22 Issue 2 2019
www.ejise.com 106 ©ACPIL
The second theoretical contribution is that our construct encompasses broad and complex concepts related to the user and his work. Alter (2008) argues that it is by taking into account a broad framework in which IS is incorporated that IS impact can be truly assessed. Our three-dimensional construction (customer satisfaction, productivity, control) shows how the information system supports the user in a wide spectrum of work. Indeed, our concept encompasses concepts such as the image conveyed to consumers through IS, working time, or compliance with the regulations by IS. They are diverse, broad notions which are contained in our construct through the different dimensions. Indeed, we note that of the four initial categories proposed, only the one relating to learning/adaptation has disappeared. This can be explained by the lack of time and above all by the competitive pressure imposed on account officers (Michel and Cocula, 2014a). Although IS allows learning to take place in practice, is not used as such and is not perceived as being able to bring this benefit, due to the lack of time to devote to this learning activity. This brings us directly to the three dimensions highlighted. It appears that for account officers, the net perceived impacts of their IS are strongly linked to the productivity dimension. IS is a tool that should be used to increase productivity by saving time, simplifying work, improving organization, improving work quality and even the quality of life at work. It is important to note that this productivity dimension is both quantitative (time saving) and qualitative, in the sense that the quality of work performed and the quality of life at work seem to be affected (Retour, Dubois and Bobillier-Chaumon, 2006). In addition, while exploratory factor analyses led us to group together productivity and customer satisfaction, confirmatory factor analyses clearly distinguish between these two dimensions. Finally, the last dimension highlighted, control, appears to be specific to the banking sector. The two items (operational and regulatory risks) are closely linked to the front office banking business. As banking activity is closely linked to risks, it is interesting to note that for account officers, IS is a risk control tool and that far from being perceived as a constraint, it is seen as a benefit. The third contribution relates to the current emphasis on customers. IS evaluation has long revolved around three main actors: developer, user and manager. In their synthesis of the literature on IS evaluation, DeLone and McLean (2016) urge us to add other players, such as consumers, but also employees, suppliers, the State, and to position ourselves in the era of the consumer (customer-focused area). Our construct responds to this twofold expectation of the literature. The "employee" user is the main evaluator, and one of the dimensions considered by this user is customer satisfaction. Thus, by adapting our structure to the complexity of the account officers' work and incorporating customer satisfaction, we have met the expectations of the literature in the specific field of banking. Another remarkable point is related to the second dimension of our construct, customer satisfaction. The impacts perceived by account officers are related to customer relations and customer satisfaction. IS is therefore a tool that they also consider "customer-oriented". This confirms the change that has taken place in banks over the last few years: very product-focused in the past, account officers are now oriented towards "customer satisfaction" (des Garets et al., 2009). From a managerial point of view, Jones and Beatty (2001), but also Rosemann and Vessey (2008) have shown that the main variables of DeLone and McLean's IS success models are very little used in managerial practice. Managers are more likely to evaluate the process of developing IS (budget, time frame, different phases) with a cost-benefit orientation. One of the reasons given by the literature for this failure to take key evaluation variables into account in practice is the absence of a simple and valid proposal for tools. Similarly, Petter, DeLone and McLean (2012) show that there is a considerable mismatch between theory and practice in IS evaluation. Managers do not often have the tools to assess the user's perspective on the impacts of using their IT system. Thus, this instrument represents a strategic tool for monitoring and guiding efforts to increase performance. This tool should enable managers to understand the positive and negative impacts of IT on the most important factors in the banking sector. Our tool meets both a need of the literature and an expectation of managers. DeLone and McLean (2016) point to the need for operationalized tools that guide managers and CIOs in allocating IT investments. For example, there are many lessons to be learned from the percentages of favourable opinions of account officers (Appendix B). If we try to measure general Net Impacts (average of all frequencies per item), we obtain a score of 53.17%. This means that just over one in two account officers subscribe to the general impression that their IS generates positive impacts. This is very low, especially in view of the expectations of the management bodies and the colossal investment in IS and the mandatory use of the IS in the banking sector. Let's now break down the results by dimension. With regard to the first dimension, only 49.18% of respondents believe that the IS improves their productivity (in a general sense). One in two respondents does not perceive a simplification of work by the IS. Worse still, only 43.8% of respondents believe that the IS

Sylvie Michel, Aurélia Michaud-Trévinal and François Cocula
www.ejise.com 107 ISSN 1566-6379
improves the quality of work life (56.2% disagree or have no opinion). The IS is therefore not seen as a tool that provides comfort at work. This may result in a barrier to its use. This is a fundamental point on which branch managers and managers should reflect in order to find solutions to remedy it. With regard to the second dimension, we find these very low rates of positive perception about improving customer satisfaction. On average, only 46% of account officers perceive a general improvement in customer satisfaction through the IS. The item questioning the perception of improved customer satisfaction, but also the one concerning the image, obtained particularly low rates (41.7%). These are the lowest scores of the entire questionnaire and they concern one of the most important dimensions for banks, especially today when an account officer is subject to significant competitive pressure, when he is "objective in the short term" and when he has to adapt to new customer purchasing behaviour. The margin of progress again is significant. These low scores must be taken into account when taking corrective actions. On the other hand, with regard to the third dimension, that of improving risk control through the IS, a high percentage of favourable opinions (76.6%) should be noted. It is interesting to note that the IS is perceived above all as a "safeguard" and not only as a regulatory constraint. This table should alert CIOs, but also business managers. It is important to remedy such a perception of the net benefits related to the IS. This tool, which is not difficult to implement, can be used as a benchmark over time to measure the improvement in the perception of net benefits. These measures will thus make it possible to implement corrective actions.
6. Conclusion, limitations and future research
Organizations need to be aware of Net Impacts about their information systems. Net Impacts are a key determinant of information system evaluation. This paper has focused on developing an evaluation construct for Net Impacts in the banking sector. This study proposes, develops and tests a construct for assessing the Net Impacts of front office information systems on account officers. We propose a three-dimensional construct (customer satisfaction, productivity, control), which shows how the information system supports the user. In terms of theoretical implications, the present research provides a greater understanding of Net Impacts. This result is important: it stresses the indispensable need for IS evaluation models to be contextualized in terms of their environment. The construct must be studied in context. In the banking sector, for front office IS, it appears that the three-dimensional construct (customer satisfaction, productivity, control) is the most important to evaluate Net Impacts. In addition, the literature, including Petter, DeLone and McLean (2013) using the DeLone and McLean (1992, 2003) models, points to the lack of comprehensive and integrative research on variables influencing IS success. In this way, our research shows that only the occupied function influences the variable Net Impacts. Moreover, from the managerial point of view, the findings of this study significantly demonstrate the ability of three mains dimensions (customer satisfaction, productivity, and control) to influence IS success. Practitioners should assign great importance to these dimensions of Net Impacts. This questionnaire constitutes a tool for improving IS Net Impacts. These results show CIOs the particular criteria they must focus on in order to get a better perception of Net Impacts. This research proposes a useful evaluation instrument. Similarly, this instrument could be used by IS developers. They could include some of its characteristics in their specifications. IS impacts must be measured at several stages over time. A longitudinal study should be considered. This would allow for the study of changes in user perception. A further limitation is that the study was conducted on a national level. Also, in this study, we did not study the feedback between Net Impacts and other variables in the DeLone and McLean (2016) model, such as satisfaction or use. In addition, a research approach aimed at improving the external validity of this work would be to duplicate this study towards new sectors of activity close to the bank. We are thinking in particular of the insurance sector, because it is very close to the banking sector in its activities and the importance of information. Finally, it would also be appropriate to test this model in sectors with high informational intensity (Porter and Millar, 1985) whose profession differs from that

The Electronic Journal of Information Systems Evaluation Volume 22 Issue 2 2019
www.ejise.com 108 ©ACPIL
of banking or insurance. This is the case, for example, in the business services sector, particularly in the areas of auditing, accounting or legal services, which are recognized as highly informational. Finally, in future research, the human resource implications of this instrument should be further explored.
References Acheampong, O. and Moyaid, S. A., 2016. An integrated model for determining business intelligence systems adoption and
post-adoption benefits in banking sector. Journal of Administrative and Business Studies, 2(2), p. 84-100. Ahmad, M.I., 2014. Incorporating Technology Acceptance into Composite IT BSC for IT Investment Evaluation. Proceedings
of INFOS2014. Alshardan, A., Goodwin, R. and Rampersad, G., 2016. A Benefits Assessment Model of Information Systems for Small
Organizations in Developing Countries. Computer and Information Science, 9(1), p. 1-20. Alter, S., 2008. Defining information systems as work systems: implications for the IS field. European Journal of Information
Systems. 17 (5), p. 448-469. Amoako-Gyampah, K. and Salam, A. F., 2004. An extension of the technology acceptance model in an ERP implementation
environment. Information and management, 41(6), p. 731-745. Andriessen, J.E., 2012. Working with groupware: Understanding and evaluating collaboration technology. Springer Science
and Business Media. Au, N., Ngai, E. W. and Cheng, T. E., 2002. A critical review of end-user information system satisfaction research and a new
research framework. Omega, 30(6) p. 451-478. Ballantine, J., Bonner, M., Levy, M., Martin, A., Munro I. and Powell P L., 1998. Developing a 3-D Model of Information
Systems Success. In Information Systems Success Measurement. Ed. Garrity E., Sanders G L. Hershey, USA: Idea Group Publishing, p. 46-59.
Baker, C.R., Cohanier, B. and Leo, N.J., (2017). Breakdowns in internal controls in bank trading information systems: The case of the fraud at Société Générale. International Journal of Accounting Information Systems, 26, p. 20-31.
Bentler, P.M. and Bonett, D.G., 1980. Significance Tests and Goodness of Fit in the Analysis of Covariance Structures. Psychological Bulletin, 88(3) p. 588-606.
Bèzes, C., 2014. Definition and Psychometric Validation of a Measurement Index Common to Website and Store Image. Journal of Business Research, 67(12) p. 2559-2578.
Borena, B. and Negash, S., (2016). IT infrastructure role in the success of a banking system: The case of limited broadband access. Information Technology for Development, 22(2), p. 265-278.
Bhatt, G. D., Wang, Z. and Rodger, J. A., 2017. Information Systems Capabilities and Their Effects on Competitive Advantages: A Study of Chinese Companies. Information Resources Management Journal, 30(3), p. 41-57.
Bradley, R.V., Pridmore, J.L. and Byrd T.A., 2006. Information Systems Success in the Context of Different Corporate Cultural Types: an Empirical Investigation. Journal of Management Information Systems, 23(2) p. 267-294.
Bravo, E. R., Santana, M. and Rodon, J., 2015. Information systems and performance: the role of technology, the task and the individual. Behaviour and Information Technology, 34(3), p. 247-260.
Brown, M.W. and Cudeck, R., 1993. Alternative ways of assessing model fit Testing structural equation models. Thousand Oaks, CA: Sage Publications, p. 136-162.
Brynjolfsson, E. and Hitt, L.M. 1996. Paradox Lost? Firm-level Evidence on the Returns to Information Systems Spending, Management Science, 42(4), p. 541-558.
Bui, Q.N., Hansen, S., Liu, M. and Tu, Q.J., 2018. The productivity paradox in health information technology. Communications of the ACM, 61(10), p. 78-85.
Chand, D., Hachey, G., Hunton, J., Owhoso, V., and Vasudevan, S., 2005. A Balanced Scorecard Based Framework for Assessing the Strategic Impacts of ERP Systems. Computers in industry, 56(6), p. 558-572.
Chang, J.C.J. and King, W.R., 2005. Measuring the Performance of Information Systems: A Functional Scorecard. Journal of
Management Information, 22(1), p. 85-115. Chen, Y., Wang, Y., Nevo, S., Benitez-Amado, J. and Kou, G., 2015. IT capabilities and product innovation performance: The
roles of corporate entrepreneurship and competitive intensity. Information and Management, 52(6), p. 643-657. Chin, W.W. and Lee, M.K.O., 2000. On the formation of end user computing satisfaction: a proposed model and
measurement instrument. 21st International Conference on Information Systems, Brisbane, Australia, p. 553-563. Churchill, G.A., 1979. A Paradigm for Developing Better Measures of Marketing Constructs. Journal of Marketing Research,
16(1), p. 64-73. DeLone, W.H. and McLean, E.R., 1992. Information Systems Success: The Quest for the Dependent Variable. Information
Systems Research, 3(1) p. 60-95. DeLone, W.H. and McLean, E.R., 2003. The DeLone and McLean Model of Information Systems Success: a Ten-Year Update.
Journal of Management Information Systems, 19(4), p. 9-30. DeLone, W.H. and McLean, E.R. 2004. Measuring e-commerce success: Applying the DeLone and McLean information
systems success model. International Journal of electronic commerce, 9(1), p. 31-47. DeLone, W.H. and McLean, E.R., 2016. Information Systems Success Measurement. Foundations and Trends in Information
Systems, 2(1), p. 1-116. DWゲ G;ヴWデゲが Vくが P;ケ┌Wヴラデが Mく ;ミS “┌W┌ヴが Iくが ヲヰヰΓく Lげ;ヮヮヴラIエW ヴWノ;デキラミミWノノW S;ミゲ ノWゲ H;ミケ┌Wゲが マ┞デエWゲ ラ┌ ヴY;ノキデY ? RW┗┌W
Fヴ;ミN;キゲW SW GWゲデキラミ, 191, p. 123-138.

Sylvie Michel, Aurélia Michaud-Trévinal and François Cocula
www.ejise.com 109 ISSN 1566-6379
Doll W.J., Koufteros X. and Torkzadeh G., 2005. Confirmatory Factor Analysis and Factorial Invariance of the Impact of Information Technology Instrument. Omega, 33(2), p. 107-118.
Drnevich, P. L. and Croson, D. C. 2013. Information technology and business-level strategy: toward an integrated theoretical perspective. MIS Quarterly, p. 483-509.
Ebrahimi, M., Hassanzadeh, A., Elahi, S. and Ebrahimi, M., 2013. The Relationship Between Information Systems Strategic Management Based on Balanced Scorecard and Information Systems Performance. International Journal of Business
Administration, 4 (4), p. 35. Ein-Dor, P. and Segev, E., 1978. Organizational Context and the Success of Management Information Systems,
Management Science, 24(10), p. 1064-1077. Epstein, M. J. and Rejc, A., 2005. How to Measure and Improve the Value of IT. Strategic Finance, 87(4), p. 34. Evrard, Y., Pras, B., Roux, E., Desmet, P., Dussaix, A.M. and Lilien, G. L., 2009. Market-Fondements et méthodes des
recherches en marketing, Paris, Dunod, 3 éd. Fang, M. and Lin, F., 2006. Measuring the Performance of ERP System from The Balanced Scorecard Perspective. Journal of
American Academy of Business, 10(1), p. 256-263. Finn, A. and Wang, L., 2014. Formative vs. Reflective Leasures: Facets of Variation, Journal of Business Research. 67(1), p.
2821-2826. Gable, G. G., Sedera, D. and Chan, T., 2008. Re-conceptualizing information system success: The IS-impact measurement
model. Journal of the association for information systems, 9(7), p. 18. Goodhue, D.L. and Thompson, R.L., 1995. Task-technology fit and individual performance. MIS Quarterly, 19(2), p. 213-236. Grover, V. and Davenport T.H., 2001. General perspectives on knowledge management: Fostering a research agenda.
Journal of Management Information Systems. 18(1), p. 5-21. Henderson, J. C. and Venkatraman, H. 1999. Strategic alignment: Leveraging information technology for transforming
organizations. IBM systems journal, 38(2.3), p. 472-484. Hou, C.K., 2016. Using the balanced scorecard in assessing the impact of BI system usage on organizational performance:
Aミ WマヮキヴキI;ノ ゲデ┌S┞ ラa T;キ┘;ミげゲ ゲWマキIラミS┌Iデラヴ キミS┌ゲデヴ┞く Information Development, 32(5), p. 1545-1569. Hsu, J.S.C., Shih, S.P., Chiang, J.C. and Liu, J.Y. C. 2012. The impact of transactive memory systems on IS development
デW;マゲげ IララヴSキミ;デキラミが Iラママ┌ミキI;デキラミが ;ミS ヮWヴaラヴマ;ミIWく International Journal of Project Management, 30(3), p. 329-340.
Ives, B. and Learmonth, G. 1984. The Information System as a Competitive Weapon, Communications of the ACM, 27(12), p. 1193-1201.
Jones, M. C. and Beatty, R. C., 2002. User satisfaction with EDI: an empirical investigation. In Advanced Topics. Information
Resources Management, 1 p. 204-222. Jöreskog, K.G., 1971. Statistical Analyses of Sets of Congeneric Tests. Psychometrika, 36, p. 109-133. Kaplan, R. and Norton, D., 1992. The Balanced Scorecard: Measures that Drive Performance. Harvard Business Review,
70(1) p. 71-79. Kim, J., Suh E. and Hwang H., 2003. A model for evaluating the effectiveness of CRM using the Balanced Scorecard. Journal
of interactive Marketing, 17 (2), p. 5-19. Laumer, S., Maier, C. and Weitzel, T., 2017. Information quality, user satisfaction, and the manifestation of workarounds: a
qualitative and quantitative study of enterprise content management system users. European Journal of Information
Systems, 26(4), p. 333-360. Lawson-Body, A., Willoughby, L., Lawson-Body, L. and Logossah, K., 2017. Developing and validating a cultural user
satisfaction instrument in developing Countries. Journal of Computer Information Systems, 57(4), p. 319-329. Lee, A. H., Chen, W. C. and Chang, C. J., 2008. A fuzzy AHP and BSC approach for evaluating performance of IT department
in the manufacturing industry in Taiwan. Expert systems with applications, 34(1), p. 96-107. LWWが Nく ;ミS HララノW┞が Gくが ヲヰヰヵく TエW E┗ラノ┌デキラミ ラa げCノ;ゲゲキI;ノ M┞デエラノラェ┞げ Wキデエキミ M;ヴニWデキミェ MW;ゲ┌ヴW DW┗WノラヮマWミデく European
Journal of Marketing, 39 (3/4), p. 365-385. Lee, S., Park, S.B. and Lim, G.G., 2013. Using Balanced Scorecards for the Evaluation of Software-as-a-Service. Information
and Management, 50(7), p. 553-561. Lucas, H.C. Jr., 1975. Performance and the Use of Information System. Management Science, 21(8), p. 908-919. MacKenzie, S., 2003. The Danger of Poor Construct Conceptualization. Journal of the Academy of Marketing Science, 31(3),
p. 323-326. MacKenzie, S., Podsakoff, P. and Podsakoff, N., 2011. Construct Measurement and Validation Procedures in MIS and
Behavioral Research: Integrating New and Existing Techniques. MIS Quarterly, 35 (2) p. 293-334. Mahmood, M. A., Burn, J. M., Gemoets, L. A., and Jacquez, C., 2000. Variables affecting information technology end-user
satisfaction: a meta-analysis of the empirical literature. International Journal of Human-Computer Studies, 52(4), p. 751-771.
Markus, M.L and Soh, C., 1993. P. Banking on Information Technology : Converting IT Spending into firm Performance, in Strategic Information Technology Management, Banker R.D., Kauffman R.J. and Mahmood M. (Eds.), Idea Group Publishing, Harrisburg, p. 375-403.
Martinsons, M. and Davison, R., 1999. The Balanced Scorecard: a Foundation for the Strategic Management of Information Systems. Decision Support Systems, 25(1), p. 71-87.
Michel, S. and Cocula, F., 2014a. AS;ヮデ;デキラミ ;┌ Sラマ;キミW H;ミI;キヴW S┌ マラSXノW SげY┗;ノ┌;デキラミ S┌ ゲ┌IIXゲ SWゲ ゲ┞ゲデXマWゲ Sげキミaラヴマ;デキラミ I““M SW DWLラミW Wデ MILW;ミく S┞ゲデXマW SげIミaラヴマ;デキラミ M;ミ;ェWマWミデが 19(1), p. 7-49.

The Electronic Journal of Information Systems Evaluation Volume 22 Issue 2 2019
www.ejise.com 110 ©ACPIL
Michel, S. and Cocula, F., 2014b. Relations entre les variables dW ケ┌;ノキデYゲ S┌ ゲ┞ゲデXマW Sげキミaラヴマ;デキラミ S;ミゲ ノWゲ ゲWIデW┌ヴゲ < エ;┌デW キミデWミゲキデY キミaラヴマ;デキラミミWノノW ぎ ノW I;ゲ S┌ “I SW aヴラミデ ラaaキIW S┌ ゲWIデW┌ヴ H;ミI;キヴW aヴ;ミN;キゲ ». ヱΒXマW Iラノノラケ┌W SW ノげAIM, Aix en Provence.
MキIエWノが “く ;ミS CラI┌ノ;が Fくが ヲヰヱヴIく LげY┗;ノ┌;デキラミ SWゲ ゲ┞ゲデXマWゲ Sげキミaラヴマ;デキラミ ぎ ┌ミ Yデ;デ SW ノげ;ヴデく Revue Management and Avenir,
74, p. 33-51. Milis, K. and Mercken, R., 2004. The Use of the Balanced Scorecard for the Evaluation of Information and Communication
Technology Projects. International Journal of Project Management, 22, p. 87-97. Mirani, R. and Lederer, A., 1998. An Instrument for Assessing the Organizational Benefits of IS Projects. Decision Sciences,
29(4), p. 803-838. Motwani, B. and Sharma, R. K., 2016. A Study on the Effect of Enterprise Resource Planning (ERP) on People of an
Organization. Journal of Technology Management for Growing Economies, 7(1), p. 73-84. Murphy, K.E. and Simon, S.J., 2002. Intangible benefits valuation in ERP projects. Information Systems Journal, 12 (4), p.
301-320. P;Sキミエ;が Bく ;ミS OげNWキノノが Hくが ヲヰヱヶく Iミaラヴマ;デキラミ ゲ┞ゲデWマゲ SWゲキェミ ;ミS UゲWヴ “;デキゲa;Iデキラミぎ A H;ミニキミェ I;ゲW ゲデ┌S┞く Atas da
Conferência da Associação Portuguesa de Sistemas de Informação, 15 (5), p. 17-35. Parsons, G.L. 1983. Information Technology: a New Weapon. Sloan Management Review, 25(1), p. 3-13. Pashkevich, N. and Haftor, D., 2014. IT-driven productivity at the individual level: Complementarities matter. In The 8th
European Conference on IS Management and Evaluation, University of Ghent, Belgium, p. 380-383. Petter, S., DeLone, W.H. and McLean, E.R., 2012. The past, present, and the future of IS Success. Journal of the Association
for Information Systems, 13(5), p. 341-362. Petter, S., DeLone, W.H. and McLean, E.R., 2013. Information Systems Success: The Quest for the Independent Variables.
Journal of Management Information Systems, 29(4), p. 7-62. Porter, M.E. and Millar, V., 1985. How Information Gives You Competitive Advantage. Harvard Business Review, 63(4),
p.149-160. Retour, D., Dubois, M. and Bobillier-Chaumon, M.E., 2006. Les professionnels de la banque le cas des chargés de clientèle
bancaire. Revue Française de Gestion, (168/169), p. 205-220. Rosemann, M. and Vessey, I., 2008. Toward improving the relevance of information systems research to practice: the role
of applicability checks. MIS Quarterly, 32(1), p. 1-22. Rosemann, M. and Wieses, J., 1999. Measuring the Performance of ERP Software-a Balanced Scorecard Approach. AMR
Research. Salzberger, T. and Koller, M., 2013. Towards a New Paradigm of Measurement in Marketing. Journal of Business Research,
66(9), p. 1307-1317. Scott, M., DeLone, W.H., Golden, W. and McLean, E.R., 2015. IS success 2.0: an extension and redefinition of the DeLone
and McLean IS Success Model. Working paper.
Sedera, D., Eden, R. and McLean, E., 2013. Are we there yet? A step closer to theorizing information systems success. Thirty
Fourth International Conference on Information Systems, Milan 2013.
Sedera, D., Gable, G., and Chan, T., 2004. Measuring enterprise systems success: The importance of a multiple stakeholder perspective. ECIS 2004 Proceedings, 100.
Sethi, V. and King, W.R., 1994. Development of Measures to Assess the Extent to Which an Information Technology Application Provides Competitive Advantage, Management Science, 40(12) , p. 1601-1627.
Shao, Z., 2019. Interaction effect of strategic leadership behaviors and organizational culture on IS-Business strategic alignment and Enterprise Systems assimilation. International Journal of Information Management, 44, p. 96-108.
Strassman, P.A., 1997. Computers Have Yet to Make Companies More Productive, Computersword, 31 (37), p. 92-92. Summers, J.O., 2001. Guidelines for Conducting Research and Publishing in Marketing: from Conceptualization through the
Review Process. Journal of the Academy of Marketing, American Marketing Association, 29(4), p. 405-415. Sun, J. and Teng, J.T. 2017. The construct of information systems use benefits: Theoretical explication of its underlying
dimensions and the development of a measurement scale. International Journal of Information Management, 37(5), p. 400-416.
Torkzadeh, G. and Doll, W.J., 1999. The Development of a Tool for Measuring the Perceived Impact of Information Technology on Work. Omega - The International Journal of Management Science, 27(3), p. 327-339.
Turner, J., 1985. Organizational Performance, Size and the Use of Data Processing Ressources, Working paper (58), Center for Research in Information System, New York University.
Ul-Ain, N., Vaia, G. and DeLone, W.H., 2019, January. Business intelligence system adoption, utilization and success-A systematic literature review. In Proceedings of the 52nd Hawaii International Conference on System Sciences.
Vaezi, R., Mills, A., Chin, W. and Zafar, H., 2016. User Satisfaction Research in Information Systems: Historical Roots and Approaches. Communications of the Association for Information Systems, 38(27), p. 501-532.
Van Grembergen, W.R., Saull, R. and. De Haes S., 2003. Linking the IT Balanced Scorecard to the Business Objectives at a Major Canadian Financial Group. Journal of Information Technology Cases and Applications, 5(1), p. 23-50.
Wu, L. and Chen, J.L., 2014. A stage-based diffusion of IT innovation and the BSC performance impact: A moderator of technologyにorganizationにenvironment. Technological Forecasting and Social Change, 88, p. 76-90.

Sylvie Michel, Aurélia Michaud-Trévinal and François Cocula
www.ejise.com 111 ISSN 1566-6379
Appendix A
Sample frame, Bank X, first data collection Profession Number percentage
Reception 113 19,8
Account officer for private customers
190 33,3
Account officer for professional customers
133 23,3
Account officer for wealth management
34 5,9
Agency Manager 101 17,7
TOTAL 571 100
Sample frame, Bank Y, second data collection Profession Number percentage
Account officer 183 33,3
Account officer (for private or professionals individuals)
220 40
Account officer for wealth management 20 3,63
Agency Manager and head of branch 127 23,1
TOTAL 550 100
Appendix B: Results of Anova for the variable さヮラゲキデキラミ エWノSざ
Average of variables of the SI success model by position held
POSITION HELD Net Impacts
Turnover Mean Average 3,1965
N 142
standard deviation ,64845
Head of the
branch
Mean Average 3,5540
N 50
standard deviation ,57613
Total Mean Average 3,2896
N 192
standard deviation ,64831
One-way ANOVA Analysis: Position held on Net Impacts
Levene’s Test ANOVA
One-way ANOVA Position held / Net Impacts F p. F P
POSITION HELD NET IMPACTS 3,099 0,080 11,887 0,001
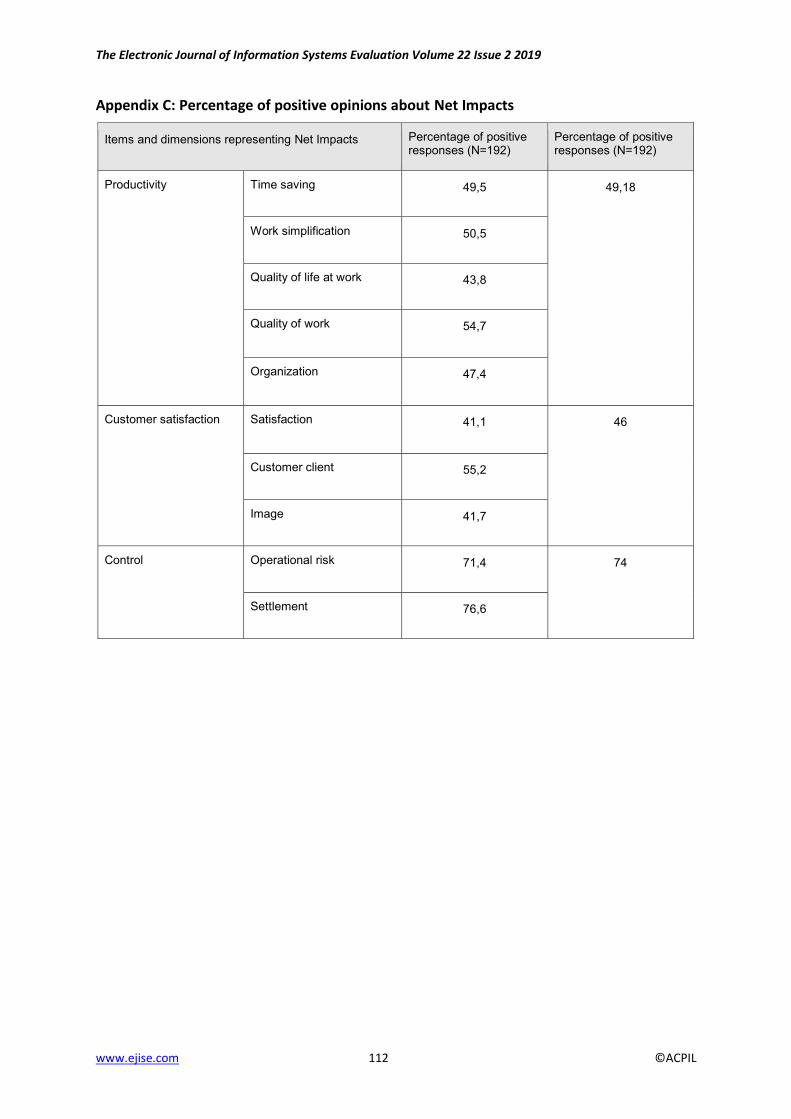
The Electronic Journal of Information Systems Evaluation Volume 22 Issue 2 2019
www.ejise.com 112 ©ACPIL
Appendix C: Percentage of positive opinions about Net Impacts
Items and dimensions representing Net Impacts Percentage of positive responses (N=192)
Percentage of positive responses (N=192)
Productivity Time saving 49,5 49,18
Work simplification 50,5
Quality of life at work 43,8
Quality of work 54,7
Organization 47,4
Customer satisfaction Satisfaction 41,1 46
Customer client 55,2
Image 41,7
Control Operational risk 71,4 74
Settlement 76,6

ISSN 1566-6379 113 ©ACPIL
Reference this paper: Kademeteme, E., and Twinomurinzi, H., 2019. A Structural Equation Model for the Evaluation of the Switching Costs of Information Communication Technology in SMEs. The Electronic Journal of
Information Systems Evaluation, 22(2), pp. 113-127, available online at www.ejise.com
A Structural Equation Model for the Evaluation of the Switching Costs of Information Communication Technology in SMEs
Edzai Kademeteme and Hossana Twinomurinzi
School of Computing, University of South Africa, UNISA Science Campus, Florida Park, Roodepoort,
South Africa
[email protected] [email protected] DOI: 10.34190/EJISE.19.22.2.004 Abstract: Most evaluation methods for purchasing newer and enticing information and communication technology (ICT) in organisations are based on financial models, or are premised on the presumption that the new ICT is not replacing an existing ICT. However, the availability and constant proliferation of more powerful and functional ICT in most organisations today means that the models may need to recognise already existing ICTs in use. There is therefore a need for such a tool that can assist decision makers, particularly in Small to Medium Enterprises (SMEs). Using the Information Systems Success Model as the base model, the study developed a conceptual framework using financial and non-financial models. Data collected from 222 SME owners using an online survey was analysed using Structural Equation Modelling (SEM). The key findings suggest that the psychological views of SME owners and the performance of the existing ICTs are important in the evaluation of existing ICTs. The study found that some features of the existing ICTs and SME surroundings do not matter, but the contentment of the SME owner with the existing ICTs does. This study is expected to assist SME owners with the creation of a handy tool to evaluate existing ICTs before considering newer enticing ICTs. The study recommends that SME owners should not base their decisions to continue using the existing ICTs on their personal experiences only. Future research, however, should consider other factors which may be relevant in the evaluation of existing ICTs. Keywords: Information and Communication Technology, evaluation, Small to medium enterprises, information system, financial models, Structural Equation Modelling, adoption, decision making, decision maker.
1. Introduction
Changes in information and communication technology (ICT) innovations have become a norm. Some of the changes are crucial as they cater for addressing new business challenges and enhancing productivity even at the national level (Xiao et al., 2013). It is important therefore, that organisations are articulate in how best they can incorporate the changes that ICT innovations bring. Given the ever-faster pace at which ICT innovations are evolving, organisations are enticed to make decisions to adopt the innovations, or to upgrade their systems, to merge the changes, or to neglect the changes and continue using the existing ICT. These options have sometimes left decision makers in organisations frustrated, as they have a critical decision to make. This paper is centered on Small and Medium Enterprises (SMEs) in South Africa. The pace at which ICTs are innovating has an influence on SMEs in their effort to remain competitive. SMEs could have benefitted if there existed a tool or framework that could assist SME owners who are usually the overall decision makers, in making an informed decision when they are at the verge of switching from an existing ICT to adopt an emerging ICT. Therefore, this papersげ objective is to develop a framework that can assist SME owners in the evaluation of an existing ICT before adopting and switching to an emerging ICT. Literature suggests that most organisations use financial models such as Return on Investment (ROI), Account Rate of Return (ARR), Payback Period (PBK), Net Present Value (NPV), Internal Rate of Return (IRR) and Real Option Value (ROV) to evaluate the value of an ICT investment (Chaysin et al., 2016). On the other hand, others have used non-financial models such as Updated Information Systems Success Model (ISSM), Theory of Planned Behavior (TPB), Technology Acceptance Model (TAM) and Unified Theory of Acceptance and Use of Technology (UTAUT). With the ISSM model as the base model, the paper therefore, reviewed the popular financial and non-financial models in order to come up with an integrated framework that can assist SME owners in the evaluation of existing ICT before switching to an emerging ICT. Specifically, the paper sought to answer the following primary research question; what is an appropriate tool that can be used by South African SMEs to evaluate existing ICTs before adopting new enticing ICTs?

The Electronic Journal of Information Systems Evaluation Volume 22 Issue 2 2019
www.ejise.com 114 ©ACPIL
The rest of the paper is organised as follows: The next section presents a discussion of the related theories. It is followed by the research methodology. The next section presents the analysis, findings and results. The final section offers inferences, conclusion and areas for further research.
2. Related theoretical background
The study reviewed both financial and non-financial models. For the non-financial models, it reviewed the updated Information Systems Success Model (ISSM) developed by DeLone and McLean (DeLone and McLean, 2002). ISSM was adopted as the base model because literature has shown that this model has been successfully and prominently used in the area of ICT evaluation (Bernroider, 2008, Gable et al., 2008, McGill et al., 2003, Petter et al., 2008, Petter and McLean, 2009, Wang and Liao, 2008). The ISSM model was supported by the following theories; Theory of Planned Behavior (TPB) developed by Ajzen (1991), Technology Acceptance Model (TAM) developed by Davis (1989) and Unified Theory of Acceptance and Use of Technology (UTAUT) developed by Venkatesh et al. (2003). These models were reviewed in order to gather the non-financial factors that would assist in the evaluation of the non-financial value of an ICT. The financial value of existing ICTs was considered using the following models Return on Investment (ROI), Account Rate of Return (ARR), Payback Period (PBK), Net Present Value (NPV), Internal Rate of Return (IRR) and Real Option Value (ROV). These models were considered because literature suggests them as the most common and popular financial evaluation models (Chaysin et al., 2016). The reviewed financial and non-financial factors were then triangulated into an integrated technology evaluation model. The following section details the review of non-financial and financial factors respectively.
2.1 Non-financial Models
The updated ISSM states that, information, system and service quality, (intention to) use and users (SME Owner in this study) satisfaction are the predictors of net benefits of using ICT (Delone and McLean, 2003). If one has to evaluate the success of an ICT then information, system, and service quality are the characteristics that affect subsequent use or intention to use and SME Owner satisfaction which in turn results with positive or negative benefits which will recursively determine further use of the ICT. It is imperative to note that, the ISSM focuses more on the exploration of the user satisfaction (by measuring information and service quality) and the system performance (by measuring system) but is silent on other important factors such as environmental, technological characteristics, social, and financial factors. According to Lyytinen and Ngwenyama (1992), many ICT applications エ;┗W aラI┌ゲWS ラミ デエW キミSキ┗キS┌;ノげゲ デ;ゲニ ヮヴラS┌Iデキ┗キデ┞ ┘エキノW underestimating the importance of the social context and this has led to inappropriate application designs, difficulty of use, and outright failure of many systems. Therefore, this paper puts the social and environmental context of ICT use into consideration. Furthermore, Orlikowski and Iacono (2001) noted that IS researchers have treated ICT as a single, stable, discrete, independent, standalone and fixed investment. This has caused organisations to replace the whole existing ICT when it is not the whole ICT artefact that should be replaced but rather one or two components that make up that ICT. Bidgoli (2011) Acknowledges and identifies that an ICT is not necessarily a single and discrete technology but it consists of various components such as; people, data, information, hardware, software, database and network. Therefore, this paper will address the system factor in ISSM as composed of the aforementioned components which will be measured independently. It is important to note that, the ultimate decider of whether an existing ICT is still valuable or not is the day-to-day user of the ICT; hence it is vital to investigate the SME Owner perceptions on the evaluation of the existing ICT. Cronje (1990) and Geisler (1999), puts it that understanding technology by its existence alone is impossible, but only within the context of its use by people, organisations, and society. ICT is not defined and evaluated by what it is, but by its actual and potential users (Cronje, 1990, Geisler, 1999). Evaluation of existing ICT thus depends on the characteristics of the SME Owners amongst other factors. To gather the SME owner perceptions, the study reviewed the TAM, TPB and UTAUT.

Edzai Kademeteme and Hossana Twinomurinzi
www.ejise.com 115 ISSN 1566-6379
2.1.1 Unified Theory of Acceptance and Use of Technology
TPB, TAM and UTAUT were developed to measure subsequent usage of an IS being driven by user intentions or perceptions towards the IS. UTAUT was developed by Venkatesh et al. (2003) through a review and consolidation of eight models that earlier research had employed to explain IS usage behavior. UTAUT reviewed the following theories; theory of reasoned action, technology acceptance model, motivational model, theory of planned behavior, a combined theory of planned behavior/technology acceptance model, model of PC utilization, innovation diffusion theory, and social cognitive theory. The purpose was to point out similarities of various factors in these models and then consolidate them into a single detailed model. In order to avoid repetition of work that has been over researched, the consideration of UTAUT model in this study implicitly recognizes the other eight models that were consolidated into the UTAUT model, since it intended to get rid of the short falls in each of the eight models by adopting the strength of each model into a single unified model. Therefore, this paper will not review explicitly the TPB and TAM. Conclusively, UTAUT summarized the eight models into four direct determinates (performance expectancy, effort expectancy, social influence, and facilitating conditions) of ICT usage intention and behaviour.
Figure 1: Unified Theory of Acceptance and Use Technology (UTAUT) (Venkatesh et al., 2003)
The eight models were distilled into four direct determinates (effort expectancy, performance expectancy, facilitating conditions and social influence) of ICT usage intention and behaviour. Diagrammatically, UTAUT model is shown in figure 1. The consideration of the UTAUT model as a potential base model to inform this study implicitly recognises the eight models consolidated into the UTAUT model. The final model intended to eliminate the short falls in each of the eight models by adopting the strength of each model into a single unified model. Originally, the UTAUT model was developed for the purpose of explaining user intentions to use and subsequent technology usage behaviour (Venkatesh et al., 2003). Several research studies (Alwahaishi and Snásel, 2013, Foon and Fah, 2011, Im et al., 2011, Maillet et al., 2015, Oliveira et al., 2014, Oye et al., 2014, Pardamean and Susanto, 2012, Tan, 2013, Yu, 2012, Zhou et al., 2010) エ;┗W ┌ゲWS UTAUT デラ W┝ヮノ;キミ ┌ゲWヴゲげ acceptance, adoption and use of ICT. Other studies (Roca et al., 2006, Zhou, 2011) have used it to investigate the effectiveness of ICTs by investigating the continual usage of ICTs. Although the measure of ICT effectiveness is closely related to evaluation of ICTs, its value does not imply evaluation of ICTs. Just like TAM, UTAUT was developed to measure the adoption, use and acceptance of emerging ICTs. Factors like effort and performance expectancy thus refer to user expectations regarding the system which is to be adopted. However, when dealing with a system that users have already experienced, these expectations HWIラマW ヴW;ノキデ┞ ;ミS ┌ゲWヴゲげ W┝ヮWヴキWミIWく WW デエ┌ゲ デヴ┞ デラ SWaキミW デエW Iラミゲデヴ┌Iデゲ ラa UTAUT as they were originally defined by Venkatesh et al. (2003). The study then goes a step further by re-defining these same constructs in the context of this research. Towards the evaluation of existing ICTs, the constructs of UTAUT may be explained as follows:
The Electronic Journal of Information Systems Evaluation Volume 22 Issue 2 2019
www.ejise.com 116 ©ACPIL
1. Social influence is the degree to which an individual perceives that other significant people believe
he/she should use the existing ICTs (Venkatesh et al., 2003). Previous studies (Ajzen, 1991) even though referred social influence as subjective norm they defined it as the perceptions that an individual possess with regards to what other people important to them think of their behavior. These two definitions agree. The opinion of any given significant other is weighted by the motivation that an individual must comply with the wishes of that significant other. Hence, overall subjective norms can be expressed as the sum of the individual perceptions and motivational assessments for all relevant significant others. This is justified by Park et al. (2007) who advocated that the effect of subjective norms is noticeable in mandatory settings (influenced at organisational ノW┗Wノぶ ┘エWヴW ラデエWヴ ヮWラヮノWげゲ ラヮキミキラミゲ マ;デデWヴ マラヴW デラ デエW キミW┝ヮWヴキWミIWS デエ;ミ キミ ┗ラノ┌ミデ;ヴ┞ ゲWデデキミェゲ (influenced at individual level). Mandatory settings place social pressure on an individual to follow specific guidelines. In voluntary settings one can decide what is needed. Later studies referred to the subjective norm as social Influence (Bandura, 1986, Park et al., 2007, Venkatesh et al., 2003) and social factors (Thompson et al., 1991). In this study subjective norm, or social influence, will be referred to as social factors.
Regarding this study, the perceptions of the significant other on the evaluation of existing ICTs must be considered. It is important to note that the perceptions held by the significant other do not directly influence the evaluation of existing ICTs. They do, however, exert influence through the perceptions held by individuals. The current study hypothesises that social factors will influence user behaviour which will then impact on the evaluation of ICTs.
2. Effort Expectancy as defined by Venkatesh et al. (2003) is the degree of ease of use of the system. In TAM Effort expectancy is explained as perceived ease of use (Davis, 1989). It is a pre-condition which measures the degree of anticipation an SME owner exhibits before he/she uses a system. This study purposes to investigate the effort that SME owners have experienced with the existing ICTs. Therefore, in relation to this study, effort expectancy is going to be termed effort experience as it purposes to investigate the degree of ease of use experienced in using the existing system. In this ヴWェ;ヴSが Waaラヴデ W┝ヮWヴキWミIW キゲ ヴWノ;デWS デラ “ME ラ┘ミWヴゲげ ゲWノa-evaluation of how stress-free and easy it is to complete tasks with the use of existing ICTs. Generally, SME owners are attracted to ICTs which they have experience of and which consequently requires less effort to use. The effort experience construct relates to the complexity of the ICTs. The more complex the ICTs are, the more effort the SME owner must exert to accomplish a task.
However, it is important to note that any system requires substantial effort to navigate in its early stages of adoption. However, as the user increasingly interacts with the ICTs, the time and effort required by the SME owner becomes less. The study theorises that the more experience the SME owner has with using the ICT, the less effort he/she requires to use the system. This theory is driven by the fact that, as experience increases, the SME owner becomes increasingly familiar with which avenues and short cuts to access or request help and support within the organisation concerning the ICT (Venkatesh et al., 2003) ;ゲ ┘Wノノ ;ゲ デエW ラヴェ;ミキゲ;デキラミげゲ デヴWミSゲ and tendencies of adopting emerging ICTs or evaluating existing ICTs.
3. Performance Expectancy as defined by Venkatesh et al. (2003) is the degree to which a user believes that using the system will help him/her achieve better job performance. Other studies have referred to performance expectancy as usefulness and job-fit (Thompson et al., 1991), while Davis (1989) referred to performance expectancy as perceived usefulness. Performance expectancy is a pre-condition as it measures the anticipated performance of the SME owner before he/she uses, or experiences, the system. This study purposes to investigate ICTs that are already being used. Therefore, performance expectancy will be termed performance experience, as it intends to investigate the opinions of SME owners as far as their performance experienced with the system is concerned. Performance experience is the degree to which an SME owner has experienced in his/her job using the existing ICTs. Performance experience will have an impact on behaviour and attitude towards existing ICTs.
4. Facilitating conditions according to Venkatesh et al. (2003) is the degree to which an individual
believes that technical and organisational infrastructure exist to support the use of existing ICTs. In

Edzai Kademeteme and Hossana Twinomurinzi
www.ejise.com 117 ISSN 1566-6379
their study, Venkatesh et al. (2003) hypothesised, tested and found, that facilitating conditions will not have an influence on behavioural intention when effort expectancy and performance expectancy are present. They empirically concluded that facilitating conditions will have a direct impact on ICT usage. Based on the definition by Venkatesh et al. (2003), facilitating conditions thus relate to the characteristics of the organisation which are termed organisational factors in this study. In this study we hypothesise, that organisational factors will directly influence evaluation of existing ICTs.
According to Cronje (1990), ICT in its totality consists of: technology, organisation, people and society, as well as all the relationships between these elements. Optimisation of the total system therefore implies the optimisation of the whole ICT and not its individual elements (Cronje, 1990). Thus there is need to consider the whole ICT artefact in the evaluation process. Therefore, apart from social context (social factors) and people (individual factors) this study will further investigate the impact of organisational factors on the evaluation of existing ICTs. Organisational factors play an important role on the evaluation of ICTs as they exert pressure on one another which leads to the creation of a competitive, turbulent environment (Teece et al., 1997, Wang and Ahmed, 2007). These pressures are thus exerted on the day to day users of ICTs. The environment in which the organisation operates moderates organisational factors. Therefore, the study hypothesises that: H1: Social factors will impact on behavioural Intention to continue using existing ICTs. H2: Effort experience will impact on behavioural Intention to continue using existing ICTs. H3: Performance experience will impact on behavioural Intention to continue using existing ICTs. H4: Organisational factors will directly influence evaluation of existing ICTs.
2.1.2 DeLone and McLean Information Systems success model
The information systems success model was initially developed by DeLone and McLean (1992) for the purpose of measuring IS success. Immediately after its development, IS researchers (Jiang et al., 2002, Pitt et al., 1995, Seddon, 1997) began proposing modifications to this model. Ten years later Delone and McLean (2003) embraced some of the changes suggested by the aforementioned researchers and consequently updated their old model to the Updated DeLone and McLean IS Success Model (ISSM). They responded by adding service quality and expanding the use construct to use and intention to use ISSM states that service, system, information and quality, (intention to) use and SME owner satisfaction are the predictors of net benefits of using ICTs. The researchers further argue that if one must evaluate the success of ICTs then service, system, information and quality are the characteristics that affect its subsequent use, or intention to use. SME owner satisfaction, in turn, results in positive or negative benefits which will determine further use of the ICTs. DeLone and McLean (2002) and Delone and McLean (2003) came up with ISSM after a review of the existing definitions of IS success and their corresponding measures. This led to a categorisation of these measures into the aforementioned predictors of net benefits (Delone and McLean, 2003) instead of individual and organisational impact (DeLone and McLean, 1992). Figure 2 summarises the ISSM. ISSM focuses on the exploration of user satisfaction (by measuring information and service quality) and the system performance (by measuring system) but does not comment on other important facets such as environmental and social factors. According to Lyytinen and Ngwenyama (1992), many ICT applications have ┌ミSWヴWゲデキマ;デWS デエW ゲキェミキaキI;ミIW ラa ゲラIキ;ノ IラミデW┝デ ┘エキノW aラI┌ゲキミェ マラヴW ラミ デエW キミSキ┗キS┌;ノげゲ デ;ゲニ ヮヴラS┌Iデキ┗キデ┞く This has led to unfitting application designs, user difficulties and the absolute failure of many systems. ISSM is not exclusive to this conundrum as it measures IS success in terms of SME owner satisfaction while explicitly neglecting other components of an information system (IS) such as hardware, software, network and social context. The framework lacks some crucial factors that influence the effective evaluation of ICTs. The current research study sought to address this gap through its investigation of environmental, technological characteristics, social and financial factors that may influence the evaluation of ICTs.

The Electronic Journal of Information Systems Evaluation Volume 22 Issue 2 2019
www.ejise.com 118 ©ACPIL
Figure 2: Updated DeLone and McLean IS success model (ISSM) (Delone and McLean, 2003)
The ultimate indicator as to whether ICTs are still valuable lies with the day-to-day user. It is thus vital to in┗Wゲデキェ;デW デエW “ME ラ┘ミWヴげゲ ヮWヴIWヮデキラミゲ ヴWェ;ヴSキミェ デエW W┗;ノ┌;デキラミ ラa W┝キゲデキミェ ICTゲく Geisler (1999) and Cronje (1990) posit that technology needs to be viewed within the context of its use by people, organisations and society and that it is thus impossible to understand technology in isolation. Evaluation of existing ICTs thus depends on the characteristics of SME owners, amongst other factors. This supports one of the sub-objectives ラa デエキゲ ゲデ┌S┞ ミ;マWノ┞ キミIラヴヮラヴ;デキミェ デエW “ME ラ┘ミWヴげゲ ヮWヴIWヮデキラミゲ ;ミS Iエ;ヴ;IデWヴキゲデキIゲ キミ デエW W┗;ノ┌;デキラミ ヮヴラIWゲゲく DeLone and McLean (2002) and Delone and McLean (2003) measured IS success based on the level of user satisfaction. User satisfaction is a derivative of information, system, service quality and intention to use (DeLone and McLean, 2002, Delone and McLean, 2003). Many research studies (Ajzen, 1991, Davis, 1989, Venkatesh et al., 2003) have been conducted as to the nature of user satisfaction. These studies measured user behaviour as a precursor to the continued use of an IS. Ajzen (1991) asserted that individual behavior or actions (continued use of an existing ICT) is determined by intentions to act and, in turn, intentions to act were determined by an individual's attitude towards the action, the subjective norms surrounding the action and the individual's perception of the ease with which the action or behaviour can be performed. Venkatesh et al. (2003) enhanced the models by Ajzen (1991) and Davis (1989) and also asserted that behaviour intention is predicted by social factors, effort expectancy and performance expectancy. The researchers (Ajzen, 1991, Davis, 1989, Davis, 1993, Venkatesh et al., 2003) were measuring behaviour which may be equated to adoption, usage or acceptance. However, other researchers (Bokhari, 2005, Cheah et al., 2014, Cornacchia et al., 2008, Kalema, 2013, Ling et al., 2011, Nirban, 2014, Noorman et al., 2007, Trimmer et al., 2008) have manipulated the dependent variable and equated it to IS effectiveness or effective usage. In their study Delone and McLean (2003) defined their model metrics as:
1. System quality describes the characteristics or features of an IS. Examples of system quality attributes are: system flexibility, ease of use, response times, ease of learning, flexibility, system reliability and sophistication.
2. Information quality describes the characteristics or features of the system outputs (processed data) such as dashboards or reports. Examples of attributes under information quality are: timeliness, completeness, currency, accuracy, relevance, conciseness, understandability and usability.
3. Service quality describes the quality of the support that users receive from the IT support personnel or ICT department. Examples of attributes under this construct are: technical competence, responsiveness, empathy of the personnel staff, reliability and accuracy. In this study service quality will be termed organisational factors.
4. Intention to use ICTs refer to the attitudes toward the ICTs (DeLone and McLean, 2002). Intention to use ICTs influence the behaviour of the individual towards the ICTs (Davis, 1989, Davis, 1993, Venkatesh and Morris, 2000, Venkatesh et al., 2003). The behaviour of an individual is considered an act such as actual ICT usage, ICT acceptance and ICT adoption (Davis, 1989, Davis, 1993, Venkatesh and Davis, 2000, Venkatesh et al., 2003). These intentions will determine continual usage of the system.

Edzai Kademeteme and Hossana Twinomurinzi
www.ejise.com 119 ISSN 1566-6379
5. System use refers to the manner and degree in which end users utilise the capabilities of an IS. Examples of attributes that measure this construct are: nature of use, extent of use, amount of use, appropriateness of use, frequency of use and purpose of use. Intention to use is an attitude whilst use designates a behaviour (DeLone and McLean, 2002). Behavioural intentions to use predict the actual behaviour of a user (Ajzen, 1991, Davis, 1989, Davis, 1993, Venkatesh and Davis, 2000, Venkatesh et al., 2003). In the case of investigating existing ICTs already in use, behavioural intention to use becomes behavioural intention to continue using. Therefore behavioural intention to continue using will influence SME owner satisfaction and ICT evaluation.
6. UゲWヴ ゲ;デキゲa;Iデキラミ ヴWノ;デWゲ デラ ノW┗Wノ ラa ┌ゲWヴゲげ ゲ;デキゲa;Iデキラミ ┘キデエ デエW キミaラヴマ;デキラミ ふラ┌デヮ┌デぶ aヴラマ デエW I“く User satisfaction and behavioural intention to continue using have a cause and effect relationship (Delone and McLean, 2003). SME owner satisfaction will determine the evaluation of existing ICTs.
7. Net benefits measures the success of nations, industries, organisations, groups and individuals as conveyed by an IS. Examples of such benefits include: improved competitive advantage, cost reductions, improved productivity, creation of jobs, consumer welfare, increased sales, improved profits, better decision making, market efficiency and economic development.
Based on definitions of the ISSM metrics, as well as the way in which they have been applied by researchers, this study proposes that system quality and information quality describe the technological characteristics. This proposition is reinforced in a study conducted by Orlikowski and Iacono (2001) in which they advocate that the ICT artefact be theorised. Their study observed that IS researchers failed to appreciate and acknowledge the ICT artefact in their studies. They noted that the ICT artefact tends to disappear from view, is often taken for granted or is presumed to be without a hitch once it has been built and installed. This observation suggests that IS studies have not explored ICT components independently but that they have conceptualised these artefacts as relatively independent, discrete, stable and fixed (Orlikowski and Iacono, 2001). The ICT artefact is made up of various components including hardware, software, databases, information and network components (Bidgoli, 2011). Organisations might believe that they need to replace the whole ICT artefact when adopting emerging ICT when, in actual fact, only the network is slow or a virus has affected the software component of the artefact. In such a scenario, it is more viable to replace the faulty component than replace the entire ICT artefact. Therefore, it is important to identify the precise problem with the existing ICTs before replacing it with new enticing ICTs. Such a thorough investigation (evaluation) will eventually lead to an informed decision. This study will therefore expand the system quality metric of the ISSM into the various components which make up an ICT: namely hardware, software, database, information, network and cloud computing. Together with information quality, these metrics describe the technological characteristics of the existing ICTs being studied. Service quality describes the role an organisation plays in supporting the use of the existing ICTs. Service quality will be incorporated into organisational factors. Therefore, this study hypothesises the following for existing ICTs: H5: Technological characteristics will influence effort experience. H6: Technological characteristics will influence performance experience. H7: Effort experience will impact on user satisfaction. H8: Performance experience will impact on user satisfaction. H9: Behavioural intention to continue using existing ICTs will influence user satisfaction. H10: Behavioural intention to continue using the existing ICTs will influence evaluation of existing ICTs. H11: User satisfaction will influence behavioural intention to continue using existing ICTs. H12: User satisfaction will influence evaluation of existing ICTs.
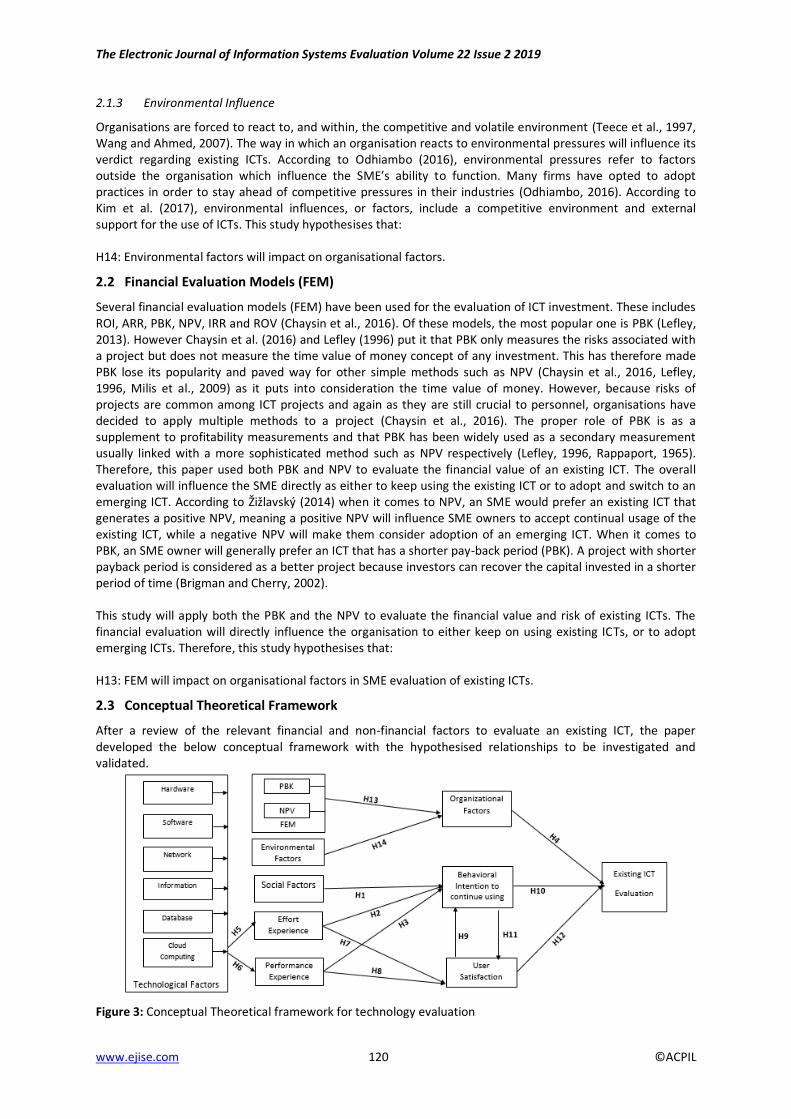
The Electronic Journal of Information Systems Evaluation Volume 22 Issue 2 2019
www.ejise.com 120 ©ACPIL
2.1.3 Environmental Influence
Organisations are forced to react to, and within, the competitive and volatile environment (Teece et al., 1997, Wang and Ahmed, 2007). The way in which an organisation reacts to environmental pressures will influence its verdict regarding existing ICTs. According to Odhiambo (2016), environmental pressures refer to factors ラ┌デゲキSW デエW ラヴェ;ミキゲ;デキラミ ┘エキIエ キミaノ┌WミIW デエW “MEげゲ ;Hキノキデ┞ デo function. Many firms have opted to adopt practices in order to stay ahead of competitive pressures in their industries (Odhiambo, 2016). According to Kim et al. (2017), environmental influences, or factors, include a competitive environment and external support for the use of ICTs. This study hypothesises that: H14: Environmental factors will impact on organisational factors.
2.2 Financial Evaluation Models (FEM)
Several financial evaluation models (FEM) have been used for the evaluation of ICT investment. These includes ROI, ARR, PBK, NPV, IRR and ROV (Chaysin et al., 2016). Of these models, the most popular one is PBK (Lefley, 2013). However Chaysin et al. (2016) and Lefley (1996) put it that PBK only measures the risks associated with a project but does not measure the time value of money concept of any investment. This has therefore made PBK lose its popularity and paved way for other simple methods such as NPV (Chaysin et al., 2016, Lefley, 1996, Milis et al., 2009) as it puts into consideration the time value of money. However, because risks of projects are common among ICT projects and again as they are still crucial to personnel, organisations have decided to apply multiple methods to a project (Chaysin et al., 2016). The proper role of PBK is as a supplement to profitability measurements and that PBK has been widely used as a secondary measurement usually linked with a more sophisticated method such as NPV respectively (Lefley, 1996, Rappaport, 1965). Therefore, this paper used both PBK and NPV to evaluate the financial value of an existing ICT. The overall evaluation will influence the SME directly as either to keep using the existing ICT or to adopt and switch to an emerging ICT. According to Žキ┥ノ;┗ゲニ┠ (2014) when it comes to NPV, an SME would prefer an existing ICT that generates a positive NPV, meaning a positive NPV will influence SME owners to accept continual usage of the existing ICT, while a negative NPV will make them consider adoption of an emerging ICT. When it comes to PBK, an SME owner will generally prefer an ICT that has a shorter pay-back period (PBK). A project with shorter payback period is considered as a better project because investors can recover the capital invested in a shorter period of time (Brigman and Cherry, 2002). This study will apply both the PBK and the NPV to evaluate the financial value and risk of existing ICTs. The financial evaluation will directly influence the organisation to either keep on using existing ICTs, or to adopt emerging ICTs. Therefore, this study hypothesises that: H13: FEM will impact on organisational factors in SME evaluation of existing ICTs.
2.3 Conceptual Theoretical Framework
After a review of the relevant financial and non-financial factors to evaluate an existing ICT, the paper developed the below conceptual framework with the hypothesised relationships to be investigated and validated.
Figure 3: Conceptual Theoretical framework for technology evaluation

Edzai Kademeteme and Hossana Twinomurinzi
www.ejise.com 121 ISSN 1566-6379
3. Methods
Due to the difficulty in getting in touch with SME owners to administer the survey the study resorted to using an online survey closed-ended questionnaire developed using Google forms. The questions included in the questionnaire were adopted and operationalised from previous research studies (especially the ones reviewed). The questions were adopted from ISSM, UTAUT and financial model studies. The researcher only rephrased them to suit the current study. The online survey questionnaire was made available to clients via
this link さ(Online Survey Questionnaire)ざく A positivism philosophy and research instrument used for data
collection paved way to the use of quantitative data analysis method. Therefore, the study collected data from 300 SME Owners whose SMEs are operating in South Africa regardless of their trade channel or line of business. Of the collected data, the study used 222 questionnaires as the rest were not usable giving a usable rate of 98.3% out of the 226 who had agreed to the consent to participate in the study. The 222 questionnaires were analysed using SPSS and AMOS software. SPSS was used to extract the reliability of the research instrument as well as for each construct. AMOS was used to conduct Structural Equation Modelling (SEM) in order to validate the developed model. The study followed the stages suggested by Hair (2006) when conducting SEM which are; developing measurement models, testing and assessing the measurement models for validity with the collected data, developing of the structure model, assessing structural model validity and finally extracting path values to assess supported and unsupported hypothesis.
4. Results
After sequentially following the stages suggested by Hair (2006) and after the structural model was found fit, the relationships that existed between constructs were then analysed, the study extracted both the refined measurement model and path values from AMOS. Figure 4 and table 1 below details the results.
Figure 4: Refined Structural Model for evaluation of an existing Technology

The Electronic Journal of Information Systems Evaluation Volume 22 Issue 2 2019
www.ejise.com 122 ©ACPIL
Table 1: Extracted Path values and summary of the Standardized Significance Levels of Constructs
Hypothesis Path Estimate S.E. C.R. P Comment
H1 BI <--- SF -.358 .170 -2.107 .035 Hypothesis accepted
H2 BI <--- EE -1.246 .818 -1.523 .128 Hypothesis rejected
H3 BI <--- PE .181 .080 2.269 .023 Hypothesis accepted
H4 OE <--- OF .175 1.240 .141 .888 Hypothesis rejected
H5a EE <--- Hw .334 .054 6.226 *** Hypothesis accepted
H5b EE <--- Sw -.045 .074 -.605 .545 Hypothesis rejected
H5c EE <--- Nw .005 .044 .123 .902 Hypothesis rejected
H5d EE <--- Inf 1.035 .215 4.820 *** Hypothesis accepted
H5e EE <--- Db .017 .028 .624 .533 Hypothesis rejected
H5f EE <--- Cc -.319 .237 -1.345 .179 Hypothesis rejected
H6a PE <--- Hw 1.058 .047 22.737 *** Hypothesis accepted
H6b PE <--- Sw -.025 .012 -2.008 .045 Hypothesis accepted
H6c PE <--- Nw .002 .013 .124 .901 Hypothesis rejected
H6d PE <--- Inf .050 .020 2.549 .011 Hypothesis accepted
H6e PE <--- Db -.001 .004 -.153 .878 Hypothesis rejected
H6f PE <--- Cc -.003 .031 -.095 .924 Hypothesis rejected
H7 US <--- EE .609 .259 2.354 .019 Hypothesis accepted
H8 US <--- PE .181 .080 2.269 .023 Hypothesis accepted
H9 BI <--- US 5.922 2.329 2.543 .011 Hypothesis accepted
H10 OE <--- BI -.024 .044 -.560 .576 Hypothesis rejected
H11 US <--- BI -.534 .347 -1.537 .124 Hypothesis rejected
H12 OE <--- US .877 .243 3.607 *** Hypothesis accepted
H13a OF <--- PBK Not included in SEM
H13b OF <--- NPV Not included in SEM
H14 OF <--- EF -.023 .063 -.364 .716 Hypothesis rejected
According to Hair (2006) for a hypothesis to be accepted the magnitude of its critical ratio (CR) should be above 1.96 whether positive or negative, while a ヴWテWIデWS エ┞ヮラデエWゲキゲげ CR ┗;ノ┌W is below 1.96. Results shown in Table 1 indicate that a good number of the suggested hypotheses (H1, H3, H5a, H5d, H6a, H6b, H6, H7, H8, H9 and H12) were accepted. This is so because their CR values were above ± 1.96; their values being-2.107, 2.269, 6.226, 4.820, 22.737, -2.008, 2.549, 2.354, 2.269, 2.543 and 3.607 respectively. On the other hand, hypotheses H2, H4, H5b, H5c, H5e, H5f, H6c, H6e, H6f, H10, H11, H13a, H13b and H14 were rejected because their CR values were below the threshold of ±1.96. Their values were -1.523, 0.141, -0.605, 0.123, 0.624, -1.345, 0.124, -0.153, -0.095, -0.560, -1.537 and -0.364 respectively, except for H13a and H13b. Hypothesis H13a and H13b were not included in SEM analysis due to violation of SEM assumptions and requirements. The NPV values were computed in monetary form, meaning the scale for NPV was different from the scale used for the other non-financial constructs that were based on the 5-Likert scale, therefore the study made an attempt to convert NPV and PBK to have the same scale as the rest of the constructs. In that endeavour because NPV could take two possible values negative NPV and positive NPV, the study decided to convert NPV into a dichotomous variable where by 1 would represent negative NPV and 2 would represent

Edzai Kademeteme and Hossana Twinomurinzi
www.ejise.com 123 ISSN 1566-6379
positive NPV. However, the NPV values for this study were all positive hence were coded with a value of 2. This shows that after recoding to a dichotomous variable the two possible values were not well and evenly represented as 2 had 100% representation while the option 1 had 0% representation. This is a challenge as noted by Hair (2006) and Kline (2004) that there is always a problem in conducting SEM when one group is over represented than the other due to imbalance of groups. Therefore, NPV was not included in SEM analysis. Due to the decision not to include NPV in SEM, it became difficult to include PBK even though PBK as a construct met all the assumptions for SEM. This is because ultimately the construct FEM would have one observable variable which is PBK since NPV was excluded. For a latent variable to be included in confirmatory analysis its observable variables should be at least two, otherwise three and more are preferable (Ding et al., 1995, Hair, 2006, Kline, 2004). Therefore, FEM could not be included in confirmatory analysis as it was left with a single observable variable (PBK). After excluding the unsupported hypothesis a final model for evaluation of an existing ICT was developed. Figure 5 below summarises the final research model.
Figure 5: Modified ICT evaluation model (TEM)
5. Discussion and contributions of findings
Davis (1989), Mathieson (1991) and Lu et al. (2005) noted that when adoption of technology is voluntary social influences exert no direct impact on intention. It is imperative to note that that an SME owner has the power to either continue using the existing ICTs or to adopt new emerging ICTs. The continual usage of existing ICTs is thus voluntary and not mandatory. The SME owner, however, has no superior to gate his/her usage and thus his/her choice would be voluntary from the beginning to the end of the project life cycle. SME owners should thus consult with significant others to ascertain whether their existing ICTs are still useful, or not. Hence, when the user has no superior, the environment is always voluntary and social factors always play part. This study thus concluded that even in voluntary settings, social factors are an important role player during the evaluation of existing ICTs; the only difference is the circumstances, or type of user. The implication of this result is that SME owners should consult with significant others, who have been using the same ICTs as the ones they are currently using, to ascertain whether they should continue using the ICTs or whether they should adopt emerging ICTs. This will allow them to gain useful insights as to the worth of their existing ICTs. The implications of this result is that SME owners should not base their decisions to continue using the existing ICTs on the effort experiences they have acquired. The experiences may deceive them to believe that the upcoming ICTs are better than the existing or vice versa. Therefore, the performance of existing ICTs matters more than how much users know about existing ICTs. However, the satisfaction of an SME owner as far as the amount of effort they expend on the existing ICTs is important in its evaluation. SME owners would prefer ICTs that require less effort to use. When it comes to the performance experienced by the SME owners in using the existing ICTs, their experience will determine their behavioural intention to continue using the existing ICTs as well as their satisfaction with the existing ICTs. Once SMEs are satisfied and intend to keep using the existing ICTs, they are likely not to consider the emerging ICTs.
The Electronic Journal of Information Systems Evaluation Volume 22 Issue 2 2019
www.ejise.com 124 ©ACPIL
ICT characteristics such as hardware, software and information were found to indirectly influence satisfaction and intentions to continue using the existing ICTs. They had a direct influence on performance experienced and effort experienced. This implies that, when SME owners are considering a switch between existing and emerging ICTs, there is no need to consider, the network infrastructure, databases and cloud computing facilities, rather the most important characteristics are hardware, software and information. This result found out that, external and internal forces referred to as environmental and organisational factors in this study do not influence the decision of an SME owner to adopt emerging ICTs or keep using existing ICTs. This result concur with the social influence result obtained that, SME owners are the sole decision makers in the road to switch between emerging and existing ICTs and hence external and internal influences are not salient. Therefore, factors such as existence of technical and organisational infrastructure and competitive pressure are not important to SME owners. Financial evaluation models were not conclusive as they failed to meet some SEM assumptions. Therefore, this study makes a contribution to SEM studies that during the preliminary stages of a study there is need to consider as many construct items as possible that surpasses the minimum of two suggested by literature. This will accommodate for elimination of invalid items to fit the model thereby allowing for each construct item to have two or more items. This study could therefore have started with six financial models and then stream them down to as little as two. The concept of ICT evaluation is not new, however the tools that have been used by various stakeholders were not sufficient. It is paramount to note that the literature regarding the evaluation of existing ICTs within SMEs is still scarce and limited. A large portion of writings surveyed apart from ICTs centered on other technological uses, acceptance, adoptions and evaluations in other environments. The literature was then contextualised to existing ICT evaluation in South African SMEs environment. The study has thus contributed to the IS body of knowledge by scoping a literature body specific to the evaluation of existing ICTs within SMEs in South Africa. Therefore, this literature could be used as a reference and starting point by IS researchers when conducting ICT evaluation studies in SMEs of other countries, or in non-SME environments. This study thus significantly contributes to the IS body of knowledge. The study has contributed to new knowledge by developing an empirical model which can be used to study the evaluation of existing ICTs in SMEs, and other environments. Finally, the study has added to the very limited body of literature on ICT evaluation. This research study was done within the South African SME environment. Hence, it is expected that the model developed will be used by South African SMEs in pursuing the evaluation of their existing ICTs before adopting any emerging ICTs. The same developed model could also assist SMEs in other countries to evaluate their existing ICTs. Other organisations (non-SMEs) can also use this model as a baseline to contextualise the evaluation of existing ICTs in their organisations. If this model is used by SMEs, it will likely help SME owners in making informed decisions as far as the evaluation of existing ICTs and adoption of emerging ICTs is concerned. As this model assists SMEs in the evaluation of existing ICTs it will, in turn, aid them in ensuring that they use the right ICTs at the right time. It thus enables them to evaluate whether the existing ICTs are useful or it might advise them to adopt emerging ICTs.
6. Conclusions and future research
TエW ヮ;ヮWヴげゲ ラHテWIデキ┗W ┘;ゲ to develop a structural model for the evaluation of an existing ICT before adopting and switching to an emerging ICT. The paper started by reviewing from literature, the financial and non-financial factors that could be considered when evaluating an existing ICT. The identified factors were developed into an integrated conceptual framework represented in figure 3 that informed this study. Data was collected and analysed using structural equation model. Figure 5 shows the final refined structural model after achieving model fitness. Extracted path values showed that, the factors to consider in the final model for evaluation of existing ICT are; technological factors like hardware, information, software, social factors, performance experience, effort experience, behavioural intention to continue using and user satisfaction are the factors to consider when evaluating an existing ICT, while technological factors like Network, database, cloud computing, organisational factors and environmental factors are not important to include when

Edzai Kademeteme and Hossana Twinomurinzi
www.ejise.com 125 ISSN 1566-6379
evaluating existing ICT. The financial factors (NPV and PBK), were not conclusive as they were not included in SEM analysis. Future research should consider doing a longitudinal study that allows more time for collection of data from a large number of SME Owners unlike 222 used in this study which others can classify as a small sample with respect to the total population of SME owners. More data might pave way for having an almost equal number of positive and negative NPV, thereby making NPV usable as a factor in SEM. Furthermore, even though literature suggested the use of two financial models, this is not good practice for SEM studies as more observable variables are recommended for good results in SEM than two. Therefore, SEM studies can use as many as four financial models. This will also address the unforeseen limitation met by this study in the case that one or two models fail to meet SEM limitations.
References
Ajzen, I., 1991. The theory of planned behavior. Organ behav hum dec 50: 179に211. Alwahaishi, S. and Snásel, V., 2013. Acceptance and use of information and communications technology: A utaut and flow
based theoretical model. Journal of Technology Management and Innovation, 8, pp. 61-73. Bandura, A., 1986. Social foundations of thought and action, NJ, Prentice-Hall, Inc. Bernroider, E. W., 2008. It governance for enterprise resource planning supported by the deloneにmclean model of
information systems success. Information & Management, 45, pp. 257-269. Bidgoli, H., 2011. MIS
2, United States of America, Cengage Learning.
Bokhari, R. H., 2005. The relationship between system usage and user satisfaction: A meta-analysis. Journal of Enterprise
Information Management, 18, pp. 211-234. Brigman, S. and Cherry, K. E., 2002. Age and skilled performance: Contributions of working memory and processing speed.
Brain and Cognition, 50, pp. 242-256. Chaysin, P., Daengdej, J. and Tangjitprom, N., 2016. Survey on available methods to evaluate it investment. Electronic
Journal Information Systems Evaluation Volume, 19, pp. 71-82. Cheah, P. K., Yap, Y. O., Unnithan, P., Moses, P., Diong, F. W. and Er, P. H. Factors leading to technology non-use in
education: Validation of reversed-utaut (r-utaut). Proceedings of the International Conference on e-Learning, 2014. pp. 39-44.
Cornacchia, M., Papa, F., Livi, S., Sapio, B., Nicolò, E. and Bruno, G. Factors affecting the usage of t-government services - an exploratory study. ICE-B 2008, 2008. pp. 315-322.
Cronje, J., 1990. Implications for teaching of a process-based research framework for information systems [Online]. Available: https://www.sites.google.com/site/johannescronje/roodeburrellmorgan [Accessed 30th May 2019.
Davis, F. D., 1989. Perceived usefulness, perceived ease of use, and user acceptance of information technology. Management Information Systems Quarterly, 13, pp. 319-340.
Davis, F. D., 1993. User acceptance of information technology: System characteristics, user perceptions and behavioral impacts. International Journal of Man-Machine Studies, 38, pp. 475-487.
DeLone, W. H. and McLean, E. R., 1992. Information systems success: The quest for the dependent variable. Information
Systems Research, 3, pp. 60-95. DeLone, W. H. and McLean, E. R. Information systems success revisited. Proceedings of the 35th Annual Hawaii
International Conference on System Sciences, 2002. IEEE, pp. 2966-2976. Delone, W. H. and McLean, E. R., 2003. The delone and mclean model of information systems success: A ten-year update.
Journal of Management Information Systems, 19, pp. 9-30. Ding, L., Velicer, W. F. and Harlow, L. L., 1995. Effects of estimation methods, number of indicators per factor, and
improper solutions on structural equation modeling fit indices. Structural Equation Modeling: A Multidisciplinary
Journal, 2, pp. 119-143. Foon, Y. S. and Fah, B. C. Y., 2011. Internet banking adoption in kuala lumpur: An application of utaut model. International
Journal of Business and Management, 6, pp. 161-167. Gable, G. G., Sedera, D. and Chan, T., 2008. Re-conceptualizing information system success: The is-impact measurement
model. Journal of the Association for Information Systems, 9, pp. 18. Geisler, E. The metrics of technology evaluation: Where we stand and where we should go from here. 24th Annual
Technology Transfer Society Meeting, 1999. pp. Hair, J. F., 2006. Multivariate data analysis, India, Pearson Education India. Im, I., Hong, S. and Kang, M. S., 2011. An international comparison of technology adoption: Testing the utaut model.
Information and Management, 48, pp. 1-8. Jiang, J. J., Klein, G. and Carr, C. L., 2002. Measuring information system service quality: Servqual from the other side.
Management Information Systems Quarterly, 26, pp. 145-166. Kalema, B. M. The role of moderating factors in erp systems usage. Third International Conference on Innovative
Computing Technology (INTECH 2013), 2013. IEEE, pp. 166-172.

The Electronic Journal of Information Systems Evaluation Volume 22 Issue 2 2019
www.ejise.com 126 ©ACPIL
Kキマが “く Hくが J;ミェが “く Yく ;ミS Y;ミェが Kく Hくが ヲヰヱΑく Aミ;ノ┞ゲキゲ ラa デエW SWデWヴマキミ;ミデゲ ラa ゲラaデ┘;ヴWど;ゲど;どゲWヴ┗キIW ;Sラヮデキラミ キミ ゲマ;ノノ businesses: Risks, benefits, and organizational and environmental factors. Journal of Small Business Management, 55, pp. 303-325.
Kline, R. B., 2004. Principles and practice of structural equation modeling (methodology in the social sciences). New York, NY: The Guilford Press.
Lefley, F., 1996. The payback method of investment appraisal: A review and synthesis. International Journal of Production
Economics, 44, pp. 207-224. Lefley, F., 2013. The appraisal of ict and non-ict capital projects: A study of the current practices of large uk organisations.
International Journal of Managing Projects in Business, 6, pp. 505-533. Ling, L. W., Downe, A. G., Ahmad, W. F. W. and Lai, T. T. Determinants of computer usage among educators: A comparison
between the utaut and tam models. 2011 National Postgraduate Conference, 2011. IEEE, pp. 1-6. Lu, J., Yao, J. E. and Yu, C. S., 2005. Personal innovativeness, social influences and adoption of wireless internet services via
mobile technology. The Journal of Strategic Information Systems, 14, pp. 245に268. Lyytinen, K. J. and Ngwenyama, O. K., 1992. What does computer support for cooperative work mean? A structurational
analysis of computer supported cooperative work. Accounting, Management and Information Technologies, 2, pp. 19-37.
Maillet, É., Mathieu, L. and Sicotte, C., 2015. Modeling factors explaining the acceptance, actual use and satisfaction of nurses using an electronic patient record in acute care settings: An extension of the utaut. International journJl of
Medical Informatics, 84, pp. 36-47. Mathieson, K., 1991. Predicting user intentions: Comparing the technology acceptance model with the theory of planned
behavior. Information Systems Research, 2, pp. 173に191. McGill, T., Hobbs, V. and Klobas, J., 2003. User developed applications and information systems success: A test of delone
and mclean's model. Information Resources Management Journal (IRMJ), 16, pp. 24-45. Milis, K., Snoeck, M. and Haesen, R. 2009. Evaluation of the applicability of investment appraisal techniques for assessing
the business value of is services. Available: Available at SSRN: https://ssrn.com/abstract=1517656 or http://dx.doi.org/10.2139/ssrn.1517656 [Accessed 30-05-2019].
Nirban, V. S. New media technology acceptance by students of undergraduate language and communication courses. 2014 IEEE International Conference on MOOC, Innovation and Technology in Education (MITE), 2014. IEEE, pp. 62-66.
Noorman, M. M., Shahriza, A. K. N. and Hussein, R., 2007. Investigating corporate intranet effectiveness: A conceptual framework. Information Management & Computer Security, 15, pp. 168-183.
Odhiambo, C. J. 2016. Response strategies adopted by public benefit organizations in kisumu county, kenya to changes in the competitive environment. Available: http://erepository.uonbi.ac.ke/bitstream/handle/11295/98997/Odhiambo_Response%20Strategies%20Adopted%20By%20Public%20Benefit%20Organizations%20In%20Kisumu%20County%2C%20Kenya%20To%20Changes%20In%20The%20Competetive%20Enviromen.pdf?sequence=1&isAllowed=y [Accessed 2017-10-10].
Oノキ┗Wキヴ;が Tくが F;ヴキ;が Mくが Tエラマ;ゲが Mく Aく ;ミS Pラヮラ┗キLが Aくが ヲヰヱヴく E┝デWミSキミェ デエW ┌ミSWヴゲデ;ミSキミェ ラa マラHキノW H;ミニキミェ ;Sラヮデキラミぎ When utaut meets ttf and itm. International Journal of Information Management, 34, pp. 689-703.
Oヴノキニラ┘ゲニキが Wく Jく ;ミS I;Iラミラが Cく “くが ヲヰヰヱく RWゲW;ヴIエ IラママWミデ;ヴ┞ぎ DWゲヮWヴ;デWノ┞ ゲWWニキミェ デエW さキデざ キミ キデ ヴWゲW;ヴIエねa call to theorizing the it artifact. Information Systems Research, 12, pp. 121-134.
Oye, N., Iahad, N. and Rahim, N. A., 2014. The history of utaut model and its impact on ict acceptance and usage by academicians. Education and Information Technologies, 19, pp. 251-270.
Pardamean, B. and Susanto, M., 2012. Assessing user acceptance toward blog technology using the utaut model. International Journal of Mathematics and Computers in Simulation, 1, pp. 203-212.
Park, J., Yang, S. and Lehto, X., 2007. Adoption of mobile technologies for chinese consumers. Journal of Electronic
Commerce Research, 8, pp. 196-206. Petter, S., DeLone, W. and McLean, E., 2008. Measuring information systems success: Models, dimensions, measures, and
interrelationships. European Journal of Information Systems, 17, pp. 236-263. Petter, S. and McLean, E. R., 2009. A meta-analytic assessment of the delone and mclean is success model: An examination
of is success at the individual level. Information and Management, 46, pp. 159-166. Pitt, L. F., Watson, R. T. and Kavan, C. B., 1995. Service quality: A measure of information systems effectiveness.
Management Information Systems Quarterly, 19, pp. 173-187. Rappaport, A., 1965. The discounted payback period. Management Services, 2, pp. 30-36. Roca, J. C., Chiu, C.-M. and Martínez, F. J., 2006. Understanding e-learning continuance intention: An extension of the
technology acceptance model. International Journal of Human-Computer Studies, 64, pp. 683-696. Seddon, P. B., 1997. A respecification and extension of the delone and mclean model of is success. Information Systems
Research, 8, pp. 240-253. Tan, P. J. Bくが ヲヰヱンく “デ┌SWミデゲげ ;Sラヮデキラミゲ ;ミS ;デデキデ┌SWゲ デラ┘;ヴSゲ WノWIデヴラミキI ヮノ;IWマWミデ デWゲデゲぎ A ┌デ;┌デ ;ミ;ノ┞ゲキゲく American
Journal of Computer Technology and Application, 1, pp. 14-23. Teece, D. J., Pisano, G. and Shuen, A., 1997. Dynamic capabilities and strategic management. Strategic Management
Journal, 18, pp. 509-533. Thompson, R. L., Higgins, C. A. and Howell, J. M., 1991. Personal computing: Toward a conceptual model of utilization.
Management Information Systems Quarterly, 15, pp. 125-143.
Edzai Kademeteme and Hossana Twinomurinzi
www.ejise.com 127 ISSN 1566-6379
Trimmer, K., Beachboard, J., Wiggins, C. and Woodhouse, W. Electronic medical records use an examination of resident physician intentions. Proceedings of the 41st Annual Hawaii International Conference on System Sciences (HICSS 2008), 2008. IEEE, pp. 249-249.
Venkatesh, V. and Davis, F. D., 2000. A theoretical extension of the technology acceptance model: Four longitudinal field studies. Management Science, 46, pp. 186-204.
Venkatesh, V. and Morris, M. G., 2000. Why don't men ever stop to ask for directions? Gender, social influence, and their role in technology acceptance and usage behavior. Management Information Systems Quarterly, 24, pp. 115-139.
Venkatesh, V., Morris, M. G., Davis, G. B. and Davis, F. D., 2003. User acceptance of information technology: Toward a unified view. Management Information Systems Quarterly, 27, pp. 425-478.
Wang, C. L. and Ahmed, P. K., 2007. Dynamic capabilities: A review and research agenda. International Journal of
Management Reviews, 9, pp. 31-51. Wang, Y.-S. and Liao, Y.-W., 2008. Assessing egovernment systems success: A validation of the delone and mclean model of
information systems success. Government Information Quarterly, 25, pp. 717-733. Xiao, X., Califf, C. B., Sarker, S. and Sarker, S., 2013. Ict innovation in emerging economies: A review of the existing
literature and a framework for future research. Journal of Information Technology, 28, pp. 264-278. Yu, C.-S., 2012. Factors affecting individuals to adopt mobile banking: Empirical evidence from the utaut model. Journal of
Electronic Commerce Research, 13, pp. 104-121. Zhou, T., 2011. Understanding mobile internet continuance usage from the perspectives of utaut and flow. Information
Development, 27, pp. 207-218. Zhou, T., Lu, Y. and Wang, B., 2010. Integrating ttf and utaut to explain mobile banking user adoption. Computers in Human
Behavior, 26, pp. 760-767. Žキ┥ノ;┗ゲニ┠が Oくが ヲヰヱヴく NWデ ヮヴWゲWミデ ┗;ノ┌W ;ヮヮヴラ;Iエぎ MWデエラS aラヴ WIラミラマキI ;ゲゲWゲゲマWミデ ラa キミミラ┗;デキラミ ヮヴラテWIデゲく Procedia-Social
and Behavioral Sciences, 156, pp. 506-512.

ISSN 1566-6379 128 ©ACPIL
Reference this paper: Cohard, P., 2019. Evaluation of Serious Game User Experience: the Role of Emotions. The
Electronic Journal of Information Systems Evaluation, 22(2), pp. 128-141, available online at www.ejise.com
Evaluation of Serious Game User Experience: the Role of Emotions
Philippe Cohard
University of Montpellier, MRM, Montpellier, France
Labex Entreprendre, Institut Montpellier Management
[email protected] DOI: 10.34190/EJISE.19.22.2.005 Abstract: Serious games are slowly becoming a part of educational systems and corporate training facilities in lots of fields such as industry, health, management, etc. Despite this, the academic knowledge on these artefacts is still limited. The research reported in this paper examined emotional implications of serious games on the user experience. This correlational research observed the relationships between factors of serious gaming and emotions. Fifty students took part in the study. The participants used a serious game on the security of an Information System and answered a structured questionnaire. The data was analysed H┞ “ヮW;ヴマ;ミげゲ IラヴヴWノ;デキラミく TエW ヴWゲ┌ノデゲ ゲエラ┘ デエ;デ デエW ケ┌;ノキデ┞ IラマヮラミWミデゲ ラa デエW multimedia system and the quality of the content of the game are correlated with emotions, satisfaction and intention to use. Moreover, they show that emotions are correlated with satisfaction, learning and success of the serious game. Satisfaction and learning play a key role in these programs. If serious game training is to have some efficiency, a deeper understanding of the factors that lead to the success of these applications is required. These factors are all levers of control that affect the perception and emotions of the user. Understanding these mechanisms could eventually lead to more effective serious games. Keywords: Serious game, emotion, learning, training, user experience, sentiment analysis
1. Introduction
Serious games are slowly becoming a part of educational systems and corporate training facilities in several fields such as industry, health, management, etc. According to Zyda (2005, p.30) "Applying games and
simulations technology to non-entertainment domains results in serious games". The objectives of serious game and gamification of learning are the improvement of learning outcomes, but the processes to achieve such gains are different (Landers, 2014). Serious games affect learning directly by implementing training content. Gamification relies more on the pre-existing knowledge of the player. So based on different approaches (Zyda, 2005, Alvarez, 2007), the serious game can be defined as: the use of the playful and the means of video games for purposes that are not entertainment and the purpose of which is learning to change personal or social behaviour such as training, marketing, recruitment, etc. Despite a keen interest in these systems, knowledge about serious games is still limited. A better understanding of the role played by the emotions in the success of the serious game could allow a more effective design of these programs. The existing systems development discussions that sometimes remains at a conventional level, could to be enriched from new dimensions. The emotional dimension, in particular, seems to play an important role and requires further investigation. This paper responds to an identified theoretical gap in respect of the implications of emotions in serious games (SGs). Based on this gap, the research question which this paper responds to is: What is the place of emotions in the experience of the user of serious game? The answer to this question will help to better understand the link between emotions and the use of serious games. The paper is structured as follows: first we present the theoretical framework and the review of the literature, then we explain the hypotheses, following a description of the implementation of the research and finally we discuss the results.
2. Theoretical framework and literature review
The literature review reveals several types of results and factors related to the serious games. We present these elements below: (1) results produced by the use of serious games, (2) factors related to the Iエ;ヴ;IデWヴキゲデキIゲ ラa デエW ヮヴラS┌Iデ さゲWヴキラ┌ゲ ェ;マWざ, (3) factors of the organizational context, (4) individual factors of the user, and (5) emotional factors. Indeed, the literature converges towards the importance of emotions felt by users.
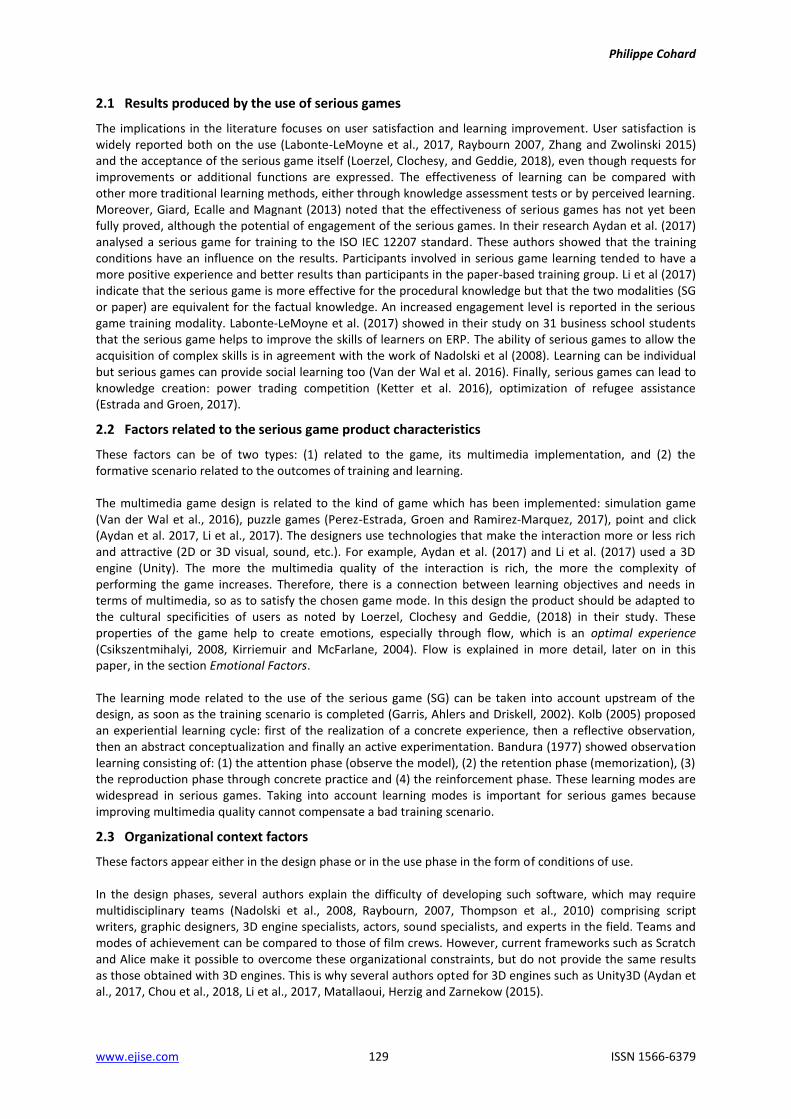
Philippe Cohard
www.ejise.com 129 ISSN 1566-6379
2.1 Results produced by the use of serious games
The implications in the literature focuses on user satisfaction and learning improvement. User satisfaction is widely reported both on the use (Labonte-LeMoyne et al., 2017, Raybourn 2007, Zhang and Zwolinski 2015) and the acceptance of the serious game itself (Loerzel, Clochesy, and Geddie, 2018), even though requests for improvements or additional functions are expressed. The effectiveness of learning can be compared with other more traditional learning methods, either through knowledge assessment tests or by perceived learning. Moreover, Giard, Ecalle and Magnant (2013) noted that the effectiveness of serious games has not yet been fully proved, although the potential of engagement of the serious games. In their research Aydan et al. (2017) analysed a serious game for training to the ISO IEC 12207 standard. These authors showed that the training conditions have an influence on the results. Participants involved in serious game learning tended to have a more positive experience and better results than participants in the paper-based training group. Li et al (2017) indicate that the serious game is more effective for the procedural knowledge but that the two modalities (SG or paper) are equivalent for the factual knowledge. An increased engagement level is reported in the serious game training modality. Labonte-LeMoyne et al. (2017) showed in their study on 31 business school students that the serious game helps to improve the skills of learners on ERP. The ability of serious games to allow the acquisition of complex skills is in agreement with the work of Nadolski et al (2008). Learning can be individual but serious games can provide social learning too (Van der Wal et al. 2016). Finally, serious games can lead to knowledge creation: power trading competition (Ketter et al. 2016), optimization of refugee assistance (Estrada and Groen, 2017).
2.2 Factors related to the serious game product characteristics
These factors can be of two types: (1) related to the game, its multimedia implementation, and (2) the formative scenario related to the outcomes of training and learning. The multimedia game design is related to the kind of game which has been implemented: simulation game (Van der Wal et al., 2016), puzzle games (Perez-Estrada, Groen and Ramirez-Marquez, 2017), point and click (Aydan et al. 2017, Li et al., 2017). The designers use technologies that make the interaction more or less rich and attractive (2D or 3D visual, sound, etc.). For example, Aydan et al. (2017) and Li et al. (2017) used a 3D engine (Unity). The more the multimedia quality of the interaction is rich, the more the complexity of performing the game increases. Therefore, there is a connection between learning objectives and needs in terms of multimedia, so as to satisfy the chosen game mode. In this design the product should be adapted to the cultural specificities of users as noted by Loerzel, Clochesy and Geddie, (2018) in their study. These properties of the game help to create emotions, especially through flow, which is an optimal experience (Csikszentmihalyi, 2008, Kirriemuir and McFarlane, 2004). Flow is explained in more detail, later on in this paper, in the section Emotional Factors. The learning mode related to the use of the serious game (SG) can be taken into account upstream of the design, as soon as the training scenario is completed (Garris, Ahlers and Driskell, 2002). Kolb (2005) proposed an experiential learning cycle: first of the realization of a concrete experience, then a reflective observation, then an abstract conceptualization and finally an active experimentation. Bandura (1977) showed observation learning consisting of: (1) the attention phase (observe the model), (2) the retention phase (memorization), (3) the reproduction phase through concrete practice and (4) the reinforcement phase. These learning modes are widespread in serious games. Taking into account learning modes is important for serious games because improving multimedia quality cannot compensate a bad training scenario.
2.3 Organizational context factors
These factors appear either in the design phase or in the use phase in the form of conditions of use. In the design phases, several authors explain the difficulty of developing such software, which may require multidisciplinary teams (Nadolski et al., 2008, Raybourn, 2007, Thompson et al., 2010) comprising script writers, graphic designers, 3D engine specialists, actors, sound specialists, and experts in the field. Teams and modes of achievement can be compared to those of film crews. However, current frameworks such as Scratch and Alice make it possible to overcome these organizational constraints, but do not provide the same results as those obtained with 3D engines. This is why several authors opted for 3D engines such as Unity3D (Aydan et al., 2017, Chou et al., 2018, Li et al., 2017, Matallaoui, Herzig and Zarnekow (2015).

The Electronic Journal of Information Systems Evaluation Volume 22 Issue 2 2019
www.ejise.com 130 ©ACPIL
The conditions of use vary according to the context: use in the workplace (Li et al., 2017, Loerzel, Clochesy and Geddie, 2018) or use in training at the university (Aydan et al., 2017, Labonte-LeMoyne et al., 2017). The influence exercised by the environments where the serious game is used can be perceived through the remarks, the wishes for improvements or the requested changes of the professionals or students.
2.4 IミSキ┗キS┌;ノ ┌ゲWヴげゲ a;Iデラヴゲ
The literature shows presuppositions about the favourable reception of serious games by the younger generations. For example, for Giard and Magnant (2013), it appears that these populations, Digital Native, NetGeneration, will be very receptive to computer-assisted learning because they spend a lot of time playing video games. In the same approach Aydan et al. (2017) used their serious game with first year engineering students. If younger generations seem more aware of the use of video games, we should nerveless consider the interest of previous generations in the discovery and use of such artefacts. Loerzel, Clochesy and Geddie (2018) showed, in this respect, the use of a serious game for the training of the elderly suffering from their treatment with chemotherapy and cancer. However, this serious game seems adapted, because these people who tend to minimize the symptoms, received the application favourably. This is in line with the work of Cohard and Marciniak (2014) on the training of the staff of nursing homes. The serious games design also makes it possible to adapt the type of learning to the learner. Experiential learning, based on Kolb (2005) or Bandura (1977) on social cognitive theory, is particularly used in serious games (Guillén-Nieto and Aleson-Carbonell, 2012, Labonte-LeMoyne et al. 2017, Van der Wal, of Kraker, Kroeze and Kirschner, 2016). Note that the profile of users of these games can be different, such as professionals, experts or beginners (Perez-Estrada, Groen and Ramirez-Marquez, 2017, Van der Wal et al., 2016, Zhang and Zwolinski, 2015). Finally, Erhel and Jamet (2013) identified intrinsic motivation and flow as important factors in learning through digital games. Flow can be achieved, in the game, through playfulness and concentration but also by the challenge it represents (Malone, 1981, Malone and Lepper, 1987) and the skill it requires (Bandura, 1977). So, taking into account user factors in the properties of the game helps to create emotions particularly through the flow.
2.5 Emotional factors
Two major streams of research coexist in the classification of emotions (Lichtlé and Plichon, 2014). The first one is called discrete perspective, the proponents of which claimed that the emotions are discrete, primary or basic and universal. The work of P. Ekman is representative of this school of thought (Ekman, 1992, 1999). The second one is the dimensional perspective, for which it was necessary to classify emotions in underlying dimensions. Russels' work, including his classification of affects, is representative of this school of thought (Feldman-Barrett and Russell 1998, Russell 1980). Emotions are frequently mentioned in serious games, especially the joy of using it (Kirriemuir and McFarlane, 2004, Labonte-LeMoyne et al., 2017, Nadolski et al., 2008), but also sometimes anxiety with the fear of being evaluated (Cohard and Marciniak, 2014), which comes the notion of valence of positive or negative emotions. Emotions are often related to flow's experience. Flow is a psychological state of pleasure and satisfaction and a feeling of control associated with a high concentration of attention on a task (Csíkszentmihalyi, 1988). Flow is linked to a high level of commitment (Sherry, 2004). De Manzano et al. (2010) showed in a study of the physiological responses of 21 pianists that flow is related to physical changes, which among other things influence heart rate and respiration. Others emotions than the flow (e.g.: fear, anger, etc.) can occur, or even disrupt the use of serious games or information systems in general. Indeed, emotions have an influence on behavior and cognition. Beaudry and Pinsonneault (2010) developed a framework that classifies emotions into four distinct types: challenge, success, loss and deterrence. This framework can be compared by some aspects to Russell's classification of affects (1980). These authors tested the direct and indirect relationships between four emotions (excitement, happiness, anger and anxiety) and the use of Information Technologies. The authors studied these relationships through a survey of 249 managers in the banking sector. Beaudry and Pinsonneault (2010) showed in their research: (1) that excitement is positively related to IT use through the task adaptation, and (2) that happiness is directly positively related to IT use, but that happiness is negatively associated with task adaptation. Indeed, Cohn et al. (2009) showed in their study of 89 students that positive emotions are a predictor of the ability to adapt to a changing environment called resilience of the Ego. Furthermore, Beaudry and Pinsonneault (2010) also showed (3) that anger is not directly related to IT use, but that it is positively

Philippe Cohard
www.ejise.com 131 ISSN 1566-6379
related to the research of social support. Finally, these authors show that (4) anxiety is negatively related to the IT use, both directly and indirectly through psychological distancing. They pointed out that anxiety was also indirectly positively related to IT use by seeking social support, offsetting the negative effect. The state of anger can be defined as a さuniversal transitory condition consisting of subjective feelings of
angerざ, the intensity and duration of which vary (Spielberger et al., In Quinn, Rollock and Vrana, 2014, p.2). This state produces a physiological reaction that increases with the intensity of the subjective feelings of anger. The state of anger is a negative feeling, related to the non-satisfaction, boredom, frustration and disgust according to Beaudry and Pinsonneault (2010), whereas anxiety is a future-oriented emotional state. Anxiety is the anticipation of a possible imminent threat, that could be more fearful than a real threat (Grupe and Nitschke, 2013). Emotions can be grouped according to their valence: positive (joy, satisfaction, pleasure and excitement, hope, arousal), or negative (anger, frustration, annoyed and anxiety, fear, worry). Finally, note that emotions in video games can be perceived as an affective loop between the expression of emotions by the player, the possible detection of emotions by the game itself, and its adaptation to the context in response to the player (Yannakakis et al., 2011). Previous investigations on emotions focused on endogenous point of view of the subject or are situated in other fields (psychology, etc.). Moreover, videogames and serious games are quite different objects. Whereas the former are for entertainment, the latter are oriented towards a serious purpose. So the relation between デエW ゲ┌HテWIデげゲ emotions and the serious game needs to be specifically investigated.
3. Hypotheses
Based on our review of the literature we have derived several hypotheses. This is to understand the correlation between the use of serious games and emotions. We postulate that ease of use has an influence on emotions, satisfaction and intention to use. Indeed, the ease of use of a system should allow the user to focus on his task as proposed by the flow theory (Csikszentmihalyi, 2008), without being disturbed by the technical problems of the system. On the opposite, a system in which use is complicated will divert the attention of the player who cannot focus on the game itself. Therefore, we propose the following hypotheses:
Correlation between ease of use and emotions
H1a: Perceived ease of use is positively correlated with achievement emotions (joy, satisfaction, pleasure)
H1b: Perceived ease of use is positively correlated with challenge emotions (excitement, hope, arousal)
H1c: Perceived ease of use is negatively correlated with loss emotions (anger, frustration, annoyed)
H1d: Perceived ease of use is negatively correlated with deterrence emotions (Anxiety, fear, worry)
The multimedia quality of the serious game enhances the immersion, which is the perception of being inside and interacting with an environment that continuously provides a stream of stimuli and experience (Witmer and Singer, 1998). This is consistent with the flow commitment (Sherry, 2004). We therefore propose the following hypotheses:
Correlation between multimedia quality and emotions
H2a: Perceived multimedia quality is positively correlated with achievement emotions (joy, satisfaction, pleasure)
H2b: Perceived multimedia quality is positively correlated with challenge emotions (excitement, hope, arousal)
H2c: Perceived multimedia quality is negatively correlated with loss emotions (anger frustration, annoyed)
H2d: Perceived multimedia quality is negatively correlated with deterrence emotions (Anxiety, fear, worry)
The existence of relations between ease of use, system quality (multimedia), satisfaction and intention to use had been shown by the work of Delone and McLean and numerous validations have confirmed this existence (Delone and McLean, 2003, Petter, Delone, and McLean, 2008). More recent work by Petter, Delone, and McLean (2013) on the independent variable of IS success has linked trust, confidence, and expectations to IS success. Following on this we proposed these hypotheses:

The Electronic Journal of Information Systems Evaluation Volume 22 Issue 2 2019
www.ejise.com 132 ©ACPIL
Correlation between ease of use and satisfaction / intention to use
H3a: Perceived ease of use is positively correlated with satisfaction
H3b: Perceived ease of use is positively correlated with intention to use
Correlation between multimedia quality and emotions / intention to use
H4a: The multimedia quality of the game is positively correlated with the satisfaction
H4b: The multimedia quality of the game is positively correlated with the intention to use
The quality of the information in the Delone and Mclean model is represented there by the quality of the game content in the serious game. The latter influences satisfaction and intention to use. Game content should therefore be correlated with the emotions felt by the users (Beaudry and Pinsonneault, 2010). Joy (Kirriemuir and McFarlane, 2004, Labonte-LeMoyne et al., 2017, Nadolski et al., 2008) and flow (Csikszentmihalyi, 2008) are frequently reported in the use of serious games. Thus a quality serious game would be likely to give rise to positive emotions to the user. In other words, a high quality system should be associated with positive emotions, great satisfaction and a strong intention to use. We therefore propose the following hypotheses:
Correlation between quality of content and emotions
H5a: The quality of game content is positively correlated with achievement emotions (joy, satisfaction, pleasure)
H5b: The quality of game content is positively correlated with challenge emotions (excitement, hope, arousal)
H5c: The quality of game content is negatively correlated with loss emotions (anger frustration, annoyed)
H5d: The quality of game content is negatively correlated with deterrence emotions (anxiety, fear, worry)
Correlation between quality of content and satisfaction/intention to use
H6 a: The quality of game content is positively correlated with satisfaction
H6 b: The quality of game content is positively correlated with the intention to use
Satisfaction is potentially influenced by the emotions of the user, particularly by joy: " Happinessねa
composite of life satisfaction, coping resources, and positive emotionsねpredicts desirable life outcomes in
many domains" (Cohn et al., 2009, p. 361). Satisfaction is a state (Labonte-LeMoyne et al., 2017, Raybourn 2007, Zhang and Zwolinski 2015), which shows that expectations are met, that desires are met. Satisfaction can influence the intention to use the serious game (Cohard and Marciniak, 2014). Satisfaction is an essential element in the success of the serious game: positive emotions towards the serious game will lead to a better satisfaction that should be associated with a greater intention to use. This is why we make the following hypotheses:
Correlations between emotions and satisfaction
H7a: Achievement emotions (joy, satisfaction, pleasure) are positively correlated to satisfaction
H7b: Challenge emotions (excitement, hope, arousal) are positively correlated to satisfaction
H7c: Loss emotions (anger frustration, annoyed) are negatively correlated to satisfaction
H7d: Deterrence emotions (anxiety, fear, worry) are negatively correlated to satisfaction
Correlation between emotion and success of the serious game
H8a: Achievement emotions (joy, satisfaction, pleasure) are positively correlated to success
H8b: Challenge emotions (excitement, hope, arousal) are positively correlated to success
H8c: Loss emotions (anger frustration, annoyed) are negatively correlated to success
H8d: Deterrence emotions (anxiety, fear, worry) are negatively correlated to success

Philippe Cohard
www.ejise.com 133 ISSN 1566-6379
Correlation between satisfaction and intention to use / success
H9 a: Satisfaction is positively correlated to the intention to use
H9 b: Satisfaction is positively correlated to the success of the serious game in general
Satisfaction and intention to use (Petter, Delone and McLean, 2008), are the factors correlated to learning and perceived utility, that we have identified. We also postulate that the overall success of serious game is influenced by emotions, satisfaction and perceived user learning. Furthermore, satisfaction and intention to use contribute to individual impact, perceived usefulness and learning. Learning has a central role in serious games. In the literature the authors (Labonte-LeMoyne et al., 2017; Van der Wal et al., 2016), often stressed experiential learning and observation as preferred modes of learning in serious games (Bandura, 1977; Kolb and Kolb, 2005). High satisfaction with the serious game should be associated with greater perceived usefulness as well as better perceived learning. Positive valence emotions (Beaudry and Pinsonneault, 2010), should allow a more favourable cognitive learning context and thus promote learning. We therefore make the following hypotheses:
Correlation between emotions and learning
H10a: Achievement emotions (joy, satisfaction, pleasure) are positively correlated to learning
H10b: Challenge emotions (excitement, hope, arousal) are positively correlated to learning
H10c: Loss emotions (anger frustration, annoyed) are negatively correlated to learning
H10d: Deterrence emotions (anxiety, fear, worry) are negatively correlated to learning
Correlation between satisfaction and perceived utility /learning
H 11 a: Satisfaction is positively correlated to perceived utility
H 11 b: Satisfaction is positively correlated to learning
Correlation between intention to use and perceived utility / learning
H 12 a: Intention to use is positively correlated to perceived utility
H 12 b: Intension to use is positively correlated to learning
The strong concern that appears throughout the literature for the analysis of the effectiveness of serious games, testifies to the importance of this parameter in the success of the serious game (Aydan et al., 2017, Giard and Magnant, 2013; Labonte-LeMoyne et al., 2017, Li et al., 2017, Van der Wal et al., 2016). This concern appears more generally in the field of training (HRM) and frequently passes through the Kirkpatrick model (1998). Given that learning is a central element it will be associated with the success of the serious game in general. We therefore make the following hypothesis:
Correlation between learning and the success of the serious game
H 13: Learning is positively correlated to the success of the serious game in general
After presenting our research hypotheses, we implement them using a structured survey (exploratory research).
4. Research Implementation
We now explain the research implementation: the study population, the use of the game, the data collection and the data analysis.

The Electronic Journal of Information Systems Evaluation Volume 22 Issue 2 2019
www.ejise.com 134 ©ACPIL
4.1 Study population
This research was conducted in a management school of a university. Respondents are third-year undergraduate and master's students in first and second year of management and entrepreneurship. The subjects were asked to answer to an online questionnaire (see Appendix 1). This research has been conducted following the ethical requirements established by the French national board of ethics.
4.2 Use of the serious game
The design of the serious game was done internally from different technologies and animation softwares. A virtual avatar explains concepts on a storytelling mode (Fig.1). Then questions appear which lead to rise to a memorization-reflection. This operating mode allows to create a dialog between the avatar and the user.
Figure 1: The serious game interface
The game is based on rule of collecting clues with which the player can answer precisely to the question. The goal is to raise questions about the security of the Information System that pushes the user to improve his score by understanding the elements and going to deepen his knowledge. Every distractor (wrong answer) gives instantly a negative feedback explaining the error. At the end of the game the final recapitulation shows every error.
4.3 Data collection
The sample size is n = 50 valid responses (out of 71 responses). The respondents have a novice level of understanding about IS security concepts. The serious game was used as follows: students are invited to use the serious game and at the end of it to answer a questionnaire. The link to the questionnaire is indicated under the score obtained by the user to encourage him to answer. The data were collected by questionnaire between 01/11/2017 and 20/02/2018. We used 5 point Likert scales, from strongly disagree to strongly agree. We paid particular attention to the anchor effect by placing the negative answers first, and to the halo bias by placing the general questions at the beginning of the questionnaire.
4.4 Data analysis
We chose to use Spearman's Rho correlation coefficient because it is less sensitive for the processing of ordinal data. Moreover, Spearman's correlation (see equation (1) below) makes it possible to detect monotonic relations (Dickinson Gibbons and Chakraborti, 2003), without presupposing on the form of the relation. ܴ ൌ ͳ െ σ మసభሺమିଵሻ (1)

Philippe Cohard
www.ejise.com 135 ISSN 1566-6379
Spearman's correlation coefficient is widely used, including in the field of game and simulation (Corbeil and Laveault 2011, Petty and Barbosa 2016, Strohhecker and Größler 2015). It should be noted that the size of the sample, if it is adapted to the treatment carried out, could also constitute a limit for subsequent analyses (PLS, etc.). An increase in the sample size will be an extension of this research. The literature review allowed us to identify possible correlations that form our hypotheses. From these we analyse the correlations obtained to see if they are empirically supported.
5. Results
The analysis reveals significant correlations at the alpha value of 0.01 or 0.05 (identified by *). Concerning the correlation matrix, we notice the link between several elements. The ease of use is positively correlated with satisfaction (0.618) and emotions of joy, satisfaction, pleasure (0.442), and moreover excitement, hope, enlightenment (0.432). The ease of use is also positively correlated with the intention of reusing the serious game later (0.355 *). For this we accept the hypotheses H1a, H1b, H3a and H3b. Note that the ease of use correlation - intention to reuse for revisions is not significant. Negative correlations expected between ease of use and loss emotions as well as deterrence emotions are not significant. We reject hypotheses H1c and H1d. The multimedia quality of the game (game multimedia quality) is positively correlated with satisfaction (0.370), emotions of excitement, hope, awakening (0.409) and emotions of joy, satisfaction, pleasure (0.315 *). It is also positively correlated with the intention of reusing the serious game later (0.343 *). This is why we accept the hypotheses H2a, H2b, H4a and H4b. Please also note that the ease of use correlation - intention to reuse for revisions is not significant. Negative correlations expected between multimedia quality and loss emotions as well as emotions are not significant. We therefore reject the hypotheses H2c and H2d. The quality of the content of the game (game content quality) is positively associated with the intention to use (0.386) including during revisions (0.359 *), to the satisfaction (0.523) and to the emotions of joy, satisfaction, pleasure (0.612) as well as excitement, hope, enlightenment (0.463). Game content quality is negatively related to emotions of disappointment, frustration and annoyance (-0.370). Therefore, we accept the hypotheses H5a, H5b, H5c, H6a and H6b. The expected negative correlation between quality of game content and the deterrence emotions is not significant. So that we reject the hypothesis H5d. The emotions of joy, satisfaction, pleasure (0.643) as well as excitement, hope, enlightenment (0.571) are positively correlated to the success of the serious game (overall score) and satisfaction (respectively 0.574 and 0.569). This leads us to accept the hypotheses H7a, H7b, H8a and H8b. Concerning the negative correlations expected in connection with the emotions, the loss emotions only are negatively related to the success (- 0.328 *). For this we accept the hypothesis H7c and reject hypotheses H7d, H8c and H8d. We notice that emotions are related to learning, joy, satisfaction, pleasure (0.403) as well as excitement, hope, enlightenment (0.377). We also note that emotions of disappointment, frustration and annoyance are negatively related to perceived utility (-0.472) and learning - attitudinal change (-0.364). So that we accept the following hypotheses H10a, H10b, H10c. The negative correlation between deterrence emotions and learning is not significant, so we reject H10d. Satisfaction is positively correlated with intention to use (0.485), perceived utility (0.552), learning (0.476), and the success of the serious game (0.580). So we accept the hypotheses H9a, H9b, H11a and H11b. The intention to use (later) is positively correlated with perceived utility (0.512) and is also related to perceived learning (0.337 *) (attitudinal 0.321 *). Hypotheses H12a and H12b are therefore accepted. Eventually, the perceived learning (0.595) (attitudinal 0.376) is positively correlated with the success of the serious game in general. Thus the hypothesis H13 is accepted. The correlation matrix is presented below (Table 1).
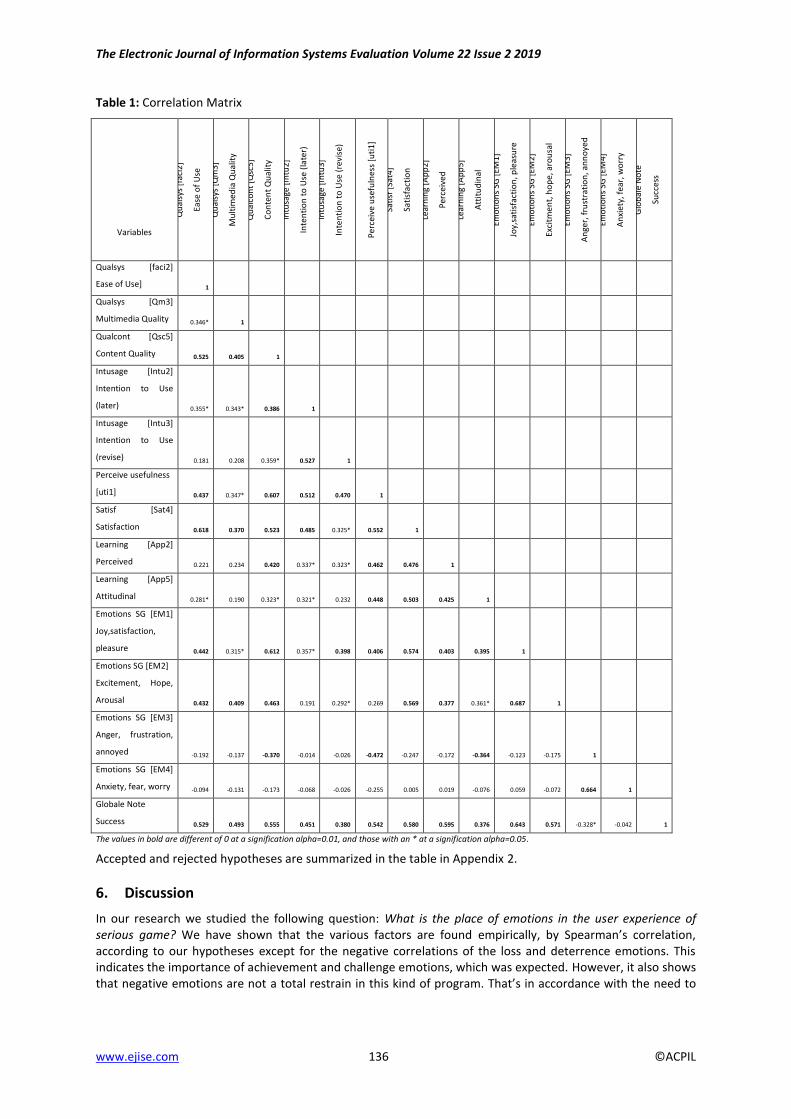
The Electronic Journal of Information Systems Evaluation Volume 22 Issue 2 2019
www.ejise.com 136 ©ACPIL
Table 1: Correlation Matrix
Variables
Qu
alsy
s [f
aci2
]
Ease
of
Use
Qu
alsy
s [Q
m3]
Mu
ltim
edia
Qu
alit
y
Qu
alco
nt
[Qsc
5]
Co
nte
nt
Qu
alit
y
Intu
sage
[In
tu2]
Inte
nti
on
to
Use
(la
ter)
Intu
sage
[In
tu3]
Inte
nti
on
to
Use
(re
vise
)
Per
ceiv
e u
sefu
lnes
s [u
ti1]
Sati
sf [
Sat4
]
Sati
sfac
tio
n
Lear
nin
g [A
pp
2]
Per
ceiv
ed
Lear
nin
g [A
pp
5]
Att
itu
din
al
Emo
tio
ns
SG [
EM1]
Joy,
sati
sfac
tio
n, p
leas
ure
Emo
tio
ns
SG [
EM2]
Exci
tmen
t, h
op
e, a
rou
sal
Emo
tio
ns
SG [
EM3]
An
ger,
fru
stra
tio
n, a
nn
oye
d
Emo
tio
ns
SG [
EM4]
An
xiet
y, f
ear,
wo
rry
Glo
bal
e N
ote
Succ
ess
Qualsys [faci2]
Ease of Use] 1
Qualsys [Qm3]
Multimedia Quality 0.346* 1
Qualcont [Qsc5]
Content Quality 0.525 0.405 1
Intusage [Intu2]
Intention to Use
(later) 0.355* 0.343* 0.386 1
Intusage [Intu3]
Intention to Use
(revise) 0.181 0.208 0.359* 0.527 1
Perceive usefulness
[uti1] 0.437 0.347* 0.607 0.512 0.470 1
Satisf [Sat4]
Satisfaction 0.618 0.370 0.523 0.485 0.325* 0.552 1
Learning [App2]
Perceived 0.221 0.234 0.420 0.337* 0.323* 0.462 0.476 1
Learning [App5]
Attitudinal 0.281* 0.190 0.323* 0.321* 0.232 0.448 0.503 0.425 1
Emotions SG [EM1]
Joy,satisfaction,
pleasure 0.442 0.315* 0.612 0.357* 0.398 0.406 0.574 0.403 0.395 1
Emotions SG [EM2]
Excitement, Hope,
Arousal 0.432 0.409 0.463 0.191 0.292* 0.269 0.569 0.377 0.361* 0.687 1
Emotions SG [EM3]
Anger, frustration,
annoyed -0.192 -0.137 -0.370 -0.014 -0.026 -0.472 -0.247 -0.172 -0.364 -0.123 -0.175 1
Emotions SG [EM4]
Anxiety, fear, worry -0.094 -0.131 -0.173 -0.068 -0.026 -0.255 0.005 0.019 -0.076 0.059 -0.072 0.664 1
Globale Note
Success 0.529 0.493 0.555 0.451 0.380 0.542 0.580 0.595 0.376 0.643 0.571 -0.328* -0.042 1
The values in bold are different of 0 at a signification alpha=0.01, and those with an * at a signification alpha=0.05.
Accepted and rejected hypotheses are summarized in the table in Appendix 2.
6. Discussion
In our research we studied the following question: What is the place of emotions in the user experience of
serious game? We have shown that the various factors are found WマヮキヴキI;ノノ┞が H┞ “ヮW;ヴマ;ミげゲ IラヴヴWノ;デキラミが according to our hypotheses except for the negative correlations of the loss and deterrence emotions. This indicates the importance of achievement and challenge emotions, which was expected. However, it also shows that negative emotions are not a total restrain in this kind of program. Tエ;デげゲ キミ ;IIラヴS;ミIW ┘キデエ デエW need to

Philippe Cohard
www.ejise.com 137 ISSN 1566-6379
live a flow experience (Csikszentmihalyi, 2008). Moreover, the flow experience is formed of several dimensions that opens up prospects for research. In this serious game a virtual avatar explains concepts in a storytelling mode, then questions appear which gives rise to a memorization-reflection. The goal is to raise questions about the security of the IS that pushes the user to improve his score by understanding the elements, changing his representations and going to deepen his knowledge. Our research shows that the use of serious game in a context of student training leads to a high level of overall success (mean of the Success ratings: 7.3 / 10, standard deviation: 1.69). This indicates that the design must take into account the user need as suggested by Norman (2013). The use of real-time 3D (Aydan et al., 2017, Li et al., 2017) is not necessary in all projects. Indeed, in this one it is unnecessary. In the sample, the age of the users of the serious game is mainly between 20 and 25. This variable is in fact controlled by the kind of respondent. Further investigations may be carried out to check the impact of age on the interest in serious games. This is a trail for future research. Moreover, learning is a key concept of the serious game, as we have shown: learning is correlated to the overall success of the serious game (H13). This is consistent with the work of the field (Labonte-LeMoyne et al., 2017, Landers 2014, Van der Wal et al., 2016). Our study confirms the influence of the multimedia quality of the game (game design), its ease of use and the quality of the content of the game (H1 to H4). But this research also shows how emotions can influence both satisfaction and success (H7 and H8). This is in correspondence with the literature on flow (Csikszentmihalyi, 2008, Kirriemuir and McFarlane, 2004) and that on emotions related to IS (Beaudry and Pinsonneault, 2010). The detected correlations between the considered variables constitute a theoretical contribution of our research. This allows to answer our research question: What is the place of emotions in the user experience of
serious game? The link between the success of the serious game and the emotions plays an important role: joy, satisfaction, and pleasure (0.403) are the mainsprings on which the serious game is based. But these are coupled with excitement, hope, enlightenment (0.377) that helps to maintain attention. This seems consistent with the work of Cohn et al. (2009), on the ability to adapt to the changing environment. Maybe these last emotions are related to the engagement of the players. Deception, frustration and annoyance are negatively linked with satisfaction and learning, which shows their deleterious side in the user experience. Yet the overcoming of the frustration of failure in the game could be likened to dimensions of the flow (achievable challenge). Everything should be done not to turn the player down by placing him in a state of anxiety. Satisfaction is an important factor produced by the use of the serious game. Note that satisfaction is positively linked to perceived usefulness, ease of use and quality of content, what is consistent with the work of Petter, Delone and McLean (2008, 2013). In the light of our results these dimensions can influence the success of the serious game via the satisfaction variable. These perceptions, through the characteristics of the game are factors of flow (Csikszentmihalyi, 2008, Kirriemuir and McFarlane, 2004). Furthermore, satisfaction is directly related to the quality of the training provided. Indeed, the evaluation model of Kirkpatrick (1998) indicated that the first level to evaluate training is the satisfaction of the learners. Other dimensions of this model could be integrated in our analyses like objective learning or organisational results which opens other avenues for the extension of this research.
7. Conclusion
This research focuses on the multiple factors of serious games and the implications of emotions in them. We have shown through a review of the literature and a statistical analysis of 50 respondents, that the quality components of the multimedia system and quality of the content of the serious game are correlated with the achievements and challenge emotions and that these emotions are correlated with satisfaction, learning and the success of the serious game. We have also shown that loss emotions such as frustration and disappointment have a negative impact on the success and the satisfaction of the serious game. All these factors that have been identified as correlated are potential control levers. They affect the perception and emotions of the user and their understanding could improve serious games. The hypotheses proposed are based on the domain literature. Statistical analysis shows the validity of certain correlations. This research improves the understanding of the implication of emotions when using serious games. Future research will be undertaken to propose a research model to show causalities between variables. This will allow to test the existence of potential moderator variables, introduce new variables of interest and understand more deeply the interactions and roles of these variables. This will help to better understand the effects of serious games

The Electronic Journal of Information Systems Evaluation Volume 22 Issue 2 2019
www.ejise.com 138 ©ACPIL
on the user. These new variables can relate to the characteristics of the game or the user himself. In future research, we should also test this serious game in a professional environment.
References
Alvarez, J., 2007. Du jeu vidéo au Serious Game, Approches culturelle, pragmatique et formelle. PhD. University of Toulouse.
Aydan, U., Yilmaz, M., Clarke, P., and OげCラミミラヴが Rくが ヲヰヱΑ. Teaching ISO/IEC 12207 software lifecycle processes: a serious
game approach. Computer Standards and Interfaces, 54(1), pp.129̻138.
Bandura, A., 1977. Self-efficacity: toward a unifying theory of behavioral change. Psychological Review, 84(2), pp.191̻215.
Beaudry, A., and Pinsonneault, A., 2010. The other side of acceptance: studying the direct and indirect effects of emotions
on information technology use. MIS Quarterly, 34(4), pp.689̻710.
Chou, C.C., Jeng, A.P., Chu, C.P., Chang, C.H. and Wang, R.G., 2018. Generation and visualization of earthquake drill scripts for first responders using ontology and serious game platforms, Advanced Engineering Informatics, 38(1), pp.
538̻554. Cohard, P., and Marciniak, R., 2014. Nursing homes as a case for assessing Serious Games. “┞ゲデXマWゲ Sげキミaラヴマ;デキラミ et
management, 19(3), pp.69̻96.
Cohn, M. A., Fredrickson, B. L., Brown, S. L., Mikels, J. A., and Conway, A. M., 2009. Happiness unpacked: positive emotions
increase life satisfaction by building resilience. Emotion, 9(3), pp.361̻368.
Corbeil, P., and Laveault, D., 2011. Validity of a simulation game as a method for history teaching. Simulation and Gaming,
42(4), pp.462̻475. Csíkszentmihalyi, M., 1988. Optimal experience: psychological studies of flow in consciousness. Cambridge: Cambridge
University Press. Csikszentmihalyi, M., 2008. Flow, the psychology of optimal experience. New York: First Harper Perennial modern classic. de Manzano, Ö., Theorell, T., Harmat, L., and Ullén, F., 2010. The psychophysiology of flow during piano playing. Emotion,
10(3), pp.301̻311. Delone, W., and McLean, E., 2003. The DeLone and McLean model of information systems Success: a ten-year update.
Journal of Management Information Systems, 19(4), pp.9̻30.
Dickinson Gibbons, J., and Chakraborti, S., 2003. Nonparametric statistical inference. New York: Marcel Dekker .
Ekman, P., 1992. An argument for basic emotions. Cognition and Emotion, 1(6), pp.169̻200. Ekman, P., 1999. Basic emotions. In T. Dalgleish and M. Power, ed. 1999, Handbook of cognition and emotion. Chichester:
Wiley. pp.45̻60. Erhel, S., and Jamet, E., 2013. Digital game-based learning: impact of instructions and feedback on motivation and learning
effectiveness. Computer and Education, 67(1), pp.156̻167. Feldman-Barrett, L., and Russell, J.,1998. Independence and bipolarity in the structure of affect. Journal of Personality and
Social Psychology, 74(1), pp.967̻984. Garris, R., Ahlers, R., and Driskell, J. E., 2002. Games, motivation, and learning: a research and practice model. Simulation
and Gaming, 33(4), pp.441̻467.
Giard, C., and Magnant, A., 2013. Serious games as new educational tools: how effective are they? A meta-analysis of
recent studies. Journal of Computer Assisted Learning, 29(1), pp.207̻219.
Grupe, W., and Nitschke, J., 2013. Uncertainty and anticipation in anxiety: an integrated neurobiological and psychological
perspective. Nature Reviews Neuroscience, 7(1), pp.488̻501. Guillén-Nieto, V., and Aleson-Carbonell, M., 2012. Serious games and leaヴミキミェ WaaWIデキ┗WミWゲゲぎ TエW I;ゲW ラa Iデげゲ ; DW;ノぁ
Computers and Education, 58(1), pp.435̻448. Ketter, W., Peters, M., Collins, J., and Gupta, A., 2016. A multiagent competitive gaming platform to address societal
challenges. MIS Quarterly, 40(2), pp.447. Kirkpatrick, D. L., 1998. Evaluating training programs, the four levels. San Francisco: Berrett-Koehler Publishers. Kirriemuir, J., and McFarlane, A., 2004. Literature review in games and learning. (Report No.8). Bristol: Futurelab. Kolb, A., and Kolb, D., 2005. Learning styles and learning spaces: enhancing experiential learning in Higher Education.
Academy of Management Learning and Education, (4), pp.193̻212. Labonte-LeMoyne, E., Leger, P.M., Robert, J., Babin, G., Charland, P., and Michon, J.F., 2017. Business intelligence serious
game participatory development: lessons from ERPsim for big data. Business Process Management Journal, 23(3),
pp.493̻505.
Landers, R. N., 2014. Developing a theory of gamified learning: linking serious games and gamification of learning.
Simulation and Gaming, 45(6), pp.752̻768. Li, K., Hall, M., Bermell-Garcia, P., Alcock, J., Tiwari, A., and González-Franco, M., 2017. Measuring the learning
effectiveness of serious gaming for training of complex manufacturing tasks. Simulation and Gaming, 48(6),
pp.770̻790. Lichtlé, M.C., and Plichon, V., 2014. Les éマラデキラミゲ ヴWゲゲWミデキWゲ S;ミゲ ┌ミ ヮラキミデ SW ┗WミデW票ぎ pヴラヮラゲキデキラミ Sげ┌ミW échelle de mesure.
Recherche et Applications en Marketing, 29(1), pp.3̻26.
Loerzel, V., Clochesy, J., and Geddie, P., 2018. Using a community advisory board to develop a serious game for older adults
undergoing treatment for cancer. Applied Nursing Research, 39(1), pp.207̻210.

Philippe Cohard
www.ejise.com 139 ISSN 1566-6379
Malone, T., 1981. Toward a theory of intrinsically motivating instruction. Cognitive Science, 1(4), pp.334̻369. Malone, T., and Lepper, M., 1987. Making learning fun: a taxonomy of intrinsic motivations for learning. In: R. Snow and J.
Farr, ed. 1987. Aptitude, learning and instruction III: Conative and affective process analyses. Hillsdale: Erlbaum. pp.
233̻253.
Matallaoui A., Herzig P. and Zarnekow R., 2015. Model-driven serious game development integration of the gamification modeling language gaml with unity. 2015 48th Hawaii International Conference on System Sciences, IEEE, pp.
643̻651. Nadolski, R., Hummel, H., Van Den Brink, H., Hoefakker, R., Slootmaker, A., Kurvers, H., and Storm, J., 2008. EMERGO:
methodology and toolkit for efficient development of serious games in higher education. Simulation and Gaming,
3(39), pp.338̻352. Norman, D. A., 2013. The design of everyday things. New York: Basic Books. Perez-Estrada, L. E., Groen, D., and Ramirez-Marquez, J. E., 2017. A serious video game to support decision making on
refugee aid deployment policy. Procedia Computer Science, 108(1), pp.205̻214.
Petter, S., Delone, W., and McLean, E., 2008. Measuring information systems success: models, dimensions, measures and
interrelationships. European Journal of Information Systems, (17), pp.236̻263.
Petter, S., DeLone, W., and McLean, E. R., 2013. Information Systems success: the quest for the independent variables.
Journal of Management Information Systems, 29(4), pp.7̻62. Petty, M. D., and Barbosa, S. E., 2016. Improving air combat maneuvering skills through self-study and simulation-based
practice. Simulation and Gaming, 47(1), pp.103̻129. Quinn, C. A., Rollock, D., and Vrana, S. R., 2014く A デWゲデ ラa “ヮキWノHWヴェWヴげゲ ゲデ;デW-trait theory of anger with adolescents: five
hypotheses. Emotion, 14(1), pp.74̻84. Raybourn, E. M., 2007. Applying simulation experience design methods to creating serious game-based adaptive training
systems. Interacting with Computers. 19(2), pp.206̻214.
Russell, J., 1980. A circumplex model of affect. Journal of Personality and Social Psychhology, 39(6), pp.1161̻1178.
Sherry, J., 2004. Flow and media enjoyment. Communication Theory, 14(4), pp.328̻347. Strohhecker, J., and Größler, A., 2015. Performance in tangible and in cognitive stock-flow tasks: closer than expected.
Simulation and Gaming, 46(3̻4), pp.230̻254. Thompson, D., Baranowski, T., Griffith, M., Buday, R., Baranowski, J., Thompson, V., and Jago, R., 2010. Serious video
games for health: how behavioral science guided the development of a serious video game. Simulation and Gaming,
41(4), pp.587̻606.
Van der Wal, M., de Kraker, J., Kroeze, C., and Kirschner, P., 2016. Can computer models be used for social learning? A
serious game in water management. Environmental Modelling and Software, 75(1), pp.119̻132. Witmer, B., and Singer, M., 1998. Measuring presence in virtual environment: a presence questionnaire. Presence, 7(3),
pp.225̻240. Yannakakis, G., Karpouzis, K., Paiva, A., and Hudlicka, E., 2011. Emotion in games. Affective Computing and Intelligent
Interaction, (1), pp.497. Zhang, F., and Zwolinski, P., 2015. SimGreen: a serious game to learn how to improve environmental integration into
companies. In S. Kara, ed. 2015. The 22nd CIRP Conference on Life Cycle Engineering. Sydney: Procedia CIRP 29.
pp.281̻286.
Zyda, M., 2005. From visual simulation to virtual reality to games. IEEE Computer Society, 38(9), pp.25̻32.
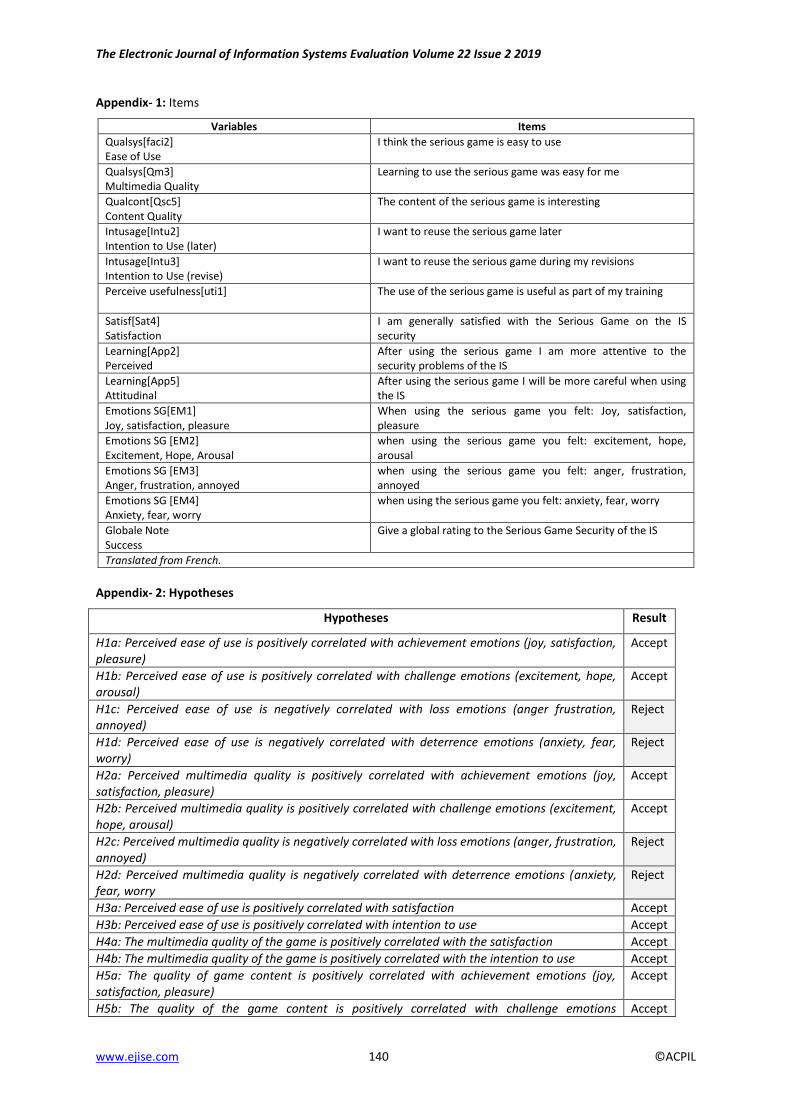
The Electronic Journal of Information Systems Evaluation Volume 22 Issue 2 2019
www.ejise.com 140 ©ACPIL
Appendix- 1: Items
Variables Items
Qualsys[faci2] Ease of Use
I think the serious game is easy to use
Qualsys[Qm3] Multimedia Quality
Learning to use the serious game was easy for me
Qualcont[Qsc5] Content Quality
The content of the serious game is interesting
Intusage[Intu2] Intention to Use (later)
I want to reuse the serious game later
Intusage[Intu3] Intention to Use (revise)
I want to reuse the serious game during my revisions
Perceive usefulness[uti1]
The use of the serious game is useful as part of my training
Satisf[Sat4] Satisfaction
I am generally satisfied with the Serious Game on the IS security
Learning[App2] Perceived
After using the serious game I am more attentive to the security problems of the IS
Learning[App5] Attitudinal
After using the serious game I will be more careful when using the IS
Emotions SG[EM1] Joy, satisfaction, pleasure
When using the serious game you felt: Joy, satisfaction, pleasure
Emotions SG [EM2] Excitement, Hope, Arousal
when using the serious game you felt: excitement, hope, arousal
Emotions SG [EM3] Anger, frustration, annoyed
when using the serious game you felt: anger, frustration, annoyed
Emotions SG [EM4] Anxiety, fear, worry
when using the serious game you felt: anxiety, fear, worry
Globale Note Success
Give a global rating to the Serious Game Security of the IS
Translated from French.
Appendix- 2: Hypotheses
Hypotheses Result
H1a: Perceived ease of use is positively correlated with achievement emotions (joy, satisfaction,
pleasure)
Accept
H1b: Perceived ease of use is positively correlated with challenge emotions (excitement, hope,
arousal)
Accept
H1c: Perceived ease of use is negatively correlated with loss emotions (anger frustration,
annoyed)
Reject
H1d: Perceived ease of use is negatively correlated with deterrence emotions (anxiety, fear,
worry)
Reject
H2a: Perceived multimedia quality is positively correlated with achievement emotions (joy,
satisfaction, pleasure)
Accept
H2b: Perceived multimedia quality is positively correlated with challenge emotions (excitement,
hope, arousal)
Accept
H2c: Perceived multimedia quality is negatively correlated with loss emotions (anger, frustration,
annoyed)
Reject
H2d: Perceived multimedia quality is negatively correlated with deterrence emotions (anxiety,
fear, worry
Reject
H3a: Perceived ease of use is positively correlated with satisfaction Accept
H3b: Perceived ease of use is positively correlated with intention to use Accept
H4a: The multimedia quality of the game is positively correlated with the satisfaction Accept
H4b: The multimedia quality of the game is positively correlated with the intention to use Accept
H5a: The quality of game content is positively correlated with achievement emotions (joy,
satisfaction, pleasure)
Accept
H5b: The quality of the game content is positively correlated with challenge emotions Accept

Philippe Cohard
www.ejise.com 141 ISSN 1566-6379
Hypotheses Result
(excitement, hope, arousal)
H5c: The quality of game content is negatively correlated with loss emotions (anger, frustration,
annoyed)
Accept
H5d: The quality of game content is negatively correlated with deterrence emotions (anxiety,
fear, worry)
Reject
H6 a: The quality of game content is positively correlated with satisfaction Accept
H6 b: The quality of game content is positively correlated with the intention to use Accept
H7a: Achievement emotions (joy, satisfaction, pleasure) are positively correlated to satisfaction Accept
H7b: Challenge emotions (excitement, hope, arousal) are positively correlated to satisfaction Accept
H7c: Loss emotions (anger, frustration, annoyed) are negatively correlated to satisfaction Accept
H7d: Deterrence emotions (anxiety, fear, worry) are negatively correlated to satisfaction Reject
H8a: Achievement emotions (joy, satisfaction, pleasure) are positively correlated to success Accept
H8b: Challenge emotions (excitement, hope, arousal) are positively correlated to success Accept
H8c: Loss emotions (anger, frustration, annoyed) are negatively correlated to success Reject
H8d: Deterrence emotions (anxiety, fear, worry) are negatively correlated to success Reject
H9 a: Satisfaction is positively correlated to the intention to use Accept
H9 b: Satisfaction is positively correlated to the success of the serious game in general Accept
H10a: Achievement emotions (joy, satisfaction, pleasure) are positively correlated to learning Accept
H10b: Challenge emotions (excitement, hope, arousal) are positively correlated to learning Accept
H10c: Loss emotions (anger, frustration, annoyed) are negatively correlated to learning Accept
H10d: Deterrence emotions (anxiety, fear, worry) are negatively correlated to learning Reject
H 11 a: Satisfaction is positively correlated to perceived utility Accept
H 11 b: Satisfaction is positively correlated to learning Accept
H 12 a: Intention to use is positively correlated to perceived utility Accept
H 12 b: Intension to use is positively correlated to learning Accept
H 13: Learning is positively correlated to the success of the serious game in general Accept