MTAT.03.231 Business Process Management (BPM) Lecture 6 Qualitative Process Analysis Marlon Dumas...
20
MTAT.03.231 Business Process Management (BPM) Lecture 6 Qualitative Process Analysis Marlon Dumas marlon.dumas ät ut . ee
-
Upload
shanon-ferguson -
Category
Documents
-
view
267 -
download
2
Transcript of MTAT.03.231 Business Process Management (BPM) Lecture 6 Qualitative Process Analysis Marlon Dumas...

MTAT.03.231Business Process Management (BPM)
Lecture 6Qualitative Process Analysis
Marlon Dumas
marlon.dumas ät ut . ee
2
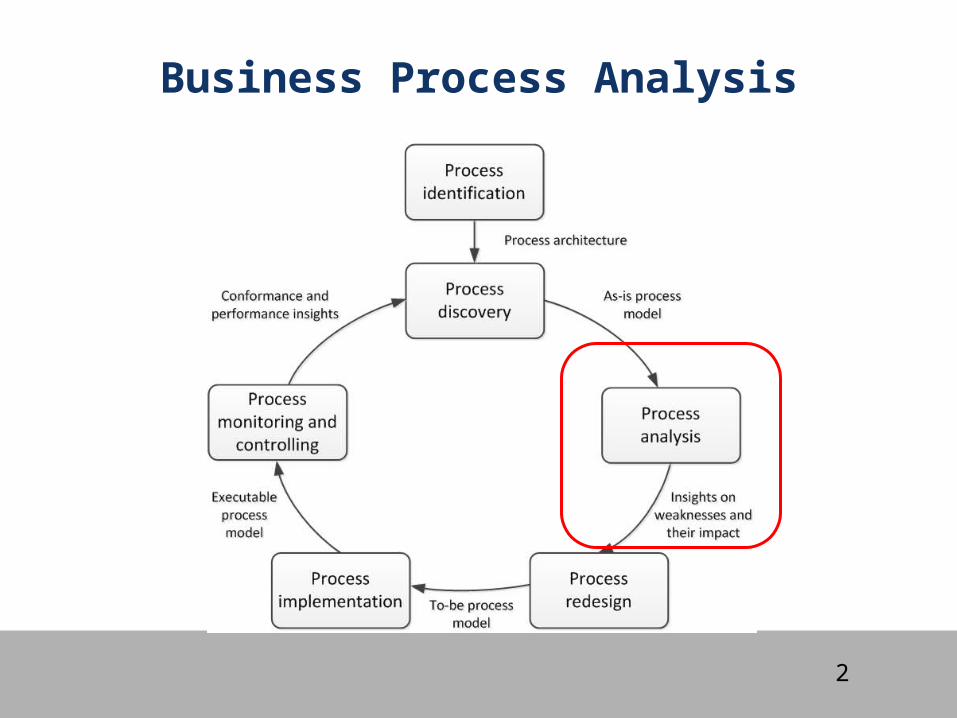
Business Process Analysis

3
Process Analysis Techniques
4
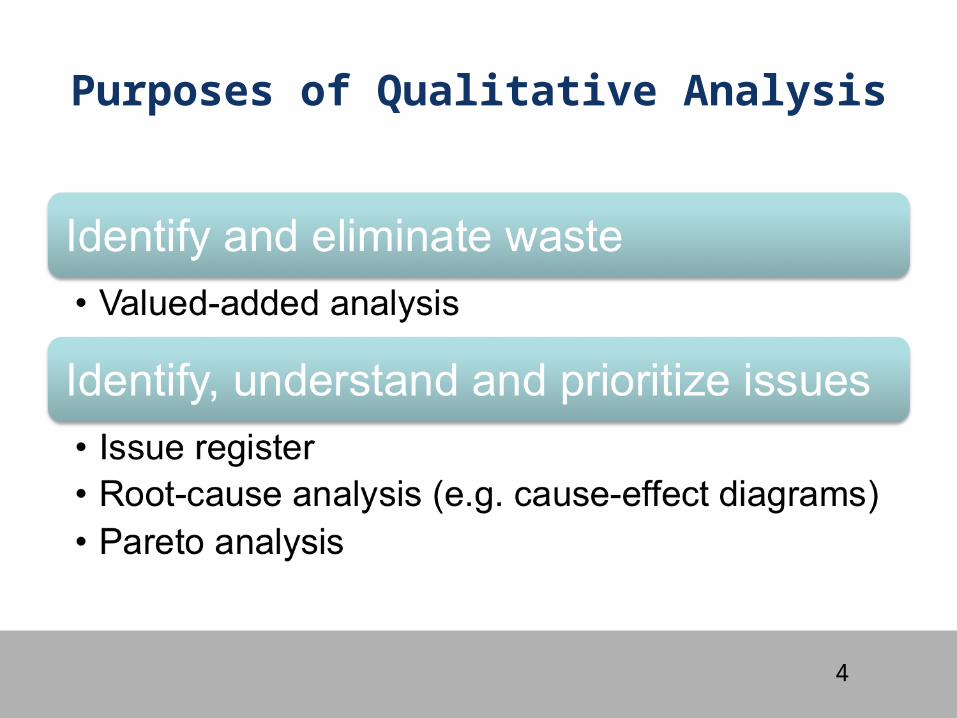
Purposes of Qualitative Analysis
5
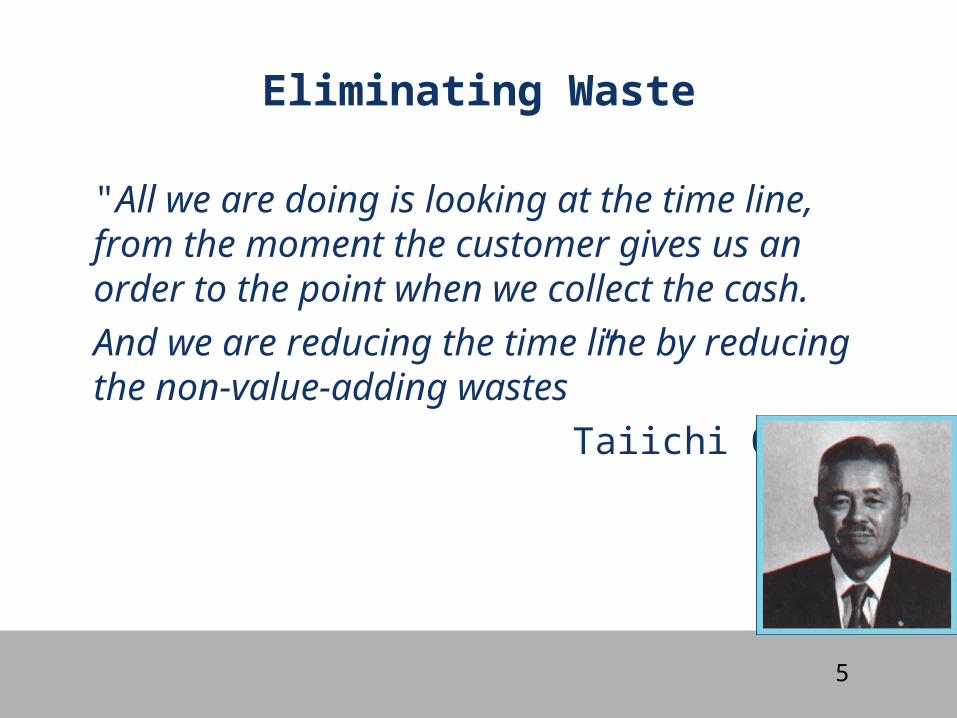
Eliminating Waste
"All we are doing is looking at the time line, from the moment the customer gives us an order to the point when we collect the cash.
And we are reducing the time line by reducing the non-value-adding wastes ”
Taiichi Ohno
6
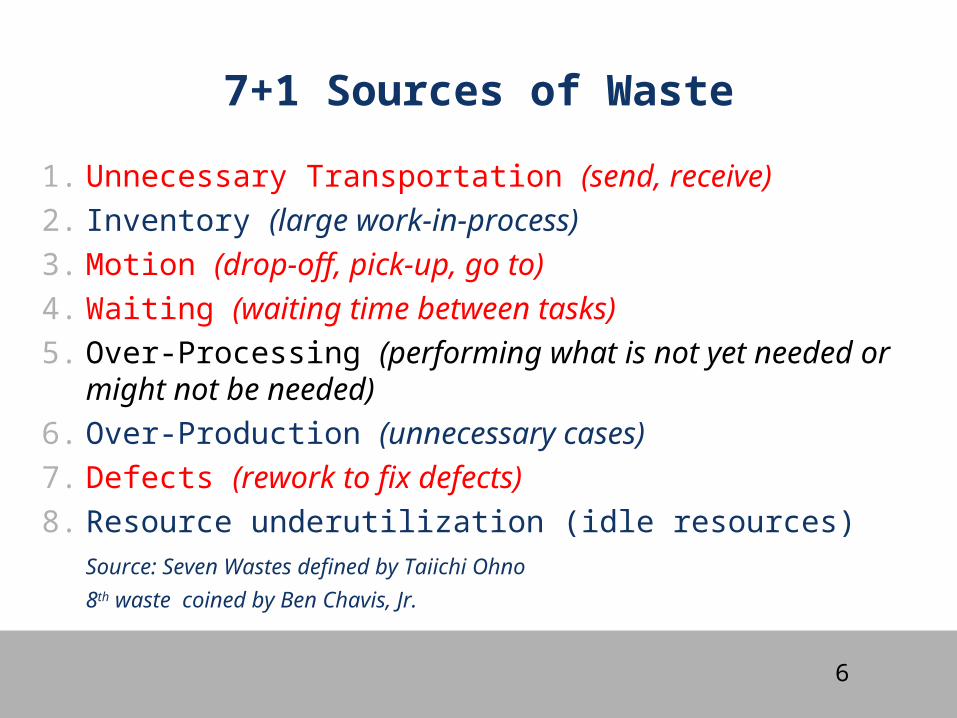
7+1 Sources of Waste
1. Unnecessary Transportation (send, receive)
2. Inventory (large work-in-process)
3. Motion (drop-off, pick-up, go to)
4. Waiting (waiting time between tasks)
5. Over-Processing (performing what is not yet needed or might not be needed)
6. Over-Production (unnecessary cases)
7. Defects (rework to fix defects)
8. Resource underutilization (idle resources)Source: Seven Wastes defined by Taiichi Ohno
8th waste coined by Ben Chavis, Jr.
7
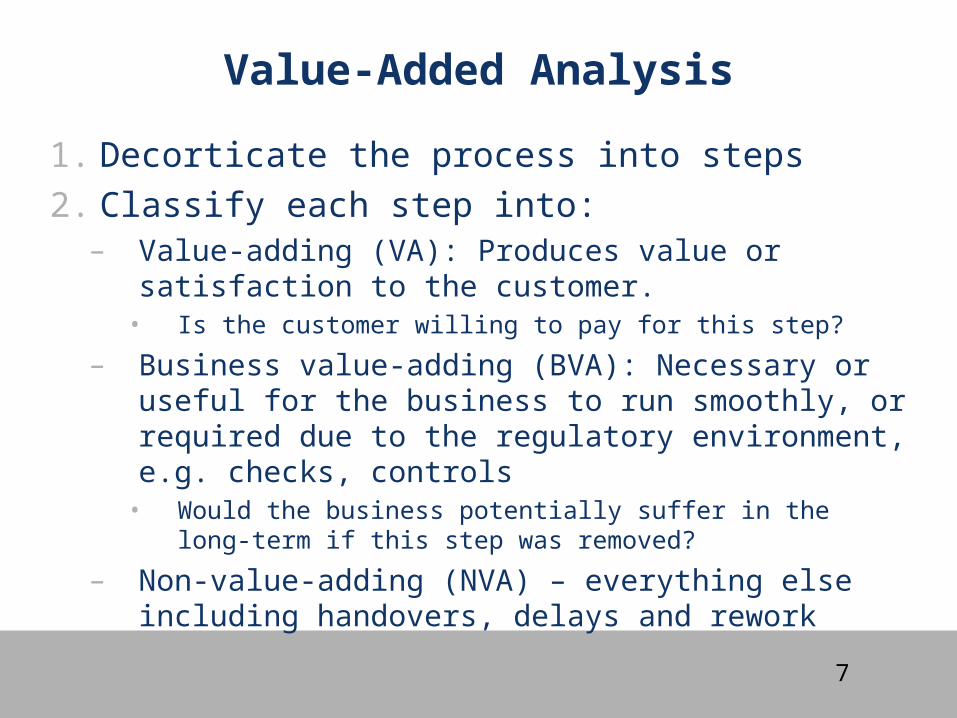
Value-Added Analysis
1. Decorticate the process into steps
2. Classify each step into:– Value-adding (VA): Produces value or satisfaction to
the customer.• Is the customer willing to pay for this step?
– Business value-adding (BVA): Necessary or useful for the business to run smoothly, or required due to the regulatory environment, e.g. checks, controls
• Would the business potentially suffer in the long-term if this step was removed?
– Non-value-adding (NVA) – everything else including handovers, delays and rework
8
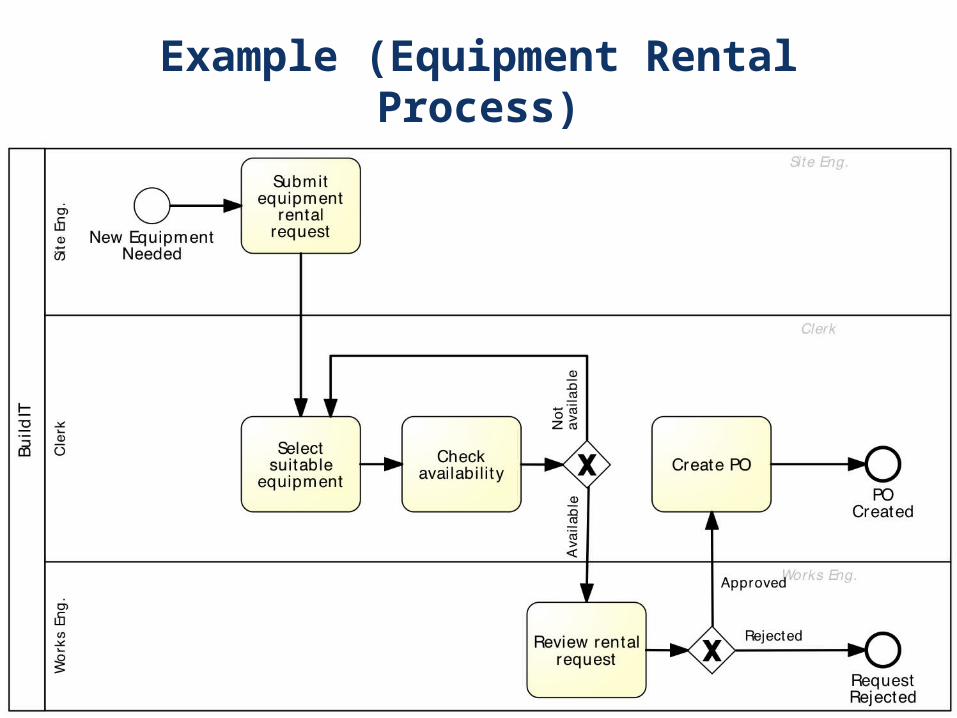
Example (Equipment Rental Process)
9
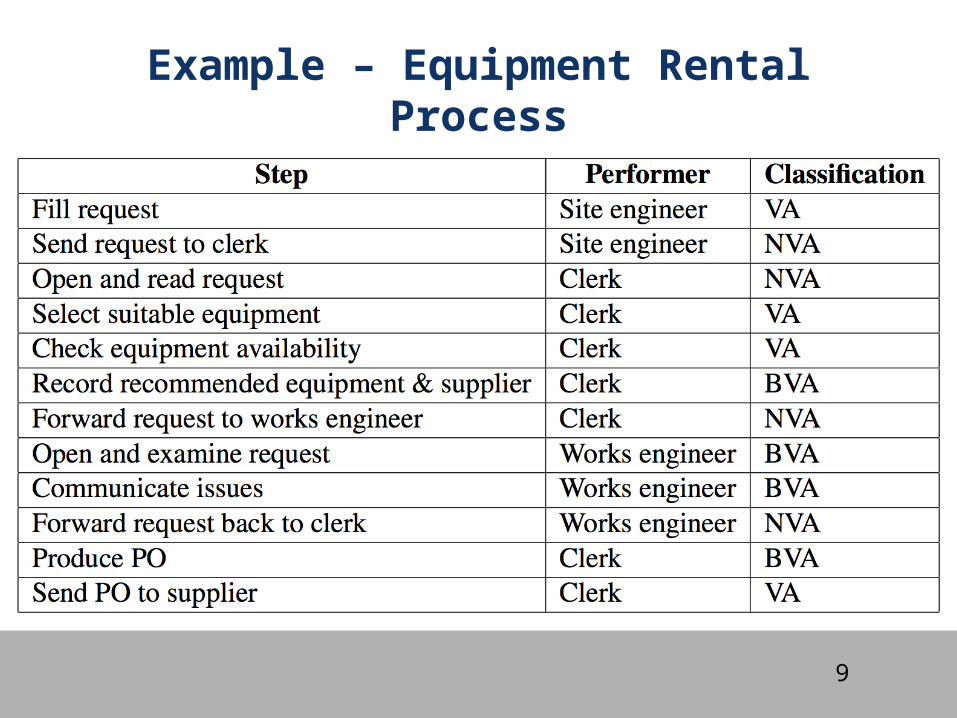
Example – Equipment Rental Process
10
Issue Register
• Purpose: to categorise identified issues as part of as-is process modelling
• Usually a table with the following columns (possibly others):– issue number– name– Description/explanation– Impact: Qualitative vs. Quantitative– Possible solution
11
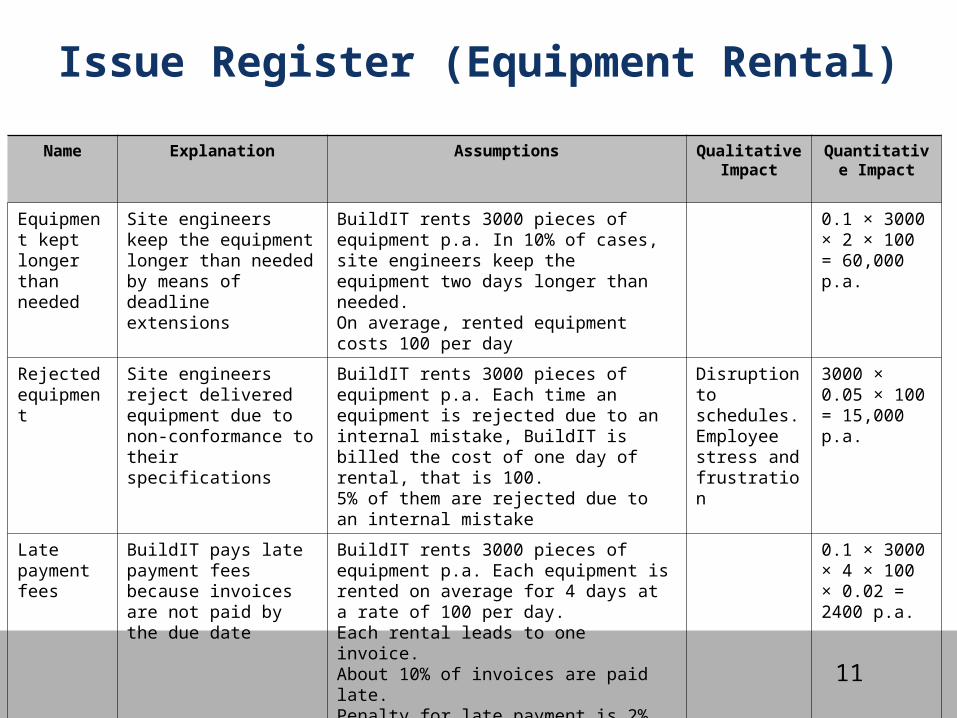
Issue Register (Equipment Rental)
Name Explanation Assumptions Qualitative Impact
Quantitative Impact
Equipment kept longer than needed
Site engineers keep the equipment longer than needed by means of deadline extensions
BuildIT rents 3000 pieces of equipment p.a. In 10% of cases, site engineers keep the equipment two days longer than needed. On average, rented equipment costs 100 per day
0.1 × 3000 × 2 × 100 = 60,000 p.a.
Rejected equipment
Site engineers reject delivered equipment due to non-conformance to their specifications
BuildIT rents 3000 pieces of equipment p.a. Each time an equipment is rejected due to an internal mistake, BuildIT is billed the cost of one day of rental, that is 100.5% of them are rejected due to an internal mistake
Disruption to schedules.Employee stress and frustration
3000 × 0.05 × 100 = 15,000 p.a.
Late payment fees
BuildIT pays late payment fees because invoices are not paid by the due date
BuildIT rents 3000 pieces of equipment p.a. Each equipment is rented on average for 4 days at a rate of 100 per day. Each rental leads to one invoice. About 10% of invoices are paid late. Penalty for late payment is 2%.
0.1 × 3000 × 4 × 100 × 0.02 = 2400 p.a.
12
Techniques for issue analysis
• Cause-effect diagrams• Why-why diagrams• Pareto charts
13
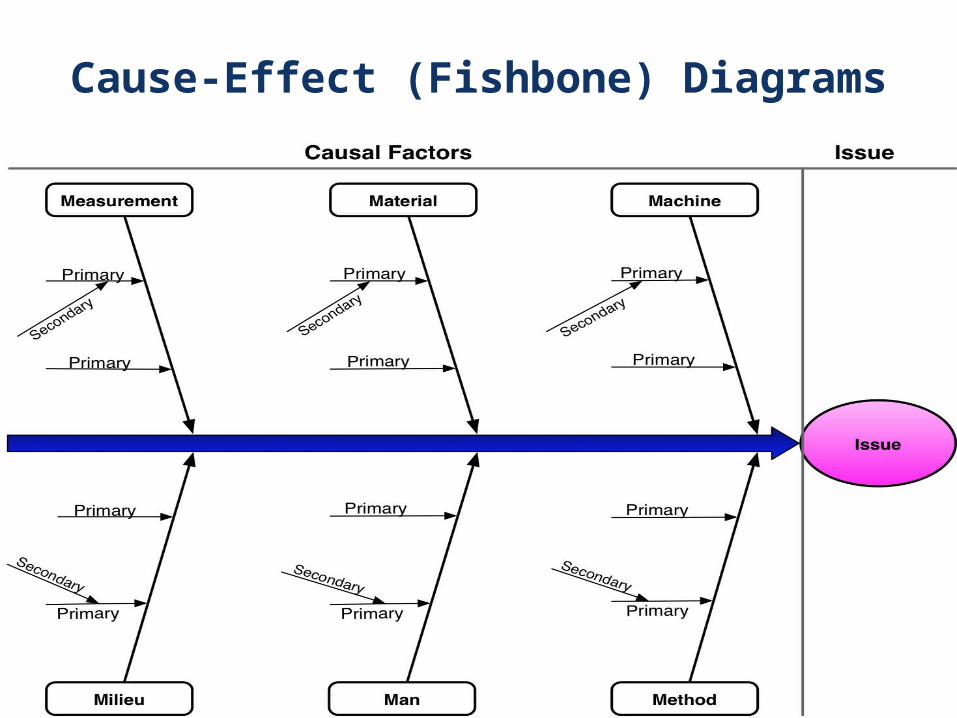
Cause-Effect (Fishbone) Diagrams
14
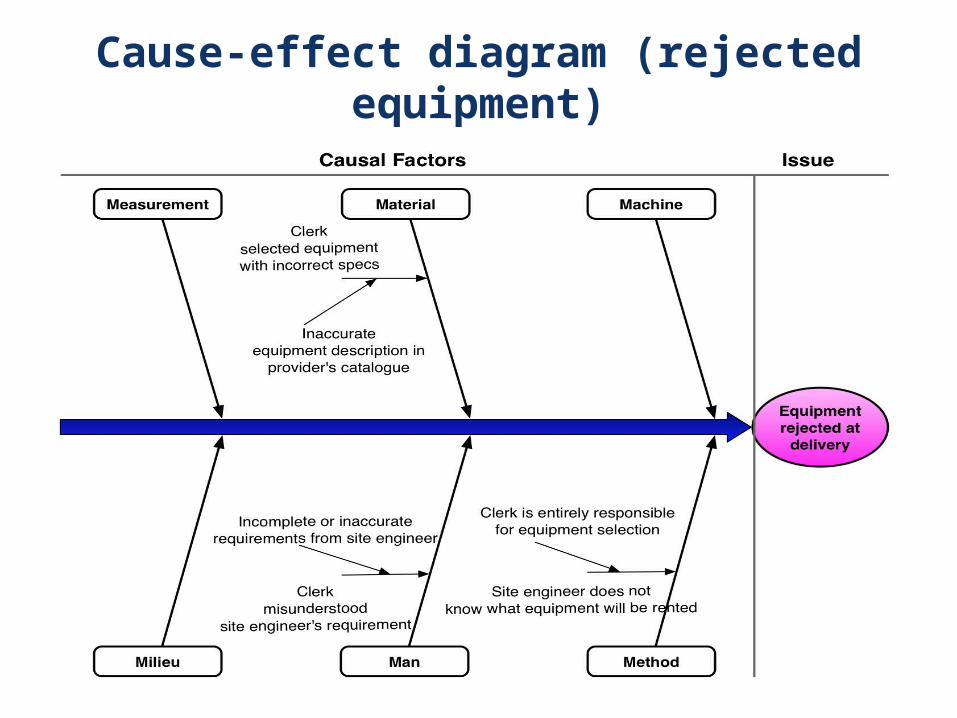
Cause-effect diagram (rejected equipment)

15
Why-Why Diagram
16
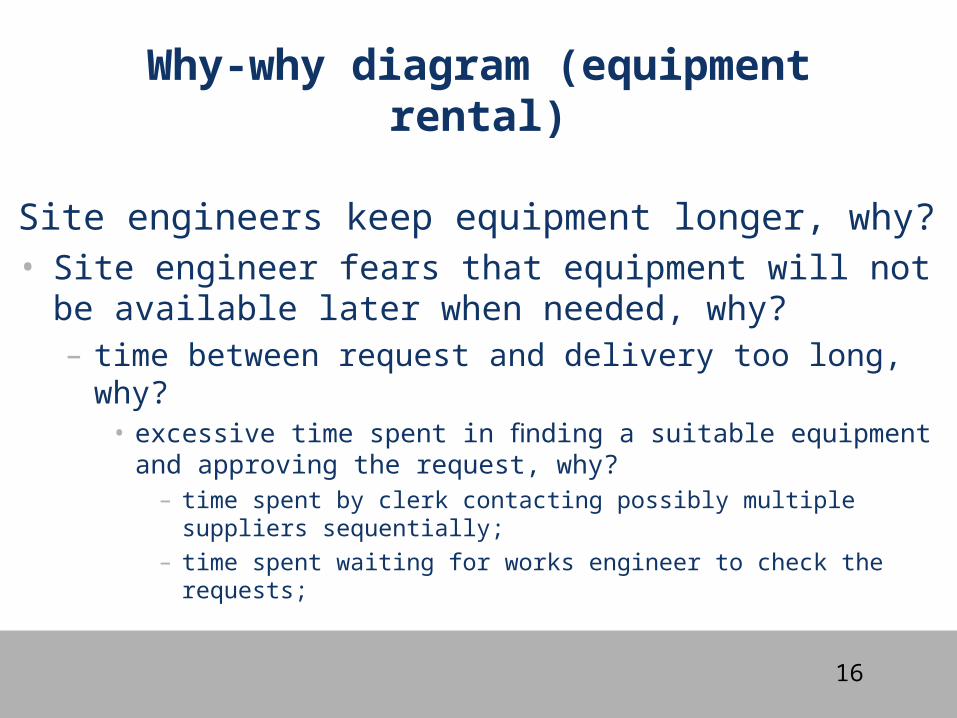
Why-why diagram (equipment rental)
Site engineers keep equipment longer, why?• Site engineer fears that equipment will not be available
later when needed, why?– time between request and delivery too long, why?
• excessive time spent in finding a suitable equipment and approving the request, why?
– time spent by clerk contacting possibly multiple suppliers sequentially;
– time spent waiting for works engineer to check the requests;
17
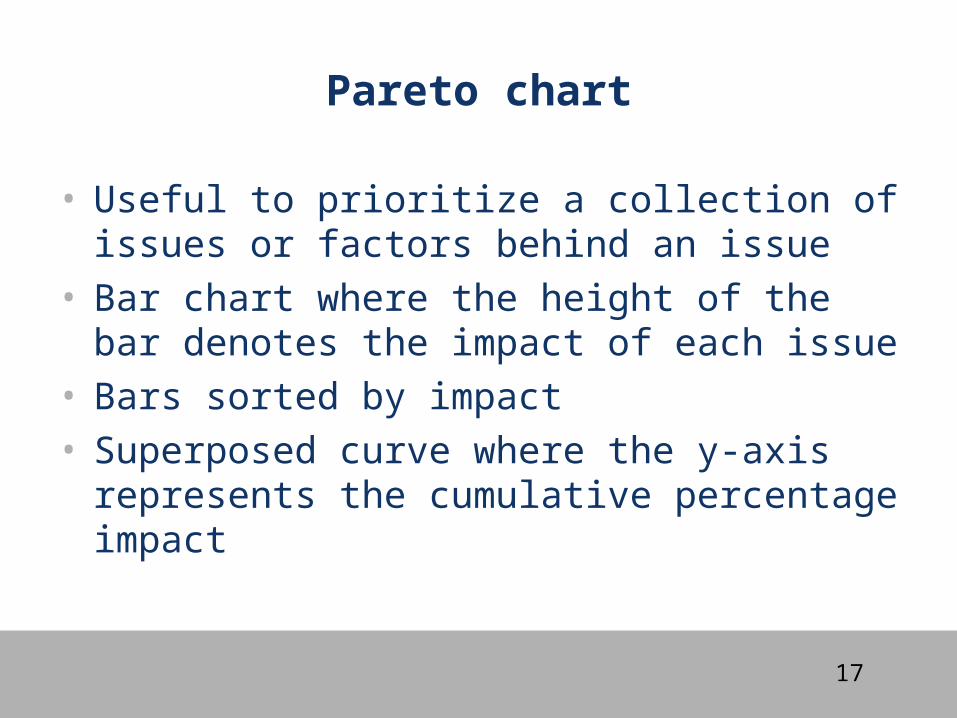
Pareto chart
• Useful to prioritize a collection of issues or factors behind an issue
• Bar chart where the height of the bar denotes the impact of each issue
• Bars sorted by impact• Superposed curve where the y-axis represents
the cumulative percentage impact
18
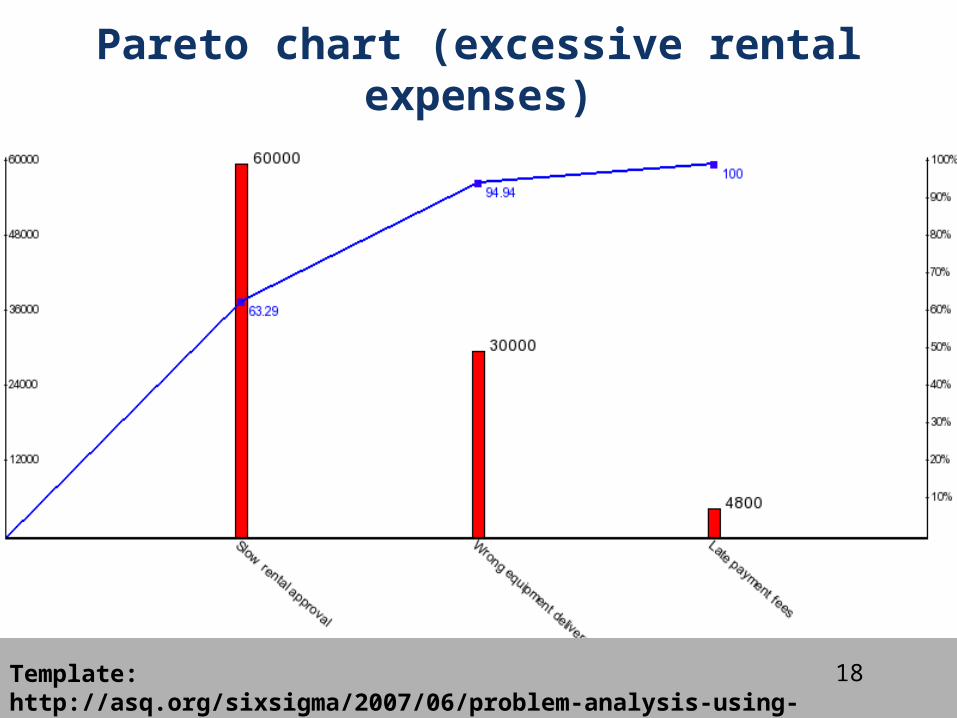
Pareto chart (excessive rental expenses)
Template:http://asq.org/sixsigma/2007/06/problem-analysis-using-pareto-chart.xls
19
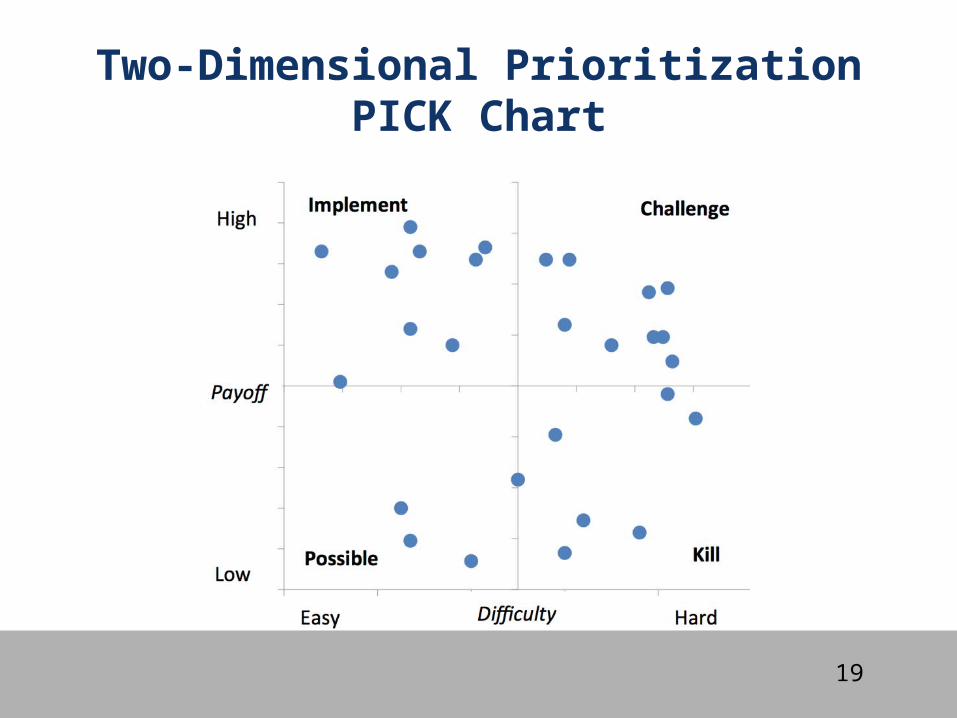
Two-Dimensional PrioritizationPICK Chart
20
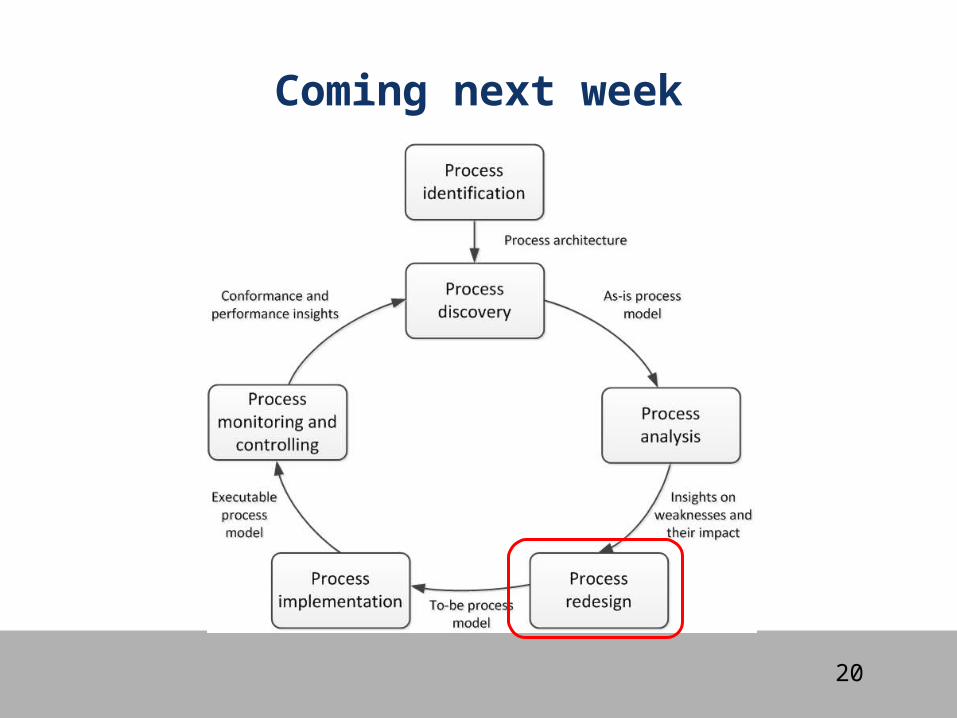
Coming next week