Mr Project Final
49
JAIPURIA INSTITUTE OF MANAGEMENT Marketing Research Project- To determine the consumer preferences while buying toothpastes in the age group 15-30 ~ 1 ~
-
Upload
vinod-kumar -
Category
Documents
-
view
42 -
download
3
Transcript of Mr Project Final
JAIPURIA INSTITUTE OF MANAGEMENT
Marketing Research Project-To determine the consumer preferences while
buying toothpastes in the age group 15-30
Submitted by:Pragya SharmaSheena SaxsenaUrvashi SharmaVinod Kumar
~ 1 ~

ACKNOWLEDGEMENT
We would like to thank our faculty, Mrs. Shalini Nath Tripathi for providing us constant guidance during our project and providing us with an opportunity to apply the concepts learnt in the course “Marketing Research” to a practical and real life situation.
We would also like to thank all the respondents who gave their valuable time for filling up the questionnaires and for giving valuable inputs during the exploratory research. Their unbiased and valuable input has helped us to administer a project in which we have taken out inferences about the consumer buying behaviour for toothpastes.
~ 2 ~

TABLE OF CONTENTS
Executive Summary4
Background5
Literature Review6
Objectives8
Research Approach8
Measurement Techniques9
Data Analysis Technique10
Key Finding11
Questionnaire Design12
Main Questionnaire 12
Chi-square analysis 17
Factor analysis 29
Cluster analysis 36
Conclusions 40
~ 3 ~

EXECUTIVE SUMMARY
Oral hygiene is sought to be one of the most necessary aspects to maintain good health since the pre-modern era where natural products like Neem sticks were used to maintain good teeth. With the advancement of technology in the modern era, products like tooth pastes, mouth washes, dental floss, and teeth whiteners have been introduced. Realizing the importance of these products in consumers daily lives especially toothpastes, many companies like P & G, Hindustan Unilever etc. are planning to launch products to fight for the share of the existing market giants. Before launching a new product in the market, the companies need to realize the factors affecting the buying behaviour so as to design their marketing strategies to cater to the correct consumer segment(s).
Initially, an exploratory research was conducted to figure out what brands of toothpastes the consumers know about and what factors do the consumers consider while making their purchase decision. Then questionnaires were administered through an online survey. Two questionnaires were administered with one question different where the first questionnaire had one non-attribute based question while the second had attribute based question; this being done for using multi-dimensional scaling. Other approaches used for analysis were tabs, cross-tabs, chi-square, factor analysis, cluster analysis, etc. These statistical tools were used with the help of SPSS. The analysis from these tools helped gather useful insights upon what type of respondents we had, what attributes the consumers consider while making the purchase decision, how the consumers perceive the various brands to be etc
~ 4 ~

BACKGROUND
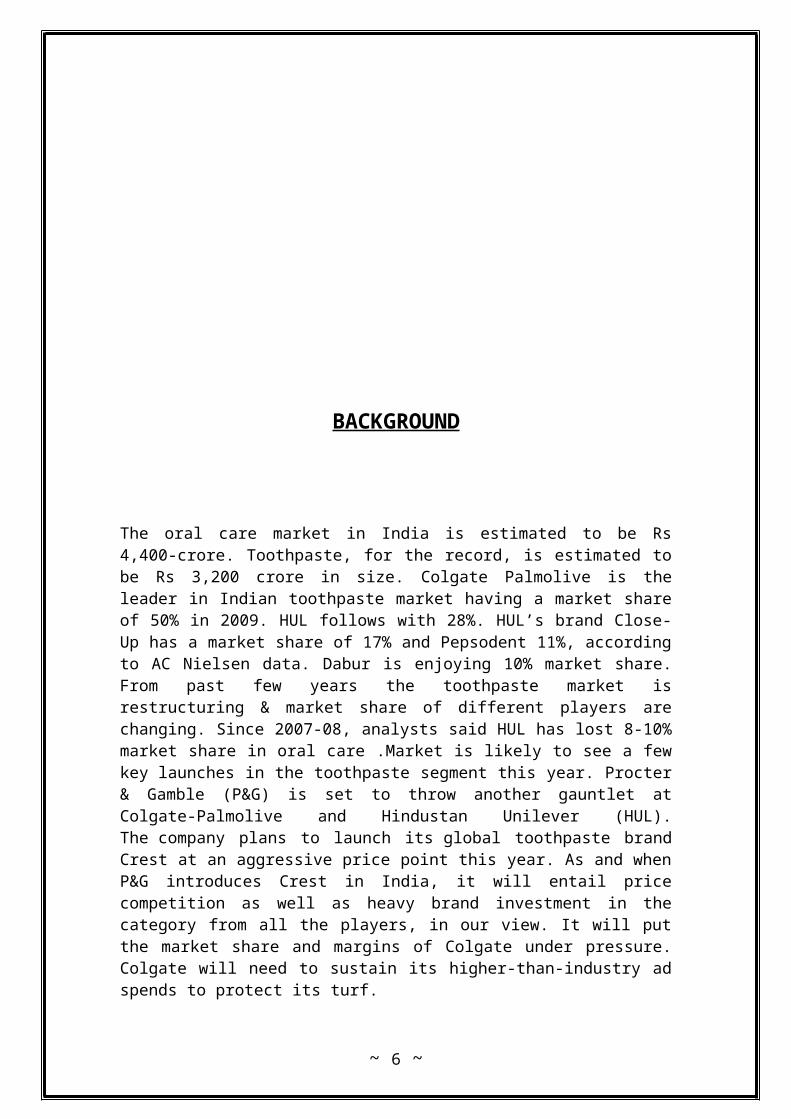
The oral care market in India is estimated to be Rs 4,400-crore. Toothpaste, for the record, is estimated to be Rs 3,200 crore in size. Colgate Palmolive is the leader in Indian toothpaste market having a market share of 50% in 2009. HUL follows with 28%. HUL’s brand Close-Up has a market share of 17% and Pepsodent 11%, according to AC Nielsen data. Dabur is enjoying 10% market share. From past few years the toothpaste market is restructuring & market share of different players are changing. Since 2007-08, analysts said HUL has lost 8-10% market share in oral care .Market is likely to see a few key launches in the toothpaste segment this year. Procter & Gamble (P&G) is set to throw another gauntlet at Colgate-Palmolive and Hindustan Unilever (HUL). The company plans to launch its global toothpaste brand Crest at an aggressive price point this year. As and when P&G introduces Crest in India, it will entail price competition as well as heavy brand investment in the category from all the players, in our view. It will put the market share and margins of Colgate under pressure. Colgate will need to sustain its higher-than-industry ad spends to protect its turf.
The consumer products arm of Johnson & Johnson (J&J) may launch toothpaste under the Listerine umbrella, while GlaxoSmithKline (GSK) Consumer Healthcare may re launch its Aqua fresh brand, phased out a few years earlier. GSK had launched Sensodyne toothpaste last year. A mass-market toothpaste product is what is missing at the moment, which GSK will plug with the re launch of Aqua fresh. Kishore Biyani's Future Group is also entering the fray with its private label.
~ 5 ~
Literature Review
Topic- Consumer Preferences While Choosing A Toothpaste Brand.
1 .Authors: Miskell, Peter Source: Business History Review; Spring2004, Vol. 78 Issue 1, p29-60, 32p Abstract:
This article examines how the marketing and advertising of toothpaste brands evolved in the twentieth century, particularly from the 1950's to the 1980's. During these decades, the promotional strategies employed by leading toothpaste manufacturers were at odds with general developments in consumer product marketing. As branding strategies were being revolutionized by the discovery of a "Pepsi Generation," the toothpaste market was itself being transformed by a technical innovation that was to have far-reaching consequences for the marketing of leading brands.
2. Authors: Wood, Lisa M. Source: Journal of Consumer Behaviour; Oct2004, Vol. 4 Issue 1, p9-24, 16p, 15 Charts
Abstract:
This paper reports the results of a study of brand selection and loyalty within the 18-24 age group. The study explores brand loyalty behaviour across different product categories, and investigates the dimensions that drive loyalty behaviour within this age group. First, the construct of brand loyalty is defined, followed by an overview of key research in the area. Finally, the study itself is detailed. The study concludes that there is a significant difference in the degree of brand loyalty exhibited by the 18-24-year-old respondents across product categories. The dimensions of brand selection also vary by product type. Brand heritage in terms of parental influence was evident in coffee and toothpaste purchase, with brand as a reflection of self-
~ 6 ~
image being something that is important to clothing brands. Value and variety are important attributes of cereal brand selection.
3. Authors: Lawrence, Raymond J. Source: Journal of Marketing Research (JMR); May69, Vol. 6 Issue 2, p137-144, 8p, 4 Charts
Abstract:
Toothpaste brand purchases following a switch from a brand previously bought regularly are analyzed from consumer panel data. It is suggested that the results do not fit existing learning theory models. New categories of consumer decision processes which are meaningful from a behavioural point of view are recommended.
4. Authors: Malaviya, Prashant Sternthal, Brian Source: Advances in Consumer Research - Asia-Pacific Conference Proceedings; 2009, Vol. 8, p188-189, 2p
Abstract:
Consider a recent comparative ad for Crest Multi-Care toothpaste in which this brand is compared to Colgate Total on a variety of features. As might be expected, on some features Crest is described as superior (better taste, fresher feeling breath). On other features Colgate is depicted as performing better (helps reduce gingivitis), perhaps to enhance the credibility of Crest's superiority claims. There are also a number of features possessed by both brands (helps fight cavities, helps brush away plaque). The inclusion of such parity features might be justified as a means of clarifying the target brand's frame of reference, but it also raises a question about their impact on the judgment of the advertised brand. Three predictions about the impact of parity features are plausible. The most intuitive one is that the presence or absence of features common to alternative brands would not influence brand preference. If brand A is preferred to brand B in the absence of parity features, including these features in the brand descriptions adds a constant and thus should preserve individuals' initial preference. Testing this hypothesis has attracted little interest, perhaps because the prediction is a null effect. An alternative prediction is that the inclusion of parity features enhances the preference for an initially preferred brand.
~ 7 ~
OBJECTIVES
Primary Research Objective (Pro):
To determine the consumer preferences while buying toothpastes in the age group 21-30
Secondary Research Objectives (SROs):
To determine the various factors affecting the purchase of toothpastes.
To determine the brand preferences for toothpastes in the age group.
To determine the type of toothpastes preferred by consumers in the age group.
To determine the positioning of various brands in the minds of consumers in the age group.
To determine whether the various demographical factors affect the purchase of toothpaste.
To determine the relative importance of various functionalities attached to toothpaste by youngsters (whiteness, freshness, protection).
Research Approach
Data Collection Method:An exploratory research was conducted for which the following techniques were used:
Close-ended questionnaire The questionnaire was posted on google-docs at jiml portal as well on facebook. The major respondents were students of jiml.
Based on the attributes found out in the exploratory research and the secondary research, the information gap was identified and hence it was decided to conduct primary research to fill the gap. The research was conducted by administering
~ 8 ~
questionnaire for the target age-group. For primary data collection, Questionnaire administration was done personally and through online questionnaires
Measurement Technique:
To record the data the following measurement techniques would be used:
Likert Scale
The Likert scale would be used to find out how the respondents perceive the features of a toothpaste.
Dichotomous Questions
These questions would be asked to get an objective answer.
Willingness Of Respondents
Personal questions like Name, Age, Gender etc have been asked at the end of the questionnaire.
Sampling Plan : The sample for survey would be taken on the following basis.
Sample Frame : People residing or working in India
Sample Unit : Students and working professionals
Sample Size : 30 respondents
Time Frame : 10-15 Days.
Sampling Method : Simple random sampling (SRS)
Data Analysis Technique
The data collected from the exploratory research provided us with the different factors that a consumer looks for in toothpaste. Based on these responses, another questionnaire will be used to do factor analysis to reduce the number of attributes handled into fewer attributes, so that handling of factors becomes easier for subsequent analysis. To determine the profile of various consumers so that we can know more about their lifestyle, attitudes and preferences so as to gain an insight on what kind of toothpaste they are likely to choose, we will use cluster analysis, a
~ 9 ~

segmentation technique. Apart from using these three major techniques, we plan to use chi square analysis with crosstab to evaluate whether the preferences are different for various demographical factors. We will also use ANOVA technique to analyze if the effect of various independent variables on the choice of the brand of toothpaste and also the interaction effect that these variables have on the toothpaste choice of the population. These various techniques would be carried out the help of software like MS-Excel, SPSS etc.
KEY FINDINGS
The exploratory research phase aims to find out the parameters over which the research should proceed. The questionnaires explored the different factors that respondents look into before buying toothpaste. The sample size was 12 respondents. Some of the findings of exploratory research were as follows
Brands commonly used were : Colgate, close-up and Pepsodent
Other Brands which people were able to recall were:Babool, Cibaca, Meswak, Signal, Vicco Vajradanti, Dabur, Glister, Emofoam, Neem, Amway
Some of the reasons given by the respondents for choosing their preferred brand of toothpaste were:
Good Cleaning Power, Habit, Brand Loyalty, Good Lather, Color, Shelf Positioning, Calcium content, Flavors, liking for gel based toothpastes, taste , Cavity Protection, Prevention of Bad Breath, Medicinal Value , and utility viewpoint.
Some additional features that the respondents said they might want in their toothpastes were:
Lower Price, Change of Color, New Flavors, Mouth, Refreshing Breath, Anti Bacterial Protection
The factors that respondents thought were influential in buying toothpastes in general were:
Advertisements, Family Influence, Packaging, Personal Experience, Protection, Cleanliness, Dentist Recommendations, Pricing, Availability and peer suggestion.
Secondary Data
The oral care market in India is estimated to be Rs 4,400-crore. Toothpaste, for the record, is estimated to be Rs 3,200 crore in size, followed by the toothbrush segment at Rs 800 crore, tooth powder at Rs 300 crore, and mouthwash being Rs 100 crore.
~ 10 ~
Colgate Palmolive is the leader in Indian toothpastes having a market share of 50% in 2009.HUL follows with 28%. It’s Close-Up has a market share of 17% and Pepsodent 11%, according to ACNielsen data. Another player, Dabur, enjoys 10% share through its portfolio of Red Toothpaste, Promise, Meswakand Babool. Recently, GlaxoSmithKline Consumer forayed into the sector by launching Sensodyne (though it was available as an import earlier), a toothpaste brand for sensitive teeth. The Future Group launched its Sach brand recently in this segment.P&G is launching Crest in India. In toothpowder, Colgate leads in the white segment with 70 per volume share (value share is even more), while Dabur leads in the red segment with 70 per cent volume share again (value is more than70 per cent).
QUESTIONNAIRE DESIGN
Two questionnaires were administered with the aim of conducting multi-dimensional scaling. One questionnaire had non attribute based question in which respondents had to give distance scores between two brands based on their perception while the other questionnaire had attribute based question in which respondent had to rank each brand according to the various features identified through the exploratory research. Questionnaires were distributed to similar set of respondents to get similar unbiased responses.
Questionnaire 1: Based on Non Attribute Based Response
Recruiter
1. Name: _________________________ 2. Region: West East North South3. Occupation: _____________________ 4. Gender:5. Age:
Less than 15 Between 16-20Between 21-25Between 26-30Above 30
MAIN QUESTIONNAIRE
1. How often do you use toothpaste in day?Once a dayTwice a dayAfter every meal
2. How often do you buy toothpaste?Every monthEvery two monthsEvery three monthsNot every often
~ 11 ~

3. Which brand of toothpaste do you use?ColgateClose upPepsodentMeswakBaboolDabur Red ToothpasteSensodyneAmwayOthers(____________)
4. How long have you been using this toothpaste?Less than 3 monthsBetween 3 to 12 monthsBetween 1 to 3 yearsMore than 3 years
5. How often do you change your toothpastes?Do not change/ Brand LoyalOccasionallyFrequentlyAs long as it is a toothpaste, the brand doesn’t matter
6. Which type of toothpaste do you prefer?PasteGelOthers
7. Where do you buy your toothpaste from?General storeDepartmental storeMedical shops/ Pharmacies
8. What features do you look for while buying toothpaste? Rank these features according to your preference.
Features
RankPriceCleansingPowerMedicinal valueLatherCalciumContentCavityProtectionPrevention against badbreathAnti Bacterial ProtectionFlavors
~ 12 ~
Brand
9. What various promotional activities for toothpaste have you come across?Newspaper AdsTV CommercialRadio JingleKiosksFree Sample DistributionWord of mouth/Recommendations
10. Whose advice do you generally take while buying toothpaste?FriendsFamilyIndividual decisionDentistShopkeeper/Salesperson
11. I select the toothpaste because it is cheaper than other toothpastes.
(1-Strongly agree; 2- agree; 3- neither agree nor disagree; 4- disagree; 5 –strongly disagree)
12. The cleansing power of the toothpaste matters a lot.
(1-Strongly agree; 2- agree; 3- neither agree nor disagree; 4- disagree; 5 –strongly disagree)
13. The brand of the toothpaste is important.
(1-Strongly agree; 2- agree; 3- neither agree nor disagree; 4- disagree; 5–stronglydisagree)
14. I look for what medicinal value the toothpaste has to offer.
(1-Strongly agree; 2- agree; 3- neither agree nor disagree; 4- disagree; 5 –strongly disagree)
15. Toothpaste which does not lather does not provide satisfaction.
(1-Strongly agree; 2- agree; 3- neither agree nor disagree; 4- disagree; 5 –strongly disagree)
6. My toothpaste should provide me with optimum quantity of calcium content.
(1-Strongly agree; 2- agree; 3- neither agree nor disagree; 4- disagree; 5 –strongly disagree)
~ 13 ~

17. I like experimenting with various flavours that toothpaste companies have to offer.
(1-Strongly agree; 2- agree; 3- neither agree nor disagree; 4- disagree; 5-Strongly disagree)
18. My toothpaste should protect me against cavity.
(1-Strongly agree; 2- agree; 3- neither agree nor disagree; 4- disagree; 5 –strongly disagree)
19. The best toothpaste is which prevent me against bad breath.
(1-Strongly agree; 2- agree; 3- neither agree nor disagree; 4- disagree; 5 –strongly disagree)
20. I look for new features promised by the toothpaste every time I buy my toothpaste.
(1-Strongly agree; 2- agree; 3- neither agree nor disagree; 4- disagree; 5–strongly disagree)
21. I prefer Indian toothpastes over imported toothpastes.
(1-Strongly agree; 2- agree; 3- neither agree nor disagree; 4- disagree; 5 –strongly disagree)
22. I buy combo packs rather than single units in order to save money.
(1-Strongly agree; 2- agree; 3- neither agree nor disagree; 4- disagree; 5–stronglydisagree)
23. I prefer toothpastes which have offers like free toothbrush, extra quantity, freebies etc.
(1-Strongly agree; 2- agree; 3- neither agree nor disagree; 4- disagree; 5–strongly disagree)
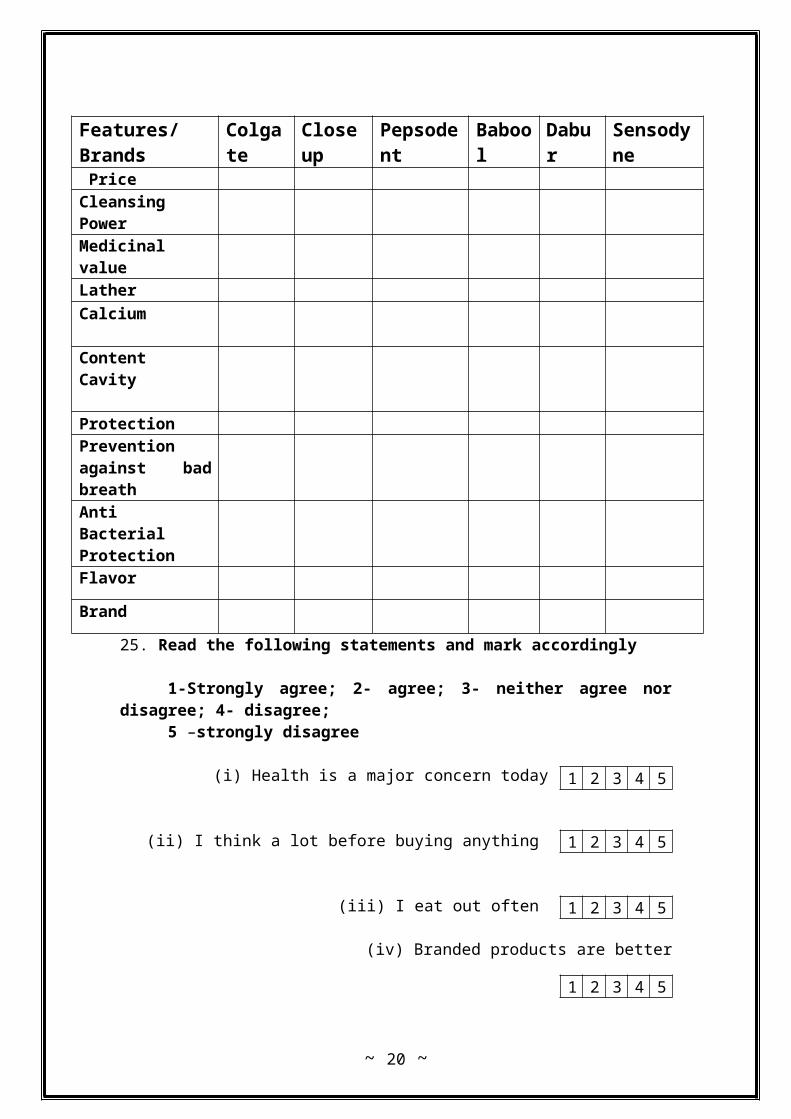
24. Rank these brands according to the features
Features/Brands Colgate Closeup Pepsodent Babool Dabur Sensodyne PriceCleansing PowerMedicinal valueLather
Calcium
~ 14 ~
Content Cavity
ProtectionPrevention against bad breathAnti Bacterial ProtectionFlavor
Brand
25. Read the following statements and mark accordingly
1-Strongly agree; 2- agree; 3- neither agree nor disagree; 4- disagree; 5 –strongly disagree
(i) Health is a major concern today
(ii) I think a lot before buying anything
(iii) I eat out often
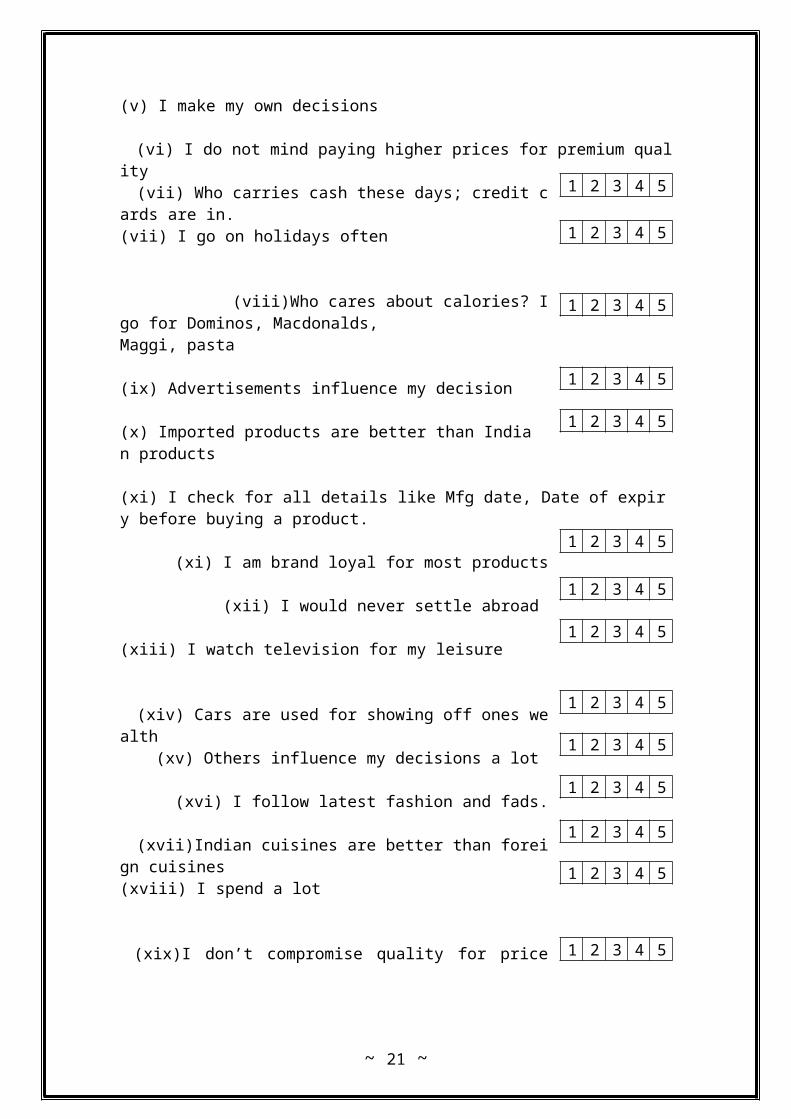
(iv) Branded products are better (v) I make my own decisions (vi) I do not mind paying higher prices for premium quality
(vii) Who carries cash these days; credit cards are in.
(vii) I go on holidays often
(viii)Who cares about calories? I go for Dominos, Macdonalds,Maggi, pasta
(ix) Advertisements influence my decision
(x) Imported products are better than Indian products
(xi) I check for all details like Mfg date, Date of expiry before buying a product.
(xi) I am brand loyal for most products
(xii) I would never settle abroad
(xiii) I watch television for my leisure
~ 15 ~
1 2 3 4 5
1 2 3 4 5
1 2 3 4 5
1 2 3 4 5
1 2 3 4 5
1 2 3 4 5
1 2 3 4 5
1 2 3 4 5
1 2 3 4 5
1 2 3 4 5
1 2 3 4 5
1 2 3 4 5
1 2 3 4 5

(xiv) Cars are used for showing off ones wealth (xv) Others influence my decisions a lot
(xvi) I follow latest fashion and fads. (xvii)Indian cuisines are better than foreign cuisines
(xviii) I spend a lot
(xix)I don’t compromise quality for price
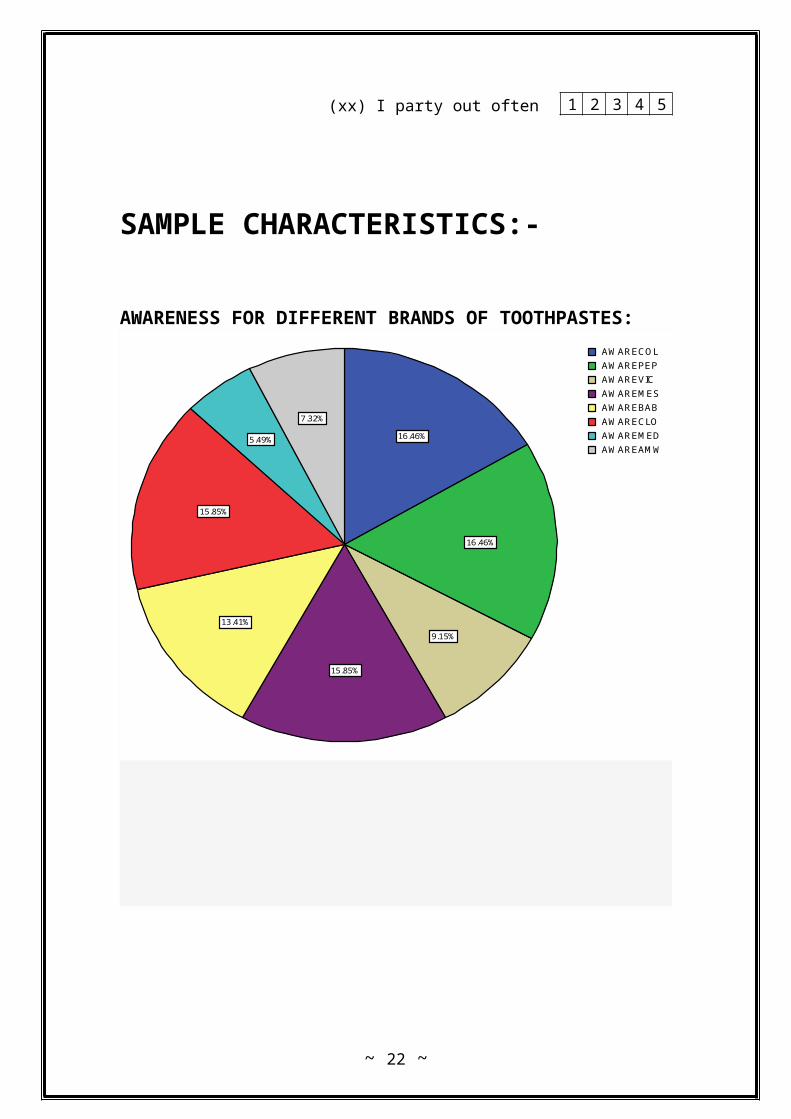
(xx) I party out often
SAMPLE CHARACTERISTICS:-
AWARENESS FOR DIFFERENT BRANDS OF TOOTHPASTES:
~ 16 ~
1 2 3 4 51 2 3 4 5
1 2 3 4 51 2 3 4 5
1 2 3 4 5
1 2 3 4 5

7.32%
5.49%
15.85%
13.41%
15.85%
9.15%
16.46%
16.46%
AWAREAMW
AWAREMED
AWARECLO
AWAREBAB
AWAREMES
AWAREVIC
AWAREPEP
AWARECOL
~ 17 ~

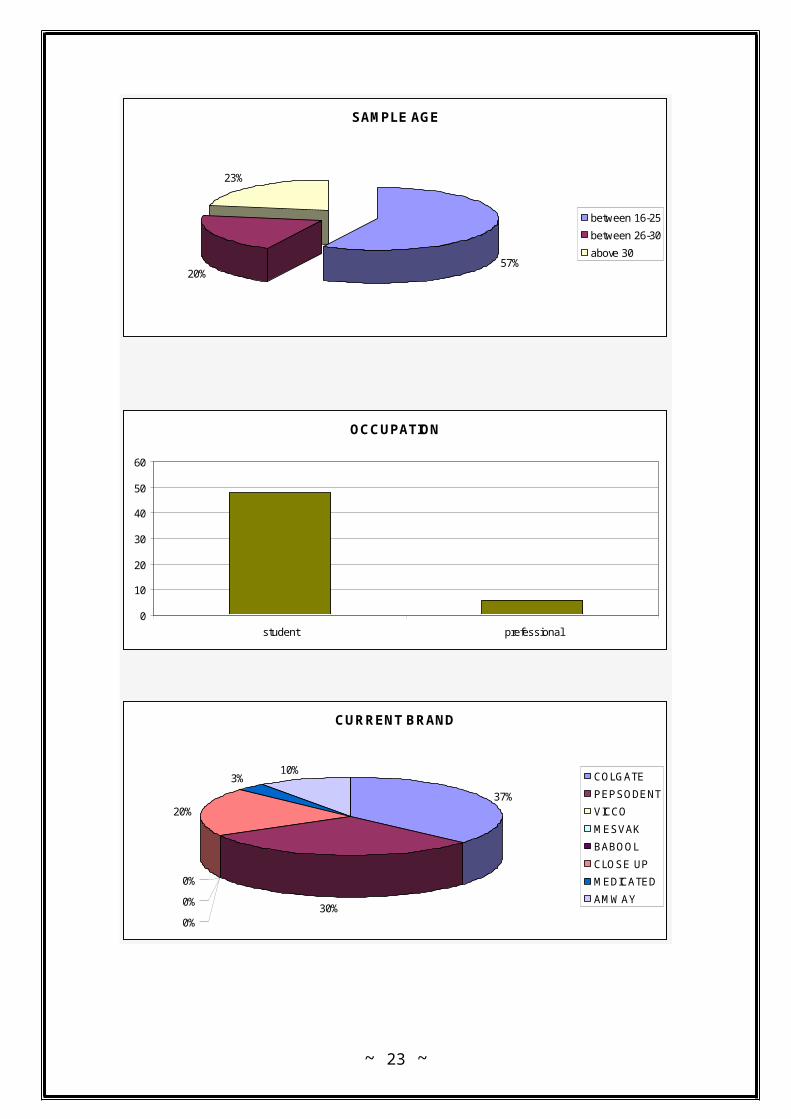
SAMPLE AGE
57%20%
23%
between 16-25
between 26-30
above 30
OCCUPATION
0
10
20
30
40
50
60
student prefessional
CURRENT BRAND
37%
30%0%
0%
0%
20%
3%10%
COLGATE
PEPSODENT
VICCO
MESVAK
BABOOL
CLOSE UP
MEDICATED
AMWAY
~ 18 ~

CHI SQUARE ANALYSIS
ANALYSIS 1-TYPE OF TOOTHPASTE VS AGE GROUPHYPOTHESIS
Ho : the type of the toothpaste does not have a significant impact on the buying behavior of various age groups.
Crosstabs
Case Processing Summary
30 100.0% 0 .0% 30 100.0%AGE * TYPEN Percent N Percent N Percent
Valid Missing Total
Cases
AGE * TYPE Crosstabulation
Count
6 10 16
2 2 4
7 3 10
15 15 30
between 16-25
between 26-30
above 30
AGE
Total
PASTE GEL
TYPE
Total
Chi-Square Tests
2.600a 2 .273
2.656 2 .265
2.495 1 .114
. . .b
30
Pearson Chi-Square
Likelihood Ratio
Linear-by-LinearAssociation
McNemar-Bowker Test
N of Valid Cases
Value dfAsymp. Sig.
(2-sided)
2 cells (33.3%) have expected count less than 5. Theminimum expected count is 2.00.
a.
Computed only for a PxP table, where P must be greaterthan 1.
b.
~ 19 ~
above 30between 26-30between 16-25
AGE
10
8
6
4
2
0
Co
un
tGEL
PASTETYPE
Bar Chart
Since significance is .273 >.2, thus Ho is accepted, ie the type of the toothpaste does not have a significant impact on the buying behavior of various age groups.
ANALYSIS 2- PLACE OF PURCHASE VS AGE GROUPHYPOTHESIS:-
Ho : the place of purchase of the toothpaste does not have a significant impact on the buying behavior of various age groups.
Crosstabs
Case Processing Summary
30 100.0% 0 .0% 30 100.0%AGE * PLACEN Percent N Percent N Percent
Valid Missing Total
Cases
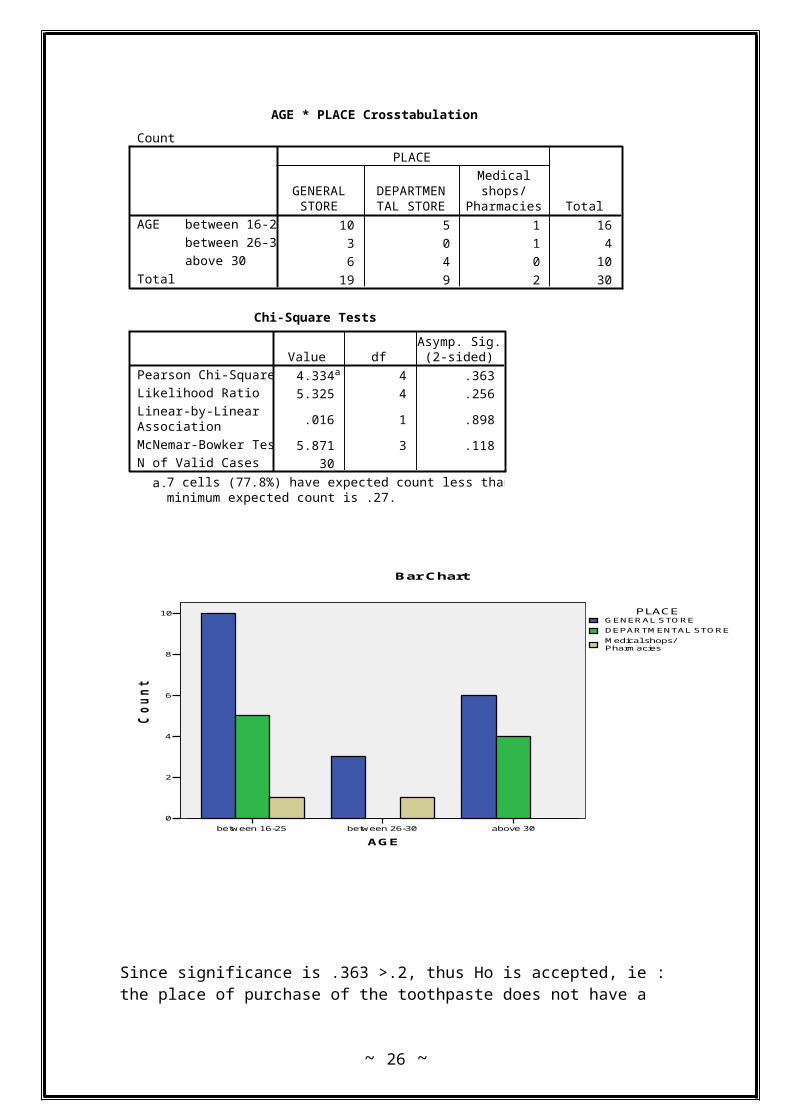
AGE * PLACE Crosstabulation
Count
10 5 1 16
3 0 1 4
6 4 0 10
19 9 2 30
between 16-25
between 26-30
above 30
AGE
Total
GENERALSTORE
DEPARTMENTAL STORE
Medicalshops/
Pharmacies
PLACE
Total
~ 20 ~
Chi-Square Tests
4.334a 4 .363
5.325 4 .256
.016 1 .898
5.871 3 .118
30
Pearson Chi-Square
Likelihood Ratio
Linear-by-LinearAssociation
McNemar-Bowker Test
N of Valid Cases
Value dfAsymp. Sig.
(2-sided)
7 cells (77.8%) have expected count less than 5. Theminimum expected count is .27.
a.
above 30between 26-30between 16-25
AGE
10
8
6
4
2
0
Co
un
t
Medical shops/Pharmacies
DEPARTMENTAL STORE
GENERAL STOREPLACE
Bar Chart
Since significance is .363 >.2, thus Ho is accepted, ie : the place of purchase of the toothpaste does not have a significant impact on the buying behavior of various age groups.
ANALYSIS 3: BRAND VS AGE GROUP
HYPOTHESIS:Ho: the brand of the toothpaste does not have a significant impact on the buying
behavior of various age groups.
Crosstabs
~ 21 ~
Case Processing Summary
30 100.0% 0 .0% 30 100.0%AGE * CURRENTBRANDN Percent N Percent N Percent
Valid Missing Total
Cases
AGE * CURRENTBRAND Crosstabulation
Count
7 5 3 1 0 16
2 1 0 0 1 4
2 3 3 0 2 10
11 9 6 1 3 30
between 16-25
between 26-30
above 30
AGE
Total
COLGATE PEPSODENT CLOSEUP MEDICATED AMWAY
CURRENTBRAND
Total
Chi-Square Tests
6.900a 8 .548
9.240 8 .322
2.190 1 .139
30
Pearson Chi-Square
Likelihood Ratio
Linear-by-LinearAssociation
N of Valid Cases
Value dfAsymp. Sig.
(2-sided)
14 cells (93.3%) have expected count less than 5. Theminimum expected count is .13.
a.
~ 22 ~
above 30between 26-30between 16-25
AGE
7
6
5
4
3
2
1
0
Co
un
t
AMWAY
MEDICATED
CLOSEUP
PEPSODENT
COLGATECURRENTBRAND
Bar Chart
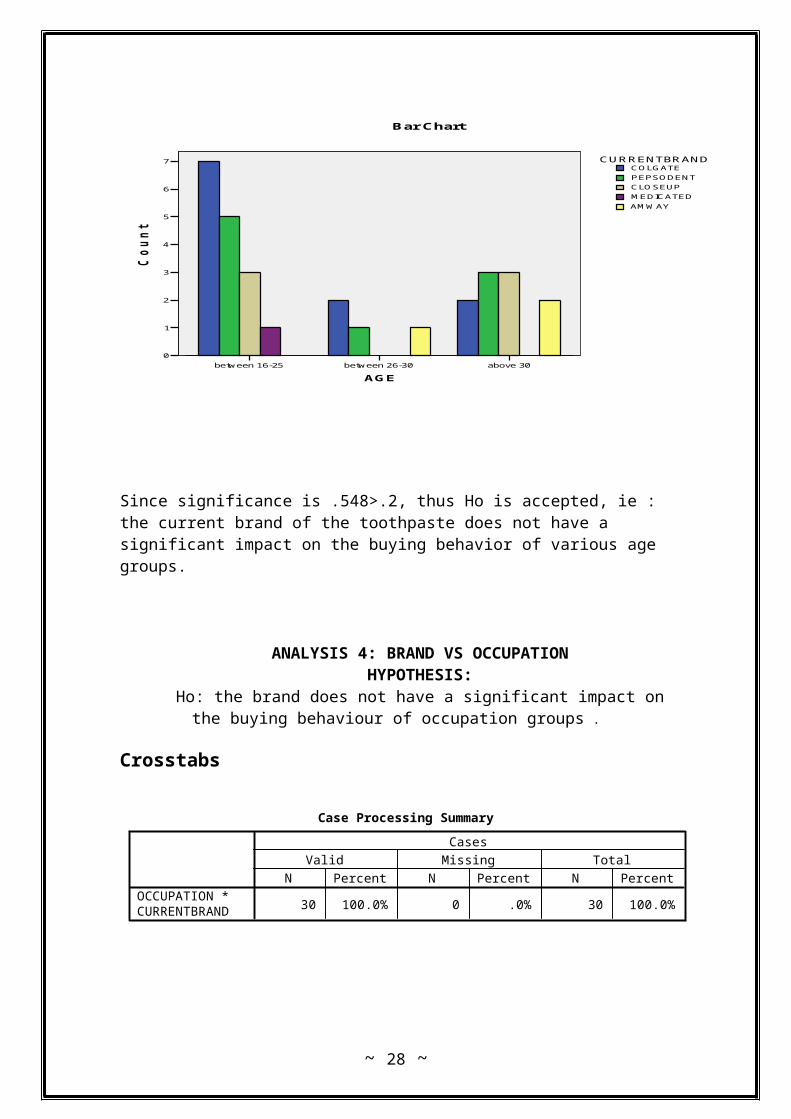
Since significance is .548>.2, thus Ho is accepted, ie : the current brand of the toothpaste does not have a significant impact on the buying behavior of various age groups.
ANALYSIS 4: BRAND VS OCCUPATIONHYPOTHESIS:
Ho: the brand does not have a significant impact on the buying behaviour of occupation groups .
Crosstabs
Case Processing Summary
30 100.0% 0 .0% 30 100.0%OCCUPATION *CURRENTBRAND
N Percent N Percent N Percent
Valid Missing Total
Cases
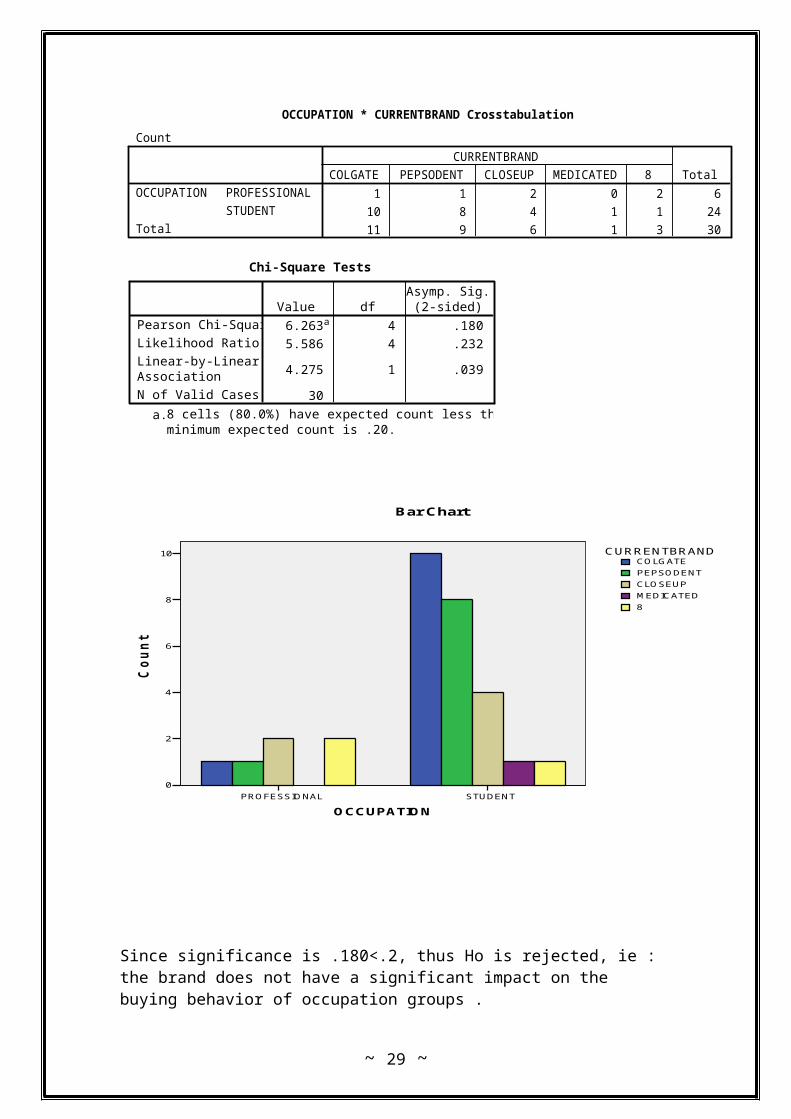
OCCUPATION * CURRENTBRAND Crosstabulation
Count
1 1 2 0 2 6
10 8 4 1 1 24
11 9 6 1 3 30
PROFESSIONAL
STUDENT
OCCUPATION
Total
COLGATE PEPSODENT CLOSEUP MEDICATED 8
CURRENTBRAND
Total
~ 23 ~

Chi-Square Tests
6.263a 4 .180
5.586 4 .232
4.275 1 .039
30
Pearson Chi-Square
Likelihood Ratio
Linear-by-LinearAssociation
N of Valid Cases
Value dfAsymp. Sig.
(2-sided)
8 cells (80.0%) have expected count less than 5. Theminimum expected count is .20.
a.
STUDENTPROFESSIONAL
OCCUPATION
10
8
6
4
2
0
Co
un
t
8
MEDICATED
CLOSEUP
PEPSODENT
COLGATECURRENTBRAND
Bar Chart
Since significance is .180<.2, thus Ho is rejected, ie : the brand does not have a significant impact on the buying behavior of occupation groups .
ANALYSIS 5: GENDER VS BRANDHYPOTHESIS:
Ho: gender of respondents have a significant impact on the brand of toothpaste purchased by them.
Crosstabs
~ 24 ~

Case Processing Summary
30 100.0% 0 .0% 30 100.0%GENDER *CURRENTBRAND
N Percent N Percent N Percent
Valid Missing Total
Cases
GENDER * CURRENTBRAND Crosstabulation
Count
6 4 6 1 1 18
5 5 0 0 2 12
11 9 6 1 3 30
MALE
FEMALE
GENDER
Total
COLGATE PEPSODENT CLOSEUP MEDICATED AMWAY
CURRENTBRAND
Total
Chi-Square Tests
6.599a 4 .159
9.038 4 .060
1.121 1 .290
30
Pearson Chi-Square
Likelihood Ratio
Linear-by-LinearAssociation
N of Valid Cases
Value dfAsymp. Sig.
(2-sided)
8 cells (80.0%) have expected count less than 5. Theminimum expected count is .40.
a.
~ 25 ~
FEMALEMALE
GENDER
6
5
4
3
2
1
0
Co
un
t
AMWAY
MEDICATED
CLOSEUP
PEPSODENT
COLGATECURRENTBRAND
Bar Chart
Since significance is .159<.2, thus Ho is rejected, ie : gender of respondents have a significant impact on the brand of toothpaste purchased by them
ANALYSIS 6: AWARENESS VS GENDERHYPOTHESIS:
Ho: gender has impact on awareness of respondent.Crosstabs
Case Processing Summary
30 100.0% 0 .0% 30 100.0%GENDER * AWARENESSN Percent N Percent N Percent
Valid Missing Total
Cases
~ 26 ~

GENDER * AWARENESS Crosstabulation
Count
4 12 2 0 18
6 5 0 1 12
10 17 2 1 30
MALE
FEMALE
GENDER
Total
STRONGLYAGREE AGREE
NEITHERAGREE NORDISAGREE DISAGREE
AWARENESS
Total
Chi-Square Tests
5.294a 3 .151
6.323 3 .097
.697 1 .404
30
Pearson Chi-Square
Likelihood Ratio
Linear-by-LinearAssociation
N of Valid Cases
Value dfAsymp. Sig.
(2-sided)
5 cells (62.5%) have expected count less than 5. Theminimum expected count is .40.
a.
FEMALEMALE
GENDER
12
10
8
6
4
2
0
Co
un
t
DISAGREE
NEITHER AGREE NORDISAGREE
AGREE
STRONGLY AGREEAWARENESS
Bar Chart
Since significance is .151 <.2, thus Ho is rejected, ie : gender of respondents have a significant impact on the awareness regarding manufacturing date etc. toothpaste purchased by them
~ 27 ~
ANALYSIS 7: AGE VS BAD BREATH PROTECTIONHYPOTHESIS:Ho : bad breath protection is an important criteria for the respondents of age group between 15 to 30 years.
AGE * BADBREATHPROTECTION
Report
AGE
1.00 9 .000
2.00 17 .935
3.00 2 .000
2.50 2 .707
1.80 30 .925
BADBREATHPROTECTIONSTRONGLY AGREE
AGREE
NEITHER AGREENOR DISAGREE
DISAGREE
Total
Mean N Std. Deviation
ANOVA Table
10.300 3 3.433 6.156 .003
14.500 26 .558
24.800 29
(Combined)Between Groups
Within Groups
Total
AGE *BADBREATHPROTECTION
Sum ofSquares df Mean Square F Sig.
the significance is .003<.05 thus Ho is rejected and the bad breath protection is an important criteria for consumers in the age group of 15 to 30 years.
ANALYSIS 8: AGE GROUP VS IMPORTED BETTERHYPOTHESIS:Ho: major respondents in the given age group consider imported products to be better than Indian products.AGE * IMPORTEDBETTER
Crosstab
Count
2 1 6 6 1 16
0 3 1 0 0 4
2 6 2 0 0 10
4 10 9 6 1 30
between 16-25
between 26-30
above 30
AGE
Total
STRONGLYAGREE AGREE
NEITHERAGREE NORDISAGREE DISAGREE
STRONGLYDISAGREE
IMPORTEDBETTER
Total
~ 28 ~
Chi-Square Tests
15.404a 8 .052
19.427 8 .013
8.054 1 .005
30
Pearson Chi-Square
Likelihood Ratio
Linear-by-LinearAssociation
N of Valid Cases
Value dfAsymp. Sig.
(2-sided)
14 cells (93.3%) have expected count less than 5. Theminimum expected count is .13.
a.
above 30between 26-30between 16-25
AGE
6
5
4
3
2
1
0
Co
un
t
STRONGLY DISAGREE
DISAGREE
NEITHER AGREE NORDISAGREE
AGREE
STRONGLY AGREEIMPORTEDBETTER
Bar Chart
The significance is .052 approx = .05 thus we can say that the major respondents in the given age group consider imported products to be better than Indian products.
~ 29 ~

FACTOR ANALYSIS
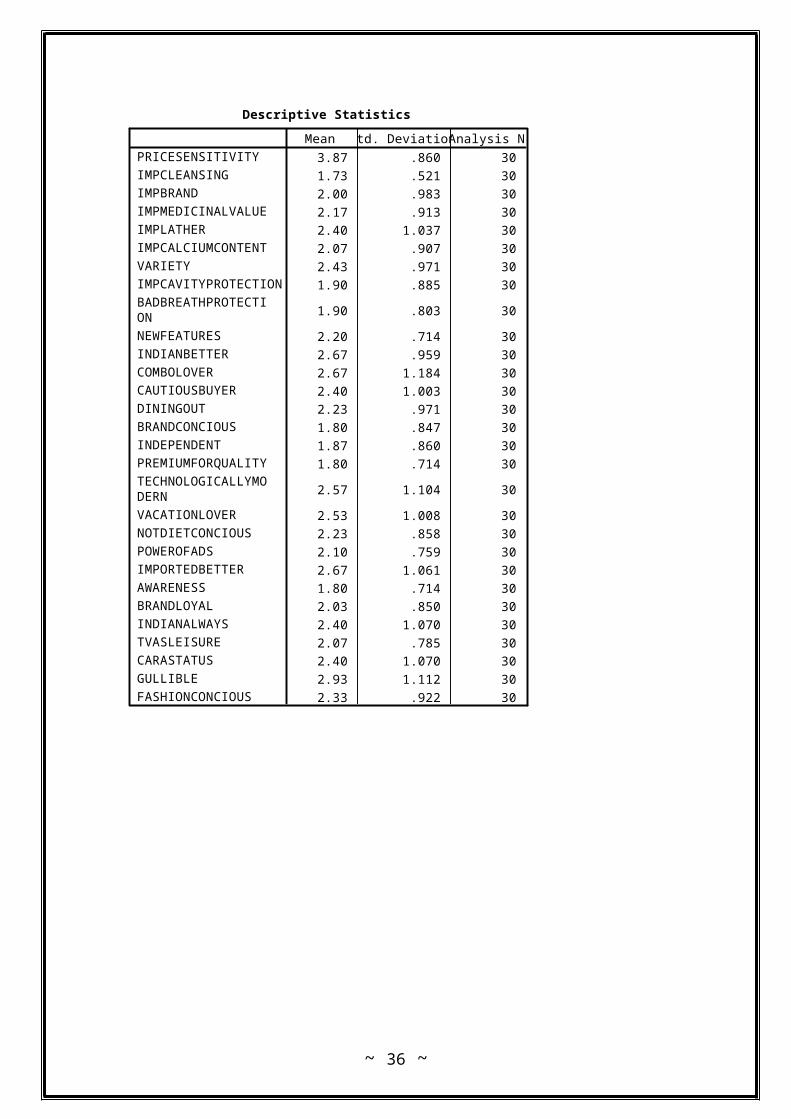
Descriptive Statistics
3.87 .860 30
1.73 .521 30
2.00 .983 30
2.17 .913 30
2.40 1.037 30
2.07 .907 30
2.43 .971 30
1.90 .885 30
1.90 .803 30
2.20 .714 30
2.67 .959 30
2.67 1.184 30
2.40 1.003 30
2.23 .971 30
1.80 .847 30
1.87 .860 30
1.80 .714 30
2.57 1.104 30
2.53 1.008 30
2.23 .858 30
2.10 .759 30
2.67 1.061 30
1.80 .714 30
2.03 .850 30
2.40 1.070 30
2.07 .785 30
2.40 1.070 30
2.93 1.112 30
2.33 .922 30
PRICESENSITIVITY
IMPCLEANSING
IMPBRAND
IMPMEDICINALVALUE
IMPLATHER
IMPCALCIUMCONTENT
VARIETY
IMPCAVITYPROTECTION
BADBREATHPROTECTION
NEWFEATURES
INDIANBETTER
COMBOLOVER
CAUTIOUSBUYER
DININGOUT
BRANDCONCIOUS
INDEPENDENT
PREMIUMFORQUALITY
TECHNOLOGICALLYMODERN
VACATIONLOVER
NOTDIETCONCIOUS
POWEROFADS
IMPORTEDBETTER
AWARENESS
BRANDLOYAL
INDIANALWAYS
TVASLEISURE
CARASTATUS
GULLIBLE
FASHIONCONCIOUS
Mean Std. Deviation Analysis N
~ 30 ~

Communalities
1.000 .647
1.000 .813
1.000 .825
1.000 .809
1.000 .791
1.000 .727
1.000 .867
1.000 .709
1.000 .776
1.000 .788
1.000 .870
1.000 .837
1.000 .740
1.000 .841
1.000 .816
1.000 .856
1.000 .836
1.000 .833
1.000 .863
1.000 .687
1.000 .760
1.000 .922
1.000 .777
1.000 .810
1.000 .811
1.000 .735
1.000 .828
1.000 .708
1.000 .554
PRICESENSITIVITY
IMPCLEANSING
IMPBRAND
IMPMEDICINALVALUE
IMPLATHER
IMPCALCIUMCONTENT
VARIETY
IMPCAVITYPROTECTION
BADBREATHPROTECTION
NEWFEATURES
INDIANBETTER
COMBOLOVER
CAUTIOUSBUYER
DININGOUT
BRANDCONCIOUS
INDEPENDENT
PREMIUMFORQUALITY
TECHNOLOGICALLYMODERN
VACATIONLOVER
NOTDIETCONCIOUS
POWEROFADS
IMPORTEDBETTER
AWARENESS
BRANDLOYAL
INDIANALWAYS
TVASLEISURE
CARASTATUS
GULLIBLE
FASHIONCONCIOUS
Initial Extraction
Extraction Method: Principal Component Analysis.
~ 31 ~

Total Variance Explained
8.037 27.715 27.715 8.037 27.715 27.715 6.091 21.004 21.004
4.517 15.577 43.292 4.517 15.577 43.292 3.103 10.698 31.703
2.268 7.819 51.111 2.268 7.819 51.111 2.839 9.789 41.492
1.965 6.777 57.888 1.965 6.777 57.888 2.687 9.265 50.756
1.836 6.333 64.220 1.836 6.333 64.220 2.487 8.575 59.331
1.579 5.446 69.666 1.579 5.446 69.666 2.034 7.013 66.344
1.446 4.988 74.654 1.446 4.988 74.654 1.970 6.795 73.139
1.188 4.095 78.749 1.188 4.095 78.749 1.627 5.610 78.749
.993 3.425 82.174
.888 3.061 85.236
.830 2.863 88.099
.729 2.515 90.613
.621 2.140 92.753
.446 1.538 94.291
.393 1.357 95.648
.325 1.121 96.769
.259 .894 97.663
.215 .741 98.404
.152 .526 98.929
.108 .373 99.303
.081 .280 99.582
.044 .152 99.734
.037 .126 99.860
.022 .076 99.936
.010 .034 99.970
.006 .021 99.991
.002 .008 99.999
.000 .001 100.000
-9.5E-017 -3.26E-016 100.000
Component1
2
3
4
5
6
7
8
9
10
11
12
13
14
15
16
17
18
19
20
21
22
23
24
25
26
27
28
29
Total % of Variance Cumulative % Total % of Variance Cumulative % Total % of Variance Cumulative %
Initial Eigenvalues Extraction Sums of Squared Loadings Rotation Sums of Squared Loadings
Extraction Method: Principal Component Analysis.
Total variance explained by the eight factors is 78.749% which is a significant proportion.
~ 32 ~

Rotated Component Matrixa
-.427 .099 .056 .104 -.162 -.506 -.393 .056
-.024 -.135 -.052 -.159 -.023 .068 -.087 .868
.385 -.482 .060 .118 -.334 -.087 .371 .413
.805 .037 -.033 -.096 .336 .040 -.098 .160
.057 .037 .857 .122 .015 -.046 .182 -.040
.517 -.043 .072 -.362 .203 -.347 .336 .215
-.041 .122 .116 .905 -.080 .098 -.054 -.010
.225 .144 .137 -.020 -.121 .764 -.110 .086
.693 .031 .135 -.142 -.435 -.124 .056 -.219
.263 .082 .682 .097 .301 -.194 -.322 -.072
.359 .501 .333 .263 .132 -.445 .003 -.306
.053 .705 .221 .204 .088 .119 .350 -.320
.237 .455 .495 .123 .197 .183 .228 .305
.748 .179 .320 .079 .184 .085 .216 .230
.823 -.102 .116 .042 .085 .278 .149 .079
.899 .052 -.044 -.006 .044 .126 -.080 -.140
.821 .155 .217 -.154 .080 .198 .120 -.088
.462 .382 -.099 .400 .389 -.195 -.320 -.112
.317 .025 .359 -.053 .784 -.062 .015 -.108
.061 .082 .064 .043 .756 .075 .306 -.006
.582 .597 .120 .160 .136 -.001 .075 -.002
.050 .364 -.221 .479 .463 -.089 .456 .279
.581 .187 .449 -.036 -.218 .331 .185 .100
.492 .051 .578 .313 .172 .173 -.214 -.166
.044 .891 -.037 .095 -.043 .057 -.012 -.021
.128 .170 .074 .033 .217 -.109 .783 -.111
-.130 .121 .163 .822 .102 -.192 .098 -.194
-.048 .503 .347 .515 .033 -.239 .094 .000
.235 -.034 -.327 -.080 .269 .552 -.084 -.010
PRICESENSITIVITY
IMPCLEANSING
IMPBRAND
IMPMEDICINALVALUE
IMPLATHER
IMPCALCIUMCONTENT
VARIETY
IMPCAVITYPROTECTION
BADBREATHPROTECTION
NEWFEATURES
INDIANBETTER
COMBOLOVER
CAUTIOUSBUYER
DININGOUT
BRANDCONCIOUS
INDEPENDENT
PREMIUMFORQUALITY
TECHNOLOGICALLYMODERN
VACATIONLOVER
NOTDIETCONCIOUS
POWEROFADS
IMPORTEDBETTER
AWARENESS
BRANDLOYAL
INDIANALWAYS
TVASLEISURE
CARASTATUS
GULLIBLE
FASHIONCONCIOUS
1 2 3 4 5 6 7 8
Component
Extraction Method: Principal Component Analysis. Rotation Method: Varimax with Kaiser Normalization.
Rotation converged in 21 iterations.a.
Component Transformation Matrix
.771 .358 .376 .171 .269 .083 .163 -.037
-.480 .489 .191 .575 .152 -.300 .004 -.225
-.117 .123 -.501 -.091 .661 .061 .466 .231
-.054 -.449 .479 -.117 .193 -.618 .300 .208
-.140 .065 .167 .237 -.483 .336 .608 .420
-.156 -.362 .289 .350 .413 .490 -.366 .306
.337 -.240 -.475 .607 -.152 -.351 -.117 .271
-.037 .473 .060 -.267 -.044 -.204 -.386 .713
Component1
2
3
4
5
6
7
8
1 2 3 4 5 6 7 8
Extraction Method: Principal Component Analysis. Rotation Method: Varimax with Kaiser Normalization.
~ 33 ~

Factor1 Factor2 Factor3 Factor4 Factor5 Factor6 Factor7 Factor8
Medicinal value
Indian better Imp to lather
Variety Vacation lover
Imp to cavity protection
Tv as leisure
Imp to cleansing
Bad breath protection
Combo lover New features
Imported better
Not diet conscious
Fashion conscious
Dining out Power of ads Cautious buyer
Car a status symbol
Brand conscious
Indian always Brand loyal
gullible
IndependentPremium for qualityawareness
NAME OF FACTORS
PREMIUM BENEFITS
PROMOTIONAL OFFERS
VALUE FOR MONEY
STATUS IN BRANDS
FUN LOVING
FASHION ANS LOOKS
TV AS MEDIUM OF PROMOTION
FEATURE
~ 34 ~
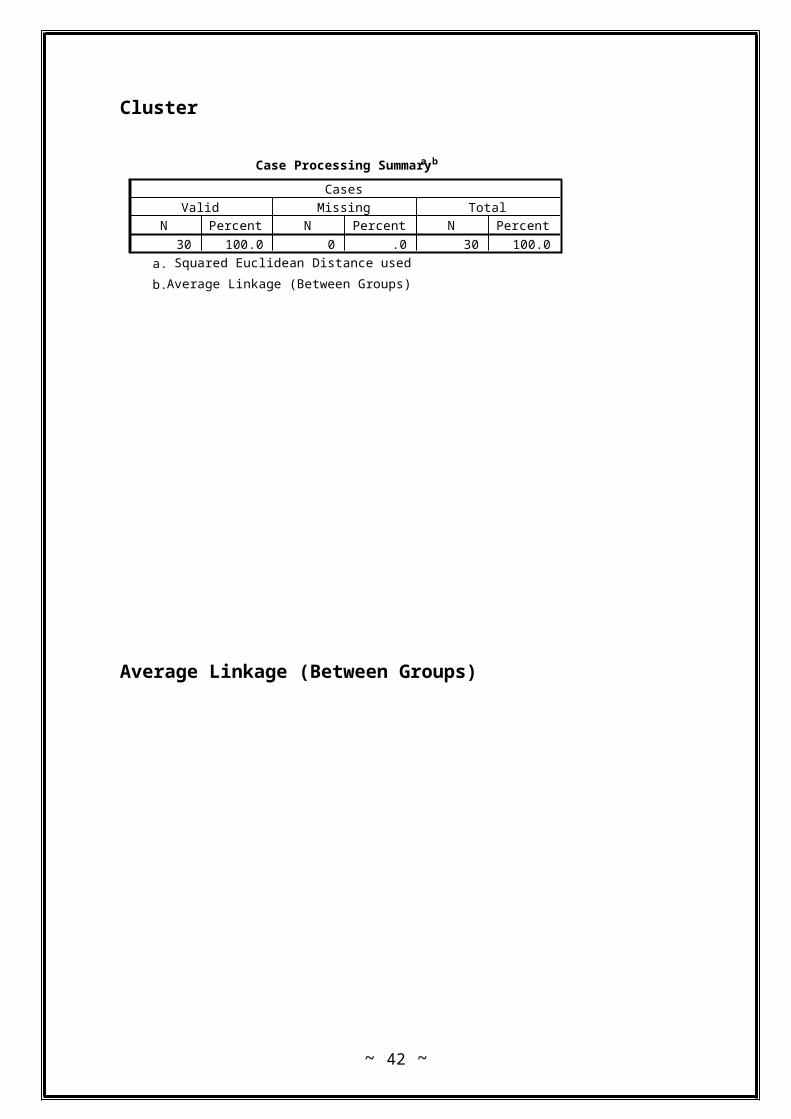
Cluster Analysis
Cluster Analysis is a class of techniques used to classify objects or cases into relatively homogeneous groups called clusters. Objects in each cluster tend to be similar to each other and dissimilar to objects in the other clusters. Cluster analysis is also called classification analysis or numerical taxonomy. Cluster Analysis is also used for the following:1.Segmenting the market: For ex: Consumers may be clustered on the basis of benefits sought from the purchase of a product. Each cluster would consist of consumers who are relatively homogenous in terms of the benefits they seek. This approach is called benefitsegmentation.2.Understanding Buyer Behaviours: Cluster Analysis can be used to identify homogenous groups of buyers. Then the buying behaviour of each group can be examined separately.3.Identifying new product opportunities: By clustering brands and products, competitive sets within the market can be determined.4.Selecting Test Markets 5.Reducing Data: Clustering analysis can be used as general data reduction tool to develop clusters or subgroups of data that are more manageable than individual observations.
Cluster
Case Processing Summarya,b
30 100.0 0 .0 30 100.0N Percent N Percent N Percent
Valid Missing Total
Cases
Squared Euclidean Distance useda.
Average Linkage (Between Groups)b.
~ 35 ~
Average Linkage (Between Groups)
Agglomeration Schedule
22 28 14.000 0 0 2
22 24 20.000 1 0 8
14 20 32.000 0 0 6
15 26 37.000 0 0 15
25 29 41.000 0 0 24
12 14 41.000 0 3 10
11 16 43.000 0 0 20
2 22 43.333 0 2 12
23 27 44.000 0 0 21
5 12 44.333 0 6 15
3 6 46.000 0 0 14
2 17 47.500 8 0 16
19 30 50.000 0 0 25
3 7 50.000 11 0 18
5 15 50.250 10 4 17
2 9 53.200 12 0 18
5 18 53.333 15 0 19
2 3 55.111 16 14 21
5 10 55.429 17 0 24
11 13 59.500 7 0 22
2 23 62.222 18 9 23
4 11 64.000 0 20 23
2 4 69.227 21 22 25
5 25 69.500 19 5 26
2 19 83.467 23 13 26
2 5 87.676 25 24 27
1 2 105.222 0 26 28
1 8 113.536 27 0 29
1 21 116.034 28 0 0
Stage1
2
3
4
5
6
7
8
9
10
11
12
13
14
15
16
17
18
19
20
21
22
23
24
25
26
27
28
29
Cluster 1 Cluster 2
Cluster Combined
Coefficients Cluster 1 Cluster 2
Stage Cluster FirstAppears
Next Stage
~ 36 ~

Quick Cluster
~ 37 ~

Final Cluster Centers
1 1 1 1
1 1 1 1
1 1 0 0
1 1 1 1
1 1 0 1
1 1 1 0
0 0 0 0
1 0 1 0
1 6 2 2
1 1 2 2
1 1 2 1
4 2 2 3
2 2 1 2
2 1 2 2
1 2 1 1
0 1 0 1
1 1 1 0
1 1 1 1
1 0 1 0
1 1 1 1
1 0 1 0
0 1 1 0
0 1 1 1
0 0 1 0
0 1 1 1
2 1 2 2
1 1 2 2
4 4 5 3
2 2 1 2
2 2 1 2
2 2 2 3
3 2 2 3
2 2 2 2
3 2 4 2
2 2 2 2
2 2 2 3
2 2 2 3
3 3 4 3
2 3 4 3
2 2 3 2
2 2 2 3
2 2 1 3
2 2 2 3
2 2 2 3
2 2 4 3
3 2 2 3
3 2 2 2
2 2 3 3
3 2 4 2
2 2 1 2
2 2 2 3
2 2 5 2
2 2 3 2
3 2 4 2
3 3 5 3
2 2 2 3
1 1 1 2
2 2 2 2
1 2 2 2
AWARECOL
AWAREPEP
AWAREVIC
AWAREMES
AWAREBAB
AWARECLO
AWAREMED
AWAREAMW
CURRENTBRAND
USEFREQUENCY
PURCHASEFREQUENCY
TIME
SWITCHINGFREQUENCY
TYPE
PLACE
PRICE
CLEANSINGPOWER
MEDICINALVALUE
LATHER
CALCIUMCONTENT
CAVITYPROTECTION
PREVETIONAGAINSTBADBREADTH
ANTIBACTERIAL
FLAVORS
BRAND
PROMOTIONMODE
INFLUENCER
PRICESENSITIVITY
IMPCLEANSING
IMPBRAND
IMPMEDICINALVALUE
IMPLATHER
IMPCALCIUMCONTENT
VARIETY
IMPCAVITYPROTECTION
BADBREATHPROTECTION
NEWFEATURES
INDIANBETTER
COMBOLOVER
CAUTIOUSBUYER
DININGOUT
BRANDCONCIOUS
INDEPENDENT
PREMIUMFORQUALITY
TECHNOLOGICALLYMODERN
VACATIONLOVER
NOTDIETCONCIOUS
POWEROFADS
IMPORTEDBETTER
AWARENESS
BRANDLOYAL
INDIANALWAYS
TVASLEISURE
CARASTATUS
GULLIBLE
FASHIONCONCIOUS
GENDER
OCCUPATION
AGE
1 2 3 4
Cluster
PROFILING OF CLUSTERS
~ 38 ~

IMPORTANT VARIABLES IN DECREASING ORDERCURRENT BRANDBRAND CONCIOUSTECHNINOGICALY MODERNBRAND LOYALTIMEINDEPENDENTPRICE SENSITIVITYINDIAN ALWAYSNEW FEATURESVARIETYINDIAN BETTERDINING OUTCOMBO LOVERINDIAN BETTERCAUTIOUS BUYERGULLIBLENOT DIET CONCIOUS
1 2 3 4CURRENT BRAND BRAND CONCIOUSTECHNINOGICALY MODERNBRAND LOYALTIMEINDEPENDENTPRICE SENSITIVITYINDIAN ALWAYSNEW FEATURESVARIETYDINING OUTCOMBO LOVERINDIAN BETTERCAUTIOUS BUYERGULLIBLENOT DIET CONCIOUS
VARIETY SEEKERS
BRAND USERS
VALUE FOR MONEY
BRAND CONCIOUS
*The stars represent the different variables which play important role to respondents in the concerned cluster.
Conclusion
1. Chi-square Analysis:
~ 39 ~

a) ANALYSIS 1-TYPE OF TOOTHPASTE VS AGE GROUP- the type of the toothpaste does not have a significant impact on the buying behaviour of various age groups.
b) ANALYSIS 2- PLACE OF PURCHASE VS AGE GROUP-the place of purchase of the toothpaste does not have a significant impact on the buying behaviour of various age groups.
c) ANALYSIS 3: BRAND VS AGE GROUP-the current brand of the toothpaste does not have a significant impact on the buying behaviour of various age groups.
d) ANALYSIS 4: BRAND VS OCCUPATION-the brand does not have a significant impact on the buying behaviour of occupation groups.
e) ANALYSIS 5: GENDER VS BRAND-gender of respondents has a significant impact on the brand of toothpaste purchased by them.
f) ANALYSIS 6: AWARENESS VS GENDER-gender of respondents has a significant impact on the awareness regarding manufacturing date etc. toothpaste purchased by them
g) ANALYSIS 7: AGE GROUP VS BAD BREATH PROTECTION- bad breath protection is an important criteria for selecting toothpaste for the concerned age group.
h) ANALYSIS 8: AGE GROUP VS IMPORTED BETTER- major respondents in the given age group consider imported products to be better than Indian products.
2. Cluster analysis:
Name of the clusters:
The four types of respondents are as follows:
1. VARIETY SEEKERS- These type of respondents always look for variety. They are willing to try new brands which are launched in the market.
2. BRAND USERS- They are the respondents who usually use the brand which suits their personality and needs.
3. VALUE FOR MONEY- They are the respondents who are always in search of better deals i.e. they purchase those brands which they think are good and is worth enough to pay a particular amount.
4. BRAND CONCIOUS- These are the respondents who conscious about the brand they use, they don’t want to try new brands in the market. They only use the brand which they have been using from a very long time.
~ 40 ~

3. Factor Analysis:
Name of the factors:
In the factor analysis we have clubbed the 29 variables into 8 factors which are a follows:
1. PREMIUM BENEFITS- the factor represents variables that are highly focused on the quality aspect of the brand, they are brand conscious.
2. PROMOTIONAL OFFERS- the factor represents variables encompass the promotional offers, they want combo packs or discount.
3. VALUE FOR MONEY- the factor represents variables that include great deals and brand loyalty.
4. STATUS IN BRANDS- the factor represents variables that products which increases their status in the society. They always try creating status symbol by purchasing brands which have attractive packaging and unique promotional strategy.
5. FUN LOVING- the factor represents variables that show outgoingness of respondents and are somewhat carefree.
6. FASHION AND LOOKS- the factor represents variables like brands whose image is trendy and fashionable in the society.
7. TV AS MEDIUM OF PROMOTION- the factor represents variables which include responsiveness to the way company promotes its brand, purchase decision is dependent on the promotion of the brand. 8. FEATURE- the factor represents variables which include the ultimate benefits of the product regardless to the brand.
BUSINESS REPORT:-
Based on the finding in the conclusive research we hereby make some recommendations regarding the buying behaviour of the customers:
~ 41 ~
The male customers are more alert and aware about the shelf life of the products
Age group is basically related to bad breath protection according to our survey data, this means that the consumers in the age group of 15-30 are concerned about features of the toothpaste which help them to create a good image in society and among peers.
Youngsters prefer imported products with better features. Majority of the respondents belong to the cluster of variety seekers, as the
product is of FMCG sector and is a necessity thus customers want different flavours, added benefits which may suit their needs.
~ 42 ~