Mr Chalk the Teacher:
52
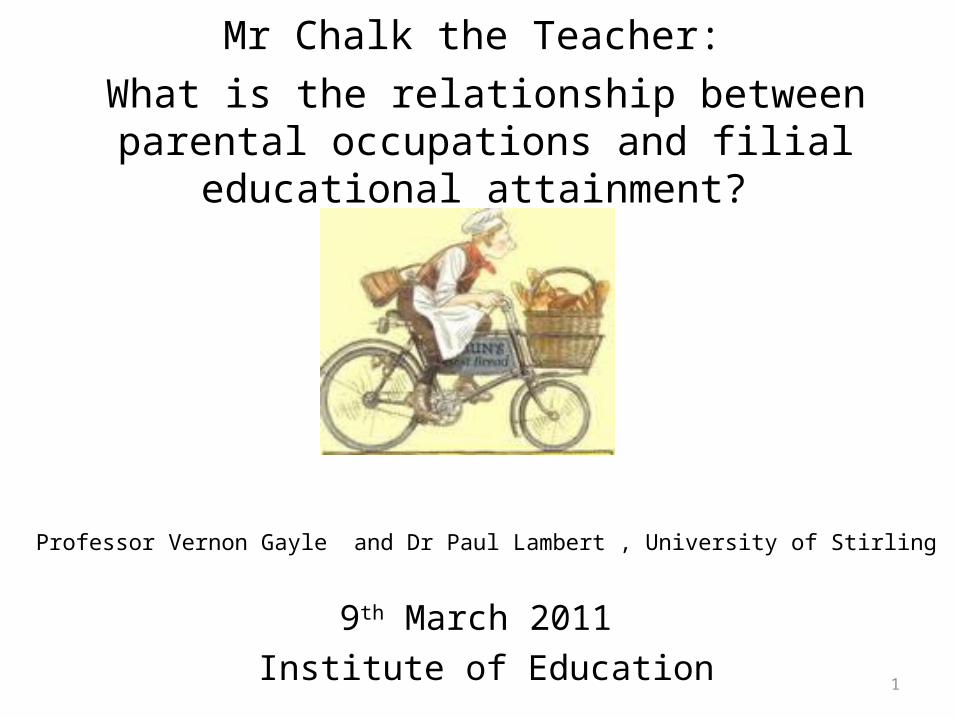
1 Mr Chalk the Teacher: What is the relationship between parental occupations and filial educational attainment? Professor Vernon Gayle and Dr Paul Lambert , University of Stirling 9 th March 2011 Institute of Education
-
Upload
bree-brewer -
Category
Documents
-
view
21 -
download
0
description
Mr Chalk the Teacher: What is the relationship between parental occupations and filial educational attainment? Professor Vernon Gayle and Dr Paul Lambert , University of Stirling 9 th March 2011 Institute of Education. BEWARE!. WORK IN PROGRESS Mainly exploratory analyses - PowerPoint PPT Presentation
Transcript of Mr Chalk the Teacher:
1
Mr Chalk the Teacher: What is the relationship between parental
occupations and filial educational attainment?
Professor Vernon Gayle and Dr Paul Lambert , University of Stirling
9th March 2011 Institute of Education

2
BEWARE!
WORK IN PROGRESS
Mainly exploratory analyses
The title is a play on the traditional card game featuring occupations
The game was devised by John Jaques II (who is also credited with inventing tiddlywinks, ludo and snakes and ladders) before the Great Exhibition of 1851 (Wikipedia)
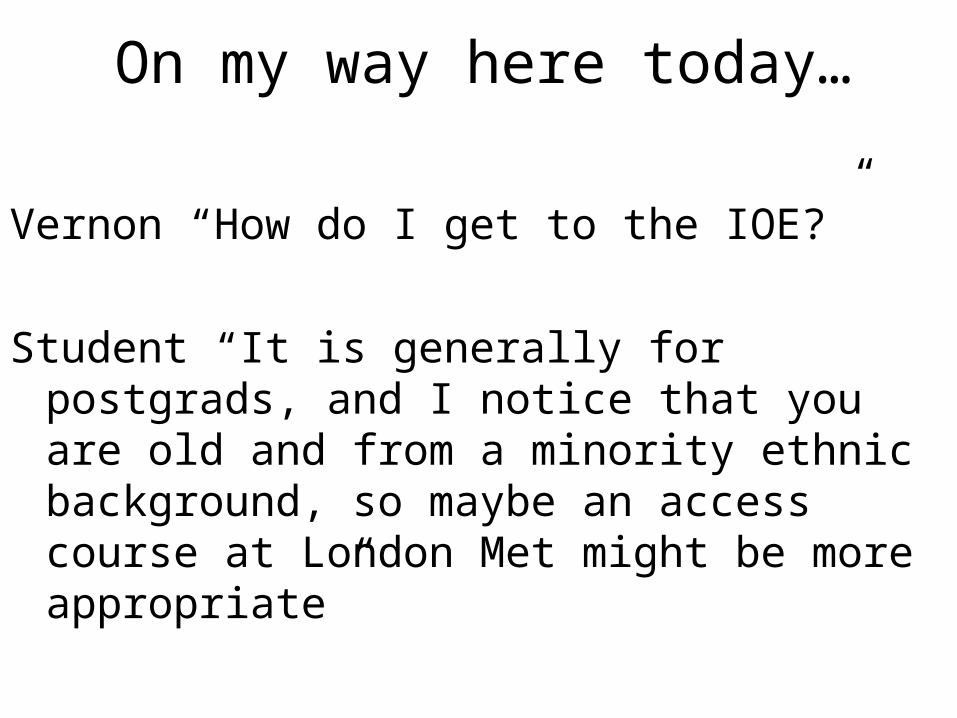
On my way here today…
Vernon “How do I get to the IOE?”
Student “It is generally for postgrads, and I notice that you are old and from a minority ethnic background, so maybe an access course at London Met might be more appropriate”
4
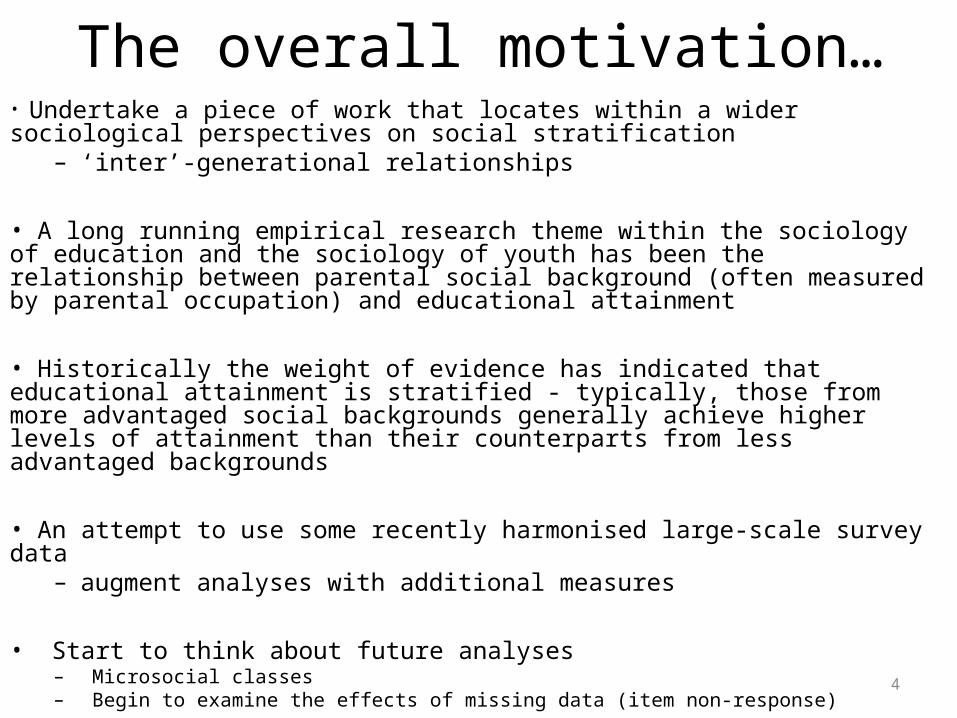
The overall motivation…• Undertake a piece of work that locates within a wider sociological perspectives on social stratification
– ‘inter’-generational relationships
• A long running empirical research theme within the sociology of education and the sociology of youth has been the relationship between parental social background (often measured by parental occupation) and educational attainment
• Historically the weight of evidence has indicated that educational attainment is stratified - typically, those from more advantaged social backgrounds generally achieve higher levels of attainment than their counterparts from less advantaged backgrounds
• An attempt to use some recently harmonised large-scale survey data– augment analyses with additional measures
• Start to think about future analyses – Microsocial classes– Begin to examine the effects of missing data (item non-response)
5
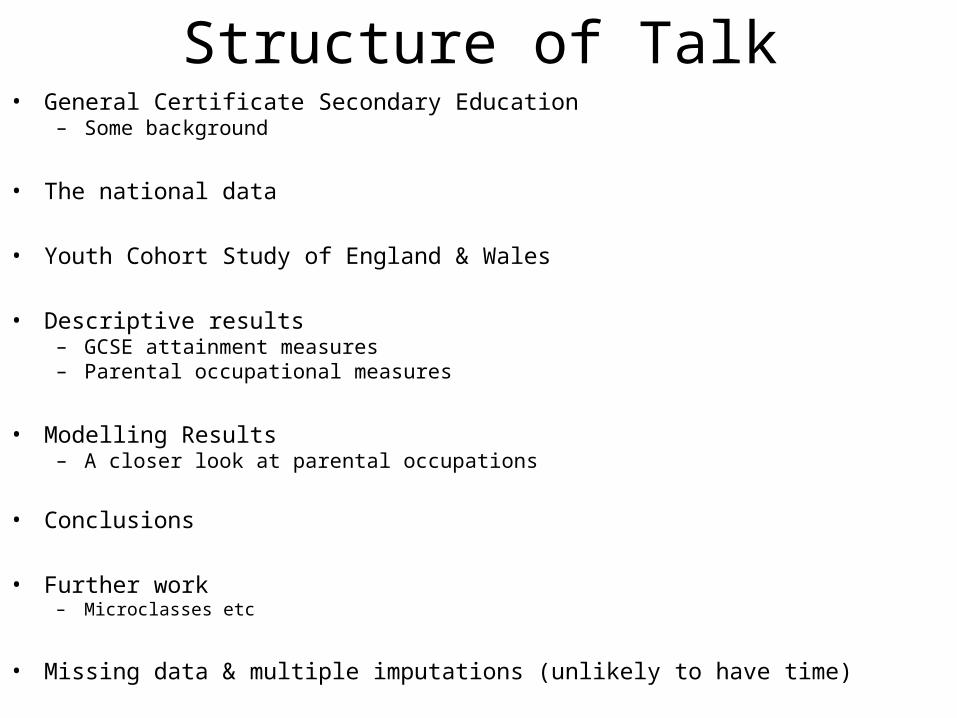
Structure of Talk• General Certificate Secondary Education
– Some background
• The national data
• Youth Cohort Study of England & Wales
• Descriptive results– GCSE attainment measures– Parental occupational measures
• Modelling Results– A closer look at parental occupations
• Conclusions
• Further work – Microclasses etc
• Missing data & multiple imputations (unlikely to have time)
6
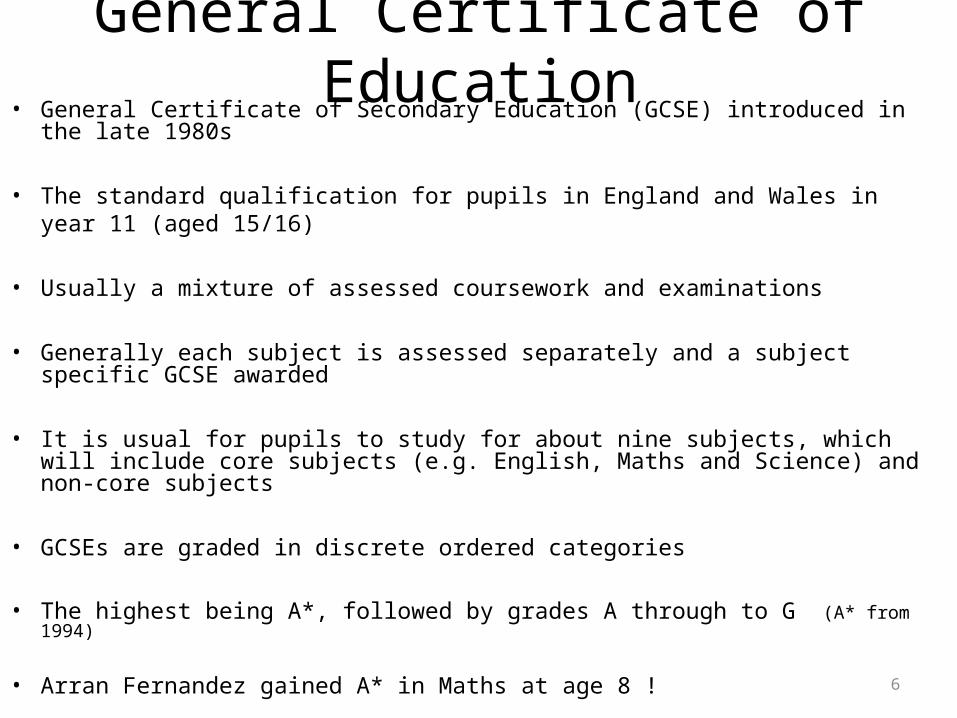
General Certificate of Education• General Certificate of Secondary Education (GCSE) introduced in the late 1980s
• The standard qualification for pupils in England and Wales inyear 11 (aged 15/16)
• Usually a mixture of assessed coursework and examinations
• Generally each subject is assessed separately and a subject specific GCSE awarded
• It is usual for pupils to study for about nine subjects, which will include core subjects (e.g. English, Maths and Science) and non-core subjects
• GCSEs are graded in discrete ordered categories
• The highest being A*, followed by grades A through to G (A* from 1994)
• Arran Fernandez gained A* in Maths at age 8 !

7
General Certificate of Education• The Education Reform Act 1988 led to rapid changes in the secondary school
curriculum, and to the organisation, management and financing of schools
• A major change for pupils was the introduction of the General Certificate of Secondary Education (GCSE)
• GCSEs differed from the qualifications that they replaced
– A new grading scheme was established and all pupils were entered for a common set of examinations
– There were also changes in the content and format of examinations and assessment by coursework was introduced
• School league tables were published
• A newsworthy item each summer– Previously only teachers, parents and pupils knew when exam day was
8
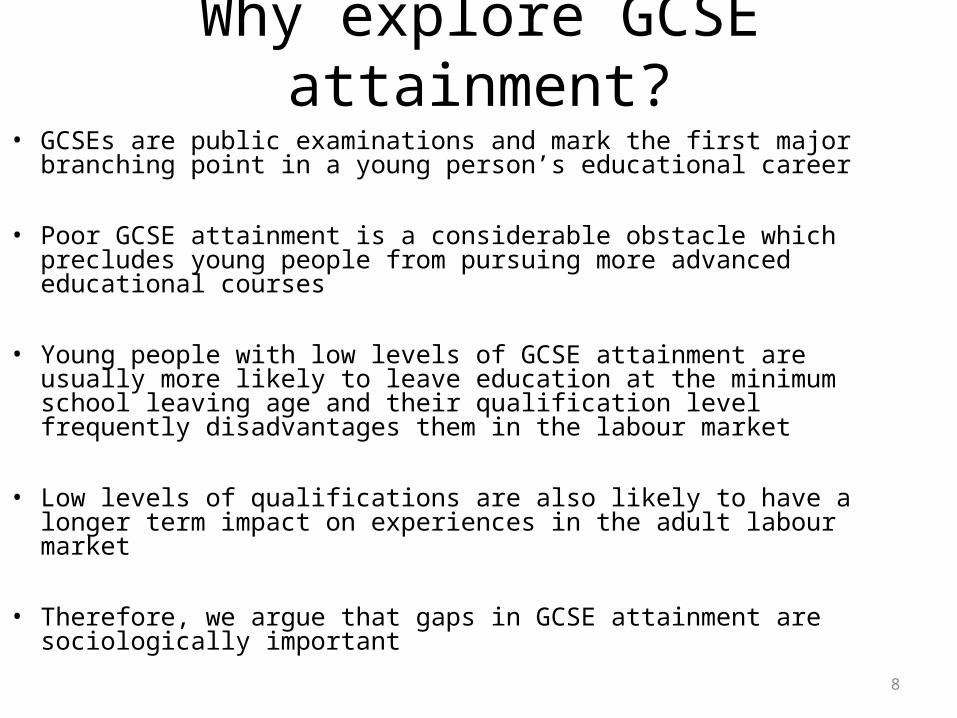
Why explore GCSE attainment?• GCSEs are public examinations and mark the first major branching point
in a young person’s educational career
• Poor GCSE attainment is a considerable obstacle which precludes young people from pursuing more advanced educational courses
• Young people with low levels of GCSE attainment are usually more likely to leave education at the minimum school leaving age and their qualification level frequently disadvantages them in the labour market
• Low levels of qualifications are also likely to have a longer term impact on experiences in the adult labour market
• Therefore, we argue that gaps in GCSE attainment are sociologically important

9
Department for Education and Skills (2007) Gender and Education: The evidence on pupils in England

10
Year All pupils Boys Girls
% % %
1990 34.5 30.8 38.4
1991 36.8 33.3 40.3
1992 38.3 34.1 42.7
1993 41.2 36.8 45.8
1994 43.3 39.1 47.8
1995 43.5 39.0 48.1
1996 44.5 39.9 49.4
1997 45.1 40.5 50.0
1998 46.3 41.3 51.5
1999 47.9 42.8 53.4
2000 49.2 44.0 54.6
2001 50.0 44.8 55.4
2002 51.6 46.4 57.0
2003 52.9 47.9 58.2
2004 53.7 48.4 58.4
2005 56.3 51.4 61.4
2006 58.5 53.8 63.5
2007 60.3 55.8 65.0
2008 65.3 60.9 69.9
National Figures, % of pupils gaining
5+ GCSEs (grades A*-C)
Percentage aged 15 on roll in all English schools
Figures 1998 onwards are for GCSE & GNVQ equivalent
Data Sources DfE&E; DfES; DfCSF
Table 1 http://www.bstubbs.co.uk/5a-c.htm#table1

11
Youth Cohort Study of England & Wales (YCS)
• Major Longitudinal Study began Mid-1980s
• Designed to monitor behaviour of young people as they reach the minimum school leaving age and either stay on in education of enter the labour market
• Experiences of Education (qualifications); Employment; Training; Aspirations; Family; Personal characteristic & circumstances
• Nationally representative; Large sample size; Panel data (albeit short); Possible to compare cohorts (trends over time)
• Study contacts a sample from an academic year group (cohort) in the spring following completion of compulsory education
• The sample is designed to be representative of all Year 11 pupils in England & Wales
• Sample are tracked for 3 (sometimes 4) waves (called Sweeps) of data collection
• Growing up in the 1990s the GCSE era; Partly fills the gap left by the missing 198(2) birth cohort
12
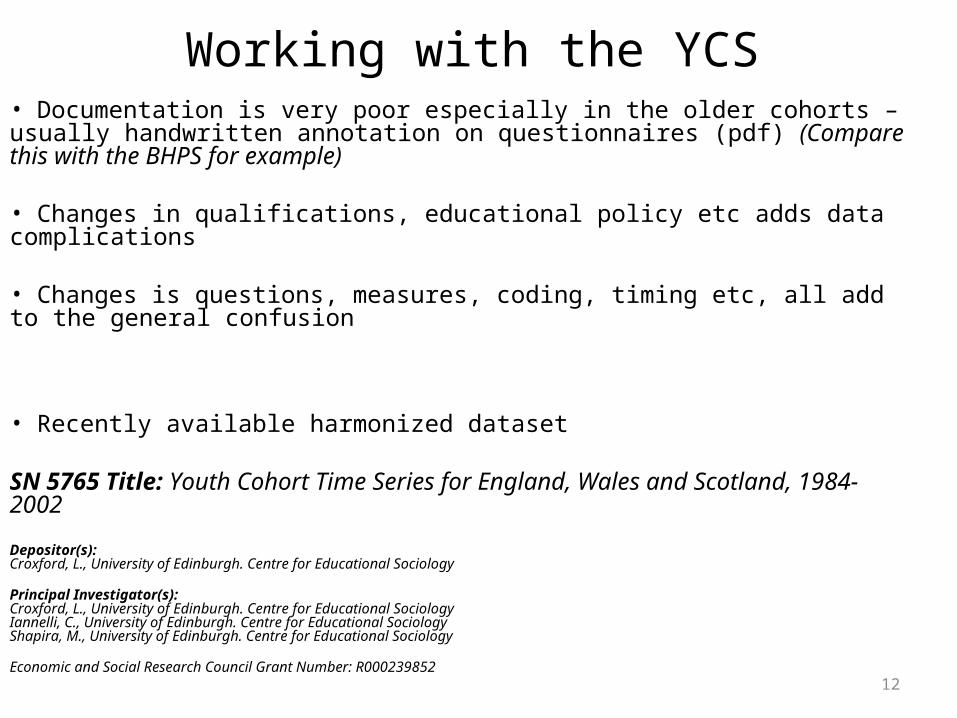
Working with the YCS• Documentation is very poor especially in the older cohorts – usually handwritten annotation on questionnaires (pdf) (Compare this with the BHPS for example)
• Changes in qualifications, educational policy etc adds data complications
• Changes is questions, measures, coding, timing etc, all add to the general confusion
• Recently available harmonized dataset
SN 5765 Title: Youth Cohort Time Series for England, Wales and Scotland, 1984-2002
Depositor(s): Croxford, L., University of Edinburgh. Centre for Educational Sociology
Principal Investigator(s): Croxford, L., University of Edinburgh. Centre for Educational SociologyIannelli, C., University of Edinburgh. Centre for Educational SociologyShapira, M., University of Edinburgh. Centre for Educational Sociology
Economic and Social Research Council Grant Number: R000239852

13
Year All Pupils YCS
Pupils Boys
Official
Boys
YCSGirls
Official
Girls
YCS
1990 34.5 35.1 30.8 31.6 38.4 38.7
1993 41.2 42.3 36.8 38.1 45.8 46.7
1995 43.5 44.9 39.0 40.6 48.1 49.3
1997 45.1 46.2 40.5 41.9 50.0 50.6
1999 47.9 51.0 42.8 46.4 53.4 55.7
Official and YCS Surveys % of pupils gaining 5+ GCSEs (grades A*-C)
YCS Data Source: Dataset SN5765 (weighted data)

14
Why parental occupation• Occupations is a key measure of social stratification
• Maps onto wider sociological conception of social class
• Why not income or wealth?– 16/17 year olds are being questioned– fluctuation in income and wealth– parents’ location on the age/income distribution
• Occupation is a proxy– lifetime income – life chances (and opportunities)– lifestyle & consumption patterns– (even correlates with health)

15
A proxy for income?
In this respect, we would argue that the use of socio-economic classifications in research is not simply to act as a proxy for income where income data themselves are unavailable. We use socio-economic classifications because they are measures designed to help us identify key forms of social relations to which income is merely epiphenomenal… It is also the case that socio-economic classifications are relatively more general and stable measures than income. Income is well known to fluctuate over the lifecourse; indeed panel data regularly reveals a high level of ‘income churning’ from year to year (for the UK see Jarvis and Jenkins 1997). What socio-economic classifications might reasonably be expected to proxy is the lifecourse/earnings profile.
(Rose and Pevalin 2003) A Researcher’s Guide to the National Statistics Socio-economic Classification

16
Which measure of occupation?Forty years ago, Bechhofer’s review of the use of occupational information in sociology bemoaned the abundance of, and inconsistencies between, occupationally based social classifications, noting that “..researchers are advised not to add to the already existing plethora of classifications without very good reason” (1969 p.118)
However since that recommendation, the number of new classifications has increased steadily
We argue for the transparent use of classifications that have ‘agreed’ standards of measurement and can therefore be replicated and compared within and across analyses

17
• Various (unsystematic) parental occupation measures deposited with individual YCS cohorts
• NS-SEC (8 and 3 category) deposited with SN 5765
• We have added a large number of additional measures not in SN 5765– Derived from data using GEODE Resources– www.geode.stir.ac.uk – www.dames.org.uk/ – Some of the measures are approximations because detailed
parental employment status is not available
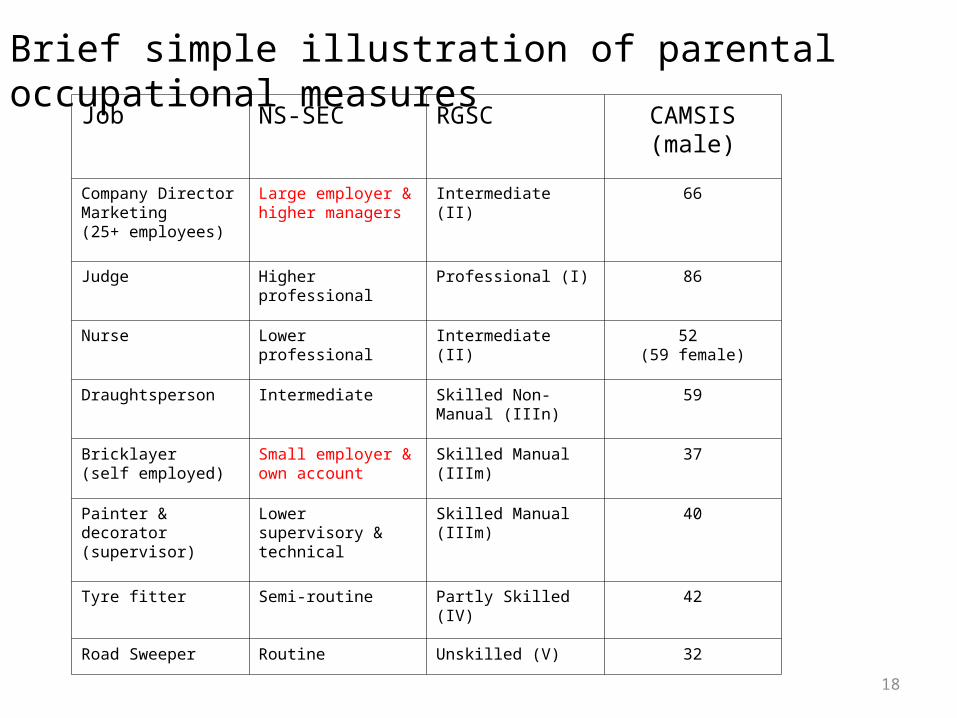
18
Job NS-SEC RGSC CAMSIS (male)
Company DirectorMarketing (25+ employees)
Large employer & higher managers
Intermediate (II) 66
Judge Higher professional Professional (I) 86
Nurse Lower professional Intermediate (II) 52 (59 female)
Draughtsperson Intermediate Skilled Non-Manual (IIIn)
59
Bricklayer (self employed)
Small employer & own account
Skilled Manual (IIIm) 37
Painter & decorator (supervisor)
Lower supervisory & technical
Skilled Manual (IIIm) 40
Tyre fitter Semi-routine Partly Skilled (IV) 42
Road Sweeper Routine Unskilled (V) 32
Brief simple illustration of parental occupational measures

Parental Occupational Measures• National Statistics Socio-economic Classification (NS-SEC) 9 category • European Socio-economic Classification (ESeC) 9 category• Registrar General’s Social Class (RGSC) 6 category• Erikson-Goldthorpe-Portocarero (EGP) 11 category
• National Statistics Socio-economic Classification (NS-SEC) 3 category • Manual / Non-Manual 2 category• Elias Skill 4 category
• CAMSIS: Social Interaction and Stratification Scale – Scale with Mean =50 (sd=15)
• NES scores– Estimated mean monthly earnings SOC90 derived from SARs New Earnings
Survey income estimations (Dale et al. 1995)

Parental Occupational Measures
• We have derived measures for mother’s and fathers
• In the following analyses we present ‘parental’ measures
• Dominance method
– common in stratification research– father or mother whichever dominant (and ft worker)
– For example…• nurse mum and consultant dad = dad• (ft) nurse mum and (ft) hospital porter dad = mum

21
YCS Data
• YCS cohorts – School leaving years 1990, 1993, 1995, 1997, 1999
• Comprehensive school pupils– Free schooling– No educational selection
• Complete information on parental occupation and other measures (n=55120)
22
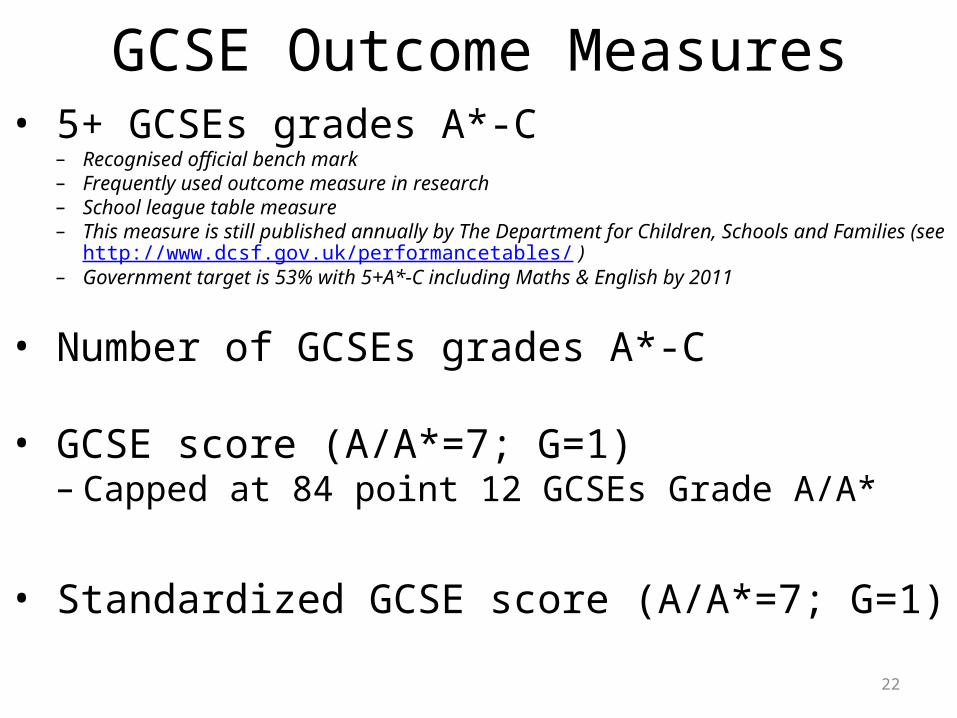
GCSE Outcome Measures• 5+ GCSEs grades A*-C
– Recognised official bench mark– Frequently used outcome measure in research– School league table measure– This measure is still published annually by The Department for Children, Schools and Families (see
http://www.dcsf.gov.uk/performancetables/ )– Government target is 53% with 5+A*-C including Maths & English by 2011
• Number of GCSEs grades A*-C
• GCSE score (A/A*=7; G=1)– Capped at 84 point 12 GCSEs Grade A/A*
• Standardized GCSE score (A/A*=7; G=1)

23
Descriptive Results• Overall trend
– Increasing proportions getting 5+GCSEs (A*-C)– Increasing mean number of A*-C grade GCSEs– Increasing mean GCSE points score
• Gender– Female pupils outperforming male pupils
• Ethnicity– Some groups doing better than white pupils (e.g. Indians)– Other groups doing worse (e.g. blacks)
• Parental Occupation– Observable gradient– Lower levels of GCSE attainment from those pupils with less occupationally
advantaged parents

0 .02 .04 .06 .08 .1Logit Pseudo R Sqaured
+NES
+MCAMSIS
+Skill
+Man/Non
+NS-SEC3
+EGP11
+RGSC
+ESEC
+NS-SEC9
Cohort+Sex+Ethnicity
Cohort+Sex
Cohort
Source: SN5765, n=55120 (unweighted data); 1990s YCS Cohorts
Logit Models: 5+GCSEs (A*-C)
GCSE Attainment Year 11

0 .005 .01 .015 .02 .025Negative Binomial Model Pseudo R Sqaured
+NES
+MCAMSIS
+Skill
+Man/Non
+NS-SEC3
+EGP11
+RGSC
+ESEC
+NS-SEC9
Cohort+Sex+Ethnicity
Cohort+Sex
Cohort
Source: SN5765, n=55120 (unweighted data); 1990s YCS Cohorts
Negative Binomial Models: Count GCSEs (A*-C)
GCSE Attainment Year 11

0 .05 .1 .15 .2Adjusted R Sqaured
+NES
+MCAMSIS
+Skill
+Man/Non
+NS-SEC3
+EGP11
+RGSC
+ESEC
+NS-SEC9
Cohort+Sex+Ethnicity
Cohort+Sex
Cohort
Source: SN5765, n=55120 (unweighted data); 1990s YCS Cohorts
Regression Models: GCSE Point Score
GCSE Attainment Year 11

0 .05 .1 .15Adjusted R Sqaured
+NES
+MCAMSIS
+Skill
+Man/Non
+NS-SEC3
+EGP11
+RGSC
+ESEC
+NS-SEC9
Sex+Ethnicity
Sex
Source: SN5765, n=55120 (unweighted data); 1990s YCS Cohorts
Regression Models: Cohort Standardized GCSE Point Score
GCSE Attainment Year 11
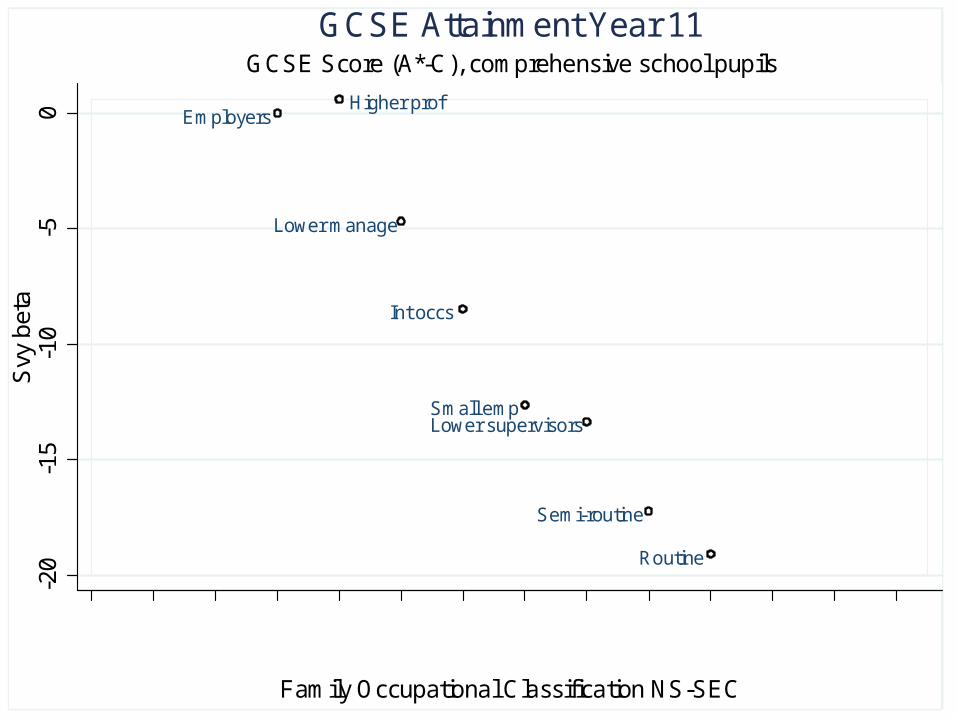
EmployersHigher prof
Lower manage
Int occs
Small empLower supervisors
Semi-routine
Routine
-20
-15
-10
-50
Svy
bet
a
Family Occupational Classification NS-SEC
GCSE Score (A*-C), comprehensive school pupils
GCSE Attainment Year 11
EmployersHigher prof
Lower manage
Int occs
Small empLower supervisors
Semi-routine
Routine
Higher salariat
Lower salariat
Intermediate
Self-emp & small
Selp-emp
Lower sup & tech
Lower servicesLower tech
Routine
-20
-15
-10
-50
Svy
bet
a
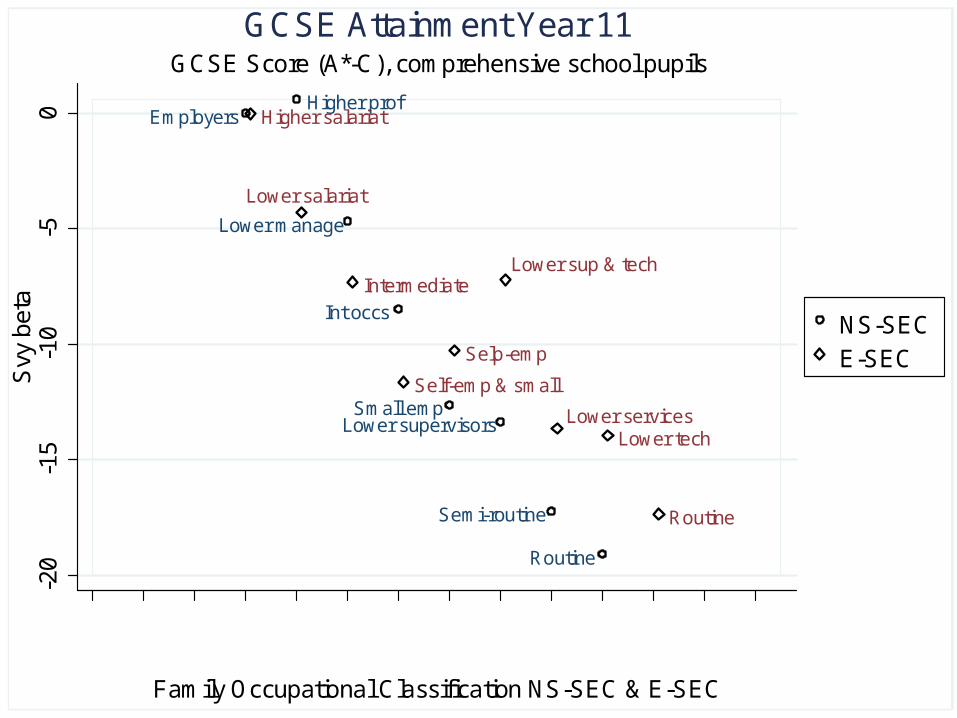
Family Occupational Classification NS-SEC & E-SEC
NS-SECE-SEC
GCSE Score (A*-C), comprehensive school pupils
GCSE Attainment Year 11
EmployersHigher prof
Lower manage
Int occs
Small empLower supervisors
Semi-routine
Routine
Higher service
Lower service
Routine nm higher
Routine nm lower
Small emp
Self emp
Farmers
Tech lower
Skilled man
Non-Skilled
Agricultural
-20
-15
-10
-50
Svy
bet
a
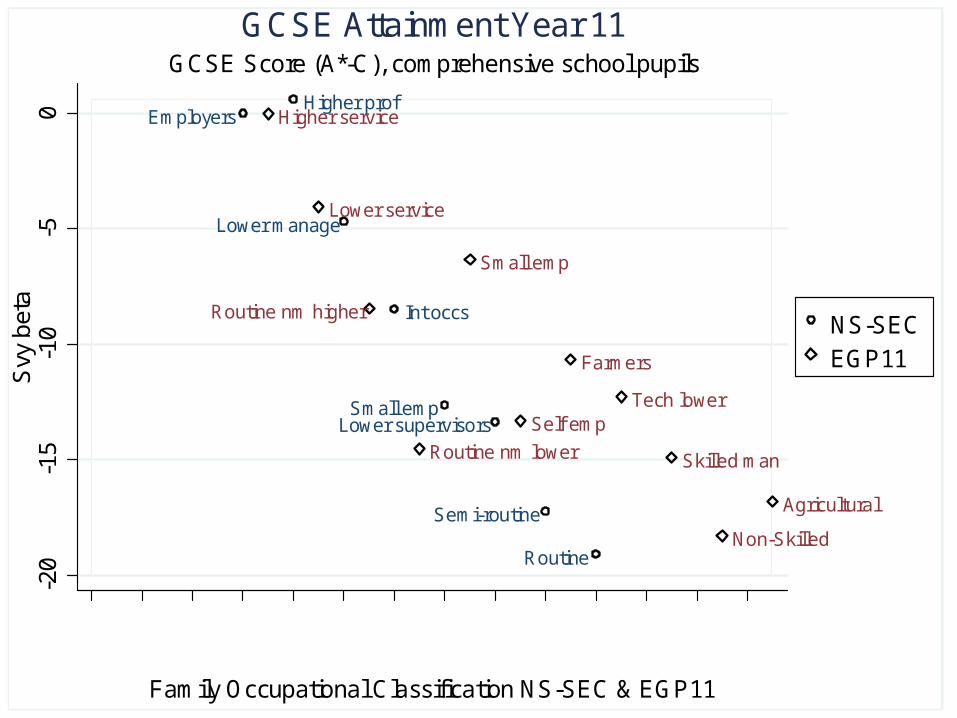
Family Occupational Classification NS-SEC & EGP11
NS-SECEGP11
GCSE Score (A*-C), comprehensive school pupils
GCSE Attainment Year 11
EmployersHigher prof
Lower manage
Int occs
Small empLower supervisors
Semi-routine
Routine
Professional
Man & tech
Skilled nm
Skilled man
Partly skilled
Unskilled-20
-15
-10
-50
Svy
bet
a
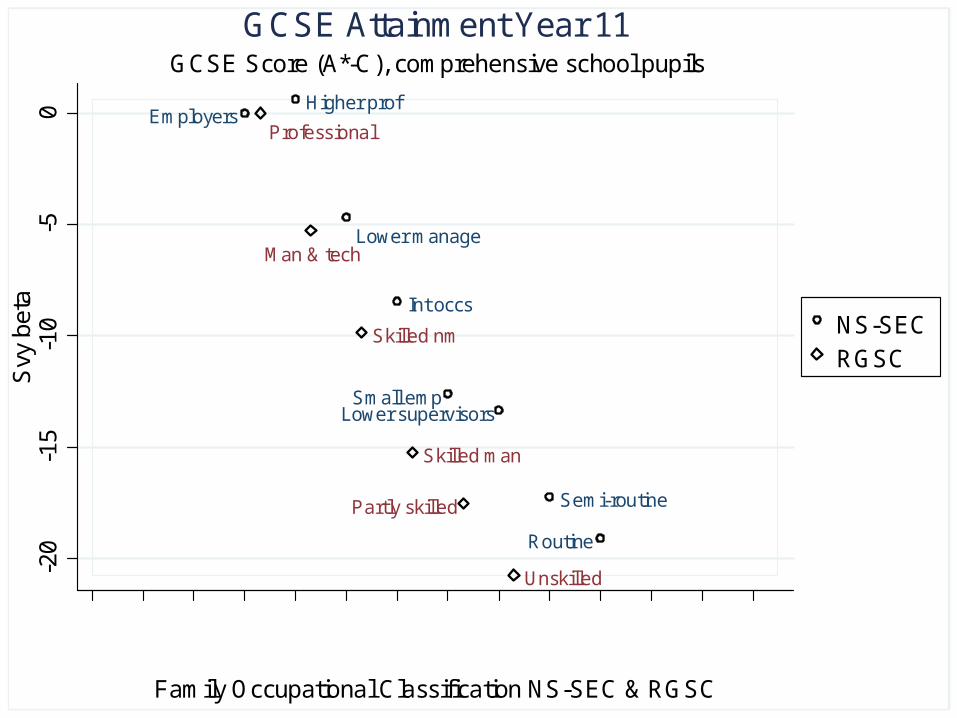
Family Occupational Classification NS-SEC & RGSC
NS-SECRGSC
GCSE Score (A*-C), comprehensive school pupils
GCSE Attainment Year 11
-15
-10
-50
510
Svy
bet
a
19901993
19951997
1999
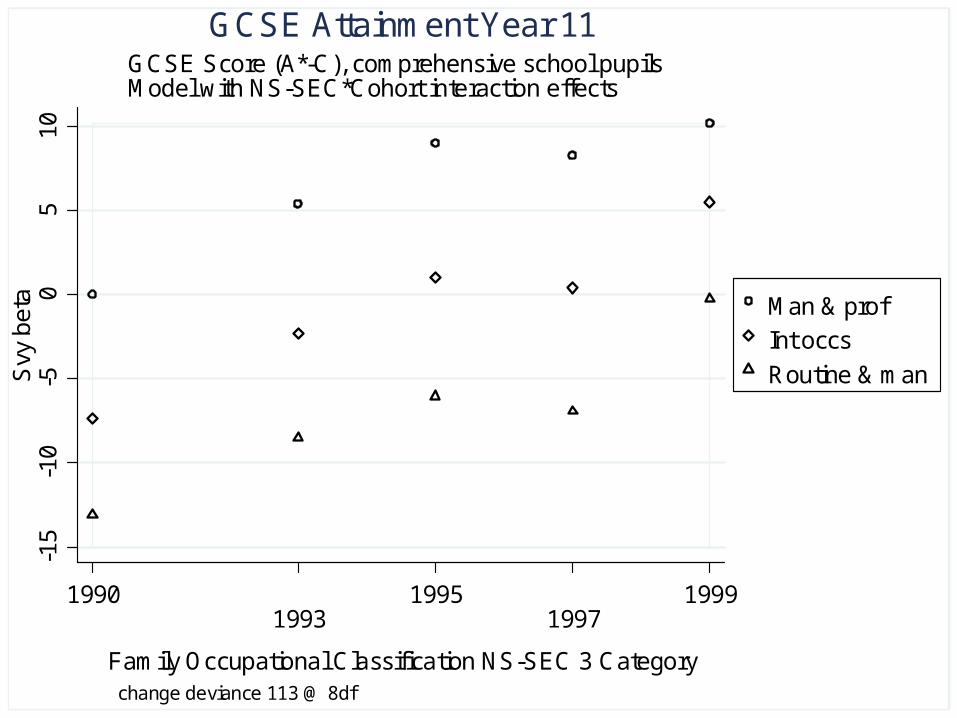
Family Occupational Classification NS-SEC 3 Category
Man & profInt occs
Routine & man
change deviance 113 @ 8df
GCSE Score (A*-C), comprehensive school pupilsModel with NS-SEC*Cohort interaction effects
GCSE Attainment Year 11
33
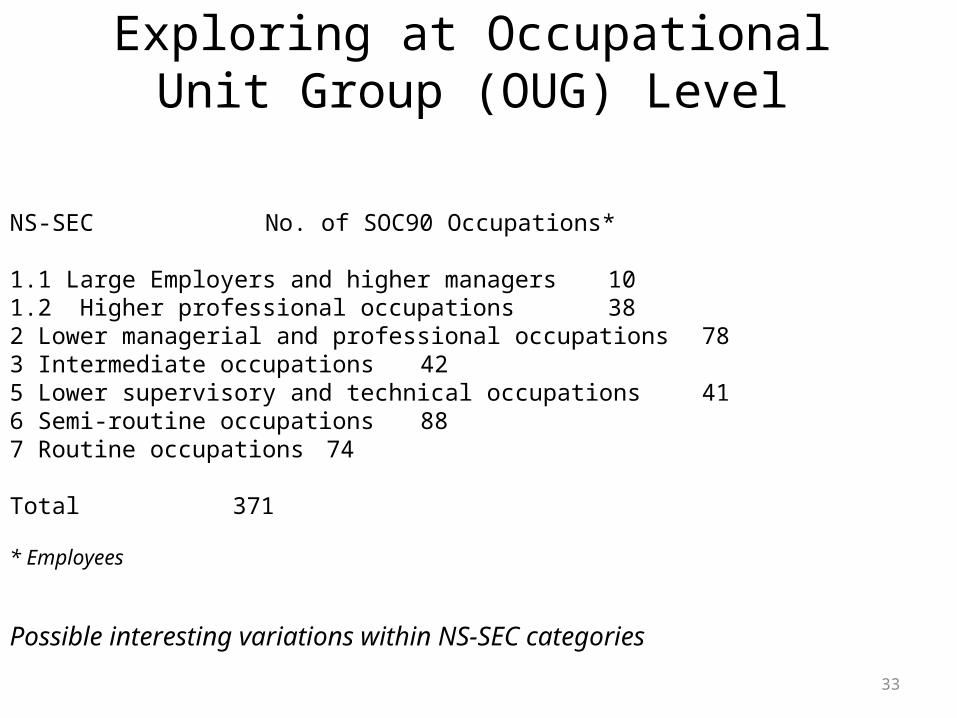
Exploring at Occupational Unit Group (OUG) Level
NS-SEC No. of SOC90 Occupations*
1.1 Large Employers and higher managers 101.2 Higher professional occupations 382 Lower managerial and professional occupations 783 Intermediate occupations 425 Lower supervisory and technical occupations 416 Semi-routine occupations 887 Routine occupations 74
Total 371
* Employees
Possible interesting variations within NS-SEC categories
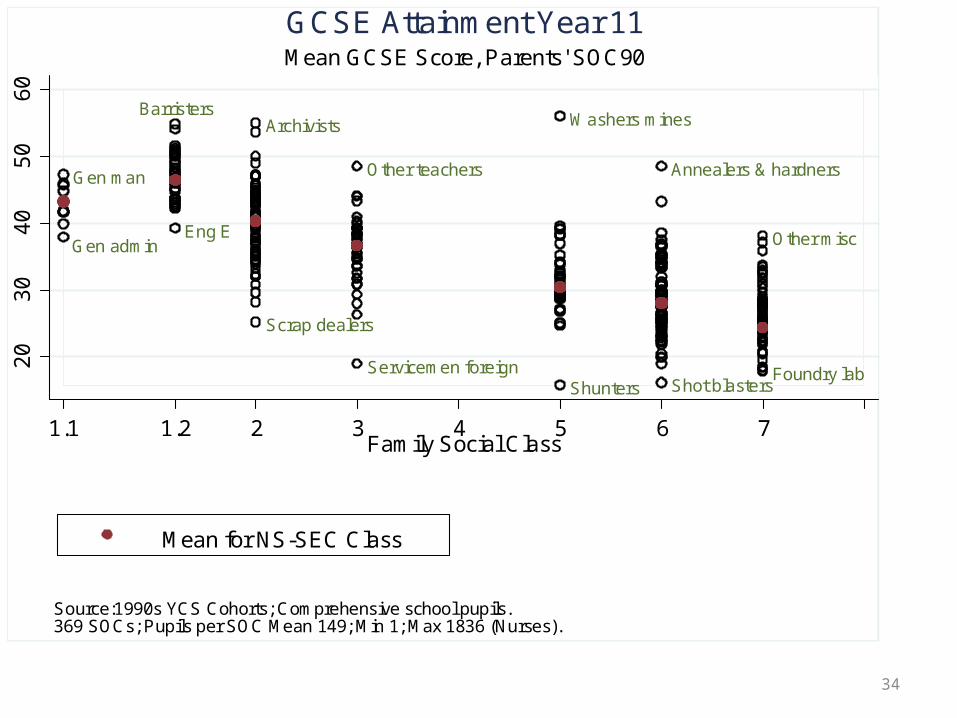
34
Gen admin
Gen man
Eng E
Barristers
Scrap dealers
Archivists
Servicemen foreign
Other teachers
Shunters
Washers mines
Shot blasters
Annealers & hardners
Foundry lab
Other misc
20
30
40
50
60
1.1 1.2 2 3 4 5 6 7 Family Social Class
Mean for NS-SEC Class
Source:1990s YCS Cohorts; Comprehensive school pupils.369 SOCs; Pupils per SOC Mean 149; Min 1; Max 1836 (Nurses).
Mean GCSE Score, Parents' SOC90
GCSE Attainment Year 11

35
Solicitor
Uni teach
Works manager
Nursery nurse
PlumberKit porter
Driver
20
30
40
50
1.1 1.2 2 3 4 5 6 7 Family Social Class
Mean for NS-SEC Class
Source:1990s YCS Cohorts; Comprehensive school pupils.121 larger SOCs; Pupils per SOC Mean 380; Min 101; Max 1836 (Nurses).
Mean GCSE Score, Parents' SOC90 (large SOC groups)Illustrations of occupations
GCSE Attainment Year 11

36
Other Eng
Medics
Publicans
Teachers (secondary)
Aux Nurses
Other teachers
Gardeners
Elec fitters
Food pro
Educ ass
Bar staff
Other misc
Metal mates
20
30
40
50
1.1 1.2 2 3 4 5 6 7 Family Social Class
Mean for NS-SEC Class
Source:1990s YCS Cohorts; Comprehensive school pupils.121 larger SOCs; Pupils per SOC Mean 380; Min 101; Max 1836 (Nurses).
Mean GCSE Score, Parents' SOC90 (large SOC groups)Illustrations of extreme occupations
GCSE Attainment Year 11

37
McKnight & Elias (1998) Guide to the 371 Database
Earnings distributions in SOC OUG ‘quindeciles?’ Distribution of employment by (highest) qualification SOC OUG
Regrettably the micro-data are no longer available
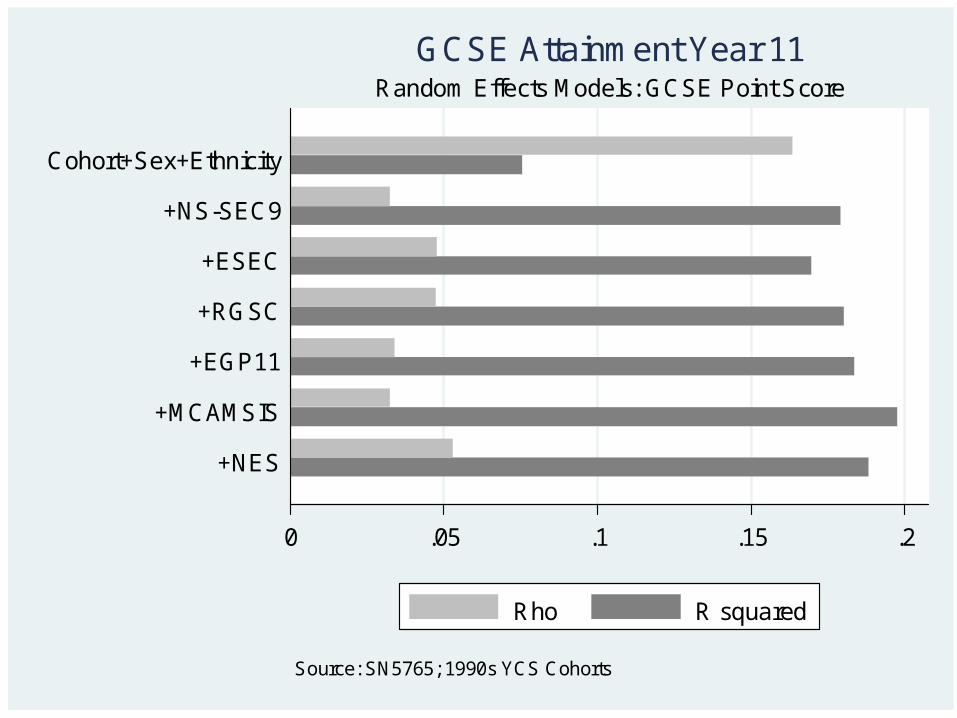
0 .05 .1 .15 .2
+NES
+MCAMSIS
+EGP11
+RGSC
+ESEC
+NS-SEC9
Cohort+Sex+Ethnicity
Source: SN5765; 1990s YCS Cohorts
Random Effects Models: GCSE Point Score
GCSE Attainment Year 11
Rho R squared

39
What is the relationship between parental occupations and filial educational attainment?
• Relatively strong (and persistent) association between a pupil’s GCSE attainment and the occupational position of their parents (net of cohort, gender and ethnicity)– Similar association with any GCSE measure– Similar association with any of the occupational based measures – e.g. NS-SEC, ESeC, RGSC, EGP, but also NS-SEC3, M/NM, Skill, and CAMSIS, NES
• The level of association is stronger than gender and ethnicity– The parental occupational gap is more striking– Changing over time? Additional comprehensive analyses required– Ongoing concern about the gender gap
• In educational circles and in public discourse (media fuelled)
• Ultimate aim is to make a contribution to wider debates within stratification research

• Which scheme requires some thought...
• It is scientifically attractive to try a variety of schemes– Sensitivity analyses– GEODE should help here (www.geode.stir.ac.uk)
• In this example broadly similar results at first glance– We doubt the established claim that competing schemes measure different
theoretical dimension of social stratification– e.g. does NS-SEC measure employment relations, whilst CAMSIS measures
status, Elias’ scheme measure skill?
• Simplified measures are less attractive– The difference in explanation may be quite large (e.g. as a proportion of R2)– The difference might be as large as the R2 for the gender effect

• For many analyses established schemes will be appropriate
• We want to further explore (and maybe unpack) relationships between parental occupations and filial attainment
• There might be extra insights somewhere between ‘big class categories’ and ‘individual occupations’?
• Work emerging in sociology…– Jonsson et al 2009 AJS– Grusky & Weeden (2005, 2006)
• Between 9 categories and 371 unorganised occupational unit groups, there may be 80-120 microclasses defined by their professional cultures and practices?
References
Dale, A., Middleton, E. and Schofield, T. (2005) ‘New Earnings Survey variables added to the SARs’, SARs Newsletter, 6.
Grusky. D. and Weeden, K. (2006) ‘Does the Sociological Approach to Studying Social Mobility Have a Future?’, in Morgan, S., Grusky, D. and Fields, G., Mobility and Inequality, Stanford University Press.
Jarvis, S. and Jenkins, S.P. (1997) ‘Low income dynamics in 1990s Britain’, Fiscal Studies, 18: 1-20.
Jonsson, J., Grusky, D., Di Carlo, D., Pollak, R. and Brinton. M (2009) ‘Micoclass Mobility: Social Reproduction in Four Countries’, American Journal of Sociology, 114: 977-1036.
Rose, D. and Pevalin, D. (2003) A Researcher’s Guide to the National Statistics Socio-economic Classification, Sage.
Weeden, K. and Grusky, D. (2005) ‘The Case for a New Class Map’, American Journal of Sociology, 111:141-212.


44
Item non-response
• Parental occupation information is an important factor in GCSE attainment
• Remember… in the YCS young people aged 17 being asked about their parents
• NS-SEC 7,835 pupils with missing data (12%)
• Promising results from a paper at RC33 Nobel et al. 2008 reported an experiment with LSYPE cohort testing pupils with YCS question and interviewing their parents

45
Item non-response
• Over 60% of young people correctly reported their parents’ occupation at 4 digit OUG (disappointingly only approx. 74% get it at 1 digit level)
– Unit group 2111Chemists– Minor group 211Natural scientists– Sub major group 21 Science and engineering professionals– Major group 2 Professional occupations
• Nobel et al. 2008 reported no significant social class pattern to the errors (using NS-SEC)!

46
Missing data & Multiple imputation
number missingGCSE Score 1135NS-SEC (3 Categories) 7835Ethnicity 1064
Gender 0Cohort 0

47
Patterns of Missing Values
Y NS-SECEthnicity Missing Vars n
+ + + 0 55145 + . + 1 6821 . + + 1 697+ . . 2 592+ + . 1 352. . + 2 318. . . 3 104 . + . 2 16
48
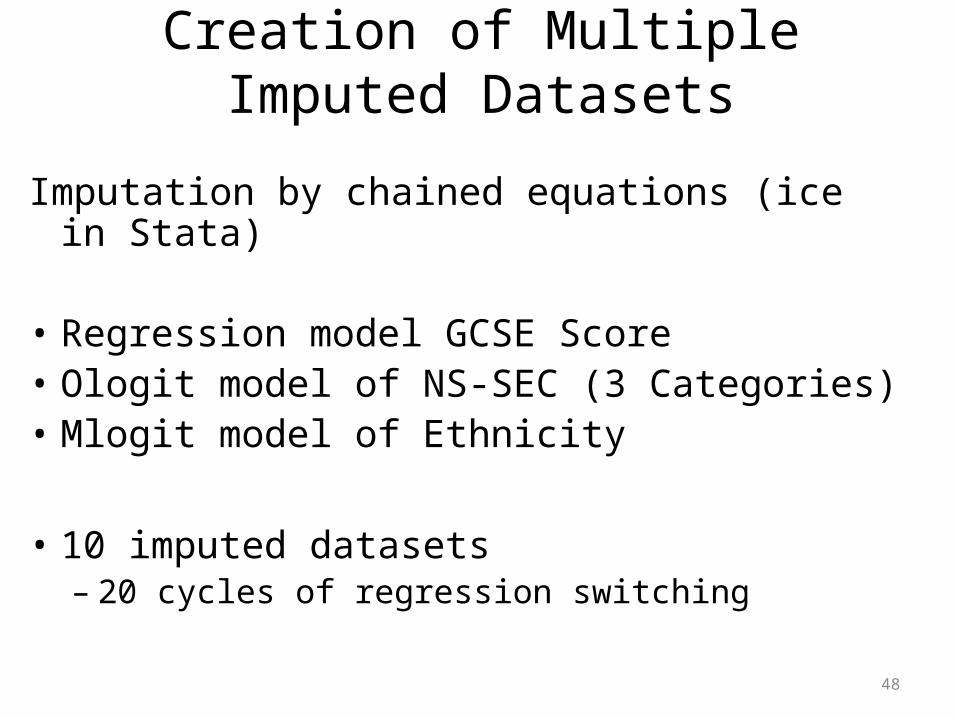
Creation of Multiple Imputed Datasets
Imputation by chained equations (ice in Stata)
• Regression model GCSE Score• Ologit model of NS-SEC (3 Categories)• Mlogit model of Ethnicity
• 10 imputed datasets– 20 cycles of regression switching

49
Analysis of Multiple Imputed Datasets
• Stata mim prefix to combine the results from the 10 different imputed data sets into a single output
• The promise of a (combined) analysis of datasets with 64045 pupils rather than 55145 pupils (complete cases)

50
Complete Cases Analysis
Model of Multiple Imputed Datasets
Beta s.e. Beta s.e. FMI
NS-SEC (3 Classes)
Managerial & Professional 0.00 0.00
Intermediate Occupations -7.46 0.15 -7.67 0.15 0.09
Routine Occupations -13.85 0.17 -14.51 0.17 0.10
Constant 39.70 0.19 39.05 0.18 0.06
n 55145 64045
The promise of a (combined) analysis of datasets with 64045 pupils rather than 55145 pupils (complete cases)
Substantive inference on NS-SEC appears similar….

51
Complete Cases Analysis
Model of Multiple Imputed Datasets
Beta s.e. Beta s.e. FMI
Whites 0.00 0.00
Black -5.62 0.57 -7.31 0.50 0.10
Indian 3.60 0.44 3.08 0.41 0.04
Pakistani -1.89 0.58 -3.61 0.48 0.15
Bangladeshi 0.42 1.04 -3.44 0.75 0.21
Other Asians 5.36 0.68 4.65 0.63 0.07
Other Groups -0.36 0.70 -1.43 0.64 0.06
n 55145 64045
The substantive inference is altered for Pakistani and Bangladeshi pupils & those within the other ethnic group…

52
Analysis of Multiple Imputed Datasets
• This might be an important first step
– The negative effects of being Pakistani or Bangladeshi are potentially being underestimated in the complete case analysis