MOSIDEO/CIRFA Tank Experiments on Behavior and Detection ... · MOSIDEO/CIRFA Tank Experiments on...
11
Proceedings of the 25 th International Conference on Port and Ocean Engineering under Arctic Conditions June 9-13, 2019, Delft, The Netherlands MOSIDEO/CIRFA Tank Experiments on Behavior and Detection of Oil in Ice Chris Petrich 1 , Megan O’Sadnick 1,2 , Camilla Brekke 2 , Marianne Myrnes 2 , Sönke Maus 3 , Martina Lan Salomon 3 , Sofie Woelk 3 , Tom Grydeland 4 , Rolf Ole Jenssen 2,4 , Hajo Eicken 5 , Marc Oggier 5 , Laurent Ferro-Famil 2,6 , Lekhmissi Harkati 6 , Ott Rebane 7 , Nils Reimer 8 1 Northern Research Institute Narvik (Norut Narvik), Narvik, Norway 2 UiT The Arctic University of Norway, Tromsø, Norway 3 NTNU, Trondheim, Norway 4 Norwegian Research Centre (NORSE), Tromsø, Norway 5 University of Alaska Fairbanks, Fairbanks, AK, USA 6 Université de Rennes 1, Rennes, France 7 LDI Innovation OÜ, Tallinn, Estonia 8 Hamburgische Schiffbau-Versuchsanstalt GmbH (HSVA), Hamburg, Germany ABSTRACT In the Arctic, presence of sea ice presents a challenge to safe and sustainable operations. To optimize planning and minimize impact of inadvertent oil spills, oil-in-ice experiments were performed at the HSVA Arctic Environmental Test Basin (AETB) from 14 March to 4 April 2017. Following an under-ice spill and simulated springtime warming, the microscopic movement and distribution of oil in the sea ice pore space as well as the detectability of oil as it approaches the surface were investigated. Two ice types were studied simultaneously, i.e., columnar ice with and without a granular ice surface layer. Among the detection techniques were electromagnetic (radar, tomographic SAR) and optical (fluorescent, hyperspectral, thermal) sensors, and microscopic distribution of oil in sea ice were determined through X- ray computed tomography (CT). This paper presents the setup of the experiment and general ice properties. It was found that the movement of oil differed considerably between the investigated ice types. Predicting the behavior of oil in ice based on environmental conditions will help optimize the approaches used in spill detection and response. KEY WORDS Oil; Ice; Tank Experiment; Microstructure; Remote Sensing INTRODUCTION Operations in Arctic water may result in oil spills that impinge on sea ice from below (cf. Uzuner et al., 1979). Oil typically collects in lenses beneath the ice constrained by the
Transcript of MOSIDEO/CIRFA Tank Experiments on Behavior and Detection ... · MOSIDEO/CIRFA Tank Experiments on...

Proceedings of the 25th International Conference on Port and Ocean Engineering under Arctic Conditions
June 9-13, 2019, Delft, The Netherlands
MOSIDEO/CIRFA Tank Experiments on Behavior and Detection
of Oil in Ice
Chris Petrich1, Megan O’Sadnick1,2, Camilla Brekke2, Marianne Myrnes2, Sönke Maus3,
Martina Lan Salomon3, Sofie Woelk3, Tom Grydeland4, Rolf Ole Jenssen2,4, Hajo Eicken5,
Marc Oggier5, Laurent Ferro-Famil2,6, Lekhmissi Harkati6, Ott Rebane7, Nils Reimer8
1 Northern Research Institute Narvik (Norut Narvik), Narvik, Norway 2 UiT The Arctic University of Norway, Tromsø, Norway 3 NTNU, Trondheim, Norway 4 Norwegian Research Centre (NORSE), Tromsø, Norway 5 University of Alaska Fairbanks, Fairbanks, AK, USA 6 Université de Rennes 1, Rennes, France 7 LDI Innovation OÜ, Tallinn, Estonia 8 Hamburgische Schiffbau-Versuchsanstalt GmbH (HSVA), Hamburg, Germany
ABSTRACT
In the Arctic, presence of sea ice presents a challenge to safe and sustainable operations. To
optimize planning and minimize impact of inadvertent oil spills, oil-in-ice experiments were
performed at the HSVA Arctic Environmental Test Basin (AETB) from 14 March to 4 April
2017. Following an under-ice spill and simulated springtime warming, the microscopic
movement and distribution of oil in the sea ice pore space as well as the detectability of oil as
it approaches the surface were investigated. Two ice types were studied simultaneously, i.e.,
columnar ice with and without a granular ice surface layer. Among the detection techniques
were electromagnetic (radar, tomographic SAR) and optical (fluorescent, hyperspectral,
thermal) sensors, and microscopic distribution of oil in sea ice were determined through X-
ray computed tomography (CT). This paper presents the setup of the experiment and general
ice properties. It was found that the movement of oil differed considerably between the
investigated ice types. Predicting the behavior of oil in ice based on environmental conditions
will help optimize the approaches used in spill detection and response.
KEY WORDS Oil; Ice; Tank Experiment; Microstructure; Remote Sensing
INTRODUCTION
Operations in Arctic water may result in oil spills that impinge on sea ice from below (cf.
Uzuner et al., 1979). Oil typically collects in lenses beneath the ice constrained by the
undulating or rough bottom topography of the sea ice, with subsequent winter ice growth
fully encapsulating the oil (e.g., NORCOR, 1975). In spring, oil from these encapsulated
lenses can reach the ice surface after brine channels widen to provide increasingly large
pathways to the surface (NORCOR, 1975). Upon release to the surface, oil is exposed to the
environment again and can be treated with spill response measures. There is currently no
generally accepted model of the timing of oil surfacing or the systematic investigation of
remote sensing techniques with respect to oil near the ice surface.
In this study, experiments aimed at quantifying the predictability of oil movement in sea ice
during melt and potential links to near-surface detectability of oil to microscopic oil
distribution were investigated through a combination of daily micro-scale characterizations of
the pore structure and oil distribution, and daily co-located remote sensing measurements.
Laboratory investigations took place in the Arctic Environmental Test Basin (AETB) of the
Hamburgische Schiffbau-Versuchsanstalt (HSVA) in a carefully controlled laboratory setting
over a three-week period.
The testing effort involved the creation of two artificial sea ice sheets, representing columnar
ice and a granular ice layer above columnar ice, respectively. Crude oil was injected beneath
the closed ice cover at several distinct lens locations, constrained by under-ice topography. As
the ambient air temperature was raised, the ice warmed and pores within the ice connected to
form efficient pathways for oil movement. As oil approached the surface, surface remote
sensing techniques were used to investigate the changing signal. The experimental set-up is
conceptually similar to oil-in-ice experiments performed in 2014/15 (Pegau et al., 2016),
although the current study is distinguished by the use of different ice types, the focus on
surface detection of oil, use of different detection techniques, and generally thinner ice. This
paper presents the general concept of the experiments and initial observations (Petrich et al.,
2018).
METHODS
Over the course of three weeks, ice was grown, oil injected beneath the ice, left to
encapsulate, and the ambient temperature was raised to induce warming of ice and internal
melt. Destructive and non-destructive measurements were performed throughout the entire
experimental period. The AETB was filled with 30 g/kg NaCl solution prepared from tap
water of pumping station Rothenburgsort. The water had been agitated with pumps and
cooled for two weeks prior to the experiments. Set-up of the experiments started on 15 Mar
2017 (day 1) and instruments were recovered on 4 Apr 2017 (day 21) (Figure 1).
The AETB is 30 x 6 m2 in size and was separated into two sections by a wooden divider, 16 x
6 m2 and 14 x 6 m2 in size, respectively (Figure 2, 3b). Water depth was 1.2 m. The larger
section was used to grow columnar ice under quiescent conditions, while the smaller section
was used to generate a granular ice layer above columnar ice. The ambient air temperature
was -12 °C during the ice growth phase. The cooling elements were defrosted mechanically
to avoid temperature cycling during the experiment.
A granular surface layer was created by blowing air through six WDH-AB10 centrifugal fans
with their exit tilted maximal from the horizontal without creating whitecaps (Figure 3a).
Fans were blowing from the morning of day 2 through the morning of day 4. A granular ice
cover was formed in the morning of day 3 except directly in front of the fans where open
water prevailed. After an initial granular ice cover was formed, the fans were left blowing to
allow for additional frazil ice formation and distribution beneath the ice cover.
Three different kinds of oil lenses were produced: small, medium, and large. Small lenses
were confined by cardboard tubes 200 mm in diameter, arrays of which had been installed
supported from below in the columnar ice section prior to ice formation (day 2). In the

granular section, tubes were installed after a thin ice layer had formed on day 4.
Adjustments of ambient temperature or surface conditions were usually performed between
17:00 and 20:00, giving the ice time to adjust until measurements commenced at 7:00 the
following day. At the end of day 10, patches of Styrofoam insulation were placed on the ice
to create bottom topography by slowing ice growth locally (Figure 4). The insulation was
removed at the end of day 12, i.e. 14 to 27 hours prior to oil injection. A total of 250 L of
crude oil were injected in 47 oil lenses beneath the ice over the course of 13 hours on day 13,
creating 34 small lenses (180 to 810 mL each, nominally either 190, 380, or 740 mL), eleven
circular oil lenses with nominally 1 m diameter (5.7 to 8.1 L each, typically 7.3 L), and two
oil patches of nominally 3 x 3 m2 size (70 and 83 L). Troll B crude oil was used, which is a
sweet, naphthenic crude oil with a pour point below 0 °C. Oil in the small lenses had been
doped with iodine. Some patches were not injected with oil to provide control sites (Figure
2).
Oil was pumped from weighted canisters with a peristaltic pump (at 2 L/min for medium and
large patches). Injection was performed through holes drilled near the target sites. The hose
was connected to an arm that was adjusted with the help of an underwater camera (Figure
7a). Air was removed from the hose prior to each injection by backward pumping and
flushing of the content of the hose though a manifold into a waste container.
The oil was left to encapsulate until the end of day 16 at which point the ambient temperature
was raised to -6 °C (Figure 1). The ambient temperature was raised further to -2 °C at the end
of day 17. Cooling was turned off at the end of day 20 and equipment was removed during
day 21. Air quality monitored during the experiment including particular attention to Benzene
and flammable limit of hydrocarbons. No increase in concentration of harmful gasses was
detected.
The AETB has two carriages for ice access which were parked in designated areas at night.
Those areas were not used for measurements.
Three temperature probes were installed in the tank to monitor ice temperature and growth. A
suite of measurements was performed daily since the beginning of ice formation. Ice
thickness and salinity cores were taken, water in the tank was monitored with a
conductivity/temperature/density instrument (CTD), and ice samples were taken (some of
them centrifuged at in-situ temperature on-site) to quantify the development of ice
microstructure and oil distribution through micro-computed tomography (μCT) off-site. A
limited number of samples was analyzed with a portable Skyscan 1074 μCT in a cold room
on-site. Destructive measurements were performed on sequentially sacrificed small and
medium-sized oil (or oil-free) patches. Several non-destructive remote sensing techniques
were employed to detect the approach of oil near the surface. The development was followed
with tomographic synthetic aperture radar (TomoSAR, Myrnes et al., 2018) (patches B4, B5,
F4, F5 in Figure 2) and an ICI 7640 thermal infrared camera, timelapse cameras, and
transects of a fluorescent instrument (Ocean Visuals Blue Hawk), TriOS RAMSES
hyperspectral detector, and prototype wideband radar with Ilmsens radar module (transects A
through G in Figure 2). Parallel to work in the AETB, samples of oiled ice were
photographed and profiled in two dimensions for oil content and salinity. For this, ice
samples were placed in freezers at -40 °C immediately after harvesting to prevent brine and
oil drainage. Subsequent sectioning and photography was performed in a cold room at -
15 °C. Samples were melted in closed glass containers to determine the amount of oil with a
TD-500 fluorescent analyzer after extraction with heptane, and to measure salinity of the
melt. The increasing freeboard after sampling of ice was compensated by adding saltwater to
the trim tank.

RESULTS AND DISCUSSION
The density of oil at room temperature was 870 kg/m3. The pour point was not determined
systematically but samples processed in the cold room showed no obvious signs of loss or
smear, indicating a pour point above 15 °C.
Just prior to the onset of ice formation, a Seabird CTD measured a conductivity of 23.857
mS/cm at -0.636 °C at 1.1 m depth. That conductivity corresponds to 27.3 g/kg NaCl
solution. No salinity gradient was detectable in the water. The salinity increased to 31.3 g/kg
due to brine rejection by the end of the experimental period.
Ice formation started on day 3 within minutes of initiating a drop in ambient temperature
from 5 °C to 10 °C. Ice thickness measured at the center of the columnar ice section is
shown in Figure 5a. Ice thickness reached a maximum of 0.26 m with most of the ice growth
having taken place before the ambient temperature had been increased at the end of day 16.
The bulk salinity profile on day 14 was C-shaped in the columnar section with salinity at the
top, center, and bottom of 8.3, 5.8, and 11.0 g/kg, respectively (Figure 5b). The salinity
profile in the granular ice section was very similar albeit with a slightly lower surface salinity
of 7.4 g/kg (Figure 5b). C-shaped salinity profiles are generally expected in undeformed ice
(Petrich and Eicken, 2017).
The initial frazil ice slush (grease ice) expanded across the water surface at a rate of 2 m per
hours from the side opposite the fans (cf. Bauer and Martin, 1983; Figure 6). The wind speed
was between 1.5 and 3.1 m/s measured with a handheld anemometer directly above the water
8 m from the fans. Subsequent consolidation of the slush and thickening of the ice took place
at a rate similar to the columnar ice section. The thickness of the granular layer in the ice was
approx. 0.07 m.
Although aligning the hose for oil injection is an art rather than a science all oil lenses were
injected at their target locations and there was no evidence of unintended subsequent spread
(Figure 7). An oil injection video corresponding to Figure 7b is available at
https://youtu.be/6hJpFwd-6Tc.
Excavated medium-size lenses showed that oil lenses were overgrown by approximately 10
mm of ice away from the edge of the oil lens (Figure 8).
Stark differences were apparent in the behavior of oil in the two different ice types. Figure 9a
shows oil-filled channels in the ice essentially stopping at the horizon of between columnar
and granular ice, while Figure 9b shows that oiled channels in columnar ice reached the
surface without encountering a similar horizon. This difference appears to have resulted from
differences in the desalination process of granular ice and columnar ice, should be reflected in
the pore structure, and affect signals of surface remote sensing, all subject to further study.
Differences between ice types are also obvious in the surface penetration by oil (Figure 10).
Throughout melt, the density of oil-filled channels at the surface is lower in granular ice than
in columnar ice. A slight, striped pattern seen in the columnar section results from frost
deposition on the ice surface that detached from the cooling elements. This indicates that the
early surface expression of oil is sensitive to the structure of even thin layers of ice.
The development of oil-filled channels is further quantified in Figure 11 for medium-sized
patches (0.8 m diameter assumed for density calculation of all patches). The channel density
increases with time in both ice types and the density is consistently higher in columnar ice
without granular layer. The figures are not an exact science as it became increasingly difficult
to discern individual channels from photographs as the melt season progressed. However,
densities around 100 channels per m2 are consistent with general observations of brine
channel densities in sea ice.

CONCLUSION
Experiments were performed to examine the process of oil surfacing in response to warming
ice and the detectability of oil as it approached the surface. Although data analysis is in the
early stages, clear differences in the fate of oil between granular and columnar ice were
obvious.
Oil was spilled beneath the ice cover in lenses from 150 mm diameter up to 9 m2. Oil
movement and distribution differed significantly between ice types with the granular surface
layer presenting a barrier to oil movement. The density of oil-filled channels at the surface
was reduced by the granular layer, suggesting that ice type should affect the remote sensing
signal before the entire surface is oil-covered. However, the first oil-filled channels appeared
at the surface at about the same time in the two sections. Since oil-filled channels would
absorb sunlight and hence increase in diameter through internal melt of ice, the rate of flow
of oil to the surface may not necessary be less in the presence of a granular layer.
Detailed studies of instrument response and oil behavior are underway (e.g., Myrnes et al.,
2018).
ACKNOWLEDGEMENTS
This project was funded through the Research Council of Norway (RCN) program
PETROMAKS2 grant 243812 (Microscale Interaction of Oil with Sea Ice for Detection and
Environmental Risk Management in Sustainable Operations, MOSIDEO), and RCN SFI
Center for Integrated Remote Sensing and Forecasting for Arctic Operations (CIRFA) grant
237906 and project partners. The portable μCT was kindly made available by Dr. Johannes
Freitag of Alfred Wegener Institute, Bremerhaven, Germany. Crude oil was provided by
Equinor (previously Statoil). The helpful attitude of technicians at HSVA is gratefully
acknowledged and contributed to the success of this project.
REFERENCES
Bauer, J., & Martin, S., 1983. A Model of Grease Ice Growth in Small Leads. Journal of
Geophysical Research – Oceans, 88(C5):2917-2925.
Myrnes, M., Brekke, C., Ferro-Famil, L., & Petrich, C., 2018. Polarimetric Analysis of Oil
Contaminated Laboratory Grown Saltwater Ice Imaged by a Ground Based SAR. In
Proceedings of the 12th European Conference on Synthetic Aperture Radar, Aachen,
Germany, 4-7 June 2018, 4 pp.
NORCOR, 1975. The Interaction of Crude Oil with Arctic Sea Ice. Beaufort Sea Technical
Report, No. 27, Beaufort Sea Project, Department of the Environment, Victoria, BC, Canada,
201 pp.
Pegau, W.S., Garron, J., & Zabilansky, L., 2016. Detection of Oil on-in-and-under Ice – Final
Report 5.3. Arctic Response Technology Joint Industry Project, 406 pp.
Petrich, C., & Eicken, H., 2017. Overview of Sea Ice Growth and Properties. In Sea Ice, 3rd
ed., D.N. Thomas (ed.), John Wiley & Sons, Ltd. doi:10.1002/9781118778371.ch1.
Petrich, C., O'Sadnick, M., Brekke, C., Myrnes, M., Maus, S., Salomon, M.L., Woelk, S.,
Grydeland, T., Jenssen, R.-O., Eicken, H., Oggier, M., Ferro-Famil, L., Lekhmissi, H.,
Rebane, O., & Reimer, N., 2018. An Overview of the MOSIDEO/CIRFA Experiments on
Behavior and Detection of Oil in Ice. In Proceedings of the forty-first AMOP Technical
Seminar, Envionment and Climate Change Canada, Ottawa, ON, Canada, 112 – 122.
Uzuner, M.S., Weiskopf, F.B., Cox, J.C., & Schultz, L.A., 1979. Transport of Oil under
Smooth Ice. EPA-600/3-79-041, Environmental Protection Agency, Corvallis, OR, 62 pp.
FIGURES
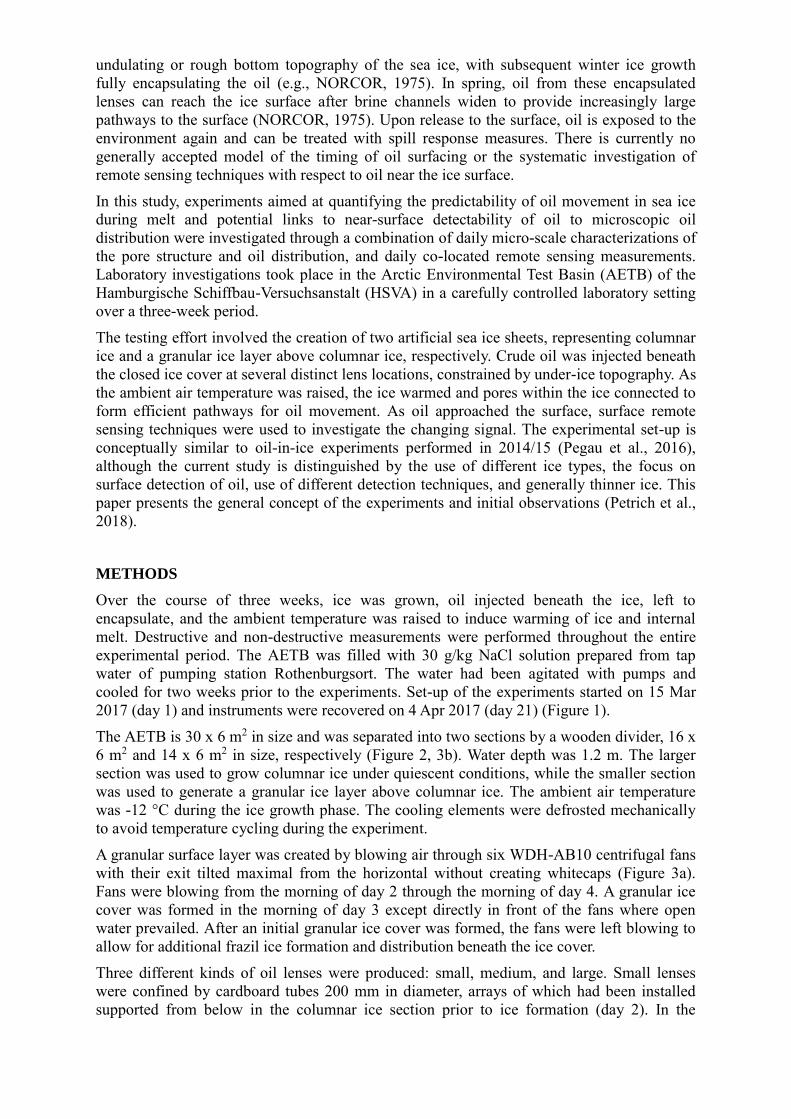
Figure 1. Ambient air temperature and timeline of the experiment starting with cooling of the
tank on 15 March 2017 (day 1). The ice growth phase with nominal air temperature –12 °C
lasted from day 3 through day 16 (dark blue), followed by ice melt under increasing ambient
temperature from day 17 through 20 (gray). Also indicated are the periods of bottom
topography generation (light blue, days 11 and 12) and under-ice oil injection (black, day 13).
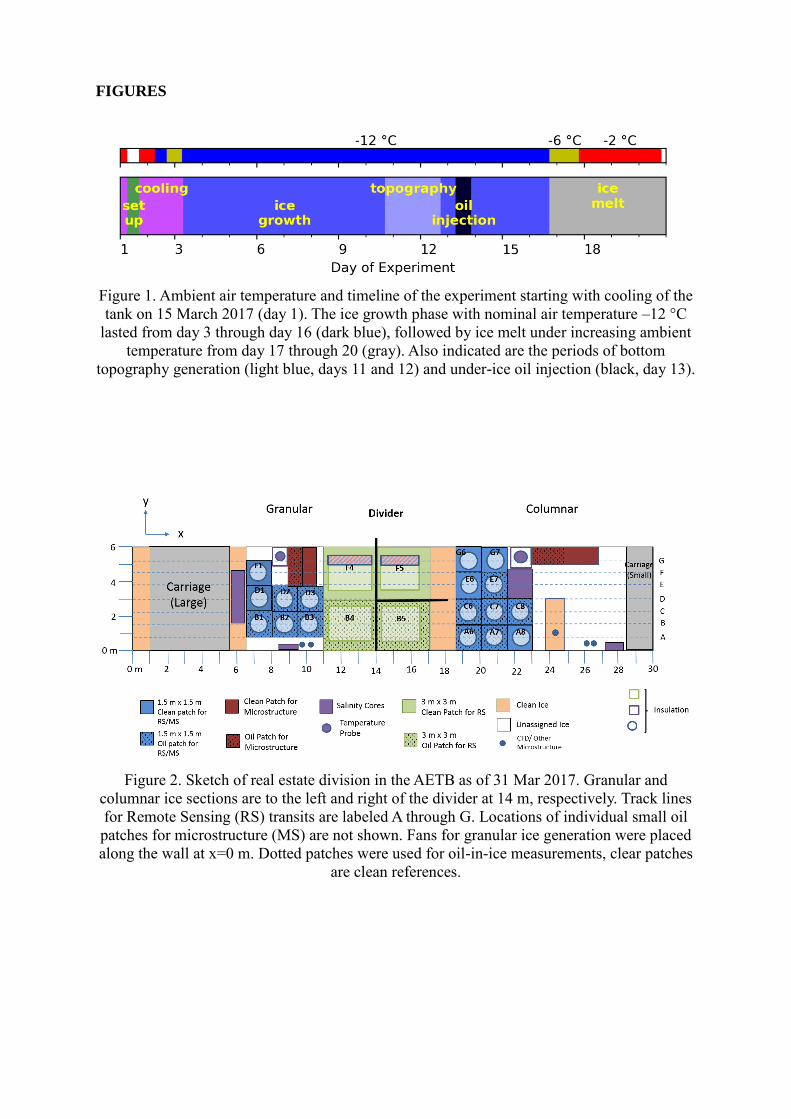
Figure 2. Sketch of real estate division in the AETB as of 31 Mar 2017. Granular and
columnar ice sections are to the left and right of the divider at 14 m, respectively. Track lines
for Remote Sensing (RS) transits are labeled A through G. Locations of individual small oil
patches for microstructure (MS) are not shown. Fans for granular ice generation were placed
along the wall at x=0 m. Dotted patches were used for oil-in-ice measurements, clear patches
are clean references.

(a) (b)
Figure 3. Water surface prior to the onset of freezing. (a) Arrangement of fans to create grease
ice, and (b) separation of agitated section of the tank from quiescent area at the divider.
Figure 4. Surface insulation to create an under-ice profile.

Figure 5. (a) Development of ice thickness in the columnar section of the tank. Dotted line
extends second order polynomial to the end of the ice growth period. (b) Bulk salinity
profiles on day 14 of columnar ice section (solid line) and section with surface granular ice
(dashed line). The bottom 0.02 m of the ice from the granular section are missing.
(a) (b) (c)
Figure 6. Initial development of the grease ice layer on day 3. Photographs (a), (b), and (c)
were taken in intervals of 1 hour.

(a) (b)
Figure 7. Illustration of the oil injection process of a medium-size lens of 1 m diameter (a)
above and (b) below the ice. (a) Camera and injection hose are fed through separate holes. (b)
The extent of the oil lens is limited by the bottom topography generated. Photo (a) is courtesy
Giuliani von Giese.
Figure 8. Example excavated medium-sized oil lens immediately after excavation. The
transition to the host ice and center of the lens is seen on the left and right hand side,
respectively. Also visible is the thickening of the ice beneath the oil lens toward the edge of
the lens (left hand side in photo).

Figure 9. Vertical thick sections of excavated oil lenses on day 17 in section (a) with and (b)
without granular surface layer.

Figure 10. Sequence of oil surfacing during the final stages of the experiment, patches B4
(lower section) and B5 (upper section). Columnar and granular ice section are above and
below the divider, respectively.
Figure 11. Average density of oil-filled channels in medium patches, assuming a diameter of
0.8 m.