Mortality of Beneficiaries of Charitable Gift Annuities
31
Mortality of Beneficiaries of Charitable Gift Annuities 1 Donald F. Behan and Bryan K. Clontz Abstract: This paper is an analysis of the mortality rates of beneficiaries of charitable gift annuities. Observed overall mortality rates were 83 percent of the Annuity 2000 Mortality Table (Basic) on the basis of exposed lives and 76 percent of expected on the basis of annuity income. A strong select and ultimate pattern of mortality was observed. The select and ultimate pattern explains most of the variation between actual mortality and the mortality rates in the table. Some variations in mortality by type of organization were observed but not all of the predicted variations occurred. Background Charitable gift annuities are an important source of funding for charitable and nonprofit organizations throughout the United States. The number of such annuities is about 200,000. The American Council on Gift Annuities (ACGA) is the primary organization advising charities in this field. The membership of ACGA numbers about 3,000 organizations, including the most significant participants in the charitable annuity field. Periodically the Council publishes advisory rates for gift annuities. These rates are established on the basis of investment returns, mortality, and expenses such that the charity is expected to receive a 50 percent future value residuum from the original gift. Remarkably, the first and only mortality study in the 84-year history of the ACGA was completed in 2002 on the basis of data from 1996 through 2000. Previously the ACGA advisory rates were based on data for insured annuities. In a typical gift annuity transaction a donor makes a contribution in exchange for an annuity that has a present value of 60 percent to 80 percent of the contributed amount. In addition to receiving a life income, the donor receives a current tax deduction equal to the excess of the donation over the present value of the annuity on the basis of a valuation prescribed by tax regulations, typically 20 percent to 40 percent of the gross amount. Many charitable organizations include gift annuities among their planned giving alternatives. The 2005 ACGA survey showed that 8 percent of charities insure some or all of their annuities with commercial insurance companies. They refer to this as “reinsurance,” even though it is not true reinsurance because the charities are not insurance companies. We estimate that there are about 200,000 charitable gift annuity contracts in force in the United States, representing about $15 to $20 billion in annuity reserves. 1 This research was supported by a grant from the Committee on Life Insurance Research of the Society of Actuaries 1 ©2005 Society of Actuaries
Transcript of Mortality of Beneficiaries of Charitable Gift Annuities
Mortality of Beneficiaries of Charitable Gift Annuities1
Donald F. Behan and Bryan K. Clontz
Abstract: This paper is an analysis of the mortality rates of beneficiaries of charitable gift annuities. Observed overall mortality rates were 83 percent of the Annuity 2000 Mortality Table (Basic) on the basis of exposed lives and 76 percent of expected on the basis of annuity income. A strong select and ultimate pattern of mortality was observed. The select and ultimate pattern explains most of the variation between actual mortality and the mortality rates in the table. Some variations in mortality by type of organization were observed but not all of the predicted variations occurred. Background Charitable gift annuities are an important source of funding for charitable and nonprofit organizations throughout the United States. The number of such annuities is about 200,000. The American Council on Gift Annuities (ACGA) is the primary organization advising charities in this field. The membership of ACGA numbers about 3,000 organizations, including the most significant participants in the charitable annuity field. Periodically the Council publishes advisory rates for gift annuities. These rates are established on the basis of investment returns, mortality, and expenses such that the charity is expected to receive a 50 percent future value residuum from the original gift. Remarkably, the first and only mortality study in the 84-year history of the ACGA was completed in 2002 on the basis of data from 1996 through 2000. Previously the ACGA advisory rates were based on data for insured annuities. In a typical gift annuity transaction a donor makes a contribution in exchange for an annuity that has a present value of 60 percent to 80 percent of the contributed amount. In addition to receiving a life income, the donor receives a current tax deduction equal to the excess of the donation over the present value of the annuity on the basis of a valuation prescribed by tax regulations, typically 20 percent to 40 percent of the gross amount. Many charitable organizations include gift annuities among their planned giving alternatives. The 2005 ACGA survey showed that 8 percent of charities insure some or all of their annuities with commercial insurance companies. They refer to this as “reinsurance,” even though it is not true reinsurance because the charities are not insurance companies. We estimate that there are about 200,000 charitable gift annuity contracts in force in the United States, representing about $15 to $20 billion in annuity reserves. 1 This research was supported by a grant from the Committee on Life Insurance Research of the Society of Actuaries
1 ©2005 Society of Actuaries

Data Used for the Study The ACGA conducted a survey of members to obtain data on 25,000 charitable gift annuities in force at some time during the period January 1, 1996 through December 31, 2000. Twenty-five organizations contributed data. They included religious, educational, and health-related nonprofit organizations and represent about 12 percent of the total charitable gift annuity exposure during the period. The ACGA data included more than 80,000 contract years of exposure. The Hay Group had performed an analysis of the data for the ACGA, and with the permission of the ACGA, the Hay Group graciously provided us with the data that they had assembled. This study is based on the ACGA data provided to us by the Hay Group. We reviewed the data for missing or inconsistent information and for other data problems. Approximately 1,000 records omitted critical information, such as date of birth or date of issue of the annuity or were for annuitants who died before the beginning of the study period and had no contingent annuitant. In addition, about 2,000 records omitted the sex of the annuitant. We considered using these records, but concluded that the uncertainty in interpretation of the results would be too great for these records to contribute meaningful information to the study, and these records were, accordingly, omitted. One organization apparently used a coding method that allowed the sex of the principal annuitant of joint annuities to be shown in some records and that of the joint annuitant in others. We decided to omit the data from this organization. The final database for our study included 21,815 records of which 25 percent were joint-life annuities. We defined one year of exposure as a year starting on the anniversary date of the annuity. Thus, for example, the 1996 exposure year extended from contract anniversaries in 1996 to anniversaries in 1997. In this way the actual exposure was measured on an age-last-birthday basis. The portion of the contract year starting in 1995, but observed in 1996, as well as the exposure from anniversaries in 2000 to December 31, 2000, were measured on a fractional basis, based on the number of days of exposure within the survey period. Fractional year mortality was considered, as will be described below in the discussion of the fractional periods related to 1995 anniversaries. Of the total 21,815 usable records, the death of the primary annuitant was recorded in 4,710 records. The dates of death were spread over more than five years. The dates of birth of the annuitants who had died spanned a wide range, but the middle half of the birth dates spanned nine years from the end of 1903 to the end of 1912. In all there are well over six million combinations for dates of birth and death in these periods, making it relatively unlikely that two individuals would share the same date. To approximate this probability, we considered a Poisson distribution with frequency parameter 4,710/6,000,000. The frequency of zero observations for this distribution is such that six million repetitions would be expected to yield 4,708 nonzero observations, so we would expect only about two cases of individuals in this group sharing the same dates of birth and death. In fact, a review of the data showed that repetitions were quite common, indicating that many individuals had more than one annuity. The average number of
©2005 Society of Actuaries
2

annuities in this group was about two per person. While we do not know the exact number of cases in which two different individuals in the database shared the same dates of birth and death, we can be sure that the number is extremely small in comparison to the number of contracts. On the basis of the same Poisson model described above, there is virtually no chance that the number of observed repetitions of date combinations could occur except for the existence of multiple annuities per annuitant. Virtually all the cases of multiple records with the same birth and death date can be assumed to represent multiple annuities to single annuitants, since the rate of random duplications would be expected to produce only two duplications out of 4,710. For reasons of privacy the call for data did not request the name nor Social Security number of the annuitant, so we had no way to conclusively determine whether two records were for the same annuitant. The considerations for annuitants who had died showed that we should expect many multiple records for individual annuitants, as explained above. For those annuitants who survived to the end of the study, we had only the date of birth and sex to identify different records that might relate to a single individual. We wanted to evaluate mortality on the basis of the number of individuals, rather than the number of contracts, so we sought a method to use dates of birth to count individual records. Of course the measurement of exposure based on annuity income did not present such a difficulty. There are some years with more than 200 different birth dates for records in the database. For this reason it would not be unusual for birth dates to be shared by different individuals. To estimate the number of distinct individuals represented, we assigned an exposure count of one to each birthday represented within a given year and weighted each count by the ratio of the estimated number of individuals to the number of birthdays. To do this we used a maximum likelihood estimator based on the Poisson distribution. If the number of individuals with birth dates in a given year is n, then the number of such individuals having a given birth date can be approximated by a Poisson distribution with frequency parameter λ = n/365, and the most likely number of dates occurring as birth dates would be 365 – 365e-λ. Accordingly, the weight used for a given year was w = -365 ln(1 - b/365)/b, where b represents the number of distinct birth dates appearing in records for the given year. For example, if 200 distinct birth dates are represented in a given year, the most likely number of individuals is 290, and a weight of 1.45 would be assigned to each date that had at least one annuitant birth date. In this way we were able to determine an exposure measure for individuals who survived that would be equivalent to the exposure for those who died, for whom the dates of birth and death gave us an essentially unique identifier. An example may help to illustrate the thought process behind this adjustment. The database included 197 records for annuitants with dates of birth during 1910 who were still alive at the end of the study period. These records included 62 distinct dates of birth. The probability that 197 selections with replacement from 365 possible dates would select 62 or fewer distinct values is less than 10-24, a negligible probability for practical purposes. Because this indicates that there are multiple contracts for some annuitants, we
©2005 Society of Actuaries
3

used a maximum likelihood estimate for the number of distinct annuitants. In this example, the most likely number of distinct annuitants would be 68. The annual annuity amount was indicated for all but about 800 records. These records were, in effect, ignored in the evaluation of mortality rates in relation to income amount. The median annual income per record was approximately $1,000, and the distribution of amounts was strongly skewed to the right. The maximum annual amount was more than $400,000. To avoid placing too much weight on a single annuitant, we decided to cap the annual income considered per person. We limited the total annual income for any individual during any year of the study to not more than $30,000. We selected this cutoff amount based on our judgment, because it was a relatively low value yet it limited only a small number of annuitants. Approximately one percent of the income amounts were capped. The limit was effected by reducing the amount of each annuity in force during the given year for the individual by the same proportion. We did not have data that could be used to measure reporting lags for deaths, but the relatively long period from the end of the observation period to the due date for the data would be expected to allow for full reporting. There was no evidence to indicate underreporting of deaths in the final period of the study. We measured mortality for the stub period from January 1, 1996 to the anniversary date in 1996 using fractional exposure. We had previously fitted a Gompertz distribution to the mortality rates in the Annuity 2000 Mortality Table (Basic). With this mortality distribution the rate of mortality for the second half of a year exceeds that of the year as a whole by an amount that depends on the overall rate for the year. At the ages of most importance in this study the rate for the second half of the year exceeds the rate for the year by an average of about 5percent. Therefore, we expected that the observed mortality for 1996 would be about 5 percent higher than the tabular rates for the second half of the exposure year. Instead, for the initial 1996 stub period, we obtained rates far below those of other years, showing approximately 65 percent of the expected number of deaths. The probability of this level of difference in a consistently measured data set would be very low (approximately 3.4 standard deviations below the level of mortality in other years). Upon further investigation we noted that many of the organizations reported no deaths during the exposure year starting in 1995, while others had mortality close to expected for the 1996 stub period. In view of this inconsistency we decided to omit data for the 1996 stub period from our analysis. Age at issue for charitable gift annuities tends to be older than would typically be the case for commercial annuities. The average issue age during the year 2000 in the database, weighted by annual annuity amount, was 81 years. Annuities were issued during that year to individuals as old as 101. We reconstructed the number of annuities issued by year, using assumed survival probabilities, and found that the level of new annuities issued during the late 1990s exceeded the level earlier in the decade, except for a peak in 1993 that was at a level comparable to the level of the late 1990s. The level during the 1980s appeared to be about one-fourth the level during the late 1990s. The average age of new annuitants tended to be elderly throughout the period.
©2005 Society of Actuaries
4

Tables 13 to 16 in the Appendix provide analyses of exposure in the database. These tables present exposure by age and sex, by duration and sex, and by type of organization. The total number of life years of exposure is 42,327. The exposure by annual income is approximately $123 million. Measurement of Actual to Expected Mortality We wished to investigate relative mortality for a variety of groupings within which individual mortality would be expected to vary widely. For each year of the analysis, we associated an expected mortality rate with each record on the basis of the Annuity 2000 Mortality Table (Basic) for male and female lives [Johansen, 1996]. This table was derived from the 1983 Table projected to 2000 by a modification of Scale G. This basic table was used to develop the valuation table adopted by the National Association of Insurance Commissioners. While this table is based on age nearest birthday we compared its rates to data based on age last birthday, as is usually used by charities to measure age in the administration of their gift annuities. We have used this table throughout this paper as the basis for expected mortality. We tested the variance of measurement of actual to expected ratios by simulating mortality for a group of individuals with an age distribution approximating that of the population under study. We found that the variance was close to the number of observed deaths, as would be the case for a Poisson distribution. On the basis of this analysis we present actual to expected ratios for various groupings of interest, and approximate the variance by the observed number of deaths. On the basis of the population as a whole we observed an actual to expected ratio of 83 percent for number of deaths with a standard error of 2 percent and an actual to expected ratio of 76 percent on the basis of annual income with a standard error of 6 percent. While the actual to expected ratio by amount is less than that on the basis of number of deaths, as expected, the difference is only slightly more than one standard deviation. Therefore, although the probability of an occurrence of such a difference at random is only about 15 percent, we do not have enough evidence to rule out the possibility that the mortality ratios are the same. As noted below, the difference between overall mortality rates on the basis of lives and income reverses when select and ultimate mortality is taken into account, which would be evidence that the difference identified above is not significant. We have estimated the standard error for mortality ratios for the population as a whole based on income by means of a simulation. The standard error for mortality ratios based on income for subsets of the population would be highly variable, and in some cases much higher because the income amounts are highly variable. It is not feasible to simulate the standard errors for all of the subsets considered.
©2005 Society of Actuaries
5

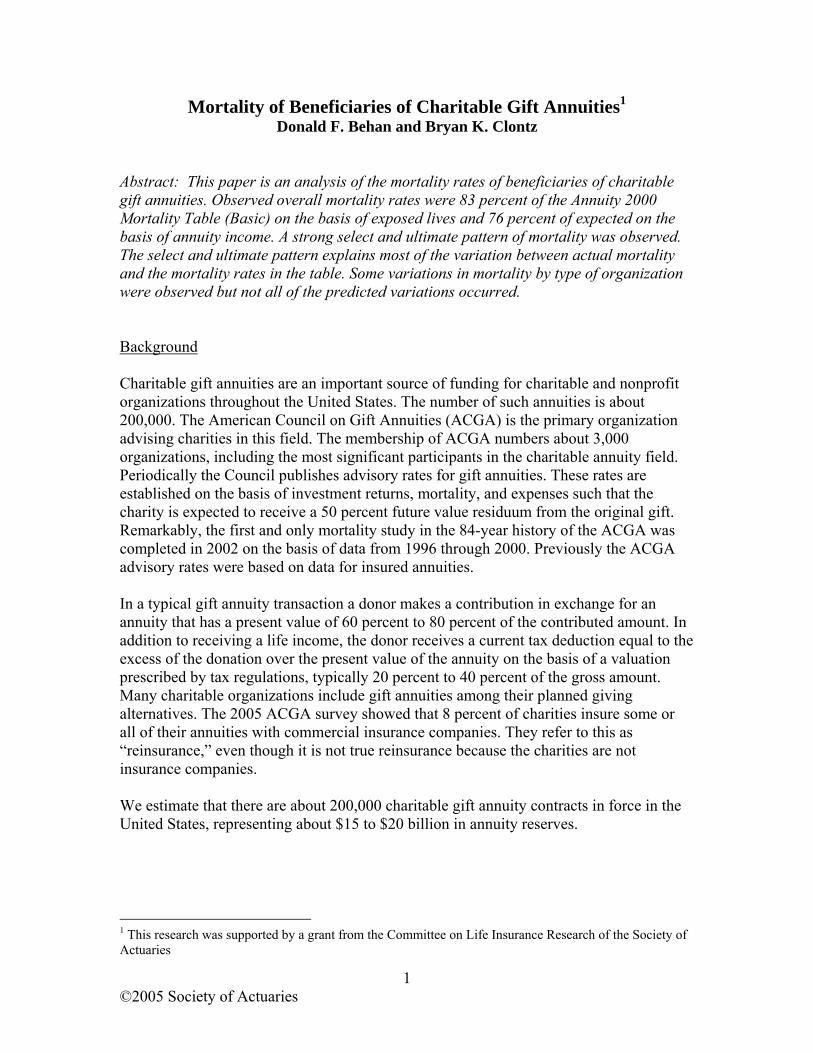
Select and Ultimate Mortality The occurrence of select mortality is typically attributed to insurance company selection of risks in relation to life insurance. It is reasonable to assume that self-interest would cause selection among applicants for annuities, and this is, in fact, strongly borne out by our analysis. In cases in which an individual had more than one annuity with such annuities having different durations, we allocated the exposure over the different durations represented. Comparing the relative mortality for annuities in durations one through six with that of annuities in durations greater than six, with approximately half of the deaths in each subset, the difference in relative mortality is 11 standard deviations. The annuities represented in the database have a relatively low overall duration because of the high levels of new annuities issued during the late 1990s and the high mortality of annuitants from prior years consistent with their advanced average age. This increases the impact of select mortality on the observed data, and much of the downward deviation of observed versus tabular mortality arises from low mortality rates during the first five years after the issuance of the annuities. The high ages typical of charitable gift annuitants would lead one to expect a rapid convergence to ultimate mortality rates, and this is, indeed, observed in the data. The ratio of ultimate to first-year select mortality is similar to but slightly smaller than that observed with insured lives of similar age. For example, for life insurance the ratio of mortality for a 75-year-old, non smoking male insured 15 years earlier is 3.1 times the mortality of a newly selected 75-year-old according to the 1990-95 U.S. Society of Actuaries Table for select and ultimate mortality of insured lives. This ratio for life insurance is comparable to the overall ratio of about 2.2 of ultimate to first-year select mortality observed here. For purposes of comparison with life insurance select and ultimate mortality, we have included a grouping of durations to correspond with typical life insurance groupings in Table 3. Tables 1, 2 and 4 show the ratio of actual to expected mortality at attained age by duration on the basis of number of lives and the standard error of the ratio. Charts 1 through 3 present these results graphically, along with an error band based on plus or minus one standard error. In all of the tables and charts below we use duration 15 to designate ultimate durations of 15 and higher.
©2005 Society of Actuaries
6

Table 1
Actual to Expected Mortality by Duration Based on the Annuity 2000 Mortality Table (Basic)
Exposure Based on Estimated Number of Lives Female Lives
Duration Actual Expected Ratio Standard Error
1 76.3 166.3 46% 5% 2 114.0 166.6 68% 6% 3 110.9 153.7 72% 7% 4 115.7 168.5 69% 6% 5 131.0 169.6 77% 7% 6 139.4 153.9 91% 8% 7 140.7 137.9 102% 9% 8 98.4 100.9 98% 10% 9 74.8 68.6 109% 13%
10 47.5 45.6 104% 15% 11 47.1 41.9 112% 16% 12 40.2 35.6 113% 18% 13 38.3 29.5 130% 21% 14 30.1 24.1 125% 23%
15 or more 295.7 255.3 116% 7%
©2005 Society of Actuaries
7
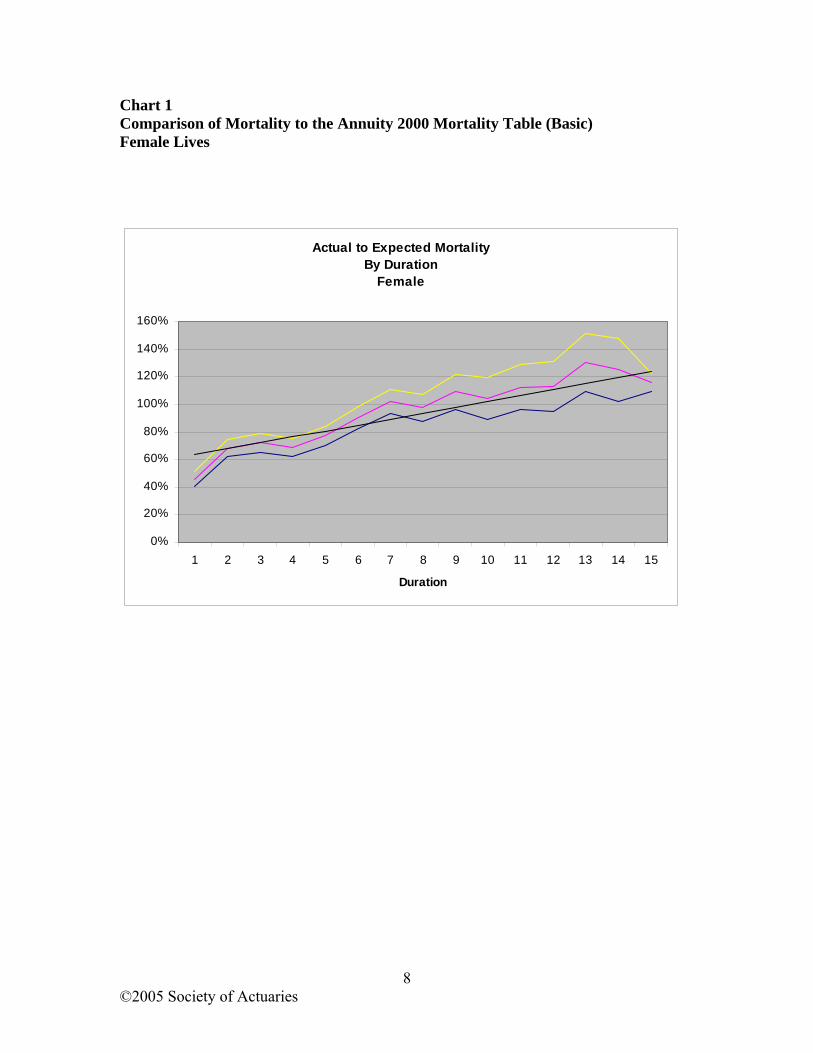
Chart 1 Comparison of Mortality to the Annuity 2000 Mortality Table (Basic) Female Lives
Actual to Expected MortalityBy Duration
Female
0%
20%
40%
60%
80%
100%
120%
140%
160%
1 2 3 4 5 6 7 8 9 10 11 12 13 14 15
Duration
©2005 Society of Actuaries
8
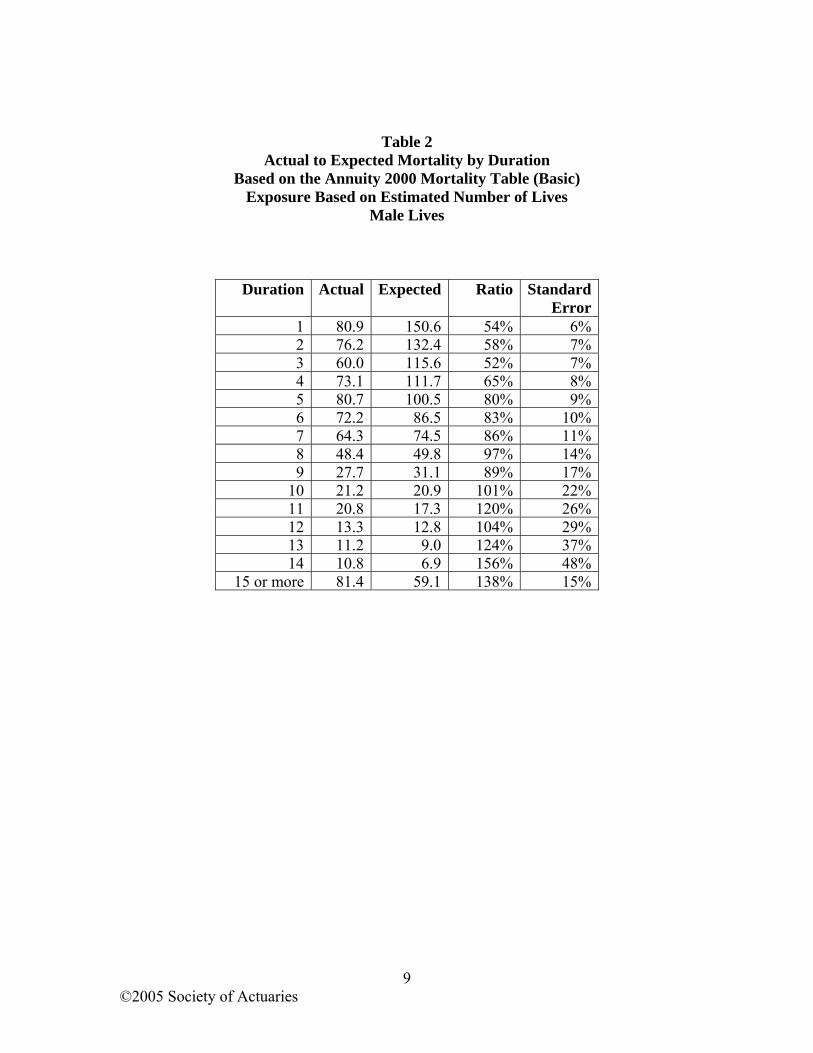
Table 2 Actual to Expected Mortality by Duration
Based on the Annuity 2000 Mortality Table (Basic) Exposure Based on Estimated Number of Lives
Male Lives
Duration Actual Expected Ratio Standard Error
1 80.9 150.6 54% 6% 2 76.2 132.4 58% 7% 3 60.0 115.6 52% 7% 4 73.1 111.7 65% 8% 5 80.7 100.5 80% 9% 6 72.2 86.5 83% 10% 7 64.3 74.5 86% 11% 8 48.4 49.8 97% 14% 9 27.7 31.1 89% 17%
10 21.2 20.9 101% 22% 11 20.8 17.3 120% 26% 12 13.3 12.8 104% 29% 13 11.2 9.0 124% 37% 14 10.8 6.9 156% 48%
15 or more 81.4 59.1 138% 15%
©2005 Society of Actuaries
9
Chart 2 Comparison of Mortality to the Annuity 2000 Mortality Table (Basic) Male Lives
Actual to Expected MortalityBy Duration
Male
0%
50%
100%
150%
200%
250%
1 2 3 4 5 6 7 8 9 10 11 12 13 14 15
Duration
As noted above, we present in Table 3 a grouping of the select and ultimate actual to expected ratios to facilitate comparison with life insurance experience.
Table 3 Actual to Expected Mortality by Duration Groups Based on the Annuity 2000 Mortality Table (Basic)
Exposure Based on Estimated Number of Lives
Duration Actual to ExpectedFemale Male
1 46% 54%2-5 72% 63%
6-10 99% 89%11 or more 117% 131%
©2005 Society of Actuaries
10
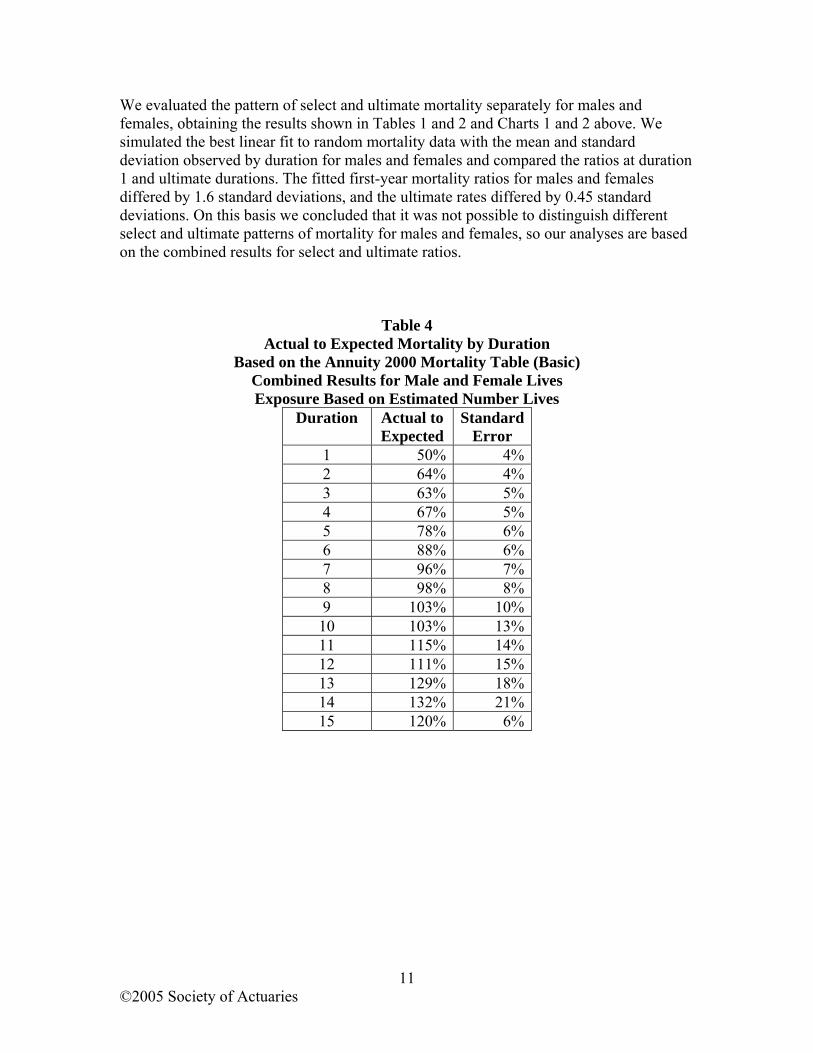
We evaluated the pattern of select and ultimate mortality separately for males and females, obtaining the results shown in Tables 1 and 2 and Charts 1 and 2 above. We simulated the best linear fit to random mortality data with the mean and standard deviation observed by duration for males and females and compared the ratios at duration 1 and ultimate durations. The fitted first-year mortality ratios for males and females differed by 1.6 standard deviations, and the ultimate rates differed by 0.45 standard deviations. On this basis we concluded that it was not possible to distinguish different select and ultimate patterns of mortality for males and females, so our analyses are based on the combined results for select and ultimate ratios.
Table 4 Actual to Expected Mortality by Duration
Based on the Annuity 2000 Mortality Table (Basic) Combined Results for Male and Female Lives Exposure Based on Estimated Number Lives
Duration Actual to Expected
StandardError
1 50% 4%2 64% 4%3 63% 5%4 67% 5%5 78% 6%6 88% 6%7 96% 7%8 98% 8%9 103% 10%10 103% 13%11 115% 14%12 111% 15%13 129% 18%14 132% 21%15 120% 6%
©2005 Society of Actuaries
11
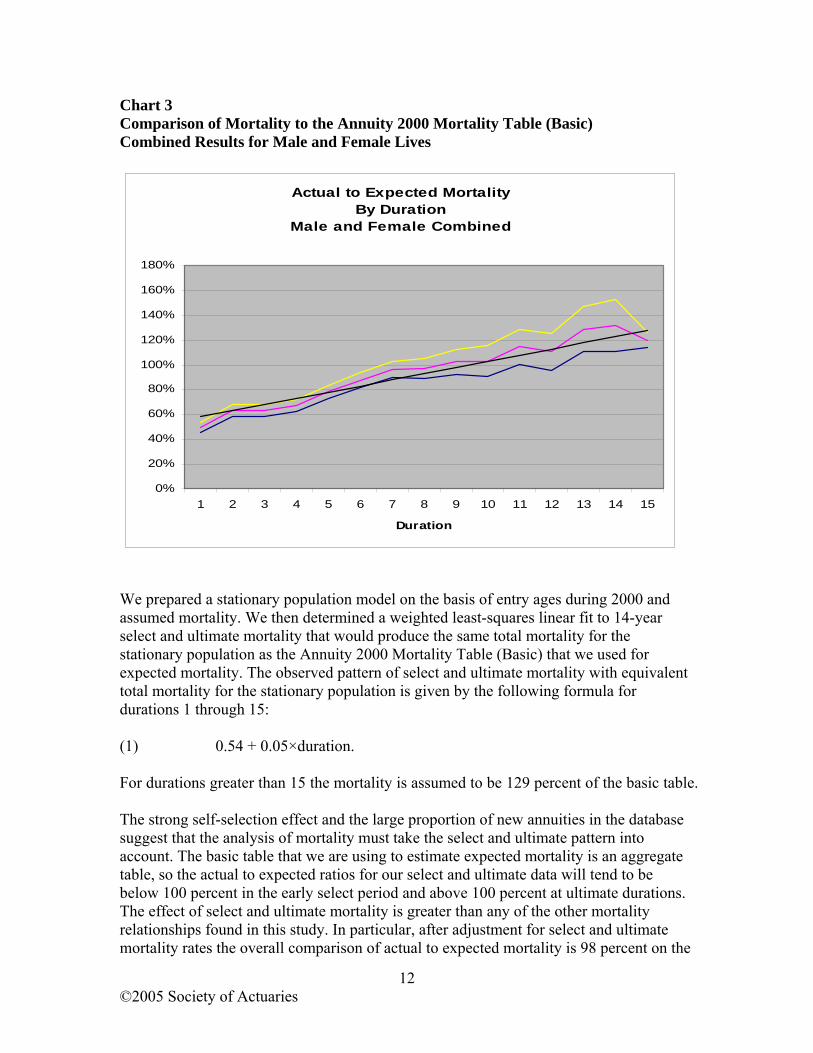
Chart 3 Comparison of Mortality to the Annuity 2000 Mortality Table (Basic) Combined Results for Male and Female Lives
Actual to Expected MortalityBy Duration
Male and Female Combined
0%
20%
40%
60%
80%
100%
120%
140%
160%
180%
1 2 3 4 5 6 7 8 9 10 11 12 13 14 15
Duration
We prepared a stationary population model on the basis of entry ages during 2000 and assumed mortality. We then determined a weighted least-squares linear fit to 14-year select and ultimate mortality that would produce the same total mortality for the stationary population as the Annuity 2000 Mortality Table (Basic) that we used for expected mortality. The observed pattern of select and ultimate mortality with equivalent total mortality for the stationary population is given by the following formula for durations 1 through 15: (1) 0.54 + 0.05×duration. For durations greater than 15 the mortality is assumed to be 129 percent of the basic table. The strong self-selection effect and the large proportion of new annuities in the database suggest that the analysis of mortality must take the select and ultimate pattern into account. The basic table that we are using to estimate expected mortality is an aggregate table, so the actual to expected ratios for our select and ultimate data will tend to be below 100 percent in the early select period and above 100 percent at ultimate durations. The effect of select and ultimate mortality is greater than any of the other mortality relationships found in this study. In particular, after adjustment for select and ultimate mortality rates the overall comparison of actual to expected mortality is 98 percent on the
©2005 Society of Actuaries
12
basis of number of lives and 106 percent on the basis of income amount. This reverses the relationship between these ratios before consideration of select and ultimate mortality rates. As noted above, the difference between these ratios is not statistically significant. The high mortality at advanced ages implies that there would be a small amount of exposure at high durations for contracts issued at advanced ages. There were approximately 800 life years of exposure for annuitants aged 95 or greater in durations 10 or greater, with about 200 deaths in this group. The overall relationship of select and ultimate mortality weights all issue ages in accordance with their respective expected mortality and is appropriate for use with a group of annuities, although the fit may be less accurate for subsets with low exposure. Organizations that issue charitable gift annuities tend to focus on the life expectancy of annuitants when they compare different sets of mortality assumptions. Taking into account the select and ultimate mortality pattern, the mortality rates observed in this study lead to higher life expectancies than are obtained with the use of the Annuity 2000 Mortality Table. The additional life expectancy for females ranges from 3.5 years at age 40 to 3.1 years at age 60 and 2.0 years at age 80. Male life expectancies are increased by 3.9 years at age 40, by 3.3 years at age 60, and by 2.0 years at age 80. All of these increases are measured from the time of issue of a new annuity. While the pattern of mortality is quite different from that of the Annuity 2000 Mortality Table, we have performed limited tests that indicate that there is a relatively small difference between the present value of benefits on the basis of observed mortality and the present value on the basis of the valuation table. Mortality Relationships to Type of Group Various theories have been proposed to predict the relative mortality of donors to various types of charitable organizations. For example, donors to universities might be expected to have low mortality because of high socio-economic status and educational attainment. Donors to religious charities might have low mortality because of a healthy lifestyle. It was also theorized that donors to health-related organizations might have high mortality, because they would include victims of various serious diseases. We analyzed the relative mortality by type of charity, taking into account select and ultimate mortality. In a few cases the same individual had charitable annuities with more than one charity. In these cases we allocated the exposure over the annuities in force with fractional exposure being allocated to the respective charities.
©2005 Society of Actuaries
13

Table 5 Actual to Expected Mortality by Type of Group
On the Basis of Lives Combined Male and Female Results
Adjusted for Select and Ultimate Mortality
Type of Group Actual Expected Ratio Standard Error
Secular College 116 95 122% 11% Health Research or Care 238 210 113% 7%
Religious Charity 1,689 1,749 97% 2% Religious College 199 241 83% 6%
Table 6 Actual to Expected Mortality by Type of Group
On the Basis of Annuity Income Combined Male and Female Results
Adjusted for Select and Ultimate Mortality
Type of Group Actual Expected Ratio Secular College 883,389 750,092 118%
Health Research or Care 989,270 798,915 124% Religious Charity 4,496,035 4,365,179 103% Religious College 615,484 685,549 90%
Some of the theories about mortality by type of charity are supported by our analysis. Other theories are not supported. Health-related charities had mortality about 13 percent above the average of the group, with a standard error of 7 percent. Colleges with a religious focus had mortality about 17 percent less than the average of the group with a standard error of 6 percent. Secular colleges had mortality 22 percent above the average of the group with a standard error of 11 percent. General religious charities had mortality close to the average of the group, taking into account the statistical uncertainty of the results. The average income for annuities is largest for secular colleges and smallest for religious colleges and religious charities, so the effects observed by organization type cannot be explained on the basis of differences in income amount. It should be noted that the charities that submitted data do not represent a random sample of the population of charities as a whole and may not be representative of the universe of charitable annuities. In particular, more than 75 percent of the data came from religious charities other than colleges. The mortality of the organizations in the database may not be representative of that of other charities with a similar mission.
©2005 Society of Actuaries
14

Pattern of Mortality by Age We evaluated actual to expected mortality by age and sex within relatively broad groups. Once multiple annuity contracts to single individuals were combined, we observed 2,200 deaths in the database. Separating these by age and sex reduced the credibility of the individual results, so we grouped the ages to provide for reasonable credibility. Although virtually all ages were represented in the group, the exposure at younger ages was very low. Only 21 deaths were observed for individuals younger than age 70, so it was not possible to obtain separate meaningful results for these ages. For ages 70 and above we grouped the data into 10-year groupings. The group of females above age 100 actually includes about 10 life years of exposure for ages greater than 110. If we had not considered select and ultimate mortality, the data by age would be severely distorted by the fact that there are a large number of newly issued annuities for individuals in their 60s and 70s. For this reason we modeled expected mortality by using the Annuity 2000 Mortality Table (Basic) with an adjustment for duration. The duration adjustment was the simple linear approximation shown in formula (1) above. Results by age are shown in Tables 7 and 8 below. Detailed results are presented in Tables 17 through 20 in the Appendix. Table 7. Actual to Expected Mortality for Females Adjusted for Select and Ultimate Mortality
Age Actual to Expected Ratio for Number
of Deaths
Actual to Expected Ratio for Annual
Income
Standard Error for Ratio Based on
Number of Deaths Less than 70 120% 164% 34%70-79 94% 96% 9%80-89 94% 107% 4%90-99 106% 110% 4%100 or More 86% 167% 12% Table 8. Actual to Expected Mortality for Males Adjusted for Select and Ultimate Mortality
Age Actual to Expected Ratio for Number
of Deaths
Actual to Expected Ratio for Annual
Income
Standard Error for Ratio Based on
Number of Deaths Less than 70 62% 22% 21%70-79 71% 54% 7%80-89 91% 104% 5%90-99 115% 107% 7%100 or More 141% 191% 32% The observed female mortality follows the tabular mortality fairly closely, taking into consideration the standard error of measurement. Male mortality is lower than the reference table at younger ages and higher at older ages, even considering the standard
©2005 Society of Actuaries
15

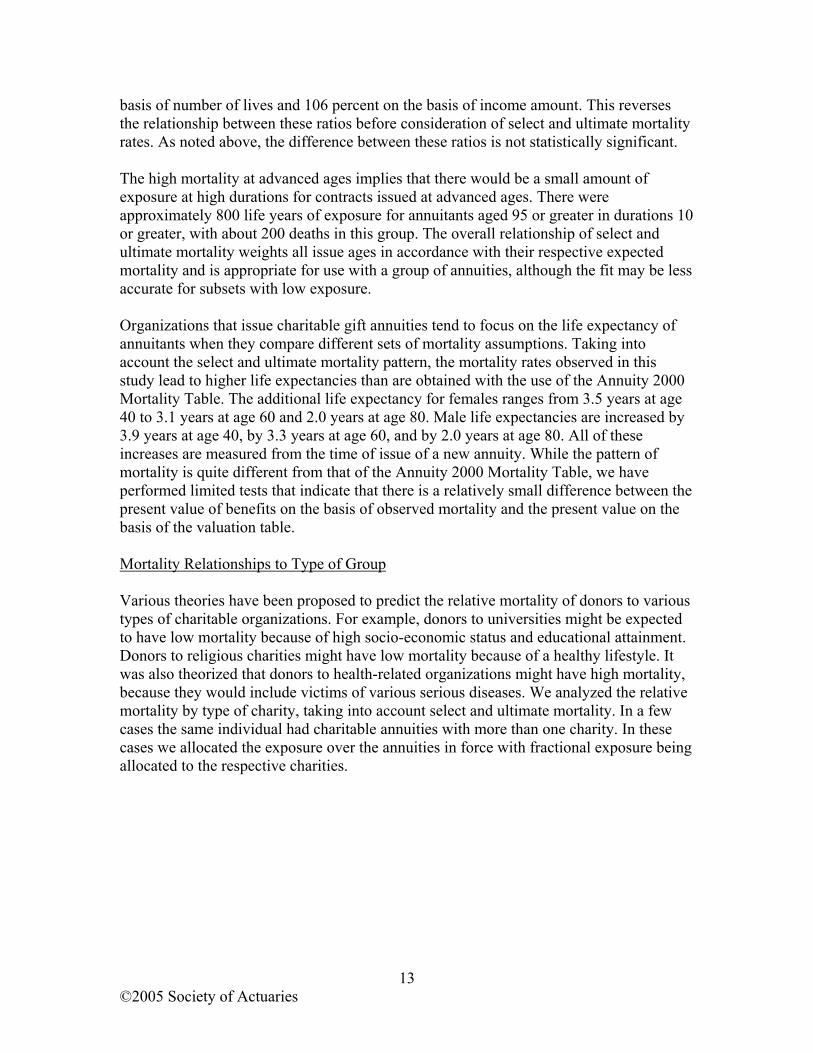
error of measurement. In comparing actual to expected mortality the effect of select and ultimate mortality is very significant in all cases. Tables 17 through 24 in the Appendix present details of actual to expected mortality by age on the basis of number of lives and amount of annual income and both with and without adjustment for select and ultimate mortality. Because of the relatively low credibility of the data and the close relationship of ultimate female actual to expected mortality at most ages, we have not developed a specific mortality table for charitable gift annuities. Select and Ultimate Mortality by Contract As suggested by the Project Oversight Group we analyzed the pattern of select and ultimate mortality by contract. This was thought to be generally advisable, but was particularly necessary in this case in view of the rather unusual approach that we took to the measurement of exposure by lives. In this analysis we assigned a weight of one to each contract, without regard to the possibility of duplicate contracts per person. We did not estimate the standard error of the actual to expected ratios, because the variability of the number of contracts per person would cause the number of actual deaths to follow a distribution other than the binomial distribution. This distribution might not be well approximated by the Poisson distribution used for the estimate of the standard deviation of the results on the basis of lives. The standard deviations of the results by contract would be greater than those for the results based on lives. The pattern of select and ultimate mortality as measured on the basis of exposure by contract is very strong, although not quite as strong as the results on the basis of estimated number of lives. Tables 9 through 12 present the results for females, males, females and males combined, and by duration groupings, respectively.
©2005 Society of Actuaries
16
Table 9 Actual to Expected Mortality by Duration
Based on the Annuity 2000 Mortality Table (Basic) Exposure Based on Number of Contracts
Female Lives Duration Actual Expected Ratio
1 120 323 37%2 229 340 67%3 174 304 57%4 192 329 58%5 208 322 65%6 238 305 78%7 250 318 79%8 181 219 83%9 117 143 82%
10 87 107 81%11 99 99 100%12 86 85 101%13 80 75 106%14 69 73 94%
15 or more 615 619 99%
Table 10 Actual to Expected Mortality by Duration
Based on the Annuity 2000 Mortality Table (Basic) Exposure Based on Number of Contracts
Male Lives Duration Actual Expected Ratio
1 148 257 58%2 138 238 58%3 105 215 49%4 132 201 66%5 133 177 75%6 132 164 81%7 143 159 90%8 92 101 91%9 62 64 97%
10 35 46 77%11 41 37 111%12 28 29 96%13 19 24 78%14 22 20 112%
15 or more 92 69 134%
©2005 Society of Actuaries
17
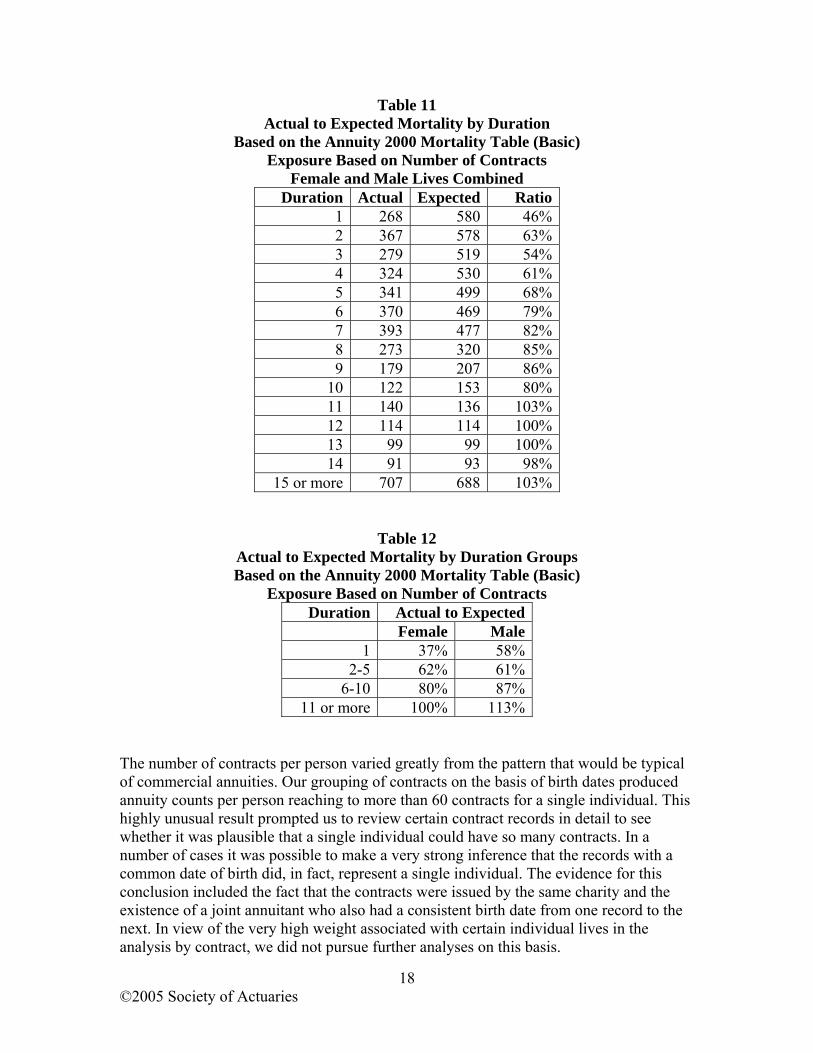
Table 11 Actual to Expected Mortality by Duration
Based on the Annuity 2000 Mortality Table (Basic) Exposure Based on Number of Contracts
Female and Male Lives Combined Duration Actual Expected Ratio
1 268 580 46%2 367 578 63%3 279 519 54%4 324 530 61%5 341 499 68%6 370 469 79%7 393 477 82%8 273 320 85%9 179 207 86%
10 122 153 80%11 140 136 103%12 114 114 100%13 99 99 100%14 91 93 98%
15 or more 707 688 103%
Table 12 Actual to Expected Mortality by Duration Groups Based on the Annuity 2000 Mortality Table (Basic)
Exposure Based on Number of Contracts Duration Actual to Expected
Female Male1 37% 58%
2-5 62% 61%6-10 80% 87%
11 or more 100% 113% The number of contracts per person varied greatly from the pattern that would be typical of commercial annuities. Our grouping of contracts on the basis of birth dates produced annuity counts per person reaching to more than 60 contracts for a single individual. This highly unusual result prompted us to review certain contract records in detail to see whether it was plausible that a single individual could have so many contracts. In a number of cases it was possible to make a very strong inference that the records with a common date of birth did, in fact, represent a single individual. The evidence for this conclusion included the fact that the contracts were issued by the same charity and the existence of a joint annuitant who also had a consistent birth date from one record to the next. In view of the very high weight associated with certain individual lives in the analysis by contract, we did not pursue further analyses on this basis.
©2005 Society of Actuaries
18
Mortality of Contingent Beneficiaries As noted above, 25 percent of the annuity contracts in the database were joint annuities. Such annuities indicated a principal annuitant and a secondary annuitant, whom we refer to here as a contingent beneficiary. We would not expect that the data for deaths of contingent beneficiaries would be maintained accurately during the life of the principal annuitant, since the death of a contingent beneficiary during this period would not affect the amount of annuity benefits payable. Therefore, we evaluated the mortality rates for contingent beneficiaries only after the death of the principal annuitant. In addition to deaths of primary beneficiaries, the database included 51 deaths of contingent beneficiaries during the study period and after the death of the primary annuitant. The ratio of actual to expected mortality on the basis of the Annuity 2000 Mortality Table (Basic) without any adjustment for select and ultimate mortality was 113 percent on the basis of the number of deaths, with a standard error of 16 percent. The actual to expected ratio based on amount of annual income was 133 percent, also without adjustment for select and ultimate mortality. The ratio of actual to expected mortality with the select and ultimate adjustment of formula (1) above was 110 percent, plus or minus 15 percent, on the basis of number of deaths and 143 percent on the basis of the amount of annual income. The small amount of data for contingent beneficiaries does not permit analysis of mortality for subsets of these individuals. Conclusion Overall, mortality for beneficiaries of charitable gift annuities is lower than the rates in the Annuity 2000 Mortality Table. Most of the difference is attributable to a strong pattern of select and ultimate mortality, which can be reasonably approximated by a linear adjustment to the tabular rates at durations 1 through 14. Ultimate mortality is greater than tabular mortality. Differences in mortality among organizations of different types exist, but not all of the expected differences were observed in the data. Differences in actual to expected mortality by age are small for females, but exhibit a pattern of increasing actual to expected ratios by age for males. Such differences are difficult to quantify because of limited statistical credibility.
©2005 Society of Actuaries
19

References BEHAN, DONALD F. 1996. “Planned Giving with Gift Annuities,” Nonprofit World, 14(2) 11-15. CLONTZ, BRYAN AND DONALD F. BEHAN. 2004. “Optimizing Charitable Gift Annuity Risk Management: Collaring the Bear and the Grim Reaper,” The Journal of Gift Planning. 8(1) 5-9, 33-41. JOHANSEN, ROBERT J. 1995. “Review of Adequacy of 1983 Individual Annuity Mortality Table,” Transactions of the Society of Actuaries. (47) 211-49. JOHANSEN, ROBERT J. 1996. “Annuity 2000 Mortality Tables,” Transactions of the Society of Actuaries 1995-96 Reports. 263-90. NEWTON, MARK AND BRYAN CLONTZ. 1998. “An Analysis of Commercial Insurance as an Alternative Gift Financing Option,” Journal of Gift Planning. 2(4) 5-53.
©2005 Society of Actuaries
20

Appendix: Details of Exposure and Mortality Ratios Table 13 Exposure for Females by Age
Age Life Income Contract Age Life Income Contract ≤30 23 9,323 28 70 347 602,597 589
31 2 290 2 71 433 812,356 717 32 2 0 2 72 503 857,805 826 33 4 718 5 73 588 1,105,256 958 34 4 1,018 4 74 664 1,267,899 1,040 35 5 1,018 8 75 785 1,560,565 1,261 36 7 1,548 10 76 862 1,675,832 1,425 37 8 1,291 15 77 923 1,887,844 1,471 38 11 1,588 18 78 1,032 2,078,481 1,657 39 11 1,920 21 79 1,091 2,234,897 1,759 40 11 2,398 19 80 1,190 2,571,310 1,936 41 11 2,779 16 81 1,262 2,940,219 2,116 42 15 26,617 16 82 1,309 3,513,823 2,278 43 18 25,927 20 83 1,312 3,689,145 2,408 44 24 29,009 32 84 1,296 3,567,108 2,411 45 23 31,782 29 85 1,277 3,586,894 2,364 46 20 29,209 25 86 1,279 3,490,841 2,325 47 25 69,642 31 87 1,220 3,411,344 2,305 48 26 68,090 31 88 1,167 3,406,270 2,246 49 28 82,007 35 89 1,104 3,474,164 2,229 50 31 88,503 38 90 1,004 3,185,099 2,045 51 30 51,748 45 91 855 2,827,017 2,031 52 26 40,968 38 92 719 2,443,675 1,684 53 26 33,426 33 93 599 2,138,408 1,503 54 39 51,088 56 94 484 1,808,652 1,142 55 42 82,865 63 95 375 1,388,502 875 56 38 87,618 53 96 280 932,841 665 57 36 77,295 59 97 228 748,426 598 58 30 64,371 53 98 154 482,932 517 59 31 37,373 36 99 117 423,599 311 60 53 103,189 71 100 75 269,891 212 61 72 133,739 101 101 43 174,660 111 62 91 159,601 145 102 26 95,292 55 63 92 170,204 152 103 17 20,859 29 64 128 197,555 207 104 12 10,839 18 65 158 288,344 230 105 9 4,798 12 66 184 359,713 271 106 6 1,658 7 67 210 367,231 324 107 5 1,668 7 68 243 378,593 374 108 2 1,101 2 69 291 459,431 460 109 3 970 4 70 347 602,597 589 ≥110 5 1,209 6
21 ©2005 Society of Actuaries
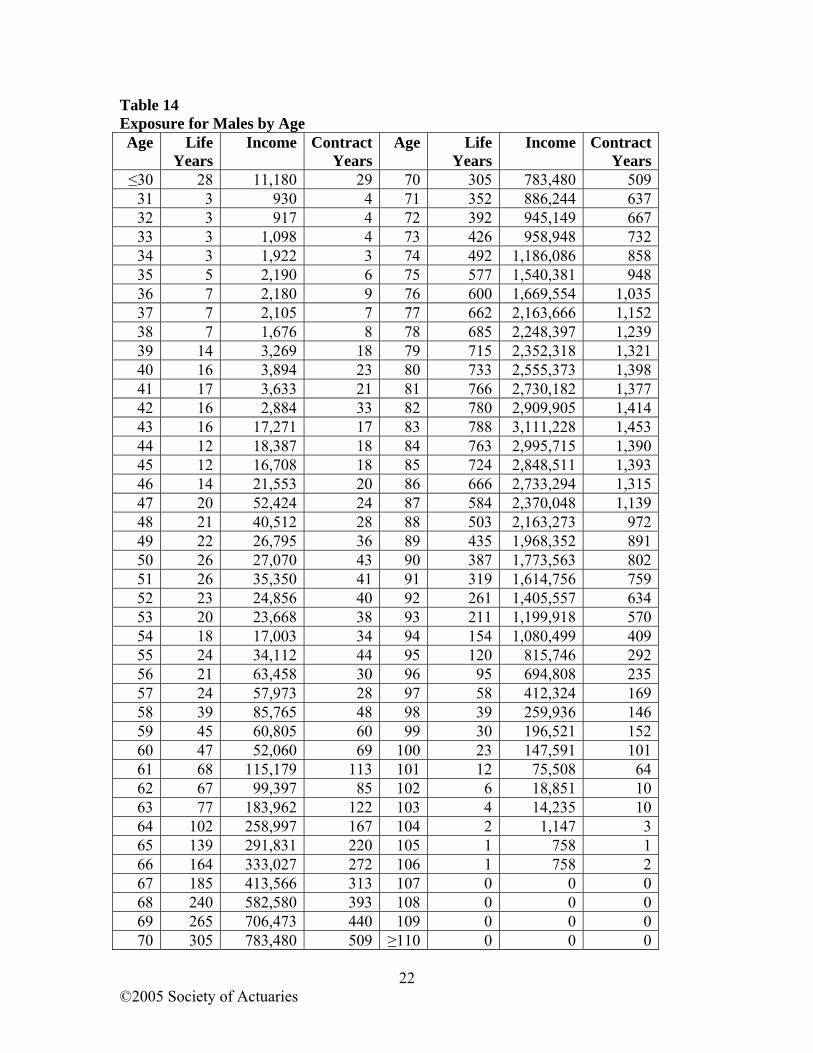
Table 14 Exposure for Males by Age Age Life
Years Income Contract
YearsAge Life
YearsIncome Contract
Years ≤30 28 11,180 29 70 305 783,480 509
31 3 930 4 71 352 886,244 637 32 3 917 4 72 392 945,149 667 33 3 1,098 4 73 426 958,948 732 34 3 1,922 3 74 492 1,186,086 858 35 5 2,190 6 75 577 1,540,381 948 36 7 2,180 9 76 600 1,669,554 1,035 37 7 2,105 7 77 662 2,163,666 1,152 38 7 1,676 8 78 685 2,248,397 1,239 39 14 3,269 18 79 715 2,352,318 1,321 40 16 3,894 23 80 733 2,555,373 1,398 41 17 3,633 21 81 766 2,730,182 1,377 42 16 2,884 33 82 780 2,909,905 1,414 43 16 17,271 17 83 788 3,111,228 1,453 44 12 18,387 18 84 763 2,995,715 1,390 45 12 16,708 18 85 724 2,848,511 1,393 46 14 21,553 20 86 666 2,733,294 1,315 47 20 52,424 24 87 584 2,370,048 1,139 48 21 40,512 28 88 503 2,163,273 972 49 22 26,795 36 89 435 1,968,352 891 50 26 27,070 43 90 387 1,773,563 802 51 26 35,350 41 91 319 1,614,756 759 52 23 24,856 40 92 261 1,405,557 634 53 20 23,668 38 93 211 1,199,918 570 54 18 17,003 34 94 154 1,080,499 409 55 24 34,112 44 95 120 815,746 292 56 21 63,458 30 96 95 694,808 235 57 24 57,973 28 97 58 412,324 169 58 39 85,765 48 98 39 259,936 146 59 45 60,805 60 99 30 196,521 152 60 47 52,060 69 100 23 147,591 101 61 68 115,179 113 101 12 75,508 64 62 67 99,397 85 102 6 18,851 10 63 77 183,962 122 103 4 14,235 10 64 102 258,997 167 104 2 1,147 3 65 139 291,831 220 105 1 758 1 66 164 333,027 272 106 1 758 2 67 185 413,566 313 107 0 0 0 68 240 582,580 393 108 0 0 0 69 265 706,473 440 109 0 0 0 70 305 783,480 509 ≥110 0 0 0
22 ©2005 Society of Actuaries
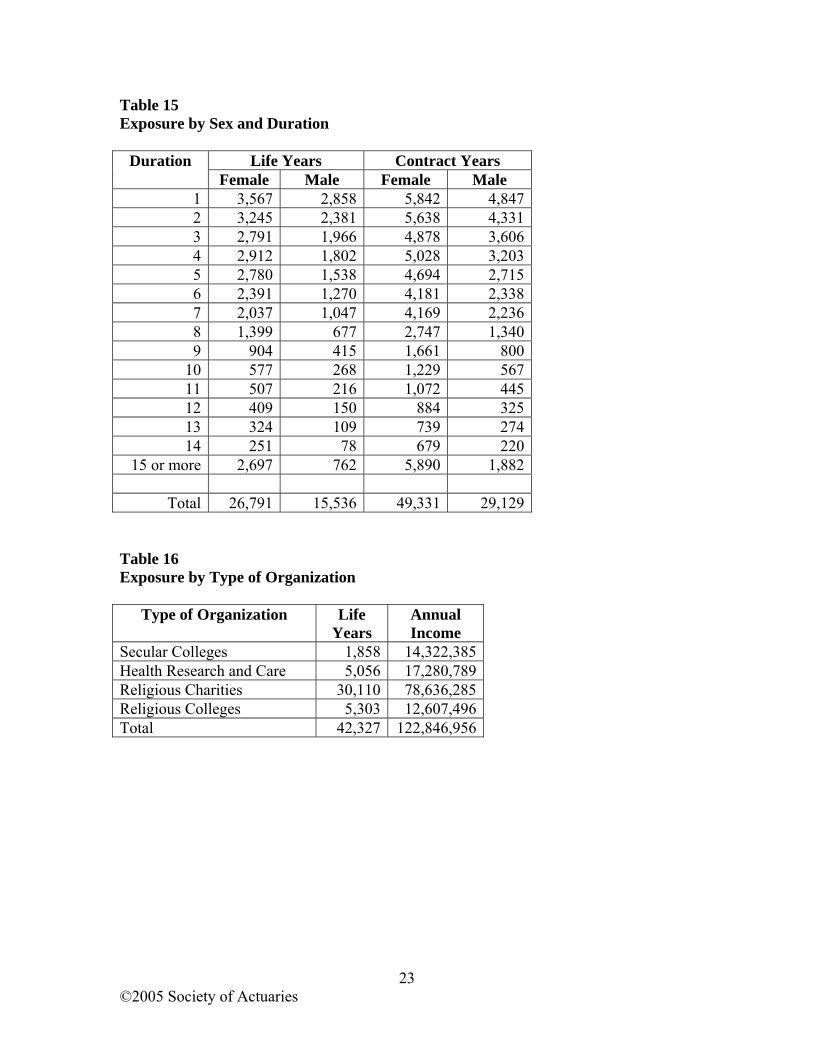
Table 15 Exposure by Sex and Duration
Life Years Contract Years Duration Female Male Female Male
1 3,567 2,858 5,842 4,8472 3,245 2,381 5,638 4,3313 2,791 1,966 4,878 3,6064 2,912 1,802 5,028 3,2035 2,780 1,538 4,694 2,7156 2,391 1,270 4,181 2,3387 2,037 1,047 4,169 2,2368 1,399 677 2,747 1,3409 904 415 1,661 800
10 577 268 1,229 56711 507 216 1,072 44512 409 150 884 32513 324 109 739 27414 251 78 679 220
15 or more 2,697 762 5,890 1,882
Total 26,791 15,536 49,331 29,129 Table 16 Exposure by Type of Organization
Type of Organization Life Years
Annual Income
Secular Colleges 1,858 14,322,385Health Research and Care 5,056 17,280,789Religious Charities 30,110 78,636,285Religious Colleges 5,303 12,607,496Total 42,327 122,846,956
©2005 Society of Actuaries
23
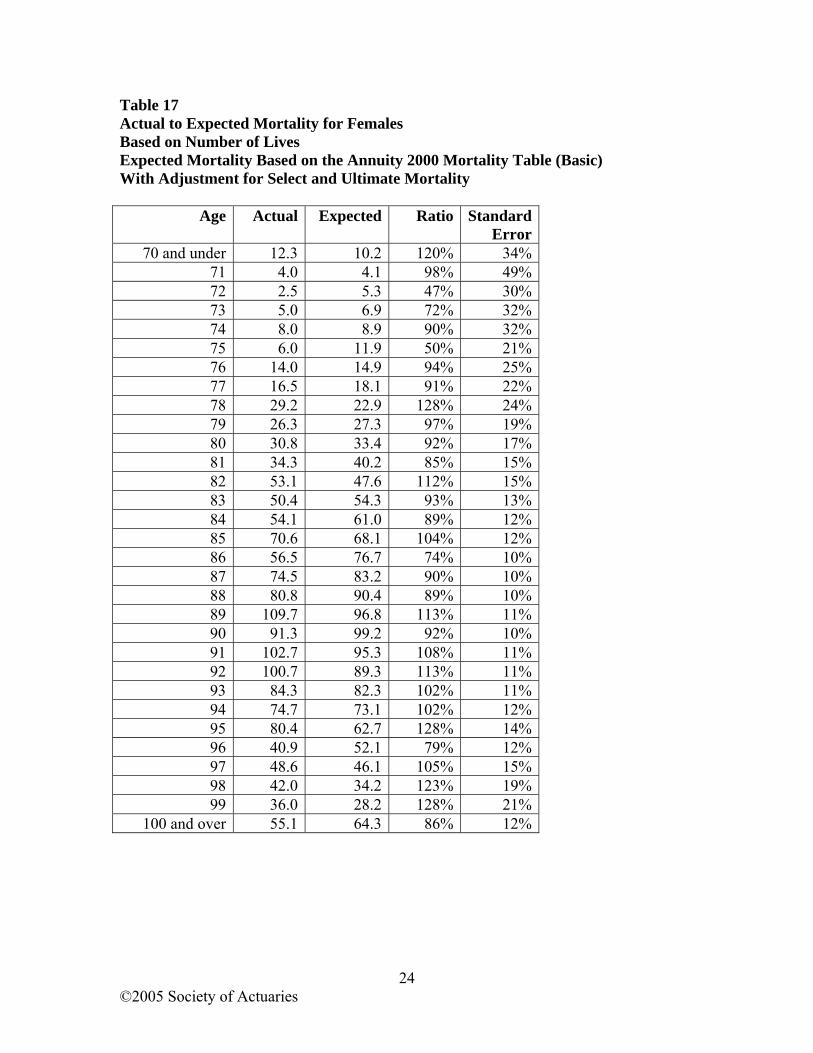
Table 17 Actual to Expected Mortality for Females Based on Number of Lives Expected Mortality Based on the Annuity 2000 Mortality Table (Basic) With Adjustment for Select and Ultimate Mortality
Age Actual Expected Ratio Standard Error
70 and under 12.3 10.2 120% 34%71 4.0 4.1 98% 49%72 2.5 5.3 47% 30%73 5.0 6.9 72% 32%74 8.0 8.9 90% 32%75 6.0 11.9 50% 21%76 14.0 14.9 94% 25%77 16.5 18.1 91% 22%78 29.2 22.9 128% 24%79 26.3 27.3 97% 19%80 30.8 33.4 92% 17%81 34.3 40.2 85% 15%82 53.1 47.6 112% 15%83 50.4 54.3 93% 13%84 54.1 61.0 89% 12%85 70.6 68.1 104% 12%86 56.5 76.7 74% 10%87 74.5 83.2 90% 10%88 80.8 90.4 89% 10%89 109.7 96.8 113% 11%90 91.3 99.2 92% 10%91 102.7 95.3 108% 11%92 100.7 89.3 113% 11%93 84.3 82.3 102% 11%94 74.7 73.1 102% 12%95 80.4 62.7 128% 14%96 40.9 52.1 79% 12%97 48.6 46.1 105% 15%98 42.0 34.2 123% 19%99 36.0 28.2 128% 21%
100 and over 55.1 64.3 86% 12%
©2005 Society of Actuaries
24
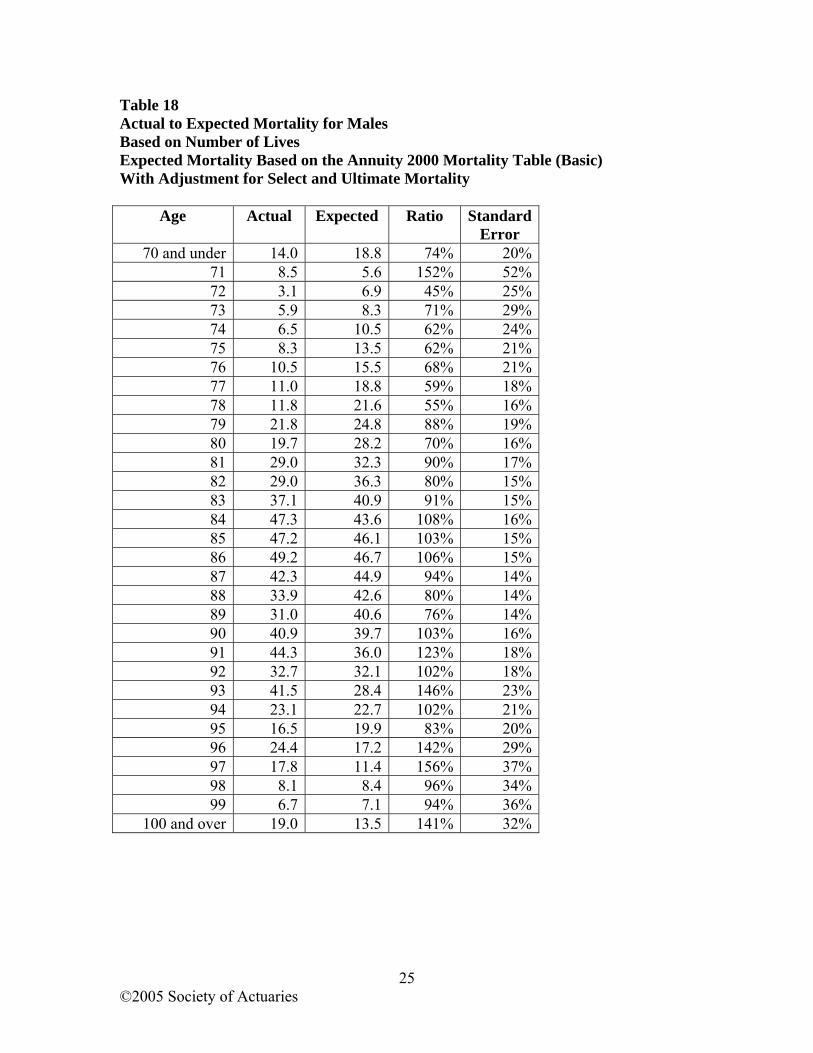
Table 18 Actual to Expected Mortality for Males Based on Number of Lives Expected Mortality Based on the Annuity 2000 Mortality Table (Basic) With Adjustment for Select and Ultimate Mortality
Age Actual Expected Ratio Standard Error
70 and under 14.0 18.8 74% 20%71 8.5 5.6 152% 52%72 3.1 6.9 45% 25%73 5.9 8.3 71% 29%74 6.5 10.5 62% 24%75 8.3 13.5 62% 21%76 10.5 15.5 68% 21%77 11.0 18.8 59% 18%78 11.8 21.6 55% 16%79 21.8 24.8 88% 19%80 19.7 28.2 70% 16%81 29.0 32.3 90% 17%82 29.0 36.3 80% 15%83 37.1 40.9 91% 15%84 47.3 43.6 108% 16%85 47.2 46.1 103% 15%86 49.2 46.7 106% 15%87 42.3 44.9 94% 14%88 33.9 42.6 80% 14%89 31.0 40.6 76% 14%90 40.9 39.7 103% 16%91 44.3 36.0 123% 18%92 32.7 32.1 102% 18%93 41.5 28.4 146% 23%94 23.1 22.7 102% 21%95 16.5 19.9 83% 20%96 24.4 17.2 142% 29%97 17.8 11.4 156% 37%98 8.1 8.4 96% 34%99 6.7 7.1 94% 36%
100 and over 19.0 13.5 141% 32%
©2005 Society of Actuaries
25

Table 19 Actual to Expected Mortality for Females Based on Amount of Annual Income Expected Mortality Based on the Annuity 2000 Mortality Table (Basic) With Adjustment for Select and Ultimate Mortality
Age Actual Expected Ratio 70 and under 24,420 14,906 164%
71 1,883 6,663 28%72 1,480 7,804 19%73 6,983 11,391 61%74 2,479 14,782 17%75 8,576 20,637 42%76 12,700 25,218 50%77 22,099 31,953 69%78 66,989 39,346 170%79 75,550 48,119 157%80 87,601 62,051 141%81 35,416 78,390 45%82 176,108 105,800 166%83 241,688 127,823 189%84 161,462 141,041 114%85 159,138 160,575 99%86 151,011 178,070 85%87 154,984 192,226 81%88 170,373 217,777 78%89 283,969 248,663 114%90 248,262 253,719 98%91 274,858 257,671 107%92 270,418 253,762 107%93 181,656 239,461 76%94 219,430 216,547 101%95 298,044 182,802 163%96 119,614 135,853 88%97 152,512 122,491 125%98 123,592 84,184 147%99 124,626 75,815 164%
100 and over 198,948 119,103 167%
©2005 Society of Actuaries
26
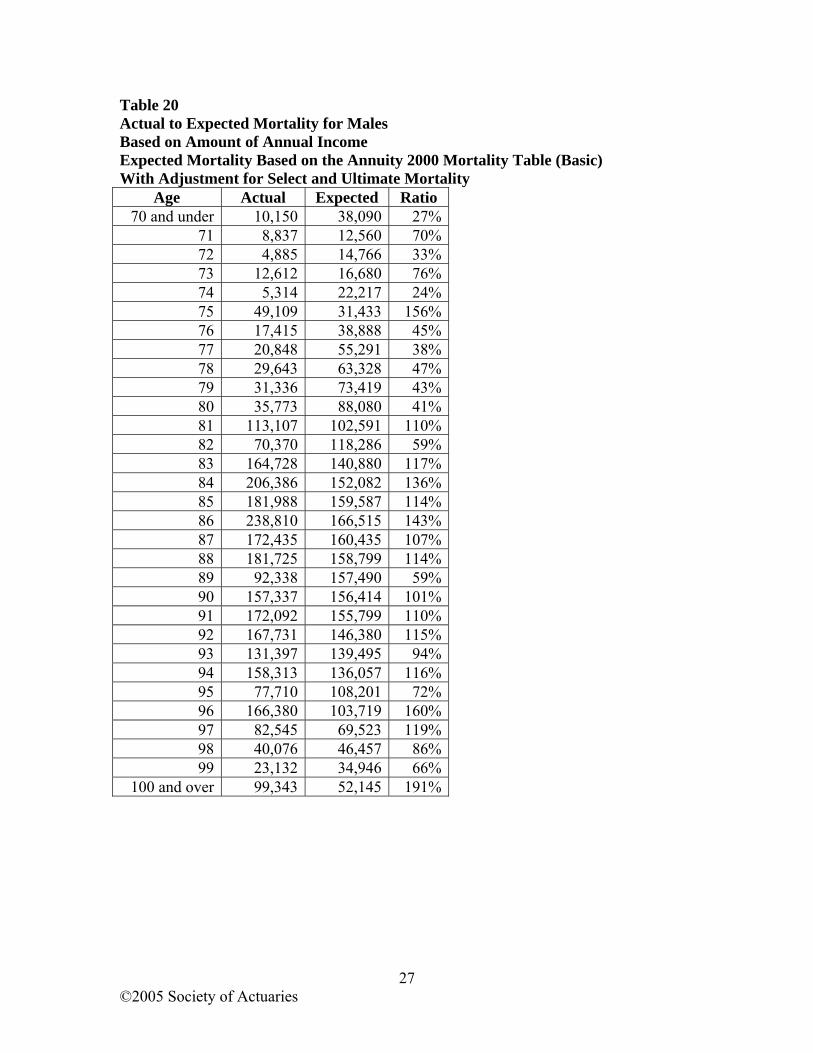
Table 20 Actual to Expected Mortality for Males Based on Amount of Annual Income Expected Mortality Based on the Annuity 2000 Mortality Table (Basic) With Adjustment for Select and Ultimate Mortality
Age Actual Expected Ratio 70 and under 10,150 38,090 27%
71 8,837 12,560 70%72 4,885 14,766 33%73 12,612 16,680 76%74 5,314 22,217 24%75 49,109 31,433 156%76 17,415 38,888 45%77 20,848 55,291 38%78 29,643 63,328 47%79 31,336 73,419 43%80 35,773 88,080 41%81 113,107 102,591 110%82 70,370 118,286 59%83 164,728 140,880 117%84 206,386 152,082 136%85 181,988 159,587 114%86 238,810 166,515 143%87 172,435 160,435 107%88 181,725 158,799 114%89 92,338 157,490 59%90 157,337 156,414 101%91 172,092 155,799 110%92 167,731 146,380 115%93 131,397 139,495 94%94 158,313 136,057 116%95 77,710 108,201 72%96 166,380 103,719 160%97 82,545 69,523 119%98 40,076 46,457 86%99 23,132 34,946 66%
100 and over 99,343 52,145 191%
©2005 Society of Actuaries
27
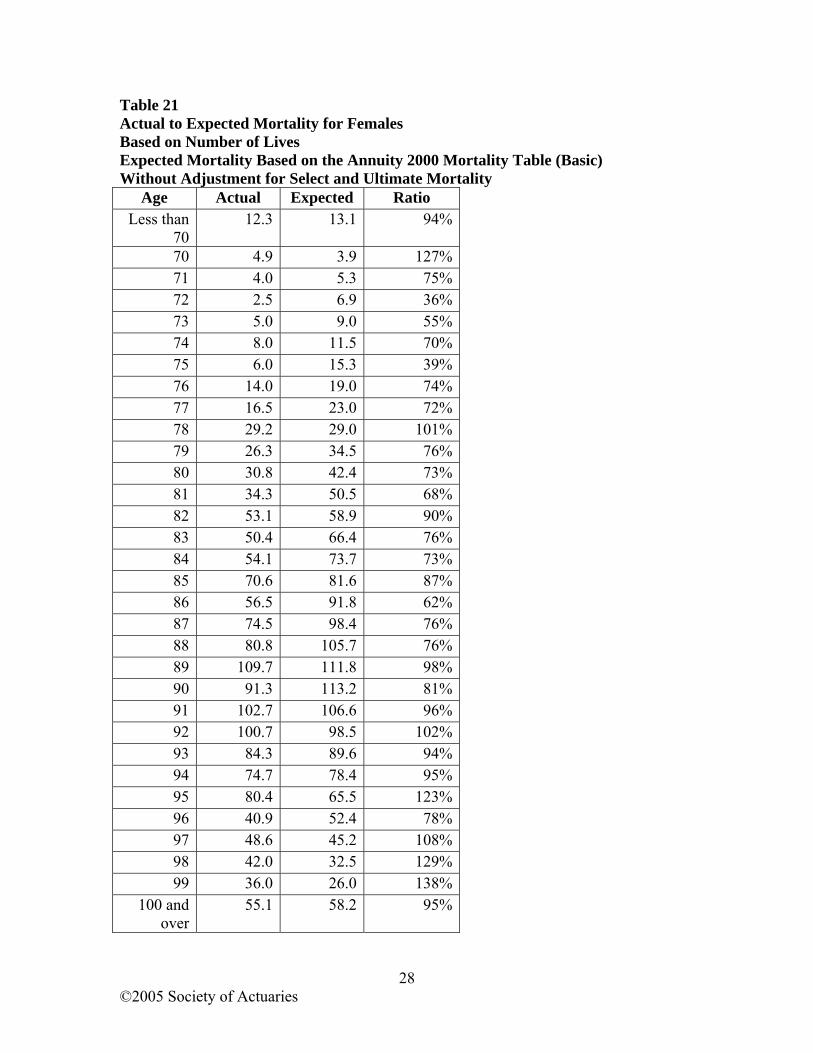
Table 21 Actual to Expected Mortality for Females Based on Number of Lives Expected Mortality Based on the Annuity 2000 Mortality Table (Basic) Without Adjustment for Select and Ultimate Mortality
Age Actual Expected Ratio Less than
70 12.3 13.1 94%
70 4.9 3.9 127%71 4.0 5.3 75%72 2.5 6.9 36%73 5.0 9.0 55%74 8.0 11.5 70%75 6.0 15.3 39%76 14.0 19.0 74%77 16.5 23.0 72%78 29.2 29.0 101%79 26.3 34.5 76%80 30.8 42.4 73%81 34.3 50.5 68%82 53.1 58.9 90%83 50.4 66.4 76%84 54.1 73.7 73%85 70.6 81.6 87%86 56.5 91.8 62%87 74.5 98.4 76%88 80.8 105.7 76%89 109.7 111.8 98%90 91.3 113.2 81%91 102.7 106.6 96%92 100.7 98.5 102%93 84.3 89.6 94%94 74.7 78.4 95%95 80.4 65.5 123%96 40.9 52.4 78%97 48.6 45.2 108%98 42.0 32.5 129%99 36.0 26.0 138%
100 and over
55.1 58.2 95%
©2005 Society of Actuaries
28
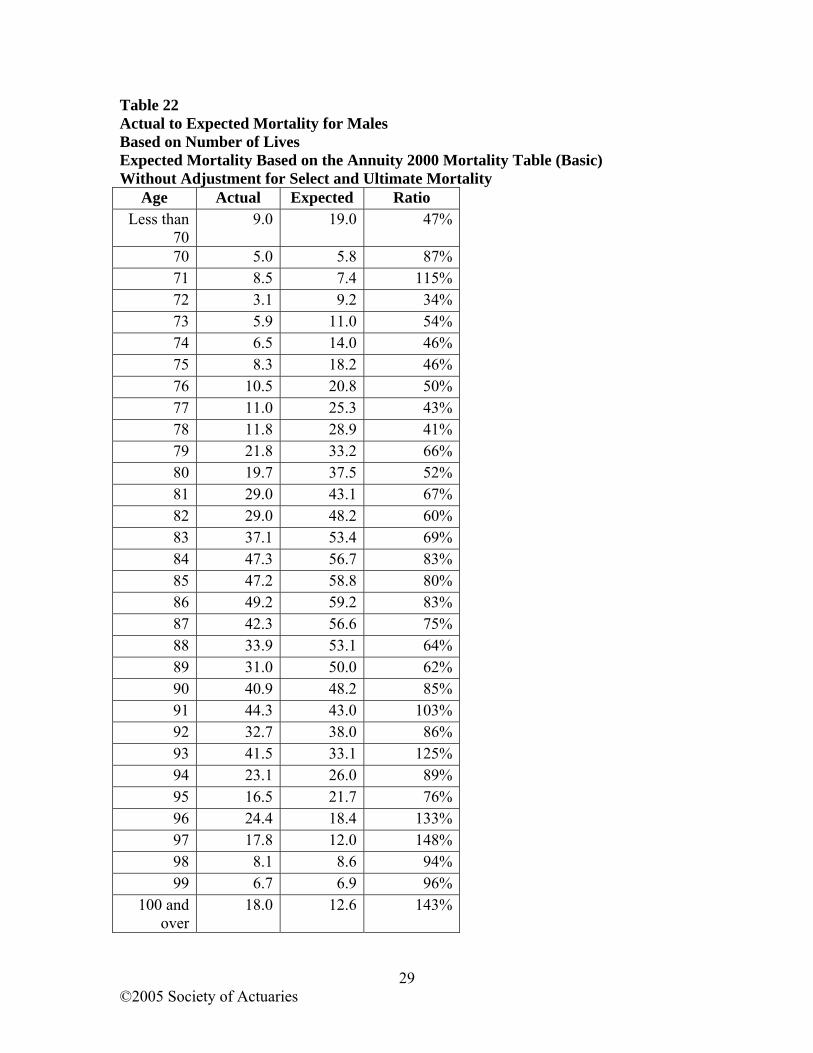
Table 22 Actual to Expected Mortality for Males Based on Number of Lives Expected Mortality Based on the Annuity 2000 Mortality Table (Basic) Without Adjustment for Select and Ultimate Mortality
Age Actual Expected Ratio Less than
70 9.0 19.0 47%
70 5.0 5.8 87%71 8.5 7.4 115%72 3.1 9.2 34%73 5.9 11.0 54%74 6.5 14.0 46%75 8.3 18.2 46%76 10.5 20.8 50%77 11.0 25.3 43%78 11.8 28.9 41%79 21.8 33.2 66%80 19.7 37.5 52%81 29.0 43.1 67%82 29.0 48.2 60%83 37.1 53.4 69%84 47.3 56.7 83%85 47.2 58.8 80%86 49.2 59.2 83%87 42.3 56.6 75%88 33.9 53.1 64%89 31.0 50.0 62%90 40.9 48.2 85%91 44.3 43.0 103%92 32.7 38.0 86%93 41.5 33.1 125%94 23.1 26.0 89%95 16.5 21.7 76%96 24.4 18.4 133%97 17.8 12.0 148%98 8.1 8.6 94%99 6.7 6.9 96%
100 and over
18.0 12.6 143%
©2005 Society of Actuaries
29
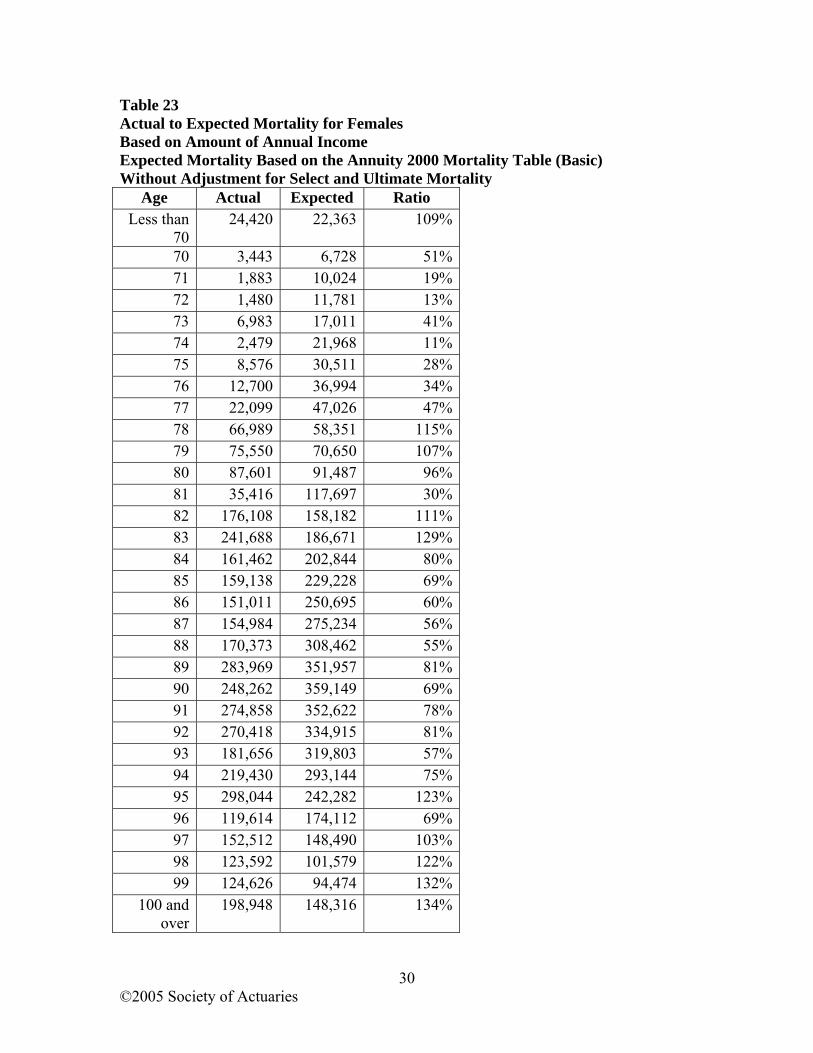
Table 23 Actual to Expected Mortality for Females Based on Amount of Annual Income Expected Mortality Based on the Annuity 2000 Mortality Table (Basic) Without Adjustment for Select and Ultimate Mortality
Age Actual Expected Ratio Less than
70 24,420 22,363 109%
70 3,443 6,728 51%71 1,883 10,024 19%72 1,480 11,781 13%73 6,983 17,011 41%74 2,479 21,968 11%75 8,576 30,511 28%76 12,700 36,994 34%77 22,099 47,026 47%78 66,989 58,351 115%79 75,550 70,650 107%80 87,601 91,487 96%81 35,416 117,697 30%82 176,108 158,182 111%83 241,688 186,671 129%84 161,462 202,844 80%85 159,138 229,228 69%86 151,011 250,695 60%87 154,984 275,234 56%88 170,373 308,462 55%89 283,969 351,957 81%90 248,262 359,149 69%91 274,858 352,622 78%92 270,418 334,915 81%93 181,656 319,803 57%94 219,430 293,144 75%95 298,044 242,282 123%96 119,614 174,112 69%97 152,512 148,490 103%98 123,592 101,579 122%99 124,626 94,474 132%
100 and over
198,948 148,316 134%
©2005 Society of Actuaries
30
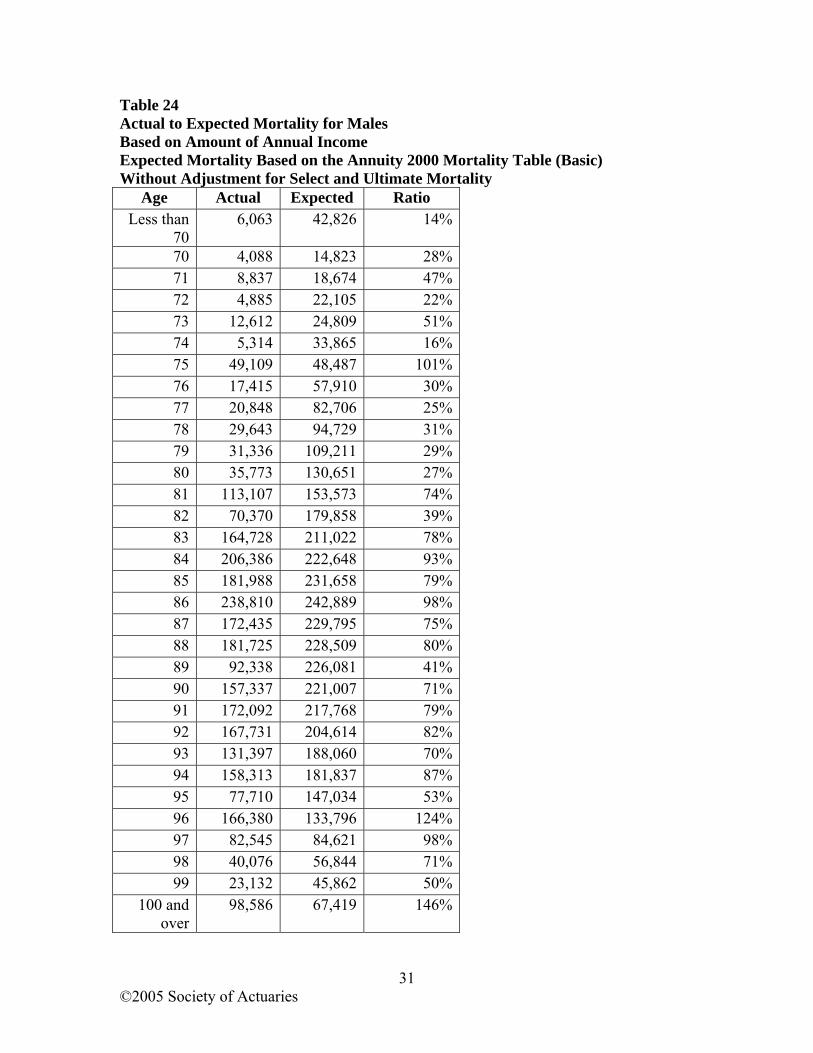
Table 24 Actual to Expected Mortality for Males Based on Amount of Annual Income Expected Mortality Based on the Annuity 2000 Mortality Table (Basic) Without Adjustment for Select and Ultimate Mortality
Age Actual Expected Ratio Less than
70 6,063 42,826 14%
70 4,088 14,823 28%71 8,837 18,674 47%72 4,885 22,105 22%73 12,612 24,809 51%74 5,314 33,865 16%75 49,109 48,487 101%76 17,415 57,910 30%77 20,848 82,706 25%78 29,643 94,729 31%79 31,336 109,211 29%80 35,773 130,651 27%81 113,107 153,573 74%82 70,370 179,858 39%83 164,728 211,022 78%84 206,386 222,648 93%85 181,988 231,658 79%86 238,810 242,889 98%87 172,435 229,795 75%88 181,725 228,509 80%89 92,338 226,081 41%90 157,337 221,007 71%91 172,092 217,768 79%92 167,731 204,614 82%93 131,397 188,060 70%94 158,313 181,837 87%95 77,710 147,034 53%96 166,380 133,796 124%97 82,545 84,621 98%98 40,076 56,844 71%99 23,132 45,862 50%
100 and over
98,586 67,419 146%
©2005 Society of Actuaries
31