MoRST Staying in Science 2 - nzcer.org.nz · Ministry of Research, Science and Technology – Te...
92
Staying in Science 2 Transition to tertiary study from the perspectives of New Zealand Year 13 science students Research carried out for the Ministry of Research, Science and Technology by the New Zealand Council for Educational Research
Transcript of MoRST Staying in Science 2 - nzcer.org.nz · Ministry of Research, Science and Technology – Te...
Staying in Science 2 Transition to tertiary study from the
perspectives of New Zealand Year 13 science students
Research carried out for the Ministry of Research, Science and Technology by the New Zealand Council for Educational Research

The research contained in this report was undertaken by Rosemary Hipkins, Josie Roberts, Rachel Bolstad and Hilary Ferral
at the New Zealand Council for Educational Research.
The views expressed in this publication are the views of the authors and do not necessarily represent the view
of the Ministry of Research, Science and Technology.
ISBN 0-478-06142-0 © NZCER 2006
Ministry of Research, Science and Technology – Te Manatū Pūtaiao | Staying in Science 2 iii
Acknowledgements
We thank the principals, other senior managers, and science faculty leaders who willingly helped administer the survey at a very busy time of the school year, or who helped us to set up focus groups. We are grateful to all the students who took part. Their thoughtful completion of the survey, or participation in the focus groups, greatly assisted us in understanding the complexities of their choices. Other members of the NZCER staff have assisted us in various ways to complete this stage of the project. We thank Charles Darr and Robyn Baker for critical thinking and ongoing conversations about the challenges raised. Edith Hodgen and Rachel Dingle contributed their expertise to the design and management of the student surveys. Natasha Kenneally managed the ethical consent processes. Christine Williams provided timely office support and Kristina Louis provided invaluable information services.
Ministry of Research, Science and Technology – Te Manatū Pūtaiao | Staying in Science 2 iv
Contents
Executive Summary .........................................................................................................................vi
1. Introduction............................................................................................................................ 1
2. Methodology.......................................................................................................................... 2 The focus groups.................................................................................................................... 2 The national survey ............................................................................................................... 4 The survey questions ............................................................................................................. 8 Other details of the statistical analysis.................................................................................10
3. A profile of the responding students.................................................................................... 11 Demographic data ................................................................................................................ 11 Students’ subject choices......................................................................................................13 Subject likes and dislikes......................................................................................................18 Students’ experiences of extracurricular science................................................................ 20 Future plans......................................................................................................................... 23 Concluding comment .......................................................................................................... 28
4. Why do students choose science in Year 13? ...................................................................... 30 Reasons for choosing science subjects................................................................................ 30 The survey data: views of science and choosing science .................................................... 34 Differences in responses by cluster group .......................................................................... 38 How do students navigate their secondary science subject choices? ................................. 39 Who chooses to continue with science at the tertiary level? ...............................................41 Concluding comment ...........................................................................................................41
5. Influences on tertiary decisions .......................................................................................... 44 Influences on plans for tertiary study ................................................................................. 44 The survey data: finding out about tertiary study options .................................................. 51 Help with making decisions .................................................................................................53 Choosing where to study ......................................................................................................55 Struggling with decision-making ........................................................................................ 56 Feeling confident about decision making and its outcomes............................................... 58 Confusion, indecision, and change ..................................................................................... 59 Concluding comment .......................................................................................................... 62
6. Reflecting on the research findings..................................................................................... 64 Who chooses to continue with science? .............................................................................. 64 What should guide subject choices?.................................................................................... 66 Curriculum and other educational issues ........................................................................... 68 Advisory issues .....................................................................................................................72
References .......................................................................................................................................74
Appendix: Questionnaire................................................................................................................76
Ministry of Research, Science and Technology – Te Manatū Pūtaiao | Staying in Science 2 v
Tables
Table 1: The focus group schools.............................................................................................. 2 Table 2: National pattern of distribution of schools within the selected strata....................... 6 Table 3: Designed sample of schools versus achieved sample..................................................7 Table 4: Gender distribution by school location ..................................................................... 11 Table 5: Participation in Year 13 sciences and related core subjects (2005 national
data sorted by decile bands) ......................................................................................12 Table 6: Ethnic groups identified by respondents...................................................................13 Table 7: Subjects taken in senior secondary school ................................................................14 Table 8: Cluster analysis of respondents’ science-related subject combinations ...................16 Table 9: Science subjects disliked by students (n=496)..........................................................18 Table 10: Students who disliked biology as a subject (n=92) ...................................................19 Table 11: Students who disliked chemistry as a subject (n=147) .............................................19 Table 12: Students who disliked physics as a subject (n=200).................................................19 Table 13: Proportion of all students taking a science who disliked this subject ..................... 20 Table 14: Experience with extracurricular science events ........................................................21 Table 15: Future study plans .................................................................................................... 23 Table 16: Students’ perceptions of their certainty about study plans...................................... 23 Table 17: Place of science in anticipated study plans............................................................... 24 Table 18: Anticipated place of study..........................................................................................25 Table 19: Tertiary institutions students hoped to attend......................................................... 26 Table 20: Type of degree aspired to...........................................................................................27 Table 21: How tertiary institutions help or hinder decision-making ...................................... 50 Table 22: Where have you got information from about your tertiary study options?.............. 51 Figures
Figure 1: Prompt sheet for focus group ..................................................................................... 3 Figure 2: Capturing students’ orientation to making choices ................................................... 4 Figure 3: Students’ interest in science, and views about secondary science teaching ............ 34 Figure 4: Students’ perceptions of academic achievement...................................................... 36 Figure 5: The influence of other people on decisions to take science ......................................37 Figure 6: Beliefs about the importance and strategic value of science.....................................37 Figure 7: Students’ orientations towards subject choice in relation to science ...................... 40 Figure 8: Helpfulness of sources of information concerning tertiary study options ...............53 Figure 9: Factors that impact on deciding where to study .......................................................55 Figure 10: Students’ feelings about making tertiary study decisions........................................ 56 Figure 11: Confidence in relation to managing a range of decisions and outcomes................. 58
Ministry of Research, Science and Technology – Te Manatū Pūtaiao | Staying in Science 2 vi
Executive Summary
This report identifies and discusses the many interwoven factors that impact on students’ decision making with regard to the ongoing study of sciences, both in the final year of secondary school, and on transition to tertiary level studies. It addresses two closely related key questions:
• Why do students choose to continue with sciences in Year 13 of their school studies?
• Why do students plan to take up (or not take up) sciences in their tertiary level studies?
Answers to these questions were sought in two ways. Ten focus group conversations were carried out with Year 13 science students in each of five purposively selected secondary schools. Themes for these conversations were informed by a literature review carried out at an earlier stage of the project. Analysis of the focus group conversations in turn informed the final design of a survey completed by 496 students from 20 randomly selected New Zealand secondary schools. All these students were taking at least one science subject in Year 13 and were nearing the end of their secondary schooling when surveyed. We found no single answer to either of the research questions. The same types of factors appear to impact on individual students’ decisions about continuing with science at both secondary and at tertiary levels, with some changes in the sources of advice students might access as they transition to tertiary studies. Students’ choices relate to their personal interests and decision-making orientations, their family background, their learning experiences – both curricular and extracurricular – and the school they attend. An intention to continue studying sciences appears to have begun, for at least some students, much earlier than Year 13. Other students are still very undecided at the stage of leaving school. Collectively, these findings suggest that no one strategy will suffice to encourage higher levels of ongoing participation in the sciences. A cluster analysis revealed four characteristic ways the students combined sciences with other selected Year 13 subjects. “Serious science” students (one-third of those surveyed) tended to be taking more than one traditional science subject, and at least one mathematics subject in their final year of school. Many had a committed intention to study science at university, and to see this as leading to somewhat traditional careers, for example in medicine, dentistry, or veterinary sciences. “Science/business” students (a quarter of those surveyed) tended to have chosen physics and calculus in combination with some form of computer science/ICT as well as the business-oriented subjects. There were more males than females in this cluster and they were less likely than the “serious science” students to see science as a worthwhile career to pursue. Just under half the students (44 percent) belonged to one of the other two clusters, both characterised by taking a more “mixed bag” of subjects that included some science, and a seemingly greater level of indecision about future study plans. These students were likely to be less confident of their academic ability in sciences, were more likely to be taking subjects beyond the three traditional disciplines, for example agriculture, horticulture, earth science, or science as an integrated subject, and were
Ministry of Research, Science and Technology – Te Manatū Pūtaiao | Staying in Science 2 vii
less likely to be enjoying their science learning. They were also less likely to be encouraged to persevere with science studies by their families and many of them seemed poised to drop sciences on transition to tertiary, despite the fact that a number of them agreed that science may be needed for their future career plans. We found the same gender imbalances in uptake of biology (favoured by females) and physics and mathematics with calculus (favoured by males) as reported from other research. Females are participating selectively and many of them seem to be avoiding “hard” (i.e. more mathematical) aspects of science. Focus group comments suggested that biology could be chosen in the expectation that it will be less mathematical, and some students linked this with a facility in text-based communication. Since many fields of biological research do require a good grasp of mathematics, and good communication skills are just as important for those working in the physical sciences as in the biological sciences, these twin assumptions need to be challenged. The attitudes of the mainly male science/business students, who were clearly science-able but tended not to see it as a worthwhile career area to pursue, are also of concern. Other research suggests that more adventurous male students may no longer aspire to traditional science-related careers because they see potentially greater rewards in entrepreneurial and cutting edge areas of knowledge development, including in the ICT field. What might need to change to encourage more of these students to stay with a wider range of sciences at the tertiary level? There were low numbers of Māori and Pacific Islands students in the survey sample, and this pattern appeared to be associated with another concerning trend we found – much lower rates of participation in senior sciences in the low decile schools nationally. Focus group students in the high decile schools spoke of science-rich home experiences and parental encouragement. Those in the decile 1 school spoke of equally high, but perhaps unrealistic and traditionally focused, family expectations. If it is seen as important that the scientists working in New Zealand reflect the full range of cultural interests and concerns of the people that reside here, participation of students from Māori and Pacific cultures, and students from low decile schools, are areas in need of more research. While the majority of students found the science subjects they had chosen interesting and were glad they had taken them in Year 13, nearly a third felt that these subjects were sometimes taught in a boring way. Many appeared to have chosen sciences for strategic (study or career-related) reasons, and some were taking science subjects under sufferance. Many students were less confident about their science achievement in Year 13 than in previous years. Interestingly, the same trend was not found for their Year 13 mathematics subjects. Students commonly believed that sciences are hard to pick up at the tertiary level without experience at secondary school. Yet only one-quarter of the surveyed students felt that it was not worth taking science at school if one was not going to continue with it at tertiary. The complex challenges these findings pose for educators are discussed in the final section of the report. It is clear that different students need different types of information, provided at different times, and from a range of sources, if they are to make productive study and career choices. Unsurprisingly, the information students have been able to access concerning tertiary study and potential careers does influence their plans. Tertiary institutions, schools, family, and friends all play a part, as do students’ interest in science, their knowledge of available careers, and their experiences of university or other science-related work. School careers advisors and university publications were
Ministry of Research, Science and Technology – Te Manatū Pūtaiao | Staying in Science 2 viii
the most commonly accessed sources of information, but family and friends were likely to be more influential. Comments made by students in the focus groups suggest that the quality of the relationship between the support/advice giver and the student is likely to determine whether or not the student trusts and acts on that support/advice. Many parents actively help students imagine future possible worlds. Since these are obviously bounded by the limits of their own experiences, we ask what can be done to better support families to support their young people in becoming aware of the breadth of science opportunities potentially available to them. It is, of course, simply not possible to predict all the types of science opportunities that might open up in the near future. Yet students with an orientation to keeping their options open seemed to be most at risk of dropping sciences on transition to tertiary. While the uncertain yet flexible pathway might be more productive for some in the long term, it also seemed likely to generate more anxiety. Students need good support and ongoing access to advice if they are to make a more flexible course of study work in their best interests. Funding issues are closely aligned with this consideration. Tertiary education is expensive and the survey students were anxious not to waste funds (and time) on courses that did not lead towards future careers. The necessity to change courses if a student fails to meet limited entry standards, or if a course does not work out for other reasons, also acts as a disincentive to making tertiary choices that could be risky but potentially rewarding. There are implications here for the flexibility of course pathways within universities, and for communicating and providing advice and support concerning these. Students need to know they will have other options without needing to “backtrack”, in the event that their initial science study plans do not work out. Focusing on clearly identified and specific future goals aligns with “managerialist” models of decision making, with underpinning assumptions about a predictable linear relationship between actions taken and future outputs or products. From this perspective, advice and support efforts should be directed to the clarification of goals and the establishment of appropriate pathways to reach identified study and career targets. Responsibility for decision making rests with individual students, who will bear the blame if they make poor choices. By contrast, focusing on the quality of immediate experiences, or inputs, aligns with “complexity” or “systems” models of decision making, which carry underpinning assumptions about the emergent and unpredictable quality of future actions and situations. From this perspective, advice and support should focus on enhancing the quality of students’ learning experiences now, and broadening their horizons so that potential avenues of work and study do not become closed to them. Our research found a demand for the science that students learn to be made more relevant, dynamic, and clearly related to potential careers, so there are opportunities here. The responsibility to ensure students make good decisions can be seen as distributed, with adults playing a greater, even if apparently indirect, role in ensuring that students have positive experiences that lead to productive choices.
Ministry of Research, Science and Technology – Te Manatū Pūtaiao | Staying in Science 2 1
1. Introduction
In recent years there has been concern that declining numbers of young people are choosing a tertiary education in the sciences, with a view to taking up science careers. This report is the second part of a research project commissioned by the Ministry of Research, Science and Technology (MoRST) to investigate the study and potential subsequent career choices of students who have chosen to continue with science subjects in the senior secondary school. The report follows on from, and builds on, the first Staying in Science report (Hipkins and Bolstad, 2005). The first report examined the view that the “problem” begins at secondary school, with fewer and fewer students choosing to study the science disciplines once these become optional (typically at Year 12 in New Zealand). It outlined different methods for describing trends in science participation in the secondary school and illustrated these with data from Australian and New Zealand studies. The transition from secondary to tertiary level studies is another potential point at which students might choose to opt out of sciences. The first report also outlined research insights concerning factors that influence the tertiary study choices made by students nearing the end of secondary school. In this phase of the research, New Zealand Year 13 students’ choices have been investigated in two different ways. Findings from the first Staying in Science report, outlined above, were used as a basis for designing focus group conversations that were carried out in a purposive sample of five schools. In turn, findings from those focus groups were used to fine-tune a survey whose shaping began with findings from the first report. Nearly 500 Year 13 science students from 20 schools completed the survey. This second Staying in Science report outlines our findings from both the focus groups and the survey. Section 2 describes details of the methodology followed in both the focus group and survey stages. Section 3 then provides a comprehensive profile of the nearly 500 students who responded to the survey. It gives their demographic details and explains how clusters formed from selected Year 13 subject choices reflect differences in attitudes to sciences and future intentions to study sciences (or not). Following that, Sections 4 and 5 introduce findings from the focus group conversations and comment on other patterns from the survey in the light of these more qualitative insights. Section 4 focuses on students’ reasons for choosing sciences while Section 5 looks at students’ decision making about their tertiary studies more broadly. Finally, Section 6 summarises the findings under our key research questions, and discusses a range of policy implications that emerge from the study.
Ministry of Research, Science and Technology – Te Manatū Pūtaiao | Staying in Science 2 2
2. Methodology
This section is divided into two parts. The first describes the process followed for the focus groups and the second the methodological decisions related to the survey component of the research.
The focus groups Focus groups took place in Term 3 of 2005.
The sample
A purposive sample of five schools was chosen to cover some of the variation in New Zealand secondary schools. Brief details about each school are shown in Table 1. Four were in the North Island and one in the South Island.
Table 1: The focus group schools
School Features of school
School 1 Large girls’ city school, high decile, strong science focus
School 2 Boys’ private school, strong science focus
School 3 Low decile co-educational suburban school, science programmes a recent professional development focus
School 4 Mid decile co-educational school in rural town, known for strong CRESTT
1 participation
School 5 Large mid decile town school with strong reputation for ICT innovation Two researchers jointly conducted focus group conversations with two groups of Year 13 students in each of the five schools – ten conversations in total. There were 3–6 students in each group and 45 students in total took part. All of the students were taking at least one Year 13 science subject. The school contact person facilitating the visit at each school (typically either the principal or the HOD science) was asked to select two groups of volunteers who would provide a range of interesting, not necessarily similar, perspectives on continuing to take sciences at the tertiary level.
1 A Royal Society funded initiative in which senior secondary students carry out extended individual
science investigations, with mentorship as necessary from scientists.
Ministry of Research, Science and Technology – Te Manatū Pūtaiao | Staying in Science 2 3
Question development and process
The background paper prepared in the first phase of the research (Hipkins and Bolstad, 2005) provided the basis for focus group question development. The questions were clustered into five main themes that emerged during the preparation of the background paper:
• reasons for choosing sciences in Year 13 and (prospectively) for tertiary level study
• how students access and make sense of information about future study choices
• students’ feelings about their upcoming transition to tertiary studies
• different approaches students can potentially take to decision-making, and
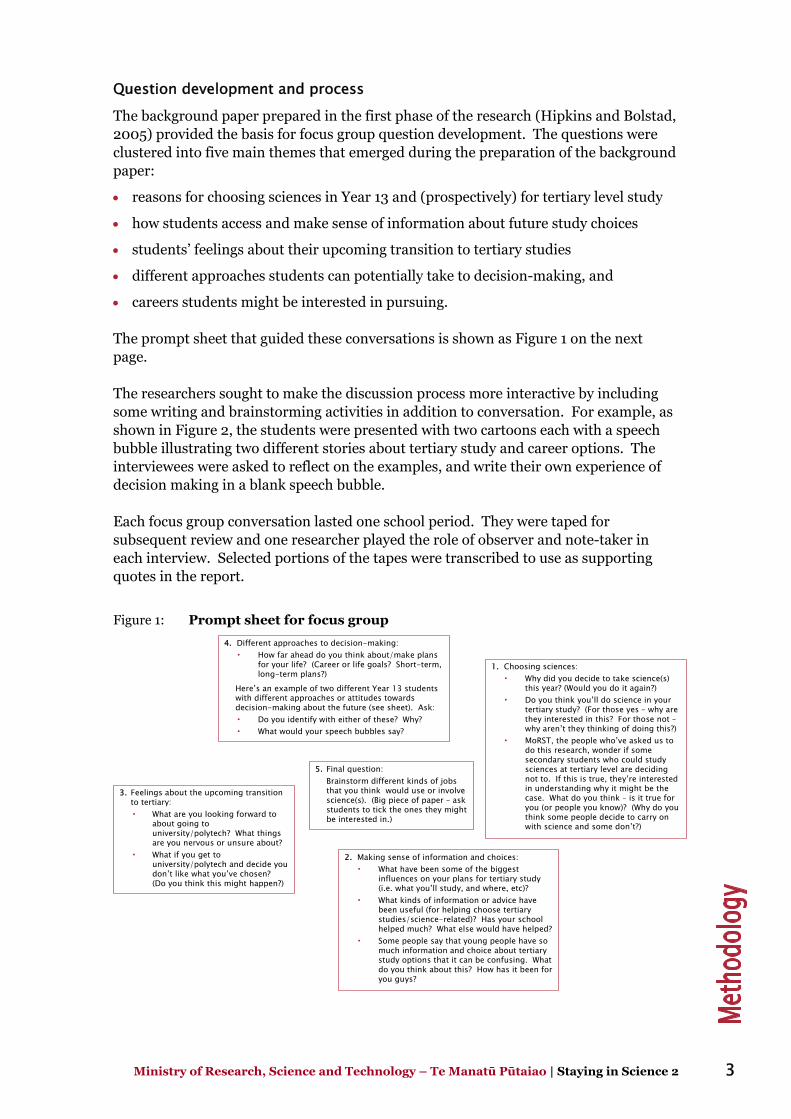
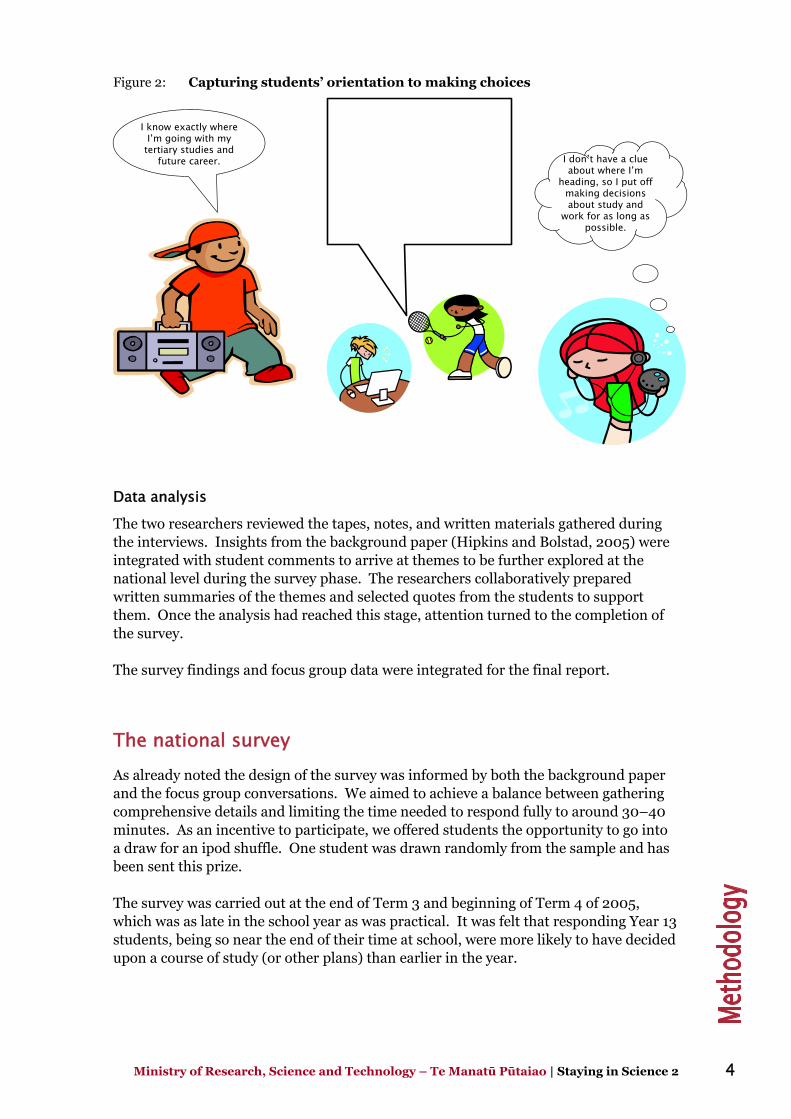
• careers students might be interested in pursuing. The prompt sheet that guided these conversations is shown as Figure 1 on the next page. The researchers sought to make the discussion process more interactive by including some writing and brainstorming activities in addition to conversation. For example, as shown in Figure 2, the students were presented with two cartoons each with a speech bubble illustrating two different stories about tertiary study and career options. The interviewees were asked to reflect on the examples, and write their own experience of decision making in a blank speech bubble. Each focus group conversation lasted one school period. They were taped for subsequent review and one researcher played the role of observer and note-taker in each interview. Selected portions of the tapes were transcribed to use as supporting quotes in the report.
Figure 1: Prompt sheet for focus group
4. Different approaches to decision-making:• How far ahead do you think about/make plans
for your life? (Career or life goals? Short-term, long-term plans?)
Here’s an example of two different Year 13 studentswith different approaches or attitudes towardsdecision-making about the future (see sheet). Ask:• Do you identify with either of these? Why?• What would your speech bubbles say?
3. Feelings about the upcoming transitionto tertiary:• What are you looking forward to
about going to university/polytech? What things are you nervous or unsure about?
• What if you get to university/polytech and decide you don’t like what you’ve chosen? (Do you think this might happen?)
5. Final question:Brainstorm different kinds of jobs that you think would use or involve science(s). (Big piece of paper – ask students to tick the ones they might be interested in.)
1. Choosing sciences:• Why did you decide to take science(s)
this year? (Would you do it again?)• Do you think you’ll do science in your
tertiary study? (For those yes – why are they interested in this? For those not –why aren’t they thinking of doing this?)
• MoRST, the people who’ve asked us to do this research, wonder if some secondary students who could study sciences at tertiary level are deciding not to. If this is true, they’re interested in understanding why it might be the case. What do you think – is it true for you (or people you know)? (Why do you think some people decide to carry on with science and some don’t?)
2. Making sense of information and choices:• What have been some of the biggest
influences on your plans for tertiary study (i.e. what you’ll study, and where, etc)?
• What kinds of information or advice have been useful (for helping choose tertiary studies/science-related)? Has your school helped much? What else would have helped?
• Some people say that young people have so much information and choice about tertiary study options that it can be confusing. What do you think about this? How has it been for you guys?
Ministry of Research, Science and Technology – Te Manatū Pūtaiao | Staying in Science 2 4
Figure 2: Capturing students’ orientation to making choices
I know exactly where I’m going with my
tertiary studies and future career. I don’t have a clue
about where I’m heading, so I put off
making decisions about study and
work for as long as possible.
Data analysis
The two researchers reviewed the tapes, notes, and written materials gathered during the interviews. Insights from the background paper (Hipkins and Bolstad, 2005) were integrated with student comments to arrive at themes to be further explored at the national level during the survey phase. The researchers collaboratively prepared written summaries of the themes and selected quotes from the students to support them. Once the analysis had reached this stage, attention turned to the completion of the survey. The survey findings and focus group data were integrated for the final report.
The national survey As already noted the design of the survey was informed by both the background paper and the focus group conversations. We aimed to achieve a balance between gathering comprehensive details and limiting the time needed to respond fully to around 30–40 minutes. As an incentive to participate, we offered students the opportunity to go into a draw for an ipod shuffle. One student was drawn randomly from the sample and has been sent this prize. The survey was carried out at the end of Term 3 and beginning of Term 4 of 2005, which was as late in the school year as was practical. It was felt that responding Year 13 students, being so near the end of their time at school, were more likely to have decided upon a course of study (or other plans) than earlier in the year.
Ministry of Research, Science and Technology – Te Manatū Pūtaiao | Staying in Science 2 5
lculus
es and mechanisms and
The focus group conversations had provided indications that we might find school-related differences in the survey. Accordingly, we designed the sample of schools invited to participate to be fully representative of the range of schools providing for secondary school learning.
Sampling methodology
We aimed to represent the views of a target population of Year 13 science students in New Zealand secondary schools with a sample of 700–800 science students (a science student being defined as a student taking at least one science subject). Our achieved sample of 496 students fell short of this target but represented the best response we could muster at a difficult time of the year to access students nearing their final examinations. We describe the details of the sample in the following sections.
Sampling frame preparation
We prepared a list of secondary schools using the early 2005 Ministry of Education (MOE) database of course enrolments. From the complete list we retained those schools where there were at least some (not zero) science enrolments at Year 13 level. ‘Science’ includes the following subjects:
• agriculture/horticulture
• biology/biological science
• biotechnology
• chemistry
• computer science/programming
• computer studies
• human biology
• electronics and control
• earth science/astronomy
• mathematics
• mathematics with ca
• mathematics with statistics
• physics
• science
• structur
• technology. In addition, only schools of the following types were retained:
• secondary (Years 9–13)
• secondary (Years 7–13) and
• composite. We trimmed the list further by excluding the Correspondence School, teen parent units, and special schools. We also excluded very small schools, defined in this instance by schools that were recorded as having fewer than 16 science course enrolments. The final list had 335 schools.
Ministry of Research, Science and Technology – Te Manatū Pūtaiao | Staying in Science 2 6
Stratification
To ensure proper representation of New Zealand secondary schools in the sample we first stratified the sampling frame by decile bands: low (deciles 1 and 2), middle (deciles 3 to 8), and high (deciles 9 and 10). Unrecorded deciles (99) were included in the high decile bracket as most of these schools are private schools and likely to be attended by a population most like the deciles 9 and 10 schools. Given the size of the frame and the sample required, there was room for only one more stratification variable. We analysed the effects of using area type (urban/rural), school type (secondary, Years 9–15/secondary, Years 7–15/composite), and school size defined by the total number of students on the Year 13 roll. The Year 13 roll proved to be the most useful, and was defined as follows:
• Small up to 50 Year 13 students;
• Medium 51–110 Year 13 students; and
• Large more than 110 Year 13 students.
Sample selection
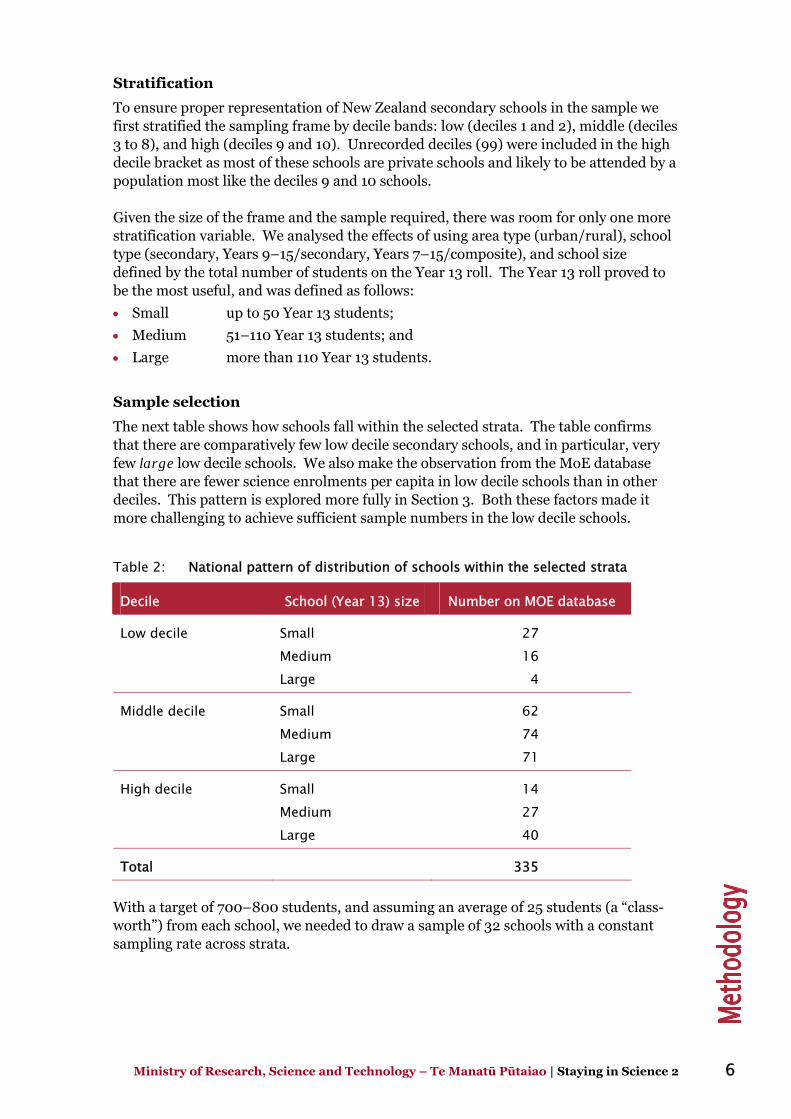
The next table shows how schools fall within the selected strata. The table confirms that there are comparatively few low decile secondary schools, and in particular, very few large low decile schools. We also make the observation from the MoE database that there are fewer science enrolments per capita in low decile schools than in other deciles. This pattern is explored more fully in Section 3. Both these factors made it more challenging to achieve sufficient sample numbers in the low decile schools.
Table 2: National pattern of distribution of schools within the selected strata
Decile School (Year 13) size Number on MOE database
Low decile Small 27 Medium 16 Large 4
Middle decile Small 62 Medium 74 Large 71
High decile Small 14 Medium 27 Large 40
Total 335 With a target of 700–800 students, and assuming an average of 25 students (a “class-worth”) from each school, we needed to draw a sample of 32 schools with a constant sampling rate across strata.
Ministry of Research, Science and Technology – Te Manatū Pūtaiao | Staying in Science 2 7
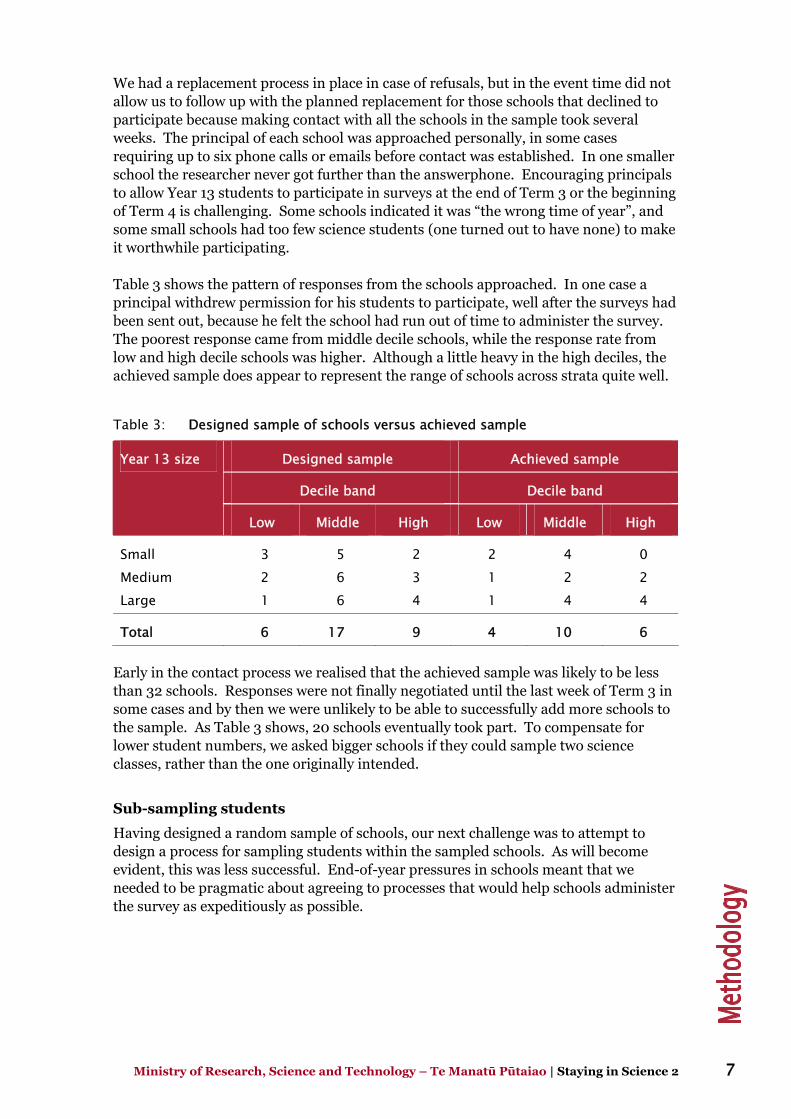
We had a replacement process in place in case of refusals, but in the event time did not allow us to follow up with the planned replacement for those schools that declined to participate because making contact with all the schools in the sample took several weeks. The principal of each school was approached personally, in some cases requiring up to six phone calls or emails before contact was established. In one smaller school the researcher never got further than the answerphone. Encouraging principals to allow Year 13 students to participate in surveys at the end of Term 3 or the beginning of Term 4 is challenging. Some schools indicated it was “the wrong time of year”, and some small schools had too few science students (one turned out to have none) to make it worthwhile participating. Table 3 shows the pattern of responses from the schools approached. In one case a principal withdrew permission for his students to participate, well after the surveys had been sent out, because he felt the school had run out of time to administer the survey. The poorest response came from middle decile schools, while the response rate from low and high decile schools was higher. Although a little heavy in the high deciles, the achieved sample does appear to represent the range of schools across strata quite well.
Table 3: Designed sample of schools versus achieved sample
Designed sample Achieved sample
Decile band Decile band
Year 13 size
Low Middle High Low Middle High
Small 3 5 2 2 4 0 Medium 2 6 3 1 2 2 Large 1 6 4 1 4 4
Total 6 17 9 4 10 6 Early in the contact process we realised that the achieved sample was likely to be less than 32 schools. Responses were not finally negotiated until the last week of Term 3 in some cases and by then we were unlikely to be able to successfully add more schools to the sample. As Table 3 shows, 20 schools eventually took part. To compensate for lower student numbers, we asked bigger schools if they could sample two science classes, rather than the one originally intended.
Sub-sampling students
Having designed a random sample of schools, our next challenge was to attempt to design a process for sampling students within the sampled schools. As will become evident, this was less successful. End-of-year pressures in schools meant that we needed to be pragmatic about agreeing to processes that would help schools administer the survey as expeditiously as possible.
Ministry of Research, Science and Technology – Te Manatū Pūtaiao | Staying in Science 2 8
We asked for larger schools to give the survey to two different classes, preferably on the same timetable line so that there were no double-ups – for example, perhaps a physics class and a biology class.2 We invited smaller schools to send responses from all their Year 13 science students who wanted to participate. Some schools asked to send the survey home overnight and some used a form time to administer it. In the event, within-school response rates varied considerably around these parameters, a factor that was beyond our control.
Demographic variables used in the analysis
All survey responses were cross-tabulated with a range of demographic variables. These included:
• gender – male, female
• school location – urban, suburban/town (there were no schools classified as rural in the sample)
• decile – low (1–2), middle (3–8), high (9–10, and 99),3 and
• school size – to enhance the potential to align findings from this survey with other NZCER research, the total school roll was used for the analysis. Small schools are defined as those that have a role of up to 650 students, medium-sized schools have 650–1000 students, and large schools have over 1000 students.
A note about schools and area type
The MoE schools database classifies schools according to where they are situated – main urban, secondary urban, or minor urban for this sample. The classification refers to the Statistics New Zealand urban/rural classification4 broadly based on population densities. In our analysis we found differences between students’ responses based on area type. We decided that the best way to encapsulate the differences clearly was to combine secondary urban and minor urban schools under one umbrella and compare these to the single main urban group. We named these groups suburban/town and city schools respectively. Section 3 reports on the demographic details of the sample actually achieved.
The survey questions The full survey is included as Appendix A. Beyond key demographics, the survey covered the four main areas set out next.
2 Had we been able to achieve the full sample in a more timely manner, we would have been more
directive about this aspect of the sampling. 3 99 is the code for private schools. 4 See http://www.stats.govt.nz/statistical-methods/classifications/urban-area-2004.htm for details.
Ministry of Research, Science and Technology – Te Manatū Pūtaiao | Staying in Science 2 9
School subject choices
From provided lists, students were asked to indicate their subject choices across the final three years of their secondary education (Q3). Our experience in other research has demonstrated the advisability of offering students a checklist of subjects rather than having them write their own list because similar subjects often have different names in different schools (Boyd, Bolstad, Cameron, Ferral, Hipkins, McDowall and Waiti, 2005). To prevent the question becoming overwhelmingly large, we limited the choices to core subjects (English, mathematics, and science) and to two other subject areas (ICT and business-type subjects) likely to be of policy interest to MoRST. Accordingly, these responses do not capture the extent to which students were combining arts and sciences, or languages and sciences, for example.
Experience of science (and other subjects) while at school
The background paper identified students’ experiences of school science as a potential influence on their decisions about continuing with science in tertiary study. We asked “Is better science teaching the answer?” (Hipkins and Bolstad, 2005, p.36). However we also noted that this question relates as much to connections students do or don’t see between the science they learn at school and the work of science in the world at large as it does to actual teaching and learning. Students’ perceptions of their own abilities as science learners were also seen to be an important influence on their ongoing choices. Accordingly, we designed a bank of Likert items that probed students’ attitudes and beliefs around all these factors (Q4). We also asked about students’ participation in extracurricular science activities such as science fairs, camps, and Olympiads (Q6).
Decision-making strategies and certainty
Several questions were informed by a longitudinal study (Cleaves, 2005), described in more detail in the Staying in Science background paper (Hipkins and Bolstad, 2005), that found students follow different choice “trajectories” that impact on the way they choose what to study. In a similar format to one focus group question, students were invited to say how much a cluster of statements “sounded like them” (or not). If they said they had found they didn’t like some science subjects, a sub-question invited them to identify specific subjects from a provided list (Q5). A separate question probed students’ level of certainty around the types of courses they were considering taking and provided a useful cross-check for these statements (Q8). This pairing provided one of a number of indicators that students answered the survey thoughtfully and with a high degree of consistency.
Ministry of Research, Science and Technology – Te Manatū Pūtaiao | Staying in Science 2 10
Tertiary study influences and intentions
The background paper also found that a lack of knowledge of the range of science occupations and work available could discourage students from continuing with sciences. We asked “Do students need better information and advice about science-related study and career options?” (Hipkins and Bolstad, 2005, p.36). We found that even students who continue with science because of their interest in it may be ambivalent about where it can take them and we cited other research that shows the complex nature of the “pathways” decisions that face today’s school-leavers (see, for example, Vaughan, 2005). Addressing these issues, the survey included a number of questions concerning students’ actual plans, their sources of advice, their feelings about the helpfulness of that advice, and their perceptions about their own confidence to make good choices (Q7, Q9–17).
Other details of the statistical analysis We selected a range of questions that could be expected to give complementary perspectives if students answered the questionnaire thoughtfully and consistently. All such cross-tabulations tested were found to be significant, indicating that there was indeed a high degree of consistency in individual responses. Illustrative examples of these cross-matches are included in Section 3. Unlike some other surveys of our experience, we discarded just two inappropriately completed surveys at the data cleaning stage. Relationships between variables, including demographic details, were checked using cross-tabulations and chi-square tests. Results were accepted as statistically significant at the 1 percent level, and reported as “indicative associations” if they fell between 1 and 5 percent. While this may seem a rather severe test of significance it does provide confidence in the many associations we report. The process used to establish the student subject choice clusters reported in Section 3 is described in detail in a separate technical report (Ferral, 2005). We used the Jaccard similarity coefficient and Ward’s method (Ward, 1963) for the hierarchical clustering.
Ministry of Research, Science and Technology – Te Manatū Pūtaiao | Staying in Science 2 11
3. A profile of the responding students
This section describes selected characteristics of the overall cohort of Year 13 students who responded to the questionnaire. First, it describes and discusses the demographic composition of the sample. The section then reports on the patterns of combinations of science-related subjects the students had chosen in the senior secondary school, in particular in their final Year 13 studies, and reports on factors associated with these subject choices. Finally, the section briefly outlines students’ responses to questions concerning their future plans. This sets the context for the discussion in the rest of the report.
Demographic data While we endeavoured to obtain a representative sample of the Year 13 students who were taking at least one science subject in 2005, there is a potential source of bias in the sample actually achieved. This is identified and discussed, so that it can be taken into account when reading the subsequent sections.
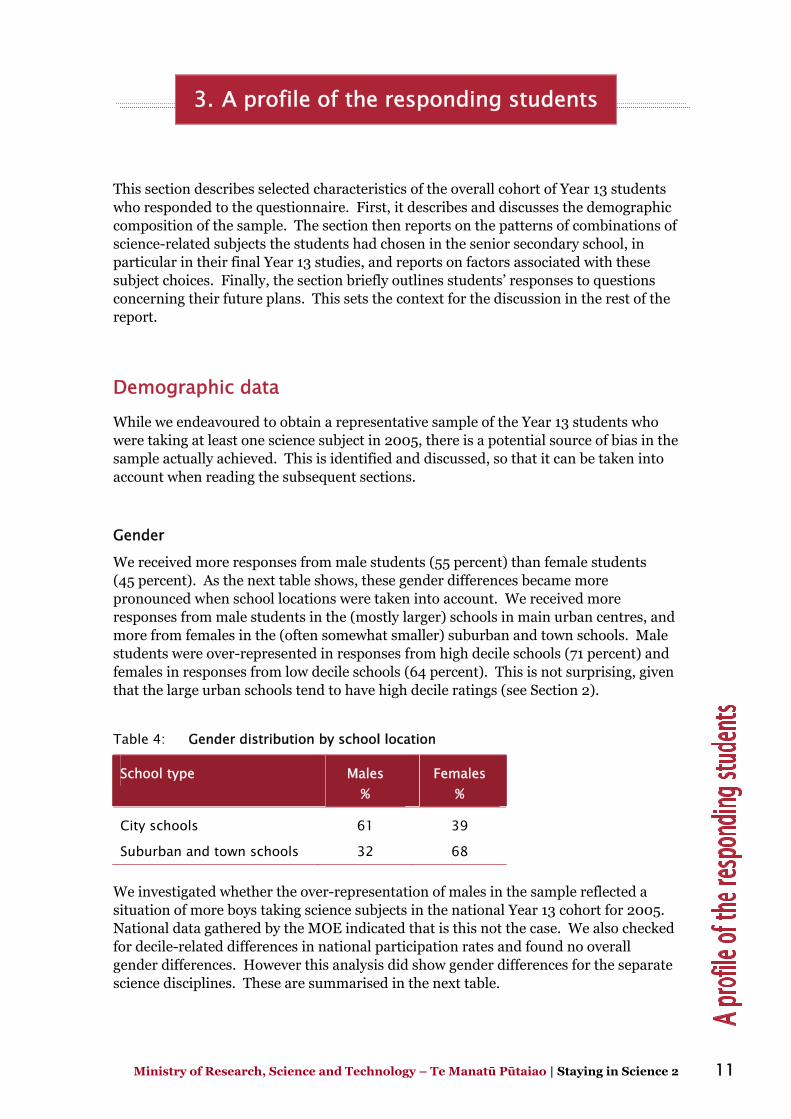
Gender
We received more responses from male students (55 percent) than female students (45 percent). As the next table shows, these gender differences became more pronounced when school locations were taken into account. We received more responses from male students in the (mostly larger) schools in main urban centres, and more from females in the (often somewhat smaller) suburban and town schools. Male students were over-represented in responses from high decile schools (71 percent) and females in responses from low decile schools (64 percent). This is not surprising, given that the large urban schools tend to have high decile ratings (see Section 2).
Table 4: Gender distribution by school location
School type Males %
Females %
City schools 61 39
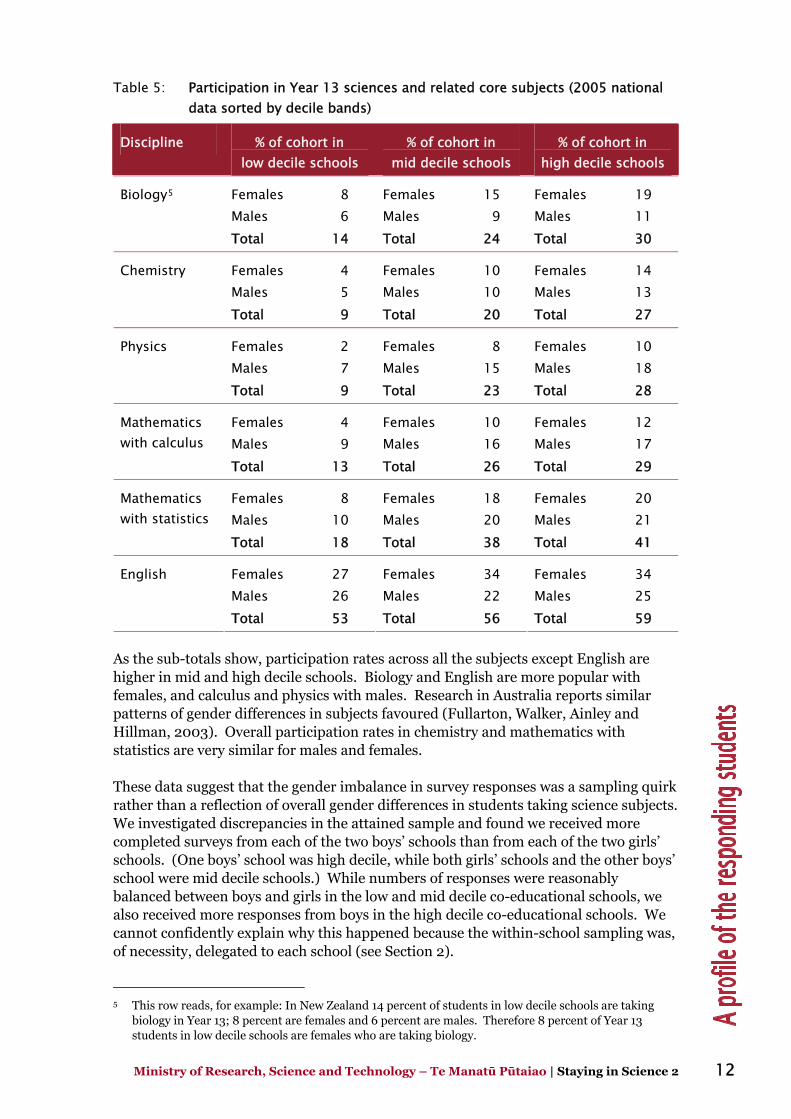
Suburban and town schools 32 68 We investigated whether the over-representation of males in the sample reflected a situation of more boys taking science subjects in the national Year 13 cohort for 2005. National data gathered by the MOE indicated that is this not the case. We also checked for decile-related differences in national participation rates and found no overall gender differences. However this analysis did show gender differences for the separate science disciplines. These are summarised in the next table.
Ministry of Research, Science and Technology – Te Manatū Pūtaiao | Staying in Science 2 12
Table 5: Participation in Year 13 sciences and related core subjects (2005 national data sorted by decile bands)
Discipline % of cohort in low decile schools
% of cohort in mid decile schools
% of cohort in high decile schools
Females 8 Males 6
Females 15 Males 9
Females 19 Males 11
Biology5
Total 14 Total 24 Total 30
Females 4 Males 5
Females 10 Males 10
Females 14 Males 13
Chemistry
Total 9 Total 20 Total 27
Females 2 Males 7
Females 8 Males 15
Females 10 Males 18
Physics
Total 9 Total 23 Total 28
Females 4 Males 9
Females 10 Males 16
Females 12 Males 17
Mathematics with calculus
Total 13 Total 26 Total 29
Females 8 Males 10
Females 18 Males 20
Females 20 Males 21
Mathematics with statistics
Total 18 Total 38 Total 41
Females 27 Males 26
Females 34 Males 22
Females 34 Males 25
English
Total 53 Total 56 Total 59 As the sub-totals show, participation rates across all the subjects except English are higher in mid and high decile schools. Biology and English are more popular with females, and calculus and physics with males. Research in Australia reports similar patterns of gender differences in subjects favoured (Fullarton, Walker, Ainley and Hillman, 2003). Overall participation rates in chemistry and mathematics with statistics are very similar for males and females. These data suggest that the gender imbalance in survey responses was a sampling quirk rather than a reflection of overall gender differences in students taking science subjects. We investigated discrepancies in the attained sample and found we received more completed surveys from each of the two boys’ schools than from each of the two girls’ schools. (One boys’ school was high decile, while both girls’ schools and the other boys’ school were mid decile schools.) While numbers of responses were reasonably balanced between boys and girls in the low and mid decile co-educational schools, we also received more responses from boys in the high decile co-educational schools. We cannot confidently explain why this happened because the within-school sampling was, of necessity, delegated to each school (see Section 2). 5 This row reads, for example: In New Zealand 14 percent of students in low decile schools are taking
biology in Year 13; 8 percent are females and 6 percent are males. Therefore 8 percent of Year 13 students in low decile schools are females who are taking biology.
Ministry of Research, Science and Technology – Te Manatū Pūtaiao | Staying in Science 2 13
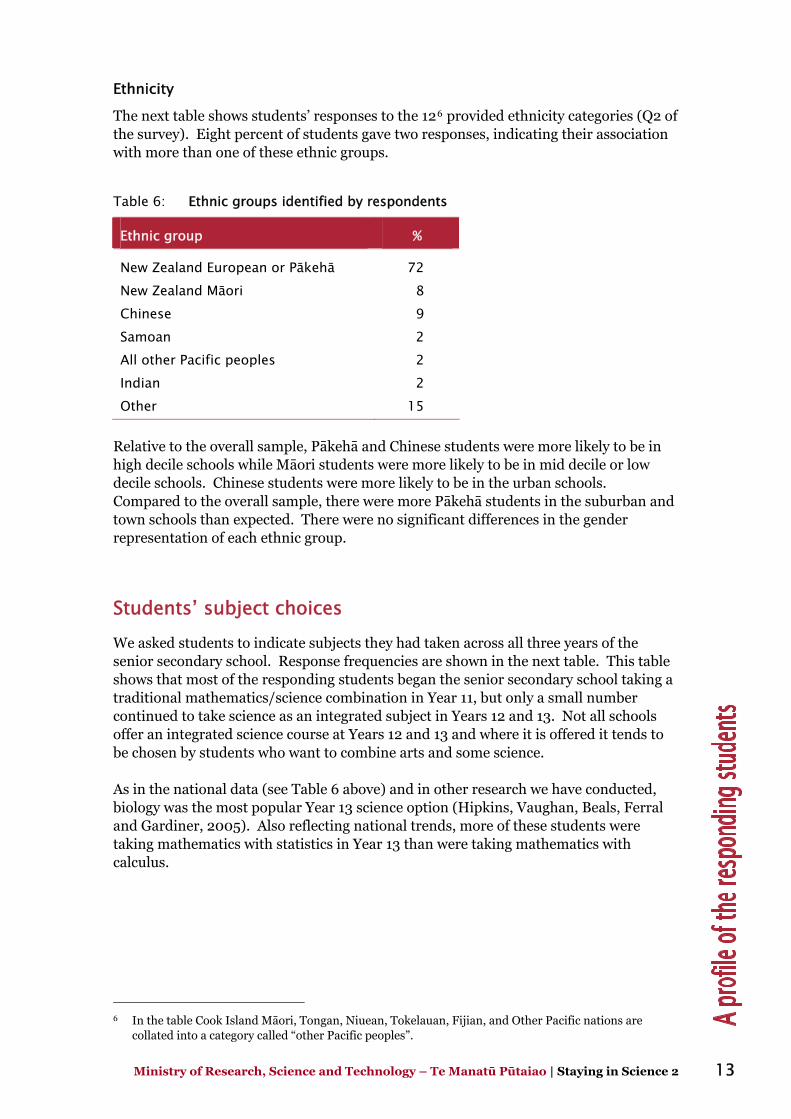
Ethnicity
The next table shows students’ responses to the 126 provided ethnicity categories (Q2 of the survey). Eight percent of students gave two responses, indicating their association with more than one of these ethnic groups.
Table 6: Ethnic groups identified by respondents
Ethnic group %
New Zealand European or Pākehā 72 New Zealand Māori 8 Chinese 9 Samoan 2 All other Pacific peoples 2 Indian 2 Other 15
Relative to the overall sample, Pākehā and Chinese students were more likely to be in high decile schools while Māori students were more likely to be in mid decile or low decile schools. Chinese students were more likely to be in the urban schools. Compared to the overall sample, there were more Pākehā students in the suburban and town schools than expected. There were no significant differences in the gender representation of each ethnic group.
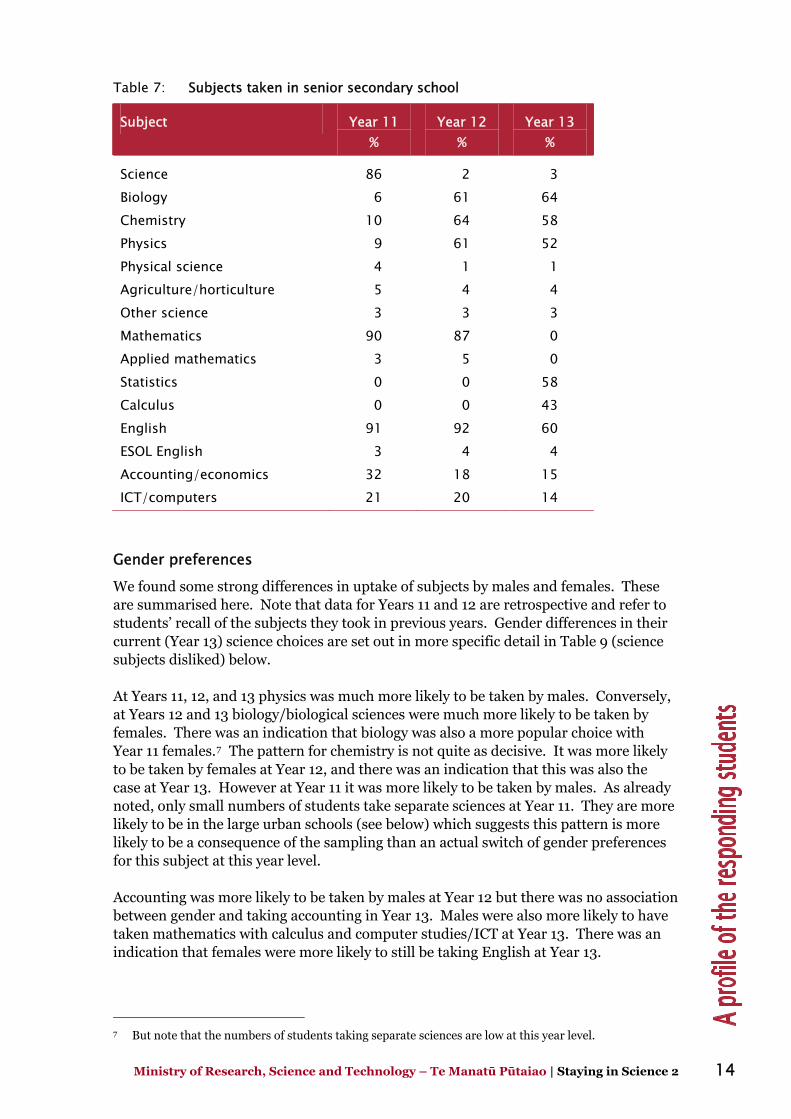
Students’ subject choices We asked students to indicate subjects they had taken across all three years of the senior secondary school. Response frequencies are shown in the next table. This table shows that most of the responding students began the senior secondary school taking a traditional mathematics/science combination in Year 11, but only a small number continued to take science as an integrated subject in Years 12 and 13. Not all schools offer an integrated science course at Years 12 and 13 and where it is offered it tends to be chosen by students who want to combine arts and some science. As in the national data (see Table 6 above) and in other research we have conducted, biology was the most popular Year 13 science option (Hipkins, Vaughan, Beals, Ferral and Gardiner, 2005). Also reflecting national trends, more of these students were taking mathematics with statistics in Year 13 than were taking mathematics with calculus.
6 In the table Cook Island Māori, Tongan, Niuean, Tokelauan, Fijian, and Other Pacific nations are
collated into a category called “other Pacific peoples”.
Ministry of Research, Science and Technology – Te Manatū Pūtaiao | Staying in Science 2 14
Table 7: Subjects taken in senior secondary school
Subject Year 11 %
Year 12 %
Year 13 %
Science 86 2 3 Biology 6 61 64 Chemistry 10 64 58 Physics 9 61 52 Physical science 4 1 1 Agriculture/horticulture 5 4 4 Other science 3 3 3 Mathematics 90 87 0 Applied mathematics 3 5 0 Statistics 0 0 58 Calculus 0 0 43 English 91 92 60 ESOL English 3 4 4 Accounting/economics 32 18 15 ICT/computers 21 20 14
Gender preferences
We found some strong differences in uptake of subjects by males and females. These are summarised here. Note that data for Years 11 and 12 are retrospective and refer to students’ recall of the subjects they took in previous years. Gender differences in their current (Year 13) science choices are set out in more specific detail in Table 9 (science subjects disliked) below. At Years 11, 12, and 13 physics was much more likely to be taken by males. Conversely, at Years 12 and 13 biology/biological sciences were much more likely to be taken by females. There was an indication that biology was also a more popular choice with Year 11 females.7 The pattern for chemistry is not quite as decisive. It was more likely to be taken by females at Year 12, and there was an indication that this was also the case at Year 13. However at Year 11 it was more likely to be taken by males. As already noted, only small numbers of students take separate sciences at Year 11. They are more likely to be in the large urban schools (see below) which suggests this pattern is more likely to be a consequence of the sampling than an actual switch of gender preferences for this subject at this year level. Accounting was more likely to be taken by males at Year 12 but there was no association between gender and taking accounting in Year 13. Males were also more likely to have taken mathematics with calculus and computer studies/ICT at Year 13. There was an indication that females were more likely to still be taking English at Year 13.
7 But note that the numbers of students taking separate sciences are low at this year level.
Ministry of Research, Science and Technology – Te Manatū Pūtaiao | Staying in Science 2 15
School-related differences
A small number of students specialised earlier than most, taking separate sciences at Year 11. For students in the high decile urban schools, these choices were more likely to include chemistry and physics, and it is possible that at least some of them had studied Year 11 science at Year 10. In the suburban and town schools, and in the smaller schools, Year 11 students taking a separate science were more likely to take an agriculture/horticulture combination. Some of these schools were Years 6–13 schools. Those in mid decile schools were more likely to have taken computer studies/ICT. In the urban schools, more students than expected said they had taken alternative forms of Year 11 mathematics.8 Correspondingly, students in other types of schools were more likely to have taken traditional mathematics. Again, these patterns are likely to reflect the ability of larger urban schools to offer a wider range of alternatives to greater numbers of students. When in Year 12, students in the smaller schools were less likely to have taken physics. Those in medium-sized suburban or town schools were more likely to have taken computer studies/ICT or biology. Those in high decile schools were more likely to have taken physics, academic mathematics, and accounting but were less likely to have taken English. Those in suburban and town schools were also more likely to have chosen chemistry or agriculture/horticulture. As at Year 11, students taking an agriculture/ horticulture course were more likely to be attending a Years 7–13 school and this pattern was repeated at Year 13. At both Year 12 and Year 13 respondents in high decile urban schools were more likely to have taken physics, calculus, and accounting. They were also more likely to be attending Years 9–13 schools than Years 7–13 schools. Our survey data and other studies show physics and calculus are favoured by males, suggesting that this high decile pattern relates at least in part to the preponderance of boys in the high decile schools in the sample. There was a related indication that students in the high decile schools were less likely to be taking English, which is favoured by girls at Year 13. Those in suburban and town schools were more likely to be taking chemistry and statistics, while those in smaller schools were less likely to have taken chemistry. Students in the high decile urban schools were more likely than those in other schools to have taken ESOL in Years 11, 12, and 13. This is understandable given that these schools tend to be in urban areas, where immigrants prefer to settle.
Combining sciences
When students intend to continue studying sciences at university they may be advised that it is important to choose a combination of sciences in secondary school (Fullarton et al, 2003). Accordingly, we felt this was an important aspect of students’ subject choices to further investigate. Thirty-eight percent of the responding students were taking just one science, and 62 percent were taking two or more.
8 Other NZCER research has shown that the introduction of the NCEA encouraged schools to offer
alternative versions of core subjects to students perceived to have different learning needs. Mathematics is the subject where this trend is most pronounced, with all six Learning Curves schools offering three versions of the subject at Year 11 (Hipkins and Vaughan, 2002).
Ministry of Research, Science and Technology – Te Manatū Pūtaiao | Staying in Science 2 16
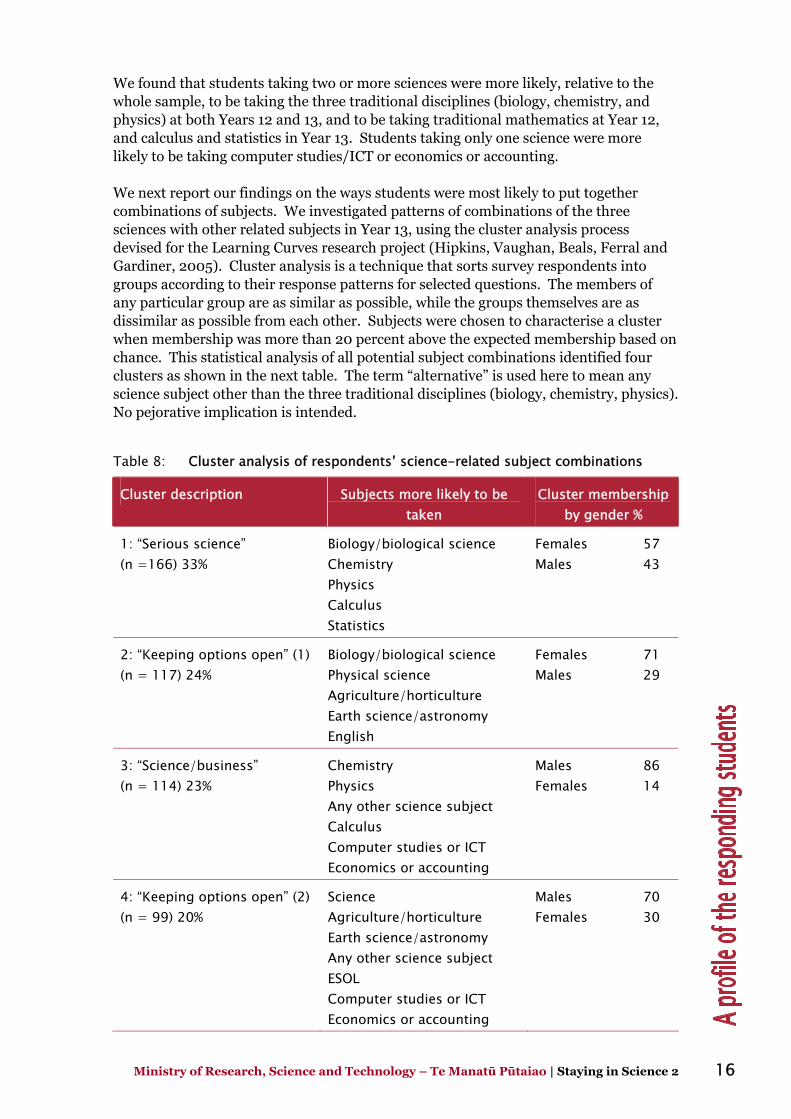
We found that students taking two or more sciences were more likely, relative to the whole sample, to be taking the three traditional disciplines (biology, chemistry, and physics) at both Years 12 and 13, and to be taking traditional mathematics at Year 12, and calculus and statistics in Year 13. Students taking only one science were more likely to be taking computer studies/ICT or economics or accounting. We next report our findings on the ways students were most likely to put together combinations of subjects. We investigated patterns of combinations of the three sciences with other related subjects in Year 13, using the cluster analysis process devised for the Learning Curves research project (Hipkins, Vaughan, Beals, Ferral and Gardiner, 2005). Cluster analysis is a technique that sorts survey respondents into groups according to their response patterns for selected questions. The members of any particular group are as similar as possible, while the groups themselves are as dissimilar as possible from each other. Subjects were chosen to characterise a cluster when membership was more than 20 percent above the expected membership based on chance. This statistical analysis of all potential subject combinations identified four clusters as shown in the next table. The term “alternative” is used here to mean any science subject other than the three traditional disciplines (biology, chemistry, physics). No pejorative implication is intended.
Table 8: Cluster analysis of respondents’ science-related subject combinations
Cluster description Subjects more likely to be taken
Cluster membership by gender %
1: “Serious science” (n =166) 33%
Biology/biological science Chemistry Physics Calculus Statistics
Females 57 Males 43
2: “Keeping options open” (1) (n = 117) 24%
Biology/biological science Physical science Agriculture/horticulture Earth science/astronomy English
Females 71 Males 29
3: “Science/business” (n = 114) 23%
Chemistry Physics Any other science subject Calculus Computer studies or ICT Economics or accounting
Males 86 Females 14
4: “Keeping options open” (2) (n = 99) 20%
Science Agriculture/horticulture Earth science/astronomy Any other science subject ESOL Computer studies or ICT Economics or accounting
Males 70 Females 30
Ministry of Research, Science and Technology – Te Manatū Pūtaiao | Staying in Science 2 17
We found considerable diversity in the types of responses given by the students in these clusters. Table 8 reports gender differences, and these, along with other differences we observed, combine to suggest three types of responses to science and the prospect of science–related study and careers. Other differences are briefly characterised here and will be more fully explored in this and subsequent sections of the report.
The “serious science” students
Students in Cluster 1 appeared to be serious about their science and were the students who were most likely to be taking two or three science disciplines in Year 13, along with mathematics. They were very interested in it and tended to be planning science-related study and careers. While there were significantly more females than males in this cluster, the gender differences were not as pronounced as for other clusters.
The “keeping options open” students
Students in Clusters 2 and 4 were taking courses that included some science, but they were more likely than students in other clusters to be planning careers in other areas, or to not be sure yet. Unlike the “serious science” students, they were less likely to see themselves as successful science learners. Students in Cluster 2 combined one or more, often alternative, types of science course with other Year 13 subjects that were likely to include English but not mathematics. Females were predominant. In Cluster 4 ESOL replaced English and there was a stronger combination of IT/business subjects with alternative versions of science. Males were predominant.
The “science/business” students
The mainly male students in Cluster 3 appeared to be more oriented to business subjects and were less likely than other students to see science as a worthwhile career to pursue, despite continuing to take some science subjects right through to the end of school. We found an association between school decile and cluster. Students in Clusters 3 and 4 were more likely to be in high decile schools. This effect is likely to be confounded by the preponderance of boys in both high decile schools and Clusters 3 and 4. We subsequently analysed clusters by both gender and decile band to determine which of these variables had the greater effect. The gender differences between clusters held for all three decile groupings, suggesting that gender was indeed the predominant variable.
Ministry of Research, Science and Technology – Te Manatū Pūtaiao | Staying in Science 2 18
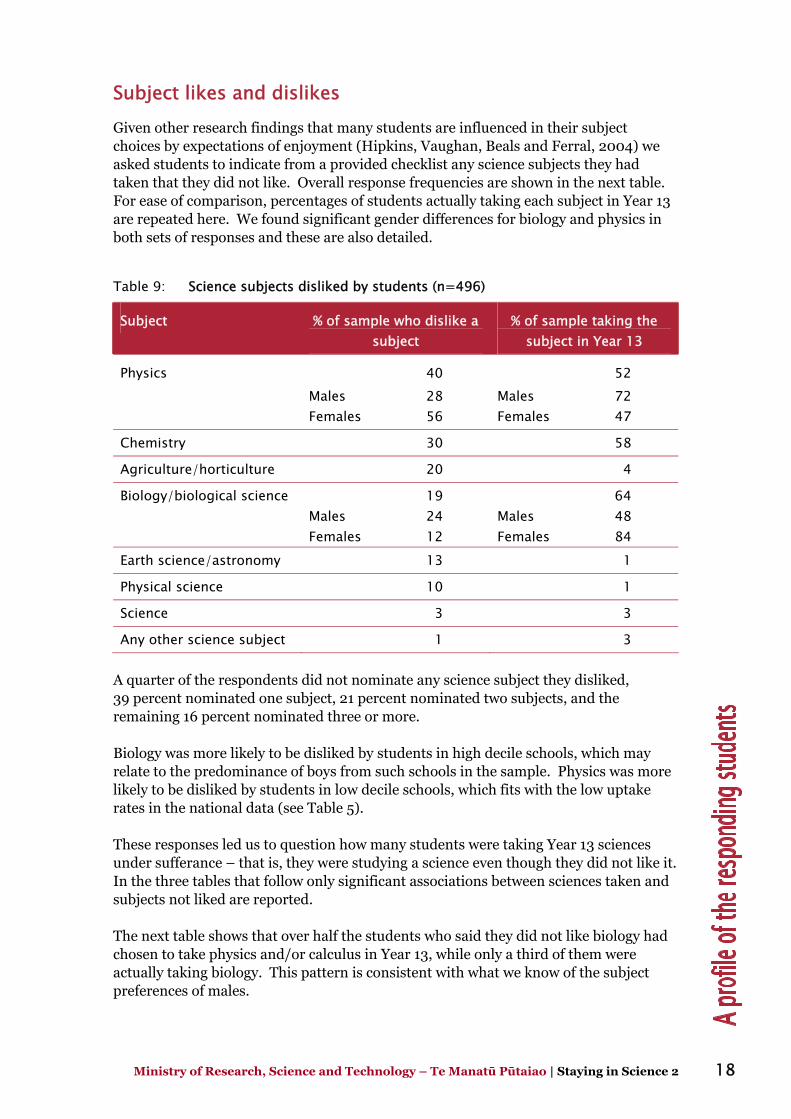
Subject likes and dislikes Given other research findings that many students are influenced in their subject choices by expectations of enjoyment (Hipkins, Vaughan, Beals and Ferral, 2004) we asked students to indicate from a provided checklist any science subjects they had taken that they did not like. Overall response frequencies are shown in the next table. For ease of comparison, percentages of students actually taking each subject in Year 13 are repeated here. We found significant gender differences for biology and physics in both sets of responses and these are also detailed.
Table 9: Science subjects disliked by students (n=496)
Subject % of sample who dislike a subject
% of sample taking the subject in Year 13
Physics 40 Males 28 Females 56
52 Males 72 Females 47
Chemistry 30 58
Agriculture/horticulture 20 4
Biology/biological science 19 Males 24 Females 12
64 Males 48 Females 84
Earth science/astronomy 13 1
Physical science 10 1
Science 3 3
Any other science subject 1 3 A quarter of the respondents did not nominate any science subject they disliked, 39 percent nominated one subject, 21 percent nominated two subjects, and the remaining 16 percent nominated three or more. Biology was more likely to be disliked by students in high decile schools, which may relate to the predominance of boys from such schools in the sample. Physics was more likely to be disliked by students in low decile schools, which fits with the low uptake rates in the national data (see Table 5). These responses led us to question how many students were taking Year 13 sciences under sufferance – that is, they were studying a science even though they did not like it. In the three tables that follow only significant associations between sciences taken and subjects not liked are reported. The next table shows that over half the students who said they did not like biology had chosen to take physics and/or calculus in Year 13, while only a third of them were actually taking biology. This pattern is consistent with what we know of the subject preferences of males.
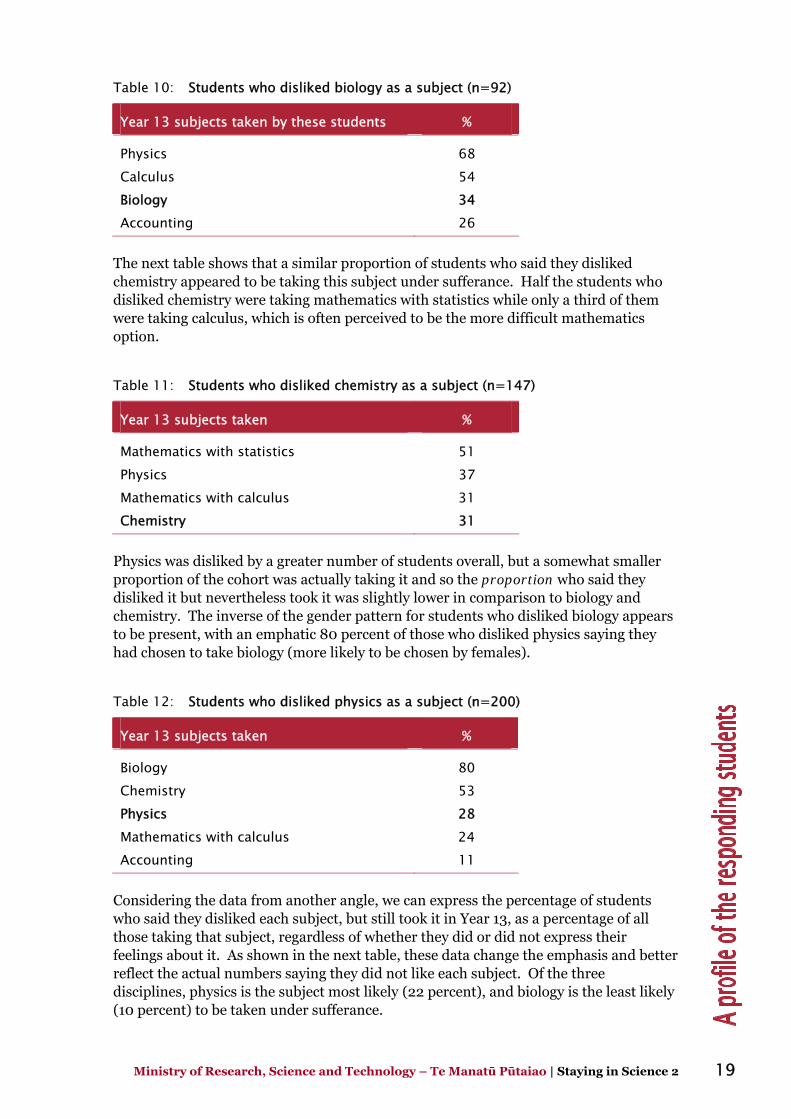
Ministry of Research, Science and Technology – Te Manatū Pūtaiao | Staying in Science 2 19
Table 10: Students who disliked biology as a subject (n=92)
Year 13 subjects taken by these students %
Physics 68 Calculus 54 Biology 34 Accounting 26
The next table shows that a similar proportion of students who said they disliked chemistry appeared to be taking this subject under sufferance. Half the students who disliked chemistry were taking mathematics with statistics while only a third of them were taking calculus, which is often perceived to be the more difficult mathematics option.
Table 11: Students who disliked chemistry as a subject (n=147)
Year 13 subjects taken %
Mathematics with statistics 51 Physics 37 Mathematics with calculus 31 Chemistry 31
Physics was disliked by a greater number of students overall, but a somewhat smaller proportion of the cohort was actually taking it and so the proportion who said they disliked it but nevertheless took it was slightly lower in comparison to biology and chemistry. The inverse of the gender pattern for students who disliked biology appears to be present, with an emphatic 80 percent of those who disliked physics saying they had chosen to take biology (more likely to be chosen by females).
Table 12: Students who disliked physics as a subject (n=200)
Year 13 subjects taken %
Biology 80 Chemistry 53 Physics 28 Mathematics with calculus 24 Accounting 11
Considering the data from another angle, we can express the percentage of students who said they disliked each subject, but still took it in Year 13, as a percentage of all those taking that subject, regardless of whether they did or did not express their feelings about it. As shown in the next table, these data change the emphasis and better reflect the actual numbers saying they did not like each subject. Of the three disciplines, physics is the subject most likely (22 percent), and biology is the least likely (10 percent) to be taken under sufferance.
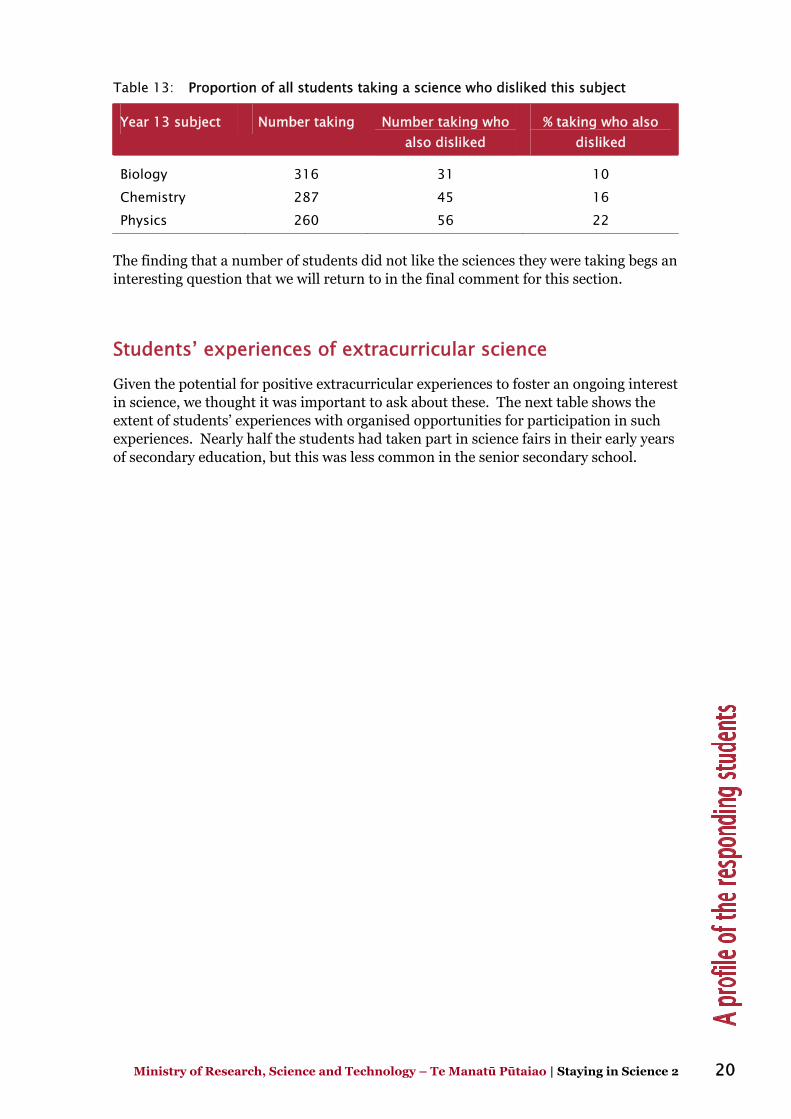
Ministry of Research, Science and Technology – Te Manatū Pūtaiao | Staying in Science 2 20
Table 13: Proportion of all students taking a science who disliked this subject
Year 13 subject Number taking Number taking who also disliked
% taking who also disliked
Biology 316 31 10 Chemistry 287 45 16 Physics 260 56 22
The finding that a number of students did not like the sciences they were taking begs an interesting question that we will return to in the final comment for this section.
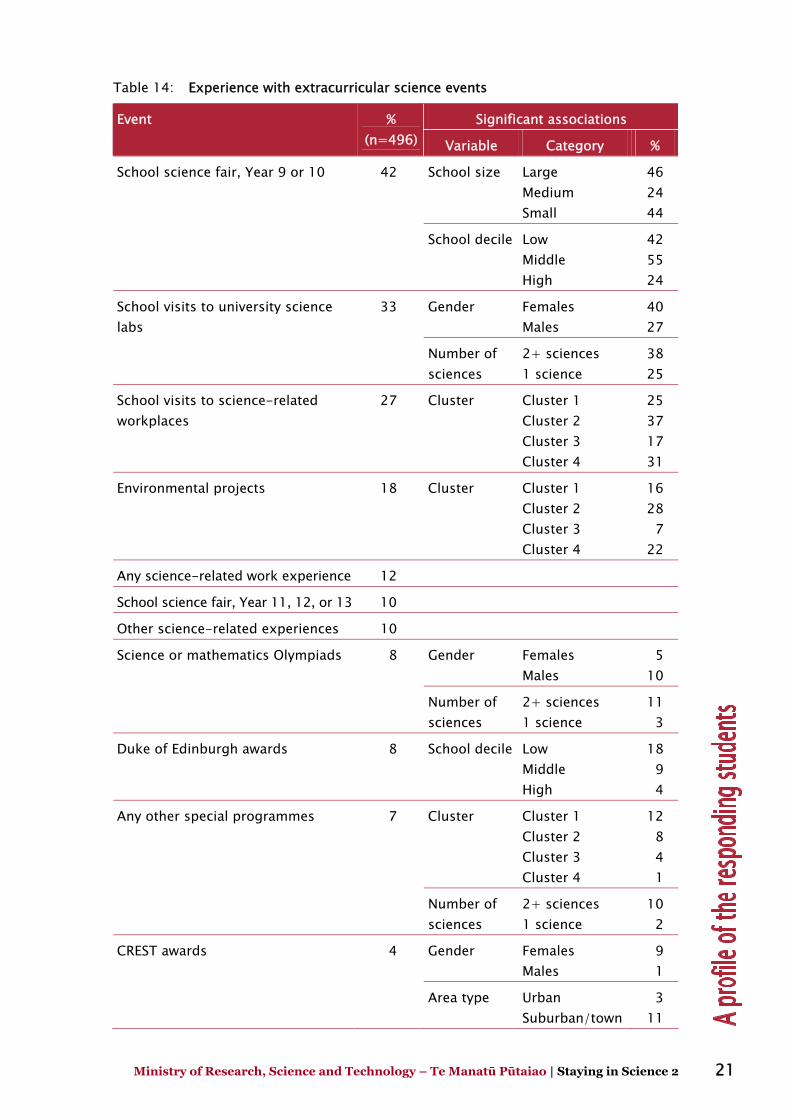
Students’ experiences of extracurricular science Given the potential for positive extracurricular experiences to foster an ongoing interest in science, we thought it was important to ask about these. The next table shows the extent of students’ experiences with organised opportunities for participation in such experiences. Nearly half the students had taken part in science fairs in their early years of secondary education, but this was less common in the senior secondary school.
Ministry of Research, Science and Technology – Te Manatū Pūtaiao | Staying in Science 2 21
Table 14: Experience with extracurricular science events
Significant associations Event % (n=496) Variable Category %
School science fair, Year 9 or 10 42 School size Large Medium Small
46 24 44
School decile Low Middle High
42 55 24
School visits to university science labs
33 Gender Females Males
40 27
Number of sciences
2+ sciences 1 science
38 25
School visits to science-related workplaces
27 Cluster Cluster 1 Cluster 2 Cluster 3 Cluster 4
25 37 17 31
Environmental projects 18 Cluster Cluster 1 Cluster 2 Cluster 3 Cluster 4
16 28
7 22
Any science-related work experience 12
School science fair, Year 11, 12, or 13 10
Other science-related experiences 10
Science or mathematics Olympiads 8 Gender Females Males
5 10
Number of sciences
2+ sciences 1 science
11 3
Duke of Edinburgh awards 8 School decile Low Middle High
18 9 4
Any other special programmes 7 Cluster Cluster 1 Cluster 2 Cluster 3 Cluster 4
12 8 4 1
Number of sciences
2+ sciences 1 science
10 2
CREST awards 4 Gender Females Males
9 1
Area type Urban Suburban/town
3 11
Ministry of Research, Science and Technology – Te Manatū Pūtaiao | Staying in Science 2 22
Gender differences in extracurricular participation
Female students, and those in the suburban and town schools were more likely to have taken part in CREST investigations. Female students, and those taking more than one science subject, were also more likely to have visited university science labs. There was a related indication that students in Clusters 1 and 2, where females were predominant, were more likely to make such visits. It may be that more female than male students took advantage of school-organised opportunities to attend university open days, or that they did so in a more strategic manner. This fits with several indicators, reported in Section 5, that female students were more likely to avail themselves of advice and guidance concerning their study and career choices. Male students and those taking more than one science subject were more likely to have competed in a mathematics or science Olympiad. There was an indication that these students were from high decile schools and were in the business-oriented Cluster 3 for their subject combinations.
Other differences in extracurricular participation
Students who had taken part in science-related work experiences, or who had visited university science labs, were also more likely to say that science would be the main thing they would study in their planned degree or diploma. This fits with the indication that “serious science” students in Cluster 1 were more likely to have gained work-related science experience. While relatively small numbers of students had participated in other science-related programmes such as science schools or camps, such students were again more likely to be in Cluster 1. Students in the suburban and town schools were more likely to say they had experienced such camps and programmes. This may be a factor of school size – it would be relatively easier for students in smaller schools to be selected to try for competitive places at such events. Similarly, these students more likely than others to be taking at least two science subjects – another factor that would count in their favour when competing for places in science schools or the like. Students in subject Clusters 2 and 4 – the “keeping options open” clusters – were more likely to say they had completed environmental science projects, and there was an association with mid decile schools. This is consistent with the types of science subjects taken by students in these clusters (see Table 8 above). These students were also more likely to say they had been on school visits to other science-related workplaces, which seems to fit with their orientation to keeping options open, and considering a range of potential careers. Those in the science/business cluster were the least likely to have been on such visits or to have completed environmental projects. Students in medium-sized, mid decile schools were less likely than those in large or small schools to have completed a science fair project in Year 9 or 10. Some schools make this compulsory and others do not. Students in low decile schools were more likely to have completed a Duke of Edinburgh award.
Ministry of Research, Science and Technology – Te Manatū Pūtaiao | Staying in Science 2 23
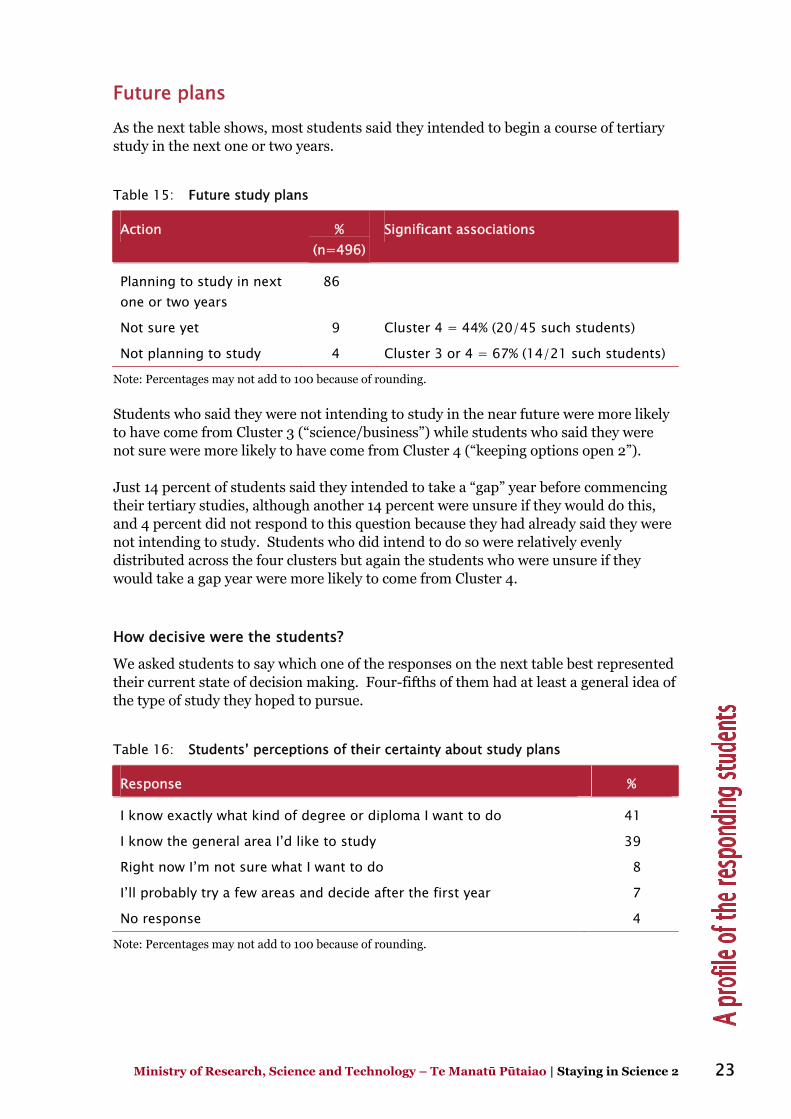
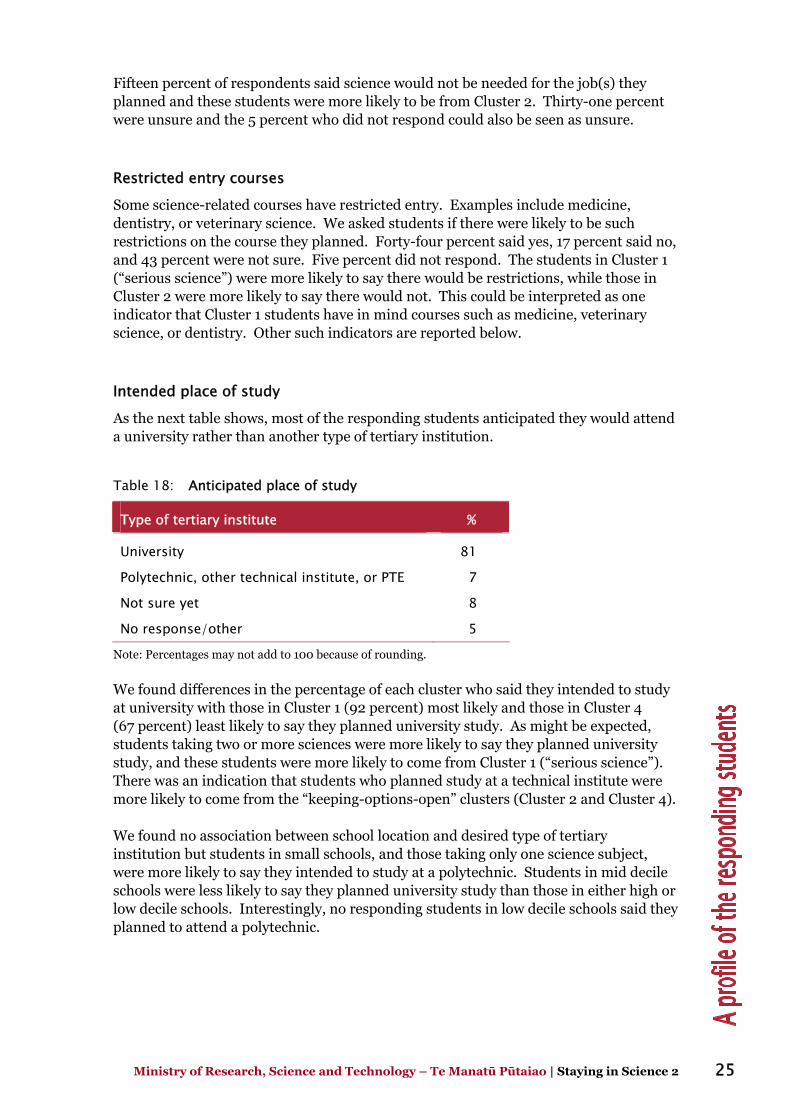
Future plans As the next table shows, most students said they intended to begin a course of tertiary study in the next one or two years.
Table 15: Future study plans
Action % (n=496)
Significant associations
Planning to study in next one or two years
86
Not sure yet 9 Cluster 4 = 44% (20/45 such students)
Not planning to study 4 Cluster 3 or 4 = 67% (14/21 such students)
Note: Percentages may not add to 100 because of rounding.
Students who said they were not intending to study in the near future were more likely to have come from Cluster 3 (“science/business”) while students who said they were not sure were more likely to have come from Cluster 4 (“keeping options open 2”). Just 14 percent of students said they intended to take a “gap” year before commencing their tertiary studies, although another 14 percent were unsure if they would do this, and 4 percent did not respond to this question because they had already said they were not intending to study. Students who did intend to do so were relatively evenly distributed across the four clusters but again the students who were unsure if they would take a gap year were more likely to come from Cluster 4.
How decisive were the students?
We asked students to say which one of the responses on the next table best represented their current state of decision making. Four-fifths of them had at least a general idea of the type of study they hoped to pursue.
Table 16: Students’ perceptions of their certainty about study plans
Response %
I know exactly what kind of degree or diploma I want to do 41
I know the general area I’d like to study 39
Right now I’m not sure what I want to do 8
I’ll probably try a few areas and decide after the first year 7
No response 4
Note: Percentages may not add to 100 because of rounding.
Ministry of Research, Science and Technology – Te Manatū Pūtaiao | Staying in Science 2 24
We also asked students where they thought they might study (see below). When we cross-checked these two different responses we found a high degree of congruence.9 Students who said they knew exactly what they wanted to do were more likely to have nominated just one place of study. Students who said they would try a few areas first were more likely to have nominated two places, or along with students who said they were not sure, to have nominated three possible choices.
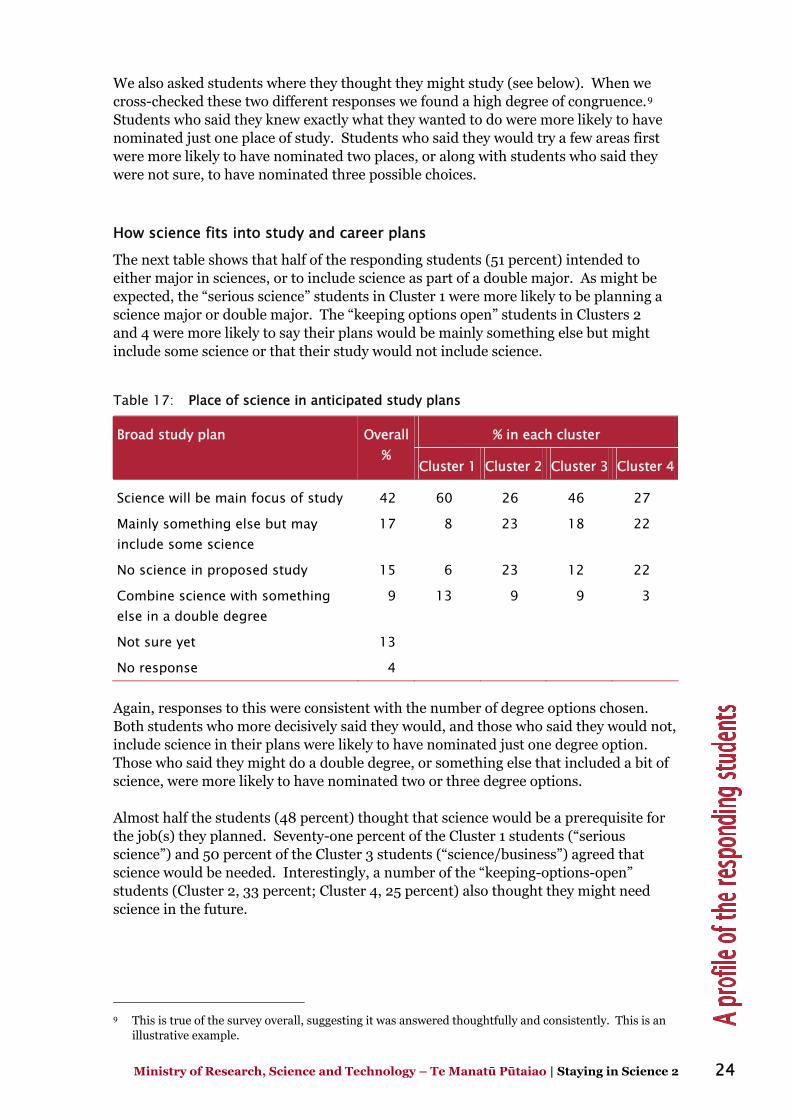
How science fits into study and career plans
The next table shows that half of the responding students (51 percent) intended to either major in sciences, or to include science as part of a double major. As might be expected, the “serious science” students in Cluster 1 were more likely to be planning a science major or double major. The “keeping options open” students in Clusters 2 and 4 were more likely to say their plans would be mainly something else but might include some science or that their study would not include science.
Table 17: Place of science in anticipated study plans
% in each cluster Broad study plan Overall%
Cluster 1 Cluster 2 Cluster 3 Cluster 4
Science will be main focus of study 42 60 26 46 27
Mainly something else but may include some science
17 8 23 18 22
No science in proposed study 15 6 23 12 22
Combine science with something else in a double degree
9 13 9 9 3
Not sure yet 13
No response 4 Again, responses to this were consistent with the number of degree options chosen. Both students who more decisively said they would, and those who said they would not, include science in their plans were likely to have nominated just one degree option. Those who said they might do a double degree, or something else that included a bit of science, were more likely to have nominated two or three degree options. Almost half the students (48 percent) thought that science would be a prerequisite for the job(s) they planned. Seventy-one percent of the Cluster 1 students (“serious science”) and 50 percent of the Cluster 3 students (“science/business”) agreed that science would be needed. Interestingly, a number of the “keeping-options-open” students (Cluster 2, 33 percent; Cluster 4, 25 percent) also thought they might need science in the future.
9 This is true of the survey overall, suggesting it was answered thoughtfully and consistently. This is an
illustrative example.
Ministry of Research, Science and Technology – Te Manatū Pūtaiao | Staying in Science 2 25
Fifteen percent of respondents said science would not be needed for the job(s) they planned and these students were more likely to be from Cluster 2. Thirty-one percent were unsure and the 5 percent who did not respond could also be seen as unsure.
Restricted entry courses
Some science-related courses have restricted entry. Examples include medicine, dentistry, or veterinary science. We asked students if there were likely to be such restrictions on the course they planned. Forty-four percent said yes, 17 percent said no, and 43 percent were not sure. Five percent did not respond. The students in Cluster 1 (“serious science”) were more likely to say there would be restrictions, while those in Cluster 2 were more likely to say there would not. This could be interpreted as one indicator that Cluster 1 students have in mind courses such as medicine, veterinary science, or dentistry. Other such indicators are reported below.
Intended place of study
As the next table shows, most of the responding students anticipated they would attend a university rather than another type of tertiary institution.
Table 18: Anticipated place of study
Type of tertiary institute %
University 81
Polytechnic, other technical institute, or PTE 7
Not sure yet 8
No response/other 5
Note: Percentages may not add to 100 because of rounding.
We found differences in the percentage of each cluster who said they intended to study at university with those in Cluster 1 (92 percent) most likely and those in Cluster 4 (67 percent) least likely to say they planned university study. As might be expected, students taking two or more sciences were more likely to say they planned university study, and these students were more likely to come from Cluster 1 (“serious science”). There was an indication that students who planned study at a technical institute were more likely to come from the “keeping-options-open” clusters (Cluster 2 and Cluster 4). We found no association between school location and desired type of tertiary institution but students in small schools, and those taking only one science subject, were more likely to say they intended to study at a polytechnic. Students in mid decile schools were less likely to say they planned university study than those in either high or low decile schools. Interestingly, no responding students in low decile schools said they planned to attend a polytechnic.

Ministry of Research, Science and Technology – Te Manatū Pūtaiao | Staying in Science 2 26
When asked an open question about their intended place of study, some students gave more than one option, suggesting there was still a degree of uncertainty about their specific plans. (The survey made space for up to three responses – see Appendix A). Nominated study venues are shown in the next table.
Table 19: Tertiary institutions students hoped to attend
Place % of all responses
An Auckland university10 30
Otago University 17
Massey University 10
Victoria University 10
Canterbury University 9
University of Waikato 6
Other 7
Not sure 6
Not intending to study 5
Note: Percentages may not add to 100 because of rounding.
One percent of students said they would attend a polytechnic that they did not name, and a further 1 percent said they would attend Unitech. Those students who nominated Massey, Otago, and the University of Waikato were more likely to say they knew exactly what kind of degree they wanted to do. Students who nominated an Auckland university or Victoria University were more likely to say they wanted to complete a double major, with science as one part of the degree. Those who nominated Otago or Canterbury were more likely to say science would be main thing they did. Students hoping to go to Waikato University were more likely to say they would take science as a main focus or that they would study something else with perhaps a small amount of science. Students in Cluster 1 were more likely to nominate Massey or Otago as likely study locations. Along with University of Auckland (which, combined with Auckland University of Technology, was a frequently nominated choice for all except Cluster 2 students) these institutions offer the high status medical, dentistry, and veterinary courses. This supports other indicators that many of the “serious science” students in this female-dominated cluster were taking sciences as a means of entry into these types of careers.
10 This includes University of Auckland and Auckland University of Technology. Many respondents did
not clearly indicate in which of these two universities they intended to enrol.
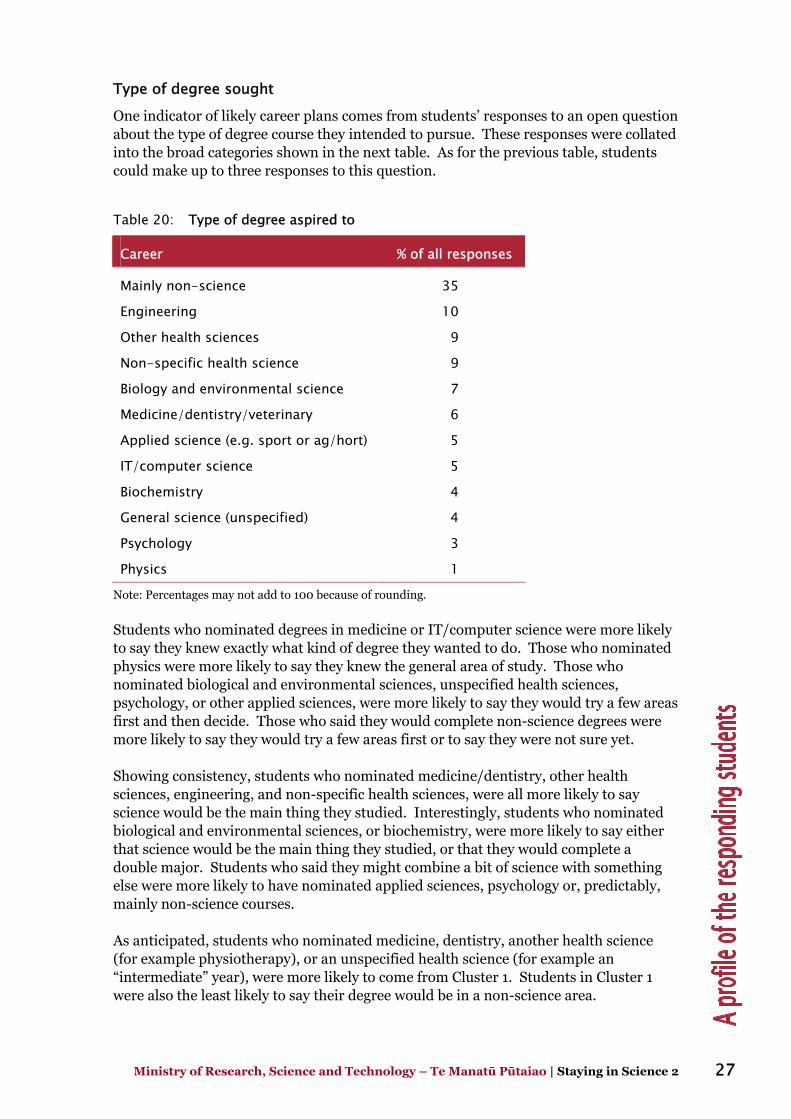
Ministry of Research, Science and Technology – Te Manatū Pūtaiao | Staying in Science 2 27
Type of degree sought
One indicator of likely career plans comes from students’ responses to an open question about the type of degree course they intended to pursue. These responses were collated into the broad categories shown in the next table. As for the previous table, students could make up to three responses to this question.
Table 20: Type of degree aspired to
Career % of all responses
Mainly non-science 35
Engineering 10
Other health sciences 9
Non-specific health science 9
Biology and environmental science 7
Medicine/dentistry/veterinary 6
Applied science (e.g. sport or ag/hort) 5
IT/computer science 5
Biochemistry 4
General science (unspecified) 4
Psychology 3
Physics 1
Note: Percentages may not add to 100 because of rounding.
Students who nominated degrees in medicine or IT/computer science were more likely to say they knew exactly what kind of degree they wanted to do. Those who nominated physics were more likely to say they knew the general area of study. Those who nominated biological and environmental sciences, unspecified health sciences, psychology, or other applied sciences, were more likely to say they would try a few areas first and then decide. Those who said they would complete non-science degrees were more likely to say they would try a few areas first or to say they were not sure yet. Showing consistency, students who nominated medicine/dentistry, other health sciences, engineering, and non-specific health sciences, were all more likely to say science would be the main thing they studied. Interestingly, students who nominated biological and environmental sciences, or biochemistry, were more likely to say either that science would be the main thing they studied, or that they would complete a double major. Students who said they might combine a bit of science with something else were more likely to have nominated applied sciences, psychology or, predictably, mainly non-science courses. As anticipated, students who nominated medicine, dentistry, another health science (for example physiotherapy), or an unspecified health science (for example an “intermediate” year), were more likely to come from Cluster 1. Students in Cluster 1 were also the least likely to say their degree would be in a non-science area.
Ministry of Research, Science and Technology – Te Manatū Pūtaiao | Staying in Science 2 28
Students who nominated engineering, and the small number who nominated physics, were more likely to come from the male-dominated business/science Cluster 3. Along with students in Cluster 4 this group was also more likely to nominate IT or computer science as prospective degree targets. Almost all the relatively small number of students who nominated biochemistry came from either Cluster 1 or Cluster 3. Students who wanted to study for a degree in the biological or environmental sciences, along with those who did not plan to take a science-related course of study, were more likely to come from Cluster 2. Those who hoped to take more applied science degrees (for example in sport science, horticulture, or agriculture) were more likely to come from one or other of the keeping-options-open clusters (Cluster 2 and Cluster 4).
Concluding comment The data reported in this section provide indications that the survey was completed by a wide range of students who were taking varying science courses, and who held varying attitudes towards and expectations of participating in further science study and subsequent science careers. Some of these differences were related to gender, or to school differences. Of concern is the low number of responses from Māori and, in particular, students of Pacific Island backgrounds. Māori students in the sample were more likely to be in mid or low decile schools but there were too few Pacific Islands students to register any such significant differences for this group. This finding for Māori students suggests low participation rates could be related to the low uptake of science by students in low decile schools, another finding of considerable concern. The policy issues raised by these patterns will be explored in Section 6. As in the background paper (Hipkins and Bolstad, 2005), we found gender preferences for science disciplines. Females were more likely to choose biology and males to choose physics. Focus group comments in Section 4 illuminate the ways students perceive differences between these subjects, and suggest that the preference of females for English is closely related to their choice of biology, which they see as more text-oriented than either chemistry or physics. It is interesting that we found no gender differences for mathematics with statistics, while males were more likely to have chosen calculus – perhaps it is considered the mathematical equivalent of physics. Does this gender difference in uptake of different types of sciences matter? We will return to this question in Section 6. Many students are continuing to take sciences they say they dislike. The data presented in Section 4 suggest these are strategic choices, made with future study plans and career prospects in mind. We thought the findings might relate to the role both physics and chemistry have traditionally played as gatekeepers to many tertiary science courses that have restricted entry. However, we checked for but found no association between an intention to apply for restricted entry courses and disliking any specific science subjects. It may be that the small sample reduced the power of the statistical test to detect an association. We still argue that there are gatekeeping issues in science.
Ministry of Research, Science and Technology – Te Manatū Pūtaiao | Staying in Science 2 29
Whatever the cause of students’ dislike, there are evident challenges here for secondary education, if increased participation in sciences is seen as an important goal. However this issue can be viewed from another perspective. There are also challenges for the long-held assumption that using such subjects as gatekeepers is the best means of selecting the students most likely to benefit from an education in certain science-related tertiary courses. The cluster analysis provides one means of capturing the essence of differences between students as they made their Year 13 subject choices and intended to make their tertiary choices. While the findings should not be used as a means of essentialising all the students in each cluster, they are a useful reminder that no single set of strategies can be expected to support and encourage across the board participation in the sciences, either at school or at tertiary level. The characteristics associated with Cluster 3 students’ choices and views provide evidence to support some key assumptions that underpinned the pilot Business of Science initiative (Bolstad, 2003). There was indeed a group of students who were combining business-oriented subjects with sciences in Year 13, and there is evidence that at least some of them were equivocal about continuing with sciences at tertiary level. Section 4 will show that they were also less likely than students in two of the other clusters to see science as a worthwhile career to pursue. We do wonder how many other students of similar orientation we may have missed by concentrating on sampling sciences to the exclusion of technology as a Year 13 subject. While our sampling decisions allowed us to manage the project within the existing constraints, the findings here suggest that the combination of mathematics/business/technology might be a worthwhile focus of investigation at some future point. The next section further explores similarities and differences between students, including those who took part in the focus groups, as it reports on students’ own perceptions of factors that influenced their subject choices and future study plans.
Ministry of Research, Science and Technology – Te Manatū Pūtaiao | Staying in Science 2 30
4. Why do students choose science in Year 13?
This section begins with a selection of verbatim comments made by students in the focus groups as they discussed their reasons for taking science subjects in the senior secondary school. These students’ voices provide deeper insights into the patterns of choices reported from the survey data in Section 3, and illustrate how these choices relate to science views and interests, school science experiences, and students’ thoughts about future study or a career in science.
Reasons for choosing science subjects The 45 focus group students had a variety of reasons for choosing Year 13 science subjects. Some of the most common reasons included: a specific science-related career interest; a strong personal interest in science; “discovering” an interest or talent in science while at high school; choosing science to keep their options open; and taking science for strategic reasons. For most students, a complex interplay of these factors led them to choose science(s) at Year 13. The focus group students’ comments are discussed below.
Career interests
Some students said they took science because it would lead them into a career/study area that they had been interested in “for a long time”. For these students, family backgrounds and home worlds seemed to play an influential role.
I want to be a vet. [I have wanted to do this] ever since I was little, just living on a farm. Vets coming out and working on the cows. Letting me help them, telling me what they’re doing. It’s all of general interest to me. (Female, School 4)
I’ve always been interested in science, and always read my dad’s science magazines, and I never really had the opportunity to take any serious sciences, so I just thought I’d come to [name of school] and take all the sciences, just to see what they’re like. But I’ve always been interested in doing something in the medical sciences. Dad does not work in science but always has science magazines, and has always been keen on me being a doctor. (Male, School 2)
Other students chose their Year 13 subjects because they had a clear idea about what kind of study/career they wanted, but this was a more recent decision, and was often based on specific advice or information they’d received in the last year or two.
I was talking to my doctor, we’re good family friends. And she was like ‘what are you taking?’ and I was like ‘chemistry’. And she said ‘there’s no point in just taking chemistry’. She was like ‘why don’t you take physics as well?’ Because her daughter is an engineer, and she was like ‘yeah she’s loving it and I think you’re really similar’. And so she was like ‘go and take chemistry and physics and become an engineer’. And I was like ‘you’ve got to be kidding me’. And I went home and just told my mum just as a joke, and she was like ‘you should go and do it’. And I actually started considering it, and that’s where I’m going now. (Female, School 1)
Ministry of Research, Science and Technology – Te Manatū Pūtaiao | Staying in Science 2 31
I wanted to be an engineer. [I decided] quite recently. I did sciences last year as well. At the start of this year I changed to doing mechanical engineering. Before that I wanted to do physics. I changed my mind because I went to a uni open day and I saw all the facilities. It looked interesting. And if you do mechanical engineering you also do physics. It looked better than just doing physics. (Male, School 5)
Strong personal interest in science (or a specific branch of science)
Many students expressed a “passion” or strong interest in science(s). This was associated with wanting to understand “how the world works”. Sometimes students said this about science in general, and sometimes, about a specific branch of science.
Biology, it’s interesting finding out how things work that you can’t see, like cells and stuff. You don’t know where exactly it is, it’s hard to explain, but it’s, like, not obvious how things work in biology and you have to do lots of explaining. (Female, School 4)
Some students expressed a more non-specific interest in science. They liked it enough to keep taking it, and saw the potential for continuing with it beyond Year 13. Some students said they “discovered” in earlier years of secondary (sometimes at Year 11) they were good at sciences or enjoyed them, therefore chose to continue.
I don’t really know why I took science. I like to know how things work. I found science interesting in 5th form and I just kept going. (Female, School 1)
As we saw in Section 3, many students in the survey expressed dislike of one or more sciences, sometimes including subjects they were actually taking. In the focus groups, it was very common for students to have strong tendencies towards one or more sciences, but to be completely disinterested or dislike another branch of science (for example, they might really like biology but not physics, or like physics and chemistry but not biology). Focus group students sometimes discovered one branch of science was too hard, or badly taught, or they didn’t do well, and so chose not to continue with it.
In physics in 5th form I got really weird results. I got two excellences in the exam, but then I, like, failed on the ... [inaudible]. I wasn’t really sure I should go on with it. (Male, School 2)
I’m a person who likes to find out like, us as humans, and how stuff is done. I can’t really explain it. I like bio and how we work, rather than maths. I like biology and physics because I like to know how stuff works and reasons why. Chemistry I just don’t like because it’s more related to maths and equations and stuff. I only did it in general science, which we did up until 5th form. (Female, School 1)
Some students who thought science was really interesting, perceived other subjects like English or history to be static and boring.
Sciences interest me more than artsy subjects like history and English and so on. And I’m a lot better at sciences as well ... In English, you learn the same thing every year, and you have to analyse ... [In English] they encourage creativity except that then they [say], you have to do this and this and this, and it’s got to look exactly like this, and it’s a bit of a farce you know. It’s sort of boring, and really dull, whereas science is really interesting, and it’s always changing as well. There’s only certain things you can do in English, like written stuff, creative writing, formal writing – it’s all the same every year. (Group of male students, School 2)
Ministry of Research, Science and Technology – Te Manatū Pūtaiao | Staying in Science 2 32
The students in another focus group perceived that biology shared similarities with English, and they understood that chemistry and physics were more related to mathematics.
In bio you have to have a deeper knowledge, where there’s not so much of that in the other subjects. It’s written too (male 1). Yeah biology is not really scientific it’s just written down stuff (female 2). It’s like English (male 1). Yeah physics and chemistry you’ve got to apply it more (female 3). Like reactions and stuff (female 2). [Inaudible] Like physics you use equations and stuff (male 2). [Does that make it more scientific?] It makes it easier (male 2). In physics and chemistry you could be asked to do four things in a row to come up with an answer or a solution, but in bio you can’t give four definitions in a row to come up with a big definition. So it’s just a matter of knowing heaps rather than processes (male 1). [Is it to do with how you’re assessed?] The practical side of biology is pretty small. Just one or two fieldtrips, and you can pass without them. You can pass biology without touching anything bar a piece of paper and a pen (male 2). (Group discussion, School 4)
Taking science for strategic reasons
Some focus group students continued to take a science subject they didn’t particularly like for strategic reasons, for example, as a “back-up” for the one that they liked.
[What do you like about physics?] Just how you can [see] applications, how it can be used to describe things. I dunno, it’s just the maths I like and how the world works and things. [Do you like the other sciences?] Probably not bio, but I need chemistry for mechanical engineering. (Male, School 5)
Biology is the main one I’m interested in – I just feel I need another one to back it up. I’ve heard it’s bad to do one science in isolation so I do chemistry to back it up, but I don’t really feel ... I mean I’ve got other interests, like geography as well, I’d rather do that than do physics. (Male, School 2)
Students had different perspectives about whether science was “harder/easier” or “more interesting/more boring” compared to non-science subjects. Some students preferred their non-science subjects, found science really hard, and thought they weren’t good at it, but persisted anyway because it was going to help them in the future.
Science is okay but it’s hard work, and not always so much fun. I would take them again [science subjects] because I want to go down an engineering path. But sometimes I’d rather be in a painting class. (Female, School 1)
I dropped [biology] at the end of 5th form and picked up classics, ’cause I’m more of a social science kind of person. (Male student, School 2)
Some students suggested they did science purely for strategic purposes. This could be associated with encouragement from someone else (such as a parent) that science is a good subject to take, or knowing that it was going to get the student into a tertiary course they wanted to do.
I don’t like [the sciences], and I’m not that good at them, but you might need them. My parents encouraged me to take science to keep my options open. For what I want to be you don’t actually have to take science at school, but again, you want to make it as easy as possible. And if you’ve got a good grasp on it – getting into second year is so hard that anything to make it easier – yeah go for it. (Female, School 1)
Ministry of Research, Science and Technology – Te Manatū Pūtaiao | Staying in Science 2 33
I never really liked science. It’s too hard. But I’m interested in genetics and stuff. That’s about all I like in it. [Why?] I’ve always been interested in human development and stuff, but the rest of it is boring and hard and I don’t understand [laughs] and I get frustrated. Mum said to take bio ‘cause I didn’t know what I want to do next year, so I’ve taken accounting, English, maths, business, and bio. Just sort of keep it all open. (Female, School 1)
Keeping your options open
Some students said they chose science subjects to keep their learning “balanced” or “options open”, or to “stay well rounded”. Students who were taking a lot of non-science subjects tended to think they should balance this with some science. Some students had decided to continue with science at tertiary, while others had decided they probably wouldn’t. Some were still not sure.
I didn’t really know what I wanted to do once I left school so I thought I could keep a general range of subjects that could lead onto anything. [The sciences] are my favourite subjects now. Next year I’m going to Canterbury to do science, but I don’t know what area yet. First year I’ll probably do chemistry and biology and then branch off in second year. (Female, School 5)
I’ve always been good at English and history, and of late, classics ... Chemistry is the only science I take, and I took it because I sort of enjoy it, and started to get a grasp of it. But by no means is my passion for it a burning desire to go on, and I don’t feel I’ve got a sufficient grasp of it to succeed at university. Whereas history and classics and English have always been my best subjects, so the natural progression would be to continue on with them as opposed to science. (Male, School 2)
A few students said one reason for choosing science was to get credits for University Entrance, because science subjects were on many “approved subjects” lists. Even for students not planning to continue with science at tertiary level, science subject(s) were seen as good subjects in which to gain credits – particularly if the student had already been doing well in that subject.
[Biology] is on a lot of the approved subject lists for when you get into University Entrance. Personally it was a subject I was into, but I never intended to do science at uni. Last year I wanted to drop it but I looked at it as, it’s good, ‘cause I can see myself achieving if I put my mind to it, and it’s good [that it’s] on a lot of approved subject lists, for a lot of the [courses] I wanted to do anyway. So that’s why I took it, and then I’m just going to drop it later. (Female, School 3)
Some students didn’t take particular science subjects at Year 13 (most often biology or chemistry) because they felt they would be able to pick these up, if necessary, at tertiary level. Some had dropped science(s) at Year 12 knowing they could pick them up again at Year 13. Others didn’t take a particular Year 13 science subject because they felt they could pick it up at university.
Back in 5th form when I couldn’t wait to drop out of science, my science teacher said you can pick up general science in Year 13. And I thought that’s a good idea, you get to do a bit of everything. And so Year 13 came along and I thought ‘Oh I better do general science’. And I had absolutely no idea what I wanted to do either so I was like ... [okay]. (Female, School 1)
I might do a summer paper in chemistry. A bridging paper. (Female, School 4)
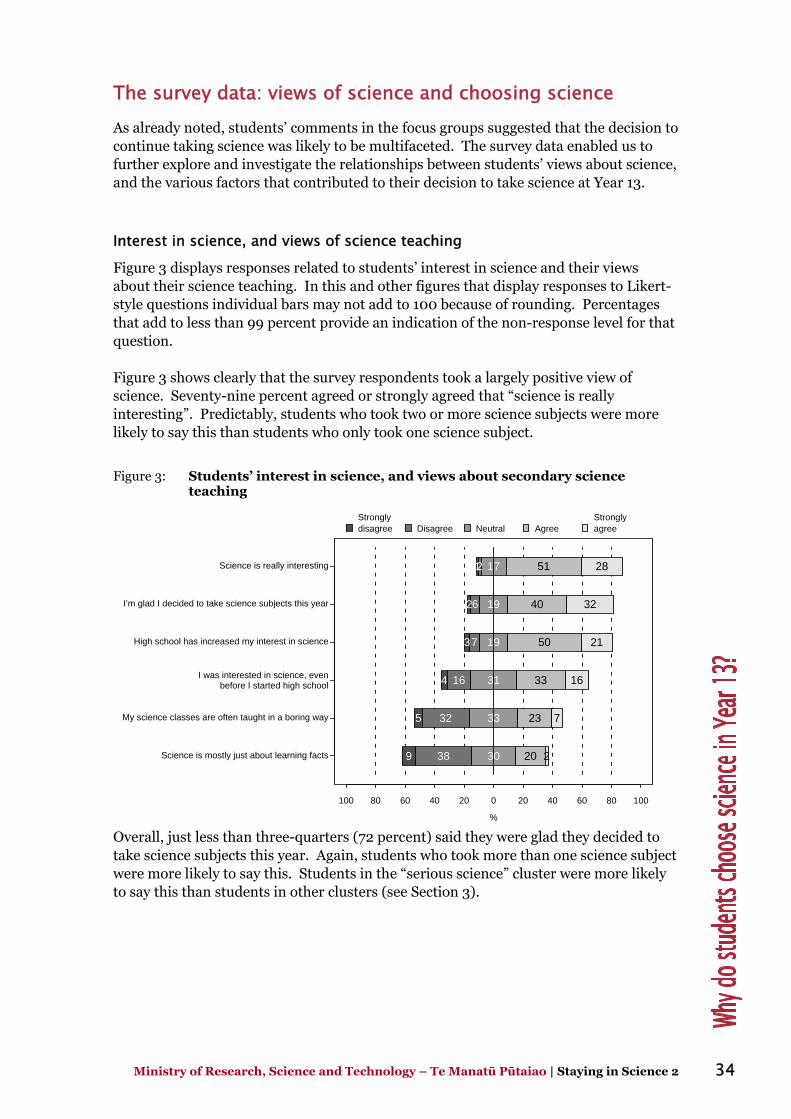
Ministry of Research, Science and Technology – Te Manatū Pūtaiao | Staying in Science 2 34
The survey data: views of science and choosing science As already noted, students’ comments in the focus groups suggested that the decision to continue taking science was likely to be multifaceted. The survey data enabled us to further explore and investigate the relationships between students’ views about science, and the various factors that contributed to their decision to take science at Year 13.
Interest in science, and views of science teaching
Figure 3 displays responses related to students’ interest in science and their views about their science teaching. In this and other figures that display responses to Likert-style questions individual bars may not add to 100 because of rounding. Percentages that add to less than 99 percent provide an indication of the non-response level for that question. Figure 3 shows clearly that the survey respondents took a largely positive view of science. Seventy-nine percent agreed or strongly agreed that “science is really interesting”. Predictably, students who took two or more science subjects were more likely to say this than students who only took one science subject.
Figure 3: Students’ interest in science, and views about secondary science teaching
%
100 80 60 40 20 0 20 40 60 80 100
Science is really interesting
I’m glad I decided to take science subjects this year
High school has increased my interest in science
I was interested in science, evenbefore I started high school
My science classes are often taught in a boring way
Science is mostly just about learning facts
1
2
3
4
5
9
2
6
7
16
32
38
17
19
19
31
33
30
51
40
50
33
23
20
28
32
21
16
7
2
Stronglydisagree Disagree Neutral Agree
Stronglyagree
Overall, just less than three-quarters (72 percent) said they were glad they decided to take science subjects this year. Again, students who took more than one science subject were more likely to say this. Students in the “serious science” cluster were more likely to say this than students in other clusters (see Section 3).
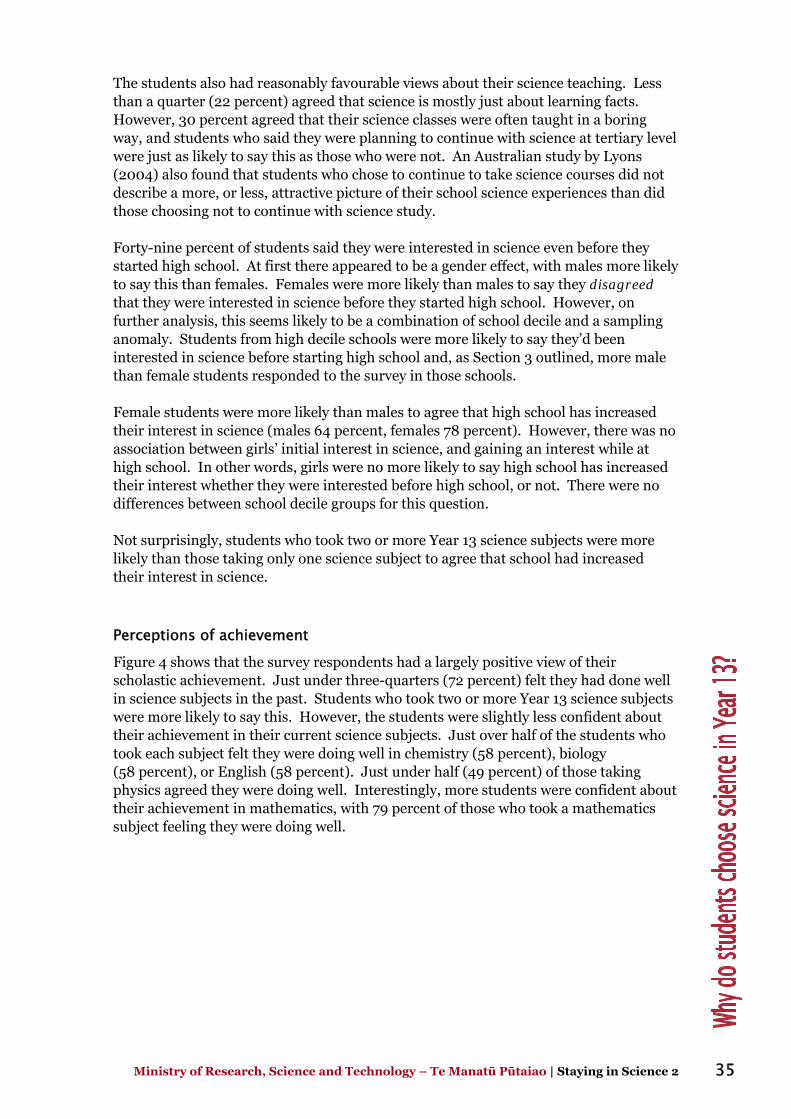
Ministry of Research, Science and Technology – Te Manatū Pūtaiao | Staying in Science 2 35
The students also had reasonably favourable views about their science teaching. Less than a quarter (22 percent) agreed that science is mostly just about learning facts. However, 30 percent agreed that their science classes were often taught in a boring way, and students who said they were planning to continue with science at tertiary level were just as likely to say this as those who were not. An Australian study by Lyons (2004) also found that students who chose to continue to take science courses did not describe a more, or less, attractive picture of their school science experiences than did those choosing not to continue with science study. Forty-nine percent of students said they were interested in science even before they started high school. At first there appeared to be a gender effect, with males more likely to say this than females. Females were more likely than males to say they disagreed that they were interested in science before they started high school. However, on further analysis, this seems likely to be a combination of school decile and a sampling anomaly. Students from high decile schools were more likely to say they’d been interested in science before starting high school and, as Section 3 outlined, more male than female students responded to the survey in those schools. Female students were more likely than males to agree that high school has increased their interest in science (males 64 percent, females 78 percent). However, there was no association between girls’ initial interest in science, and gaining an interest while at high school. In other words, girls were no more likely to say high school has increased their interest whether they were interested before high school, or not. There were no differences between school decile groups for this question. Not surprisingly, students who took two or more Year 13 science subjects were more likely than those taking only one science subject to agree that school had increased their interest in science.
Perceptions of achievement
Figure 4 shows that the survey respondents had a largely positive view of their scholastic achievement. Just under three-quarters (72 percent) felt they had done well in science subjects in the past. Students who took two or more Year 13 science subjects were more likely to say this. However, the students were slightly less confident about their achievement in their current science subjects. Just over half of the students who took each subject felt they were doing well in chemistry (58 percent), biology (58 percent), or English (58 percent). Just under half (49 percent) of those taking physics agreed they were doing well. Interestingly, more students were confident about their achievement in mathematics, with 79 percent of those who took a mathematics subject feeling they were doing well.
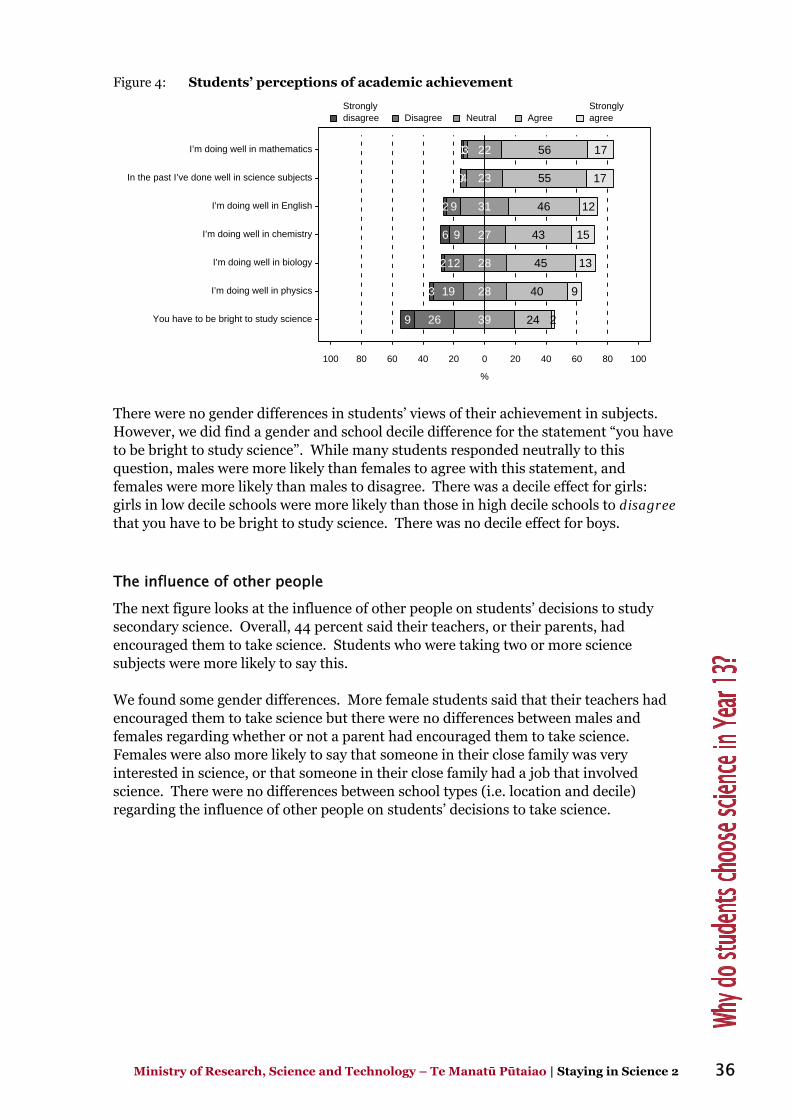
Ministry of Research, Science and Technology – Te Manatū Pūtaiao | Staying in Science 2 36
Figure 4: Students’ perceptions of academic achievement
%
100 80 60 40 20 0 20 40 60 80 100
I’m doing well in mathematics
In the past I’ve done well in science subjects
I’m doing well in English
I’m doing well in chemistry
I’m doing well in biology
I’m doing well in physics
You have to be bright to study science
1
0
2
6
2
3
9
3
4
9
9
12
19
26
22
23
31
27
28
28
39
56
55
46
43
45
40
24
17
17
12
15
13
9
2
Stronglydisagree Disagree Neutral Agree
Stronglyagree
There were no gender differences in students’ views of their achievement in subjects. However, we did find a gender and school decile difference for the statement “you have to be bright to study science”. While many students responded neutrally to this question, males were more likely than females to agree with this statement, and females were more likely than males to disagree. There was a decile effect for girls: girls in low decile schools were more likely than those in high decile schools to disagree that you have to be bright to study science. There was no decile effect for boys.
The influence of other people
The next figure looks at the influence of other people on students’ decisions to study secondary science. Overall, 44 percent said their teachers, or their parents, had encouraged them to take science. Students who were taking two or more science subjects were more likely to say this. We found some gender differences. More female students said that their teachers had encouraged them to take science but there were no differences between males and females regarding whether or not a parent had encouraged them to take science. Females were also more likely to say that someone in their close family was very interested in science, or that someone in their close family had a job that involved science. There were no differences between school types (i.e. location and decile) regarding the influence of other people on students’ decisions to take science.
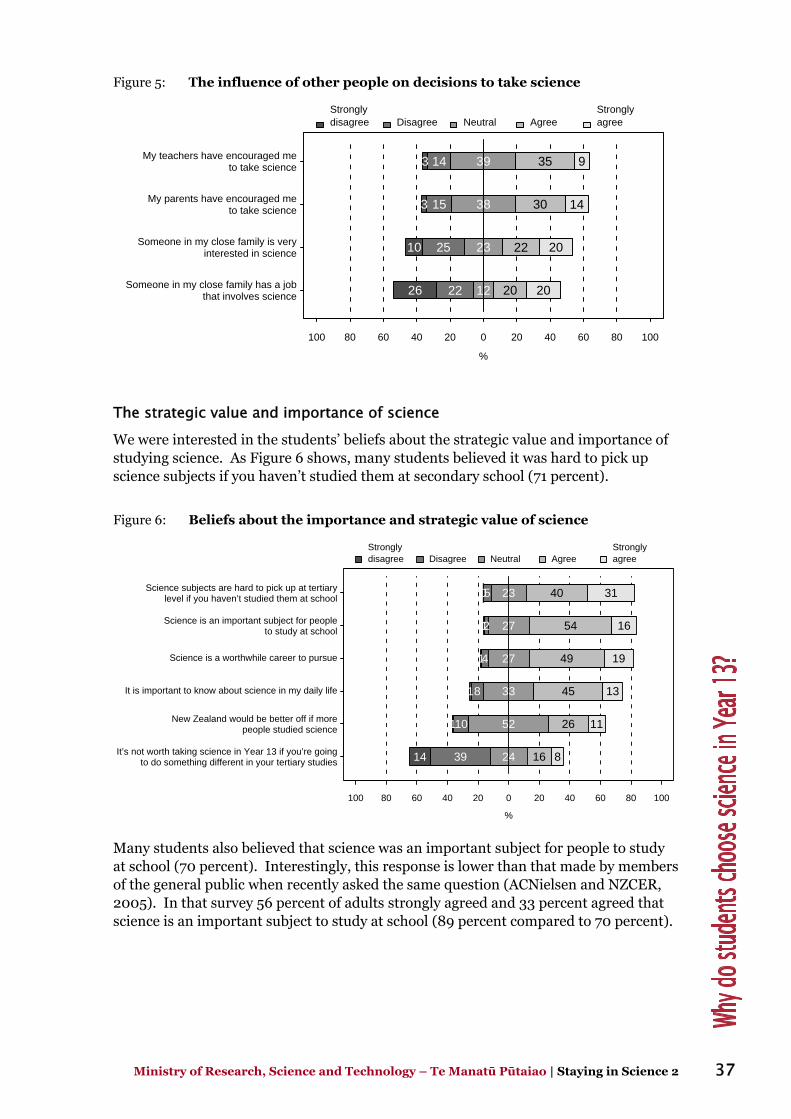
Ministry of Research, Science and Technology – Te Manatū Pūtaiao | Staying in Science 2 37
Figure 5: The influence of other people on decisions to take science
%
100 80 60 40 20 0 20 40 60 80 100
My teachers have encouraged meto take science
My parents have encouraged meto take science
Someone in my close family is veryinterested in science
Someone in my close family has a jobthat involves science
3
3
10
26
14
15
25
22
39
38
23
12
35
30
22
20
9
14
20
20
Stronglydisagree Disagree Neutral Agree
Stronglyagree
The strategic value and importance of science
We were interested in the students’ beliefs about the strategic value and importance of studying science. As Figure 6 shows, many students believed it was hard to pick up science subjects if you haven’t studied them at secondary school (71 percent).
Figure 6: Beliefs about the importance and strategic value of science
%
100 80 60 40 20 0 20 40 60 80 100
Science subjects are hard to pick up at tertiarylevel if you haven’t studied them at school
Science is an important subject for peopleto study at school
Science is a worthwhile career to pursue
It is important to know about science in my daily life
New Zealand would be better off if morepeople studied science
It’s not worth taking science in Year 13 if you’re goingto do something different in your tertiary studies
0
1
1
1
1
14
5
2
4
8
10
39
23
27
27
33
52
24
40
54
49
45
26
16
31
16
19
13
11
8
Stronglydisagree Disagree Neutral Agree
Stronglyagree
Many students also believed that science was an important subject for people to study at school (70 percent). Interestingly, this response is lower than that made by members of the general public when recently asked the same question (ACNielsen and NZCER, 2005). In that survey 56 percent of adults strongly agreed and 33 percent agreed that science is an important subject to study at school (89 percent compared to 70 percent).
Ministry of Research, Science and Technology – Te Manatū Pūtaiao | Staying in Science 2 38
The students appeared to value science more for career directions than for its relevance to everyday life; 68 percent agreed that science was a worthwhile career to pursue, while 58 percent felt that science was important to know about in their daily lives. Again positive responses were given by a smaller proportion of the student sample than the general public sample. In the ACNielsen survey 83 percent said science was a worthwhile career to pursue and 65 percent of respondents said it was important to know about science in their daily lives (ACNielsen and NZCER, 2005). Differences in response rates for these two common questions may relate to differences in the overall context of each survey. The public survey (ACNielsen) began with several questions that were intended to provide a wide ranging “frame” for thinking about science at work in the world (for example in food production, medical research, and new transport options). The Year 13 survey, being set in the context of school subject choices, implicitly framed science as “school science subjects”. The background paper raised questions of the relevance students perceive for science as they experience it (Hipkins & Bolstad, 2005), which tends to support such an interpretation, but obviously the finding begs further questions. Female students were more likely than males to say that science was a worthwhile career to pursue, as were students taking more than one Year 13 science subject. Many students also believed it was worthwhile taking science in Year 13, even if they were going to do something different at tertiary level (53 percent agreed that it was worthwhile, 24 percent disagreed).
Differences in responses by cluster group We found a number of differences in the types of responses to the above questions given by the students in the four clusters introduced in Section 3. These combine to suggest different types of responses to science and the prospect of science-related study and careers. These differences are reported next.
The “serious science” students
Unsurprisingly, the “serious science” students in Cluster 1, who demonstrated the highest levels of interest in science as a subject, said that their learning at school had increased that interest, and that they had done well in (general) science, and in biology. They were pleased they had taken science subjects, and indeed were more likely to say they had been encouraged by their parents and their teachers to do so. They were more likely to see science as a worthwhile career to pursue. However they were also more likely to believe that sciences would be hard to pick up at the tertiary level.
Ministry of Research, Science and Technology – Te Manatū Pūtaiao | Staying in Science 2 39
The “keeping options open” students
Students in Clusters 2 and 4, who were taking more mixed courses that included some science, were more likely to disagree with the statement that “science is really interesting”. They also indicated that school science had not increased their interest in the subject and they were not pleased they had chosen to take sciences in Year 13. (In the case of Cluster 4 some students gave a neutral response to both these statements.) Those in Cluster 2 were more likely to disagree that they had done well in science subjects in the past, while those in Cluster 4 were more likely to disagree that they had done well in biology. These students were more likely to say they had not been encouraged by their parents to choose sciences. Students in Cluster 2 were more likely to give a neutral response to the statement that science is a worthwhile career to pursue, while those in Cluster 4 were more likely to disagree.
The “science/business” students
The students in the business oriented Cluster 3 were more likely to give neutral responses to the statements that “science is really interesting” and “high school has increased my interest in science”. Along with the students in Cluster 2 they were less likely to believe that sciences would be hard to pick up at the tertiary level and, like the students in Cluster 4, they were more likely to disagree that science is a worthwhile career to pursue.
How do students navigate their secondary science subject choices? American research (Cleaves, 2005) suggests that it may be possible to identify a variety of different “choice trajectories” among students as they move through the final few years of secondary school. In Cleaves’ longitudinal study, for example, some students had identified a career goal early in secondary school, and tended to funnel their subject choices through senior secondary school to lead them towards this career. If science was not the focus of this early career goal, it was not pursued at senior secondary level by the students in Cleaves’ study. Other students kept their subject options broad, gradually gravitating towards particular subject areas as they became aware of their own strengths, interests, and breadth of choices. These students often eventually dropped science because they found it boring, or irrelevant, or lacked confidence in their science abilities. Other students juggled images of themselves in a variety of career roles, including science, and often chose an area other than science not because they no longer liked science, but because they had developed a stronger taste in other directions. In the focus group interviews, we also met students who seemed to have a range of different affinities for science as a secondary subject, tertiary study option, and potential future career. We analysed the survey data to see whether we could identify any clear patterns or differences between different students’ subject choice orientations.
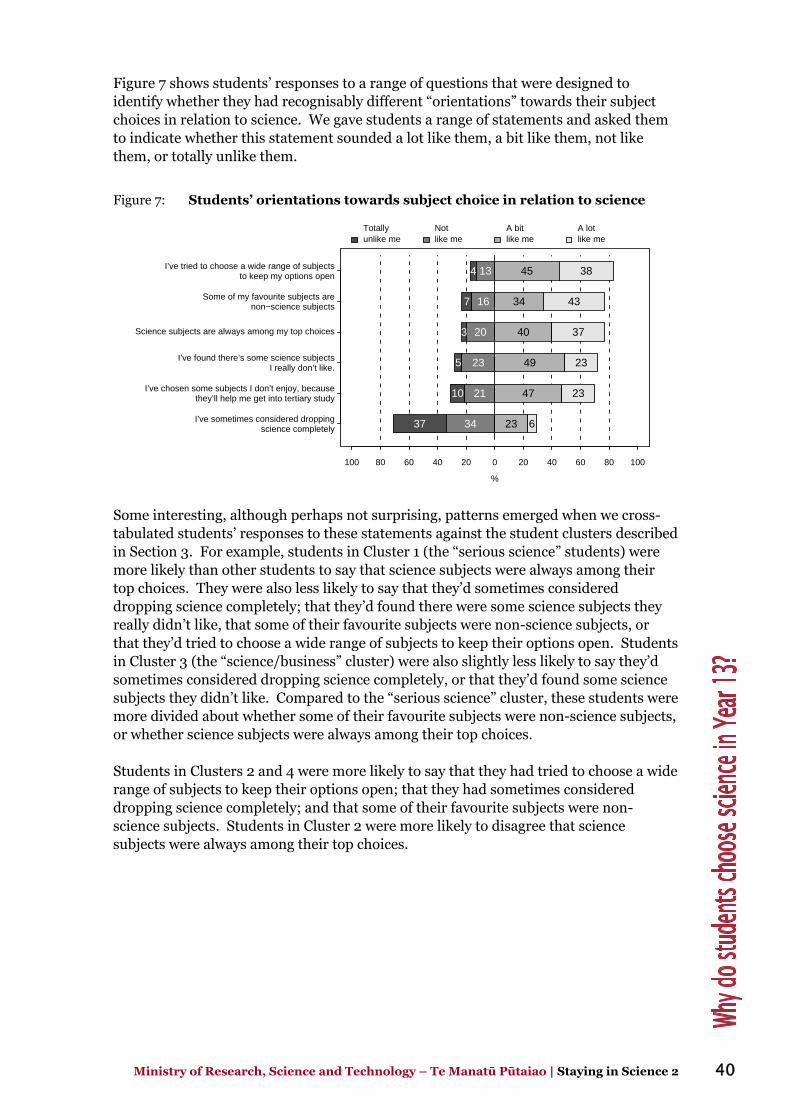
Ministry of Research, Science and Technology – Te Manatū Pūtaiao | Staying in Science 2 40
Figure 7 shows students’ responses to a range of questions that were designed to identify whether they had recognisably different “orientations” towards their subject choices in relation to science. We gave students a range of statements and asked them to indicate whether this statement sounded a lot like them, a bit like them, not like them, or totally unlike them.
Figure 7: Students’ orientations towards subject choice in relation to science
%
100 80 60 40 20 0 20 40 60 80 100
I’ve tried to choose a wide range of subjectsto keep my options open
Some of my favourite subjects arenon−science subjects
Science subjects are always among my top choices
I’ve found there’s some science subjectsI really don’t like.
I’ve chosen some subjects I don’t enjoy, becausethey’ll help me get into tertiary study
I’ve sometimes considered droppingscience completely
4
7
3
5
10
37
13
16
20
23
21
34
45
34
40
49
47
23
38
43
37
23
23
6
Totallyunlike me
Notlike me
A bitlike me
A lotlike me
Some interesting, although perhaps not surprising, patterns emerged when we cross-tabulated students’ responses to these statements against the student clusters described in Section 3. For example, students in Cluster 1 (the “serious science” students) were more likely than other students to say that science subjects were always among their top choices. They were also less likely to say that they’d sometimes considered dropping science completely; that they’d found there were some science subjects they really didn’t like, that some of their favourite subjects were non-science subjects, or that they’d tried to choose a wide range of subjects to keep their options open. Students in Cluster 3 (the “science/business” cluster) were also slightly less likely to say they’d sometimes considered dropping science completely, or that they’d found some science subjects they didn’t like. Compared to the “serious science” cluster, these students were more divided about whether some of their favourite subjects were non-science subjects, or whether science subjects were always among their top choices. Students in Clusters 2 and 4 were more likely to say that they had tried to choose a wide range of subjects to keep their options open; that they had sometimes considered dropping science completely; and that some of their favourite subjects were non-science subjects. Students in Cluster 2 were more likely to disagree that science subjects were always among their top choices.
Ministry of Research, Science and Technology – Te Manatū Pūtaiao | Staying in Science 2 41
tudents who said they would not include any science in their tertiary studies h each of
or the remaining 39 percent of students in between these two extremes – for example,
The survey data confirmed our hypothesis that there are some identifiably different
s a
urite
Who chooses to continue with science at the tertiary level? Section 3 reported on students’ responses to a question about how they thought science might fit into their tertiary study plans.11 As we saw in that section, students in Cluster 1 were likely to say that science would be the main thing they intended to study in their degree/diploma, or that they might do a double degree and combine science with something else. Students in Clusters 2 and 4 were more likely to say that they would not include any science, or that they would mainly do something else, but might include a bit of science as well, or that they were not sure yet. There were some clear relationships between students’ intention to continue with science at tertiary level and their responses to questions about choosing science at secondary school. Students who said science was the main thing they planned to study at tertiary level (42 percent of the survey sample) were more likely to agree that:
• science is interesting
• I was interested in science even before I started high school
• high school has increased my interest in science
• in the past I’ve done well in science subjects
• I’m glad I decided to take science subjects this year
• my parents have encouraged me to take science
• someone in my family has a job that involves science
• science is a worthwhile career to pursue
• New Zealand would be better off if more people studied science, and
it is important to know about science in my daily life. • S(15 percent of the sample) were more likely than other students to disagree witthese statements – particularly the statement about being glad they decided to take science subjects in Year 13. Fthose who were considering a double degree, or pursuing another area with a possible science component, or those who were not sure yet – the associations between responses were not as clear-cut.
Concluding comment
orientations towards secondary subject choice in relation to science. The “serious science” and “business/science” clusters of students tended to emphasise science ahigh-priority choice, were less likely to have ever considered dropping science, and had less strong tendencies towards non-science subjects. Conversely, students in the “keeping options open” clusters indicated a tendency to choose a wide range of subjects, to be less powerfully drawn to science as a top choice, and to have favosubjects in other areas.
11 As already noted in Section 3, 4 percent of students did not plan to study in the next year or two.
Ministry of Research, Science and Technology – Te Manatū Pūtaiao | Staying in Science 2 42
Both the survey data and the focus group data provide insights into potential influences that lead to these differences in students’ attitudes towards continuing to choose and prioritise science. These factors are interrelated in complex ways. What is most interesting is how they relate to each individual student’s particular context, experiences, goals, and personality. The focus group comments show the important influence of families – both in encouraging the choice of science, discussing possible career pathways that require science, and in the provision of role models for such careers. Students from high decile schools were more likely to say they were interested in science even before they started high school. Comments such as that made by the student who read his father’s science magazines suggest that this might be related to family experiences. Collating “agree” and “strongly agree” survey responses showed that families were likely to be as influential as teachers in encouraging the choice to continue with science. As Section 5 will show, this family influence continues and may even strengthen in the transition to tertiary education. In Section 6 we will return to the policy questions this raises. Schools can make a difference. Their influence is complex, appears to involve a number of factors, and to impact differently on different students. In Section 3 we saw that some students were continuing with sciences even though they did not enjoy them. The focus group comments in this section illuminate the strategic thinking that perpetuates this situation. It is food for thought that the students’ comments make links between not liking a science and not being “good” at it, or perceiving it as “hard”. Despite thinking they had done well in sciences in the past, around half the survey students did not see this as the case for their Year 13 science study, and their impressions of their success in mathematics were likely to be more positive. In the past, science, like mathematics, was often seen as a “gatekeeper” discipline to be used to determine eligibility of “bright” students for further study. While there clearly is considerable intellectual effort required for the mastery of science disciplines, it seems worth debating how productive it is to discourage students so early in their learning lives. On the positive side, more students disagreed than agreed that “you have to be bright to study science” – a statement that reflects a gatekeeper orientation to the discipline. Another 39 percent of the sample expressed no view on this statement and possibly could be influenced either way by their ongoing learning experiences. There are indications in both focus group and survey responses that some students are learning sciences in ways that do not hold their interest, or help them make connections to science at work in the world. For example, just 58 percent of surveyed students said it was important, or very important, to know about science in their daily lives and 30 percent agreed or strongly agreed that their classes were often taught in a boring way. Using science for making better “real world” decisions is a commonly given rationale for making science compulsory in the school curriculum up until the end of Year 10, at which point some students will drop science. Commentary in the science education literature often suggests that they do so because they fail to see these connections. (For a frequently quoted discussion see Millar and Osborne (1998).) But the perceptions reported here are those of students who have chosen voluntarily to continue with sciences. The strategic importance of sciences, so clearly stated by several focus group students, explains why students may persevere with studies that do not engage them, but obviously cannot address the issue of lost opportunities for other students who have been put off, or who have lacked strategic family advice. Might this be one dynamic underpinning the low uptake of Year 13 sciences in the low decile schools, reported in Section 3? Another important lost opportunity may be that when students do not connect their science learning to real life, they are less likely to make
Ministry of Research, Science and Technology – Te Manatū Pūtaiao | Staying in Science 2 43
connections that could raise their awareness of potential career prospects. Thus the interest and relevance of science, as taught at school, seems an important education issue to tackle. There were some clear relationships between students’ intention to continue with science at tertiary level and their views about science and reasons for choosing Year 13 science. The strongest split was evident between students who thought science would be the main thing they would study at tertiary level, and those who thought they would definitely not include science in their tertiary studies. Unsurprisingly, those who intended to continue tended to have positive views about science, came from homes where science study was encouraged, and thought science was a worthwhile career to pursue, while those who did not were more likely to disagree with these statements. The large group of students in between these two extremes had a much more variable range of views and ideas. These “undecided” students may be the best targets for policy initiatives designed to encourage continuing participation in tertiary science. The next section will further discuss students’ views and decisions regarding tertiary science study, and their relationship to these different secondary subject-choice orientations.
Ministry of Research, Science and Technology – Te Manatū Pūtaiao | Staying in Science 2 44
5. Influences on tertiary decisions
This section looks at how students make decisions about tertiary study. As in Section 4, it begins by reporting aspects of the focus group discussions. These highlight the numerous and complex influences on students’ decision making. The survey data that follows provides a quantitative picture of these influences, presented as five themes:
• finding out about tertiary study options
• helping with making decisions
• choosing where to study
• struggling with decision making, and
• feeling confident about decision making and its outcomes. The section concludes with further comments from the focus groups. These present a deeper account of how confusion, indecision, and change play a part in moving towards tertiary study. Throughout the section we pay particular attention to the ways that preferences towards science, at both school and tertiary levels, relate to influences on, and experiences of, decision-making.
Influences on plans for tertiary study In the focus groups we asked students to tell us about the biggest influences on their plans for study, and what kinds of information or advice had been useful in making decisions about tertiary studies. In most cases their responses were complex, featuring influences related to a mixture of personal interest and experience, family and friends, school, and tertiary institutions.
Personal interest and experience
Focus group participants talked about how they were attracted towards particular study possibilities because they were “interested” in them.
It comes down to interest. These two [students] like animals so [they want to be] vets; I like sports so [I want to do] PE. (Male, School 4)
Interest often appeared to be related to students’ learning experiences and knowledge of science subjects and of related careers. For example, some students said that doing well in a school subject encouraged them to think about how they could continue with it, or something similar, at university. On the other hand some students felt that they or others discontinued science when moving into tertiary because it was “too hard”.
I think what initially puts people off is [that] sciences are quite demanding. They require quite a lot of in-depth reading and trying to understand things. I did accounting last year and it was quite straightforward, as opposed to physics. (Female, School 1)
It’s also hard because if you don’t understand one aspect of science it affects a lot of the others, because they are so interlocked. Like, you can’t have chemistry without physics. (Female, School 1)
Ministry of Research, Science and Technology – Te Manatū Pūtaiao | Staying in Science 2 45
HavinenvirTheir knowledge (or lack of knowledge) about what courses and jobs were available to
o science
try researchers because we don’t know what they really do. They seem to
For so n and w
d of money. (Female, School 3)
t
nd stuff. So you
Anoth ents were ld be able to get into a course or get through to ompletion. Science options, in particular, were seen as a hard route, particularly
ff a little bit.
you
urself
and
s
Certa
I also think the inequality between sexes, like it’s quite a male area. I don’t know if oing into engineering.
g work experience in an area, or exposure to subjects in the university onment, could either encourage or discourage students from an interest area.
them was obviously a guiding influence, and was often discussed in relation toptions.
It’s what we know about – doctors and teachers – because we see them, and about what we see on TV. We know it’s real and what it involves. We don’t know about chemisjust sit in a lab. (Female, School 5)
I’ve kind of been forced there [doctor] by myself because I don’t really know about the alternatives. (Male, School 2)
I think a lot of us don’t see a career in [science] – e.g. other than engineer, doctor – there’s not a lot of career options we know about. (Female, School 1)
me students or their parents, there was a tension between following a passioanting to earn good money.
Like, at first your parents might think ‘oh my God, you’re not going to make any money in that subject’, but later on they see how passionate you are about it, so they look more at passion, instea
How about finance, like with me I have a low-income background. And you don’want to just go to something and just splash out and work for three years and get a massive-as student loan, and on top of that you’re trying to work awant to do something that is affordable to pay off quickly so you can get on with your life. (Female, School 3)
er disincentive to following an interest area into university arose when studnot confident that they wou
cbecause of their limited entry requirements at different levels. This was considered oneof the biggest barriers to carrying on with science at tertiary level.
Science it seems more hard to get into – entry requirements. [Does that have an influence?] Yes, like vet course gets cut down from 400+ to 75 after the first semester. [It is the] same with health sciences. Sort of scares you o[But you’re still wanting to do it, why is that?] Determination – that’s what I want to do. If you didn’t have your mind set on it so much, like ‘I want to be a vet’, might go do the other one because it’s easier. (Group discussion, School 4)
The same goes for doctors, the cut is just so high. Like I know someone whose son went off to be a doctor and he was 2 points below the cut. It doesn’t mean he couldn’t be a good doctor. But it puts you off. Why would you want to set youp to fail? Especially when it is so expensive. It’s so long and your debt just goes on and on. There’s no pulling factors. You want to do something for a reason if there’s other reasons that you’re also interested in, and you’re making your choice, then you wouldn’t [choose science]. There are so many negative factors about taking science I think. (Female, School 1)
Yeah I was going to be a vet and it put me off too. Like my sister’s friend who wareally smart, like so much smarter than me, didn’t even make the cut. So I just put that completely behind me. (Female, School 1)
in science courses were also seen as intimidating:
that puts people off or not but I was kind of sceptical g(Female, School 1)
Ministry of Research, Science and Technology – Te Manatū Pūtaiao | Staying in Science 2 46
How
Most d the role that members of their family have played in their decision making about tertiary study. Some families were more directive than others.
o to university, or into a particular area, because a
Otheroffering advice or encouragement in a particular direction.
Mum has been keen on me doing science since I was born. She always gave me lots
edicine, because he says
During one focus group, the participants discussed the important role that family had for thhat w eturn for the sacrifices
y or a Māori family, it’s
Some lso discussed the negative side of their family’s encouragement. They said that the pressure to succeed could be daunting, and that the concept of “success”
high expectations of us. They’re like ‘oh well, go to
t have to be a doctor or a lawyer to really be
Some eir decisischoo
ey
and not have any friends go with you. (Female, School 3)
family and friends feature
students mentione
Some students were influenced to gparent or family member had gone to university, or worked in that or a similar field.
They went to university, and it was always a given that I’d be going to university, somehow. (Male, School 2)
My sister did the same subjects as well. (Female, School 5)
students’ families were more involved in helping them to make a decision by
of science books etc. (Male, School 5)
My dad is supportive. He has encouraged me into taking myou can go in all sorts of directions with it. (Male, School 5)
em as Māori and Pacific young people. They spoke of the importance of success ould make their family proud. This was seen as a fair rt
made in enabling them to receive a good education. They also talked about the importance of being a role model for younger siblings, or following in the footsteps of successful older siblings. One student pointed out that his father had a degree and good job, but even so had encouraged him to aim further.
The most Tongan one I’d say, the biggest influence would be the need for success in life. So then you should know that the first step is to go to uni. (Female, School 3)
Like when you go to uni, if you come from an Island famillike you’re doing something for your family to put yourself out there. (Female, School 3)
To represent yourself, and your family, and your culture. (Female, School 3)
students a
could be narrow, or unrealistic.
If you did badly, I’d just feel so stink. They’d say I worked so hard and look what you gave me. (Male, School 3)
Some of our parents have toouni’ and they think that maybe doctors and lawyers are the only top professions. Even my mum, she wants me to be a doctor. They don’t realise that even going to uni is a profession itself. Like you don’up there. [Why do you think they pick those?] It’s stereotyped. (Female, School 3)
students discussed the role that friends or contemporaries had played in thons about tertiary study. They talked about what their older friends or past l leavers had gone on to do. Awareness of these experiences allowed them to
know more about a university or particular course. Some mentioned that they wanted to go to a university where they would have friends, whereas others suggested that thwould be comfortable in making new friends.
Friends are a major part – like you wouldn’t want to go to university by yourself
Ministry of Research, Science and Technology – Te Manatū Pūtaiao | Staying in Science 2 47
One role of secondary education is to prepare students for further study and emplo s had influen classes, presentations, and
that they had attended within their school. Some students also mentioned bject teachers had influenced their decision making, particularly if they had
nd if they
or
Students distinguished etween helpful and not helpful advice and practices. Overall, the quality and
.
us because we’ve had her in 3rd form, 4th form, etc. (Group discussion, School 4)
Self-a ative, were respo
a bit of initiative and ask them, it seems that they come to you when new stuff arrives. But if you don’t put much effort in, well they won’t, which is fair
peared to vary widely in the ways ers. The o ptions, and w ents held different opinions and understandings of the
peration and usefulness of careers advice within the same school.
with post-school ork or study. The school careers adviser had been in contact with the students since
Year 9, and had built up a good relationship with most students. She knew the required to attend an interview with her
Schools
yment. Focus group participants discussed ways in which careers adviserced their decisions about university, and spoke of the
activities that their sumade a subject more interesting, expected and supported high achievement, ahad a good knowledge of tertiary options related to the subject. Careers advisers were seen to help students in two ways. They could provide advice fmaking decisions about tertiary study, based on students’ interests and achievement at secondary school. Alternatively they could give advice for choosing secondary subject options, based on intended tertiary study or career preferences. bfrequency of the student’s relationship with the careers adviser was seen to be important.
[The careers adviser] tries to get through to everybody, schedule time with all the 7th formers. She writes in her little book where you’re wanting to go to, and she checks in with you again to see whether you’re still going for the same directionsShe teaches the careers course, and she teaches other courses as well. Like, she knows
wareness about interests and preferences, as well as a level of personal initiseen to be necessary for decision making, although some saw this to be a nsibility the careers advisers should also take up.
If you take
enough. (Male, School 4) Overall, the five schools involved in the focus groups ap
they supported their students to make decisions about tertiary study and careverall picture we report next is based on the focus group students’ percee note that different stud
o
School 4: active personal guidance
Students at School 4 were generally positive about careers support in the school. The one student who was less so did not know where she wanted to headw
students’ interests. All students had beenbetween Year 12 and 13, to reflect on their marks and subject preferences as they selected their Year 13 courses and identified potential directions for tertiary. Students had attended a careers course, which was run at some stage prior to Year 13.

Ministry of Research, Science and Technology – Te Manatū Pūtaiao | Staying in Science 2 48
School 3: guidance as gatekeeping
Students in this school were less positive, with some explicitly negative about the careers support they had experienced. The school careers adviser’s roles were seen to be informing students of prerequisites for entrance into desired tertiary options and gatekeeping by telling students whether or not they had a chance at getting a scholarship. A mentoring programme between tertiary advisers and Year 12 students was seen as helpful, but students did not perceive that this was directly relevant to the sort of decision making for tertiary that was most important in Year 13.
School 5: presenting options
In this school, the careers adviser was perceived to be mainly focused on organising university visits to the school, and on passing on information booklets from tertiary institutions. Some students felt that these actions were most helpful for people who already knew what they wanted to do. They varied between those who felt careers information had been “forced” on them since Year 9 and those who thought they had not been supported to think about careers until Year 13, when it was “too late”.
Schools 1 and 2: missed opportunities
In School 2 there was a generally negative feeling and a perception that there had not been a focus on careers until the end of secondary school. Students mostly mentioned visits from university liaison staff. They had attended a careers rotation class in a previous year, although few considered it helpful and many were disappointed that the computers were always down when they were supposed to be doing a careers quest exercise. Some students commented that they did not know about the range of options open to high-achieving science students, other than medicine. The focus group was held in the careers room, which displayed a range of information booklets. Students in School 1 were also fairly negative about the careers advice they had received. An area in the school was set up for careers support, in addition to health and wellbeing services. However, the students felt that external visits to the school, particularly from ex-students who had gone on to university, were generally more helpful than the careers adviser. The school ran a work experience day, but many students felt that the options were not clearly relevant to their employment preferences.
Tertiary institutions
Most science students felt it was a given that they would go on to further study. Although some discussed taking a year out, in order to gain some life or travel experience and decide what they wanted to do, tertiary qualifications were generally seen as necessary for securing decent employment.
That’s the bad thing about sciences, if you were a receptionist or whatever you could just go get a job, but with sciences you have to have a degree. (Female, School 4)
Students in an all-female focus group, held at a co-educational school in a rural area, perceived that males had access to trades oriented work immediately out of school, whereas girls needed a degree.
Ministry of Research, Science and Technology – Te Manatū Pūtaiao | Staying in Science 2 49
Like we could go farming or plumbing or something, but 90 percent of the time if you put your name in against a guy’s, he’ll get picked above you. If I could get a job that I liked without going to uni I would, but I can’t, so I have to go to uni. [It would have to be] a job that paid well. And that’s pretty much the apprenticeships that we don’t get. (Group discussion, School 4)
Tertiary institutions featured both passively and actively in decision making. Institutions have a passive influence via the options they are seen to offer, and the match between these options and the individual student’s perceived needs for study and wider life. A range of such passive university-specific factors were discussed when participants recounted what had influenced their thinking about what and where to study. The value of the course or university was considered important. For example, some argued that a BSc had a higher value than a BA in terms of career prospects and future earnings.
You want to know, if you do a degree, that someone with a higher degree isn’t going to come along and take the job ... You want to know how your degree rates against other people’s. I don’t know how you find that stuff out. (Female, School 4)
Obviously, some courses are only offered by particular institutions, which has an ultimate influence over where students intend to study.
Next year I want to do speech and language therapy – which is actually a BSc even though it doesn’t sound like it would be ... You can only do it at Canterbury. You can do it at other places but the qualifications aren’t recognised by the association, so it’s kind of dumb. (Female, School 1)
On the other hand, for some students the location of the institution was their first consideration.
I also want to know what different unis have as courses. For example, I was looking at doing speech therapy but you can only do it at Auckland or Massey, and I don’t want to leave. It’s cheaper for me to live at home. (Female, School 4)
Some universities were also seen to have a more inviting culture than others. Institutions have an active influence when they assist students in making a decision. Focus group participants discussed a range of activities run, and information produced by, tertiary institutions. The next table shows some of the factors discussed as helpful or not helpful. We note that not all students would necessarily agree with all the points raised by other students.
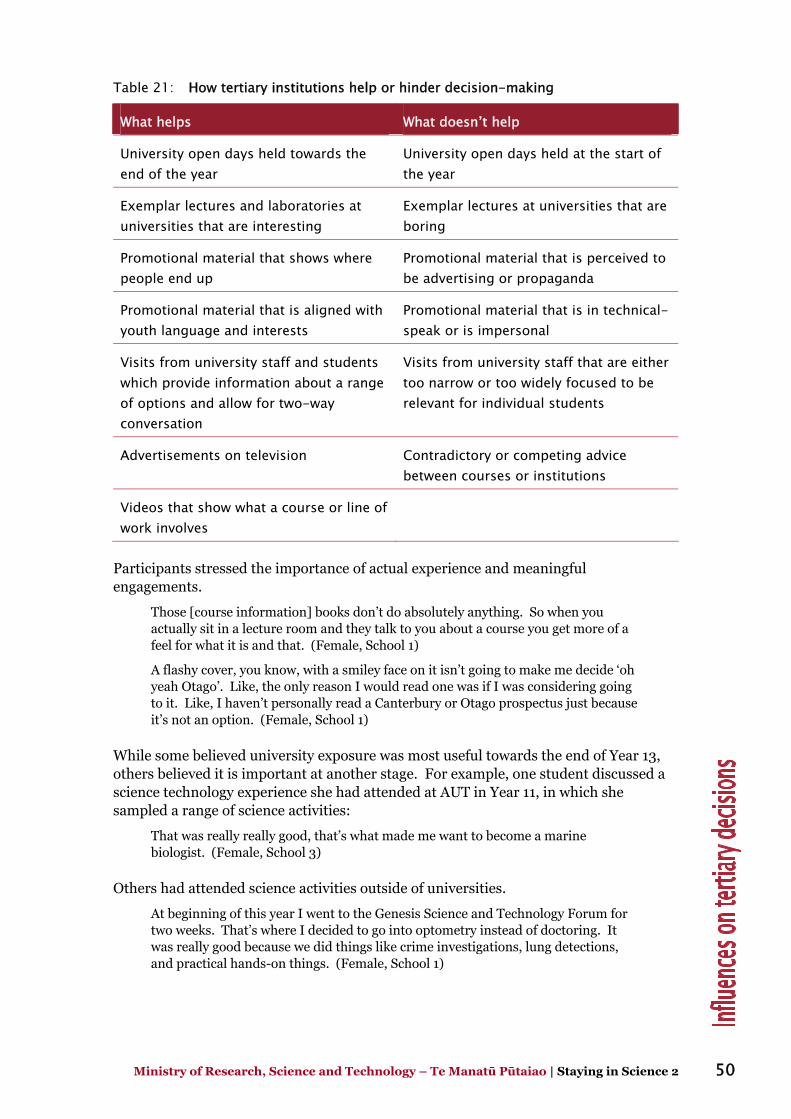
Ministry of Research, Science and Technology – Te Manatū Pūtaiao | Staying in Science 2 50
Table 21: How tertiary institutions help or hinder decision-making
What helps What doesn’t help
University open days held towards the end of the year
University open days held at the start of the year
Exemplar lectures and laboratories at universities that are interesting
Exemplar lectures at universities that are boring
Promotional material that shows where people end up
Promotional material that is perceived to be advertising or propaganda
Promotional material that is aligned with youth language and interests
Promotional material that is in technical-speak or is impersonal
Visits from university staff and students which provide information about a range of options and allow for two-way conversation
Visits from university staff that are either too narrow or too widely focused to be relevant for individual students
Advertisements on television Contradictory or competing advice between courses or institutions
Videos that show what a course or line of work involves
Participants stressed the importance of actual experience and meaningful engagements.
Those [course information] books don’t do absolutely anything. So when you actually sit in a lecture room and they talk to you about a course you get more of a feel for what it is and that. (Female, School 1)
A flashy cover, you know, with a smiley face on it isn’t going to make me decide ‘oh yeah Otago’. Like, the only reason I would read one was if I was considering going to it. Like, I haven’t personally read a Canterbury or Otago prospectus just because it’s not an option. (Female, School 1)
While some believed university exposure was most useful towards the end of Year 13, others believed it is important at another stage. For example, one student discussed a science technology experience she had attended at AUT in Year 11, in which she sampled a range of science activities:
That was really really good, that’s what made me want to become a marine biologist. (Female, School 3)
Others had attended science activities outside of universities.
At beginning of this year I went to the Genesis Science and Technology Forum for two weeks. That’s where I decided to go into optometry instead of doctoring. It was really good because we did things like crime investigations, lung detections, and practical hands-on things. (Female, School 1)
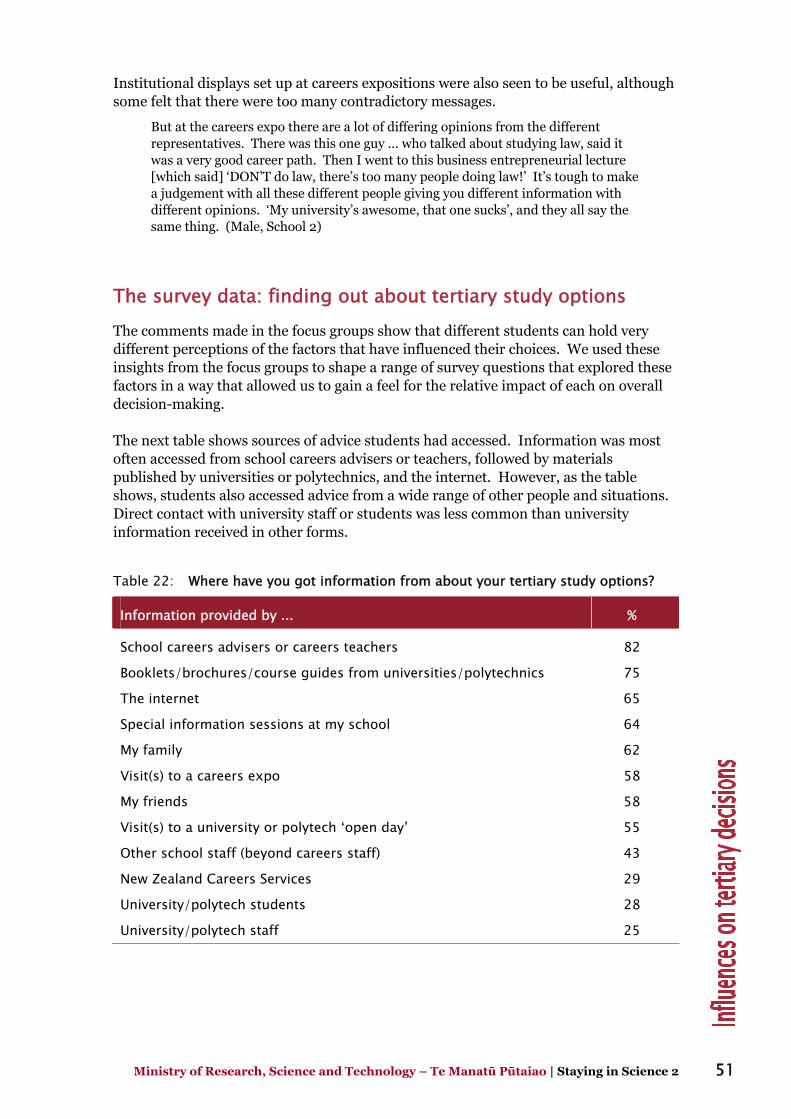
Ministry of Research, Science and Technology – Te Manatū Pūtaiao | Staying in Science 2 51
Institutional displays set up at careers expositions were also seen to be useful, although some felt that there were too many contradictory messages.
But at the careers expo there are a lot of differing opinions from the different representatives. There was this one guy ... who talked about studying law, said it was a very good career path. Then I went to this business entrepreneurial lecture [which said] ‘DON’T do law, there’s too many people doing law!’ It’s tough to make a judgement with all these different people giving you different information with different opinions. ‘My university’s awesome, that one sucks’, and they all say the same thing. (Male, School 2)
The survey data: finding out about tertiary study options The comments made in the focus groups show that different students can hold very different perceptions of the factors that have influenced their choices. We used these insights from the focus groups to shape a range of survey questions that explored these factors in a way that allowed us to gain a feel for the relative impact of each on overall decision-making. The next table shows sources of advice students had accessed. Information was most often accessed from school careers advisers or teachers, followed by materials published by universities or polytechnics, and the internet. However, as the table shows, students also accessed advice from a wide range of other people and situations. Direct contact with university staff or students was less common than university information received in other forms.
Table 22: Where have you got information from about your tertiary study options?
Information provided by ... %
School careers advisers or careers teachers 82
Booklets/brochures/course guides from universities/polytechnics 75
The internet 65
Special information sessions at my school 64
My family 62
Visit(s) to a careers expo 58
My friends 58
Visit(s) to a university or polytech ‘open day’ 55
Other school staff (beyond careers staff) 43
New Zealand Careers Services 29
University/polytech students 28
University/polytech staff 25
Ministry of Research, Science and Technology – Te Manatū Pūtaiao | Staying in Science 2 52
Students could choose multiple options and many did so, indicating that they had accessed a number of types of information and advice. A small number indicated they had accessed information from three or fewer sources (14 percent). More commonly, students indicated they had accessed between four and six (36 percent) or between seven and nine (33 percent) sources of information. Some had accessed 10 or more sources (16 percent).
Gender associations
There was a gender effect across 7 of the 12 sources of information. Males were more likely than females to indicate that they gained information from their family and friends, whereas females were more likely to gain information from school careers advisers, special information sessions at school, careers expos, tertiary publications, tertiary staff, and the Careers Service. These disparities suggest that males tend to rely more on informal sources of information, whereas females access more formal sources. While these findings do indicate that gender plays a part in the sources of information that students use, we note that the differences in some categories were intertwined with school characteristics. For example, it was the girls in the low decile schools who were less likely to get information from their families, while there was no decile effect for boys. The same pattern appeared in regard to sourcing information from friends. There was a gender difference for sourcing information from careers teachers. However this was even more difficult to tease out, being bound up with school size and location. Although, overall, girls are more likely to source information from a careers adviser, the preponderance of girls in suburban and town schools in the overall sample may have contributed to this result.
Other associations
Beyond gender effects, we also found that information gained from visits to careers expos was more common for students in low decile schools, suburban and town schools, and smaller schools, all of which are interrelated. We found a tendency for students from schools outside the main urban centres to be more likely to say they had gained information from sources that did not include their family and friends. This result was statistically significant for 4 of the 12 options (careers advisers, tertiary publications, careers expos, and tertiary students). Looking at information sources by cluster group (see Section 3) students in Clusters 1 and 2 (where girls predominated) were more likely to say they had accessed information from visits to a university or polytechnic open day than students in the “science/business” and “science taster” groups (where boys predominated). This finding is consistent with the association between girls and visits to university science labs reported in Section 3.
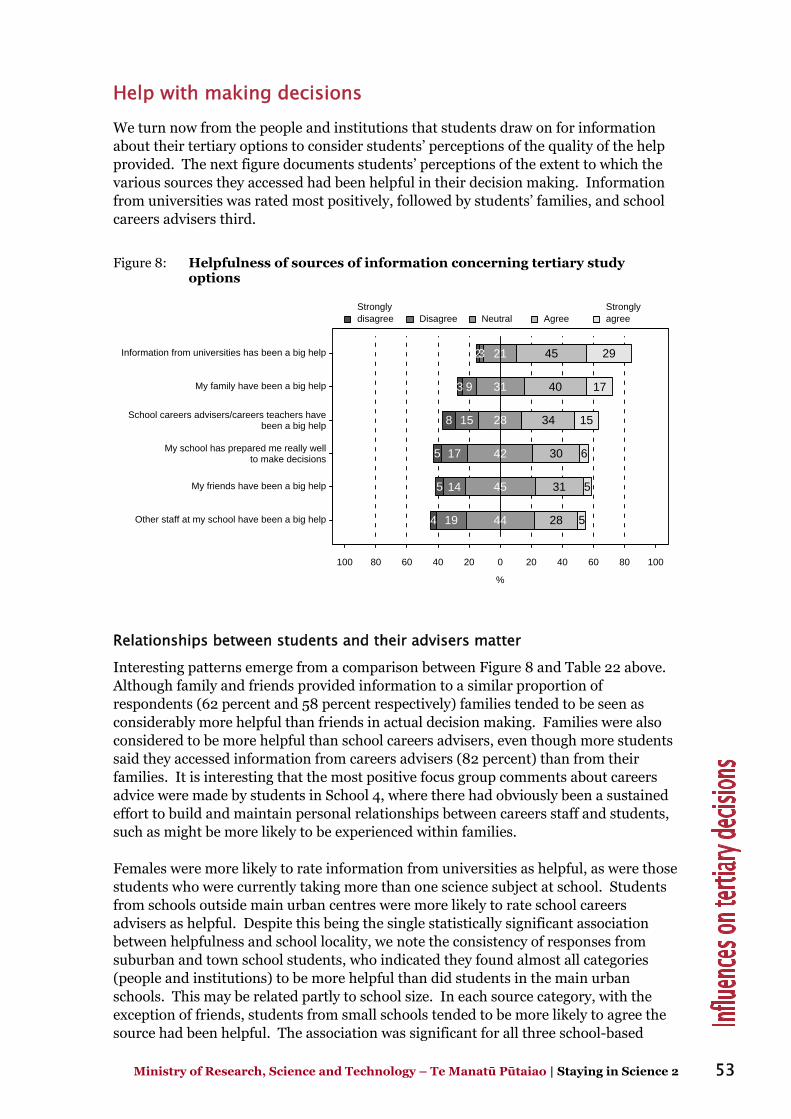
Ministry of Research, Science and Technology – Te Manatū Pūtaiao | Staying in Science 2 53
Help with making decisions We turn now from the people and institutions that students draw on for information about their tertiary options to consider students’ perceptions of the quality of the help provided. The next figure documents students’ perceptions of the extent to which the various sources they accessed had been helpful in their decision making. Information from universities was rated most positively, followed by students’ families, and school careers advisers third.
Figure 8: Helpfulness of sources of information concerning tertiary study options
%
100 80 60 40 20 0 20 40 60 80 100
Information from universities has been a big help
My family have been a big help
School careers advisers/careers teachers havebeen a big help
My school has prepared me really wellto make decisions
My friends have been a big help
Other staff at my school have been a big help
2
3
8
5
5
4
3
9
15
17
14
19
21
31
28
42
45
44
45
40
34
30
31
28
29
17
15
6
5
5
Stronglydisagree Disagree Neutral Agree
Stronglyagree
Relationships between students and their advisers matter
Interesting patterns emerge from a comparison between Figure 8 and Table 22 above. Although family and friends provided information to a similar proportion of respondents (62 percent and 58 percent respectively) families tended to be seen as considerably more helpful than friends in actual decision making. Families were also considered to be more helpful than school careers advisers, even though more students said they accessed information from careers advisers (82 percent) than from their families. It is interesting that the most positive focus group comments about careers advice were made by students in School 4, where there had obviously been a sustained effort to build and maintain personal relationships between careers staff and students, such as might be more likely to be experienced within families. Females were more likely to rate information from universities as helpful, as were those students who were currently taking more than one science subject at school. Students from schools outside main urban centres were more likely to rate school careers advisers as helpful. Despite this being the single statistically significant association between helpfulness and school locality, we note the consistency of responses from suburban and town school students, who indicated they found almost all categories (people and institutions) to be more helpful than did students in the main urban schools. This may be related partly to school size. In each source category, with the exception of friends, students from small schools tended to be more likely to agree the source had been helpful. The association was significant for all three school-based
Ministry of Research, Science and Technology – Te Manatū Pūtaiao | Staying in Science 2 54
sources (careers advisers, other school staff, and school in general). Consistent with this association between perceptions of “helpfulness” and smaller schools, we found that students from secondary schools that started at Year 7 instead of Year 9 were more likely to agree that their schools had prepared them well, and that school staff beyond careers teachers had been helpful. In the light of other findings reported above, it seems likely that the calibre of personal relationships built and maintained with each school’s advisers could explain these patterns.
Certainty influences perceptions of helpfulness
Students who knew exactly what they wanted to study had found careers advisers, other school staff, school in general, and information from universities, to be more helpful than those who were not sure. Students who knew the general area for their tertiary study, or expected to try a few areas and decide after the first year, occupied the middle ground, with the former more likely to agree that sources had been helpful than the latter. We also considered whether perceptions of helpfulness were associated with the extent to which science featured in tertiary study plans. The clearest pattern was that the stronger the intention to study science at tertiary, the more likely students were to agree that their families had been a big help. Other indicative associations did not map quite as tidily onto the science to non-science gradient. More students who intended to incorporate some level of science in their tertiary study found information from universities to be a big help (80 percent), compared to students who did not intend to incorporate science (65 percent), or who were unsure about what they would study (51 percent). Those who intended to do a double degree were the most likely of all to say that information from universities had been a big help. There was a similar pattern, albeit with lower levels of responses, for perceptions of the helpfulness of advice from schools. Whereas almost half (47 percent) of respondents who intended to study mainly science at tertiary level agreed that their careers advisers had been a big help, less than 20 percent of respondents in all the other tertiary study combinations agreed. Students who intended to mainly study science were also more likely to think that their school had prepared them well to make a decision about tertiary study (43 percent agreed) compared to those who intended to do predominantly non-science or no science (35 percent agreed). Students who either expected to do a double degree or major (including some science) and those who were unsure about what to study were least likely to say that their schools had prepared them well for making decisions (25 percent).
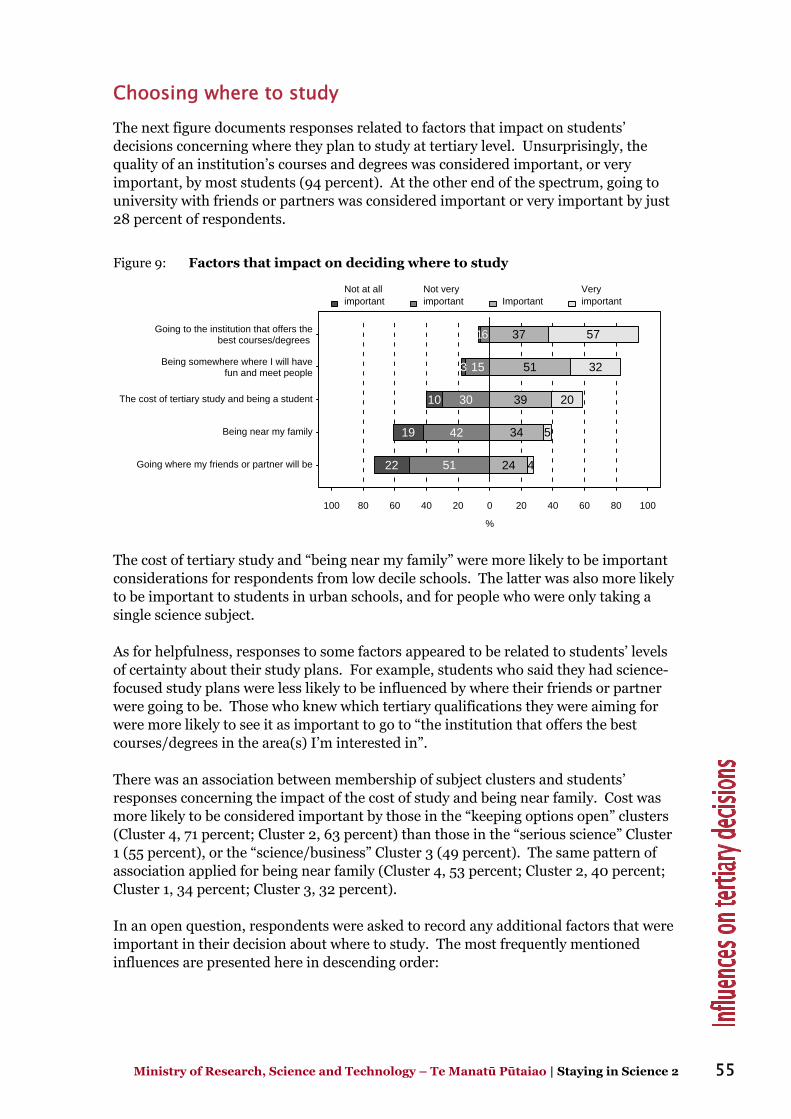
Ministry of Research, Science and Technology – Te Manatū Pūtaiao | Staying in Science 2 55
Choosing where to study The next figure documents responses related to factors that impact on students’ decisions concerning where they plan to study at tertiary level. Unsurprisingly, the quality of an institution’s courses and degrees was considered important, or very important, by most students (94 percent). At the other end of the spectrum, going to university with friends or partners was considered important or very important by just 28 percent of respondents.
Figure 9: Factors that impact on deciding where to study
%
100 80 60 40 20 0 20 40 60 80 100
Going to the institution that offers thebest courses/degrees
Being somewhere where I will havefun and meet people
The cost of tertiary study and being a student
Being near my family
Going where my friends or partner will be
1
3
10
19
22
6
15
30
42
51
37
51
39
34
24
57
32
20
5
4
Not at allimportant
Not veryimportant Important
Veryimportant
The cost of tertiary study and “being near my family” were more likely to be important considerations for respondents from low decile schools. The latter was also more likely to be important to students in urban schools, and for people who were only taking a single science subject. As for helpfulness, responses to some factors appeared to be related to students’ levels of certainty about their study plans. For example, students who said they had science-focused study plans were less likely to be influenced by where their friends or partner were going to be. Those who knew which tertiary qualifications they were aiming for were more likely to see it as important to go to “the institution that offers the best courses/degrees in the area(s) I’m interested in”. There was an association between membership of subject clusters and students’ responses concerning the impact of the cost of study and being near family. Cost was more likely to be considered important by those in the “keeping options open” clusters (Cluster 4, 71 percent; Cluster 2, 63 percent) than those in the “serious science” Cluster 1 (55 percent), or the “science/business” Cluster 3 (49 percent). The same pattern of association applied for being near family (Cluster 4, 53 percent; Cluster 2, 40 percent; Cluster 1, 34 percent; Cluster 3, 32 percent). In an open question, respondents were asked to record any additional factors that were important in their decision about where to study. The most frequently mentioned influences are presented here in descending order:
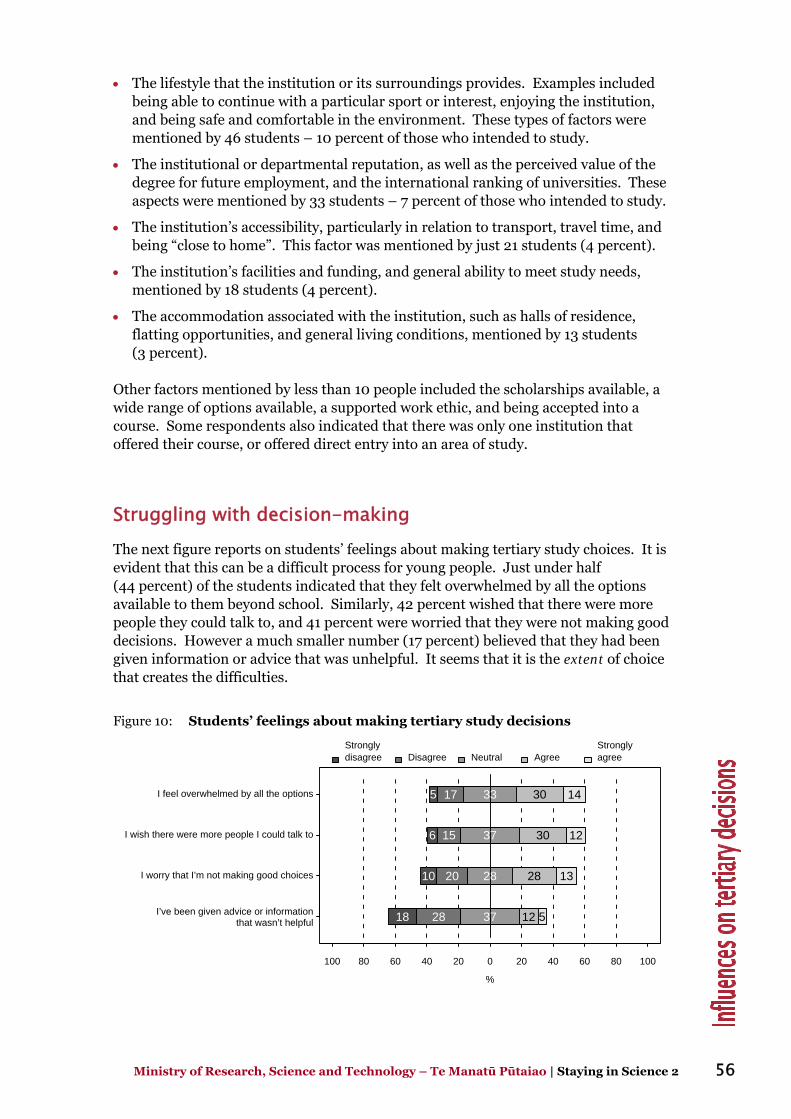
Ministry of Research, Science and Technology – Te Manatū Pūtaiao | Staying in Science 2 56
• The lifestyle that the institution or its surroundings provides. Examples included being able to continue with a particular sport or interest, enjoying the institution, and being safe and comfortable in the environment. These types of factors were mentioned by 46 students – 10 percent of those who intended to study.
• The institutional or departmental reputation, as well as the perceived value of the degree for future employment, and the international ranking of universities. These aspects were mentioned by 33 students – 7 percent of those who intended to study.
• The institution’s accessibility, particularly in relation to transport, travel time, and being “close to home”. This factor was mentioned by just 21 students (4 percent).
• The institution’s facilities and funding, and general ability to meet study needs, mentioned by 18 students (4 percent).
• The accommodation associated with the institution, such as halls of residence, flatting opportunities, and general living conditions, mentioned by 13 students (3 percent).
Other factors mentioned by less than 10 people included the scholarships available, a wide range of options available, a supported work ethic, and being accepted into a course. Some respondents also indicated that there was only one institution that offered their course, or offered direct entry into an area of study.
Struggling with decision-making The next figure reports on students’ feelings about making tertiary study choices. It is evident that this can be a difficult process for young people. Just under half (44 percent) of the students indicated that they felt overwhelmed by all the options available to them beyond school. Similarly, 42 percent wished that there were more people they could talk to, and 41 percent were worried that they were not making good decisions. However a much smaller number (17 percent) believed that they had been given information or advice that was unhelpful. It seems that it is the extent of choice that creates the difficulties.
Figure 10: Students’ feelings about making tertiary study decisions
%
100 80 60 40 20 0 20 40 60 80 100
I feel overwhelmed by all the options
I wish there were more people I could talk to
I worry that I’m not making good choices
I’ve been given advice or informationthat wasn’t helpful
5
6
10
18
17
15
20
28
33
37
28
37
30
30
28
12
14
12
13
5
Stronglydisagree Disagree Neutral Agree
Stronglyagree
Ministry of Research, Science and Technology – Te Manatū Pūtaiao | Staying in Science 2 57
There was strong consistency amongst the responses made. Students who agreed with one statement were more likely to agree with most of the other statements and vice versa. For example, there was a linear relationship between a wish that there were more people to talk to, and each of the other three categories, which demonstrates that people who feel less sure about their current and future choices are more likely to want additional support. In view of this, it is not surprising that feeling overwhelmed was related to perceptions that students had lacked good advice. We considered associations between the statements in Figure 10 and those in Figure 8 above (perceptions of helpfulness). We found that each area of “struggle” was negatively associated with at least two of the six “help” statements. Although not true for all cross-tabulations, the overall pattern suggests that students who struggled with decision making had not experienced as much helpful support from people or institutions as students who did not struggle. Females were more likely than males to be concerned that they were not making good decisions about tertiary study and there were indications that they were also more likely to feel overwhelmed by tertiary options.
Uncertainty and struggle
We have already reported that students who were uncertain about their study plans were more likely to perceive that the advice they had received was not helpful. Uncertainty also seems to be linked to negative feelings about decision making. For example, we found an association between agreement with the statement “I’ve tried to choose a wide range of [school] subjects, to keep my options open” and feelings of being overwhelmed by all the tertiary options available. Students who thought that making science a top choice was either “a lot like me” or “totally unlike me” were more likely to know exactly what kind of tertiary degree or diploma they wanted to do. Both groups were less likely to be concerned that they were making a poor choice than students who gave more equivocal responses. Students who had sometimes considering dropping science entirely were more likely to be worried than all other students. A similar pattern was found when the “top choices” statement was cross-tabulated with responses concerning how sure respondents were about the type of tertiary study they wanted to do. Overall, these findings build a picture that suggests students who struggle with subject choice decisions at secondary level may be more likely to struggle with decision making about tertiary education. This seems to be particularly so for those science students who do not have a clear orientation towards science, and those who choose subjects to keep a range of pathways open. These young people appear to be in the greatest need of support in making good tertiary choices, and yet are perhaps the least well-equipped for processing information presented to them. This was echoed in the stories shared by focus group participants, which suggested that a level of interest and initiative is necessary for making decisions about tertiary education, as well as for making sense of the advice and information provided by other people and institutions.

Ministry of Research, Science and Technology – Te Manatū Pūtaiao | Staying in Science 2 58
Feeling confident about decision making and its outcomes Figure 11 illustrates students’ perceptions of their levels of confidence across a range of activities, which are either part of the tertiary decision-making process, or a result of the decision made. Despite the struggle expressed in the previous section, 81 percent of students were confident that they could find courses that relate to their interests, and 71 percent were confident that they could find out about interest-related job(s). They were, however, less confident that they could actually make the best decisions for their futures (61 percent), or that they could handle the workload of university (55 percent).
Figure 11: Confidence in relation to managing a range of decisions and outcomes
%
100 80 60 40 20 0 20 40 60 80 100
Find tertiary courses that relate to my interests
Find out about job(s) that relate to my interests
Pass my first year of tertiary studies
Set goals and work towards them
Get the kind of job I want
Develop a good CV
Make the best decisions for my future
Handle the workload of university study
0
1
1
2
2
1
2
1
4
8
6
7
9
11
9
12
15
21
25
25
27
25
29
32
56
48
49
52
47
46
45
47
25
23
20
15
16
17
16
8
Veryunconfident Unconfident Neutral Confident
Veryconfident
While students seemed to be somewhat more confident about their ability to take action than the feelings responses reported in Figure 10 above would predict, there was a degree of consistency in the two sets of responses. Response patterns for each of the four “struggle” statements were associated with the response patterns for at least three of the “confidence” categories. For example, lower confidence in all the above categories, with the exception of setting goals, was associated with a greater wish to have more people to talk to. As might be predicted from the responses reported thus far, across six of the eight statements, respondents who knew exactly what they wanted to study were most likely to be confident about their decision making. Students who were not sure what to study were likely to be the least confident, with those who knew the general area, and those who expected to try a few areas before deciding occupying the middle ground. Students in the “serious science” and “science/business” clusters were more confident in their ability to pass the first year of their tertiary studies than those in the “keeping options open” clusters. Students who intended to specialise in tertiary science, or integrate it with something else, had the highest level of confidence in finding an interest-related tertiary qualification (85 percent), while students who did not intend to combine science with other subjects were slightly less confident (79 percent). As might be anticipated, those who were not sure what to do were the least confident (58 percent). The same overall pattern was evident for confidence to handle the workload of university, and confidence to pass the first year of studies.
Ministry of Research, Science and Technology – Te Manatū Pūtaiao | Staying in Science 2 59
The higher the student’s school decile, the more likely they were to be confident that they would pass the first year of their tertiary studies. Students in low decile schools were less likely to be confident in their ability to set goals and work towards them. Students from schools outside of main urban areas were more likely to be confident that they could find out about tertiary courses that related to their interests.
Confusion, indecision, and change We asked students in several of the focus groups to respond to the suggestion that “young people have so much information and choice about tertiary study options that it can be confusing”. Some individuals believed this to be the case.
I’ve been to the careers lady and she gave me all this stuff but I still can’t decide what I want. (Female, School 4)
Yeah there is so much to choose from at university, like all the specialised courses you can do, it’s just too hard to choose. (Male, School 2)
If there are two fields you want to go into but they interlink [specifically computers and engineering] then there’s so many options you can do. (Male, School 2)
It’s tough to make a judgement with all these different people giving you different information with different opinions. (Male, School 2)
Others did not believe the information was confusing, and some suggested that they would like to know more, particularly outside of the more obvious options.
If I had known there were more options than being a doctor, I would have chosen a wider range of subjects. (Male, School 2)
I don’t even know if I could name 10 degrees to be honest. (Female, School 1) Some students pointed out that there can be a difference between feeling overwhelmed by “options” presented and feeling overwhelmed by making a “decision” (both of which are inherent in the word “choice”). Some saw knowledge about a greater range of options as important, even if it became more confusing to choose one. In a similar vein interviewees were cognisant that the flipside of selecting school or tertiary subjects that keep options open is that it is harder to decide once it comes to the crunch.
We don’t really know what to expect. Social science is a really open kind of degree, you can do geography, human, psychology, political, there’s heaps. It doesn’t take you in one set direction. (Female, School 4)
Students also varied in how comfortable they were with not being able to decide on what qualifications or careers they wanted. Some saw school as the place to decide what you are aiming for, whereas others thought it was better (or at least possible) to decide on final qualifications or career goals once already at university. Some students believed that their career interests would emerge from their chosen area of tertiary study, whereas others had selected their area of study in order to reach preset career goals. Those who supported emerging choices explained that it was not possible to know all the jobs that a general qualification, such as a BSc could lead to, before beginning it.
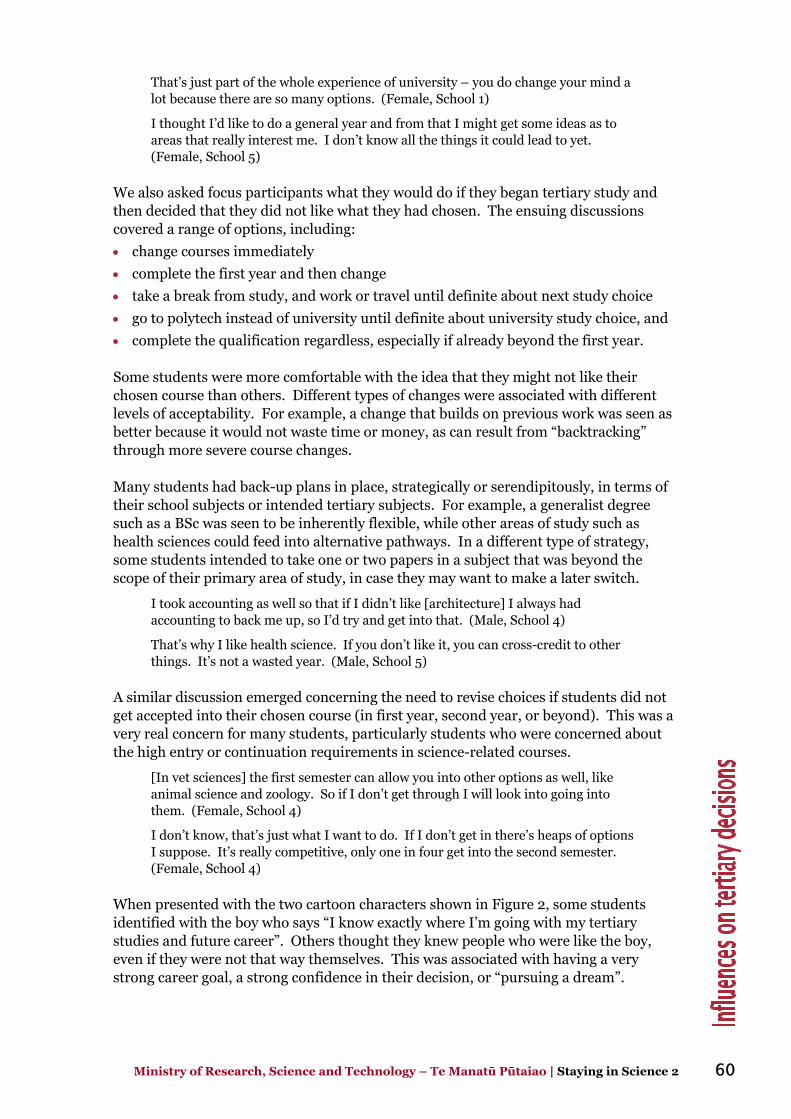
Ministry of Research, Science and Technology – Te Manatū Pūtaiao | Staying in Science 2 60
That’s just part of the whole experience of university – you do change your mind a lot because there are so many options. (Female, School 1)
I thought I’d like to do a general year and from that I might get some ideas as to areas that really interest me. I don’t know all the things it could lead to yet. (Female, School 5)
We also asked focus participants what they would do if they began tertiary study and then decided that they did not like what they had chosen. The ensuing discussions covered a range of options, including:
• change courses immediately
• complete the first year and then change
• take a break from study, and work or travel until definite about next study choice
• go to polytech instead of university until definite about university study choice, and
• complete the qualification regardless, especially if already beyond the first year. Some students were more comfortable with the idea that they might not like their chosen course than others. Different types of changes were associated with different levels of acceptability. For example, a change that builds on previous work was seen as better because it would not waste time or money, as can result from “backtracking” through more severe course changes. Many students had back-up plans in place, strategically or serendipitously, in terms of their school subjects or intended tertiary subjects. For example, a generalist degree such as a BSc was seen to be inherently flexible, while other areas of study such as health sciences could feed into alternative pathways. In a different type of strategy, some students intended to take one or two papers in a subject that was beyond the scope of their primary area of study, in case they may want to make a later switch.
I took accounting as well so that if I didn’t like [architecture] I always had accounting to back me up, so I’d try and get into that. (Male, School 4)
That’s why I like health science. If you don’t like it, you can cross-credit to other things. It’s not a wasted year. (Male, School 5)
A similar discussion emerged concerning the need to revise choices if students did not get accepted into their chosen course (in first year, second year, or beyond). This was a very real concern for many students, particularly students who were concerned about the high entry or continuation requirements in science-related courses.
[In vet sciences] the first semester can allow you into other options as well, like animal science and zoology. So if I don’t get through I will look into going into them. (Female, School 4)
I don’t know, that’s just what I want to do. If I don’t get in there’s heaps of options I suppose. It’s really competitive, only one in four get into the second semester. (Female, School 4)
When presented with the two cartoon characters shown in Figure 2, some students identified with the boy who says “I know exactly where I’m going with my tertiary studies and future career”. Others thought they knew people who were like the boy, even if they were not that way themselves. This was associated with having a very strong career goal, a strong confidence in their decision, or “pursuing a dream”.
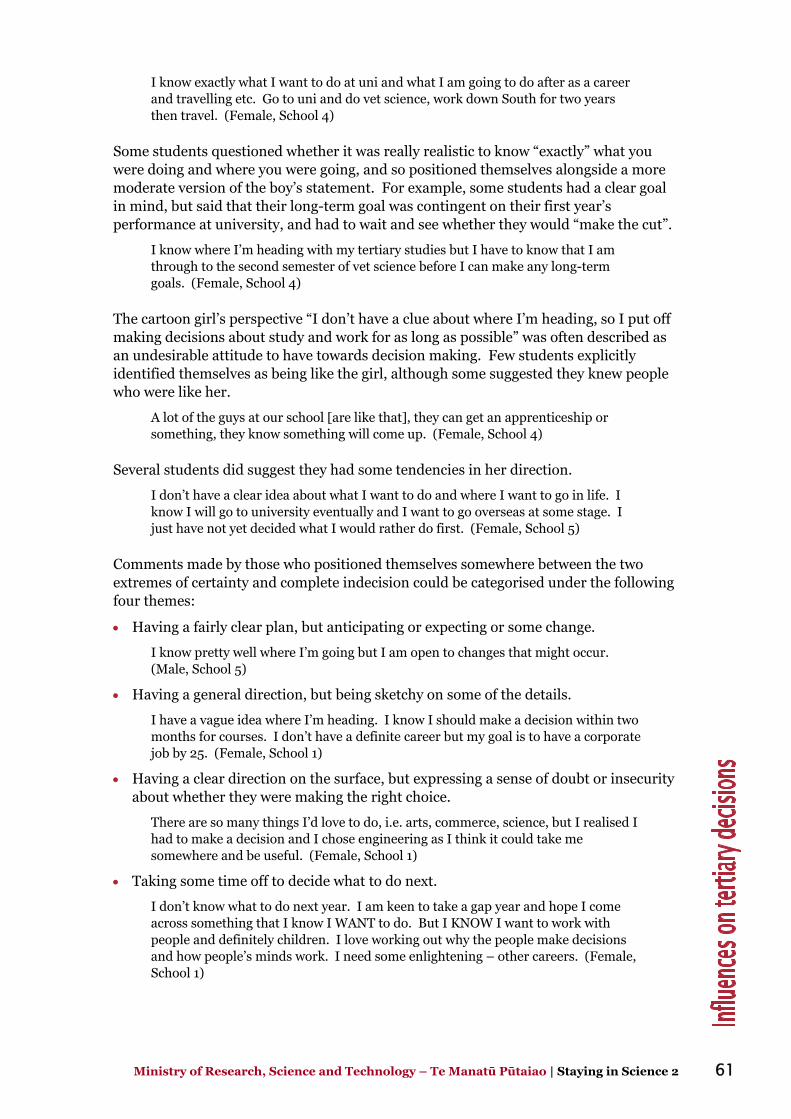
Ministry of Research, Science and Technology – Te Manatū Pūtaiao | Staying in Science 2 61
I know exactly what I want to do at uni and what I am going to do after as a career and travelling etc. Go to uni and do vet science, work down South for two years then travel. (Female, School 4)
Some students questioned whether it was really realistic to know “exactly” what you were doing and where you were going, and so positioned themselves alongside a more moderate version of the boy’s statement. For example, some students had a clear goal in mind, but said that their long-term goal was contingent on their first year’s performance at university, and had to wait and see whether they would “make the cut”.
I know where I’m heading with my tertiary studies but I have to know that I am through to the second semester of vet science before I can make any long-term goals. (Female, School 4)
The cartoon girl’s perspective “I don’t have a clue about where I’m heading, so I put off making decisions about study and work for as long as possible” was often described as an undesirable attitude to have towards decision making. Few students explicitly identified themselves as being like the girl, although some suggested they knew people who were like her.
A lot of the guys at our school [are like that], they can get an apprenticeship or something, they know something will come up. (Female, School 4)
Several students did suggest they had some tendencies in her direction.
I don’t have a clear idea about what I want to do and where I want to go in life. I know I will go to university eventually and I want to go overseas at some stage. I just have not yet decided what I would rather do first. (Female, School 5)
Comments made by those who positioned themselves somewhere between the two extremes of certainty and complete indecision could be categorised under the following four themes:
• Having a fairly clear plan, but anticipating or expecting or some change.
I know pretty well where I’m going but I am open to changes that might occur. (Male, School 5)
• Having a general direction, but being sketchy on some of the details.
I have a vague idea where I’m heading. I know I should make a decision within two months for courses. I don’t have a definite career but my goal is to have a corporate job by 25. (Female, School 1)
• Having a clear direction on the surface, but expressing a sense of doubt or insecurity about whether they were making the right choice.
There are so many things I’d love to do, i.e. arts, commerce, science, but I realised I had to make a decision and I chose engineering as I think it could take me somewhere and be useful. (Female, School 1)
• Taking some time off to decide what to do next.
I don’t know what to do next year. I am keen to take a gap year and hope I come across something that I know I WANT to do. But I KNOW I want to work with people and definitely children. I love working out why the people make decisions and how people’s minds work. I need some enlightening – other careers. (Female, School 1)
Ministry of Research, Science and Technology – Te Manatū Pūtaiao | Staying in Science 2 62
Concluding comment Both the focus group comments and the survey data suggest that many Year 13 students struggle with tertiary decision making in a variety of ways. It is food for thought that nearly half the survey respondents felt overwhelmed by all the options available. Yet the comments made by the focus group students suggest that more, not less, knowledge of the variety of science-related careers may be needed. If the students who are interested in science, and who have demonstrated success in its study, are only aware of a narrow range of relatively traditional science-related careers, opportunities to make best use of their talents may be being missed. Focus group comments, such as that reported in this section about becoming a doctor because it seemed the only option, align with the analysis of the survey students’ subject choices and intended study plans, as presented in Section 3. Would the focus group student who made this comment have been a Cluster 1 “serious science” student as a survey respondent? If it is accepted that more information about the variety of science-related careers that are potentially available is needed, then it is also clear that not just any information will do. For the survey students, school careers advisers and university publications were the most commonly accessed sources of information about tertiary study options. Yet the survey also showed that the most accessible sources of information were not necessarily considered the most helpful sources. Just one-third of the survey respondents agreed that “my school has prepared me really well to make decisions” and the focus group students’ comments suggest at least some level of disaffection with the careers advice in all but one of the schools. In fairness to these schools this may relate more to feelings of being overwhelmed and uncertain, as also reported above for the survey respondents, than to lack of good intent and effort on the part of the careers advisers. Nevertheless, the students’ perceptions are what matter here and there is clearly work to be done in better supporting students as they struggle to make study- and career-related decisions on transition to tertiary institutions. This begs the question of what changes in practice could be made by schools and those who support schools in providing timely and up-to-date careers and study advice. Both the focus group comments and the survey data suggest the quality of students’ relationships with those who advise them is important. In contrast to the situation for schools, nearly as many students said their family had been a big help (57 percent) as said they had accessed help from the family (62 percent). (The equivalent data for schools are 49 percent seen as helpful compared to 82 percent who accessed school advice.) This may well be related to the closer relationships in families but adds another dimension to the challenges raised here. Who does, or ought to, have a role in helping families keep up-to-date with careers and study information? What do schools do already (assuming they do address this question)? What more, if anything, could they do? Who else should support them, or perhaps also take up this challenge? The cluster analysis in Section 3 suggested that a one-size-fits-all approach would not meet the information and decision making needs of the wide variety of students who took part in the survey because their learning goals and interests can be quite different. The gender differences in survey responses reported here reinforce and add another dimension to this assertion. We found that females tended to be more likely to worry about their choices. However they were also more likely to have sourced information about tertiary options from more formal sources such as schools and universities, and to have found this helpful. Males were more likely to have relied on informal

Ministry of Research, Science and Technology – Te Manatū Pūtaiao | Staying in Science 2 63
information from family and friends, which returns us to the challenges raised in the previous paragraph. Schools also do not meet a one-size-fits-all model. It was not easy to disentangle gender differences and school effects, and in particular school size. It seems that students in smaller schools, which tend to be outside the main urban areas, are more likely to find support from careers advisers helpful. This could relate to the ease with which more personal relationships can potentially be established in smaller institutions. The relationship between being clear about choices and directions and feeling confident about decision making for the transition to tertiary study also poses tricky issues of balance. Year 13 students who tried to keep their options open, or who were unsure about continuing in science, were more likely to say they struggled to make good choices, and to have found various information sources unhelpful in that struggle. Students who were more certain that they would study science (and those who were equally certain they would not) did not seem to be assailed with the same level of anxiety. What may develop seems like a chicken-and-egg scenario, whereby students who are the least clear about their preferences and options are less likely to find different sources of information helpful, and are less confident in their ability to make good decisions. Yet the focus group conversations illustrated ways that some types and levels of indecision and change can be seen as positive, so long as they do not involve backtracking. Many students had backups in place in case they did not succeed or enjoy their first choice. Some intended to go into a course that allowed them to refocus or swap in their second year. Again the challenge is to help students work with uncertainty in fluid study situations, without allowing that uncertainty to swamp them in doubts and sap their self-confidence. Making the most of advice and making sense of options is partly dependent on students having at least some preferences in the first place – this begs the question, what support can be given to those who do not have guiding interests or a clear orientation to science? Self-confidence issues do not stop with the making of choices about study directions. Just as students who intended to incorporate science in their tertiary study had higher levels of confidence about their decision making, they were also more likely to be confident that they could handle the workload of tertiary learning and be successful in their first year. It is food for thought that students from low decile schools were less likely to be confident about the likelihood of academic success at tertiary, particularly in view of their low participation rates in school science, reported in Section 3. If New Zealand wishes to draw on the differing perspectives of scientists from a wide range of backgrounds, this issue would benefit from further investigation.
Ministry of Research, Science and Technology – Te Manatū Pūtaiao | Staying in Science 2 64
6. Reflecting on the research findings
This report identifies and discusses the many interwoven factors that impact on students’ decision making with regard to the ongoing study of sciences, both in the final year of secondary school, and on transition to tertiary level studies. It addresses two closely related key questions:
• Why do students choose to continue with sciences in Year 13 of their school studies?
• Why do students plan to take up (or not take up) sciences in their tertiary level studies?
As we have seen, there is no one answer to either of these questions. On the whole, the same types of factors impact on both sets of decisions, with some changes in the sources of advice students might access as they transition to tertiary studies. Students’ choices relate to their personal interests and decision-making orientations, their family background, their learning experiences – both curricular and extracurricular – and the school they attend. The information they have been able to access concerning tertiary study and careers also has an influence. This appears to have begun, for at least some students, much earlier than Year 13. Other students are still very undecided at the stage of leaving school. These findings are specifically related to the New Zealand context, but confirm and expand on the research literature considered in the background paper (Hipkins and Bolstad, 2005). This section highlights key findings from the empirical phases of the research, and suggests policy implications for MoRST’s consideration.
Who chooses to continue with science? A cluster analysis revealed patterns in subjects that students were likely to combine with their Year 13 science(s). We subsequently used the four cluster groups to test for differences in associations with other variables, in this way building a profile of three broad orientations towards choosing to continue with sciences at the tertiary level, or not.
Ministry of Research, Science and Technology – Te Manatū Pūtaiao | Staying in Science 2 65
The “serious science” students
One-third of the surveyed Year 13 students formed a cluster we called the “serious science” students. All of them were studying at least one science subject in Year 13 and had a committed intention to study science at university. They tended to be taking more than one traditional science subject, and at least one mathematics subject in their final year of school. As suggested by other research (Lyons, 2004) their interest in science was likely to have been influenced by their family background and experiences beyond school. While there were more females than males in the “serious science” cluster, the gender differences were not as pronounced as for the other three clusters we found. Other significant associations suggest that these students may hold reasonably conservative views of the types of careers in which they could expect to use their science talents, for example medical or veterinary science careers. Awareness of restricted entry hurdles, at various points on such study pathways, may make this seem a daunting prospect for less determined students. Comments made in the focus groups suggest students who are intent on a career in a competitive, high profile area may be following a long held dream, or they may be simply unaware of the wide range of other career areas for which science is a prerequisite.
The “science/business” students
The inclusion of economics, accounting, and ICT/computer studies in the survey’s list of subjects taken allowed us to identify the types of potential science and business associations that were the focus of the recent Business of Science careers initiative. The cluster analysis did indeed identify a group of students who were likely to combine such interests, and they comprised just under a quarter of the students in the sample. This was the cluster with the strongest gender imbalance – these students were much more likely to be males. The science and mathematics subjects they had chosen in Year 13 tended to be those favoured by males, in particular physics and calculus, and they were likely to combine these with some form of computer science/ICT as well as the business-oriented subjects. They were more equivocal about their interest in science than the “serious science” students, and were less likely to see science as a worthwhile career to pursue. The predominance of males suggests, however, particular challenges for reaching this group with an initiative such as the Business of Science. We found that overall the male students surveyed were less likely than the female students to go about accessing study and careers information in an organised way from formal sources, but were more likely than females to access information from family and friends. This is a challenge to which we will return shortly.
The “keeping options open” students
An important finding is that just under half (44 percent) of all the students surveyed belonged to one of two clusters characterised by taking a more “mixed bag” of subjects that included some science, and a seemingly greater level of indecision about future study plans. They were likely to be less confident of their academic ability in sciences, and were more likely to be taking subjects beyond the three traditional disciplines, for example agriculture, horticulture, earth science, or science as an integrated subject. These might be combined with biology in the female-dominated Cluster 2, or with business subjects/ESOL in the male-dominated Cluster 4. These students were less likely to be enjoying their science learning and they were also less likely to be encouraged to persevere with science studies by their families. Many of them seemed

Ministry of Research, Science and Technology – Te Manatū Pūtaiao | Staying in Science 2 66
poised to drop sciences on transition to tertiary, despite the fact that a number of them agreed that science may be needed for their future career plans. Such profiles suggest different sorts of strategies may be needed to help students in these clusters, who comprised a substantial proportion of the cohort we sampled, if they are to see ongoing potential in study and careers underpinned by the sciences.
Policy questions that arise from the cluster group findings
Given the differences we found, between students, is it appropriate to seek to target specific groups with tailor-made approaches? If so, what might these solutions be? Identification of such students may be an issue. (For example, we found that students in the focus groups who were less sure about their tertiary options and preferences were less vocal.) Also, given the relationship between orientation to choosing sciences and home and family background, should school and/or other providers of science learning try to boost science experiences for those without science-rich family backgrounds? One recent example was the Closing the Equity Gaps in Science initiative that involved a successful partnership between several science staff at the University of Auckland, along with selected student mentors, and the teachers and students at a low decile Auckland school (Boyd et al, 2005). While focus group students from this school did not necessarily see these experiences as relevant to their tertiary decision making, such effects would be hard to disentangle from the many other considerations that influence their decisions. On a cautionary note, the Business of Science initiative showed that it is not easy to identify the “right” target audience for a particular campaign (Bolstad, 2003). This suggests a need to get to know different students and their particular goals, interests, and aspirations, in order to match these up to the range of options, especially options they might not necessarily be aware of already. As the focus group component of the research showed, it is possible for careers advisers to establish strong individual relationships with students, and where this happens these relationships are valued. But this does not appear to be common. The survey data suggested such relationships were more easily achieved in smaller schools. MoRST could consider both school-based and other ways to support the provision of advice that is oriented to students’ personal profiles and interests, and to their family contexts.
What should guide subject choices? There is an interesting tension between choosing to study subjects that provide immediate learning experiences that are interesting and motivating and making strategic choices with some future goal in mind. The survey data revealed that a number of these Year 13 students were taking sciences under sufferance, not enjoying their study, and not feeling successful, yet persevering, presumably because they perceived an actual or potential need for that subject in the future. NZCER’s Learning Curves research showed that both “enjoyment” and “future plans” influenced students’ decisions to study Year 11 and Year 12 sciences to a similar extent, and more than other factors such as the influence of other people and expectations of gaining easy NCEA credits (Hipkins et al, 2004). This finding also matches Lyons’ (2004) findings about strategic subject choices made by Australian science students.
Ministry of Research, Science and Technology – Te Manatū Pūtaiao | Staying in Science 2 67
While “pathways”-type arguments might persuade students to stick with sciences in the short term, we wonder about the invisible costs of negative learning experiences. What opportunities are missed when students soldier on with learning that fails to engage them, simply because they have some longer-term goal in mind? It may be of course that some students work their way through these challenges to greater success. Or it may be that they carry a negative, and possibly narrow, view of the science they have experienced into their adult lives, never again to consider their potential to contribute in that area. And as we have already seen, they may simply miss opportunities to widen their science interests and career horizons. When completing this analysis, we found it helpful to discuss ways the two decision-making approaches align with different management perspectives. Focusing on clearly identified and specific future goals aligns with “managerialist” models of decision making, with underpinning assumptions about a predictable linear relationship between actions taken and future outputs or products. From this perspective, advice and support efforts should be directed to the clarification of goals and the establishment of appropriate pathways to reach identified study and career targets. It is food for thought that the responsibility of goal-oriented decision making rests with individual students, who will bear the blame if they make poor choices. (And they will certainly be the ones to suffer the financial consequences of any less fruitful study.) By contrast, focusing on the quality of immediate experiences, or inputs, aligns with “complexity” or “systems” models of decision making, which carry underpinning assumptions about the emergent and unpredictable quality of future actions and situations. From this perspective, advice and support should focus on enhancing the quality of students’ learning experiences now, and broadening their horizons so that potential avenues of work and study do not become closed to them. For example the curriculum could be widened to situate more of the students’ learning experiences in contexts that provide them with realistic insights into sciences at work in the world, and hence into potential future pathways. Thus the responsibility to ensure students make good decisions can be seen as distributed, with adults playing a greater, even if sometimes indirect, role in ensuring that students have positive experiences that lead to productive choices. It seems to us that school career guidance and teaching practices have traditionally been focused on the managerialist model. Although it is certainly the case that many teachers will encourage students to follow their passion, in other research we have found that the deans (who tend to be responsible for subject choice guidance) are more likely to do so at Year 11. Their advice becomes more career-focused as students near the end of secondary school (Hipkins et al, 2004). They are a group whose influence should not be overlooked. We have already asked to what cost the outputs model is employed. Now a different question arises. What would support for a more systems-oriented approach to advice provision look like? Would there be benefits in exploring this question further, particularly in view of the rapidly changing nature of fields of science study and the emphasis on interdisciplinary research that is not (and possibly cannot be) modelled in the way the science curriculum is currently managed at school level? We see this as an emergent area of policy interest.
Ministry of Research, Science and Technology – Te Manatū Pūtaiao | Staying in Science 2 68
Curriculum and other educational issues While curriculum questions might be seen as the primary responsibility of the Ministry of Education rather than MoRST, we next discuss issues that we think bear wider scrutiny, including the involvement of the science sector.
A “relevant” curriculum
The surprising number of students taking science subjects that they didn’t like raised curriculum questions. Some focus group students talked about discovering an interest or talent in a science during secondary school, while others spoke of frustration, not understanding, getting poor marks, and then dropping some subjects. Would things have worked out differently for many of the disaffected students if they’d had a different experience with these subjects? How might curriculum be changed to better reflect the realities of science in the real world, or the kinds of science students might encounter at tertiary level? Could a more “relevant” curriculum engage students’ interest in areas they might otherwise stop taking? The background paper reached the conclusion that such change could help (Hipkins and Bolstad, 2005) and our findings here endorse the argument in the New Zealand context. There is a temptation with findings such as these to blame teachers. Why are they not doing a better job of interesting and motivating students? But this is a narrow and superficial response. The science education literature emphasises the dilemmas that are perpetuated by science’s traditional role, along with mathematics, as a “gatekeeper” subject, used to determine “intelligence” and ration entry to high status university courses. (For comment on the implications of this see Gilbert, 2001.) So long as secondary school teachers are expected to sort students like this, they must continue to provide learning experiences that some will find too hard or too abstract. (We note in passing that “difficulty” is not an objective measure, and often benefits those whose worldviews, experiences, and culture align with dominant sectors in society.) Not to sort students in this way is to risk being accused of “dumbing down” or “lowering standards” or other such criticism. This highlights the role that the wider community plays in the perpetuation of traditional approaches to curriculum and learning. The corollary is that the key members of that community must also understand and support the reasons for any changes of approach to science teaching and curriculum, if these are to be sustainable (Hipkins, Barker and Bolstad, 2005). As we further discuss below, this also raises questions for how parents are supported to constructively advise their children as they make decisions about subjects and potential careers. We want to be clear that we are not arguing for an easier learning pathway through the sciences, but rather for one that today’s students see as relevant, dynamic, and worthy of their intellectual effort. Making science more “relevant” does not mean removing important abstract concepts and ideas. Instead they are located more deeply in the acts of knowledge-building that characterise working science. It seems to us that future-focused writing about what students should learn about science as a knowledge system demands more rather than less of teachers and students (see, for example, Gilbert, 2001). However, teachers would need considerable support to change their practice to take this “nature of science” approach, as recommended in the science education literature (Hipkins, et al, 2005; Millar and Osborne, 1998). There are implications for scientists and policy makers here, because science teachers cannot construct such a
Ministry of Research, Science and Technology – Te Manatū Pūtaiao | Staying in Science 2 69
curriculum without knowledge of rich contemporary examples of science in the making that they have been given the resources to explore.
Mathematics and science
The survey responses raised, but could not answer, some interesting questions about the close interrelationship between mathematics and science subjects in the senior secondary school. Facility in mathematics is important for students with a serious intention to continue in the sciences (Fullarton et al, 2003) yet only 64 percent of students were taking some form of Year 13 mathematics (calculus, 43 percent, statistics, 58 percent, with 39 percent of these students taking both). Focus group responses suggested that the more mathematical aspects of chemistry and physics were linked with perceptions that these subjects were too hard. Yet many of the survey students were more confident of their mathematics ability than of their learning success in the sciences, and we are not sure why this might be so. We could speculate that students who struggle with mathematics in earlier years do not even consider carrying on with sciences if these are seen as even harder. If this is so, then in what ways might lack of success in mathematics in earlier years limit the range of students who carry on with sciences at Years 12 and 13? We think this question bears further investigation. Focus group comments suggested that biology could be chosen in the expectation that it will be less mathematical, and some students linked this with a facility in text-based communication. These twin assumptions need to be challenged. Many fields of biological research do require a good grasp of mathematics. And good communication skills are just as important for those working in the physical sciences as in the biological sciences (Yore, Hand and Florence, 2004). Because females in the survey took both biology and English in greater numbers, we could infer that they would be more likely to hold such views. Does this matter, and if so, what further issues are raised? We return to gender differences shortly. Finally in this subsection we note that the introduction of more meaningful “real life” contexts into the science curriculum, as suggested by the preceding discussion, would likely demand that students master a range of mathematical aspects of areas of contemporary research. From a policy perspective, all these aspects serve as reminders that learning in mathematics should be considered as part of any new initiatives, not just learning in the sciences, but also that it is the contextual and practical side of mathematics that many students may find of most benefit.
Gender patterns in participation in the sciences
While survey responses were somewhat weighted towards males, we suspect this was a sampling quirk. Overall it does seem that historical gender imbalances in the uptake of sciences have been ameliorated in terms of participation numbers overall. We note that females were more likely than males to say their learning experiences at school had increased their interest in science. This could be interpreted as an encouraging sign that gender equity programmes, so popular in the 1980s and early 1990s, have borne fruit. This is clearly a success to be applauded. Nevertheless, we have some reservations.
Ministry of Research, Science and Technology – Te Manatū Pūtaiao | Staying in Science 2 70
We found the same gender imbalances in uptake of biology (favoured by females) and physics (favoured by males) as reported in the background paper (Hipkins and Bolstad, 2005). Females are participating selectively and many of them seem to be avoiding “hard” (i.e. more mathematical) aspects of science. It is worth noting here that calculus was favoured by males, and that many of those taking calculus were also taking mathematics with statistics. The implications of these gender imbalances seem worthy of further discussion. In a future-focused discussion of the implications of knowledge era changes in society, Gilbert (2005) suggests that the recent success of female students in forging increased access to “high status” career fields such as veterinary and medical science may be illusory. More adventurous male students, she suggests, have vacated these fields to chase the greater rewards to be found in entrepreneurial and cutting edge areas of knowledge development, including in the ICT field. The traditional high status fields, with their emphasis on learning large volumes of information in a demanding and developmentally structured “knowledge apprenticeship”, carry little appeal for them now because they are no longer the most high status or financially rewarding occupations. Is this what we were seeing in the attitudes of the science/business students (mainly male, as Gilbert would predict) who were clearly science-able but tended not to see it as a worthwhile career area to pursue? If so, what might need to change to encourage at least some of these students to stay with sciences? The discussion thus far suggests there should be both curriculum and advisory aspects to any policy developed in this area.
Ethnicity, SES, and equity
The low participation rates of Māori and Pacific Islands students in senior secondary sciences are a cause for concern. We have already reported that this pattern appears to be associated with another concerning trend we found – much lower rates of participation in senior sciences in the low decile schools nationally. In the background paper we noted:
... there is still a great deal we don’t yet know about students’ decision making in relation to science study. That contextual factors such as family background have an impact seems clear, but these are not New Zealand studies and we have yet to find out whether SES effects, and the role of parental support, are as evident in this country (Hipkins and Bolstad, 2005, p.40).
We can now say that SES effects are evident, but what is causing them remains an open question. The effects are likely to be multiple and interacting. Perhaps, reflecting the “cultural capital” aspects of choosing sciences, as discussed in the background paper, students in high decile schools were more likely to say they had been interested in science before beginning secondary school. The comments of the focus group students illustrate why this might be so. Students in the high decile schools spoke of science-rich home experiences and parental encouragement. Those in the decile 1 school spoke of equally high, but perhaps unrealistic and traditionally focused, family expectations. As we have seen, many parents actively help students imagine future possible worlds. Since these are obviously bounded by the limits of their own experiences, we must now ask what can be done to better support families to support their young people.
Ministry of Research, Science and Technology – Te Manatū Pūtaiao | Staying in Science 2 71
This survey does not allow us to say what role schools may play in facilitating the different levels of by-decile participation in the sciences, as revealed by our analysis of the national data. Do most students in low decile schools not see these subjects as relevant? Does the “gatekeeping” role of these subjects successfully shut them out by drawing on cultural capital many of them are less likely to possess? Are these students experiencing a different quality of science teaching? There is some indirect evidence to support the latter hypothesis. A recent national survey of secondary schools found that decile 9 and 10 schools were less likely to have difficulty in getting suitable mathematics and science teachers (Hipkins and Hodgen, 2004). Another recent study investigated teacher mobility in New Zealand. The research found that, in times of overall teacher shortage, teachers tend to move from low to high decile schools, leaving low decile schools to recruit from whatever sources they can. These circumstances can result in disproportionate numbers of overseas-trained, beginning, and older returning teachers on the staff of low decile schools (Ritchie, 2004). Together these findings suggest teaching issues may contribute to the low uptake of sciences in low decile schools. Another recent New Zealand project examined the transition and decision making support given to students in seven “innovative” low-decile schools (Boyd and McDowall, 2004). It highlighted the importance of careers teachers and subject teachers working together whilst also building quality student–teacher relationships. The most useful support was tailored to individuals and incorporated hands-on experiences, people-based information sources, and life coaching. The latter gave students the support and skills they needed to make sense of information and make decisions. The schools facilitated careers exploration in a “low-stakes environment”, which was otherwise not necessarily accessible by students’ or their families in low-income communities. If it is seen as important that the scientists working in New Zealand reflect the full range of cultural interests and concerns of the people that reside here, participation of students from Māori and Pacific cultures, and students from low decile schools, is an area in urgent need of more research, with an intention to inform effective interventions.
Ministry of Research, Science and Technology – Te Manatū Pūtaiao | Staying in Science 2 72
Advisory issues The final section of the report outlines issues for providing sound advice to students, particularly on transition to tertiary studies.
The “keeping options open” students
The students in Clusters 2 and 4 pose some interesting policy challenges. We think it is important not to see the desire to keep options open as a negative characteristic, always in need of “fixing up” with better and more timely advice. From a systems perspective, it could be seen as a good thing that these students keep many options in play, open to opportunities that may arise in the future. However, complex systems theory also emphasises the importance of quality and diversity of inputs (see, for example, Davis and Sumara (2005)). How do we keep these students engaged and interested in a range of sciences, including those they currently see as “too hard”, in the absence of a definite career-baited “carrot”. They are more vulnerable than other students to dropping sciences if they are bored or do not see the relevance of their learning, and so the curriculum issues raised above seem especially pertinent to maintaining their science participation. We note that flexibility and openness can be associated with several types of liability or risk. Firstly, students who said they were keeping their options open were more likely to also say they were not so confident about their choices on transition to tertiary. While the uncertain yet flexible pathway might be more productive for some in the long term, it is likely to generate more anxiety. Students need good support and ongoing access to advice if they are to make such a course of action work in their best interests. Funding issues are closely aligned with this consideration. Tertiary education is expensive and the survey students were anxious not to waste funds (and time) on courses that did not lead towards future careers. This was particularly so for students in the two “keeping options open” clusters. However, the necessity to change courses if a student fails to meet limited entry standards, or if a course does not work out for other reasons, also acts as a disincentive to making tertiary choices that could be risky but potentially rewarding. There are implications here for the flexibility of course pathways within universities, and for communicating and providing advice and support concerning these. Students need to know they will have other options without needing to “backtrack”, in the event that their initial science study plans do not work out.
The timing, targets, and sources of advice
It is clear that different students need different types of information, provided at different times, and from a range of sources, if they are to make productive study and career choices. This was a tentative finding of the background paper (Hipkins and Bolstad, 2005) and has been confirmed by both the focus group and survey components of this research.
Ministry of Research, Science and Technology – Te Manatū Pūtaiao | Staying in Science 2 73
Whether students knew what they wanted to do or were not sure, many expressed a lack of knowledge about the range of science-related tertiary and career options that might be available to them, and more significantly, how they might access such choices. Those who were certain they would continue science tended to be heading towards high-visibility areas such as medicine, engineering, or veterinary studies. Others who were not interested in these areas appeared to think there wasn’t much else they could do with science, and so they did not see it as an option of interest to them. In view of these findings it would seem important to find ways to raise students’ awareness of science-related tertiary and career options, and provide them with helpful advice on ways to access such opportunities. However, this recommendation raises another set of policy questions. Who is best placed to provide careers advice to students? Clearly school careers advice is an accessible and frequently accessed source of information for students in Year 13. But parents are seen as more helpful, and their influence is likely to begin much earlier and continue on into the tertiary level. We think this raises a tricky challenge. How can we best provide more wide-ranging and up-to-date study and careers information to parents and the wider community? Should school or university careers advisers’ roles be extended to encompass this wider brief? Many schools might respond to this challenge by pointing out that they already organise careers expositions and the like. But these are likely to be annual events, and relatively impersonal. As we have seen, the quality of the students’ relationships with their advice givers is important. Presumably the same would hold true for adults, who are likely to be emotionally invested in helping their children make good choices. If they do not trust sources of advice, these may well be ignored. Is it possible for advice providers to build relationships with both parents and students? Given their influence on the taught curriculum, we could also add teachers to those in need of such ongoing advice. But what might such processes look like? Who would keep materials updated? And how should this work be funded? These are questions MoRST may choose to explore further.

Ministry of Research, Science and Technology – Te Manatū Pūtaiao | Staying in Science 2 74
References
ACNielsen, NZCER. (2005). Science and the general public 2005. Report prepared for Ministry of Research, Science and Technology. Wellington: ACNielsen.
Bolstad R. (2003). Evaluation of the Business of Science initiative. Wellington: New Zealand Council for Educational Research.
Boyd S, McDowall S. (2004). Innovative pathways from secondary school. Where are the young people now? Paper presented at the NZARE Conference, 24–26 November 2004, Wellington.
Boyd S, Bolstad R, Cameron M, Ferral H, Hipkins R, McDowall S, Waiti P. (2005). Planning and managing change: Messages from the Curriculum Innovation Projects. Final report to the Ministry of Education. Wellington: Ministry of Education.
Cleaves A. (2005). The formation of science choices at secondary school. International Journal of Science Education 27(4): 471–86.
Davis B, Sumara D. (2005). Challenging images of knowing: Complexity science and educational research. International Journal of Qualitative Studies in Education 18: 305–21.
Ferral H. (2005). Clustering students by their subject choices in the Learning Curves project. Wellington: New Zealand Council for Educational Research. Available at: http://www.nzcer.org.nz/pdfs/14504.pdf
Fullarton S, Walker M, Ainley J, Hillman K. (2003). Longitudinal studies of Australian youth: Research report 33: Patterns of participation at year 12. Melbourne: Australian Council for Educational Research.
Gilbert J. (2001). It’s science Jim, but not as we know it: Re-thinking an ‘Old’ discipline for the ‘Knowledge Society’. SAMEpapers 174–90.
Gilbert J. (2005). Catching the knowledge wave? The knowledge society and the future of education. Wellington: NZCER Press.
Hipkins R, Barker M, Bolstad R. (2005). Teaching the ‘nature of science’: Modest adaptations or radical reconceptions? International Journal of Science Education 27(2): 243–54.
Hipkins R, Bolstad R. (2005). Staying in science: Students’ participation in secondary education and on transition to tertiary studies. Report prepared for Ministry of Research, Science and Technology. Wellington: New Zealand Council for Educational Research.
Hipkins R, Hodgen E. (2004). National survey of secondary schools 2003. Wellington: New Zealand Council for Educational Research.
Hipkins R, Vaughan K. (2002). From cabbages to kings: Interim research report – first year of Learning Curves: Meeting student needs in an evolving qualifications regime. Wellington: New Zealand Council for Educational Research.
Hipkins R, Vaughan K, Beals F, Ferral H. (2004). Shared pathways and multiple tracks. Interim research report – second year of Learning Curves: Meeting student learning needs in an evolving qualifications regime. Wellington: New Zealand Council for Educational Research.
Hipkins R, Vaughan K, Beals F, Ferral H, Gardiner B. (2005). Shaping our futures: Meeting secondary students’ learning needs in a time of evolving qualifications. Wellington: New Zealand Council for Educational Research.
Ministry of Research, Science and Technology – Te Manatū Pūtaiao | Staying in Science 2 75
Lyons T. (2004). Choosing physical science courses: The importance of cultural and social capital in the enrolment decisions of high achieving students. Paper presented at the International Organisation for Science and Technology Education IOSTE XI Symposium, Lublin, Poland, 25–30 July.
Millar R, Osborne JF. (1998). Beyond 2000: Science education for the future. Kings College. Last accessed 8 January 2006 from http://www.kcl.ac.uk/depsta/education/publications/bey2000.pdf
Ritchie G. (2004). Quantifying the effects of teacher movements between schools in New Zealand: To schools that hath, shall be given. Journal of Education Policy 19(1): 57–79.
Vaughan K. (2005). The pathways framework meets consumer culture: Young people, careers and commitment. Journal of Youth Studies 8(2): 173–86.
Ward JH. (1963). Hierarchical grouping to optimize an objective function. Journal of the American Statistical Association 58: 236–44.
Yore L, Hand B, Florence M. (2004). Scientists’ views of science, models of writing, and science writing practices. Journal of Research in Science Teaching 41: 338–69.
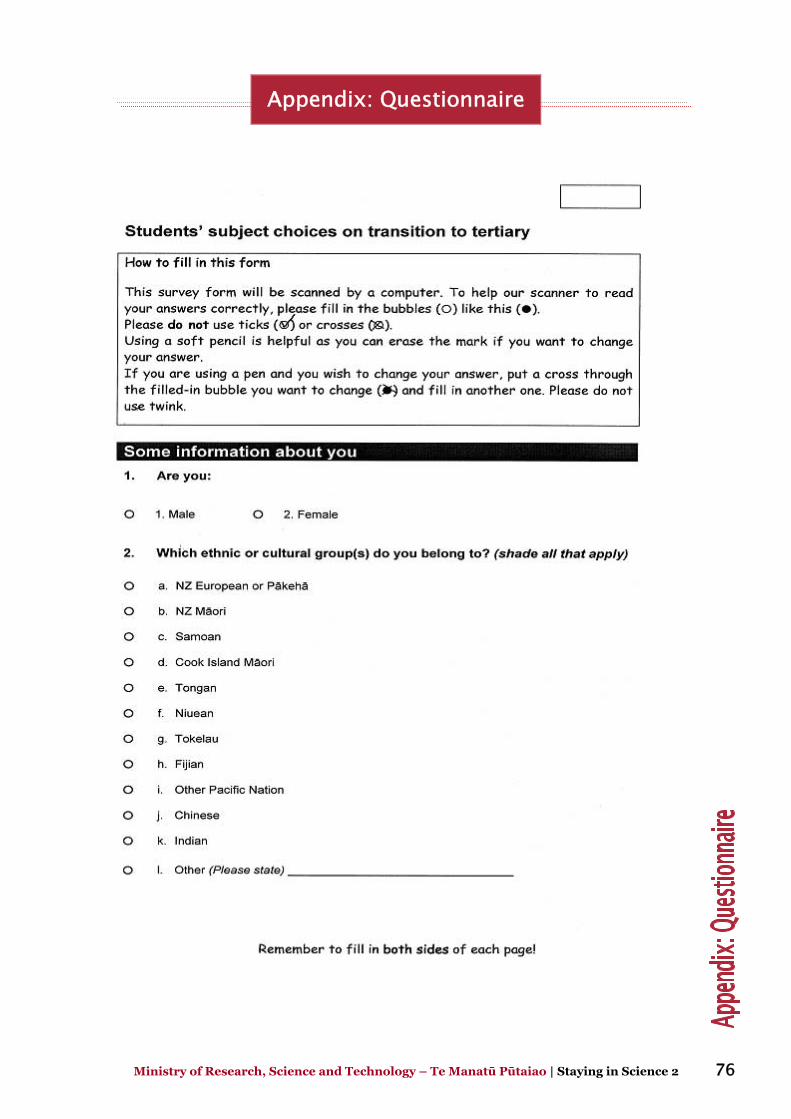
Ministry of Research, Science and Technology – Te Manatū Pūtaiao | Staying in Science 2 76
Appendix: Questionnaire
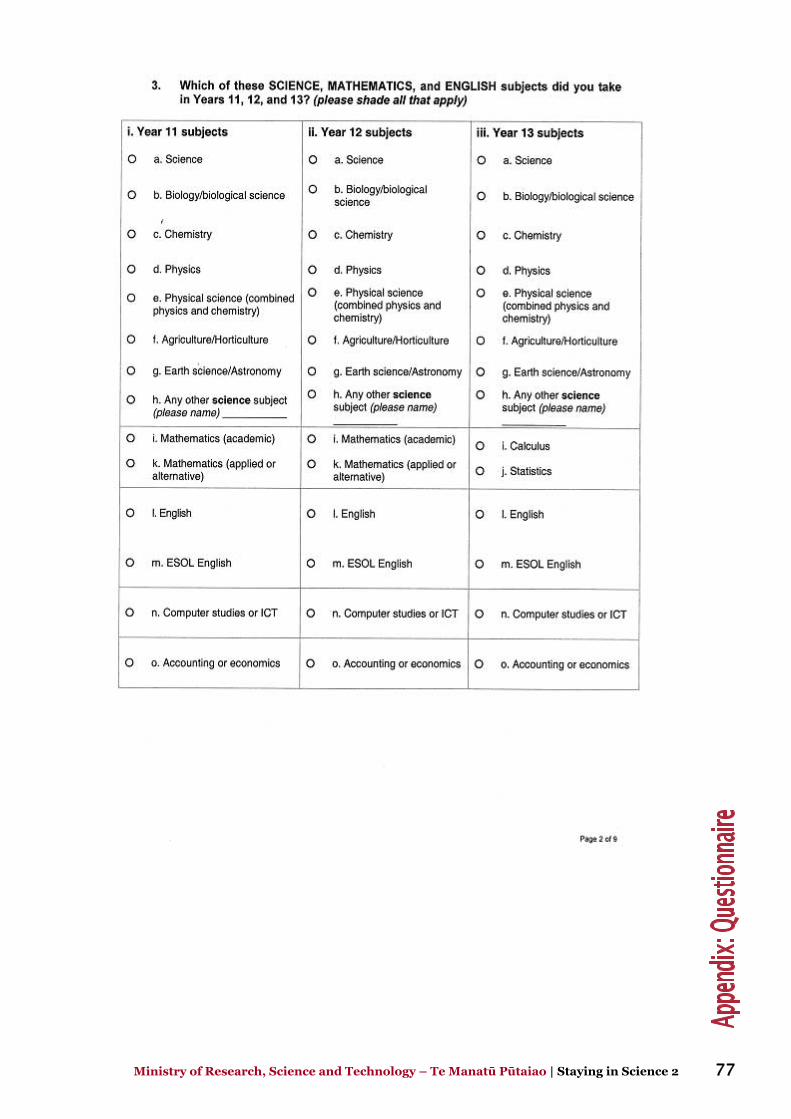
Ministry of Research, Science and Technology – Te Manatū Pūtaiao | Staying in Science 2 77
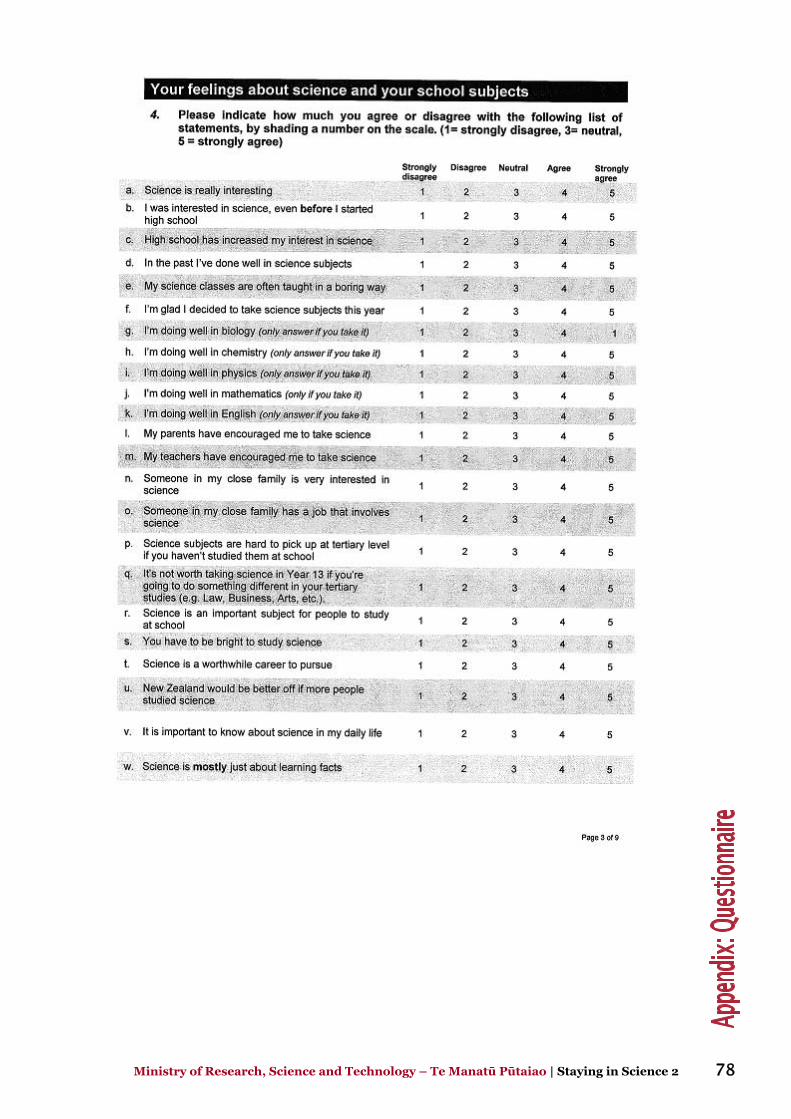
Ministry of Research, Science and Technology – Te Manatū Pūtaiao | Staying in Science 2 78

Ministry of Research, Science and Technology – Te Manatū Pūtaiao | Staying in Science 2 79
Ministry of Research, Science and Technology – Te Manatū Pūtaiao | Staying in Science 2 80

Ministry of Research, Science and Technology – Te Manatū Pūtaiao | Staying in Science 2 81
Ministry of Research, Science and Technology – Te Manatū Pūtaiao | Staying in Science 2 82
Ministry of Research, Science and Technology – Te Manatū Pūtaiao | Staying in Science 2 83
Ministry of Research, Science and Technology – Te Manatū Pūtaiao | Staying in Science 2 84