
Moreno Valley’s TRANSIMS Traffic Model: Microsimulating ... · Moreno Valley’s TRANSIMS Traffic...
20
Moreno Valley’s TRANSIMS Traffic Model: Microsimulating the MPO’s Model John A. Kerenyi, P.E., PTOE (F) Abstract: TRANSIMS (Transportation Analysis and Simulation System) is an open-source, activity-based, microsimulating travel demand model. In 2010 the City of Moreno Valley completed a contract to develop a TRANSIMS traffic model of the Southern California region based on the current MPO's TransCAD travel-demand model, and research certain problem statements that had been proposed by the City. The Author served as Principal Investigator. Since the project's conclusion, the City has continued to develop and apply the model to new projects, especially roadway link additions. The City's initial time investment in constructing the model has yielded the ability to respond quickly to decision-makers' analysis requests. This paper will briefly introduce the reader to the TRANSIMS software program, describe preparation of the Moreno Valley TRANSIMS model, and present selected results from the following analyses: Analysis of the impacts of converting the zoning of 4,700 acres of undeveloped land from a mixture of land uses to high-cube warehousing (which was the subject of the FHWA contract that funded the model development). Analysis of the changes in traffic distribution associated with constructing a new roadway connection in the City's existing industrial area. Analysis of the increase in traffic associated with completing two roadway gap closures to aid in economic development, an analysis that was completed in three business days due to a City management-imposed deadline. Introduction The TRANSIMS (Transportation Analysis and Simulation System) program suite was originally developed in the 1990’s by Los Alamos National Labs in partnership with IBM Corporation. Active development ceased near the turn of the millennium, and shortly thereafter the Federal Highway Administration (FHWA) chose to undertake a re-writing of the software under open- source principles, funded by the TEA-21 federal transportation bill. The software is currently stable as Version 4 (the first open-source version) and is actively being developed as Version 5. The source code and executables for multiple platforms, along with sample datasets, can be downloaded from the project’s Web site; links are provided at the end of the paper. Moreno Valley is a community of about 190,000 located along the east border of the City of Riverside, in Riverside County, California; approximately 50 miles east of downtown Los Angeles.
Transcript of Moreno Valley’s TRANSIMS Traffic Model: Microsimulating ... · Moreno Valley’s TRANSIMS Traffic...
Moreno Valley’s TRANSIMS Traffic Model: Microsimulating the MPO’s Model
John A. Kerenyi, P.E., PTOE (F)
Abstract: TRANSIMS (Transportation Analysis and Simulation System) is an open-source, activity-based, microsimulating travel demand model. In 2010 the City of Moreno Valley completed a contract to develop a TRANSIMS traffic model of the Southern California region based on the current MPO's TransCAD travel-demand model, and research certain problem statements that had been proposed by the City. The Author served as Principal Investigator. Since the project's conclusion, the City has continued to develop and apply the model to new projects, especially roadway link additions. The City's initial time investment in constructing the model has yielded the ability to respond quickly to decision-makers' analysis requests. This paper will briefly introduce the reader to the TRANSIMS software program, describe preparation of the Moreno Valley TRANSIMS model, and present selected results from the following analyses:
Analysis of the impacts of converting the zoning of 4,700 acres of undeveloped land from a mixture of land uses to high-cube warehousing (which was the subject of the FHWA contract that funded the model development).
Analysis of the changes in traffic distribution associated with constructing a new roadway connection in the City's existing industrial area.
Analysis of the increase in traffic associated with completing two roadway gap closures to aid in economic development, an analysis that was completed in three business days due to a City management-imposed deadline.
Introduction
The TRANSIMS (Transportation Analysis and Simulation System) program suite was originally developed in the 1990’s by Los Alamos National Labs in partnership with IBM Corporation. Active development ceased near the turn of the millennium, and shortly thereafter the Federal Highway Administration (FHWA) chose to undertake a re-writing of the software under open-source principles, funded by the TEA-21 federal transportation bill. The software is currently stable as Version 4 (the first open-source version) and is actively being developed as Version 5. The source code and executables for multiple platforms, along with sample datasets, can be downloaded from the project’s Web site; links are provided at the end of the paper.
Moreno Valley is a community of about 190,000 located along the east border of the City of Riverside, in Riverside County, California; approximately 50 miles east of downtown Los Angeles.

In 2008, the City of Moreno Valley and the FHWA contracted to prepare a TRANSIMS model of Moreno Valley and its environs under the TRANSIMS Deployment Case Studies program. The program’s objective has been to increase TRANSIMS deployment; the City’s objective was to obtain a (meaning capable of replicating the current MPO model’s results to a reasonable degree of accuracy) travel demand model. The City had a readily applicable analysis in mind relating to a wholesale land-use change in the undeveloped east end of the City, and that formed the basis for the research questions that were posed in the model. Since the completion of the research project in early 2011, the City has found other uses for the model; this paper presents a selection of results from three analyses performed to date. The selected results are partly intended to convey the TRANSIMS model’s fidelity relative to classic travel demand models; however, the program is capable of generating much more data than can be presented herein, and thus the results reported herein should not be considered to be a comprehensive model results reporting exercise.
Model Preparation
The TRANSIMS model was prepared using in-house resources, supplemented by a support consultant to serve as advisor and to prepare data from the parent model (RivTAM, a focused version of the Southern California Association of Governments’ regional travel demand model). Model preparation generally fell into three categories:
Network preparation. Ninety-five percent of the network can be converted automatically using conversion tools; however, some attention is required to fully take advantage of the microsimulator’s fidelity. For example, dedicated turning lanes, especially dual left-turn lanes, are manually coded. In addition, the location of signalized intersections and/or other intersection controls (e.g. four-way stop versus side-street stop) was customized.
Trip table conversion. Trip data were converted directly from the parent model. A specially devised procedure was used to convert trip data retaining production/attraction information. Thus, for example, commuting trips can be distinguished from shopping trips in the output data.
Microsimulator troubleshooting. A time investment was necessary to inspect microsimulation results to identify and correct sub-optimal simulator performance. For example, the connection of carpool facilities to general-purpose lanes required reconfiguration to account for weaving: The parent model’s carpool ingress connections were roughly 100 feet downstream of on ramps. Microsimulating these connections caused severe weaving problems as cars were routed from on ramps across all freeway mainlines to the carpool connectors. The solution was to modify the connections so that they occurred upstream of on ramps. The finer ramifications of this change could be debated; however, the end result is viewed by the model preparers as being reasonable.
An iterative procedure is used to evaluate the model’s reasonableness; each iteration seeks to approach user equilibrium, the state in which no vehicle can improve its travel-time performance by changing its route. User equilibrium is a commonly accepted stable model state since it

replicates actual driver strategy. User equilibrium is sought by re-routing a portion of trips to determine if they can significantly improve their travel time. For example, if a given 20-minute trip can improve its travel time by, say, three minutes, this is considered a significant improvement and the new route is retained for the next iteration. Over the course of multiple iterations, the travel plans approach an optimal configuration. In all cases, the end result was also evaluated for other desirable features such as stability of link volumes between iterations, since the model would be used for predicting said volumes.
The model was calibrated and validated against 2007 ground counts, and the validation report was peer reviewed by a panel convened by the FHWA. The panel made a number of suggestions for further model improvement, which were duly incorporated. The panel’s general consensus was that the model was well-prepared.
Upon completion of the base-year model, the 2035 model was prepared. As is customary for model defensibility, the model’s underlying structure is unchanged, and only the road network and trip tables differ. The specifics of the future-year scenarios are discussed below.
The model represents the entire Southern California Association of Government’s (SCAG, the MPO for Moreno Valley) six-county region, although only a small subset of that area is microsimulated. Figures 1 and 2 represent the model’s routed and microsimulated areas, respectively. The model is re-usable anywhere within the routed area, recognizing that any newly microsimulated area would require microsimulator troubleshooting and validation appropriate to the undertaking.
East-End Land Use Warehousing
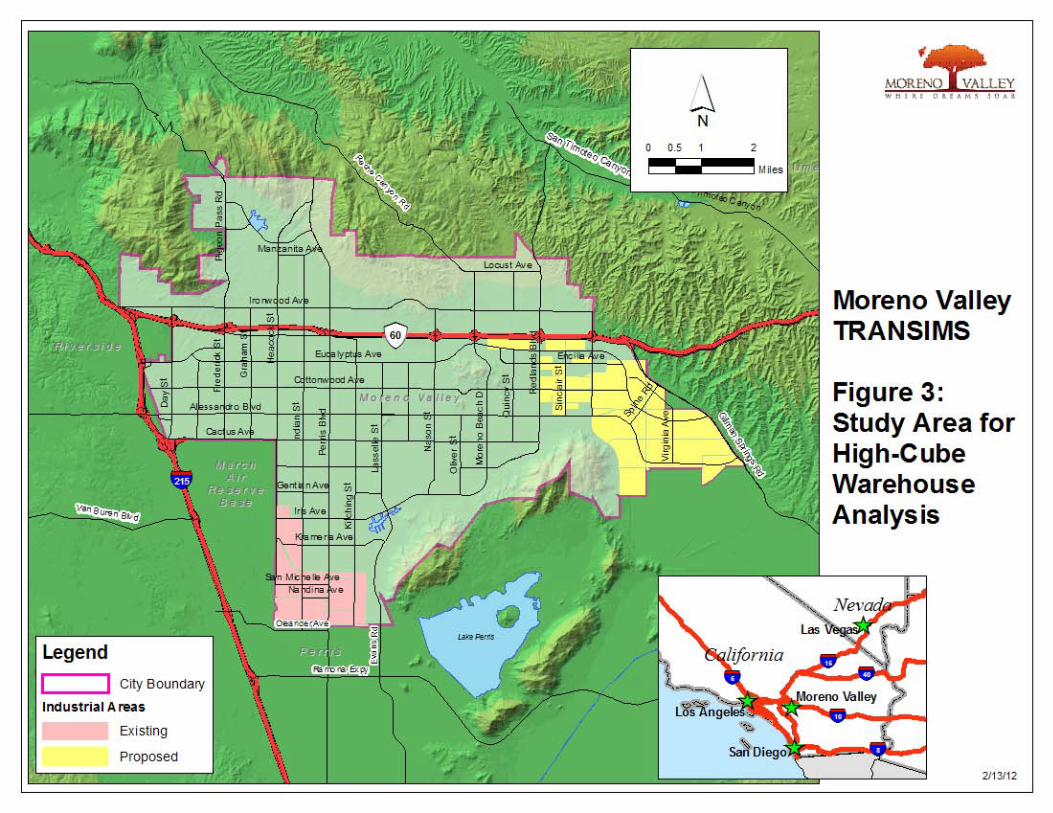
The research questions posed to FHWA, and investigated as part of the model development contract, were related to potential re-zoning of 4,700 acres of vacant land from a mix of uses to high-cube warehousing. The study area is shown as Figure 3. The goal was to investigate TRANSIMS’ ability to replicate the parent model’s results to a reasonable degree of accuracy, and to explore the TRANSIMS program’s ability to report results in additional detail as befitting a microsimulator.
Three future (Year 2035) scenarios were prepared; the first being a straight conversion of the parent model, and the second and third being scenario alternatives (“base” and “alternate”). The base scenario represented refinement of the parent model to more accurately represent the future industrial development with no zoning changes. The alternative scenario represented wholesale conversion of the project study area to industrial land use. Both scenarios were implemented through modifications to the socioeconomic data by traffic analysis zone used as input by the parent model.
For truck movements, the TRANSIMS model relies on the parent model’s heavy-duty truck component, which was developed by SCAG at least in part to explicitly model interactions between industrial areas and the ports of Long Beach and Los Angeles. Although detailed discussion of the heavy-duty truck model is beyond the scope of this paper, we wish to indicate


that the observed truck volume outputs were reasonable, accounting for additional truck traffic between industrial areas in Moreno Valley; and even allowing for time-of-day analysis of the results. For example, the model predicts substantial truck movements through residential areas at night in the alternate land-use scenario, an item that would likely be of concern to constituents were the re-zoning to occur.
The analysis results can be summarized as follows:
Commuting patterns would be substantially changed (see Table 1 on the next page), although not so much as to require major modifications to planned interchange improvements in the project vicinity. Generally, the currently expected commute-out pattern would be replaced by a commute-in pattern, accompanied by a substantial increase in truck volumes.
The City’s General Plan roadway system, planned using conservatively derived ADT estimates from the predecessor of the parent model, generally contains sufficient reserve capacity to absorb the project’s local traffic increases; although certain intersections are expected to require improvements.
The reduction in households associated with the analyzed land-use change has the side effect of reducing carpool formation for commuting westerly. This was found to shift traffic volume from the carpool lanes to the general-purpose lanes of the nearby freeways.
The industrial areas shown on Figure 3 (labeled in the legend as “Existing” and “Proposed”) are expected to interact, increasing truck volumes on direct routes between them at all hours of the day and night, not all of which are designated as truck routes.
Certain roadways will require a stronger than normal structural cross section to accommodate the forecast truck volumes without reducing expected pavement life.
Heacock Street Extension
The City used the TRANSIMS program to analyze the traffic changes associated with a new roadway connection (Figure 4). The historical reason for omitting this connection is not discussed in detail herein, but is related to the presence of a military runway nearby. Consensus to make the connection was recently achieved by all parties, and Moreno Valley is currently in the preliminary engineering phase of the project to construct the connection.
To isolate the impact of the road network change, the end result of user equilibrium testing for the base scenario was modified to include the new road connection, and the user equilibrium process was re-started. In this manner, the trip-making characteristics—that is, origin and destination, as well as start and end time—were made consistent between scenarios.
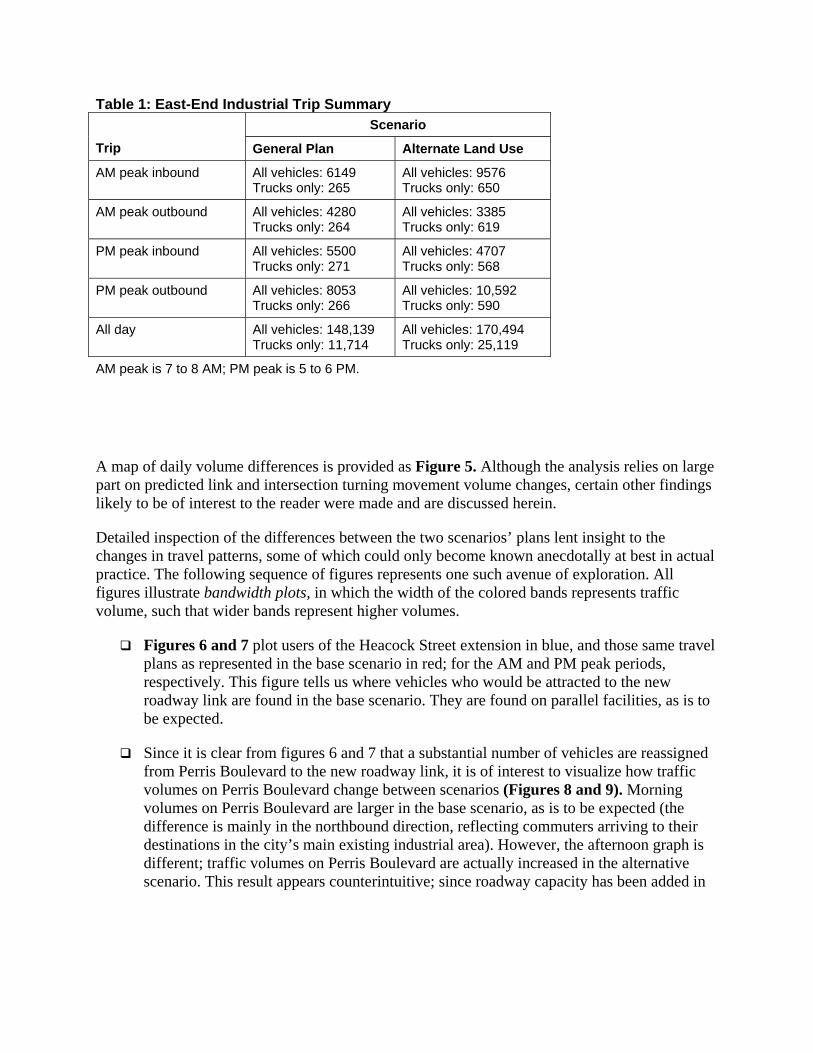
Table 1: East-End Industrial Trip Summary Scenario
Trip General Plan Alternate Land Use
AM peak inbound All vehicles: 6149 Trucks only: 265
All vehicles: 9576 Trucks only: 650
AM peak outbound All vehicles: 4280 Trucks only: 264
All vehicles: 3385 Trucks only: 619
PM peak inbound All vehicles: 5500 Trucks only: 271
All vehicles: 4707 Trucks only: 568
PM peak outbound All vehicles: 8053 Trucks only: 266
All vehicles: 10,592 Trucks only: 590
All day All vehicles: 148,139 Trucks only: 11,714
All vehicles: 170,494 Trucks only: 25,119
AM peak is 7 to 8 AM; PM peak is 5 to 6 PM.
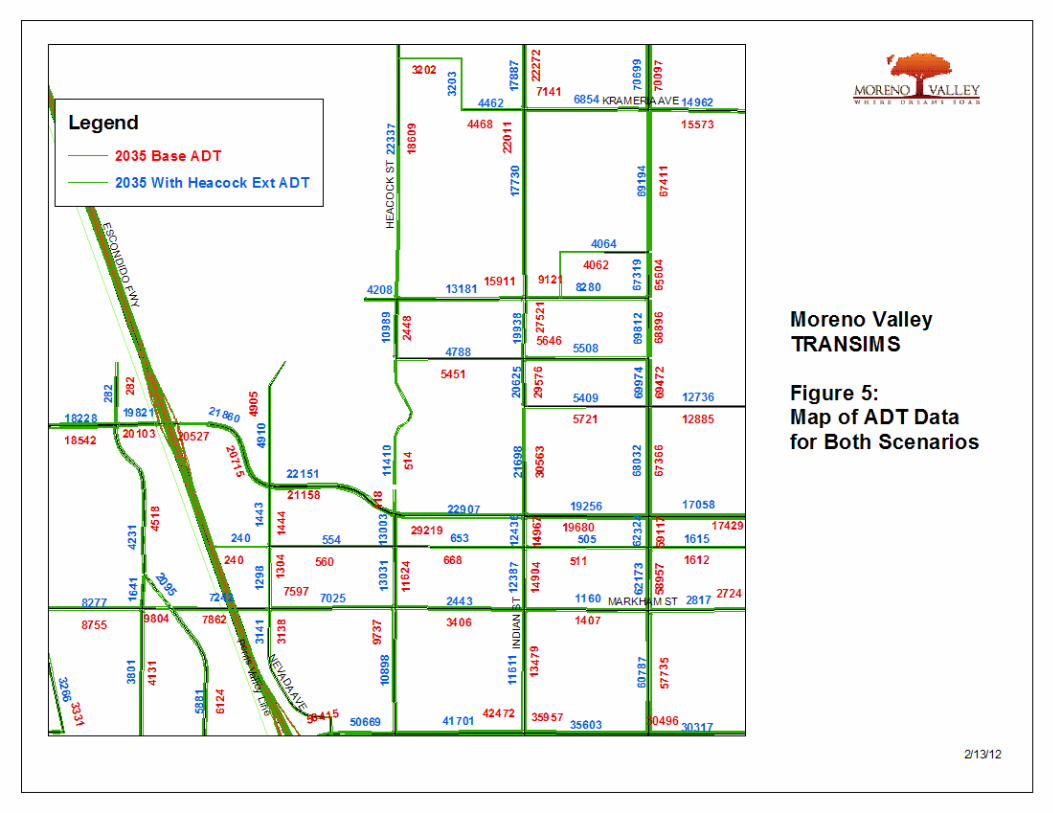
A map of daily volume differences is provided as Figure 5. Although the analysis relies on large part on predicted link and intersection turning movement volume changes, certain other findings likely to be of interest to the reader were made and are discussed herein.
Detailed inspection of the differences between the two scenarios’ plans lent insight to the changes in travel patterns, some of which could only become known anecdotally at best in actual practice. The following sequence of figures represents one such avenue of exploration. All figures illustrate bandwidth plots, in which the width of the colored bands represents traffic volume, such that wider bands represent higher volumes.
Figures 6 and 7 plot users of the Heacock Street extension in blue, and those same travel plans as represented in the base scenario in red; for the AM and PM peak periods, respectively. This figure tells us where vehicles who would be attracted to the new roadway link are found in the base scenario. They are found on parallel facilities, as is to be expected.
Since it is clear from figures 6 and 7 that a substantial number of vehicles are reassigned from Perris Boulevard to the new roadway link, it is of interest to visualize how traffic volumes on Perris Boulevard change between scenarios (Figures 8 and 9). Morning volumes on Perris Boulevard are larger in the base scenario, as is to be expected (the difference is mainly in the northbound direction, reflecting commuters arriving to their destinations in the city’s main existing industrial area). However, the afternoon graph is different; traffic volumes on Perris Boulevard are actually increased in the alternative scenario. This result appears counterintuitive; since roadway capacity has been added in


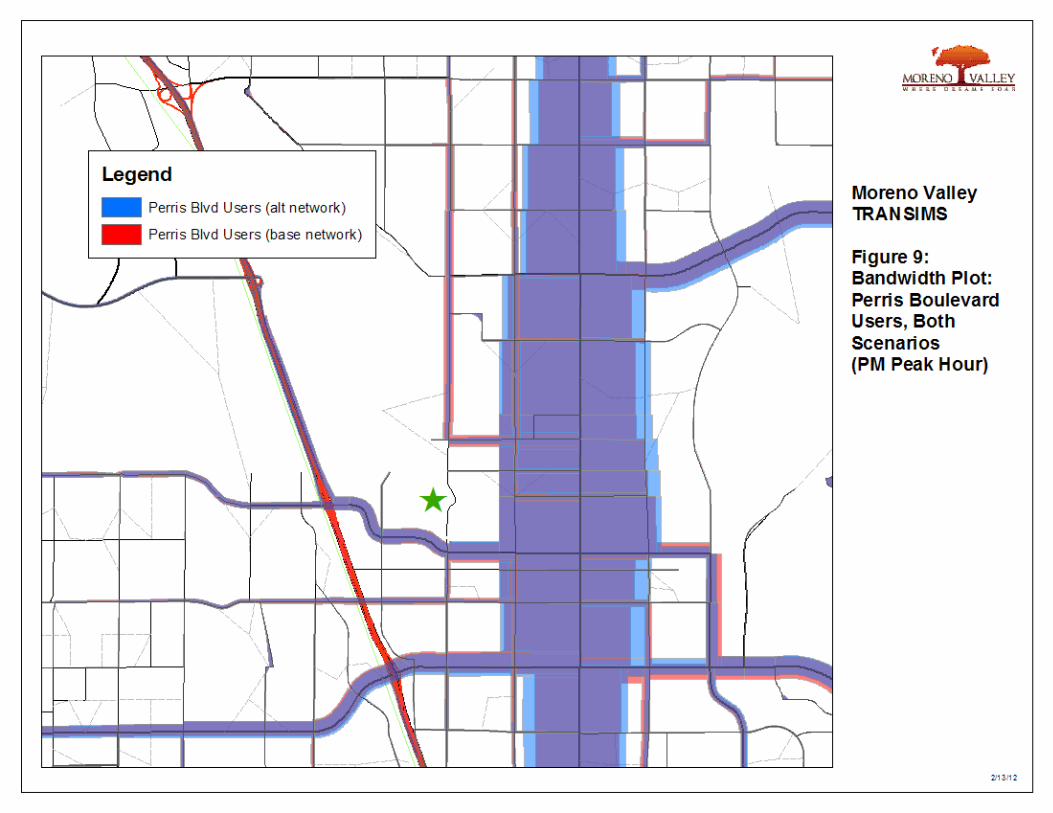
the corridor, one would expect traffic to be reduced on the existing links, in the absence of other factors. Since user equilibrium is maintained, we know that Perris Boulevard must have travel-time advantages over other available routes even with the additional traffic.
To gain insight, plots were prepared to compare the routes of vehicles that are attracted to Perris Boulevard in the “with Heacock Street extension” scenario (Figure 10—only afternoon plot provided). The scale of the bandwidth lines is at a larger scale (e.g. vehicles per unit width) in order to resolve the differences. The figure shows, in red, where such travelers can be found on the base network. As one would expect, they shift from parallel facilities. However, inspection of the figure reveals that in the base (without the Heacock Street extension) scenario, a substantial number of these travelers divert from Perris Boulevard to the north and south of the project area in order to optimize their travel time. Provision of the new roadway connection results in more direct travel routes, which reduces conflicting movements along Perris Boulevard.
Thus, it can be argued that providing the additional roadway connection has not only added capacity to the system, but has also increased the capacity of a particular parallel facility by removing cross traffic from it. This inference would be difficult to make from output of a classic travel demand model, since it requires explicit consideration of delay associated with conflicting traffic.
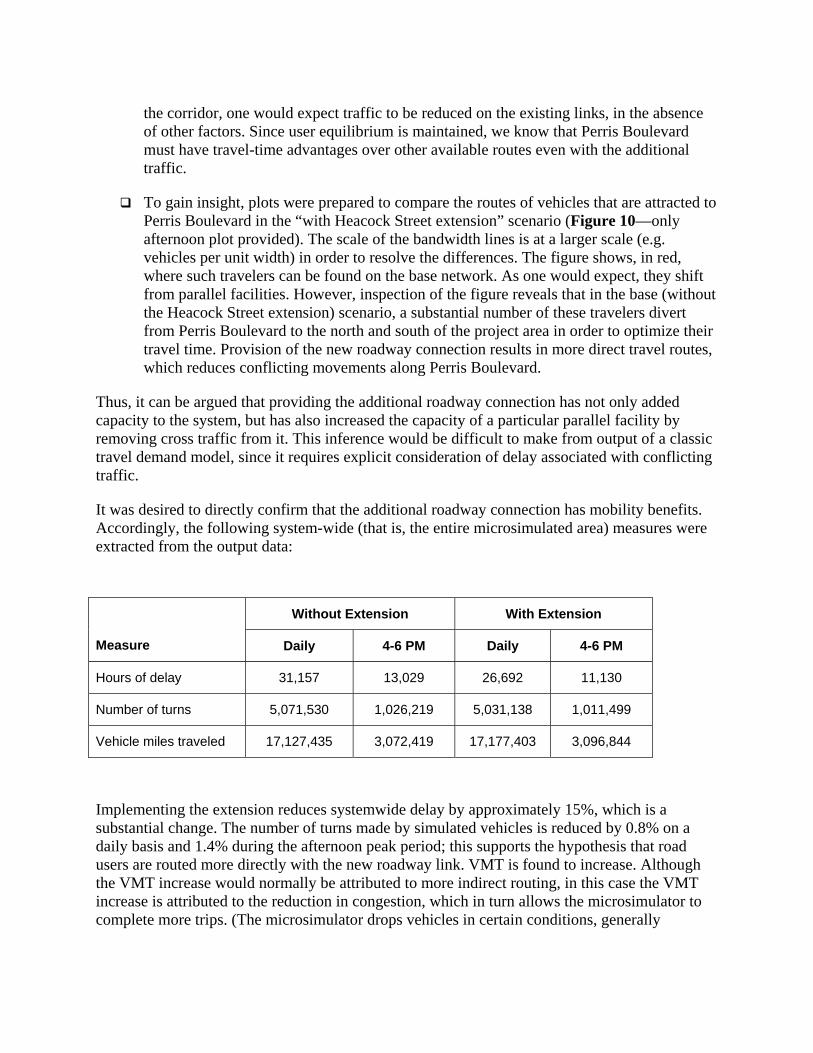
It was desired to directly confirm that the additional roadway connection has mobility benefits. Accordingly, the following system-wide (that is, the entire microsimulated area) measures were extracted from the output data:
Without Extension With Extension
Measure Daily 4-6 PM Daily 4-6 PM
Hours of delay 31,157 13,029 26,692 11,130
Number of turns 5,071,530 1,026,219 5,031,138 1,011,499
Vehicle miles traveled 17,127,435 3,072,419 17,177,403 3,096,844
Implementing the extension reduces systemwide delay by approximately 15%, which is a substantial change. The number of turns made by simulated vehicles is reduced by 0.8% on a daily basis and 1.4% during the afternoon peak period; this supports the hypothesis that road users are routed more directly with the new roadway link. VMT is found to increase. Although the VMT increase would normally be attributed to more indirect routing, in this case the VMT increase is attributed to the reduction in congestion, which in turn allows the microsimulator to complete more trips. (The microsimulator drops vehicles in certain conditions, generally


occurring in heavy congestion; this is done by numerous microsimulation programs to offset the impact of stuck vehicles; stuck vehicles can occur for a variety of reasons, for example an inability to change lanes in preparation for a turn.) Specifically, an additional 2,142 trips per day are found to complete in the “with extension” scenario.
Nason Street Extension
In the spring of 2011, new executive management at Moreno Valley explored means of facilitating economic development by constructing roadway links that would likely attract land development upon their completion. The following base-year network changes were made, and analysis re-run, within three business days to accommodate the request in a timely manner:
Extension of Nason Street to connect to Iris Avenue. This is a master-planned roadway connection. The model predicts 9,000 ADT solely on the basis of the new connection (that is, before the attraction of any new development). Construction of the connection is currently underway, and the City anticipates receipt of an application to construct a medical office campus along the new street this calendar year (2012).
Closure of a gap in Eucalyptus Avenue at Moreno Beach Drive. This gap closure project resides adjacent to two commercial centers which are faring poorly in part due to the missing street connection. Construction of the connection, together with increased occupancy of the commercial centers (the result of a manual assignment process), is expected to result in 16,000 ADT on the segment. The connection is expected to be made in 2013; in order to complete the project, the adjacent freeway interchange must be modified.
Figure 11 presents the base and alternate scenario ADT for the analysis, for the interested reader’s perusal. The author presents the case as an example of staff’s ability to lend insight to complicated questions quickly and at little cost.
Conclusions
The Moreno Valley TRANSIMS model has been found to produce reasonable results, with rigor, accuracy and defensibility comparable to the accuracy of classic travel demand models; while adding detail with respect to time-of-day information and intersection control delay that can be difficult to provide with the standard type of model. Further, when the model does produce counterintuitive results (such as with the Perris Boulevard traffic volume increase described in the Heacock Street extension section), the available toolset facilitates (through the available data reduction tools) further investigation of the phenomenon, and rewards diligent analysis by providing insight into the model’s behavior.

5237+6495886
1552-1221430
79618-1025069368
35366-1140523961
8678
+3390
12068
0+9
317
9317
11077+364514722
9408-9928416
11098+757318671
5435+8506285
9138+240211540
2980
-44
2936
28029-516622863
3460
-893
2567
28029
-2000
26029
3066-3
3063
3803
-879
2924
2496+802576
988+121000
1790
+259
2049
4501+6775178
8333+9909323
2252
-30
2222
6263+9397202
3382+1273509
6983
-930
6053
2157
4-4
665
1690
9
1763
+9428
11191
2848 -9
2839
7513
-112
863
8569
73-1
814
5159
1737+101747
4955+565011
4665+904755
3712-413671
21851
-1440
20411
2237+562293
4096-57
4039
1989
6-2
546
1735
0
1791
5-2
351
1556
4
1857
7-3
095
1548
2
1208
6-4
3011
656
8976
+522
714
203
9269+423913508
5472
-608
4864
5147
+664
111
788
5557+34649021
1211
3+8
883
2099
6
6619+31899808
71127-374667381
6667+7047371
76670-592970741
4556
+682
5238
18357
-2879
15478
14452+13914591
10997+86
11083
16026+305719083
5624+30408664
2 0 2
18451
-2286
16165
12145+338215527
7859-9306929
4780
+123
060
10
5311
+817
613
487
2476+282504
2560+172577
1033
9-3
9799
42
1259
8+3
200
1579
8
19293
+2020
21313
1086
6-3
9110
475
2349
7-8
9922
598
21544-434717197
9487-36715816
1110
6+4
364
1547
0
IRIS AVE
LAS
SE
LLE
ST
NA
SO
NS
T
MO
RE
NO
BE
AC
HD
R IRONWOOD AVE
COTTONWOOD AVE
ALESSANDRO BLVDO
LIV
ER
ST
ELDER AVEMORENO VALLEY FWY
EUCALYPTUS AVE
CACTUS AVCACTUS AVE
JOHN F KENNEDY DR
VIA DEL LAGO
MO
RR
ISO
NS
T
GENTIAN AVE
DRACAEA AVE
CH
AMP
LAIN
STMORENO VALLEY FWY
JOHN F KENNEDY DR
New Road Connections:Nason to IrisEucalyptus to Moreno Beach DriveAverage Daily Traffic Levels
Prepared 3/14/11
Legend:
16,000
Bottom # = ADT with new road connectionsMiddle # = Difference (new - base)Top # = ADT in 2007 model scenario (base vol)

The author has compiled the following types of analyses for which TRANSIMS would be particularly well suited:
Link addition/deletion/change. As the Heacock Street extension project demonstrated, such analyses are straightforward and provide both classic and extended data for the analyst’s use.
Select link analysis. This commonly used four-step model output helps answer the question, “If we build it, who will come?” TRANSIMS can provide similar data.
Major project construction detours. Large-scale public works projects often must balance cost to construct versus cost to displaced road users. TRANSIMS can help inform such decisions with great accuracy, relying both on its compatibility with the parent model and its output detail.
Operational enhancements. Formerly known as Transportation Systems Management, this category of capacity enhancement which is commonly defined as any improvement short of construction of additional full-length lanes can be informed by TRANSIMS. For example, peak-hour parking restrictions can be explicitly considered, as can performance of weaving sections.
Refined time-of-day analysis. TRANSIMS’ ability to estimate volumes and system performance in 15-minute increments can be used to analyze sub-peak-period issues such as school traffic/commuter traffic interaction, especially when the two do not directly coincide with respect to time of day.
Acknowledgements
The work was partially supported by the U.S. Department of Transportation, the Illinois Department of Transportation and the Transportation Research and Analysis Computing Center.
The team’s FHWA project manager, Scott Smith, was instrumental to achieving the results in this document through careful review of results and timely advice.
Carleton Waters of Urban Crossroads Inc. served as the team’s expert consultant resource and was called upon regularly to lend his expertise.
The following persons regularly participated in the Technical Review Committee and whose expert input was essential to the end product:
Mike Ainsworth, Southern California Association of Governments
James Camarillo, Caltrans
Maria Aranguiz, Caltrans

Links
TRANSIMS FHWA project homepage: http://www.fhwa.dot.gov/planning/tmip/transims/
TRANSIMS Community homepage : http://code.google.com/p/transims/
TRANSIMS source code and documentation: http://sourceforge.net/projects/transims/
Author’s Information: John Kerenyi has been employed by the City of Moreno Valley as a Senior Engineer since January of 2006. He has contributed to development review, capital projects, and ITS deployment programs during his employment there. Prior to his engagement with Moreno Valley, he worked at Kimley-Horn and Associates and KOA Corporation. He graduated with a Bachelor’s Degree in Engineering in 1993 from Harvey Mudd College in Claremont, California. John A. Kerenyi, P.E., PTOE, Fellow of ITE Senior Traffic Engineer City of Moreno Valley 14177 Frederick Street P.O. Box 88005 Moreno Valley, CA 92552-0805 Phone: (951) 413-3199 Email: [email protected]


![Parallel implementation of the TRANSIMS micro … · arXiv:cs/0105004v1 [cs.CE] 2 May 2001 Parallel implementation of the TRANSIMS micro-simulation Kai Nagela ,1 and Marcus Rickertb](https://static.fdocuments.us/doc/165x107/5b5de4f37f8b9a65028e94ab/parallel-implementation-of-the-transims-micro-arxivcs0105004v1-csce-2-may.jpg)

