Moody's China's Core Shadow Banking Activity Continues to Slow Aug 2015
44
Quarterly China Shadow Banking Monitor JULY 2015 This publication does not announce a credit rating action. For any credit ratings referenced in this publication, please see the ratings tab on the issuer/entity page on www.moodys.com for the most updated credit rating action information and rating history.
description
report
Transcript of Moody's China's Core Shadow Banking Activity Continues to Slow Aug 2015
Quarterly China Shadow Banking Monitor
JULY 2015
This publication does not announce a credit rating action. For any credit ratings referenced in this publication, please see the ratings tab on the issuer/entity page on www.moodys.com for the most updated credit rating action information and rating history.
2Quarterly Shadow Banking Monitor, July 2015
Quarterly China Shadow Banking Monitor
1. Key Messages
2. Trends in the Growth of Core Shadow Banking Components
3. Composition of Broad Shadow Banking Components(a) Wealth Management Products
(b) Trust Sector
4. Securitization
5. Regulatory Updates & Market Events
6. Appendix: Glossary, Notes on Estimates, & Data Sources

3Quarterly Shadow Banking Monitor, July 2015
Key Messages1

4Quarterly Shadow Banking Monitor, July 2015
Key Messages» Tighter regulation has been most effective in slowing the growth rate of “core”
shadow banking activity, as other forms of shadow banking expand more rapidly. Accordingly, in this report we distinguish more clearly than in the past between “core” shadow banking activities (comprising entrusted loans, trust loans, and undiscounted bankers’ acceptances) and the range of other activities.
» Shifts are taking place in the risk and composition of the broader range of shadow banking activities. In particular, “non-core” components of shadow banking such as umbrella trusts, e-financing and peer-to-peer lending have been growing at a faster pace than core activities. Also, the share of trust sector assets in the capital market has risen at the expense of loans to more traditional sectors.
» Recent stock market volatility has thrust the role of margin finance into the spotlight. After peaking in June, outstanding margin finance has declined sharply with the market selloff. In a break with the trend of tighter regulations, the authorities have responded by loosening restrictions on margin finance.
» While the growth of core shadow banking has fallen to below the growth rate of nominal GDP in the past quarter, total social financing has held up as credit flows shift back toward the formal banking system. Increased intermediation through the regulated banking system should help improve transparency and reduce financial risks.
» The contraction in core shadow banking may create pressures for borrowers such as property developers and small enterprises who rely on such financing. However, evidence is mixed, and recent supportive policies may help alleviate these pressures.
5Quarterly Shadow Banking Monitor, July 2015
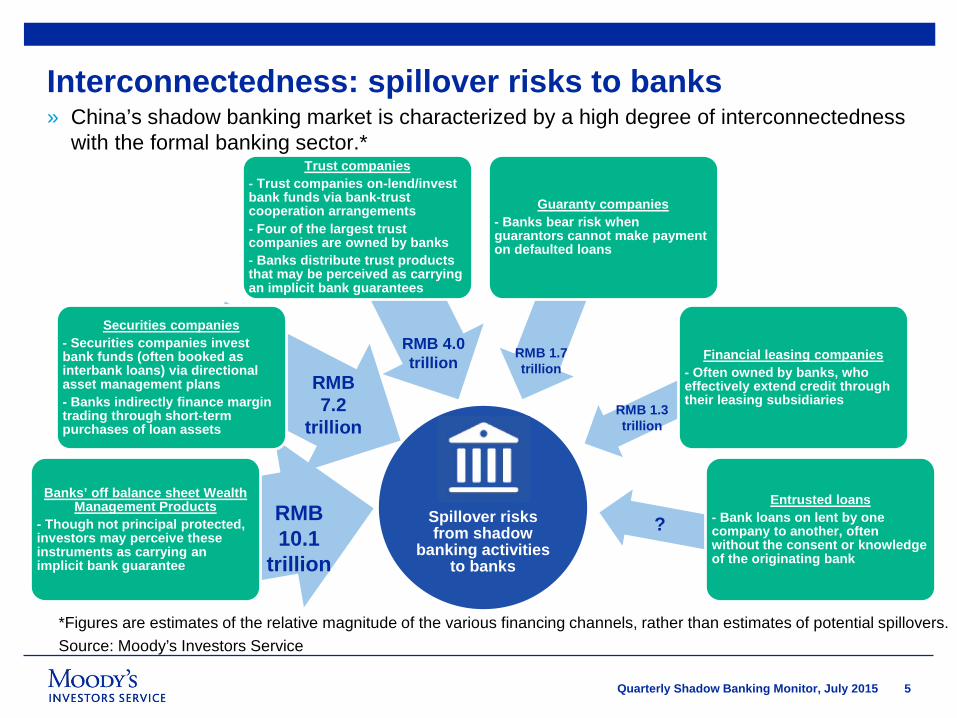
Interconnectedness: spillover risks to banks» China’s shadow banking market is characterized by a high degree of interconnectedness
with the formal banking sector.*
*Figures are estimates of the relative magnitude of the various financing channels, rather than estimates of potential spillovers.Source: Moody’s Investors Service
Spillover risks from shadow
banking activities to banks
Banks’ off balance sheet Wealth Management Products
- Though not principal protected, investors may perceive these instruments as carrying an implicit bank guarantee
Securities companies- Securities companies invest bank funds (often booked as interbank loans) via directional asset management plans- Banks indirectly finance margin trading through short-term purchases of loan assets
Trust companies- Trust companies on-lend/invest bank funds via bank-trust cooperation arrangements- Four of the largest trust companies are owned by banks- Banks distribute trust products that may be perceived as carrying an implicit bank guarantees
Guaranty companies- Banks bear risk when guarantors cannot make payment on defaulted loans
Financial leasing companies- Often owned by banks, who effectively extend credit through their leasing subsidiaries
Entrusted loans- Bank loans on lent by one company to another, often without the consent or knowledge of the originating bank
RMB 7.2
trillion
RMB 4.0 trillion
?
RMB 1.7 trillion
RMB 10.1
trillion
RMB 1.3 trillion
6Quarterly Shadow Banking Monitor, July 2015
Trends in the Growth of Core Shadow Banking Components2
7Quarterly Shadow Banking Monitor, July 2015
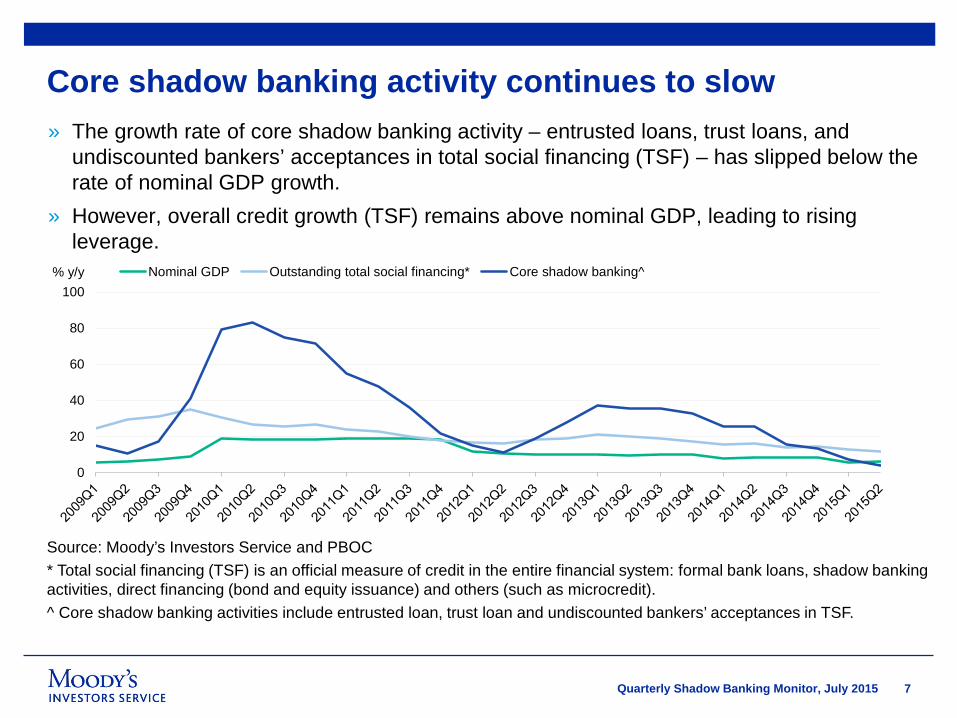
Core shadow banking activity continues to slow
Source: Moody’s Investors Service and PBOC* Total social financing (TSF) is an official measure of credit in the entire financial system: formal bank loans, shadow banking activities, direct financing (bond and equity issuance) and others (such as microcredit).^ Core shadow banking activities include entrusted loan, trust loan and undiscounted bankers’ acceptances in TSF.
» The growth rate of core shadow banking activity – entrusted loans, trust loans, and undiscounted bankers’ acceptances in total social financing (TSF) – has slipped below the rate of nominal GDP growth.
» However, overall credit growth (TSF) remains above nominal GDP, leading to rising leverage.
0
20
40
60
80
100% y/y Nominal GDP Outstanding total social financing* Core shadow banking^

8Quarterly Shadow Banking Monitor, July 2015
Accounting for the slowdown by components
Source: Moody’s Investors Service and PBOC^ Core shadow banking components include entrusted loan, trust loan and undiscounted bankers’ acceptances in the TSF
» The slowdown in core shadow banking activity is mainly due to a decline in undiscounted bankers’ acceptances and trust loans under the weight of tighter regulations; entrusted loans have been comparatively robust.
-20
0
20
40
60
80
100
% y/y Entrusted loans Trust loans Undiscounted bankers' acceptances Core shadow banking growth^
9Quarterly Shadow Banking Monitor, July 2015
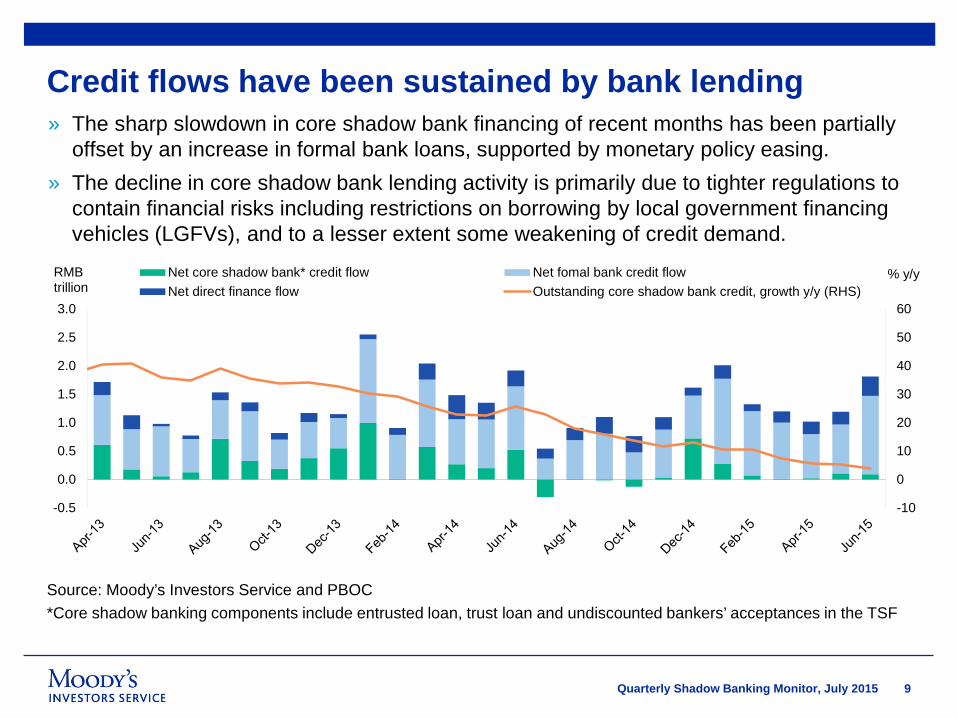
Credit flows have been sustained by bank lending
Source: Moody’s Investors Service and PBOC*Core shadow banking components include entrusted loan, trust loan and undiscounted bankers’ acceptances in the TSF
» The sharp slowdown in core shadow bank financing of recent months has been partially offset by an increase in formal bank loans, supported by monetary policy easing.
» The decline in core shadow bank lending activity is primarily due to tighter regulations to contain financial risks including restrictions on borrowing by local government financing vehicles (LGFVs), and to a lesser extent some weakening of credit demand.
-10
0
10
20
30
40
50
60
-0.5
0.0
0.5
1.0
1.5
2.0
2.5
3.0
% y/yRMBtrillion
Net core shadow bank* credit flow Net fomal bank credit flowNet direct finance flow Outstanding core shadow bank credit, growth y/y (RHS)
10Quarterly Shadow Banking Monitor, July 2015
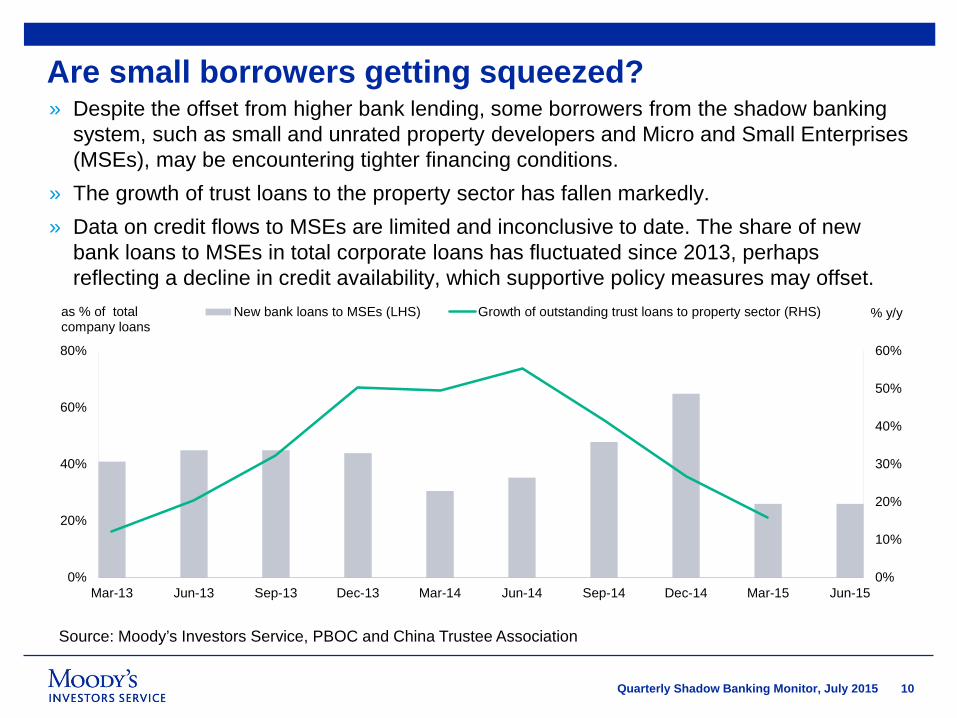
Are small borrowers getting squeezed?» Despite the offset from higher bank lending, some borrowers from the shadow banking
system, such as small and unrated property developers and Micro and Small Enterprises (MSEs), may be encountering tighter financing conditions.
» The growth of trust loans to the property sector has fallen markedly.» Data on credit flows to MSEs are limited and inconclusive to date. The share of new
bank loans to MSEs in total corporate loans has fluctuated since 2013, perhaps reflecting a decline in credit availability, which supportive policy measures may offset.
Source: Moody’s Investors Service, PBOC and China Trustee Association
0%
10%
20%
30%
40%
50%
60%
0%
20%
40%
60%
80%
Mar-13 Jun-13 Sep-13 Dec-13 Mar-14 Jun-14 Sep-14 Dec-14 Mar-15 Jun-15
% y/yas % of totalcompany loans
New bank loans to MSEs (LHS) Growth of outstanding trust loans to property sector (RHS)
11Quarterly Shadow Banking Monitor, July 2015
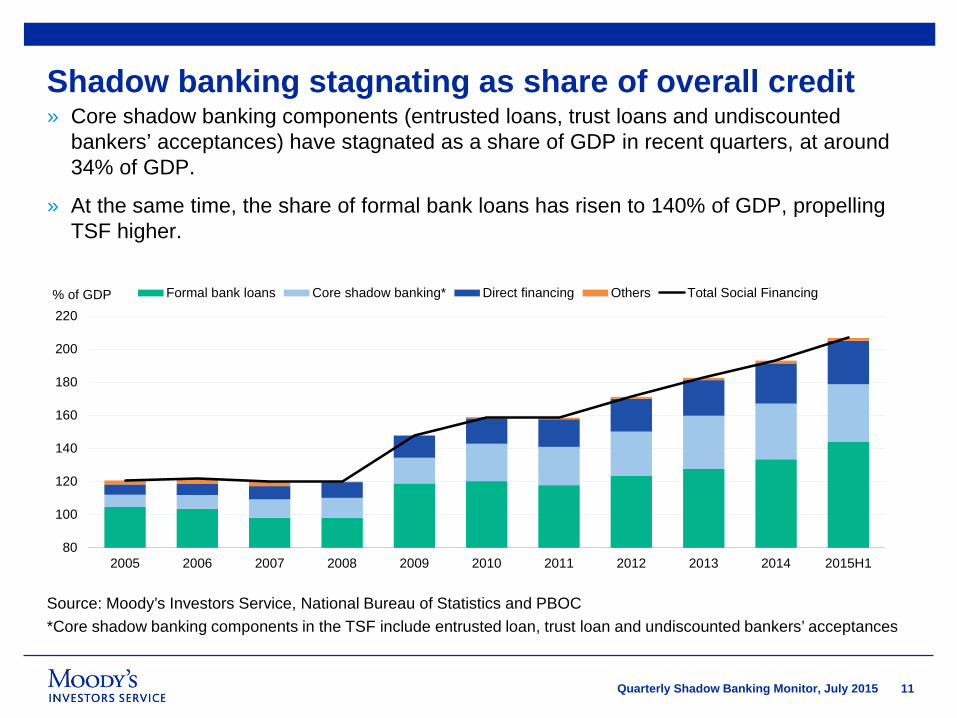
Shadow banking stagnating as share of overall credit» Core shadow banking components (entrusted loans, trust loans and undiscounted
bankers’ acceptances) have stagnated as a share of GDP in recent quarters, at around 34% of GDP.
» At the same time, the share of formal bank loans has risen to 140% of GDP, propelling TSF higher.
Source: Moody’s Investors Service, National Bureau of Statistics and PBOC*Core shadow banking components in the TSF include entrusted loan, trust loan and undiscounted bankers’ acceptances
80
100
120
140
160
180
200
220
2005 2006 2007 2008 2009 2010 2011 2012 2013 2014 2015H1
% of GDP Formal bank loans Core shadow banking* Direct financing Others Total Social Financing
12Quarterly Shadow Banking Monitor, July 2015
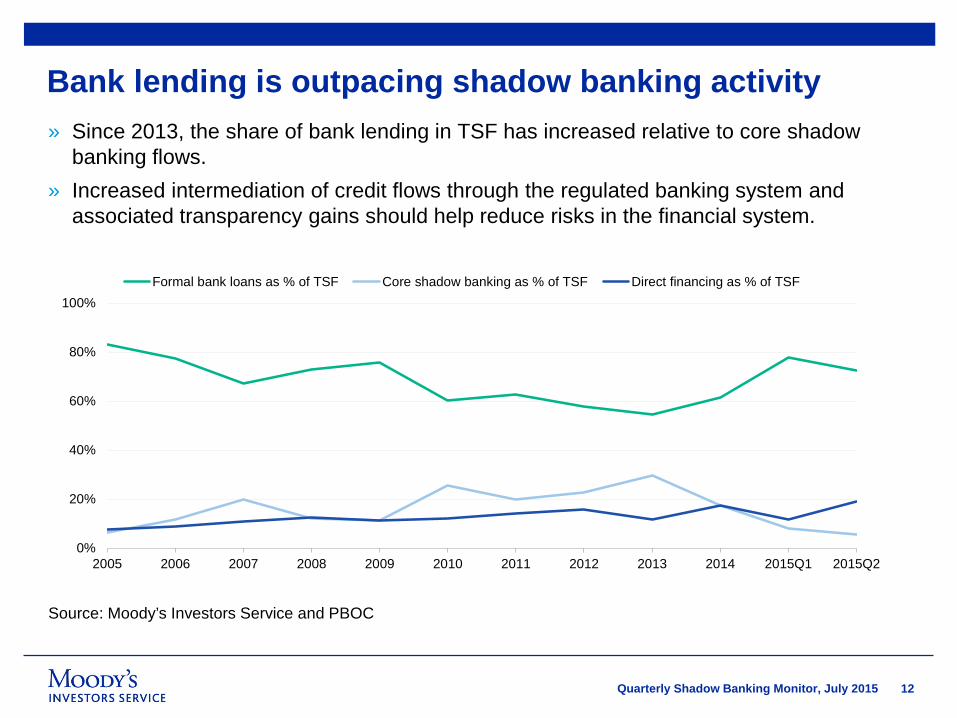
Bank lending is outpacing shadow banking activity
Source: Moody’s Investors Service and PBOC
» Since 2013, the share of bank lending in TSF has increased relative to core shadow banking flows.
» Increased intermediation of credit flows through the regulated banking system and associated transparency gains should help reduce risks in the financial system.
0%
20%
40%
60%
80%
100%
2005 2006 2007 2008 2009 2010 2011 2012 2013 2014 2015Q1 2015Q2
Formal bank loans as % of TSF Core shadow banking as % of TSF Direct financing as % of TSF

13Quarterly Shadow Banking Monitor, July 2015
Composition of Broad Shadow Banking Components3
14Quarterly Shadow Banking Monitor, July 2015
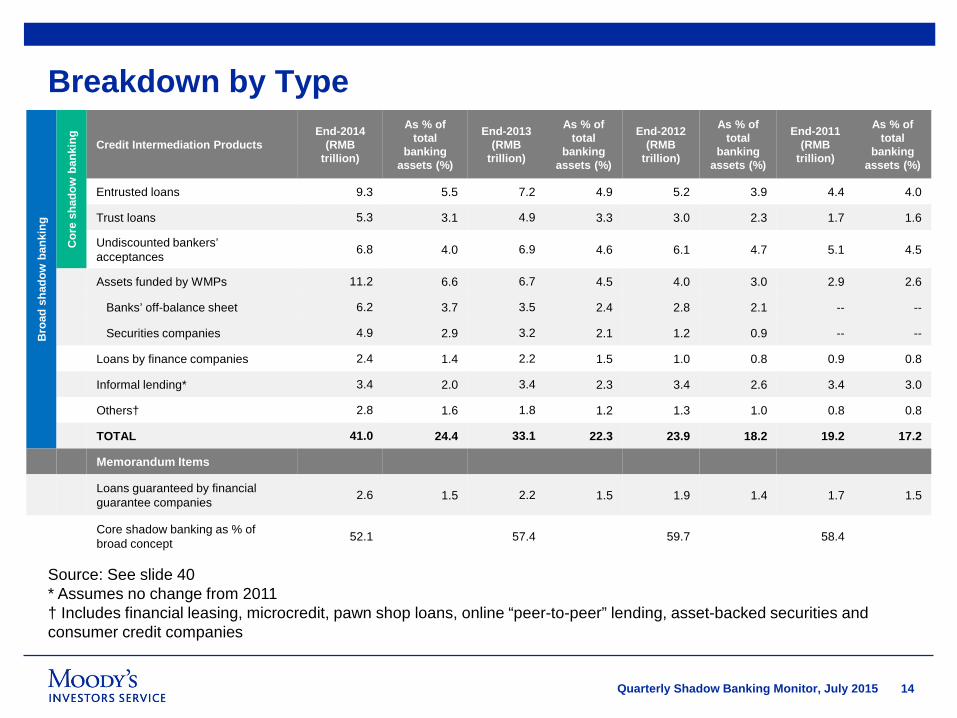
Breakdown by TypeB
road
shad
ow b
anki
ng
Cor
e sh
adow
bank
ing
Credit Intermediation ProductsEnd-2014
(RMB trillion)
As % of total
banking assets (%)
End-2013 (RMB
trillion)
As % of total
banking assets (%)
End-2012 (RMB
trillion)
As % of total
banking assets (%)
End-2011 (RMB
trillion)
As % of total
banking assets (%)
Entrusted loans 9.3 5.5 7.2 4.9 5.2 3.9 4.4 4.0
Trust loans 5.3 3.1 4.9 3.3 3.0 2.3 1.7 1.6
Undiscounted bankers’ acceptances 6.8 4.0 6.9 4.6 6.1 4.7 5.1 4.5
Assets funded by WMPs 11.2 6.6 6.7 4.5 4.0 3.0 2.9 2.6
Banks’ off-balance sheet 6.2 3.7 3.5 2.4 2.8 2.1 -- --
Securities companies 4.9 2.9 3.2 2.1 1.2 0.9 -- --
Loans by finance companies 2.4 1.4 2.2 1.5 1.0 0.8 0.9 0.8
Informal lending* 3.4 2.0 3.4 2.3 3.4 2.6 3.4 3.0
Others† 2.8 1.6 1.8 1.2 1.3 1.0 0.8 0.8
TOTAL 41.0 24.4 33.1 22.3 23.9 18.2 19.2 17.2
Memorandum Items
Loans guaranteed by financial guarantee companies 2.6 1.5 2.2 1.5 1.9 1.4 1.7 1.5
Core shadow banking as % of broad concept 52.1 57.4 59.7 58.4
Source: See slide 40* Assumes no change from 2011† Includes financial leasing, microcredit, pawn shop loans, online “peer-to-peer” lending, asset-backed securities and consumer credit companies
15Quarterly Shadow Banking Monitor, July 2015
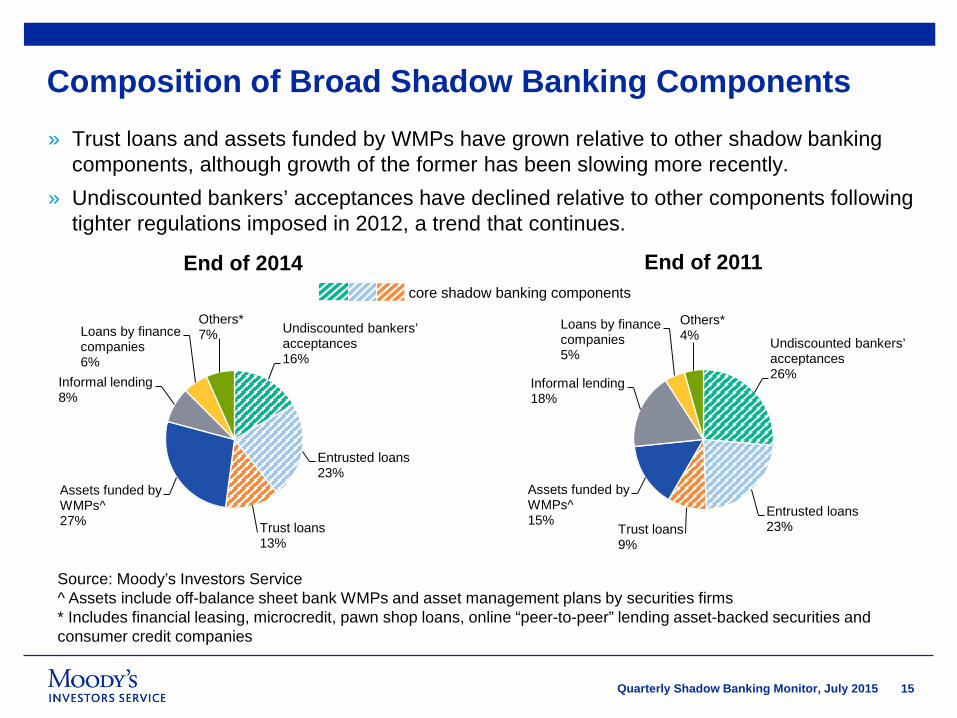
» Trust loans and assets funded by WMPs have grown relative to other shadow banking components, although growth of the former has been slowing more recently.
» Undiscounted bankers’ acceptances have declined relative to other components following tighter regulations imposed in 2012, a trend that continues.
Undiscounted bankers’ acceptances16%
Entrusted loans 23%
Trust loans 13%
Assets funded by WMPs^27%
Informal lending 8%
Loans by finance companies 6%
Others*7%
Composition of Broad Shadow Banking Components
End of 2014 End of 2011
Source: Moody’s Investors Service^ Assets include off-balance sheet bank WMPs and asset management plans by securities firms* Includes financial leasing, microcredit, pawn shop loans, online “peer-to-peer” lending asset-backed securities and consumer credit companies
Undiscounted bankers’ acceptances26%
Entrusted loans 23%Trust loans
9%
Assets funded by WMPs^15%
Informal lending 18%
Loans by finance companies 5%
Others*4%
core shadow banking components
16Quarterly Shadow Banking Monitor, July 2015
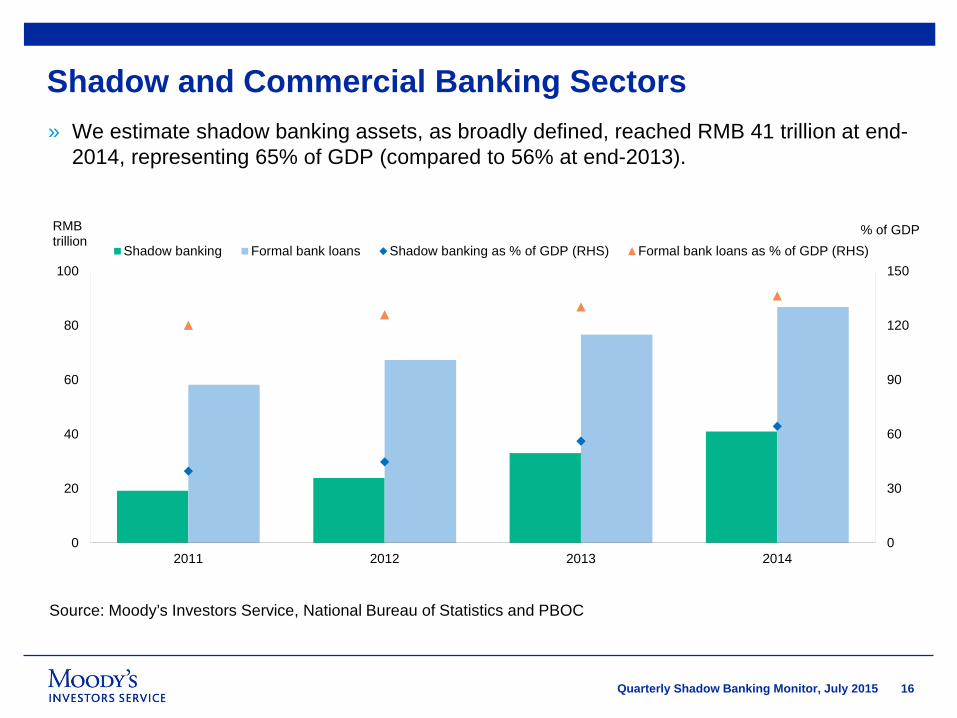
Shadow and Commercial Banking Sectors
Source: Moody’s Investors Service, National Bureau of Statistics and PBOC
» We estimate shadow banking assets, as broadly defined, reached RMB 41 trillion at end-2014, representing 65% of GDP (compared to 56% at end-2013).
0
30
60
90
120
150
0
20
40
60
80
100
2011 2012 2013 2014
% of GDPRMB trillion
Shadow banking Formal bank loans Shadow banking as % of GDP (RHS) Formal bank loans as % of GDP (RHS)
17Quarterly Shadow Banking Monitor, July 2015
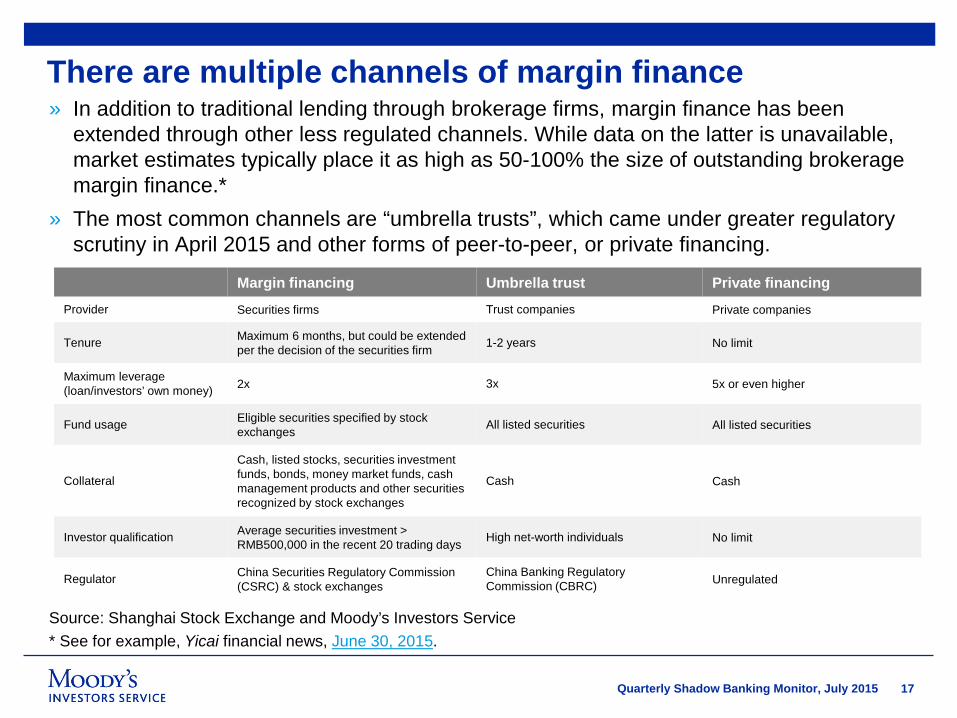
There are multiple channels of margin finance» In addition to traditional lending through brokerage firms, margin finance has been
extended through other less regulated channels. While data on the latter is unavailable, market estimates typically place it as high as 50-100% the size of outstanding brokerage margin finance.*
» The most common channels are “umbrella trusts”, which came under greater regulatory scrutiny in April 2015 and other forms of peer-to-peer, or private financing.
Source: Shanghai Stock Exchange and Moody’s Investors Service* See for example, Yicai financial news, June 30, 2015.
Margin financing Umbrella trust Private financing
Provider Securities firms Trust companies Private companies
Tenure Maximum 6 months, but could be extended per the decision of the securities firm 1-2 years No limit
Maximum leverage (loan/investors’ own money) 2x 3x 5x or even higher
Fund usage Eligible securities specified by stock exchanges All listed securities All listed securities
Collateral
Cash, listed stocks, securities investment funds, bonds, money market funds, cash management products and other securities recognized by stock exchanges
Cash Cash
Investor qualification Average securities investment > RMB500,000 in the recent 20 trading days High net-worth individuals No limit
Regulator China Securities Regulatory Commission (CSRC) & stock exchanges
China Banking Regulatory Commission (CBRC) Unregulated
18Quarterly Shadow Banking Monitor, July 2015
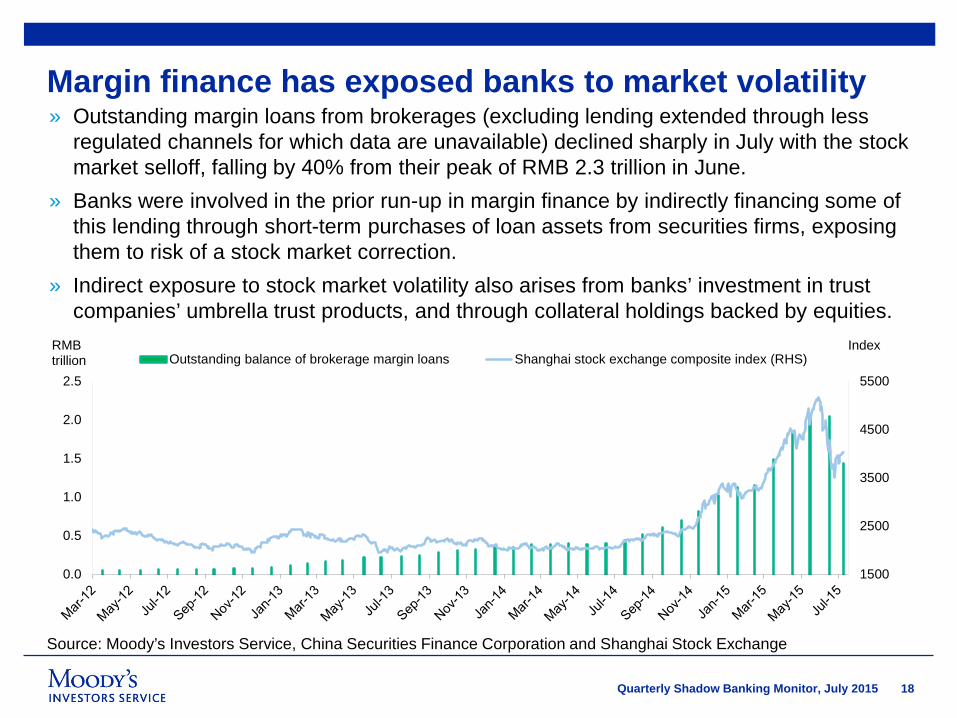
Margin finance has exposed banks to market volatility» Outstanding margin loans from brokerages (excluding lending extended through less
regulated channels for which data are unavailable) declined sharply in July with the stock market selloff, falling by 40% from their peak of RMB 2.3 trillion in June.
» Banks were involved in the prior run-up in margin finance by indirectly financing some of this lending through short-term purchases of loan assets from securities firms, exposing them to risk of a stock market correction.
» Indirect exposure to stock market volatility also arises from banks’ investment in trust companies’ umbrella trust products, and through collateral holdings backed by equities.
Source: Moody’s Investors Service, China Securities Finance Corporation and Shanghai Stock Exchange
1500
2500
3500
4500
5500
0.0
0.5
1.0
1.5
2.0
2.5
IndexRMBtrillion Outstanding balance of brokerage margin loans Shanghai stock exchange composite index (RHS)
19Quarterly Shadow Banking Monitor, July 2015
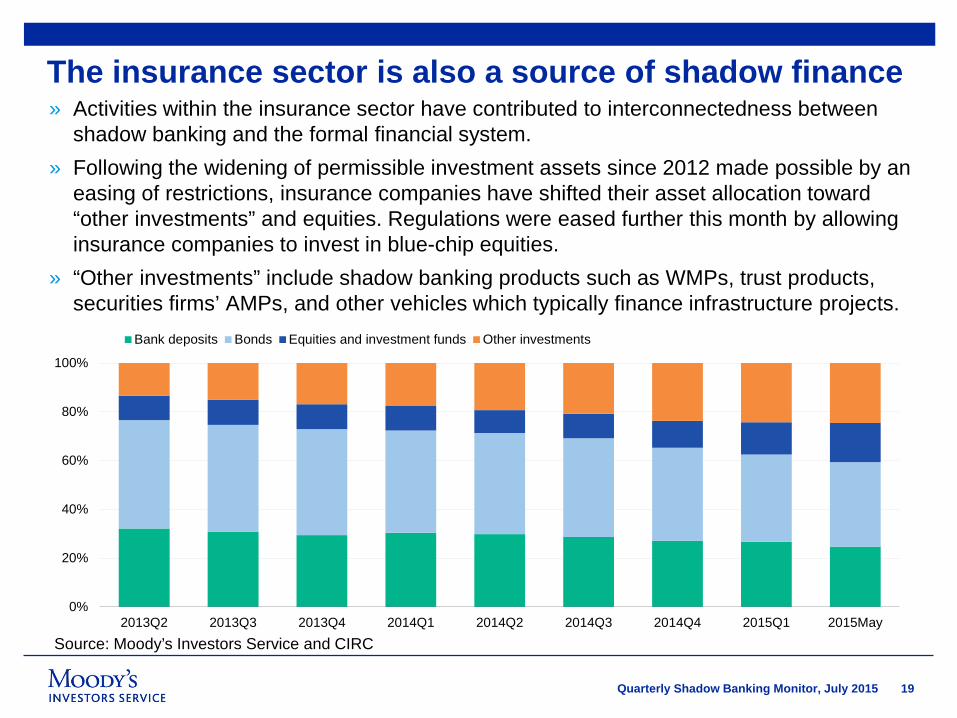
The insurance sector is also a source of shadow finance» Activities within the insurance sector have contributed to interconnectedness between
shadow banking and the formal financial system.» Following the widening of permissible investment assets since 2012 made possible by an
easing of restrictions, insurance companies have shifted their asset allocation toward “other investments” and equities. Regulations were eased further this month by allowing insurance companies to invest in blue-chip equities.
» “Other investments” include shadow banking products such as WMPs, trust products, securities firms’ AMPs, and other vehicles which typically finance infrastructure projects.
Source: Moody’s Investors Service and CIRC
0%
20%
40%
60%
80%
100%
2013Q2 2013Q3 2013Q4 2014Q1 2014Q2 2014Q3 2014Q4 2015Q1 2015May
Bank deposits Bonds Equities and investment funds Other investments
20Quarterly Shadow Banking Monitor, July 2015
Wealth Management Products3a

21Quarterly Shadow Banking Monitor, July 2015
WMPs continued to grow briskly through 2014
Source: Moody’s Investors Service, China Banking Wealth Management Registration System, CBRC and China Banking Association
» Wealth Management Products (WMPs) issued or distributed by Chinese banks rose to RMB 15 trillion at end-2014, accounting for 24% of GDP and equivalent to 13% of outstanding deposits.
0
5
10
15
20
25
0
3
6
9
12
15
18
2007 2008 2009 2010 2011 2012 2013 2014
%RMB trillion WMP outstanding (LHS) As % of GDP (RHS) As % of deposits (RHS)
22Quarterly Shadow Banking Monitor, July 2015
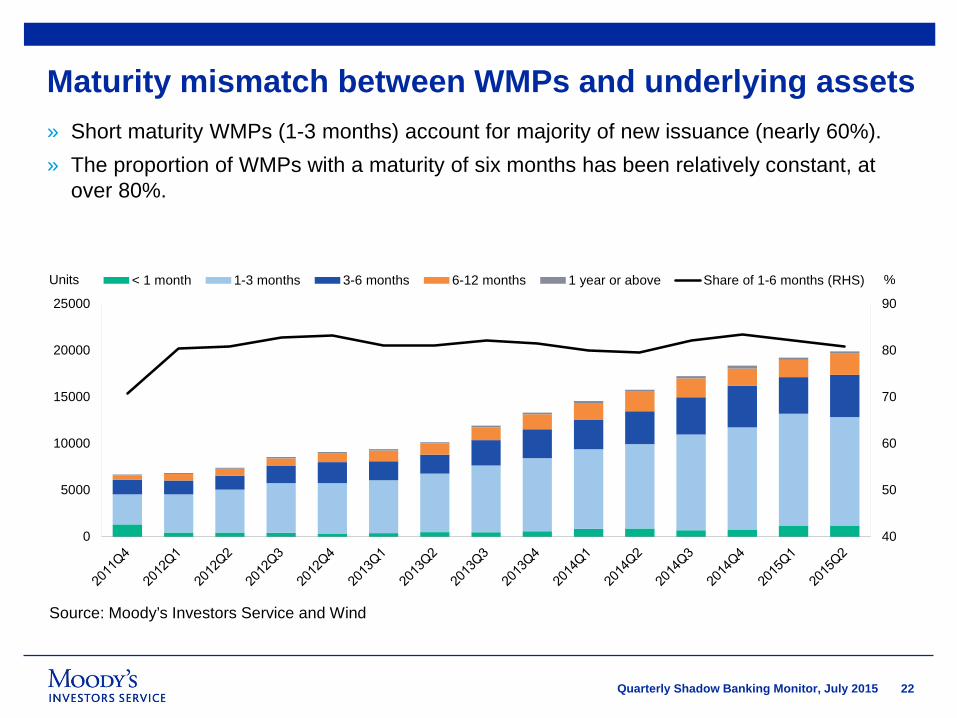
Maturity mismatch between WMPs and underlying assets» Short maturity WMPs (1-3 months) account for majority of new issuance (nearly 60%). » The proportion of WMPs with a maturity of six months has been relatively constant, at
over 80%.
Source: Moody’s Investors Service and Wind
40
50
60
70
80
90
0
5000
10000
15000
20000
25000
%Units < 1 month 1-3 months 3-6 months 6-12 months 1 year or above Share of 1-6 months (RHS)
23Quarterly Shadow Banking Monitor, July 2015
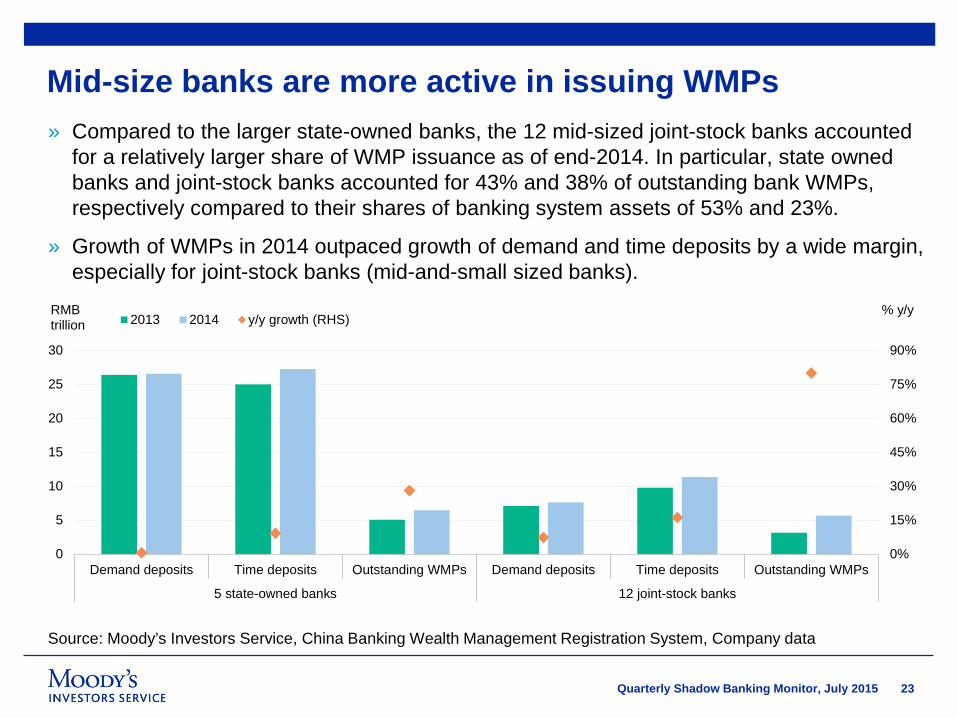
Mid-size banks are more active in issuing WMPs
Source: Moody’s Investors Service, China Banking Wealth Management Registration System, Company data
» Compared to the larger state-owned banks, the 12 mid-sized joint-stock banks accounted for a relatively larger share of WMP issuance as of end-2014. In particular, state owned banks and joint-stock banks accounted for 43% and 38% of outstanding bank WMPs, respectively compared to their shares of banking system assets of 53% and 23%.
» Growth of WMPs in 2014 outpaced growth of demand and time deposits by a wide margin, especially for joint-stock banks (mid-and-small sized banks).
0%
15%
30%
45%
60%
75%
90%
0
5
10
15
20
25
30
Demand deposits Time deposits Outstanding WMPs Demand deposits Time deposits Outstanding WMPs
5 state-owned banks 12 joint-stock banks
% y/yRMBtrillion 2013 2014 y/y growth (RHS)
24Quarterly Shadow Banking Monitor, July 2015
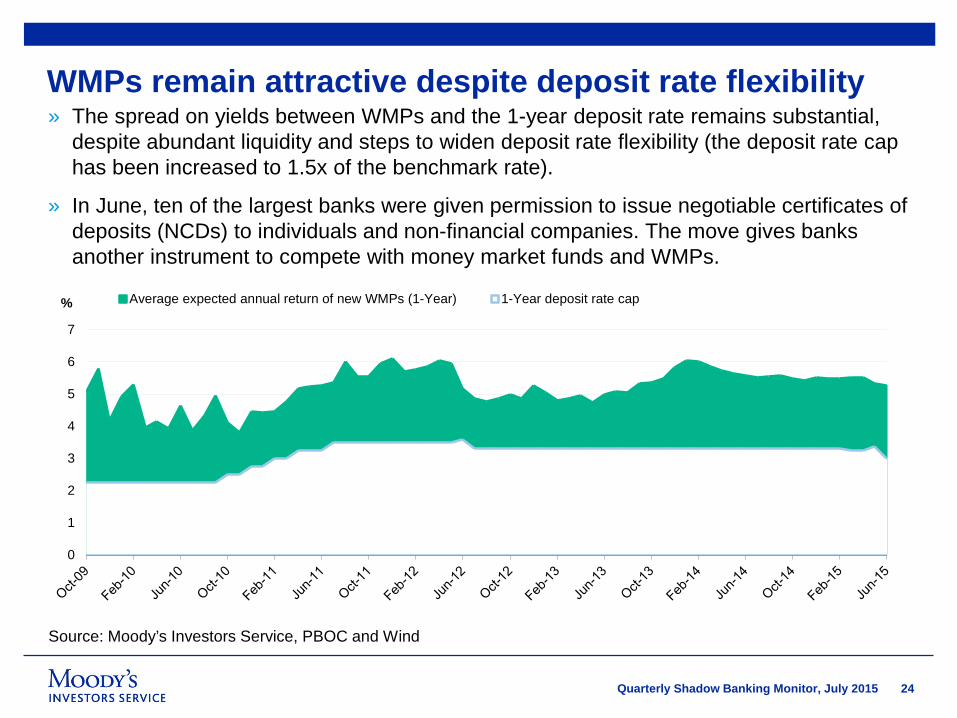
WMPs remain attractive despite deposit rate flexibility
Source: Moody’s Investors Service, PBOC and Wind
» The spread on yields between WMPs and the 1-year deposit rate remains substantial, despite abundant liquidity and steps to widen deposit rate flexibility (the deposit rate cap has been increased to 1.5x of the benchmark rate).
» In June, ten of the largest banks were given permission to issue negotiable certificates of deposits (NCDs) to individuals and non-financial companies. The move gives banks another instrument to compete with money market funds and WMPs.
0
1
2
3
4
5
6
7
Average expected annual return of new WMPs (1-Year) 1-Year deposit rate cap%
25Quarterly Shadow Banking Monitor, July 2015
Trust Sector3b

26Quarterly Shadow Banking Monitor, July 2015
Growth in trust company loans has been slowing
Source: Moody’s Investors Service and China Trustee Association
» The outstanding stock of loans by trust companies has flattened since mid-2014, leading to a decline as a percentage of outstanding total bank loans (6% in 2015 Q1).
» The slowing trend is primarily due to tighter regulations on off-balance sheet lending by banks and restrictions on borrowing by local government financing vehicles (LGFVs), and to a lesser extent weaker credit demand from lower economic growth.
0
2
4
6
8
0
2
4
6
%RMBtrillion
Loans made by Trusts Trust loan as % of bank loan (RHS)

27Quarterly Shadow Banking Monitor, July 2015
Changing Exposure of Trust Assets by Sectors
Source: Moody’s Investors Service and China Trustee Association
» Under pressure from tighter regulations, trust sector assets have been shifting away from loans to businesses and the infrastructure and property sectors (although exposure is still substantial at around 1/3 of the total), toward financial sector activities.
» It remains to be seen what impact, if any, recent stock market volatility and tighter regulations on umbrella trusts will have on these trends.
0%
20%
40%
60%
80%
100%
2010 2011 2012 2013 2014 2015Q1
Infrastructure and property Non-financial enterprises Financial institutions and securities markets Others
28Quarterly Shadow Banking Monitor, July 2015
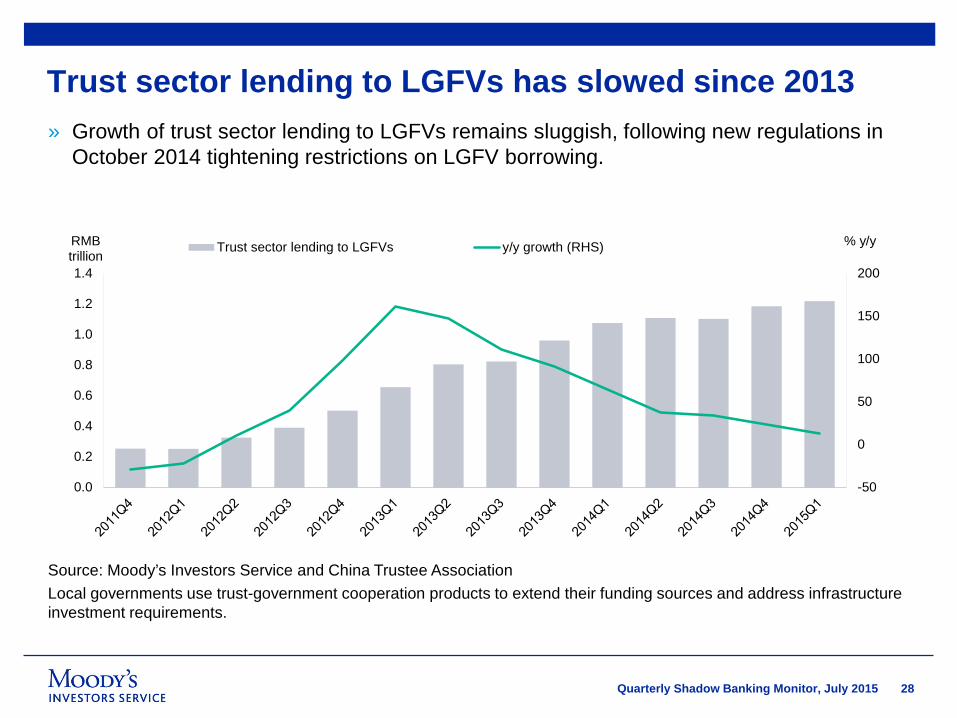
Trust sector lending to LGFVs has slowed since 2013
Source: Moody’s Investors Service and China Trustee AssociationLocal governments use trust-government cooperation products to extend their funding sources and address infrastructure investment requirements.
» Growth of trust sector lending to LGFVs remains sluggish, following new regulations in October 2014 tightening restrictions on LGFV borrowing.
-50
0
50
100
150
200
0.0
0.2
0.4
0.6
0.8
1.0
1.2
1.4
% y/yRMBtrillion
Trust sector lending to LGFVs y/y growth (RHS)

29Quarterly Shadow Banking Monitor, July 2015
Leverage of trust companies increased further in 2014» Leverage in the trust sector has continued to climb despite tighter regulatory policies.
Source: Moody’s Investors Service and Company data
0
10
20
30
40
50
60
2005 2006 2007 2008 2009 2010 2011 2012 2013 2014
Asset under management / Equity All trust companies Top 10 (ranked by 2014 Asset under Management)
30Quarterly Shadow Banking Monitor, July 2015
Securitization 4

31Quarterly Shadow Banking Monitor, July 2015
New issuance trend continues with more diversification
Note: In the years 2009-2011, there was no issuance.CLO refers to Collateralized Loan Obligations; Auto ABS refers to Auto Loans Asset Backed Securities; RMBS refers to Residential Mortgage Backed Securities; Source: China Central Depository & Clearing Co., Ltd, Shanghai Clearing House and Moody’s Investors Service
» New structured finance deals issued in China’s securitization market under the Credit Asset Securitization (CAS) scheme regulated by PBOC and CBRC remained robust in the second quarter. New Auto ABS issuance in Q2 has exceeded the aggregated amount in 2014, suggesting an increasingly diversification of the asset class.
» Size of China’s CAS market remains small compared to either formal or shadow banking system, accounting for merely 1.3% of total TSF flows in 2015 H1.
0
50
100
150
200
250
300
2005 2006 2007 2008 2012 2013 2014 2015Q1 2015Q2
RMBbillion CLO Auto ABS RMBS Consumer Loans Finance Leasing ABS
32Quarterly Shadow Banking Monitor, July 2015
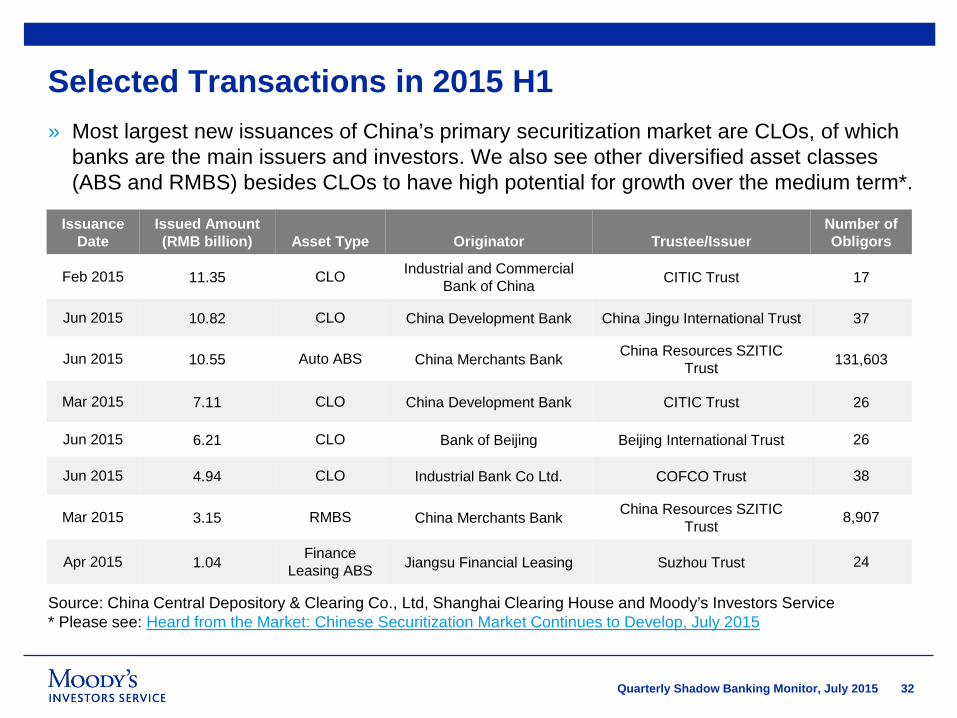
Selected Transactions in 2015 H1
Source: China Central Depository & Clearing Co., Ltd, Shanghai Clearing House and Moody’s Investors Service* Please see: Heard from the Market: Chinese Securitization Market Continues to Develop, July 2015
Issuance Date
Issued Amount (RMB billion) Asset Type Originator Trustee/Issuer
Number of Obligors
Feb 2015 11.35 CLO Industrial and Commercial Bank of China CITIC Trust 17
Jun 2015 10.82 CLO China Development Bank China Jingu International Trust 37
Jun 2015 10.55 Auto ABS China Merchants Bank China Resources SZITIC Trust 131,603
Mar 2015 7.11 CLO China Development Bank CITIC Trust 26
Jun 2015 6.21 CLO Bank of Beijing Beijing International Trust 26
Jun 2015 4.94 CLO Industrial Bank Co Ltd. COFCO Trust 38
Mar 2015 3.15 RMBS China Merchants Bank China Resources SZITIC Trust 8,907
Apr 2015 1.04 Finance Leasing ABS Jiangsu Financial Leasing Suzhou Trust 24
» Most largest new issuances of China’s primary securitization market are CLOs, of which banks are the main issuers and investors. We also see other diversified asset classes (ABS and RMBS) besides CLOs to have high potential for growth over the medium term*.

33Quarterly Shadow Banking Monitor, July 2015
Regulatory Updates & Market Events5
34Quarterly Shadow Banking Monitor, July 2015
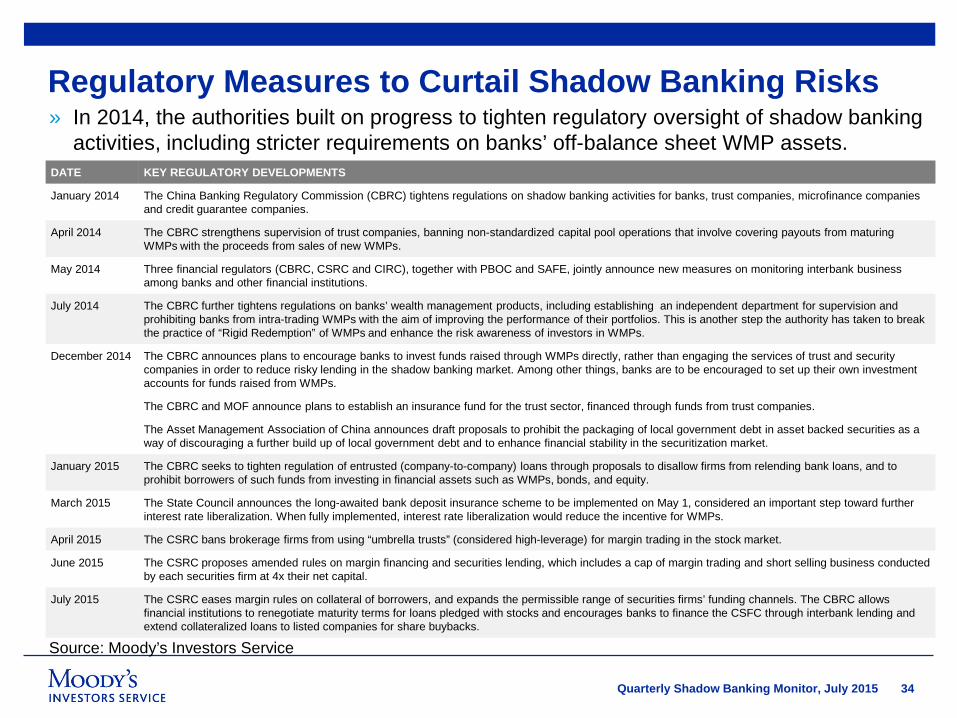
Regulatory Measures to Curtail Shadow Banking Risks
Source: Moody’s Investors Service
DATE KEY REGULATORY DEVELOPMENTS
January 2014 The China Banking Regulatory Commission (CBRC) tightens regulations on shadow banking activities for banks, trust companies, microfinance companies and credit guarantee companies.
April 2014 The CBRC strengthens supervision of trust companies, banning non-standardized capital pool operations that involve covering payouts from maturing WMPs with the proceeds from sales of new WMPs.
May 2014 Three financial regulators (CBRC, CSRC and CIRC), together with PBOC and SAFE, jointly announce new measures on monitoring interbank business among banks and other financial institutions.
July 2014 The CBRC further tightens regulations on banks’ wealth management products, including establishing an independent department for supervision and prohibiting banks from intra-trading WMPs with the aim of improving the performance of their portfolios. This is another step the authority has taken to break the practice of “Rigid Redemption” of WMPs and enhance the risk awareness of investors in WMPs.
December 2014 The CBRC announces plans to encourage banks to invest funds raised through WMPs directly, rather than engaging the services of trust and security companies in order to reduce risky lending in the shadow banking market. Among other things, banks are to be encouraged to set up their own investment accounts for funds raised from WMPs.
The CBRC and MOF announce plans to establish an insurance fund for the trust sector, financed through funds from trust companies.
The Asset Management Association of China announces draft proposals to prohibit the packaging of local government debt in asset backed securities as a way of discouraging a further build up of local government debt and to enhance financial stability in the securitization market.
January 2015 The CBRC seeks to tighten regulation of entrusted (company-to-company) loans through proposals to disallow firms from relending bank loans, and to prohibit borrowers of such funds from investing in financial assets such as WMPs, bonds, and equity.
March 2015 The State Council announces the long-awaited bank deposit insurance scheme to be implemented on May 1, considered an important step toward further interest rate liberalization. When fully implemented, interest rate liberalization would reduce the incentive for WMPs.
April 2015 The CSRC bans brokerage firms from using “umbrella trusts” (considered high-leverage) for margin trading in the stock market.
June 2015 The CSRC proposes amended rules on margin financing and securities lending, which includes a cap of margin trading and short selling business conducted by each securities firm at 4x their net capital.
July 2015 The CSRC eases margin rules on collateral of borrowers, and expands the permissible range of securities firms’ funding channels. The CBRC allows financial institutions to renegotiate maturity terms for loans pledged with stocks and encourages banks to finance the CSFC through interbank lending and extend collateralized loans to listed companies for share buybacks.
» In 2014, the authorities built on progress to tighten regulatory oversight of shadow banking activities, including stricter requirements on banks’ off-balance sheet WMP assets.
35Quarterly Shadow Banking Monitor, July 2015
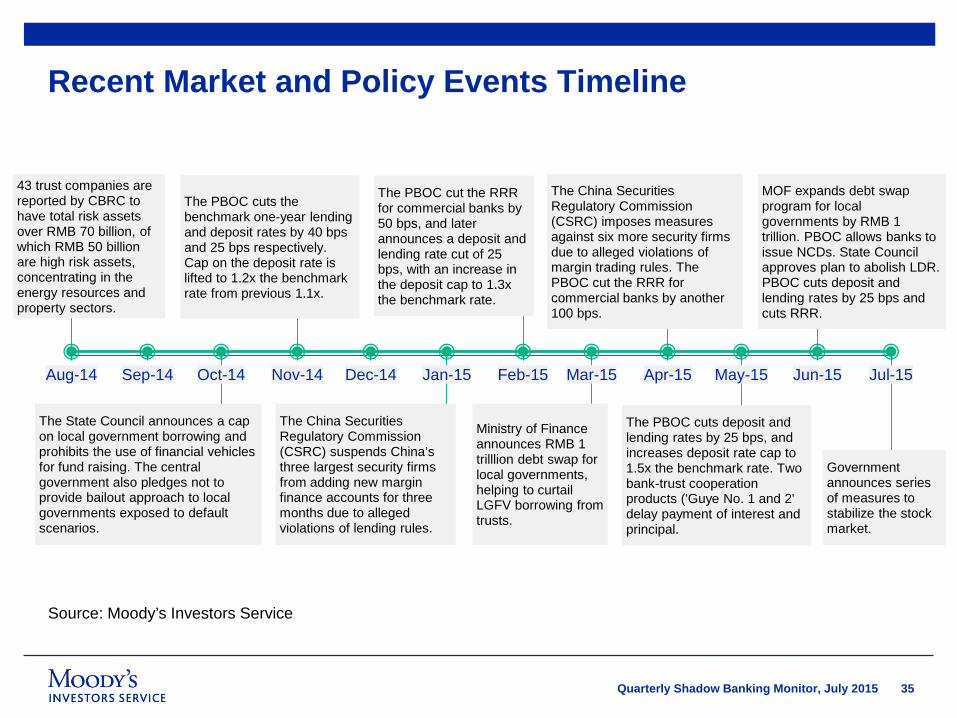
Recent Market and Policy Events Timeline
Source: Moody’s Investors Service
43 trust companies are reported by CBRC to have total risk assets over RMB 70 billion, of which RMB 50 billion are high risk assets, concentrating in the energy resources and property sectors.
The State Council announces a cap on local government borrowing and prohibits the use of financial vehicles for fund raising. The central government also pledges not to provide bailout approach to local governments exposed to default scenarios.
The PBOC cuts the benchmark one-year lending and deposit rates by 40 bps and 25 bps respectively. Cap on the deposit rate is lifted to 1.2x the benchmark rate from previous 1.1x.
The China Securities Regulatory Commission (CSRC) suspends China’s three largest security firms from adding new margin finance accounts for three months due to alleged violations of lending rules.
The PBOC cut the RRR for commercial banks by 50 bps, and later announces a deposit and lending rate cut of 25 bps, with an increase in the deposit cap to 1.3x the benchmark rate.
Ministry of Finance announces RMB 1 trilllion debt swap for local governments, helping to curtail LGFV borrowing from trusts.
The China Securities Regulatory Commission (CSRC) imposes measures against six more security firms due to alleged violations of margin trading rules. The PBOC cut the RRR for commercial banks by another 100 bps.
The PBOC cuts deposit and lending rates by 25 bps, and increases deposit rate cap to 1.5x the benchmark rate. Two bank-trust cooperation products ('Guye No. 1 and 2' delay payment of interest and principal.
MOF expands debt swap program for local governments by RMB 1 trillion. PBOC allows banks to issue NCDs. State Council approves plan to abolish LDR. PBOC cuts deposit and lending rates by 25 bps and cuts RRR.
Government announces series of measures to stabilize the stock market.
Aug-14 Sep-14 Oct-14 Nov-14 Dec-14 Jan-15 Feb-15 Mar-15 Apr-15 May-15 Jun-15 Jul-15
36Quarterly Shadow Banking Monitor, July 2015
Appendix: Glossary6
37Quarterly Shadow Banking Monitor, July 2015
Glossary» Entrusted loans – Loans between companies with banks or other finance institutions (trust
companies, finance companies etc.) acting as agents to the transaction. Borrowers and lenders are familiar with each other. Entrusted loans are treated as off-balance sheet items to banks with very limited underlying credit risk.
» Trust loans – Loans made by Chinese trust companies and often funded through structuring these loans into WMPs with banks acting as distribution channels. Trust loans tend to have elevated levels of credit risks given the underlying borrowers are often from industries more prone to cash flow volatility (property, mining sectors etc.)
» Undiscounted bankers’ acceptances – BAs are short-term debt instruments issued by a company with trade credit guaranteed by a bank. These instruments are not always associated with corporate leverage and are treated as off-balance sheet items to banks.
» Total Social Financing – TSF is an official measure of the PBOC to capture a comprehensive measure of credit supplied by the entire financial system in China. The major components include formal bank loans, shadow banking activities, direct financing (bond and equity issuance) and others (such as microcredit and pawn shops).
» Core shadow banking activity – our definition consists of the following components of TSF: entrusted loans, trust loans, and undiscounted bankers’ acceptances (see slide 14).
» Broad shadow banking activity – our definition consists of core shadow banking activity, plus assets funded by WMPs, loans by finance companies, informal lending, and others (see slide 14).
38Quarterly Shadow Banking Monitor, July 2015
Glossary (cont’d)» Wealth management products – WMPs are usually sold to retail investors through bank retail
channels with higher yields than formal bank deposit rates. WMPs are backed by credit instruments including bonds, interbank placements, bank loans and trust loans, carrying the same credit risks as the underlying assets in which they invest. Banks’ off-balance sheet WMPs are not principal protected. Securities companies also issue WMPs, mainly through “asset management” or “directional” plans for institutional investors, consisting of assets originated by banks.
» Umbrella trust – A type of financing vehicle through which funds from WMPs sold to “senior tranche holders” with a guaranteed rate of return are used for margin loans to high net-worth individuals and private equity firms to set up accounts (“junior tranche holders”) for stock market investment.
39Quarterly Shadow Banking Monitor, July 2015
Data Sources» Slide 7, 8 and 9 – Growth of outstanding shadow banking components is estimated by Moody’s
based on data provided by the People’s Bank of China (PBOC).» Slide 10 – Data from National Bureau of Statistics, PBOC and China Trustee Association.» Slide 11 – Historical Total Social Financing (TSF) stock is estimated by Moody’s based on data
provided by the PBOC. » Slide 12 – Share of each component is calculated based on Total Social Financing (TSF) flows data
provided by the PBOC. Core shadow banking flows include flows of entrusted loans, trust loans and undiscounted bankers’ acceptances.
» Slide 16 – Moody’s calculation is based on data from Asset Management Association of China and China Trustee Association.
» Slide 19 – Data of outstanding brokerage margin loans are collected from China Securities Finance Corporation Limited (CSF).
» Slide 20 – Data from China Insurance Regulatory Commission» Slide 23 – Data of WMPs new issuance are collected from Wind Information.» Slide 24 – Data from the China Banking Wealth Management Registration System» Slide 27, 28 and 29 – China Trustee Association.» Slide 32 and 33 – Data is organized based on public information on websites of China Central
Depository & Clearing Co., Ltd and Shanghai Clearing House.
40Quarterly Shadow Banking Monitor, July 2015
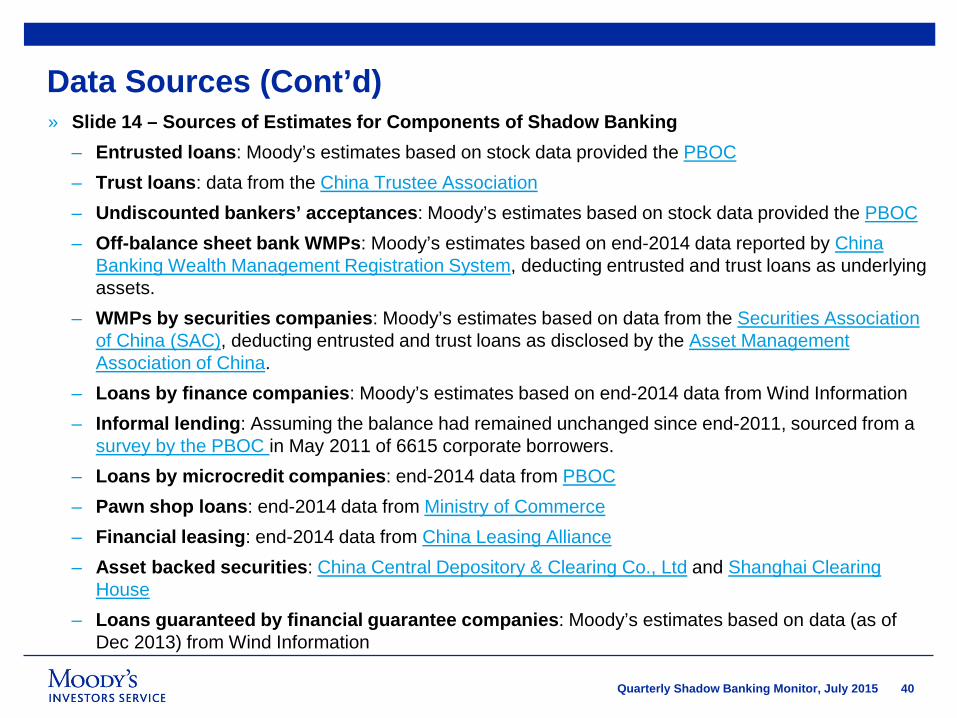
Data Sources (Cont’d)» Slide 14 – Sources of Estimates for Components of Shadow Banking
– Entrusted loans: Moody’s estimates based on stock data provided the PBOC– Trust loans: data from the China Trustee Association– Undiscounted bankers’ acceptances: Moody’s estimates based on stock data provided the PBOC – Off-balance sheet bank WMPs: Moody’s estimates based on end-2014 data reported by China
Banking Wealth Management Registration System, deducting entrusted and trust loans as underlying assets.
– WMPs by securities companies: Moody’s estimates based on data from the Securities Association of China (SAC), deducting entrusted and trust loans as disclosed by the Asset Management Association of China.
– Loans by finance companies: Moody’s estimates based on end-2014 data from Wind Information– Informal lending: Assuming the balance had remained unchanged since end-2011, sourced from a
survey by the PBOC in May 2011 of 6615 corporate borrowers.– Loans by microcredit companies: end-2014 data from PBOC– Pawn shop loans: end-2014 data from Ministry of Commerce – Financial leasing: end-2014 data from China Leasing Alliance– Asset backed securities: China Central Depository & Clearing Co., Ltd and Shanghai Clearing
House– Loans guaranteed by financial guarantee companies: Moody’s estimates based on data (as of
Dec 2013) from Wind Information
41Quarterly Shadow Banking Monitor, July 2015
Notes on Estimates and Calculations» GDP figures used throughout this report are based on the recently revised series of the National Bureau
of Statistics (NBS) based on the third economic census. The revised series results in higher nominal GDP levels, and correspondingly lower ratios compared to our calculations in previous reports.
» Shadow banking estimates for 2014 have been updated, incorporating end-2014 data for off-balance sheet bank WMPs. Entrusted and trust loans as underlying assets have been deducted thanks to improved data transparency. We have retained our estimate for loans guaranteed by financial guarantee companies as a memorandum line given the potential risks posed to banks in the event that guarantee companies are unable to honor their repayment obligations. Our estimate for 2014 is based on the same annual growth as in 2013, and is subject to revision as final data are released from official sources.
» Calculation of “Assets funded by WMPs” (Slide 14):
– Consists of two parts, WMPs structured or distributed by banks off-balance sheet, and asset management or directional plans issued by securities companies. To eliminate double counting, from the former we deduct outstanding “trust-bank cooperation products” provided by the China Trustee Association and entrusted and trust loans as disclosed by China Banking Wealth Management Registration System; from the latter we deduct entrusted and trust loans as disclosed by the Asset Management Association of China.
– While we have made best efforts to eliminate double-counting, it is not possible to eliminate it entirely given the limitations of the data currently available. Nevertheless, we believe that we have been able to reduce it to a level where the impact on our findings is relatively modest.
42Quarterly Shadow Banking Monitor, July 2015
Related Research» Special Comment
– Public Support and Strong Capital Mitigate the Downside Risks for Margin Financing, July 2015
» Sector Comments
– China’s Easier Margin Requirements Are Credit Negative, July 2015
– China’s Removal of Loan-to-Deposit Cap Is Credit Positive for Chinese Banks, June 2015
– Comparing Shadow Banking in the West and China, June 2015
– China Proposes Credit-Positive Change for Margin Financing and Securities Lending Rules, June 2015
– Corporate Distress Is Rising, but Policy Support Will Prevent Systemic Risk, June 2015
– China Will Allow Select Banks to Issue Negotiable Certificates of Deposit, a Credit Positive, June 2015
– China’s Interest Rate Reduction Is Credit Negative for Banks, May 2015
– Quarterly China Shadow Banking Monitor, April 2015
– China’s Securities Lending and Umbrella Trust Measures Are Credit Positive for Securities Companies, April 2015
– China’s Securities Lending and Umbrella Trust Measures Are Credit Positive for Securities Companies, April 2015
– China’s New Deposit Insurance Scheme Is Credit Negative for Small Banks, April 2015
– Shadow Banking in the West and China, January 2015
» Banking System Outlook
– China, January 2015
43Quarterly Shadow Banking Monitor, July 2015
Michael TaylorManaging Director – Credit [email protected]
Stephen SchwartzSenior Vice President – Credit [email protected]
George XuAssociate Analyst – Credit [email protected]
44Quarterly Shadow Banking Monitor, July 2015
© 2015 Moody’s Corporation, Moody’s Investors Service, Inc., Moody’s Analytics, Inc. and/or their licensors and affiliates (collectively, “MOODY’S”). All rights reserved.
CREDIT RATINGS ISSUED BY MOODY'S INVESTORS SERVICE, INC. AND ITS RATINGS AFFILIATES (“MIS”) ARE MOODY’S CURRENT OPINIONS OF THE RELATIVE FUTURE CREDIT RISK OF ENTITIES, CREDIT COMMITMENTS, OR DEBT OR DEBT-LIKE SECURITIES, AND CREDIT RATINGS AND RESEARCH PUBLICATIONS PUBLISHED BY MOODY’S (“MOODY’S PUBLICATIONS”) MAY INCLUDE MOODY’S CURRENT OPINIONS OF THE RELATIVE FUTURE CREDIT RISK OF ENTITIES, CREDIT COMMITMENTS, OR DEBT OR DEBT-LIKE SECURITIES. MOODY’S DEFINES CREDIT RISK AS THE RISK THAT AN ENTITY MAY NOT MEET ITS CONTRACTUAL, FINANCIAL OBLIGATIONS AS THEY COME DUE AND ANY ESTIMATED FINANCIAL LOSS IN THE EVENT OF DEFAULT. CREDIT RATINGS DO NOT ADDRESS ANY OTHER RISK, INCLUDING BUT NOT LIMITED TO: LIQUIDITY RISK, MARKET VALUE RISK, OR PRICE VOLATILITY. CREDIT RATINGS AND MOODY’S OPINIONS INCLUDED IN MOODY’S PUBLICATIONS ARE NOT STATEMENTS OF CURRENT OR HISTORICAL FACT. MOODY’S PUBLICATIONS MAY ALSO INCLUDE QUANTITATIVE MODEL-BASED ESTIMATES OF CREDIT RISK AND RELATED OPINIONS OR COMMENTARY PUBLISHED BY MOODY’S ANALYTICS, INC. CREDIT RATINGS AND MOODY’S PUBLICATIONS DO NOT CONSTITUTE OR PROVIDE INVESTMENT OR FINANCIAL ADVICE, AND CREDIT RATINGS AND MOODY’S PUBLICATIONS ARE NOT AND DO NOT PROVIDE RECOMMENDATIONS TO PURCHASE, SELL, OR HOLD PARTICULAR SECURITIES. NEITHER CREDIT RATINGS NOR MOODY’S PUBLICATIONS COMMENT ON THE SUITABILITY OF AN INVESTMENT FOR ANY PARTICULAR INVESTOR. MOODY’S ISSUES ITS CREDIT RATINGS AND PUBLISHES MOODY’S PUBLICATIONS WITH THE EXPECTATION AND UNDERSTANDING THAT EACH INVESTOR WILL, WITH DUE CARE, MAKE ITS OWN STUDY AND EVALUATION OF EACH SECURITY THAT IS UNDER CONSIDERATION FOR PURCHASE, HOLDING, OR SALE.
MOODY’S CREDIT RATINGS AND MOODY’S PUBLICATIONS ARE NOT INTENDED FOR USE BY RETAIL INVESTORS AND IT WOULD BE RECKLESS FOR RETAIL INVESTORS TO CONSIDER MOODY’S CREDIT RATINGS OR MOODY’S PUBLICATIONS IN MAKING ANY INVESTMENT DECISION. IF IN DOUBT YOU SHOULD CONTACT YOUR FINANCIAL OR OTHER PROFESSIONAL ADVISER.
ALL INFORMATION CONTAINED HEREIN IS PROTECTED BY LAW, INCLUDING BUT NOT LIMITED TO, COPYRIGHT LAW, AND NONE OF SUCH INFORMATION MAY BE COPIED OR OTHERWISE REPRODUCED, REPACKAGED, FURTHER TRANSMITTED, TRANSFERRED, DISSEMINATED, REDISTRIBUTED OR RESOLD, OR STORED FOR SUBSEQUENT USE FOR ANY SUCH PURPOSE, IN WHOLE OR IN PART, IN ANY FORM OR MANNER OR BY ANY MEANS WHATSOEVER, BY ANY PERSON WITHOUT MOODY’S PRIOR WRITTEN CONSENT.
All information contained herein is obtained by MOODY’S from sources believed by it to be accurate and reliable. Because of the possibility of human or mechanical error as well as other factors, however, all information contained herein is provided “AS IS” without warranty of any kind. MOODY'S adopts all necessary measures so that the information it uses in assigning a credit rating is of sufficient quality and from sources MOODY'S considers to be reliable including, when appropriate, independent third-party sources. However, MOODY’S is not an auditor and cannot in every instance independently verify or validate information received in the rating process or in preparing the Moody’s Publications.
To the extent permitted by law, MOODY’S and its directors, officers, employees, agents, representatives, licensors and suppliers disclaim liability to any person or entity for any indirect, special, consequential, or incidental losses or damages whatsoever arising from or in connection with the information contained herein or the use of or inability to use any such information, even if MOODY’S or any of its directors, officers, employees, agents, representatives, licensors or suppliers is advised in advance of the possibility of such losses or damages, including but not limited to: (a) any loss of present or prospective profits or (b) any loss or damage arising where the relevant financial instrument is not the subject of a particular credit rating assigned by MOODY’S.
To the extent permitted by law, MOODY’S and its directors, officers, employees, agents, representatives, licensors and suppliers disclaim liability for any direct or compensatory losses or damages caused to any person or entity, including but not limited to by any negligence (but excluding fraud, willful misconduct or any other type of liability that, for the avoidance of doubt, by law cannot be excluded) on the part of, or any contingency within or beyond the control of, MOODY’S or any of its directors, officers, employees, agents, representatives, licensors or suppliers, arising from or in connection with the information contained herein or the use of or inability to use any such information.
NO WARRANTY, EXPRESS OR IMPLIED, AS TO THE ACCURACY, TIMELINESS, COMPLETENESS, MERCHANTABILITY OR FITNESS FOR ANY PARTICULAR PURPOSE OF ANY SUCH RATING OR OTHER OPINION OR INFORMATION IS GIVEN OR MADE BY MOODY’S IN ANY FORM OR MANNER WHATSOEVER.
Moody’s Investors Service, Inc., a wholly-owned credit rating agency subsidiary of Moody’s Corporation (“MCO”), hereby discloses that most issuers of debt securities (including corporate and municipal bonds, debentures, notes and commercial paper) and preferred stock rated by Moody’s Investors Service, Inc. have, prior to assignment of any rating, agreed to pay to Moody’s Investors Service, Inc. for appraisal and rating services rendered by it fees ranging from $1,500 to approximately $2,500,000. MCO and MIS also maintain policies and procedures to address the independence of MIS’s ratings and rating processes. Information regarding certain affiliations that may exist between directors of MCO and rated entities, and between entities who hold ratings from MIS and have also publicly reported to the SEC an ownership interest in MCO of more than 5%, is posted annually at www.moodys.com under the heading “Investor Relations — Corporate Governance — Director and Shareholder Affiliation Policy.”
For Australia only: Any publication into Australia of this document is pursuant to the Australian Financial Services License of MOODY’S affiliate, Moody’s Investors Service Pty Limited ABN 61 003 399 657AFSL 336969 and/or Moody’s Analytics Australia Pty Ltd ABN 94 105 136 972 AFSL 383569 (as applicable). This document is intended to be provided only to “wholesale clients” within the meaning of section 761G of the Corporations Act 2001. By continuing to access this document from within Australia, you represent to MOODY’S that you are, or are accessing the document as a representative of, a “wholesale client” and that neither you nor the entity you represent will directly or indirectly disseminate this document or its contents to “retail clients” within the meaning of section 761G of the Corporations Act 2001. MOODY’S credit rating is an opinion as to the creditworthiness of a debt obligation of the issuer, not on the equity securities of the issuer or any form of security that is available to retail clients. It would be dangerous for “retail clients” to make any investment decision based on MOODY’S credit rating. If in doubt you should contact your financial or other professional adviser.
For Japan only: Moody's Japan K.K. (“MJKK”) is a wholly-owned credit rating agency subsidiary of Moody's Group Japan G.K., which is wholly-owned by Moody’s Overseas Holdings Inc., a wholly-owned subsidiary of MCO. Moody’s SF Japan K.K. (“MSFJ”) is a wholly-owned credit rating agency subsidiary of MJKK. MSFJ is not a Nationally Recognized Statistical Rating Organization (“NRSRO”). Therefore, credit ratings assigned by MSFJ are Non-NRSRO Credit Ratings. Non-NRSRO Credit Ratings are assigned by an entity that is not a NRSRO and, consequently, the rated obligation will not qualify for certain types of treatment under U.S. laws. MJKK and MSFJ are credit rating agencies registered with the Japan Financial Services Agency and their registration numbers are FSA Commissioner (Ratings) No. 2 and 3 respectively.
MJKK or MSFJ (as applicable) hereby disclose that most issuers of debt securities (including corporate and municipal bonds, debentures, notes and commercial paper) and preferred stock rated by MJKK or MSFJ (as applicable) have, prior to assignment of any rating, agreed to pay to MJKK or MSFJ (as applicable) for appraisal and rating services rendered by it fees ranging from JPY200,000 to approximately JPY350,000,000.
MJKK and MSFJ also maintain policies and procedures to address Japanese regulatory requirements.