Monthly Market Report - iso-ne.com › ... › documents › 2016 › 01 ›...
63
Monthly Market Operations Report Page 1 of 63 December 2015 ISO-NE PUBLIC 2016 ISO New England Inc. Monthly Market Operations Report December 2015 © ISO New England Inc. Market Analysis and Settlements JANUARY 12, 2016 ISO-NE PUBLIC
Transcript of Monthly Market Report - iso-ne.com › ... › documents › 2016 › 01 ›...

Monthly Market Operations Report Page 1 of 63
December 2015 ISO-NE PUBLIC 2016 ISO New England Inc.
Monthly Market Operations Report December 2015
ISO-NE PUBLIC
© ISO New England Inc. Market Analysis and Settlements
JANUARY 12, 2016
ISO-NE PUBLIC

Monthly Market Operations Report Page 2 of 63
December 2015 ISO-NE PUBLIC 2016 ISO New England Inc.
1. Introduction
1.1 About ISO New England
Created in 1997, ISO New England Inc. (the ISO) is the not-for-profit regional transmission organization (RTO) responsible for the day-to-day reliable operation of New England’s bulk power generation and transmission system, oversight and administration of the region’s wholesale electricity markets, and management of a comprehensive regional bulk power system planning process.
1.2 Market Reporting
The ISO’s FERC Electric Tariff No. 3, Section III – Market Rule 1 – Standard Market Design, Appendix A – Market Monitoring, Reporting and Market Power Mitigation Section III.A.11.2.1 requires the ISO to publish a monthly report, “which will be available to the public...containing an overview of the market’s performance in the most recent period.”
The ISO produces many reports that summarize the operations of New England’s wholesale electricity markets. The weekly report provides summaries of key market activities for the trading week encompassing Monday-Sunday. This report, generally posted on Wednesdays, can be found on the ISO’s web site here1. This report is also supplemented by a Mid-Week Market Update, generally posted on Fridays, that reports pricing and congestion highlights from Monday through Thursday. This update may be accessed here. There is also a summary of weekly Net Commitment Period Compensation (NCPC) credits posted here.
Monthly summaries of certain wholesale market concepts are reported monthly by the ISO’s Chief Operating Officer at the NEPOOL Participants Committee Meeting. These summaries are posted on the ISO’s web site here, under the link entitled “Materials.”
Additionally, in compliance with federal requirements, the ISO issues quarterly reports of key statistics for the region's wholesale electric power markets. These reports can be found on the ISO’s web site here2.
1.3 About This Report
This report summarizes aspects of New England’s wholesale electricity markets that are generally not discussed in the first two reports noted above. There are many interrelationships between the various markets that the ISO administers – each of the concepts presented in this report may interact with others, and second order effects cannot be included here. Additional information can be found on the ISO’s web site here
1 Select “Weekly Markets Reports” from the document type filter on the left hand side of the page.
2 Select “Quarterly Markets Reports” from the document type filter on the left hand side of the page.

Monthly Market Operations Report Page 3 of 63
December 2015 ISO-NE PUBLIC 2016 ISO New England Inc.
2. Table of Contents
1. Introduction ........................................................................................................................................ 2 1.1 About ISO New England ............................................................................................................ 2 1.2 Market Reporting ..................................................................................................................... 2 1.3 About This Report ..................................................................................................................... 2
2. Table of Contents ............................................................................................................................... 3
3. Monthly Summary .............................................................................................................................. 5
4. Locational Marginal Prices (LMPs)...................................................................................................... 7 4.1 LMP Summary Statistics .......................................................................................................... 7
4.1.1 All Hours, December 2015 ............................................................................................. 7 4.1.2 On-Peak Hours, December 2015 ................................................................................... 8 4.1.3 Off-Peak Hours, December 2015 ................................................................................... 8
4.2 LMP Graphs, Day-Ahead Market, 13 Months Ending December 2015 .................................... 9 4.3 LMP Graphs, Real-Time Market, 13 Months Ending December 2015 .................................... 11 4.4 For More Information ............................................................................................................. 13
5. Imports and Exports ......................................................................................................................... 14 5.1 Net Interchange Summary, December 2015 .......................................................................... 14
5.1.1 Day-Ahead and Real-Time Market Summary by Interface ......................................... 14
5.2 Day-Ahead and Real-Time Net Interchange Summary, Last 13 Months ................................ 15 5.3 Net Interchange Summary by Interface, Last 13 Months ...................................................... 17 5.4 For More Information ............................................................................................................. 23
6. Financial Transmission Rights (FTR) Auctions .................................................................................. 24 6.1 FTR Auction Results ................................................................................................................ 24
6.1.1 Monthly Auction Summary, December 2015 .............................................................. 24 6.1.2 Number of Auction Participants, December 2015 ....................................................... 24 6.1.3 Monthly FTR Auction Results, Last 13 Months ............................................................ 24
6.2 Monthly FTR Auction Results, Last 13 Months ....................................................................... 25 6.3 Auction Value, Last 13 Months ............................................................................................... 29 6.4 For More Information ............................................................................................................. 32
7. Effectiveness of FTRs ........................................................................................................................ 33 7.1 FTRs as a Congestion Hedging Instrument ............................................................................. 33 7.2 Profitability of Monthly FTRs, 13 Mos. Ending December 2015, On-Peak Hours, in $/MWh, from Hub to Load Zones ............................................................................................................... 34
8. Auction Revenue Rights .................................................................................................................... 36
Section 8 ............................................................................................................................................... 37 8.1 For More Information ............................................................................................................. 37
Monthly Market Operations Report Page 4 of 63
December 2015 ISO-NE PUBLIC 2016 ISO New England Inc.
9. Reserve Markets ............................................................................................................................... 39
Section 9 ............................................................................................................................................... 39 9.1 Forward Reserve Market Results ............................................................................................ 39
9.1.1 FRM Payment Summary by Reserve Zone, December 2015 ....................................... 39 9.1.2 FRM Charge Summary by Load Zone, December 2015 ............................................... 40
9.2 Real-Time On-Peak LMP vs. Forward Reserve Threshold Price, Last 13 Mos. ....................... 41 9.3 Composition of Forward Reserve Market Payments, Last 13 Mos. ....................................... 41 9.4 Real-Time Reserve Markets .................................................................................................... 42 9.5 For More Information ............................................................................................................. 43
10. Regulation Market .......................................................................................................................... 45 10.1 Monthly Average of Hourly Regulation Market Clearing Price, Last 13 Months ................. 45 10.2 Monthly Regulation Market Clearing Price Statistics, Last 13 Months ................................ 45 10.3 Components of Monthly Regulation Market Cost, Last 13 Months ..................................... 47 10.4 For More Information ........................................................................................................... 47
11. Marginal Loss Revenue Fund .......................................................................................................... 49 11.1 Marginal Loss Revenue Fund by Month, 13 Mos. Ending December 2015 .......................... 49 11.2 For More Information ........................................................................................................... 49
12. Forward Capacity Market ............................................................................................................... 50 12.1 FCM Auction Results and Monthly Modifications ................................................................ 50 12.2 FCM Payments and Charges ................................................................................................. 51 12.3 PER Adjustment .................................................................................................................... 54 12.4 Sources of Capacity ............................................................................................................... 55 12.5 Capacity Imports ................................................................................................................... 56 12.6 Performance ......................................................................................................................... 56
12.6.1 Generation and Import Resource Availability ............................................................ 57 12.6.2 Demand Resource Performance ................................................................................ 57
12.7 For More Information ........................................................................................................... 59
13. Energy Market Payments to Demand Assets ................................................................................. 60 13.1 Transitional Demand Response ............................................................................................ 60
13.1.1 Transitional Demand Response Payments ................................................................ 60 13.1.2 Transitional Demand Response Charges ................................................................... 60
13.2 For More Information: .......................................................................................................... 62
15. Document History ......................................................................................................................... 63

Monthly Market Operations Report Page 5 of 63
December 2015 ISO-NE PUBLIC 2016 ISO New England Inc.
3. Monthly Summary
Day-ahead and real-time LMPs at the New England Hub averaged $22.42/MWh and $21.35/MWh, respectively, during December 2015. Day-ahead and real-time prices at the Hub and in the Load Zones averaged 17-28% lower than November 2015 averages. In the aggregate, December 2015 day-ahead and real-time LMPs were approximately 49% lower during December 2015 than in December 2014. Average natural gas prices were 63% below the prior year’s average prices, while residual fuel prices were down 52% from a year ago.
Overall, the average of the hourly real-time LMPs at the Hub and in the Load Zones ranged between 5.7% lower than day-ahead in the Vermont (VT) Load Zone to 3.9% lower than its day-ahead counterpart in the Southeastern Massachusetts (SEMA) Load Zone. In the Day-Ahead Market, Load Zone average LMPs ranged between 2.0% lower than the Hub average LMPs in the Maine (ME) Load Zone to 0.3% higher than the Hub in the Rhode Island (RI) Load Zone. In the Real-Time Market, Load Zone average LMPs ranged between 2.4% lower than the Hub average LMPs in the ME Load Zone to 1.2% higher than the Hub in the SEMA Load Zone. Price differentials between on-peak and off-peak hours at the Hub and in the Load Zones ranged between 60% and 91% in both the Day-Ahead and Real-Time Markets.
The New England Control Area was a net importer of electricity in the Real-Time Market during December. In the Day-Ahead Energy Market, there were approximately 252,000 MWh of total exports and 2,018,000 MWh of imports, yielding a net import of approximately 1,766,000 MWh. In the Real-Time Energy Market, there were approximately 309,000 MWh of total exports and 1,895,000 MWh of imports, yielding a net import of approximately 1,585,000 MWh. This was about 873,000 MW lower than a year ago. On December 15, 2015, ISO New England and the New York ISO implemented a new scheduling protocol on the New York Northern AC ties. Coordinated Transaction Scheduling (CTS) moves Real-Time scheduling and settlement to a 15-minute level on this interface only. Read more about CTS here.
The Monthly FTR Auction (December 2015) had 32 participants and the awarded value of FTRs in the auction totaled $697K. This represented a decline of $21K from the previous month and a decrease of about $342K from the prior year’s monthly FTR auction. The allocation of FTR Auction Revenue for December 2015 resulted in $2.1 million awarded to eligible entities, with $124K allocated to Incremental Auction Revenue Rights (IARR).
The Marginal Loss Revenue Fund totaled $1.9 million for December, down $1.3 million from its November 2015 total.
Total Forward Reserve Credits to eligible assets of $4.1 million were reduced by $34K in Failure to Reserve Penalties and $2K in Failure to Activate Penalties during December 2015. The net Forward Reserve Payment of $4.1 million represented 99% of the maximum possible payment of $4.2 million. Real-Time Reserve Prices occurred in 56 separate hours during the month, and those yielded real-time payments to designated assets of $720K. These payments were reduced by Forward Reserve Energy Obligation Charges totaling $231K yielding a net compensation of $491K during the month.
Regulation Market Payments totaled $1.6 million during the month, a decrease of $70K from the November 2015 value of $1.7 million.

Monthly Market Operations Report Page 6 of 63
December 2015 ISO-NE PUBLIC 2016 ISO New England Inc.
For the month of December 2015, Forward Capacity payments were made to a total of 33,662 MW of eligible capacity and totaled $93.5 million.
The Transitional Demand Response program is the method through which demand assets can participate in the Energy Market. Payments during December 2015 totaled $57K for interruptions associated with Day Ahead, $40K for interruptions associated with the Real Time, and $7K associated with FCM/Audit. Total Transitional Demand Response payments for the month, $104K, were down approximately $3K from their November levels.

Monthly Market Operations Report Page 7 of 63
December 2015 ISO-NE PUBLIC 2016 ISO New England Inc.
4. Locational Marginal Prices (LMPs)
Under Standard Market Design (SMD), the LMP is the cost of supplying an increment of load at a particular location. LMPs are calculated for each Internal and External Node as well as the eight Load Zones and the internal Hub in both the Day-Ahead and Real-Time Markets. LMPs are made up of three components: energy, congestion and marginal loss. The energy component of an LMP is the cost of providing an additional MW of energy to the distributed market reference bus. In any hour, the energy component is the same for all locations, while the congestion and marginal loss components vary among locations. If there were no congestion and losses, LMPs would be the same for all locations. Although the three components of the LMP are separated in some stages of the accounting process, the cost of energy at a location is the total LMP.
The following tables summarize Hub, zonal, and external node LMPs during the month on an overall, on-peak, and off-peak basis. On-peak hours are weekdays between 7:00 a.m. and 11:00 p.m. Off-peak hours are weekdays between 11:00 p.m. and 7:00 a.m., Saturdays, Sundays, and North American Electric Reliability Council (NERC) holidays.
4.1 LMP Summary Statistics
The following tables show summary statistics for LMPs for the Hub, eight internal Load Zones, and five external nodes for both the Day-Ahead and Real-Time Markets:
4.1.1 All Hours, December 2015
Hub/Zone/ Ext. Node
Avg DA LMP
($/MWh)
Avg RT LMP
($/MWh)
Min DA LMP
($/MWh)
Min RT LMP
($/MWh)
Max DA LMP
($/MWh)
Max RT LMP
($/MWh)
DA % of Hub
RT % of
Hub RT % of DA
DA Std Dev
RT Std Dev
RT Std/DA
Std
Hub $22.42 $21.35 $0.00 -$118.74 $68.71 $350.03 52% 50% 95.2% $10.18 $21.05 2.07
ME $21.97 $20.83 $0.00 -$113.15 $67.63 $348.08 51% 49% 94.8% $9.93 $20.65 2.08
NH $22.33 $21.18 -$0.31 -$115.81 $68.50 $350.49 52% 50% 94.8% $10.13 $20.92 2.06
VT $22.32 $21.04 $0.00 -$115.58 $66.94 $340.98 52% 50% 94.3% $10.03 $20.59 2.05
CT $22.26 $21.26 $0.00 -$118.86 $67.00 $348.14 52% 50% 95.5% $10.02 $20.90 2.08
RI $22.34 $21.40 $0.00 -$119.26 $68.16 $348.62 52% 50% 95.8% $10.08 $21.05 2.09
SEMA $22.47 $21.60 $0.00 -$118.78 $69.62 $350.52 52% 51% 96.1% $10.25 $21.24 2.07
WCMA $22.47 $21.38 $0.00 -$118.83 $68.53 $350.47 52% 50% 95.2% $10.18 $21.06 2.07
NEMA $22.48 $21.54 $0.00 -$118.40 $69.74 $355.02 52% 51% 95.8% $10.29 $21.30 2.07
NB Ext $20.90 $19.93 $0.00 -$108.95 $63.61 $339.75 49% 47% 95% $9.32 $19.90 2.13
NYN Ext3 $21.93 $20.21 $0.00 -$138.99 $60.42 $337.46 51% 48% 92% $9.60 $20.89 2.18
HQ Ext $21.98 $21.01 $0.00 -$116.15 $67.82 $347.25 51% 49% 96% $10.00 $20.78 2.08
HG Ext $20.71 $19.41 $0.00 -$107.11 $62.23 $315.71 48% 46% 94% $9.28 $19.11 2.06
CSC Ext $22.28 $21.95 $0.00 -$119.10 $66.71 $352.35 52% 52% 99% $10.03 $21.52 2.15
NNC Ext $22.24 $21.25 $0.00 -$119.53 $66.23 $348.11 52% 50% 96% $9.93 $20.85 2.10
3 CTS has changed settlement to a 15-minute level on this interface in the Real-Time Market. The values shown here are computed over all
of the hours (pre-CTS) and 15-minute intervals (post-CTS implementation) during the month.

Monthly Market Operations Report Page 8 of 63
December 2015 ISO-NE PUBLIC 2016 ISO New England Inc.
4.1.2 On-Peak Hours, December 2015
Hub/Zone/ Ext. Node
Avg DA LMP
($/MWh)
Avg RT LMP
($/MWh)
Min DA LMP
($/MWh)
Min RT LMP
($/MWh)
Max DA LMP
($/MWh)
Max RT LMP
($/MWh)
DA % of
Hub
RT % of
Hub RT % of DA
DA Std Dev
RT Std Dev
RT Std
/DA Std
Hub $28.02 $28.33 $12.63 $0.02 $68.71 $350.03 55% 51% 101% $9.15 $22.33 2.44
ME $27.56 $27.81 $12.27 $0.02 $67.63 $348.08 55% 50% 101% $8.87 $22.11 2.49
NH $27.97 $28.22 $12.29 $0.02 $68.50 $350.49 55% 50% 101% $9.07 $22.31 2.46
VT $27.93 $27.95 $12.35 $0.02 $66.94 $340.98 55% 50% 100% $8.90 $21.74 2.44
CT $27.84 $28.25 $12.72 $0.02 $67.00 $348.14 55% 50% 101% $8.92 $22.10 2.48
RI $27.82 $28.36 $12.72 $0.02 $68.16 $348.62 55% 51% 102% $9.10 $22.27 2.45
SEMA $28.05 $28.74 $12.71 $0.02 $69.62 $350.52 55% 51% 102% $9.30 $22.53 2.42
WCMA $28.09 $28.39 $12.66 $0.02 $68.53 $350.47 56% 51% 101% $9.13 $22.33 2.45
NEMA $28.14 $28.68 $12.72 $0.02 $69.74 $355.02 56% 51% 102% $9.31 $22.70 2.44
NB Ext $26.17 $26.69 $11.74 $0.02 $63.61 $339.75 52% 48% 102% $8.28 $21.42 2.59
NYN Ext $27.25 $26.30 $12.49 -$138.99 $60.42 $337.46 54% 47% 97% $8.32 $22.74 2.73
HQ Ext $27.48 $27.91 $12.42 $0.02 $67.82 $347.25 54% 50% 102% $9.02 $22.11 2.45
HG Ext $25.89 $25.79 $11.27 $0.02 $62.23 $315.71 51% 46% 100% $8.31 $20.15 2.42
CSC Ext $27.90 $28.93 $12.78 $0.02 $66.71 $352.35 55% 52% 104% $8.88 $22.83 2.57
NNC Ext $27.81 $28.22 $12.75 $0.02 $66.23 $348.11 55% 50% 102% $8.76 $21.99 2.51
4.1.3 Off-Peak Hours, December 2015
Hub/Zone/ Ext. Node
Avg DA LMP
($/MWh)
Avg RT LMP
($/MWh)
Min DA LMP
($/MWh)
Min RT LMP
($/MWh)
Max DA LMP
($/MWh)
Max RT LMP
($/MWh)
DA % of
Hub
RT % of
Hub RT % of DA
DA Std Dev
RT Std Dev
RT Std
/DA Std
Hub $17.40 $15.07 $0.00 -$118.74 $47.90 $106.18 48% 50% 87% $8.25 $17.64 2.14
ME $16.95 $14.56 $0.00 -$113.15 $46.13 $101.02 47% 48% 86% $7.97 $16.97 2.13
NH $17.27 $14.86 -$0.31 -$115.81 $47.47 $104.17 48% 49% 86% $8.18 $17.32 2.12
VT $17.28 $14.83 $0.00 -$115.58 $47.63 $104.06 48% 49% 86% $8.13 $17.30 2.13
CT $17.24 $14.98 $0.00 -$118.86 $47.47 $105.49 48% 49% 87% $8.13 $17.54 2.16
RI $17.41 $15.14 $0.00 -$119.26 $47.35 $106.85 48% 50% 87% $8.21 $17.72 2.16
SEMA $17.45 $15.18 $0.00 -$118.78 $47.78 $106.99 48% 50% 87% $8.28 $17.73 2.14
WCMA $17.42 $15.09 $0.00 -$118.83 $48.00 $106.19 48% 50% 87% $8.25 $17.65 2.14
NEMA $17.41 $15.13 $0.00 -$118.40 $48.08 $106.36 48% 50% 87% $8.30 $17.68 2.13
NB Ext $16.17 $13.87 $0.00 -$108.95 $43.72 $94.57 45% 46% 86% $7.49 $16.21 2.16
NYN Ext $17.15 $14.74 $0.00 -$118.21 $47.06 $104.08 47% 49% 86% $8.05 $17.38 2.16
HQ Ext $17.04 $14.81 $0.00 -$116.15 $46.91 $104.29 47% 49% 87% $8.09 $17.33 2.14
HG Ext $16.06 $13.68 $0.00 -$107.11 $44.52 $95.12 44% 45% 85% $7.48 $16.12 2.16
CSC Ext $17.23 $15.69 $0.00 -$119.10 $48.60 $105.90 48% 52% 91% $8.14 $18.15 2.23
NNC Ext $17.25 $15.00 $0.00 -$119.53 $47.39 $105.07 48% 49% 87% $8.09 $17.57 2.17

Monthly Market Operations Report Page 9 of 63
December 2015 ISO-NE PUBLIC 2016 ISO New England Inc.
4.2 LMP Graphs, Day-Ahead Market, 13 Months Ending December 2015
The following four graphs show the 13 month history of average hourly Day-Ahead LMPs for the Hub, Load Zones, and External Nodes on an overall and on-peak basis.
$/M
Wh
$0
$25
$50
$75
$100
$125
$150
Month
DEC201
4JA
N2015
FEB2015
MAR20
15APR
2015
MAY2
015
JUN
2015
JUL2
015AUG201
5SE
P2015
OCT2
015NO
V2015DEC
2015
Monthly Avg Day-Ahead LMPs for Hub and Load Zones13 Mos Ending December 2015, Al l Hours
CT Hub MENEMA NH RISEMA VT WCMA
$/M
Wh
$0
$25
$50
$75
$100
$125
$150
Month
DEC201
4JA
N2015
FEB2015
MAR20
15APR
2015
MAY2
015
JUN
2015
JUL2
015AUG201
5SE
P2015
OCT2
015NO
V2015DEC
2015
Monthly Avg Day-Ahead LMPs for Hub and Load Zones13 Mos Ending December 2015, On-Peak Hours
CT Hub MENEMA NH RISEMA VT WCMA

Monthly Market Operations Report Page 10 of 63
December 2015 ISO-NE PUBLIC 2016 ISO New England Inc.
$/M
Wh
$0
$25
$50
$75
$100
$125
$150
Month
DEC201
4JA
N2015
FEB2015
MAR20
15APR
2015
MAY2
015
JUN
2015
JUL2
015AUG201
5SE
P2015
OCT2
015NO
V2015DEC
2015
Monthly Avg Day-Ahead LMPs for Hub and External Nodes13 Mos Ending December 2015, Al l Hours
CSC Ext HG ExtHQ Ext HubNB Ext NNC ExtNYN Ext
$/M
Wh
$0
$25
$50
$75
$100
$125
$150
Month
DEC201
4JA
N2015
FEB2015
MAR20
15APR
2015
MAY2
015
JUN
2015
JUL2
015AUG201
5SE
P2015
OCT2
015NO
V2015DEC
2015
Monthly Avg Day-Ahead LMPs for Hub and External Nodes13 Mos Ending December 2015, On-Peak Hours
CSC Ext HG ExtHQ Ext HubNB Ext NNC ExtNYN Ext

Monthly Market Operations Report Page 11 of 63
December 2015 ISO-NE PUBLIC 2016 ISO New England Inc.
4.3 LMP Graphs, Real-Time Market, 13 Months Ending December 2015
The following four graphs show the 13 month history of average hourly Real-Time LMPs for the Hub, Load Zones, and External Nodes on an overall and on-peak basis.
$/M
Wh
$0
$25
$50
$75
$100
$125
$150
Month
DEC201
4JA
N2015
FEB2015
MAR20
15APR
2015
MAY2
015
JUN
2015
JUL2
015AUG201
5SE
P2015
OCT2
015NO
V2015DEC
2015
Monthly Avg Real-Time LMPs for Hub and Load Zones13 Mos Ending December 2015, Al l Hours
CT Hub MENEMA NH RISEMA VT WCMA
$/M
Wh
$0
$25
$50
$75
$100
$125
$150
Month
DEC201
4JA
N2015
FEB2015
MAR20
15APR
2015
MAY2
015
JUN
2015
JUL2
015AUG201
5SE
P2015
OCT2
015NO
V2015DEC
2015
Monthly Avg Real-Time LMPs for Hub and Load Zones13 Mos Ending December 2015, On-Peak Hours
CT Hub MENEMA NH RISEMA VT WCMA

Monthly Market Operations Report Page 12 of 63
December 2015 ISO-NE PUBLIC 2016 ISO New England Inc.
$/M
Wh
$0
$25
$50
$75
$100
$125
$150
Month
DEC201
4JA
N2015
FEB2015
MAR20
15APR
2015
MAY2
015
JUN
2015
JUL2
015AUG201
5SE
P2015
OCT2
015NO
V2015DEC
2015
Monthly Avg Real-Time LMPs for Hub and External Nodes13 Mos Ending December 2015, Al l Hours
CSC Ext HG ExtHQ Ext HubNB Ext NNC ExtNYN Ext
$/M
Wh
$0
$25
$50
$75
$100
$125
$150
Month
DEC201
4JA
N2015
FEB2015
MAR20
15APR
2015
MAY2
015
JUN
2015
JUL2
015AUG201
5SE
P2015
OCT2
015NO
V2015DEC
2015
Monthly Avg Real-Time LMPs for Hub and External Nodes13 Mos Ending December 2015, On-Peak Hours
CSC Ext HG ExtHQ Ext HubNB Ext NNC ExtNYN Ext

Monthly Market Operations Report Page 13 of 63
December 2015 ISO-NE PUBLIC 2016 ISO New England Inc.
4.4 For More Information
The ISO provides a discussion of LMP results on a weekly basis in its Weekly Market Performance Report, located here4.
The ISO also provides a discussion of LMP results on an annual basis in its Annual Market Performance Reports, located here5.
Downloadable Hub and Load Zone weekly and monthly LMP indices are located here.
Customizable downloads of Day-Ahead and Real-Time Hourly LMPs can be performed here.
Current Day-Ahead and Real-Time LMPs for the Hub and Load Zones can be monitored here.
A discussion of the calculation of LMPs can be found in the ISO’s Market Rule 1 located here.
4 Select “Weekly Markets Reports” from the document type filter on the left hand side of the page
5 Select “Annual Markets Reports” from the document type filter on the left hand side of the page

Monthly Market Operations Report Page 14 of 63
December 2015 ISO-NE PUBLIC 2016 ISO New England Inc.
5. Imports and Exports
Market Participants can submit hourly Fixed External Transaction quantities for which they commit to import at Day-Ahead LMPs for delivery in the next Operating Day. They can also submit hourly Fixed External Transaction quantities for which they commit to import at Real-Time LMPs for physical delivery within the Operating Day. There are also several types of price-dependent transactions that can be submitted.
5.1 Net Interchange Summary, December 2015
The following tables show summary statistics for imports and exports on the six external interfaces for both the Day-Ahead and Real-Time Markets:
5.1.1 Day-Ahead and Real-Time Market Summary by Interface
On/Off Peak Interface
DA Total Exports (MWh)
DA Total Imports (MWh)
DA Net Int
(MWh)
RT Total Exports (MWh)
RT Total Imports (MWh)
RT Net Int (MWh)
All Hours NNC -41,272 14,108 -27,164 -51,539 14,920 -36,619
NY-CSC -109,740 0 -109,740 -110,368 0 -110,368
HQ HG 0 148,753 148,753 0 149,408 149,408
HQ I/II -1,175 1,007,246 1,006,071 -1,692 1,004,959 1,003,267
NY-N AC -99,678 419,073 319,395 -201,366 486,416 285,050
NB -251 429,295 429,044 -17,370 442,525 425,155
Total All Hours -252,116 2,018,475 1,766,359 -382,335 2,098,228 1,715,893
Off-Peak NNC -18,854 6,514 -12,340 -25,534 5,754 -19,780
NY-CSC -34,180 0 -34,180 -34,258 0 -34,258
HQ HG 0 72,162 72,162 0 72,799 72,799
HQ I/II -400 524,096 523,696 -1,692 519,668 517,976
NY-N AC -40,068 196,670 156,602 -103,545 223,815 120,269
NB -82 216,335 216,253 -2,489 229,904 227,415
Total Off-Peak -93,583 1,015,777 922,194 -167,518 1,051,940 884,421
On-Peak NNC -22,418 7,594 -14,824 -26,005 9,166 -16,839
NY-CSC -75,560 0 -75,560 -76,110 0 -76,110
HQ HG 0 76,591 76,591 0 76,609 76,609
HQ I/II -775 483,150 482,375 0 485,291 485,291
NY-N AC -59,611 222,403 162,792 -97,821 262,602 164,781
NB -169 212,960 212,791 -14,881 212,621 197,740
Total On-Peak -158,533 1,002,698 844,166 -214,817 1,046,289 831,472

Monthly Market Operations Report Page 15 of 63
December 2015 ISO-NE PUBLIC 2016 ISO New England Inc.
5.2 Day-Ahead and Real-Time Net Interchange Summary, Last 13 Months
Net Interchange, Last 13 Mos., New England Control AreaDay-Ahead Market, All Hours
Import Export Net Int
MW
h
-1,000,000
-500,000
0
500,000
1,000,000
1,500,000
2,000,000
2,500,000
3,000,000
DEC14
JAN15
FEB15
MAR15
APR15
MAY1
5JU
N15
JUL1
5AUG15SE
P15O
CT15
NOV15
DEC15
Net Interchange, Last 13 Mos., New England Control AreaDay-Ahead Market, On-Peak Hours
Import Export Net Int
MW
h
-1,000,000
-500,000
0
500,000
1,000,000
1,500,000
2,000,000
2,500,000
3,000,000
DEC14
JAN15
FEB15
MAR15
APR15
MAY1
5JU
N15
JUL1
5AUG15SE
P15O
CT15
NOV15
DEC15

Monthly Market Operations Report Page 16 of 63
December 2015 ISO-NE PUBLIC 2016 ISO New England Inc.
Net Interchange, Last 13 Mos., New England Control AreaReal-Time Market, All Hours
Import Export Net Int
MW
h
-1,000,000
-500,000
0
500,000
1,000,000
1,500,000
2,000,000
2,500,000
3,000,000
DEC14
JAN15
FEB15
MAR15
APR15
MAY1
5JU
N15
JUL1
5AUG15SE
P15O
CT15
NOV15
DEC15
Net Interchange, Last 13 Mos., New England Control AreaDay-Ahead Market, On-Peak Hours
Import Export Net Int
MW
h
-1,000,000
-500,000
0
500,000
1,000,000
1,500,000
2,000,000
2,500,000
3,000,000
DEC14
JAN15
FEB15
MAR15
APR15
MAY1
5JU
N15
JUL1
5AUG15SE
P15O
CT15
NOV15
DEC15

Monthly Market Operations Report Page 17 of 63
December 2015 ISO-NE PUBLIC 2016 ISO New England Inc.
5.3 Net Interchange Summary by Interface, Last 13 Months
Net Interchange, Last 13 Mos., New BrunswickDay-Ahead Market, All Hours
Import Export Net Int
MW
h
-1,000,000
-500,000
0
500,000
1,000,000
1,500,000
2,000,000
2,500,000
3,000,000
DEC14
JAN15
FEB15
MAR15
APR15
MAY1
5JU
N15
JUL1
5AUG15SE
P15O
CT15
NOV15
DEC15
Net Interchange, Last 13 Mos., New BrunswickReal-Time Market, All Hours
Import Export Net Int
MW
h
-1,000,000
-500,000
0
500,000
1,000,000
1,500,000
2,000,000
2,500,000
3,000,000
DEC14
JAN15
FEB15
MAR15
APR15
MAY1
5JU
N15
JUL1
5AUG15SE
P15O
CT15
NOV15
DEC15

Monthly Market Operations Report Page 18 of 63
December 2015 ISO-NE PUBLIC 2016 ISO New England Inc.
Net Interchange, Last 13 Mos., New York N-AC TiesDay-Ahead Market, All Hours
Import Export Net Int
MW
h
-1,000,000
-500,000
0
500,000
1,000,000
1,500,000
2,000,000
2,500,000
3,000,000
DEC14
JAN15
FEB15
MAR15
APR15
MAY1
5JU
N15
JUL1
5AUG15SE
P15O
CT15
NOV15
DEC15
Net Interchange, Last 13 Mos., New York N-AC TiesReal-Time Market, All Hours
Import Export Net Int
MW
h
-1,000,000
-500,000
0
500,000
1,000,000
1,500,000
2,000,000
2,500,000
3,000,000
DEC14
JAN15
FEB15
MAR15
APR15
MAY1
5JU
N15
JUL1
5AUG15SE
P15O
CT15
NOV15
DEC15

Monthly Market Operations Report Page 19 of 63
December 2015 ISO-NE PUBLIC 2016 ISO New England Inc.
Net Interchange, Last 13 Mos., Hydro-Quebec Phase I/IIDay-Ahead Market, All Hours
Import Export Net Int
MW
h
-1,000,000
-500,000
0
500,000
1,000,000
1,500,000
2,000,000
2,500,000
3,000,000
DEC14
JAN15
FEB15
MAR15
APR15
MAY1
5JU
N15
JUL1
5AUG15SE
P15O
CT15
NOV15
DEC15
Net Interchange, Last 13 Mos., Hydro-Quebec Phase I/IIReal-Time Market, All Hours
Import Export Net Int
MW
h
-1,000,000
-500,000
0
500,000
1,000,000
1,500,000
2,000,000
2,500,000
3,000,000
DEC14
JAN15
FEB15
MAR15
APR15
MAY1
5JU
N15
JUL1
5AUG15SE
P15O
CT15
NOV15
DEC15

Monthly Market Operations Report Page 20 of 63
December 2015 ISO-NE PUBLIC 2016 ISO New England Inc.
Net Interchange, Last 13 Mos., HQ HighgateDay-Ahead Market, All Hours
Import Export Net Int
MW
h
-1,000,000
-500,000
0
500,000
1,000,000
1,500,000
2,000,000
2,500,000
3,000,000
DEC14
JAN15
FEB15
MAR15
APR15
MAY1
5JU
N15
JUL1
5AUG15SE
P15O
CT15
NOV15
DEC15
Net Interchange, Last 13 Mos., HQ HighgateReal-Time Market, All Hours
Import Export Net Int
MW
h
-1,000,000
-500,000
0
500,000
1,000,000
1,500,000
2,000,000
2,500,000
3,000,000
DEC14
JAN15
FEB15
MAR15
APR15
MAY1
5JU
N15
JUL1
5AUG15SE
P15O
CT15
NOV15
DEC15

Monthly Market Operations Report Page 21 of 63
December 2015 ISO-NE PUBLIC 2016 ISO New England Inc.
Net Interchange, Last 13 Mos., NY Cross Sound CableDay-Ahead Market, All Hours
Import Export Net Int
MW
h
-1,000,000
-500,000
0
500,000
1,000,000
1,500,000
2,000,000
2,500,000
3,000,000
DEC14
JAN15
FEB15
MAR15
APR15
MAY1
5JU
N15
JUL1
5AUG15SE
P15O
CT15
NOV15
DEC15
Net Interchange, Last 13 Mos., NY Cross Sound CableReal-Time Market, All Hours
Import Export Net Int
MW
h
-1,000,000
-500,000
0
500,000
1,000,000
1,500,000
2,000,000
2,500,000
3,000,000
DEC14
JAN15
FEB15
MAR15
APR15
MAY1
5JU
N15
JUL1
5AUG15SE
P15O
CT15
NOV15
DEC15

Monthly Market Operations Report Page 22 of 63
December 2015 ISO-NE PUBLIC 2016 ISO New England Inc.
Net Interchange, Last 13 Mos., Northport-Norwalk CableDay-Ahead Market, All Hours
Import Export Net Int
MW
h
-1,000,000
-500,000
0
500,000
1,000,000
1,500,000
2,000,000
2,500,000
3,000,000
DEC14
JAN15
FEB15
MAR15
APR15
MAY1
5JU
N15
JUL1
5AUG15SE
P15O
CT15
NOV15
DEC15
Net Interchange, Last 13 Mos., Northport-Norwalk CableReal-Time Market, All Hours
Import Export Net Int
MW
h
-1,000,000
-500,000
0
500,000
1,000,000
1,500,000
2,000,000
2,500,000
3,000,000
DEC14
JAN15
FEB15
MAR15
APR15
MAY1
5JU
N15
JUL1
5AUG15SE
P15O
CT15
NOV15
DEC15

Monthly Market Operations Report Page 23 of 63
December 2015 ISO-NE PUBLIC 2016 ISO New England Inc.
5.4 For More Information
Selectable historical hourly net interchange for the New England Control can be found on the ISO’s website here.
Monthly, daily, and hourly summaries of New England Control Area net interchange can be found on the ISO’s web site here.
The market rules governing the scheduling of external transactions can be found in Section III.1.10 “Scheduling” of the ISO’s Market Rule 1 located here.
The business rules and procedures for external transactions can be found in Section 6.5, “External Transactions” in the ISO’s Manual 11 – Market Operations located here.
A history of emergency purchases and sales from and to neighboring control areas can be found here.

Monthly Market Operations Report Page 24 of 63
December 2015 ISO-NE PUBLIC 2016 ISO New England Inc.
6. Financial Transmission Rights (FTR) Auctions
FTRs are financial instruments that entitle the holder to a share of congestion collections in the Day-Ahead Market. The difference in prices (excluding losses) along a path or between any two locations on the system in the Day-Ahead Market reflects the marginal cost of transmission along that path. An FTR allows its purchaser to collect up to the full value of such congestion as consistent with the FTR’s specified path and MW value.
FTRs can be acquired in three ways:
FTR Auction – the ISO conducts periodic auctions to allow bidders to acquire and sell monthly and long-term FTRs. The bidders in the FTR auction initially define all FTRs.
Secondary Market – The FTR secondary market is an ISO-administered bulletin board where existing FTRs are electronically bought or sold on a bilateral basis.
Unregistered Trades – FTRs can be exchanged bilaterally outside of the ISO-administered process. However, the ISO compensates only FTR holders of record and does not recognize business done in this manner for day-ahead congestion settlement purposes.
6.1 FTR Auction Results
The results of the monthly FTR auction and any applicable long-term FTR auction are shown below.
6.1.1 Monthly Auction Summary, December 2015
Bids to Buy or Offers to
Sell On-Peak or
Off-Peak No. of Bids or Offers
Bid or Offered
MW-Mos. Bid or Offered Dollars No. of
Awards Awarded MW-Mos.
Awarded Dollars
Buy Off 4,534 33,463 $1,404,318 2,068 15,100 $314,665
Buy On 4,532 35,130 $1,760,805 2,096 15,536 $409,205
Buy Buy Total 9,066 68,593 $3,165,123 4,164 30,636 $723,870
Sell Off 1,230 4,247 $680,471 132 271 -$19,762
Sell On 360 3,171 $809,120 69 201 -$6,931
Sell Sell Total 1,590 7,418 $1,489,591 201 472 -$26,693
Grand Total Grand Total 10,656 76,011 $4,654,714 4,365 31,108 $697,178
6.1.2 Number of Auction Participants, December 2015
Auction Period Monthly or Long-Term No. of Bidders
Dec 2015 MO 32
6.1.3 Monthly FTR Auction Results, Last 13 Months
Auction Month
Bids to Buy or Offers to
Sell No. of Bids or Offers
Bid or Offered
MW-Mos. Bid or Offered
Dollars No. of
Awards Awarded MW-Mos.
Awarded Dollars
DEC 2014 Buy 17,420 104,104 $6,609,853 7,917 41,381 $1,067,697
DEC 2014 Sell 2,610 8,048 $5,884,632 192 1,276 -$28,225
DEC 2014 Tot 20,030 112,151 $12,494,484 8,109 42,658 $1,039,472
JAN 2015 Buy 24,298 107,259 $5,026,171 8,451 40,478 $1,077,749

Monthly Market Operations Report Page 25 of 63
December 2015 ISO-NE PUBLIC 2016 ISO New England Inc.
Auction Month
Bids to Buy or Offers to
Sell No. of Bids or Offers
Bid or Offered
MW-Mos. Bid or Offered
Dollars No. of
Awards Awarded MW-Mos.
Awarded Dollars
JAN 2015 Sell 5,730 12,109 $3,708,788 280 608 -$91,414
JAN 2015 Tot 30,028 119,368 $8,734,959 8,731 41,085 $986,334
FEB 2015 Buy 19,316 107,144 $4,270,459 8,162 42,310 $860,822
FEB 2015 Sell 8,615 13,924 $3,160,446 616 908 -$107,383
FEB 2015 Tot 27,931 121,068 $7,430,906 8,778 43,218 $753,438
MAR 2015 Buy 13,707 82,739 $5,486,668 5,920 38,159 $1,137,153
MAR 2015 Sell 8,004 14,393 $2,514,195 420 791 -$187,482
MAR 2015 Tot 21,711 97,132 $8,000,863 6,340 38,950 $949,670
APR 2015 Buy 19,544 96,391 $4,475,393 7,129 33,196 $1,066,026
APR 2015 Sell 7,876 14,020 $2,245,905 757 1,433 -$162,220
APR 2015 Tot 27,420 110,411 $6,721,298 7,886 34,628 $903,806
MAY 2015 Buy 13,989 80,167 $2,976,157 5,755 34,385 $685,661
MAY 2015 Sell 5,772 10,606 $1,465,011 245 606 -$52,461
MAY 2015 Tot 19,761 90,774 $4,441,168 6,000 34,990 $633,200
JUN 2015 Buy 13,738 74,509 $2,661,192 6,021 35,661 $552,630
JUN 2015 Sell 5,788 10,998 $1,970,657 389 561 -$44,765
JUN 2015 Tot 19,526 85,507 $4,631,849 6,410 36,222 $507,865
JUL 2015 Buy 14,138 81,160 $3,151,391 6,651 40,048 $709,150
JUL 2015 Sell 1,718 8,147 $919,873 183 395 -$28,761
JUL 2015 Tot 15,856 89,307 $4,071,263 6,834 40,442 $680,389
AUG 2015 Buy 13,511 80,138 $2,533,786 6,611 36,553 $623,353
AUG 2015 Sell 1,742 8,287 $907,884 211 788 -$42,725
AUG 2015 Tot 15,253 88,425 $3,441,671 6,822 37,342 $580,629
SEP 2015 Buy 24,278 65,486 $1,856,339 4,845 32,997 $461,001
SEP 2015 Sell 2,314 8,803 $801,635 232 1,017 -$33,569
SEP 2015 Tot 26,592 74,289 $2,657,974 5,077 34,013 $427,432
OCT 2015 Buy 27,816 78,732 $3,352,157 5,591 27,435 $834,747
OCT 2015 Sell 1,902 9,525 $1,167,039 411 1,957 -$103,006
OCT 2015 Tot 29,718 88,256 $4,519,196 6,002 29,393 $731,741
NOV 2015 Buy 11,167 62,231 $3,002,938 4,668 26,057 $754,575
NOV 2015 Sell 1,594 7,480 $1,052,590 232 527 -$35,999
NOV 2015 Tot 12,761 69,711 $4,055,528 4,900 26,584 $718,576
DEC 2015 Buy 9,066 68,593 $3,165,123 4,164 30,636 $723,870
DEC 2015 Sell 1,590 7,418 $1,489,591 201 472 -$26,693
DEC 2015 Tot 10,656 76,011 $4,654,714 4,365 31,108 $697,178
6.2 Monthly FTR Auction Results, Last 13 Months
The next series of graphs show summaries of FTR Auction activity over the last 13 months, including bids to buy monthly FTRs and offers to sell long-term FTRs into each monthly auction.

Monthly Market Operations Report Page 26 of 63
December 2015 ISO-NE PUBLIC 2016 ISO New England Inc.
Monthly FTR Auctions: Number of Bids, Buy Activity13 Months Ending December 2015
Awarded Bid
Nu
mb
er o
f B
ids
0
10,000
20,000
30,000
DEC
20
14
JAN
20
15
FEB
20
15
MA
R2
01
5
AP
R2
01
5
MA
Y20
15
JUN
20
15
JUL2
01
5
AU
G2
01
5
SEP
20
15
OC
T20
15
NO
V2
01
5
DEC
20
15
Monthly FTR Auctions: Number of Bids, Sell Activity13 Months Ending December 2015
Awarded Bid
Nu
mb
er o
f B
ids
0
1,000
2,000
3,000
4,000
5,000
6,000
7,000
8,000
9,000
DEC
20
14
JAN
20
15
FEB
20
15
MA
R2
01
5
AP
R2
01
5
MA
Y20
15
JUN
20
15
JUL2
01
5
AU
G2
01
5
SEP
20
15
OC
T20
15
NO
V2
01
5
DEC
20
15

Monthly Market Operations Report Page 27 of 63
December 2015 ISO-NE PUBLIC 2016 ISO New England Inc.
Monthly FTR Auctions: MW-Months, Buy Activity13 Months Ending December 2015
Awarded Bid
MW
-Mo
nth
s
0
10,000
20,000
30,000
40,000
50,000
60,000
70,000
80,000
90,000
100,000
110,000
DEC
20
14
JAN
20
15
FEB
20
15
MA
R2
01
5
AP
R2
01
5
MA
Y20
15
JUN
20
15
JUL2
01
5
AU
G2
01
5
SEP
20
15
OC
T20
15
NO
V2
01
5
DEC
20
15
Monthly FTR Auctions: MW-Months, Sell Activity13 Months Ending December 2015
Awarded Bid
MW
-Mo
nth
s
0 1,000 2,000 3,000 4,000 5,000 6,000 7,000 8,000 9,000
10,000 11,000 12,000 13,000 14,000 15,000
DEC
20
14
JAN
20
15
FEB
20
15
MA
R2
01
5
AP
R2
01
5
MA
Y20
15
JUN
20
15
JUL2
01
5
AU
G2
01
5
SEP
20
15
OC
T20
15
NO
V2
01
5
DEC
20
15

Monthly Market Operations Report Page 28 of 63
December 2015 ISO-NE PUBLIC 2016 ISO New England Inc.
Monthly FTR Auctions: Dollars, Buy Activity13 Months Ending December 2015
Awarded Bid
Do
llars
$0
$1,000,000
$2,000,000
$3,000,000
$4,000,000
$5,000,000
$6,000,000
$7,000,000
DEC
20
14
JAN
20
15
FEB
20
15
MA
R2
01
5
AP
R2
01
5
MA
Y20
15
JUN
20
15
JUL2
01
5
AU
G2
01
5
SEP
20
15
OC
T20
15
NO
V2
01
5
DEC
20
15
Monthly FTR Auctions: Dollars, Sell Activity13 Months Ending December 2015
Awarded Bid
Do
llars
$-1,000,000
$0
$1,000,000
$2,000,000
$3,000,000
$4,000,000
$5,000,000
$6,000,000
DEC
20
14
JAN
20
15
FEB
20
15
MA
R2
01
5
AP
R2
01
5
MA
Y20
15
JUN
20
15
JUL2
01
5
AU
G2
01
5
SEP
20
15
OC
T20
15
NO
V2
01
5
DEC
20
15

Monthly Market Operations Report Page 29 of 63
December 2015 ISO-NE PUBLIC 2016 ISO New England Inc.
6.3 Auction Value, Last 13 Months
The next series of graphs show summaries of FTR Auction value and on/off-peak activity over the last 13 months.
Value of Monthly Auctions13 Months Ending December 2015
On-Peak Off-Peak
Do
llars
$0
$100,000
$200,000
$300,000
$400,000
$500,000
$600,000
$700,000
$800,000
$900,000
$1,000,000
$1,100,000
DEC
20
14
JAN
20
15
FEB
20
15
MA
R2
01
5
AP
R2
01
5
MA
Y20
15
JUN
20
15
JUL2
01
5
AU
G2
01
5
SEP
20
15
OC
T20
15
NO
V2
01
5
DEC
20
15
Value of Long-Term AuctionsConducted Within 13 Months Ending December 2015
On-Peak Off-Peak
Do
llars
$0
$1,000,000
$2,000,000
$3,000,000
$4,000,000
$5,000,000
$6,000,000
$7,000,000
$8,000,000
$9,000,000
DEC
20
14
JAN
20
15
FEB
20
15
MA
R2
01
5
AP
R2
01
5
MA
Y20
15
JUN
20
15
JUL2
01
5
AU
G2
01
5
SEP
20
15
OC
T20
15
NO
V2
01
5
DEC
20
15

Monthly Market Operations Report Page 30 of 63
December 2015 ISO-NE PUBLIC 2016 ISO New England Inc.
Awarded MW-Months, Monthly FTR AuctionsBuy/Sell Activity, 13 Mos. Ending December 2015
Buy Sell
Aw
ard
ed M
W-M
on
ths
0
10,000
20,000
30,000
40,000
50,000
DEC201
4JA
N2015
FEB2015
MAR20
15APR
2015
MAY2
015
JUN
2015
JUL2
015AUG201
5SE
P2015
OCT2
015NO
V2015DEC
2015
Monthly and Long-Term FTR AuctionsAggregate Equivalent Cost to Procure, All Hours
LT (Monthly Equiv.) Monthly Auction
$/M
W-M
on
th
$0.00
$10.00
$20.00
$30.00
$40.00
DEC201
4JA
N2015
FEB2015
MAR20
15APR
2015
MAY2
015
JUN
2015
JUL2
015AUG201
5SE
P2015
OCT2
015NO
V2015DEC
2015

Monthly Market Operations Report Page 31 of 63
December 2015 ISO-NE PUBLIC 2016 ISO New England Inc.
Monthly and Long-Term FTR AuctionsAggregate Equivalent Cost to Procure, On-Peak Hours
LT (Monthly Equiv.) Monthly Auction
$/M
W-M
on
th
$0.00
$10.00
$20.00
$30.00
$40.00
$50.00
DEC201
4JA
N2015
FEB2015
MAR20
15APR
2015
MAY2
015
JUN
2015
JUL2
015AUG201
5SE
P2015
OCT2
015NO
V2015DEC
2015
Monthly and Long-Term FTR AuctionsAggregate Equivalent Cost to Procure, Off-Peak Hours
LT (Monthly Equiv.) Monthly Auction
$/M
W-M
on
th
$0.00
$10.00
$20.00
$30.00
DEC201
4JA
N2015
FEB2015
MAR20
15APR
2015
MAY2
015
JUN
2015
JUL2
015AUG201
5SE
P2015
OCT2
015NO
V2015DEC
2015

Monthly Market Operations Report Page 32 of 63
December 2015 ISO-NE PUBLIC 2016 ISO New England Inc.
6.4 For More Information
The market rules governing the FTR auctions can be found in Section III.7 “Financial Transmission Rights Auctions” of the ISO’s Market Rule 1 located here.
The business rules and procedures for FTRs can be found in Section 6.5, “External Transactions” in the ISO’s Manual 6 – Financial Transmission Rights located here.
Information about the monthly and long-term FTR auctions can be found on the ISO’s web site here.

Monthly Market Operations Report Page 33 of 63
December 2015 ISO-NE PUBLIC 2016 ISO New England Inc.
7. Effectiveness of FTRs
7.1 FTRs as a Congestion Hedging Instrument
Congestion costs occur in the Day-Ahead and Real-Time Markets between locations on the system when the most economic power cannot be transferred to needed load areas without violating transmission limits. These costs are embedded in the congestion component of LMP and its difference between locations. Customers who wish to protect against these real-time costs can do so by scheduling in the Day-Ahead Market. In turn, to hedge against day-ahead congestion costs, customers can obtain FTRs.
To analyze congestion and the effectiveness of the FTR market in managing the costs of congestion in New England, day-ahead congestion costs are examined in relation to FTR auction path clearing prices. Transmission paths from the Hub to the various New England Load Zones are examined in this section. In the following exhibits, monthly on-peak auction clearing prices are compared to the average day-ahead congestion components of prices for the month for each Hub-to-zone path. All units are presented in $/MWh equivalents.
Note that the exhibits are for illustration only, and do not indicate whether FTRs were actually owned by any market participant for the paths shown.
Monthly Avg Congestion vs. FTR Cost, DEC2015Hub to Load Zones, On-Peak Hours
$/M
Wh
$-5.00
$-2.50
$0.00
$2.50
$5.00
ME NH VT CT RI SEMA WCMA NEMA
DA
Co
nge
stM
thly
FTR
Pro
fit
DA
Co
nge
stM
thly
FTR
Pro
fit
DA
Co
nge
stM
thly
FTR
Pro
fit
DA
Co
nge
stM
thly
FTR
Pro
fit
DA
Co
nge
stM
thly
FTR
Pro
fit
DA
Co
nge
stM
thly
FTR
Pro
fit
DA
Co
nge
stM
thly
FTR
Pro
fit
DA
Co
nge
stM
thly
FTR
Pro
fit

Monthly Market Operations Report Page 34 of 63
December 2015 ISO-NE PUBLIC 2016 ISO New England Inc.
Monthly Avg Congestion vs. FTR Cost, DEC2015Hub to Load Zones, Off-Peak Hours
$/M
Wh
$-5.00
$-2.50
$0.00
$2.50
$5.00
ME NH VT CT RI SEMA WCMA NEMA
DA
Co
nge
stM
thly
FTR
Pro
fit
DA
Co
nge
stM
thly
FTR
Pro
fit
DA
Co
nge
stM
thly
FTR
Pro
fit
DA
Co
nge
stM
thly
FTR
Pro
fit
DA
Co
nge
stM
thly
FTR
Pro
fit
DA
Co
nge
stM
thly
FTR
Pro
fit
DA
Co
nge
stM
thly
FTR
Pro
fit
DA
Co
nge
stM
thly
FTR
Pro
fit
7.2 Profitability of Monthly FTRs, 13 Mos. Ending December 2015, On-Peak Hours, in $/MWh, from Hub to Load Zones
A comparison of the “profitability” or the success of the hedge that the illustrated FTRs provided over the last thirteen months is presented below.
Hub to Month
Avg DA
Congest
FTR Path
Cost
FTR
Profit
ME Dec-14 -$0.50 $0.09 -$0.59
ME Jan-15 -$0.11 $0.75 -$0.87
ME Feb-15 -$0.36 $0.38 -$0.74
ME Mar-15 -$0.49 $0.08 -$0.57
ME Apr-15 $0.09 -$0.09 $0.18
ME May-15 $0.00 -$0.11 $0.11
ME Jun-15 $0.00 -$0.05 $0.06
ME Jul-15 $0.00 -$0.03 $0.03
ME Aug-15 $2.28 $0.01 $2.27
ME Sep-15 -$0.30 -$0.06 -$0.24
ME Oct-15 $0.01 -$0.04 $0.05
ME Nov-15 $0.58 -$0.04 $0.62
ME Dec-15 -$0.01 -$0.07 $0.06
Hub to Month
Avg DA
Congest
FTR Path
Cost
FTR
Profit
NH Dec-14 -$0.02 $0.17 -$0.19
NH Jan-15 -$0.02 $0.57 -$0.59
NH Feb-15 -$0.10 $0.35 -$0.46
NH Mar-15 $0.30 $0.20 $0.10
NH Apr-15 -$0.05 $0.04 -$0.08
NH May-15 -$0.02 -$0.02 $0.00
NH Jun-15 -$0.01 -$0.03 $0.02
NH Jul-15 $0.13 -$0.01 $0.14
NH Aug-15 $10.01 $0.02 $9.99
NH Sep-15 -$0.21 $0.03 -$0.25
NH Oct-15 $0.02 $0.07 -$0.05
NH Nov-15 $0.34 $0.05 $0.29
NH Dec-15 -$0.01 $0.00 -$0.01

Monthly Market Operations Report Page 35 of 63
December 2015 ISO-NE PUBLIC 2016 ISO New England Inc.
Hub to Month
Avg DA
Congest
FTR Path
Cost
FTR
Profit
VT Dec-14 -$0.06 -$0.55 $0.48
VT Jan-15 -$0.17 -$1.24 $1.08
VT Feb-15 -$0.04 -$0.34 $0.30
VT Mar-15 -$0.71 -$0.34 -$0.37
VT Apr-15 $4.27 -$0.17 $4.44
VT May-15 $0.36 $0.47 -$0.10
VT Jun-15 -$0.10 $0.31 -$0.40
VT Jul-15 $0.00 $0.00 -$0.01
VT Aug-15 -$0.02 $0.02 -$0.04
VT Sep-15 -$0.12 $0.01 -$0.13
VT Oct-15 -$0.06 -$0.11 $0.06
VT Nov-15 -$0.77 $0.07 -$0.84
VT Dec-15 -$0.01 -$0.06 $0.06
Hub to Month
Avg DA
Congest
FTR Path
Cost
FTR
Profit
CT Dec-14 -$0.08 -$0.39 $0.31
CT Jan-15 $0.00 -$1.07 $1.07
CT Feb-15 $0.03 -$0.66 $0.69
CT Mar-15 -$0.60 -$0.52 -$0.08
CT Apr-15 -$0.25 $0.04 -$0.29
CT May-15 $0.07 $0.01 $0.05
CT Jun-15 $0.89 $0.05 $0.84
CT Jul-15 $0.00 $0.23 -$0.23
CT Aug-15 $0.01 $0.20 -$0.19
CT Sep-15 -$0.01 $0.14 -$0.16
CT Oct-15 $0.01 $0.36 -$0.35
CT Nov-15 -$1.02 $0.26 -$1.28
CT Dec-15 $0.00 -$0.02 $0.02
Hub to Month
Avg DA
Congest
FTR Path
Cost
FTR
Profit
RI Dec-14 $0.58 $0.48 $0.10
RI Jan-15 $0.01 $1.27 -$1.26
RI Feb-15 $0.10 $0.94 -$0.84
RI Mar-15 $0.47 $0.73 -$0.26
RI Apr-15 $0.60 $0.72 -$0.11
RI May-15 -$0.02 $0.52 -$0.54
RI Jun-15 $0.03 $0.48 -$0.45
RI Jul-15 $0.02 $0.35 -$0.32
RI Aug-15 $0.05 $0.45 -$0.40
RI Sep-15 $0.58 $0.38 $0.20
RI Oct-15 $0.06 $0.31 -$0.25
RI Nov-15 $1.75 $0.44 $1.31
RI Dec-15 $0.00 $0.36 -$0.36
Hub to Month
Avg DA
Congest
FTR Path
Cost
FTR
Profit
SEMA Dec-14 $0.19 $0.44 -$0.25
SEMA Jan-15 $0.01 $1.20 -$1.19
SEMA Feb-15 $0.24 $0.79 -$0.56
SEMA Mar-15 $0.94 $1.25 -$0.31
SEMA Apr-15 $0.23 $1.25 -$1.02
SEMA May-15 -$0.03 $0.85 -$0.88
SEMA Jun-15 $0.01 $0.69 -$0.68
SEMA Jul-15 $0.01 $0.57 -$0.56
SEMA Aug-15 $0.11 $0.45 -$0.33
SEMA Sep-15 $0.14 $0.49 -$0.35
SEMA Oct-15 $0.04 $0.76 -$0.71
SEMA Nov-15 $0.81 $0.84 -$0.03
SEMA Dec-15 $0.01 $0.65 -$0.64
Hub to Month
Avg DA
Congest
FTR Path
Cost
FTR
Profit
WCMA Dec-14 -$0.04 -$0.06 $0.02
WCMA Jan-15 $0.00 -$0.15 $0.15
WCMA Feb-15 -$0.01 -$0.10 $0.08
WCMA Mar-15 -$0.08 -$0.09 $0.01
WCMA Apr-15 -$0.05 -$0.02 -$0.03
WCMA May-15 $0.01 $0.01 $0.00
WCMA Jun-15 $0.02 $0.01 $0.01
WCMA Jul-15 $0.00 $0.01 -$0.01
WCMA Aug-15 $0.01 $0.01 $0.00
WCMA Sep-15 $0.02 $0.00 $0.02
WCMA Oct-15 -$0.01 $0.01 -$0.01
WCMA Nov-15 -$0.08 $0.00 -$0.08
WCMA Dec-15 $0.00 -$0.01 $0.01
Hub to Month
Avg DA
Congest
FTR Path
Cost
FTR
Profit
NEMA Dec-14 $0.09 $1.35 -$1.26
NEMA Jan-15 $0.19 $1.42 -$1.23
NEMA Feb-15 $0.00 $0.91 -$0.91
NEMA Mar-15 $0.51 $0.57 -$0.06
NEMA Apr-15 $0.14 $0.56 -$0.42
NEMA May-15 $0.07 $0.22 -$0.15
NEMA Jun-15 $0.45 $0.27 $0.18
NEMA Jul-15 $0.01 $0.29 -$0.28
NEMA Aug-15 $0.02 $0.27 -$0.26
NEMA Sep-15 $4.99 $0.15 $4.84
NEMA Oct-15 $0.10 $1.37 -$1.27
NEMA Nov-15 $0.59 $0.51 $0.08
NEMA Dec-15 $0.00 $0.55 -$0.55

Monthly Market Operations Report Page 36 of 63
December 2015 ISO-NE PUBLIC 2016 ISO New England Inc.
8. Auction Revenue Rights
Auction Revenue is allocated to two main categories. First, it is allocated in the form of Incremental Auction Revenue Rights (IARRs) to entities, which, by paying for transmission upgrades, have increased the transfer capability of the NEPOOL transmission system and have enabled more FTRs to be available in the FTR auction. Second, it is allocated through the Auction Revenue Rights (ARR) process, where it is primarily received by congestion paying load-serving entities (LSEs). The majority of auction revenue is allocated through the ARR process.
The ARR process allocates dollars to: Excepted Transactions – special grandfathered transactions (listed in Attachment G of
NEPOOL Tariff) NEMA Contracts – other long-term contracts having delivery in Northeastern Massachusetts. Long-Term Firm Through or Out Service. Load Share – the proportional Real-Time Load Obligation share of Congestion paying
entities at the time of the pool’s coincident peak for the month.
The following table provides a more detailed view of how auction revenues are allocated through the ARR and IARR process by including the dollars allocated to each component of the ARR process for each of the last 13 months.
Month
Net FTR Auction Revenue
NEMA Contracts Load Share
Total ARR Allocation
IARR Allocation
Total Auction
Distribution
Dec-14 -$2,643,073 $107,284 $2,351,379 $2,458,663 $184,410 $2,643,073
Jan-15 -$2,550,692 $173,745 $2,204,769 $2,378,514 $172,177 $2,550,692
Feb-15 -$2,166,406 $145,223 $1,874,097 $2,019,320 $147,086 $2,166,406
Mar-15 -$2,514,028 $143,192 $2,176,677 $2,319,870 $194,158 $2,514,028
Apr-15 -$2,417,700 $136,857 $2,064,398 $2,201,255 $216,445 $2,417,700
May-15 -$2,197,557 $125,555 $1,912,888 $2,038,443 $159,114 $2,197,557
Jun-15 -$2,021,759 $122,082 $1,780,654 $1,902,736 $119,023 $2,021,759
Jul-15 -$2,244,746 $130,422 $2,007,525 $2,137,947 $106,799 $2,244,746
Aug-15 -$2,144,986 $128,899 $1,901,459 $2,030,358 $114,628 $2,144,986
Sep-15 -$1,941,326 $119,421 $1,732,040 $1,851,461 $89,865 $1,941,326
Oct-15 -$2,296,098 $145,650 $2,026,129 $2,171,779 $124,319 $2,296,098
Nov-15 -$2,232,470 $129,334 $1,993,071 $2,122,406 $110,064 $2,232,470
Dec-15 -$2,261,535 $135,105 $2,002,370 $2,137,475 $124,060 $2,261,535

Monthly Market Operations Report Page 37 of 63
December 2015 ISO-NE PUBLIC 2016 ISO New England Inc.
The following tables display the total distribution of On- and Off-Peak ARR dollars to the various
Load Zones for each of the last 13 months. The sum across zones totals to the ‘Total ARR Allocation’
column in the preceding table.
On Peak
Month ME NH VT CT RI SEMA WCMA NEMA
Dec-14 $168,868 $64,940 $16,023 $173,628 $249,971 $161,924 $105,836 $714,559
Jan-15 $120,582 $105,351 $4,157 $63,151 $154,627 $217,542 $87,377 $683,897
Feb-15 $103,122 $89,931 $11,807 $60,185 $134,302 $174,781 $68,039 $569,961
Mar-15 $105,223 $90,752 $15,018 $109,133 $146,789 $261,148 $86,707 $603,665
Apr-15 $79,888 $67,221 $10,070 $98,070 $141,832 $280,684 $63,525 $564,530
May-15 $69,189 $60,429 $36,413 $73,990 $134,728 $226,954 $56,765 $534,279
Jun-15 $64,336 $54,729 $22,825 $70,630 $134,434 $222,044 $49,667 $535,597
Jul-15 $69,481 $60,740 $11,050 $96,817 $144,218 $276,784 $58,493 $603,794
Aug-15 $71,162 $65,176 $10,212 $99,689 $137,116 $215,461 $51,590 $587,400
Sep-15 $65,528 $69,911 $10,142 $81,719 $124,279 $198,297 $49,641 $525,890
Oct-15 $69,523 $66,762 $7,549 $92,653 $111,904 $194,700 $51,857 $745,946
Nov-15 $67,164 $62,795 $11,331 $121,603 $132,348 $258,533 $52,510 $598,698
Dec-15 $72,492 $65,266 $9,350 $87,667 $130,605 $223,969 $61,021 $624,576
Off Peak
Month ME NH VT CT RI SEMA WCMA NEMA
Dec-14 $70,408 $23,104 $2,298 $32,411 $233,978 $110,667 $33,913 $296,135
Jan-15 $79,400 $71,504 $1,710 $21,900 $113,880 $144,743 $52,146 $456,547
Feb-15 $60,370 $55,988 $2,618 $25,783 $106,787 $127,022 $44,147 $384,476
Mar-15 $62,923 $56,295 $6,612 $53,440 $106,431 $162,404 $51,794 $401,535
Apr-15 $53,948 $47,425 $4,816 $55,303 $109,411 $192,570 $43,419 $388,544
May-15 $42,314 $39,129 $7,294 $41,144 $119,038 $193,988 $35,713 $367,076
Jun-15 $35,343 $31,027 $5,328 $24,769 $104,954 $160,643 $27,408 $359,002
Jul-15 $37,882 $34,550 $3,554 $37,191 $108,363 $181,052 $30,528 $383,451
Aug-15 $38,110 $40,884 $3,269 $29,905 $113,866 $165,884 $30,259 $370,375
Sep-15 $37,148 $42,006 $1,801 $25,370 $98,289 $151,276 $25,490 $344,675
Oct-15 $40,123 $40,063 $3,247 $60,337 $90,382 $128,523 $30,221 $437,990
Nov-15 $44,435 $42,624 $2,139 $38,584 $105,657 $166,967 $32,637 $384,382
Dec-15 $53,014 $49,061 $3,522 $38,313 $105,883 $146,699 $41,511 $424,526
Section 8
8.1 For More Information
The market rules governing the FTR auctions can be found in Section III.7 “Financial Transmission Rights Auctions” of the ISO’s Market Rule 1 located here.

Monthly Market Operations Report Page 38 of 63
December 2015 ISO-NE PUBLIC 2016 ISO New England Inc.
The business rules and procedures for FTR Auction Revenue Settlement can be found in Section 7 and the Incremental Auction Revenue Rights procedures can be found in Section 8 of the ISO’s Manual 6 – Financial Transmission Rights located here.
The methodology for and details of ARR Contracts can be found here.

Monthly Market Operations Report Page 39 of 63
December 2015 ISO-NE PUBLIC 2016 ISO New England Inc.
9. Reserve Markets
The sixteenth Forward Reserve Market Auction, covering the Winter 2015-2016 Procurement Period (October-May) cleared on September 9, 2015. The results may be found on the ISO’s website here.
Participants must meet their cleared portfolio-based obligations by assigning them to eligible generating or dispatchable asset related demand through offering or bidding them into the Energy Market at a $/MWh rate that is greater than or equal to the Forward Reserve Threshold Price. For the month of December 2015, the threshold price ranged from $16.20 to $43.88 and averaged $31.19.
Section 9
9.1 Forward Reserve Market Results
Each month, the ISO calculates an individual hourly Forward Reserve Payment Rate for each reserve product and reserve zone by reducing (on a $/MWh basis) their auction clearing price by the Forward Capacity Auction clearing price for the capacity zone associated to the reserve zone in effect for that month, adjusted pursuant to Section III.13.2.7.3(b)6. Payments will be further reduced by any Failure-to-Reserve or Failure-to-Activate Penalties. FRM payments by reserve zone made during the month are shown in the following table. These figures are preliminary and subject to revision during the Settlement process.
9.1.1 FRM Payment Summary by Reserve Zone, December 2015
Reserve Zone Reserve Product
Max FRM Payment
Final FRM Credits
Failure to Reserve
Penalties
Failure to Activate Penalties
Total FRM Performance
Pct. of Max.
SYSTEM TMNSR $2,862,024 $2,856,203 -$8,824 -$1,876 $2,845,503 99%
SYSTEM TMOR $1,286,648 $1,272,069 -$24,806 $0 $1,247,263 97%
SYSTEM TOTAL $4,148,672 $4,128,272 -$33,630 -$1,876 $4,092,766 99%
ROS TMNSR $1,537,488 $1,535,461 -$3,134 -$1,500 $1,530,827 100%
ROS TMOR $492,242 $484,272 -$14,892 $0 $469,380 95%
ROS TOTAL $2,029,730 $2,019,732 -$18,026 -$1,500 $2,000,206 99%
SWCT TMNSR $0 $0 $0 -$376 -$376 n/a
SWCT TMOR $367,282 $363,816 -$5,201 $0 $358,616 98%
SWCT TOTAL $367,282 $363,816 -$5,201 -$376 $358,240 98%
CT TMNSR $1,324,536 $1,320,742 -$5,690 $0 $1,315,053 99%
CT TMOR $427,123 $423,981 -$4,714 $0 $419,267 98%
CT TOTAL $1,751,659 $1,744,723 -$10,403 $0 $1,734,320 99%
NEMABSTN TMNSR $0 $0 $0 $0 $0 n/a
NEMABSTN TMOR $0 $0 $0 $0 $0 n/a
NEMABSTN TOTAL $0 $0 $0 $0 $0 n/a
6 Prior to the start of the Forward Capacity Market on June 1, 2010, the auction clearing price was reduced by the ICAP
Transition Rate for Unforced Capacity in effect for that month.

Monthly Market Operations Report Page 40 of 63
December 2015 ISO-NE PUBLIC 2016 ISO New England Inc.
The ISO allocates Forward Reserve Credits, net of Forward Reserve Failure-to-Reserve Penalties and Forward Reserve Failure-to-Activate Penalties, to each Load Zone. The Forward Reserve charge allocation method changed on June 1, 2011. Under the new Forward Reserve Cost Allocation, the Forward Reserves Credits for TMNSR and TMOR are not allocated separately. Instead, the Forward Reserve Credits are allocated based upon System Requirements (Step 1) and Remaining Forward Reserve Credit (Step 2), if applicable. The System Requirements include the cost of procuring TMNSR and TMOR to meet the minimum requirements for the New England Control Area (Market Rule 1, Section III.9.2.1). The remaining Forward Reserve Credit includes the Incremental Cost associated with procuring Forward Reserves above the System Requirements. See Market Rule 1, Section III.9.9 Forward Reserve Charges and Manual 28, Section 2.6.2 Forward Reserve Charges for details on the two-step cost allocation approach.
FRM charges allocated to each Load Zone during the prior week are shown in the following table. These figures are also preliminary and subject to revision during the Settlement process.
9.1.2 FRM Charge Summary by Load Zone, December 2015
Load Zone FRM Charge
ME $390,766
NH $392,919
VT $192,263
CT $1,005,020
RI $259,056
SEMA $475,966
WCMA $558,365
NEMA $818,411
ALL $4,092,766

Monthly Market Operations Report Page 41 of 63
December 2015 ISO-NE PUBLIC 2016 ISO New England Inc.
9.2 Real-Time On-Peak LMP vs. Forward Reserve Threshold Price, Last 13 Mos.
9.3 Composition of Forward Reserve Market Payments, Last 13 Mos.
$/M
Wh
$0.00
$50.00
$100.00
$150.00
$200.00
$250.00
$300.00
DEC2014
JAN2015
FEB2015
MAR2015
APR2015
MAY2015
JUN2015
JUL2
015
AUG2015
SEP2015
OCT2015
NOV2015
DEC2015
On-Peak LMP Average vs. Forward Reserve Strike/Threshold Price13 Mos. Ending December 2015
Number of times hourly RT LMP exceeded strike/threshold price during on-peak hours noted
Avg. RT On-Peak LMP FR Strike Price
481
22
56
28 56 68 122 140 93 76 87 79
Monthly Forward Reserve Market PaymentsBy Component, 13 Mos. Ending, December 2015
Tot Pmts Penalties
$M
illio
ns
$-5.0
$0.0
$5.0
$10.0
$15.0
DEC201
4JA
N2015
FEB2015
MAR20
15APR
2015
MAY2
015
JUN
2015
JUL2
015AUG201
5SE
P2015
OCT2
015NO
V2015DEC
2015

Monthly Market Operations Report Page 42 of 63
December 2015 ISO-NE PUBLIC 2016 ISO New England Inc.
9.4 Real-Time Reserve Markets
Resources that are providing Real-Time Reserves are designated in the ISO’s Energy Management System. When reserves are ample, the Real-Time Reserve price is $0. However, if there is a shortage of available reserves in a reserve zone or system-wide or reserve requirements are met through a re-dispatch of the system, non-zero Real-Time Reserve prices can result.
During the month, there were non-zero real-time reserve prices in 56 separate hours. On a reserve zone basis, non-zero prices occurred thus: CT-56 hours; NEMABSTN-56 hours; ROS-56 hours; SWCT-56 hours. The total compensation paid to assets providing real-time reserves during December 2015, and reductions in those payments for the Forward Reserve Obligation Charge are shown in the following table:
Reserve Zone Real-Time
Reserve Credits
Fwd Reserve Obligation
Charges Net Real-Time
Reserve Payments
SYSTEM $721,686 ($231,134) $490,552
ROS $350,834 ($103,278) $247,556
SWCT $191,169 ($16,288) $174,882
CT $154,875 ($111,568) $43,306
NEMABSTN $24,808 $0 $24,808
The ISO allocates Real Time Reserve Credits, net of Forward Reserve Energy Obligation Charges, to each Load Zone. The Real Time Reserve charges allocated to each Load Zone during the month are shown in the following table. These figures are also preliminary and subject to revision during the Settlement process.
Load Zone Reserve Product
RT Reserve Charge
ME TMSR $15,579
ME TMNSR $24,899
ME TMOR $7,462
ME ALL $47,940
NH TMSR $15,515
NH TMNSR $24,523
NH TMOR $7,298
NH ALL $47,336
VT TMSR $7,492
VT TMNSR $11,888
VT TMOR $3,555
VT ALL $22,935
CT TMSR $38,899
CT TMNSR $61,079
CT TMOR $18,176
CT ALL $118,154
RI TMSR $10,273

Monthly Market Operations Report Page 43 of 63
December 2015 ISO-NE PUBLIC 2016 ISO New England Inc.
Load Zone Reserve Product
RT Reserve Charge
RI TMNSR $16,307
RI TMOR $4,854
RI ALL $31,434
SEMA TMSR $19,326
SEMA TMNSR $30,850
SEMA TMOR $9,185
SEMA ALL $59,361
WCMA TMSR $21,960
WCMA TMNSR $34,622
WCMA TMOR $10,271
WCMA ALL $66,853
NEMA TMSR $31,649
NEMA TMNSR $50,029
NEMA TMOR $14,861
NEMA ALL $96,538
The following chart shows the frequency (in percent of total hours in the month) that there were non-zero reserve market prices by reserve zone and market product.
9.5 For More Information
The market rules governing the Forward Reserve Market can be found in Section III.9 “Forward Reserve Market” of the ISO’s Market Rule 1 located here.
Real-Time Reserve Price Frequency, December 2015
$0.01 - $10.00 $10.01 - $25.00
$25.01 - $49.99 Over $50
Pct
. of
Hrs
.
0
2
4
6
8
10
SWCT CT NEMABSTN ROS
TMSR
TMN
SR
TMO
R
TMSR
TMN
SR
TMO
R
TMSR
TMN
SR
TMO
R
TMSR
TMN
SR
TMO
R

Monthly Market Operations Report Page 44 of 63
December 2015 ISO-NE PUBLIC 2016 ISO New England Inc.
The market rules governing Real-Time Reserve can be found in Section III.10 “Real-Time Reserve” of the ISO’s Market Rule 1 located here.
The business rules and procedures for forward and real-time reserve can be found in the ISO’s Manual 28 –Market Rule 1 Accounting located here.
Information about the monthly forward reserve auctions and assumptions can be found on the ISO’s web site located here.

Monthly Market Operations Report Page 45 of 63
December 2015 ISO-NE PUBLIC 2016 ISO New England Inc.
10. Regulation Market
Regulation, or Automatic Generation Control (AGC), is necessary to balance supply levels against second-to-second variations in demand.
10.1 Monthly Average of Hourly Regulation Market Clearing Price, Last 13 Months
$/M
Wh
$0
$10
$20
$30
$40
$50
$60
DEC20
14JA
N20
15FE
B2015
MAR20
15APR
2015
MAY2
015
JUN20
15JU
L201
5AU
G2015
SEP20
15O
CT20
15N
OV20
15DEC
2015
Monthly Regulation Clearing Price13 Months Ending December 2015
Avg Clearing Price Avg Service Clearing PriceAvg Capacity Clearing Price
10.2 Monthly Regulation Market Clearing Price Statistics, Last 13 Months
On-Peak Clearing Price Statistics Off-Peak Clearing Price Statistics
Month Mean Max Min StdDev Mean Max Min StdDev
Dec-14 $17.32 $579.91 $3.86 $45.95 $21.51 $170.60 $2.47 $27.66
Jan-15 $15.54 $381.13 $4.09 $22.36 $17.39 $136.99 $4.08 $16.32
Feb-15 $20.39 $222.55 $4.00 $20.09 $28.80 $214.05 $4.19 $27.23
Mar-157 $11.46 $66.82 $3.67 $8.51 $16.13 $167.32 $2.86 $17.25
7 March 1-30, 2015

Monthly Market Operations Report Page 46 of 63
December 2015 ISO-NE PUBLIC 2016 ISO New England Inc.
On-Peak Service Clearing Price Statistics Off-Peak Service Clearing Price Statistics
Month Mean Max Min StdDev Mean Max Min StdDev
Mar-158 $0.00 $0.00 $0.00 $0.00 $0.00 $0.00 $0.00 $0.00
Apr-15 $0.16 $8.33 $0.00 $0.51 $0.44 $10.00 $0.00 $1.07
May-15 $0.28 $10.00 $0.00 $0.70 $0.39 $5.00 $0.00 $0.63
Jun-15 $0.13 $1.63 $0.00 $0.23 $0.41 $9.32 $0.00 $1.09
Jul-15 $0.30 $9.32 $0.00 $0.75 $0.27 $4.21 $0.00 $0.35
Aug-15 $0.43 $10.00 $0.00 $1.11 $0.21 $1.58 $0.00 $0.32
Sep-15 $0.40 $6.69 $0.00 $0.83 $0.27 $2.58 $0.00 $0.33
Oct-15 $0.34 $3.00 $0.00 $0.40 $0.31 $3.00 $0.00 $0.44
Nov-15 $0.26 $3.25 $0.00 $0.41 $0.21 $3.00 $0.00 $0.34
Dec-15 $0.27 $5.00 $0.00 $0.54 $0.27 $2.58 $0.00 $0.34
On-Peak Capacity Clearing Price Statistics Off-Peak Capacity Clearing Price Statistics
Month Mean Max Min StdDev Mean Max Min StdDev
Mar-157 $25.95 $38.94 $11.63 $10.67 $77.63 $103.66 $47.98 $16.66
Apr-15 $21.17 $311.42 $5.20 $19.30 $21.61 $123.38 $2.51 $16.97
May-15 $22.71 $103.94 $5.69 $12.92 $28.46 $1172.47 $3.80 $79.10
Jun-15 $23.49 $167.02 $5.03 $17.56 $23.96 $158.94 $4.48 $21.02
Jul-15 $27.23 $238.79 $2.44 $26.57 $19.77 $157.95 $3.67 $16.79
Aug-15 $42.56 $406.99 $5.71 $50.55 $23.40 $633.04 $4.43 $35.71
Sep-15 $39.82 $452.31 $4.70 $53.68 $21.65 $361.07 $2.53 $24.74
Oct-15 $25.02 $107.33 $6.16 $15.82 $24.41 $179.50 $2.93 $21.64
Nov-15 $23.71 $278.26 $4.83 $25.12 $26.20 $165.23 $4.26 $22.53
Dec-15 $19.91 $247.86 $3.24 $19.97 $20.47 $221.93 $4.65 $19.43
8 March 31, 2015 only.

Monthly Market Operations Report Page 47 of 63
December 2015 ISO-NE PUBLIC 2016 ISO New England Inc.
10.3 Components of Monthly Regulation Market Cost, Last 13 Months
Month Time on
Regulation Cost Regulation
Service Cost Lost Opportunity
Credit Cost Regulation Make
Whole Cost Total Regulation
Cost
Dec-14 $1,306,281 $1,193,306 $0 $818,771 $3,318,359
Jan-15 $831,261 $755,841 $0 $507,000 $2,094,103
Feb-15 $1,125,593 $1,066,715 $0 $742,775 $2,935,082
Mar-15 $677,989 $635,039 $87,609 $408,462 $1,809,099
Apr-15 $0 $129,914 $929,817 $91,276 $1,151,008
May-15 $0 $148,482 $1,092,814 $166,408 $1,407,704
Jun-15 $0 $151,530 $1,193,435 $105,423 $1,450,389
Jul-15 $0 $143,908 $1,100,080 $115,006 $1,358,994
Aug-15 $0 $214,678 $2,021,950 $175,425 $2,412,052
Sep-15 $0 $197,877 $1,967,593 $327,013 $2,492,483
Oct-15 $0 $160,852 $1,172,225 $122,919 $1,455,996
Nov-15 $0 $123,363 $1,365,937 $202,282 $1,691,582
Dec-15 $0 $189,570 $1,260,422 $171,565 $1,621,557
10.4 For More Information
The market rules governing the Regulation Market can be found in Section III.1.11.5 “Regulation” of the ISO’s Market Rule 1 located here.
Monthly Regulation Market CostBy Component, 13 Mos. Ending, December 2015
Time-On Credit Service Credit
Capacity Credit Make Whole Cost
$0
$1,000,000
$2,000,000
$3,000,000
$4,000,000
DEC201
4JA
N2015
FEB2015
MAR20
15APR
2015
MAY2
015
JUN
2015
JUL2
015AUG201
5SE
P2015
OCT2
015NO
V2015DEC
2015

Monthly Market Operations Report Page 48 of 63
December 2015 ISO-NE PUBLIC 2016 ISO New England Inc.
The business rules and procedures for the Regulation Market can be found in the ISO’s Manual 11 – Market Operations located here:
Information about current regulation clearing prices can be found on the ISO’s web site here.
Selectable hourly historical regulation clearing prices can be found on the ISO’s web site here.
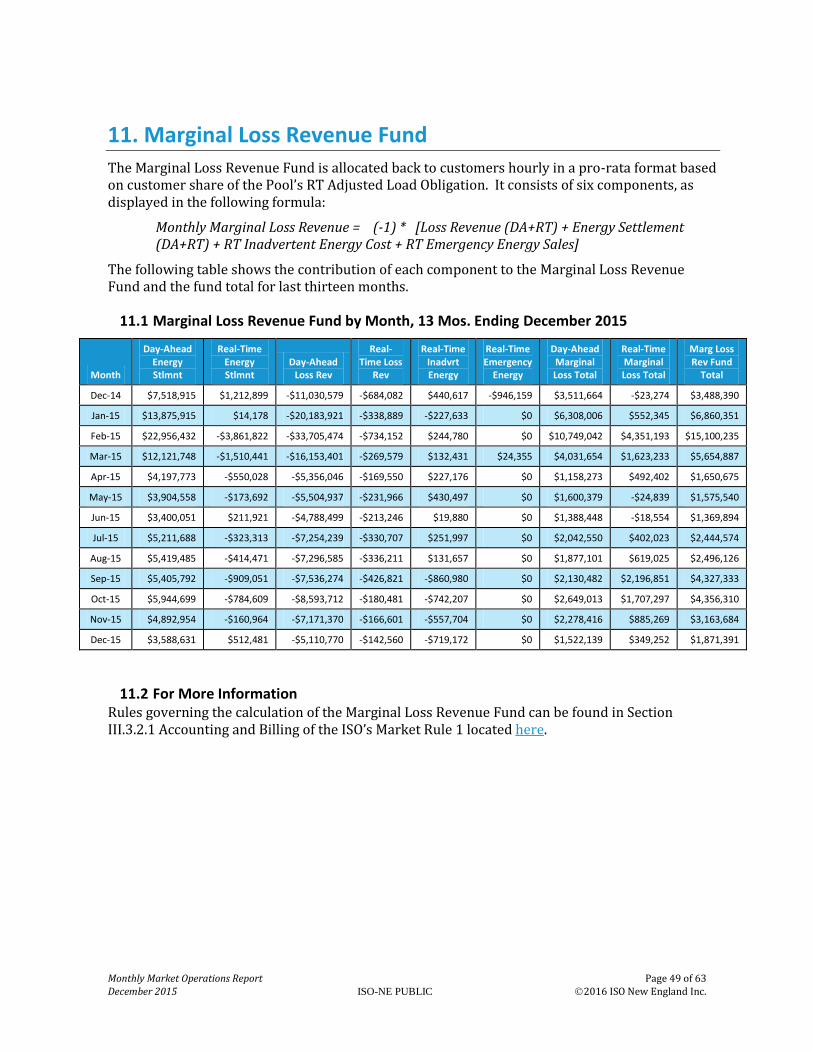
Monthly Market Operations Report Page 49 of 63
December 2015 ISO-NE PUBLIC 2016 ISO New England Inc.
11. Marginal Loss Revenue Fund
The Marginal Loss Revenue Fund is allocated back to customers hourly in a pro-rata format based on customer share of the Pool’s RT Adjusted Load Obligation. It consists of six components, as displayed in the following formula:
Monthly Marginal Loss Revenue = (-1) * [Loss Revenue (DA+RT) + Energy Settlement (DA+RT) + RT Inadvertent Energy Cost + RT Emergency Energy Sales]
The following table shows the contribution of each component to the Marginal Loss Revenue Fund and the fund total for last thirteen months.
11.1 Marginal Loss Revenue Fund by Month, 13 Mos. Ending December 2015
Month
Day-Ahead Energy Stlmnt
Real-Time Energy Stlmnt
Day-Ahead Loss Rev
Real-Time Loss
Rev
Real-Time Inadvrt Energy
Real-Time Emergency
Energy
Day-Ahead Marginal Loss Total
Real-Time Marginal Loss Total
Marg Loss Rev Fund
Total
Dec-14 $7,518,915 $1,212,899 -$11,030,579 -$684,082 $440,617 -$946,159 $3,511,664 -$23,274 $3,488,390
Jan-15 $13,875,915 $14,178 -$20,183,921 -$338,889 -$227,633 $0 $6,308,006 $552,345 $6,860,351
Feb-15 $22,956,432 -$3,861,822 -$33,705,474 -$734,152 $244,780 $0 $10,749,042 $4,351,193 $15,100,235
Mar-15 $12,121,748 -$1,510,441 -$16,153,401 -$269,579 $132,431 $24,355 $4,031,654 $1,623,233 $5,654,887
Apr-15 $4,197,773 -$550,028 -$5,356,046 -$169,550 $227,176 $0 $1,158,273 $492,402 $1,650,675
May-15 $3,904,558 -$173,692 -$5,504,937 -$231,966 $430,497 $0 $1,600,379 -$24,839 $1,575,540
Jun-15 $3,400,051 $211,921 -$4,788,499 -$213,246 $19,880 $0 $1,388,448 -$18,554 $1,369,894
Jul-15 $5,211,688 -$323,313 -$7,254,239 -$330,707 $251,997 $0 $2,042,550 $402,023 $2,444,574
Aug-15 $5,419,485 -$414,471 -$7,296,585 -$336,211 $131,657 $0 $1,877,101 $619,025 $2,496,126
Sep-15 $5,405,792 -$909,051 -$7,536,274 -$426,821 -$860,980 $0 $2,130,482 $2,196,851 $4,327,333
Oct-15 $5,944,699 -$784,609 -$8,593,712 -$180,481 -$742,207 $0 $2,649,013 $1,707,297 $4,356,310
Nov-15 $4,892,954 -$160,964 -$7,171,370 -$166,601 -$557,704 $0 $2,278,416 $885,269 $3,163,684
Dec-15 $3,588,631 $512,481 -$5,110,770 -$142,560 -$719,172 $0 $1,522,139 $349,252 $1,871,391
11.2 For More Information Rules governing the calculation of the Marginal Loss Revenue Fund can be found in Section III.3.2.1 Accounting and Billing of the ISO’s Market Rule 1 located here.

Monthly Market Operations Report Page 50 of 63
December 2015 ISO-NE PUBLIC 2016 ISO New England Inc.
12. Forward Capacity Market
The Forward Capacity Market (FCM) is an auction based approach to meeting New England’s forecasted capacity requirements for a future year. A portfolio of supply and demand resources is selected to provide this capacity through a competitive Forward Capacity Auction (FCA) process. Resources clearing in the FCA are paid the market clearing price for capacity and acquire a capacity supply obligation (CSO), a financially binding obligation to provide the cleared amount of capacity. FCM was implemented in June 2010, corresponding with the termination of the Forward Capacity Transition Period. For more information on the Forward Capacity Transition Period, see Section 12 of the Monthly Market Reports published prior to June 2011.
12.1 FCM Auction Results and Monthly Modifications
The outcome of the Forward Capacity Auction (FCA) determines the initial CSOs for Resources. In the event that the Capacity Clearing Price Floor condition is reached in the FCA, the ISO will adjust (prorate) the per-MW rate of each CSO to adjust the over-purchased capacity. After the FCA is finalized, Lead Participants of obligated Resources may have the option to leave the CSO of these resources based upon the default proration (full CSO with a reduced payment rate - referred to as ‘price proration’) or opt to prorate the CSO MWs and receive the full CCP (described as ‘MW proration’). The proration elections chosen by resources will not have an effect on the total amount of charges to load. The following table shows the aggregated CSO values by resource type from FCA 6, the 2015-2016 commitment period, with prorated amounts and change from the FCA for each resource type.
2015-2016 Forward Capacity Auction
Resource Type FCA CSO
MW Prorated CSO MW
Proration Change MW
Demand 3,645 3,472 -173
Generator 30,757 28,798 -1,959
Import 1,924 1,768 -156
Total 36,326 34,038 -2,288
In the event where proration is rejected for reliability reasons, the resource will be still be paid consistent with the proration method. The difference between the resources actual payment based on the Capacity Clearing Price and what its payment would have been had prorationing not been rejected, will result in an FCM Proration Denial for Reliability Charge (PDFR) to cover this cost. This charge shall be allocated to Regional Network Load within the affected Reliability Region.
FCM Proration Denial for Reliability Charge
Month ME NH VT CT RI SEMA WCMA NEMA
Dec-14 $0 $0 $0 $0 $0 $0 $0 $984,410
Jan-15 $0 $0 $0 $0 $0 $0 $0 $984,410
Feb-14 $0 $0 $0 $0 $0 $0 $0 $984,410
Mar-14 $0 $0 $0 $0 $0 $0 $0 $984,410
Apr-15 $0 $0 $0 $0 $0 $0 $0 $988,468
May-15 $0 $0 $0 $0 $0 $0 $0 $988,468

Monthly Market Operations Report Page 51 of 63
December 2015 ISO-NE PUBLIC 2016 ISO New England Inc.
Month ME NH VT CT RI SEMA WCMA NEMA
Jun-15 $0 $0 $0 $0 $0 $0 $96 $861,481
Jul-15 $0 $0 $0 $0 $0 $0 $96 $861,481
Aug-15 $0 $0 $0 $0 $0 $0 $96 $861,481
Sep-15 $0 $0 $0 $0 $0 $0 $96 $861,481
Oct-15 $0 $0 $0 $0 $0 $0 $167 $862,385
Nov-15 $0 $0 $0 $0 $0 $0 $167 $862,385
Dec-15 $0 $0 $0 $0 $0 $0 $167 $858,698
Each month, CSO values can change for a variety of reasons, which are referred to below as CSO modifications. Typically, changes result from the monthly or annual Reconfiguration Auctions. Additional examples of CSO modifications include ISO participation in annual reconfiguration auctions and termination of resource supply obligations. The table below displays the CSO modifications for the current month.
CSO Modifications for December 2015
Capacity Zone Resource Type
Balance Net CSO MW for
Multiyear Offer MW
Existing Capacity
Obligation MW
Multi-Year Existing Capacity
Obligation MW
New Capacity
Obligation MW
Retained for Reliability Capacity
Obligation MW
Self-Supply Capacity
Obligation MW Total MW
Rest-of-Pool Demand Resource 0.00 -229.18 -115.43 -6.37 -51.23 0.00 -402.22
Rest-of-Pool Generator 0.00 -52.86 -13.50 -48.37 -27.38 -0.21 -142.31
Rest-of-Pool Import 0.00 0.00 0.00 0.00 0.00 0.00 0.00
Total 0.00 -282.04 -128.93 -54.74 -78.61 -0.21 -544.53
The table below displays a summary of the prorated CSO MW and dollars from the FCA, along with the CSO modifications for the current month. The CSO modification MWs are totaled for each Resource and Capacity Zone from the table above. These CSO modifications are used in the calculation of the final CSO MW and Dollars.
Final CSO MW and Dollars for December 2015
Capacity Zone Resource Type CSO MW CSO Dollars
CSO Modification
MW
CSO Modification
Dollars Final CSO MW Final CSO Dollars
Rest-of-Pool Demand Resource 2,887 $8,894,458 -401.69 -$1,354,148 2,485.34 $7,540,310
Rest-of-Pool Generator 30,203 $87,340,944 -149.82 -$476,630 30,053.46 $86,864,315
Rest-of-Pool Import 1,124 $4,576,206 0.00 $0 1,123.59 $4,576,206
Total 34,214 $100,811,608 -551.51 -$1,830,777 33,662.39 $98,980,830
12.2 FCM Payments and Charges
Supply Credit is the total credit paid to customer resources for incurring a CSO and is the sum of the following types of CSO-related payments: Forward Capacity Auction (FCA) Credits, Bilateral

Monthly Market Operations Report Page 52 of 63
December 2015 ISO-NE PUBLIC 2016 ISO New England Inc.
Dollars, and Reconfiguration Auction (RA) Dollars. The following table shows total Supply Credit and its aforementioned components by Capacity Zone for the last thirteen months.
Month Capacity Zone FCA Credit Bilateral Dollars
Reconfiguration Auction Dollars Supply Credit
Dec-14 Rest-of-Pool $94,029,070 $0 -$767,700 $93,261,370
Jan-15 Rest-of-Pool $94,029,070 $0 -$767,700 $93,261,370
Feb-15 Rest-of-Pool $94,029,070 $0 -$767,700 $93,261,370
Mar-15 Rest-of-Pool $94,029,070 $0 -$767,700 $93,261,370
Apr-15 Rest-of-Pool $93,732,433 $0 -$767,700 $92,964,733
May-15 Rest-of-Pool $93,732,433 $0 -$767,700 $92,964,733
Jun-15 Rest-of-Pool $98,950,067 $0 -$878,406 $98,071,661
Jul-15 Rest-of-Pool $98,947,696 $0 -$885,249 $98,062,447
Aug-15 Rest-of-Pool $98,934,393 $0 -$885,249 $98,049,145
Sep-15 Rest-of-Pool $98,930,901 $0 -$885,249 $98,045,652
Oct-15 Rest-of-Pool $99,585,324 $0 -$868,837 $98,716,488
Nov-15 Rest-of-Pool $99,585,324 $0 -$869,569 $98,715,755
Dec-15 Rest-of-Pool $99,854,666 $0 -$873,836 $98,980,830
The initial supply credit paid for the CSO, as shown above, can be further adjusted based upon computed values for Peak Energy Rent (PER), the participation of the ISO in reconfiguration auctions, and actual resource performance. PER is a downward adjustment of FCM payments to reflect energy market revenues earned during high priced hours. In reconfiguration auctions, credits are reduced by the sale of excess CSO by the ISO or increased by the purchase of additional CSO. Resource availability during shortage events (generator and import resources) or performance during dispatch events and performance hours (demand resources) result in additional penalties and credits. The supply credit adjusted for reasons just stated results in the pool of money called the Net Regional Clearing Price (NRCP) Credit, which is the basis for charges for capacity allocated to real-time load obligation. Additional credits may be earned by resources retained for reliability and their cost is allocated to Regional Network Load through the Open-Access Transmission Tariff rather than to Capacity Load Obligation (CLO).
The following table shows the various credit adjustments and total payments in the FCM made over the last 13 obligation months.
Month Capacity
Zone CSO MW
Supply Credit (A)
PER Adjustment (B)
Excess DR Penalties (C)
NRCP Credit (D=A+B+C)
Reliability Credit (E)
Total Payment (F=D+E)
Dec-14 Rest-of-Pool 32,981 $93,261,370 -$1,064,892 $0 $92,196,478 $0 $92,196,478
Jan-15 Rest-of-Pool 32,981 $93,261,370 -$2,380,343 $0 $90,881,026 $0 $90,881,026
Feb-15 Rest-of-Pool 32,981 $93,261,370 -$2,548,451 $0 $90,712,918 $0 $90,712,918
Mar-15 Rest-of-Pool 32,981 $93,261,370 -$2,692,864 $0 $90,568,506 $0 $90,568,506
Apr-15 Rest-of-Pool 32,870 $92,964,733 -$2,677,728 $0 $90,287,005 $0 $90,287,005
May-15 Rest-of-Pool 32,870 $92,964,733 -$2,685,472 $0 $90,279,260 $0 $90,279,260
Jun-15 Rest-of-Pool 33,388 $98,071,661 -$3,572,771 $0 $94,498,890 $0 $94,498,890
Jul-15 Rest-of-Pool 33,382 $98,062,447 -$3,571,826 $0 $94,490,621 $0 $94,490,621
Aug-15 Rest-of-Pool 33,378 $98,049,145 -$3,568,844 $0 $94,480,301 $0 $94,480,301
Sep-15 Rest-of-Pool 33,377 $98,045,652 -$4,691,033 $0 $93,354,619 $0 $93,354,619

Monthly Market Operations Report Page 53 of 63
December 2015 ISO-NE PUBLIC 2016 ISO New England Inc.
Month Capacity
Zone CSO MW
Supply Credit (A)
PER Adjustment (B)
Excess DR Penalties (C)
NRCP Credit (D=A+B+C)
Reliability Credit (E)
Total Payment (F=D+E)
Oct-15 Rest-of-Pool 33,580 $98,716,488 -$5,379,309 $0 $93,337,178 $0 $93,337,178
Nov-15 Rest-of-Pool 33,579 $98,715,755 -$5,394,379 $0 $93,321,376 $0 $93,321,376
Dec-15 Rest-of-Pool 33,662 $98,980,830 -$5,445,629 $0 $93,535,202 $0 $93,535,202
For each month and Capacity Zone, Load Serving Entities (LSEs) have capacity requirements which are calculated as their share of the total CSO purchased, based on their contribution to the system peak load from the previous year. Customers pay for capacity based on CLO. A customer’s CLO is equivalent to its capacity requirement, adjusted for any Hydro-Quebec Installed Capacity Credits (HQICC), self-supply MWs, and CLO bilateral contracts. CLO bilateral contracts provide a means of transferring a capacity load obligation between two customers. Note that any customer, not just LSEs, can take on or shed CLO through a CLO bilateral contract.
The Net Regional Clearing Price is the rate at which load pays for capacity. It is calculated as:
NRCP ($/kW-month) = NRCP Credit / (CLO MW * 1000)
Where: CLO MW = CSO MW – Self Supply MW – Excess RTEG MW
Excess RTEG MW is composed of the CSO MW of Real Time Emergency Generation purchased in the Forward Capacity Auction in excess of 600 MW.
Charges are calculated as the product of a customer’s CLO and the NRCP.
The following table provides details on aggregate FCM charges to load.
Month CSO MW
(A)
CLO Bilat MW
HQICC MW (B)
Excess RTEG MW (C)
Self Supply
MW (D)
Capacity Req MW
(E=A+B-C)
Peak Contrib
MW CLO MW (F=A-C-D)
Net Regional Clearing Price ($/kW-month)
Capacity Load
Obligation Charge
Dec-14 32,981 454 996 0 3,166 33,977 26,911 29,815 $3.092281 $92,196,478
Jan-15 32,981 454 996 0 3,166 33,977 26,911 29,815 $3.048160 $90,881,026
Feb-15 32,981 454 996 0 3,166 33,977 26,911 29,815 $3.042522 $90,712,918
Mar-15 32,981 454 996 0 3,166 33,977 26,911 29,815 $3.037678 $90,568,506
Apr-15 32,870 204 996 0 3,166 33,866 26,911 29,704 $3.039607 $90,287,005
May-15 32,870 204 996 0 3,166 33,866 26,911 29,704 $3.039346 $90,279,260
Jun-15 33,388 115 1,042 0 4,164 34,430 24,068 29,225 $3.233514 $94,498,890
Jul-15 33,382 115 1,042 0 4,164 34,424 24,068 29,219 $3.233892 $94,490,621
Aug-15 33,378 115 1,042 0 4,164 34,420 24,068 29,215 $3.233971 $94,480,301
Sep-15 33,377 115 1,042 0 4,164 34,419 24,068 29,214 $3.195551 $93,354,619
Oct-15 33,580 115 1,042 0 4,163 34,622 24,068 29,417 $3.172952 $93,337,178
Nov-15 33,579 115 1,042 0 4,163 34,621 24,068 29,416 $3.172475 $93,321,376
Dec-15 33,662 115 1,042 0 4,163 34,704 24,068 29,499 $3.170781 $93,535,202
The calculations below describe how the Capacity Requirement and the Capacity Load Obligations are calculated for each Capacity Zone.
Capacity Requirement Capacity Zone = (Peak Contribution MW (CCP-2) Capacity Zone / Peak Contribution

Monthly Market Operations Report Page 54 of 63
December 2015 ISO-NE PUBLIC 2016 ISO New England Inc.
(CCP-2) Pool ) * (CSO Pool + HQICC MW pool - Excess RTEG MW pool) * (-1) CLO Capacity Zone = Capacity Requirement Capacity Zone - HQICC MW Capacity Zone - CLO Self-Supply MW
Capacity Zone
There are two sides to a self-supply agreement – the generator supplying the MW and the entity using the MW to reduce its capacity requirement. During the 2013/2014 commitment period, with multiple capacity zones, a generator in Maine can have self-supply designations
in both the Rest-of-Pool (ROP) and Maine. The NRCP is the per MW cost of capacity in a capacity zone. Self-supply MW used in the NRCP calculation are based on where the
generator supplying the MWs resides and is presented in that manner below.
The following table provides details on FCM charges to load at the Capacity Zone level.
Month Capacity
Zone CSO MW HQICC MW
Self Supply
MW Capacity Req MW
Peak Contrib
MW CLO MW
Net Regional Clearing Price ($/kW-month)
Capacity Load Obligation
Charge
Dec-14 Rest-of-Pool 32,981 996 3,166 33,977 26,911 29,815 $3.092281 $92,196,478
Jan-15 Rest-of-Pool 32,981 996 3,166 33,977 26,911 29,815 $3.048160 $90,881,026
Feb-15 Rest-of-Pool 32,981 996 3,166 33,977 26,911 29,815 $3.042522 $90,712,918
Mar-15 Rest-of-Pool 32,981 996 3,166 33,977 26,911 29,815 $3.037678 $90,568,506
Apr-15 Rest-of-Pool 32,870 996 3,166 33,866 26,911 29,704 $3.039607 $90,287,005
May-15 Rest-of-Pool 32,870 996 3,166 33,866 26,911 29,704 $3.039346 $90,279,260
Jun-15 Rest-of-Pool 33,388 1,042 4,164 34,430 24,068 29,225 $3.233514 $94,498,890
Jul-15 Rest-of-Pool 33,382 1,042 4,164 34,424 24,068 29,219 $3.233892 $94,490,621
Aug-15 Rest-of-Pool 33,378 1,042 4,164 34,420 24,068 29,215 $3.233971 $94,480,301
Sep-15 Rest-of-Pool 33,377 1,042 4,164 34,419 24,068 29,214 $3.195551 $93,354,619
Oct-15 Rest-of-Pool 33,580 1,042 4,163 34,622 24,068 29,417 $3.172952 $93,337,178
Nov-15 Rest-of-Pool 33,579 1,042 4,163 34,621 24,068 29,416 $3.172475 $93,321,376
Dec-15 Rest-of-Pool 33,662 1,042 4,163 34,704 24,068 29,499 $3.170781 $93,535,202
12.3 PER Adjustment
As stated above, PER is a payment adjustment made to reflect revenues earned by resources during high priced hours in the Energy markets. Generation and Import resources with a CSO are subject to PER adjustments (excluding self-supply CSO MWs). Demand resources are not subject to PER adjustments.
The following table provides detail, by month and capacity zone, of the CSO subject to PER, the rate at which these CSO are charged, and the total PER adjustment. It is important to note that individual resources are subject to an overall PER cap. Therefore, the product of the CSO and the rate in the table below will not necessarily equal the total PER adjustment.

Monthly Market Operations Report Page 55 of 63
December 2015 ISO-NE PUBLIC 2016 ISO New England Inc.
Month Capacity Zone PER CSO MW
Average PER ($/kW-month)
Total PER Adjustment
Dec-14 Rest-of-Pool 28,023 0.038 $1,064,892
Jan-15 Rest-of-Pool 28,004 0.085 $2,380,343
Feb-15 Rest-of-Pool 28,005 0.091 $2,548,451
Mar-15 Rest-of-Pool 28,051 0.096 $2,692,864
Apr-15 Rest-of-Pool 27,893 0.096 $2,677,728
May-15 Rest-of-Pool 27,974 0.096 $2,685,472
Jun-15 Rest-of-Pool 27,066 0.132 $3,572,771
Jul-15 Rest-of-Pool 27,059 0.132 $3,571,826
Aug-15 Rest-of-Pool 27,037 0.132 $3,568,844
Sep-15 Rest-of-Pool 27,116 0.173 $4,691,033
Oct-15 Rest-of-Pool 27,306 0.197 $5,379,309
Nov-15 Rest-of-Pool 27,383 0.197 $5,394,379
Dec-15 Rest-of-Pool 27,503 0.198 $5,445,629
12.4 Sources of Capacity
The following graph shows, in MW, the amount of capacity procured by type in New England for each of the last 13 months. The subsequent table displays the data underlying the graph.
CSO Sources by Type13 Months Ending December 2015
Generator Demand Import
MW
25,000
27,000
29,000
31,000
33,000
35,000
DEC14
JAN15
FEB15
MAR15
APR15
MAY1
5JU
N15
JUL1
5AUG15SE
P15O
CT15
NOV15
DEC15

Monthly Market Operations Report Page 56 of 63
December 2015 ISO-NE PUBLIC 2016 ISO New England Inc.
Month
Demand Resource
MW Generation
MW Import MW Total MW
Dec-14 1,821 30,548 612 32,981
Jan-15 1,842 30,528 612 32,981
Feb-15 1,840 30,529 612 32,981
Mar-15 1,794 30,461 725 32,981
Apr-15 1,840 30,269 760 32,870
May-15 1,836 30,340 694 32,870
Jun-15 2,194 29,967 1,227 33,388
Jul-15 2,188 29,907 1,287 33,382
Aug-15 2,209 29,987 1,182 33,378
Sep-15 2,146 30,049 1,182 33,377
Oct-15 2,135 30,467 978 33,580
Nov-15 2,132 30,378 1,069 33,579
Dec-15 2,095 30,601 967 33,662
12.5 Capacity Imports
The following table shows the monthly CSO MW resulting from imports for each of the last 13 months.
Month Capacity Zone NY AC Ties New
Brunswick HQ Phase
I/II HQ Highgate Total
Dec-14 Rest-of-Pool 80 0 39 194 313
Jan-15 Rest-of-Pool 80 0 39 194 313
Feb-15 Rest-of-Pool 80 0 39 194 313
Mar-15 Rest-of-Pool 150 0 39 194 383
Apr-15 Rest-of-Pool 146 0 78 194 418
May-15 Rest-of-Pool 80 0 78 194 352
Jun-15 Rest-of-Pool 82 0 0 180 261
Jul-15 Rest-of-Pool 82 0 0 180 261
Aug-15 Rest-of-Pool 82 0 39 180 300
Sep-15 Rest-of-Pool 82 0 39 180 300
Oct-15 Rest-of-Pool 82 0 0 31 113
Nov-15 Rest-of-Pool 82 0 0 31 113
Dec-15 Rest-of-Pool 82 0 0 31 113
12.6 Performance
All capacity resources with a CSO are subject to evaluation during each obligation month of a commitment period to ensure they can deliver the capacity for which they are paid. Generation and Import resources are evaluated for performance during shortage events. Demand resources are evaluated during dispatch events and performance hours.

Monthly Market Operations Report Page 57 of 63
December 2015 ISO-NE PUBLIC 2016 ISO New England Inc.
12.6.1 Generation and Import Resource Availability
A shortage event reflects a shortage of operating reserves, as defined by 30 or more consecutive minutes of system Reserve Constraint Penalty Factor activation. Available MWs from Generation and Import resources are measured during shortage events, and availability scores are calculated based on this performance. Available MWs can be adjusted by Supplemental Availability Bilateral (SAB) agreements as well as exempt outage MWs. A resource’s availability score is then used to compute the availability penalty associated with the shortage event.
Month
Hours with Shortage
Events
Total Duration of Shortage
Events (Hours) Resource Type SAB MW
(Sold) SAB MW
(purchased) Shortage Event
Penalty
Dec-14 0 0.00 Generator 0 0 $0
Dec-14 0 0.00 Import 0 0 $0
Jan-15 0 0.00 Generator 0 0 $0
Jan-15 0 0.00 Import 0 0 $0
Feb-15 0 0.00 Generator 0 0 $0
Feb-15 0 0.00 Import 0 0 $0
Mar-15 0 0.00 Generator 0 0 $0
Mar-15 0 0.00 Import 0 0 $0
Apr-15 0 0.00 Generator 0 0 $0
Apr-15 0 0.00 Import 0 0 $0
May-15 0 0.00 Generator 0 0 $0
May-15 0 0.00 Import 0 0 $0
Jun-15 0 0.00 Generator 0 0 $0
Jun-15 0 0.00 Import 0 0 $0
Jul-15 0 0.00 Generator 0 0 $0
Jul-15 0 0.00 Import 0 0 $0
Aug-15 0 0.00 Generator 0 0 $0
Aug-15 0 0.00 Import 0 0 $0
Sep-15 0 0.00 Generator 0 0 $0
Sep-15 0 0.00 Import 0 0 $0
Oct-15 0 0.00 Generator 0 0 $0
Oct-15 0 0.00 Import 0 0 $0
Nov-15 0 0.00 Generator 0 0 $0
Nov-15 0 0.00 Import 0 0 $0
Dec-15 0 0.00 Generator 0 0 $0
Dec-15 0 0.00 Import 0 0 $0
12.6.2 Demand Resource Performance
Demand Resources are collections of assets which reduce their consumption of energy in order to provide capacity to the system. There are four types of Demand Resources: Real-Time Demand Response resources (RTDR), Real-Time Emergency Generation resources (RTEG), On-Peak resources, and Seasonal Peak resources. RTDR and RTEG are active demand resources, and are required to respond to dispatch instructions from ISO-NE. During these dispatch events, active

Monthly Market Operations Report Page 58 of 63
December 2015 ISO-NE PUBLIC 2016 ISO New England Inc.
resources are expected to curtail their energy consumption for the system by an amount equal to that requested by ISO-NE. On-Peak and Seasonal Peak resources, on the other hand, are passive demand resources, and do not receive dispatch instructions from ISO-NE. Instead, these resources curtail their electricity use at set times throughout the year. On-Peak resources must reduce consumption during summer peak hours (non-holiday weekdays, 1:00 p.m. to 5:00 p.m., during June, July, and August) and winter peak hours (non-holiday weekdays, 5:00 p.m. to 7:00 p.m., during December and January). Seasonal Peak resources must reduce consumption during the summer months of June, July, and August and during the winter months of December and January in hours on non-holiday weekdays when the Real-Time System Hourly Load is equal to or greater than 90% of the most recent “50/50” System Peak Load Forecast.
Demand Resource performance is measured during hours with dispatch events for active resources, and during performance hours for passive resources. Resources with a capacity value less than their CSO will be assessed a penalty, while those with a capacity value greater than their CSO are eligible for a performance incentive. In the absence of a performance event during performance months, a resource’s capacity value and resulting variance will be based on its effective audit result; and in non-performance months, a resource’s capacity value and resulting variance will be based upon its Seasonal Demand Reduction Value.
The following table displays a pool-level summary of Demand Resource performance by type for the past 13 months.
Month DR Type Performance
Hours CSO MW
Capacity Value (MW)
Negative Capacity Variance
(MW)
Positive Capacity Variance
(MW) Performance Penalty ($)
Performance Incentive ($)
Dec-14 ON_PEAK 44 1,032.94 1,649.05 -12.80 628.90 -$36,533 $111,478
Dec-14 REAL_TIME 0 296.15 331.18 -32.27 67.31 -$92,771 $11,375
Dec-14 REAL_TIME_EG 0 145.22 145.42 -15.04 15.24 -$35,705 $2,072
Dec-14 SEASONAL_PEAK 4 347.18 592.22 0.00 245.04 $0 $40,084
Jan-15 ON_PEAK 42 1,033.04 1,657.12 -11.43 635.51 -$32,644 $183,246
Jan-15 REAL_TIME 0 282.64 333.14 -37.44 87.93 -$120,177 $23,570
Jan-15 REAL_TIME_EG 0 179.03 146.19 -47.23 14.38 -$112,119 $3,182
Jan-15 SEASONAL_PEAK 30 347.18 553.62 0.00 206.44 $0 $54,943
Feb-15 ON_PEAK 0 1,032.24 1,654.07 -9.18 631.01 -$26,215 $118,243
Feb-15 REAL_TIME 0 274.02 326.20 -4.27 56.45 -$12,154 $9,955
Feb-15 REAL_TIME_EG 0 186.59 145.80 -55.17 14.38 -$130,981 $2,070
Feb-15 SEASONAL_PEAK 0 347.18 572.92 0.00 225.74 $0 $39,082
Mar-15 ON_PEAK 0 1,040.29 1,653.41 -10.02 623.14 -$28,610 $28,925
Mar-15 REAL_TIME 0 280.69 332.22 -4.63 56.16 -$13,196 $2,466
Mar-15 REAL_TIME_EG 0 126.14 145.80 -0.01 19.67 -$21 $705
Mar-15 SEASONAL_PEAK 0 347.18 572.92 0.00 225.74 $0 $9,731
Apr-15 ON_PEAK 0 1,033.65 1,233.77 -2.94 203.06 -$8,388 $5,969
Apr-15 REAL_TIME 0 318.75 355.32 -0.32 36.89 -$865 $1,073
Apr-15 REAL_TIME_EG 0 140.86 159.32 -0.01 18.48 -$19 $430
Apr-15 SEASONAL_PEAK 0 347.18 411.45 0.00 64.27 $0 $1,800

Monthly Market Operations Report Page 59 of 63
December 2015 ISO-NE PUBLIC 2016 ISO New England Inc.
Month DR Type Performance
Hours CSO MW
Capacity Value (MW)
Negative Capacity Variance
(MW)
Positive Capacity Variance
(MW) Performance Penalty ($)
Performance Incentive ($)
May-15 ON_PEAK 0 1,028.85 1,234.19 -2.75 208.10 -$7,854 $5,692
May-15 REAL_TIME 0 318.74 355.32 -0.32 36.90 -$865 $989
May-15 REAL_TIME_EG 0 140.86 159.32 -0.01 18.48 -$19 $397
May-15 SEASONAL_PEAK 0 347.18 411.45 0.00 64.27 $0 $1,659
Jun-15 ON_PEAK 88 1,321.97 1,506.82 -23.37 208.23 -$73,125 $112,809
Jun-15 REAL_TIME 0 322.86 372.56 -8.07 57.77 -$24,182 $32,018
Jun-15 REAL_TIME_EG 0 192.31 165.41 -34.74 7.84 -$105,736 $4,141
Jun-15 SEASONAL_PEAK 0 356.86 456.44 0.00 99.58 $0 $54,075
Jul-15 ON_PEAK 88 1,321.31 1,533.53 -20.79 233.01 -$65,136 $138,231
Jul-15 REAL_TIME 0 325.06 351.79 -29.84 56.58 -$94,737 $33,783
Jul-15 REAL_TIME_EG 0 184.86 172.14 -25.91 13.20 -$78,882 $7,633
Jul-15 SEASONAL_PEAK 7 356.86 456.28 0.00 99.43 $0 $59,107
Aug-15 ON_PEAK 84 0.00 0.00 0.00 0.00 $0 $0
Aug-15 SEASONAL_PEAK 1 0.00 0.00 0.00 0.00 $0 $0
Sep-15 ON_PEAK 0 0.00 0.00 0.00 0.00 $0 $0
Sep-15 SEASONAL_PEAK 0 0.00 0.00 0.00 0.00 $0 $0
Oct-15 ON_PEAK 0 0.00 0.00 0.00 0.00 $0 $0
Oct-15 SEASONAL_PEAK 0 0.00 0.00 0.00 0.00 $0 $0
Nov-15 ON_PEAK 0 0.00 0.00 0.00 0.00 $0 $0
Nov-15 SEASONAL_PEAK 0 0.00 0.00 0.00 0.00 $0 $0
Dec-15 ON_PEAK 44 0.00 0.00 0.00 0.00 $0 $0
Dec-15 SEASONAL_PEAK 0 0.00 0.00 0.00 0.00 $0 $0
12.7 For More Information
Detailed information on the FCM, including information on the qualification process, auction results, and FERC filings and orders can be found here. Detailed information about FCM Charge calculation summaries can be found here.
Detailed information about charges to Network Load can be found here.

Monthly Market Operations Report Page 60 of 63
December 2015 ISO-NE PUBLIC 2016 ISO New England Inc.
13. Energy Market Payments to Demand Assets
Energy Market payments to demand assets are administered through the Transitional Demand Response (TDR) program.
13.1 Transitional Demand Response
The Transitional Demand Response (TDR) program represents, in the aggregate, agreements between wholesale providers and retail customers to encourage reduction of their electricity consumption during periods of peak demand. Transitional Demand Response in New England is administered post the Day-Ahead Energy Market clearing and the scheduling of demand reductions by Market Participants in real-time based upon system conditions.
13.1.1 Transitional Demand Response Payments
A Real-Time Demand Response Asset with an offer that clears in the post Day-Ahead Energy Market clearing will receive a payment for its Day-Ahead Demand Reduction Obligation at the applicable Day-Ahead Zonal Locational Marginal Price (LMP) and will be paid or charged for the difference between its Real-Time Demand Reduction Obligation and its Day-Ahead Demand Reduction Obligation in Real-Time at the applicable Real-Time Zonal LMP.
A Real-Time Demand Response Asset with an offer that does not clear in the post Day-
Ahead Energy Market clearing will be eligible to receive a payment for its Real-Time Demand Reduction Obligation at the applicable Real-Time Zonal LMP when the hourly provisional Real-Time Zonal LMP is greater than or equal to the its Demand Reduction Offer price.
A Real-Time Demand Response Asset or Real-Time Emergency Generation Asset that is associated to a Demand Resource in the Forward Capacity Market will receive a payment at the applicable Real-Time Zonal LMP, for its demand reduction, when the Demand Resource is dispatched or audited pursuant to Section III.13 of Market Rule 1.
13.1.2 Transitional Demand Response Charges
The total credits associated with Transitional Demand Response are allocated proportionally on an hourly basis to Market Participants with Real-Time Load Obligations on a system-wide basis. Excluded are Real-Time Load Obligations incurred at all External Nodes or incurred by Dispatchable Asset Related Demand Postured by the ISO.
The following table includes Day-Ahead Demand Reduction Obligation megawatt-hours MWh (Day-Ahead Cleared MWh, plus average avoided peak distribution losses of 6.5%), Real-Time Demand Reduction MWh, Real-Time Demand Reduction Obligation MWh, RT Demand Reduction Deviation Set to Zero MWh, Real-Time Demand Reduction Deviation MWh, Average Pool Demand Response Charge Allocation MWh, and the FCM/Audit Demand Reduction MWh (Also adjusted for average avoided peak distribution losses of 6.5%).
RT Demand Reduction Obligation MWh = Average Avoided Peak Distribution Losses (1.065) * RT Demand Reduction MWh

Monthly Market Operations Report Page 61 of 63
December 2015 ISO-NE PUBLIC 2016 ISO New England Inc.
RT Demand Reduction Deviation MW = RT Demand Reduction Obligation MWh - DA Demand Reduction Obligation MWh + RT Demand Reduction Deviation Set to Zero MWh
Transitional Demand Response Settlement MW Other Statistics
Month
DA Demand Reduction Obligation
MWh (A)
RT Demand
Reduction MWh
(B)
RT Demand Reduction
Obligation MW (C)=(B)*1.065
RT Demand Reduction
Deviation Set to Zero MWh
(D)
RT Demand Reduction
Deviation MWh (E)=(C)-(A)+(D)
Average Pool Demand Response
Charge Allocation MWh
FCM/ Audit Demand
Reduction MWh
Dec-14 1,912 2,326 2,477 0 565 16,393 361
Jan-15 2,845 3,693 3,933 -93 995 17,416 50
Feb-15 2,472 2,621 2,791 0 319 17,604 0
Mar-15 1,362 1,602 1,706 -63 281 16,160 0
Apr-15 63 123 131 -25 42 14,277 0
May-15 1,720 2,108 2,245 -22 503 14,977 0
Jun-15 1,428 1,983 2,092 -146 517 16,116 137
Jul-15 3,385 4,538 4,787 -42 1,361 18,901 316
Aug-15 3,018 4,349 4,588 -22 1,547 18,982 81
Sep-15 2,238 3,065 3,233 -26 969 17,407 0
Oct-15 1,929 2,261 2,385 -14 442 14,087 0
Nov-15 2,391 2,755 2,906 -20 495 14,474 0
Dec-15 1,937 2,926 3,087 -3 1,147 15,315 291
In the above table the RT Demand Reduction Deviation Set to Zero MWh column is the difference between DA Demand Reduction Obligation MW and RT Demand Reduction Obligation MW when the RT Demand Reduction Deviation MWh has been set to zero in the settlement, which occurs when the following is true:
Control Room denies interruption of an Asset DA Demand Reduction Obligation MW > 0, Load Zone Real-Time Net Benefit Hour Flag =
N, and RT Demand Reduction MWh > DA Demand Reduction Obligation MW
The following table displays Day-Ahead payments, Real-Time Payment Dollars, Total Payment (sum of total Day-Ahead and Real-Time Payments), and the Charge per MWh.
Month DA Payment
Dollars RT Payment
Dollars
FCM Audit Demand
Reduction Dollars Total Payment
(Charge) Dollars Charge per
MWh
Dec-14 $108,880 $41,030 $14,153 $164,062 $0.00
Jan-15 $256,865 $99,589 $3,611 $360,064 $0.00
Feb-15 $346,410 $45,652 $0 $392,062 $0.00
Mar-15 $125,681 $24,695 $0 $150,375 $0.00
Apr-15 $4,228 $3,096 $0 $7,325 $0.00
May-15 $61,626 $17,615 $0 $79,241 $0.00
Jun-15 $40,974 $16,848 $2,510 $60,332 $0.00
Jul-15 $163,842 $63,461 $15,375 $242,678 $0.00
Aug-15 $146,694 $115,481 $10,076 $272,250 $0.00
Sep-15 $117,715 $85,101 $4 $202,820 $0.00

Monthly Market Operations Report Page 62 of 63
December 2015 ISO-NE PUBLIC 2016 ISO New England Inc.
Month DA Payment
Dollars RT Payment
Dollars
FCM Audit Demand
Reduction Dollars Total Payment
(Charge) Dollars Charge per
MWh
Oct-15 $90,737 $18,058 $0 $108,794 $0.00
Nov-15 $88,988 $18,309 $0 $107,297 $0.00
Dec-15 $57,216 $39,956 $6,869 $104,041 $0.00
13.2 For More Information:
Rules governing the calculation of the Transitional Demand Response can be found in Section III.13 Market Rule 1 and Section III, Appendix E located here.

Monthly Market Operations Report Page 63 of 63
December 2015 ISO-NE PUBLIC 2016 ISO New England Inc.
15. Document History
Date Version Description 1/12/2016 Original Posting