2020 Regional Electricity Outlook - iso-ne.com · the fuel or technology used to generate the...
46
New England can achieve its clean-energy goals at the least cost, while keeping the power system reliable, by harnessing competitive market forces. 2020 Regional Electricity Outlook
Transcript of 2020 Regional Electricity Outlook - iso-ne.com · the fuel or technology used to generate the...
New England can achieve its clean-energy goals at the least cost, while keeping the power system reliable, by harnessing competitive market forces.
2020 Regional Electricity Outlook
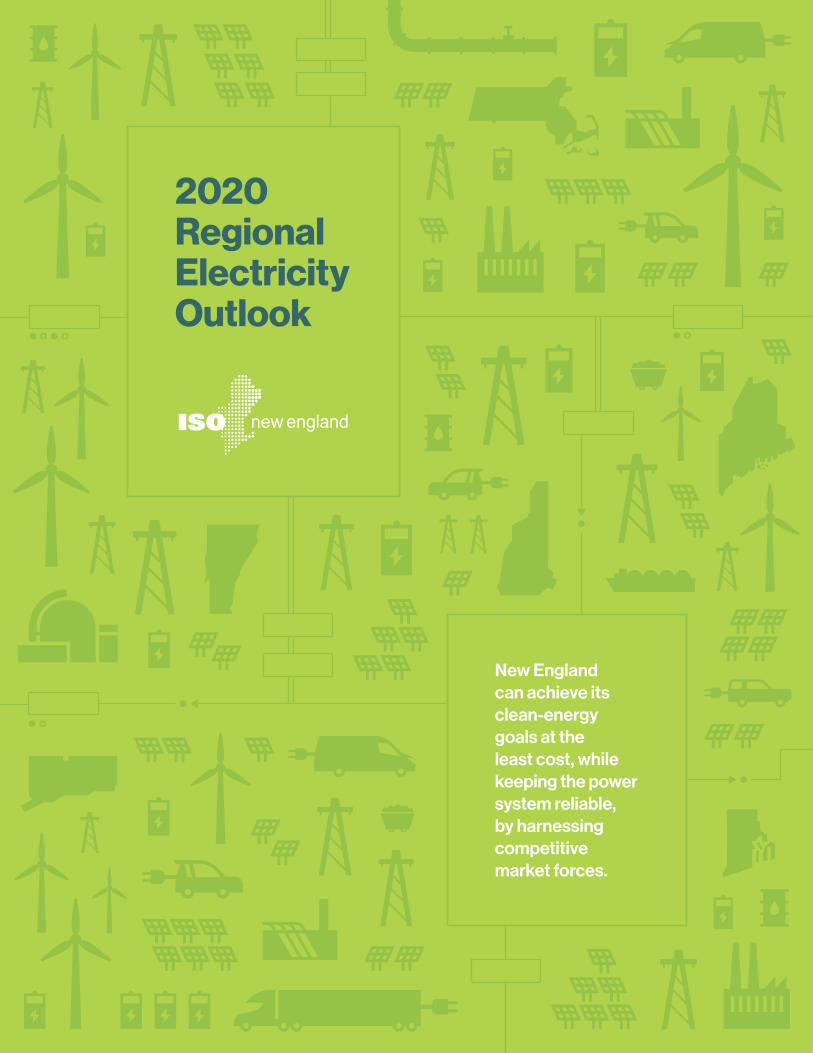
2 From the Board Chair and CEO:
The Clean-Energy Transition: How to Get There from Here
6 Focusing on State Goals:
Achieving Cleaner, Lower-Cost Electric Power
16 Focusing on Our Role:
Planning, Innovating, and Enabling a Reliable, Clean-Energy Grid
26 Focusing on Energy Security:
Reliably Operating a Future Power Grid with a High Penetration of Renewable and Energy-Limited Resources
34 Focusing on the Future:
Sustaining a Power Grid that Reliably Supports a Carbon-Free Economy and Society
38 ISO Metrics:
Measuring ISO New England’s Performance, Accountability, and Transparency
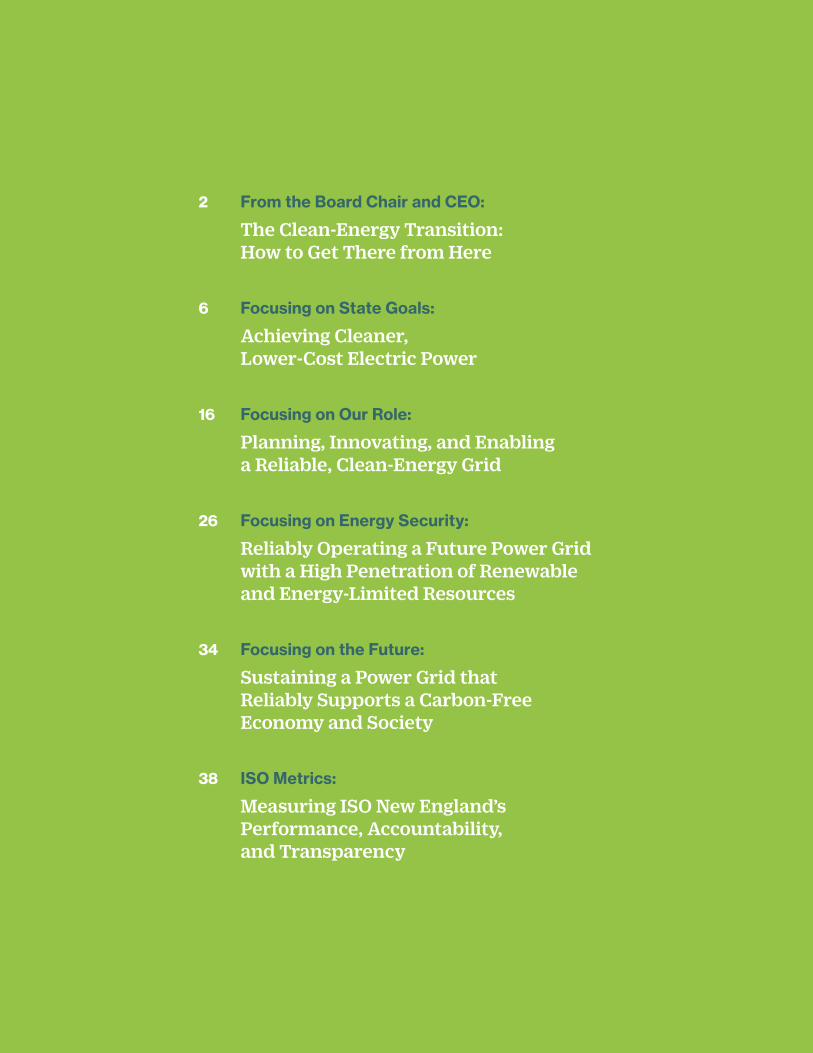
Our Mission
Through innovation and collaboration, ISO New England ensures that New England has reliable, competitively priced wholesale electricity today and into the future.
The company’s engineers, economists, computer scientists, and other professionals fulfill this mission through three interconnected responsibilities:
n Managing 24/7 operation of the region’s high-voltage power grid
n Administering the region’s billion-dollar competitive markets for buying and selling wholesale electricity
n Planning for the future power needs of 15 million New Englanders
The ISO is an independent not-for-profit— none of its board members, officers, or employees has any financial interest in any company doing business in the region’s wholesale electricity marketplace. The Federal Energy Regulatory Commission (FERC) regulates the ISO.
About This Report
ISO New England’s unique role gives it an objective, bird’s-eye view of trends that could affect the region’s power system. The Regional Electricity Outlook is one of the many ways the ISO keeps stakeholders informed about the current state of the grid, issues affecting its future, and ISO initiatives to ensure a modern, reliable power system for New England. Please also see our Annual Work Plan at www.iso-ne.com/work-plan for information on the ISO’s major projects for the year to improve our services and performance. Contact ISO New England’s Corporate Communications and External Affairs teams at (413) 535-4309 for copies of this report.
Visit www.iso-ne.com/reo.
One Sullivan Road, Holyoke, MA 01040
2
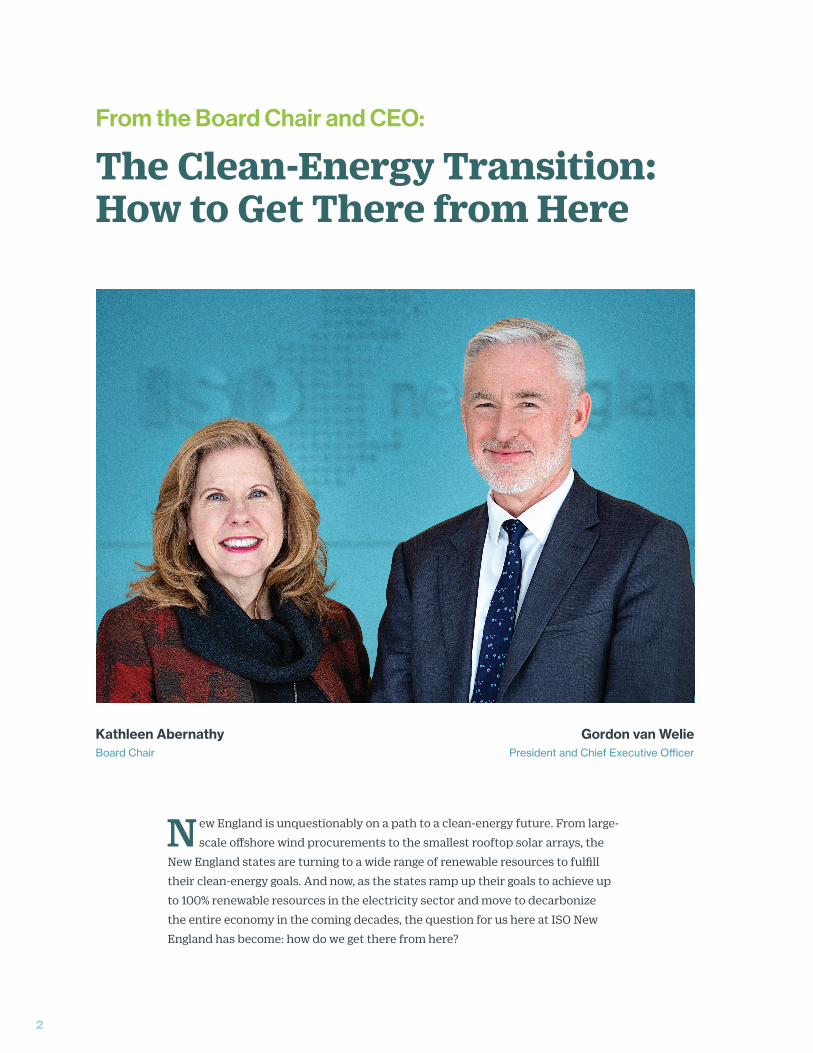
From the Board Chair and CEO:
The Clean-Energy Transition: How to Get There from Here
Kathleen AbernathyBoard Chair
Gordon van WeliePresident and Chief Executive Officer
N ew England is unquestionably on a path to a clean-energy future. From large-
scale offshore wind procurements to the smallest rooftop solar arrays, the
New England states are turning to a wide range of renewable resources to fulfill
their clean-energy goals. And now, as the states ramp up their goals to achieve up
to 100% renewable resources in the electricity sector and move to decarbonize
the entire economy in the coming decades, the question for us here at ISO New
England has become: how do we get there from here?
For more than a decade, ISO New England has been preparing for this transition.
Through the creation of vibrant, competitive electricity markets, the ISO and
New England stakeholders have brought about one of the cleanest, most efficient
fleets of power generating resources in the country, achieved very low wholesale
energy prices that reflect the efficiency of the market design, and facilitated a
dramatic reduction in emissions—all while successfully maintaining reliable 24/7
bulk power system operations.
While the path to decarbonizing the
electricity industry is well underway,
the journey to decarbonize the other
sectors has really only just begun. As the
transportation sector and the heating
and cooling industry turn to carbon-free
electricity, the ISO firmly believes that
the region can achieve its clean-energy
goals at the least cost, while keeping the
power system reliable, by harnessing
competitive market forces.
The region currently does this using
a suite of competitive markets—
the energy, ancillary, and capacity
markets—that attract and sustain the
resources needed to operate the grid
reliably and deliver economic and
environmental benefits to the region.
But, as the number of renewable
resources increase, the market
architecture will need to be updated so
wholesale prices remain competitive
and all resources get paid a fair price for
providing their products and services.
We see the introduction of two sets
of market innovations, the CASPR (Competitive Auctions for Sponsored Policy
Resources) auction platform and the Energy-Security Improvements, as the next
steps toward achieving the region’s long-term, carbon-free goals.
Where We Are Today: CASPR and ESI Market Mechanisms
CASPR was designed as a solution that should, over time, enable a reliable and
efficient turnover in New England’s power fleet—moving the power system
away from fossil fuel resources to serving the region’s electricity needs using
In 2019, coal and oil-fired resources produced less than half a percent of New England’s electricity— only 0.1% of New England’s electricity came from oil-fired power plants and 0.4% from coal plants. And New England had the second lowest annual average wholesale energy price on record.
3
renewables—all done by achieving a fair, market-based price. In the coming years,
we anticipate that, as they become more cost-competitive, renewable resources
will enter the wholesale market directly and the need for CASPR will diminish.
Carbon pricing would work to more quickly change the overall economics of all
resources in the market, making renewable and low-carbon resources more cost-
competitive than high-carbon-emitting resources. The ISO is ready to introduce
such a mechanism on the wholesale level; however, this will require support of the
New England states or federal legislation.
In addition to CASPR, the ISO and New England stakeholders are working on
market enhancements called the Energy-Security Improvements (ESI) initiative.
ESI is a critical market enhancement
designed to keep the system reliable
during energy-limited conditions, such
as extreme cold weather. Furthermore,
ESI will also provide the market
structure needed as the New England
system makes the change from fossil
fuel to renewable resources that are
inherently intermittent and may be
energy-limited during extended periods
of inclement weather. ESI will introduce
stronger, market-based compensation
for electric energy and reserve services
and will select the least-cost resources
to provide electrical energy when called
on by the ISO. ESI is expected to be in
place by mid-2024.
Today, Tomorrow, and Beyond: Our Work Together Continues
As we move forward in the coming years, New England’s wholesale markets
must continue to adapt to the region’s changing resource mix and the changing
needs of its power system. This adaptation will be necessary because of the
anticipated impact to the power system should the states fully decarbonize
other carbon-based sectors. As the states’ plans become more formalized and
the transportation and heating sectors decarbonize, they will turn to the region’s
power grid for electricity: to keep our plug-in electric vehicles moving and to keep
For ISO New England, a broadened scope for the region’s power grid is expected to increase both the power system planning and operational complexity—and this will drive a need for more investment in staff skills, training, and software development.
4
the temperature in our houses and businesses comfortable. As a result,
the demand for carbon-free electricity will likely increase over the coming
decades and the power grid will become even more important than it is today
because every sector of the economy will be dependent on it.
The states, stakeholders, and the ISO will need to continue to collaborate
to understand what the period beyond 2030 may look like, including the
forecasted demand for clean electricity from other sectors, and the likely
market-based pathways to supplying this demand. Analyzing future pathways
for decarbonization will also allow the region to have an informed discussion
about whether, and where, additional transmission investments will be required
to enable the vast quantities of grid-scale renewable energy.
ISO New England respects the environmental policy objectives of the New England
states and believes that a strong, competitive wholesale market provides the
best structure for achieving these objectives in a cost-effective and reliable way.
By working with the states and other industry stakeholders, we together will
determine if there are better market design solutions or needed adjustments to
the markets. ISO New England is dedicating market-development and planning
resources in 2020, and beyond, to discuss potential future market frameworks
that are consistent with state decarbonization goals, as outlined in the summary
of our strategic plan presented later in this report.
ISO New England has worked tirelessly for the past two decades to ensure
the region’s power system is there to serve New England and its consumers
every day—today, tomorrow, and for decades to come. We are proud of our
accomplishments to date in ensuring the region’s power system reliability through
competitive wholesale markets, and we pledge to continue this dedication as
the region transitions to a clean-energy future. We also know that, based on our
history, collaboration with all industry and government stakeholders will be
paramount to achieve this successful transition. The next phase of our region’s
energy journey has begun—and we are excited by the prospects.
Sincerely,
Kathleen AbernathyBoard Chair
Gordon van WeliePresident and Chief Executive Officer
5
Focusing on State Goals:
Achieving Cleaner, Lower-Cost PowerNew England restructured its electricity industry more than 20 years ago, driven by state and federal initiatives that were guided by the principle that a reliable supply of competitively priced electricity is fundamental to a thriving society and economy. Specifically, the overarching goals of introducing wholesale competitive markets were to lower costs, encourage innovation, and shield consumers from unwise investments.
6
7
For decades before restructuring, the region’s utilities operated as vertically integrated, rate-payer-funded,
regulated monopolies that generated, transmitted, and distributed electricity. Dissatisfied with investments
that increased consumer rates while limiting funds for needed infrastructure, the federal government, with
support from the New England states, introduced wholesale markets where privately developed resources
would compete with each other to provide the least-cost, reliable wholesale electricity supply, regardless of
the fuel or technology used to generate the electricity.
Through a cooperative effort, federal, state, and industry officials agreed to create ISO New England in 1997
as the independent administrator of the region’s wholesale electricity markets and operator of the regional
power grid. In this role, the ISO is bound by its regulator, the Federal Energy Regulatory Commission, to
allow participation in the highly competitive markets by all resources. The FERC and the ISO carry out
laws created by Congress, which set US federal policy related to power. The ISO does not set policy and
does not select the mix of resources being developed in the region. Congress has reserved the right to site
generation to the states.
While the states were focused on markets driving efficiency and innovation, they also began introducing
clean-energy incentives and emission-reduction goals, focusing first on reducing greenhouse gas (GHG)
emissions from the electric power industry. Emissions regulations work well with the wholesale markets by
making higher-polluting power plants more expensive to operate and providing a reliable means for cleaner
resources to come on line in their place.
Over two decades, the market and policy approach has driven change in the direction the states have
been seeking: around $16 billion in private investment in some of the most efficient, lowest-emitting power
resources in the country, shifting investment costs and risks away from consumers, lowering wholesale
prices, reducing carbon emissions, and enabling the transition to an even lower-carbon system. This is
evidenced by the following:
20002005
20102015
2019
Nuclear
Net Imports
RenewablesHydroCoal
Oil
Natural Gas
13%
27%
14%
6%6%
15%
19%
40%
25%
19%
7% 0.4%0.1%
9%
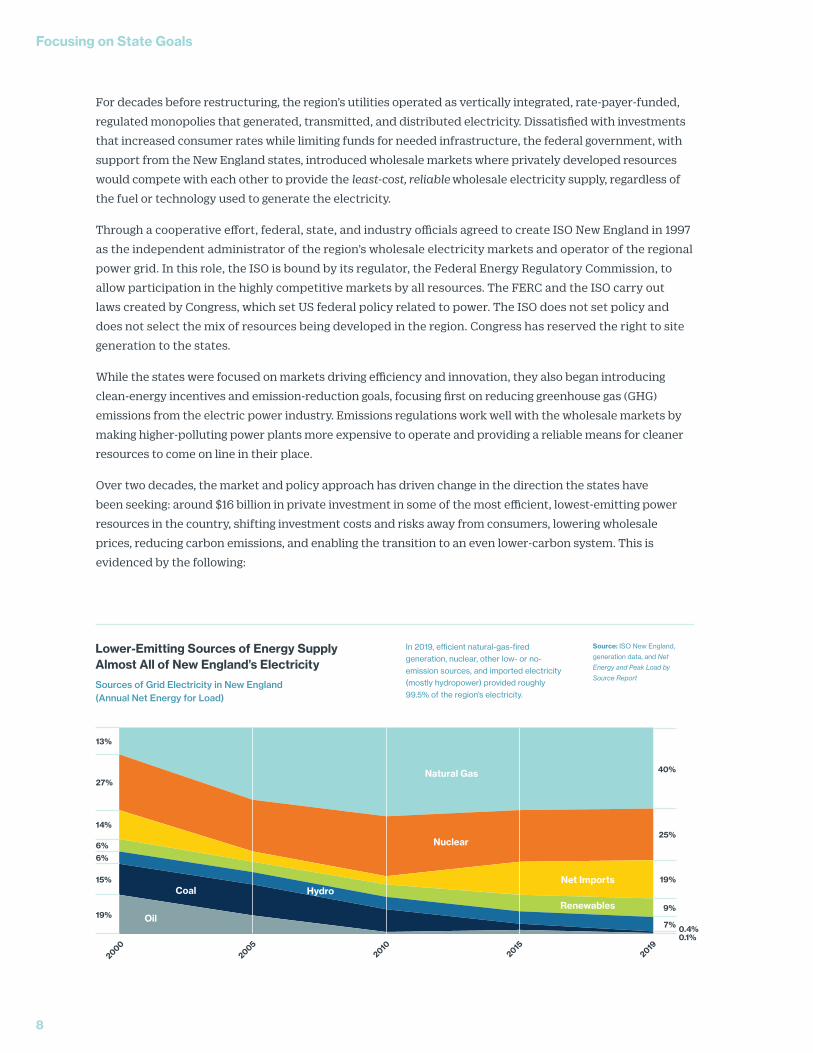
Lower-Emitting Sources of Energy Supply Almost All of New England’s Electricity
Sources of Grid Electricity in New England (Annual Net Energy for Load)
Source: ISO New England,
generation data, and Net
Energy and Peak Load by
Source Report
In 2019, efficient natural-gas-fired generation, nuclear, other low- or no-emission sources, and imported electricity (mostly hydropower) provided roughly 99.5% of the region’s electricity.
Focusing on State Goals
8
The Rapid Development of a Cleaner, Cheaper, More Efficient Power Fleet in New England
When the wholesale markets opened to competition, private
investors pursued the development of natural-gas-fired power
plants because they used advanced technology that made
them run efficiently; were relatively inexpensive to build, site,
and interconnect; and their lower carbon emissions compared
to coal and oil helped the region meet state environmental
policies. As nearby shale gas emerged as an inexpensive and
plentiful fuel resource in the 2008 timeframe, natural gas
generators became the go-to resource for New England, clearing
as the largest resource type in the market year after year.
In contrast, aging coal-fired, oil-fired, and nuclear power plants
have been closing largely because their operating, fuel, and
environmental-compliance costs make them too expensive
to compete against lower-cost resources. Consumers have
benefited from this least-cost resource mix created through
competitive markets. Since 2013, roughly 7,000 megawatts
(MW) of mostly coal, oil, and nuclear generation have retired
or have announced plans for retirement in the coming years.
Another 5,000 MW of oil and coal, which now run only during
peak demand or periods of gas pipeline constraints, are
likely to retire soon. (The region’s remaining two zero-carbon-
emitting nuclear facilities, Millstone and Seabrook, supply a
quarter of the electricity New England consumes in a year).
Competition in the markets brought about this change at a
faster pace than under the traditional industry model. Under
wholesale markets, private companies have carried the risks of
uneconomic investments, not utilities and their customers.
A Major Reduction in Emissions from the Power System
The shift to cleaner, more efficient generation and strong
regional investment in transmission improvements to move
this power to consumers that demand it has resulted in a
striking decrease in annual generator air emissions, compared
here between 2001 and 2018. Emissions rose slightly between
2017 and 2018 because oil- and coal-fired plants, which typically
don’t run often, became critical during a winter cold spell when
fuel for natural-gas-fired generators was limited and expensive.
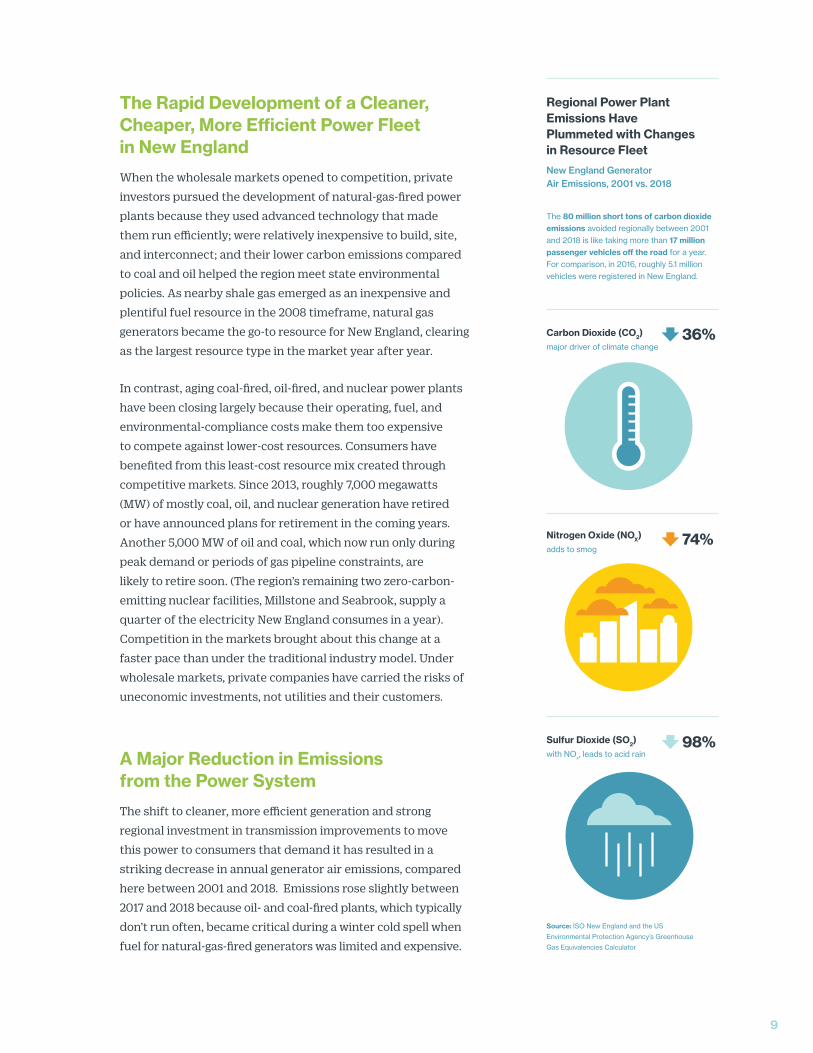
Regional Power Plant Emissions Have Plummeted with Changes in Resource Fleet
New England Generator Air Emissions, 2001 vs. 2018
Source: ISO New England and the US
Environmental Protection Agency’s Greenhouse
Gas Equivalencies Calculator
The 80 million short tons of carbon dioxide emissions avoided regionally between 2001 and 2018 is like taking more than 17 million passenger vehicles off the road for a year. For comparison, in 2016, roughly 5.1 million vehicles were registered in New England.
74%Nitrogen Oxide (NOX)adds to smog
98%Sulfur Dioxide (SO2)with NOx, leads to acid rain
Carbon Dioxide (CO2)major driver of climate change
36%
9
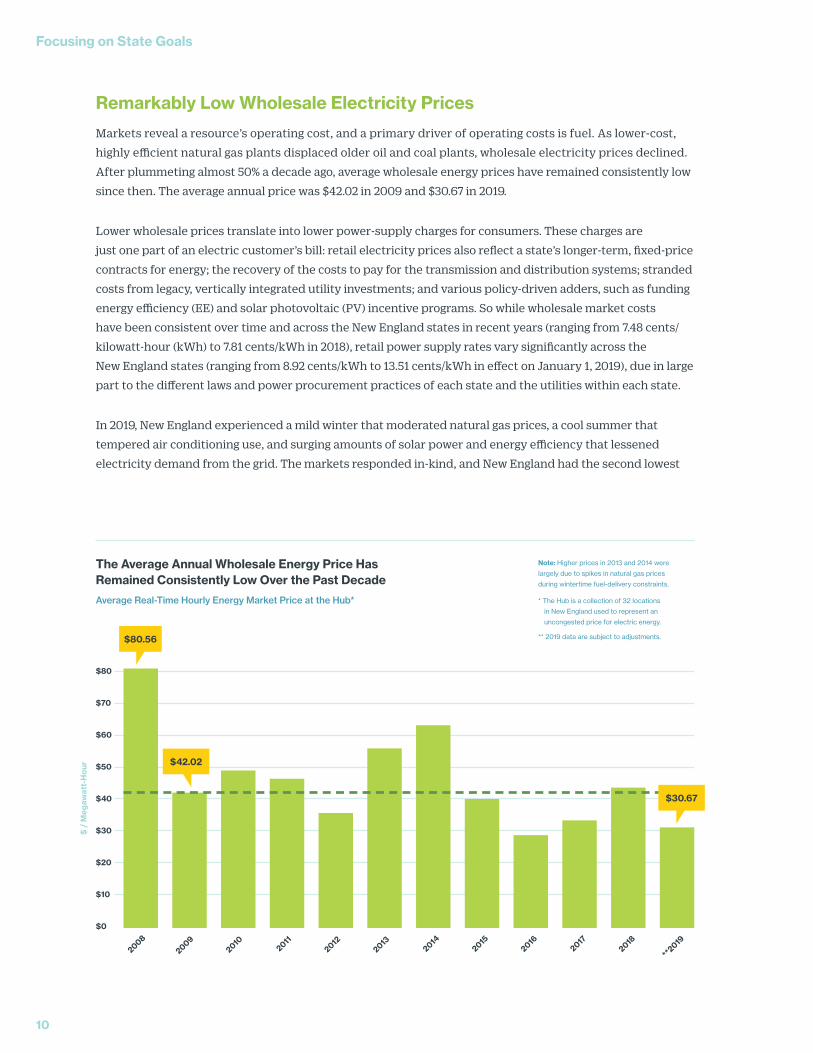
Remarkably Low Wholesale Electricity Prices
Markets reveal a resource’s operating cost, and a primary driver of operating costs is fuel. As lower-cost,
highly efficient natural gas plants displaced older oil and coal plants, wholesale electricity prices declined.
After plummeting almost 50% a decade ago, average wholesale energy prices have remained consistently low
since then. The average annual price was $42.02 in 2009 and $30.67 in 2019.
Lower wholesale prices translate into lower power-supply charges for consumers. These charges are
just one part of an electric customer’s bill: retail electricity prices also reflect a state’s longer-term, fixed-price
contracts for energy; the recovery of the costs to pay for the transmission and distribution systems; stranded
costs from legacy, vertically integrated utility investments; and various policy-driven adders, such as funding
energy efficiency (EE) and solar photovoltaic (PV) incentive programs. So while wholesale market costs
have been consistent over time and across the New England states in recent years (ranging from 7.48 cents/
kilowatt-hour (kWh) to 7.81 cents/kWh in 2018), retail power supply rates vary significantly across the
New England states (ranging from 8.92 cents/kWh to 13.51 cents/kWh in effect on January 1, 2019), due in large
part to the different laws and power procurement practices of each state and the utilities within each state.
In 2019, New England experienced a mild winter that moderated natural gas prices, a cool summer that
tempered air conditioning use, and surging amounts of solar power and energy efficiency that lessened
electricity demand from the grid. The markets responded in-kind, and New England had the second lowest
$80
$70
$60
$50
$40
$30
$20
$10
$0
$ /
Meg
awat
t-H
our
$80.56
$42.02
The Average Annual Wholesale Energy Price Has Remained Consistently Low Over the Past Decade
Average Real-Time Hourly Energy Market Price at the Hub*
$30.67
Focusing on State Goals
10
20082009
20102011
20122013
20142015
20162017
2018
**2019
Note: Higher prices in 2013 and 2014 were
largely due to spikes in natural gas prices
during wintertime fuel-delivery constraints.
* The Hub is a collection of 32 locations
in New England used to represent an
uncongested price for electric energy.
** 2019 data are subject to adjustments.
annual average price since the introduction
of the current market structure in 2003.
Higher real-time power prices in 2013 and
2014 were largely due to spikes in natural
gas prices during wintertime natural gas
delivery constraints.
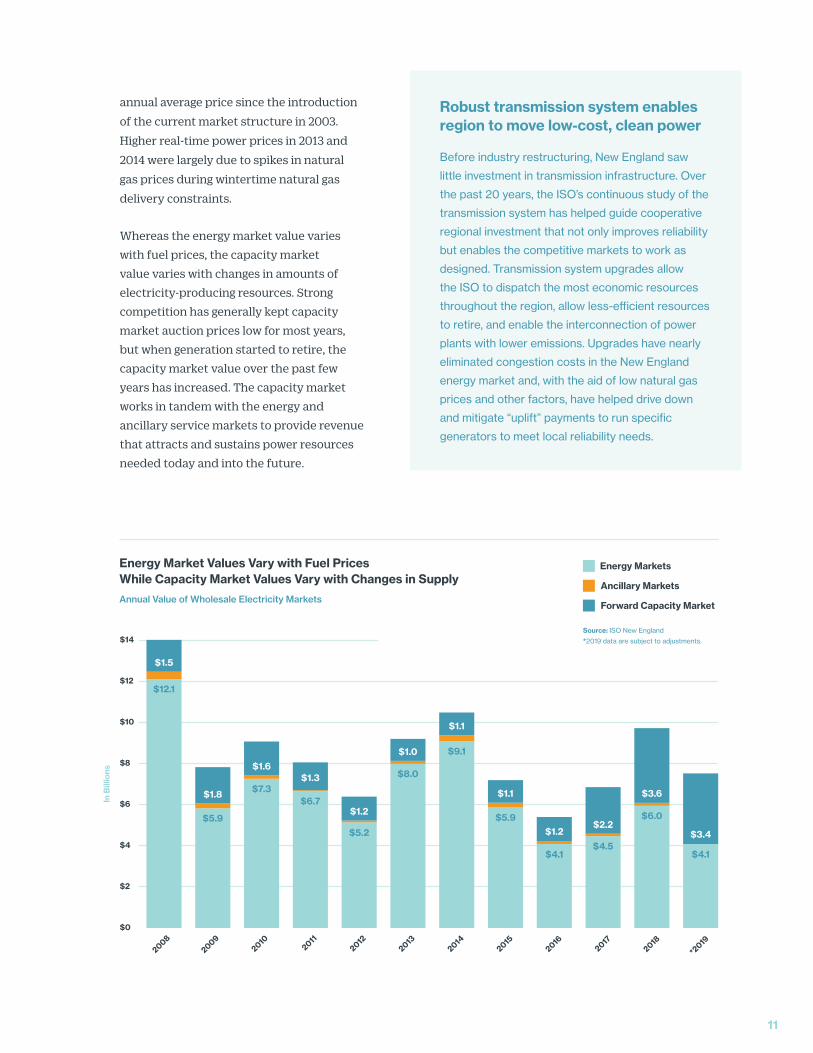
Whereas the energy market value varies with fuel prices, the capacity market value varies with changes in amounts of electricity-producing resources. Strong competition has generally kept capacity market auction prices low for most years, but when generation started to retire, the capacity market value over the past few years has increased. The capacity market works in tandem with the energy and ancillary service markets to provide revenue that attracts and sustains power resources needed today and into the future.
Robust transmission system enables region to move low-cost, clean power
Before industry restructuring, New England saw
little investment in transmission infrastructure. Over
the past 20 years, the ISO’s continuous study of the
transmission system has helped guide cooperative
regional investment that not only improves reliability
but enables the competitive markets to work as
designed. Transmission system upgrades allow
the ISO to dispatch the most economic resources
throughout the region, allow less-efficient resources
to retire, and enable the interconnection of power
plants with lower emissions. Upgrades have nearly
eliminated congestion costs in the New England
energy market and, with the aid of low natural gas
prices and other factors, have helped drive down
and mitigate “uplift” payments to run specific
generators to meet local reliability needs.
In B
illio
ns
$14
$12
$10
$8
$6
$4
$2
$0
Forward Capacity Market
Ancillary Markets
Energy Markets
$1.5
$12.1
$1.8
$5.9
$1.6
$7.3$1.3
$6.7$1.2
$5.2
$1.0
$8.0
$1.1
$9.1
$1.1
$5.9$1.2
$4.1
$3.4
$4.1
$2.2
$4.5
$3.6
$6.0
Energy Market Values Vary with Fuel Prices While Capacity Market Values Vary with Changes in Supply
Annual Value of Wholesale Electricity Markets
Source: ISO New England
*2019 data are subject to adjustments.
11
20082009
20102011
20122013
20142015
20162017
2018
*2019
The Steep Growth of Energy Efficiency and Solar Power that Are Driving Down Annual Grid Use
New England’s 7.2 million retail electricity customers used over 119,000 gigawatt-hours (GWh) of electricity
from the grid in 2019, down from the record 136,355 GWh consumed in 2005. Today, 20% of total system
capacity is provided by distributed energy resources that reduce demand from the grid and the need to
turn on or build expensive power plants.
State policies and wholesale market revenues are stimulating the rapid growth of energy efficiency and
demand response. New England states invest billions of dollars on EE programs that promote the use of
energy-efficient appliances and lighting and advanced cooling and heating technologies (nearly $5.4 billion
on EE programs from 2013–2018 and another $10.7 billion between 2021 and 2029). Nearly 3,000 MW of EE
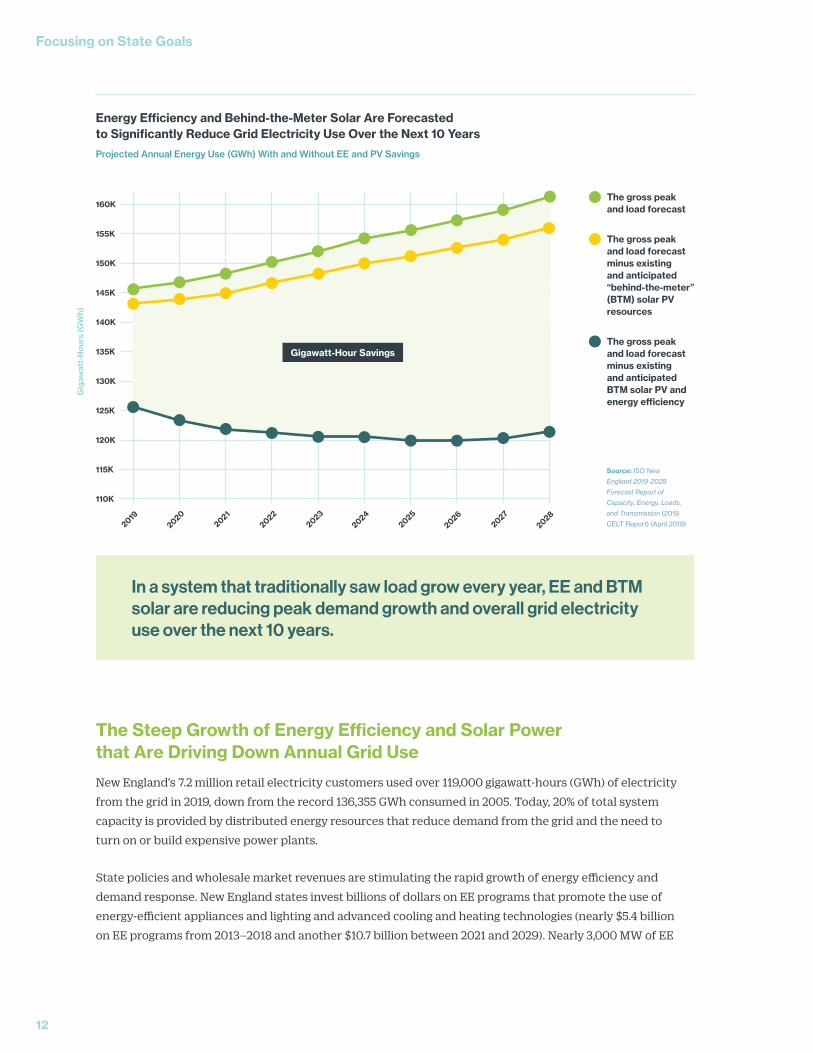
Energy Efficiency and Behind-the-Meter Solar Are Forecasted to Significantly Reduce Grid Electricity Use Over the Next 10 Years
Projected Annual Energy Use (GWh) With and Without EE and PV Savings
Gig
awat
t-H
ours
(GW
h)
160K
155K
150K
145K
140K
135K
130K
125K
120K
115K
110K
20192020
20212022
20232024
20252026
20272028
Focusing on State Goals
12
In a system that traditionally saw load grow every year, EE and BTM solar are reducing peak demand growth and overall grid electricity use over the next 10 years.
The gross peak and load forecast
The gross peak and load forecast minus existing and anticipated “behind-the-meter” (BTM) solar PV resources
The gross peak and load forecast minus existing and anticipated BTM solar PV and energy efficiency
Source: ISO New
England 2019-2028
Forecast Report of
Capacity, Energy, Loads,
and Transmission (2019
CELT Report) (April 2019)
Gigawatt-Hour Savings
measures and 500 MW of demand response can reduce electricity demand from New England’s power grid—
that’s 10% of system capacity acquired in the Forward Capacity Auction. And New England is first in the nation
to innovate and enable demand resources to fully participate in the energy and reserve markets.
Incentivizing local/residential solar power is also a top priority for New England policymakers, with the states
spending billions of dollars on making solar energy affordable for consumers. New England started the decade
with 40 MW of behind-the-meter (BTM) solar photovoltaic resources. Today, more than 183,000 installations
span the six states, with a combined nameplate generating capability of more than 3,400 MW. The region is on
track to reach nearly 8,000 MW over the next decade. Though these resources don’t participate in the markets,
the markets are flexible to changes in grid demand, so grid electricity is not over produced—or over purchased.
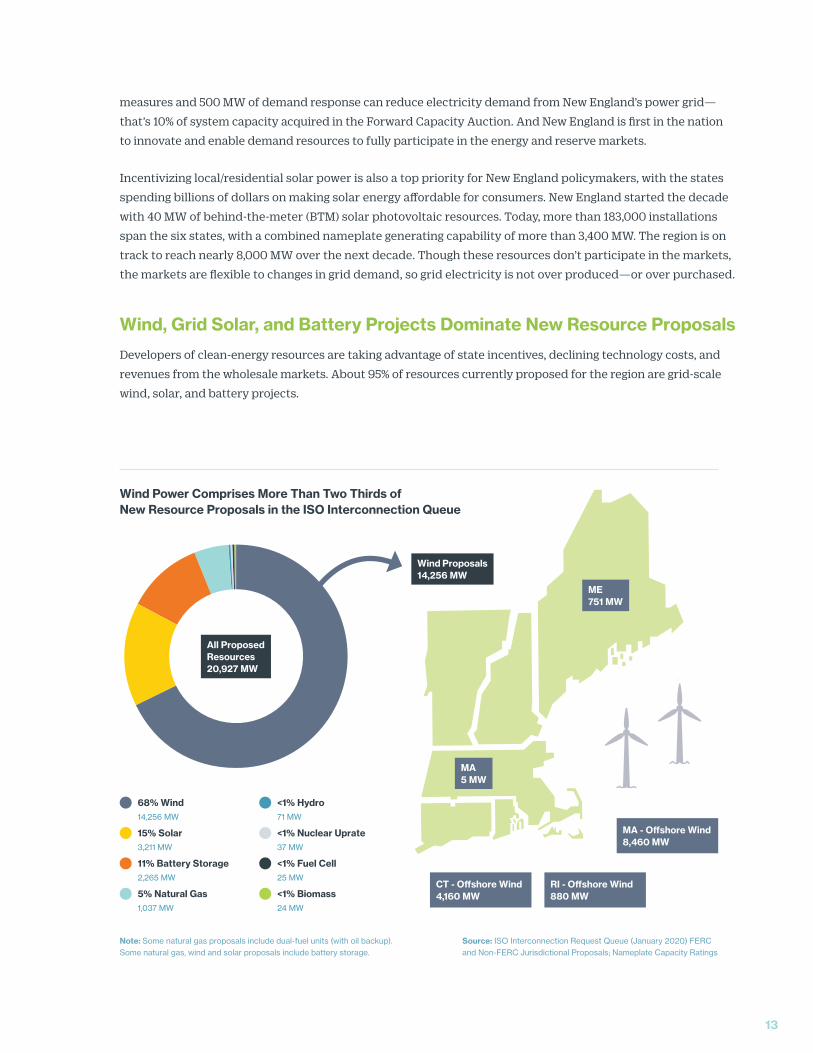
Wind, Grid Solar, and Battery Projects Dominate New Resource Proposals
Developers of clean-energy resources are taking advantage of state incentives, declining technology costs, and
revenues from the wholesale markets. About 95% of resources currently proposed for the region are grid-scale
wind, solar, and battery projects.
Wind Power Comprises More Than Two Thirds of New Resource Proposals in the ISO Interconnection Queue
13
68% Wind 14,256 MW
15% Solar 3,211 MW
11% Battery Storage 2,265 MW
5% Natural Gas 1,037 MW
<1% Hydro 71 MW
<1% Nuclear Uprate 37 MW
<1% Fuel Cell 25 MW
<1% Biomass 24 MW
Source: ISO Interconnection Request Queue (January 2020) FERC and Non-FERC Jurisdictional Proposals; Nameplate Capacity Ratings
Note: Some natural gas proposals include dual-fuel units (with oil backup). Some natural gas, wind and solar proposals include battery storage.
Wind Proposals14,256 MW
ME751 MW
CT - Offshore Wind4,160 MW
RI - Offshore Wind880 MW
MA - Offshore Wind8,460 MW
MA5 MW
All Proposed Resources20,927 MW
ISO New England has more than 14,000 MW of wind interconnections under study, which is by far the largest
group of resources seeking to connect to the region’s electricity grid (as of January 2020). The New England
coast offers prime conditions for offshore wind, and about 13,500 MW of proposed wind is located offshore of
Massachusetts, Rhode Island, and Connecticut, with most of the remaining located onshore in Maine. In 2016,
the wind turbines at the Block Island Wind Farm began putting power onto the electricity grid, making the
30 MW project the first offshore wind farm in the United States.
Solar and battery storage now rank second and third in the ISO Interconnection Request Queue, both
surpassing natural gas. New storage technologies are emerging, driven by technological advances, falling
costs, support from the states, and changes to the markets that enable storage participation. About 20 MW
of grid-scale battery-storage projects have come on line since 2015; nearly 2,300 MW of grid-scale stand-alone
energy-storage projects are requesting interconnection. Grid-scale and behind-the-meter energy storage can
contribute a number of benefits: provide grid operators with short-term reliability services, maximize the
output from wind and solar resources by storing their excess energy, defer transmission and distribution
system upgrades when strategically placed, shave the peak during times of high system demand, provide
backup power during localized power outages, and enable the development of microgrids.
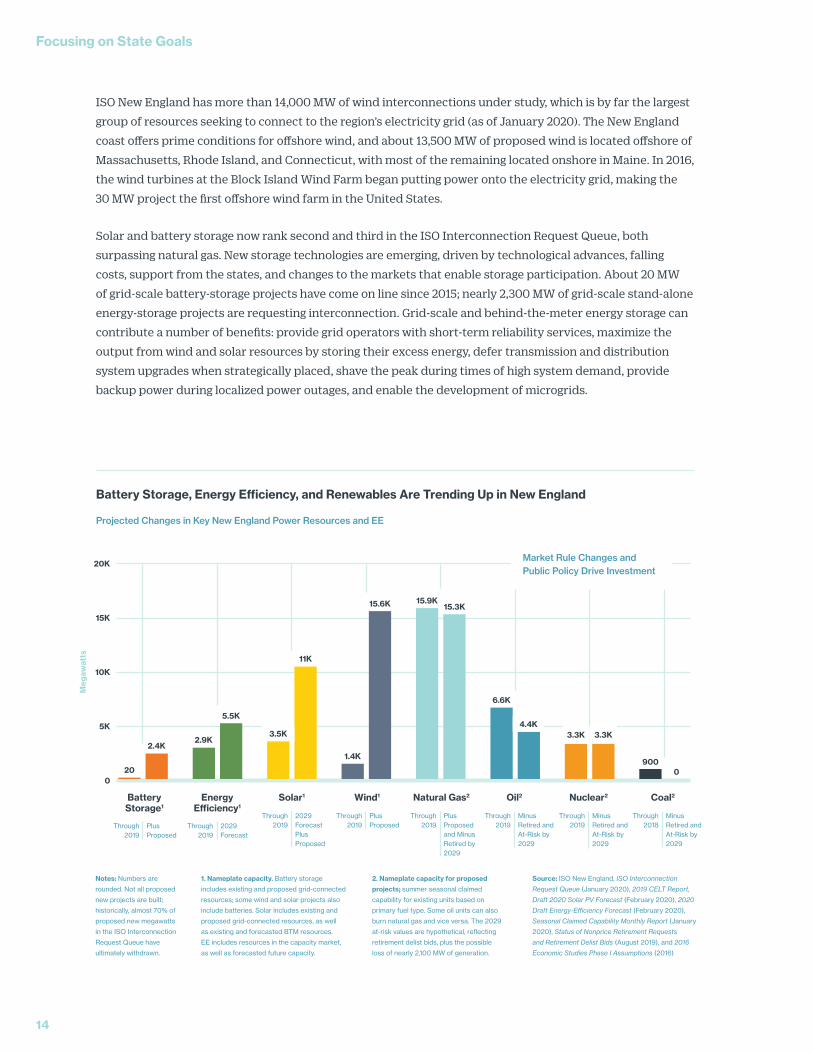
Notes: Numbers are
rounded. Not all proposed
new projects are built;
historically, almost 70% of
proposed new megawatts
in the ISO Interconnection
Request Queue have
ultimately withdrawn.
1. Nameplate capacity. Battery storage
includes existing and proposed grid-connected
resources; some wind and solar projects also
include batteries. Solar includes existing and
proposed grid-connected resources, as well
as existing and forecasted BTM resources.
EE includes resources in the capacity market,
as well as forecasted future capacity.
2. Nameplate capacity for proposed
projects; summer seasonal claimed
capability for existing units based on
primary fuel type. Some oil units can also
burn natural gas and vice versa. The 2029
at-risk values are hypothetical, reflecting
retirement delist bids, plus the possible
loss of nearly 2,100 MW of generation.
Source: ISO New England, ISO Interconnection
Request Queue (January 2020), 2019 CELT Report,
Draft 2020 Solar PV Forecast (February 2020), 2020
Draft Energy-Efficiency Forecast (February 2020),
Seasonal Claimed Capability Monthly Report (January
2020), Status of Nonprice Retirement Requests
and Retirement Delist Bids (August 2019), and 2016
Economic Studies Phase I Assumptions (2016)
Battery Storage, Energy Efficiency, and Renewables Are Trending Up in New England
Projected Changes in Key New England Power Resources and EE
Meg
awat
ts
20K
15K
10K
5K
0
Battery Storage1
Energy Efficiency1
Solar1 Wind1 Natural Gas2 Oil2 Nuclear2 Coal2
Through 2019
Through 2019
Through 2019
Through 2019
Through 2019
Through 2019
Through 2019
Through 2018Plus
Proposed2029 Forecast
2029 Forecast Plus Proposed
Plus Proposed
Plus Proposed and Minus Retired by 2029
Minus Retired and At-Risk by 2029
Minus Retired and At-Risk by 2029
Minus Retired and At-Risk by 2029
20
2.9K3.5K
1.4K2.4K
5.5K
11K
15.6K 15.9K
6.6K
4.4K3.3K 3.3K
9000
15.3K
Market Rule Changes and Public Policy Drive Investment
Focusing on State Goals
14
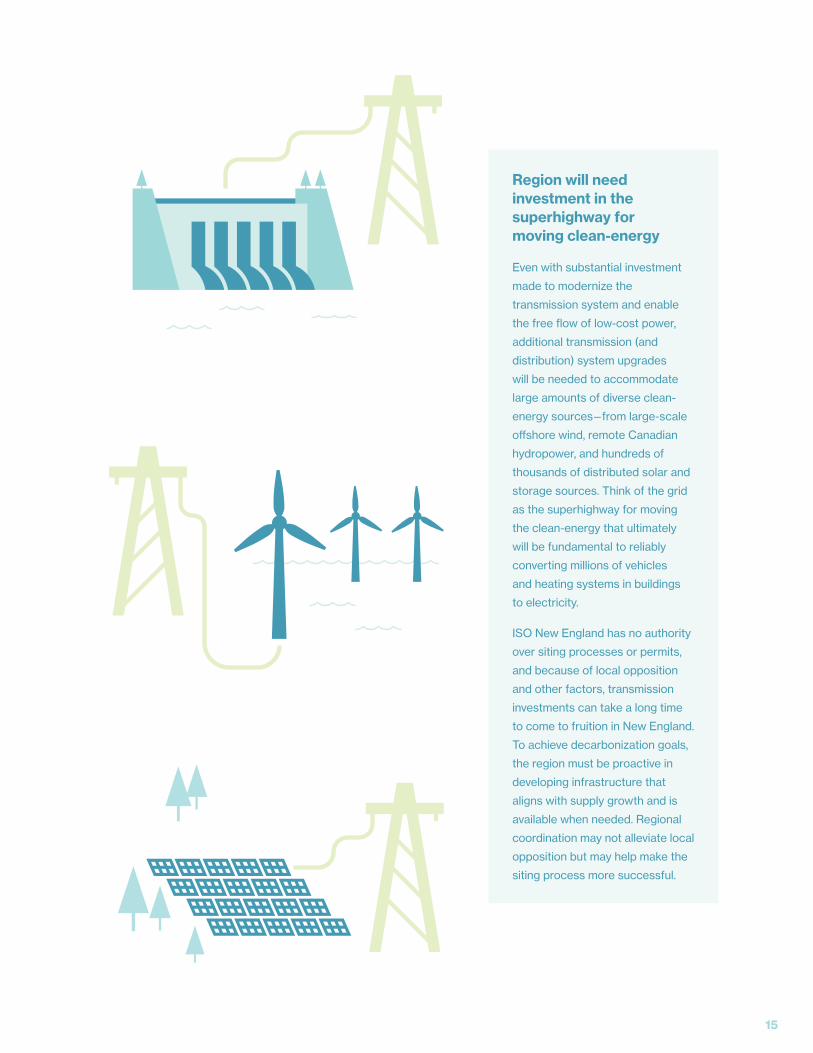
Region will need investment in the superhighway for moving clean-energy
Even with substantial investment
made to modernize the
transmission system and enable
the free flow of low-cost power,
additional transmission (and
distribution) system upgrades
will be needed to accommodate
large amounts of diverse clean-
energy sources—from large-scale
offshore wind, remote Canadian
hydropower, and hundreds of
thousands of distributed solar and
storage sources. Think of the grid
as the superhighway for moving
the clean-energy that ultimately
will be fundamental to reliably
converting millions of vehicles
and heating systems in buildings
to electricity.
ISO New England has no authority
over siting processes or permits,
and because of local opposition
and other factors, transmission
investments can take a long time
to come to fruition in New England.
To achieve decarbonization goals,
the region must be proactive in
developing infrastructure that
aligns with supply growth and is
available when needed. Regional
coordination may not alleviate local
opposition but may help make the
siting process more successful.
15
Focusing on Our Role:
Planning, Innovating, and Enabling a Reliable, Clean-Energy Grid
ISO New England is a leader in operational and market innovation to get the grid ready for the future—one that will primarily use clean-energy resources to meet consumer demand. The ISO team of highly skilled technical staff have the unique responsibility, independent of any technological, financial, or other interests, to minimize risk to the reliable operation of the power system and ensure that the competitive markets can continuously provide sufficient revenues for all resources needed for grid reliability.
16
17
13K
12K
11K
10K
9K
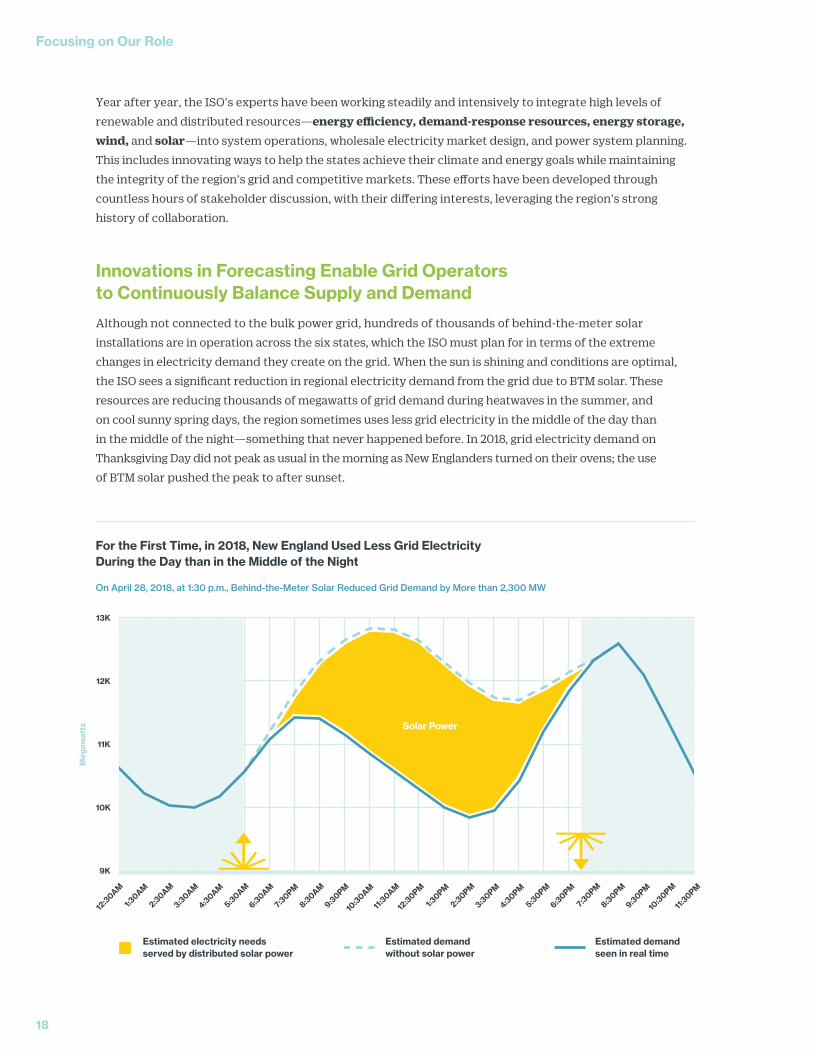
Year after year, the ISO’s experts have been working steadily and intensively to integrate high levels of
renewable and distributed resources—energy efficiency, demand-response resources, energy storage, wind, and solar—into system operations, wholesale electricity market design, and power system planning.
This includes innovating ways to help the states achieve their climate and energy goals while maintaining
the integrity of the region’s grid and competitive markets. These efforts have been developed through
countless hours of stakeholder discussion, with their differing interests, leveraging the region’s strong
history of collaboration.
Innovations in Forecasting Enable Grid Operators to Continuously Balance Supply and Demand
Although not connected to the bulk power grid, hundreds of thousands of behind-the-meter solar
installations are in operation across the six states, which the ISO must plan for in terms of the extreme
changes in electricity demand they create on the grid. When the sun is shining and conditions are optimal,
the ISO sees a significant reduction in regional electricity demand from the grid due to BTM solar. These
resources are reducing thousands of megawatts of grid demand during heatwaves in the summer, and
on cool sunny spring days, the region sometimes uses less grid electricity in the middle of the day than
in the middle of the night—something that never happened before. In 2018, grid electricity demand on
Thanksgiving Day did not peak as usual in the morning as New Englanders turned on their ovens; the use
of BTM solar pushed the peak to after sunset.
Meg
awat
ts
12:3
0AM
1:30AM
2:30AM
3:30AM
4:30AM
5:30AM
6:30AM
7:30PM
8:30AM
9:30PM
10:3
0AM
11:30AM
12:3
0PM
1:30PM
2:30PM
3:30PM
4:30PM
5:30PM
6:30PM
7:30PM
8:30PM
9:30PM
10:3
0PM
11:30PM
Solar Power
Estimated demand seen in real time
Estimated demand without solar power
Estimated electricity needs served by distributed solar power
For the First Time, in 2018, New England Used Less Grid Electricity During the Day than in the Middle of the Night
On April 28, 2018, at 1:30 p.m., Behind-the-Meter Solar Reduced Grid Demand by More than 2,300 MW
Focusing on Our Role
18
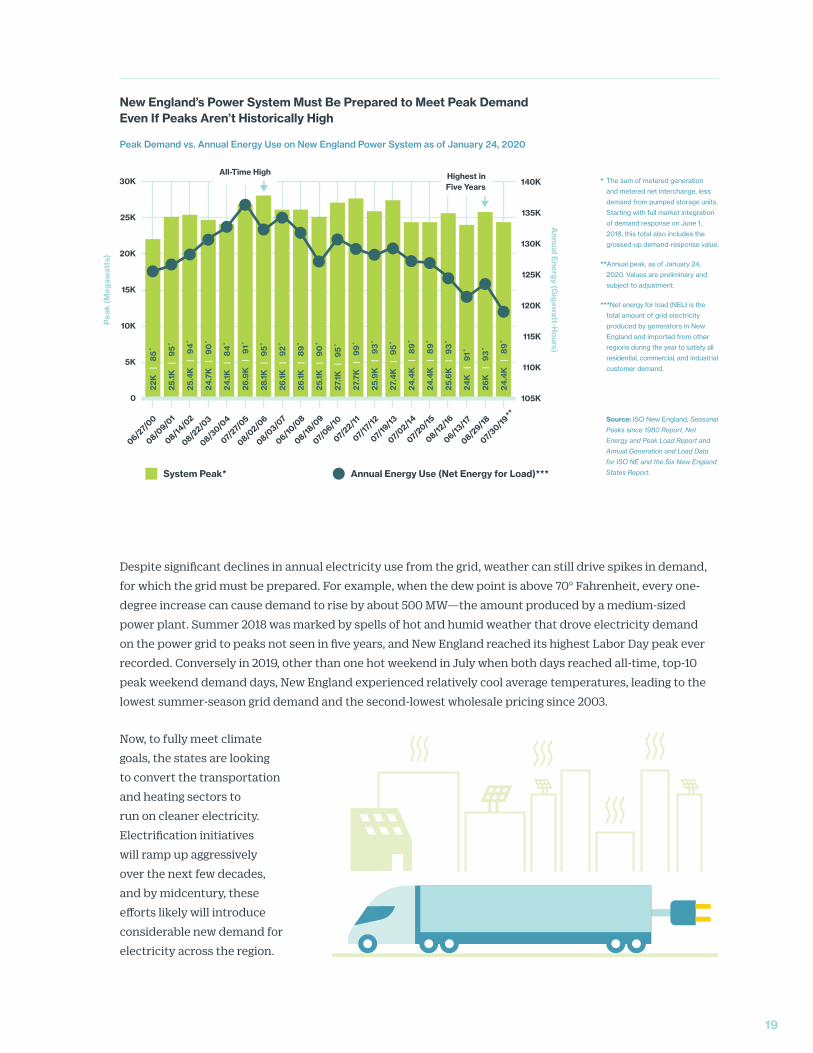
Despite significant declines in annual electricity use from the grid, weather can still drive spikes in demand,
for which the grid must be prepared. For example, when the dew point is above 70° Fahrenheit, every one-
degree increase can cause demand to rise by about 500 MW—the amount produced by a medium-sized
power plant. Summer 2018 was marked by spells of hot and humid weather that drove electricity demand
on the power grid to peaks not seen in five years, and New England reached its highest Labor Day peak ever
recorded. Conversely in 2019, other than one hot weekend in July when both days reached all-time, top-10
peak weekend demand days, New England experienced relatively cool average temperatures, leading to the
lowest summer-season grid demand and the second-lowest wholesale pricing since 2003.
Now, to fully meet climate
goals, the states are looking
to convert the transportation
and heating sectors to
run on cleaner electricity.
Electrification initiatives
will ramp up aggressively
over the next few decades,
and by midcentury, these
efforts likely will introduce
considerable new demand for
electricity across the region.
30K
25K
20K
15K
10K
5K
0
* The sum of metered generation
and metered net interchange, less
demand from pumped storage units.
Starting with full market integration
of demand response on June 1,
2018, this total also includes the
grossed-up demand-response value.
**Annual peak, as of January 24,
2020. Values are preliminary and
subject to adjustment.
***Net energy for load (NEL) is the
total amount of grid electricity
produced by generators in New
England and imported from other
regions during the year to satisfy all
residential, commercial, and industrial
customer demand.
Source: ISO New England, Seasonal
Peaks since 1980 Report, Net
Energy and Peak Load Report and
Annual Generation and Load Data
for ISO NE and the Six New England
States Report.
Pea
k (M
egaw
atts
)
Annual E
nergy (Gigaw
att-Hours)
06/27/
00
08/09/0
1
08/14/0
2
08/22/0
3
08/30/0
4
07/27/
05
08/02/0
6
08/03/0
7
06/10/0
8
08/18/0
9
07/06/10
07/22/11
07/17
/12
07/19
/13
07/02/14
07/20/15
08/12/16
06/13/17
08/29/18
07/30/19
140K
135K
130K
125K
120K
115K
110K
105K
Annual Energy Use (Net Energy for Load)*** System Peak*
22K
|
85
˚
25.1K
|
95
˚
25.4
K
| 9
4˚
24.7
K
| 9
0˚
24.1K
|
84
˚
26.1K
|
92˚
27.1K
|
95
˚
27.4
K
| 9
5˚
25.6
K
| 9
3˚
26.9
K
| 9
1˚
26.1K
|
89
˚
27.7
K
| 9
9˚
24.4
K
| 8
9˚
24K
|
91˚
28.1K
|
95
˚
25.1K
|
90
˚
25.9
K
| 9
3˚
24.4
K
| 8
9˚
26K
|
93
˚
24.4
K
| 8
9˚
All-Time High Highest in Five Years
New England’s Power System Must Be Prepared to Meet Peak Demand Even If Peaks Aren’t Historically High
Peak Demand vs. Annual Energy Use on New England Power System as of January 24, 2020
19
**
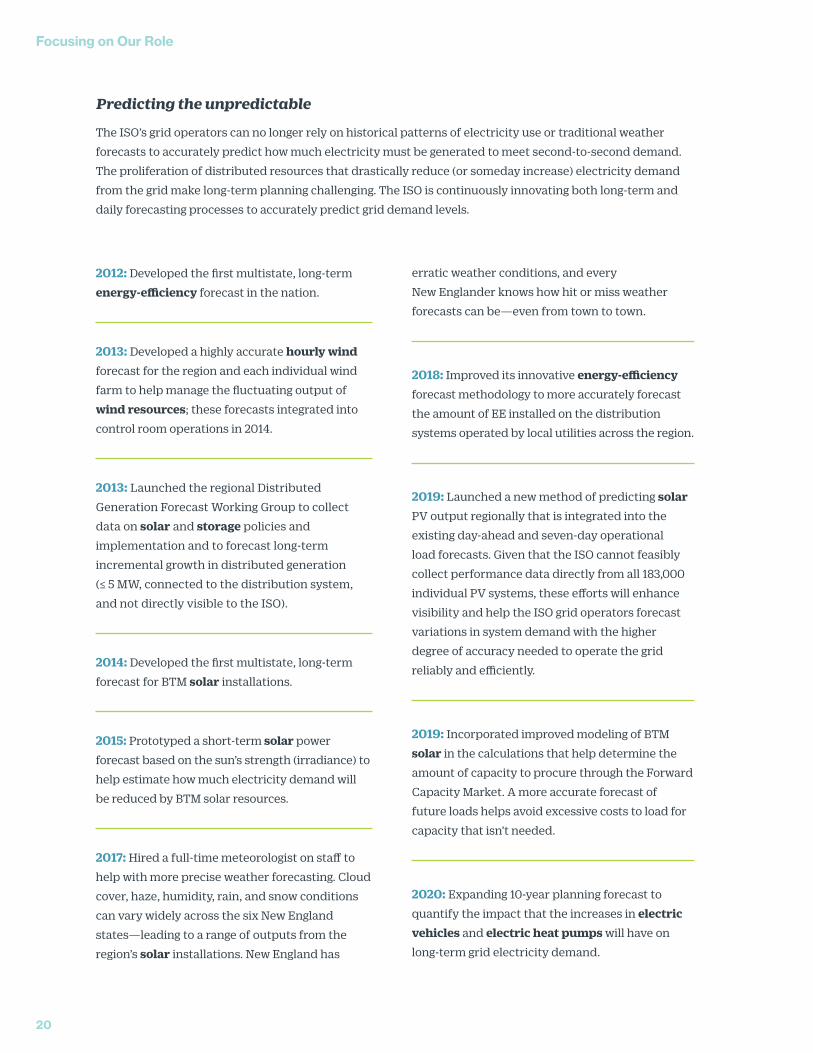
Predicting the unpredictable
The ISO’s grid operators can no longer rely on historical patterns of electricity use or traditional weather
forecasts to accurately predict how much electricity must be generated to meet second-to-second demand.
The proliferation of distributed resources that drastically reduce (or someday increase) electricity demand
from the grid make long-term planning challenging. The ISO is continuously innovating both long-term and
daily forecasting processes to accurately predict grid demand levels.
2012: Developed the first multistate, long-term
energy-efficiency forecast in the nation.
2013: Developed a highly accurate hourly wind
forecast for the region and each individual wind
farm to help manage the fluctuating output of
wind resources; these forecasts integrated into
control room operations in 2014.
2013: Launched the regional Distributed
Generation Forecast Working Group to collect
data on solar and storage policies and
implementation and to forecast long-term
incremental growth in distributed generation
(≤ 5 MW, connected to the distribution system,
and not directly visible to the ISO).
2014: Developed the first multistate, long-term
forecast for BTM solar installations.
2015: Prototyped a short-term solar power
forecast based on the sun’s strength (irradiance) to
help estimate how much electricity demand will
be reduced by BTM solar resources.
2017: Hired a full-time meteorologist on staff to
help with more precise weather forecasting. Cloud
cover, haze, humidity, rain, and snow conditions
can vary widely across the six New England
states—leading to a range of outputs from the
region’s solar installations. New England has
erratic weather conditions, and every
New Englander knows how hit or miss weather
forecasts can be—even from town to town.
2018: Improved its innovative energy-efficiency
forecast methodology to more accurately forecast
the amount of EE installed on the distribution
systems operated by local utilities across the region.
2019: Launched a new method of predicting solar
PV output regionally that is integrated into the
existing day-ahead and seven-day operational
load forecasts. Given that the ISO cannot feasibly
collect performance data directly from all 183,000
individual PV systems, these efforts will enhance
visibility and help the ISO grid operators forecast
variations in system demand with the higher
degree of accuracy needed to operate the grid
reliably and efficiently.
2019: Incorporated improved modeling of BTM
solar in the calculations that help determine the
amount of capacity to procure through the Forward
Capacity Market. A more accurate forecast of
future loads helps avoid excessive costs to load for
capacity that isn’t needed.
2020: Expanding 10-year planning forecast to
quantify the impact that the increases in electric vehicles and electric heat pumps will have on
long-term grid electricity demand.
Focusing on Our Role
20
Wholesale Markets Enable the Proliferation of Renewable and Distributed Energy Resources
Renewable resources like wind are variable, inverter-based generators that operate differently from
conventional power resources. For a decade, the ISO has been developing the ability of renewable and
distributed energy resources to participate and earn revenue in the wholesale markets and implementing
operational tools to efficiently manage the grid with increasing amounts of these resources.
2010: Studied the potential impacts of
integrating large amounts of wind resources
into the New England system.
2013: Integrated into our operations, power
system data from phasor measurement units
(PMUs) and associated computer systems installed
across the region to increase the observability of
system conditions, enable new applications, and
improve oscillation detection, which help manage
the variability of demand from BTM solar and the
variability of supply from wind resources. The
ISO has also worked with leading universities to
demonstrate how cloud computing can be used to
create a reliable, secure, resilient, and affordable
platform for managing PMU data and sharing it
with neighboring grid operators.
2014: Introduced the ability to offer negative prices (i.e., pay to operate) in the energy market, enabling primarily wind but also solar power to continue operating during low-load conditions when they otherwise could be curtailed.
2014: With scientists from the Lawrence Livermore National Laboratory, studied how high-performance computing can be used to model and simulate a new robust unit-commitment solution for dispatching variable wind.
2015: Introduced an “energy-neutral” dispatch signal to integrate new energy-storage technologies, such as batteries and flywheels, into the regulation market to provide real-time frequency-regulation services.
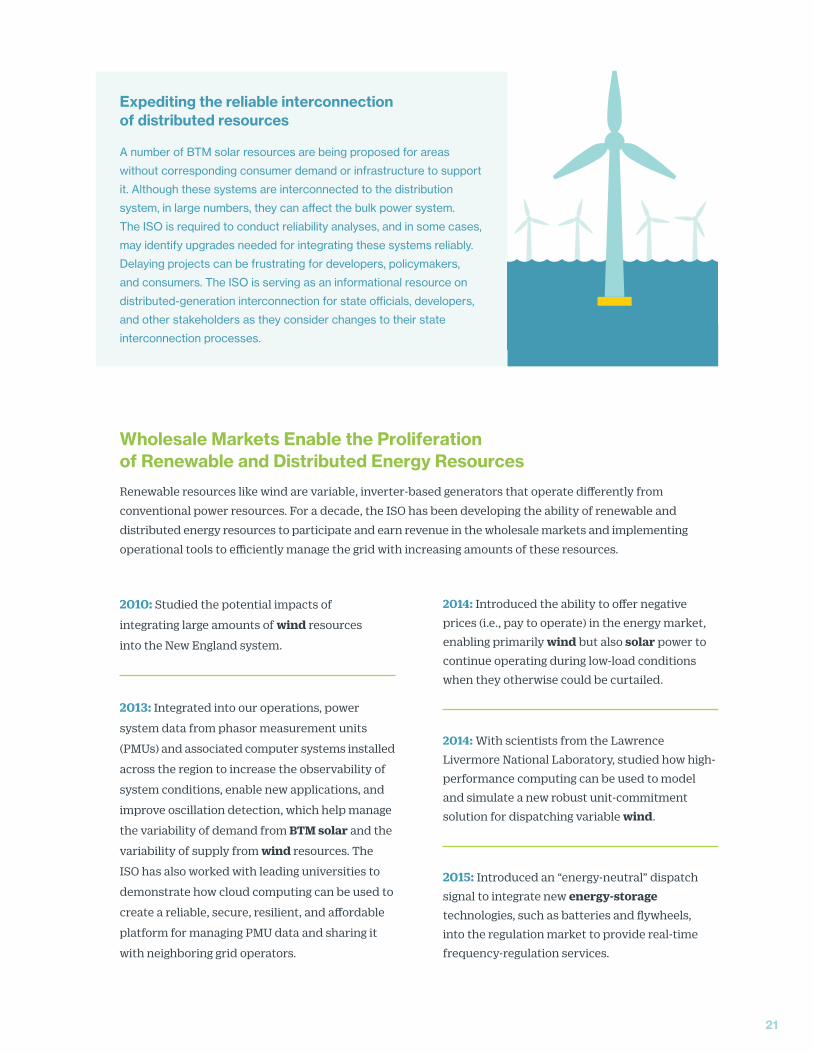
Expediting the reliable interconnection of distributed resources
A number of BTM solar resources are being proposed for areas
without corresponding consumer demand or infrastructure to support
it. Although these systems are interconnected to the distribution
system, in large numbers, they can affect the bulk power system.
The ISO is required to conduct reliability analyses, and in some cases,
may identify upgrades needed for integrating these systems reliably.
Delaying projects can be frustrating for developers, policymakers,
and consumers. The ISO is serving as an informational resource on
distributed-generation interconnection for state officials, developers,
and other stakeholders as they consider changes to their state
interconnection processes.
21
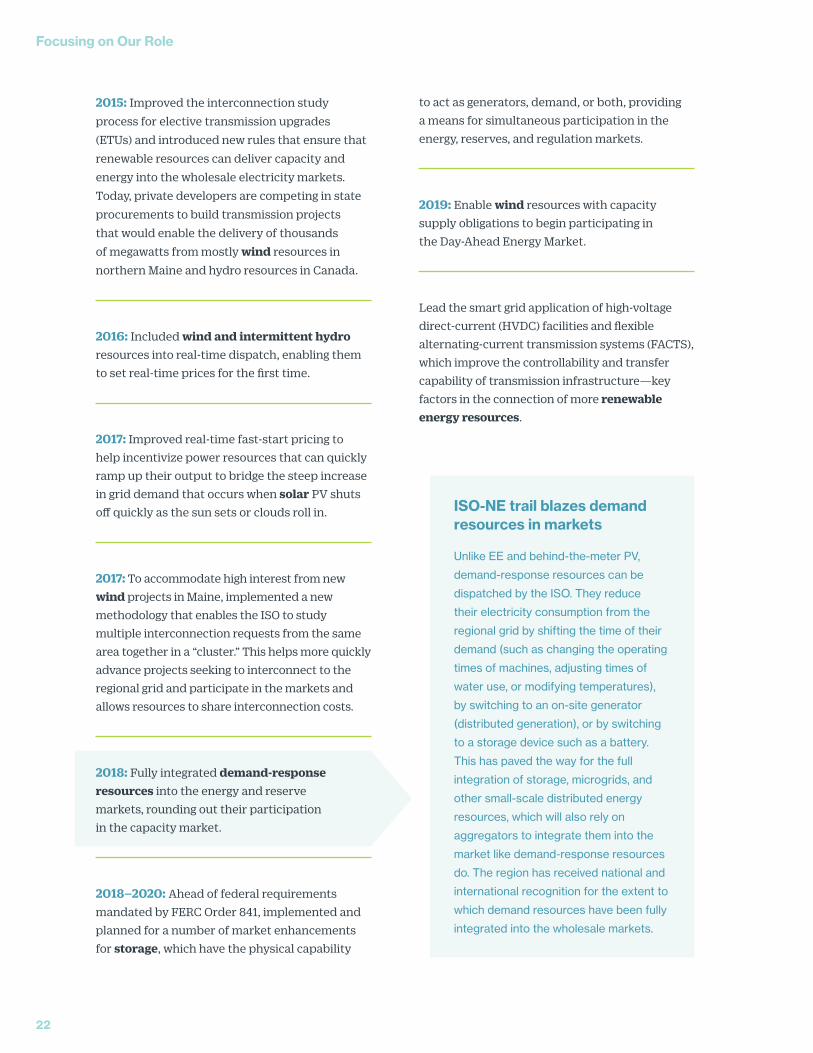
ISO-NE trail blazes demand resources in markets
Unlike EE and behind-the-meter PV,
demand-response resources can be
dispatched by the ISO. They reduce
their electricity consumption from the
regional grid by shifting the time of their
demand (such as changing the operating
times of machines, adjusting times of
water use, or modifying temperatures),
by switching to an on-site generator
(distributed generation), or by switching
to a storage device such as a battery.
This has paved the way for the full
integration of storage, microgrids, and
other small-scale distributed energy
resources, which will also rely on
aggregators to integrate them into the
market like demand-response resources
do. The region has received national and
international recognition for the extent to
which demand resources have been fully
integrated into the wholesale markets.
2015: Improved the interconnection study process for elective transmission upgrades (ETUs) and introduced new rules that ensure that renewable resources can deliver capacity and energy into the wholesale electricity markets. Today, private developers are competing in state procurements to build transmission projects that would enable the delivery of thousands of megawatts from mostly wind resources in northern Maine and hydro resources in Canada.
2016: Included wind and intermittent hydro resources into real-time dispatch, enabling them to set real-time prices for the first time.
2017: Improved real-time fast-start pricing to help incentivize power resources that can quickly ramp up their output to bridge the steep increase in grid demand that occurs when solar PV shuts off quickly as the sun sets or clouds roll in.
2017: To accommodate high interest from new wind projects in Maine, implemented a new methodology that enables the ISO to study multiple interconnection requests from the same area together in a “cluster.” This helps more quickly advance projects seeking to interconnect to the regional grid and participate in the markets and allows resources to share interconnection costs.
2018: Fully integrated demand-response resources into the energy and reserve markets, rounding out their participation in the capacity market.
2018–2020: Ahead of federal requirements mandated by FERC Order 841, implemented and planned for a number of market enhancements for storage, which have the physical capability
to act as generators, demand, or both, providing a means for simultaneous participation in the energy, reserves, and regulation markets.
2019: Enable wind resources with capacity supply obligations to begin participating in the Day-Ahead Energy Market.
Lead the smart grid application of high-voltage direct-current (HVDC) facilities and flexible alternating-current transmission systems (FACTS), which improve the controllability and transfer capability of transmission infrastructure—key factors in the connection of more renewable energy resources.
Focusing on Our Role
22
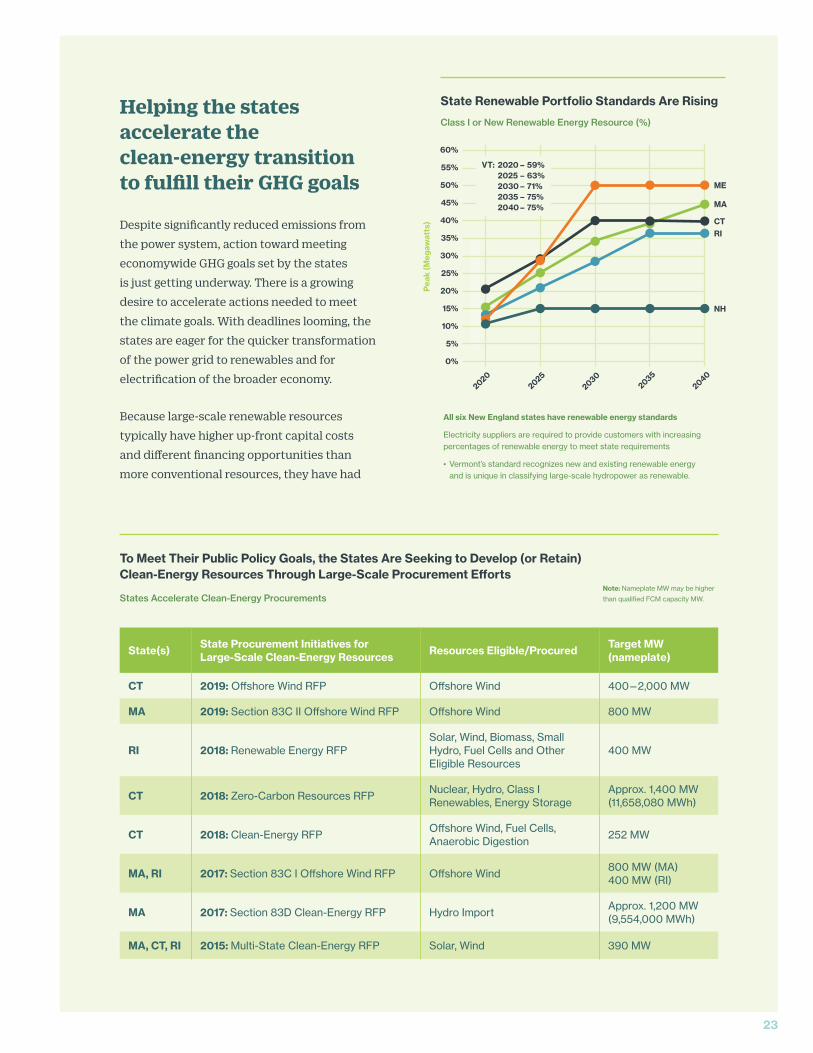
Helping the states accelerate the clean-energy transition to fulfill their GHG goals
Despite significantly reduced emissions from
the power system, action toward meeting
economywide GHG goals set by the states
is just getting underway. There is a growing
desire to accelerate actions needed to meet
the climate goals. With deadlines looming, the
states are eager for the quicker transformation
of the power grid to renewables and for
electrification of the broader economy.
Because large-scale renewable resources
typically have higher up-front capital costs
and different financing opportunities than
more conventional resources, they have had
All six New England states have renewable energy standards
Electricity suppliers are required to provide customers with increasing percentages of renewable energy to meet state requirements
• Vermont’s standard recognizes new and existing renewable energy and is unique in classifying large-scale hydropower as renewable.
State Renewable Portfolio Standards Are Rising
Class I or New Renewable Energy Resource (%)
Pea
k (M
egaw
atts
)
20202025
20302035
2040
60%
55%
50%
45%
40%
35%
30%
25%
20%
15%
10%
5%
0%
VT: 2020 – 59% 2025 – 63% 2030 – 71% 2035 – 75% 2040 – 75%
ME
MA
CTRI
NH
To Meet Their Public Policy Goals, the States Are Seeking to Develop (or Retain) Clean-Energy Resources Through Large-Scale Procurement Efforts
States Accelerate Clean-Energy Procurements
State(s) State Procurement Initiatives for Large-Scale Clean-Energy Resources Resources Eligible/Procured Target MW
(nameplate)
CT 2019: Offshore Wind RFP Offshore Wind 400—2,000 MW
MA 2019: Section 83C II Offshore Wind RFP Offshore Wind 800 MW
RI 2018: Renewable Energy RFPSolar, Wind, Biomass, Small Hydro, Fuel Cells and Other Eligible Resources
400 MW
CT 2018: Zero-Carbon Resources RFPNuclear, Hydro, Class I Renewables, Energy Storage
Approx. 1,400 MW (11,658,080 MWh)
CT 2018: Clean-Energy RFPOffshore Wind, Fuel Cells, Anaerobic Digestion
252 MW
MA, RI 2017: Section 83C I Offshore Wind RFP Offshore Wind800 MW (MA) 400 MW (RI)
MA 2017: Section 83D Clean-Energy RFP Hydro ImportApprox. 1,200 MW (9,554,000 MWh)
MA, CT, RI 2015: Multi-State Clean-Energy RFP Solar, Wind 390 MW
Note: Nameplate MW may be higher
than qualified FCM capacity MW.
23
difficulty competing in the wholesale markets.
Therefore, the New England states are promoting,
at varying levels and speed, the development
of specific clean-energy resources to meet their
public policy goals.
Several states have established public policies
that direct electric power companies to enter
into rate-payer-funded, long-term contracts for
large-scale carbon-free energy that would cover
most, if not all, of the resource’s costs. Long-term
contracts carry risk given the rapid development
and falling costs of new technologies—and
this risk of stranded costs is placed back on
consumers. As policymakers seek to convert the
transportation and heating sectors to carbon-free
electricity to fully meet climate goals, this public
policy trend is expected to continue.
Pricing carbon within the competitive market
structure is the simplest, easiest, and most
efficient way to rapidly reduce GHG emissions in
the electricity sector. Moreover, placing a realistic
price on carbon would enable consumers to pay
accurate, competitive prices without the risk of
paying for stranded costs. However, New England
state policymakers and other stakeholders
responsible for putting this approach into motion
have not pursued a carbon-pricing option that
effectively reflects decarbonization goals, neither
economywide nor in the electricity sector.
In the absence of a regional strategy for realistic
carbon pricing, ISO New England designed and
implemented Competitive Auctions for Sponsored
Policy Resources (CASPR) to enable the resource
transition to take place in a manner that does
not compromise reliability. CASPR is a state-
of-the-art solution that allows state-sponsored
clean-energy resources (such as state-contracted
offshore wind) into the capacity market without
artificially depressing prices for all other resources.
Unrestricted entry of state-sponsored resources
into the capacity market could lead to economic
distortions, undermine the competitiveness of
the market, and cause retirements to happen too
quickly. Or, it could deter new investment in other
resources that don’t have a contract but are needed
to operate the grid reliably (such as merchant
investment in grid-scale storage technologies).
It is important to note that CASPR does not
prevent potential capacity resources from
clearing in the primary auction if they are
economic. Rather, it provides an opportunity for
state-sponsored resources unable to clear in the
primary auction to trade with a capacity resource
seeking to retire, thereby avoiding the expensive
and inefficient acquisition of more resources than
required for reliability.
The ISO conducted the first substitution auction in
conjunction with Forward Capacity Auction #13 in
2019. CASPR will work over time, depending on the
timing and buildup of the economic incentives for
buyers and sellers. While CASPR is a second-best
solution for reducing (or eliminating) carbon from
the power sector, the market design demonstrates
ISO New England’s consideration of the region’s
climate goals and adherence to our mission to
ensure reliability through a competitive wholesale
market structure.
Focusing on Our Role
24
Pricing carbon within the competitive market structure is the simplest, easiest, and most efficient way to rapidly reduce GHG emissions in the electricity sector.
Regional cap-and-trade GHG reduction initiatives work well with markets
In addition to their individual state goals and laws, all six New England
states have been members of the Regional Greenhouse Gas Initiative
(RGGI) since 2007. The first mandatory cap-and-trade program in the
United States to limit carbon dioxide (CO2) in the power sector, RGGI is a
tool for some of the states to invest in efforts, such as energy efficiency
and renewable energy, via the revenue-generating auction mechanism
of CO2 allowances. However, the caps on allowances to date have not
been restrictive enough to raise prices to a level that spurs development
of renewable resources without other incentives or power purchase
agreements. The New England states have also participated in discussions
with the Transportation and Climate Initiative, a regional collaboration of
Northeast and Mid-Atlantic states and the District of Columbia that seeks
to improve transportation, develop the clean-energy economy, and reduce
carbon emissions from the transportation sector. The goal of the initiative
is the design of a proposal for a regional low-carbon transportation policy
using a cap-and-invest program or other pricing mechanism to reduce
carbon emissions from transportation fuels.
25
What is the capacity market?
Power resources compete in the Forward Capacity Market to take on a
commitment to be available to meet projected demand for electricity three
years out. The FCM works in tandem with the energy and ancillary services
markets to provide revenue that attracts and sustains power resources needed
today and into the future. Over the years, the FCM has enabled the entry
of nearly 12,000 MW from energy efficiency, demand response, renewable
resources and natural gas plants. And it has provided an orderly process for
the retirement of almost 7,000 MW from older fossil units and nuclear plants.
Focusing on Energy Security:
Reliably Operating a Future Power Grid with a High Penetration of Renewable and Energy-Limited Resources
26
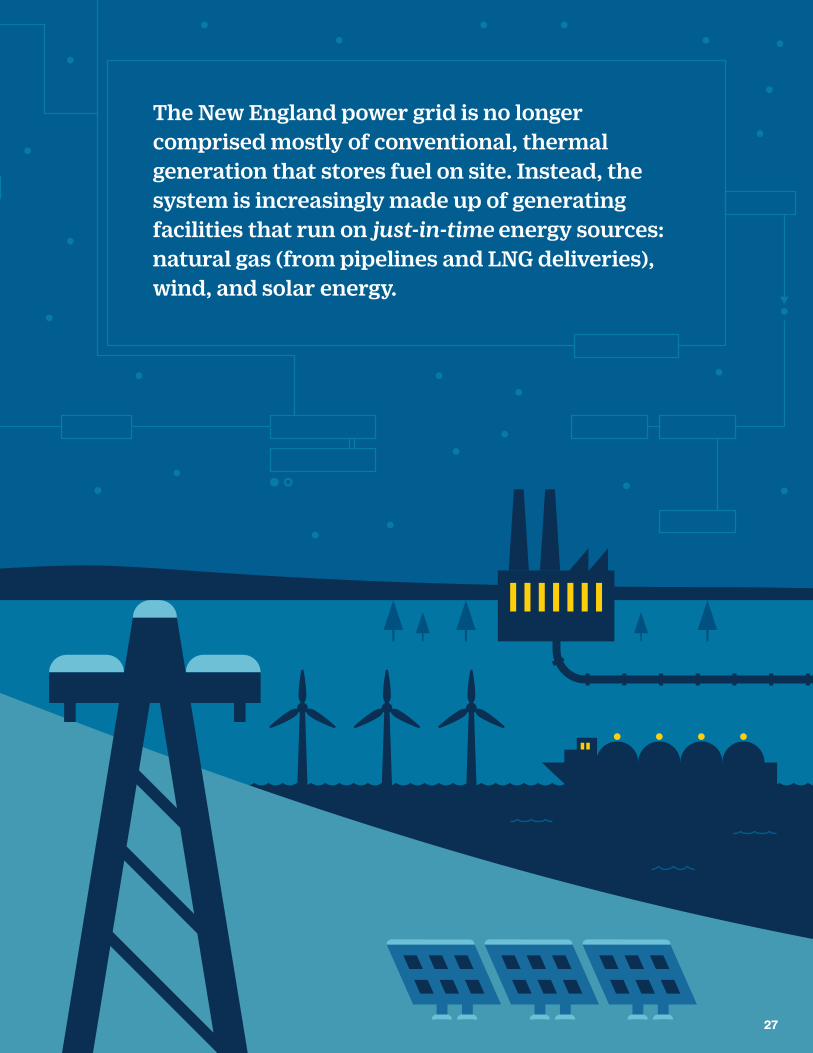
The New England power grid is no longer comprised mostly of conventional, thermal generation that stores fuel on site. Instead, the system is increasingly made up of generating facilities that run on just-in-time energy sources: natural gas (from pipelines and LNG deliveries), wind, and solar energy.
27
Natural Gas, Wind, and Solar Are Especially Variable in Winter
With limited options for storing natural
gas, most natural-gas-fired plants rely on
just-in-time fuel delivered to New England
through interstate pipelines. However,
interstate pipeline infrastructure has only
expanded incrementally over the last several
decades, even as reliance on natural gas
for home heating and for power generation
has grown significantly.
During cold weather, most natural gas is
committed to local utilities for residential,
commercial, and industrial heating. As a
result, we are finding that during severe
winter weather, many power plants in
New England cannot obtain fuel to generate
electricity. Liquefied natural gas (LNG),
brought to New England by ship from
overseas, can help fill the gap—but regional
LNG storage and sendout capability is
limited, and its timely arrival depends on
long-term weather forecasts, global market
prices, and other logistical challenges.
Winter also imposes the most challenges
for solar output in New England due to
snow, clouds, and shortened daylight hours.
In addition, shortened winter days means
consumers use the most electricity after
sunset, and therefore solar doesn’t reduce
winter peak demand. While offshore wind
experiences its highest production during
winter, winter storms that limit solar power
can also significantly limit the output of
wind generation. This type of variability is
an understandable challenge in meeting
the states’ decarbonization goals through
greater renewable, weather-dependent
technologies, and it poses new technical
challenges to the grid’s reliability.
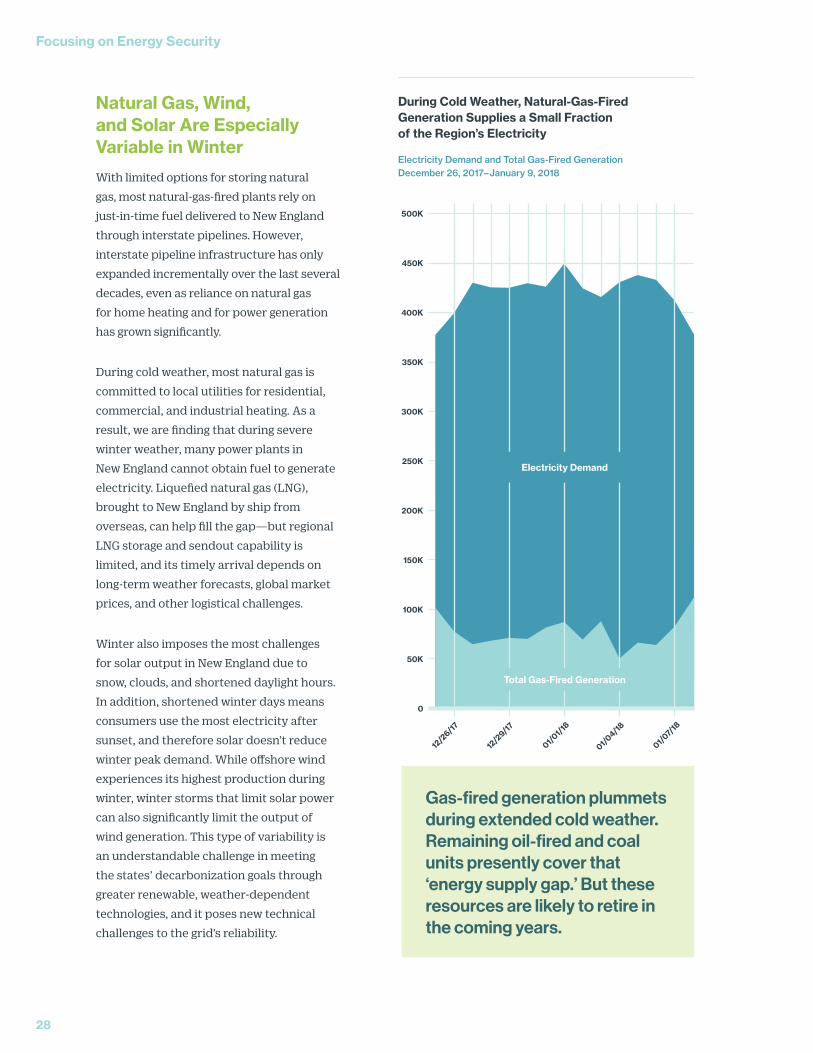
During Cold Weather, Natural-Gas-Fired Generation Supplies a Small Fraction of the Region’s Electricity
Electricity Demand and Total Gas-Fired Generation December 26, 2017–January 9, 2018
500K
450K
400K
350K
300K
250K
200K
150K
100K
50K
0
12/2
6/17
12/2
9/17
01/01/1
8
01/04/18
01/07/
18
Electricity Demand
Total Gas-Fired Generation
Gas-fired generation plummets during extended cold weather. Remaining oil-fired and coal units presently cover that ‘energy supply gap.’ But these resources are likely to retire in the coming years.
Focusing on Energy Security
28
From storing fossil fuel to storing clean energy: flexible resources will be required
Although New England currently enjoys the benefit of almost 2,000 MW of large-scale hydroelectric energy-storage facilities (that can pump water uphill at night to generate power the next day), future storage technologies that can offer longer-term and even seasonal electricity-storage capability are becoming important to balancing electricity supply and demand. The region is in the nascent stages of developing new grid-scale lithium-ion batteries, and much more grid-scale, clean-energy storage capability may ultimately be needed, including clean fuels.
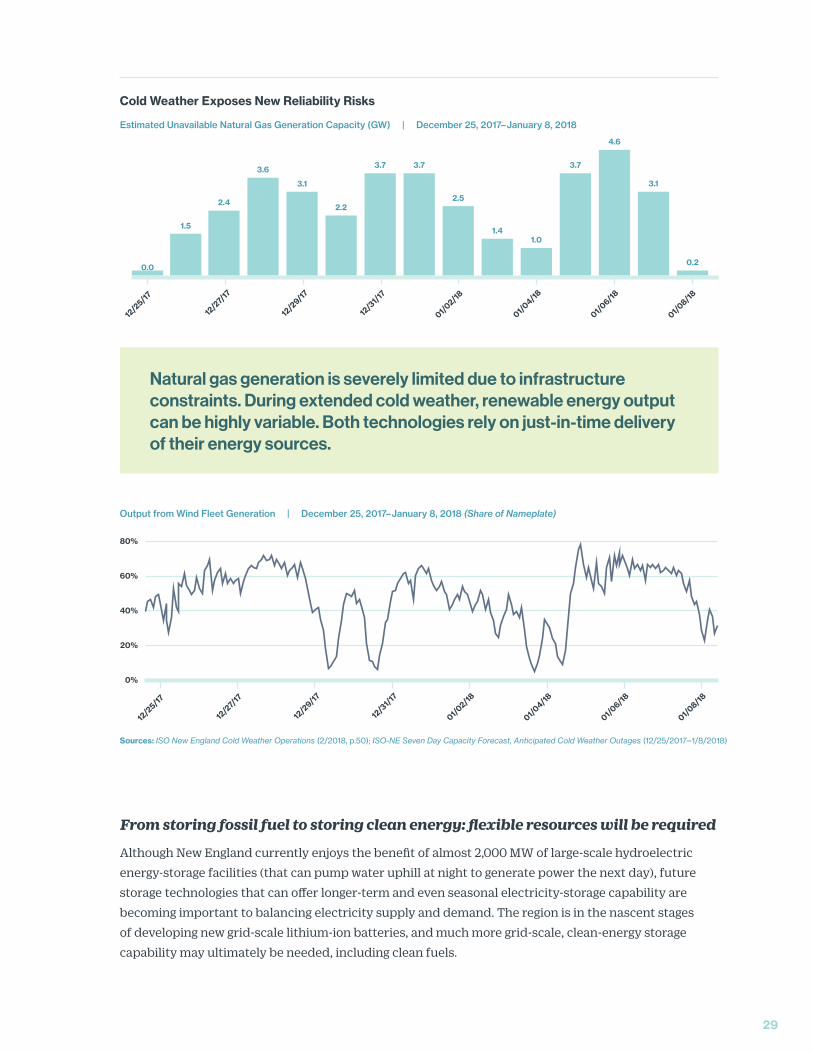
Cold Weather Exposes New Reliability Risks
Estimated Unavailable Natural Gas Generation Capacity (GW) | December 25, 2017–January 8, 2018
12/2
6/17
12/2
9/17
01/01/1
8
01/04/18
01/07/
18
Output from Wind Fleet Generation | December 25, 2017–January 8, 2018 (Share of Nameplate)
80%
60%
40%
20%
0%
12/2
5/17
12/2
7/17
12/2
9/17
12/3
1/17
01/02/18
01/04/18
01/06/18
01/08/18
Sources: ISO New England Cold Weather Operations (2/2018, p.50); ISO-NE Seven Day Capacity Forecast, Anticipated Cold Weather Outages (12/25/2017–1/8/2018)
12/2
5/17
12/2
7/17
12/2
9/17
12/3
1/17
01/02/18
01/04/18
01/06/18
01/08/18
0.0
1.5
2.4
3.6
3.1
2.2
3.7 3.7
2.5
1.41.0
3.7
4.6
3.1
0.2
Natural gas generation is severely limited due to infrastructure constraints. During extended cold weather, renewable energy output can be highly variable. Both technologies rely on just-in-time delivery of their energy sources.
29
The synergies between renewable energy sources and
flexible energy storage is already evident in the grid’s
operation. Consumers’ demand for power can be low
on many days when the sun is shining and the wind
is blowing steadily. Yet, without greater capabilities to
convert and store that zero-carbon electricity, much of
that power may simply go unused. And conversely, if
the region experiences high electricity demand on days
when the output from renewable resources falters (due to
adverse weather), the grid requires a considerable amount
of flexible-resource capacity that can promptly respond—
and sustain output for as long as needed—to fill the gap.
Until storage technologies can supply much more
energy for extended periods, the system’s existing fleet
of modern, flexible natural gas resources will remain
essential for meeting energy demand and, critically, filling
the “energy gap” when the weather is uncooperative
for wind and solar and the system’s existing grid-scale
storage facilities run low.
Managing Energy Security to Date
In New England, interstate natural gas pipeline constraints, combined with the retirement of many
older (oil and coal-fired) power plants, have heightened the region’s energy-security concerns. The ISO
doesn’t have authority over pipelines or other fuel infrastructure that supply New England’s power plants.
Instead, the ISO has the ability to develop market rules that result in accurate pricing signals that incentivize
power suppliers to make investments in their generation facilities and fuel-supply arrangements to operate
reliably and profitably.
Over nearly two decades, the ISO has made many successful market and operational enhancements to
improve gas system and electric power system coordination; boost power plants’ performance; and lead
generation owners to make more resilient fuel-supply arrangements across all system conditions (and, at
times, working to delay the retirement of key facilities still needed for reliability). The most recent changes,
since the publication of the 2019 REO, include:
n Temporarily retaining the Mystic Generation Station in Everett, MA from retiring, using a special
cost-of-service contract. ISO New England was given federal approval to retain resources from retiring
for a limited period based on the region’s fuel-security reliability challenges in winter.
n Developing a temporary Inventoried Energy Program, a short-term, stop-gap program to be in effect
for the winters of 2023/2024 and 2024/2025. This mechanism provides revenues to resources with
inventoried energy that contribute to reliable operations during cold winter conditions and reduce
the potential for these resources to retire prematurely for uneconomic reasons.
Storage also consumes energy and may not provide assistance once depleted
Energy-storage resources draw
electricity from the power system or
directly from a generating resource
(such as a colocated solar or wind
facility) as they “stockpile” energy, and
then send electricity to the grid at a
later time. Overall, they consume more
energy than they supply, as operations
and losses during energy conversion
consume some of their “inventory”
of stored energy. If these resources
are already depleted during a system
emergency, they would not be able to
provide help but would instead sit idle,
making their “inventory management”
and optimization a key technical
challenge for the grid’s reliability.
Focusing on Energy Security
30
The Next Step Forward: Ensuring Enough Flexible Supply Each Day to Manage the Uncertainties in an Increasingly Energy-Limited Power System
The design of the wholesale energy markets is based on the physics of the power system. Generators
with stored fuel provide enough flexibility for the daily energy market to balance electricity supply and
demand over the course of the day, reliably and at least cost. However, a system predominantly comprised
of generating facilities with just-in-time fuel supplies—wind, solar, or natural gas—loses flexibility.
In the coming years, the ISO must ensure that the grid has sufficient energy “on demand” to power
New England if these just-in-time gas-fired and renewable technologies are unavailable simultaneously.
Grid electricity will need to balance supply and demand over time spans from fractions of a second to
several weeks—to operate through both instantaneous disturbance and throughout sustained variation
in demand, availability of resources, and weather conditions.
To solve this challenge, ISO New England and regional stakeholders are proactively developing long-term
market enhancements known as Energy-Security Improvements (ESI), to be put in place in 2024. ESI
introduces strong market-based compensation for new energy and reserve services that will reward
the lowest-cost resources that can firm-up their energy sources and deliver electricity reliably when
unforeseen grid operating challenges arise. These new competitive market mechanisms create powerful
incentives that will help ensure that enough flexible resources are on line or available in the region during
energy-limited conditions.
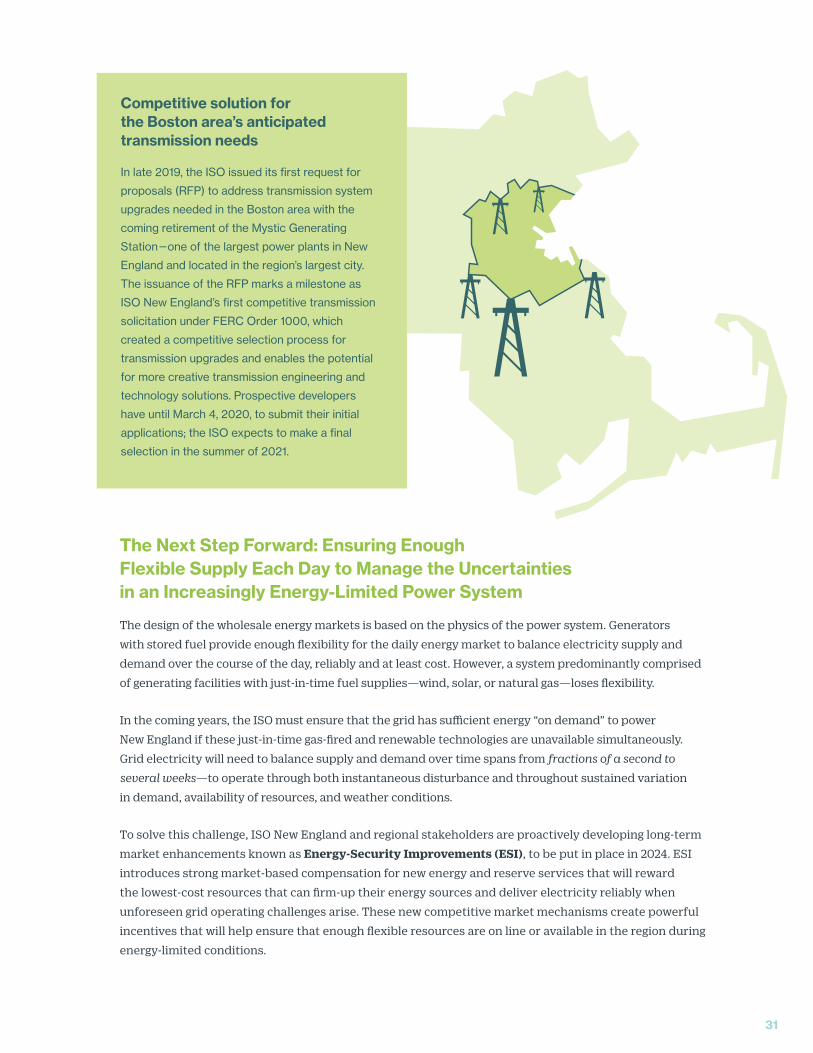
Competitive solution for the Boston area’s anticipated transmission needs
In late 2019, the ISO issued its first request for
proposals (RFP) to address transmission system
upgrades needed in the Boston area with the
coming retirement of the Mystic Generating
Station—one of the largest power plants in New
England and located in the region’s largest city.
The issuance of the RFP marks a milestone as
ISO New England’s first competitive transmission
solicitation under FERC Order 1000, which
created a competitive selection process for
transmission upgrades and enables the potential
for more creative transmission engineering and
technology solutions. Prospective developers
have until March 4, 2020, to submit their initial
applications; the ISO expects to make a final
selection in the summer of 2021.
31
New England is the first in the nation to bring forward a market design that will directly recognize and
compensate resources for the reliable, flexible, and responsive attributes they provide and will thereby
help accelerate the transition to reliable zero-carbon, renewable resources and storage technologies.
For example, a solar facility with battery storage has the same opportunity to provide these reliability
services as a natural gas plant with a contract for liquefied natural gas or an offshore wind farm that
operates at a high capacity factor during winter. All may be rewarded under the ESI design.
ESI does not favor fossil fuels—rather, it focuses on promoting reliable energy output instead of
compensating for specific production inputs such as fossil fuel. By contrast, direct subsidies to selected
generators to procure additional fuel would benefit only those selected resource owners, providing no
incentive for the systems’ other resources—or for potential new technologies, such as current and future
storage technologies—that may ultimately comprise the most cost-effective long-term solutions.
The design maintains New England’s transparent, technology-neutral principles of competition and
a familiar framework for resources:
1. Reliability. Minimize the heightened risk of unserved electricity demand
2. Cost Effectiveness. Leverage established markets and efficiently use the region’s infrastructure
3. Sustainability. Facilitate innovation that can reduce energy-security risk as technology
continues to evolve
ESI is comprised of two conceptual components:
1 File with FERC: April 15, 2020; Take Effect: June 1, 2024: Create new option-based services in the day-
ahead markets that compensate for the flexibility of energy “on demand” to manage uncertainties
each operating day. The ESI design will firm up and formalize the option to call on 3,500 to 5,000 MW of
potential energy “in reserve” each day, as follows, with a range of specific delivery-response times, to
help ensure reliable operations—capabilities previously relied on but not properly compensated:
n Generation Contingency Reserves (GCR): Three new day-ahead ancillary services that ensure operating reserve energy (GCR 10-minute spinning reserve, GCR 10-minute nonspinning reserve, and GCR 30-minute reserve)
n Replacement Energy Reserves (RER): Two new day-ahead ancillary services that ensure energy through the balance of the day to cover any “supply gap” that may arise if scheduled energy suppliers’ falter (RER 90-minute and RER 4-hour reserve)
n Energy Imbalance Reserves (EIR): A day-ahead means to ensure energy to cover any “gap” between forecast consumer demand the next day and the supplies scheduled from both fossil and forecasted renewable resources
Focusing on Energy Security
32
2 In development 2020–2021: Develop a new, seasonal forward market auction that awards
competitive, resource-neutral forward contracts to reduce both investors’ and consumers’ risks
of achieving any combination of more reliable energy supplies or longer-term (multimonth)
energy-storage arrangements.
Designing and implementing long-term winter energy-security improvements is a large, complex, multiyear
project to develop the rules, complete quantitative and qualitative analyses on the design, and review
the details with stakeholders. After filing a proposal with FERC in April 2020 and awaiting its response,
implementing market administration processes and developing new software and IT systems is expected
to take another three to four years.
33
Focusing on the Future:
Sustaining a Power Grid that Can Reliably Support a Carbon-Free Economy and Society
34
35
Future Market Analyses: Thinking Even Longer TermIn 2019, the ISO received requests from the New England States Committee on
Electricity, New England Power Generators Association, and other participants, that
we dedicate time and staffing in 2020 and beyond to discuss potential future market
frameworks that will help them achieve their state decarbonization goals.
According to Energy Information Administration data, almost 75% of New England’s
GHG emissions come from the transportation sector and residential, commercial,
and industrial buildings, with the remaining 25% from the electricity sector. Regional
policymakers are considering which policy instruments will best incentivize New
Englanders to adopt electric vehicles and convert their homes and businesses to
electric heat.
As the region moves toward these goals, we must ensure that the wholesale
markets and regional planning process can bring to fruition a power system that
continuously and reliably supports the electrification of millions of vehicles, homes,
and buildings with low-to-no-carbon energy.
The New England power system will look very different in that future world, and the
“electrification of everything” raises important questions about where the region is
heading in the coming decades in terms of the overall architecture of the regional
power system and wholesale market structure. We are committed to working
with the states and industry stakeholders to evaluate how wholesale markets can
sustain a power grid that can reliably support decarbonization across New England’s
economy and society.
ISO-NE Strategic PlanningISO New England is guided by a purposeful and integrated business planning
approach to assist the organization in thinking strategically about the future and
drive focus toward a common target for years to come. Our strategic planning
framework aligns the organization’s purpose with measurable goals and objectives
that are a direct reflection of ongoing input from states and stakeholders. The
framework provides the foundation for the development of our annual work plans
and associated budgets.
The strategic plan provides clarity and focus for the company during this time of
change. As the region moves along its decarbonization journey, ISO New England’s
goal is to collaborate with the New England states and industry stakeholders to
ensure that competitive markets and reliability stay aligned and keep pace with
environmental policies and rapid technological changes.
Discussions with the states on the future of New England’s market framework are
included as part of our 2020 Annual Work Plan (www.iso-ne.com/work-plan).
35
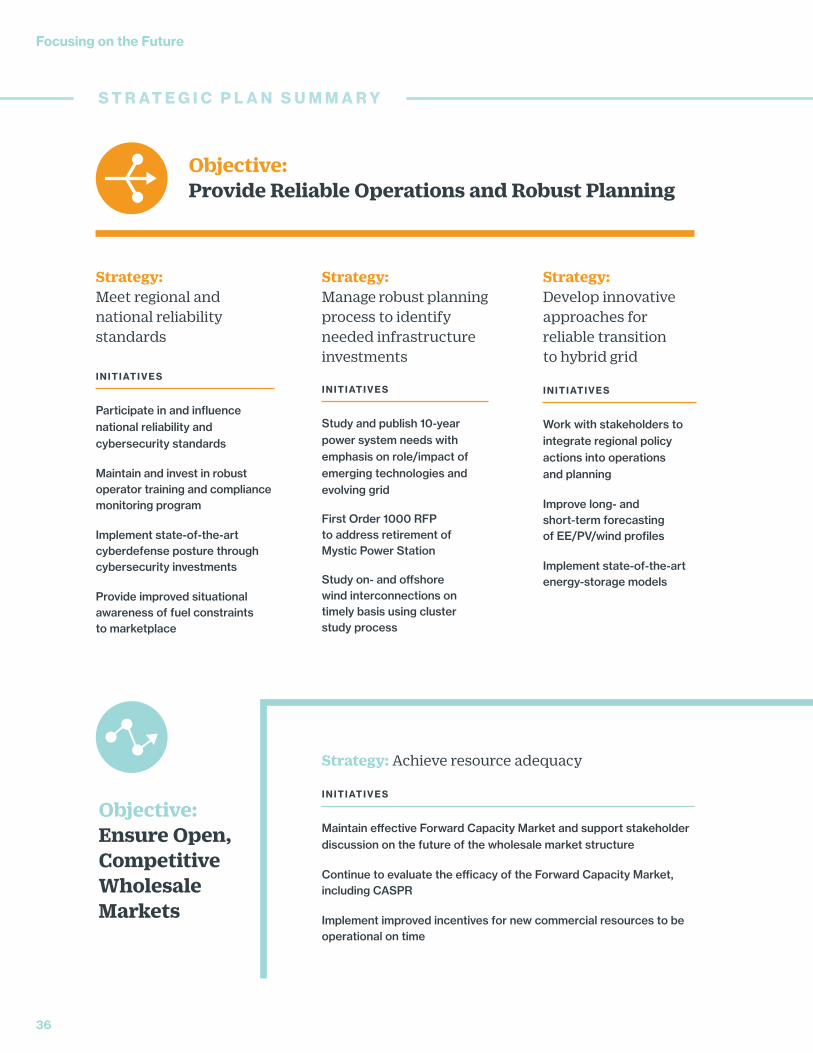
Strategy: Achieve resource adequacy
INITIATIVES
Maintain effective Forward Capacity Market and support stakeholder discussion on the future of the wholesale market structure
Continue to evaluate the efficacy of the Forward Capacity Market, including CASPR
Implement improved incentives for new commercial resources to be operational on time
Objective:Ensure Open, Competitive Wholesale Markets
S T R A T E G I C P L A N S U M M A R Y
Strategy: Manage robust planning process to identify needed infrastructure investments
INITIATIVES
Study and publish 10-year power system needs with emphasis on role/impact of emerging technologies and evolving grid
First Order 1000 RFP to address retirement of Mystic Power Station
Study on- and offshore wind interconnections on timely basis using cluster study process
Objective:Provide Reliable Operations and Robust Planning
Strategy: Meet regional and national reliability standards
INITIATIVES
Participate in and influence national reliability and cybersecurity standards
Maintain and invest in robust operator training and compliance monitoring program
Implement state-of-the-art cyberdefense posture through cybersecurity investments
Provide improved situational awareness of fuel constraints to marketplace
Strategy: Develop innovative approaches for reliable transition to hybrid grid
INITIATIVES
Work with stakeholders to integrate regional policy actions into operations and planning
Improve long- and short-term forecasting of EE/PV/wind profiles
Implement state-of-the-art energy-storage models
Focusing on the Future
36
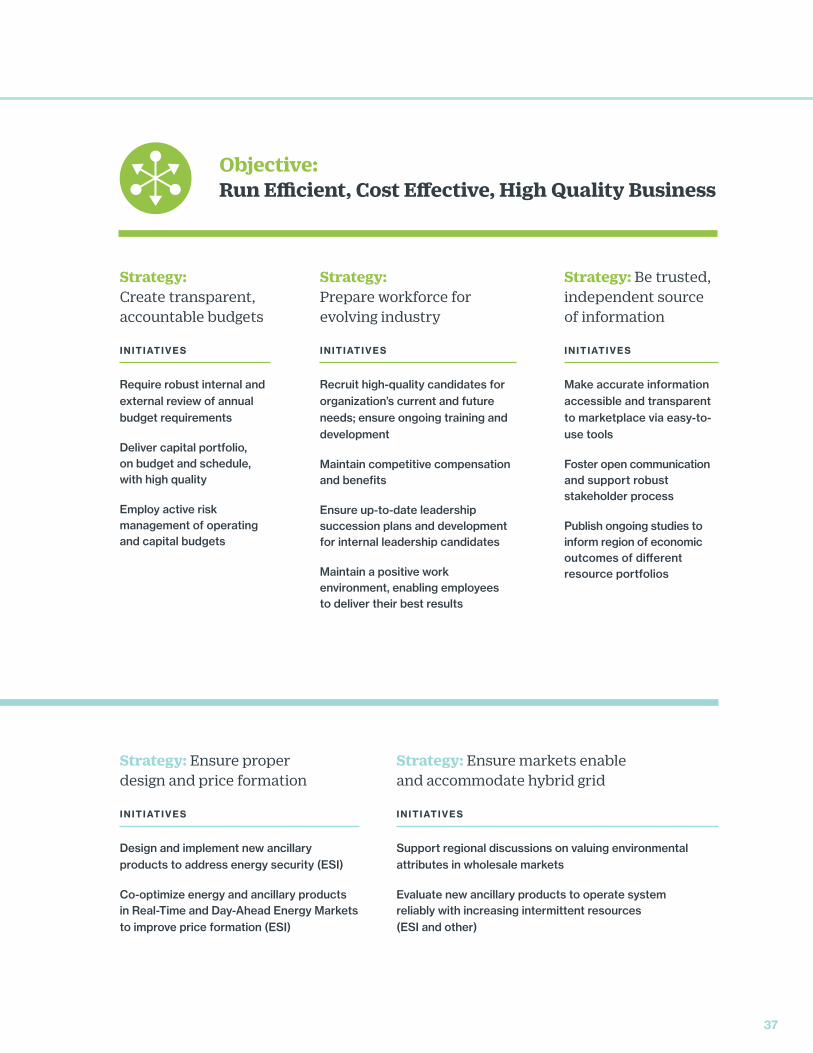
Strategy: Ensure proper design and price formation
INITIATIVES
Design and implement new ancillary products to address energy security (ESI)
Co-optimize energy and ancillary products in Real-Time and Day-Ahead Energy Markets to improve price formation (ESI)
Strategy: Ensure markets enable and accommodate hybrid grid
INITIATIVES
Support regional discussions on valuing environmental attributes in wholesale markets
Evaluate new ancillary products to operate system reliably with increasing intermittent resources (ESI and other)
Strategy: Be trusted, independent source of information
INITIATIVES
Make accurate information accessible and transparent to marketplace via easy-to-use tools
Foster open communication and support robust stakeholder process
Publish ongoing studies to inform region of economic outcomes of different resource portfolios
Strategy: Create transparent, accountable budgets
INITIATIVES
Require robust internal and external review of annual budget requirements
Deliver capital portfolio, on budget and schedule, with high quality
Employ active risk management of operating and capital budgets
Strategy: Prepare workforce for evolving industry
INITIATIVES
Recruit high-quality candidates for organization’s current and future needs; ensure ongoing training and development
Maintain competitive compensation and benefits
Ensure up-to-date leadership succession plans and development for internal leadership candidates
Maintain a positive work environment, enabling employees to deliver their best results
Objective:Run Efficient, Cost Effective, High Quality Business
37
ISO Metrics:
Measuring ISO New England’s Performance, Accountability, and Transparency
97% SatisfactionThe latest survey of market participants
(2019) revealed high overall satisfaction
levels with the information and services
the ISO provides. Positive satisfaction
among respondents with an opinion was
97%. Responses help the ISO identify
and prioritize improvements in system
operations, market administration, the
website, and other information products.
Accountability and Transparency
$1.01 per MonthThe services and benefits the ISO provides to keep
competitively priced power flowing will cost the average
New England residential electricity consumer $1.01 per
month in 2020, based on 750 kilowatt-hours per month
usage. The ISO’s 2020 operating budget is $201.7 million,
which is $3.7 million more than 2019, or a 1.9% increase.
This includes $1.3 million of special purpose funds for work
related to FERC Order 1000, which, if underutilized, will be
returned in a following year. Other increases are for funding (other
than to maintain current operations): cybersecurity, NERC Critical Infrastructure Protection (CIP) compliance, and energy security market improvements. The FERC-approved budget is the result of a robust stakeholder
discussion to set priorities. Full financial statements are available at www.iso-ne.com/about.
38
70+ Stakeholder MeetingsThe ISO’s stakeholders are a wide-ranging group, from market participants
to regulators to policymakers to environmental advocates and retail consumers. Their diverse perspectives help inform discussions and generate
solutions to regional challenges and ensure a collaborative process in the
administration of New England’s wholesale electricity markets and power
system. Changes to the ISO New England Inc. Transmission, Markets, and
Services Tariff and associated procedures, which govern the administration
of the region’s wholesale electricity markets and the operation of the bulk
power system, are all vetted through the New England Power Pool (NEPOOL)
stakeholder process. Stakeholders also interact regularly with ISO staff and
participate in committees and working groups. In 2019, the ISO coordinated
or participated in 73 meetings of the Markets, Reliability, Transmission, and
Participants Committees and the Planning Advisory Committee (PAC). The
Consumer Liaison Group (CLG) also met quarterly to share information about
the power system and wholesale electricity markets’ impacts on consumers.
The PAC and CLG are open to the public, while the rules governing NEPOOL,
the association of regional market participants, determines attendance for
the other committees.
9,600 Issues ResolvedThe ISO has a strong culture of responsiveness and outreach
to keep market participants and other stakeholders well
informed. In 2019:
n ISO Customer Support resolved over
9,600 issues submitted via phone call,
email, and Ask ISO self-service.
n We held classroom or web-conference trainings for
over 800 stakeholders and made over 79 e-learning
modules and 163 presentations available on the ISO
website for stakeholders.
n Our extensive website was accessed over 1.1 million
times by more than 350,000 unique visitors.
n ISO senior management, subject matter experts,
and other staff met well over 500 requests from
stakeholders and the media for presentations, panel
discussions, technical answers, and interviews.
39
2019 Improvements for a Better Stakeholder Experience
Forward Capacity Market Delayed Commercial Resource Treatment
This new monthly “failure-to-cover” charge
incentivizes market participants unable to fulfill
their capacity supply obligation to take action to
cover their obligation or assume a charge.
Annual Reconfiguration Transactions (ARTs)
ARTs were introduced to provide the equivalent
of a bilateral transfer of a capacity supply
obligation at a fixed price. By entering into an ART
and participating in an annual reconfiguration
auction, a capacity supplier can achieve price-
quantity assurance (to the extent the capacity is
substitutable) when either acquiring or shedding
an obligation.
Financial Transmission Rights— Balance of Planning Period
The FTR BoPP augments the FTR bidding
process by implementing multiple on-peak
and off-peak auctions for the months
remaining in the annual period. This provides
market participants with more opportunities
to configure their FTR portfolio.
New Software for Scheduling External Transactions
The 16-year-old Enhanced Energy Scheduling
software was replaced by the New England
External Transaction Tool (NEXTT), a new software
application for market participants to submit
external transactions in the Day-Ahead and Real-
Time Energy Markets. Numerous improvements
allow customers to better manage their external
transactions, with the tool being an important part
of the day-to-day operation of the electricity grid.
40
Cybersecurity to Protect the Grid and Marketplace
A successful cyberattack on ISO New England
would result in loss of control over critical IT
systems, jeopardizing the reliable operation
of the power system. The energy sector faces
significant risk of attempted cyberintrusion,
and the bulk power system is the only industry
subject to mandatory and enforceable
cybersecurity standards. Violation of the North
American Electric Reliability Corporation
(NERC) Critical Infrastructure Protection
standards can result in fines of up to $1 million
per violation per day.
The ISO continuously works internally and
with stakeholders and regulators to meet
evolving threats and build on our already
extensive 24/7 systems of process controls,
advanced detection and response, redundancy
in systems and control centers, and intensive
employee training. These help us detect,
respond to, and recover from any cyberattacks,
as well as to comply with mandatory standards.
And more than 100 employees participated
in GridEx V, hosted by NERC and designed to
exercise coordinated responses to cyber and
physical attacks.
The ISO’s cybersecurity initiatives for 2020 include:
n Enhancing network security and building a new
network to safeguard control center communications
n Complying with all NERC standards, including:
n CIP-012 (communications between control centers)n CIP-013 (supply chain risk management)
n Implementing an Identity and Access Management system that
automates and secures access to CIP and non-CIP assets and, going
forward, will serve as a foundation for the ISO’s cybersecurity program
41

1.
7.
10.
3.
6.5.
9.8.
2.
4.
1. Kathleen AbernathyBoard Chair
2. Gordon van WeliePresident and Chief Executive Officer
3. Brook Colangelo
4. Michael J. Curran
5. Roberto R. Denis
6. Cheryl LaFleur
7. Barney Rush
8. Philip N. Shapiro
9. Vickie VanZandt
10. Christopher Wilson
ISO Board of Directorsas of January 2020
42

1.
7.
10. 11.
3.
6.5.
9.8.
2.
4.
1. Gordon van WeliePresident and Chief Executive Officer
2. Vamsi ChadalavadaExecutive Vice President and Chief Operating Officer
3. Jamshid A. AfnanVice President, Information and Cyber Security Services
4. Peter T. BrandienVice President, System Operations and Market Administration
5. Janice S. DicksteinVice President, Human Resources
6. Robert EthierVice President, System Planning
7. Anne C. GeorgeVice President, External Affairs and Corporate Communications
8. Maria GulluniVice President, General Counsel, and Corporate Secretary
9. Mark KarlVice President, Market Development and Settlements
10. Robert C. LudlowVice President and Chief Financial and Compliance Officer
11. Jeffrey McDonaldVice President, Market Monitoring
ISO Senior Managementas of January 2020
43
The ISO was established to ensure that a not-for-profit, independent organization with no financial stake in the energy industry would design and administer New England’s competitive wholesale electricity markets and guide the development of a reliable and efficient power grid.
The ISO is the regional energy expert in power system operations, wholesale electricity market design and development, and power system planning.
ISO New England delivers value to the region by being a stable presence in a changing and challenging industry.
For more than 20 years, ISO New England has been an effective manager, with proven experience and expertise to handle evolving industry challenges.
The ISO recognizes the environmental policy imperative within the region and is working hard to facilitate the integration of renewable energy while continuously ensuring that electric power reliability is delivered through competitive wholesale markets.
ISO New England is synonymous with innovation. The ISO will continue to innovate advances in markets, operations, and planning as the region transitions to a low-to-no carbon power grid that will be used to electrify millions of vehicles and building heating systems across the region.
The ISO successfully collaborates with market participants and regulatory commissions and is committed to working with the states to ensure that wholesale markets can bring to fruition a power grid that reliably supports decarbonization across New England’s economy and society.
A B O U T I S O N E W E N G L A N D
isoexpress.iso-ne.com isonewswire.comiso-ne.com iso-ne.com/isotogo @isonewengland