Monthly Market Outlook May 2020
113
1 Monthly Market Outlook May 2020
Transcript of Monthly Market Outlook May 2020

1
Monthly Market Outlook May 2020

2

3
Medical Crisis
Financial Crisis
Real Life Crisis
Past Financial Crisis
Unprecedented Times
Past Medical Crisis
SARSAvian influenzaEbolaZika
Harshad Mehta ScamAsian CrisisKetan Parekh ScamSubprime CrisisTaper TantrumDemonetization
3

4 4

5
Sector impact - Revenue Significantly Impacted but Costs continue
• Agricultural Produce• Telecom• FMCG• Food Processing • Online Education• Seeds & Fertilisers• Sugar
• Auto Ancillaries• Consumer Durables• Housing Finance Companies• Automobile OEMs• Logistics• Power• Electronics• Banks• Engineering• Mining• Real Estate ( Residential)• Financial Services• Healthcare &
Pharmaceuticals
• Aviation• Hotels & Tourism• Gems & Jewellery• Multiplexes• Microfinance Institution• Textiles ( Cotton Spinning)• Ports & Seafood• MSME• Retailing
Agility in running business to see through near term without loosing sight of the opportunities in the medium to long term
Please click here for our Sectoral Update Report – March 2020
Low Medium High

6
Economic Implication Of Lockdown
Description In $ ( Approximate)GDP $ 3000 Bn Monthly GDP Loss(a) 100% $ 250 Bn(a) 50% $ 125 Bn+ Cost of restart 45 Days Lockdown ( Assuming 50% activity is shut) $ 190 Bn + Cost of restartSavings Correction in Oil Prices $ 40 - 45 Bn Trade Deficit with China $ 20 Bn
Net Cost $ 130 Bn + Cost of restart
Approximately $130 Bn cost and economy restarting cost could be managed through Fiscal Stimulus + Monetary Stimulus + Foreign Direct Investment
Source: Internal Calculations

7
Nonetheless, India Has Low Leverage Risk Among EM’s
Selected Emerging economies ranked on four measures of financial strength
Source: EIU , JP Morgan , ishares , Economist , Central Banks

8
How The World Responded To Covid-19
Source: Oxford COVID-19 Government response tracker
Data as on 27th April 2020
Stringency index developed at the university of oxford scores the response by the Indian government to combat COVID-19 as ‘100’

9
Current Situation On Coronavirus Treatments Or Vaccines
86 Covid-19 vaccine under development

10
Likely Recovery Scenario
Medical Solution
Low
High V Shaped recovery L Shaped recovery
Reality will be between V and L
Fiscal &
Monetary stimulus
Early Late

11
Benefits for India Economy
Lower Oil Prices
Lower trade deficit with China
Fiscal Stimulus
Monetary Stimulus
- RBI rate cut – credit flow to economy could begin
Higher capital allocation from Global investors
FPI flows due to MSCI & FTSE
FDI through supply chain
Lower Global Interest Rates & Higher Liquidity can bring more capital allocation to India
Supply chain disruption companies coming from China to India

Global Crude Oil Prices Fall Due To COVID-19 Concerns
23.7
10
20
30
40
50
60
70
80
Apr-19 May-19 Jun-19 Jul-19 Aug-19 Sep-19 Oct-19 Nov-19 Dec-19 Jan-20 Feb-20 Mar-20 Apr-20
Source: Bloomberg. Data as on 30th April 202012

13
Trade Deficit With China will reduce (~20 bn)
0
11
29
4547
52
58
0
10
20
30
40
50
60
70
2001 2008 2012 2015 2016 2017 2018
Trade Deficit with China ($ bn)
Source: Elara Securities

14
RBI Rate Cut – Credit Flow To Economy Will Begin
Source: Economic Times

15
RBI Takes Measures To Reduce The Cost Of Borrowings And Enhance Liquidity Into The System
Source: RBI, Spark Capital Research
Net liquidity in the system stood at Rs. 7.4 tn as of 29th Apr 20 10-year G-sec yield stood at 6.12% as of Apr’20The yield curve has been steepening led by excess liquidity in the system and fiscal pressure
RBI cuts the reserve repo rate by 25 bps from 3.75% in Apr’20 to 4% in Mar’20
CRR has been cut by 100 bps to 3% of NDTL in Mar’20 from the 4% earlier`
MCLR has increased by 5 bps to 8% in Mar’20 from 7.95% in Feb’20

16
Possible Fiscal Measures To Help Revive Economy
Support to Poor
Credit Guarantee Schemes to insure lending to business
Increase working capital limit for business
Capitalization of banking system
Increased spending on Infrastructure
Tax cuts to spur consumption
Trade off between reviving growth, rating downgrade and ability to raise resources to determine extent of fiscal stimulus

17
Central Bank Stimulus Has Eased Financial Stress To A Great Extent
Source: Bloomberg
Extraordinary central bank stimulus has eased financial stresses
The ECB’s balance sheet growsFed Balance Sheet tops $6tn for 1st time
6.7
0.0
1.0
2.0
3.0
4.0
5.0
6.0
7.0
No
v-0
5
No
v-0
6
Dec
-07
Dec
-08
Dec
-09
Jan
-11
Jan
-12
Jan
-13
Feb
-14
Feb
-15
Mar
-16
Mar
-17
Mar
-18
Ap
r-1
9
Ap
r-2
0
US Condition of All FederalReserve Banks Total Assets
($tn)
5347
0
1000
2000
3000
4000
5000
6000
Ap
r-0
6
Ap
r-0
7
Ap
r-0
8
Ap
r-0
9
Ap
r-1
0
Ap
r-1
1
Ap
r-1
2
Ap
r-1
3
Ap
r-1
4
Ap
r-1
5
Ap
r-1
6
Ap
r-1
7
Ap
r-1
8
Ap
r-1
9
Ap
r-2
0
Asset purchase programme has expanded massively
(Eur bn)
18
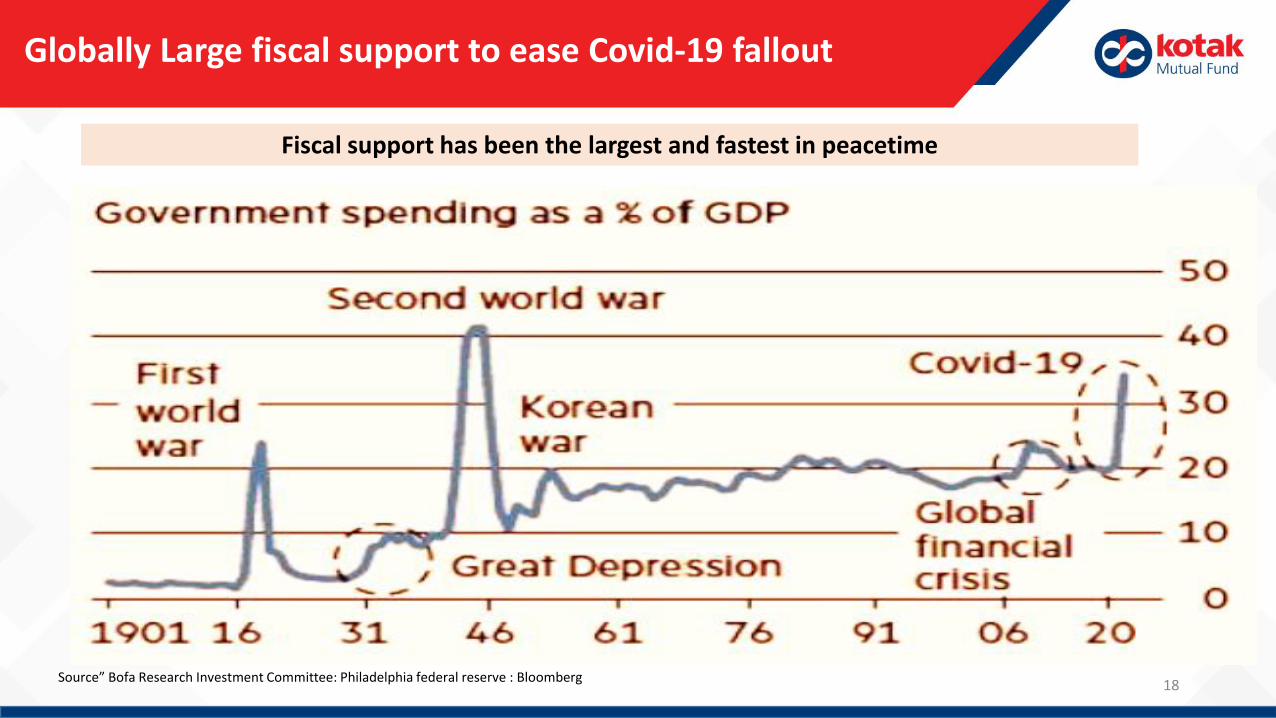
Globally Large fiscal support to ease Covid-19 fallout
Fiscal support has been the largest and fastest in peacetime
Source” Bofa Research Investment Committee: Philadelphia federal reserve : Bloomberg

19
Governments And Central Banks Are Taking Actions To Support The Economy Amid Downside Risks From Covid-19
Source: Kotak Institutional Equities

20
Governments And Central Banks Are Taking Actions To Support The Economy Amid Downside Risks From Covid-19..
Source: Kotak Institutional Equities

21
Indian Exporters Of Chemicals, Engineering Goods, And Marine Products Will Benefit The Most From The Coronavirus Outbreak
Source: Economic Times

22
Exit China Enter India ?
Negative views on China continue to grow in US

23
Recovery Path Ahead Post Lockdown -Lessons From China
China discretionary spend post lockdown remains at sub 50% levels
Source: Eagle Alpha; Chinese transport ministry; Marine Traffic; STR; Economist

24
Valuation
25
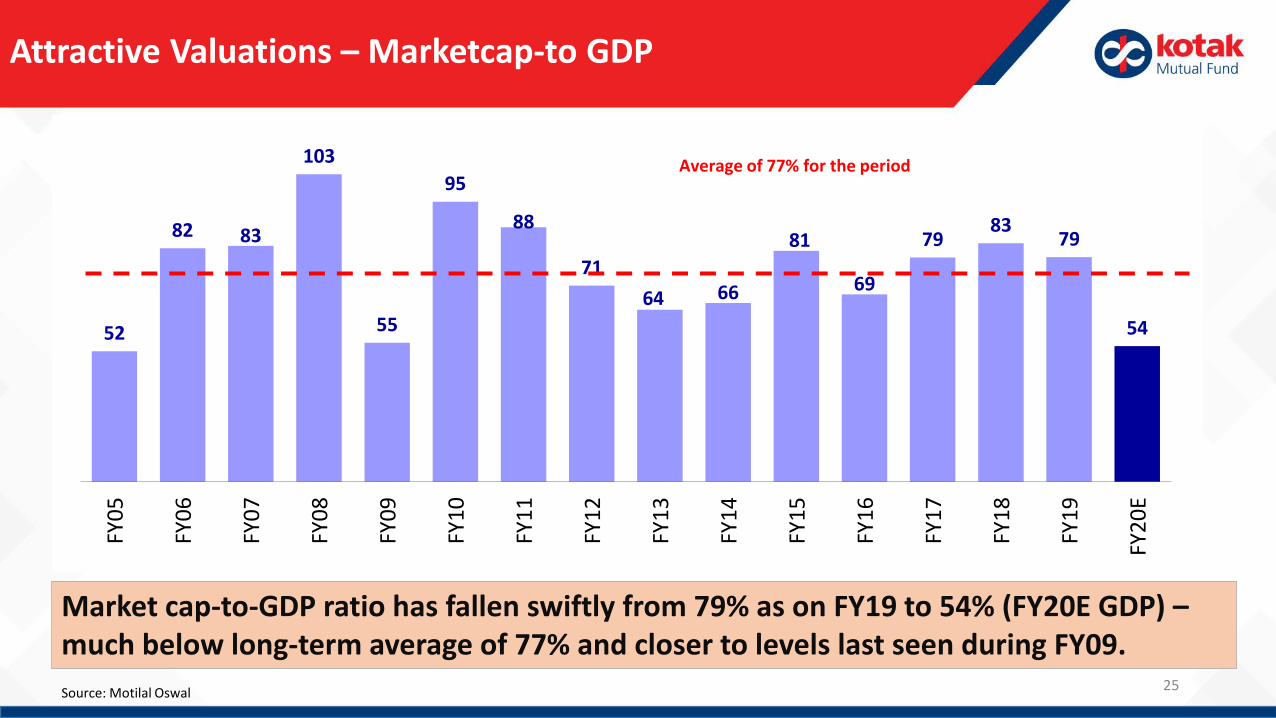
Attractive Valuations – Marketcap-to GDP
Source: Motilal Oswal
Market cap-to-GDP ratio has fallen swiftly from 79% as on FY19 to 54% (FY20E GDP) –much below long-term average of 77% and closer to levels last seen during FY09.
52
82 83
103
55
95
88
71
64 66
81
69
7983
79
54
FY0
5
FY0
6
FY0
7
FY0
8
FY0
9
FY1
0
FY1
1
FY1
2
FY1
3
FY1
4
FY1
5
FY1
6
FY1
7
FY1
8
FY1
9
FY2
0E
Average of 77% for the period

26
Attractive Valuations – P/B
NIFTY P/B (x) - 1 Year Forward NIFTY P/B (x) – Trailing
At 2.4x, the Nifty 12-month trailing P/B is well below the historical average of 3.0x.
At 2.2x, the Nifty 12-month forward P/B is also well below thehistorical average of 2.6x
Source: Motilal Oswal
2.4
1.5
2.5
3.5
4.5
5.5
Ap
r-0
5
Ap
r-0
6
Ap
r-0
7
Ap
r-0
8
Ap
r-0
9
Ap
r-1
0
Ap
r-1
1
Ap
r-1
2
Ap
r-1
3
Ap
r-1
4
Ap
r-1
5
Ap
r-1
6
Ap
r-1
7
Ap
r-1
8
Ap
r-1
9
Ap
r-2
0
Average: 3x
2.2
1.5
2.3
3.0
3.8
4.5
Ap
r-0
5
Ap
r-0
6
Ap
r-0
7
Ap
r-0
8
Ap
r-0
9
Ap
r-1
0
Ap
r-1
1
Ap
r-1
2
Ap
r-1
3
Ap
r-1
4
Ap
r-1
5
Ap
r-1
6
Ap
r-1
7
Ap
r-1
8
Ap
r-1
9
Ap
r-2
0
Average: 2.6x

27
Attractive Valuations – P/B
Source: Bloomberg, Internal Calculations
% of Top 1000 stocks by market cap trading below 1x P/B
74%
49%41%
43%
36%
0%
10%
20%
30%
40%
50%
60%
70%
80%
Apr 00 Apr 02 Apr 04 Apr 06 Apr 08 Apr 10 Apr 12 Apr 14 Apr 16 Apr 18 Apr 20

28
Equity Markets Are Doing A Time Travel To Past
Source: Capital Line , Internal Calculations
9860
13502
4078
0
5000
10000
15000
20000
25000
Ap
r-0
8
Jul-
08
Oct
-08
Jan
-09
Ap
r-0
9
Jul-
09
Oct
-09
Jan
-10
Ap
r-1
0
Jul-
10
Oct
-10
Jan
-11
Ap
r-1
1
Jul-
11
Oct
-11
Jan
-12
Ap
r-1
2
Jul-
12
Oct
-12
Jan
-13
Ap
r-1
3
Jul-
13
Oct
-13
Jan
-14
Ap
r-1
4
Jul-
14
Oct
-14
Jan
-15
Ap
r-1
5
Jul-
15
Oct
-15
Jan
-16
Ap
r-1
6
Jul-
16
Oct
-16
Jan
-17
Ap
r-1
7
Jul-
17
Oct
-17
Jan
-18
Ap
r-1
8
Jul-
18
Oct
-18
Jan
-19
Ap
r-1
9
Jul-
19
Oct
-19
Jan
-20
Ap
r-2
0
Nifty 50 Nifty Midcap 100 Nifty Smallcap 100
Nifty50 at 2017 levelsNifty Midcap100 at 2015 LevelsNifty Smalcap100 at 2010 Levels

Market Performance
29

Market Snapshot
Source: Axis Capital , Bloomberg,
Dec-07 May-13 Apr-20 Dec-07 May-13 Apr-20
Macro Indicators 10-Year Govt Bond Yield
Capacity Utilisation (Dec 19) 91.7% 71.6% (Jun-13) 68.6% India 7.8% 7.2% 6.1%
Credit Growth (as on Mar 20) 22.0% 14.4% 6.1% USA 4.0% 2.1% 0.6%
ROE Nifty 50 (Apr 20) 25.5% 17.1% (Mar-13) 14.0% Japan 1.5% 0.9% 0.0%
Net FII Flows (12M - Rs. Cr – Apr 20) 71,952 125,110 -21,015 Europe 4.3% 1.5% -0.6%
IIP – Feb 20 13.5% 1.0% 4.5% China 4.5% 3.4% 2.5%
GDP Growth (Oct – Dec 19) 9.6% 6.4% 4.7%
Dec-07 May-13 Apr-20 Dec-07 May-13 Apr-20
Valuations Returns of Nifty 50 (CAGR)
Trailing P/E Nifty 50 27.6 18.0 22.4 Last 1 Yr Return 54.8% 21.6% -16.1%
Trailing P/B Nifty 50 6.4 3.2 2.8 Last 2 Yr Return 47.1% 3.8% -4.2%
Last 3 Yr Return 43.4% 5.6% 2.0%
30

*As on 30 April 2020, Source: Axis Capital, Bloomberg, Past Performance may or may not sustain in the future
Performance Across Market Cap
31

32
Gauge To View Market Sentiment
15
46
54
49
40 1 0 0
2
54
9
0
40
29
13
3
23
48
36
66
40
40 0 0
36
21 22
63
5
0 0
65
47
81
40 0 0 0 0 0 0
13
57
7
0 00
10
20
30
40
50
60
70
80
90
2004 2005 2006 2007 2008 2009 2010 2011 2012 2013 2014 2015 2016 2017 2018 2019 2020
Nifty Index NSE Midcap 100 NSE Smallcap 100
Number of New All Time Highs
Source: Axis Capital

Drawdown from 52 Week HighNo. of Stocks
% of Top 1000
stocks
Less than 10% 40 4%
Between 10% and 20% 66 7%
Between 20% and 30% 128 13%
Between 30% and 50% 427 43%
More than 50% 328 34%
Median Correction from 52 Week High by Market Cap
Top 10 -20%
10 to 100 -30%
100 to 500 -39%
500 to 1000 -48%
Overall : Top 1000 -28%
Small And Mid Cap Corrected Significantly
Source: Axis Capital, Bloomberg, As on 30 April2 020 33
Drawdown fromDrawdown from
52 week highDrawdown
from Jan 2018
Nifty 50 -21% -11%
Nifty Midcap 100 -27% -35%
Nifty Smallcap 100 -39% -54%

34
FPI Flows Trend May Reverse - Post MSCI And FTSE Russel Index Rejig
Source: Morgan Stanley
MSCI + FTSE India Potential Passive Inflow of US$6.4 bn this year
Possible index impact for FTSE is likely in June 2020 and MSCI is likely in August 2020
Earliest possible flows impact ( US$ bn)
Jun-20 Aug-20 Sep-20 Nov-20 Dec-20 Total
MSCI - net - 3.09 - 0.51 - 3.6
FTSE - net 2.16 - 0.6 - 0.04 2.8
Total - net 2.16 3.09 0.6 0.51 0.04 6.4
MSCI - gross - 5.09 - 0.51 - 5.6
FTSE - gross 2.66 - 0.60 - 0.04 3.26
Total - gross 2.66 5.09 0.60 0.51 0.04 8.86
Time to Be Over Weight on Equities in staggered manner
35

36
Buying Into The Mayhem Made Sense In The Past
Source: Motilal Oswal & Internal analysis
Past performance may or may not be sustained in future
Nifty50 Performance (%)
Date (MM-YY) Peak Trough Peak to Trough +1M +3M +6M +12M
Jun 96 -Dec 96 13/06/1996 04/12/1996 -33% 18% 42% 35% 28%
Aug97-Jan 98 05/08/1997 29/01/1998 -26% 13% 22% -3% 3%
Apr98-Nov 98 02/04/1998 28/11/1998 -30% 9% 16% 35% 73%
Feb 00-May 2000 11/02/2000 23/05/2000 -30% 22% 12% 1% -4%
Feb 01-Sep 01 15/02/2001 21/09/2001 -40% 14% 24% 35% 14%
Jan04-May 04 14/01/2004 17/05/2004 -30% 8% 15% 35% 43%
May06-June 06 10/05/2006 14/06/2006 -30% 19% 29% 46% 58%
Jan 08-Oct 08 08/01/2008 27/10/2008 -60% 9% 6% 38% 92%
Nov 10-Dec 11 05/11/2010 20/12/2011 -28% 10% 16% 13% 30%
May- Aug 2013 17/05/2013 28/08/2013 -15% 10% 15% 17% 51%
Mar 15 to Feb 16 03/03/2015 25/02/2016 -23% 11% 14% 24% 28%
Aug 18 to Oct 18 28/08/2018 26/10/2018 -15% 5% 8% 17% 15%
Jan 20 to Mar 20 14/01/2020 23/03/2020 -38% 22% ? ? ?

37
Earlier Epidemics Such As SARS, EBOLA And ZICA Does Suggest That Medical Science Will Find Out A Solution Sooner Than Later
Source : Bloomberg , Mint Research and Intrenal Calculations
Do Not Convert Notional Loss To Real Loss
Virus OutbreakEstimated Period of
OutbreakReturns during
Outbreak1-Year return post
outbreak
SARS Jan to Mar 2003 -10.07 83.38
Avian influenza Jan to Aug 2004 -12.23 50.33
Ebola Dec 2013 to Feb 2014 1.58 39.02
Zika Nov 2015 to Feb 2016 -13.14 24.14
Covid-19 14 Jan 20 to 23 Mar 20 -38.44 ?
38
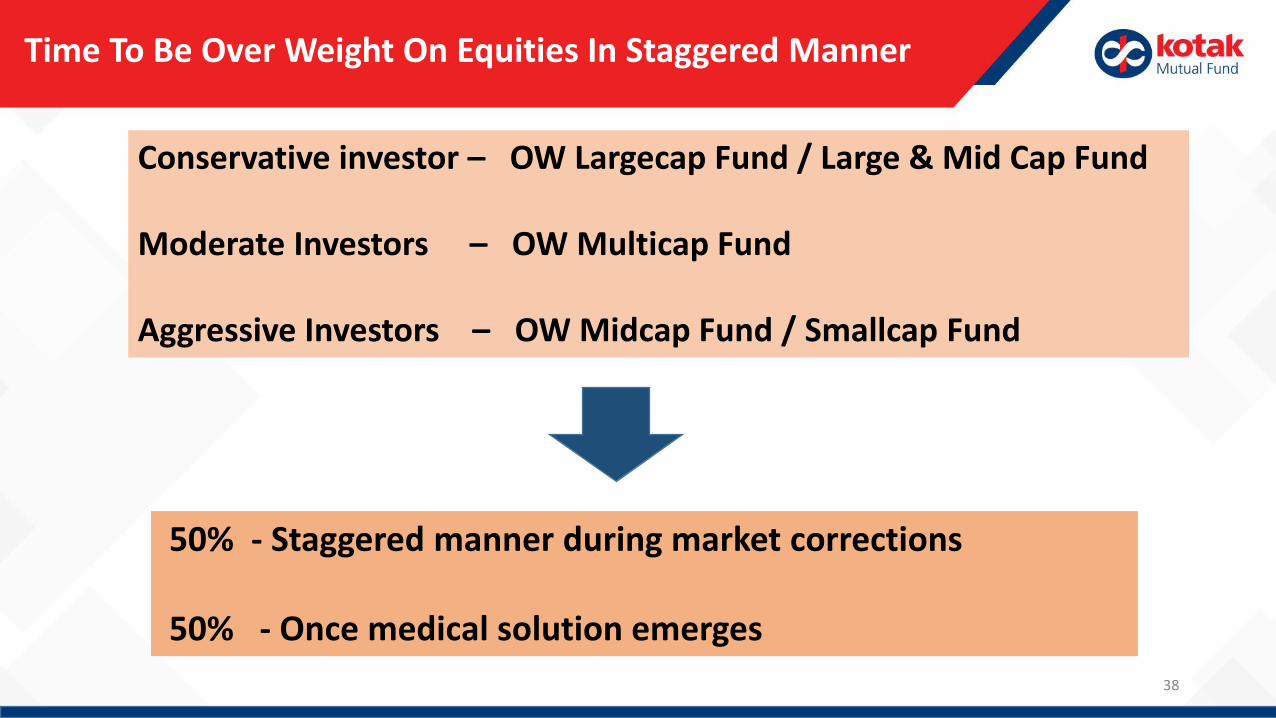
Time To Be Over Weight On Equities In Staggered Manner
Conservative investor – OW Largecap Fund / Large & Mid Cap Fund
Moderate Investors – OW Multicap Fund
Aggressive Investors – OW Midcap Fund / Smallcap Fund
50% - Staggered manner during market corrections
50% - Once medical solution emerges

Equity Hybrid Fund
Largecap Fund
Multicap Fund
Midcap Fund
Smallcap Fund
Time To Play On Front Foot ( Cautiously)
39Mutual Fund investments are subject to market risks, read all scheme related documents carefully. Please consult your financial advisor or investment professional for investment decisions.
Time To Notch Up The Risk Appetite One At A Time

• It has been our long ongoing call that Mid & Small Cap category positioned better in terms of valuation over Large Cap
• With the recent Coronavirus scare, some of the valuations in Mid & Small cap has become more attractive, both in relation to the largecaps and vis-à-vis its own historical average.
• Thus, a portfolio with a mix exposure of large & mid is better suited to gain from this upside than an only large cap portfolio.
• For an investor with a moderately high risk appetite, one can choose to invest in:
• Kotak Equity Opportunities Fund - Large & Mid Cap Fund - An open ended equity scheme investing in both large cap and mid cap stocks
• Kotak Equity Opportunities Fund has increased its exposure in mid-cap category to take advantage of attractive valuations
Latest Valuation Estimates Nifty 50 Nifty Midcap 50
Price to Book Ratio 2.38 1.53Price to Sales Ratio 1.73 1.34
Price Earnings Ratio (P/E) 19.42 21.65
Historical Valuation Average* Nifty 50 Nifty Midcap 50
Price to Book Ratio 2.60 1.86
Price to Sales Ratio 1.96 1.64
Price Earnings Ratio (P/E) 21.91 27.09
* Average of last 10 years data until Feb 2020Source: Bloomberg
Market Correction Provides Opportunity to Upgrade from Largecap to Large & Midcap
Date Large Cap Mid Cap Small Cap
Apr-20 46.61% 42.08% 4%
Mar-20 46.90% 41.42% 4.45%
Source: MFi Explorer51
40

41
Is It Time To Switch From Value/Contra Category To Mid & Small?
Market Size of Two Categories (Rs in Cr as of Mar 2020)Net Inflows in the mutual Fund Category (in Rs Cr as of Mar 20)
Old investments are Flowing Out of Contra-Value Segment. Midcap & Small-cap segment may provide an alternative for this money
Data Source: Morningstar.

Kotak Balanced Advantage Fund – Asset AllocationEpisodes in last 21 months where we have demonstrated discipline and agility
Kotak Balanced Advantage Fund benefitted by investing when cheap and selling when expensive. Thus, when Nifty was flat, asset allocation helped earn returns.
Source: Internal Analysis. As on 30th April 2020. Disclaimer: Past Performance is not a guarantee for future return. Mutual fund investments are subject to market risks, read all scheme related documents carefully. Please refer to slide number 106, 107 and 108 for detailed performance of the fund. . Please click here for performance disclaimers
42
84
101
60
70
80
90
100
110
Nifty 50 Index Value( Rebased to100) K-BAF NAV (Rebased to 100)
K-BAF NAV (Rebased to 100)
Nifty 50 Index Value (Rebased to 100)
10198
1064111157
11597 11600
12053
7610.25
9859.9
51.2
35.8 34.6 29.9
48.9
37.9
79.0 74.0
20.0
30.0
40.0
50.0
60.0
70.0
80.0
90.0
7000
8000
9000
10000
11000
12000
Aug-18 Oct-18 Nov-18 Dec-18 Feb-19 Mar-19 Apr-19 Jun-19 Jul-19 Aug-19 Oct-19 Nov-19 Dec-19 Feb-20 Mar-20 Apr-20
Nifty 50 KBAF Net Equity
Nifty 50 Index Value (LHS)
K-BAF Net Equity (RHS)
42

Kotak Equity Arbitrage – Market Volatility May Help Performance Potential
• The roll spread (annualized) on the arbitrage book is approximately 5.40%. We have increased our proportion incash future Arbitrage to 70.86% as rollover spreads were better than average. The rest 29.14% of corpus is investedin FDs, debt and money market instruments.
• On the last day of April series, market-wide rollovers stands high at 90% (vs. average rollovers of 84% seen in lastthree series). Stock futures rollovers also stands high at 93% (vs. average rollovers of 88% seen in last three series).
• Going forward allocation to Arbitrage book may remain high as post the rate cuts arbitrage book may offer a betterreturn compared to debt.
• On the debt side, we continue to run a conservative portfolio as far as credit and duration are concerned. Investorsneed to analyze the debt component of arbitrage funds and evaluate if higher returns are a function of credit orduration risk.
43

30
61
0
10
20
30
40
50
60
70
Jan-0
0
Jan-0
1
Jan-0
2
Jan-0
3
Jan-0
4
Jan-0
5
Jan-0
6
Jan-0
7
Jan-0
8
Jan-0
9
Jan-1
0
Jan-1
1
Jan-1
2
Dec-1
2
Dec-1
3
Dec-1
4
Dec-1
5
Dec-1
6
Dec-1
7
Dec-1
8
Dec-1
9
SIPS stopped at Mkt Falls Simple SIP
Even with Assumption of Perfect Information, SIP Start-Stop Strategy may be Sub-optimal vis-à-vis Regular SIP
Regular SIP Investor Stopping SIP at FAlls
SIP amount 5000/- 5000/-
Total money invested through SIP 12,00,000 6,95,000
Amount saved by stopping SIP in market Falls N.A 5,05,000
Corpus at end of Dec-19 Rs 60.83 lakhs Rs 29.67 lakhs
Performance in XIRR (%) 14.29% 13.12%
There were 15 cycles market cycles when the index fell by 10% or more since 2000-19. Above assumes the Investors stops SIP at the cycle beginning and restarts at cycle bottom. 44

Volatile Market Conditions Impact Your SIP Returns In the Short-Term, Generally Over the Long-Term SIP investments deliver returns
Ups & Downs in the market helps to reduce the overall cost of SIP investments
For A SIP Investor, Volatility Is Your Friend
Please consult your financial advisor or other professionals before acting on any information in this communication.
Mutual Fund investments are subject to market risks, read all scheme related documents carefully.
45

Kotak Emerging Equity Fund SIP Returns
Source: MFi Explorer. As on 30 April 2020. Returns are for regular plan. Nifty Midcap 100 TRI is the benchmark for Kotak Emerging Equity FundDisclaimer: SIP is an optional feature offered by Kotak Mutual Fund. This feature does not in any way give assurance of the performance of any of the Funds of Kotak Mutual. Past performance may or may not be sustained in the future. The returns are calculated by XIRR approach assuming investment of Rs. 10,000/- on the 1st working day of every month. XIRR helps in calculating return on investments given an initial and final value and a series of cash inflows and outflows and taking the time of investment into consideration. Since inception returns are assumed to be starting from the beginning of the subsequent month from the date of inception. Please consult your financial advisor or other professionals before acting on any information in this communication. 46
Kotak Emerging Equity Apr-19 May-19 Jun-19 Jul-19 Aug-19 Sep-19 Oct-19 Nov-19 Dec-19 Jan-20 Feb-20 Mar-20 Apr-20
10 Yr 16.59 16.78 16.46 14.71 14.37 15.25 15.63 15.81 15.74 16.77 15.67 9.24 11.38
7 Yr 17.15 17.50 16.94 14.24 13.62 14.85 15.33 15.53 15.33 16.81 15.06 5.29 8.31
5 yr 10.76 11.06 10.25 6.50 5.73 7.69 8.52 8.97 8.88 11.19 8.89 -4.54 0.16
3 yr 5.21 6.34 5.38 -0.41 -1.13 2.53 4.31 5.38 5.28 9.10 5.26 -16.04 -8.23
1 yr 2.31 9.04 8.37 -6.96 -6.68 6.33 11.66 14.23 13.93 26.63 13.16 -41.26 -21.05
Benchmark Apr-19 May-19 Jun-19 Jul-19 Aug-19 Sep-19 Oct-19 Nov-19 Dec-19 Jan-20 Feb-20 Mar-20 Apr-20
10 Yr 12.50 12.60 12.09 9.97 9.50 9.77 10.52 10.81 10.52 11.34 9.91 2.89 5.56
7 Yr 12.88 13.18 12.35 9.19 8.43 8.76 9.83 10.20 9.70 10.87 8.67 -1.76 2.03
5 yr 7.98 8.28 7.19 2.83 1.88 2.57 4.20 4.87 4.32 6.11 3.17 -11.05 -5.43
3 yr 2.39 3.25 1.47 -5.49 -6.64 -5.17 -2.13 -0.74 -1.56 1.39 -3.33 -24.95 -15.87
1 yr -4.93 1.10 -1.65 -18.41 -18.53 -11.19 -1.38 3.44 2.42 13.11 -0.97 -51.01 -28.60
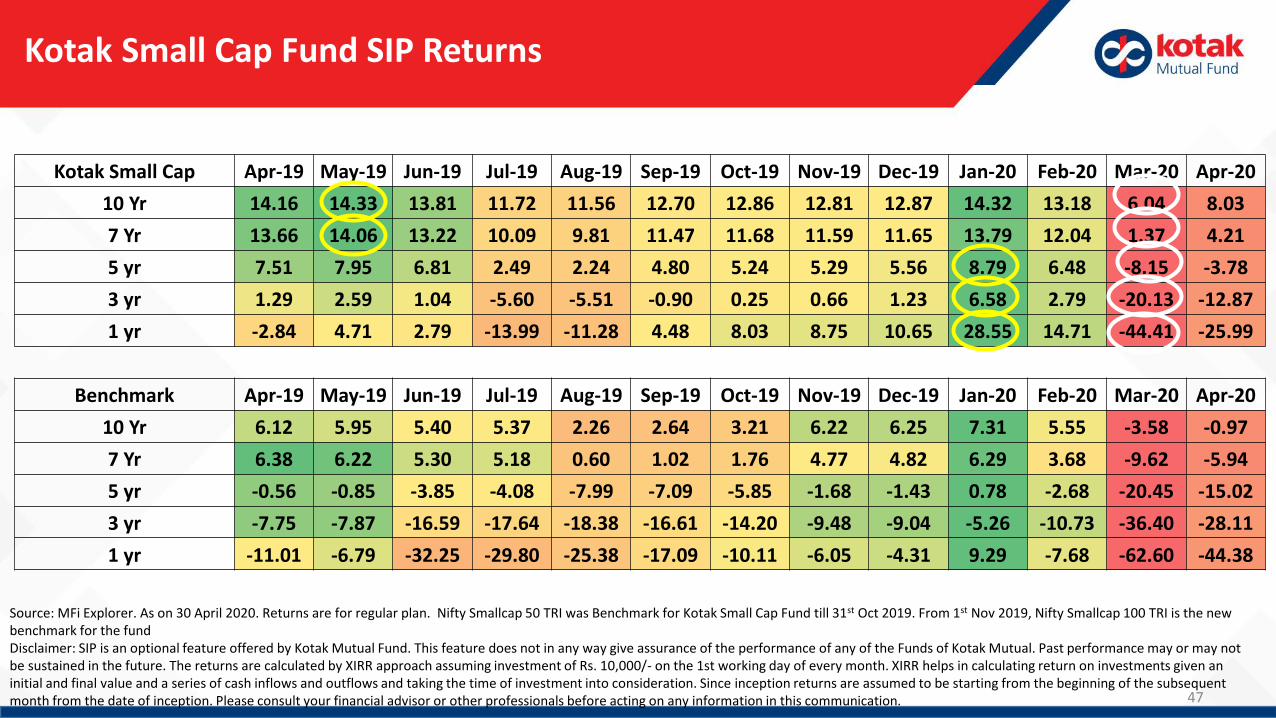
Kotak Small Cap Fund SIP Returns
Source: MFi Explorer. As on 30 April 2020. Returns are for regular plan. Nifty Smallcap 50 TRI was Benchmark for Kotak Small Cap Fund till 31st Oct 2019. From 1st Nov 2019, Nifty Smallcap 100 TRI is the new benchmark for the fundDisclaimer: SIP is an optional feature offered by Kotak Mutual Fund. This feature does not in any way give assurance of the performance of any of the Funds of Kotak Mutual. Past performance may or may not be sustained in the future. The returns are calculated by XIRR approach assuming investment of Rs. 10,000/- on the 1st working day of every month. XIRR helps in calculating return on investments given an initial and final value and a series of cash inflows and outflows and taking the time of investment into consideration. Since inception returns are assumed to be starting from the beginning of the subsequent month from the date of inception. Please consult your financial advisor or other professionals before acting on any information in this communication. 47
Kotak Small Cap Apr-19 May-19 Jun-19 Jul-19 Aug-19 Sep-19 Oct-19 Nov-19 Dec-19 Jan-20 Feb-20 Mar-20 Apr-20
10 Yr 14.16 14.33 13.81 11.72 11.56 12.70 12.86 12.81 12.87 14.32 13.18 6.04 8.03
7 Yr 13.66 14.06 13.22 10.09 9.81 11.47 11.68 11.59 11.65 13.79 12.04 1.37 4.21
5 yr 7.51 7.95 6.81 2.49 2.24 4.80 5.24 5.29 5.56 8.79 6.48 -8.15 -3.78
3 yr 1.29 2.59 1.04 -5.60 -5.51 -0.90 0.25 0.66 1.23 6.58 2.79 -20.13 -12.87
1 yr -2.84 4.71 2.79 -13.99 -11.28 4.48 8.03 8.75 10.65 28.55 14.71 -44.41 -25.99
Benchmark Apr-19 May-19 Jun-19 Jul-19 Aug-19 Sep-19 Oct-19 Nov-19 Dec-19 Jan-20 Feb-20 Mar-20 Apr-20
10 Yr 6.12 5.95 5.40 5.37 2.26 2.64 3.21 6.22 6.25 7.31 5.55 -3.58 -0.97
7 Yr 6.38 6.22 5.30 5.18 0.60 1.02 1.76 4.77 4.82 6.29 3.68 -9.62 -5.94
5 yr -0.56 -0.85 -3.85 -4.08 -7.99 -7.09 -5.85 -1.68 -1.43 0.78 -2.68 -20.45 -15.02
3 yr -7.75 -7.87 -16.59 -17.64 -18.38 -16.61 -14.20 -9.48 -9.04 -5.26 -10.73 -36.40 -28.11
1 yr -11.01 -6.79 -32.25 -29.80 -25.38 -17.09 -10.11 -6.05 -4.31 9.29 -7.68 -62.60 -44.38

Kotak Equity Opportunities Fund SIP Returns
Source: MFi Explorer. As on 30 April 2020. Returns are for regular plan. Nifty 200 TRI is the benchmark for Kotak Equity Opportunities FundDisclaimer: SIP is an optional feature offered by Kotak Mutual Fund. This feature does not in any way give assurance of the performance of any of the Funds of Kotak Mutual. Past performance may or may not be sustained in the future. The returns are calculated by XIRR approach assuming investment of Rs. 10,000/- on the 1st working day of every month. XIRR helps in calculating return on investments given an initial and final value and a series of cash inflows and outflows and taking the time of investment into consideration. Since inception returns are assumed to be starting from the beginning of the subsequent month from the date of inception. Please consult your financial advisor or other professionals before acting on any information in this communication. 48
Kotak Equity Opportunities
Apr-19 May-19 Jun-19 Jul-19 Aug-19 Sep-19 Oct-19 Nov-19 Dec-19 Jan-20 Feb-20 Mar-20 Apr-20
10 Yr 13.64 13.72 13.18 11.96 11.76 12.36 12.80 13.07 13.15 13.71 12.42 7.09 9.26
7 Yr 14.46 14.63 13.70 11.80 11.41 12.23 12.80 13.14 13.18 13.93 11.92 3.91 7.00
5 yr 11.36 11.53 10.30 7.67 7.21 8.55 9.48 10.11 10.32 11.54 8.85 -2.20 2.49
3 yr 9.55 10.02 7.92 3.60 3.07 5.49 7.24 8.38 8.58 10.47 5.82 -12.05 -4.31
1 yr 12.24 15.51 10.16 -1.69 -1.32 7.66 13.03 15.73 16.31 22.39 7.20 -37.53 -16.86
Benchmark Apr-19 May-19 Jun-19 Jul-19 Aug-19 Sep-19 Oct-19 Nov-19 Dec-19 Jan-20 Feb-20 Mar-20 Apr-20
10 Yr 12.22 12.26 11.91 10.60 10.36 10.93 11.52 11.61 11.57 11.29 9.92 4.66 7.20
7 Yr 13.23 13.33 12.68 10.67 10.22 10.98 11.78 11.87 11.73 11.25 9.15 1.34 4.99
5 yr 11.46 11.59 10.79 8.04 7.53 8.82 10.07 10.35 10.29 9.69 6.86 -3.91 1.47
3 yr 11.68 11.83 10.31 5.51 4.69 6.85 8.94 9.26 8.83 7.51 2.56 -14.70 -6.02
1 yr 10.29 12.44 8.75 -4.04 -4.17 4.45 11.66 12.40 11.89 8.82 -4.78 -43.76 -21.21

Kotak Standard Multicap Fund SIP Returns
Source: MFi Explorer. As on 30 April 2020. Returns are for regular plan. Nifty 200 TRI is the benchmark for Kotak Standard Multicap FundDisclaimer: SIP is an optional feature offered by Kotak Mutual Fund. This feature does not in any way give assurance of the performance of any of the Funds of Kotak Mutual. Past performance may or may not be sustained in the future. The returns are calculated by XIRR approach assuming investment of Rs. 10,000/- on the 1st working day of every month. XIRR helps in calculating return on investments given an initial and final value and a series of cash inflows and outflows and taking the time of investment into consideration. Since inception returns are assumed to be starting from the beginning of the subsequent month from the date of inception. Please consult your financial advisor or other professionals before acting on any information in this communication. 49
Kotak Standard Multicap
Apr-19 May-19 Jun-19 Jul-19 Aug-19 Sep-19 Oct-19 Nov-19 Dec-19 Jan-20 Feb-20 Mar-20 Apr-20
10 Yr NA NA NA NA NA 14.43 14.80 14.90 14.78 14.81 13.53 8.10 10.20
7 Yr 16.47 16.97 16.14 13.97 13.41 14.31 14.76 14.84 14.54 14.50 12.50 4.31 7.31
5 yr 13.01 13.66 12.58 9.57 8.88 10.38 11.16 11.45 11.22 11.33 8.70 -2.56 2.02
3 yr 11.51 12.81 10.97 5.97 5.06 7.76 9.24 9.76 9.18 9.16 4.62 -13.46 -5.92
1 yr 12.77 18.36 13.52 -0.52 -1.10 8.90 13.69 14.67 13.18 13.62 0.14 -42.26 -22.50
Benchmark Apr-19 May-19 Jun-19 Jul-19 Aug-19 Sep-19 Oct-19 Nov-19 Dec-19 Jan-20 Feb-20 Mar-20 Apr-20
10 Yr 12.22 12.26 11.91 10.60 10.36 10.93 11.52 11.61 11.57 11.29 9.92 4.66 7.20
7 Yr 13.23 13.33 12.68 10.67 10.22 10.98 11.78 11.87 11.73 11.25 9.15 1.34 4.99
5 yr 11.46 11.59 10.79 8.04 7.53 8.82 10.07 10.35 10.29 9.69 6.86 -3.91 1.47
3 yr 11.68 11.83 10.31 5.51 4.69 6.85 8.94 9.26 8.83 7.51 2.56 -14.70 -6.02
1 yr 10.29 12.44 8.75 -4.04 -4.17 4.45 11.66 12.40 11.89 8.82 -4.78 -43.76 -21.21

Kotak Tax Saver Fund SIP Returns
Source: MFi Explorer. As on 30 April 2020. Returns are for regular plan. Nifty 500 TRI is the benchmark for Kotak Tax Saver FundDisclaimer: SIP is an optional feature offered by Kotak Mutual Fund. This feature does not in any way give assurance of the performance of any of the Funds of Kotak Mutual. Past performance may or may not be sustained in the future. The returns are calculated by XIRR approach assuming investment of Rs. 10,000/- on the 1st working day of every month. XIRR helps in calculating return on investments given an initial and final value and a series of cash inflows and outflows and taking the time of investment into consideration. Since inception returns are assumed to be starting from the beginning of the subsequent month from the date of inception. Please consult your financial advisor or other professionals before acting on any information in this communication. 50
Kotak Tax Saver Apr-19 May-19 Jun-19 Jul-19 Aug-19 Sep-19 Oct-19 Nov-19 Dec-19 Jan-20 Feb-20 Mar-20 Apr-20
10 Yr 12.84 13.14 12.94 11.42 10.99 11.74 12.13 12.33 12.37 12.84 11.59 6.12 8.30
7 Yr 13.99 14.48 14.09 11.77 11.06 12.10 12.63 12.90 12.89 13.55 11.63 3.47 6.59
5 yr 11.32 11.89 11.35 8.04 7.04 8.64 9.43 9.92 10.03 11.06 8.46 -2.82 1.87
3 yr 10.16 11.32 10.42 4.90 3.49 6.36 7.88 8.78 8.77 10.28 5.74 -12.52 -4.82
1 yr 13.78 18.82 16.53 0.18 -2.23 7.98 12.57 14.30 14.38 19.27 4.80 -39.77 -19.67
Benchmark Apr-19 May-19 Jun-19 Jul-19 Aug-19 Sep-19 Oct-19 Nov-19 Dec-19 Jan-20 Feb-20 Mar-20 Apr-20
10 Yr 12.18 12.23 11.83 10.45 10.20 10.80 11.37 11.46 11.42 11.27 9.92 4.52 7.03
7 Yr 13.19 13.30 12.58 10.47 10.01 10.81 11.59 11.67 11.54 11.24 9.16 1.14 4.74
5 yr 11.11 11.24 10.35 7.46 6.94 8.27 9.50 9.75 9.71 9.38 6.58 -4.47 0.84
3 yr 10.71 10.91 9.23 4.25 3.43 5.69 7.76 8.09 7.73 6.87 2.01 -15.61 -7.02
1 yr 8.86 11.44 7.56 -5.51 -5.51 3.50 10.63 11.43 11.16 9.53 -3.97 -44.09 -21.81

51
Should We Invest In Gold ?

Gold Corrected In 2008 From June To Sept 2008 And Than Rallied To Life Time High As Central Banks Cut Interest Rates And Pumped Liquidity
Gold correction
in 2008
Fall in Gold
prices
Life time High
Source: Bloomberg 52

53
Debt Market Outlook April 2020

54
Whatever It Takes From RBI– Measures Will Keep Coming Till Economy Stabilizes. Have Patience For Medicine To Work
Monetary Initiatives Measures Impact
Rate Cut75bps repo cut to 4.40%
Bring down short term yield starting from Sov and gradually gets transmitted to Credits, leading to spread compression
Cut the reverse repo rate by 115 bps to 3.75%Disincentive banks from parking the surplus liquidity with the RBI
TLTRO (1.0)Targeted long-term repo operations for securities up to three years for a total amount of Rs 1 lakh crore. These will be issued at a floating rate linked to the benchmark repo rate
This could help in offsetting in part the adverse impact of the fiscal slippage in the offing
TLTRO (2.0)
Conduct targeted long-term repo operations (TLTRO 2.0) for an aggregate amount of Rs500 bn in tranches of appropriate sizes. The funds availed by banks under TLTRO 2.0 should be invested in investment grade bonds, commercial paper, and non-convertible debentures of NBFCs, with atleast50% of the total amount availed going to small and mid-sized NBFCs and MFI
Very Positive for NBFC and MFI. This will create demand for assets thus arrest the sharp spike in yields. It will also create demand for other assets in credit markets but it takes time for demand response from banks.
Mutual Fund Liquidity Support
RBI to open Rs 50,000-cr special liquidity window to support mutual fundsHelp boost confidence and reduce volatility seen in corporate debt market
Operation Twist Rs. 10,000 cr operation twist announced on 28 April 2020
The sov curve has a tendency to steepen in such time and we have steepest curve 1 yr at 3.70% and 30 yr at 6.90%. This will help some flattening of the curve hence positive for duration investors.
Refinancing Facilities for All India Financial Institutions (AIFIs
Provide special refinance facilities for a total amount of Rs500 bn to NABARD, SIDBI and NHB to enable them to meet sectoral credit needs. Advances under this facility will be charged at the RBI’s policy repo rate at the time of availment
This will remove some supply of bonds from PSU category thereby will creates space for yields coming down.

55
Monetary Initiatives Measures Impact
CRR100 bps CRR cut to 3% for 1 year. Also, a 1- time dispensation - reduced the requirement of minimum daily CRR balance maintenance from 90% to 80%
Immediate infusion of liquidity into the banking system to help in rate transmission. Reduction to release liquidity worth Rs1.37 tn. Bring down short term yield starting from Sov and gradually gets transmitted to Credits leading to spread compression
Liquidity Coverage RatioReduced LCR requirement for Scheduled Commercial Banks from 100% to 80% with immediate effect
Pressure for managing balance sheet eases hence provides liquidity comfort at individual institution level
MSF
Accommodation of Marginal Standing Facility to be increased from 2% SLR to 3%. Banks can dip into their mandated pool of government securities or the ‘statutory liquidity ratio’ to borrow from the RBI’s marginal standing facility.
The ability of banks to obtain funds from RBI on MSF rate increases by as much. This will provide additional liquidity potential to the debt market. Allows banks to avail an additional Rs1.37 tn of liquidity under the LAF window in times of stress at the MSF rate
OMO Purchases Conducted OMO purchases worth Rs400 bnCreates demand for long bonds hence help rate transmission
USD-INR sell-buy swap Conducted US$4bn worth of USD-INR sell buy swap Providing dollar liquidity
WMA limit for the central govt
Increased the limits for Ways and Means Advances (WMA) for 1HFY21 to Rs1.2 tn (earlier Rs750 bn)
Govt can manage better as supply of bonds will ease in primary markt hence yields come down.
WMA limit for the state govt
Increased the limits for Ways and Means Advances (WMA) for states 1HFY21 by 60%
Govt can manage better as supply of bonds will ease in primary markt hence yields come down.
Whatever It Takes From RBI– Measures Will Keep Coming Till Economy Stabilizes. Have Patience For Medicine To Work

56
A Step Towards Inclusion of Indian Bonds in Global Indices
Measures To Attract FPI Investment Implication
RBI has opened a new window “Fully Accessible Route” wherein specified govt. securities shall be eligible for investment by foreign investors
• This will ease access of foreign investors to the Indian Bond Market and facilitate inclusion in global bond indices
• Indian Bond Market has a huge scope of incremental flows by FPIs. This will have a downward pressure on interest ratesIncreased FPI Limit For Corporate Bonds
• Increased FPI limits for corporate bonds to 15% from 9% for 2020-21
Source: RBI Documents
57
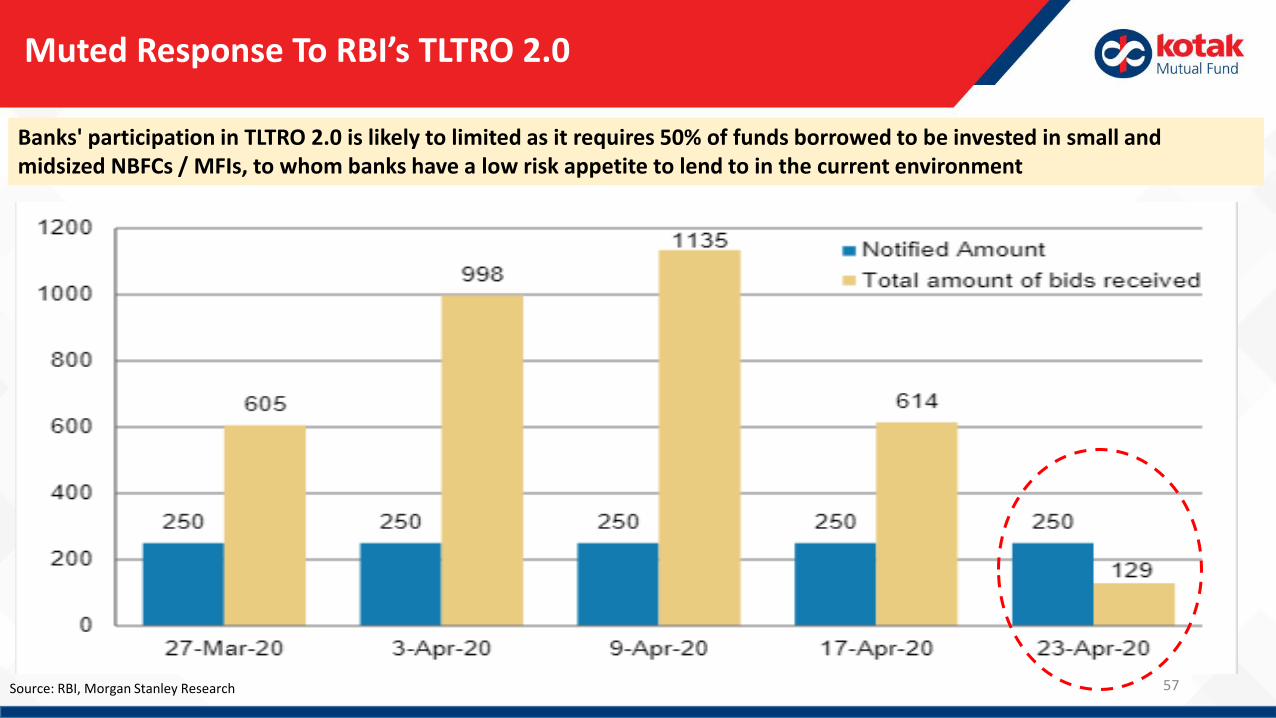
Muted Response To RBI’s TLTRO 2.0
Source: RBI, Morgan Stanley Research
Banks' participation in TLTRO 2.0 is likely to limited as it requires 50% of funds borrowed to be invested in small and midsized NBFCs / MFIs, to whom banks have a low risk appetite to lend to in the current environment

58
Hopes of More RBI Measures Leads To a Fall In 10 Year Gilt
Source: Bloomberg; Data as on 30 April 2020
6.31
6.11
6.00
6.10
6.20
6.30
6.40
6.50
6.60
3-A
pr-
20
4-A
pr-
20
5-A
pr-
20
6-A
pr-
20
7-A
pr-
20
8-A
pr-
20
9-A
pr-
20
10
-Ap
r-2
0
11
-Ap
r-2
0
12
-Ap
r-2
0
13
-Ap
r-2
0
14
-Ap
r-2
0
15
-Ap
r-2
0
16
-Ap
r-2
0
17
-Ap
r-2
0
18
-Ap
r-2
0
19
-Ap
r-2
0
20
-Ap
r-2
0
21
-Ap
r-2
0
22
-Ap
r-2
0
23
-Ap
r-2
0
24
-Ap
r-2
0
25
-Ap
r-2
0
26
-Ap
r-2
0
27
-Ap
r-2
0
28
-Ap
r-2
0
29
-Ap
r-2
0
30
-Ap
r-2
0
Disappointing April-Sept Borrowing Plan and weak demand expectation at auction
Headline Inflation eases to 5.91%
Hopes on the RBI to announce more steps such as open market purchases of dated securities and liquidity infusion to improve the transmission of interest rates,
Improved appetite for dated securities as the Reserve Bank of India set better-than-expected cutoffs at today's 200-bln-rupee debt sale
Anticipation Of Fiscal Stimulus
Hopes of more rounds of special open market operations by the Reserve Bank of India were offset by fears of fiscal slippage and additional market borrowing
RBI likely placed bids at the 200-bln-rupee auction boosted investor sentiment.

59
Super Surplus Liquidity In The System To Support The Economy
Inr Bn
Source: RBI, Data as on 30 April 2020
Liquidity Surplus is here to stay for longer than what market is pricing 5,035.83
(3,000.00)
(2,000.00)
(1,000.00)
-
1,000.00
2,000.00
3,000.00
4,000.00
5,000.00
6,000.00
Au
g-1
8
Sep
-18
Oct
-18
No
v-1
8
Dec
-18
Jan
-19
Feb
-19
Mar
-19
Ap
r-1
9
May
-19
Jun
-19
Jul-
19
Au
g-1
9
Sep
-19
Oct
-19
No
v-1
9
Dec
-19
Jan
-20
Feb
-20
Mar
-20
Ap
r-2
0
System Borrowing

Source: MOSPI, ICRA
• Consumer price inflation declined to 5.91% in Mar 2020, from 6.6% in Feb 2020
• Core inflation eased to 4.03% in Mar 2020, from 4.08% in Feb 2020
• Inflation in food and beverages segment softened to 7.82% in Mar 2020, from 9.45% in Feb 2020
• Urban CPI inflation softened to 5.66% in Mar 2020, from 6.7% in Feb 2020
• Rural CPI inflation declined to 6.09% in Mar 2020, from 6.7% in Feb 2020
Source: Bloomberg 60
CPI Inflation Eases To 5.91% In Mar 2020
5.91%
4.03%
0.0%
2.0%
4.0%
6.0%
8.0%
10.0%
12.0%
Oct-13 May-14 Dec-14 Jul-15 Feb-16 Sep-16 Apr-17 Nov-17 Jun-18 Jan-19 Aug-19 Mar-20
CPI Core CPI
61
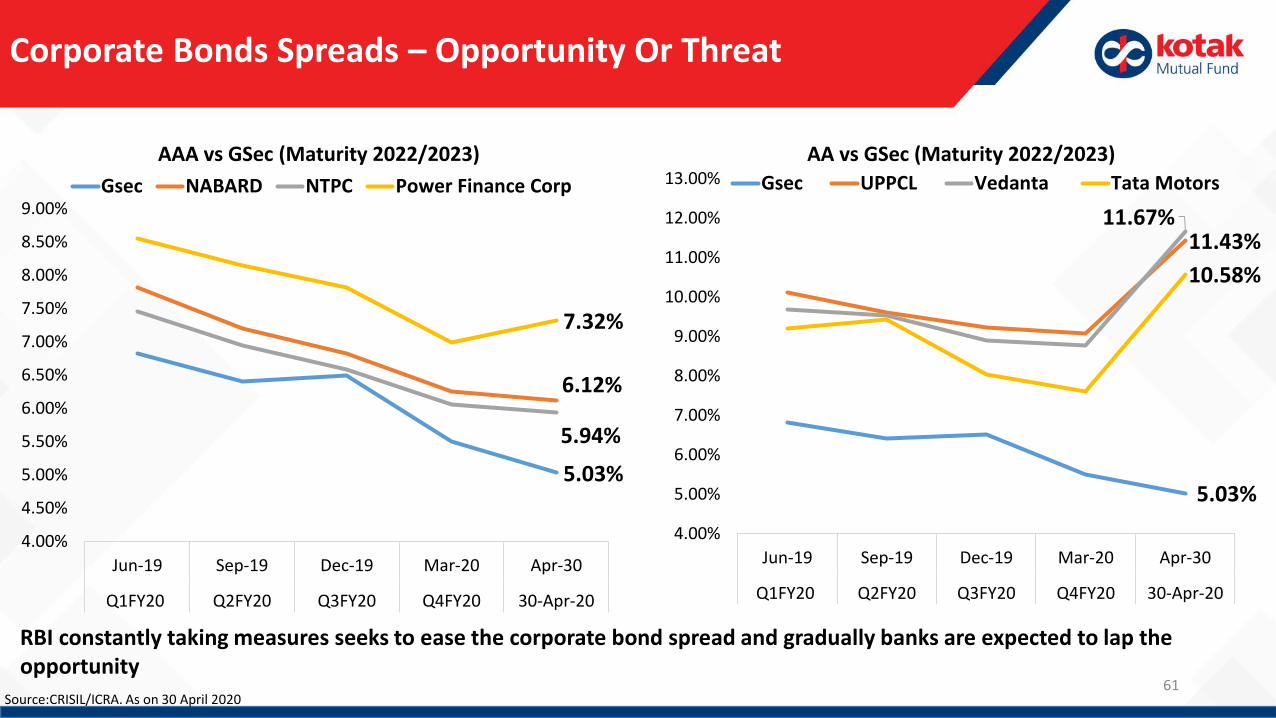
Corporate Bonds Spreads – Opportunity Or Threat
Source:CRISIL/ICRA. As on 30 April 2020
5.03%
6.12%
5.94%
7.32%
4.00%
4.50%
5.00%
5.50%
6.00%
6.50%
7.00%
7.50%
8.00%
8.50%
9.00%
Jun-19 Sep-19 Dec-19 Mar-20 Apr-30
Q1FY20 Q2FY20 Q3FY20 Q4FY20 30-Apr-20
AAA vs GSec (Maturity 2022/2023)
Gsec NABARD NTPC Power Finance Corp
5.03%
11.43%11.67%
10.58%
4.00%
5.00%
6.00%
7.00%
8.00%
9.00%
10.00%
11.00%
12.00%
13.00%
Jun-19 Sep-19 Dec-19 Mar-20 Apr-30
Q1FY20 Q2FY20 Q3FY20 Q4FY20 30-Apr-20
AA vs GSec (Maturity 2022/2023)
Gsec UPPCL Vedanta Tata Motors
RBI constantly taking measures seeks to ease the corporate bond spread and gradually banks are expected to lap the opportunity

62
Bank Perp Spread- Opportunity Or Threat
5.03%
12.63%
9.14%
12.64%
10.50%
4.00%
6.00%
8.00%
10.00%
12.00%
14.00%
Jun-19 Sep-19 Dec-19 Mar-20 Apr-30
Q1FY20 Q2FY20 Q3FY20 Q4FY20 30-Apr-20
Perpetual Bonds vs GSec (Call Date 2022/2023)
Gsec PNB SBI Union Bank Bank of Baroda
Source:CRISIL/ICRA. As on 30 April 2020
• When a bank buys a perp of other bank it means the bank is straight lending capital to other bank. Despite that, banks are queuing up to take this opportunity.
• Banks understand banks more than any one • Its often quoted “Don’t go by what they say, but watch what they do” • Almost all banks are buying these assets, this says some thing about the quality of the assets and future too.

63
FII Debt Flows
Source: Axis Capital, SEBI
Trend In Monthly FII Flows (Debt) – USD mn
(367)(1,158)
2,213
(846)
537 1,199 1,226
1,593
(274)
713
(442) (756)(1,494)
381
(8,680)
(1,129)
(10,500)
(9,000)
(7,500)
(6,000)
(4,500)
(3,000)
(1,500)
0
1,500
3,000
Jan
-19
Feb
-19
Mar
-19
Ap
r-1
9
May
-19
Jun
-19
Jul-
19
Au
g-1
9
Sep
-19
Oct
-19
No
v-1
9
Dec
-19
Jan
-20
Feb
-20
Mar
-20
Ap
r-2
0

Debt Outlook
64
• RBI Policy Measures were a reasonably strong boost in terms of action across the market.
• The falling commodity prices especially Brent and the bond rally globally will help lower Indian rates. This may reduce the trade deficit. However due to equityselloff INR will remain under pressure. However, this is manageable as RBI has enough reserves to fight the same.
• Govt has announced H1 borrowing programme of Rs 4.88 tn worth of bonds and Rs 3 tn T bill for Q1. This is on expected lines but given low tradingvolumes/risk appetite, it may find difficulty to absorb 20k of weekly duration supply.
• We need some strong Demand side measures for bonds more than 5 yr. However given over all global environment with zero and negative sovereign rates inworld major economies, India 30 yr bonds ~7.30% (currently at 6.80%~)and 12-15 SDL at 7.60-7.90% (Currently at 7.20-7.30%) may emerge as great valuecreator for the coming year
The large liquidity infusion and rate cut may lower short term rates.
The Cut in Small savings rate and low bank deposit rate may lead to chase for high yielding assets through flow in MF this may aid spread compression
Expect corporate bonds to now outperform government bonds as the spreads may ease in weeks ahead
We prefer low to mid duration strategies on risk adjusted basis.
SDL spreads are attractive bet at ~100-120 bps on a 10 year curve. We may see a good compression in these spreads over the year. Therefore investors whohave appetite for volatility and who are looking for duration gains, can look to invest in the Gilt and Bond Funds space.
We believe that opportunities in the 1-3yr yield curve space are a potent option for investors. For this reason, investors with 6 month plus investmenthorizon may consider investing in corporate bond space.
In the same vein, the investment opportunity in short duration bond funds, banking and PSU funds, credit funds and dynamically managed duration fundsis still present and becoming more attractive. Investors may look to invest in the funds depending on the scale of risk appetite and the investment horizon.
65
Kotak MF Mantra: ‘Return of Capital’ is more important than ‘Return on Capital’
Strong Promoters, Cashflow backed business, Liquidity, and Asset Security are key to our investment ideas

Rating & Category Breakup Across Kotak MF Debt Assets
Credit Rating % of Total AUM
Tbill/G-Sec/SDL/AAA/A1+/Cash/NCA 90.99%
AA+ 1.58%
AA 4.12%
AA- 1.52%
Below AA- 1.78%
Grand Total (AUM) (INR Cr) 82,305
Category Breakup% of Total
AUM
Non-Credit Risk Funds 95%
Credit Risk Funds 5%
Grand Total (AUM) (INR Cr) 82,305
Data As on 30 April 2020
• In these challenging times, we reassure you that we always follow our investment process of focussing on credit quality and liquidity profile of our debt funds and maintain high degree of transparency for investors. Debt Funds can be broadly divided in two categories -Credit Risk Funds and Non Credit Risk Funds.
• Kotak MF has zero borrowing across all our schemes as on 30 April 2020.
We reassure you that we always follow our investment process of focussing on credit quality and liquidity profile of our debt funds and maintain high degree of transparency for investors.
Mutual fund investment are subject to market risks, read all scheme related documents carefully. This communication isn't solicitation for investments and is only meant for Kotak MF’s distributors and investors
• Liquidity, Maturity profile and Credit quality for Non Credit Risk Funds which constitutes ~ 95% of our debt AUM as on April 30, 2020 is substantially superior to credit risk funds.
66

67
• Our Liquidity profile remains robust
We reassure you that we follow our investment process of focusing on credit quality and liquidity profile of our debt funds and maintain high degree of transparency for investor.
Mutual fund investments are subject to market risks, read all scheme related documents carefully.
Liquidity Position Of Kotak MF Debt Funds As on 30 April 2020
Scheme Category Name of Scheme% of AUM in AAA (Long Term) or A1+ (Short
Term), Sovereign Debt, Cash & NCANon-Credit Strategies
Liquid Fund Kotak Liquid Fund 100
Money Market Fund Kotak Money Market Fund 100
Corporate Bond Fund Kotak Corporate Bond Fund 100
Short Duration Fund Kotak Bond Short Term Fund 100
Ultra Short Duration Fund Kotak Savings Fund 87.05Dynamic Bond Fund Kotak Dynamic Bond Fund 84.96
Medium to Long Duration Fund Kotak Bond Fund 84.14Banking and PSU Fund Kotak Banking and PSU Debt Fund 78.93
Low Duration Fund Kotak Low Duration Fund 54.91
Credit Strategies Medium Duration Fund Kotak Medium Term Fund 49.63Credit Risk Fund Kotak Credit Risk Fund 26.58

68
Kotak MF Debt Funds Are Well Equipped To Meet Redemption Requirements & Contingencies
We request for rationality and level-headed approach. Our portfolios are well provided-for normal redemption
requirements, as also for some level of contingencies.
SEBI regulation allow borrowing up to 20% of net assets of a fund to meet redemption requirements. But when does a
fund need to borrow? - At times due to redemption pressure, yields rise so high that it is more sensible to borrow at
lower cost and meet the redemption rather than to sell.
Thankfully, none of our funds have had to borrow to meet redemptions currently. We do have multiple credit lines if
needed. This also shows the quality of our fund and its liquidity profile even in stressful times.
We have done stress test of our portfolio’s to see what is the level of portfolio that we will be able to liquate quickly
and meet redemptions without borrowing in a worst case scenario and the found it encouraging. The liquidity profile of
debt funds have been given in the end of this minutes.
Having said that we may endeavour to reward the patient investor and share risk with the panicky investor.
Thus, if we face high redemption requirements, then we may endeavour to sell low credit rating / high credit risk papers.
This way, early redeemers may have to exit at lower NAVs. Additionally, the incremental proceeds would be invested in higher quality assets. Thus patient investors will see their investment portfolio improve rather than deteriorate
Mutual fund investment are subject to market risks, read all scheme related documents carefully.

69
Kotak MF – Our Past Experience
In past, we had chosen to defer payment rather than have knee-jerk reaction and hurt investors’
interest. Case in point: the issue surrounding delayed payment from Essel group.
o Our six FMPs got affected due to this issue in 2019. Then, we chose to delay marginal redemption
amount, rather than exercise the stock selling of Essel.
o We coordinated with Essel to arrange both capital and late payment interest for our investors.
Had we sold stocks instead, then the under-realization would have resulted in irrecoverable loss
of investors.
o We believe we have a fire proof house. We have done fire drills regularly, but we still don’t want
to see even a spark fly.
In any case, investors’ interests will be primary
Mutual fund investment are subject to market risks, read all scheme related documents carefully.

70
Investment Opportunity

71
Reality Check – Emerging Trends
Market Factors Pre-COVID-19 Post-COVID-19
31-Jan-20 31-Mar-20 30-Apr-20
Liquidity (System Borrowing) (Inr Bn) 3409.64 4841.78 5035.83
Weighted Avg Overnight Rate (RBI) 4.56% 0.85% 3.30%
India 10 Year Gilt 6.60% 6.14% 6.11%
Corporate Bond AAA 3 Year 6.83% 6.54% 6.42%
NBFC AAA 3 Year 7.19% 7.24% 6.95%
Corporate Bond AA 3 Year 7.51% 7.19% 7.12%
Corporate Bond AA 1 Year 6.89% 6.48% 6.71%
US 10 Year Gilt 1.51% 0.67% 0.63%
• Yields have fallen sharply all across the markets i.e Overnight, OIS, G Sec, AAA while yields in short term credit has shot up significantly
• Due to recent event supply in secondary of sub AAA rated bonds in market has increase which has lead to sharp increase in yields of sub AAA credit assets in particular
• Owing to COVID-19 and Lockdown, markets have become thin and if supply of bonds increase sharply irrsepticve of the quality then yield spikes up significantly – trader misery is investor delight
• Surplus liquidity in the system has increased further indicating that it’s a matter of time for an increase in the demand for the assets
Source: RBI, Bloomberg

72
Yield Across The Segment – Sanity Will Prevail
3.94
4.73
6.41
7.12
3.50
4.50
5.50
6.50
7.50
8.50
9.50
May
-19
Jun
-19
Jul-
19
Au
g-1
9
Sep
-19
Oct
-19
No
v-1
9
Dec
-19
Jan
-20
Feb
-20
Mar
-20
Ap
r-2
0
3 Year OIS 3 Year G-Sec 3 Year AAA 3 Year AA
Fund YTM (As on 30 April 2020) Respective Segment YieldsIncremental Earnings%
(Spread)Kotak Banking & PSU Fund 7.13% 3 Year AAA 6.41% 0.72%Kotak Low Duration Fund 9.47% 1 Year OIS 3.94% 5.53%
Kotak Credit Risk Fund 11.16% 3 Year AA 7.12% 4.04%
Kotak Medium Term Fund 10.51% 3 Year AA 7.12% 3.39%
Source: Bloomberg. Data as on 30 April 2020. Past performance may or may not sustain in the future
Mutual fund investment are subject to market risks, read all scheme related documents carefully.

73
Kotak Low Duration Fund: Yield Valuation Matrix – More Attractive Now
• If overnight return is ~3.5% and OIS is telling us this will remain here for about 2-3 year
• YTM of Kotak Low Duration Fund is ~10% and the same is for Kotak Credit Risk Fund
• This implies interest income for this risk is almost 250%-300% more
• This was 20-50% a year back
• Rs. 1 cr investment will earn ~9-10 lac of income vs ~3.5-3.7 lac in overnight which is a good incentive to take advantage of all the volatility in between
• Hence it is just a matter of time the demand from banks will come for these assets
9.47
6.10
4
5
6
7
8
9
10
May
-19
Jun
-19
Jul-
19
Au
g-1
9
Sep
-19
Oct
-19
No
v-1
9
Dec
-19
Jan
-20
Feb
-20
Mar
-20
Ap
r-2
0
Kotak Low Duration Fund (YTM) vs 1 Year AAA
Kotak Low Duration Fund - Std - Growth
1 Year AAA
Source: Bloomberg, MFi Explorer. Data as on 30 April 2020
Mutual fund investment are subject to market risks, read all scheme related documents carefully.

74
Kotak Credit Risk & Kotak Medium Term Fund: Yield Valuation Matrix – More Attractive Now
• This is an investor market and it is time to take contra bets when trader is willing to give steep discount for liquidity• All regulators are taking measure to bring sanity and we need to take advantage of this anomaly created due to
impatience of others
9.08 8.71
11.16
2.05 1.88
4.75
0
2
4
6
8
10
12
Oct-19 Jan-20 Apr-20
Kotak Credit Risk Fund
Kotak Credit Risk Fund (YTM)
Spread (Kotak Credit Risk vs 3 Year AAA)
9.24 8.79
10.51
2.21
1.96
4.10
0
2
4
6
8
10
12
Oct-19 Jan-20 Apr-20
Kotak Medium Term Fund
Kotak Medium Term Fund(YTM)
Spread (Kotak Medium Term vs 3 year AAA)
Source: MFi Explorer, Bloomberg. Data as on 30 April 2020 Mutual fund investment are subject to market risks, read all scheme related documents carefully.

75
Our Credit Funds – Rating Profile
Rating Profile (% of AUM)
Mutual fund investment are subject to market risks, read all scheme related documents carefully.
Kotak Credit Risk Fund 30-Apr-20 15-Apr-20 31-Mar-20
AAA/Cash/NCA 26.57 25.67 29.32
AA/AA+ 33.69 31.45 29.75
AA- & Below 39.73 42.87 40.93
Kotak Medium Term Fund 30-Apr-20 15-Apr-20 31-Mar-20
AAA/A1+/Cash/NCA/Sov 49.63 47.59 51.04
AA/AA+ 22.29 29.00 26.84
AA- & Below 28.07 23.41 22.12
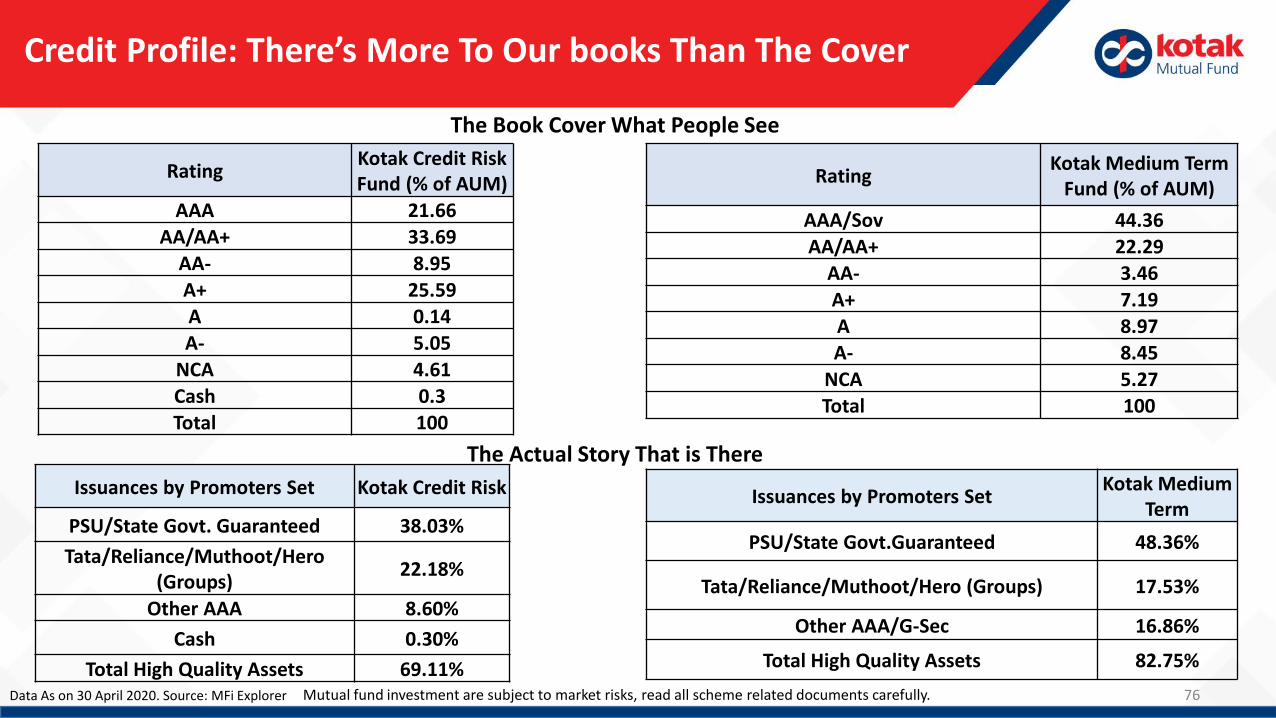
Credit Profile: There’s More To Our books Than The Cover
76
RatingKotak Credit Risk Fund (% of AUM)
AAA 21.66AA/AA+ 33.69
AA- 8.95A+ 25.59A 0.14A- 5.05
NCA 4.61
Cash 0.3Total 100
RatingKotak Medium Term
Fund (% of AUM)
AAA/Sov 44.36
AA/AA+ 22.29AA- 3.46
A+ 7.19A 8.97
A- 8.45NCA 5.27Total 100
Issuances by Promoters Set Kotak Credit Risk
PSU/State Govt. Guaranteed 38.03%
Tata/Reliance/Muthoot/Hero (Groups)
22.18%
Other AAA 8.60%
Cash 0.30%
Total High Quality Assets 69.11%
Issuances by Promoters SetKotak Medium
Term
PSU/State Govt.Guaranteed 48.36%
Tata/Reliance/Muthoot/Hero (Groups) 17.53%
Other AAA/G-Sec 16.86%
Total High Quality Assets 82.75%
The Book Cover What People See
The Actual Story That is There
Data As on 30 April 2020. Source: MFi Explorer Mutual fund investment are subject to market risks, read all scheme related documents carefully.

77
YTM At Elevated Levels Despite Better Rating Profile NowH
igh
Qu
alit
y A
sse
t A
s P
erc
en
tage
of
Po
rtfo
lio (
LHS)
Source: Internal Research; High Quality – Sov, A1+, AAA,AA+, & Cash.
YTM
Kotak Credit Risk Fund
29.15
11.16
8
8.5
9
9.5
10
10.5
11
11.5
5
10
15
20
25
30
35
40
45
50
Sep-1
8
Oct-1
8
No
v-18
Dec-1
8
Jan-1
9
Feb-1
9
Mar-1
9
Ap
r-19
May-1
9
Jun
-19
Jul-1
9
Au
g-19
Sep-1
9
Oct-1
9
No
v-19
Dec-1
9
Jan-2
0
Feb-2
0
Mar-2
0
Ap
r-20
High Quality (LHS) YTM (RHS)

78
Kotak Dynamic Bond Fund Has Outperformed Over Long-Term Since 2017
Credit funds carry credit risk and duration/ dynamic funds carry interest rate risk
Hence our advice to IFA/ distributors is that they allocate clients money in both dynamic and accrual funds from a 3 year
perspectiveSource: ICRA. As on 30th April 2020. The above returns is daily rolling returns for last 36months. Past Performance is not a guarantee for future return. Mutual fund investments are subject to market risks, read all scheme related documents carefully.

Liquid Funds
Ultra Short Term Debt Funds
Short Duration Funds
Credit Risk/Dynamic Debt/Medium Term
Long Duration Funds
Time To Play On Front Foot (Cautiously)
79Mutual Fund investments are subject to market risks, read all scheme related documents carefully. Please consult your financial advisor or investment professional for investment decisions.
Time To Notch Up The Risk Appetite One At A Time

80
Declining Trend In Net Redemptions in Credit Risk Funds
81
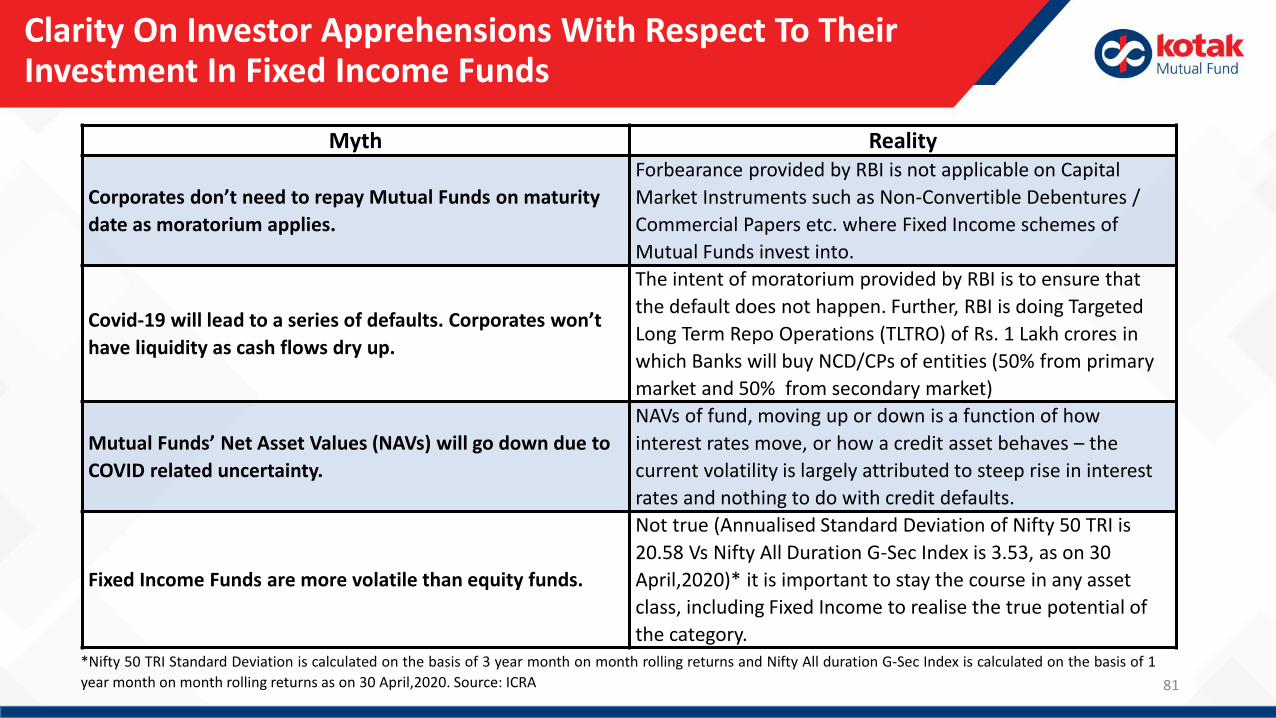
Clarity On Investor Apprehensions With Respect To Their Investment In Fixed Income Funds
Myth Reality
Corporates don’t need to repay Mutual Funds on maturity
date as moratorium applies.
Forbearance provided by RBI is not applicable on Capital
Market Instruments such as Non-Convertible Debentures /
Commercial Papers etc. where Fixed Income schemes of
Mutual Funds invest into.
Covid-19 will lead to a series of defaults. Corporates won’t
have liquidity as cash flows dry up.
The intent of moratorium provided by RBI is to ensure that
the default does not happen. Further, RBI is doing Targeted
Long Term Repo Operations (TLTRO) of Rs. 1 Lakh crores in
which Banks will buy NCD/CPs of entities (50% from primary
market and 50% from secondary market)
Mutual Funds’ Net Asset Values (NAVs) will go down due to
COVID related uncertainty.
NAVs of fund, moving up or down is a function of how
interest rates move, or how a credit asset behaves – the
current volatility is largely attributed to steep rise in interest
rates and nothing to do with credit defaults.
Fixed Income Funds are more volatile than equity funds.
Not true (Annualised Standard Deviation of Nifty 50 TRI is
20.58 Vs Nifty All Duration G-Sec Index is 3.53, as on 30
April,2020)* it is important to stay the course in any asset
class, including Fixed Income to realise the true potential of
the category.*Nifty 50 TRI Standard Deviation is calculated on the basis of 3 year month on month rolling returns and Nifty All duration G-Sec Index is calculated on the basis of 1
year month on month rolling returns as on 30 April,2020. Source: ICRA

Key Recommendations
Segment Scheme Rationale
Accrual
PlayKotak Credit Risk Fund /
Kotak Medium Term Fund
Investment for higher
accrual
Asset Allocation Kotak Debt Hybrid FundInvestment for asset
allocation
Short Term Parking of
Funds
Kotak Savings Fund / Kotak Low Duration Fund /
Kotak Corporate Bond Fund
Parking of surplus
cash
Kotak Equity Arbitrage Fund
Parking of surplus
cash with equity
taxation status
Duration Play
Kotak Dynamic Bond FundInvestment for Active
Duration Management
Kotak Bond Short Term FundInvestment for shorter
maturities
Kotak Bond FundInvestment for longer
maturities
82

ANNEXURES
83
84
SIP Pause Facility
Kotak Mutual Fund Offers SIP Pause Facility
• We understand in times like these, some of you might have a high liquidity requirement.
• There is NO NEED TO STOP THE SIP, you can PAUSE THE SIP for a particular period of time.
• Please note: SIP Pause facility would allow existing investor to ‘Pause’ their SIP for a specified periodof time i.e. Minimum 1 Month and Maximum 6 Months
Please consult your financial advisor or investment professional for investment decisions. Mutual Fund investments are subject to market risks, read all scheme related documents carefully.

SIP Pause and Cancellation Facility
85
SIP Pause or Cancellation facility is provided to Investors in their post login section of Kotak Mutual Fund App and
Website.
Steps to Pause SIP
Logon to Kotak Mutual fund Website/App
Choose SIP Pause option from Menu
Select the Folio number
Choose the SIP that you would like to pause
You can Pause your SIP for a Maximum period
of 6 Installments
Steps to Cancel SIP
Logon to Kotak Mutual fund Website/App
Choose Systematic Transaction from Menu
Choose Cancellation of Systematic registration
Choose Systematic Investment Plan
Select the mode of SIP (Online/Offline)
Choose the SIP that you would like to Cancel

Business Hub
An Initiative by Kotak Mutual Fund to Support Distributor's to Improve the efficiency in their Business
Logon to https://kotakmfadvisor.comKey Features of Business Hub Include
Initiate Transaction
Existing Investors
Lumpsum Switch Redeem SIP STP SWP
New Investors
Lumpsum SIP Zero Balance Folio
Business Opportunity
SIP Ceased
Inactive Investors
SIP Upcoming Maturity
Zero Balance Investor
Equity Only Investor
Debt Only Investor
ELSS Opportunity
Liquid Investor
And much more business data
86

87
Stay Home, Stay Safe And Learn From The Comfort Of Your Home With Prostart
Log on to www.kotakmfadvisor.com
VIEW ALL 10 VIDEOS Excel Based Financial Calculators on email PLUS
Course Completion Certificate
In case you are unable to log in kindly send a message to
Tejas Thakur (9619510328) – Kotak AMC.
“FINANCIAL PLANNING - VIDEO MODULE” was a grand success
VIEWERSHIP CROSSED 22,000+ 1500+ UNIQUE USERS 215+ CERTIFCATES AWARDED
Click here For Process of ProStart Video Learning Login
88
Debt Market Outlook – Mar 2020
Stay Updated ! Follow us at Kotak Mutual Fund Click here to visit our Youtube Channel
All About Kotak Tax SaverInvestor Education
Product VideoEquity Market Outlook – April 2020
Opportunity in Mid and Small cap spaceWhy invest in Small and Midcap fund now?

Key Variables & Their Impact On Equities
Key VariablesShort -term
Medium –term
Remarks
EconomyNear-term growth to get impacted due to Coronavirus scare, but many reforms like IBC, GST, RERA to improve longer term growth trajectory
Corporate Earnings
Near-term earning growth to get impacted. Strong medium term earning growth trajectory, as previous cycle of NPA ends and capacity utilization improves. Will also be aided by recent tax cuts
FII Flow
Flows to turn negative in short term. Strong long term growth as India stands out among global asset classes with prospects of long term growth given favorable demographics
DII Flow Long runaway of growth in financialization of savings
Supply of paperNear term supply will be impacted. Higher disinvestment target and repair of leveraged balance sheet to create supply in markets.
Policy/Reform Initiative Expect improved policy measures reform momentum
Signify Growth 89
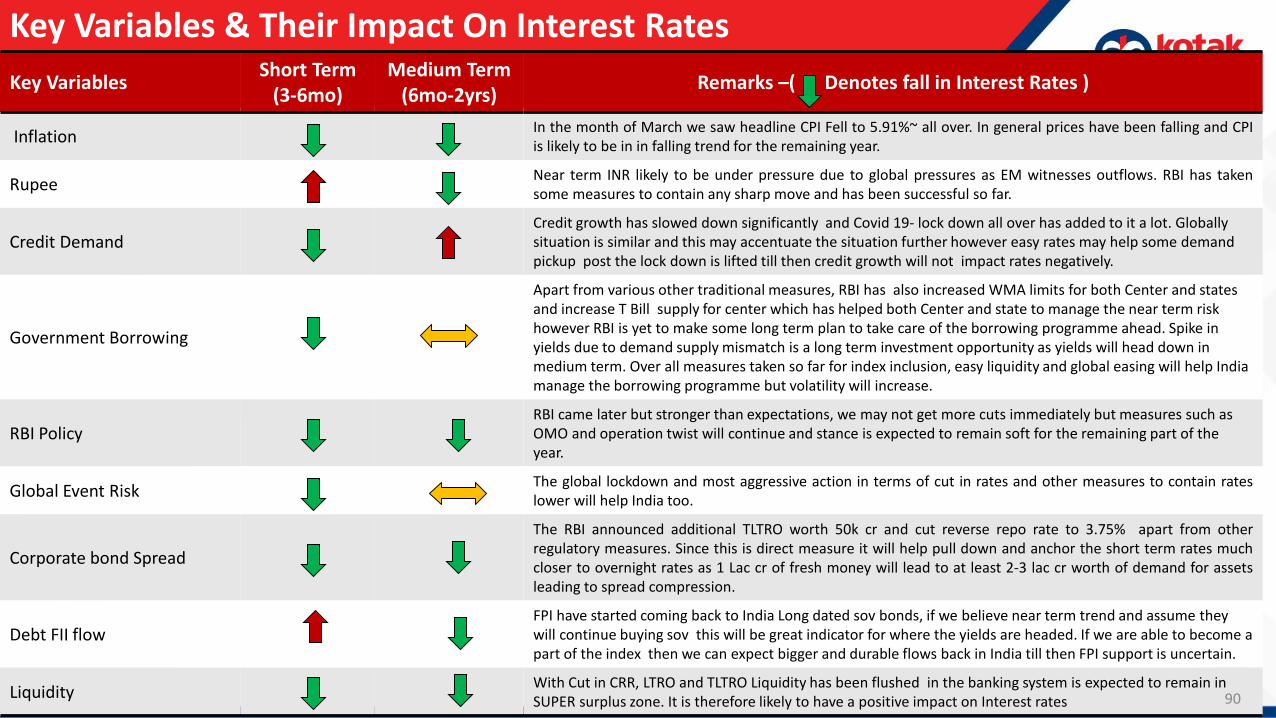
Key Variables & Their Impact On Interest Rates
Key VariablesShort Term
(3-6mo)Medium Term
(6mo-2yrs)Remarks –( Denotes fall in Interest Rates )
InflationIn the month of March we saw headline CPI Fell to 5.91%~ all over. In general prices have been falling and CPIis likely to be in in falling trend for the remaining year.
RupeeNear term INR likely to be under pressure due to global pressures as EM witnesses outflows. RBI has takensome measures to contain any sharp move and has been successful so far.
Credit DemandCredit growth has slowed down significantly and Covid 19- lock down all over has added to it a lot. Globally situation is similar and this may accentuate the situation further however easy rates may help some demand pickup post the lock down is lifted till then credit growth will not impact rates negatively.
Government Borrowing
Apart from various other traditional measures, RBI has also increased WMA limits for both Center and states and increase T Bill supply for center which has helped both Center and state to manage the near term risk however RBI is yet to make some long term plan to take care of the borrowing programme ahead. Spike in yields due to demand supply mismatch is a long term investment opportunity as yields will head down in medium term. Over all measures taken so far for index inclusion, easy liquidity and global easing will help India manage the borrowing programme but volatility will increase.
RBI PolicyRBI came later but stronger than expectations, we may not get more cuts immediately but measures such as OMO and operation twist will continue and stance is expected to remain soft for the remaining part of the year.
Global Event RiskThe global lockdown and most aggressive action in terms of cut in rates and other measures to contain rateslower will help India too.
Corporate bond Spread
The RBI announced additional TLTRO worth 50k cr and cut reverse repo rate to 3.75% apart from otherregulatory measures. Since this is direct measure it will help pull down and anchor the short term rates muchcloser to overnight rates as 1 Lac cr of fresh money will lead to at least 2-3 lac cr worth of demand for assetsleading to spread compression.
Debt FII flowFPI have started coming back to India Long dated sov bonds, if we believe near term trend and assume they will continue buying sov this will be great indicator for where the yields are headed. If we are able to become a part of the index then we can expect bigger and durable flows back in India till then FPI support is uncertain.
LiquidityWith Cut in CRR, LTRO and TLTRO Liquidity has been flushed in the banking system is expected to remain in SUPER surplus zone. It is therefore likely to have a positive impact on Interest rates 90

12-month Forward Sensex P/E (X)
Sensex in ‘Fair Value Plus’ Range in P/E Terms
Source: Axis Capital , Internal Estimates91
11000
15000
19000
23000
27000
31000
35000
39000
43000
May
-17
Jun
-17
Jul-
17
Au
g-1
7
Sep
-17
Oct
-17
No
v-1
7
Dec
-17
Jan
-18
Feb
-18
Mar
-18
Ap
r-1
8
May
-18
Jun
-18
Jul-
18
Au
g-1
8
Sep
-18
No
v-1
8
Dec
-18
Jan
-19
Feb
-19
Mar
-19
Ap
r-1
9
May
-19
Jun
-19
Jul-
19
Au
g-1
9
Sep
-19
Oct
-19
Dec
-19
Jan
-20
Feb
-20
Mar
-20
Ap
r-2
0
Cheap 8x - 10x
Attractive 10x - 13x
Fair 13x - 17x
Fair Value Plus 17x - 20x
Stretched 20x - 24x

92
Performance Of Sensex And Nifty Indices
Source: Bloomberg, Kotak Institutional Equities

Disclaimers & Disclosures
93

The information contained in this (document) is extracted from different public sources. All reasonable care has been taken to ensure that the information contained hereinis not misleading or untrue at the time of publication. This is for the information of the person to whom it is provided without any liability whatsoever on the part of KotakMahindra Asset Management Co Ltd or any associated companies or any employee thereof.We are not soliciting any action based on this material and is for generalinformation only. Investors should consult their financial advisors if in doubt about whether the product is suitable for them before investing
These materials are not intended for distribution to or use by any person in any jurisdiction where such distribution would be contrary to local law or regulation. Thedistribution of this document in certain jurisdictions may be restricted or totally prohibited and accordingly, persons who come into possession of this document arerequired to inform themselves about, and to observe, any such restrictions
Mutual Fund investments are subject to market risks, read all scheme related documents carefully.
Disclaimers & Risk Factors
94

95
Kotak Dynamic Bond Fund
Scheme Inception date is 26/05/2008. Mr. Deepak Agrawal has been managing the fund since 25/11/2012. Different plans have different expense structure. The performance details provided herein are of regular plan ^Past performance may or may not be sustained in future.*All payouts during the period have been reinvested in the units of the scheme at the then prevailing NAV. Returns >= 1 year: CAGR (Compounded Annualised Growth Rate). N.A stands for data not available. Note: Point to Point (PTP) Returns in INR shows the value of 10,000/- investment made at inception. Source: ICRA MFI Explorer. # Name of Scheme Benchmark. ## Name of Additional Benchmark. The performance of the scheme is benchmarked to the Total Return variant (TRI) of the Benchmark. Alpha is difference of scheme return with benchmark return.
Kotak Dynamic Bond Fund As on 30 April 2020
May 26, 2008Kotak Dynamic Bond Fund -
GrowthNIFTY Composite Debt
Index# ALPHACRISIL 1 Year
Tbill##Kotak Dynamic Bond Fund -
GrowthNIFTY Composite Debt
Index# CRISIL 1 Year Tbill##
Since Inception 8.63% 8.51% 0.12% 6.68% 26,869 26,503 21,645
Last 1 Year 10.77% 13.05% -2.28% 8.37% 11,077 11,305 10,837
Last 3 Years 8.38% 8.10% 0.28% 7.27% 12,740 12,641 12,351
Last 5 Years 9.11% 8.41% 0.69% 7.29% 15,470 14,983 14,220
Kotak Dynamic Bond Fund
Systematic Investment Plan (SIP) If you had invested Rs 10,000 every month
Monthly SIP of Rs 10000 Since Inception 10 years 7 years 5 years 3 years 1 year
Total amount invested (Rs) 1,440,000 1,200,000 840,000 600,000 360,000 120,000
Total Value as on Apr 30, 2020 (Rs) 2,520,450 1,918,226 1,157,089 750,896 413,170 125,163
Scheme Returns (%) 8.93 9.08 9.01 8.92 9.17 8.12
Nifty Composite Debt Index Returns (%) 8.55 8.68 8.77 8.62 9.53 10.73
Alpha* 0.38 0.39 0.24 0.30 -0.36 -2.60
Nifty Composite Debt Index (Rs)# 2,443,106 1,866,159 1,139,528 740,368 412,358 125,826
CRISIL 1 Year T-Bill Index (Rs)^ 2,242,911 1,751,175 1,093,188 722,827 405,434 125,696
CRISIL 1 Year T-Bill Index Returns (%) 7.11 7.34 7.41 7.39 7.89 8.97
Scheme Inception : - May 26, 2008. The returns are calculated by XIRR approach assuming investment of Rs. 10,000/- on the 1st working day of every month. XIRR helps in calculating return on investments given an initial and final value and a series of cash inflows and outflows and taking the time of investment into consideration. Since inception returns are assumed to be starting from the beginning of the subsequent month from the date of inception. # Benchmark ; ^ Additional Benchmark. Alpha is difference of scheme return with benchmark return.

96
Kotak Credit Risk Fund
Scheme Inception date is 11/05/2010. Mr. Deepak Agrawal has been managing the fund since 12/04/2010. Different plans have different expense structure. The performance details provided herein are of regular plan ^Past performance may or may not be sustained in future.*All payouts during the period have been reinvested in the units of the scheme at the then prevailing NAV. Returns >= 1 year: CAGR (Compounded Annualised Growth Rate). N.A stands for data not available. Note: Point to Point (PTP) Returns in INR shows the value of 10,000/- investment made at inception. Source: ICRA MFI Explorer. # Name of Scheme Benchmark. ## Name of Additional Benchmark. The performance of the scheme is benchmarked to the Total Return variant (TRI) of the Benchmark. Alpha is difference of scheme return with benchmark return
Kotak Credit Risk Fund Performance As on 30 April 2020
May 11, 2010 Kotak Credit Risk Fund - GrowthNIFTY Credit Risk Bond
Index# ALPHACRISIL 1 Year
Tbill##Kotak Credit Risk Fund -
GrowthNIFTY Credit Risk Bond
Index# CRISIL 1 Year Tbill##Since Inception 7.90% 9.08% -1.17% 6.97% 21,364 23,799 19,586Last 1 Year 4.72% 8.43% -3.71% 8.37% 10,472 10,843 10,837Last 3 Years 5.80% 7.61% -1.82% 7.27% 11,847 12,469 12,351Last 5 Years 7.28% 8.50% -1.22% 7.29% 14,215 15,046 14,220
Kotak Credit Risk Fund
Systematic Investment Plan (SIP) If you had invested Rs 10,000 every month
Monthly SIP of Rs 10000 Since Inception 10 years 7 years 5 years 3 years 1 year
Total amount invested (Rs) 1,200,000 NA 840,000 600,000 360,000 120,000
Total Value as on Apr 30, 2020 (Rs) 1,776,527 NA 1,077,939 701,054 388,685 120,295
Scheme Returns (%) 7.62 NA 7.02 6.17 5.05 0.46
NIFTY Credit Risk Bond Index Returns (%) 8.92 NA 8.49 8.00 7.70 6.71
Alpha* -1.30 NA -1.47 -1.83 -2.65 -6.25
NIFTY Credit Risk Bond Index (Rs)# 1,902,151 NA 1,136,163 733,870 404,324 124,279
CRISIL 1 Year T-Bill Index (Rs)^ 1,751,118 NA 1,093,188 722,827 405,434 125,696
CRISIL 1 Year T-Bill Index (%) 7.34 NA 7.41 7.39 7.89 8.97
Scheme Inception : - May 11, 2010. The returns are calculated by XIRR approach assuming investment of Rs. 10,000/- on the 1st working day of every month. XIRR helps in calculating return on investments given an initial and final value and a series of cash inflows and outflows and taking the time of investment into consideration. Since inception returns are assumed to be starting from the beginning of the subsequent month from the date of inception. # Benchmark ; ^ Additional Benchmark. Alpha is difference of scheme return with benchmark return.

Kotak Emerging Equity Fund Performance As on 30 April 2020
97
Scheme Inception date is 30/03/2007. Mr. Pankaj Tibrewal has been managing the fund since 27/05/2010. Different plans have different expense structure. The performance details provided herein are of regular plan ^Past performance may or may not be sustained in future.*All payouts during the period have been reinvested in the units of the scheme at the then prevailing NAV. Returns >= 1 year: CAGR (Compounded Annualised Growth Rate). N.A stands for data not available. Note: Point to Point (PTP) Returns in INR shows the value of 10,000/- investment made at inception. Source: ICRA MFI Explorer. # Name of Scheme Benchmark. ## Name of Additional Benchmark. TRI Total Return Index, In terms of SEBI circular dated January 4, 2018, the performance of the scheme is benchmarked to the Total Return variant (TRI) of the Benchmark Index instead of Price Return Variant (PRI). Alpha is difference of scheme return with benchmark return.
Scheme Inception : - March 30, 2007. The returns are calculated by XIRR approach assuming investment of Rs.10,000/- on the 1st working day of every month. XIRR helps in calculating return on investments given an initial and final value and a series of cash inflows and outflows and taking the time of investment into consideration. Since inception returns are assumed to be starting from the beginning of the subsequent month from the date of inception. # Benchmark ; ^ Additional Benchmark TRI Total Return Index, In terms of SEBI circular dated January 4, 2018, the performance of the scheme is benchmarked to the Total Return variant (TRI) of the Benchmark Index instead of Price Return Variant (PRI). Alpha is difference of scheme return with benchmark return.
Mar 30, 2007Kotak Emerging Equity Fund -
Growth Nifty Midcap 100 TRI# ALPHA Nifty 50 TRI##Kotak Emerging Equity Fund
- GrowthNifty Midcap
100 TRI# Nifty 50 TRI##Since Inception 9.64% 9.52% 0.12% 8.79% 33,359 32,897 30,144Last 1 Year -12.46% -22.10% 9.64% -14.88% 8,754 7,790 8,512Last 3 Years -2.84% -8.31% 5.48% 3.33% 9,171 7,702 11,034Last 5 Years 5.80% 2.41% 3.39% 5.16% 13,261 11,266 12,863
Kotak Emerging Equity Scheme
Systematic Investment Plan (SIP) If you had invested Rs 10,000 every month
Monthly SIP of Rs 10000 Since Inception 10 years 7 years 5 years 3 years 1 year
Total amount invested (Rs) 1,580,000 1,200,000 840,000 600,000 360,000 120,000
Total Value as on Apr 30, 2020 (Rs) 3,581,167 2,167,177 1,128,874 602,431 316,317 105,946
Scheme Returns (%) 11.68 11.38 8.31 0.16 -8.23 -21.05
Nifty Midcap 100 (TRI) Returns (%) 7.69 5.56 2.03 -5.43 -15.87 -28.60
Alpha* 3.99 5.82 6.28 5.59 7.64 7.55
Nifty Midcap 100 (TRI) (Rs)# 2,683,625 1,595,753 902,698 522,416 279,088 100,623
Nifty 50 (TRI) (Rs)^ 2,756,311 1,735,580 1,010,837 640,065 337,402 106,057
Nifty 50 (TRI) Returns (%) 8.06 7.17 5.21 2.55 -4.17 -20.89

Kotak Smallcap Fund Performance as on 30 April 2020
Scheme Inception date is 24/02/2005. Mr. Pankaj Tibrewal has been managing the fund since 21/01/2010. Different plans have different expense structure. The performance details provided herein are of regular plan.^Past performance may or may not be sustained in future.*All payouts during the period have been reinvested in the units of the scheme at the then prevailing NAV. Returns >= 1 year: CAGR (Compounded Annualised Growth Rate). N.A stands for data not available. Note: Point to Point (PTP) Returns in INR shows the value of 10,000/- investment made at inception. Source: ICRA MFI Explorer. # Name of Scheme Benchmark. ## Name of Additional Benchmark. TRI Total Return Index, In terms of SEBI circular dated January 4, 2018, the performance of the scheme is benchmarked to the Total Return variant (TRI) of the Benchmark Index instead of Price Return Variant (PRI). Alpha is difference of scheme return with benchmark return.
Scheme Inception : - February 24,2005. The returns are calculated by XIRR approach assuming investment of `10,000/- on the 1st working day of every month. XIRR helps in calculating return on investments given an initial and final value and a series of cash inflows and outflows and taking the time of investment into consideration. Since inception returns are assumed to be starting from the beginning of the subsequent month from the date of inception. # Benchmark ; ^ Additional Benchmark TRI Total Return Index, In terms of SEBI circular dated January 4, 2018, the performance of the scheme is benchmarked to the Total Return variant (TRI) of the Benchmark Index instead of Price Return Variant (PRI). Alpha is difference of scheme return with benchmark return.
98
Feb 24, 2005 Kotak Smallcap Fund - GrowthNIFTY Smallcap 100
TRI# ALPHA Nifty 50 TRI##Kotak Smallcap Fund -
GrowthNIFTY Smallcap
100 TRI# Nifty 50 TRI##
Since Inception 12.37% 8.46% 3.91% 12.28% 58,783 34,311 58,045
Last 1 Year -16.52% -35.91% 19.39% -14.88% 8,348 6,409 8,512
Last 3 Years -6.83% -17.21% 10.38% 3.33% 8,082 5,666 11,034
Last 5 Years 3.23% -4.64% 7.87% 5.16% 11,728 7,886 12,863
Kotak Smallcap Fund (Previously known as Kotak Midcap)
Systematic Investment Plan (SIP) If you had invested Rs 10,000 every month
Monthly SIP of Rs 10000 Since Inception 10 years 7 years 5 years 3 years 1 year
Total amount invested (Rs) 1,830,000 1,200,000 840,000 600,000 360,000 120,000
Total Value as on Apr 30, 2020 (Rs) 4,100,487 1,815,663 975,263 544,965 293,352 102,486
Scheme Returns (%) 9.88 8.03 4.21 -3.78 -12.87 -25.99
NIFTY Smallcap 100 (TRI) Returns (%) 3.09 -0.97 -5.94 -15.02 -28.11 -44.38
Alpha* 6.79 9.00 10.15 11.24 15.24 18.40
NIFTY Smallcap 100 (TRI) (Rs)# 2,331,047 1,142,950 681,554 408,035 225,710 88,843
Nifty 50 (TRI) (Rs)^ 3,821,331 1,735,580 1,010,837 640,065 337,402 106,057
Nifty 50 (TRI) Returns (%) 9.05 7.17 5.21 2.55 -4.17 -20.89

Kotak Standard Multicap Fund Performance as on 30 April 2020
Scheme Inception date is 11/09/2009. Mr. Harsha Upadhyaya has been managing the fund since 04/08/2012. Different plans have different expense structure. The performance details provided herein are of regular plan ^Past performance may or may not be sustained in future.*All payouts during the period have been reinvested in the units of the scheme at the then prevailing NAV. Returns >= 1 year: CAGR (Compounded Annualised Growth Rate). N.A stands for data not available. Note: Point to Point (PTP) Returns in INR shows the value of 10,000/- investment made at inception. Source: ICRA MFI Explorer. # Name of Scheme Benchmark. ## Name of Additional Benchmark. Kotak Select Focus Fund is renamed as Kotak Standard Multicap Fund with effect from 25th May 2018. TRI Total Return Index, In terms of SEBI circular dated January 4, 2018, the performance of the scheme is benchmarked to the Total Return variant (TRI) of the Benchmark Index instead of Price Return Variant (PRI). Alpha is difference of scheme return with benchmark return.
99
Scheme Inception : - September 11, 2009. The returns are calculated by XIRR approach assuming investment of `10,000/- on the 1st working day of every month. XIRR helps in calculating return on investments given an initial and final value and a series of cash inflows and outflows and taking the time of investment into consideration. Since inception returns are assumed to be starting from the beginning of the subsequent month from the date of inception. # Benchmark ; ^ Additional Benchmark TRI Total Return Index, In terms of SEBI circular dated January 4, 2018, the performance of the scheme is benchmarked to the Total Return variant (TRI) of the Benchmark Index instead of Price Return Variant (PRI)
Kotak Standard Multicap Fund -Growth Nifty 200 TRI# ALPHA Nifty 50 TRI##
Kotak Standard Multicap Fund - Growth Nifty 200 TRI# Nifty 50 TRI##
11.02% 8.27% 2.75% 8.23% 30,416 23,291 23,197-14.61% -15.36% 0.75% -14.88% 8,539 8,464 8,5120.40% 1.36% -0.97% 3.33% 10,120 10,416 11,0346.55% 4.96% 1.59% 5.16% 13,736 12,741 12,863
Kotak Standard Multicap Fund (Previously known as Kotak Select Focus Fund)
Systematic Investment Plan (SIP) If you had invested Rs 10,000 every month
Monthly SIP of Rs 10000 Since Inception 10 years 7 years 5 years 3 years 1 year
Total amount invested (Rs) 1,280,000 1,200,000 840,000 600,000 360,000 120,000
Total Value as on Apr 30, 2020 (Rs) 2,272,347 2,035,579 1,089,071 631,438 328,241 104,938
Scheme Returns (%) 10.34 10.20 7.31 2.02 -5.92 -22.50
Nifty 200 (TRI) Returns (%) 7.31 7.20 4.99 1.47 -6.02 -21.21
Alpha* 3.02 3.00 2.32 0.55 0.10 -1.29
Nifty 200 (TRI) (Rs)# 1,914,970 1,737,796 1,002,713 622,747 327,704 105,835
Nifty 50 (TRI) (Rs)^ 1,914,771 1,735,580 1,010,837 640,065 337,402 106,057
Nifty 50 (TRI) Returns (%) 7.31 7.17 5.21 2.55 -4.17 -20.89

Kotak Equity Opportunities Fund Performance as on 30 April 2020
Scheme Inception date is 09/09/2004. Mr. Harsha Upadhyaya has been managing the fund since 04/08/2012. Different plans have different expense structure. The performance details provided herein are of regular plan ^Past performance may or may not be sustained in future.*All payouts during the period have been reinvested in the units of the scheme at the then prevailing NAV. Returns >= 1 year: CAGR (Compounded Annualised Growth Rate). N.A stands for data not available. Note: Point to Point (PTP) Returns in INR shows the value of 10,000/- investment made at inception. Source: ICRA MFI Explorer. # Name of Scheme Benchmark. ## Name of Additional Benchmark. TRI Total Return Index, In terms of SEBI circular dated January 4, 2018, the performance of the scheme is benchmarked to the Total Return variant (TRI) of the Benchmark Index instead of Price Return Variant (PRI). Alpha is difference of scheme return with benchmark return.
Scheme Inception : - September 09, 2004. The returns are calculated by XIRR approach assuming investment of Rs. 10,000/- on the 1st working day of every month. XIRR helps in calculating return on investments given an initial and final value and a series of cash inflows and outflows and taking the time of investment into consideration. Since inception returns are assumed to be starting from the beginning of the subsequent month from the date of inception. # Benchmark ; ^ Additional Benchmark TRI - Total Return Index, In terms of SEBI circular dated January 4, 2018, the performance of the scheme is benchmarked to the Total Return variant (TRI) of the Benchmark Index instead of Price Return Variant (PRI). Alpha is difference of scheme return with benchmark return
100
Kotak Equity Opportunities Fund -Growth Nifty 200 TRI# ALPHA Nifty 50 TRI##
Kotak Equity Opportunities Fund - Growth Nifty 200 TRI# Nifty 50 TRI##
16.39% 13.25% 3.14% 13.52% 107,533 70,105 72,788
-11.01% -15.36% 4.35% -14.88% 8,899 8,464 8,512
0.36% 1.36% -1.00% 3.33% 10,109 10,416 11,034
6.09% 4.96% 1.13% 5.16% 13,444 12,741 12,863
Kotak Equity Opportunities Fund (Previously known as Kotak Opportunities - Growth)
Systematic Investment Plan (SIP) If you had invested Rs 10,000 every month
Monthly SIP of Rs 10000 Since Inception 10 years 7 years 5 years 3 years 1 year
Total amount invested (Rs) 1,880,000 1,200,000 840,000 600,000 360,000 120,000
Total Value as on Apr 30, 2020 (Rs) 5,055,664 1,937,297 1,077,356 639,040 336,660 108,831
Scheme Returns (%) 11.65 9.26 7.00 2.49 -4.31 -16.86
Nifty 200 (TRI) Returns (%) 9.31 7.20 4.99 1.47 -6.02 -21.21
Alpha* 2.34 2.07 2.02 1.02 1.71 4.35
Nifty 200 (TRI) (Rs)# 4,105,048 1,737,796 1,002,713 622,747 327,704 105,835
Nifty 50 (TRI) (Rs)^ 4,145,762 1,735,580 1,010,837 640,065 337,402 106,057
Nifty 50 (TRI) Returns (%) 9.42 7.17 5.21 2.55 -4.17 -20.89

Kotak Tax Saver Fund Performance as on 30 April 2020
Scheme Inception date is 23/11/2005. Mr. Harsha Upadhyaya has been managing the fund since 25/08/2015. Different plans have different expense structure. The performance details provided herein are of regular plan ^Past performance may or may not be sustained in future.*All payouts during the period have been reinvested in the units of the scheme at the then prevailing NAV. Returns >= 1 year: CAGR (Compounded Annualised Growth Rate). N.A stands for data not available. Note: Point to Point (PTP) Returns in INR shows the value of 10,000/- investment made at inception. Source: ICRA MFI Explorer. # Name of Scheme Benchmark. ## Name of Additional Benchmark. TRI Total Return Index, In terms of SEBI circular dated January 4, 2018, the performance of the scheme is benchmarked to the Total Return variant (TRI) of the Benchmark Index instead of Price Return Variant (PRI). Alpha is difference of scheme return with benchmark return.
Scheme Inception : - November 23, 2005. The returns are calculated by XIRR approach assuming investment of `10,000/- on the 1st working day of every month. XIRR helps in calculating return on investments given an initial and final value and a series of cash inflows and outflows and taking the time of investment into consideration. Since inception returns are assumed to be starting from the beginning of the subsequent month from the date of inception. # Benchmark ; ^ Additional Benchmark TRI Total Return Index, In terms of SEBI circular dated January 4, 2018, the performance of the scheme is benchmarked to the Total Return variant (TRI) of the Benchmark Index instead of Price Return Variant (PRI). Alpha is difference of scheme return with benchmark return
101
Kotak Tax Saver Fund - Growth Nifty 500 TRI# ALPHA Nifty 50 TRI##Kotak Tax Saver Fund -
Growth Nifty 500 TRI# Nifty 50 TRI##9.86% 10.51% -0.65% 11.00% 38,881 42,329 45,135
-12.45% -15.93% 3.47% -14.88% 8,755 8,407 8,512-0.12% 0.42% -0.54% 3.33% 9,963 10,126 11,0345.17% 4.76% 0.41% 5.16% 12,869 12,622 12,863
Kotak Tax Saver
Systematic Investment Plan (SIP) If you had invested Rs 10,000 every month
Monthly SIP of Rs 10000 Since Inception 10 years 7 years 5 years 3 years 1 year
Total amount invested (Rs) 1,740,000 1,200,000 840,000 600,000 360,000 120,000
Total Value as on Apr 30, 2020 (Rs) 3,417,533 1,841,938 1,061,686 629,097 333,991 106,900
Scheme Returns (%) 8.78 8.30 6.59 1.87 -4.82 -19.67
Nifty 500 (TRI) Returns (%) 8.32 7.03 4.74 0.84 -7.02 -21.81
Alpha* 0.46 1.27 1.85 1.03 2.20 2.13
Nifty 500 (TRI) (Rs)# 3,292,842 1,722,787 993,931 612,964 322,522 105,422
Nifty 50 (TRI) (Rs)^ 3,327,085 1,735,580 1,010,837 640,065 337,402 106,057
Nifty 50 (TRI) Returns (%) 8.45 7.17 5.21 2.55 -4.17 -20.89

Kotak Balanced Advantage Fund Performance as on 30 April 2020
Scheme Inception date is 03/08/2018. Mr. Harish Krishnan, Mr. Abhishek Bisen have been managing the fund since 03/08/2018. Mr. Hiten Shah has been managing the fund since 03/10/2019. Different plans have different expense structure. The performance details provided herein are of regular plan ^Past performance may or may not be sustained in future.*All payouts during the period have been reinvested in the units of the scheme at the then prevailing NAV. Returns >= 1 year: CAGR (Compounded Annualised Growth Rate). N.A stands for data not available. Note: Point to Point (PTP) Returns in INR shows the value of 10,000/- investment made at inception. Source: ICRA MFI Explorer. # Name of Scheme Benchmark. ## Name of Additional Benchmark. Alpha is difference of scheme return with benchmark return
Scheme Inception : - August 03,2018. The returns are calculated by XIRR approach assuming investment of Rs. 10,000/- on the 1st working day of every month. XIRR helps in calculating return on investments given an initial and final value and a series of cash inflows and outflows and taking the time of investment into consideration. Since inception returns are assumed to be starting from the beginning of the subsequent month from the date of inception. # Benchmark ; ^ Additional Benchmark TRI - Total Return Index, In terms of SEBI circular dated January 4, 2018, the performance of the scheme is benchmarked to the Total Return variant (TRI) of the Benchmark Index instead of Price Return Variant (PRI). The debt component of the index is TRI since inception. *All payouts during the period have been reinvested in the units of the scheme at the then prevailing NAV. Returns >= 1 year: CAGR (Compounded Annualised Growth Rate). N.A stands for data not available. Note: Point to Point (PTP) Returns in INR shows the value of 10,000/- investment made at inception. Source: ICRA MFI Explorer. # Name of Scheme Benchmark. ## Name of Additional Benchmark. Alpha is difference of scheme return with benchmark return
102
Aug 03, 2018Kotak Balanced Advantage Fund
– GrowthNIFTY 50 Hybrid Composite
Debt 50:50 Index# ALPHA Nifty 50 TRI##Kotak Balanced Advantage
Fund - GrowthNIFTY 50 Hybrid Composite
Debt 50:50 Index# Nifty 50 TRI##
Since Inception 1.19% 2.94% -1.75% -6.74% 10,209 10,518 8,854
Last 1 Year -2.49% -0.20% -2.29% -14.88% 9,751 9,980 8,512
Last 3 Years NA NA NA NA NA NA NA
Last 5 Years NA NA NA NA NA NA NA
Kotak Balanced Advantage Fund
Systematic Investment Plan (SIP) If you had invested Rs 10,000 every month
Monthly SIP of Rs 10000 Since Inception 10 years 7 years 5 years 3 years 1 year
Total amount invested (Rs) 210,000 NA NA NA NA 120,000
Total Value as on Apr 30, 2020 (Rs) 206,893 NA NA NA NA 115,148
Scheme Returns (%) -1.63 NA NA NA NA -7.44
NIFTY 50 Hybrid Composite Debt 50:50 Index Returns (%) 1.10 NA NA NA NA -3.75
Alpha* -2.73 NA NA NA NA -3.69
NIFTY 50 Hybrid Composite Debt 50:50 Index (Rs)# 212,110 NA NA NA NA 117,570
Nifty 50 (TRI) (Rs)^ 187,736 NA NA NA NA 106,057
Nifty 50 (TRI) Returns (%) -11.76 NA NA NA NA -20.89

103
Funds Managed by Mr. Deepak Agarwal
Mr. Deepak Agrawal manages 12 & All FMPs funds of Kotak Mahindra Mutual Fund. Different plans shall have a different expense structure. The performance details provided herein are of regular plan.
Kotak Banking and PSU Debt Fund - Growth, *Name of the Benchmark - CRISIL Banking and PSU Debt Index, Scheme Inception date is 29/12/1998. Mr. Deepak Agrawal has been managing the fund since 01/08/2008.Kotak Bond Short Term Fund - Growth, *Name of the Benchmark - NIFTY Short Duration Debt Index, Scheme Inception date is 02/05/2002. Mr. Deepak Agrawal has been managing the fund since 11/07/2007.Kotak Corporate Bond Fund - Growth, *Name of the Benchmark - CRISIL Corporate Bond Composite Index, Scheme Inception date is 21/09/2007. Mr. Deepak Agrawal has been managing the fund since 01/02/2015.Kotak Liquid Fund - Growth, *Name of the Benchmark - NIFTY Liquid Index, Scheme Inception date is 04/11/2003. Mr. Deepak Agrawal has been managing the fund since 01/05/2007.Kotak Overnight Fund - Growth, *Name of the Benchmark - NIFTY 1D Rate Index, Scheme Inception date is 15/01/2019. Mr. Deepak Agrawal has been managing the fund since 15/01/2019.Kotak Medium Term Fund - Growth, *Name of the Benchmark - NIFTY Medium Duration Debt Index, Scheme Inception date is 21/03/2014. Mr. Deepak Agrawal has been managing the fund since 22/06/2015.
Scheme Names
1 YEAR 3 YEARS 5 YEARS Since Inception
Scheme Returns(%)^
Benchmark Returns (%)^*
Scheme Returns(%)^
Benchmark Returns (%)^*
Scheme Returns(%)^
Benchmark Returns (%)^*
Scheme Returns(%)^
Benchmark Returns (%)^*
Top 3
Kotak Banking and PSU Debt Fund -Growth
10.25 10.21 7.99 8.12 8.29 8.46 7.48 NA
Kotak Bond Short Term Fund - Growth 9.53 9.09 7.35 7.63 7.78 7.97 7.72 7.91
Kotak Corporate Bond Fund - Growth 8.84 11.36 7.90 7.84 8.16 8.61 8.19 9.40
Bottom 3
Kotak Liquid Fund - Growth 5.85 5.85 6.68 6.62 7.05 6.94 7.34 7.36
Kotak Overnight Fund - Growth 4.87 4.97 NA NA NA NA 5.19 5.29
Kotak Medium Term Fund - Growth 2.88 11.59 4.94 7.95 6.83 8.31 7.69 8.99

Funds Managed by Mr. Harsha Upadhyaya
Mr. Harsha Upadhyaya manages 3 funds of Kotak Mahindra Mutual Fund. Different plans shall have a different expense structure. The performance details provided herein are of regular plan. Kotak Equity Opportunities Fund (Sep 9, 04), Kotak Standard Multicap Fund (Sep 11, 09), Kotak Tax Saver Fund (Nov. 23,'05). Kotak Equity Opportunities Fund - Growth, *Name of the Benchmark - Nifty 200 TRI, Scheme Inception date is 09/09/2004. Mr . Harsha Upadhyaya has been managing the fund since 04/08/2012. Kotak Tax Saver Fund - Growth, *Name of the Benchmark - Nifty 500 TRI, Scheme Inception date is 23/11/2005. Mr . Harsha Upadhyaya has been managing the fund since 25/08/2015. Kotak Standard Multicap Fund - Growth, *Name of the Benchmark - Nifty 200 TRI, Scheme Inception date is 11/09/2009. Mr . Harsha Upadhyaya has been managing the fund since 04/08/2012.
Funds Managed by Mr. Pankaj Tibrewal
Mr. Pankaj Tibrewal manages 3 funds of Kotak Mahindra Mutual Fund. Different plans shall have a different expense structure. The performance details provided herein are of regular plan. Kotak Small Cap Fund (Feb. 24,05), Kotak Emerging Equity Fund (Mar 30,'07), Kotak Equity Hybrid Fund (Nov. 25,'99). Kotak Emerging Equity Fund - Growth, *Name of the Benchmark - Nifty Midcap 100 TRI, Scheme Inception date is 30/03/2007. Mr. Pankaj Tibrewal has been managing the fund since 27/05/2010. Kotak Smallcap Fund - Growth, *Name of the Benchmark - NIFTY Smallcap 100 TRI, Scheme Inception date is 24/02/2005. Mr. Pankaj Tibrewal has been managing the fund since 21/01/2010. Kotak Equity Hybrid Fund - Growth, *Name of the Benchmark - NIFTY 50 Hybrid Composite Debt 65:35 Index, Scheme Inception date is 25/11/1999. Mr. Pankaj Tibrewal has been managing the fund since 25/08/2015. Mr. Abhishek Bisen has been managing the fund since 15/04/2008
104
Scheme Names
1 YEAR 3 YEARS 5 YEARS Since Inception
Scheme Returns(%)^
Benchmark Returns (%)^*
Scheme Returns(%)^
Benchmark Returns (%)^*
Scheme Returns(%)^
Benchmark Returns (%)^*
Scheme Returns(%)^
Benchmark Returns (%)^*
Kotak Equity Opportunities Fund - Growth -11.01 -15.36 0.36 1.36 6.09 4.96 16.39 13.25
Kotak Tax Saver Fund - Growth -12.45 -15.93 -0.12 0.42 5.17 4.76 9.86 10.51
Kotak Standard Multicap Fund - Growth -14.61 -15.36 0.40 1.36 6.55 4.96 11.02 8.27
Scheme Names
1 YEAR 3 YEARS 5 YEARS Since Inception
Scheme Returns(%)^
Benchmark Returns (%)^*
Scheme Returns(%)^
Benchmark Returns (%)^*
Scheme Returns(%)^
Benchmark Returns (%)^*
Scheme Returns(%)^
Benchmark Returns (%)^*
Kotak Equity Hybrid Fund - Growth -9.21 -4.48 -0.72 5.67 4.13 6.79 4.44 6.36
Kotak Emerging Equity Fund - Growth -12.46 -22.10 -2.84 -8.31 5.80 2.41 9.64 9.52
Kotak Small Cap Fund - Growth -16.52 -35.91 -6.83 -17.21 3.23 -4.64 12.37 8.46

Funds Managed by Mr. Hiten Shah
Mr. Hiten Shah manages 3 fund of Kotak Mahindra Mutual Fund Different plans shall have a different expense structure. The performance details provided herein are of regular plan. Kotak Balanced Advantage Fund (Aug. 03, 18), Kotak Equity Savings Fund (Oct. 13, 2014), Kotak Equity Arbitrage Fund (Sep. 29, 05). Kotak Balanced Advantage Fund - Growth, *Name of the Benchmark - NIFTY 50 Hybrid Composite Debt 50:50 Index . Scheme Inception date is 03/08/2018. Mr. Abhishek Bisen & Mr. Harish Krishnan has been managing the fund since 03/08/2018. Mr. Hiten Shah has been managing the fund since 03/10/2019. Kotak Equity Savings Fund - Growth, *Name of the Benchmark - 75% NIFTY 50 Arbitrage + 25% Nifty 50 TRI, Scheme Inception date is 13/10/2014. Mr. Harish Krishnan has been managing the fund since 09/05/2019. Mr. Abhishek Bisen has been managing the fund since 17/09/2014. Mr. Hiten Shah has been managing the fund since 03/10/2019. Kotak Equity Arbitrage Fund - Growth, *Name of the Benchmark - Nifty 50 Arbitrage Index, Scheme Inception date is 29/09/2005. Mr. Hiten Shah has been managing the fund since 03/10/2019.
105
Scheme Names
1 YEAR 3 YEARS 5 YEARS Since Inception
Scheme Returns(%)^
Benchmark Returns (%)^*
Scheme Returns(%)^
Benchmark Returns (%)^*
Scheme Returns(%)^
Benchmark Returns (%)^*
Scheme Returns(%)^
Benchmark Returns (%)^*
Kotak Equity Arbitrage Fund - Growth 6.01 5.60 6.23 5.29 6.33 5.62 7.36 NA
Kotak Equity Savings Fund - Growth 0.30 0.93 5.17 5.18 6.24 5.82 6.70 6.13
Kotak Balanced Advantage Fund - Growth -2.49 -0.20 NA NA NA NA 1.19 2.94

Funds Managed by Mr. Harish Krishnan
Mr. Harish Krishnan manages 7 funds of Kotak Mahindra Mutual Fund. Different plans shall have a different expense structure. The performance details provided herein are of regular plan. Kotak BluechipFund (Feb 04, 03), Kotak Infrastructure & Economic Reform Fund (Feb 25, '08), Kotak India Growth Fund Series 5 (May15,18), Kotak Balanced Advantage Fund (Aug. 03,18), Kotak Equity Savings Fund (Oct. 13' 14), Kotak Focused Equity fund (Jul 16, '19), Kotak Pioneer Fund (Oct 31, '19). Kotak India Growth Fund Series 5- Growth, *Name of the Benchmark - Nifty 200 TRI, Scheme Inception date is 15/05/2018. Mr. Harish Krishnan has been managing the fund since 15/05/2018. Kotak Infrastructure and Economic Reform Fund - Growth, *Name of the Benchmark - India Infrastructure Index (Customised Index by IISL), Scheme Inception date is 25/02/2008. Mr. Harish Krishnan has been managing the fund since 31/01/2015. Kotak Bluechip Fund - Growth, *Name of the Benchmark - Nifty 50 TRI, Scheme Inception date is 04/02/2003. Mr. Harish Krishnan has been managing the fund since 15/11/2013. Kotak Balanced Advantage Fund - Growth, *Name of the Benchmark - NIFTY 50 Hybrid Composite Debt 50:50 Index . Scheme Inception date is 03/08/2018. Mr. Abhishek Bisen & Mr. Harish Krishnan has been managing the fund since 03/08/2018. Mr. Hiten Shah has been managing the fund since 03/10/2019. Kotak Equity Savings Fund - Growth, *Name of the Benchmark - 75% NIFTY 50 ARBITRAGE + 25% Nifty 50 TRI, Scheme Inception date is 13/10/2014. Mr. Harish Krishnan has been managing the fund since 09/05/2019. Mr. Abhishek Bisen has been managing the fund since 17/09/2014. Mr. Hiten Shah has been managing the fund since 03/10/2019.
106
Scheme Names1 YEAR 3 YEARS 5 YEARS Since Inception
Scheme Returns(%)^
Benchmark Returns (%)^*
Scheme Returns(%)^
Benchmark Returns (%)^*
Scheme Returns(%)^
Benchmark Returns (%)^*
Scheme Returns(%)^
Benchmark Returns (%)^*
Kotak Equity Savings Fund - Growth 0.30 0.93 5.17 5.18 6.24 5.82 6.70 6.13
Kotak Balanced Advantage Fund - Growth -2.49 -0.20 NA NA NA NA 1.19 2.94
Kotak Bluechip Fund - Growth -12.01 -14.88 0.91 3.33 4.31 5.16 17.95 15.43
Kotak India Growth Fund - Series 5 - Growth -14.36 -15.36 NA NA NA NA -9.16 -5.28
Kotak Infrastructure and Economic Reform Fund - Growth -23.87 -23.30 -9.74 -10.00 0.49 -3.41 3.47 -2.12
Kotak Focused Equity Fund Since Kotak Focused Equity fund and Kotak Pioneer Fund has not yet completed 1 year from Inception, the performance of the scheme is not disclosed.Kotak Pioneer Fund

Funds Managed by Mr. Abhishek Bisen
Mr. Abhishek Bisen manages 9 funds of Kotak Mahindra Mutual Fund. Different plans shall have a different expense structure. The performance details provided herein are of regular plan. Kotak Equity Savings Fund - Growth, *Name of the Benchmark - 75% NIFTY 50 ARBITRAGE + 25% Nifty 50 TRI, Scheme Inception date is 13/10/2014. Mr. Harish Krishnan has been managing the fund since 09/05/2019. Mr. Abhishek Bisen has been managing the fund since 17/09/2014. Mr. Hiten Shah has been managing the fund since 03/10/2019.
Kotak Balanced Advantage Fund - Growth, *Name of the Benchmark - NIFTY 50 Hybrid Composite Debt 50:50 Index . Scheme Inception date is 03/08/2018. Mr. Abhishek Bisen & Mr. Harish Krishnan has been managing the fund since 03/08/2018. Mr. Hiten Shah has been managing the fund since 03/10/2019.
Kotak Bluechip Fund - Growth (Erstwhile Kotak 50), *Name of the Benchmark - Nifty 50 TRI, Scheme Inception date is 04/02/2003. Mr. Harish Krishnan has been managing the fund since 15/11/2013.Kotak India Growth Fund Series 5- Growth, *Name of the Benchmark - Nifty 200 TRI, Scheme Inception date is 15/05/2018. Mr. Harish Krishnan has been managing the fund since 15/05/2018.Kotak Infrastructure and Economic Reform Fund - Growth, *Name of the Benchmark - India Infrastructure Index (Customised Index by IISL), Scheme Inception date is 25/02/2008. Mr. Harish Krishnan has been managing the fund since 31/01/2015.
107
Scheme Names
1 YEAR 3 YEARS 5 YEARS Since Inception
Scheme Returns(%)^
Benchmark Returns (%)^*
Scheme Returns(%)^
Benchmark Returns (%)^*
Scheme Returns(%)^
Benchmark Returns (%)^*
Scheme Returns(%)^
Benchmark Returns (%)^*
Top 3
Kotak Gold Fund - Growth 48.13 47.43 15.86 17.09 10.73 11.39 7.84 9.20
Kotak Gold ETF 45.93 47.43 15.92 17.09 10.22 11.39 12.80 13.99
Kotak Gilt Fund - Growth 15.12 15.36 8.65 8.94 8.67 8.78 9.71 NA
Bottom 3
Kotak Debt Hybrid Fund - Growth 4.68 9.62 4.57 7.70 6.89 8.56 7.40 8.27
Kotak Equity Savings Fund - Growth 0.30 0.93 5.17 5.18 6.24 5.82 6.70 6.13
Kotak Equity Hybrid - Growth -9.21 -4.48 -0.72 5.67 4.13 6.79 4.44 6.36
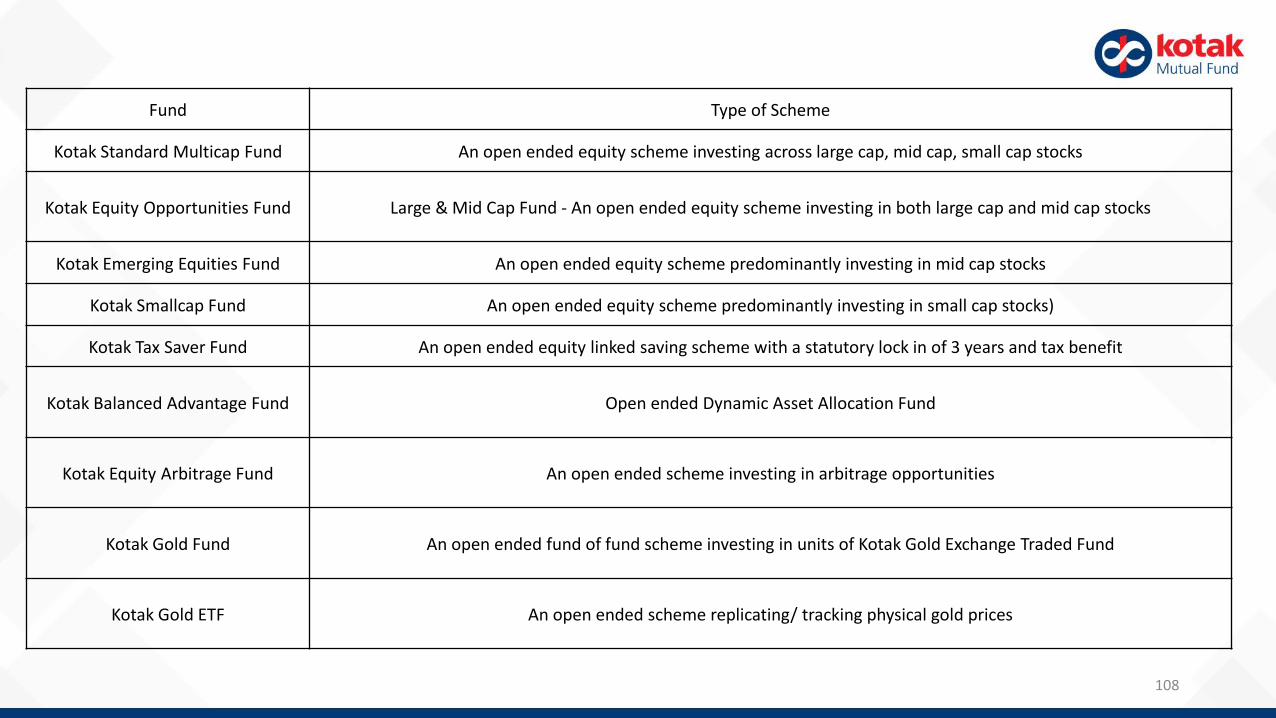
108
Fund Type of Scheme
Kotak Standard Multicap Fund An open ended equity scheme investing across large cap, mid cap, small cap stocks
Kotak Equity Opportunities Fund Large & Mid Cap Fund - An open ended equity scheme investing in both large cap and mid cap stocks
Kotak Emerging Equities Fund An open ended equity scheme predominantly investing in mid cap stocks
Kotak Smallcap Fund An open ended equity scheme predominantly investing in small cap stocks)
Kotak Tax Saver Fund An open ended equity linked saving scheme with a statutory lock in of 3 years and tax benefit
Kotak Balanced Advantage Fund Open ended Dynamic Asset Allocation Fund
Kotak Equity Arbitrage Fund An open ended scheme investing in arbitrage opportunities
Kotak Gold Fund An open ended fund of fund scheme investing in units of Kotak Gold Exchange Traded Fund
Kotak Gold ETF An open ended scheme replicating/ tracking physical gold prices
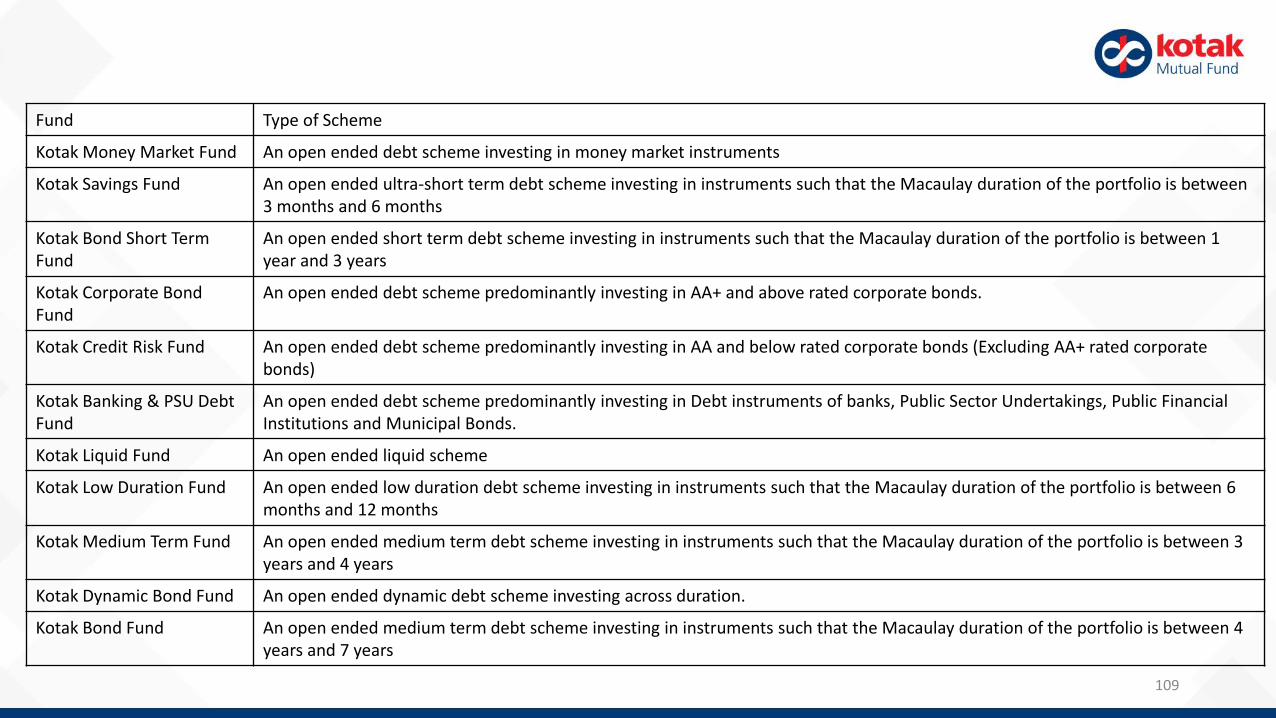
109
Fund Type of Scheme
Kotak Money Market Fund An open ended debt scheme investing in money market instruments
Kotak Savings Fund An open ended ultra-short term debt scheme investing in instruments such that the Macaulay duration of the portfolio is between 3 months and 6 months
Kotak Bond Short Term Fund
An open ended short term debt scheme investing in instruments such that the Macaulay duration of the portfolio is between 1 year and 3 years
Kotak Corporate Bond Fund
An open ended debt scheme predominantly investing in AA+ and above rated corporate bonds.
Kotak Credit Risk Fund An open ended debt scheme predominantly investing in AA and below rated corporate bonds (Excluding AA+ rated corporate bonds)
Kotak Banking & PSU Debt Fund
An open ended debt scheme predominantly investing in Debt instruments of banks, Public Sector Undertakings, Public Financial Institutions and Municipal Bonds.
Kotak Liquid Fund An open ended liquid scheme
Kotak Low Duration Fund An open ended low duration debt scheme investing in instruments such that the Macaulay duration of the portfolio is between 6months and 12 months
Kotak Medium Term Fund An open ended medium term debt scheme investing in instruments such that the Macaulay duration of the portfolio is between 3 years and 4 years
Kotak Dynamic Bond Fund An open ended dynamic debt scheme investing across duration.
Kotak Bond Fund An open ended medium term debt scheme investing in instruments such that the Macaulay duration of the portfolio is between 4 years and 7 years

*Investors should consult their financial advisors if in doubt about whether the product is suitable for them 110

*Investors should consult their financial advisors if in doubt about whether the product is suitable for them 111

*Investors should consult their financial advisors if in doubt about whether the product is suitable for them 112

*Investors should consult their financial advisors if in doubt about whether the product is suitable for them 113