MONTHLY LOG EXPORTS F.O.B. US$ MILLION Mix e d Rosew'd Ta un Te k 2000 2001 2002 AVERAGE EXPORT...
21
EXPORT STATISTICS 1997 – 2002 MONTHLY LOG EXPORTS F.O.B. US$ MILLION 0 5 10 15 20 25 30 35 40 JAN FEB MAR APR MAY JUN JUL AUG SEP OCT NOV DEC 1997 1998 1999 2000 2001 2002 MONTHLY LOG EXPORTS VOLUME M3’000 0 50 100 150 200 250 300 JAN FEB MAR APR MAY JUN JUL AUG SEP OCT NOV DEC 1997 1998 1999 2000 2001 2002
Transcript of MONTHLY LOG EXPORTS F.O.B. US$ MILLION Mix e d Rosew'd Ta un Te k 2000 2001 2002 AVERAGE EXPORT...

EXPORT STATISTICS 1997 – 2002
MONTHLY LOG EXPORTS F.O.B. US$ MILLION
0
5
10
15
20
25
30
35
40
JAN FEB MAR APR MAY JUN JUL AUG SEP OCT NOV DEC
199719981999200020012002
MONTHLY LOG EXPORTS VOLUME M3’000
0
50
100
150
200
250
300
JAN FEB MAR APR MAY JUN JUL AUG SEP OCT NOV DEC
199719981999200020012002

LOG EXPORTS BY DESTINATION
0
10
20
30
40
50
60
70
China Japan Korea India Taiwan Philipns Other
199719981999200020012002
1. Based on percentage of total log export volume. 2. China includes exports to Hong Kong. 3. In 2001 Other is comprised of Malaysia, Indonesia and Vietnam. Indonesia only in 2002.
LOG EXPORTS BY SPECIES (M3 %)
0
5
10
15
20
25
KWI CAL MAL MER TAU TER GP1 GP2 GP3 GP4
199719981999200020012002
1. GP1 includes all other group 1 species not graphed individually.

EXPORT STATISTICS 1992 - 2002
AVERAGE LOG EXPORT PRICE US$ / M3
0
20
40
60
80
100
120
140
160
180
1992 1993 1994 1995 1996 1997 1998 1999 2000 2001 2002
$/M3
LOG EXPORTS VOLUME IN M3’million
0
0.5
1
1.5
2
2.5
3
1992 1994 1996 1998 2000 2002
M3mil.

AVERAGE LOG EXPORT PRICES
0
20
40
60
80
100
120
140
160
180
200
1992 1993 1994 1995 1996 1997 1998 1999 2000 2001 2002
K/M3US$/M3
Exchange rates 1992 – 1996 Bank PNG Quarterly Economic Bulletin yearly rate 1997 – 2002 Actual average rates for log exports derived from SGS log export reports
KINA / US$ EXCHANGE RATES
0
0.2
0.4
0.6
0.8
1
1.2
1992 1994 1996 1998 2000 2002
K1=$

EXPORT TAX PAID K’million
020406080
100120140160180
1992 1994 1996 1998 2000 2002
K'mil.
1992 – 1996 Government PNG Budget papers 1997 – 2002 SGS log export reports
EXPORT TAX AS % OF F.O.B. VALUE
05
10152025303540
1992 1994 1996 1998 2000 2002
%FOB
Tax rates have been amended from 16-11-93, 3% increase, from 11-03-94, 13% increase, on and from 22-11-95, current revenue system introduced, the effective tax rates increased only slightly but a marginal tax scale based on FOB value in Kina was implemented 26-10-98, the first K130 of FOB value was exempted from tax 09-08-99, the exemption was withdrawn and 1995 rates reapplied 01-01-02, marginal tax rates were reduced by 5%

TOTAL F.O.B. VALUE LOG EXPORTS (million)
0
100
200
300
400
500
600
1992 1994 1996 1998 2000 2002
KinaUS $
F.O.B. EXPORT PRICE US$/M3 AND EXPORT TAX $/M3
0
20
40
60
80
100
120
140
160
180
1992 1993 1994 1995 1996 1997 1998 1999 2000 2001 2002
FOB $/M3Tax $/M3

Key Statistics Log Exports 1999 – 2002
1999 2000 2001 2002 Export Volume M3 1,983,852 1,992,527 1,556,220 1,853,550 Value FOB US$ 151,952,894 143,705,096 89,393,440 99,750,854 Value FOB Kina 385,572,125 383,746,252 283,089,897 367,043,757 Export Tax Paid Kina 100,597,156 135,853,442 95,770,091 112,692,564 Average Price US$/M3 76.60 72.12 57.44 53.82 Average Price Kina/M3 194.35 192.59 181.91 198.02 Average Tax Rate 26.1% 35.4% 33.8% 30.7%
NUMBER OF COMPANIES INVOLVED IN LOG EXPORT SUB-SECTOR
0
5
10
15
20
25
30
35
40
45
1997 1998 1999 2000 2001 2002 JUL '03

JAPANESE LOG IMPORTS 1992 – 2001 M3’million
0123456789
10
1992 1993 1994 1995 1996 1997 1998 1999 2000 2001
SouthseaNth AmericaRussiaN.Z.Africa/Europe
1.Southsea includes PNG, Malaysia, Indonesia, Solomon Islands. PNG’s share 2001, 20% (1997, 37.5%) 2.Source Japan Lumber Journal 31-5-02.
JAPANESE TIMBER IMPORTS 1992 – 2001 M3’million
0
1
2
3
4
5
6
7
8
1992 1993 1994 1995 1996 1997 1998 1999 2000 2001
SouthseaN AmericaRussiaN.Z.ChileEuropePlywood
1.Plywood from all sources (mainly Indonesia 2.7m.M3 and Malaysia 1.8m.M3). 2.Source Japan Lumber Journal 31-5-02.

CHINA FOREST PRODUCTS IMPORTS 1999 - 2000 US$billion
CHINA LOG IMPORTS YR 2000 M3’million
00.5
11.5
22.5
33.5
44.5
1999 2000
LogsTimberPlywoodVeneerPulp/Used PaperPaper/Paperboard
0
1
2
3
4
5
6
7
8
2000
RussiaMalaysiaGabonPNGIndonesiaManyamarGermanyFranceOthersTOTALHardwoodSoftwood

CHINA TIMBER IMPORTS YR 2000 M3’million
0
0.2
0.4
0.6
0.8
1
1.2
1.4
2000
IndonesiaUSRussiaMalaysiaCanadaNZOthers
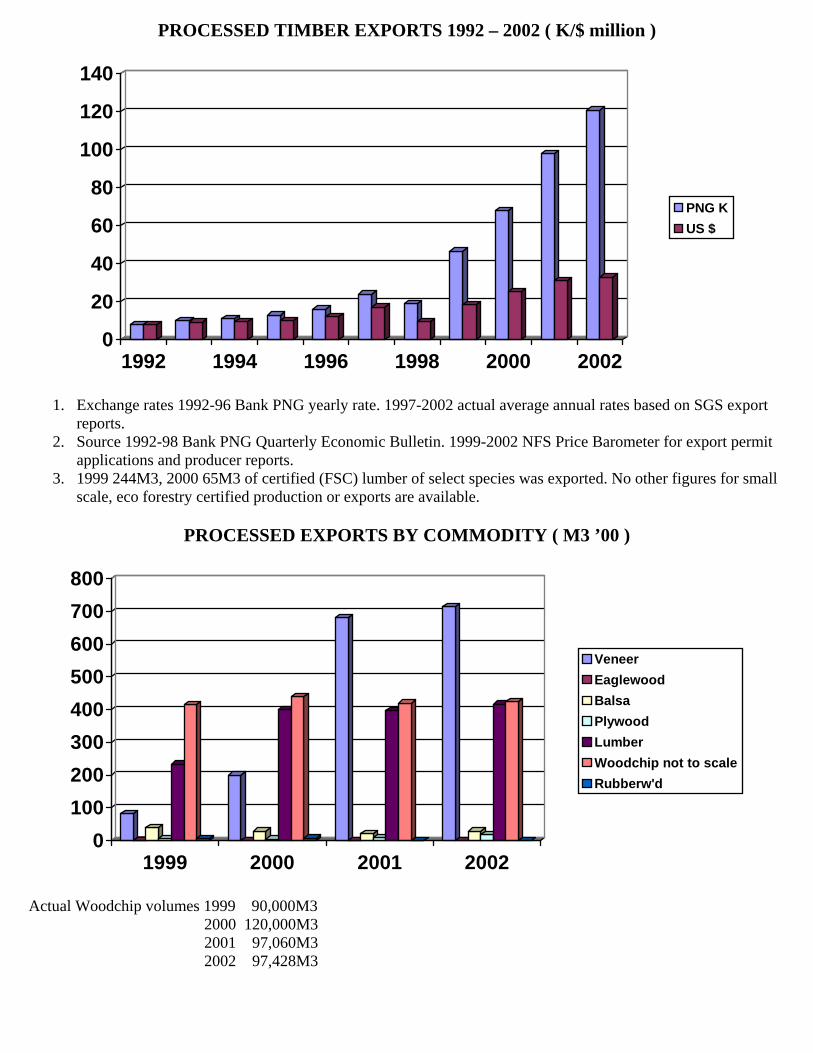
PROCESSED TIMBER EXPORTS 1992 – 2002 ( K/$ million )
0
20
40
60
80
100
120
140
1992 1994 1996 1998 2000 2002
PNG KUS $
1. Exchange rates 1992-96 Bank PNG yearly rate. 1997-2002 actual average annual rates based on SGS export
reports. 2. Source 1992-98 Bank PNG Quarterly Economic Bulletin. 1999-2002 NFS Price Barometer for export permit
applications and producer reports. 3. 1999 244M3, 2000 65M3 of certified (FSC) lumber of select species was exported. No other figures for small
scale, eco forestry certified production or exports are available.
PROCESSED EXPORTS BY COMMODITY ( M3 ’00 )
0100200300400500600700800
1999 2000 2001 2002
VeneerEaglewoodBalsaPlywoodLumberWoodchip not to scaleRubberw'd
Actual Woodchip volumes 1999 90,000M3
2000 120,000M3 2001 97,060M3 2002 97,428M3

PROCESSED EXPORTS BY VALUE ( US$ ‘000 )
02000400060008000
10000120001400016000
1999 2000 2001 2002
VeneerSand'wdBalsaPlywoodLumberWoodchipRubberw'd
LUMBER, RUBBERWOOD & BALSA EXPORTS BY DESTINATION
( US$’000 )
0
1000
2000
3000
4000
5000
6000
7000
Australi
a
Belgium
New C
al UKIndia
China
Malays
ia NZTah
iti
Taiwan
Indonesia
Other Asia
Europe
200020012002
1. Total value 2000 US$15.3m, 2001 US$16.2m, 2002 US$15.2m

LUMBER EXPORTS BY SPECIES M3
0
5000
10000
15000
20000
25000
Malas
Furn C
ompKwila
Pencil
Cdr
Other Grp
1Mixe
d
Rosew'd
Taun
Teak
200020012002
AVERAGE EXPORT PRICES MAJOR SPECIES US$/M3
0 200 400 600 800 1000
Balsa
Kempas
Kwila
Mixed
Rosew'd
Rubberw'd
Taun
Teak
200220012000

AVERAGE EXPORT PRICES MINOR SPECIES
& OTHER PRODUCTS US$/M3
0 100 200 300 400 500
Malas
Calo.
Plyw'd
Veneer
Woodchip
Walnut
Vitex
Pencil Cdr
200220012000

PLANTATION DEVELOPMENT AREAS PLANTED AS AT END OF YR, Ha’s
0 5000 10000 15000
Brown Rv
Bulolo
Gogol
Madang
Fayatina
Ialibu
Kainantu
Kaut
Kerevat
Kuriva
Lapegu
Open Bay
Stettin Bay
Ulabo
Wahgi
Galley Rch
Ulamona
2000199619741969
Source NFS Annual Reports 1969,1974, National Forest Board reports 1996, 2000. No new plantings in 2001.

PNG PLANTATION ESTATE TOTAL Ha’s AT END OF YEAR
0
10000
20000
30000
40000
50000
60000
70000
1969 1974 1996 2000
Ha's
1. Reliable figures are unavailable for areas established by private smallholders, mainly in East New Britain, for Balsawood production. Estimated area ranges up to 400 hectares. Charts do not include Balsa plantation figures.
PLANTATION DEVELOPMENT BY STATE/PRIVATE SECTOR AGENCIES
0%
20%
40%
60%
80%
100%
1969 1974 1996 2000
PrivateState

NEW PLANTATION AREAS DEVELOPED, Ha’s
-50000
500010000150002000025000300003500040000
To 1969 1970-74 1975-96 1997-2000
StatePrivate
PLANTATION RESOURCES BY SPECIES, END YR 2000, Ha’s
05000
10000150002000025000300003500040000
TeakPinus/Aurc.Rubberw'dHardwoods
Major hardwood species planted include E.sp, Saligna, Robusta, Deglupta & Grandis, A. Mangium, T. Brassii Minor hardwood plantings include Rosewood, Erima, Albizia F., Callophylum

COMMERCIAL GROSS WOOD VOLUMES AVAILABLE AT MATURITY M3’000 TOTAL VOLUME 15.2Million M3
0
2000
4000
6000
8000
10000
TeakPinus/Aurc.Rubberw'dHardwoods
Planting, thinning and felling cycles vary for different species and locations. Above estimates are based on average yields at maturity of 225M3/ha. Pinus and Rubberwood and 255M3/ha. for Teak and Hardwoods.

ANNUAL REVENUE FROM LOG EXPORTS K’million
PERCENTAGE SHARE OF ANNUAL REVENUE
0
100
200
300
400
500
600
1992 1993 1994 1995 1996 1997 1998 1999 2000 2001 2002
KiExLa
05
10152025303540
1992 1993 1994 1995 1996 1997 1998 1999 2000 2001 2002
Export TaxLandowners

ALLOCATION OF FOB VALUE PER M3
INDICATORS OF CAPITAL INVESTMENT IN CURRENT OPERATIONS
Note above – total cost to operator is cost of production plus loss.
-50
0
50
100
150
200
1992 1993 1994 1995 1996 1997 1998 1999 2000 2001 2002
FOB
US$
/M3 Los
InvCosLanExp
0
50
100
150
200
250
1992 1993 1994 1995 1996 1997 1998 1999 2000 2001
Uni
t Sal
es
Heavy EquiLogging Tru

PNG EXPORTS BY COMMODITY ( Source BPNG Quarterly Bulletin, SGS and NFS reports )
PNG KINA / US $ AVERAGE EXCHANGE RATE
0
500
1000
1500
2000
2500
1997 1998 1999 2000 2001 2002
K'm
illio
n
00.10.20.30.40.50.60.70.8
1997 1998 1999 2000 2001 2002
PNG Kina