Monthly energy review december 2013
211
-
Upload
correo-coleguitas -
Category
Documents
-
view
42 -
download
2
description
Monthly energy review december 2013
Transcript of Monthly energy review december 2013

DOE/EIA-0035(2013/12)
December 2013
Monthly Energy Review
www.eia.gov/mer
Monthly Energy Review
The Monthly Energy Review (MER) is the U.S. Energy Information Administration’s (EIA) primaryreport of recent and historical energy statistics. Included are statistics on total energy production,consumption, trade, and energy prices; overviews of petroleum, natural gas, coal, electricity,nuclear energy, renewable energy, and international petroleum; carbon dioxide emissions; and dataunit conversions.
Release of the MER is in keeping with responsibilities given to EIA in Public Law 95–91 (Depart-ment of Energy Organization Act), which states, in part, in Section 205(a)(2):
“The Administrator shall be responsible for carrying out a central, comprehen-sive, and unified energy data and information program which will collect, evalu-ate, assemble, analyze, and disseminate data and information....”
The MER is intended for use by Members of Congress, federal and state agencies, energy analysts,and the general public. EIA welcomes suggestions from readers regarding the content of the MERand other EIA publications.
Related Monthly Publications: Other monthly EIA reports are Petroleum SupplyMonthly, Petroleum Marketing Monthly, Natural Gas Monthly, and Electric Power Monthly. Formore information, contact EIA’s Office of Communications via email at [email protected].
Important Notes About the Data
Data Displayed: For tables beginning in 1949, annual data are usually displayed only in5-year increments between 1950 and 2000 in the tables in Portable Document Format (PDF) files;however, all annual data are shown in the Excel and comma-separated values (CSV) files. Also,only two to three years of monthly data are displayed in the PDF files; however, for many series,monthly data beginning with January 1973 are available in the Excel and CSV files.
Comprehensive Changes: Each month, most MER tables and figures carry a new monthof data, which is usually preliminary (and sometimes estimated or even forecast) and likely to berevised in the succeeding month.
Annual Data From 1949: In 2013, EIA expanded the MER to incorporate annual data asfar back as 1949 in those data tables that were previously published in both the Annual EnergyReview (AER) and MER. Analysts may wish to use the data in this report in conjunction with theAER which offers annual data beginning in 1949 for many related supplemental data series that arenot found in the MER. The AER is available at http://www.eia.gov/totalenergy/data/annual.
Electronic Access
The MER is available on EIA’s website in a variety of formats at http://www.eia.gov/totalenergy/data/monthly.
Full report and sections: PDF files Report tables: PDF files Table data (unrounded): Excel and CSV files Graphs: PDF files
Note: PDF files display selected annual and monthly data; Excel and CSV files display all availableannual and monthly data, often at a greater level of precision than the PDF files.
Timing of Release: The MER is posted on the EIA website no later than the last work day ofthe month at http://www.eia.gov/totalenergy/data/monthly.
Released: December 24, 2013

DOE/EIA-0035(2013/12)
Monthly Energy Review December 2013
U.S. Energy Information AdministrationOffice of Energy StatisticsU.S. Department of Energy
Washington, DC 20585
This report was prepared by the U.S. Energy Information Administration (EIA), the statistical and analytical agency within theU.S. Department of Energy. By law, EIA’s data, analyses, and forecasts are independent of approval by any other officer oremployee of the United States Government. The views in this report therefore should not be construed as representing those ofthe Department of Energy or other federal agencies.

Contacts
The Monthly Energy Review is prepared by the U.S. Energy Information Administration, Office of Energy Statistics, Officeof Survey Development and Statistical Integration, Integrated Energy Statistics Team, under the direction of Barbara T.Fichman, 202-586-5737 ([email protected]). Questions and comments specifically related to the Monthly EnergyReview may be addressed to Alexander Sun, 202-287-5948 ([email protected]).
For assistance in acquiring data, please contact EIA’s Office of Communications at 202-586-8800 ([email protected]).Questions about the collection, processing, or interpretation of the information may be directed to the following subjectspecialists:
Section 1. Energy Overview. . . . . . . . . . . . . . . . . . . . . . . . . . . . . . . . Dianne R. Dunn [email protected]
Section 2. Energy Consumption by Sector . . . . . . . . . . . . . . . . . . . . Dianne R. Dunn [email protected]
Section 3. Petroleum . . . . . . . . . . . . . . . . . . . . . . . . . . . . . . . . . . . . . . Jennifer Barrick [email protected]
Section 4. Natural Gas . . . . . . . . . . . . . . . . . . . . . . . . . . . . . . . . . . . . Amy Sweeney [email protected]
Section 5. Crude Oil and Natural Gas Resource Development . . . Robert Schmitt [email protected]
Section 6. Coal . . . . . . . . . . . . . . . . . . . . . . . . . . . . . . . . . . . . . . . . . . . Nicholas Paduano [email protected]
Section 7. Electricity . . . . . . . . . . . . . . . . . . . . . . . . . . . . . . . . . . . . . . Ronald S. Hankey [email protected]
Section 8. Nuclear Energy . . . . . . . . . . . . . . . . . . . . . . . . . . . . . . . . . Michele Simmons 202-586-9787 [email protected]
Section 9. Energy PricesPetroleum . . . . . . . . . . . . . . . . . . . . . . . . . . . . . . . . . . . . . . Maureen Klein 202-586-8013
Natural Gas . . . . . . . . . . . . . . . . . . . . . . . . . . . . . . . . . . . . . Amy Sweeney [email protected]
Average Retail Prices of Electricity . . . . . . . . . . . . . . . . . . Charlene Harris-Russell [email protected]
Cost of Fuel at Electric Generating Plants . . . . . . . . . . . . . .Rebecca Peterson [email protected]
Section 10. Renewable Energy . . . . . . . . . . . . . . . . . . . . . . . . . . . . . . . Peter Wong [email protected]
Section 11. International Petroleum . . . . . . . . . . . . . . . . . . . . . . . . . . Patricia Smith [email protected]
Section 12. Environment . . . . . . . . . . . . . . . . . . . . . . . . . . . . . . . . . . . .Perry Lindstrom [email protected]
ii U.S. Energy Information Administration / Monthly Energy Review December 2013
Contents
Page
Section 1. Energy Overview. . . . . . . . . . . . . . . . . . . . . . . . . . . . . . . . . . . . . . . . . . . . . 1
Section 2. Energy Consumption by Sector. . . . . . . . . . . . . . . . . . . . . . . . . . . . . . . . . 21
Section 3. Petroleum. . . . . . . . . . . . . . . . . . . . . . . . . . . . . . . . . . . . . . . . . . . . . . . . . . 35
Section 4. Natural Gas. . . . . . . . . . . . . . . . . . . . . . . . . . . . . . . . . . . . . . . . . . . . . . . . . 67
Section 5. Crude Oil and Natural Gas Resource Development. . . . . . . . . . . . . . . . . . 75
Section 6. Coal. . . . . . . . . . . . . . . . . . . . . . . . . . . . . . . . . . . . . . . . . . . . . . . . . . . . . . 81
Section 7. Electricity. . . . . . . . . . . . . . . . . . . . . . . . . . . . . . . . . . . . . . . . . . . . . . . . . . 91
Section 8. Nuclear Energy. . . . . . . . . . . . . . . . . . . . . . . . . . . . . . . . . . . . . . . . . . . . . 113
Section 9. Energy Prices. . . . . . . . . . . . . . . . . . . . . . . . . . . . . . . . . . . . . . . . . . . . . . 117
Section 10. Renewable Energy. . . . . . . . . . . . . . . . . . . . . . . . . . . . . . . . . . . . . . . . . . 135
Section 11. International Petroleum. . . . . . . . . . . . . . . . . . . . . . . . . . . . . . . . . . . . . . 147
Section 12. Environment. . . . . . . . . . . . . . . . . . . . . . . . . . . . . . . . . . . . . . . . . . . . . . . 157
Appendix A. British Thermal Unit Conversion Factors. . . . . . . . . . . . . . . . . . . . . . . . . 171
Appendix B. Metric Conversion Factors, Metric Prefixes, and Other
Physical Conversion Factors. . . . . . . . . . . . . . . . . . . . . . . . . . . . . . . . . . 183
Glossary . . . . . . . . . . . . . . . . . . . . . . . . . . . . . . . . . . . . . . . . . . . . . . . . . . . . . . . . . 187
U.S. Energy Information Administration / Monthly Energy Review December 2013 iii
Tables
PageSection 1. Energy Overview
1.1 Primary Energy Overview. . . . . . . . . . . . . . . . . . . . . . . . . . . . . . . . . . . . . . . . . . . . . . . . . . . . . . . . . . . . 31.2 Primary Energy Production by Source. . . . . . . . . . . . . . . . . . . . . . . . . . . . . . . . . . . . . . . . . . . . . . . . . . 51.3 Primary Energy Consumption by Source. . . . . . . . . . . . . . . . . . . . . . . . . . . . . . . . . . . . . . . . . . . . . . . . 71.4a Primary Energy Imports by Source. . . . . . . . . . . . . . . . . . . . . . . . . . . . . . . . . . . . . . . . . . . . . . . . . . . . 101.4b Primary Energy Exports by Source and Total Net Imports. . . . . . . . . . . . . . . . . . . . . . . . . . . . . . . . . . 111.5 Merchandise Trade Value. . . . . . . . . . . . . . . . . . . . . . . . . . . . . . . . . . . . . . . . . . . . . . . . . . . . . . . . . . . 131.6 Cost of Fuels to End Users in Real (1982–1984) Dollars. . . . . . . . . . . . . . . . . . . . . . . . . . . . . . . . . . . 151.7 Primary Energy Consumption per Real Dollar of Gross Domestic Product. . . . . . . . . . . . . . . . . . . . . 161.8 Motor Vehicle Mileage, Fuel Consumption, and Fuel Economy. . . . . . . . . . . . . . . . . . . . . . . . . . . . . 171.9 Heating Degree-Days by Census Division. . . . . . . . . . . . . . . . . . . . . . . . . . . . . . . . . . . . . . . . . . . . . . 181.10 Cooling Degree-Days by Census Division. . . . . . . . . . . . . . . . . . . . . . . . . . . . . . . . . . . . . . . . . . . . . . 19
Section 2. Energy Consumption by Sector2.1 Energy Consumption by Sector. . . . . . . . . . . . . . . . . . . . . . . . . . . . . . . . . . . . . . . . . . . . . . . . . . . . . . . 232.2 Residential Sector Energy Consumption. . . . . . . . . . . . . . . . . . . . . . . . . . . . . . . . . . . . . . . . . . . . . . . . 252.3 Commercial Sector Energy Consumption. . . . . . . . . . . . . . . . . . . . . . . . . . . . . . . . . . . . . . . . . . . . . . . 272.4 Industrial Sector Energy Consumption. . . . . . . . . . . . . . . . . . . . . . . . . . . . . . . . . . . . . . . . . . . . . . . . . 292.5 Transportation Sector Energy Consumption. . . . . . . . . . . . . . . . . . . . . . . . . . . . . . . . . . . . . . . . . . . . . 312.6 Electric Power Sector Energy Consumption. . . . . . . . . . . . . . . . . . . . . . . . . . . . . . . . . . . . . . . . . . . . . 33
Section 3. Petroleum3.1 Petroleum Overview . . . . . . . . . . . . . . . . . . . . . . . . . . . . . . . . . . . . . . . . . . . . . . . . . . . . . . . . . . . . . . . 373.2 Refinery and Blender Net Inputs and Net Production. . . . . . . . . . . . . . . . . . . . . . . . . . . . . . . . . . . . . . 393.3 Petroleum Trade
3.3a Overview. . . . . . . . . . . . . . . . . . . . . . . . . . . . . . . . . . . . . . . . . . . . . . . . . . . . . . . . . . . . . . . . . 413.3b Imports and Exports by Type. . . . . . . . . . . . . . . . . . . . . . . . . . . . . . . . . . . . . . . . . . . . . . . . . 433.3c Imports From OPEC Countries. . . . . . . . . . . . . . . . . . . . . . . . . . . . . . . . . . . . . . . . . . . . . . . . 443.3d Imports From Non-OPEC Countries. . . . . . . . . . . . . . . . . . . . . . . . . . . . . . . . . . . . . . . . . . . . 45
3.4 Petroleum Stocks. . . . . . . . . . . . . . . . . . . . . . . . . . . . . . . . . . . . . . . . . . . . . . . . . . . . . . . . . . . . . . . . . . 473.5 Petroleum Products Supplied by Type. . . . . . . . . . . . . . . . . . . . . . . . . . . . . . . . . . . . . . . . . . . . . . . . . 493.6 Heat Content of Petroleum Products Supplied by Type. . . . . . . . . . . . . . . . . . . . . . . . . . . . . . . . . . . . 513.7 Petroleum Consumption
3.7a Residential and Commercial Sectors. . . . . . . . . . . . . . . . . . . . . . . . . . . . . . . . . . . . . . . . . . . . 533.7b Industrial Sector. . . . . . . . . . . . . . . . . . . . . . . . . . . . . . . . . . . . . . . . . . . . . . . . . . . . . . . . . . . 543.7c Transportation and Electric Power Sectors. . . . . . . . . . . . . . . . . . . . . . . . . . . . . . . . . . . . . . . 55
3.8 Heat Content of Petroleum Consumption3.8a Residential and Commercial Sectors. . . . . . . . . . . . . . . . . . . . . . . . . . . . . . . . . . . . . . . . . . . . 583.8b Industrial Sector. . . . . . . . . . . . . . . . . . . . . . . . . . . . . . . . . . . . . . . . . . . . . . . . . . . . . . . . . . . 593.8c Transportation and Electric Power Sectors. . . . . . . . . . . . . . . . . . . . . . . . . . . . . . . . . . . . . . . 60
Section 4. Natural Gas4.1 Natural Gas Overview. . . . . . . . . . . . . . . . . . . . . . . . . . . . . . . . . . . . . . . . . . . . . . . . . . . . . . . . . . . . . . 694.2 Natural Gas Trade by Country . . . . . . . . . . . . . . . . . . . . . . . . . . . . . . . . . . . . . . . . . . . . . . . . . . . . . . . 704.3 Natural Gas Consumption by Sector. . . . . . . . . . . . . . . . . . . . . . . . . . . . . . . . . . . . . . . . . . . . . . . . . . . 714.4 Natural Gas in Underground Storage. . . . . . . . . . . . . . . . . . . . . . . . . . . . . . . . . . . . . . . . . . . . . . . . . . 72
Section 5. Crude Oil and Natural Gas Resource Development5.1 Crude Oil and Natural Gas Drilling Activity Measurements. . . . . . . . . . . . . . . . . . . . . . . . . . . . . . . . 775.2 Crude Oil and Natural Gas Exploratory and Development Wells. . . . . . . . . . . . . . . . . . . . . . . . . . . . . 78
iv U.S. Energy Information Administration / Monthly Energy Review December 2013
Tables
Page
Section 6. Coal6.1 Coal Overview. . . . . . . . . . . . . . . . . . . . . . . . . . . . . . . . . . . . . . . . . . . . . . . . . . . . . . . . . . . . . . . . . . . . 836.2 Coal Consumption by Sector. . . . . . . . . . . . . . . . . . . . . . . . . . . . . . . . . . . . . . . . . . . . . . . . . . . . . . . . . 846.3 Coal Stocks by Sector. . . . . . . . . . . . . . . . . . . . . . . . . . . . . . . . . . . . . . . . . . . . . . . . . . . . . . . . . . . . . . 85
Section 7. Electricity7.1 Electricity Overview. . . . . . . . . . . . . . . . . . . . . . . . . . . . . . . . . . . . . . . . . . . . . . . . . . . . . . . . . . . . . . . 937.2 Electricity Net Generation
7.2a Total (All Sectors). . . . . . . . . . . . . . . . . . . . . . . . . . . . . . . . . . . . . . . . . . . . . . . . . . . . . . . . . . 957.2b Electric Power Sector. . . . . . . . . . . . . . . . . . . . . . . . . . . . . . . . . . . . . . . . . . . . . . . . . . . . . . . 967.2c Commercial and Industrial Sectors. . . . . . . . . . . . . . . . . . . . . . . . . . . . . . . . . . . . . . . . . . . . . 97
7.3 Consumption of Combustible Fuels for Electricity Generation7.3a Total (All Sectors). . . . . . . . . . . . . . . . . . . . . . . . . . . . . . . . . . . . . . . . . . . . . . . . . . . . . . . . . . 997.3b Electric Power Sector. . . . . . . . . . . . . . . . . . . . . . . . . . . . . . . . . . . . . . . . . . . . . . . . . . . . . . 1007.3c Commercial and Industrial Sectors (Selected Fuels). . . . . . . . . . . . . . . . . . . . . . . . . . . . . . 101
7.4 Consumption of Combustible Fuels for Electricity Generation and Useful Thermal Output7.4a Total (All Sectors). . . . . . . . . . . . . . . . . . . . . . . . . . . . . . . . . . . . . . . . . . . . . . . . . . . . . . . . . 1037.4b Electric Power Sector. . . . . . . . . . . . . . . . . . . . . . . . . . . . . . . . . . . . . . . . . . . . . . . . . . . . . . 1047.4c Commercial and Industrial Sectors (Selected Fuels). . . . . . . . . . . . . . . . . . . . . . . . . . . . 105
7.5 Stocks of Coal and Petroleum: Electric Power Sector. . . . . . . . . . . . . . . . . . . . . . . . . . . . . . . . . . . . 1077.6 Electricity End Use. . . . . . . . . . . . . . . . . . . . . . . . . . . . . . . . . . . . . . . . . . . . . . . . . . . . . . . . . . . . . . . 109
Section 8. Nuclear Energy8.1 Nuclear Energy Overview. . . . . . . . . . . . . . . . . . . . . . . . . . . . . . . . . . . . . . . . . . . . . . . . . . . . . . . . . . 115
Section 9. Energy Prices9.1 Crude Oil Price Summary. . . . . . . . . . . . . . . . . . . . . . . . . . . . . . . . . . . . . . . . . . . . . . . . . . . . . . . . . . 1199.2 F.O.B. Costs of Crude Oil Imports From Selected Countries. . . . . . . . . . . . . . . . . . . . . . . . . . . . . . . 1209.3 Landed Costs of Crude Oil Imports From Selected Countries. . . . . . . . . . . . . . . . . . . . . . . . . . . . . . 1219.4 Motor Gasoline Retail Prices, U.S. City Average. . . . . . . . . . . . . . . . . . . . . . . . . . . . . . . . . . . . . . . . 1229.5 Refiner Prices of Residual Fuel Oil. . . . . . . . . . . . . . . . . . . . . . . . . . . . . . . . . . . . . . . . . . . . . . . . . . . 1239.6 Refiner Prices of Petroleum Products for Resale. . . . . . . . . . . . . . . . . . . . . . . . . . . . . . . . . . . . . . . . 1249.7 Refiner Prices of Petroleum Products to End Users. . . . . . . . . . . . . . . . . . . . . . . . . . . . . . . . . . . . . . 1259.8 Average Retail Prices of Electricity. . . . . . . . . . . . . . . . . . . . . . . . . . . . . . . . . . . . . . . . . . . . . . . . . . 1279.9 Cost of Fossil-Fuel Receipts at Electric Generating Plants. . . . . . . . . . . . . . . . . . . . . . . . . . . . . . . . . 1299.10 Natural Gas Prices. . . . . . . . . . . . . . . . . . . . . . . . . . . . . . . . . . . . . . . . . . . . . . . . . . . . . . . . . . . . . . . . 131
Section 10. Renewable Energy10.1 Renewable Energy Production and Consumption by Source. . . . . . . . . . . . . . . . . . . . . . . . . . . . . . . 13710.2 Renewable Energy Consumption
10.2a Residential and Commercial Sectors. . . . . . . . . . . . . . . . . . . . . . . . . . . . . . . . . . . . . . . . . . . 13810.2b Industrial and Transportation Sectors. . . . . . . . . . . . . . . . . . . . . . . . . . . . . . . . . . . . . . . . . . 13910.2c Electric Power Sector . . . . . . . . . . . . . . . . . . . . . . . . . . . . . . . . . . . . . . . . . . . . . . . . . . . . . 140
10.3 Fuel Ethanol Overview. . . . . . . . . . . . . . . . . . . . . . . . . . . . . . . . . . . . . . . . . . . . . . . . . . . . . . . . . . . . 14110.4 Biodiesel Overview. . . . . . . . . . . . . . . . . . . . . . . . . . . . . . . . . . . . . . . . . . . . . . . . . . . . . . . . . . . . . . 142
U.S. Energy Information Administration / Monthly Energy Review December 2013 v
Tables
Page
Section 11. International Petroleum 11.1 World Crude Oil Production
11.1a OPEC Members. . . . . . . . . . . . . . . . . . . . . . . . . . . . . . . . . . . . . . . . . . . . . . . . . . . . . . . . . . 15011.1b Persian Gulf Nations, Non-OPEC, and World. . . . . . . . . . . . . . . . . . . . . . . . . . . . . . . . . . . 151
11.2 Petroleum Consumption in OECD Countries. . . . . . . . . . . . . . . . . . . . . . . . . . . . . . . . . . . . . . . . . . . 15311.3 Petroleum Stocks in OECD Countries. . . . . . . . . . . . . . . . . . . . . . . . . . . . . . . . . . . . . . . . . . . . . . . . 155
Section 12. Environment12.1 Carbon Dioxide Emissions From Energy Consumption by Source . . . . . . . . . . . . . . . . . . . . . . . . . . 15912.2 Carbon Dioxide Emissions From Energy Consumption: Residential Sector . . . . . . . . . . . . . . . . . . 16112.3 Carbon Dioxide Emissions From Energy Consumption: Commercial Sector. . . . . . . . . . . . . . . . . . 16212.4 Carbon Dioxide Emissions From Energy Consumption: Industrial Sector. . . . . . . . . . . . . . . . . . . . 16312.5 Carbon Dioxide Emissions From Energy Consumption: Transportation Sector. . . . . . . . . . . . . . . . 16412.6 Carbon Dioxide Emissions From Energy Consumption: Electric Power Sector. . . . . . . . . . . . . . . . 16512.7 Carbon Dioxide Emissions From Biomass Energy Consumption . . . . . . . . . . . . . . . . . . . . . . . . . . . 166
Appendix A. British Thermal Unit Conversion FactorsA1. Approximate Heat Content of Petroleum Products. . . . . . . . . . . . . . . . . . . . . . . . . . . . . . . . . . . . . . 171A2. Approximate Heat Content of Petroleum Production, Imports, and Exports. . . . . . . . . . . . . . . . . . . 172A3. Approximate Heat Content of Petroleum Consumption and Biofuels Production. . . . . . . . . . . . . . . 173A4. Approximate Heat Content of Natural Gas. . . . . . . . . . . . . . . . . . . . . . . . . . . . . . . . . . . . . . . . . . . . 174A5. Approximate Heat Content of Coal and Coal Coke. . . . . . . . . . . . . . . . . . . . . . . . . . . . . . . . . . . . . . 175A6. Approximate Heat Rates for Electricity, and Heat Content of Electricity. . . . . . . . . . . . . . . . . . . . . 176
Appendix B. Metric Conversion Factors, Metric Prefixes, and Other Physical Conversion FactorsB1. Metric Conversion Factors. . . . . . . . . . . . . . . . . . . . . . . . . . . . . . . . . . . . . . . . . . . . . . . . . . . . . . . . . 184B2. Metric Prefixes. . . . . . . . . . . . . . . . . . . . . . . . . . . . . . . . . . . . . . . . . . . . . . . . . . . . . . . . . . . . . . . . . . 185B3. Other Physical Conversion Factors. . . . . . . . . . . . . . . . . . . . . . . . . . . . . . . . . . . . . . . . . . . . . . . . . . 185
vi U.S. Energy Information Administration / Monthly Energy Review December 2013
Figures
PageSection 1. Energy Overview
1.1 Primary Energy Overview. . . . . . . . . . . . . . . . . . . . . . . . . . . . . . . . . . . . . . . . . . . . . . . . . . . . . . . . . . . . 21.2 Primary Energy Production. . . . . . . . . . . . . . . . . . . . . . . . . . . . . . . . . . . . . . . . . . . . . . . . . . . . . . . . . . . 41.3 Primary Energy Consumption. . . . . . . . . . . . . . . . . . . . . . . . . . . . . . . . . . . . . . . . . . . . . . . . . . . . . . . . . 61.4a Primary Energy Imports and Exports. . . . . . . . . . . . . . . . . . . . . . . . . . . . . . . . . . . . . . . . . . . . . . . . . . . 81.4b Primary Energy Net Imports. . . . . . . . . . . . . . . . . . . . . . . . . . . . . . . . . . . . . . . . . . . . . . . . . . . . . . . . . . 91.5 Merchandise Trade Value. . . . . . . . . . . . . . . . . . . . . . . . . . . . . . . . . . . . . . . . . . . . . . . . . . . . . . . . . . . 121.6 Cost of Fuels to End Users in Real (1982–1984) Dollars. . . . . . . . . . . . . . . . . . . . . . . . . . . . . . . . . . . 141.7 Primary Energy Consumption per Real Dollar of Gross Domestic Product. . . . . . . . . . . . . . . . . . . . . 161.8 Motor Vehicle Fuel Economy. . . . . . . . . . . . . . . . . . . . . . . . . . . . . . . . . . . . . . . . . . . . . . . . . . . . . . . . 17
Section 2. Energy Consumption by Sector2.1 Energy Consumption by Sector. . . . . . . . . . . . . . . . . . . . . . . . . . . . . . . . . . . . . . . . . . . . . . . . . . . . . . . 222.2 Residential Sector Energy Consumption. . . . . . . . . . . . . . . . . . . . . . . . . . . . . . . . . . . . . . . . . . . . . . . . 242.3 Commercial Sector Energy Consumption. . . . . . . . . . . . . . . . . . . . . . . . . . . . . . . . . . . . . . . . . . . . . . . 262.4 Industrial Sector Energy Consumption. . . . . . . . . . . . . . . . . . . . . . . . . . . . . . . . . . . . . . . . . . . . . . . . . 282.5 Transportation Sector Energy Consumption. . . . . . . . . . . . . . . . . . . . . . . . . . . . . . . . . . . . . . . . . . . . . 302.6 Electric Power Sector Energy Consumption. . . . . . . . . . . . . . . . . . . . . . . . . . . . . . . . . . . . . . . . . . . . . 32
Section 3. Petroleum3.1 Petroleum Overview . . . . . . . . . . . . . . . . . . . . . . . . . . . . . . . . . . . . . . . . . . . . . . . . . . . . . . . . . . . . . . 363.2 Refinery and Blender Net Inputs and Net Production. . . . . . . . . . . . . . . . . . . . . . . . . . . . . . . . . . . . . . 383.3 Petroleum Trade
3.3a Overview. . . . . . . . . . . . . . . . . . . . . . . . . . . . . . . . . . . . . . . . . . . . . . . . . . . . . . . . . . . . . . . . . . 40 3.3b Imports. . . . . . . . . . . . . . . . . . . . . . . . . . . . . . . . . . . . . . . . . . . . . . . . . . . . . . . . . . . . . . . . . . . . 42
3.4 Petroleum Stocks. . . . . . . . . . . . . . . . . . . . . . . . . . . . . . . . . . . . . . . . . . . . . . . . . . . . . . . . . . . . . . . . . . 463.5 Petroleum Products Supplied by Type. . . . . . . . . . . . . . . . . . . . . . . . . . . . . . . . . . . . . . . . . . . . . . . . . 483.6 Heat Content of Petroleum Products Supplied by Type. . . . . . . . . . . . . . . . . . . . . . . . . . . . . . . . . . . . 503.7 Petroleum Consumption by Sector. . . . . . . . . . . . . . . . . . . . . . . . . . . . . . . . . . . . . . . . . . . . . . . . . . . . 523.8a Heat Content of Petroleum Consumption by End-User Sector. . . . . . . . . . . . . . . . . . . . . . . . . . . . . . . 563.8b Heat Content of Petroleum Consumption by End-User Sector, Monthly. . . . . . . . . . . . . . . . . . . . . . . 57
Section 4. Natural Gas4.1 Natural Gas. . . . . . . . . . . . . . . . . . . . . . . . . . . . . . . . . . . . . . . . . . . . . . . . . . . . . . . . . . . . . . . . . . . . . . 68
Section 5. Crude Oil and Natural Gas Resource Development5.1 Crude Oil and Natural Gas Resource Development Indicators. . . . . . . . . . . . . . . . . . . . . . . . . . . . . . . 76
Section 6. Coal6.1 Coal. . . . . . . . . . . . . . . . . . . . . . . . . . . . . . . . . . . . . . . . . . . . . . . . . . . . . . . . . . . . . . . . . . . . . . . . . . . . 82
Section 7. Electricity7.1 Electricity Overview. . . . . . . . . . . . . . . . . . . . . . . . . . . . . . . . . . . . . . . . . . . . . . . . . . . . . . . . . . . . . . . 927.2 Electricity Net Generation. . . . . . . . . . . . . . . . . . . . . . . . . . . . . . . . . . . . . . . . . . . . . . . . . . . . . . . . . . . 947.3 Consumption of Selected Combustible Fuels for Electricity Generation. . . . . . . . . . . . . . . . . . . . . . . 987.4 Consumption of Selected Combustible Fuels for Electricity Generation and
Useful Thermal Output. . . . . . . . . . . . . . . . . . . . . . . . . . . . . . . . . . . . . . . . . . . . . . . . . . . . . . . . . . 1027.5 Stocks of Coal and Petroleum: Electric Power Sector. . . . . . . . . . . . . . . . . . . . . . . . . . . . . . . . . . . . 1067.6 Electricity End Use. . . . . . . . . . . . . . . . . . . . . . . . . . . . . . . . . . . . . . . . . . . . . . . . . . . . . . . . . . . . . . . 108
U.S. Energy Information Administration / Monthly Energy Review December 2013 vii
Figures
Page
Section 8. Nuclear Energy8.1 Nuclear Energy Overview. . . . . . . . . . . . . . . . . . . . . . . . . . . . . . . . . . . . . . . . . . . . . . . . . . . . . . . . . . 114
Section 9. Energy Prices9.1 Petroleum Prices. . . . . . . . . . . . . . . . . . . . . . . . . . . . . . . . . . . . . . . . . . . . . . . . . . . . . . . . . . . . . . . . . 1189.2 Average Retail Prices of Electricity. . . . . . . . . . . . . . . . . . . . . . . . . . . . . . . . . . . . . . . . . . . . . . . . . . 1269.3 Cost of Fossil-Fuel Receipts at Electric Generating Plants. . . . . . . . . . . . . . . . . . . . . . . . . . . . . . . . . 1289.4 Natural Gas Prices. . . . . . . . . . . . . . . . . . . . . . . . . . . . . . . . . . . . . . . . . . . . . . . . . . . . . . . . . . . . . . . . 130
Section 10. Renewable Energy 10.1 Renewable Energy Consumption. . . . . . . . . . . . . . . . . . . . . . . . . . . . . . . . . . . . . . . . . . . . . . . . . . . . 136
Sectionr 11. International Petroleum11.1 World Crude Oil Production
11.1a Overview. . . . . . . . . . . . . . . . . . . . . . . . . . . . . . . . . . . . . . . . . . . . . . . . . . . . . . . . . . . . . . . . 14811.1b By Selected Country. . . . . . . . . . . . . . . . . . . . . . . . . . . . . . . . . . . . . . . . . . . . . . . . . . . . . . . 149
11.2 Petroleum Consumption in OECD Countries. . . . . . . . . . . . . . . . . . . . . . . . . . . . . . . . . . . . . . . . . . . 15211.3 Petroleum Stocks in OECD Countries. . . . . . . . . . . . . . . . . . . . . . . . . . . . . . . . . . . . . . . . . . . . . . . . 154
Section 12. Environment12.1 Carbon Dioxide Emissions From Energy Consumption by Source . . . . . . . . . . . . . . . . . . . . . . . . . . 15812.2 Carbon Dioxide Emissions From Energy Consumption by Sector. . . . . . . . . . . . . . . . . . . . . . . . . . . 160
viii U.S. Energy Information Administration / Monthly Energy Review December 2013

Energy Consumption by Sector1. EnergyOverview
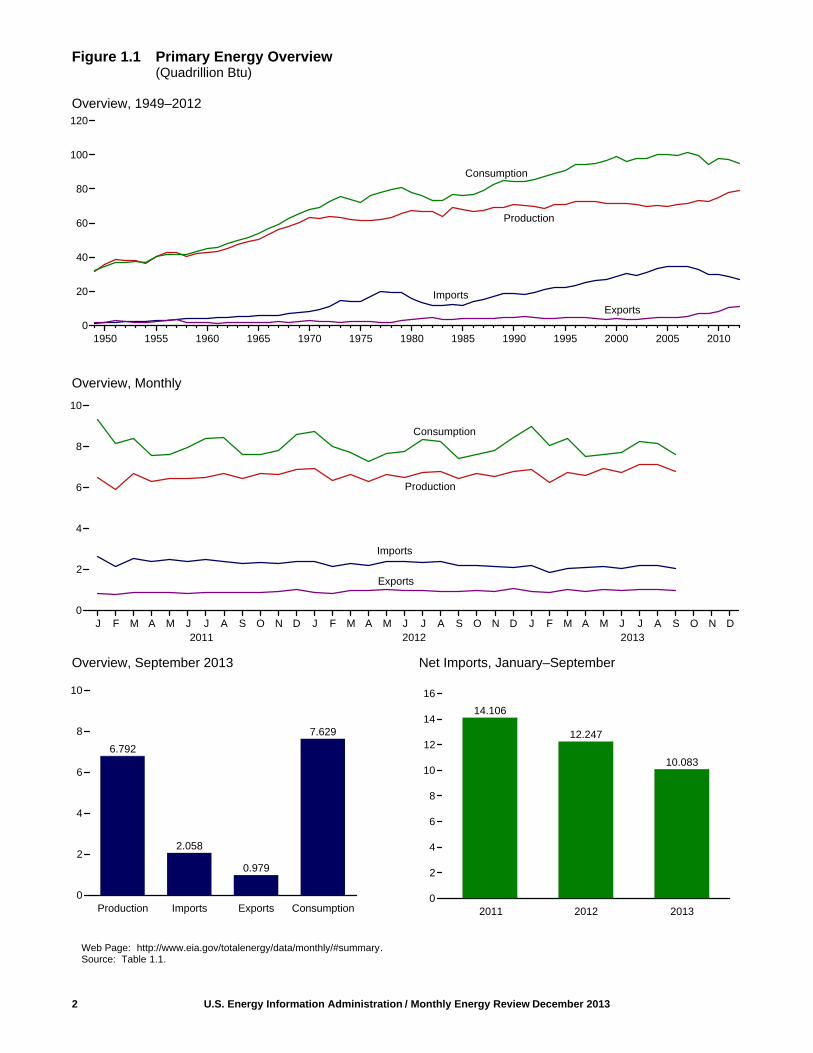
Figure 1.1 Primary Energy Overview(Quadrillion Btu)
Overview, 1949–2012
Overview, Monthly
Overview, September 2013 Net Imports, January–September
Web Page: http://www.eia.gov/totalenergy/data/monthly/#summary.Source: Table 1.1.
2 U.S. Energy Information Administration / Monthly Energy Review December 2013
14.106
12.247
10.083
2011 2012 20130
2
4
6
8
10
12
14
16
1950 1955 1960 1965 1970 1975 1980 1985 1990 1995 2000 2005 20100
20
40
60
80
100
120
Consumption
Production
Imports
Exports
2011 2012 2013J F M A M J J A S O N D J F M A M J J A S O N D J F M A M J J A S O N D
0
2
4
6
8
10
Consumption
Production
Imports
Exports
6.792
2.058
0.979
7.629
Production Imports Exports Consumption0
2
4
6
8
10

U.S. Energy Information Administration / Monthly Energy Review December 2013 3
Table 1.1 Primary Energy Overview (Quadrillion Btu)
Production TradeStock
Changeand
Otherd
Consumption
FossilFuelsa
NuclearElectricPower
Renew-able
Energyb Total Imports ExportsNet
ImportscFossilFuelse
NuclearElectricPower
Renew-able
Energyb Totalf
1950 Total .................... 32.563 0.000 2.978 35.540 1.913 1.465 0.448 -1.372 31.632 0.000 2.978 34.6161955 Total .................... 37.364 .000 2.784 40.148 2.790 2.286 .504 -.444 37.410 .000 2.784 40.2081960 Total .................... 39.869 .006 2.928 42.803 4.188 1.477 2.710 -.427 42.137 .006 2.928 45.0861965 Total .................... 47.235 .043 3.396 50.674 5.892 1.829 4.063 -.722 50.577 .043 3.396 54.0151970 Total .................... 59.186 .239 4.070 63.495 8.342 2.632 5.709 -1.367 63.522 .239 4.070 67.8381975 Total .................... 54.733 1.900 4.687 61.320 14.032 2.323 11.709 -1.065 65.357 1.900 4.687 71.9651980 Total .................... 59.008 2.739 5.428 67.175 15.796 3.695 12.101 -1.210 69.828 2.739 5.428 78.0671985 Total .................... 57.539 4.076 6.084 67.698 11.781 4.196 7.584 1.110 66.093 4.076 6.084 76.3921990 Total .................... 58.560 6.104 6.041 70.705 18.817 4.752 14.065 -.284 72.332 6.104 6.041 84.4851995 Total .................... 57.540 7.075 6.558 71.174 22.260 4.511 17.750 2.105 77.259 7.075 6.560 91.0292000 Total .................... 57.366 7.862 6.104 71.332 28.973 4.006 24.967 2.515 84.731 7.862 6.106 98.8142001 Total .................... 58.541 8.029 5.164 71.735 30.157 3.771 26.386 -1.953 82.902 8.029 5.163 96.1682002 Total .................... 56.834 8.145 5.734 70.713 29.408 3.669 25.739 1.193 83.699 8.145 5.729 97.6452003 Total .................... 56.033 R 7.960 5.947 R 69.939 31.061 4.054 27.007 .998 84.014 R 7.960 5.948 97.9432004 Total .................... 55.942 R 8.223 6.069 R 70.234 33.544 4.434 29.110 .817 85.819 R 8.223 6.081 R 100.1612005 Total .................... 55.044 8.161 6.229 69.434 34.709 4.560 30.149 .698 85.794 8.161 6.242 100.2822006 Total .................... 55.938 8.215 6.599 R 70.751 34.679 4.873 29.806 -.929 84.702 8.215 6.649 R 99.6292007 Total .................... 56.436 R 8.459 6.528 R 71.422 34.704 5.483 29.220 .675 86.211 R 8.459 6.541 R 101.3172008 Total .................... 57.587 R 8.426 7.219 R 73.233 32.993 7.063 25.931 .129 83.551 R 8.426 7.202 R 99.2922009 Total .................... 56.670 R 8.355 7.655 R 72.680 29.706 6.966 22.740 -.824 78.487 R 8.355 7.638 R 94.5962010 Total .................... 58.207 8.434 8.128 74.769 29.877 8.234 21.643 1.604 81.412 8.434 8.081 98.016
2011 January ................ 4.982 .761 .747 6.490 2.642 .841 1.801 1.035 7.824 .761 .731 9.326 February .............. 4.501 .678 .710 5.889 2.116 .759 1.357 .890 6.747 .678 .703 8.136 March ................... 5.165 .687 .816 6.668 2.528 .880 1.648 .065 6.880 .687 .806 8.381 April ..................... 4.912 .571 .813 6.296 2.401 .878 1.523 -.280 6.157 .571 .804 7.539 May ...................... 5.002 .597 .832 6.431 2.487 .847 1.640 -.459 6.178 .597 .826 7.613 June ..................... 4.920 .683 .825 6.427 2.407 .818 1.588 -.091 6.407 .683 .824 7.925 July ...................... 4.941 .757 .792 6.490 2.493 .854 1.639 .278 6.852 .757 .782 8.408 August ................. 5.209 .746 .742 6.697 2.395 .879 1.515 .217 6.927 .746 .741 8.430 September ........... 5.054 .700 .677 6.431 2.285 .892 1.393 -.235 6.209 .700 .670 7.589 October ................ 5.302 .663 .708 6.673 2.344 .891 1.453 -.515 6.240 .663 .699 7.611 November ............ 5.238 .675 .738 6.650 2.264 .894 1.370 -.212 6.398 .675 .727 7.808 December ............ 5.339 .752 .770 6.861 2.358 1.026 1.333 .408 7.078 .752 .761 8.602 Total .................... 60.563 8.269 9.170 78.002 28.720 10.459 18.261 1.103 79.896 8.269 9.074 97.366
2012 January ................ R 5.402 R .758 R .773 R 6.933 2.361 .858 1.502 .276 R 7.190 R .758 R .752 R 8.711 February .............. R 4.987 R .669 R .694 R 6.350 2.142 .830 1.313 R .340 R 6.642 R .669 R .682 R 8.003 March ................... R 5.213 R .647 R .793 6.653 2.296 .960 1.336 R -.274 R 6.272 R .647 R .786 R 7.715 April ..................... R 4.940 .585 R .766 R 6.291 2.211 .987 1.224 R -.257 R 5.898 .585 R .762 R 7.258 May ...................... R 5.155 R .651 R .807 R 6.612 2.392 1.000 1.393 R -.359 R 6.177 R .651 R .804 R 7.646 June ..................... R 5.017 R .683 R .773 R 6.473 2.371 .985 1.386 R -.092 R 6.296 R .683 R .773 R 7.766 July ...................... R 5.257 R .724 R .744 R 6.725 2.354 .973 1.381 R .217 R 6.835 R .724 R .745 R 8.323 August ................. R 5.325 R .729 R .713 R 6.768 2.361 .940 1.420 R .076 R 6.798 R .729 R .719 R 8.264 September ........... R 5.110 R .676 R .645 R 6.431 2.199 .906 1.293 R -.326 R 6.064 R .676 R .644 R 7.398 October ................ R 5.377 R .626 R .679 R 6.681 2.176 .944 1.232 R -.307 R 6.284 R .626 R .684 R 7.606 November ............ R 5.264 R .594 R .684 R 6.543 2.119 .930 1.189 R .068 6.507 R .594 R .684 R 7.799 December ............ R 5.270 R .719 .767 R 6.756 2.093 1.043 1.050 R .620 R 6.931 R .719 .764 R 8.425 Total .................... R 62.317 R 8.062 R 8.838 R 79.216 27.075 11.357 15.718 R -.019 R 77.894 R 8.062 R 8.798 R 94.915
2013 January ................ R 5.340 R .748 R .780 R 6.869 2.194 .894 1.300 R .802 7.429 R .748 R .779 R 8.970 February .............. R 4.890 R .644 R .693 R 6.227 1.826 .858 .968 R .826 6.670 R .644 R .694 R 8.021 March ................... R 5.334 R .660 R .756 R 6.750 2.047 1.031 1.016 R .612 6.947 R .660 R .756 R 8.377 April ..................... R 5.192 R .595 R .796 R 6.583 2.074 .912 1.162 R -.230 6.112 R .595 R .798 R 7.516 May ...................... R 5.407 R .659 R .845 R 6.911 2.154 1.008 1.146 R -.460 6.077 R .659 R .845 R 7.596 June ..................... R 5.216 R .696 R .807 R 6.720 2.058 .964 1.094 R -.093 6.199 R .696 R .808 R 7.721 July ...................... 5.580 R .739 R .799 R 7.117 2.197 1.036 1.161 R -.027 6.697 R .739 R .796 R 8.251 August ................. R 5.635 R .748 R .723 7.106 2.186 1.029 1.158 R -.100 6.676 R .748 R .721 R 8.163 September ........... E 5.421 .690 .681 E 6.792 E 2.058 E .979 E 1.079 -.242 E 6.240 .690 .684 E 7.629 9-Month Total ..... E 48.016 6.178 6.881 E 61.074 E 18.794 E 8.711 E 10.083 1.088 E 59.048 6.178 6.881 E 72.245
2012 9-Month Total ..... 46.406 6.123 6.708 59.236 20.687 8.439 12.247 -.399 58.172 6.123 6.665 71.0842011 9-Month Total ..... 44.685 6.180 6.954 57.818 21.754 7.648 14.106 1.421 60.180 6.180 6.888 73.345
a Coal, natural gas (dry), crude oil, and natural gas plant liquids.b See Tables 10.1–10.2c for notes on series components and estimation; and
see Note, "Renewable Energy Production and Consumption," at end of Section 10.c Net imports equal imports minus exports.d Includes petroleum stock change and adjustments; natural gas net storage
withdrawals and balancing item; coal stock change, losses, and unaccounted for;fuel ethanol stock change; and biodiesel stock change and balancing item.
e Coal, coal coke net imports, natural gas, and petroleum.f Also includes electricity net imports.
R=Revised. E=Estimate.
Notes: • See "Primary Energy," "Primary Energy Production," and "PrimaryEnergy Consumption," in Glossary. • Totals may not equal sum of componentsdue to independent rounding. • Geographic coverage is the 50 states and theDistrict of Columbia.
Web Page: See http://www.eia.gov/totalenergy/data/monthly/#summary (Exceland CSV files) for all available annual data beginning in 1949 and monthly databeginning in 1973.
Sources: • Production: Table 1.2. • Trade: Tables 1.4a and 1.4b. • StockChange and Other: Calculated as consumption minus production and net imports. • Consumption: Table 1.3.
Selected years of data from 1949 through 1972 have been added to this table.For all years of data from 1949 through 2013, see the “Web Page” cited above.
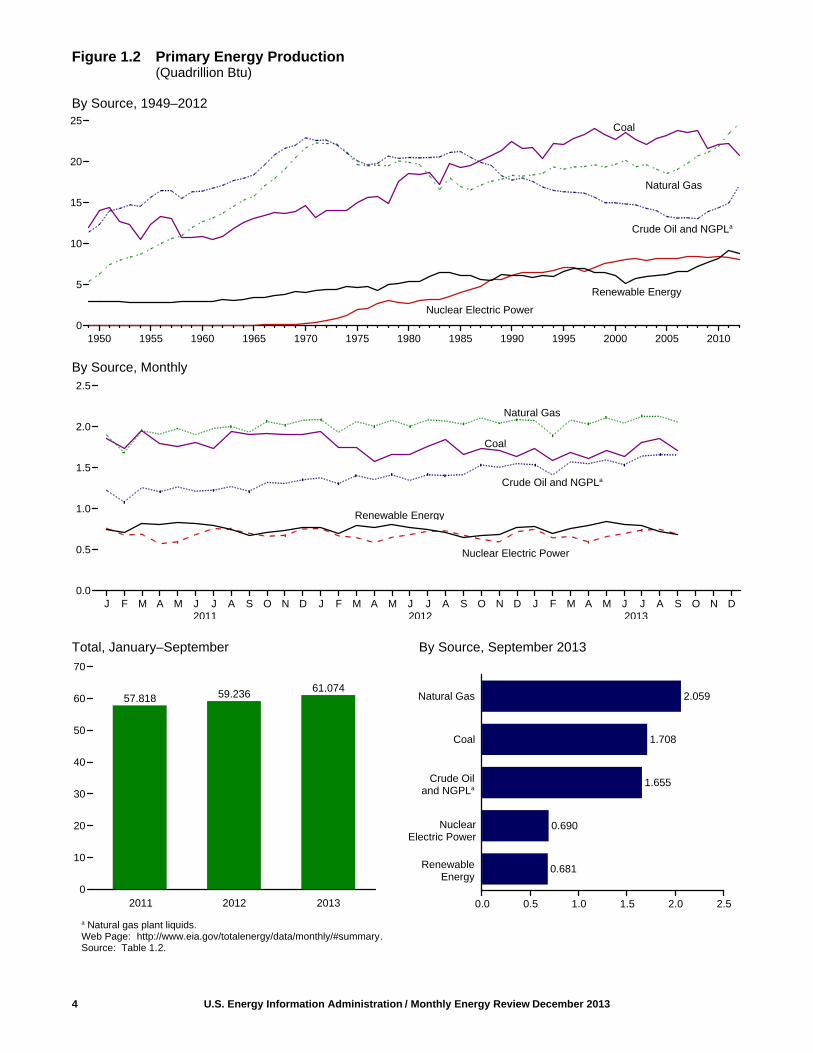
Figure 1.2 Primary Energy Production(Quadrillion Btu)
By Source, 1949–2012
By Source, Monthly
Total, January–September By Source, September 2013
a Natural gas plant liquids. Web Page: http://www.eia.gov/totalenergy/data/monthly/#summary.Source: Table 1.2.
4 U.S. Energy Information Administration / Monthly Energy Review December 2013
2011 2012 2013
RenewableEnergy
NuclearElectric Power
Crude Oiland NGPLa
Coal
Natural Gas
Crude Oil and NGPLa
Renewable Energy
Nuclear Electric Power
1950 1955 1960 1965 1970 1975 1980 1985 1990 1995 2000 2005 20100
5
10
15
20
25
J F M A M J J A S O N D J F M A M J J A S O N D J F M A M J J A S O N D0.0
0.5
1.0
1.5
2.0
2.5
Coal
Natural Gas
Crude Oil and NGPLa
Nuclear Electric Power
Renewable Energy
57.818 59.236 61.074
2011 2012 20130
10
20
30
40
50
60
70
2.059
1.708
1.655
0.690
0.681
Natural Gas
Coal
0.0 0.5 1.0 1.5 2.0 2.5

U.S. Energy Information Administration / Monthly Energy Review December 2013 5
Table 1.2 Primary Energy Production by Source (Quadrillion Btu)
Fossil Fuels
NuclearElectricPower
Renewable Energya
TotalCoalb
NaturalGas(Dry)
Crude Oilc NGPLd Total
Hydro-electricPowere
Geo-thermal
Solar/PV Wind
Bio-mass Total
1950 Total .................. 14.060 6.233 11.447 0.823 32.563 0.000 1.415 NA NA NA 1.562 2.978 35.5401955 Total .................. 12.370 9.345 14.410 1.240 37.364 .000 1.360 NA NA NA 1.424 2.784 40.1481960 Total .................. 10.817 12.656 14.935 1.461 39.869 .006 1.608 (s) NA NA 1.320 2.928 42.8031965 Total .................. 13.055 15.775 16.521 1.883 47.235 .043 2.059 .002 NA NA 1.335 3.396 50.6741970 Total .................. 14.607 21.666 20.401 2.512 59.186 .239 2.634 .006 NA NA 1.431 4.070 63.4951975 Total .................. 14.989 19.640 17.729 2.374 54.733 1.900 3.155 .034 NA NA 1.499 4.687 61.3201980 Total .................. 18.598 19.908 18.249 2.254 59.008 2.739 2.900 .053 NA NA 2.475 5.428 67.1751985 Total .................. 19.325 16.980 18.992 2.241 57.539 4.076 2.970 .097 (s) (s) 3.016 6.084 67.6981990 Total .................. 22.488 18.326 15.571 2.175 58.560 6.104 3.046 .171 .059 .029 2.735 6.041 70.7051995 Total .................. 22.130 19.082 13.887 2.442 57.540 7.075 3.205 .152 .069 .033 3.099 6.558 71.1742000 Total .................. 22.735 19.662 12.358 2.611 57.366 7.862 2.811 .164 .066 .057 3.006 6.104 71.3322001 Total .................. 23.547 20.166 12.282 2.547 58.541 8.029 2.242 .164 .064 .070 2.624 5.164 71.7352002 Total .................. 22.732 19.382 12.160 2.559 56.834 8.145 2.689 .171 .063 .105 2.705 5.734 70.7132003 Total .................. 22.094 19.633 11.960 2.346 56.033 R 7.960 2.793 .173 .062 .113 2.805 5.947 R 69.9392004 Total .................. 22.852 19.074 11.550 2.466 55.942 R 8.223 2.688 .178 .063 .142 2.998 6.069 R 70.2342005 Total .................. 23.185 18.556 10.969 2.334 55.044 8.161 2.703 .181 .063 .178 3.104 6.229 69.4342006 Total .................. 23.790 19.022 10.771 2.356 55.938 8.215 2.869 .181 .068 .264 3.216 6.599 R 70.7512007 Total .................. 23.493 19.786 10.748 2.409 56.436 R 8.459 2.446 .186 .076 .341 3.480 6.528 R 71.4222008 Total .................. 23.851 20.703 10.613 2.419 57.587 R 8.426 2.511 .192 .089 .546 3.881 7.219 R 73.2332009 Total .................. 21.624 21.139 11.333 2.574 56.670 R 8.355 2.669 .200 .098 .721 3.967 7.655 R 72.6802010 Total .................. 22.038 21.806 11.581 2.781 58.207 8.434 2.539 .208 .126 .923 4.332 8.128 74.769
2011 January .............. 1.854 1.901 .986 .241 4.982 .761 .248 .018 .013 .083 .384 .747 6.490 February ............ 1.736 1.684 .875 .207 4.501 .678 .234 .017 .013 .102 .345 .710 5.889 March ................. 1.958 1.950 1.007 .250 5.165 .687 .303 .018 .014 .102 .379 .816 6.668 April ................... 1.795 1.909 .966 .241 4.912 .571 .303 .017 .014 .121 .358 .813 6.296 May .................... 1.760 1.977 1.010 .254 5.002 .597 .317 .018 .015 .114 .368 .832 6.431 June ................... 1.804 1.903 .972 .241 4.920 .683 .312 .017 .015 .107 .374 .825 6.427 July .................... 1.736 1.979 .975 .251 4.941 .757 .304 .018 .015 .073 .383 .792 6.490 August ............... 1.937 2.003 1.016 .254 5.209 .746 .250 .018 .015 .073 .386 .742 6.697 September ......... 1.907 1.935 .973 .239 5.054 .700 .208 .017 .014 .067 .371 .677 6.431 October .............. 1.919 2.063 1.057 .263 5.302 .663 .192 .018 .015 .102 .381 .708 6.673 November .......... 1.909 2.022 1.046 .261 5.238 .675 .201 .018 .014 .121 .385 .738 6.650 December .......... 1.908 2.079 1.084 .268 5.339 .752 .231 .018 .014 .104 .404 .770 6.861 Total .................. 22.221 23.406 11.966 2.970 60.563 8.269 3.103 .212 .171 1.168 4.516 9.170 78.002
2012 January .............. R 1.938 E 2.089 1.103 .272 R 5.402 R .758 R .220 R .017 .017 R .130 R .388 R .773 R 6.933 February ............ R 1.750 E 1.931 R 1.049 .256 R 4.987 R .669 R .193 R .016 .017 R .105 R .363 R .694 R 6.350 March ................. R 1.748 E 2.062 1.132 .272 R 5.213 R .647 R .247 R .018 .019 R .133 R .377 R .793 6.653 April ................... R 1.577 E 2.007 R 1.094 .263 R 4.940 .585 R .250 R .017 .019 R .121 R .358 R .766 R 6.291 May .................... R 1.664 E 2.079 R 1.138 .273 R 5.155 R .651 R .273 R .018 .021 R .119 R .376 R .807 R 6.612 June ................... R 1.667 E 2.005 R 1.087 .258 R 5.017 R .683 R .254 R .017 .021 R .114 R .367 R .773 R 6.473 July .................... R 1.760 E 2.084 R 1.148 .266 R 5.257 R .724 R .252 R .018 .021 R .084 R .369 R .744 R 6.725 August ............... 1.850 E 2.070 R 1.134 .271 R 5.325 R .729 R .219 R .018 .021 .081 R .375 R .713 R 6.768 September ......... R 1.666 E 2.029 R 1.143 .272 R 5.110 R .676 R .168 R .018 .020 .084 R .356 R .645 R 6.431 October .............. R 1.735 E 2.108 R 1.248 .286 R 5.377 R .626 .157 R .018 R .020 R .120 R .363 R .679 R 6.681 November .......... R 1.716 E 2.043 R 1.225 .280 R 5.264 R .594 R .178 R .018 .019 R .111 R .358 R .684 R 6.543 December .......... 1.634 E 2.086 R 1.274 .276 R 5.270 R .719 R .219 R .019 R .020 .138 R .372 .767 R 6.756 Total .................. R 20.705 E 24.592 R 13.774 3.246 R 62.317 R 8.062 R 2.629 R .212 R .234 R 1.340 R 4.423 R 8.838 R 79.216
2013 January .............. 1.728 E 2.076 RE 1.266 .270 R 5.340 R .748 R .239 .019 R .022 R .138 .361 R .780 R 6.869 February ............ 1.585 E 1.894 RE 1.158 .253 R 4.890 R .644 R .195 R .017 .022 R .132 .327 R .693 R 6.227 March ................. 1.682 E 2.081 RE 1.289 .283 R 5.334 R .660 R .196 .019 .026 R .149 .367 R .756 R 6.750 April ................... 1.611 E 2.032 RE 1.276 .273 R 5.192 R .595 R .236 R .018 .026 R .165 .352 R .796 R 6.583 May .................... 1.705 E 2.108 RE 1.312 .283 R 5.407 R .659 R .272 .019 .027 R .156 .371 R .845 R 6.911 June ................... 1.635 E 2.044 RE 1.260 .276 R 5.216 R .696 R .260 .019 R .027 R .131 .370 R .807 R 6.720 July .................... 1.812 E 2.126 RE 1.351 .291 5.580 R .739 R .259 .019 .027 R .106 .387 R .799 R 7.117 August ............... 1.851 E 2.126 R1.354 .303 R 5.635 R .748 R .206 .019 .029 R .092 .378 R .723 7.106 September ......... 1.708 F 2.059 E 1.356 .299 E 5.421 .690 .161 .018 .028 .112 .363 .681 E 6.792 9-Month Total ... 15.318 E 18.545 E 11.623 2.530 E 48.016 6.178 2.023 .168 .235 1.180 3.276 6.881 E 61.074
2012 9-Month Total ... 15.620 E 18.355 10.028 2.404 46.406 6.123 2.075 .157 .175 .971 3.330 6.708 59.2362011 9-Month Total ... 16.486 17.242 8.780 2.177 44.685 6.180 2.479 .159 .129 .841 3.347 6.954 57.818
a Most data are estimates. See Tables 10.1–10.2c for notes on seriescomponents and estimation; and see Note, "Renewable Energy Production andConsumption," at end of Section 10.
b Beginning in 1989, includes waste coal supplied. Beginning in 2001, alsoincludes a small amount of refuse recovery. See Table 6.1.
c Includes lease condensate.d Natural gas plant liquids.e Conventional hydroelectric power.R=Revised. E=Estimate. NA=Not available. (s)=Less than 0.5 trillion Btu.
F=Forecast.
Notes: • See "Primary Energy Production" in Glossary. • Totals may not equalsum of components due to independent rounding. • Geographic coverage is the50 states and the District of Columbia.
Web Page: See http://www.eia.gov/totalenergy/data/monthly/#summary (Exceland CSV files) for all available annual data beginning in 1949 and monthly databeginning in 1973.
Sources: • Coal: Tables 6.1 and A5. • Natural Gas (Dry): Tables 4.1 andA4. • Crude Oil and Natural Gas Plant Liquids: Tables 3.1 and A2.• Nuclear Electric Power: Tables 7.2a and A6 ("Nuclear Plants" heat rate).• Renewable Energy: Table 10.1.
Selected years of data from 1949 through 1972 have been added to this table.For all years of data from 1949 through 2013, see the “Web Page” cited above.

Figure 1.3 Primary Energy Consumption(Quadrillion Btu)
By Source,a 1949–2012
By Source,a Monthly
Total, January–September By Source,a September 2013
a Small quantities of net imports of coal coke and electricity are not shown. Web Page: http://www.eia.gov/totalenergy/data/monthly/#summary. Source: Table 1.3.
6 U.S. Energy Information Administration / Monthly Energy Review December 2013
1950 1955 1960 1965 1970 1975 1980 1985 1990 1995 2000 2005 20100
15
30
45Petroleum
Natural Gas
Coal
Nuclear Electric Power
Renewable Energy
J F M A M J J A S O N D J F M A M J J A S O N D J F M A M J J A S O N D0
1
2
3
4
2011 2 012 2013
Petroleum
Natural Gas
Coal
Renewable Energy
Nuclear Electric Power
2.930
1.796
1.515
0.690
0.684
Petroleum
Natural Gas
Coal
0 1 2 3 4
73.34571.084 72.245
2011 2012 20130
10
20
30
40
50
60
70
80
NuclearElectric Power
RenewableEnergy

U.S. Energy Information Administration / Monthly Energy Review December 2013 7
Table 1.3 Primary Energy Consumption by Source (Quadrillion Btu)
Fossil Fuels
NuclearElectricPower
Renewable Energya
TotalfCoalNaturalGasb
Petro-leumc Totald
Hydro-electricPowere
Geo-thermal
Solar/PV Wind
Bio-mass Total
1950 Total .................... 12.347 5.968 13.315 31.632 0.000 1.415 NA NA NA 1.562 2.978 34.6161955 Total .................... 11.167 8.998 17.255 37.410 .000 1.360 NA NA NA 1.424 2.784 40.2081960 Total .................... 9.838 12.385 19.919 42.137 .006 1.608 (s) NA NA 1.320 2.928 45.0861965 Total .................... 11.581 15.769 23.246 50.577 .043 2.059 .002 NA NA 1.335 3.396 54.0151970 Total .................... 12.265 21.795 29.521 63.522 .239 2.634 .006 NA NA 1.431 4.070 67.8381975 Total .................... 12.663 19.948 32.732 65.357 1.900 3.155 .034 NA NA 1.499 4.687 71.9651980 Total .................... 15.423 20.235 34.205 69.828 2.739 2.900 .053 NA NA 2.475 5.428 78.0671985 Total .................... 17.478 17.703 30.925 66.093 4.076 2.970 .097 (s) (s) 3.016 6.084 76.3921990 Total .................... 19.173 19.603 33.552 72.332 6.104 3.046 .171 .059 .029 2.735 6.041 84.4851995 Total .................... 20.089 22.671 34.438 77.259 7.075 3.205 .152 .069 .033 3.101 6.560 91.0292000 Total .................... 22.580 23.824 38.262 84.731 7.862 2.811 .164 .066 .057 3.008 6.106 98.8142001 Total .................... 21.914 22.773 38.186 82.902 8.029 2.242 .164 .064 .070 2.622 5.163 96.1682002 Total .................... 21.904 23.510 38.224 83.699 8.145 2.689 .171 .063 .105 2.701 5.729 97.6452003 Total .................... 22.321 22.831 38.811 84.014 R 7.960 2.793 .173 .062 .113 2.807 5.948 97.9432004 Total .................... 22.466 22.923 40.292 85.819 R 8.223 2.688 .178 .063 .142 3.010 6.081 R 100.1612005 Total .................... 22.797 22.565 40.388 85.794 8.161 2.703 .181 .063 .178 3.117 6.242 100.2822006 Total .................... 22.447 22.239 39.955 84.702 8.215 2.869 .181 .068 .264 3.267 6.649 R 99.6292007 Total .................... 22.749 23.663 39.774 86.211 R 8.459 2.446 .186 .076 .341 3.492 6.541 R 101.3172008 Total .................... 22.387 23.843 37.280 83.551 R 8.426 2.511 .192 .089 .546 3.865 7.202 R 99.2922009 Total .................... 19.691 23.416 35.403 78.487 R 8.355 2.669 .200 .098 .721 3.950 7.638 R 94.5962010 Total .................... 20.834 24.575 36.010 81.412 8.434 2.539 .208 .126 .923 4.285 8.081 98.016
2011 January ................ 1.888 2.940 2.996 7.824 .761 .248 .018 .013 .083 .368 .731 9.326 February .............. 1.560 2.497 2.689 6.747 .678 .234 .017 .013 .102 .338 .703 8.136 March ................... 1.544 2.276 3.058 6.880 .687 .303 .018 .014 .102 .368 .806 8.381 April ..................... 1.421 1.863 2.872 6.157 .571 .303 .017 .014 .121 .349 .804 7.539 May ...................... 1.550 1.695 2.931 6.178 .597 .317 .018 .015 .114 .362 .826 7.613 June ..................... 1.757 1.684 2.964 6.407 .683 .312 .017 .015 .107 .373 .824 7.925 July ...................... 1.953 1.913 2.986 6.852 .757 .304 .018 .015 .073 .373 .782 8.408 August ................. 1.916 1.914 3.093 6.927 .746 .250 .018 .015 .073 .385 .741 8.430 September ........... 1.614 1.677 2.917 6.209 .700 .208 .017 .014 .067 .364 .670 7.589 October ................ 1.475 1.773 2.992 6.240 .663 .192 .018 .015 .102 .372 .699 7.611 November ............ 1.425 2.053 2.922 6.398 .675 .201 .018 .014 .121 .374 .727 7.808 December ............ 1.556 2.574 2.947 7.078 .752 .231 .018 .014 .104 .394 .761 8.602 Total .................... 19.658 24.860 35.368 79.896 8.269 3.103 .212 .171 1.168 4.420 9.074 97.366
2012 January ................ R 1.488 2.809 2.891 R 7.190 R .758 R .220 R .017 .017 R .130 R .367 R .752 R 8.711 February .............. 1.335 R 2.550 2.757 R 6.642 R .669 R .193 R .016 .017 R .105 R .351 R .682 R 8.003 March ................... R 1.230 R 2.165 2.874 R 6.272 R .647 R .247 R .018 .019 R .133 R .370 R .786 R 7.715 April ..................... R 1.110 R 1.989 2.794 R 5.898 .585 R .250 R .017 .019 R .121 R .354 R .762 R 7.258 May ...................... R 1.326 R 1.903 2.947 R 6.177 R .651 R .273 R .018 .021 R .119 R .373 R .804 R 7.646 June ..................... R 1.495 R 1.898 2.904 R 6.296 R .683 R .254 R .017 .021 R .114 R .367 R .773 R 7.766 July ...................... R 1.786 R 2.102 2.947 R 6.835 R .724 R .252 R .018 .021 R .084 R .369 R .745 R 8.323 August ................. R 1.714 R 2.040 3.044 R 6.798 R .729 R .219 R .018 .021 .081 R .380 R .719 R 8.264 September ........... 1.452 R 1.834 2.780 R 6.064 R .676 R .168 R .018 .020 .084 R .355 R .644 R 7.398 October ................ R 1.400 R 1.931 2.956 R 6.284 R .626 .157 R .018 R .020 R .120 R .368 R .684 R 7.606 November ............ R 1.469 R 2.204 2.837 6.507 R .594 R .178 R .018 .019 R .111 R .358 R .684 R 7.799 December ............ 1.535 R 2.549 2.847 R 6.931 R .719 R .219 R .019 R .020 .138 R .369 .764 R 8.425 Total .................... R 17.339 R 25.974 34.577 R 77.894 R 8.062 R 2.629 R .212 R .234 R 1.340 R 4.383 R 8.798 R 94.915
2013 January ................ 1.574 2.920 2.936 7.429 R .748 R .239 .019 R .022 R .138 .360 R .779 R 8.970 February .............. 1.417 2.604 2.648 6.670 R .644 R .195 R .017 .022 R .132 .327 R .694 R 8.021 March ................... 1.483 2.557 2.909 6.947 R .660 R .196 .019 .026 R .149 .367 R .756 R 8.377 April ..................... 1.292 1.986 2.836 6.112 R .595 R .236 R .018 .026 R .165 .353 R .798 R 7.516 May ...................... 1.368 1.773 2.937 6.077 R .659 R .272 .019 .027 R .156 .372 R .845 R 7.596 June ..................... 1.569 1.761 2.872 6.199 R .696 R .260 .019 R .027 R .131 .371 R .808 R 7.721 July ...................... 1.727 1.950 3.022 6.697 R .739 R .259 .019 .027 R .106 .385 R .796 R 8.251 August ................. 1.699 1.947 3.032 6.676 R .748 R .206 .019 .029 R .092 .375 R .721 R 8.163 September ........... 1.515 F 1.796 2.930 E 6.240 .690 .161 .018 .028 .112 .366 .684 E 7.629 9-Month Total ..... 13.644 E 19.294 26.122 E 59.048 6.178 2.023 .168 .235 1.180 3.276 6.881 E 72.245
2012 9-Month Total ..... 12.936 19.289 25.938 58.172 6.123 2.075 .157 .175 .971 3.288 6.665 71.0842011 9-Month Total ..... 15.202 18.459 26.507 60.180 6.180 2.479 .159 .129 .841 3.280 6.888 73.345
a Most data are estimates. See Tables 10.1–10.2c for notes on seriescomponents and estimation; and see Note, "Renewable Energy Production andConsumption," at end of Section 10.
b Natural gas only; excludes supplemental gaseous fuels. See Note 3,"Supplemental Gaseous Fuels," at end of Section 4.
c Petroleum products supplied, including natural gas plant liquids and crude oilburned as fuel. Does not include biofuels that have been blended withpetroleum—biofuels are included in "Biomass."
d Includes coal coke net imports. See Tables 1.4a and 1.4b.e Conventional hydroelectric power.f Includes coal coke net imports and electricity net imports, which are not
separately displayed. See Tables 1.4a and 1.4b.
R=Revised. E=Estimate. NA=Not available. F=Forecast. (s)=Less than 0.5trillion Btu.
Notes: • See "Primary Energy Consumption" in Glossary.• Totals may not equal sum of components due to independent rounding.• Geographic coverage is the 50 states and the District of Columbia.
Web Page: See http://www.eia.gov/totalenergy/data/monthly/#summary (Exceland CSV files) for all available annual data beginning in 1949 and monthly databeginning in 1973.
Sources: • Coal: Tables 6.1 and A5. • Natural Gas: Tables 4.1 and A4.• Petroleum: Table 3.6. • Nuclear Electric Power: Tables 7.2a and A6("Nuclear Plants" heat rate). • Renewable Energy: Table 10.1. • Net Imports ofCoal Coke and Electricity: Tables 1.4a and 1.4b.
Selected years of data from 1949 through 1972 have been added to this table.For all years of data from 1949 through 2013, see the “Web Page” cited above.
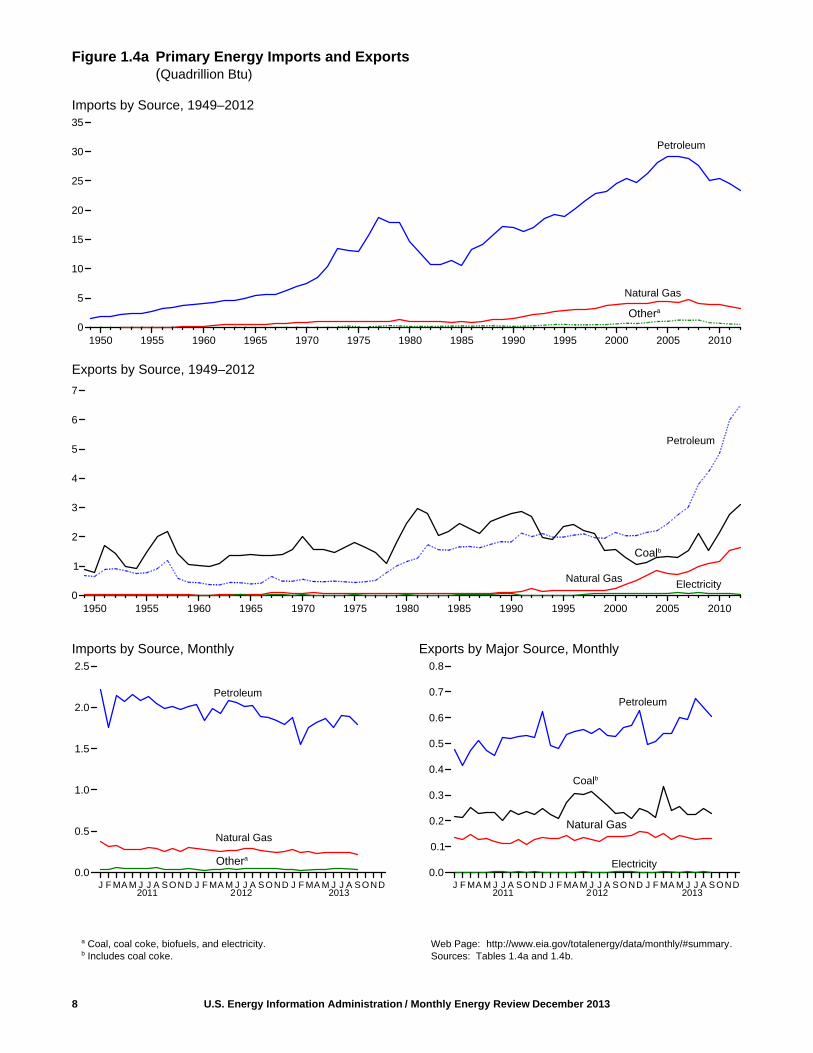
Figure 1.4a Primary Energy Imports and Exports(Quadrillion Btu)
Imports by Source, 1949–2012
Exports by Source, 1949–2012
Imports by Source, Monthly Exports by Major Source, Monthly
a Coal, coal coke, biofuels, and electricity. Web Page: http://www.eia.gov/totalenergy/data/monthly/#summary.b Includes coal coke. Sources: Tables 1.4a and 1.4b.
8 U.S. Energy Information Administration / Monthly Energy Review December 2013
1950 1955 1960 1965 1970 1975 1980 1985 1990 1995 2000 2005 20100
5
10
15
20
25
30
35
Natural Gas
Petroleum
Othera
1950 1955 1960 1965 1970 1975 1980 1985 1990 1995 2000 2005 20100
1
2
3
4
5
6
7
Petroleum
Electricity
Coalb
Natural Gas
J F MA M J J A SOND J F MA M J J A SOND J F MA M J J A SOND0.0
0.5
1.0
1.5
2.0
2.5
Petroleum
J F MA M J J A SOND J F MA M J J A SOND J F MA M J J A SOND0.0
0.1
0.2
0.3
0.4
0.5
0.6
0.7
0.8
Natural Gas
Coalb
Petroleum
Natural Gas
ElectricityOthera
2011 2012 2013 2011 2012 2013

Figure 1.4b Primary Energy Net Imports(Quadrillion Btu)
Total, 1949–2012
By Major Source, 1949–2012
Total, Monthly By Major Source, Monthly
U.S. Energy Information Administration / Monthly Energy Review December 2013 9
1950 1955 1960 1965 1970 1975 1980 1985 1990 1995 2000 2005 2010-5
0
5
10
15
20
25
30
35
Natural Gas
Crude Oila
Petroleum Productsb
Coal
Crude Oila
1950 1955 1960 1965 1970 1975 1980 1985 1990 1995 2000 2005 2010-5
0
5
10
15
20
25
0
-5
PetroleumProductsb
Coal
Natural Gas
J F MA M J J A SOND J F MA M J J A SOND J F MA M J J A SOND0.0
0.5
1.0
1.5
2.0
2011 2012 2013 2011 2012 2013 J F MA M J J A SOND J F MA M J J A SOND J F MA M J J A SOND
-0.5
0.0
0.5
1.0
1.5
2.0
-0.5
a Crude oil and lease condensate. Includes imports into the StrategicPetroleum Reserve, which began in 1977.
b Petroleum products, unfinished oils, pentanes plus, and gasoline
blending components. Does not include biofuels.Web Page: http://www.eia.gov/totalenergy/data/monthly/#summary.Sources: Tables 1.4a and 1.4b.
10 U.S. Energy Information Administration / Monthly Energy Review December 2013
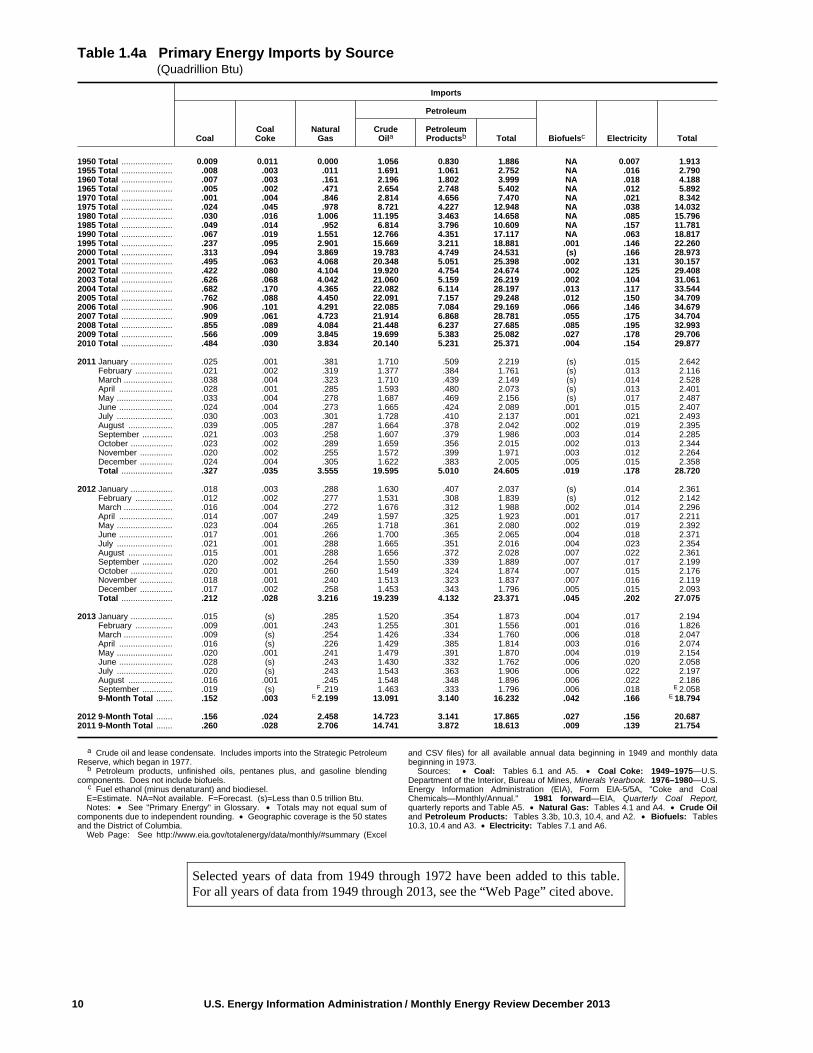
Table 1.4a Primary Energy Imports by Source (Quadrillion Btu)
Imports
CoalCoalCoke
NaturalGas
Petroleum
Biofuelsc Electricity TotalCrudeOila
PetroleumProductsb Total
1950 Total ...................... 0.009 0.011 0.000 1.056 0.830 1.886 NA 0.007 1.9131955 Total ...................... .008 .003 .011 1.691 1.061 2.752 NA .016 2.7901960 Total ...................... .007 .003 .161 2.196 1.802 3.999 NA .018 4.1881965 Total ...................... .005 .002 .471 2.654 2.748 5.402 NA .012 5.8921970 Total ...................... .001 .004 .846 2.814 4.656 7.470 NA .021 8.3421975 Total ...................... .024 .045 .978 8.721 4.227 12.948 NA .038 14.0321980 Total ...................... .030 .016 1.006 11.195 3.463 14.658 NA .085 15.7961985 Total ...................... .049 .014 .952 6.814 3.796 10.609 NA .157 11.7811990 Total ...................... .067 .019 1.551 12.766 4.351 17.117 NA .063 18.8171995 Total ...................... .237 .095 2.901 15.669 3.211 18.881 .001 .146 22.2602000 Total ...................... .313 .094 3.869 19.783 4.749 24.531 (s) .166 28.9732001 Total ...................... .495 .063 4.068 20.348 5.051 25.398 .002 .131 30.1572002 Total ...................... .422 .080 4.104 19.920 4.754 24.674 .002 .125 29.4082003 Total ...................... .626 .068 4.042 21.060 5.159 26.219 .002 .104 31.0612004 Total ...................... .682 .170 4.365 22.082 6.114 28.197 .013 .117 33.5442005 Total ...................... .762 .088 4.450 22.091 7.157 29.248 .012 .150 34.7092006 Total ...................... .906 .101 4.291 22.085 7.084 29.169 .066 .146 34.6792007 Total ...................... .909 .061 4.723 21.914 6.868 28.781 .055 .175 34.7042008 Total ...................... .855 .089 4.084 21.448 6.237 27.685 .085 .195 32.9932009 Total ...................... .566 .009 3.845 19.699 5.383 25.082 .027 .178 29.7062010 Total ...................... .484 .030 3.834 20.140 5.231 25.371 .004 .154 29.877
2011 January .................. .025 .001 .381 1.710 .509 2.219 (s) .015 2.642 February ................ .021 .002 .319 1.377 .384 1.761 (s) .013 2.116 March ..................... .038 .004 .323 1.710 .439 2.149 (s) .014 2.528 April ....................... .028 .001 .285 1.593 .480 2.073 (s) .013 2.401 May ........................ .033 .004 .278 1.687 .469 2.156 (s) .017 2.487 June ....................... .024 .004 .273 1.665 .424 2.089 .001 .015 2.407 July ........................ .030 .003 .301 1.728 .410 2.137 .001 .021 2.493 August ................... .039 .005 .287 1.664 .378 2.042 .002 .019 2.395 September ............. .021 .003 .258 1.607 .379 1.986 .003 .014 2.285 October .................. .023 .002 .289 1.659 .356 2.015 .002 .013 2.344 November .............. .020 .002 .255 1.572 .399 1.971 .003 .012 2.264 December .............. .024 .004 .305 1.622 .383 2.005 .005 .015 2.358 Total ...................... .327 .035 3.555 19.595 5.010 24.605 .019 .178 28.720
2012 January .................. .018 .003 .288 1.630 .407 2.037 (s) .014 2.361 February ................ .012 .002 .277 1.531 .308 1.839 (s) .012 2.142 March ..................... .016 .004 .272 1.676 .312 1.988 .002 .014 2.296 April ....................... .014 .007 .249 1.597 .325 1.923 .001 .017 2.211 May ........................ .023 .004 .265 1.718 .361 2.080 .002 .019 2.392 June ....................... .017 .001 .266 1.700 .365 2.065 .004 .018 2.371 July ........................ .021 .001 .288 1.665 .351 2.016 .004 .023 2.354 August ................... .015 .001 .288 1.656 .372 2.028 .007 .022 2.361 September ............. .020 .002 .264 1.550 .339 1.889 .007 .017 2.199 October .................. .020 .001 .260 1.549 .324 1.874 .007 .015 2.176 November .............. .018 .001 .240 1.513 .323 1.837 .007 .016 2.119 December .............. .017 .002 .258 1.453 .343 1.796 .005 .015 2.093 Total ...................... .212 .028 3.216 19.239 4.132 23.371 .045 .202 27.075
2013 January .................. .015 (s) .285 1.520 .354 1.873 .004 .017 2.194 February ................ .009 .001 .243 1.255 .301 1.556 .001 .016 1.826 March ..................... .009 (s) .254 1.426 .334 1.760 .006 .018 2.047 April ....................... .016 (s) .226 1.429 .385 1.814 .003 .016 2.074 May ........................ .020 .001 .241 1.479 .391 1.870 .004 .019 2.154 June ....................... .028 (s) .243 1.430 .332 1.762 .006 .020 2.058 July ........................ .020 (s) .243 1.543 .363 1.906 .006 .022 2.197 August ................... .016 .001 .245 1.548 .348 1.896 .006 .022 2.186 September ............. .019 (s) F .219 1.463 .333 1.796 .006 .018 E 2.058 9-Month Total ....... .152 .003 E 2.199 13.091 3.140 16.232 .042 .166 E 18.794
2012 9-Month Total ....... .156 .024 2.458 14.723 3.141 17.865 .027 .156 20.6872011 9-Month Total ....... .260 .028 2.706 14.741 3.872 18.613 .009 .139 21.754
a Crude oil and lease condensate. Includes imports into the Strategic PetroleumReserve, which began in 1977.
b Petroleum products, unfinished oils, pentanes plus, and gasoline blendingcomponents. Does not include biofuels.
c Fuel ethanol (minus denaturant) and biodiesel.E=Estimate. NA=Not available. F=Forecast. (s)=Less than 0.5 trillion Btu. Notes: • See "Primary Energy" in Glossary. • Totals may not equal sum of
components due to independent rounding. • Geographic coverage is the 50 statesand the District of Columbia.
Web Page: See http://www.eia.gov/totalenergy/data/monthly/#summary (Excel
and CSV files) for all available annual data beginning in 1949 and monthly databeginning in 1973.
Sources: • Coal: Tables 6.1 and A5. • Coal Coke: 1949–1975—U.S.Department of the Interior, Bureau of Mines, Minerals Yearbook. 1976–1980—U.S.Energy Information Administration (EIA), Form EIA-5/5A, "Coke and CoalChemicals—Monthly/Annual." 1981 forward—EIA, Quarterly Coal Report,quarterly reports and Table A5. • Natural Gas: Tables 4.1 and A4. • Crude Oiland Petroleum Products: Tables 3.3b, 10.3, 10.4, and A2. • Biofuels: Tables10.3, 10.4 and A3. • Electricity: Tables 7.1 and A6.
Selected years of data from 1949 through 1972 have been added to this table.For all years of data from 1949 through 2013, see the “Web Page” cited above.

U.S. Energy Information Administration / Monthly Energy Review December 2013 11
Selected years of data from 1949 through 1972 have been added to this table.For all years of data from 1949 through 2013, see the “Web Page” cited above.
Table 1.4b Primary Energy Exports by Source and Total Net Imports (Quadrillion Btu)
Exports NetImportsa
CoalCoalCoke
NaturalGas
Petroleum
Biofuelsd Electricity Total TotalCrudeOilb
PetroleumProductsc Total
1950 Total ...................... 0.786 0.010 0.027 0.202 0.440 0.642 NA 0.001 1.465 0.4481955 Total ...................... 1.465 .013 .032 .067 .707 .774 NA .002 2.286 .5041960 Total ...................... 1.023 .009 .012 .018 .413 .431 NA .003 1.477 2.7101965 Total ...................... 1.376 .021 .027 .006 .386 .392 NA .013 1.829 4.0631970 Total ...................... 1.936 .061 .072 .029 .520 .549 NA .014 2.632 5.7091975 Total ...................... 1.761 .032 .074 .012 .427 .439 NA .017 2.323 11.7091980 Total ...................... 2.421 .051 .049 .609 .551 1.160 NA .014 3.695 12.1011985 Total ...................... 2.438 .028 .056 .432 1.225 1.657 NA .017 4.196 7.5841990 Total ...................... 2.772 .014 .087 .230 1.594 1.824 NA .055 4.752 14.0651995 Total ...................... 2.318 .034 .156 .200 1.791 1.991 NA .012 4.511 17.7502000 Total ...................... 1.528 .028 .245 .106 2.048 2.154 NA .051 4.006 24.9672001 Total ...................... 1.265 .033 .377 .043 1.996 2.039 (s) .056 3.771 26.3862002 Total ...................... 1.032 .020 .520 .019 2.023 2.042 (s) .054 3.669 25.7392003 Total ...................... 1.117 .018 .686 .026 2.124 2.151 .001 .082 4.054 27.0072004 Total ...................... 1.253 .033 .862 .057 2.151 2.208 .001 .078 4.434 29.1102005 Total ...................... 1.273 .043 .735 .067 2.374 2.442 .001 .065 4.560 30.1492006 Total ...................... 1.264 .040 .730 .052 2.699 2.751 .005 .083 4.873 29.8062007 Total ...................... 1.507 .036 .830 .058 2.949 3.007 .036 .069 5.483 29.2202008 Total ...................... 2.071 .049 .972 .061 3.739 3.800 .089 .083 7.063 25.9312009 Total ...................... 1.515 .032 1.082 .093 4.147 4.240 .035 .062 6.966 22.7402010 Total ...................... 2.101 .036 1.147 .088 4.750 4.838 .047 .065 8.234 21.643
2011 January .................. .218 .001 .137 .013 .460 .473 .006 .005 .841 1.801 February ................ .212 .002 .126 .005 .403 .408 .005 .005 .759 1.357 March ..................... .252 .001 .146 .007 .461 .467 .008 .005 .880 1.648 April ....................... .227 .001 .128 .007 .499 .506 .011 .005 .878 1.523 May ........................ .232 .002 .133 .007 .462 .469 .007 .004 .847 1.640 June ....................... .233 .003 .121 .006 .444 .451 .006 .004 .818 1.588 July ........................ .202 .003 .114 .013 .506 .520 .011 .004 .854 1.639 August ................... .241 .001 .112 .006 .511 .517 .005 .003 .879 1.515 September ............. .224 .003 .128 .006 .518 .524 .010 .003 .892 1.393 October .................. .235 .002 .110 .009 .520 .529 .011 .003 .891 1.453 November .............. .226 .004 .129 .011 .507 .518 .013 .004 .894 1.370 December .............. .249 .001 .136 .010 .613 .622 .014 .003 1.026 1.333 Total ...................... 2.751 .024 1.521 .100 5.904 6.004 .108 .051 10.459 18.261
2012 January .................. .224 .001 .132 .014 .477 .491 .008 .003 .858 1.502 February ................ .208 .002 .131 .012 .467 .479 .007 .003 .830 1.313 March ..................... .271 .002 .142 .013 .520 .533 .008 .004 .960 1.336 April ....................... .308 .001 .124 .007 .535 .542 .007 .004 .987 1.224 May ........................ .301 .003 .134 .015 .536 .551 .007 .004 1.000 1.393 June ....................... .313 .001 .126 .008 .526 .534 .007 .004 .985 1.386 July ........................ .285 .001 .119 .014 .542 .556 .008 .003 .973 1.381 August ................... .260 .001 .141 .011 .519 .530 .006 .003 .940 1.420 September ............. .229 .003 .139 .012 .514 .526 .006 .003 .906 1.293 October .................. .231 .004 .141 .012 .547 .559 .006 .003 .944 1.232 November .............. .209 .004 .144 .013 .555 .567 .004 .003 .930 1.189 December .............. .247 .002 .160 .013 .613 .625 .005 .004 1.043 1.050 Total ...................... 3.088 .024 1.633 .143 6.350 6.493 .078 .041 11.357 15.718
2013 January .................. .235 .001 .156 .013 .481 .494 .005 .003 .894 1.300 February ................ .212 .001 .134 .020 .484 .504 .004 .003 .858 .968 March ..................... .335 .003 .150 .018 .516 .534 .006 .003 1.031 1.016 April ....................... .240 .002 .127 .023 .512 .535 .005 .004 .912 1.162 May ........................ .257 (s) .143 .022 .575 .598 .006 .003 1.008 1.146 June ....................... .226 .003 .135 .021 .571 .592 .006 .003 .964 1.094 July ........................ .224 .002 .130 .018 .654 .671 .005 .003 1.036 1.161 August ................... .247 .002 .131 .012 .625 .637 .008 .003 1.029 1.158 September ............. .231 .001 F .134 .017 .587 .604 .007 .003 E .979 E 1.079 9-Month Total ....... 2.206 .015 E 1.240 .164 5.004 5.169 .052 .029 E 8.711 E 10.083
2012 9-Month Total ....... 2.400 .015 1.189 .106 4.635 4.741 .063 .032 8.439 12.2472011 9-Month Total ....... 2.041 .017 1.146 .070 4.264 4.334 .070 .041 7.648 14.106
a Net imports equal imports minus exports.b Crude oil and lease condensate.c Petroleum products, unfinished oils, pentanes plus, and gasoline blending
components. Does not include biofuels.d Through 2010, data are for biodiesel only. Beginning in 2011, data are for fuel
ethanol (minus denaturant) and biodiesel.E=Estimate. NA=Not available. F=Forecast. (s)=Less than 0.5 trillion Btu. Notes: • See "Primary Energy" in Glossary. • Totals may not equal sum of
components due to independent rounding. • Geographic coverage is the 50 statesand the District of Columbia.
Web Page: See http://www.eia.gov/totalenergy/data/monthly/#summary (Exceland CSV files) for all available annual data beginning in 1949 and monthly databeginning in 1973.
Sources: • Coal: Tables 6.1 and A5. • Coal Coke: 1949–1975—U.S.Department of the Interior, Bureau of Mines, Minerals Yearbook.1976–1980—U.S. Energy Information Administration (EIA), Form EIA-5/5A, "Cokeand Coal Chemicals—Monthly/Annual." 1981 forward—EIA, Quarterly CoalReport, quarterly reports and Table A5. • Natural Gas: Tables 4.1 and A4.• Crude Oil and Petroleum Products: Tables 3.3b, 10.4, and A2.• Biofuels: Tables 10.3, 10.4 and A3. • Electricity: Tables 7.1 and A6.
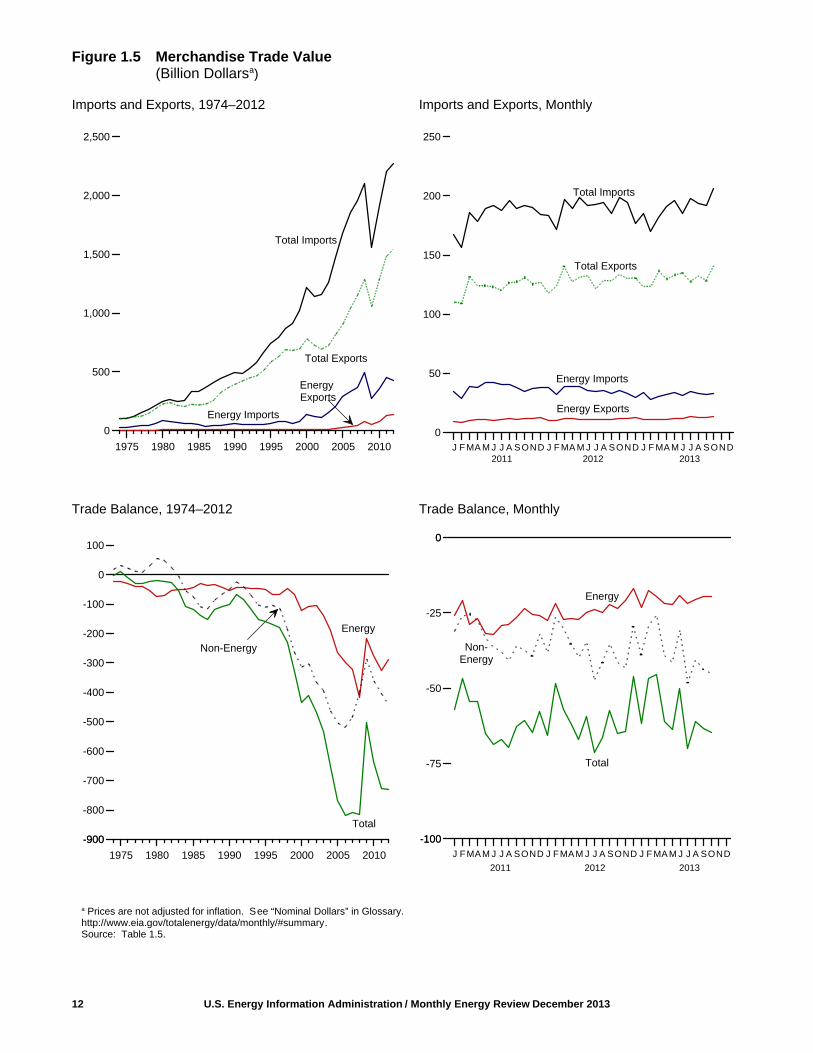
Figure 1.5 Merchandise Trade Value(Billion Dollarsa)
Imports and Exports, 1974–2012 Imports and Exports, Monthly
Trade Balance, 1974–2012 Trade Balance, Monthly
a Prices are not adjusted for inflation. See “Nominal Dollars” in Glossary.http://www.eia.gov/totalenergy/data/monthly/#summary.Source: Table 1.5.
12 U.S. Energy Information Administration / Monthly Energy Review December 2013
Energy Exports
1975 1980 1985 1990 1995 2000 2005 2010
0
500
1,000
1,500
2,000
2,500
J F MA M J J A SOND J F MA M J J A SOND J F MA M J J A SOND
0
50
100
150
200
250
2011 2012 2013
Total Imports
Total Exports
Energy Imports
Total Imports
Total Exports
Energy Imports
Energy Exports
2011 2012 2013
J FMAM J J A SOND J FMAM J J A SOND J F MA M J J A SOND
-100
-75
-50
-25
0
-100
0
1975 1980 1985 1990 1995 2000 2005 2010
-900
-800
-700
-600
-500
-400
-300
-200
-100
0
100
-900
Non-Energy
Energy
Total
Energy
Non-Energy
Total
U.S. Energy Information Administration / Monthly Energy Review December 2013 13
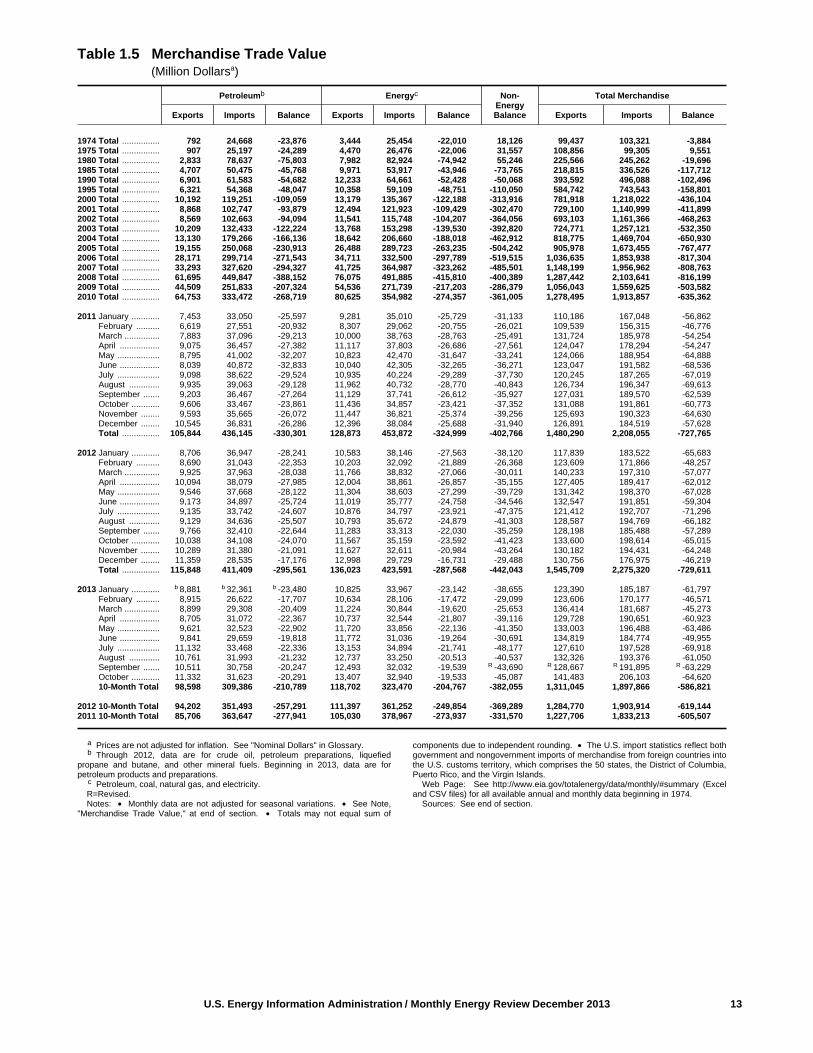
Table 1.5 Merchandise Trade Value (Million Dollarsa)
Petroleumb Energyc Non-EnergyBalance
Total Merchandise
Exports Imports Balance Exports Imports Balance Exports Imports Balance
1974 Total ................ 792 24,668 -23,876 3,444 25,454 -22,010 18,126 99,437 103,321 -3,8841975 Total ................ 907 25,197 -24,289 4,470 26,476 -22,006 31,557 108,856 99,305 9,5511980 Total ................ 2,833 78,637 -75,803 7,982 82,924 -74,942 55,246 225,566 245,262 -19,6961985 Total ................ 4,707 50,475 -45,768 9,971 53,917 -43,946 -73,765 218,815 336,526 -117,7121990 Total ................ 6,901 61,583 -54,682 12,233 64,661 -52,428 -50,068 393,592 496,088 -102,4961995 Total ................ 6,321 54,368 -48,047 10,358 59,109 -48,751 -110,050 584,742 743,543 -158,8012000 Total ................ 10,192 119,251 -109,059 13,179 135,367 -122,188 -313,916 781,918 1,218,022 -436,1042001 Total ................ 8,868 102,747 -93,879 12,494 121,923 -109,429 -302,470 729,100 1,140,999 -411,8992002 Total ................ 8,569 102,663 -94,094 11,541 115,748 -104,207 -364,056 693,103 1,161,366 -468,2632003 Total ................ 10,209 132,433 -122,224 13,768 153,298 -139,530 -392,820 724,771 1,257,121 -532,3502004 Total ................ 13,130 179,266 -166,136 18,642 206,660 -188,018 -462,912 818,775 1,469,704 -650,9302005 Total ................ 19,155 250,068 -230,913 26,488 289,723 -263,235 -504,242 905,978 1,673,455 -767,4772006 Total ................ 28,171 299,714 -271,543 34,711 332,500 -297,789 -519,515 1,036,635 1,853,938 -817,3042007 Total ................ 33,293 327,620 -294,327 41,725 364,987 -323,262 -485,501 1,148,199 1,956,962 -808,7632008 Total ................ 61,695 449,847 -388,152 76,075 491,885 -415,810 -400,389 1,287,442 2,103,641 -816,1992009 Total ................ 44,509 251,833 -207,324 54,536 271,739 -217,203 -286,379 1,056,043 1,559,625 -503,5822010 Total ................ 64,753 333,472 -268,719 80,625 354,982 -274,357 -361,005 1,278,495 1,913,857 -635,362
2011 January ............ 7,453 33,050 -25,597 9,281 35,010 -25,729 -31,133 110,186 167,048 -56,862 February .......... 6,619 27,551 -20,932 8,307 29,062 -20,755 -26,021 109,539 156,315 -46,776 March ............... 7,883 37,096 -29,213 10,000 38,763 -28,763 -25,491 131,724 185,978 -54,254 April ................. 9,075 36,457 -27,382 11,117 37,803 -26,686 -27,561 124,047 178,294 -54,247 May .................. 8,795 41,002 -32,207 10,823 42,470 -31,647 -33,241 124,066 188,954 -64,888 June ................. 8,039 40,872 -32,833 10,040 42,305 -32,265 -36,271 123,047 191,582 -68,536 July .................. 9,098 38,622 -29,524 10,935 40,224 -29,289 -37,730 120,245 187,265 -67,019 August ............. 9,935 39,063 -29,128 11,962 40,732 -28,770 -40,843 126,734 196,347 -69,613 September ....... 9,203 36,467 -27,264 11,129 37,741 -26,612 -35,927 127,031 189,570 -62,539 October ............ 9,606 33,467 -23,861 11,436 34,857 -23,421 -37,352 131,088 191,861 -60,773 November ........ 9,593 35,665 -26,072 11,447 36,821 -25,374 -39,256 125,693 190,323 -64,630 December ........ 10,545 36,831 -26,286 12,396 38,084 -25,688 -31,940 126,891 184,519 -57,628 Total ................ 105,844 436,145 -330,301 128,873 453,872 -324,999 -402,766 1,480,290 2,208,055 -727,765
2012 January ............ 8,706 36,947 -28,241 10,583 38,146 -27,563 -38,120 117,839 183,522 -65,683 February .......... 8,690 31,043 -22,353 10,203 32,092 -21,889 -26,368 123,609 171,866 -48,257 March ............... 9,925 37,963 -28,038 11,766 38,832 -27,066 -30,011 140,233 197,310 -57,077 April ................. 10,094 38,079 -27,985 12,004 38,861 -26,857 -35,155 127,405 189,417 -62,012 May .................. 9,546 37,668 -28,122 11,304 38,603 -27,299 -39,729 131,342 198,370 -67,028 June ................. 9,173 34,897 -25,724 11,019 35,777 -24,758 -34,546 132,547 191,851 -59,304 July .................. 9,135 33,742 -24,607 10,876 34,797 -23,921 -47,375 121,412 192,707 -71,296 August ............. 9,129 34,636 -25,507 10,793 35,672 -24,879 -41,303 128,587 194,769 -66,182 September ....... 9,766 32,410 -22,644 11,283 33,313 -22,030 -35,259 128,198 185,488 -57,289 October ............ 10,038 34,108 -24,070 11,567 35,159 -23,592 -41,423 133,600 198,614 -65,015 November ........ 10,289 31,380 -21,091 11,627 32,611 -20,984 -43,264 130,182 194,431 -64,248 December ........ 11,359 28,535 -17,176 12,998 29,729 -16,731 -29,488 130,756 176,975 -46,219 Total ................ 115,848 411,409 -295,561 136,023 423,591 -287,568 -442,043 1,545,709 2,275,320 -729,611
2013 January ............ b 8,881 b 32,361 b -23,480 10,825 33,967 -23,142 -38,655 123,390 185,187 -61,797 February .......... 8,915 26,622 -17,707 10,634 28,106 -17,472 -29,099 123,606 170,177 -46,571 March ............... 8,899 29,308 -20,409 11,224 30,844 -19,620 -25,653 136,414 181,687 -45,273 April ................. 8,705 31,072 -22,367 10,737 32,544 -21,807 -39,116 129,728 190,651 -60,923 May .................. 9,621 32,523 -22,902 11,720 33,856 -22,136 -41,350 133,003 196,488 -63,486 June ................. 9,841 29,659 -19,818 11,772 31,036 -19,264 -30,691 134,819 184,774 -49,955 July .................. 11,132 33,468 -22,336 13,153 34,894 -21,741 -48,177 127,610 197,528 -69,918 August ............. 10,761 31,993 -21,232 12,737 33,250 -20,513 -40,537 132,326 193,376 -61,050 September ....... 10,511 30,758 -20,247 12,493 32,032 -19,539 R -43,690 R 128,667 R 191,895 R -63,229 October ............ 11,332 31,623 -20,291 13,407 32,940 -19,533 -45,087 141,483 206,103 -64,620 10-Month Total 98,598 309,386 -210,789 118,702 323,470 -204,767 -382,055 1,311,045 1,897,866 -586,821
2012 10-Month Total 94,202 351,493 -257,291 111,397 361,252 -249,854 -369,289 1,284,770 1,903,914 -619,1442011 10-Month Total 85,706 363,647 -277,941 105,030 378,967 -273,937 -331,570 1,227,706 1,833,213 -605,507
a Prices are not adjusted for inflation. See "Nominal Dollars" in Glossary.b Through 2012, data are for crude oil, petroleum preparations, liquefied
propane and butane, and other mineral fuels. Beginning in 2013, data are forpetroleum products and preparations.
c Petroleum, coal, natural gas, and electricity.R=Revised. Notes: • Monthly data are not adjusted for seasonal variations. • See Note,
"Merchandise Trade Value," at end of section. • Totals may not equal sum of
components due to independent rounding. • The U.S. import statistics reflect bothgovernment and nongovernment imports of merchandise from foreign countries intothe U.S. customs territory, which comprises the 50 states, the District of Columbia,Puerto Rico, and the Virgin Islands.
Web Page: See http://www.eia.gov/totalenergy/data/monthly/#summary (Exceland CSV files) for all available annual and monthly data beginning in 1974.
Sources: See end of section.
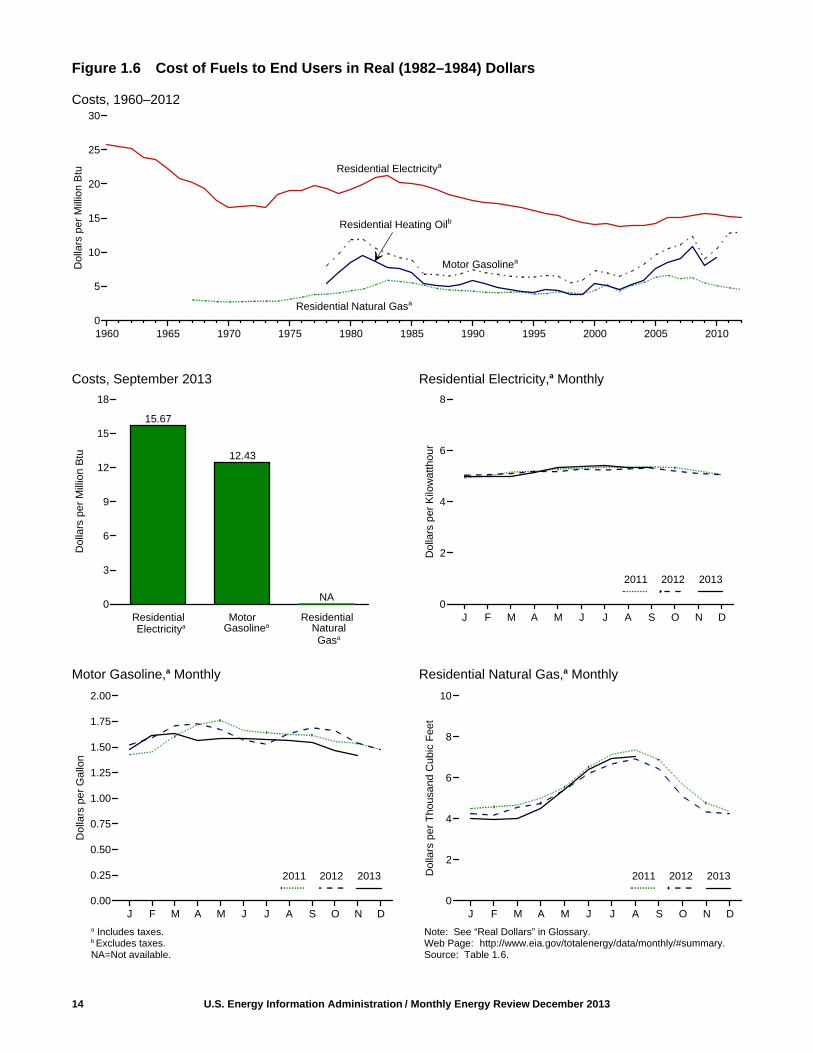
Figure 1.6 Cost of Fuels to End Users in Real (1982–1984) Dollars
Costs, 1960–2012
Costs, September 2013 Residential Electricity,a Monthly
Motor Gasoline,a Monthly Residential Natural Gas,a Monthly
14 U.S. Energy Information Administration / Monthly Energy Review December 2013
Residential Heating Oilb
1960 1965 1970 1975 1980 1985 1990 1995 2000 2005 20100
5
10
15
20
25
30
Dol
lars
per
Mill
ion
Btu Residential Electricitya
Motor Gasolinea
Residential Natural Gasa
J F M A M J J A S O N D0
2
4
6
8
Dol
lars
per
Kilo
wat
thou
r
2011 2012 2013
Electricitya
15.67
12.43
NA
Residential Motor Residential0
3
6
9
12
15
18
Dol
lars
per
Mill
ion
Btu
Gasolinea NaturalGasa
J F M A M J J A S O N D0.00
0.25
0.50
0.75
1.00
1.25
1.50
1.75
2.00
Dol
lars
per
Gal
lon
2011 2012 2013
J F M A M J J A S O N D0
2
4
6
8
10
Dol
lars
per
Tho
usan
d C
ubic
Fee
t
2011 2012 2013
a Includes taxes.b Excludes taxes.NA=Not available.
Note: See “Real Dollars” in Glossary.Web Page: http://www.eia.gov/totalenergy/data/monthly/#summary.Source: Table 1.6.
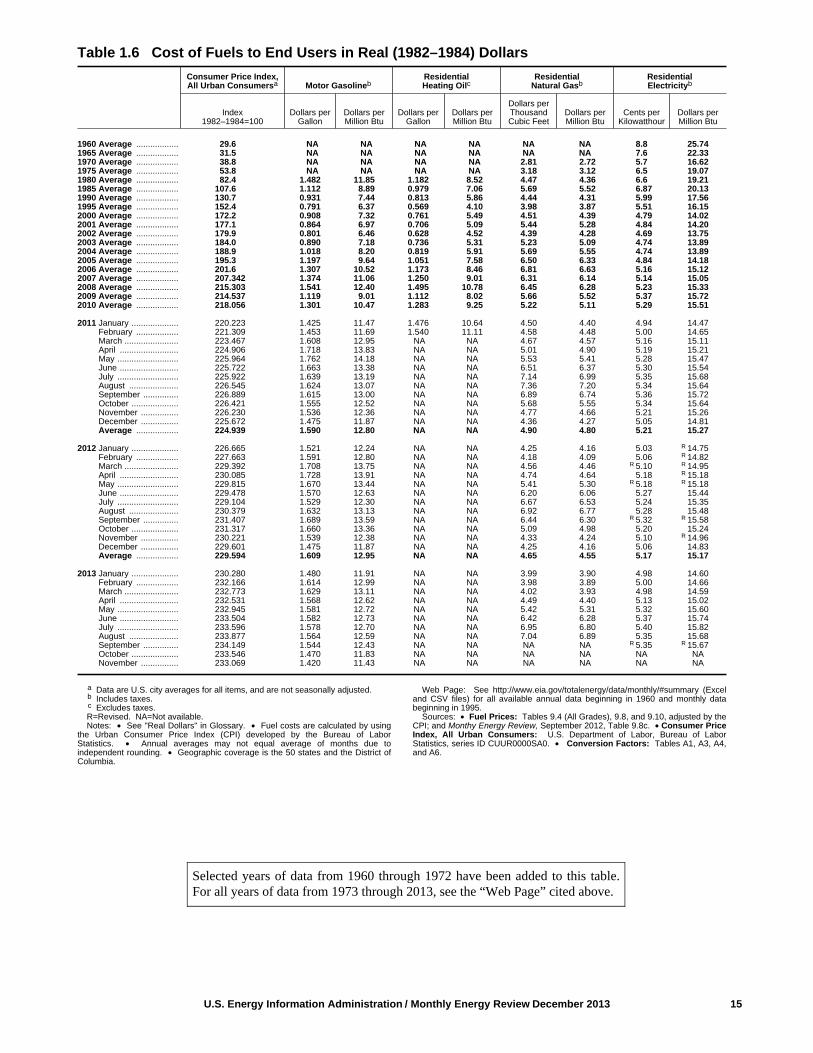
U.S. Energy Information Administration / Monthly Energy Review December 2013 15
Table 1.6 Cost of Fuels to End Users in Real (1982–1984) Dollars
Consumer Price Index,All Urban Consumersa Motor Gasolineb
ResidentialHeating Oilc
ResidentialNatural Gasb
ResidentialElectricityb
Index1982–1984=100
Dollars perGallon
Dollars perMillion Btu
Dollars perGallon
Dollars perMillion Btu
Dollars perThousandCubic Feet
Dollars perMillion Btu
Cents perKilowatthour
Dollars perMillion Btu
1960 Average .................. 29.6 NA NA NA NA NA NA 8.8 25.741965 Average .................. 31.5 NA NA NA NA NA NA 7.6 22.331970 Average .................. 38.8 NA NA NA NA 2.81 2.72 5.7 16.621975 Average .................. 53.8 NA NA NA NA 3.18 3.12 6.5 19.071980 Average .................. 82.4 1.482 11.85 1.182 8.52 4.47 4.36 6.6 19.211985 Average .................. 107.6 1.112 8.89 0.979 7.06 5.69 5.52 6.87 20.131990 Average .................. 130.7 0.931 7.44 0.813 5.86 4.44 4.31 5.99 17.561995 Average .................. 152.4 0.791 6.37 0.569 4.10 3.98 3.87 5.51 16.152000 Average .................. 172.2 0.908 7.32 0.761 5.49 4.51 4.39 4.79 14.022001 Average .................. 177.1 0.864 6.97 0.706 5.09 5.44 5.28 4.84 14.202002 Average .................. 179.9 0.801 6.46 0.628 4.52 4.39 4.28 4.69 13.752003 Average .................. 184.0 0.890 7.18 0.736 5.31 5.23 5.09 4.74 13.892004 Average .................. 188.9 1.018 8.20 0.819 5.91 5.69 5.55 4.74 13.892005 Average .................. 195.3 1.197 9.64 1.051 7.58 6.50 6.33 4.84 14.182006 Average .................. 201.6 1.307 10.52 1.173 8.46 6.81 6.63 5.16 15.122007 Average .................. 207.342 1.374 11.06 1.250 9.01 6.31 6.14 5.14 15.052008 Average .................. 215.303 1.541 12.40 1.495 10.78 6.45 6.28 5.23 15.332009 Average .................. 214.537 1.119 9.01 1.112 8.02 5.66 5.52 5.37 15.722010 Average .................. 218.056 1.301 10.47 1.283 9.25 5.22 5.11 5.29 15.51
2011 January .................... 220.223 1.425 11.47 1.476 10.64 4.50 4.40 4.94 14.47 February .................. 221.309 1.453 11.69 1.540 11.11 4.58 4.48 5.00 14.65 March ....................... 223.467 1.608 12.95 NA NA 4.67 4.57 5.16 15.11 April ......................... 224.906 1.718 13.83 NA NA 5.01 4.90 5.19 15.21 May .......................... 225.964 1.762 14.18 NA NA 5.53 5.41 5.28 15.47 June ......................... 225.722 1.663 13.38 NA NA 6.51 6.37 5.30 15.54 July .......................... 225.922 1.639 13.19 NA NA 7.14 6.99 5.35 15.68 August ..................... 226.545 1.624 13.07 NA NA 7.36 7.20 5.34 15.64 September ............... 226.889 1.615 13.00 NA NA 6.89 6.74 5.36 15.72 October .................... 226.421 1.555 12.52 NA NA 5.68 5.55 5.34 15.64 November ................ 226.230 1.536 12.36 NA NA 4.77 4.66 5.21 15.26 December ................ 225.672 1.475 11.87 NA NA 4.36 4.27 5.05 14.81 Average .................. 224.939 1.590 12.80 NA NA 4.90 4.80 5.21 15.27
2012 January .................... 226.665 1.521 12.24 NA NA 4.25 4.16 5.03 R 14.75 February .................. 227.663 1.591 12.80 NA NA 4.18 4.09 5.06 R 14.82 March ....................... 229.392 1.708 13.75 NA NA 4.56 4.46 R 5.10 R 14.95 April ......................... 230.085 1.728 13.91 NA NA 4.74 4.64 5.18 R 15.18 May .......................... 229.815 1.670 13.44 NA NA 5.41 5.30 R 5.18 R 15.18 June ......................... 229.478 1.570 12.63 NA NA 6.20 6.06 5.27 15.44 July .......................... 229.104 1.529 12.30 NA NA 6.67 6.53 5.24 15.35 August ..................... 230.379 1.632 13.13 NA NA 6.92 6.77 5.28 15.48 September ............... 231.407 1.689 13.59 NA NA 6.44 6.30 R 5.32 R 15.58 October .................... 231.317 1.660 13.36 NA NA 5.09 4.98 5.20 15.24 November ................ 230.221 1.539 12.38 NA NA 4.33 4.24 5.10 R 14.96 December ................ 229.601 1.475 11.87 NA NA 4.25 4.16 5.06 14.83 Average .................. 229.594 1.609 12.95 NA NA 4.65 4.55 5.17 15.17
2013 January .................... 230.280 1.480 11.91 NA NA 3.99 3.90 4.98 14.60 February .................. 232.166 1.614 12.99 NA NA 3.98 3.89 5.00 14.66 March ....................... 232.773 1.629 13.11 NA NA 4.02 3.93 4.98 14.59 April ......................... 232.531 1.568 12.62 NA NA 4.49 4.40 5.13 15.02 May .......................... 232.945 1.581 12.72 NA NA 5.42 5.31 5.32 15.60 June ......................... 233.504 1.582 12.73 NA NA 6.42 6.28 5.37 15.74 July .......................... 233.596 1.578 12.70 NA NA 6.95 6.80 5.40 15.82 August ..................... 233.877 1.564 12.59 NA NA 7.04 6.89 5.35 15.68 September ............... 234.149 1.544 12.43 NA NA NA NA R 5.35 R 15.67 October .................... 233.546 1.470 11.83 NA NA NA NA NA NA November ................ 233.069 1.420 11.43 NA NA NA NA NA NA
a Data are U.S. city averages for all items, and are not seasonally adjusted.b Includes taxes.c Excludes taxes.R=Revised. NA=Not available. Notes: • See "Real Dollars" in Glossary. • Fuel costs are calculated by using
the Urban Consumer Price Index (CPI) developed by the Bureau of LaborStatistics. • Annual averages may not equal average of months due toindependent rounding. • Geographic coverage is the 50 states and the District ofColumbia.
Web Page: See http://www.eia.gov/totalenergy/data/monthly/#summary (Exceland CSV files) for all available annual data beginning in 1960 and monthly databeginning in 1995.
Sources: • Fuel Prices: Tables 9.4 (All Grades), 9.8, and 9.10, adjusted by theCPI; and Monthy Energy Review, September 2012, Table 9.8c. • Consumer PriceIndex, All Urban Consumers: U.S. Department of Labor, Bureau of LaborStatistics, series ID CUUR0000SA0. • Conversion Factors: Tables A1, A3, A4,and A6.
Selected years of data from 1960 through 1972 have been added to this table.For all years of data from 1973 through 2013, see the “Web Page” cited above.
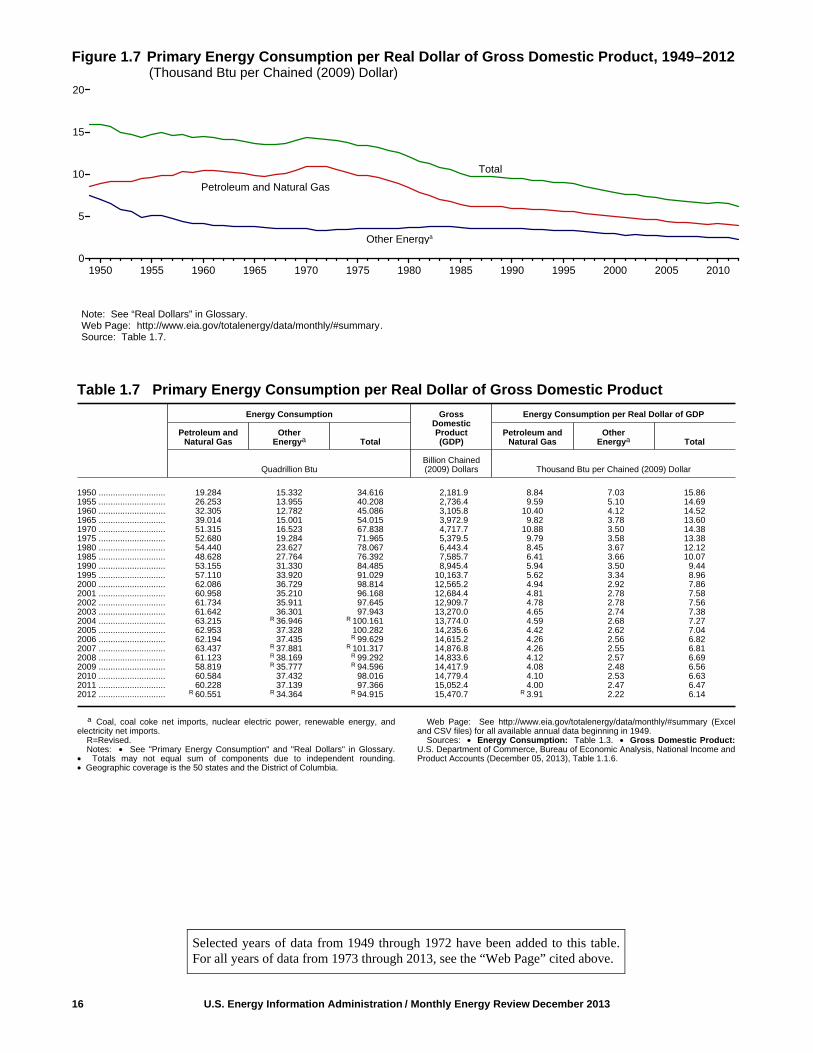
Figure 1.7 Primary Energy Consumption per Real Dollar of Gross Domestic Product, 1949–2012 (Thousand Btu per Chained (2009) Dollar)
Note: See “Real Dollars” in Glossary.Web Page: http://www.eia.gov/totalenergy/data/monthly/#summary.Source: Table 1.7.
16 U.S. Energy Information Administration / Monthly Energy Review December 2013
Table 1.7 Primary Energy Consumption per Real Dollar of Gross Domestic Product
Energy Consumption GrossDomesticProduct(GDP)
Energy Consumption per Real Dollar of GDP
Petroleum andNatural Gas
OtherEnergya Total
Petroleum andNatural Gas
OtherEnergya Total
Quadrillion Btu
Billion Chained(2009) Dollars
Thousand Btu per Chained (2009) Dollar
1950 ............................ 19.284 15.332 34.616 2,181.9 8.84 7.03 15.861955 ............................ 26.253 13.955 40.208 2,736.4 9.59 5.10 14.691960 ............................ 32.305 12.782 45.086 3,105.8 10.40 4.12 14.521965 ............................ 39.014 15.001 54.015 3,972.9 9.82 3.78 13.601970 ............................ 51.315 16.523 67.838 4,717.7 10.88 3.50 14.381975 ............................ 52.680 19.284 71.965 5,379.5 9.79 3.58 13.381980 ............................ 54.440 23.627 78.067 6,443.4 8.45 3.67 12.121985 ............................ 48.628 27.764 76.392 7,585.7 6.41 3.66 10.071990 ............................ 53.155 31.330 84.485 8,945.4 5.94 3.50 9.441995 ............................ 57.110 33.920 91.029 10,163.7 5.62 3.34 8.962000 ............................ 62.086 36.729 98.814 12,565.2 4.94 2.92 7.862001 ............................ 60.958 35.210 96.168 12,684.4 4.81 2.78 7.582002 ............................ 61.734 35.911 97.645 12,909.7 4.78 2.78 7.562003 ............................ 61.642 36.301 97.943 13,270.0 4.65 2.74 7.382004 ............................ 63.215 R 36.946 R 100.161 13,774.0 4.59 2.68 7.272005 ............................ 62.953 37.328 100.282 14,235.6 4.42 2.62 7.042006 ............................ 62.194 37.435 R 99.629 14,615.2 4.26 2.56 6.822007 ............................ 63.437 R 37.881 R 101.317 14,876.8 4.26 2.55 6.812008 ............................ 61.123 R 38.169 R 99.292 14,833.6 4.12 2.57 6.692009 ............................ 58.819 R 35.777 R 94.596 14,417.9 4.08 2.48 6.562010 ............................ 60.584 37.432 98.016 14,779.4 4.10 2.53 6.632011 ............................ 60.228 37.139 97.366 15,052.4 4.00 2.47 6.472012 ............................ R 60.551 R 34.364 R 94.915 15,470.7 R 3.91 2.22 6.14
a Coal, coal coke net imports, nuclear electric power, renewable energy, andelectricity net imports.
R=Revised. Notes: • See "Primary Energy Consumption" and "Real Dollars" in Glossary.
• Totals may not equal sum of components due to independent rounding.• Geographic coverage is the 50 states and the District of Columbia.
Web Page: See http://www.eia.gov/totalenergy/data/monthly/#summary (Exceland CSV files) for all available annual data beginning in 1949.
Sources: • Energy Consumption: Table 1.3. • Gross Domestic Product:U.S. Department of Commerce, Bureau of Economic Analysis, National Income andProduct Accounts (December 05, 2013), Table 1.1.6.
1950 1955 1960 1965 1970 1975 1980 1985 1990 1995 2000 2005 20100
5
10
15
20
Total
Petroleum and Natural Gas
Other Energya
Selected years of data from 1949 through 1972 have been added to this table.For all years of data from 1973 through 2013, see the “Web Page” cited above.

Figure 1.8 Motor Vehicle Fuel Economy, 1949–2011(Miles per Gallon)
U.S. Energy Information Administration / Monthly Energy Review December 2013 17
Table 1.8 Motor Vehicle Mileage, Fuel Consumption, and Fuel Economy
Light-Duty Vehicles,Short Wheelbasea
Light-Duty Vehicles,Long Wheelbaseb Heavy-Duty Trucksc All Motor Vehiclesd
MileageFuel
ConsumptionFuel
Economy MileageFuel
ConsumptionFuel
Economy MileageFuel
ConsumptionFuel
Economy MileageFuel
ConsumptionFuel
Economy
Miles perVehicle
Gallonsper Vehicle
Miles perGallon
Miles perVehicle
Gallonsper Vehicle
Miles perGallon
Miles perVehicle
Gallonsper Vehicle
Miles perGallon
Miles perVehicle
Gallonsper Vehicle
Miles perGallon
1950 .......... 9,060 603 15.0 e( ) e( ) e( ) 10,316 1,229 8.4 9,321 725 12.81955 .......... 9,447 645 14.6 e( ) e( ) e( ) 10,576 1,293 8.2 9,661 761 12.71960 .......... 9,518 668 14.3 e( ) e( ) e( ) 10,693 1,333 8.0 9,732 784 12.41965 .......... 9,603 661 14.5 e( ) e( ) e( ) 10,851 1,387 7.8 9,826 787 12.51970 .......... 9,989 737 13.5 8,676 866 10.0 13,565 2,467 5.5 9,976 830 12.01975 .......... 9,309 665 14.0 9,829 934 10.5 15,167 2,722 5.6 9,627 790 12.21980 .......... 8,813 551 16.0 10,437 854 12.2 18,736 3,447 5.4 9,458 712 13.31985 .......... 9,419 538 17.5 10,506 735 14.3 20,597 3,570 5.8 10,020 685 14.61990 .......... 10,504 520 20.2 11,902 738 16.1 23,603 3,953 6.0 11,107 677 16.41995 .......... 11,203 530 21.1 12,018 694 17.3 26,514 4,315 6.1 11,793 700 16.82000 .......... 11,976 547 21.9 11,672 669 17.4 25,617 4,391 5.8 12,164 720 16.92001 .......... 11,831 534 22.1 11,204 636 17.6 26,602 4,477 5.9 11,887 695 17.12002 .......... 12,202 555 22.0 11,364 650 17.5 27,071 4,642 5.8 12,171 719 16.92003 .......... 12,325 556 22.2 11,287 697 16.2 28,093 4,215 6.7 12,208 718 17.02004 .......... 12,460 553 22.5 11,184 690 16.2 27,023 4,057 6.7 12,200 714 17.12005 .......... 12,510 567 22.1 10,920 617 17.7 26,235 4,385 6.0 12,082 706 17.12006 .......... 12,485 554 22.5 10,920 612 17.8 25,231 4,304 5.9 12,017 698 17.22007 .......... a 10,710 a 468 a 22.9 b 14,970 b 877 b 17.1 c 28,290 c 4,398 6.4 11,915 693 17.22008 .......... 10,290 435 23.7 15,256 880 17.3 28,573 4,387 6.5 11,631 667 17.42009 .......... 10,391 442 23.5 15,252 882 17.3 26,274 4,037 6.5 11,631 661 17.62010 .......... 10,650 456 23.3 15,474 901 17.2 26,604 4,180 6.4 11,866 681 17.42011P ....... 10,614 460 23.1 14,596 855 17.1 26,016 4,126 6.3 11,640 666 17.5
a Through 1989, data are for passenger cars and motorcycles. For 1990–2006,data are for passenger cars only. Beginning in 2007, data are for light-dutyvehicles (passenger cars, light trucks, vans, and sport utility vehicles) with awheelbase less than or equal to 121 inches.
b For 1966–2006, data are for vans, pickup trucks, and sport utility vehicles.Beginning in 2007, data are for light-duty vehicles (passenger cars, light trucks,vans, and sport utility vehicles) with a wheelbase greater than 121 inches.
c For 1949–1965, data are for single-unit trucks with 2 axles and 6 or more tires,combination trucks, and other vehicles with 2 axles and 4 tires that are notpassenger cars. For 1965–2006, data are for single-unit trucks with 2 axles and 6or more tires, and combination trucks. Beginning in 2007, data are for single-unittrucks with 2 axles and 6 or more tires (or a gross vehicle weight rating exceeding10,000 pounds), and combination trucks.
d Includes buses and motorcycles, which are not separately displayed.e Included in "Heavy-Duty Trucks."P=Preliminary. Note: Geographic coverage is the 50 states and the District of Columbia. Web Page: See http://www.eia.gov/totalenergy/data/monthly/#summary (Excel
and CSV files) for all available annual data beginning in 1949.Sources: • Light-Duty Vehicles, Short Wheelbase: 1990–1994—U.S.
Department of Transportation, Bureau of Transportation Statistics, NationalTransportation Statistics 1998, Table 4-13. • All Other Data:1949–1994—Federal Highway Administration (FHWA), Highway StatisticsSummary to 1995, Table VM-201A. 1995 forward—FHWA, Highway Statistics,annual reports, Table VM-1.
Selected years of data from 1949 through 1972 have been added to this table.For all years of data from 1949 through 2013, see the “Web Page” cited above.
1950 1955 1960 1965 1970 1975 1980 1985 1990 1995 2000 2005 20100
5
10
15
20
25Light-Duty Vehicles, Short Wheelbasea
Light-Duty Vehicles, Long Wheelbaseb
Heavy-Duty Trucksc
Web Page: http://www.eia.gov/totalenergy/data/monthly/#summary.Source: Table 1.8.
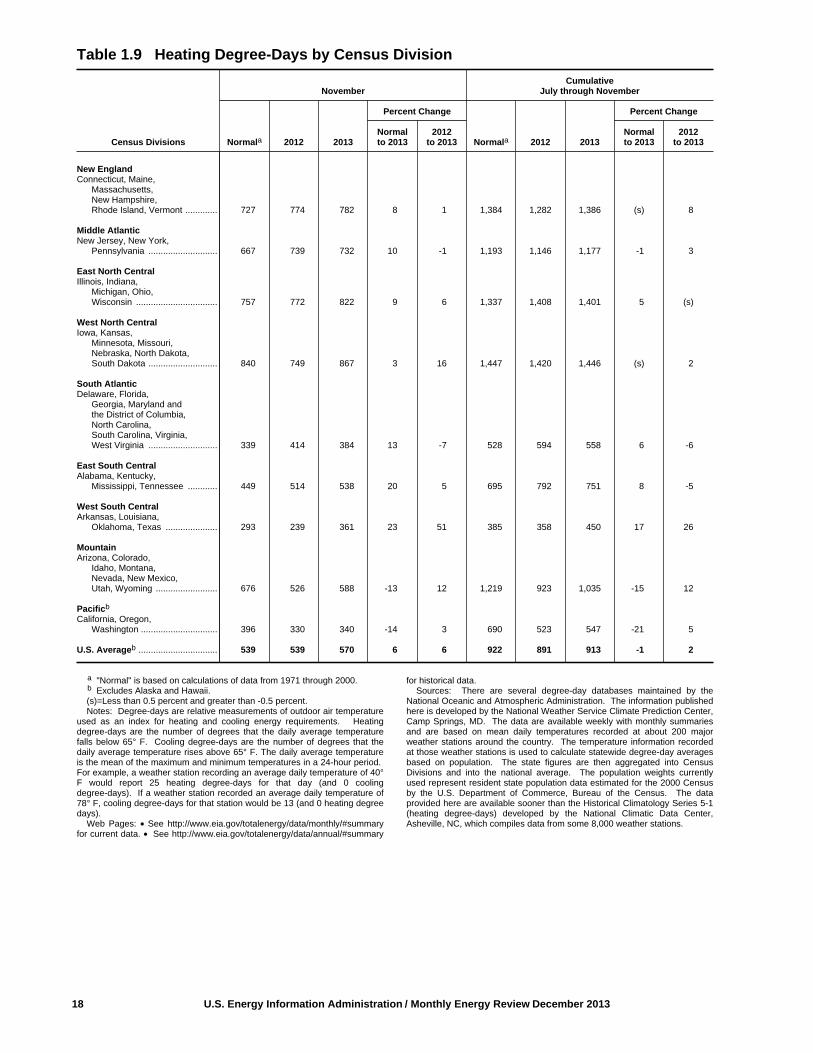
18 U.S. Energy Information Administration / Monthly Energy Review December 2013
Table 1.9 Heating Degree-Days by Census Division
Census Divisions
NovemberCumulative
July through November
Normala 2012 2013
Percent Change
Normala 2012 2013
Percent Change
Normalto 2013
2012to 2013
Normalto 2013
2012to 2013
New EnglandConnecticut, Maine,
Massachusetts,New Hampshire,Rhode Island, Vermont ............. 727 774 782 8 1 1,384 1,282 1,386 (s) 8
Middle AtlanticNew Jersey, New York,
Pennsylvania ............................ 667 739 732 10 -1 1,193 1,146 1,177 -1 3
East North CentralIllinois, Indiana,
Michigan, Ohio,Wisconsin ................................. 757 772 822 9 6 1,337 1,408 1,401 5 (s)
West North CentralIowa, Kansas,
Minnesota, Missouri,Nebraska, North Dakota,South Dakota ............................ 840 749 867 3 16 1,447 1,420 1,446 (s) 2
South AtlanticDelaware, Florida,
Georgia, Maryland andthe District of Columbia,North Carolina,South Carolina, Virginia,West Virginia ............................ 339 414 384 13 -7 528 594 558 6 -6
East South CentralAlabama, Kentucky,
Mississippi, Tennessee ............ 449 514 538 20 5 695 792 751 8 -5
West South CentralArkansas, Louisiana,
Oklahoma, Texas ..................... 293 239 361 23 51 385 358 450 17 26
MountainArizona, Colorado,
Idaho, Montana,Nevada, New Mexico,Utah, Wyoming ......................... 676 526 588 -13 12 1,219 923 1,035 -15 12
Pacificb
California, Oregon,Washington ............................... 396 330 340 -14 3 690 523 547 -21 5
U.S. Averageb ................................ 539 539 570 6 6 922 891 913 -1 2
a "Normal" is based on calculations of data from 1971 through 2000.b Excludes Alaska and Hawaii.(s)=Less than 0.5 percent and greater than -0.5 percent. Notes: Degree-days are relative measurements of outdoor air temperature
used as an index for heating and cooling energy requirements. Heatingdegree-days are the number of degrees that the daily average temperaturefalls below 65° F. Cooling degree-days are the number of degrees that thedaily average temperature rises above 65° F. The daily average temperatureis the mean of the maximum and minimum temperatures in a 24-hour period. For example, a weather station recording an average daily temperature of 40°F would report 25 heating degree-days for that day (and 0 coolingdegree-days). If a weather station recorded an average daily temperature of78° F, cooling degree-days for that station would be 13 (and 0 heating degreedays).
Web Pages: • See http://www.eia.gov/totalenergy/data/monthly/#summaryfor current data. • See http://www.eia.gov/totalenergy/data/annual/#summary
for historical data.Sources: There are several degree-day databases maintained by the
National Oceanic and Atmospheric Administration. The information publishedhere is developed by the National Weather Service Climate Prediction Center,Camp Springs, MD. The data are available weekly with monthly summariesand are based on mean daily temperatures recorded at about 200 majorweather stations around the country. The temperature information recordedat those weather stations is used to calculate statewide degree-day averagesbased on population. The state figures are then aggregated into CensusDivisions and into the national average. The population weights currentlyused represent resident state population data estimated for the 2000 Censusby the U.S. Department of Commerce, Bureau of the Census. The dataprovided here are available sooner than the Historical Climatology Series 5-1(heating degree-days) developed by the National Climatic Data Center,Asheville, NC, which compiles data from some 8,000 weather stations.
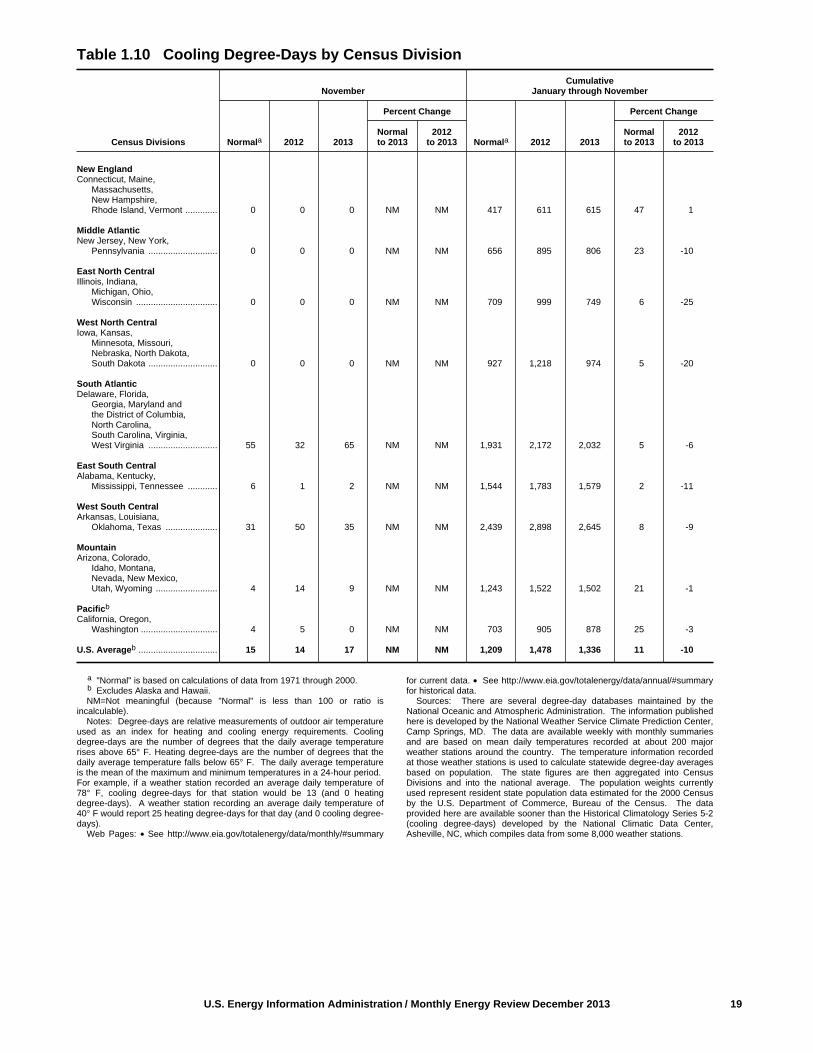
U.S. Energy Information Administration / Monthly Energy Review December 2013 19
Table 1.10 Cooling Degree-Days by Census Division
Census Divisions
NovemberCumulative
January through November
Normala 2012 2013
Percent Change
Normala 2012 2013
Percent Change
Normalto 2013
2012to 2013
Normalto 2013
2012to 2013
New EnglandConnecticut, Maine,
Massachusetts,New Hampshire,Rhode Island, Vermont ............. 0 0 0 NM NM 417 611 615 47 1
Middle AtlanticNew Jersey, New York,
Pennsylvania ............................ 0 0 0 NM NM 656 895 806 23 -10
East North CentralIllinois, Indiana,
Michigan, Ohio,Wisconsin ................................. 0 0 0 NM NM 709 999 749 6 -25
West North CentralIowa, Kansas,
Minnesota, Missouri,Nebraska, North Dakota,South Dakota ............................ 0 0 0 NM NM 927 1,218 974 5 -20
South AtlanticDelaware, Florida,
Georgia, Maryland andthe District of Columbia,North Carolina,South Carolina, Virginia,West Virginia ............................ 55 32 65 NM NM 1,931 2,172 2,032 5 -6
East South CentralAlabama, Kentucky,
Mississippi, Tennessee ............ 6 1 2 NM NM 1,544 1,783 1,579 2 -11
West South CentralArkansas, Louisiana,
Oklahoma, Texas ..................... 31 50 35 NM NM 2,439 2,898 2,645 8 -9
MountainArizona, Colorado,
Idaho, Montana,Nevada, New Mexico,Utah, Wyoming ......................... 4 14 9 NM NM 1,243 1,522 1,502 21 -1
Pacificb
California, Oregon,Washington ............................... 4 5 0 NM NM 703 905 878 25 -3
U.S. Averageb ................................ 15 14 17 NM NM 1,209 1,478 1,336 11 -10
a "Normal" is based on calculations of data from 1971 through 2000.b Excludes Alaska and Hawaii.NM=Not meaningful (because "Normal" is less than 100 or ratio is
incalculable). Notes: Degree-days are relative measurements of outdoor air temperature
used as an index for heating and cooling energy requirements. Coolingdegree-days are the number of degrees that the daily average temperaturerises above 65° F. Heating degree-days are the number of degrees that thedaily average temperature falls below 65° F. The daily average temperatureis the mean of the maximum and minimum temperatures in a 24-hour period. For example, if a weather station recorded an average daily temperature of78° F, cooling degree-days for that station would be 13 (and 0 heatingdegree-days). A weather station recording an average daily temperature of40° F would report 25 heating degree-days for that day (and 0 cooling degree-days).
Web Pages: • See http://www.eia.gov/totalenergy/data/monthly/#summary
for current data. • See http://www.eia.gov/totalenergy/data/annual/#summaryfor historical data.
Sources: There are several degree-day databases maintained by theNational Oceanic and Atmospheric Administration. The information publishedhere is developed by the National Weather Service Climate Prediction Center,Camp Springs, MD. The data are available weekly with monthly summariesand are based on mean daily temperatures recorded at about 200 majorweather stations around the country. The temperature information recordedat those weather stations is used to calculate statewide degree-day averagesbased on population. The state figures are then aggregated into CensusDivisions and into the national average. The population weights currentlyused represent resident state population data estimated for the 2000 Censusby the U.S. Department of Commerce, Bureau of the Census. The dataprovided here are available sooner than the Historical Climatology Series 5-2(cooling degree-days) developed by the National Climatic Data Center,Asheville, NC, which compiles data from some 8,000 weather stations.

Energy Overview
Note. Merchandise Trade Value. Imports data presentedare based on the customs values. Those values do notinclude insurance and freight and are consequently lowerthan the cost, insurance, and freight (CIF) values, which arealso reported by the Bureau of the Census. All exports data,and imports data through 1980, are on a free alongside ship(f.a.s.) basis.
“Balance” is exports minus imports; a positive balanceindicates a surplus trade value and a negative balanceindicates a deficit trade value. “Energy” includes mineralfuels, lubricants, and related material. “Non-Energy Balance”and “Total Merchandise” include foreign exports (i.e.,re-exports) and nonmonetary gold and U.S. Department ofDefense Grant-Aid shipments. The “Non-Energy Balance”is calculated by subtracting the “Energy” from the “TotalMerchandise Balance.”
“Imports” consist of government and nongovernmentshipments of merchandise into the 50 states, the District ofColumbia, Puerto Rico, the U.S. Virgin Islands, and theU.S. Foreign Trade Zones. They reflect the total arrivalfrom foreign countries of merchandise that immediatelyentered consumption channels, warehouses, the ForeignTrade Zones, or the Strategic Petroleum Reserve. Theyexclude shipments between the United States, Puerto Rico,and U.S. possessions, shipments to U.S. Armed Forces anddiplomatic missions abroad for their own use, U.S. goodsreturned to the United States by its Armed Forces, andin-transit shipments.
Table 1.5 Sources
U.S. Department of Commerce, Bureau of the Census,Foreign Trade Division:
Petroleum Exports1974–1987: “U.S. Exports,” FT-410, December issues. 1988 and 1989: “Report on U.S. Merchandise Trade,” FinalRevisions.1990–1992: “U.S. Merchandise Trade,” Final Report.1993–2009: “U.S. International Trade in Goods and Services,”Annual Revisions.2010–2012: “U.S. International Trade in Goods and Services,”2012 Annual Revisions.2013: “U.S. International Trade in Goods and Services,”FT-900, monthly.
Petroleum Imports1974–1987: “U.S. Merchandise Trade,” FT-900, Decemberissues, 1975-1988.1988 and 1989: “Report on U.S. Merchandise Trade,” FinalRevisions.1990–1993: “U.S. Merchandise Trade,” Final Report.1994–2009: “U.S. International Trade in Goods and Services,”Annual Revisions.2010–2012: “U.S. International Trade in Goods and Services,”2012 Annual Revisions.2013: “U.S. International Trade in Goods and Services,”FT-900, monthly.
Energy Exports and Imports1974–1987: U.S. merchandise trade press releases anddatabase printouts for adjustments. 1988: January-July, monthly FT-900 supplement, 1989 issues.August-December, monthly FT-900, 1989 issues.1989: Monthly FT-900, 1990 issues. 1990–1992: “U.S. Merchandise Trade,” Final Report.1993–2009: “U.S. International Trade in Goods and Services,”Annual Revisions. 2010–2012: “U.S. International Trade in Goods and Services,”2012 Annual Revisions.2013: “U.S. International Trade in Goods and Services,”FT-900, monthly. Petroleum, Energy, and Non-Energy BalancesCalculated by the U.S. Energy Information Administration.
Total Merchandise1974–1987: U.S. merchandise trade press releases and databaseprintouts for adjustments.1988: “Report on U.S. Merchandise Trade, 1988 FinalRevisions,” August 18, 1989.1989: “Report on U.S. Merchandise Trade, 1989Revisions,” July 10, 1990.1990: “U.S. Merchandise Trade, 1990 Final Report,” May10, 1991, and “U.S. Merchandise Trade, December 1992,”February 18, 1993, page 3.1991: “U.S. Merchandise Trade, 1992 Final Report,” May12, 1993.1992–2009: “U.S. International Trade in Goods and Services,”Annual Revisions.2010–2012: “U.S. International Trade in Goods and Services,”2012 Annual Revisions.2013: “U.S. International Trade in Goods and Services,”FT-900, monthly.
20 U.S. Energy Information Administration / Monthly Energy Review December 2013

2. Energy Consumptionby Sector
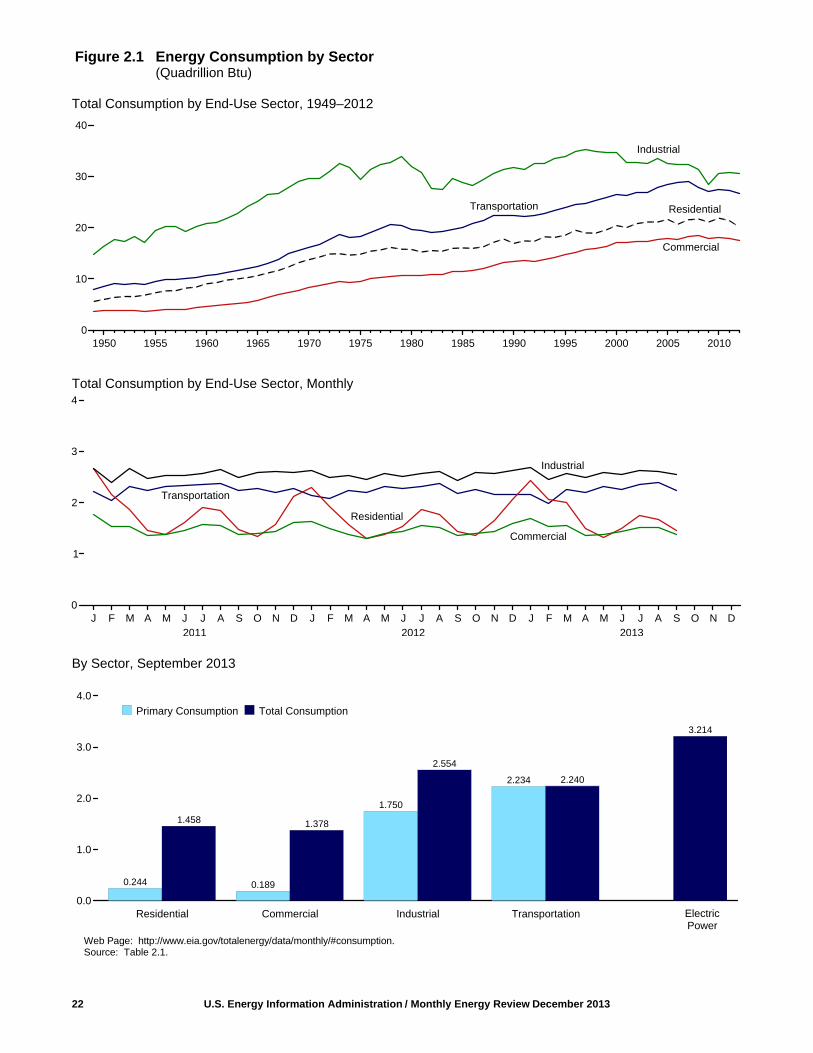
Figure 2.1 Energy Consumption by Sector(Quadrillion Btu)
Total Consumption by End-Use Sector, 1949–2012
Total Consumption by End-Use Sector, Monthly
By Sector, September 2013
22 U.S. Energy Information Administration / Monthly Energy Review December 2013
Transportation
Residential
1950 1955 1960 1965 1970 1975 1980 1985 1990 1995 2000 2005 20100
10
20
30
40
Industrial
Transportation Residential
Commercial
J F M A M J J A S O N D J F M A M J J A S O N D J F M A M J J A S O N D0
1
2
3
4
Industrial
Commercial
2011 2012 2013
1.458 1.378
2.554
2.240
3.214
0.244 0.189
1.750
2.234
Residential Commercial Industrial Transportation0.0
1.0
2.0
3.0
4.0
Primary Consumption Total Consumption
ElectricPower
Web Page: http://www.eia.gov/totalenergy/data/monthly/#consumption.Source: Table 2.1.

U.S. Energy Information Administration / Monthly Energy Review December 2013 23
Table 2.1 Energy Consumption by Sector (Trillion Btu)
End-Use Sectors ElectricPower
Sectorc,d
BalancingItemg
Primary Totalh
Residential Commerciala Industrialb Transportation
Primarye Totalf Primarye Totalf Primarye Totalf Primarye Totalf Primarye
1950 Total ...................... 4,829 5,989 2,834 3,893 13,890 16,241 8,383 8,492 4,679 (s) 34,6161955 Total ...................... 5,608 7,278 2,561 3,895 16,103 19,485 9,474 9,550 6,461 (s) 40,2081960 Total ...................... 6,651 9,039 2,723 4,609 16,996 20,842 10,560 10,596 8,158 (s) 45,0861965 Total ...................... 7,279 10,639 3,177 5,845 20,148 25,098 12,399 12,432 11,012 (s) 54,0151970 Total ...................... 8,322 13,766 4,237 8,346 22,964 29,628 16,062 16,098 16,253 (s) 67,8381975 Total ...................... 7,990 14,813 4,059 9,492 21,434 29,413 18,210 18,245 20,270 1 71,9651980 Total ...................... 7,439 15,753 4,105 10,578 22,595 32,039 19,659 19,697 24,269 -1 78,0671985 Total ...................... 7,148 16,041 3,732 11,451 19,443 28,816 20,041 20,088 26,032 -4 76,3921990 Total ...................... 6,557 16,945 3,896 13,320 21,180 31,810 22,366 22,420 d 30,495 -9 84,4851995 Total ...................... 6,936 18,519 4,101 14,690 22,719 33,971 23,791 23,846 33,479 3 91,0292000 Total ...................... 7,159 20,425 4,278 17,175 22,824 34,664 26,489 26,548 38,062 2 98,8142001 Total ...................... 6,868 20,042 4,084 17,137 21,794 32,720 26,213 26,275 37,215 -6 96,1682002 Total ...................... 6,912 20,791 4,132 17,345 21,799 32,662 26,781 26,842 38,016 5 97,6452003 Total ...................... 7,238 21,125 4,298 17,346 21,536 32,555 26,845 26,919 38,028 -1 97,9432004 Total ...................... 6,993 21,092 4,232 17,659 22,412 33,519 27,817 27,895 38,712 -6 R 100,1612005 Total ...................... 6,909 21,626 4,051 17,857 21,411 32,446 28,272 28,353 39,638 (s) 100,2822006 Total ...................... 6,168 20,688 3,747 R 17,710 21,536 32,401 28,751 28,830 39,428 (s) R 99,6292007 Total ...................... 6,608 R 21,542 3,922 R 18,256 21,379 R 32,404 29,029 29,116 R 40,380 -1 R 101,3172008 Total ...................... 6,916 21,695 4,098 R 18,405 20,553 31,362 27,747 27,829 39,978 1 R 99,2922009 Total ...................... 6,666 21,111 4,053 17,891 18,776 28,488 27,025 27,107 R 38,076 (s) R 94,5962010 Total ...................... 6,595 21,853 4,013 18,053 20,296 30,543 27,479 27,560 39,627 7 98,016
2011 January .................. 1,160 2,670 633 1,760 1,835 2,668 2,218 2,225 3,477 3 9,326 February ................ 942 2,158 529 1,539 1,618 2,391 2,041 2,048 3,006 (s) 8,136 March ..................... 760 1,862 447 1,542 1,801 2,665 2,306 2,313 3,069 -2 8,381 April ....................... 474 1,460 297 1,354 1,634 2,479 2,240 2,247 2,895 -1 7,539 May ........................ 325 1,380 220 1,382 1,642 2,528 2,316 2,323 3,111 -1 7,613 June ....................... 257 1,608 196 1,463 1,623 2,522 2,323 2,330 3,523 2 7,925 July ........................ 235 1,908 186 1,571 1,632 2,575 2,340 2,347 4,008 6 8,408 August ................... 244 1,846 203 1,551 1,726 2,653 2,370 2,377 3,883 5 8,430 September ............. 256 1,473 210 1,379 1,651 2,493 2,238 2,244 3,234 (s) 7,589 October .................. 374 1,347 284 1,401 1,715 2,582 2,276 2,282 2,963 -1 7,611 November .............. 585 1,572 366 1,431 1,749 2,605 2,195 2,201 2,916 -2 7,808 December .............. 872 2,111 501 1,618 1,743 2,595 2,273 2,280 3,215 -1 8,602 Total ...................... 6,483 21,395 4,071 17,990 20,368 30,758 27,136 27,217 39,301 8 97,366
2012 January .................. 992 R 2,291 553 R 1,639 R 1,816 R 2,633 2,140 2,147 R 3,210 (s) R 8,711 February ................ 834 R 1,927 478 R 1,492 R 1,707 R 2,500 2,079 2,086 R 2,906 -2 R 8,003 March ..................... 562 R 1,573 341 R 1,384 R 1,701 R 2,529 2,227 2,233 R 2,889 -5 R 7,715 April ....................... 413 R 1,308 272 R 1,298 R 1,629 R 2,452 2,199 2,205 R 2,750 -5 R 7,258 May ........................ 297 R 1,370 212 R 1,390 R 1,674 R 2,574 2,308 2,314 R 3,157 -2 R 7,646 June ....................... 252 R 1,541 193 R 1,430 R 1,638 R 2,515 2,272 2,278 R 3,409 2 R 7,766 July ........................ 239 R 1,873 R 187 R 1,545 R 1,656 2,577 R 2,316 2,322 R 3,921 R 5 R 8,323 August ................... 247 R 1,760 R 205 R 1,515 R 1,708 R 2,609 R 2,370 2,376 R 3,732 R 3 R 8,264 September ............. 248 R 1,429 202 R 1,360 R 1,621 R 2,436 2,165 2,171 R 3,160 2 R 7,398 October .................. 377 R 1,356 275 R 1,393 R 1,754 R 2,594 R 2,258 2,264 R 2,942 (s) R 7,606 November .............. 632 R 1,643 379 R 1,438 R 1,744 R 2,565 2,148 2,154 R 2,896 (s) R 7,799 December .............. 838 R 2,057 473 R 1,584 R 1,786 R 2,623 2,154 R 2,160 R 3,174 1 R 8,425 Total ...................... 5,931 R 20,122 R 3,770 R 17,472 R 20,435 R 30,612 26,634 R 26,710 R 38,146 R -1 R 94,915
2013 January .................. 1,067 R 2,431 572 R 1,688 1,884 R 2,695 2,154 2,161 R 3,297 -4 R 8,970 February ................ 926 R 2,066 516 R 1,534 1,693 R 2,445 1,975 1,981 R 2,916 -4 R 8,021 March ..................... 837 R 1,997 474 R 1,553 1,765 R 2,576 2,249 2,256 R 3,057 -5 R 8,377 April ....................... 509 R 1,485 311 R 1,349 1,688 R 2,484 2,197 2,204 R 2,817 -7 R 7,516 May ........................ 318 R 1,325 219 R 1,377 R 1,720 R 2,595 2,299 2,306 R 3,046 -6 R 7,596 June ....................... 241 R 1,493 181 R 1,432 1,678 R 2,543 2,248 2,254 R 3,376 -3 R 7,721 July ........................ 233 R 1,744 183 R 1,517 1,746 R 2,627 2,357 2,363 R 3,733 (s) R 8,251 August ................... 231 R 1,662 188 R 1,509 1,728 R 2,608 2,379 2,385 R 3,639 -1 R 8,163 September ............. E 244 E 1,458 E 189 E 1,378 E 1,750 E 2,554 E 2,234 E 2,240 3,214 E -1 E 7,629 9-Month Total ....... E 4,606 E 15,660 E 2,833 E 13,337 E 15,652 E 23,128 E 20,091 E 20,151 29,094 E -31 E 72,245
2012 9-Month Total ....... 4,084 15,072 2,644 13,055 15,150 22,826 20,075 20,132 29,133 -1 71,0842011 9-Month Total ....... 4,653 16,363 2,921 13,541 15,161 22,975 20,393 20,454 30,205 12 73,345
a Commercial sector, including commercial combined-heat-and-power (CHP)and commercial electricity-only plants.
b Industrial sector, including industrial combined-heat-and-power (CHP) andindustrial electricity-only plants.
c Electricity-only and combined-heat-and-power (CHP) plants within the NAICS22 category whose primary business is to sell electricity, or electricity and heat, tothe public.
d Through 1988, data are for electric utilities only. Beginning in 1989, data arefor electric utilities and independent power producers.
e See "Primary Energy Consumption" in Glossary.f Total energy consumption in the end-use sectors consists of primary energy
consumption, electricity retail sales, and electrical system energy losses. See Note1, "Electrical System Energy Losses," at end of section.
g A balancing item. The sum of primary consumption in the five energy-usesectors equals the sum of total consumption in the four end-use sectors. However,
total energy consumption does not equal the sum of the sectoral components dueto the use of sector-specific conversion factors for coal and natural gas.
h Primary energy consumption total. See Table 1.3.R=Revised. E=Estimate. (s)=Less than 0.5 trillion Btu and greater than -0.5
trillion Btu. Notes: • Data are estimates, except for the electric power sector. • See Note 2,
"Classification of Power Plants Into Energy-Use Sectors," at end of Section 7.• See Note 2, "Energy Consumption Data and Surveys," at end of section.• Totals may not equal sum of components due to independent rounding.• Geographic coverage is the 50 states and the District of Columbia.
Web Page: See http://www.eia.gov/totalenergy/data/monthly/#consumption(Excel and CSV files) for all available annual data beginning in 1949 and monthlydata beginning in 1973.
Sources: Tables 1.3 and 2.2–2.6.
Selected years of data from 1949 through 1972 have been added to this table.For all years of data from 1949 through 2013, see the “Web Page” cited above.

Figure 2.2 Residential Sector Energy Consumption(Quadrillion Btu)
By Major Source, 1949–2012
By Major Source, Monthly
Total, January–September By Major Source, September 2013
24 U.S. Energy Information Administration / Monthly Energy Review December 2013
Natural Gas
Electricitya
Petroleum
Coal
1950 1955 1960 1965 1970 1975 1980 1985 1990 1995 2000 2005 20100
1
2
3
4
5
6
Renewable Energy
J F M A M J J A S O N D J F M A M J J A S O N D J F M A M J J A S O N D0.0
0.3
0.6
0.9
1.2
Natural Gas
Electricitya
Petroleum
2011 2012 2013
Renewable Energy
16.36315.072
15.660
2011 2012 20130
3
6
9
12
15
18
0.414
0.124
0.064
0.057
Natural Gas
Petroleum
0.0 0.2 0.4 0.6 0.8 1.0
Electricitya
RenewableEnergy
a Electricity retail sales.Web Page: http://www.eia.gov/totalenergy/data/monthly/#consumption.Source: Table 2.2.
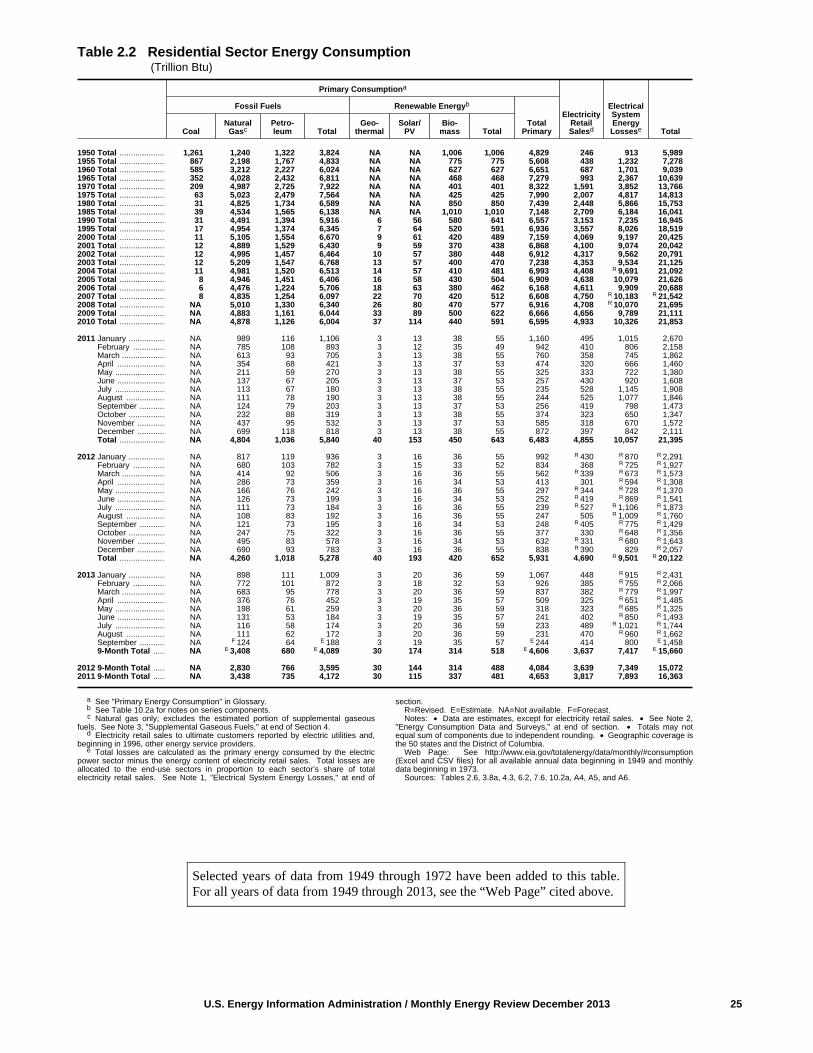
U.S. Energy Information Administration / Monthly Energy Review December 2013 25
Table 2.2 Residential Sector Energy Consumption (Trillion Btu)
Primary Consumptiona
ElectricityRetailSalesd
ElectricalSystemEnergyLossese Total
Fossil Fuels Renewable Energyb
TotalPrimaryCoal
NaturalGasc
Petro-leum Total
Geo-thermal
Solar/PV
Bio-mass Total
1950 Total .................... 1,261 1,240 1,322 3,824 NA NA 1,006 1,006 4,829 246 913 5,9891955 Total .................... 867 2,198 1,767 4,833 NA NA 775 775 5,608 438 1,232 7,2781960 Total .................... 585 3,212 2,227 6,024 NA NA 627 627 6,651 687 1,701 9,0391965 Total .................... 352 4,028 2,432 6,811 NA NA 468 468 7,279 993 2,367 10,6391970 Total .................... 209 4,987 2,725 7,922 NA NA 401 401 8,322 1,591 3,852 13,7661975 Total .................... 63 5,023 2,479 7,564 NA NA 425 425 7,990 2,007 4,817 14,8131980 Total .................... 31 4,825 1,734 6,589 NA NA 850 850 7,439 2,448 5,866 15,7531985 Total .................... 39 4,534 1,565 6,138 NA NA 1,010 1,010 7,148 2,709 6,184 16,0411990 Total .................... 31 4,491 1,394 5,916 6 56 580 641 6,557 3,153 7,235 16,9451995 Total .................... 17 4,954 1,374 6,345 7 64 520 591 6,936 3,557 8,026 18,5192000 Total .................... 11 5,105 1,554 6,670 9 61 420 489 7,159 4,069 9,197 20,4252001 Total .................... 12 4,889 1,529 6,430 9 59 370 438 6,868 4,100 9,074 20,0422002 Total .................... 12 4,995 1,457 6,464 10 57 380 448 6,912 4,317 9,562 20,7912003 Total .................... 12 5,209 1,547 6,768 13 57 400 470 7,238 4,353 9,534 21,1252004 Total .................... 11 4,981 1,520 6,513 14 57 410 481 6,993 4,408 R 9,691 21,0922005 Total .................... 8 4,946 1,451 6,406 16 58 430 504 6,909 4,638 10,079 21,6262006 Total .................... 6 4,476 1,224 5,706 18 63 380 462 6,168 4,611 9,909 20,6882007 Total .................... 8 4,835 1,254 6,097 22 70 420 512 6,608 4,750 R 10,183 R 21,5422008 Total .................... NA 5,010 1,330 6,340 26 80 470 577 6,916 4,708 R 10,070 21,6952009 Total .................... NA 4,883 1,161 6,044 33 89 500 622 6,666 4,656 9,789 21,1112010 Total .................... NA 4,878 1,126 6,004 37 114 440 591 6,595 4,933 10,326 21,853
2011 January ................ NA 989 116 1,106 3 13 38 55 1,160 495 1,015 2,670 February .............. NA 785 108 893 3 12 35 49 942 410 806 2,158 March ................... NA 613 93 705 3 13 38 55 760 358 745 1,862 April ..................... NA 354 68 421 3 13 37 53 474 320 666 1,460 May ...................... NA 211 59 270 3 13 38 55 325 333 722 1,380 June ..................... NA 137 67 205 3 13 37 53 257 430 920 1,608 July ...................... NA 113 67 180 3 13 38 55 235 528 1,145 1,908 August ................. NA 111 78 190 3 13 38 55 244 525 1,077 1,846 September ........... NA 124 79 203 3 13 37 53 256 419 798 1,473 October ................ NA 232 88 319 3 13 38 55 374 323 650 1,347 November ............ NA 437 95 532 3 13 37 53 585 318 670 1,572 December ............ NA 699 118 818 3 13 38 55 872 397 842 2,111 Total .................... NA 4,804 1,036 5,840 40 153 450 643 6,483 4,855 10,057 21,395
2012 January ................ NA 817 119 936 3 16 36 55 992 R 430 R 870 R 2,291 February .............. NA 680 103 782 3 15 33 52 834 368 R 725 R 1,927 March ................... NA 414 92 506 3 16 36 55 562 R 339 R 673 R 1,573 April ..................... NA 286 73 359 3 16 34 53 413 301 R 594 R 1,308 May ...................... NA 166 76 242 3 16 36 55 297 R 344 R 728 R 1,370 June ..................... NA 126 73 199 3 16 34 53 252 R 419 R 869 R 1,541 July ...................... NA 111 73 184 3 16 36 55 239 R 527 R 1,106 R 1,873 August ................. NA 108 83 192 3 16 36 55 247 505 R 1,009 R 1,760 September ........... NA 121 73 195 3 16 34 53 248 R 405 R 775 R 1,429 October ................ NA 247 75 322 3 16 36 55 377 330 R 648 R 1,356 November ............ NA 495 83 578 3 16 34 53 632 R 331 R 680 R 1,643 December ............ NA 690 93 783 3 16 36 55 838 R 390 829 R 2,057 Total .................... NA 4,260 1,018 5,278 40 193 420 652 5,931 4,690 R 9,501 R 20,122
2013 January ................ NA 898 111 1,009 3 20 36 59 1,067 448 R 915 R 2,431 February .............. NA 772 101 872 3 18 32 53 926 385 R 755 R 2,066 March ................... NA 683 95 778 3 20 36 59 837 382 R 779 R 1,997 April ..................... NA 376 76 452 3 19 35 57 509 325 R 651 R 1,485 May ...................... NA 198 61 259 3 20 36 59 318 323 R 685 R 1,325 June ..................... NA 131 53 184 3 19 35 57 241 402 R 850 R 1,493 July ...................... NA 116 58 174 3 20 36 59 233 489 R 1,021 R 1,744 August ................. NA 111 62 172 3 20 36 59 231 470 R 960 R 1,662 September ........... NA F 124 64 E 188 3 19 35 57 E 244 414 800 E 1,458 9-Month Total ..... NA E 3,408 680 E 4,089 30 174 314 518 E 4,606 3,637 7,417 E 15,660
2012 9-Month Total ..... NA 2,830 766 3,595 30 144 314 488 4,084 3,639 7,349 15,0722011 9-Month Total ..... NA 3,438 735 4,172 30 115 337 481 4,653 3,817 7,893 16,363
a See "Primary Energy Consumption" in Glossary.b See Table 10.2a for notes on series components.c Natural gas only; excludes the estimated portion of supplemental gaseous
fuels. See Note 3, "Supplemental Gaseous Fuels," at end of Section 4.d Electricity retail sales to ultimate customers reported by electric utilities and,
beginning in 1996, other energy service providers.e Total losses are calculated as the primary energy consumed by the electric
power sector minus the energy content of electricity retail sales. Total losses areallocated to the end-use sectors in proportion to each sector’s share of totalelectricity retail sales. See Note 1, "Electrical System Energy Losses," at end of
section.R=Revised. E=Estimate. NA=Not available. F=Forecast. Notes: • Data are estimates, except for electricity retail sales. • See Note 2,
"Energy Consumption Data and Surveys," at end of section. • Totals may notequal sum of components due to independent rounding. • Geographic coverage isthe 50 states and the District of Columbia.
Web Page: See http://www.eia.gov/totalenergy/data/monthly/#consumption(Excel and CSV files) for all available annual data beginning in 1949 and monthlydata beginning in 1973.
Sources: Tables 2.6, 3.8a, 4.3, 6.2, 7.6, 10.2a, A4, A5, and A6.
Selected years of data from 1949 through 1972 have been added to this table.For all years of data from 1949 through 2013, see the “Web Page” cited above.

Figure 2.3 Commercial Sector Energy Consumption(Quadrillion Btu)
By Major Source, 1949–2012
By Major Source, Monthly
Total, January–September By Major Source, September 2013
.
26 U.S. Energy Information Administration / Monthly Energy Review December 2013
1950 1955 1960 1965 1970 1975 1980 1985 1990 1995 2000 2005 20100
1
2
3
4
5Electricitya
Natural Gas
Petroleum
Coal Renewable Energy
2011 2012 2013J F M A M J J A S O N D J F M A M J J A S O N D J F M A M J J A S O N D
0.0
0.1
0.2
0.3
0.4
0.5
0.6
Natural Gas
Electricitya
PetroleumRenewable Energy
13.54113.055 13.337
2011 2012 20130
3
6
9
12
15
0.405
0.139
0.035
0.011
0.003
Natural Gas
Petroleum
Coal
0.0 0.1 0.2 0.3 0.4 0.5 0.6
Electricitya
RenewableEnergy
a Electricity retail sales.Web Page: http://www.eia.gov/totalenergy/data/monthly/#consumption.Source: Table 2.3.

U.S. Energy Information Administration / Monthly Energy Review December 2013 27
Table 2.3 Commercial Sector Energy Consumption (Trillion Btu)
Primary Consumptiona
Elec-tricityRetailSalesf
ElectricalSystemEnergyLossesg Total
Fossil Fuels Renewable Energyb
TotalPrimaryCoal
NaturalGasc
Petro-leumd Total
Hydro-electricPowere
Geo-thermal
Solar/PV Wind
Bio-mass Total
1950 Total .................... 1,542 401 872 2,815 NA NA NA NA 19 19 2,834 225 834 3,8931955 Total .................... 801 651 1,095 2,547 NA NA NA NA 15 15 2,561 350 984 3,8951960 Total .................... 407 1,056 1,248 2,711 NA NA NA NA 12 12 2,723 543 1,344 4,6091965 Total .................... 265 1,490 1,413 3,168 NA NA NA NA 9 9 3,177 789 1,880 5,8451970 Total .................... 165 2,473 1,592 4,229 NA NA NA NA 8 8 4,237 1,201 2,908 8,3461975 Total .................... 147 2,558 1,346 4,051 NA NA NA NA 8 8 4,059 1,598 3,835 9,4921980 Total .................... 115 2,651 1,318 4,084 NA NA NA NA 21 21 4,105 1,906 4,567 10,5781985 Total .................... 137 2,488 1,083 3,708 NA NA NA NA 24 24 3,732 2,351 5,368 11,4511990 Total .................... 124 2,682 991 3,798 1 3 – – 94 98 3,896 2,860 6,564 13,3201995 Total .................... 117 3,096 769 3,982 1 5 – – 113 118 4,101 3,252 7,338 14,6902000 Total .................... 92 3,252 807 4,150 1 8 – – 119 128 4,278 3,956 8,942 17,1752001 Total .................... 97 3,097 790 3,984 1 8 – – 92 101 4,084 4,062 8,990 17,1372002 Total .................... 90 3,212 726 4,028 (s) 9 – – 95 104 4,132 4,110 9,104 17,3452003 Total .................... 82 3,261 842 4,185 1 11 – – 101 113 4,298 4,090 8,958 17,3462004 Total .................... 103 3,201 809 4,113 1 12 – – 105 118 4,232 4,198 9,229 17,6592005 Total .................... 97 3,073 761 3,932 1 14 – – 105 120 4,051 4,351 9,455 17,8572006 Total .................... 65 2,902 663 3,629 1 14 – – 103 118 3,747 4,435 9,529 R 17,7102007 Total .................... 70 3,085 649 3,805 1 14 – – 103 118 3,922 4,560 R 9,774 R 18,2562008 Total .................... 81 3,228 664 3,973 1 15 (s) – 109 125 4,098 4,558 9,749 R 18,4052009 Total .................... 73 3,187 664 3,924 1 17 (s) (s) 112 129 4,053 4,460 9,378 17,8912010 Total .................... 70 3,165 649 3,883 1 19 (s) (s) 111 130 4,013 4,539 9,501 18,053
2011 January ................ 8 539 75 622 (s) 2 (s) (s) 9 11 633 369 757 1,760 February .............. 7 441 70 518 (s) 2 (s) (s) 9 10 529 340 670 1,539 March ................... 7 371 58 436 (s) 2 (s) (s) 10 11 447 356 740 1,542 April ..................... 5 240 41 286 (s) 2 (s) (s) 9 11 297 343 714 1,354 May ...................... 5 171 33 209 (s) 2 (s) (s) 10 12 220 367 795 1,382 June ..................... 5 138 42 185 (s) 2 (s) (s) 10 11 196 403 863 1,463 July ...................... 4 130 40 175 (s) 2 (s) (s) 10 12 186 437 948 1,571 August ................. 4 138 50 191 (s) 2 (s) (s) 10 12 203 441 906 1,551 September ........... 4 143 51 198 (s) 2 (s) (s) 9 11 210 402 767 1,379 October ................ 4 212 57 273 (s) 2 (s) (s) 10 11 284 371 747 1,401 November ............ 4 288 62 354 (s) 2 (s) (s) 10 11 366 343 722 1,431 December ............ 5 405 79 489 (s) 2 (s) (s) 10 12 501 358 759 1,618 Total .................... 62 3,214 659 3,935 (s) 20 1 (s) 115 136 4,071 4,531 9,387 17,990
2012 January ................ 5 457 79 542 (s) 2 (s) (s) 9 11 553 359 R 727 R 1,639 February .............. 5 398 65 468 (s) 2 (s) (s) 9 R 10 478 R 341 R 672 R 1,492 March ................... R 4 267 58 330 (s) 2 (s) (s) 9 11 341 R 350 R 694 R 1,384 April ..................... 3 214 45 261 (s) 2 (s) (s) 9 11 272 R 345 R 681 R 1,298 May ...................... 3 152 46 201 (s) 2 (s) (s) 9 11 212 R 378 R 800 R 1,390 June ..................... 3 134 45 182 (s) 2 (s) (s) 9 11 193 R 403 R 834 R 1,430 July ...................... 3 128 45 175 (s) 2 (s) (s) 9 11 R 187 R 439 R 920 R 1,545 August ................. 3 138 53 194 (s) 2 (s) (s) 9 11 R 205 R 437 R 873 R 1,515 September ........... 3 144 44 191 (s) 2 (s) (s) 9 11 202 R 398 R 761 R 1,360 October ................ 3 217 43 264 (s) 2 (s) (s) 9 11 275 R 377 R 741 R 1,393 November ............ 4 314 50 369 (s) 2 (s) (s) 9 11 379 R 347 R 711 R 1,438 December ............ R 5 400 57 461 (s) 2 (s) (s) R 9 R 11 473 R 355 R 756 R 1,584 Total .................... 44 2,963 631 3,638 (s) 20 1 1 R 110 R 132 R 3,770 R 4,528 R 9,174 R 17,472
2013 January ................ 5 487 68 561 (s) 2 (s) (s) 10 12 572 366 R 749 R 1,688 February .............. 5 436 64 505 (s) 2 (s) (s) 9 10 516 344 R 674 R 1,534 March ................... 5 400 58 463 (s) 2 (s) (s) 10 12 474 355 R 724 R 1,553 April ..................... 3 252 45 300 (s) 2 (s) (s) 9 11 311 346 R 692 R 1,349 May ...................... 3 171 34 208 (s) 2 (s) (s) 9 11 219 371 R 787 R 1,377 June ..................... 3 138 28 169 (s) 2 (s) (s) 9 11 181 402 R 850 R 1,432 July ...................... 3 139 30 171 (s) 2 (s) (s) 9 12 183 432 R 902 R 1,517 August ................. 3 140 34 176 (s) 2 (s) (s) 9 11 188 434 R 887 R 1,509 September ........... 3 F 139 35 E 178 (s) 2 (s) (s) 9 11 E 189 405 784 E 1,378 9-Month Total ..... 32 E 2,302 397 E 2,731 (s) 15 2 1 84 101 E 2,833 3,455 7,050 E 13,337
2012 9-Month Total ..... 32 2,032 481 2,545 (s) 15 1 (s) 83 99 2,644 3,449 6,962 13,0552011 9-Month Total ..... 48 2,310 461 2,819 (s) 15 1 (s) 86 102 2,921 3,460 7,160 13,541
a See "Primary Energy Consumption" in Glossary.b See Table 10.2a for notes on series components and estimation.c Natural gas only; excludes the estimated portion of supplemental gaseous
fuels. See Note 3, "Supplemental Gaseous Fuels," at end of Section 4.d Does not include biofuels that have been blended with petroleum—biofuels
are included in "Biomass."e Conventional hydroelectric power.f Electricity retail sales to ultimate customers reported by electric utilities and,
beginning in 1996, other energy service providers.g Total losses are calculated as the primary energy consumed by the electric
power sector minus the energy content of electricity retail sales. Total losses areallocated to the end-use sectors in proportion to each sector’s share of totalelectricity retail sales. See Note 1, "Electrical System Energy Losses," at end ofsection.
R=Revised. E=Estimate. NA=Not available. – =No data reported. F=Forecast. (s)=Less than 0.5 trillion Btu.
Notes: • Data are estimates, except for coal totals beginning in 2008;hydroelectric power; solar/PV; wind; and electricity retail sales beginning in 1979.• The commercial sector includes commercial combined-heat-and-power (CHP)and commercial electricity-only plants. See Note 2, "Classification of Power PlantsInto Energy-Use Sectors," at end of Section 7. • See Note 2, "EnergyConsumption Data and Surveys," at end of section. • Totals may not equal sum ofcomponents due to independent rounding. • Geographic coverage is the 50 statesand the District of Columbia.
Web Page: See http://www.eia.gov/totalenergy/data/monthly/#consumption(Excel and CSV files) for all available annual data beginning in 1949 and monthlydata beginning in 1973.
Sources: Tables 2.6, 3.8a, 4.3, 6.2, 7.6, 10.2a, A4, A5, and A6.
Selected years of data from 1949 through 1972 have been added to this table.For all years of data from 1949 through 2013, see the “Web Page” cited above.

Figure 2.4 Industrial Sector Energy Consumption(Quadrillion Btu)
By Major Source, 1949–2012
By Major Source, Monthly
Total, January–September By Major Source, September 2013
28 U.S. Energy Information Administration / Monthly Energy Review December 2013
Coal
1950 1955 1960 1965 1970 1975 1980 1985 1990 1995 2000 2005 20100
3
6
9
12
Natural Gas
Petroleum
Electricitya
Renewable Energy
J F M A M J J A S O N D J F M A M J J A S O N D J F M A M J J A S O N D0.0
0.2
0.4
0.6
0.8
1.0
Natural Gas
Petroleum
Electricitya
Coal
Renewable Energy
2011 2012 2013
22.975 22.826 23.128
2011 2012 20130
3
6
9
12
15
18
21
24
27
0.736
0.717
0.274
0.182
0.115
Petroleum
Coal
0.0 0.2 0.4 0.6 0.8 1.0
NaturalGas
RenewableEnergy
Electricitya
a Electricity retail sales.Web Page: http://www.eia.gov/totalenergy/data/monthly/#consumption.Source: Table 2.4.

U.S. Energy Information Administration / Monthly Energy Review December 2013 29
Table 2.4 Industrial Sector Energy Consumption (Trillion Btu)
Primary Consumptiona
Elec-tricityRetailSalesg
ElectricalSystemEnergyLossesh Totale
Fossil Fuels Renewable Energyb
TotalPrimaryCoal
NaturalGasc
Petro-leumd Totale
Hydro-electricPowerf
Geo-thermal
Solar/PV Wind
Bio-mass Total
1950 Total .................... 5,781 3,546 3,960 13,288 69 NA NA NA 532 602 13,890 500 1,852 16,2411955 Total .................... 5,620 4,701 5,123 15,434 38 NA NA NA 631 669 16,103 887 2,495 19,4851960 Total .................... 4,543 5,973 5,766 16,277 39 NA NA NA 680 719 16,996 1,107 2,739 20,8421965 Total .................... 5,127 7,339 6,813 19,260 33 NA NA NA 855 888 20,148 1,463 3,487 25,0981970 Total .................... 4,656 9,536 7,776 21,911 34 NA NA NA 1,019 1,053 22,964 1,948 4,716 29,6281975 Total .................... 3,667 8,532 8,127 20,339 32 NA NA NA 1,063 1,096 21,434 2,346 5,632 29,4131980 Total .................... 3,155 8,333 9,509 20,962 33 NA NA NA 1,600 1,633 22,595 2,781 6,664 32,0391985 Total .................... 2,760 7,032 7,714 17,492 33 NA NA NA 1,918 1,951 19,443 2,855 6,518 28,8161990 Total .................... 2,756 8,451 8,251 19,463 31 2 – – 1,684 1,717 21,180 3,226 7,404 31,8101995 Total .................... 2,488 9,592 8,586 20,727 55 3 – – 1,934 1,992 22,719 3,455 7,796 33,9712000 Total .................... 2,256 9,500 9,075 20,896 42 4 – – 1,881 1,928 22,824 3,631 8,208 34,6642001 Total .................... 2,192 8,676 9,178 20,075 33 5 – – 1,681 1,719 21,794 3,400 7,526 32,7202002 Total .................... 2,019 8,832 9,168 20,079 39 5 – – 1,676 1,720 21,799 3,379 7,484 32,6622003 Total .................... 2,041 8,488 9,230 19,811 43 3 – – 1,679 1,725 21,536 3,454 7,565 32,5552004 Total .................... 2,047 8,550 9,825 20,559 33 4 – – 1,817 1,853 22,412 3,473 R 7,635 33,5192005 Total .................... 1,954 7,907 9,633 19,538 32 4 – – 1,837 1,873 21,411 3,477 7,557 32,4462006 Total .................... 1,914 7,861 9,770 19,606 29 4 – – 1,897 1,930 21,536 3,451 R 7,414 32,4012007 Total .................... 1,865 8,074 9,451 19,414 16 5 – – 1,944 1,965 21,379 3,507 R 7,518 R 32,4042008 Total .................... 1,793 8,083 8,588 18,506 17 5 – – 2,026 2,047 20,553 3,444 7,365 31,3622009 Total .................... 1,392 7,609 7,813 16,791 18 4 – – 1,963 1,985 18,776 3,130 6,582 28,4882010 Total .................... 1,631 8,278 8,172 18,075 16 4 (s) – 2,201 2,221 20,296 3,313 6,934 30,543
2011 January ................ 136 775 725 1,636 1 (s) (s) (s) 197 199 1,835 273 560 2,668 February .............. 132 705 604 1,441 2 (s) (s) (s) 175 177 1,618 260 512 2,391 March ................... 138 734 735 1,608 2 (s) (s) (s) 191 193 1,801 280 583 2,665 April ..................... 123 683 644 1,451 2 (s) (s) (s) 180 182 1,634 274 571 2,479 May ...................... 129 680 646 1,457 2 (s) (s) (s) 182 185 1,642 280 607 2,528 June ..................... 128 647 658 1,434 1 (s) (s) (s) 187 189 1,623 286 613 2,522 July ...................... 124 657 660 1,441 1 (s) (s) (s) 190 191 1,632 298 646 2,575 August ................. 129 669 731 1,533 1 (s) (s) (s) 191 192 1,726 304 623 2,653 September ........... 130 663 670 1,464 1 (s) (s) (s) 185 187 1,651 290 552 2,493 October ................ 130 693 703 1,525 1 (s) (s) (s) 189 190 1,715 288 579 2,582 November ............ 129 715 712 1,555 1 (s) (s) (s) 192 194 1,749 276 581 2,605 December ............ 134 768 636 1,540 2 (s) (s) (s) 201 203 1,743 273 579 2,595 Total .................... 1,561 8,389 8,124 18,086 17 4 (s) (s) 2,261 2,283 20,368 3,382 7,007 30,758
2012 January ................ R 125 792 698 R 1,616 R 3 (s) (s) (s) R 197 R 200 R 1,816 R 270 R 547 R 2,633 February .............. 125 741 655 1,521 2 (s) (s) (s) R 184 R 187 R 1,707 R 267 R 526 R 2,500 March ................... R 129 732 R 646 1,510 2 (s) (s) (s) R 189 R 191 R 1,701 R 277 R 550 R 2,529 April ..................... 120 702 620 1,447 2 (s) (s) (s) R 180 R 182 R 1,629 R 276 R 546 R 2,452 May ...................... 121 700 661 1,483 2 (s) (s) (s) R 189 R 191 R 1,674 R 289 R 611 R 2,574 June ..................... 116 686 R 651 1,453 R 2 (s) (s) (s) R 184 R 186 R 1,638 R 285 R 591 R 2,515 July ...................... 119 699 R 650 1,468 1 (s) (s) (s) R 186 R 188 R 1,656 R 298 R 624 2,577 August ................. 122 710 R 684 1,517 1 (s) (s) (s) R 189 R 191 R 1,708 R 301 R 601 R 2,609 September ........... R 116 696 627 R 1,438 R 2 (s) (s) (s) R 182 R 184 R 1,621 R 280 R 535 R 2,436 October ................ 121 728 R 720 1,566 R 2 (s) (s) (s) R 186 R 188 R 1,754 R 283 R 557 R 2,594 November ............ 124 740 695 1,556 2 (s) (s) (s) R 186 R 188 R 1,744 269 R 552 R 2,565 December ............ 127 774 R 691 R 1,592 2 (s) (s) (s) R 192 R 195 R 1,786 R 267 R 569 R 2,623 Total .................... R 1,465 8,699 R 7,998 R 18,166 R 22 4 (s) (s) R 2,242 R 2,269 R 20,435 R 3,363 R 6,814 R 30,612
2013 January ................ 132 808 755 1,694 3 (s) (s) (s) 186 190 1,884 267 R 545 R 2,695 February .............. 127 743 651 1,522 4 (s) (s) (s) 168 171 1,693 254 R 498 R 2,445 March ................... 131 785 664 1,577 3 (s) (s) (s) 185 188 1,765 266 R 544 R 2,576 April ..................... 126 725 659 1,509 2 (s) (s) (s) 177 180 1,688 265 R 531 R 2,484 May ...................... 128 725 679 1,532 3 (s) (s) (s) 185 188 R 1,720 280 R 594 R 2,595 June ..................... 125 689 679 1,490 3 (s) (s) (s) 185 188 1,678 278 R 588 R 2,543 July ...................... 123 713 712 1,547 3 (s) (s) (s) 195 199 1,746 286 R 596 R 2,627 August ................. 121 723 695 1,537 2 (s) (s) (s) 188 190 1,728 289 R 591 R 2,608 September ........... 115 F 717 736 E 1,568 2 (s) (s) (s) 179 182 E 1,750 274 530 E 2,554 9-Month Total ..... 1,128 E 6,629 6,230 E 13,976 25 3 (s) (s) 1,647 1,676 E 15,652 2,459 5,017 E 23,128
2012 9-Month Total ..... 1,093 6,457 5,892 13,452 17 3 (s) (s) 1,678 1,698 15,150 2,544 5,133 22,8262011 9-Month Total ..... 1,169 6,213 6,073 13,466 13 3 (s) (s) 1,679 1,695 15,161 2,546 5,268 22,975
a See "Primary Energy Consumption" in Glossary. b See Table 10.2b for notes on series components and estimation.c Natural gas only; excludes the estimated portion of supplemental gaseous
fuels. See Note 3, "Supplemental Gaseous Fuels," at end of Section 4.d Does not include biofuels that have been blended with petroleum—biofuels
are included in "Biomass."e Includes coal coke net imports, which are not separately displayed. See
Tables 1.4a and 1.4b.f Conventional hydroelectric power.
g Electricity retail sales to ultimate customers reported by electric utilities and,beginning in 1996, other energy service providers.
h Total losses are calculated as the primary energy consumed by the electricpower sector minus the energy content of electricity retail sales. Total losses areallocated to the end-use sectors in proportion to each sector’s share of totalelectricity retail sales. See Note 1, "Electrical System Energy Losses," at end of
section.R=Revised. E=Estimate. NA=Not available. – =No data reported. F=Forecast.
(s)=Less than 0.5 trillion Btu. Notes: • Data are estimates, except for coal totals; hydroelectric power in
1949–1978 and 1989 forward; solar/PV; wind; and electricity retail sales. • Theindustrial sector includes industrial combined-heat-and-power (CHP) and industrialelectricity-only plants. See Note 2, "Classification of Power Plants Into Energy-UseSectors," at end of Section 7. • See Note 2, "Energy Consumption Data andSurveys," at end of section. • Totals may not equal sum of components due toindependent rounding. • Geographic coverage is the 50 states and the District ofColumbia.
Web Page: See http://www.eia.gov/totalenergy/data/monthly/#consumption(Excel and CSV files) for all available annual data beginning in 1949 and monthlydata beginning in 1973.
Sources: Tables 1.4a, 1.4b, 2.6, 3.8b, 4.3, 6.2, 7.6, 10.2b, A4, A5, and A6.
Selected years of data from 1949 through 1972 have been added to this table.For all years of data from 1949 through 2013, see the “Web Page” cited above.
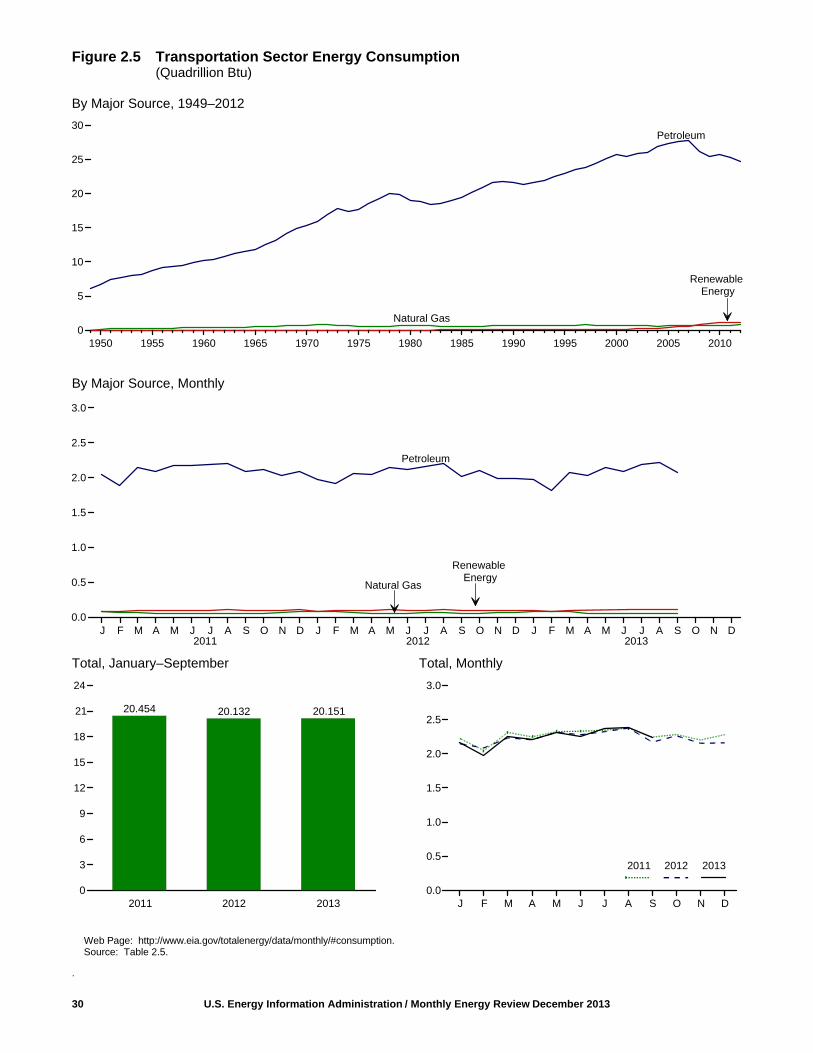
Figure 2.5 Transportation Sector Energy Consumption(Quadrillion Btu)
By Major Source, 1949–2012
By Major Source, Monthly
Total, January–September Total, Monthly
.
30 U.S. Energy Information Administration / Monthly Energy Review December 2013
2011 2012 2013
1950 1955 1960 1965 1970 1975 1980 1985 1990 1995 2000 2005 20100
5
10
15
20
25
30Petroleum
Natural Gas
Renewable Energy
J F M A M J J A S O N D J F M A M J J A S O N D J F M A M J J A S O N D0.0
0.5
1.0
1.5
2.0
2.5
3.0
Petroleum
Natural Gas
Renewable Energy
20.454 20.132 20.151
2011 2012 20130
3
6
9
12
15
18
21
24
J F M A M J J A S O N D0.0
0.5
1.0
1.5
2.0
2.5
3.0
2011 2012 2013
Web Page: http://www.eia.gov/totalenergy/data/monthly/#consumption.Source: Table 2.5.

U.S. Energy Information Administration / Monthly Energy Review December 2013 31
Table 2.5 Transportation Sector Energy Consumption (Trillion Btu)
Primary Consumptiona
ElectricityRetailSalese
ElectricalSystemEnergyLossesf Total
Fossil FuelsRenewable
Energyb
TotalPrimaryCoal Natural Gasc Petroleumd Total Biomass
1950 Total .................... 1,564 130 6,690 8,383 NA 8,383 23 86 8,4921955 Total .................... 421 254 8,799 9,474 NA 9,474 20 56 9,5501960 Total .................... 75 359 10,125 10,560 NA 10,560 10 26 10,5961965 Total .................... 16 517 11,866 12,399 NA 12,399 10 24 12,4321970 Total .................... 7 745 15,310 16,062 NA 16,062 11 26 16,0981975 Total .................... 1 595 17,615 18,210 NA 18,210 10 24 18,2451980 Total .................... g( ) 650 19,009 19,659 NA 19,659 11 27 19,6971985 Total .................... g( ) 519 19,472 19,992 50 20,041 14 32 20,0881990 Total .................... g( ) 680 21,626 22,306 60 22,366 16 37 22,4201995 Total .................... g( ) 724 22,955 23,679 112 23,791 17 38 23,8462000 Total .................... g( ) 672 25,682 26,354 135 26,489 18 42 26,5482001 Total .................... g( ) 658 25,412 26,070 142 26,213 20 43 26,2752002 Total .................... g( ) 699 25,913 26,612 170 26,781 19 42 26,8422003 Total .................... g( ) 627 25,987 26,615 230 26,845 23 51 26,9192004 Total .................... g( ) 602 26,925 27,527 290 27,817 25 54 27,8952005 Total .................... g( ) 624 27,309 27,933 339 28,272 26 56 28,3532006 Total .................... g( ) 625 27,651 28,276 475 28,751 25 54 28,8302007 Total .................... g( ) 663 27,763 28,427 602 29,029 28 60 29,1162008 Total .................... g( ) 692 26,230 26,922 825 27,747 26 56 27,8292009 Total .................... g( ) 715 25,375 26,090 935 27,025 27 56 27,1072010 Total .................... g( ) 719 25,686 26,405 1,075 27,479 26 55 27,560
2011 January ................ g( ) 87 2,045 2,132 86 2,218 2 5 2,225 February .............. g( ) 74 1,883 1,957 84 2,041 2 4 2,048 March ................... g( ) 67 2,146 2,213 93 2,306 2 5 2,313 April ..................... g( ) 55 2,095 2,150 90 2,240 2 4 2,247 May ...................... g( ) 50 2,168 2,218 98 2,316 2 5 2,323 June ..................... g( ) 50 2,171 2,221 103 2,323 2 5 2,330 July ...................... g( ) 56 2,187 2,244 96 2,340 2 5 2,347 August ................. g( ) 56 2,207 2,263 107 2,370 2 4 2,377 September ........... g( ) 49 2,093 2,142 96 2,238 2 4 2,244 October ................ g( ) 52 2,124 2,176 100 2,276 2 4 2,282 November ............ g( ) 60 2,035 2,095 99 2,195 2 4 2,201 December ............ g( ) 76 2,091 2,167 105 2,273 2 5 2,280 Total .................... g( ) 732 25,246 25,978 1,158 27,136 26 54 27,217
2012 January ................ g( ) 82 1,971 2,053 87 2,140 2 R 4 2,147 February .............. g( ) 74 1,916 1,990 89 2,079 2 4 2,086 March ................... g( ) 64 2,064 2,128 99 2,227 2 4 2,233 April ..................... g( ) 59 2,042 2,101 98 2,199 2 4 2,205 May ...................... g( ) 56 2,147 2,204 104 2,308 2 4 2,314 June ..................... g( ) 56 2,114 2,170 102 2,272 2 4 2,278 July ...................... g( ) 62 2,155 2,217 98 R 2,316 2 5 2,322 August ................. g( ) 60 2,203 2,264 106 R 2,370 2 4 2,376 September ........... g( ) 54 2,018 2,073 92 2,165 2 4 2,171 October ................ g( ) 57 2,101 2,158 100 R 2,258 2 4 2,264 November ............ g( ) 65 1,992 2,056 92 2,148 2 4 2,154 December ............ g( ) 74 R 1,988 R 2,062 91 2,154 2 R 4 R 2,160 Total .................... g( ) 764 24,712 25,476 1,158 26,634 R 25 R 51 R 26,710
2013 January ................ g( ) 85 1,976 2,061 92 2,154 2 5 2,161 February .............. g( ) 76 1,813 1,888 87 1,975 2 4 1,981 March ................... g( ) 75 2,074 2,149 101 2,249 2 4 2,256 April ..................... g( ) 59 2,037 2,095 102 2,197 2 4 2,204 May ...................... g( ) 53 2,139 2,192 107 2,299 2 R 4 2,306 June ..................... g( ) 52 2,089 2,141 106 2,248 2 5 2,254 July ...................... g( ) 58 2,194 2,252 105 2,357 2 5 2,363 August ................. g( ) 58 2,218 2,276 103 2,379 2 4 2,385 September ........... g( ) F 52 2,076 E 2,127 106 E 2,234 2 4 E 2,240 9-Month Total ..... g( ) E 566 18,616 E 19,182 910 E 20,091 20 40 E 20,151
2012 9-Month Total ..... g( ) 568 18,631 19,199 876 20,075 19 38 20,1322011 9-Month Total ..... g( ) 544 18,996 19,540 853 20,393 20 41 20,454
a See "Primary Energy Consumption" in Glossary. b See Table 10.2b for notes on series components.c Natural gas only; does not include supplemental gaseous fuels—see Note 3,
"Supplemental Gaseous Fuels," at end of Section 4. Data are for natural gasconsumed in the operation of pipelines (primarily in compressors) and smallamounts consumed as vehicle fuel—see Table 4.3.
d Does not include biofuels that have been blended with petroleum—biofuelsare included in "Biomass."
e Electricity retail sales to ultimate customers reported by electric utilities and,beginning in 1996, other energy service providers.
f Total losses are calculated as the primary energy consumed by the electricpower sector minus the energy content of electricity retail sales. Total losses areallocated to the end-use sectors in proportion to each sector’s share of totalelectricity retail sales. See Note 1, "Electrical System Energy Losses," at end of
section.g Beginning in 1978, the small amounts of coal consumed for transportation are
reported as industrial sector consumption.R=Revised. E=Estimate. NA=Not available. F=Forecast. Notes: • Data are estimates, except for coal totals through 1977; and electricity
retail sales beginning in 1979. • See Note 2, "Energy Consumption Data andSurveys," at end of section. • Totals may not equal sum of components due toindependent rounding. • Geographic coverage is the 50 states and the District ofColumbia.
Web Page: See http://www.eia.gov/totalenergy/data/monthly/#consumption(Excel and CSV files) for all available annual data beginning in 1949 and monthlydata beginning in 1973.
Sources: Tables 2.6, 3.8c, 4.3, 6.2, 7.6, 10.2b, A4, A5, and A6.
Selected years of data from 1949 through 1972 have been added to this table.For all years of data from 1949 through 2013, see the “Web Page” cited above.
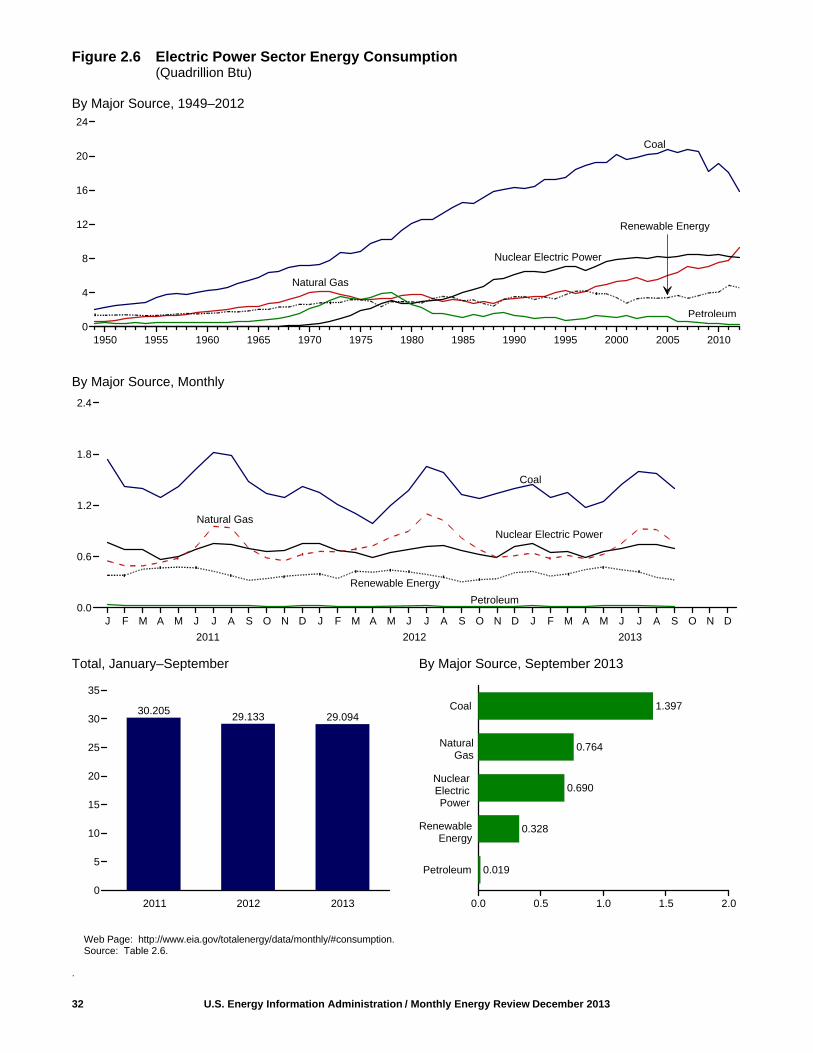
Figure 2.6 Electric Power Sector Energy Consumption(Quadrillion Btu)
By Major Source, 1949–2012
By Major Source, Monthly
Total, January–September By Major Source, September 2013
.
32 U.S. Energy Information Administration / Monthly Energy Review December 2013
2011 2012 2013
Nuclear Electric Power
Natural Gas
Petroleum
Renewable Energy
Coal
Renewable Energy
Natural Gas
1950 1955 1960 1965 1970 1975 1980 1985 1990 1995 2000 2005 20100
4
8
12
16
20
24
J F M A M J J A S O N D J F M A M J J A S O N D J F M A M J J A S O N D0.0
0.6
1.2
1.8
2.4
Nuclear Electric Power
Petroleum
Coal
30.20529.133 29.094
2011 2012 20130
5
10
15
20
25
30
35
1.397
0.764
0.690
0.328
0.019
Coal
Petroleum
0.0 0.5 1.0 1.5 2.0
Nuclear Electric
Power
NaturalGas
RenewableEnergy
Web Page: http://www.eia.gov/totalenergy/data/monthly/#consumption.Source: Table 2.6.
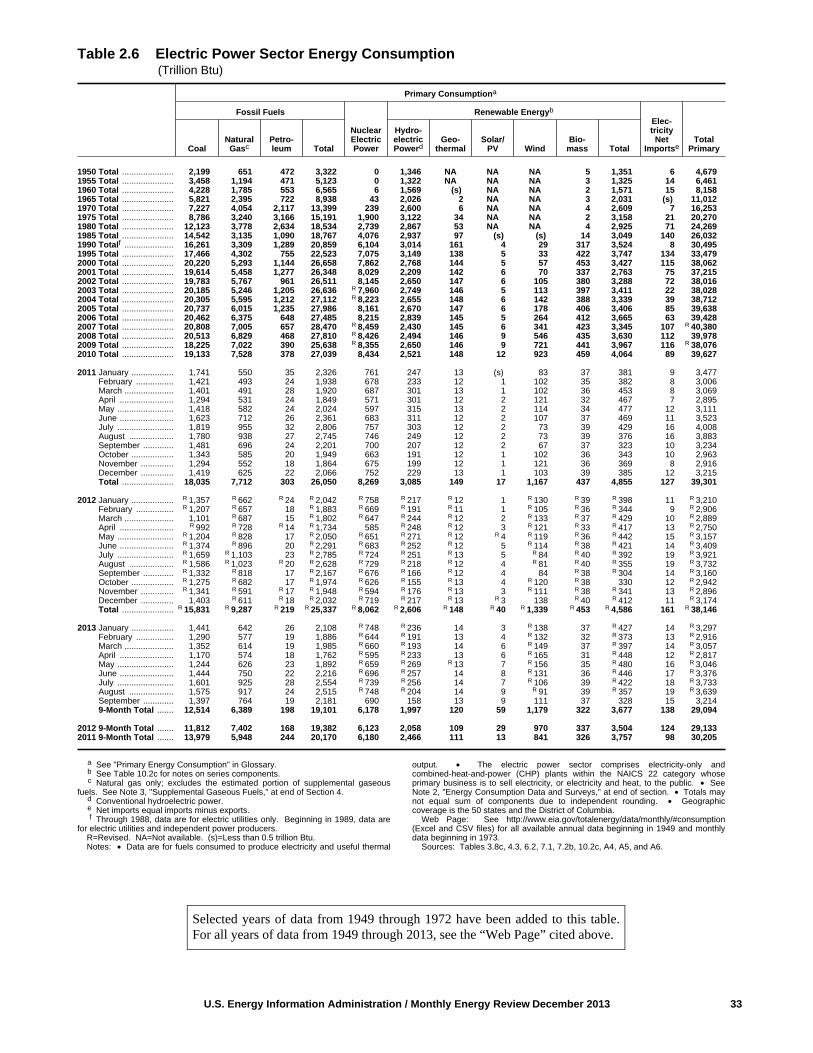
U.S. Energy Information Administration / Monthly Energy Review December 2013 33
Table 2.6 Electric Power Sector Energy Consumption (Trillion Btu)
Primary Consumptiona
Fossil Fuels
NuclearElectricPower
Renewable Energyb
Elec-tricityNet
ImportseTotal
PrimaryCoalNatural
GascPetro-leum Total
Hydro-electricPowerd
Geo-thermal
Solar/PV Wind
Bio-mass Total
1950 Total ...................... 2,199 651 472 3,322 0 1,346 NA NA NA 5 1,351 6 4,6791955 Total ...................... 3,458 1,194 471 5,123 0 1,322 NA NA NA 3 1,325 14 6,4611960 Total ...................... 4,228 1,785 553 6,565 6 1,569 (s) NA NA 2 1,571 15 8,1581965 Total ...................... 5,821 2,395 722 8,938 43 2,026 2 NA NA 3 2,031 (s) 11,0121970 Total ...................... 7,227 4,054 2,117 13,399 239 2,600 6 NA NA 4 2,609 7 16,2531975 Total ...................... 8,786 3,240 3,166 15,191 1,900 3,122 34 NA NA 2 3,158 21 20,2701980 Total ...................... 12,123 3,778 2,634 18,534 2,739 2,867 53 NA NA 4 2,925 71 24,2691985 Total ...................... 14,542 3,135 1,090 18,767 4,076 2,937 97 (s) (s) 14 3,049 140 26,0321990 Totalf ..................... 16,261 3,309 1,289 20,859 6,104 3,014 161 4 29 317 3,524 8 30,4951995 Total ...................... 17,466 4,302 755 22,523 7,075 3,149 138 5 33 422 3,747 134 33,4792000 Total ...................... 20,220 5,293 1,144 26,658 7,862 2,768 144 5 57 453 3,427 115 38,0622001 Total ...................... 19,614 5,458 1,277 26,348 8,029 2,209 142 6 70 337 2,763 75 37,2152002 Total ...................... 19,783 5,767 961 26,511 8,145 2,650 147 6 105 380 3,288 72 38,0162003 Total ...................... 20,185 5,246 1,205 26,636 R 7,960 2,749 146 5 113 397 3,411 22 38,0282004 Total ...................... 20,305 5,595 1,212 27,112 R 8,223 2,655 148 6 142 388 3,339 39 38,7122005 Total ...................... 20,737 6,015 1,235 27,986 8,161 2,670 147 6 178 406 3,406 85 39,6382006 Total ...................... 20,462 6,375 648 27,485 8,215 2,839 145 5 264 412 3,665 63 39,4282007 Total ...................... 20,808 7,005 657 28,470 R 8,459 2,430 145 6 341 423 3,345 107 R 40,3802008 Total ...................... 20,513 6,829 468 27,810 R 8,426 2,494 146 9 546 435 3,630 112 39,9782009 Total ...................... 18,225 7,022 390 25,638 R 8,355 2,650 146 9 721 441 3,967 116 R 38,0762010 Total ...................... 19,133 7,528 378 27,039 8,434 2,521 148 12 923 459 4,064 89 39,627
2011 January .................. 1,741 550 35 2,326 761 247 13 (s) 83 37 381 9 3,477 February ................ 1,421 493 24 1,938 678 233 12 1 102 35 382 8 3,006 March ..................... 1,401 491 28 1,920 687 301 13 1 102 36 453 8 3,069 April ....................... 1,294 531 24 1,849 571 301 12 2 121 32 467 7 2,895 May ........................ 1,418 582 24 2,024 597 315 13 2 114 34 477 12 3,111 June ....................... 1,623 712 26 2,361 683 311 12 2 107 37 469 11 3,523 July ........................ 1,819 955 32 2,806 757 303 12 2 73 39 429 16 4,008 August ................... 1,780 938 27 2,745 746 249 12 2 73 39 376 16 3,883 September ............. 1,481 696 24 2,201 700 207 12 2 67 37 323 10 3,234 October .................. 1,343 585 20 1,949 663 191 12 1 102 36 343 10 2,963 November .............. 1,294 552 18 1,864 675 199 12 1 121 36 369 8 2,916 December .............. 1,419 625 22 2,066 752 229 13 1 103 39 385 12 3,215 Total ...................... 18,035 7,712 303 26,050 8,269 3,085 149 17 1,167 437 4,855 127 39,301
2012 January .................. R 1,357 R 662 R 24 R 2,042 R 758 R 217 R 12 1 R 130 R 39 R 398 11 R 3,210 February ................ R 1,207 R 657 18 R 1,883 R 669 R 191 R 11 1 R 105 R 36 R 344 9 R 2,906 March ..................... 1,101 R 687 15 R 1,802 R 647 R 244 R 12 2 R 133 R 37 R 429 10 R 2,889 April ....................... R 992 R 728 R 14 R 1,734 585 R 248 R 12 3 R 121 R 33 R 417 13 R 2,750 May ........................ R 1,204 R 828 17 R 2,050 R 651 R 271 R 12 R 4 R 119 R 36 R 442 15 R 3,157 June ....................... R 1,374 R 896 20 R 2,291 R 683 R 252 R 12 5 R 114 R 38 R 421 14 R 3,409 July ........................ R 1,659 R 1,103 23 R 2,785 R 724 R 251 R 13 5 R 84 R 40 R 392 19 R 3,921 August ................... R 1,586 R 1,023 R 20 R 2,628 R 729 R 218 R 12 4 R 81 R 40 R 355 19 R 3,732 September ............. R 1,332 R 818 17 R 2,167 R 676 R 166 R 12 4 84 R 38 R 304 14 R 3,160 October .................. R 1,275 R 682 17 R 1,974 R 626 R 155 R 13 4 R 120 R 38 330 12 R 2,942 November .............. R 1,341 R 591 R 17 R 1,948 R 594 R 176 R 13 3 R 111 R 38 R 341 13 R 2,896 December .............. 1,403 R 611 R 18 R 2,032 R 719 R 217 R 13 R 3 138 R 40 R 412 11 R 3,174 Total ...................... R 15,831 R 9,287 R 219 R 25,337 R 8,062 R 2,606 R 148 R 40 R 1,339 R 453 R 4,586 161 R 38,146
2013 January .................. 1,441 642 26 2,108 R 748 R 236 14 3 R 138 37 R 427 14 R 3,297 February ................ 1,290 577 19 1,886 R 644 R 191 13 4 R 132 32 R 373 13 R 2,916 March ..................... 1,352 614 19 1,985 R 660 R 193 14 6 R 149 37 R 397 14 R 3,057 April ....................... 1,170 574 18 1,762 R 595 R 233 13 6 R 165 31 R 448 12 R 2,817 May ........................ 1,244 626 23 1,892 R 659 R 269 R 13 7 R 156 35 R 480 16 R 3,046 June ....................... 1,444 750 22 2,216 R 696 R 257 14 8 R 131 36 R 446 17 R 3,376 July ........................ 1,601 925 28 2,554 R 739 R 256 14 7 R 106 39 R 422 18 R 3,733 August ................... 1,575 917 24 2,515 R 748 R 204 14 9 R 91 39 R 357 19 R 3,639 September ............. 1,397 764 19 2,181 690 158 13 9 111 37 328 15 3,214 9-Month Total ....... 12,514 6,389 198 19,101 6,178 1,997 120 59 1,179 322 3,677 138 29,094
2012 9-Month Total ....... 11,812 7,402 168 19,382 6,123 2,058 109 29 970 337 3,504 124 29,1332011 9-Month Total ....... 13,979 5,948 244 20,170 6,180 2,466 111 13 841 326 3,757 98 30,205
a See "Primary Energy Consumption" in Glossary.b See Table 10.2c for notes on series components.c Natural gas only; excludes the estimated portion of supplemental gaseous
fuels. See Note 3, "Supplemental Gaseous Fuels," at end of Section 4.d Conventional hydroelectric power.e Net imports equal imports minus exports.f Through 1988, data are for electric utilities only. Beginning in 1989, data are
for electric utilities and independent power producers.R=Revised. NA=Not available. (s)=Less than 0.5 trillion Btu. Notes: • Data are for fuels consumed to produce electricity and useful thermal
output. • The electric power sector comprises electricity-only andcombined-heat-and-power (CHP) plants within the NAICS 22 category whoseprimary business is to sell electricity, or electricity and heat, to the public. • SeeNote 2, "Energy Consumption Data and Surveys," at end of section. • Totals maynot equal sum of components due to independent rounding. • Geographiccoverage is the 50 states and the District of Columbia.
Web Page: See http://www.eia.gov/totalenergy/data/monthly/#consumption(Excel and CSV files) for all available annual data beginning in 1949 and monthlydata beginning in 1973.
Sources: Tables 3.8c, 4.3, 6.2, 7.1, 7.2b, 10.2c, A4, A5, and A6.
Selected years of data from 1949 through 1972 have been added to this table.For all years of data from 1949 through 2013, see the “Web Page” cited above.
Energy Consumption by Sector
Note 1. Electrical System Energy Losses. Electricalsystem energy losses are calculated as the differencebetween total primary consumption by the electric powersector (see Table 2.6) and the total energy content of elec-tricity retail sales (see Tables 7.6 and A6). Most of theselosses occur at steam-electric power plants (conventionaland nuclear) in the conversion of heat energy intomechanical energy to turn electric generators. The loss isa thermodynamically necessary feature of the steam-electric cycle. Part of the energy input-to-output losses isa result of imputing fossil energy equivalent inputs forhydroelectric, geothermal, solar thermal, photovoltaic,and wind energy sources. In addition to conversionlosses, other losses include power plant use of electricity,transmission and distribution of electricity from powerplants to end-use consumers (also called "line losses"),and unaccounted-for electricity. Total losses are allocatedto the end-use sectors in proportion to each sector's shareof total electricity sales. Overall, about two thirds of totalenergy input is lost in conversion. Currently, of electric-ity generated, approximately 5 percent is lost in plant useand 7 percent is lost in transmission and distribution.
Note 2. Energy Consumption Data and Surveys. Mostof the data in this section of the Monthly Energy Review
(MER) are developed from a group of energy-relatedsurveys, typically called "supply surveys," conducted by theU.S. Energy Information Administration (EIA). Supplysurveys are directed to suppliers and marketers of specificenergy sources. They measure the quantities of specificenergy sources produced, or the quantities supplied to themarket, or both. The data obtained from EIA's supplysurveys are integrated to yield the summary consumptionstatistics published in this section (and in Section 1) of theMER.
Users of EIA's energy consumption statistics should beaware of a second group of energy-related surveys, typicallycalled "consumption surveys." Consumption surveys gatherinformation on the types of energy consumed by end usersof energy, along with the characteristics of those end usersthat can be associated with energy use. For example, the“Manufacturing Energy Consumption Survey” belongs tothe consumption survey group because it collects informa-tion directly from end users (the manufacturing establish-ments). There are important differences between the supplyand consumption surveys that need to be taken into accountin any analysis that uses both data sources. For informationon those differences, see “Energy Consumption by End-UseSector, A Comparison of Measures by Consumption andSupply Surveys,” DOE/EIA-0533, U.S. Energy InformationAdministration, Washington, DC, April 6, 1990.
34 U.S. Energy Information Administration / Monthly Energy Review December 2013

.
3. Petroleum
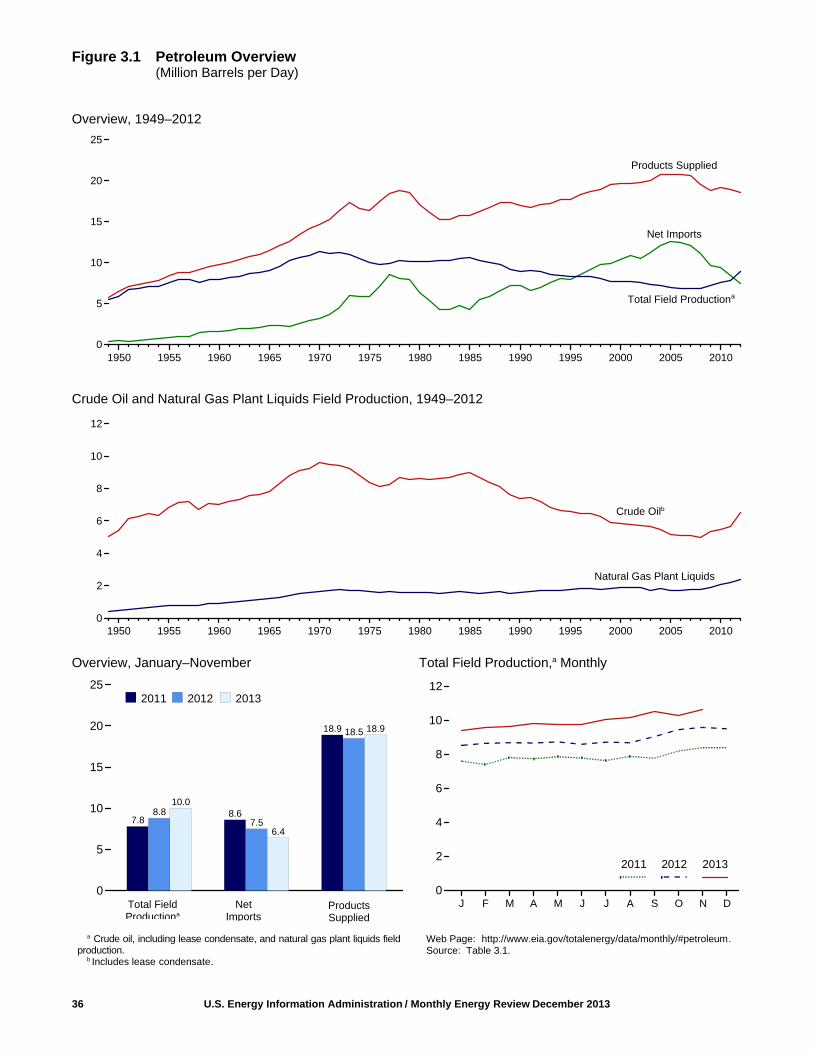
Figure 3.1 Petroleum Overview(Million Barrels per Day)
Overview, 1949–2012
Crude Oil and Natural Gas Plant Liquids Field Production, 1949–2012
Overview, January–November Total Field Production,a Monthly
36 U.S. Energy Information Administration / Monthly Energy Review December 2013
Natural Gas Plant Liquids
Total Field Productiona
1950 1955 1960 1965 1970 1975 1980 1985 1990 1995 2000 2005 20100
5
10
15
20
25
Products Supplied
Net Imports
1950 1955 1960 1965 1970 1975 1980 1985 1990 1995 2000 2005 20100
2
4
6
8
10
12
Crude Oilb
J F M A M J J A S O N D0
2
4
6
8
10
12
2011 2012 2013
10.0
6.4
18.9
8.87.5
18.5
7.88.6
18.9
0
5
10
15
20
252011 2012 2013
NetImports
ProductsSupplied
Total FieldProductiona
a Crude oil, including lease condensate, and natural gas plant liquids fieldproduction.
b Includes lease condensate.
Web Page: http://www.eia.gov/totalenergy/data/monthly/#petroleum. Source: Table 3.1.
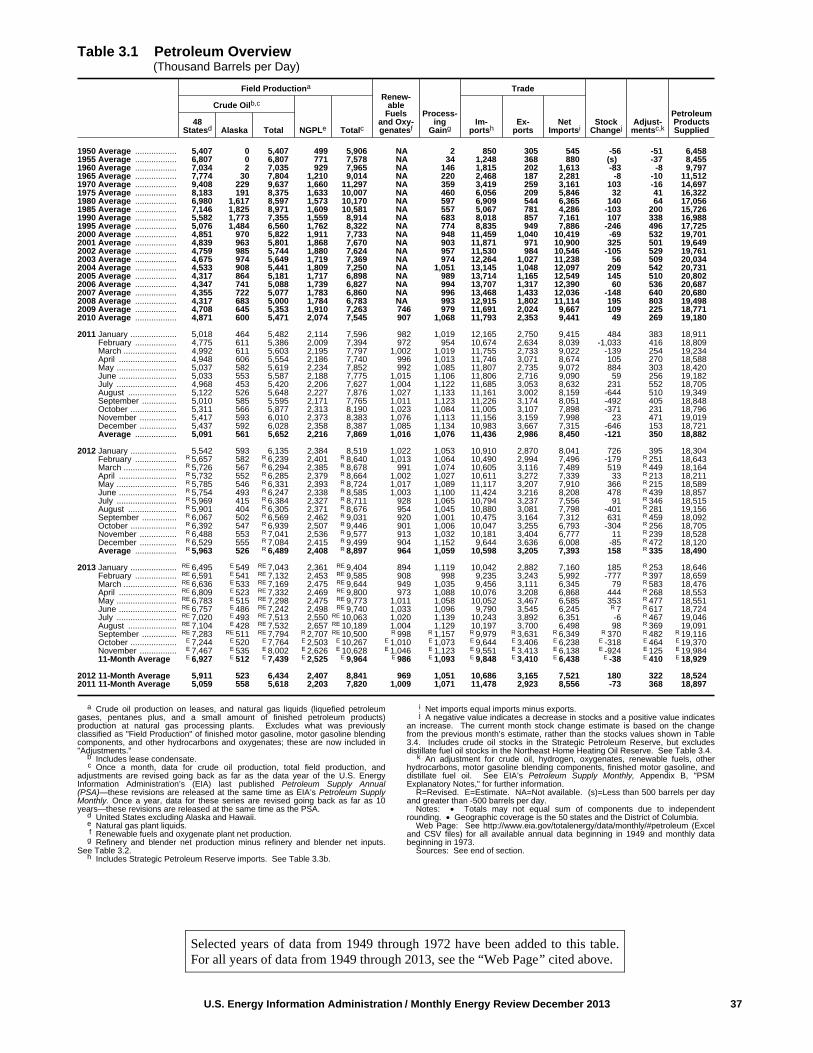
U.S. Energy Information Administration / Monthly Energy Review December 2013 37
Table 3.1 Petroleum Overview (Thousand Barrels per Day)
Field Productiona
Renew-able
Fuelsand Oxy-genatesf
Process-ing
Gaing
Trade
StockChangej
Adjust-mentsc,k
PetroleumProductsSupplied
Crude Oilb,c
NGPLe TotalcIm-
portshEx-
portsNet
Importsi48
Statesd Alaska Total
1950 Average .................. 5,407 0 5,407 499 5,906 NA 2 850 305 545 -56 -51 6,4581955 Average .................. 6,807 0 6,807 771 7,578 NA 34 1,248 368 880 (s) -37 8,4551960 Average .................. 7,034 2 7,035 929 7,965 NA 146 1,815 202 1,613 -83 -8 9,7971965 Average .................. 7,774 30 7,804 1,210 9,014 NA 220 2,468 187 2,281 -8 -10 11,5121970 Average .................. 9,408 229 9,637 1,660 11,297 NA 359 3,419 259 3,161 103 -16 14,6971975 Average .................. 8,183 191 8,375 1,633 10,007 NA 460 6,056 209 5,846 32 41 16,3221980 Average .................. 6,980 1,617 8,597 1,573 10,170 NA 597 6,909 544 6,365 140 64 17,0561985 Average .................. 7,146 1,825 8,971 1,609 10,581 NA 557 5,067 781 4,286 -103 200 15,7261990 Average .................. 5,582 1,773 7,355 1,559 8,914 NA 683 8,018 857 7,161 107 338 16,9881995 Average .................. 5,076 1,484 6,560 1,762 8,322 NA 774 8,835 949 7,886 -246 496 17,7252000 Average .................. 4,851 970 5,822 1,911 7,733 NA 948 11,459 1,040 10,419 -69 532 19,7012001 Average .................. 4,839 963 5,801 1,868 7,670 NA 903 11,871 971 10,900 325 501 19,6492002 Average .................. 4,759 985 5,744 1,880 7,624 NA 957 11,530 984 10,546 -105 529 19,7612003 Average .................. 4,675 974 5,649 1,719 7,369 NA 974 12,264 1,027 11,238 56 509 20,0342004 Average .................. 4,533 908 5,441 1,809 7,250 NA 1,051 13,145 1,048 12,097 209 542 20,7312005 Average .................. 4,317 864 5,181 1,717 6,898 NA 989 13,714 1,165 12,549 145 510 20,8022006 Average .................. 4,347 741 5,088 1,739 6,827 NA 994 13,707 1,317 12,390 60 536 20,6872007 Average .................. 4,355 722 5,077 1,783 6,860 NA 996 13,468 1,433 12,036 -148 640 20,6802008 Average .................. 4,317 683 5,000 1,784 6,783 NA 993 12,915 1,802 11,114 195 803 19,4982009 Average .................. 4,708 645 5,353 1,910 7,263 746 979 11,691 2,024 9,667 109 225 18,7712010 Average .................. 4,871 600 5,471 2,074 7,545 907 1,068 11,793 2,353 9,441 49 269 19,180
2011 January .................... 5,018 464 5,482 2,114 7,596 982 1,019 12,165 2,750 9,415 484 383 18,911 February .................. 4,775 611 5,386 2,009 7,394 972 954 10,674 2,634 8,039 -1,033 416 18,809 March ....................... 4,992 611 5,603 2,195 7,797 1,002 1,019 11,755 2,733 9,022 -139 254 19,234 April ......................... 4,948 606 5,554 2,186 7,740 996 1,013 11,746 3,071 8,674 105 270 18,588 May .......................... 5,037 582 5,619 2,234 7,852 992 1,085 11,807 2,735 9,072 884 303 18,420 June ......................... 5,033 553 5,587 2,188 7,775 1,015 1,106 11,806 2,716 9,090 59 256 19,182 July .......................... 4,968 453 5,420 2,206 7,627 1,004 1,122 11,685 3,053 8,632 231 552 18,705 August ..................... 5,122 526 5,648 2,227 7,876 1,027 1,133 11,161 3,002 8,159 -644 510 19,349 September ............... 5,010 585 5,595 2,171 7,765 1,011 1,123 11,226 3,174 8,051 -492 405 18,848 October .................... 5,311 566 5,877 2,313 8,190 1,023 1,084 11,005 3,107 7,898 -371 231 18,796 November ................ 5,417 593 6,010 2,373 8,383 1,076 1,113 11,156 3,159 7,998 23 471 19,019 December ................ 5,437 592 6,028 2,358 8,387 1,085 1,134 10,983 3,667 7,315 -646 153 18,721 Average .................. 5,091 561 5,652 2,216 7,869 1,016 1,076 11,436 2,986 8,450 -121 350 18,882
2012 January .................... 5,542 593 6,135 2,384 8,519 1,022 1,053 10,910 2,870 8,041 726 395 18,304 February .................. R 5,657 582 R 6,239 2,401 R 8,640 1,013 1,064 10,490 2,994 7,496 -179 R 251 18,643 March ....................... R 5,726 567 R 6,294 2,385 R 8,678 991 1,074 10,605 3,116 7,489 519 R 449 18,164 April ......................... R 5,732 552 R 6,285 2,379 R 8,664 1,002 1,027 10,611 3,272 7,339 33 R 213 18,211 May .......................... R 5,785 546 R 6,331 2,393 R 8,724 1,017 1,089 11,117 3,207 7,910 366 R 215 18,589 June ......................... R 5,754 493 R 6,247 2,338 R 8,585 1,003 1,100 11,424 3,216 8,208 478 R 439 18,857 July .......................... R 5,969 415 R 6,384 2,327 R 8,711 928 1,065 10,794 3,237 7,556 91 R 346 18,515 August ..................... R 5,901 404 R 6,305 2,371 R 8,676 954 1,045 10,880 3,081 7,798 -401 R 281 19,156 September ............... R 6,067 502 R 6,569 2,462 R 9,031 920 1,001 10,475 3,164 7,312 631 R 459 18,092 October .................... R 6,392 547 R 6,939 2,507 R 9,446 901 1,006 10,047 3,255 6,793 -304 R 256 18,705 November ................ R 6,488 553 R 7,041 2,536 R 9,577 913 1,032 10,181 3,404 6,777 11 R 239 18,528 December ................ R 6,529 555 R 7,084 2,415 R 9,499 904 1,152 9,644 3,636 6,008 -85 R 472 18,120 Average .................. R 5,963 526 R 6,489 2,408 R 8,897 964 1,059 10,598 3,205 7,393 158 R 335 18,490
2013 January .................... RE 6,495 E 549 RE 7,043 2,361 RE 9,404 894 1,119 10,042 2,882 7,160 185 R 253 18,646 February .................. RE 6,591 E 541 RE 7,132 2,453 RE 9,585 908 998 9,235 3,243 5,992 -777 R 397 18,659 March ....................... RE 6,636 E 533 RE 7,169 2,475 RE 9,644 949 1,035 9,456 3,111 6,345 79 R 583 18,476 April ......................... RE 6,809 E 523 RE 7,332 2,469 RE 9,800 973 1,088 10,076 3,208 6,868 444 R 268 18,553 May .......................... RE 6,783 E 515 RE 7,298 2,475 RE 9,773 1,011 1,058 10,052 3,467 6,585 353 R 477 18,551 June ......................... RE 6,757 E 486 RE 7,242 2,498 RE 9,740 1,033 1,096 9,790 3,545 6,245 R 7 R 617 18,724 July .......................... RE 7,020 E 493 RE 7,513 2,550 RE 10,063 1,020 1,139 10,243 3,892 6,351 -6 R 467 19,046 August ..................... RE 7,104 E 428 RE 7,532 2,657 RE 10,189 1,004 1,129 10,197 3,700 6,498 98 R 369 19,091 September ............... RE 7,283 RE 511 RE 7,794 R 2,707 RE 10,500 R 998 R 1,157 R 9,979 R 3,631 R 6,349 R 370 R 482 R 19,116 October .................... E 7,244 E 520 E 7,764 E 2,503 E 10,267 E 1,010 E 1,073 E 9,644 E 3,406 E 6,238 E -318 E 464 E 19,370 November ................ E 7,467 E 535 E 8,002 E 2,626 E 10,628 E 1,046 E 1,123 E 9,551 E 3,413 E 6,138 E -924 E 125 E 19,984 11-Month Average E 6,927 E 512 E 7,439 E 2,525 E 9,964 E 986 E 1,093 E 9,848 E 3,410 E 6,438 E -38 E 410 E 18,929
2012 11-Month Average 5,911 523 6,434 2,407 8,841 969 1,051 10,686 3,165 7,521 180 322 18,5242011 11-Month Average 5,059 558 5,618 2,203 7,820 1,009 1,071 11,478 2,923 8,556 -73 368 18,897
a Crude oil production on leases, and natural gas liquids (liquefied petroleumgases, pentanes plus, and a small amount of finished petroleum products)production at natural gas processing plants. Excludes what was previouslyclassified as "Field Production" of finished motor gasoline, motor gasoline blendingcomponents, and other hydrocarbons and oxygenates; these are now included in"Adjustments."
b Includes lease condensate.c Once a month, data for crude oil production, total field production, and
adjustments are revised going back as far as the data year of the U.S. EnergyInformation Administration’s (EIA) last published Petroleum Supply Annual(PSA)—these revisions are released at the same time as EIA’s Petroleum SupplyMonthly. Once a year, data for these series are revised going back as far as 10years—these revisions are released at the same time as the PSA.
d United States excluding Alaska and Hawaii.e Natural gas plant liquids.f Renewable fuels and oxygenate plant net production.
g Refinery and blender net production minus refinery and blender net inputs.See Table 3.2.
h Includes Strategic Petroleum Reserve imports. See Table 3.3b.
i Net imports equal imports minus exports.j A negative value indicates a decrease in stocks and a positive value indicates
an increase. The current month stock change estimate is based on the changefrom the previous month’s estimate, rather than the stocks values shown in Table3.4. Includes crude oil stocks in the Strategic Petroleum Reserve, but excludesdistillate fuel oil stocks in the Northeast Home Heating Oil Reserve. See Table 3.4.
k An adjustment for crude oil, hydrogen, oxygenates, renewable fuels, otherhydrocarbons, motor gasoline blending components, finished motor gasoline, anddistillate fuel oil. See EIA’s Petroleum Supply Monthly, Appendix B, "PSMExplanatory Notes," for further information.
R=Revised. E=Estimate. NA=Not available. (s)=Less than 500 barrels per dayand greater than -500 barrels per day.
Notes: • Totals may not equal sum of components due to independentrounding. • Geographic coverage is the 50 states and the District of Columbia.
Web Page: See http://www.eia.gov/totalenergy/data/monthly/#petroleum (Exceland CSV files) for all available annual data beginning in 1949 and monthly databeginning in 1973.
Sources: See end of section.
Selected years of data from 1949 through 1972 have been added to this table.For all years of data from 1949 through 2013, see the “Web Page” cited above.
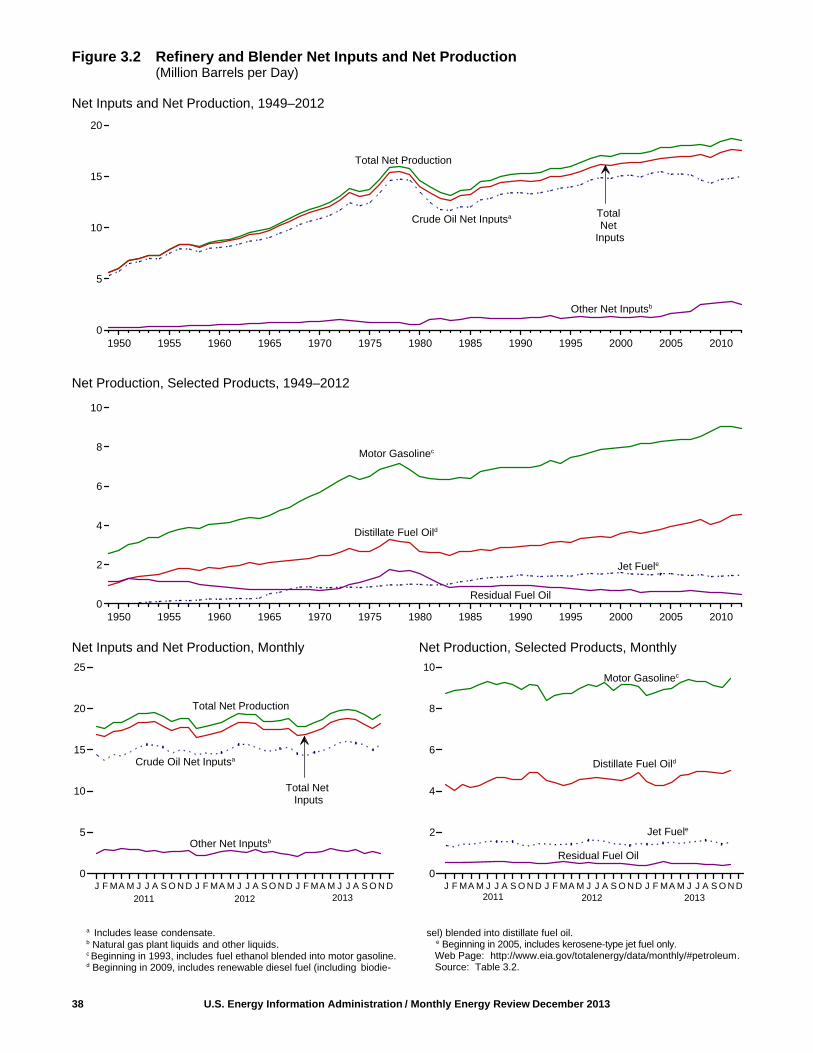
Figure 3.2 Refinery and Blender Net Inputs and Net Production(Million Barrels per Day)
Net Inputs and Net Production, 1949–2012
Net Production, Selected Products, 1949–2012
Net Inputs and Net Production, Monthly Net Production, Selected Products, Monthly
38 U.S. Energy Information Administration / Monthly Energy Review December 2013
1950 1955 1960 1965 1970 1975 1980 1985 1990 1995 2000 2005 20100
5
10
15
20
Other Net Inputsb
Crude Oil Net Inputsa
Total Net Production
TotalNet
Inputs
J F MA M J J A S O N D J F MA M J J A S O N D J F MA M J J A S O N D0
2
4
6
8
10
1950 1955 1960 1965 1970 1975 1980 1985 1990 1995 2000 2005 20100
2
4
6
8
10
Distillate Fuel Oild
Jet Fuele
Residual Fuel Oil
Motor Gasolinec
a Includes lease condensate.b Natural gas plant liquids and other liquids.c Beginning in 1993, includes fuel ethanol blended into motor gasoline.d Beginning in 2009, includes renewable diesel fuel (including biodie-
sel) blended into distillate fuel oil. e Beginning in 2005, includes kerosene-type jet fuel only. Web Page: http://www.eia.gov/totalenergy/data/monthly/#petroleum. Source: Table 3.2.
Total Net Production
Crude Oil Net Inputsa
Total Net Inputs
Other Net Inputsb
J F MA M J J A S O N D J F MA M J J A S O N D J F MA M J J A S O N D0
5
10
15
20
25
2011 2013
Residual Fuel Oil
Motor Gasolinec
Jet Fuele
2011 20132012
Distillate Fuel Oild
2012

U.S. Energy Information Administration / Monthly Energy Review December 2013 39
Table 3.2 Refinery and Blender Net Inputs and Net Production (Thousand Barrels per Day)
Refinery and Blender Net Inputsa Refinery and Blender Net Productionb
CrudeOild NGPLe
OtherLiquidsf Total
DistillateFuel Oilg
JetFuelh
LPGc
MotorGasolinej
ResidualFuel Oil
OtherProductsk TotalPropanei Total
1950 Average .................... 5,739 259 19 6,018 1,093 h( ) NA 80 2,735 1,165 947 6,0191955 Average .................... 7,480 345 32 7,857 1,651 155 NA 119 3,648 1,152 1,166 7,8911960 Average .................... 8,067 455 61 8,583 1,823 241 NA 212 4,126 908 1,420 8,7291965 Average .................... 9,043 618 88 9,750 2,096 523 NA 293 4,507 736 1,814 9,9701970 Average .................... 10,870 763 121 11,754 2,454 827 NA 345 5,699 706 2,082 12,1131975 Average .................... 12,442 710 72 13,225 2,653 871 234 311 6,518 1,235 2,097 13,6851980 Average .................... 13,481 462 81 14,025 2,661 999 269 330 6,492 1,580 2,559 14,6221985 Average .................... 12,002 509 681 13,192 2,686 1,189 295 391 6,419 882 2,183 13,7501990 Average .................... 13,409 467 713 14,589 2,925 1,488 404 499 6,959 950 2,452 15,2721995 Average .................... 13,973 471 775 15,220 3,155 1,416 503 654 7,459 788 2,522 15,9942000 Average .................... 15,067 380 849 16,295 3,580 1,606 583 705 7,951 696 2,705 17,2432001 Average .................... 15,128 429 825 16,382 3,695 1,530 556 667 8,022 721 2,651 17,2852002 Average .................... 14,947 429 941 16,316 3,592 1,514 572 671 8,183 601 2,712 17,2732003 Average .................... 15,304 419 791 16,513 3,707 1,488 570 658 8,194 660 2,780 17,4872004 Average .................... 15,475 422 866 16,762 3,814 1,547 584 645 8,265 655 2,887 17,8142005 Average .................... 15,220 441 1,149 16,811 3,954 1,546 540 573 8,318 628 2,782 17,8002006 Average .................... 15,242 501 1,238 16,981 4,040 1,481 543 627 8,364 635 2,827 17,9752007 Average .................... 15,156 505 1,337 16,999 4,133 1,448 562 655 8,358 673 2,728 17,9942008 Average .................... 14,648 485 2,019 17,153 4,294 1,493 519 630 8,548 620 2,561 18,1462009 Average .................... 14,336 485 2,082 16,904 4,048 1,396 537 623 8,786 598 2,431 17,8822010 Average .................... 14,724 442 2,219 17,385 4,223 1,418 560 659 9,059 585 2,509 18,452
2011 January ...................... 14,423 549 1,835 16,807 4,303 1,362 561 431 8,714 552 2,464 17,826 February .................... 13,676 515 2,388 16,579 4,033 1,298 512 472 8,866 529 2,335 17,533 March ......................... 14,451 460 2,350 17,261 4,326 1,431 528 636 8,908 526 2,454 18,280 April ........................... 14,231 448 2,606 17,285 4,189 1,422 542 781 8,978 534 2,394 18,298 May ............................ 14,718 432 2,535 17,685 4,283 1,479 563 815 9,157 538 2,496 18,770 June ........................... 15,294 444 2,522 18,260 4,471 1,568 567 847 9,289 553 2,638 19,366 July ............................ 15,589 417 2,288 18,294 4,656 1,550 557 820 9,166 563 2,661 19,416 August ....................... 15,556 437 2,396 18,388 4,668 1,543 553 791 9,264 604 2,652 19,522 September ................. 15,275 494 2,100 17,870 4,576 1,553 569 603 9,140 516 2,605 18,993 October ...................... 14,570 524 2,205 17,298 4,539 1,378 540 480 8,932 530 2,525 18,382 November .................. 14,960 599 2,118 17,677 4,902 1,341 564 377 9,141 516 2,513 18,790 December .................. 14,842 566 2,270 17,678 4,919 1,449 566 368 9,128 486 2,462 18,812 Average .................... 14,806 490 2,300 17,596 4,492 1,449 552 619 9,058 537 2,518 18,673
2012 January ...................... 14,374 512 1,644 16,531 4,500 1,437 531 421 8,385 500 2,341 17,584 February .................... 14,615 532 1,627 16,774 4,408 1,402 542 503 8,606 548 2,372 17,838 March ......................... 14,476 445 2,008 16,929 4,263 1,412 545 688 8,705 577 2,359 18,004 April ........................... 14,609 451 2,208 17,269 4,352 1,434 558 835 8,720 525 2,430 18,295 May ............................ 15,097 432 2,317 17,846 4,547 1,469 568 858 8,950 509 2,603 18,936 June ........................... 15,637 442 2,182 18,261 4,632 1,610 585 841 9,157 538 2,583 19,360 July ............................ 15,665 439 2,149 18,253 4,660 1,613 569 848 9,073 486 2,640 19,319 August ....................... 15,325 436 2,436 18,197 4,600 1,560 543 779 9,237 495 2,571 19,242 September ................. 14,910 523 2,003 17,436 4,566 1,450 522 553 8,888 508 2,474 18,438 October ...................... 14,843 622 1,997 17,462 4,510 1,419 541 470 9,176 481 2,414 18,468 November .................. 15,085 627 1,747 17,460 4,669 1,374 550 364 9,156 458 2,471 18,492 December .................. 15,330 646 1,627 17,604 4,884 1,466 579 390 9,051 388 2,578 18,756 Average .................... 14,999 509 1,997 17,505 4,550 1,471 553 630 8,926 501 2,487 18,564
2013 January ...................... 14,569 541 1,580 16,690 4,476 1,421 543 417 8,624 399 2,472 17,810 February .................... 14,246 501 2,094 16,841 4,267 1,403 535 485 8,794 508 2,382 17,839 March ......................... 14,703 488 2,035 17,226 4,285 1,463 557 652 8,908 571 2,380 18,260 April ........................... 14,865 427 2,275 17,567 4,415 1,526 561 820 8,963 509 2,422 18,655 May ............................ 15,300 379 2,606 18,286 4,767 1,451 574 869 9,241 483 2,532 19,343 June ........................... 15,833 426 2,376 18,634 4,788 1,523 566 848 9,409 469 2,693 19,731 July ............................ 16,040 427 2,295 18,761 4,933 1,562 575 865 9,314 477 2,750 19,900 August ....................... 15,803 444 2,413 18,660 4,931 1,606 583 837 9,291 423 2,701 19,789 September ................. R 15,628 R 560 R 1,926 R 18,113 R 4,889 R 1,544 R 575 R 634 R 9,120 R 428 R 2,655 R 19,270 October ...................... E 14,951 RF 595 RE 2,038 RF 17,584 E 4,849 E 1,450 RE 705 F 481 E 9,033 E 385 RE 2,459 RE 18,657 November .................. E 15,662 F 634 E 1,856 F 18,152 E 5,014 E 1,511 E 726 F 366 E 9,462 E 446 E 2,477 E 19,275 11-Month Average ... E 15,242 E 493 E 2,136 E 17,871 E 4,695 E 1,497 E 591 E 663 E 9,107 E 463 E 2,540 E 18,964
2012 11-Month Average ... 14,968 496 2,031 17,495 4,519 1,471 550 652 8,915 511 2,478 18,5462011 11-Month Average ... 14,803 483 2,303 17,589 4,452 1,449 551 642 9,051 542 2,523 18,660
a See "Refinery and Blender Net Inputs" in Glossary.b See "Refinery and Blender Net Production" in Glossary.c Liquefied petroleum gases.d Includes lease condensate.e Natural gas plant liquids (liquefied petroleum gases and pentanes plus).f Unfinished oils (net), other hydrocarbons, and hydrogen. Beginning in 1981,
also includes aviation and motor gasoline blending components (net). Beginning in1993, also includes oxygenates (net), including fuel ethanol. Beginning in 2009,also includes renewable diesel fuel (including biodiesel).
g Beginning in 2009, includes renewable diesel fuel (including biodiesel)blended into distillate fuel oil.
h Beginning in 1965, includes kerosene-type jet fuel. (Through 1964,kerosene-type jet fuel is included with kerosene in "Other Products.") For1952–2004, also includes naphtha-type jet fuel. (Through 1951, naphtha-type jetfuel is included in the products from which it was blended—gasoline, kerosene, anddistillate fuel oil. Beginning in 2005, naphtha-type jet fuel is included in "OtherProducts.")
i Includes propylene.j Finished motor gasoline. Through 1963, also includes aviation gasoline and
special naphthas. Beginning in 1993, also includes fuel ethanol blended into motor
gasoline.k Asphalt and road oil, kerosene, lubricants, petrochemical feedstocks,
petroleum coke, still gas (refinery gas), waxes, and miscellaneous products.Through 1964, also includes kerosene-type jet fuel. Beginning in 1964, alsoincludes finished aviation gasoline and special naphthas. Beginning in 2005, alsoincludes naphtha-type jet fuel.
R=Revised. E=Estimate. F=Forecast. NA=Not available. Notes: • Totals may not equal sum of components due to independent
rounding. • Geographic coverage is the 50 states and the District of Columbia.Web Page: See http://www.eia.gov/totalenergy/data/monthly/#petroleum (Excel
and CSV files) for all available annual data beginning in 1949 and monthly databeginning in 1973.
Sources: • 1949–1975: Bureau of Mines, Mineral Industry Surveys, PetroleumStatement, Annual, annual reports. • 1976–1980: U.S. Energy InformationAdministration (EIA), Energy Data Reports, Petroleum Statement, Annual, annualreports. • 1981–2012: EIA, Petroleum Supply Annual, annual reports. • 2013: EIA, Petroleum Supply Monthly, monthly reports; and, for the current two months,Weekly Petroleum Status Report data system, Short-Term Integrated ForecastingSystem, and Monthly Energy Review data system calculations.
Selected years of data from 1949 through 1972 have been added to this table.For all years of data from 1949 through 2013, see the “Web Page” cited above.

Figure 3.3a Petroleum Trade: Overview
Overview, September 2013
Imports From OPEC and Persian Gulf as Share of Total Imports, 1960–2012
Net Imports as Share of Products Supplied, 1949–2012
Note: OPEC=Organization of the Petroleum Exporting Countries.Web Page: http://www.eia.gov/totalenergy/data/monthly/#petroleum.Source: Table 3.3a.
40 U.S. Energy Information Administration / Monthly Energy Review December 2013
OPEC Imports ImportsPersian Gulf Supplied
2.13.9
10.0
3.6
6.3
19.1
Imports From Imports From Total Exports Net Products0
5
10
15
20
25
Mill
ion
Bar
rels
per
Day
OPEC
47.8%(1973)
13.6%(1973)
Persian Gulf17.9%(1960)
68.0%(1960)
20.3%(2012)
40.3%(2012)
1960 1965 1970 1975 1980 1985 1990 1995 2000 2005 20100
20
40
60
80
Per
cent
40.0%(2012)
34.8%(1973)
5.5%(1949)
1950 1955 1960 1965 1970 1975 1980 1985 1990 1995 2000 2005 20100
25
50
75
Per
cent
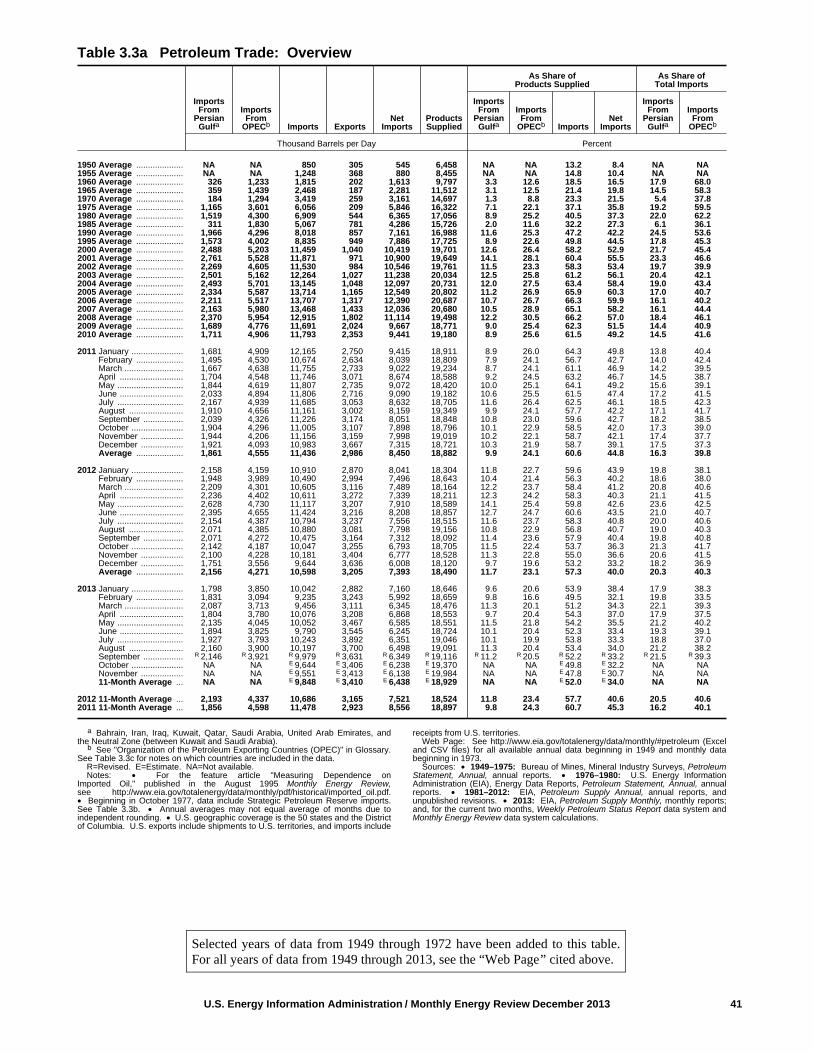
U.S. Energy Information Administration / Monthly Energy Review December 2013 41
Table 3.3a Petroleum Trade: Overview
ImportsFrom
PersianGulfa
ImportsFrom
OPECb Imports ExportsNet
ImportsProductsSupplied
As Share ofProducts Supplied
As Share ofTotal Imports
ImportsFrom
PersianGulfa
ImportsFrom
OPECb ImportsNet
Imports
ImportsFrom
PersianGulfa
ImportsFrom
OPECb
Thousand Barrels per Day Percent
1950 Average .................... NA NA 850 305 545 6,458 NA NA 13.2 8.4 NA NA1955 Average .................... NA NA 1,248 368 880 8,455 NA NA 14.8 10.4 NA NA1960 Average .................... 326 1,233 1,815 202 1,613 9,797 3.3 12.6 18.5 16.5 17.9 68.01965 Average .................... 359 1,439 2,468 187 2,281 11,512 3.1 12.5 21.4 19.8 14.5 58.31970 Average .................... 184 1,294 3,419 259 3,161 14,697 1.3 8.8 23.3 21.5 5.4 37.81975 Average .................... 1,165 3,601 6,056 209 5,846 16,322 7.1 22.1 37.1 35.8 19.2 59.51980 Average .................... 1,519 4,300 6,909 544 6,365 17,056 8.9 25.2 40.5 37.3 22.0 62.21985 Average .................... 311 1,830 5,067 781 4,286 15,726 2.0 11.6 32.2 27.3 6.1 36.11990 Average .................... 1,966 4,296 8,018 857 7,161 16,988 11.6 25.3 47.2 42.2 24.5 53.61995 Average .................... 1,573 4,002 8,835 949 7,886 17,725 8.9 22.6 49.8 44.5 17.8 45.32000 Average .................... 2,488 5,203 11,459 1,040 10,419 19,701 12.6 26.4 58.2 52.9 21.7 45.42001 Average .................... 2,761 5,528 11,871 971 10,900 19,649 14.1 28.1 60.4 55.5 23.3 46.62002 Average .................... 2,269 4,605 11,530 984 10,546 19,761 11.5 23.3 58.3 53.4 19.7 39.92003 Average .................... 2,501 5,162 12,264 1,027 11,238 20,034 12.5 25.8 61.2 56.1 20.4 42.12004 Average .................... 2,493 5,701 13,145 1,048 12,097 20,731 12.0 27.5 63.4 58.4 19.0 43.42005 Average .................... 2,334 5,587 13,714 1,165 12,549 20,802 11.2 26.9 65.9 60.3 17.0 40.72006 Average .................... 2,211 5,517 13,707 1,317 12,390 20,687 10.7 26.7 66.3 59.9 16.1 40.22007 Average .................... 2,163 5,980 13,468 1,433 12,036 20,680 10.5 28.9 65.1 58.2 16.1 44.42008 Average .................... 2,370 5,954 12,915 1,802 11,114 19,498 12.2 30.5 66.2 57.0 18.4 46.12009 Average .................... 1,689 4,776 11,691 2,024 9,667 18,771 9.0 25.4 62.3 51.5 14.4 40.92010 Average .................... 1,711 4,906 11,793 2,353 9,441 19,180 8.9 25.6 61.5 49.2 14.5 41.6
2011 January ...................... 1,681 4,909 12,165 2,750 9,415 18,911 8.9 26.0 64.3 49.8 13.8 40.4 February .................... 1,495 4,530 10,674 2,634 8,039 18,809 7.9 24.1 56.7 42.7 14.0 42.4 March ......................... 1,667 4,638 11,755 2,733 9,022 19,234 8.7 24.1 61.1 46.9 14.2 39.5 April ........................... 1,704 4,548 11,746 3,071 8,674 18,588 9.2 24.5 63.2 46.7 14.5 38.7 May ............................ 1,844 4,619 11,807 2,735 9,072 18,420 10.0 25.1 64.1 49.2 15.6 39.1 June ........................... 2,033 4,894 11,806 2,716 9,090 19,182 10.6 25.5 61.5 47.4 17.2 41.5 July ............................ 2,167 4,939 11,685 3,053 8,632 18,705 11.6 26.4 62.5 46.1 18.5 42.3 August ....................... 1,910 4,656 11,161 3,002 8,159 19,349 9.9 24.1 57.7 42.2 17.1 41.7 September ................. 2,039 4,326 11,226 3,174 8,051 18,848 10.8 23.0 59.6 42.7 18.2 38.5 October ...................... 1,904 4,296 11,005 3,107 7,898 18,796 10.1 22.9 58.5 42.0 17.3 39.0 November .................. 1,944 4,206 11,156 3,159 7,998 19,019 10.2 22.1 58.7 42.1 17.4 37.7 December .................. 1,921 4,093 10,983 3,667 7,315 18,721 10.3 21.9 58.7 39.1 17.5 37.3 Average .................... 1,861 4,555 11,436 2,986 8,450 18,882 9.9 24.1 60.6 44.8 16.3 39.8
2012 January ...................... 2,158 4,159 10,910 2,870 8,041 18,304 11.8 22.7 59.6 43.9 19.8 38.1 February .................... 1,948 3,989 10,490 2,994 7,496 18,643 10.4 21.4 56.3 40.2 18.6 38.0 March ......................... 2,209 4,301 10,605 3,116 7,489 18,164 12.2 23.7 58.4 41.2 20.8 40.6 April ........................... 2,236 4,402 10,611 3,272 7,339 18,211 12.3 24.2 58.3 40.3 21.1 41.5 May ............................ 2,628 4,730 11,117 3,207 7,910 18,589 14.1 25.4 59.8 42.6 23.6 42.5 June ........................... 2,395 4,655 11,424 3,216 8,208 18,857 12.7 24.7 60.6 43.5 21.0 40.7 July ............................ 2,154 4,387 10,794 3,237 7,556 18,515 11.6 23.7 58.3 40.8 20.0 40.6 August ....................... 2,071 4,385 10,880 3,081 7,798 19,156 10.8 22.9 56.8 40.7 19.0 40.3 September ................. 2,071 4,272 10,475 3,164 7,312 18,092 11.4 23.6 57.9 40.4 19.8 40.8 October ...................... 2,142 4,187 10,047 3,255 6,793 18,705 11.5 22.4 53.7 36.3 21.3 41.7 November .................. 2,100 4,228 10,181 3,404 6,777 18,528 11.3 22.8 55.0 36.6 20.6 41.5 December .................. 1,751 3,556 9,644 3,636 6,008 18,120 9.7 19.6 53.2 33.2 18.2 36.9 Average .................... 2,156 4,271 10,598 3,205 7,393 18,490 11.7 23.1 57.3 40.0 20.3 40.3
2013 January ...................... 1,798 3,850 10,042 2,882 7,160 18,646 9.6 20.6 53.9 38.4 17.9 38.3 February .................... 1,831 3,094 9,235 3,243 5,992 18,659 9.8 16.6 49.5 32.1 19.8 33.5 March ......................... 2,087 3,713 9,456 3,111 6,345 18,476 11.3 20.1 51.2 34.3 22.1 39.3 April ........................... 1,804 3,780 10,076 3,208 6,868 18,553 9.7 20.4 54.3 37.0 17.9 37.5 May ............................ 2,135 4,045 10,052 3,467 6,585 18,551 11.5 21.8 54.2 35.5 21.2 40.2 June ........................... 1,894 3,825 9,790 3,545 6,245 18,724 10.1 20.4 52.3 33.4 19.3 39.1 July ............................ 1,927 3,793 10,243 3,892 6,351 19,046 10.1 19.9 53.8 33.3 18.8 37.0 August ....................... 2,160 3,900 10,197 3,700 6,498 19,091 11.3 20.4 53.4 34.0 21.2 38.2 September ................. R 2,146 R 3,921 R 9,979 R 3,631 R 6,349 R 19,116 R 11.2 R 20.5 R 52.2 R 33.2 R 21.5 R 39.3 October ...................... NA NA E 9,644 E 3,406 E 6,238 E 19,370 NA NA E 49.8 E 32.2 NA NA November .................. NA NA E 9,551 E 3,413 E 6,138 E 19,984 NA NA E 47.8 E 30.7 NA NA 11-Month Average ... NA NA E 9,848 E 3,410 E 6,438 E 18,929 NA NA E 52.0 E 34.0 NA NA
2012 11-Month Average ... 2,193 4,337 10,686 3,165 7,521 18,524 11.8 23.4 57.7 40.6 20.5 40.62011 11-Month Average ... 1,856 4,598 11,478 2,923 8,556 18,897 9.8 24.3 60.7 45.3 16.2 40.1
a Bahrain, Iran, Iraq, Kuwait, Qatar, Saudi Arabia, United Arab Emirates, andthe Neutral Zone (between Kuwait and Saudi Arabia).
b See "Organization of the Petroleum Exporting Countries (OPEC)" in Glossary.See Table 3.3c for notes on which countries are included in the data.
R=Revised. E=Estimate. NA=Not available. Notes: • For the feature article "Measuring Dependence on
Imported Oil," published in the August 1995 Monthly Energy Review,see http://www.eia.gov/totalenergy/data/monthly/pdf/historical/imported_oil.pdf.• Beginning in October 1977, data include Strategic Petroleum Reserve imports.See Table 3.3b. • Annual averages may not equal average of months due toindependent rounding. • U.S. geographic coverage is the 50 states and the Districtof Columbia. U.S. exports include shipments to U.S. territories, and imports include
receipts from U.S. territories.Web Page: See http://www.eia.gov/totalenergy/data/monthly/#petroleum (Excel
and CSV files) for all available annual data beginning in 1949 and monthly databeginning in 1973.
Sources: • 1949–1975: Bureau of Mines, Mineral Industry Surveys, PetroleumStatement, Annual, annual reports. • 1976–1980: U.S. Energy InformationAdministration (EIA), Energy Data Reports, Petroleum Statement, Annual, annualreports. • 1981–2012: EIA, Petroleum Supply Annual, annual reports, andunpublished revisions. • 2013: EIA, Petroleum Supply Monthly, monthly reports;and, for the current two months, Weekly Petroleum Status Report data system andMonthly Energy Review data system calculations.
Selected years of data from 1949 through 1972 have been added to this table.For all years of data from 1949 through 2013, see the “Web Page” cited above.

Figure 3.3b Petroleum Trade: Imports (Million Barrels per Day)
Overview, 1949–2012
OPEC and Non-OPEC, 1960–2012
From Selected OPEC Countries, September 2013 From Selected Non-OPEC Countries, September 2013
Note: OPEC=Organization of the Petroleum Exporting Countries.Web Page: http http://www.eia.gov/totalenergy/data/monthly/#petroleum.Sources: Tables 3.3b–3.3d.
42 U.S. Energy Information Administration / Monthly Energy Review December 2013
1950 1955 1960 1965 1970 1975 1980 1985 1990 1995 2000 2005 20100
2
4
6
8
10
12
Crude Oil
Petroleum Products
Non-OPEC
OPEC
1960 1965 1970 1975 1980 1985 1990 1995 2000 2005 20100
2
4
6
8
10
3.072
0.839
0.4580.314 0.242
Canada Mexico Russia Colombia Brazil0.0
1.0
2.0
3.0
4.0
Arabia
1.557
0.837
0.299 0.287 0.286
Saudi Vene- Kuwait Iraq Nigeria0.0
0.5
1.0
1.5
2.0
zuela

U.S. Energy Information Administration / Monthly Energy Review December 2013 43
Table 3.3b Petroleum Trade: Imports and Exports by Type (Thousand Barrels per Day)
Imports Exports
Crude OilaDistillateFuel Oil
JetFueld
LPGb
MotorGasolinef
ResidualFuel Oil Otherg Total
CrudeOila
PetroleumProducts TotalSPRc Total Propanee Total
1950 Average ................ – – 487 7 d( ) 0 0 (s) 329 27 850 95 210 3051955 Average ................ – – 782 12 d( ) 0 0 13 417 24 1,248 32 336 3681960 Average ................ – – 1,015 35 34 NA 4 27 637 62 1,815 8 193 2021965 Average ................ – – 1,238 36 81 NA 21 28 946 119 2,468 3 184 1871970 Average ................ – – 1,324 147 144 26 52 67 1,528 157 3,419 14 245 2591975 Average ................ – – 4,105 155 133 60 112 184 1,223 144 6,056 6 204 2091980 Average ................ 44 5,263 142 80 69 216 140 939 130 6,909 287 258 5441985 Average ................ 118 3,201 200 39 67 187 381 510 550 5,067 204 577 7811990 Average ................ 27 5,894 278 108 115 188 342 504 705 8,018 109 748 8571995 Average ................ – 7,230 193 106 102 146 265 187 708 8,835 95 855 9492000 Average ................ 8 9,071 295 162 161 215 427 352 938 11,459 50 990 1,0402001 Average ................ 11 9,328 344 148 145 206 454 295 1,095 11,871 20 951 9712002 Average ................ 16 9,140 267 107 145 183 498 249 1,085 11,530 9 975 9842003 Average ................ – 9,665 333 109 168 225 518 327 1,087 12,264 12 1,014 1,0272004 Average ................ 77 10,088 325 127 209 263 496 426 1,419 13,145 27 1,021 1,0482005 Average ................ 52 10,126 329 190 233 328 603 530 1,609 13,714 32 1,133 1,1652006 Average ................ 8 10,118 365 186 228 332 475 350 1,881 13,707 25 1,292 1,3172007 Average ................ 7 10,031 304 217 182 247 413 372 1,885 13,468 27 1,405 1,4332008 Average ................ 19 9,783 213 103 185 253 302 349 1,913 12,915 29 1,773 1,8022009 Average ................ 56 9,013 225 81 147 182 223 331 1,635 11,691 44 1,980 2,0242010 Average ................ – 9,213 228 98 121 153 134 366 1,600 11,793 42 2,311 2,353
2011 January .................. – 9,183 337 65 175 207 102 411 1,860 12,165 72 2,678 2,750 February ................ – 8,184 206 68 175 201 119 364 1,532 10,674 30 2,604 2,634 March ..................... – 9,183 190 65 137 165 135 378 1,639 11,755 36 2,696 2,733 April ....................... – 8,839 191 80 96 115 138 424 1,959 11,746 41 3,031 3,071 May ........................ – 9,059 170 91 74 101 137 306 1,942 11,807 37 2,698 2,735 June ....................... – 9,235 127 82 62 89 130 353 1,789 11,806 36 2,680 2,716 July ........................ – 9,276 157 95 61 85 92 246 1,733 11,685 73 2,980 3,053 August ................... – 8,936 148 66 73 101 106 231 1,573 11,161 34 2,969 3,002 September ............. – 8,914 179 58 109 132 99 277 1,567 11,226 35 3,139 3,174 October .................. – 8,907 128 61 95 118 66 286 1,440 11,005 51 3,057 3,107 November .............. – 8,724 138 72 110 129 74 341 1,677 11,156 64 3,094 3,159 December .............. – 8,711 175 21 152 177 60 330 1,509 10,983 53 3,614 3,667 Average ................ – 8,935 179 69 110 135 105 328 1,686 11,436 47 2,939 2,986
2012 January .................. – 8,527 157 6 146 169 80 330 1,641 10,910 78 2,791 2,870 February ................ – 8,562 142 41 125 155 46 228 1,315 10,490 73 2,921 2,994 March ..................... – 8,771 137 5 109 137 79 273 1,204 10,605 71 3,045 3,116 April ....................... – 8,636 98 45 115 143 33 252 1,404 10,611 41 3,231 3,272 May ........................ – 8,991 113 49 106 133 43 265 1,524 11,117 83 3,124 3,207 June ....................... – 9,193 87 42 102 130 37 325 1,609 11,424 46 3,170 3,216 July ........................ – 8,712 117 48 115 134 32 247 1,505 10,794 77 3,160 3,237 August ................... – 8,665 112 124 85 109 34 244 1,593 10,880 60 3,021 3,081 September ............. – 8,381 86 84 100 124 23 257 1,521 10,475 68 3,096 3,164 October .................. – 8,108 88 106 91 116 26 236 1,368 10,047 67 3,188 3,255 November .............. – 8,183 188 46 138 158 32 236 1,339 10,181 73 3,331 3,404 December .............. – 7,604 190 59 161 182 64 178 1,367 9,644 71 3,565 3,636 Average ................ – 8,527 126 55 116 141 44 256 1,450 10,598 67 3,137 3,205
2013 January .................. – 7,953 213 46 184 207 40 238 1,345 10,042 73 2,809 2,882 February ................ – 7,270 174 61 166 186 19 196 1,331 9,235 124 3,119 3,243 March ..................... – 7,460 146 18 141 164 56 300 1,312 9,456 101 3,010 3,111 April ....................... – 7,726 238 74 110 130 35 259 1,614 10,076 132 3,075 3,208 May ........................ – 7,737 168 83 81 98 24 186 1,757 10,052 125 3,342 3,467 June ....................... – 7,730 120 76 110 131 70 173 1,490 9,790 120 3,425 3,545 July ........................ – 8,071 107 75 87 108 53 249 1,580 10,243 98 3,794 3,892 August ................... – 8,099 123 124 85 109 68 292 1,383 10,197 66 3,634 3,700 September ............. – R 7,911 R 132 R 68 R 87 R 108 R 40 R 229 R 1,490 R 9,979 R 99 R 3,532 R 3,631 October .................. – E 7,630 E 137 E 57 E 127 NA E 36 E 174 NA E 9,644 E 56 E 3,350 E 3,406 November .............. – E 7,745 E 145 E 65 E 133 NA E 50 E 187 NA E 9,551 E 57 E 3,357 E 3,413 11-Month Average – E 7,762 E 155 E 68 E 119 NA E 45 E 226 NA E 9,848 E 95 E 3,315 E 3,410
2012 11-Month Average – 8,612 120 54 112 137 42 263 1,457 10,686 67 3,098 3,1652011 11-Month Average – 8,956 179 73 106 131 109 328 1,702 11,478 46 2,876 2,923
a Includes lease condensate.b Liquefied petroleum gases.c "SPR" is the Strategic Petroleum Reserve, which began in October 1977.
Through 2003, includes crude oil imports by SPR only; beginning in 2004, includescrude oil imports by SPR, and crude oil imports into SPR by others.
d Beginning in 1965, includes kerosene-type jet fuel. (Through 1964,kerosene-type jet fuel is included with kerosene in "Other.") For 1956–2004, alsoincludes naphtha-type jet fuel. (Through 1955, naphtha-type jet fuel is included in"Motor Gasoline." Beginning in 2005, naphtha-type jet fuel is included in "Other.")
e Includes propylene.f Finished motor gasoline. Through 1955, also includes naphtha-type jet fuel.
Through 1963, also includes aviation gasoline and special naphthas. Through1980, also includes motor gasoline blending components.
g Asphalt and road oil, aviation gasoline blending components, kerosene,lubricants, pentanes plus, petrochemical feedstocks, petroleum coke, unfinishedoils, waxes, other hydrocarbons and oxygenates, and miscellaneous products.Through 1964, also includes kerosene-type jet fuel. Beginning in 1964, also
includes finished aviation gasoline and special naphthas. Beginning in 1981, alsoincludes motor gasoline blending components. Beginning in 2005, also includesnaphtha-type jet fuel.
R=Revised. E=Estimate. NA=Not available. – – =Not applicable. – =No datareported. (s)=Less than 500 barrels per day.
Notes: • Totals may not equal sum of components due to independentrounding. • Geographic coverage is the 50 states and the District of Columbia.
Web Page: See http://www.eia.gov/totalenergy/data/monthly/#petroleum (Exceland CSV files) for all available annual data beginning in 1949 and monthly databeginning in 1973.
Sources: • 1949–1975: Bureau of Mines, Mineral Industry Surveys, PetroleumStatement, Annual, annual reports. • 1976–1980: U.S. Energy InformationAdministration (EIA), Energy Data Reports, Petroleum Statement, Annual, annualreports. • 1981–2012: EIA, Petroleum Supply Annual, annual reports, andunpublished revisions. • 2013: EIA, Petroleum Supply Monthly, monthly reports;and, for the current two months, Weekly Petroleum Status Report data system andMonthly Energy Review data system calculations.
Selected years of data from 1949 through 1972 have been added to this table.For all years of data from 1949 through 2013, see the “Web Page” cited above.
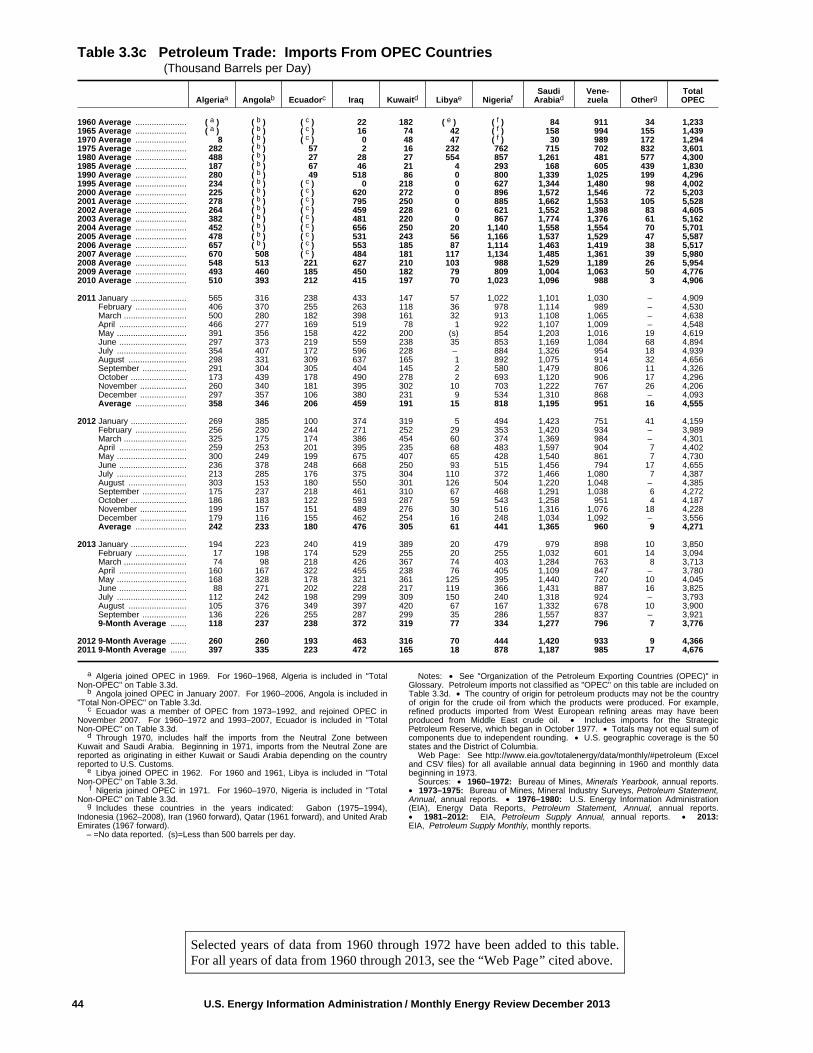
44 U.S. Energy Information Administration / Monthly Energy Review December 2013
Table 3.3c Petroleum Trade: Imports From OPEC Countries (Thousand Barrels per Day)
Algeriaa Angolab Ecuadorc Iraq Kuwaitd Libyae NigeriafSaudi
ArabiadVene-zuela Otherg
TotalOPEC
1960 Average ...................... a( ) b( ) c( ) 22 182 e( ) f( ) 84 911 34 1,2331965 Average ...................... a( ) b( ) c( ) 16 74 42 f( ) 158 994 155 1,4391970 Average ...................... 8 b( ) c( ) 0 48 47 f( ) 30 989 172 1,2941975 Average ...................... 282 b( ) 57 2 16 232 762 715 702 832 3,6011980 Average ...................... 488 b( ) 27 28 27 554 857 1,261 481 577 4,3001985 Average ...................... 187 b( ) 67 46 21 4 293 168 605 439 1,8301990 Average ...................... 280 b( ) 49 518 86 0 800 1,339 1,025 199 4,2961995 Average ...................... 234 b( ) c( ) 0 218 0 627 1,344 1,480 98 4,0022000 Average ...................... 225 b( ) c( ) 620 272 0 896 1,572 1,546 72 5,2032001 Average ...................... 278 b( ) c( ) 795 250 0 885 1,662 1,553 105 5,5282002 Average ...................... 264 b( ) c( ) 459 228 0 621 1,552 1,398 83 4,6052003 Average ...................... 382 b( ) c( ) 481 220 0 867 1,774 1,376 61 5,1622004 Average ...................... 452 b( ) c( ) 656 250 20 1,140 1,558 1,554 70 5,7012005 Average ...................... 478 b( ) c( ) 531 243 56 1,166 1,537 1,529 47 5,5872006 Average ...................... 657 b( ) c( ) 553 185 87 1,114 1,463 1,419 38 5,5172007 Average ...................... 670 508 c( ) 484 181 117 1,134 1,485 1,361 39 5,9802008 Average ...................... 548 513 221 627 210 103 988 1,529 1,189 26 5,9542009 Average ...................... 493 460 185 450 182 79 809 1,004 1,063 50 4,7762010 Average ...................... 510 393 212 415 197 70 1,023 1,096 988 3 4,906
2011 January ........................ 565 316 238 433 147 57 1,022 1,101 1,030 – 4,909 February ...................... 406 370 255 263 118 36 978 1,114 989 – 4,530 March ........................... 500 280 182 398 161 32 913 1,108 1,065 – 4,638 April ............................. 466 277 169 519 78 1 922 1,107 1,009 – 4,548 May .............................. 391 356 158 422 200 (s) 854 1,203 1,016 19 4,619 June ............................. 297 373 219 559 238 35 853 1,169 1,084 68 4,894 July .............................. 354 407 172 596 228 – 884 1,326 954 18 4,939 August ......................... 298 331 309 637 165 1 892 1,075 914 32 4,656 September ................... 291 304 305 404 145 2 580 1,479 806 11 4,326 October ........................ 173 439 178 490 278 2 693 1,120 906 17 4,296 November .................... 260 340 181 395 302 10 703 1,222 767 26 4,206 December .................... 297 357 106 380 231 9 534 1,310 868 – 4,093 Average ...................... 358 346 206 459 191 15 818 1,195 951 16 4,555
2012 January ........................ 269 385 100 374 319 5 494 1,423 751 41 4,159 February ...................... 256 230 244 271 252 29 353 1,420 934 – 3,989 March ........................... 325 175 174 386 454 60 374 1,369 984 – 4,301 April ............................. 259 253 201 395 235 68 483 1,597 904 7 4,402 May .............................. 300 249 199 675 407 65 428 1,540 861 7 4,730 June ............................. 236 378 248 668 250 93 515 1,456 794 17 4,655 July .............................. 213 285 176 375 304 110 372 1,466 1,080 7 4,387 August ......................... 303 153 180 550 301 126 504 1,220 1,048 – 4,385 September ................... 175 237 218 461 310 67 468 1,291 1,038 6 4,272 October ........................ 186 183 122 593 287 59 543 1,258 951 4 4,187 November .................... 199 157 151 489 276 30 516 1,316 1,076 18 4,228 December .................... 179 116 155 462 254 16 248 1,034 1,092 – 3,556 Average ...................... 242 233 180 476 305 61 441 1,365 960 9 4,271
2013 January ........................ 194 223 240 419 389 20 479 979 898 10 3,850 February ...................... 17 198 174 529 255 20 255 1,032 601 14 3,094 March ........................... 74 98 218 426 367 74 403 1,284 763 8 3,713 April ............................. 160 167 322 455 238 76 405 1,109 847 – 3,780 May .............................. 168 328 178 321 361 125 395 1,440 720 10 4,045 June ............................. 88 271 202 228 217 119 366 1,431 887 16 3,825 July .............................. 112 242 198 299 309 150 240 1,318 924 – 3,793 August ......................... 105 376 349 397 420 67 167 1,332 678 10 3,900 September ................... 136 226 255 287 299 35 286 1,557 837 – 3,921 9-Month Average ....... 118 237 238 372 319 77 334 1,277 796 7 3,776
2012 9-Month Average ....... 260 260 193 463 316 70 444 1,420 933 9 4,3662011 9-Month Average ....... 397 335 223 472 165 18 878 1,187 985 17 4,676
a Algeria joined OPEC in 1969. For 1960–1968, Algeria is included in "TotalNon-OPEC" on Table 3.3d.
b Angola joined OPEC in January 2007. For 1960–2006, Angola is included in"Total Non-OPEC" on Table 3.3d.
c Ecuador was a member of OPEC from 1973–1992, and rejoined OPEC inNovember 2007. For 1960–1972 and 1993–2007, Ecuador is included in "TotalNon-OPEC" on Table 3.3d.
d Through 1970, includes half the imports from the Neutral Zone betweenKuwait and Saudi Arabia. Beginning in 1971, imports from the Neutral Zone arereported as originating in either Kuwait or Saudi Arabia depending on the countryreported to U.S. Customs.
e Libya joined OPEC in 1962. For 1960 and 1961, Libya is included in "TotalNon-OPEC" on Table 3.3d.
f Nigeria joined OPEC in 1971. For 1960–1970, Nigeria is included in "TotalNon-OPEC" on Table 3.3d.
g Includes these countries in the years indicated: Gabon (1975–1994),Indonesia (1962–2008), Iran (1960 forward), Qatar (1961 forward), and United ArabEmirates (1967 forward).
– =No data reported. (s)=Less than 500 barrels per day.
Notes: • See "Organization of the Petroleum Exporting Countries (OPEC)" inGlossary. Petroleum imports not classified as "OPEC" on this table are included onTable 3.3d. • The country of origin for petroleum products may not be the countryof origin for the crude oil from which the products were produced. For example,refined products imported from West European refining areas may have beenproduced from Middle East crude oil. • Includes imports for the StrategicPetroleum Reserve, which began in October 1977. • Totals may not equal sum ofcomponents due to independent rounding. • U.S. geographic coverage is the 50states and the District of Columbia.
Web Page: See http://www.eia.gov/totalenergy/data/monthly/#petroleum (Exceland CSV files) for all available annual data beginning in 1960 and monthly databeginning in 1973.
Sources: • 1960–1972: Bureau of Mines, Minerals Yearbook, annual reports.• 1973–1975: Bureau of Mines, Mineral Industry Surveys, Petroleum Statement,Annual, annual reports. • 1976–1980: U.S. Energy Information Administration(EIA), Energy Data Reports, Petroleum Statement, Annual, annual reports.• 1981–2012: EIA, Petroleum Supply Annual, annual reports. • 2013:EIA, Petroleum Supply Monthly, monthly reports.
Selected years of data from 1960 through 1972 have been added to this table.For all years of data from 1960 through 2013, see the “Web Page” cited above.
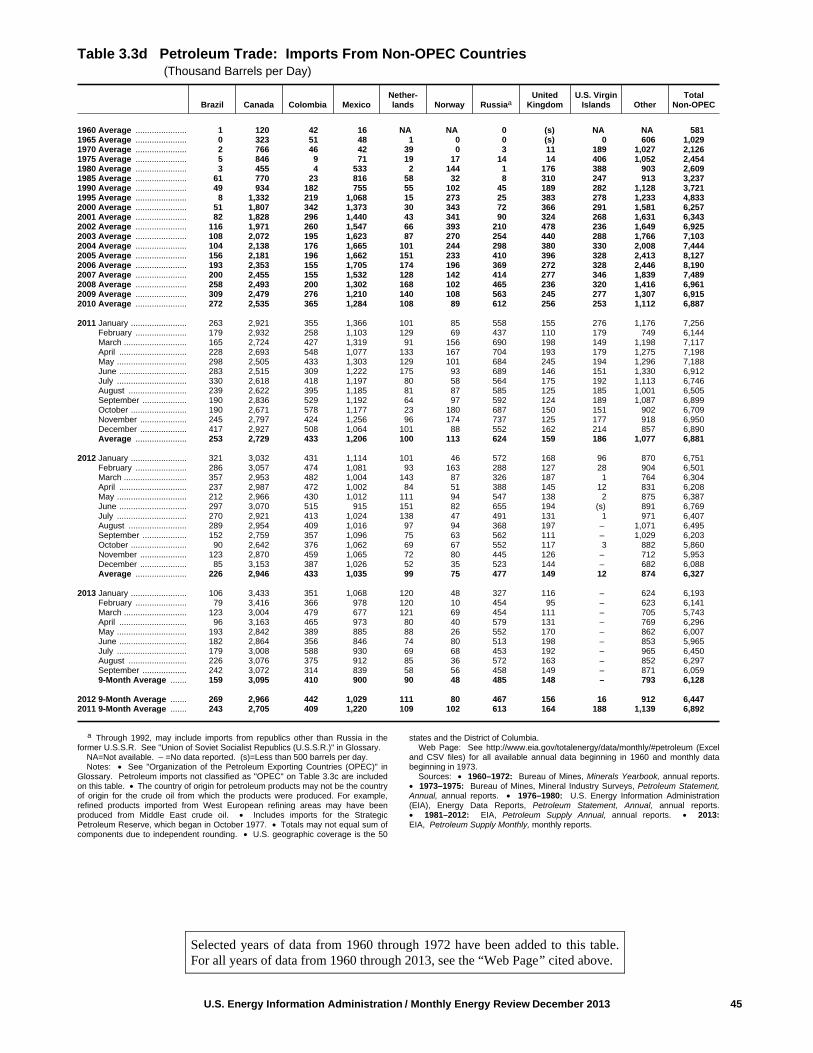
U.S. Energy Information Administration / Monthly Energy Review December 2013 45
Table 3.3d Petroleum Trade: Imports From Non-OPEC Countries (Thousand Barrels per Day)
Brazil Canada Colombia MexicoNether-lands Norway Russiaa
UnitedKingdom
U.S. VirginIslands Other
TotalNon-OPEC
1960 Average ...................... 1 120 42 16 NA NA 0 (s) NA NA 5811965 Average ...................... 0 323 51 48 1 0 0 (s) 0 606 1,0291970 Average ...................... 2 766 46 42 39 0 3 11 189 1,027 2,1261975 Average ...................... 5 846 9 71 19 17 14 14 406 1,052 2,4541980 Average ...................... 3 455 4 533 2 144 1 176 388 903 2,6091985 Average ...................... 61 770 23 816 58 32 8 310 247 913 3,2371990 Average ...................... 49 934 182 755 55 102 45 189 282 1,128 3,7211995 Average ...................... 8 1,332 219 1,068 15 273 25 383 278 1,233 4,8332000 Average ...................... 51 1,807 342 1,373 30 343 72 366 291 1,581 6,2572001 Average ...................... 82 1,828 296 1,440 43 341 90 324 268 1,631 6,3432002 Average ...................... 116 1,971 260 1,547 66 393 210 478 236 1,649 6,9252003 Average ...................... 108 2,072 195 1,623 87 270 254 440 288 1,766 7,1032004 Average ...................... 104 2,138 176 1,665 101 244 298 380 330 2,008 7,4442005 Average ...................... 156 2,181 196 1,662 151 233 410 396 328 2,413 8,1272006 Average ...................... 193 2,353 155 1,705 174 196 369 272 328 2,446 8,1902007 Average ...................... 200 2,455 155 1,532 128 142 414 277 346 1,839 7,4892008 Average ...................... 258 2,493 200 1,302 168 102 465 236 320 1,416 6,9612009 Average ...................... 309 2,479 276 1,210 140 108 563 245 277 1,307 6,9152010 Average ...................... 272 2,535 365 1,284 108 89 612 256 253 1,112 6,887
2011 January ........................ 263 2,921 355 1,366 101 85 558 155 276 1,176 7,256 February ...................... 179 2,932 258 1,103 129 69 437 110 179 749 6,144 March ........................... 165 2,724 427 1,319 91 156 690 198 149 1,198 7,117 April ............................. 228 2,693 548 1,077 133 167 704 193 179 1,275 7,198 May .............................. 298 2,505 433 1,303 129 101 684 245 194 1,296 7,188 June ............................. 283 2,515 309 1,222 175 93 689 146 151 1,330 6,912 July .............................. 330 2,618 418 1,197 80 58 564 175 192 1,113 6,746 August ......................... 239 2,622 395 1,185 81 87 585 125 185 1,001 6,505 September ................... 190 2,836 529 1,192 64 97 592 124 189 1,087 6,899 October ........................ 190 2,671 578 1,177 23 180 687 150 151 902 6,709 November .................... 245 2,797 424 1,256 96 174 737 125 177 918 6,950 December .................... 417 2,927 508 1,064 101 88 552 162 214 857 6,890 Average ...................... 253 2,729 433 1,206 100 113 624 159 186 1,077 6,881
2012 January ........................ 321 3,032 431 1,114 101 46 572 168 96 870 6,751 February ...................... 286 3,057 474 1,081 93 163 288 127 28 904 6,501 March ........................... 357 2,953 482 1,004 143 87 326 187 1 764 6,304 April ............................. 237 2,987 472 1,002 84 51 388 145 12 831 6,208 May .............................. 212 2,966 430 1,012 111 94 547 138 2 875 6,387 June ............................. 297 3,070 515 915 151 82 655 194 (s) 891 6,769 July .............................. 270 2,921 413 1,024 138 47 491 131 1 971 6,407 August ......................... 289 2,954 409 1,016 97 94 368 197 – 1,071 6,495 September ................... 152 2,759 357 1,096 75 63 562 111 – 1,029 6,203 October ........................ 90 2,642 376 1,062 69 67 552 117 3 882 5,860 November .................... 123 2,870 459 1,065 72 80 445 126 – 712 5,953 December .................... 85 3,153 387 1,026 52 35 523 144 – 682 6,088 Average ...................... 226 2,946 433 1,035 99 75 477 149 12 874 6,327
2013 January ........................ 106 3,433 351 1,068 120 48 327 116 – 624 6,193 February ...................... 79 3,416 366 978 120 10 454 95 – 623 6,141 March ........................... 123 3,004 479 677 121 69 454 111 – 705 5,743 April ............................. 96 3,163 465 973 80 40 579 131 – 769 6,296 May .............................. 193 2,842 389 885 88 26 552 170 – 862 6,007 June ............................. 182 2,864 356 846 74 80 513 198 – 853 5,965 July .............................. 179 3,008 588 930 69 68 453 192 – 965 6,450 August ......................... 226 3,076 375 912 85 36 572 163 – 852 6,297 September ................... 242 3,072 314 839 58 56 458 149 – 871 6,059 9-Month Average ....... 159 3,095 410 900 90 48 485 148 – 793 6,128
2012 9-Month Average ....... 269 2,966 442 1,029 111 80 467 156 16 912 6,4472011 9-Month Average ....... 243 2,705 409 1,220 109 102 613 164 188 1,139 6,892
a Through 1992, may include imports from republics other than Russia in theformer U.S.S.R. See "Union of Soviet Socialist Republics (U.S.S.R.)" in Glossary.
NA=Not available. – =No data reported. (s)=Less than 500 barrels per day. Notes: • See "Organization of the Petroleum Exporting Countries (OPEC)" in
Glossary. Petroleum imports not classified as "OPEC" on Table 3.3c are includedon this table. • The country of origin for petroleum products may not be the countryof origin for the crude oil from which the products were produced. For example,refined products imported from West European refining areas may have beenproduced from Middle East crude oil. • Includes imports for the StrategicPetroleum Reserve, which began in October 1977. • Totals may not equal sum ofcomponents due to independent rounding. • U.S. geographic coverage is the 50
states and the District of Columbia.Web Page: See http://www.eia.gov/totalenergy/data/monthly/#petroleum (Excel
and CSV files) for all available annual data beginning in 1960 and monthly databeginning in 1973.
Sources: • 1960–1972: Bureau of Mines, Minerals Yearbook, annual reports.• 1973–1975: Bureau of Mines, Mineral Industry Surveys, Petroleum Statement,Annual, annual reports. • 1976–1980: U.S. Energy Information Administration(EIA), Energy Data Reports, Petroleum Statement, Annual, annual reports.• 1981–2012: EIA, Petroleum Supply Annual, annual reports. • 2013:EIA, Petroleum Supply Monthly, monthly reports.
Selected years of data from 1960 through 1972 have been added to this table.For all years of data from 1960 through 2013, see the “Web Page” cited above.
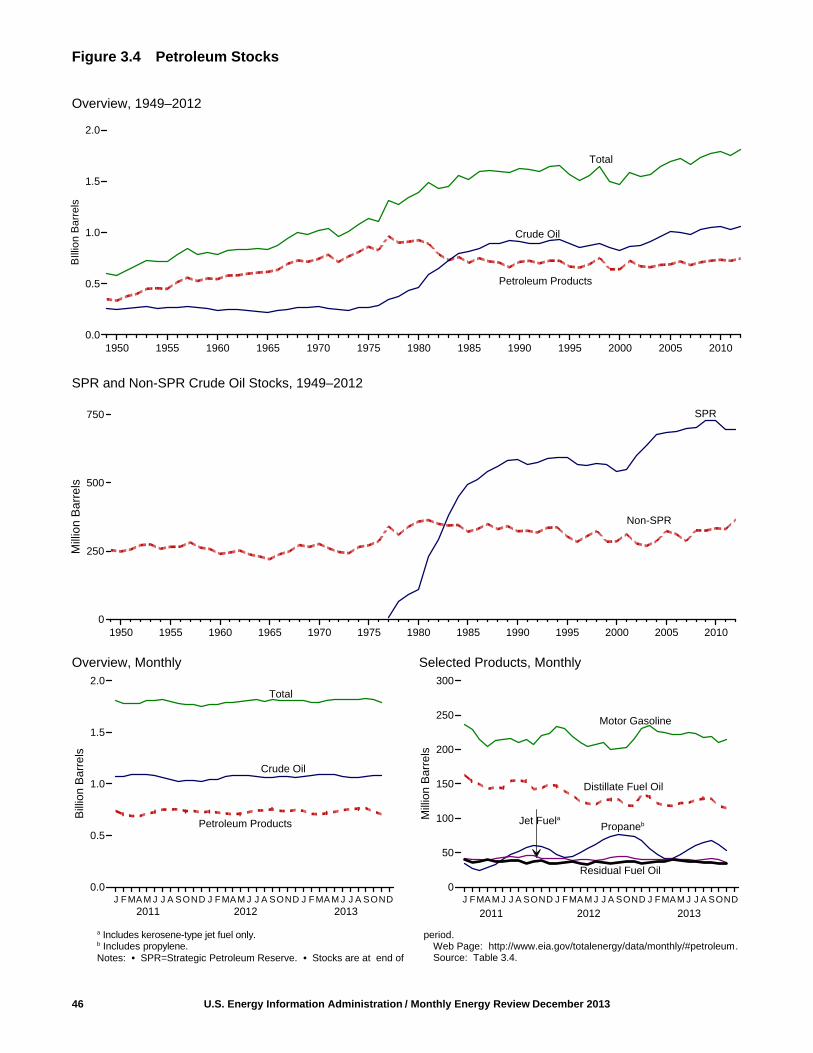
Figure 3.4 Petroleum Stocks
Overview, 1949–2012
SPR and Non-SPR Crude Oil Stocks, 1949–2012
Overview, Monthly Selected Products, Monthly
46 U.S. Energy Information Administration / Monthly Energy Review December 2013
1950 1955 1960 1965 1970 1975 1980 1985 1990 1995 2000 2005 20100.0
0.5
1.0
1.5
2.0
BIll
ion
Bar
rels
Total
Crude Oil
Petroleum Products
Petroleum Products
1950 1955 1960 1965 1970 1975 1980 1985 1990 1995 2000 2005 20100
250
500
750
Mill
ion
Bar
rels
SPR
Non-SPR
2011 2012 2013J F MA M J J A SOND J F MA M J J A SOND J F MA M J J A SOND
0.0
0.5
1.0
1.5
2.0
Bill
ion
Bar
rels
J FMAM J J A SOND J FMAM J J A SOND J FMAM J J A SOND0
50
100
150
200
250
300
Mill
ion
Bar
rels
a Includes kerosene-type jet fuel only. b Includes propylene.Notes: • SPR=Strategic Petroleum Reserve. • Stocks are at end of
period. Web Page: http://www.eia.gov/totalenergy/data/monthly/#petroleum.Source: Table 3.4.
Total
Motor Gasoline
Distillate Fuel Oil
Crude Oil
PropanebJet Fuela
Residual Fuel Oil
2011 2012 2013
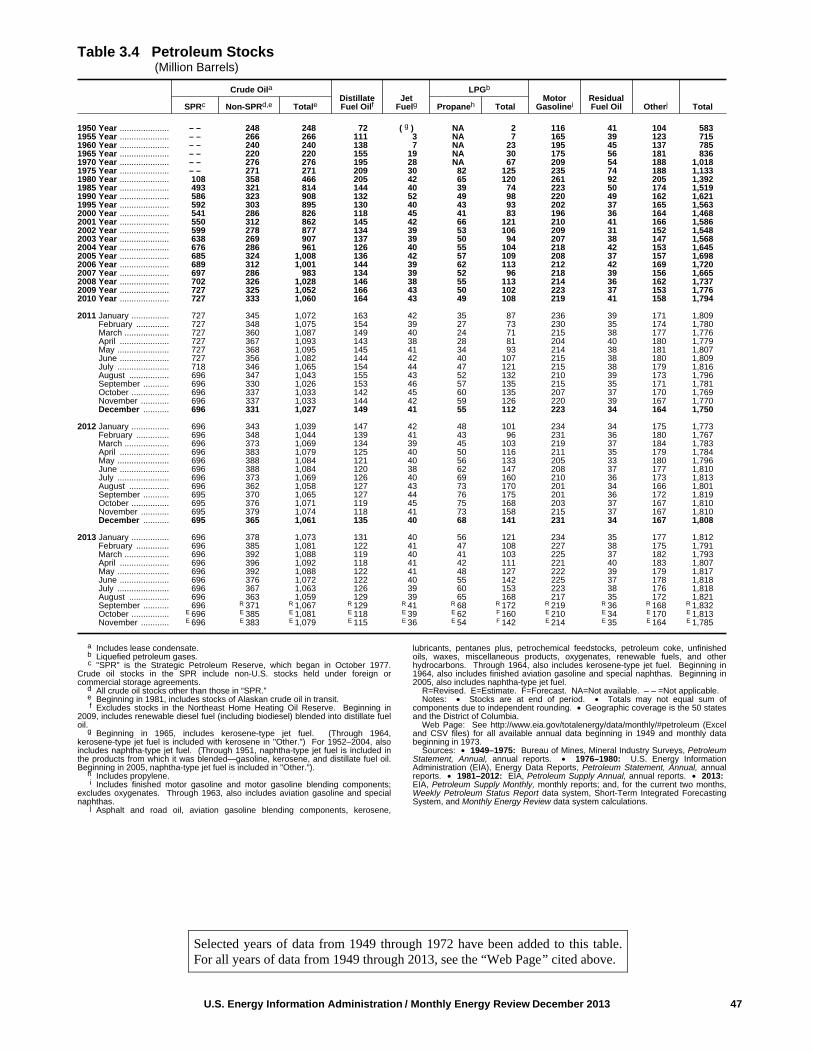
U.S. Energy Information Administration / Monthly Energy Review December 2013 47
Table 3.4 Petroleum Stocks (Million Barrels)
Crude OilaDistillateFuel Oilf
JetFuelg
LPGb
MotorGasolinei
ResidualFuel Oil Otherj TotalSPRc Non-SPRd,e Totale Propaneh Total
1950 Year ..................... – – 248 248 72 g( ) NA 2 116 41 104 5831955 Year ..................... – – 266 266 111 3 NA 7 165 39 123 7151960 Year ..................... – – 240 240 138 7 NA 23 195 45 137 7851965 Year ..................... – – 220 220 155 19 NA 30 175 56 181 8361970 Year ..................... – – 276 276 195 28 NA 67 209 54 188 1,0181975 Year ..................... – – 271 271 209 30 82 125 235 74 188 1,1331980 Year ..................... 108 358 466 205 42 65 120 261 92 205 1,3921985 Year ..................... 493 321 814 144 40 39 74 223 50 174 1,5191990 Year ..................... 586 323 908 132 52 49 98 220 49 162 1,6211995 Year ..................... 592 303 895 130 40 43 93 202 37 165 1,5632000 Year ..................... 541 286 826 118 45 41 83 196 36 164 1,4682001 Year ..................... 550 312 862 145 42 66 121 210 41 166 1,5862002 Year ..................... 599 278 877 134 39 53 106 209 31 152 1,5482003 Year ..................... 638 269 907 137 39 50 94 207 38 147 1,5682004 Year ..................... 676 286 961 126 40 55 104 218 42 153 1,6452005 Year ..................... 685 324 1,008 136 42 57 109 208 37 157 1,6982006 Year ..................... 689 312 1,001 144 39 62 113 212 42 169 1,7202007 Year ..................... 697 286 983 134 39 52 96 218 39 156 1,6652008 Year ..................... 702 326 1,028 146 38 55 113 214 36 162 1,7372009 Year ..................... 727 325 1,052 166 43 50 102 223 37 153 1,7762010 Year ..................... 727 333 1,060 164 43 49 108 219 41 158 1,794
2011 January ................ 727 345 1,072 163 42 35 87 236 39 171 1,809 February .............. 727 348 1,075 154 39 27 73 230 35 174 1,780 March ................... 727 360 1,087 149 40 24 71 215 38 177 1,776 April ..................... 727 367 1,093 143 38 28 81 204 40 180 1,779 May ...................... 727 368 1,095 145 41 34 93 214 38 181 1,807 June ..................... 727 356 1,082 144 42 40 107 215 38 180 1,809 July ...................... 718 346 1,065 154 44 47 121 215 38 179 1,816 August ................. 696 347 1,043 155 43 52 132 210 39 173 1,796 September ........... 696 330 1,026 153 46 57 135 215 35 171 1,781 October ................ 696 337 1,033 142 45 60 135 207 37 170 1,769 November ............ 696 337 1,033 144 42 59 126 220 39 167 1,770 December ........... 696 331 1,027 149 41 55 112 223 34 164 1,750
2012 January ................ 696 343 1,039 147 42 48 101 234 34 175 1,773 February .............. 696 348 1,044 139 41 43 96 231 36 180 1,767 March ................... 696 373 1,069 134 39 45 103 219 37 184 1,783 April ..................... 696 383 1,079 125 40 50 116 211 35 179 1,784 May ...................... 696 388 1,084 121 40 56 133 205 33 180 1,796 June ..................... 696 388 1,084 120 38 62 147 208 37 177 1,810 July ...................... 696 373 1,069 126 40 69 160 210 36 173 1,813 August ................. 696 362 1,058 127 43 73 170 201 34 166 1,801 September ........... 695 370 1,065 127 44 76 175 201 36 172 1,819 October ................ 695 376 1,071 119 45 75 168 203 37 167 1,810 November ............ 695 379 1,074 118 41 73 158 215 37 167 1,810 December ........... 695 365 1,061 135 40 68 141 231 34 167 1,808
2013 January ................ 696 378 1,073 131 40 56 121 234 35 177 1,812 February .............. 696 385 1,081 122 41 47 108 227 38 175 1,791 March ................... 696 392 1,088 119 40 41 103 225 37 182 1,793 April ..................... 696 396 1,092 118 41 42 111 221 40 183 1,807 May ...................... 696 392 1,088 122 41 48 127 222 39 179 1,817 June ..................... 696 376 1,072 122 40 55 142 225 37 178 1,818 July ...................... 696 367 1,063 126 39 60 153 223 38 176 1,818 August ................. 696 363 1,059 129 39 65 168 217 35 172 1,821 September ........... 696 R 371 R 1,067 R 129 R 41 R 68 R 172 R 219 R 36 R 168 R 1,832 October ................ E 696 E 385 E 1,081 E 118 E 39 E 62 F 160 E 210 E 34 E 170 E 1,813 November ............ E 696 E 383 E 1,079 E 115 E 36 E 54 F 142 E 214 E 35 E 164 E 1,785
a Includes lease condensate.b Liquefied petroleum gases.c "SPR" is the Strategic Petroleum Reserve, which began in October 1977.
Crude oil stocks in the SPR include non-U.S. stocks held under foreign orcommercial storage agreements.
d All crude oil stocks other than those in “SPR.”e Beginning in 1981, includes stocks of Alaskan crude oil in transit. f Excludes stocks in the Northeast Home Heating Oil Reserve. Beginning in
2009, includes renewable diesel fuel (including biodiesel) blended into distillate fueloil.
g Beginning in 1965, includes kerosene-type jet fuel. (Through 1964,kerosene-type jet fuel is included with kerosene in "Other.") For 1952–2004, alsoincludes naphtha-type jet fuel. (Through 1951, naphtha-type jet fuel is included inthe products from which it was blended—gasoline, kerosene, and distillate fuel oil.Beginning in 2005, naphtha-type jet fuel is included in "Other.").
h Includes propylene.i Includes finished motor gasoline and motor gasoline blending components;
excludes oxygenates. Through 1963, also includes aviation gasoline and specialnaphthas.
j Asphalt and road oil, aviation gasoline blending components, kerosene,
lubricants, pentanes plus, petrochemical feedstocks, petroleum coke, unfinishedoils, waxes, miscellaneous products, oxygenates, renewable fuels, and otherhydrocarbons. Through 1964, also includes kerosene-type jet fuel. Beginning in1964, also includes finished aviation gasoline and special naphthas. Beginning in2005, also includes naphtha-type jet fuel.
R=Revised. E=Estimate. F=Forecast. NA=Not available. – – =Not applicable. Notes: • Stocks are at end of period. • Totals may not equal sum of
components due to independent rounding. • Geographic coverage is the 50 statesand the District of Columbia.
Web Page: See http://www.eia.gov/totalenergy/data/monthly/#petroleum (Exceland CSV files) for all available annual data beginning in 1949 and monthly databeginning in 1973.
Sources: • 1949–1975: Bureau of Mines, Mineral Industry Surveys, PetroleumStatement, Annual, annual reports. • 1976–1980: U.S. Energy InformationAdministration (EIA), Energy Data Reports, Petroleum Statement, Annual, annualreports. • 1981–2012: EIA, Petroleum Supply Annual, annual reports. • 2013: EIA, Petroleum Supply Monthly, monthly reports; and, for the current two months,Weekly Petroleum Status Report data system, Short-Term Integrated ForecastingSystem, and Monthly Energy Review data system calculations.
Selected years of data from 1949 through 1972 have been added to this table.For all years of data from 1949 through 2013, see the “Web Page” cited above.
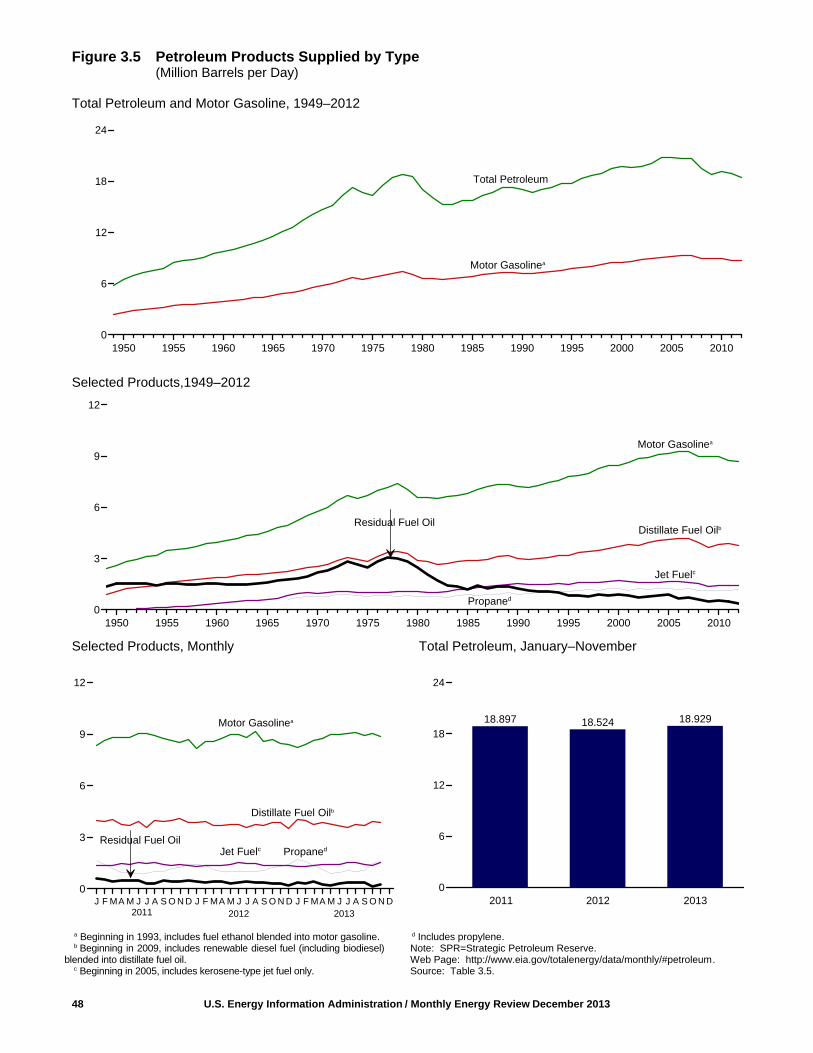
Figure 3.5 Petroleum Products Supplied by Type(Million Barrels per Day)
Total Petroleum and Motor Gasoline, 1949–2012
Selected Products,1949–2012
Selected Products, Monthly Total Petroleum, January–November
48 U.S. Energy Information Administration / Monthly Energy Review December 2013
1950 1955 1960 1965 1970 1975 1980 1985 1990 1995 2000 2005 20100
6
12
18
24
18.897 18.524 18.929
2011 2012 20130
6
12
18
24
Total Petroleum
Motor Gasolinea
1950 1955 1960 1965 1970 1975 1980 1985 1990 1995 2000 2005 20100
3
6
9
12
Motor Gasolinea
Distillate Fuel Oilb
Jet Fuelc
Propaned
Motor Gasolinea
J F MA M J J A S O N D J F MA M J J A S O N D J F MA M J J A S O N D0
3
6
9
12
Residual Fuel Oil
Distillate Fuel Oilb
Jet FuelcResidual Fuel Oil
a Beginning in 1993, includes fuel ethanol blended into motor gasoline.b Beginning in 2009, includes renewable diesel fuel (including biodiesel)
blended into distillate fuel oil. c Beginning in 2005, includes kerosene-type jet fuel only.
d Includes propylene. Note: SPR=Strategic Petroleum Reserve. Web Page: http://www.eia.gov/totalenergy/data/monthly/#petroleum.Source: Table 3.5.
20122011
Propaned
2013

U.S. Energy Information Administration / Monthly Energy Review December 2013 49
Table 3.5 Petroleum Products Supplied by Type (Thousand Barrels per Day)
Asphaltand
Road OilAviationGasoline
DistillateFuel Oilb
JetFuelc
Kero-sene
LPGa
Lubri-cants
MotorGasolinee
Petro-leumCoke
ResidualFuel Oil Otherf TotalPropaned Total
1950 Average .................. 180 108 1,082 c( ) 323 NA 234 106 2,616 41 1,517 250 6,4581955 Average .................. 254 192 1,592 154 320 NA 404 116 3,463 67 1,526 366 8,4551960 Average .................. 302 161 1,872 371 271 NA 621 117 3,969 149 1,529 435 9,7971965 Average .................. 368 120 2,126 602 267 NA 841 129 4,593 202 1,608 657 11,5121970 Average .................. 447 55 2,540 967 263 776 1,224 136 5,785 212 2,204 866 14,6971975 Average .................. 419 39 2,851 1,001 159 783 1,333 137 6,675 247 2,462 1,001 16,3221980 Average .................. 396 35 2,866 1,068 158 754 1,469 159 6,579 237 2,508 1,581 17,0561985 Average .................. 425 27 2,868 1,218 114 883 1,599 145 6,831 264 1,202 1,032 15,7261990 Average .................. 483 24 3,021 1,522 43 917 1,556 164 7,235 339 1,229 1,373 16,9881995 Average .................. 486 21 3,207 1,514 54 1,096 1,899 156 7,789 365 852 1,381 17,7252000 Average .................. 525 20 3,722 1,725 67 1,235 2,231 166 8,472 406 909 1,458 19,7012001 Average .................. 519 19 3,847 1,655 72 1,142 2,044 153 8,610 437 811 1,481 19,6492002 Average .................. 512 18 3,776 1,614 43 1,248 2,163 151 8,848 463 700 1,474 19,7612003 Average .................. 503 16 3,927 1,578 55 1,215 2,074 140 8,935 455 772 1,579 20,0342004 Average .................. 537 17 4,058 1,630 64 1,276 2,132 141 9,105 524 865 1,657 20,7312005 Average .................. 546 19 4,118 1,679 70 1,229 2,030 141 9,159 515 920 1,605 20,8022006 Average .................. 521 18 4,169 1,633 54 1,215 2,052 137 9,253 522 689 1,640 20,6872007 Average .................. 494 17 4,196 1,622 32 1,235 2,085 142 9,286 490 723 1,593 20,6802008 Average .................. 417 15 3,945 1,539 14 1,154 1,954 131 8,989 464 622 1,408 19,4982009 Average .................. 360 14 3,631 1,393 18 1,160 2,051 118 8,997 427 511 1,251 18,7712010 Average .................. 362 15 3,800 1,432 20 1,160 2,173 131 8,993 376 535 1,343 19,180
2011 January .................... 221 11 3,958 1,346 19 1,683 2,674 124 8,370 361 582 1,244 18,911 February .................. 248 14 3,913 1,352 50 1,439 2,462 121 8,604 293 566 1,185 18,809 March ....................... 282 18 4,045 1,385 26 1,209 2,315 150 8,799 348 462 1,405 19,234 April ......................... 311 10 3,755 1,457 8 952 1,981 136 8,796 355 477 1,301 18,588 May .......................... 357 18 3,699 1,424 (s) 945 2,018 122 8,817 414 468 1,082 18,420 June ......................... 454 17 3,947 1,540 4 905 1,956 125 9,067 379 479 1,213 19,182 July .......................... 465 19 3,564 1,473 9 921 1,967 119 9,031 368 329 1,363 18,705 August ..................... 545 18 4,009 1,554 5 990 2,036 137 8,925 461 347 1,311 19,349 September ............... 462 13 3,936 1,416 8 989 2,006 125 8,744 349 491 1,299 18,848 October .................... 423 16 4,003 1,384 2 1,162 2,179 102 8,649 395 405 1,239 18,796 November ................ 297 12 4,109 1,416 6 1,250 2,331 124 8,537 377 419 1,391 19,019 December ................ 187 10 3,853 1,353 12 1,399 2,534 111 8,683 229 519 1,228 18,721 Average .................. 355 15 3,899 1,425 12 1,153 2,204 125 8,753 361 461 1,272 18,882
2012 January .................... 201 12 3,861 1,308 6 1,436 2,497 121 8,190 403 452 1,253 18,304 February .................. 220 11 3,923 1,351 27 1,358 2,439 139 8,598 304 393 1,238 18,643 March ....................... 234 14 3,715 1,381 7 1,134 2,232 110 8,582 317 412 1,160 18,164 April ......................... 327 14 3,719 1,350 2 1,005 2,098 125 8,741 345 423 1,067 18,211 May .......................... 383 17 3,756 1,409 8 1,037 2,086 122 8,979 385 317 1,128 18,589 June ......................... 455 13 3,732 1,546 2 1,033 2,037 108 8,996 385 364 1,219 18,857 July .......................... 464 20 3,557 1,468 (s) 990 2,058 107 8,810 345 458 1,228 18,515 August ..................... 497 13 3,743 1,470 (s) 1,043 2,136 110 9,154 411 401 1,221 19,156 September ............... 445 15 3,674 1,378 4 1,095 2,149 106 8,561 374 376 1,010 18,092 October .................... 374 14 3,852 1,353 3 1,239 2,344 112 8,701 309 311 1,331 18,705 November ................ 282 10 3,848 1,381 3 1,277 2,390 121 8,483 378 323 1,309 18,528 December ................ 201 9 3,529 1,381 2 1,452 2,548 92 8,389 366 196 1,408 18,120 Average .................. 340 14 3,741 1,398 5 1,175 2,251 114 8,682 360 369 1,215 18,490
2013 January .................... 223 11 4,055 1,297 9 1,693 2,767 127 8,218 369 350 1,220 18,646 February .................. 212 8 3,975 1,320 7 1,597 2,753 125 8,412 281 304 1,259 18,659 March ....................... 237 12 3,772 1,369 15 1,376 2,498 126 8,616 306 431 1,095 18,476 April ......................... 295 12 3,871 1,414 5 1,148 2,245 110 8,766 293 284 1,259 18,553 May .......................... 294 15 3,772 1,416 2 924 2,038 129 8,983 360 215 1,327 18,551 June ......................... 410 15 3,667 1,431 2 979 2,025 141 8,965 402 303 1,362 18,724 July .......................... 451 16 3,568 1,519 1 1,052 2,222 118 9,056 357 362 1,376 19,046 August ..................... 464 14 3,727 1,525 3 1,036 2,144 118 9,088 415 403 1,191 19,091 September ............... R 466 R 11 R 3,713 R 1,419 4 R 1,093 R 2,217 R 125 R 8,918 R 393 R 349 R 1,502 R 19,116 October .................... F 359 F 12 E 3,922 E 1,386 RF 9 E 1,468 RF 2,435 RF 121 E 9,035 F 327 E 169 RE 1,594 E 19,370 November ................ F 252 F 9 E 3,883 E 1,535 F 28 E 1,594 F 2,517 F 107 E 8,895 F 377 E 239 E 2,142 E 19,984 11-Month Average E 334 E 12 E 3,810 E 1,422 E 8 E 1,267 E 2,348 E 122 E 8,816 E 353 E 310 E 1,393 E 18,929
2012 11-Month Average 353 14 3,761 1,400 6 1,149 2,224 116 8,709 360 385 1,197 18,5242011 11-Month Average 370 15 3,903 1,432 12 1,130 2,174 126 8,759 373 456 1,276 18,897
a Liquefied petroleum gases.b Beginning in 2009, includes renewable diesel fuel (including biodiesel)
blended into distillate fuel oil. c Beginning in 1957, includes kerosene-type jet fuel. For 1952–2004, also
includes naphtha-type jet fuel. (Through 1951, naphtha-type jet fuel is included inthe products from which it was blended—gasoline, kerosene, and distillate fuel oil.Beginning in 2005, naphtha-type jet fuel is included in "Other.").
d Includes propylene.e Finished motor gasoline. Through 1963, also includes special naphthas.
Beginning in 1993, also includes fuel ethanol blended into motor gasoline.f Pentanes plus, petrochemical feedstocks, still gas (refinery gas), waxes, and
miscellaneous products. Beginning in 1964, also includes special naphthas.Beginning in 1981, also includes negative barrels per day of distillate and residualfuel oil reclassified as unfinished oils, and other products (from both primary andsecondary supply) reclassified as gasoline blending components.Beginning in 1983, also includes crude oil burned as fuel. Beginning in 2005, alsoincludes naphtha-type jet fuel.
R=Revised. E=Estimate. F=Forecast. NA=Not available. (s)=Less than 500
barrels per day and greater than -500 barrels per day.Notes: • Petroleum products supplied is an approximation of petroleum
consumption and is synonymous with the term "petroleum consumption" in Tables3.7a–3.8c. See Note 1, "Petroleum Products Supplied and PetroleumConsumption," at end of section. • Totals may not equal sum of components dueto independent rounding. • Geographic coverage is the 50 states and the Districtof Columbia.
Web Page: See http://www.eia.gov/totalenergy/data/monthly/#petroleum (Exceland CSV files) for all available annual data beginning in 1949 and monthly databeginning in 1973.
Sources: • 1949–1975: Bureau of Mines, Mineral Industry Surveys, PetroleumStatement, Annual, annual reports. • 1976–1980: U.S. Energy InformationAdministration (EIA), Energy Data Reports, Petroleum Statement, Annual, annualreports. • 1981–2012: EIA, Petroleum Supply Annual, annual reports, andunpublished revisions. • 2013: EIA, Petroleum Supply Monthly, monthly reports;and, for the current two months, Weekly Petroleum Status Report data system,Short-Term Integrated Forecasting System, and Monthly Energy Review datasystem calculations.
Selected years of data from 1949 through 1972 have been added to this table.For all years of data from 1949 through 2013, see the “Web Page” cited above.

Figure 3.6 Heat Content of Petroleum Products Supplied by Type Total, 1949–2012
Petroleum Products Supplied as Share of Total Energy Consumption, 1949–2012
By Product, November 2013
50 U.S. Energy Information Administration / Monthly Energy Review December 2013
1950 1955 1960 1965 1970 1975 1980 1985 1990 1995 2000 2005 20100
10
20
30
40
50
Qua
drill
ion
Btu
1950 1955 1960 1965 1970 1975 1980 1985 1990 1995 2000 2005 20100
10
20
30
40
50
Per
cent
d
0.050 0.001
0.679
0.261
0.005
0.267
0.020
1.393
0.068 0.045
0.374
Asphalt Aviation Distillate Jet Kerosene Liquefied Lubricants Motor Petroleum Residual Other0.0
0.5
1.0
1.5
Qua
drill
ion
Btu
a Includes renewable diesel fuel (including biodiesel) blended into distil-late fuel oil.
b Includes kerosene-type jet fuel only.c Includes fuel ethanol blended into motor gasoline.
d All petroleum products not separately displayed.Web Page: http://www.eia.gov/totalenergy/data/monthly/#petroleum.Sources: Tables 1.1 and 3.6.
andRoad Oil
Gasoline Fuel OilCokeGasolinecPetroleumGases
Fuel Oila Fuelb

U.S. Energy Information Administration / Monthly Energy Review December 2013 51
Table 3.6 Heat Content of Petroleum Products Supplied by Type (Trillion Btu)
Asphaltand
Road OilAviationGasoline
DistillateFuel Oilb
JetFuelc
Kero-sene
LPGa
Lubri-cants
MotorGasolinee
Petro-leumCoke
ResidualFuel Oil Otherf TotalPropaned Total
1950 Total ...................... 435 199 2,300 c( ) 668 NA 343 236 5,015 90 3,482 546 13,3151955 Total ...................... 615 354 3,385 301 662 NA 592 258 6,640 147 3,502 798 17,2551960 Total ...................... 734 298 3,992 739 563 NA 912 259 7,631 328 3,517 947 19,9191965 Total ...................... 890 222 4,519 1,215 553 NA 1,232 286 8,806 444 3,691 1,390 23,2461970 Total ...................... 1,082 100 5,401 1,973 544 1,086 1,689 301 11,091 465 5,057 1,817 29,5211975 Total ...................... 1,014 71 6,061 2,047 329 1,097 1,807 304 12,798 542 5,649 2,109 32,7321980 Total ...................... 962 64 6,110 2,190 329 1,059 1,976 354 12,648 522 5,772 3,278 34,2051985 Total ...................... 1,029 50 6,098 2,497 236 1,236 2,103 322 13,098 582 2,759 2,152 30,9251990 Total ...................... 1,170 45 6,422 3,129 88 1,284 2,059 362 13,872 745 2,820 2,839 33,5521995 Total ...................... 1,178 40 6,818 3,132 112 1,534 2,512 346 14,825 802 1,955 2,837 34,5562000 Total ...................... 1,276 36 7,935 3,580 140 1,734 2,945 369 16,155 895 2,091 2,979 38,4022001 Total ...................... 1,257 35 8,179 3,426 150 1,598 2,697 338 16,373 961 1,861 3,056 38,3332002 Total ...................... 1,240 34 8,028 3,340 90 1,747 2,852 334 16,819 1,018 1,605 3,040 38,4002003 Total ...................... 1,220 30 8,349 3,265 113 1,701 2,748 309 16,981 1,000 1,772 3,264 39,0512004 Total ...................... 1,304 31 8,652 3,383 133 1,791 2,824 313 17,379 1,156 1,990 3,428 40,5932005 Total ...................... 1,323 35 8,755 3,475 144 1,721 2,682 312 17,444 1,133 2,111 3,318 40,7322006 Total ...................... 1,261 33 8,864 3,379 111 1,701 2,700 303 17,622 1,148 1,581 3,416 40,4202007 Total ...................... 1,197 32 8,921 3,358 67 1,729 2,733 313 17,689 1,077 1,659 3,313 40,3582008 Total ...................... 1,012 28 8,411 3,193 30 1,620 2,574 291 17,168 1,022 1,432 2,941 38,1012009 Total ...................... 873 27 7,720 2,883 36 1,624 2,664 262 17,135 938 1,173 2,611 36,3212010 Total ...................... 878 27 8,080 2,963 41 1,624 2,821 291 17,127 826 1,228 2,800 37,082
2011 January .................. 45 2 715 237 3 200 294 23 1,354 67 113 227 3,081 February ................ 46 2 638 215 8 155 247 20 1,257 49 100 190 2,772 March ..................... 58 3 730 243 5 144 253 28 1,423 65 90 250 3,149 April ....................... 62 2 656 248 1 110 209 25 1,377 64 90 224 2,958 May ........................ 73 3 668 250 (s) 112 219 23 1,426 77 91 194 3,025 June ....................... 90 3 690 262 1 104 206 23 1,419 68 90 209 3,061 July ........................ 96 3 644 259 2 110 213 22 1,461 69 64 245 3,077 August ................... 112 3 724 273 1 118 223 26 1,444 86 68 234 3,193 September ............. 92 2 688 241 1 114 211 23 1,369 63 93 224 3,006 October .................. 87 2 723 243 (s) 138 239 19 1,399 74 79 220 3,086 November .............. 59 2 718 241 1 144 247 23 1,336 68 79 239 3,013 December .............. 38 2 696 238 2 166 279 21 1,405 43 101 220 3,044 Total ...................... 859 27 8,289 2,950 25 1,614 2,839 276 16,670 794 1,058 2,676 36,464
2012 January .................. 41 2 697 230 1 171 274 23 1,325 75 88 221 2,978 February ................ 42 2 663 222 4 151 252 24 1,301 53 72 208 2,843 March ..................... 48 2 671 243 1 135 245 21 1,388 59 80 208 2,967 April ....................... 65 2 650 230 (s) 116 222 23 1,369 62 80 184 2,886 May ........................ 79 3 678 248 1 123 228 23 1,453 72 62 200 3,046 June ....................... 91 2 652 263 (s) 119 214 20 1,408 70 69 212 3,000 July ........................ 95 3 642 258 (s) 118 223 20 1,425 64 89 219 3,040 August ................... 102 2 676 258 (s) 124 233 21 1,481 77 78 217 3,145 September ............. 89 2 642 234 1 126 227 19 1,340 68 71 176 2,869 October .................. 77 2 696 238 1 147 258 21 1,408 58 61 236 3,054 November .............. 56 2 672 235 1 147 255 22 1,328 68 61 226 2,926 December .............. 41 1 637 243 (s) 173 282 17 1,357 68 38 252 2,937 Total ...................... 827 25 7,977 2,901 11 1,649 2,912 254 16,584 794 849 2,558 35,691
2013 January .................. 46 2 732 228 2 201 308 24 1,330 69 68 218 3,025 February ................ 39 1 648 210 1 171 277 21 1,229 47 53 204 2,732 March ..................... 49 2 681 241 3 164 278 24 1,394 57 84 195 3,006 April ....................... 59 2 676 241 1 132 240 20 1,372 53 54 217 2,934 May ........................ 61 2 681 249 (s) 110 223 24 1,453 67 42 236 3,039 June ....................... 82 2 641 243 (s) 113 214 26 1,404 73 57 233 2,975 July ........................ 93 3 644 267 (s) 125 244 22 1,465 67 71 249 3,125 August ................... 95 2 673 268 (s) 123 235 22 1,470 78 79 213 3,136 September ............. R 93 2 R 649 R 241 1 R 126 R 233 R 23 R 1,396 R 71 R 66 R 257 R 3,032 October .................. F 74 F 2 E 708 E 244 RF 2 E 175 RF 267 RF 23 E 1,462 F 61 E 33 RE 292 E 3,167 November .............. F 50 F 1 E 679 E 261 F 5 E 183 F 267 F 20 E 1,393 F 68 E 45 E 374 E 3,162 11-Month Total ..... E 740 E 21 E 7,413 E 2,692 E 14 E 1,623 E 2,784 E 248 E 15,368 E 711 E 651 E 2,690 E 33,333
2012 11-Month Total ..... 785 24 7,339 2,659 11 1,477 2,630 236 15,227 726 810 2,307 32,7542011 11-Month Total ..... 821 25 7,594 2,712 23 1,447 2,560 255 15,266 751 957 2,456 33,421
a Liquefied petroleum gases.b Beginning in 2009, includes renewable diesel fuel (including biodiesel)
blended into distillate fuel oil. c Beginning in 1957, includes kerosene-type jet fuel. For 1952–2004, also
includes naphtha-type jet fuel. (Through 1951, naphtha-type jet fuel is included inthe products from which it was blended—gasoline, kerosene, and distillate fuel oil.Beginning in 2005, naphtha-type jet fuel is included in "Other.").
d Includes propylene.e Finished motor gasoline. Through 1963, also includes special naphthas.
Beginning in 1993, also includes fuel ethanol blended into motor gasoline.f Pentanes plus, petrochemical feedstocks, still gas (refinery gas), waxes, and
miscellaneous products. Beginning in 1964, also includes special naphthas.Beginning in 1981, also includes negative barrels per day of distillate and residualfuel oil reclassified as unfinished oils, and other products (from both primary andsecondary supply) reclassified as gasoline blending components.
Beginning in 1983, also includes crude oil burned as fuel. Beginning in 2005, alsoincludes naphtha-type jet fuel.
R=Revised. E=Estimate. F=Forecast. NA=Not available. (s)=Less than 0.5trillion Btu and greater than -0.5 trillion Btu.
Notes: • Petroleum products supplied is an approximation of petroleumconsumption and is synonymous with the term "petroleum consumption" in Tables3.7a–3.8c. See Note 1, "Petroleum Products Supplied and PetroleumConsumption," at end of section. • Totals may not equal sum of components dueto independent rounding. • Geographic coverage is the 50 states and the Districtof Columbia.
Web Page: See http://www.eia.gov/totalenergy/data/monthly/#petroleum (Exceland CSV files) for all available annual data beginning in 1949 and monthly databeginning in 1973.
Sources: See end of section.
Selected years of data from 1949 through 1972 have been added to this table.For all years of data from 1949 through 2013, see the “Web Page” cited above.
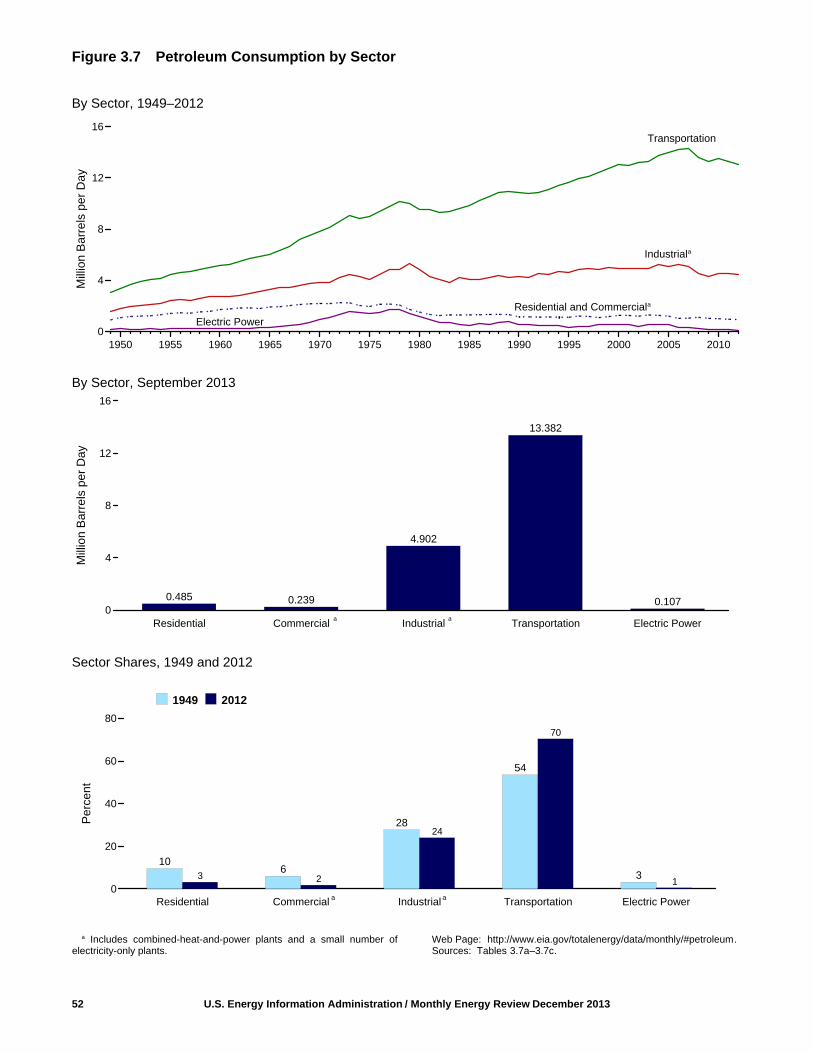
Figure 3.7 Petroleum Consumption by Sector
By Sector, 1949–2012
By Sector, September 2013
Sector Shares, 1949 and 2012
52 U.S. Energy Information Administration / Monthly Energy Review December 2013
Transportation
1950 1955 1960 1965 1970 1975 1980 1985 1990 1995 2000 2005 20100
4
8
12
16
Mill
ion
Bar
rels
per
Day
Industriala
Residential and Commerciala
Electric Power
a a
0.485 0.239
4.902
13.382
0.107
Residential Commercial Industrial Transportation Electric Power0
4
8
12
16
Mill
ion
Bar
rels
per
Day
a a
3 2
24
70
1
106
28
54
3
Residential Commercial Industrial Transportation Electric Power0
20
40
60
80
Per
cent
1949 2012
a Includes combined-heat-and-power plants and a small number ofelectricity-only plants.
Web Page: http://www.eia.gov/totalenergy/data/monthly/#petroleum. Sources: Tables 3.7a–3.7c.
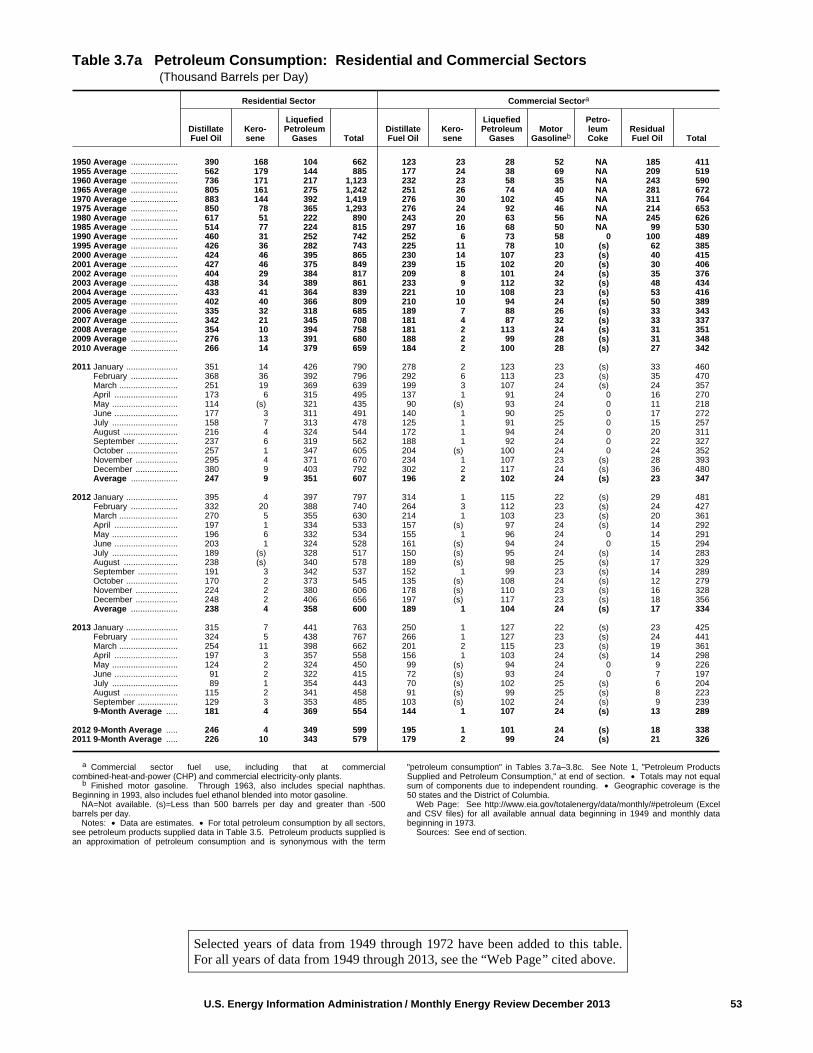
U.S. Energy Information Administration / Monthly Energy Review December 2013 53
Table 3.7a Petroleum Consumption: Residential and Commercial Sectors (Thousand Barrels per Day)
Residential Sector Commercial Sectora
DistillateFuel Oil
Kero-sene
LiquefiedPetroleum
Gases TotalDistillateFuel Oil
Kero-sene
LiquefiedPetroleum
GasesMotor
Gasolineb
Petro-leumCoke
ResidualFuel Oil Total
1950 Average .................... 390 168 104 662 123 23 28 52 NA 185 4111955 Average .................... 562 179 144 885 177 24 38 69 NA 209 5191960 Average .................... 736 171 217 1,123 232 23 58 35 NA 243 5901965 Average .................... 805 161 275 1,242 251 26 74 40 NA 281 6721970 Average .................... 883 144 392 1,419 276 30 102 45 NA 311 7641975 Average .................... 850 78 365 1,293 276 24 92 46 NA 214 6531980 Average .................... 617 51 222 890 243 20 63 56 NA 245 6261985 Average .................... 514 77 224 815 297 16 68 50 NA 99 5301990 Average .................... 460 31 252 742 252 6 73 58 0 100 4891995 Average .................... 426 36 282 743 225 11 78 10 (s) 62 3852000 Average .................... 424 46 395 865 230 14 107 23 (s) 40 4152001 Average .................... 427 46 375 849 239 15 102 20 (s) 30 4062002 Average .................... 404 29 384 817 209 8 101 24 (s) 35 3762003 Average .................... 438 34 389 861 233 9 112 32 (s) 48 4342004 Average .................... 433 41 364 839 221 10 108 23 (s) 53 4162005 Average .................... 402 40 366 809 210 10 94 24 (s) 50 3892006 Average .................... 335 32 318 685 189 7 88 26 (s) 33 3432007 Average .................... 342 21 345 708 181 4 87 32 (s) 33 3372008 Average .................... 354 10 394 758 181 2 113 24 (s) 31 3512009 Average .................... 276 13 391 680 188 2 99 28 (s) 31 3482010 Average .................... 266 14 379 659 184 2 100 28 (s) 27 342
2011 January ...................... 351 14 426 790 278 2 123 23 (s) 33 460 February .................... 368 36 392 796 292 6 113 23 (s) 35 470 March ......................... 251 19 369 639 199 3 107 24 (s) 24 357 April ........................... 173 6 315 495 137 1 91 24 0 16 270 May ............................ 114 (s) 321 435 90 (s) 93 24 0 11 218 June ........................... 177 3 311 491 140 1 90 25 0 17 272 July ............................ 158 7 313 478 125 1 91 25 0 15 257 August ....................... 216 4 324 544 172 1 94 24 0 20 311 September ................. 237 6 319 562 188 1 92 24 0 22 327 October ...................... 257 1 347 605 204 (s) 100 24 0 24 352 November .................. 295 4 371 670 234 1 107 23 (s) 28 393 December .................. 380 9 403 792 302 2 117 24 (s) 36 480 Average .................... 247 9 351 607 196 2 102 24 (s) 23 347
2012 January ...................... 395 4 397 797 314 1 115 22 (s) 29 481 February .................... 332 20 388 740 264 3 112 23 (s) 24 427 March ......................... 270 5 355 630 214 1 103 23 (s) 20 361 April ........................... 197 1 334 533 157 (s) 97 24 (s) 14 292 May ............................ 196 6 332 534 155 1 96 24 0 14 291 June ........................... 203 1 324 528 161 (s) 94 24 0 15 294 July ............................ 189 (s) 328 517 150 (s) 95 24 (s) 14 283 August ....................... 238 (s) 340 578 189 (s) 98 25 (s) 17 329 September ................. 191 3 342 537 152 1 99 23 (s) 14 289 October ...................... 170 2 373 545 135 (s) 108 24 (s) 12 279 November .................. 224 2 380 606 178 (s) 110 23 (s) 16 328 December .................. 248 2 406 656 197 (s) 117 23 (s) 18 356 Average .................... 238 4 358 600 189 1 104 24 (s) 17 334
2013 January ...................... 315 7 441 763 250 1 127 22 (s) 23 425 February .................... 324 5 438 767 266 1 127 23 (s) 24 441 March ......................... 254 11 398 662 201 2 115 23 (s) 19 361 April ........................... 197 3 357 558 156 1 103 24 (s) 14 298 May ............................ 124 2 324 450 99 (s) 94 24 0 9 226 June ........................... 91 2 322 415 72 (s) 93 24 0 7 197 July ............................ 89 1 354 443 70 (s) 102 25 (s) 6 204 August ....................... 115 2 341 458 91 (s) 99 25 (s) 8 223 September ................. 129 3 353 485 103 (s) 102 24 (s) 9 239 9-Month Average ..... 181 4 369 554 144 1 107 24 (s) 13 289
2012 9-Month Average ..... 246 4 349 599 195 1 101 24 (s) 18 3382011 9-Month Average ..... 226 10 343 579 179 2 99 24 (s) 21 326
a Commercial sector fuel use, including that at commercialcombined-heat-and-power (CHP) and commercial electricity-only plants.
b Finished motor gasoline. Through 1963, also includes special naphthas.Beginning in 1993, also includes fuel ethanol blended into motor gasoline.
NA=Not available. (s)=Less than 500 barrels per day and greater than -500barrels per day.
Notes: • Data are estimates. • For total petroleum consumption by all sectors,see petroleum products supplied data in Table 3.5. Petroleum products supplied isan approximation of petroleum consumption and is synonymous with the term
"petroleum consumption" in Tables 3.7a–3.8c. See Note 1, "Petroleum ProductsSupplied and Petroleum Consumption," at end of section. • Totals may not equalsum of components due to independent rounding. • Geographic coverage is the50 states and the District of Columbia.
Web Page: See http://www.eia.gov/totalenergy/data/monthly/#petroleum (Exceland CSV files) for all available annual data beginning in 1949 and monthly databeginning in 1973.
Sources: See end of section.
Selected years of data from 1949 through 1972 have been added to this table.For all years of data from 1949 through 2013, see the “Web Page” cited above.
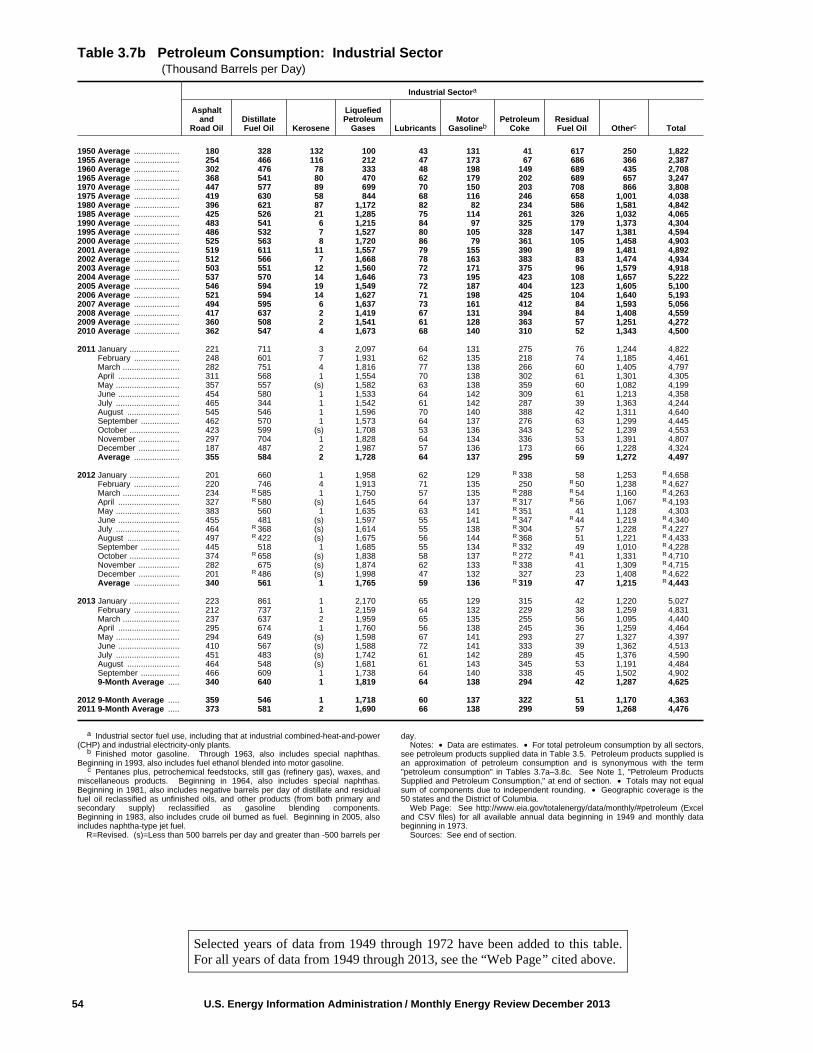
54 U.S. Energy Information Administration / Monthly Energy Review December 2013
Table 3.7b Petroleum Consumption: Industrial Sector (Thousand Barrels per Day)
Industrial Sectora
Asphaltand
Road OilDistillateFuel Oil Kerosene
LiquefiedPetroleum
Gases LubricantsMotor
GasolinebPetroleum
CokeResidualFuel Oil Otherc Total
1950 Average .................... 180 328 132 100 43 131 41 617 250 1,8221955 Average .................... 254 466 116 212 47 173 67 686 366 2,3871960 Average .................... 302 476 78 333 48 198 149 689 435 2,7081965 Average .................... 368 541 80 470 62 179 202 689 657 3,2471970 Average .................... 447 577 89 699 70 150 203 708 866 3,8081975 Average .................... 419 630 58 844 68 116 246 658 1,001 4,0381980 Average .................... 396 621 87 1,172 82 82 234 586 1,581 4,8421985 Average .................... 425 526 21 1,285 75 114 261 326 1,032 4,0651990 Average .................... 483 541 6 1,215 84 97 325 179 1,373 4,3041995 Average .................... 486 532 7 1,527 80 105 328 147 1,381 4,5942000 Average .................... 525 563 8 1,720 86 79 361 105 1,458 4,9032001 Average .................... 519 611 11 1,557 79 155 390 89 1,481 4,8922002 Average .................... 512 566 7 1,668 78 163 383 83 1,474 4,9342003 Average .................... 503 551 12 1,560 72 171 375 96 1,579 4,9182004 Average .................... 537 570 14 1,646 73 195 423 108 1,657 5,2222005 Average .................... 546 594 19 1,549 72 187 404 123 1,605 5,1002006 Average .................... 521 594 14 1,627 71 198 425 104 1,640 5,1932007 Average .................... 494 595 6 1,637 73 161 412 84 1,593 5,0562008 Average .................... 417 637 2 1,419 67 131 394 84 1,408 4,5592009 Average .................... 360 508 2 1,541 61 128 363 57 1,251 4,2722010 Average .................... 362 547 4 1,673 68 140 310 52 1,343 4,500
2011 January ...................... 221 711 3 2,097 64 131 275 76 1,244 4,822 February .................... 248 601 7 1,931 62 135 218 74 1,185 4,461 March ......................... 282 751 4 1,816 77 138 266 60 1,405 4,797 April ........................... 311 568 1 1,554 70 138 302 61 1,301 4,305 May ............................ 357 557 (s) 1,582 63 138 359 60 1,082 4,199 June ........................... 454 580 1 1,533 64 142 309 61 1,213 4,358 July ............................ 465 344 1 1,542 61 142 287 39 1,363 4,244 August ....................... 545 546 1 1,596 70 140 388 42 1,311 4,640 September ................. 462 570 1 1,573 64 137 276 63 1,299 4,445 October ...................... 423 599 (s) 1,708 53 136 343 52 1,239 4,553 November .................. 297 704 1 1,828 64 134 336 53 1,391 4,807 December .................. 187 487 2 1,987 57 136 173 66 1,228 4,324 Average .................... 355 584 2 1,728 64 137 295 59 1,272 4,497
2012 January ...................... 201 660 1 1,958 62 129 R 338 58 1,253 R 4,658 February .................... 220 746 4 1,913 71 135 250 R 50 1,238 R 4,627 March ......................... 234 R 585 1 1,750 57 135 R 288 R 54 1,160 R 4,263 April ........................... 327 R 580 (s) 1,645 64 137 R 317 R 56 1,067 R 4,193 May ............................ 383 560 1 1,635 63 141 R 351 41 1,128 4,303 June ........................... 455 481 (s) 1,597 55 141 R 347 R 44 1,219 R 4,340 July ............................ 464 R 368 (s) 1,614 55 138 R 304 57 1,228 R 4,227 August ....................... 497 R 422 (s) 1,675 56 144 R 368 51 1,221 R 4,433 September ................. 445 518 1 1,685 55 134 R 332 49 1,010 R 4,228 October ...................... 374 R 658 (s) 1,838 58 137 R 272 R 41 1,331 R 4,710 November .................. 282 675 (s) 1,874 62 133 R 338 41 1,309 R 4,715 December .................. 201 R 486 (s) 1,998 47 132 327 23 1,408 R 4,622 Average .................... 340 561 1 1,765 59 136 R 319 47 1,215 R 4,443
2013 January ...................... 223 861 1 2,170 65 129 315 42 1,220 5,027 February .................... 212 737 1 2,159 64 132 229 38 1,259 4,831 March ......................... 237 637 2 1,959 65 135 255 56 1,095 4,440 April ........................... 295 674 1 1,760 56 138 245 36 1,259 4,464 May ............................ 294 649 (s) 1,598 67 141 293 27 1,327 4,397 June ........................... 410 567 (s) 1,588 72 141 333 39 1,362 4,513 July ............................ 451 483 (s) 1,742 61 142 289 45 1,376 4,590 August ....................... 464 548 (s) 1,681 61 143 345 53 1,191 4,484 September ................. 466 609 1 1,738 64 140 338 45 1,502 4,902 9-Month Average ..... 340 640 1 1,819 64 138 294 42 1,287 4,625
2012 9-Month Average ..... 359 546 1 1,718 60 137 322 51 1,170 4,3632011 9-Month Average ..... 373 581 2 1,690 66 138 299 59 1,268 4,476
a Industrial sector fuel use, including that at industrial combined-heat-and-power(CHP) and industrial electricity-only plants.
b Finished motor gasoline. Through 1963, also includes special naphthas.Beginning in 1993, also includes fuel ethanol blended into motor gasoline.
c Pentanes plus, petrochemical feedstocks, still gas (refinery gas), waxes, andmiscellaneous products. Beginning in 1964, also includes special naphthas.Beginning in 1981, also includes negative barrels per day of distillate and residualfuel oil reclassified as unfinished oils, and other products (from both primary andsecondary supply) reclassified as gasoline blending components.Beginning in 1983, also includes crude oil burned as fuel. Beginning in 2005, alsoincludes naphtha-type jet fuel.
R=Revised. (s)=Less than 500 barrels per day and greater than -500 barrels per
day. Notes: • Data are estimates. • For total petroleum consumption by all sectors,
see petroleum products supplied data in Table 3.5. Petroleum products supplied isan approximation of petroleum consumption and is synonymous with the term"petroleum consumption" in Tables 3.7a–3.8c. See Note 1, "Petroleum ProductsSupplied and Petroleum Consumption," at end of section. • Totals may not equalsum of components due to independent rounding. • Geographic coverage is the50 states and the District of Columbia.
Web Page: See http://www.eia.gov/totalenergy/data/monthly/#petroleum (Exceland CSV files) for all available annual data beginning in 1949 and monthly databeginning in 1973.
Sources: See end of section.
Selected years of data from 1949 through 1972 have been added to this table.For all years of data from 1949 through 2013, see the “Web Page” cited above.

U.S. Energy Information Administration / Monthly Energy Review December 2013 55
Table 3.7c Petroleum Consumption: Transportation and Electric Power Sectors (Thousand Barrels per Day)
Transportation Sector Electric Power Sectora
AviationGasoline
DistillateFuel Oilb
JetFuelc
LiquefiedPetroleum
GasesLubri-cants
MotorGasolined
ResidualFuel Oil Total
DistillateFuel Oile
Petro-leumCoke
ResidualFuel Oilf Total
1950 Average .................... 108 226 c( ) 2 64 2,433 524 3,356 15 NA 192 2071955 Average .................... 192 372 154 9 70 3,221 440 4,458 15 NA 191 2061960 Average .................... 161 418 371 13 68 3,736 367 5,135 10 NA 231 2411965 Average .................... 120 514 602 23 67 4,374 336 6,036 14 NA 302 3161970 Average .................... 55 738 967 32 66 5,589 332 7,778 66 9 853 9281975 Average .................... 39 998 992 31 70 6,512 310 8,951 107 1 1,280 1,3881980 Average .................... 35 1,311 1,062 13 77 6,441 608 9,546 79 2 1,069 1,1511985 Average .................... 27 1,491 1,218 21 71 6,667 342 9,838 40 3 435 4781990 Average .................... 24 1,722 1,522 16 80 7,080 443 10,888 45 14 507 5661995 Average .................... 21 1,973 1,514 13 76 7,674 397 11,668 51 37 247 3342000 Average .................... 20 2,422 1,725 8 81 8,370 386 13,012 82 45 378 5052001 Average .................... 19 2,489 1,655 10 74 8,435 255 12,938 80 47 437 5642002 Average .................... 18 2,536 1,614 10 73 8,662 295 13,208 60 80 287 4272003 Average .................... 16 2,629 1,578 13 68 8,733 249 13,286 76 79 379 5342004 Average .................... 17 2,783 1,630 14 69 8,887 321 13,720 52 101 382 5352005 Average .................... 19 2,858 1,679 20 68 8,948 365 13,957 54 111 382 5472006 Average .................... 18 3,017 1,633 20 67 9,029 395 14,178 35 97 157 2892007 Average .................... 17 3,037 1,622 16 69 9,093 433 14,287 42 78 173 2932008 Average .................... 15 2,738 1,539 29 64 8,834 402 13,621 34 70 104 2092009 Average .................... 14 2,626 1,393 20 57 8,841 344 13,296 33 63 79 1752010 Average .................... 15 2,765 1,432 21 64 8,824 389 13,509 38 65 67 170
2011 January ...................... 11 2,575 1,346 29 60 8,216 417 12,655 43 85 56 184 February .................... 14 2,620 1,352 26 59 8,446 421 12,938 33 75 37 144 March ......................... 18 2,816 1,385 25 73 8,637 342 13,294 29 82 37 147 April ........................... 10 2,844 1,457 21 66 8,634 354 13,386 33 54 46 133 May ............................ 18 2,907 1,424 22 59 8,655 355 13,439 31 55 41 128 June ........................... 17 3,019 1,540 21 61 8,900 358 13,915 32 70 43 145 July ............................ 19 2,901 1,473 21 58 8,865 223 13,558 36 81 52 169 August ....................... 18 3,048 1,554 22 67 8,761 240 13,711 26 73 44 143 September ................. 13 2,918 1,416 21 61 8,583 372 13,383 24 73 33 130 October ...................... 16 2,921 1,384 23 50 8,489 297 13,180 24 52 32 107 November .................. 12 2,852 1,416 25 60 8,380 306 13,051 25 40 32 97 December .................. 10 2,656 1,353 27 54 8,523 386 13,010 28 56 31 116 Average .................... 15 2,841 1,425 24 61 8,592 338 13,295 30 66 41 137
2012 January ...................... 12 R 2,465 1,308 27 59 8,040 R 331 R 12,242 R 27 R 65 34 R 126 February .................... 11 R 2,558 1,351 26 67 8,439 291 12,743 23 55 27 105 March ......................... 14 2,626 1,381 24 54 8,424 310 R 12,832 R 20 R 29 29 R 77 April ........................... 14 R 2,762 1,350 22 61 8,580 R 325 R 13,114 R 23 R 28 28 R 79 May ............................ 17 R 2,817 1,409 22 59 8,814 233 R 13,371 R 28 R 34 R 28 91 June ........................... 13 2,859 1,546 22 52 8,830 R 260 R 13,583 29 R 38 45 R 112 July ............................ 20 R 2,819 1,468 22 52 8,648 R 335 R 13,365 R 30 R 41 R 52 R 123 August ....................... 13 2,871 1,470 23 53 8,985 R 295 13,711 R 24 R 43 R 38 R 105 September ................. 15 R 2,792 1,378 23 52 8,403 284 R 12,946 R 21 R 42 R 29 R 92 October ...................... 14 2,867 1,353 25 55 8,541 227 13,081 R 22 R 37 R 31 R 90 November .................. 10 2,747 1,381 25 59 8,326 R 237 R 12,786 24 R 40 28 R 92 December .................. 9 R 2,571 1,381 27 45 8,234 126 R 12,393 R 27 38 28 R 93 Average .................... 14 2,730 1,398 24 56 8,522 271 13,014 25 R 41 R 33 R 99
2013 January ...................... 11 2,595 1,297 30 62 8,067 234 12,296 32 54 50 136 February .................... 8 2,626 1,320 29 61 8,257 206 12,507 23 52 37 112 March ......................... 12 2,659 1,369 27 61 8,457 329 12,913 21 51 28 100 April ........................... 12 2,822 1,414 24 53 8,604 204 13,134 22 48 29 100 May ............................ 15 2,873 1,416 22 63 8,817 151 13,357 26 66 28 120 June ........................... 15 2,915 1,431 22 68 8,800 225 13,476 22 69 32 123 July ............................ 16 2,893 1,519 24 57 8,889 262 13,660 33 68 49 149 August ....................... 14 2,951 1,525 23 57 8,921 309 13,800 22 70 33 126 September ................. 11 2,850 1,419 24 61 8,754 265 13,382 22 55 30 107 9-Month Average ..... 13 2,799 1,413 25 60 8,621 243 13,175 25 59 35 119
2012 9-Month Average ..... 14 2,730 1,407 23 56 8,574 296 13,102 25 41 35 1012011 9-Month Average ..... 15 2,851 1,439 23 63 8,634 341 13,367 32 72 44 147
a Electricity-only and combined-heat-and-power (CHP) plants within the NAICS22 category whose primary business is to sell electricity, or electricity and heat, tothe public. Through 1988, data are for electric utilities only; beginning in 1989, dataare for electric utilities and independent power producers.
b Beginning in 2009, includes renewable diesel fuel (including biodiesel)blended into distillate fuel oil.
c Beginning in 1957, includes kerosene-type jet fuel. For 1952–2004, alsoincludes naphtha-type jet fuel. (Through 1951, naphtha-type jet fuel is included inthe products from which it was blended—gasoline, kerosene, and distillate fuel oil.Beginning in 2005, naphtha-type jet fuel is included in "Other" on Table 3.7b.)
d Finished motor gasoline. Through 1963, also includes special naphthas.Beginning in 1993, also includes fuel ethanol blended into motor gasoline.
e Fuel oil nos. 1, 2, and 4. Through 1979, data are for gas turbine and internalcombustion plant use of petroleum. Through 2000, electric utility data also includesmall amounts of kerosene and jet fuel.
f Fuel oil nos. 5 and 6. Through 1979, data are for steam plant use ofpetroleum. Through 2000, electric utility data also include a small amount of fuel oilno. 4.
R=Revised. NA=Not available. Notes: • Transportation sector data are estimates. • For total petroleum
consumption by all sectors, see petroleum products supplied data in Table 3.5.Petroleum products supplied is an approximation of petroleum consumption and issynonymous with the term "petroleum consumption" in Tables 3.7a–3.8c. See Note1, "Petroleum Products Supplied and Petroleum Consumption," at end of section.• Totals may not equal sum of components due to independent rounding.• Geographic coverage is the 50 states and the District of Columbia.
Web Page: See http://www.eia.gov/totalenergy/data/monthly/#petroleum (Exceland CSV files) for all available annual data beginning in 1949 and monthly databeginning in 1973.
Sources: See end of section.
Selected years of data from 1949 through 1972 have been added to this table.For all years of data from 1949 through 2013, see the “Web Page” cited above.
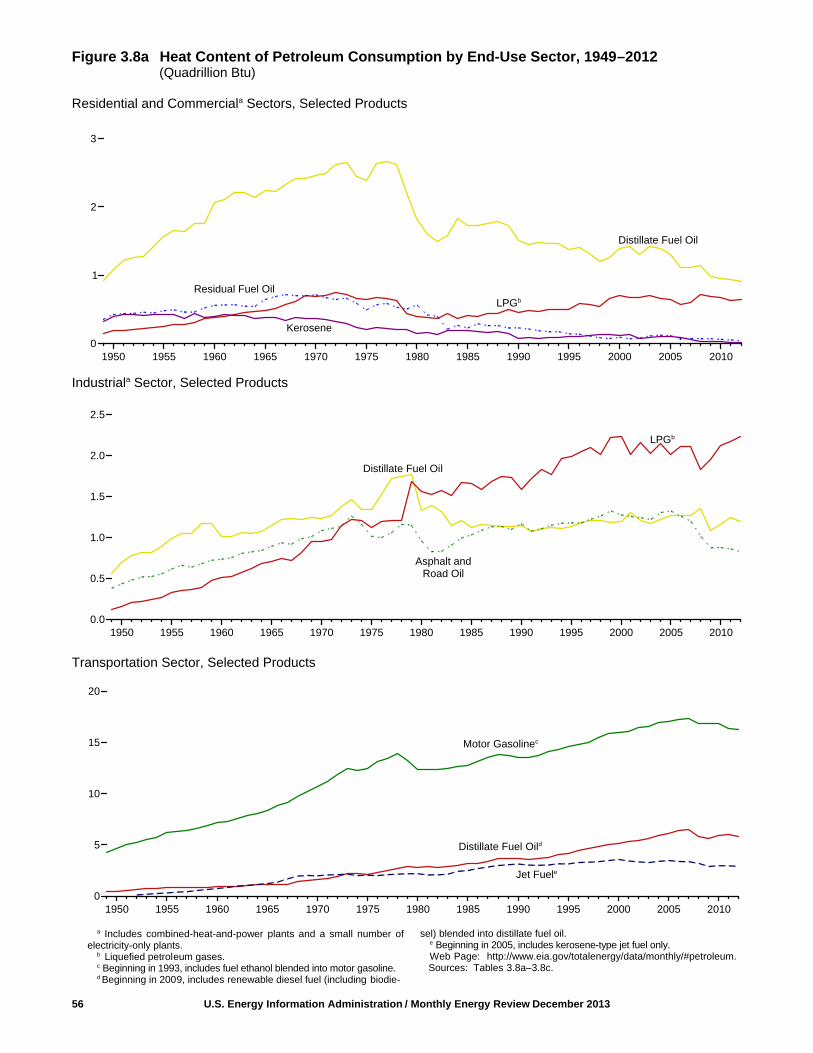
Figure 3.8a Heat Content of Petroleum Consumption by End-Use Sector, 1949–2012 (Quadrillion Btu)
Residential and Commerciala Sectors, Selected Products
Industriala Sector, Selected Products
Transportation Sector, Selected Products
56 U.S. Energy Information Administration / Monthly Energy Review December 2013
1950 1955 1960 1965 1970 1975 1980 1985 1990 1995 2000 2005 20100
1
2
3
Distillate Fuel Oil
LPGb
Kerosene
Residual Fuel Oil
LPGb
1950 1955 1960 1965 1970 1975 1980 1985 1990 1995 2000 2005 20100.0
0.5
1.0
1.5
2.0
2.5
Distillate Fuel Oil
Asphalt andRoad Oil
1950 1955 1960 1965 1970 1975 1980 1985 1990 1995 2000 2005 20100
5
10
15
20
Distillate Fuel Oild
Jet Fuele
Motor Gasolinec
a Includes combined-heat-and-power plants and a small number ofelectricity-only plants.
b Liquefied petroleum gases.c Beginning in 1993, includes fuel ethanol blended into motor gasoline.
d Beginning in 2009, includes renewable diesel fuel (including biodie-
sel) blended into distillate fuel oil.e Beginning in 2005, includes kerosene-type jet fuel only.Web Page: http://www.eia.gov/totalenergy/data/monthly/#petroleum.
Sources: Tables 3.8a–3.8c.
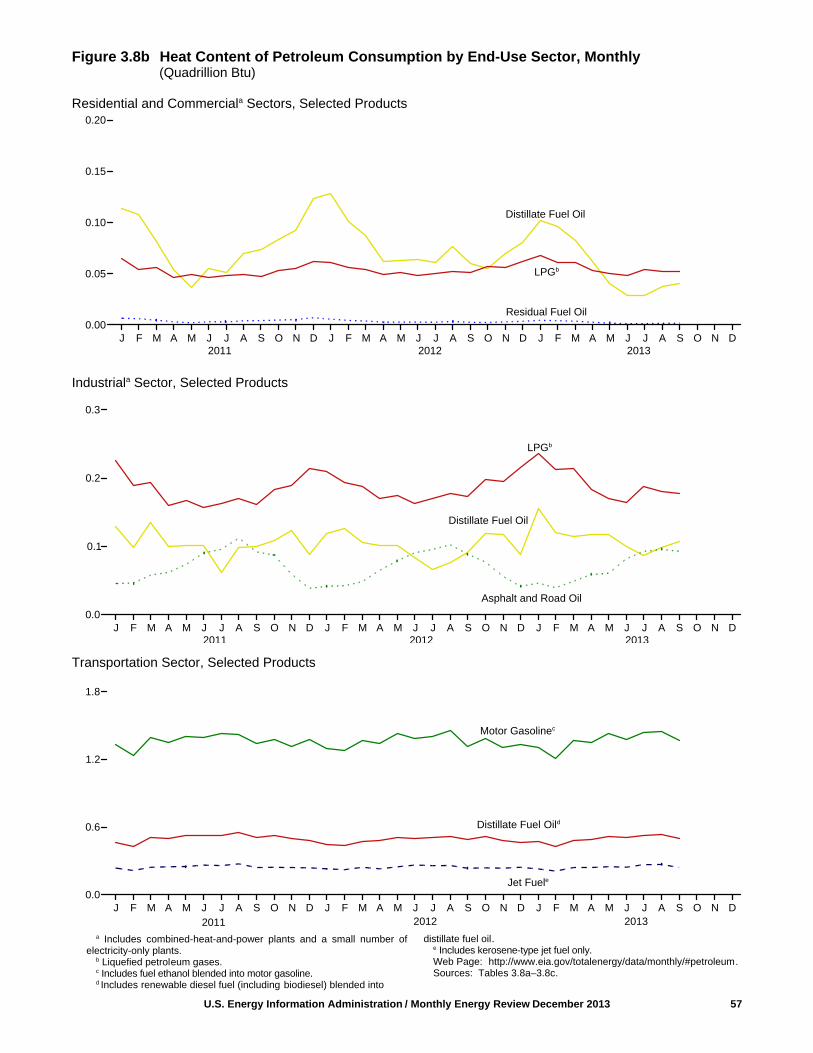
Figure 3.8b Heat Content of Petroleum Consumption by End-Use Sector, Monthly (Quadrillion Btu)
Residential and Commerciala Sectors, Selected Products
Industriala Sector, Selected Products
Transportation Sector, Selected Products
U.S. Energy Information Administration / Monthly Energy Review December 2013 57
J F M A M J J A S O N D J F M A M J J A S O N D J F M A M J J A S O N D0.00
0.05
0.10
0.15
0.20
Residual Fuel Oil
2012 2013
LPGb
Distillate Fuel Oil
J F M A M J J A S O N D J F M A M J J A S O N D J F M A M J J A S O N D0.0
0.1
0.2
0.3
LPGb
Distillate Fuel Oil
2011
Asphalt and Road Oil
2011 2012 2013
20122011 2013J F M A M J J A S O N D J F M A M J J A S O N D J F M A M J J A S O N D
0.0
0.6
1.2
1.8
Motor Gasolinec
Distillate Fuel Oild
Jet Fuele
a Includes combined-heat-and-power plants and a small number ofelectricity-only plants.
b Liquefied petroleum gases.c Includes fuel ethanol blended into motor gasoline.d Includes renewable diesel fuel (including biodiesel) blended into
distillate fuel oil.e Includes kerosene-type jet fuel only.Web Page: http://www.eia.gov/totalenergy/data/monthly/#petroleum.Sources: Tables 3.8a–3.8c.
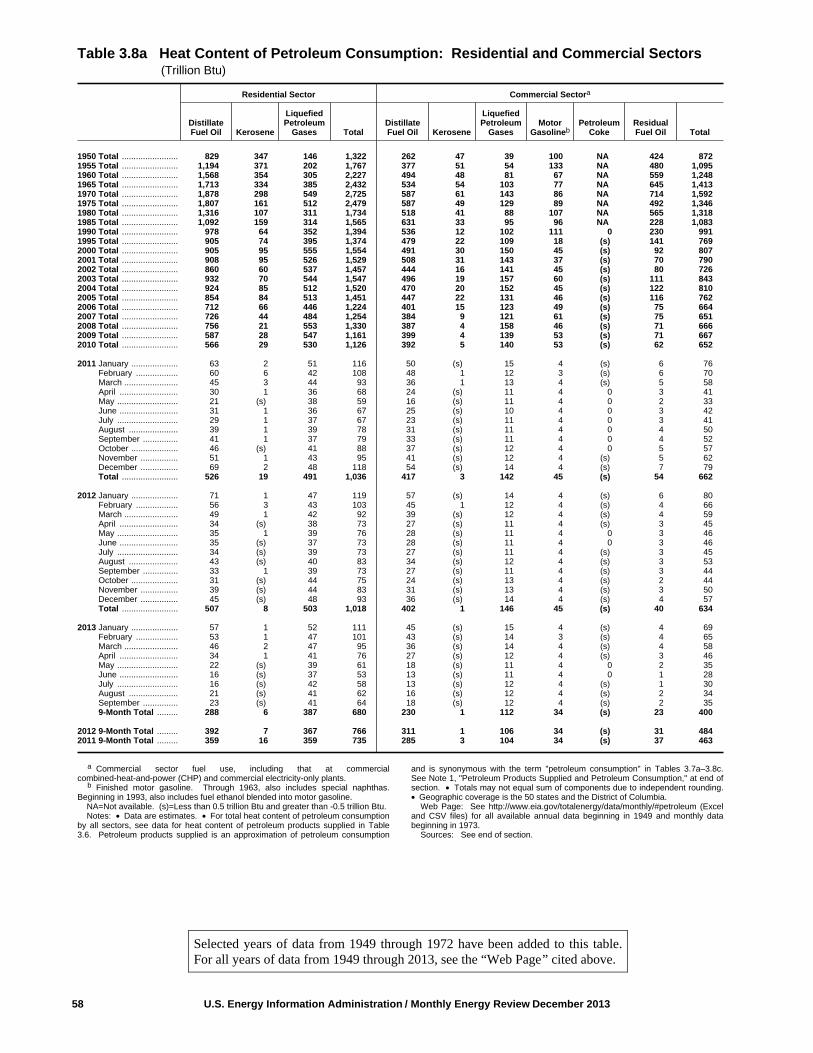
58 U.S. Energy Information Administration / Monthly Energy Review December 2013
Selected years of data from 1949 through 1972 have been added to this table.For all years of data from 1949 through 2013, see the “Web Page” cited above.
Table 3.8a Heat Content of Petroleum Consumption: Residential and Commercial Sectors (Trillion Btu)
Residential Sector Commercial Sectora
DistillateFuel Oil Kerosene
LiquefiedPetroleum
Gases TotalDistillateFuel Oil Kerosene
LiquefiedPetroleum
GasesMotor
GasolinebPetroleum
CokeResidualFuel Oil Total
1950 Total ........................ 829 347 146 1,322 262 47 39 100 NA 424 8721955 Total ........................ 1,194 371 202 1,767 377 51 54 133 NA 480 1,0951960 Total ........................ 1,568 354 305 2,227 494 48 81 67 NA 559 1,2481965 Total ........................ 1,713 334 385 2,432 534 54 103 77 NA 645 1,4131970 Total ........................ 1,878 298 549 2,725 587 61 143 86 NA 714 1,5921975 Total ........................ 1,807 161 512 2,479 587 49 129 89 NA 492 1,3461980 Total ........................ 1,316 107 311 1,734 518 41 88 107 NA 565 1,3181985 Total ........................ 1,092 159 314 1,565 631 33 95 96 NA 228 1,0831990 Total ........................ 978 64 352 1,394 536 12 102 111 0 230 9911995 Total ........................ 905 74 395 1,374 479 22 109 18 (s) 141 7692000 Total ........................ 905 95 555 1,554 491 30 150 45 (s) 92 8072001 Total ........................ 908 95 526 1,529 508 31 143 37 (s) 70 7902002 Total ........................ 860 60 537 1,457 444 16 141 45 (s) 80 7262003 Total ........................ 932 70 544 1,547 496 19 157 60 (s) 111 8432004 Total ........................ 924 85 512 1,520 470 20 152 45 (s) 122 8102005 Total ........................ 854 84 513 1,451 447 22 131 46 (s) 116 7622006 Total ........................ 712 66 446 1,224 401 15 123 49 (s) 75 6642007 Total ........................ 726 44 484 1,254 384 9 121 61 (s) 75 6512008 Total ........................ 756 21 553 1,330 387 4 158 46 (s) 71 6662009 Total ........................ 587 28 547 1,161 399 4 139 53 (s) 71 6672010 Total ........................ 566 29 530 1,126 392 5 140 53 (s) 62 652
2011 January .................... 63 2 51 116 50 (s) 15 4 (s) 6 76 February .................. 60 6 42 108 48 1 12 3 (s) 6 70 March ....................... 45 3 44 93 36 1 13 4 (s) 5 58 April ......................... 30 1 36 68 24 (s) 11 4 0 3 41 May .......................... 21 (s) 38 59 16 (s) 11 4 0 2 33 June ......................... 31 1 36 67 25 (s) 10 4 0 3 42 July .......................... 29 1 37 67 23 (s) 11 4 0 3 41 August ..................... 39 1 39 78 31 (s) 11 4 0 4 50 September ............... 41 1 37 79 33 (s) 11 4 0 4 52 October .................... 46 (s) 41 88 37 (s) 12 4 0 5 57 November ................ 51 1 43 95 41 (s) 12 4 (s) 5 62 December ................ 69 2 48 118 54 (s) 14 4 (s) 7 79 Total ........................ 526 19 491 1,036 417 3 142 45 (s) 54 662
2012 January .................... 71 1 47 119 57 (s) 14 4 (s) 6 80 February .................. 56 3 43 103 45 1 12 4 (s) 4 66 March ....................... 49 1 42 92 39 (s) 12 4 (s) 4 59 April ......................... 34 (s) 38 73 27 (s) 11 4 (s) 3 45 May .......................... 35 1 39 76 28 (s) 11 4 0 3 46 June ......................... 35 (s) 37 73 28 (s) 11 4 0 3 46 July .......................... 34 (s) 39 73 27 (s) 11 4 (s) 3 45 August ..................... 43 (s) 40 83 34 (s) 12 4 (s) 3 53 September ............... 33 1 39 73 27 (s) 11 4 (s) 3 44 October .................... 31 (s) 44 75 24 (s) 13 4 (s) 2 44 November ................ 39 (s) 44 83 31 (s) 13 4 (s) 3 50 December ................ 45 (s) 48 93 36 (s) 14 4 (s) 4 57 Total ........................ 507 8 503 1,018 402 1 146 45 (s) 40 634
2013 January .................... 57 1 52 111 45 (s) 15 4 (s) 4 69 February .................. 53 1 47 101 43 (s) 14 3 (s) 4 65 March ....................... 46 2 47 95 36 (s) 14 4 (s) 4 58 April ......................... 34 1 41 76 27 (s) 12 4 (s) 3 46 May .......................... 22 (s) 39 61 18 (s) 11 4 0 2 35 June ......................... 16 (s) 37 53 13 (s) 11 4 0 1 28 July .......................... 16 (s) 42 58 13 (s) 12 4 (s) 1 30 August ..................... 21 (s) 41 62 16 (s) 12 4 (s) 2 34 September ............... 23 (s) 41 64 18 (s) 12 4 (s) 2 35 9-Month Total ......... 288 6 387 680 230 1 112 34 (s) 23 400
2012 9-Month Total ......... 392 7 367 766 311 1 106 34 (s) 31 4842011 9-Month Total ......... 359 16 359 735 285 3 104 34 (s) 37 463
a Commercial sector fuel use, including that at commercialcombined-heat-and-power (CHP) and commercial electricity-only plants.
b Finished motor gasoline. Through 1963, also includes special naphthas.Beginning in 1993, also includes fuel ethanol blended into motor gasoline.
NA=Not available. (s)=Less than 0.5 trillion Btu and greater than -0.5 trillion Btu.Notes: • Data are estimates. • For total heat content of petroleum consumption
by all sectors, see data for heat content of petroleum products supplied in Table3.6. Petroleum products supplied is an approximation of petroleum consumption
and is synonymous with the term "petroleum consumption" in Tables 3.7a–3.8c.See Note 1, "Petroleum Products Supplied and Petroleum Consumption," at end ofsection. • Totals may not equal sum of components due to independent rounding.• Geographic coverage is the 50 states and the District of Columbia.
Web Page: See http://www.eia.gov/totalenergy/data/monthly/#petroleum (Exceland CSV files) for all available annual data beginning in 1949 and monthly databeginning in 1973.
Sources: See end of section.

U.S. Energy Information Administration / Monthly Energy Review December 2013 59
Selected years of data from 1949 through 1972 have been added to this table.For all years of data from 1949 through 2013, see the “Web Page” cited above.
Table 3.8b Heat Content of Petroleum Consumption: Industrial Sector (Trillion Btu)
Industrial Sectora
Asphaltand
Road OilDistillateFuel Oil Kerosene
LiquefiedPetroleum
Gases LubricantsMotor
GasolinebPetroleum
CokeResidualFuel Oil Otherc Total
1950 Total ........................ 435 698 274 156 94 251 90 1,416 546 3,9601955 Total ........................ 615 991 241 323 103 332 147 1,573 798 5,1231960 Total ........................ 734 1,016 161 507 107 381 328 1,584 947 5,7661965 Total ........................ 890 1,150 165 712 137 342 444 1,582 1,390 6,8131970 Total ........................ 1,082 1,226 185 953 155 288 446 1,624 1,817 7,7761975 Total ........................ 1,014 1,339 119 1,123 149 223 540 1,509 2,109 8,1271980 Total ........................ 962 1,324 181 1,559 182 158 516 1,349 3,278 9,5091985 Total ........................ 1,029 1,119 44 1,664 166 218 575 748 2,152 7,7141990 Total ........................ 1,170 1,150 12 1,582 186 185 714 411 2,839 8,2511995 Total ........................ 1,178 1,131 15 1,990 178 200 721 337 2,837 8,5882000 Total ........................ 1,276 1,200 16 2,228 190 150 796 241 2,979 9,0762001 Total ........................ 1,257 1,300 23 2,014 174 295 858 203 3,056 9,1812002 Total ........................ 1,240 1,204 14 2,160 172 309 842 190 3,040 9,1712003 Total ........................ 1,220 1,171 24 2,028 159 324 825 220 3,264 9,2352004 Total ........................ 1,304 1,214 28 2,141 161 372 934 249 3,428 9,8312005 Total ........................ 1,323 1,264 39 2,009 160 356 889 281 3,318 9,6402006 Total ........................ 1,261 1,263 30 2,104 156 376 934 239 3,416 9,7802007 Total ........................ 1,197 1,265 13 2,106 161 306 906 193 3,313 9,4612008 Total ........................ 1,012 1,359 4 1,823 150 250 868 194 2,941 8,6002009 Total ........................ 873 1,081 4 1,950 135 244 799 130 2,611 7,8262010 Total ........................ 878 1,163 7 2,121 149 267 682 120 2,800 8,188
2011 January .................... 45 128 (s) 226 12 21 51 15 227 726 February .................. 46 98 1 190 11 20 37 13 190 605 March ....................... 58 136 1 194 14 22 50 12 250 736 April ......................... 62 99 (s) 159 13 22 55 12 224 646 May .......................... 73 101 (s) 167 12 22 67 12 194 648 June ......................... 90 101 (s) 157 12 22 56 12 209 659 July .......................... 96 62 (s) 163 11 23 54 8 245 661 August ..................... 112 99 (s) 170 13 23 73 8 234 732 September ............... 92 100 (s) 161 12 21 50 12 224 672 October .................... 87 108 (s) 183 10 22 64 10 220 704 November ................ 59 123 (s) 189 12 21 61 10 239 714 December ................ 38 88 (s) 213 11 22 32 13 220 638 Total ........................ 859 1,242 4 2,173 142 262 648 135 2,676 8,141
2012 January .................... 41 119 (s) 210 12 21 63 11 221 699 February .................. 42 126 1 193 13 20 44 9 208 656 March ....................... 48 106 (s) 188 11 22 R 54 10 208 647 April ......................... 65 101 (s) 170 12 21 57 10 184 621 May .......................... 79 101 (s) 175 12 23 66 8 200 663 June ......................... 91 84 (s) 163 10 22 63 8 212 653 July .......................... 95 R 66 (s) 170 10 22 57 11 219 652 August ..................... 102 76 (s) 178 11 23 69 10 217 686 September ............... 89 R 91 (s) 173 10 21 60 9 176 628 October .................... 77 119 (s) 197 11 22 51 8 236 721 November ................ 56 118 (s) 195 11 21 61 8 226 R 696 December ................ 41 88 (s) 216 9 21 61 4 252 693 Total ........................ 827 R 1,195 2 2,229 130 260 R 704 108 2,558 R 8,014
2013 January .................... 46 156 (s) 237 12 21 59 8 218 756 February .................. 39 120 (s) 213 11 19 39 7 204 653 March ....................... 49 115 (s) 213 12 22 48 11 195 665 April ......................... 59 118 (s) 184 10 22 44 7 217 661 May .......................... 61 117 (s) 171 13 23 55 5 236 680 June ......................... 82 99 (s) 164 13 22 60 7 233 680 July .......................... 93 87 (s) 187 11 23 54 9 249 714 August ..................... 95 99 (s) 180 11 23 64 10 213 696 September ............... 93 106 (s) 178 12 22 61 8 257 738 9-Month Total ......... 616 1,017 1 1,726 106 196 484 73 2,024 6,243
2012 9-Month Total ......... 652 871 1 1,621 99 196 531 88 1,844 5,9042011 9-Month Total ......... 675 923 3 1,587 110 197 491 102 1,997 6,085
a Industrial sector fuel use, including that at industrial combined-heat-and-power(CHP) and industrial electricity-only plants.
b Finished motor gasoline. Through 1963, also includes special naphthas.Beginning in 1993, also includes fuel ethanol blended into motor gasoline.
c Pentanes plus, petrochemical feedstocks, still gas (refinery gas), waxes, andmiscellaneous products. Beginning in 1964, also includes special naphthas.Beginning in 1981, also includes negative barrels per day of distillate and residualfuel oil reclassified as unfinished oils, and other products (from both primary andsecondary supply) reclassified as gasoline blending components.Beginning in 1983, also includes crude oil burned as fuel. Beginning in 2005, alsoincludes naphtha-type jet fuel.
R=Revised. (s)=Less than 0.5 trillion Btu and greater than -0.5 trillion Btu.
Notes: • Data are estimates. • For total heat content of petroleum consumptionby all sectors, see data for heat content of petroleum products supplied in Table3.6. Petroleum products supplied is an approximation of petroleum consumptionand is synonymous with the term "petroleum consumption" in Tables 3.7a–3.8c.See Note 1, "Petroleum Products Supplied and Petroleum Consumption," at end ofsection. • Totals may not equal sum of components due to independent rounding.• Geographic coverage is the 50 states and the District of Columbia.
Web Page: See http://www.eia.gov/totalenergy/data/monthly/#petroleum (Exceland CSV files) for all available annual data beginning in 1949 and monthly databeginning in 1973.
Sources: See end of section.

60 U.S. Energy Information Administration / Monthly Energy Review December 2013
Table 3.8c Heat Content of Petroleum Consumption: Transportation and Electric Power Sectors (Trillion Btu)
Transportation Sector Electric Power Sectora
AviationGasoline
DistillateFuel Oilb
JetFuelc
LiquefiedPetroleum
GasesLubri-cants
MotorGasolined
ResidualFuel Oil Total
DistillateFuel Oile
Petro-leumCoke
ResidualFuel Oilf Total
1950 Total ........................ 199 480 c( ) 3 141 4,664 1,201 6,690 32 NA 440 4721955 Total ........................ 354 791 301 13 155 6,175 1,009 8,799 32 NA 439 4711960 Total ........................ 298 892 739 19 152 7,183 844 10,125 22 NA 530 5531965 Total ........................ 222 1,093 1,215 32 149 8,386 770 11,866 29 NA 693 7221970 Total ........................ 100 1,569 1,973 44 147 10,716 761 15,310 141 19 1,958 2,1171975 Total ........................ 71 2,121 2,029 43 155 12,485 711 17,615 226 2 2,937 3,1661980 Total ........................ 64 2,795 2,179 18 172 12,383 1,398 19,009 169 5 2,459 2,6341985 Total ........................ 50 3,170 2,497 30 156 12,784 786 19,472 85 7 998 1,0901990 Total ........................ 45 3,661 3,129 23 176 13,575 1,016 21,626 97 30 1,163 1,2891995 Total ........................ 40 4,195 3,132 18 168 14,607 911 23,070 108 81 566 7552000 Total ........................ 36 5,165 3,580 12 179 15,960 888 25,820 175 99 871 1,1442001 Total ........................ 35 5,292 3,426 14 164 16,041 586 25,557 171 103 1,003 1,2772002 Total ........................ 34 5,392 3,340 14 162 16,465 677 26,085 127 175 659 9612003 Total ........................ 30 5,590 3,265 18 150 16,597 571 26,222 161 175 869 1,2052004 Total ........................ 31 5,932 3,383 19 152 16,962 740 27,219 111 222 879 1,2122005 Total ........................ 35 6,076 3,475 28 151 17,043 837 27,645 115 243 876 1,2352006 Total ........................ 33 6,414 3,379 27 147 17,197 906 28,105 74 214 361 6482007 Total ........................ 32 6,457 3,358 22 152 17,321 994 28,335 89 171 397 6572008 Total ........................ 28 5,837 3,193 40 141 16,872 926 27,038 73 154 240 4682009 Total ........................ 27 5,583 2,883 28 127 16,838 791 26,277 70 139 181 3902010 Total ........................ 27 5,879 2,963 29 141 16,807 892 26,738 80 144 154 378
2011 January .................... 2 465 237 3 11 1,329 81 2,128 8 16 11 35 February .................. 2 427 215 3 10 1,234 74 1,965 5 13 6 24 March ....................... 3 509 243 3 14 1,397 67 2,235 5 15 7 28 April ......................... 2 497 248 2 12 1,352 67 2,179 6 10 9 24 May .......................... 3 525 250 3 11 1,400 69 2,261 6 10 8 24 June ......................... 3 528 262 2 11 1,393 67 2,266 6 13 8 26 July .......................... 3 524 259 2 11 1,434 43 2,276 7 15 10 32 August ..................... 3 550 273 3 13 1,417 47 2,306 5 14 9 27 September ............... 2 510 241 2 11 1,344 70 2,180 4 13 6 24 October .................... 2 527 243 3 9 1,373 58 2,216 4 10 6 20 November ................ 2 498 241 3 11 1,312 58 2,124 4 7 6 18 December ................ 2 480 238 3 10 1,379 75 2,186 5 11 6 22 Total ........................ 27 6,040 2,950 33 134 16,363 776 26,323 64 146 93 303
2012 January .................... 2 445 230 3 11 1,301 65 2,057 5 12 7 R 24 February .................. 2 432 222 3 12 1,277 53 2,001 4 10 5 18 March ....................... 2 474 243 3 10 1,363 60 2,155 R 4 R 5 6 15 April ......................... 2 R 483 230 3 11 1,343 61 2,133 4 5 5 R 14 May .......................... 3 509 248 3 11 1,426 45 2,244 5 6 6 17 June ......................... 2 500 263 2 10 1,382 49 2,208 5 7 9 20 July .......................... 3 509 258 3 10 1,399 65 2,247 5 R 8 10 23 August ..................... 2 518 258 3 10 1,454 57 2,303 4 8 R 7 R 20 September ............... 2 488 234 3 9 1,316 54 2,106 4 8 6 17 October .................... 2 518 238 3 10 1,382 44 2,197 4 7 6 17 November ................ 2 480 235 3 11 1,304 45 2,079 4 7 5 R 17 December ................ 1 R 464 243 3 8 1,332 25 2,077 R 5 7 R 6 R 18 Total ........................ 25 5,820 2,901 34 123 16,279 624 25,806 R 53 R 90 77 R 219
2013 January .................... 2 469 228 4 12 1,305 46 2,064 6 10 10 26 February .................. 1 428 210 3 10 1,207 36 1,895 4 9 6 19 March ....................... 2 480 241 3 11 1,368 64 2,170 4 9 6 19 April ......................... 2 493 241 3 10 1,347 38 2,134 4 9 6 18 May .......................... 2 519 249 3 12 1,427 29 2,240 5 12 5 23 June ......................... 2 509 243 2 12 1,378 42 2,190 4 13 6 22 July .......................... 3 522 267 3 11 1,438 51 2,295 6 13 9 28 August ..................... 2 533 268 3 11 1,443 60 2,320 4 13 7 24 September ............... 2 498 241 3 11 1,371 50 2,175 4 10 6 19 9-Month Total ......... 17 4,452 2,188 26 100 12,283 417 19,483 40 98 60 198
2012 9-Month Total ......... 20 4,358 2,186 25 94 12,261 510 19,453 40 68 60 1682011 9-Month Total ......... 21 4,534 2,228 24 104 12,299 586 19,796 51 118 75 244
a Electricity-only and combined-heat-and-power (CHP) plants within the NAICS22 category whose primary business is to sell electricity, or electricity and heat, tothe public. Through 1988, data are for electric utilities only; beginning in 1989, dataare for electric utilities and independent power producers.
b Beginning in 2009, includes renewable diesel fuel (including biodiesel)blended into distillate fuel oil.
c Beginning in 1957, includes kerosene-type jet fuel. For 1952–2004, alsoincludes naphtha-type jet fuel. (Through 1951, naphtha-type jet fuel is included inthe products from which it was blended—gasoline, kerosene, and distillate fuel oil.Beginning in 2005, naphtha-type jet fuel is included in "Other" on Table 3.8b.)
d Finished motor gasoline. Through 1963, also includes special naphthas.Beginning in 1993, also includes fuel ethanol blended into motor gasoline.
e Fuel oil nos. 1, 2, and 4. Through 1979, data are for gas turbine and internalcombustion plant use of petroleum. Through 2000, electric utility data also includesmall amounts of kerosene and jet fuel.
f Fuel oil nos. 5 and 6. Through 1979, data are for steam plant use of
petroleum. Through 2000, electric utility data also include a small amount of fuel oilno. 4.
R=Revised. NA=Not available. Notes: • Transportation sector data are estimates. • For total heat content of
petroleum consumption by all sectors, see data for heat content of petroleumproducts supplied in Table 3.6. Petroleum products supplied is an approximation ofpetroleum consumption and is synonymous with the term "petroleum consumption"in Tables 3.7a–3.8c. See Note 1, "Petroleum Products Supplied and PetroleumConsumption," at end of section. • Totals may not equal sum of components dueto independent rounding. • Geographic coverage is the 50 states and the Districtof Columbia.
Web Page: See http://www.eia.gov/totalenergy/data/monthly/#petroleum (Exceland CSV files) for all available annual data beginning in 1949 and monthly databeginning in 1973.
Sources: See end of section.
Selected years of data from 1949 through 1972 have been added to this table.For all years of data from 1949 through 2013, see the “Web Page” cited above.

Petroleum
Note 1. Petroleum Products Supplied and PetroleumConsumption. Total petroleum products supplied is thesum of the products supplied for each petroleum product,crude oil, unfinished oils, and gasoline blending compo-nents. For each of these except crude oil, product suppliedis calculated by adding refinery production, natural gasplant liquids production, new supply of other liquids,imports, and stock withdrawals, and subtracting stockadditions, refinery inputs, and exports. Crude oil productsupplied is the sum of crude oil burned on leases and atpipeline pump stations as reported on Form EIA-813,“Monthly Crude Oil Report.” Prior to 1983, crude oilburned on leases and used at pipeline pump stations wasreported as either distillate or residual fuel oil and wasincluded as product supplied for these products. Petro-leum product supplied (see Tables 3.5 and 3.6) is anapproximation of petroleum consumption and is synony-mous with the term “Petroleum Consumption” in Tables3.7a–3.8c.
Note 2. Petroleum Survey Respondents. The U.S.Energy Information Administration (EIA) uses a number ofsources and methods to maintain the survey respondent lists.On a regular basis, survey managers review such industrypublications as the Oil & Gas Journal and Oil Daily forinformation on facilities or companies starting up or closingdown operations. Those sources are augmented by articlesin newspapers, communications from respondents indicatingchanges in status, and information received from surveysystems.
To supplement routine frames maintenance and to providemore thorough coverage, a comprehensive frames investiga-tion is conducted every 3 years. This investigation results inthe reassessment and recompilation of the complete framefor each survey. The effort also includes the evaluation ofthe impact of potential frame changes on the historical timeseries of data from these respondents. The results of thisframe study are usually implemented in January to provide afull year under the same frame.
Note 3. Historical Petroleum Data. Detailed informationon petroleum data through 1993 can be found in Notes 1–6on pages 60 and 61 in the July 2013 Monthly Energy Review(MER) athttp://www.eia.gov/totalenergy/data/monthly/archive/00351307.pdf.The notes discuss:Note 1, “Petroleum Survey Respondents”: In 1993, EIAadded numerous companies that produce, blend, store, orimport oxygenates to the monthly surveys.Note 2, “Motor Gasoline”: In 1981, EIA expanded itsuniverse to include nonrefinery blenders and separatedblending components from finished motor gasoline as areporting category. In 1993, EIA made adjustments tofinished motor gasoline product supplied data to moreaccurately account for fuel ethanol and motor gasolineblending components blended into finished motor gasoline.
Note 3, “Distillate and Residual Fuel Oils”: In 1981, EIAeliminated the requirement to report crude oil in pipelines orburned on leases as either distillate or residual fuel oil.Note 4, “Petroleum New Stock Basis”: In 1975, 1979,1981, and 1983, EIA added numerous respondents to bulkterminal and pipeline surveys; in 1984, EIA made changesin the reporting of natural gas liquids; and in 1993, EIAchanged how it collected bulk terminal and pipeline stocksof oxygenates. These changes affected stocks reported andstock change calculations.Note 5, “Stocks of Alaskan Crude Oil”: In 1981, EIA beganto include data for stocks of Alaskan crude oil in transit.Note 6, “Petroleum Data Discrepancies”: In 1976, 1978,and 1979, there are some small discrepancies between datain the MER and the Petroleum Supply Annual.
Table 3.1 Sources
1949–1975: Bureau of Mines, Mineral Industry Surveys,
Petroleum Statement, Annual, annual reports. 1976–1980: U.S. Energy Information Administration(EIA), Energy Data Reports, Petroleum Statement, Annual,annual reports.
1981–2001: EIA, Petroleum Supply Annual (PSA), annualreports.2002 forward: EIA, PSA, annual reports, and unpublishedrevisions; Petroleum Supply Monthly, monthly reports;revisions to crude oil production, total field production, andadjustments (based on crude oil production data from: stategovernment agencies; U.S. Department of the Interior,Bureau of Safety and Environmental Enforcement, andpredecessor agencies; and Form EIA-182, “Domestic CrudeOil First Purchase Report”); and, for the current twomonths, Weekly Petroleum Status Report data system andMonthly Energy Review data system calculations.
Table 3.6 Sources
Asphalt and Road Oil, Aviation Gasoline, Distillate FuelOil, Kerosene, Propane, Lubricants, Petroleum Coke,and Residual Fuel OilProduct supplied data in thousand barrels per day for thesepetroleum products are from Table 3.5, and are converted totrillion Btu by multiplying by the appropriate heat contentfactors in Table A1.
Jet FuelProduct supplied data in thousand barrels per day forkerosene-type jet fuel and, through 2004, naphtha-type jetfuel are from the U.S. Energy Information Administration’s(EIA) Petroleum Supply Annual (PSA), Petroleum SupplyMonthly (PSM), and earlier publications (see sources forTable 3.5). These data are converted to trillion Btu by multi-plying by the appropriate heat content factors in Table A1.Total jet fuel product supplied is the sum of the data in trillionBtu for kerosene-type and naphtha-type jet fuel.
U.S. Energy Information Administration / Monthly Energy Review December 2013 61

Liquefied Petroleum Gases (LPG) TotalPrior to the current two months, product supplied data inthousand barrels per day for the component products ofLPG (ethane/ethylene, propane/propylene, normalbutane/butylene, and isobutane/isobutylene) are from thePSA, PSM, and earlier publications (see sources for Table3.5). These data are converted to trillion Btu by multiplyingby the appropriate heat content factors in Table A1. TotalLPG product supplied is the sum of the data in trillion Btufor the LPG component products.
For the current two months, product supplied data inthousand barrels per day for total LPG are from Table 3.5,and are converted to trillion Btu by multiplying by the LPGheat content factors in Table A3.
Motor Gasoline Product supplied data in thousand barrels per day for motorgasoline are from Table 3.5, and are converted to trillion Btuby multiplying by the motor gasoline heat content factors inTable A3.
Other Petroleum ProductsPrior to the current two months, product supplied data inthousand barrels per day for “other” petroleum productsare from the PSA, PSM, and earlier publications (seesources for Table 3.5). “Other” petroleum productsinclude pentanes plus, petrochemical feedstocks, specialnaphthas, still gas (refinery gas), waxes, and miscellane-ous products; beginning in 1981, also includes negativebarrels per day of distillate and residual fuel oil reclassi-fied as unfinished oils, and other products (from bothprimary and secondary supply) reclassified as gasolineblending components; beginning in 1983, also includescrude oil burned as fuel; and beginning in 2005, alsoincludes naphtha-type jet fuel. These data are convertedto trillion Btu by multiplying by the appropriate heatcontent factors in MER Table A1. Total “Other” petro-leum product supplied is the sum of the data in trillionBtu for the individual products.
For the current two months, total “Other” petroleumproducts supplied is calculated by first estimating totalpetroleum products supplied (product supplied data inthousand barrels per day for total petroleum from Table 3.5are converted to trillion Btu by multiplying by the totalpetroleum consumption heat content factor in Table A3),and then subtracting data in trillion Btu (from Table 3.6) forasphalt and road oil, aviation gasoline, distillate fuel oil, jetfuel, kerosene, total LPG, lubricants, motor gasoline, petro-leum coke, and residual fuel oil.
Total PetroleumTotal petroleum products supplied is the sum of the data intrillion Btu for the products (except “Propane”) shown inTable 3.6.
Tables 3.7a–3.7c Sources
Petroleum consumption data for 1949–1972 are from thefollowing sources: 1949–1959: Bureau of Mines, Mineral Industry Surveys,Petroleum Statement, Annual, annual reports, and U.S.Energy Information Administration (EIA) estimates.1960–1972: EIA, State Energy Data System.
Petroleum consumption data beginning in 1973 are derivedfrom data for “petroleum products supplied” from thefollowing sources:1973–1975: Bureau of Mines, Mineral Industry Surveys,Petroleum Statement Annual, annual reports.1976–1980: EIA, Energy Data Reports, Petroleum State-ment Annual, annual reports.1981–2012: EIA, Petroleum Statement Annual, annualreports, and unpublished revisions.2013: EIA, Petroleum Supply Monthly, monthly reports.
Beginning in 1973, energy-use allocation procedures byindividual product are as follows:
Asphalt and Road Oil All consumption of asphalt and road oil is assigned to theindustrial sector.
Aviation Gasoline All consumption of aviation gasoline is assigned to thetransportation sector.
Distillate Fuel Oil Distillate fuel oil consumption is assigned to the sectors asfollows:
Distillate Fuel Oil Consumed by the Electric PowerSector See sources for Table 7.4b. For 1973–1979, electric utilityconsumption of distillate fuel oil is assumed to be theamount of petroleum (minus small amounts of keroseneand kerosene-type jet fuel deliveries) consumed in gasturbine and internal combustion plants. For 1980–2000,electric utility consumption of distillate fuel oil is assumedto be the amount of light oil (fuel oil nos. 1 and 2, plussmall amounts of kerosene and jet fuel) consumed.
Distillate Fuel Oil Consumed by the End-Use Sectors,Annually The aggregate end-use amount is total distillate fuel oilsupplied minus the amount consumed by the electric powersector. The end-use total consumed annually is allocated tothe individual end-use sectors (residential, commercial,industrial, and transportation) in proportion to eachsector’s share of sales as reported in EIA's Fuel Oil andKerosene Sales (Sales) report series (DOE/EIA-0535),which is based primarily on data collected by FormEIA-821, “Annual Fuel Oil and Kerosene Sales Report”
62 U.S. Energy Information Administration / Monthly Energy Review December 2013
(previously Form EIA-172). Shares for the current year arebased on the most recent Sales report.
Following are notes on the individual sector groupings:
Beginning in 1979, the residential sector sales total isdirectly from the Sales reports. Through 1978, each year'ssales subtotal of the heating plus industrial category is splitinto residential, commercial, and industrial (includingfarm) in proportion to the 1979 shares.
Beginning in 1979, the commercial sector sales total isdirectly from the Sales reports. Through 1978, each year'ssales subtotal of the heating plus industrial category is splitinto residential, commercial, and industrial (including farm)in proportion to the 1979 shares.
Beginning in 1979, the industrial sector sales total is thesum of the sales for industrial, farm, oil company,off-highway diesel, and all other uses. Through 1978,each year's sales subtotal of the heating plus industrialcategory is split into residential, commercial, and indus-trial (including farm) in proportion to the 1979 shares,and this estimated industrial portion is added to oilcompany, off-highway diesel, and all other uses.
The transportation sector sales total is the sum of the salesfor railroad, vessel bunkering, on-highway diesel, andmilitary uses for all years.
Distillate Fuel Oil Consumed by the End-Use Sectors,Monthly Residential sector and commercial sector monthlyconsumption is estimated by allocating the annualestimates, which are described above, into the months inproportion to each month's share of the year's sales ofNo. 2 heating oil. (For each month of the current year,the residential and commercial consumption increasefrom the same month in the previous year is based on thepercent increase in that month’s No. 2 heating oil salesfrom the same month in the previous year.) The years’No. 2 heating oil sales totals are from the followingsources: for 1973–1980, the Ethyl Corporation, MonthlyReport of Heating Oil Sales; for 1981 and 1982, theAmerican Petroleum Institute, Monthly Report of HeatingOil Sales; and for 1983 forward, EIA, Form EIA-782A,"Refiners'/Gas Plant Operators' Monthly PetroleumProduct Sales Report," No. 2 Fuel Oil Sales to End Usersand for Resale.
The transportation highway use portion is allocated intothe months in proportion to each month's share of theyear's total sales for highway use as reported by theFederal Highway Administration's Table MF-25,"Private and Commercial Highway Use of Special Fuelsby Months." Beginning in 1994, the sales-for-highway-use data are no longer available as a monthly series; the1993 data are used for allocating succeeding year's totalsinto months.
A distillate fuel oil “balance” is calculated as total distillatefuel oil supplied minus the amount consumed by the electricpower sector, residential sector, commercial sector, and forhighway use.
Industrial sector monthly consumption is estimated bymultiplying each month’s distillate fuel oil “balance” by theannual industrial consumption share of the annual distillatefuel oil “balance.”
Total transportation sector monthly consumption isestimated as total distillate fuel oil supplied minus theamount consumed by the residential, commercial, industrial,and electric power sectors.
Jet Fuel Through 1982, small amounts of kerosene-type jet fuel wereconsumed by the electric power sector. Kerosene-type jetfuel deliveries to the electric power sector as reported onForm FERC-423 (formerly Form FPC-423) were used asestimates of this consumption. Through 2004, all remainingjet fuel (kerosene-type and naphtha-type) is assigned to thetransportation sector. Beginning in 2005, kerosene-type jetfuel is assigned to the transportation sector, while naphtha-type jet fuel is classified under “Other Petroleum Products,”which is assigned to the industrial sector.
Kerosene Kerosene product supplied is allocated to the individualend-use sectors (residential, commercial, and industrial)in proportion to each sector’s share of sales as reported inEIA's Fuel Oil and Kerosene Sales (Sales) report series(DOE/EIA-0535), which is based primarily on datacollected by Form EIA-821, “Annual Fuel Oil andKerosene Sales Report” (previously Form EIA-172).
Beginning in 1979, the residential sector sales total isdirectly from the Sales reports. Through 1978, each year'ssales category called "heating" is allocated to the residential,commercial, and industrial sectors in proportion to the 1979shares.
Beginning in 1979, the commercial sector sales total isdirectly from the Sales reports. Through 1978, each year'ssales category called "heating" is allocated to the residential,commercial, and industrial sectors in proportion to the 1979shares.
Beginning in 1979, the industrial sector sales total is thesum of the sales for industrial, farm, and all other uses.Through 1978, each year's sales category called "heating" isallocated to the residential, commercial and industrialsectors in proportion to the 1979 shares, and the estimatedindustrial (including farm) portion is added to all other uses.
Liquefied Petroleum Gases (LPG) The annual shares of LPG's total consumption that areestimated to be used by each sector are applied to eachmonth's total LPG consumption to create monthly sector
U.S. Energy Information Administration / Monthly Energy Review December 2013 63

consumption estimates. The annual sector shares arecalculated as described below.
Sales of LPG to the residential and commercial sectorscombined are converted from thousand gallons per year tothousand barrels per year and are assumed to be theannual consumption of LPG by the combined sectors.Beginning in 2003, residential sector LPG consumptionis assumed to equal propane retail sales, with the remain-der of the combined residential and commercial LPGconsumption being assigned to the commercial sector.Through 2002, residential sector LPG consumption is basedon the average of the state residential shares for 2003–2008,with the remainder of the combined residential and commercialLPG consumption being assigned to the commercial sector.
The quantity of LPG sold each year for consumption ininternal combustion engines is allocated between the trans-portation and industrial sectors on the basis of data forspecial fuels used on highways published by the U.S.Department of Transportation, Federal Highway Admin-istration, in Highway Statistics. The allocations of LPG soldfor internal combustion engine use to the transportationsector range from a low of 20 percent (in 2001) to a high of80 percent (in 2008).
LPG consumed annually by the industrial sector is estimatedas the difference between LPG total product supplied andthe sum of the estimated LPG consumption by the residen-tial, commercial, and transportation sectors. The industrialsector LPG consumption includes LPG used by chemicalplants as raw materials or solvents and used in the produc-tion of synthetic rubber; refinery fuel use; use as syntheticnatural gas feedstock and use in secondary recoveryprojects; all farm use; LPG sold to gas utility companies fordistribution through the mains; and a portion of the use ofLPG as an internal combustion engine fuel.
Sources of the annual sales data for creating annual energyshares are:
1973–1982: EIA's "Sales of Liquefied Petroleum Gasesand Ethane" reports, based primarily on data collected byForm EIA-174, “Sales of Liquefied Petroleum Gases.”1983: End-use consumption estimates for 1983 are basedon 1982 end-use consumption because the collection of dataunder Form EIA-174 was discontinued after data year 1982.1984 forward: American Petroleum Institute (API), "Salesof Natural Gas Liquids and Liquefied Refinery Gases,"which is based on an LPG sales survey jointly sponsoredby API, the Gas Processors Association, and the NationalLiquefied Petroleum Gas Association. EIA adjusts the datato remove quantities of pentanes plus and to estimatewithheld values.
Lubricants The consumption of lubricants is allocated to the industrialand transportation sectors for all months according to propor-tions developed from annual sales of lubricants to the two
sectors from U.S. Department of Commerce, Bureau of theCensus, Current Industrial Reports, "Sales of Lubricating andIndustrial Oils and Greases." The 1973 shares are applied to1973 and 1974; the 1975 shares are applied to 1975 and 1976;and the 1977 shares are applied to 1977 forward.
Motor Gasoline The total monthly consumption of motor gasoline isallocated to the sectors in proportion to aggregations ofannual sales categories created on the basis of the U.S.Department of Transportation, Federal Highway Admin-istration, Highway Statistics, Tables MF-21, MF-24, andMF-25, as follows:
Commercial sales are the sum of sales for publicnon-highway use and miscellaneous and unclassified uses.
Industrial sales are the sum of sales for agriculture,construction, and industrial and commercial use as classi-fied in the Highway Statistics.
Transportation sales are the sum of sales for highway use(minus the sales of special fuels, which are primarily dieselfuel and are accounted for in the transportation sector ofdistillate fuel) and sales for marine use.
Petroleum Coke Portions of petroleum coke are consumed by the electricpower sector (see sources for Table 7.4b) and the commercialsector (see sources for Table 7.4c). The remaining petroleumcoke is assigned to the industrial sector.
Residual Fuel Oil Residual fuel oil consumption is assigned to the sectors asfollows:
Residual Fuel Oil Consumed by the Electric PowerSector See sources for Table 7.4b. For 1973–1979, electric utilityconsumption of residual fuel oil is assumed to be theamount of petroleum consumed in steam-electric powerplants. For 1980–2000, electric utility consumption ofresidual fuel oil is assumed to be the amount of heavy oil(fuel oil nos. 4, 5, and 6) consumed.
Residual Fuel Oil Consumed by the End-Use Sectors,Annually The aggregate end-use amount is total residual fuel oilsupplied minus the amount consumed by the electricpower sector. The end-use total consumed annually isallocated to the individual end-use sectors (commercial,industrial, and transportation) in proportion to eachsector’s share of sales as reported in EIA’s Fuel Oil andKerosene Sales (Sales) report series (DOE/EIA-535),which is based primarily on data collected by FormEIA-821, “Annual Fuel Oil and Kerosene Sales Report”(previously Form EIA-172). Shares for the current yearare based on the most recent Sales report.
64 U.S. Energy Information Administration / Monthly Energy Review December 2013

Following are notes on the individual sector groupings:
Beginning in 1979, commercial sales data are directlyfrom the Sales reports. Through 1978, each year's salessubtotal of the heating plus industrial category isallocated to the commercial and industrial sectors inproportion to the 1979 shares.
Beginning in 1979, industrial sales data are the sum ofsales for industrial, oil company, and all other uses.Through 1978, each year's sales subtotal of the heatingplus industrial category is allocated to the commercialand industrial sectors in proportion to the 1979 shares,and the estimated industrial portion is added to oilcompany and all other uses.
Transportation sales are the sum of sales for railroad,vessel bunkering, and military uses for all years.
Residual Fuel Oil Consumed by the End-Use Sectors,Monthly Commercial sector monthly consumption is estimated byallocating the annual estimates, which are describedabove, into the months in proportion to each month'sshare of the year's sales of No. 2 heating oil. (For each monthof the current year, the consumption increase from the samemonth in the previous year is based on the percent increase inthat month’s No. 2 heating oil sales from the same month inthe previous year.) The years' No. 2 heating oil sales totalsare from the following sources: for 1973–1980, the EthylCorporation, Monthly Report of Heating Oil Sales; for 1981and 1982, the American Petroleum Institute, Monthly Reportof Heating Oil Sales; and for 1983 forward, EIA, FormEIA-782A, "Refiners'/Gas Plant Operators' Monthly Petro-leum Product Sales Report," No. 2 Fuel Oil Sales to EndUsers and for Resale.
A residual fuel oil “balance” is calculated as total residualfuel oil supplied minus the amount consumed by theelectric power sector, commercial sector, and by industrialcombined-heat-and-power plants (see sources for Table7.4c).
Transportation sector monthly consumption is estimated bymultiplying each month’s residual fuel oil “balance” by theannual transportation consumption share of the annual resid-ual fuel oil “balance.”
Total industrial sector monthly consumption is estimated astotal residual fuel oil supplied minus the amount consumed bythe commercial, transportation, and electric power sectors.
Other Petroleum Products Consumption of all remaining petroleum products isassigned to the industrial sector. Other petroleumproducts include pentanes plus, petrochemical feedstocks,
special naphthas, still gas (refinery gas), waxes, andmiscellaneous products. Beginning in 1981, also includesnegative barrels per day of distillate and residual fuel oilreclassified as unfinished oils, and other products (fromboth primary and secondary supply) reclassified asgasoline blending components. Beginning in 1983, alsoincludes crude oil burned as fuel. Beginning in 2005, alsoincludes naphtha-type jet fuel.
Table 3.8a Sources
Distillate Fuel Oil, Kerosene, Petroleum Coke, andResidual Fuel Oil Residential and/or commercial sector consumption data inthousand barrels per day for these petroleum products arefrom Table 3.7a, and are converted to trillion Btu bymultiplying by the appropriate heat content factors inTable A1.
Liquefied Petroleum Gases (LPG) Residential and commercial sector consumption data inthousand barrels per day for LPG are from Table 3.7a, andare converted to trillion Btu by multiplying by the propaneheat content factor in Table A1.
Motor Gasoline Commercial sector consumption data in thousand barrels perday for motor gasoline are from Table 3.7a, and areconverted to trillion Btu by multiplying by the motorgasoline heat content factors in Table A3.
Total PetroleumResidential sector total petroleum consumption is the sum ofthe data in trillion Btu for the petroleum products shownunder “Residential Sector” in Table 3.8a. Commercialsector total petroleum consumption is the sum of the data intrillion Btu for the petroleum products shown under“Commercial Sector” in Table 3.8a.
Table 3.8b Sources
Asphalt and Road Oil, Distillate Fuel Oil, Kerosene,Lubricants, Petroleum Coke, and Residual Fuel OilIndustrial sector consumption data in thousand barrels perday for these petroleum products are from Table 3.7b, andare converted to trillion Btu by multiplying by the appropri-ate heat content factors in Table A1.
Liquefied Petroleum Gases (LPG) Industrial sector consumption data for LPG are calculatedby subtracting LPG consumption data in trillion Btu forthe residential (Table 3.8a), commercial (Table 3.8a), andtransportation (Table 3.8c) sectors from total LPGconsumption (Table 3.6).
U.S. Energy Information Administration / Monthly Energy Review December 2013 65

Motor GasolineIndustrial sector consumption data in thousand barrels perday for motor gasoline are from Table 3.7b, and areconverted to trillion Btu by multiplying by the motorgasoline heat content factors in Table A3.
Other Petroleum Products Industrial sector “Other” petroleum data are equal to the“Other” petroleum data in Table 3.6.
Total PetroleumIndustrial sector total petroleum consumption is the sum ofthe data in trillion Btu for the petroleum products shown in Table 3.8b.
Table 3.8c Sources
Aviation Gasoline, Distillate Fuel Oil, Lubricants, Petro-leum Coke, and Residual Fuel Oil Transportation and/or electric power sector consumptiondata in thousand barrels per day for these petroleumproducts are from Table 3.7c, and are converted to trillionBtu by multiplying by the appropriate heat content factors inTable A1.
Jet Fuel Transportation sector consumption data in thousand barrels
per day for kerosene-type jet fuel and, through 2004,naphtha-type jet fuel (see sources for Table 3.7c) areconverted to trillion Btu by multiplying by the appropriateheat content factors in Table A1. Total transportation sectorjet fuel consumption is the sum of the data in trillion Btu forkerosene-type and naphtha-type jet fuel.
Liquefied Petroleum Gases (LPG) Transportation sector consumption data in thousand barrelsper day for LPG are from Table 3.7c, and are converted totrillion Btu by multiplying by the propane heat contentfactor in Table A1.
Motor Gasoline Transportation sector consumption data in thousand barrelsper day for motor gasoline are from Table 3.7c, and areconverted to trillion Btu by multiplying by the motorgasoline heat content factors in Table A3.
Total Petroleum Transportation sector total petroleum consumption is thesum of the data in trillion Btu for the petroleum productsshown under “Transportation Sector” in Table 3.8c. Electricpower sector total petroleum consumption is the sum of thedata in trillion Btu for the petroleum products shown under“Electric Power Sector” in Table 3.8c.
66 U.S. Energy Information Administration / Monthly Energy Review December 2013

Crude Oil and Natural Gas
Resource Development
.
4. Natural Gas
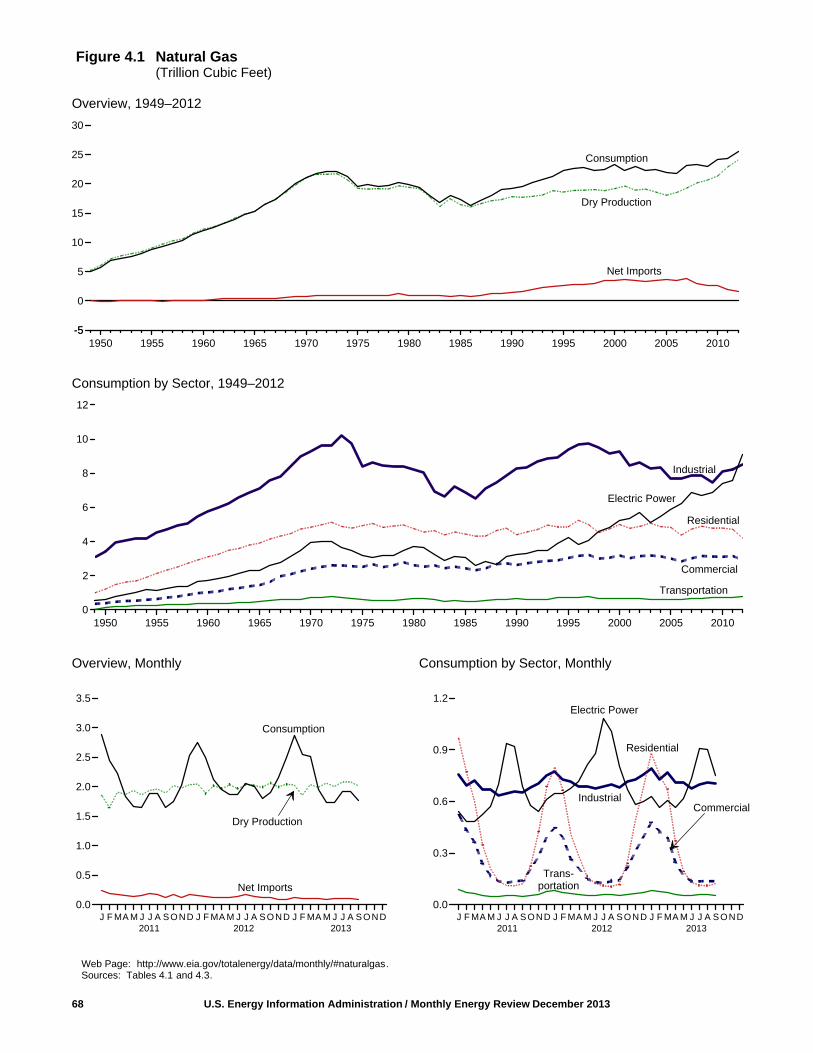
Figure 4.1 Natural Gas(Trillion Cubic Feet)
Overview, 1949–2012
Consumption by Sector, 1949–2012
Overview, Monthly Consumption by Sector, Monthly
Web Page: http://www.eia.gov/totalenergy/data/monthly/#naturalgas.Sources: Tables 4.1 and 4.3.
68 U.S. Energy Information Administration / Monthly Energy Review December 2013
Commercial
Electric Power
Industrial
Industrial
Trans-portation
Transportation
1950 1955 1960 1965 1970 1975 1980 1985 1990 1995 2000 2005 2010-5
0
5
10
15
20
25
30
-5
J F MA M J J A SOND J F MA M J J A SOND J F MA M J J A SOND0.0
0.5
1.0
1.5
2.0
2.5
3.0
3.5
Consumption
Dry Production
Net Imports
Consumption
Dry Production
Net Imports
2011 2012 2013
1950 1955 1960 1965 1970 1975 1980 1985 1990 1995 2000 2005 20100
2
4
6
8
10
12
Residential
Electric Power
Residential
2011 2012 2013
Commercial
J F MA M J J A SOND J F MA M J J A SOND J F MA M J J A SOND0.0
0.3
0.6
0.9
1.2
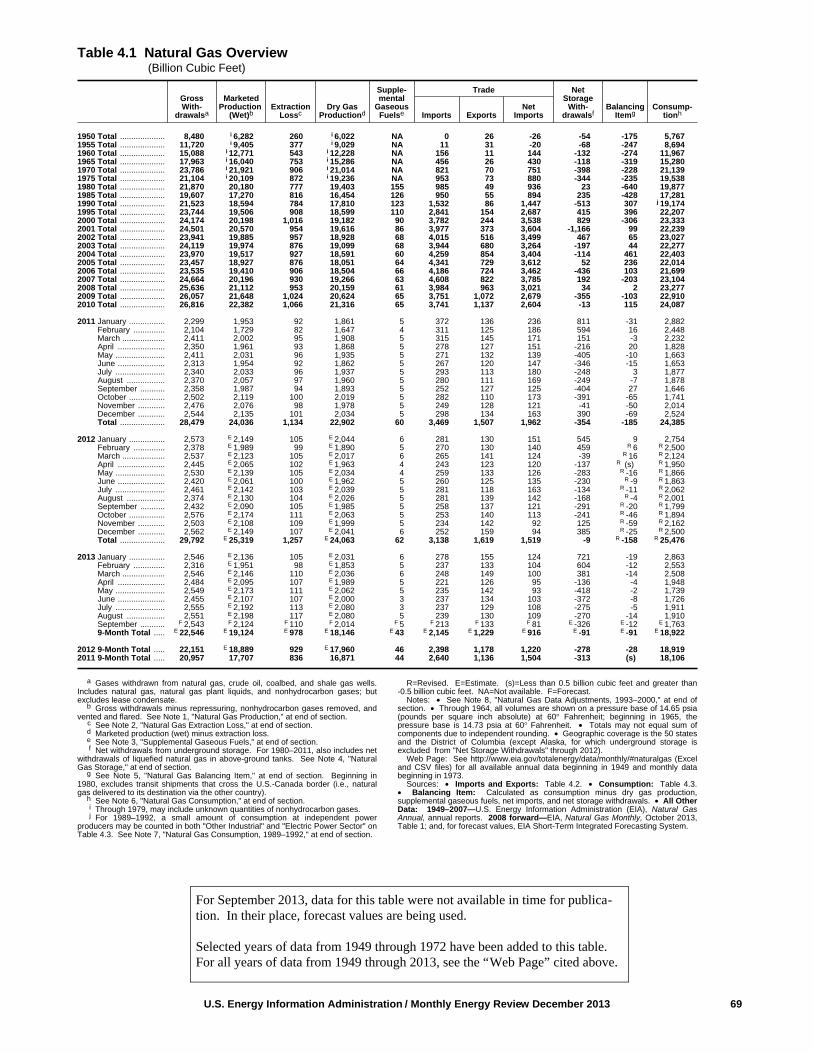
U.S. Energy Information Administration / Monthly Energy Review December 2013 69
Table 4.1 Natural Gas Overview (Billion Cubic Feet)
GrossWith-
drawalsa
MarketedProduction
(Wet)bExtraction
LosscDry Gas
Productiond
Supple-mental
GaseousFuelse
Trade NetStorage
With-drawalsf
BalancingItemg
Consump-tionhImports Exports
NetImports
1950 Total .................... 8,480 i 6,282 260 i 6,022 NA 0 26 -26 -54 -175 5,7671955 Total .................... 11,720 i 9,405 377 i 9,029 NA 11 31 -20 -68 -247 8,6941960 Total .................... 15,088 i 12,771 543 i 12,228 NA 156 11 144 -132 -274 11,9671965 Total .................... 17,963 i 16,040 753 i 15,286 NA 456 26 430 -118 -319 15,2801970 Total .................... 23,786 i 21,921 906 i 21,014 NA 821 70 751 -398 -228 21,1391975 Total .................... 21,104 i 20,109 872 i 19,236 NA 953 73 880 -344 -235 19,5381980 Total .................... 21,870 20,180 777 19,403 155 985 49 936 23 -640 19,8771985 Total .................... 19,607 17,270 816 16,454 126 950 55 894 235 -428 17,2811990 Total .................... 21,523 18,594 784 17,810 123 1,532 86 1,447 -513 307 j 19,1741995 Total .................... 23,744 19,506 908 18,599 110 2,841 154 2,687 415 396 22,2072000 Total .................... 24,174 20,198 1,016 19,182 90 3,782 244 3,538 829 -306 23,3332001 Total .................... 24,501 20,570 954 19,616 86 3,977 373 3,604 -1,166 99 22,2392002 Total .................... 23,941 19,885 957 18,928 68 4,015 516 3,499 467 65 23,0272003 Total .................... 24,119 19,974 876 19,099 68 3,944 680 3,264 -197 44 22,2772004 Total .................... 23,970 19,517 927 18,591 60 4,259 854 3,404 -114 461 22,4032005 Total .................... 23,457 18,927 876 18,051 64 4,341 729 3,612 52 236 22,0142006 Total .................... 23,535 19,410 906 18,504 66 4,186 724 3,462 -436 103 21,6992007 Total .................... 24,664 20,196 930 19,266 63 4,608 822 3,785 192 -203 23,1042008 Total .................... 25,636 21,112 953 20,159 61 3,984 963 3,021 34 2 23,2772009 Total .................... 26,057 21,648 1,024 20,624 65 3,751 1,072 2,679 -355 -103 22,9102010 Total .................... 26,816 22,382 1,066 21,316 65 3,741 1,137 2,604 -13 115 24,087
2011 January ................ 2,299 1,953 92 1,861 5 372 136 236 811 -31 2,882 February .............. 2,104 1,729 82 1,647 4 311 125 186 594 16 2,448 March ................... 2,411 2,002 95 1,908 5 315 145 171 151 -3 2,232 April ..................... 2,350 1,961 93 1,868 5 278 127 151 -216 20 1,828 May ...................... 2,411 2,031 96 1,935 5 271 132 139 -405 -10 1,663 June ..................... 2,313 1,954 92 1,862 5 267 120 147 -346 -15 1,653 July ...................... 2,340 2,033 96 1,937 5 293 113 180 -248 3 1,877 August ................. 2,370 2,057 97 1,960 5 280 111 169 -249 -7 1,878 September ........... 2,358 1,987 94 1,893 5 252 127 125 -404 27 1,646 October ................ 2,502 2,119 100 2,019 5 282 110 173 -391 -65 1,741 November ............ 2,476 2,076 98 1,978 5 249 128 121 -41 -50 2,014 December ............ 2,544 2,135 101 2,034 5 298 134 163 390 -69 2,524 Total .................... 28,479 24,036 1,134 22,902 60 3,469 1,507 1,962 -354 -185 24,385
2012 January ................ 2,573 E 2,149 105 E 2,044 6 281 130 151 545 9 2,754 February .............. 2,378 E 1,989 99 E 1,890 5 270 130 140 459 R 6 R 2,500 March ................... 2,537 E 2,123 105 E 2,017 6 265 141 124 -39 R 16 R 2,124 April ..................... 2,445 E 2,065 102 E 1,963 4 243 123 120 -137 R (s) R 1,950 May ...................... 2,530 E 2,139 105 E 2,034 4 259 133 126 -283 R -16 R 1,866 June ..................... 2,420 E 2,061 100 E 1,962 5 260 125 135 -230 R -9 R 1,863 July ...................... 2,461 E 2,142 103 E 2,039 5 281 118 163 -134 R -11 R 2,062 August ................. 2,374 E 2,130 104 E 2,026 5 281 139 142 -168 R -4 R 2,001 September ........... 2,432 E 2,090 105 E 1,985 5 258 137 121 -291 R -20 R 1,799 October ................ 2,576 E 2,174 111 E 2,063 5 253 140 113 -241 R -46 R 1,894 November ............ 2,503 E 2,108 109 E 1,999 5 234 142 92 125 R -59 R 2,162 December ............ 2,562 E 2,149 107 E 2,041 6 252 159 94 385 R -25 R 2,500 Total .................... 29,792 E 25,319 1,257 E 24,063 62 3,138 1,619 1,519 -9 R -158 R 25,476
2013 January ................ 2,546 E 2,136 105 E 2,031 6 278 155 124 721 -19 2,863 February .............. 2,316 E 1,951 98 E 1,853 5 237 133 104 604 -12 2,553 March ................... 2,546 E 2,146 110 E 2,036 6 248 149 100 381 -14 2,508 April ..................... 2,484 E 2,095 107 E 1,989 5 221 126 95 -136 -4 1,948 May ...................... 2,549 E 2,173 111 E 2,062 5 235 142 93 -418 -2 1,739 June ..................... 2,455 E 2,107 107 E 2,000 3 237 134 103 -372 -8 1,726 July ...................... 2,555 E 2,192 113 E 2,080 3 237 129 108 -275 -5 1,911 August ................. 2,551 E 2,198 117 E 2,080 5 239 130 109 -270 -14 1,910 September ........... F 2,543 F 2,124 F 110 F 2,014 F 5 F 213 F 133 F 81 E -326 E -12 E 1,763 9-Month Total ..... E 22,546 E 19,124 E 978 E 18,146 E 43 E 2,145 E 1,229 E 916 E -91 E -91 E 18,922
2012 9-Month Total ..... 22,151 E 18,889 929 E 17,960 46 2,398 1,178 1,220 -278 -28 18,9192011 9-Month Total ..... 20,957 17,707 836 16,871 44 2,640 1,136 1,504 -313 (s) 18,106
a Gases withdrawn from natural gas, crude oil, coalbed, and shale gas wells.Includes natural gas, natural gas plant liquids, and nonhydrocarbon gases; butexcludes lease condensate.
b Gross withdrawals minus repressuring, nonhydrocarbon gases removed, andvented and flared. See Note 1, "Natural Gas Production," at end of section.
c See Note 2, "Natural Gas Extraction Loss," at end of section.d Marketed production (wet) minus extraction loss.e See Note 3, "Supplemental Gaseous Fuels," at end of section.f Net withdrawals from underground storage. For 1980–2011, also includes net
withdrawals of liquefied natural gas in above-ground tanks. See Note 4, "NaturalGas Storage," at end of section.
g See Note 5, "Natural Gas Balancing Item," at end of section. Beginning in1980, excludes transit shipments that cross the U.S.-Canada border (i.e., naturalgas delivered to its destination via the other country).
h See Note 6, "Natural Gas Consumption," at end of section.i Through 1979, may include unknown quantities of nonhydrocarbon gases.j For 1989–1992, a small amount of consumption at independent power
producers may be counted in both "Other Industrial" and "Electric Power Sector" onTable 4.3. See Note 7, "Natural Gas Consumption, 1989–1992," at end of section.
R=Revised. E=Estimate. (s)=Less than 0.5 billion cubic feet and greater than-0.5 billion cubic feet. NA=Not available. F=Forecast.
Notes: • See Note 8, "Natural Gas Data Adjustments, 1993–2000," at end ofsection. • Through 1964, all volumes are shown on a pressure base of 14.65 psia(pounds per square inch absolute) at 60° Fahrenheit; beginning in 1965, thepressure base is 14.73 psia at 60° Fahrenheit. • Totals may not equal sum ofcomponents due to independent rounding. • Geographic coverage is the 50 statesand the District of Columbia (except Alaska, for which underground storage isexcluded from "Net Storage Withdrawals" through 2012).
Web Page: See http://www.eia.gov/totalenergy/data/monthly/#naturalgas (Exceland CSV files) for all available annual data beginning in 1949 and monthly databeginning in 1973.
Sources: • Imports and Exports: Table 4.2. • Consumption: Table 4.3.• Balancing Item: Calculated as consumption minus dry gas production,supplemental gaseous fuels, net imports, and net storage withdrawals. • All OtherData: 1949–2007—U.S. Energy Information Administration (EIA), Natural GasAnnual, annual reports. 2008 forward—EIA, Natural Gas Monthly, October 2013,Table 1; and, for forecast values, EIA Short-Term Integrated Forecasting System.
For September 2013, data for this table were not available in time for publica-tion. In their place, forecast values are being used.
Selected years of data from 1949 through 1972 have been added to this table.For all years of data from 1949 through 2013, see the “Web Page” cited above.
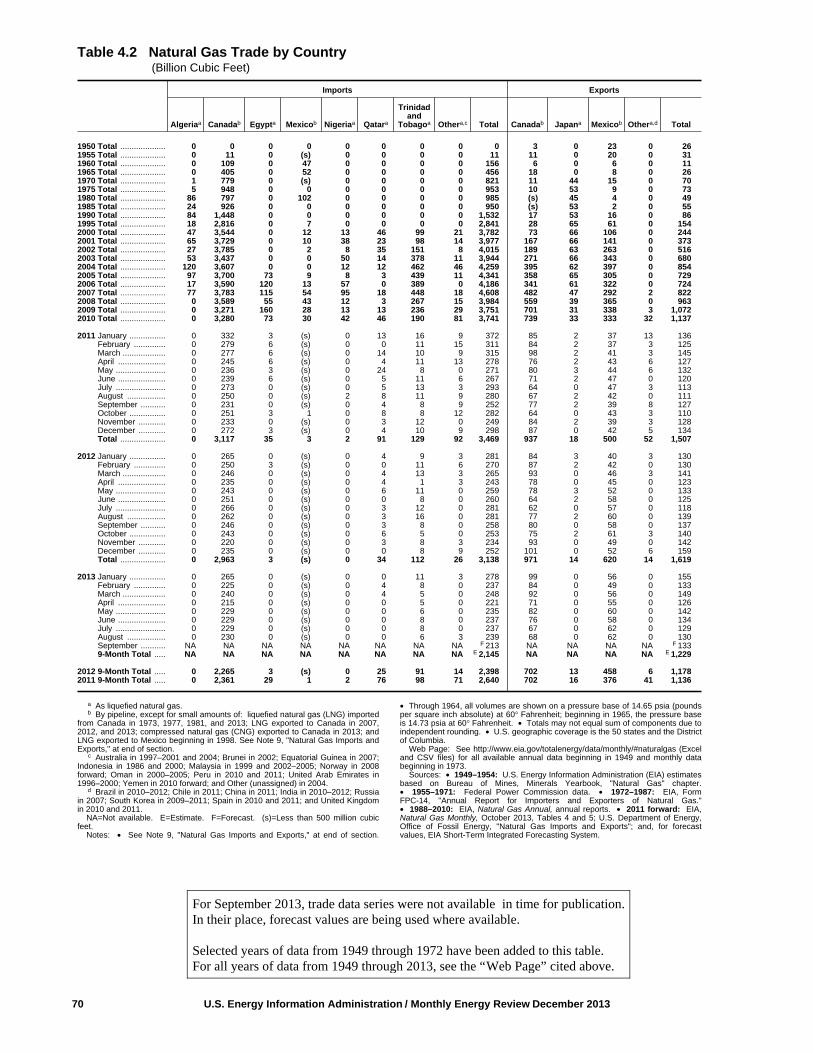
70 U.S. Energy Information Administration / Monthly Energy Review December 2013
Table 4.2 Natural Gas Trade by Country (Billion Cubic Feet)
Imports Exports
Algeriaa Canadab Egypta Mexicob Nigeriaa Qatara
Trinidadand
Tobagoa Othera,c Total Canadab Japana Mexicob Othera,d Total
1950 Total .................... 0 0 0 0 0 0 0 0 0 3 0 23 0 261955 Total .................... 0 11 0 (s) 0 0 0 0 11 11 0 20 0 311960 Total .................... 0 109 0 47 0 0 0 0 156 6 0 6 0 111965 Total .................... 0 405 0 52 0 0 0 0 456 18 0 8 0 261970 Total .................... 1 779 0 (s) 0 0 0 0 821 11 44 15 0 701975 Total .................... 5 948 0 0 0 0 0 0 953 10 53 9 0 731980 Total .................... 86 797 0 102 0 0 0 0 985 (s) 45 4 0 491985 Total .................... 24 926 0 0 0 0 0 0 950 (s) 53 2 0 551990 Total .................... 84 1,448 0 0 0 0 0 0 1,532 17 53 16 0 861995 Total .................... 18 2,816 0 7 0 0 0 0 2,841 28 65 61 0 1542000 Total .................... 47 3,544 0 12 13 46 99 21 3,782 73 66 106 0 2442001 Total .................... 65 3,729 0 10 38 23 98 14 3,977 167 66 141 0 3732002 Total .................... 27 3,785 0 2 8 35 151 8 4,015 189 63 263 0 5162003 Total .................... 53 3,437 0 0 50 14 378 11 3,944 271 66 343 0 6802004 Total .................... 120 3,607 0 0 12 12 462 46 4,259 395 62 397 0 8542005 Total .................... 97 3,700 73 9 8 3 439 11 4,341 358 65 305 0 7292006 Total .................... 17 3,590 120 13 57 0 389 0 4,186 341 61 322 0 7242007 Total .................... 77 3,783 115 54 95 18 448 18 4,608 482 47 292 2 8222008 Total .................... 0 3,589 55 43 12 3 267 15 3,984 559 39 365 0 9632009 Total .................... 0 3,271 160 28 13 13 236 29 3,751 701 31 338 3 1,0722010 Total .................... 0 3,280 73 30 42 46 190 81 3,741 739 33 333 32 1,137
2011 January ................ 0 332 3 (s) 0 13 16 9 372 85 2 37 13 136 February .............. 0 279 6 (s) 0 0 11 15 311 84 2 37 3 125 March ................... 0 277 6 (s) 0 14 10 9 315 98 2 41 3 145 April ..................... 0 245 6 (s) 0 4 11 13 278 76 2 43 6 127 May ...................... 0 236 3 (s) 0 24 8 0 271 80 3 44 6 132 June ..................... 0 239 6 (s) 0 5 11 6 267 71 2 47 0 120 July ...................... 0 273 0 (s) 0 5 13 3 293 64 0 47 3 113 August ................. 0 250 0 (s) 2 8 11 9 280 67 2 42 0 111 September ........... 0 231 0 (s) 0 4 8 9 252 77 2 39 8 127 October ................ 0 251 3 1 0 8 8 12 282 64 0 43 3 110 November ............ 0 233 0 (s) 0 3 12 0 249 84 2 39 3 128 December ............ 0 272 3 (s) 0 4 10 9 298 87 0 42 5 134 Total .................... 0 3,117 35 3 2 91 129 92 3,469 937 18 500 52 1,507
2012 January ................ 0 265 0 (s) 0 4 9 3 281 84 3 40 3 130 February .............. 0 250 3 (s) 0 0 11 6 270 87 2 42 0 130 March ................... 0 246 0 (s) 0 4 13 3 265 93 0 46 3 141 April ..................... 0 235 0 (s) 0 4 1 3 243 78 0 45 0 123 May ...................... 0 243 0 (s) 0 6 11 0 259 78 3 52 0 133 June ..................... 0 251 0 (s) 0 0 8 0 260 64 2 58 0 125 July ...................... 0 266 0 (s) 0 3 12 0 281 62 0 57 0 118 August ................. 0 262 0 (s) 0 3 16 0 281 77 2 60 0 139 September ........... 0 246 0 (s) 0 3 8 0 258 80 0 58 0 137 October ................ 0 243 0 (s) 0 6 5 0 253 75 2 61 3 140 November ............ 0 220 0 (s) 0 3 8 3 234 93 0 49 0 142 December ............ 0 235 0 (s) 0 0 8 9 252 101 0 52 6 159 Total .................... 0 2,963 3 (s) 0 34 112 26 3,138 971 14 620 14 1,619
2013 January ................ 0 265 0 (s) 0 0 11 3 278 99 0 56 0 155 February .............. 0 225 0 (s) 0 4 8 0 237 84 0 49 0 133 March ................... 0 240 0 (s) 0 4 5 0 248 92 0 56 0 149 April ..................... 0 215 0 (s) 0 0 5 0 221 71 0 55 0 126 May ...................... 0 229 0 (s) 0 0 6 0 235 82 0 60 0 142 June ..................... 0 229 0 (s) 0 0 8 0 237 76 0 58 0 134 July ...................... 0 229 0 (s) 0 0 8 0 237 67 0 62 0 129 August ................. 0 230 0 (s) 0 0 6 3 239 68 0 62 0 130 September ........... NA NA NA NA NA NA NA NA F 213 NA NA NA NA F 133 9-Month Total ..... NA NA NA NA NA NA NA NA E 2,145 NA NA NA NA E 1,229
2012 9-Month Total ..... 0 2,265 3 (s) 0 25 91 14 2,398 702 13 458 6 1,1782011 9-Month Total ..... 0 2,361 29 1 2 76 98 71 2,640 702 16 376 41 1,136
a As liquefied natural gas.b By pipeline, except for small amounts of: liquefied natural gas (LNG) imported
from Canada in 1973, 1977, 1981, and 2013; LNG exported to Canada in 2007,2012, and 2013; compressed natural gas (CNG) exported to Canada in 2013; andLNG exported to Mexico beginning in 1998. See Note 9, "Natural Gas Imports andExports," at end of section.
c Australia in 1997–2001 and 2004; Brunei in 2002; Equatorial Guinea in 2007;Indonesia in 1986 and 2000; Malaysia in 1999 and 2002–2005; Norway in 2008forward; Oman in 2000–2005; Peru in 2010 and 2011; United Arab Emirates in1996–2000; Yemen in 2010 forward; and Other (unassigned) in 2004.
d Brazil in 2010–2012; Chile in 2011; China in 2011; India in 2010–2012; Russiain 2007; South Korea in 2009–2011; Spain in 2010 and 2011; and United Kingdomin 2010 and 2011.
NA=Not available. E=Estimate. F=Forecast. (s)=Less than 500 million cubicfeet.
Notes: • See Note 9, "Natural Gas Imports and Exports," at end of section.
• Through 1964, all volumes are shown on a pressure base of 14.65 psia (poundsper square inch absolute) at 60° Fahrenheit; beginning in 1965, the pressure baseis 14.73 psia at 60° Fahrenheit. • Totals may not equal sum of components due toindependent rounding. • U.S. geographic coverage is the 50 states and the Districtof Columbia.
Web Page: See http://www.eia.gov/totalenergy/data/monthly/#naturalgas (Exceland CSV files) for all available annual data beginning in 1949 and monthly databeginning in 1973.
Sources: • 1949–1954: U.S. Energy Information Administration (EIA) estimatesbased on Bureau of Mines, Minerals Yearbook, "Natural Gas" chapter.• 1955–1971: Federal Power Commission data. • 1972–1987: EIA, FormFPC-14, "Annual Report for Importers and Exporters of Natural Gas."• 1988–2010: EIA, Natural Gas Annual, annual reports. • 2011 forward: EIA,Natural Gas Monthly, October 2013, Tables 4 and 5; U.S. Department of Energy,Office of Fossil Energy, "Natural Gas Imports and Exports"; and, for forecastvalues, EIA Short-Term Integrated Forecasting System.
For September 2013, trade data series were not available in time for publication.In their place, forecast values are being used where available.
Selected years of data from 1949 through 1972 have been added to this table.For all years of data from 1949 through 2013, see the “Web Page” cited above.
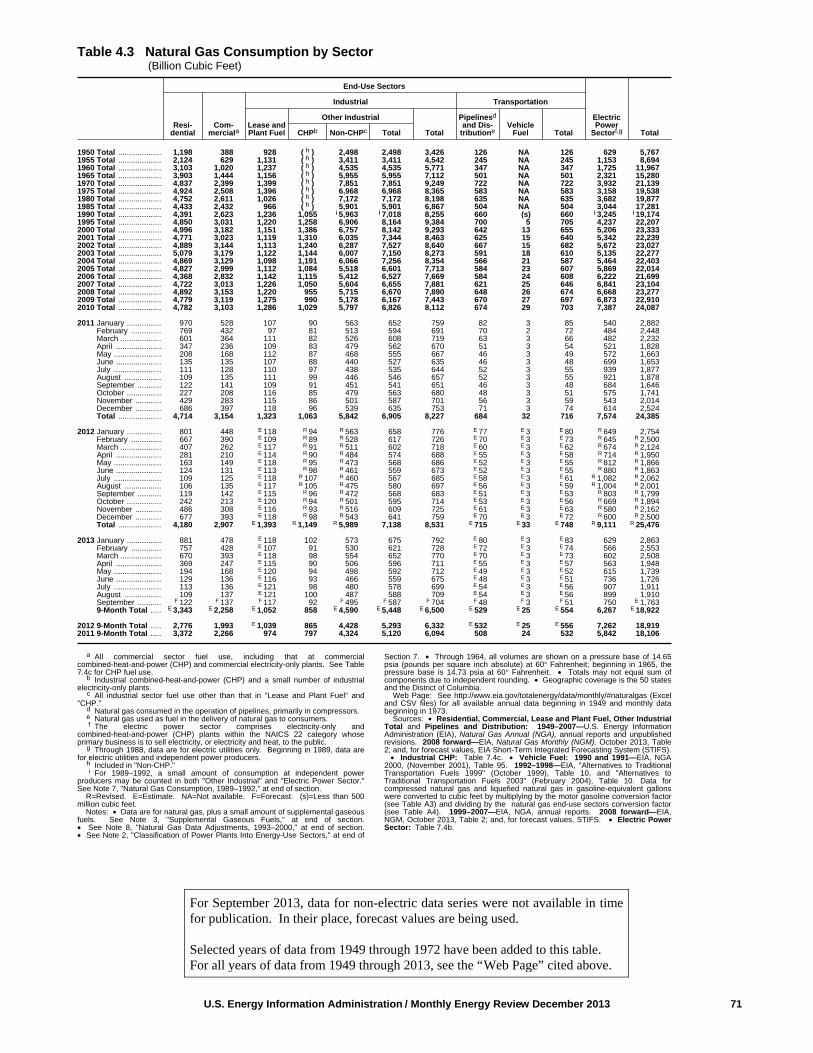
U.S. Energy Information Administration / Monthly Energy Review December 2013 71
Table 4.3 Natural Gas Consumption by Sector (Billion Cubic Feet)
End-Use Sectors
ElectricPower
Sectorf,g TotalResi-
dentialCom-
merciala
Industrial Transportation
Lease andPlant Fuel
Other Industrial
Total
Pipelinesd
and Dis-tributione
VehicleFuel TotalCHPb Non-CHPc Total
1950 Total .................... 1,198 388 928 h( ) 2,498 2,498 3,426 126 NA 126 629 5,7671955 Total .................... 2,124 629 1,131 h( ) 3,411 3,411 4,542 245 NA 245 1,153 8,6941960 Total .................... 3,103 1,020 1,237 h( ) 4,535 4,535 5,771 347 NA 347 1,725 11,9671965 Total .................... 3,903 1,444 1,156 h( ) 5,955 5,955 7,112 501 NA 501 2,321 15,2801970 Total .................... 4,837 2,399 1,399 h( ) 7,851 7,851 9,249 722 NA 722 3,932 21,1391975 Total .................... 4,924 2,508 1,396 h( ) 6,968 6,968 8,365 583 NA 583 3,158 19,5381980 Total .................... 4,752 2,611 1,026 h( ) 7,172 7,172 8,198 635 NA 635 3,682 19,8771985 Total .................... 4,433 2,432 966 h( ) 5,901 5,901 6,867 504 NA 504 3,044 17,2811990 Total .................... 4,391 2,623 1,236 1,055 i 5,963 i 7,018 8,255 660 (s) 660 i 3,245 i 19,1741995 Total .................... 4,850 3,031 1,220 1,258 6,906 8,164 9,384 700 5 705 4,237 22,2072000 Total .................... 4,996 3,182 1,151 1,386 6,757 8,142 9,293 642 13 655 5,206 23,3332001 Total .................... 4,771 3,023 1,119 1,310 6,035 7,344 8,463 625 15 640 5,342 22,2392002 Total .................... 4,889 3,144 1,113 1,240 6,287 7,527 8,640 667 15 682 5,672 23,0272003 Total .................... 5,079 3,179 1,122 1,144 6,007 7,150 8,273 591 18 610 5,135 22,2772004 Total .................... 4,869 3,129 1,098 1,191 6,066 7,256 8,354 566 21 587 5,464 22,4032005 Total .................... 4,827 2,999 1,112 1,084 5,518 6,601 7,713 584 23 607 5,869 22,0142006 Total .................... 4,368 2,832 1,142 1,115 5,412 6,527 7,669 584 24 608 6,222 21,6992007 Total .................... 4,722 3,013 1,226 1,050 5,604 6,655 7,881 621 25 646 6,841 23,1042008 Total .................... 4,892 3,153 1,220 955 5,715 6,670 7,890 648 26 674 6,668 23,2772009 Total .................... 4,779 3,119 1,275 990 5,178 6,167 7,443 670 27 697 6,873 22,9102010 Total .................... 4,782 3,103 1,286 1,029 5,797 6,826 8,112 674 29 703 7,387 24,087
2011 January ................ 970 528 107 90 563 652 759 82 3 85 540 2,882 February .............. 769 432 97 81 513 594 691 70 2 72 484 2,448 March ................... 601 364 111 82 526 608 719 63 3 66 482 2,232 April ..................... 347 236 109 83 479 562 670 51 3 54 521 1,828 May ...................... 208 168 112 87 468 555 667 46 3 49 572 1,663 June ..................... 135 135 107 88 440 527 635 46 3 48 699 1,653 July ...................... 111 128 110 97 438 535 644 52 3 55 939 1,877 August ................. 109 135 111 99 446 546 657 52 3 55 921 1,878 September ........... 122 141 109 91 451 541 651 46 3 48 684 1,646 October ................ 227 208 116 85 479 563 680 48 3 51 575 1,741 November ............ 429 283 115 86 501 587 701 56 3 59 543 2,014 December ............ 686 397 118 96 539 635 753 71 3 74 614 2,524 Total .................... 4,714 3,154 1,323 1,063 5,842 6,905 8,227 684 32 716 7,574 24,385
2012 January ................ 801 448 E 118 R 94 R 563 658 776 E 77 E 3 E 80 R 649 2,754 February .............. 667 390 E 109 R 89 R 528 617 726 E 70 E 3 E 73 R 645 R 2,500 March ................... 407 262 E 117 R 91 R 511 602 718 E 60 E 3 E 62 R 674 R 2,124 April ..................... 281 210 E 114 R 90 R 484 574 688 E 55 E 3 E 58 R 714 R 1,950 May ...................... 163 149 E 118 R 95 R 473 568 686 E 52 E 3 E 55 R 812 R 1,866 June ..................... 124 131 E 113 R 98 R 461 559 673 E 52 E 3 E 55 R 880 R 1,863 July ...................... 109 125 E 118 R 107 R 460 567 685 E 58 E 3 E 61 R 1,082 R 2,062 August ................. 106 135 E 117 R 105 R 475 580 697 E 56 E 3 E 59 R 1,004 R 2,001 September ........... 119 142 E 115 R 96 R 472 568 683 E 51 E 3 E 53 R 803 R 1,799 October ................ 242 213 E 120 R 94 R 501 595 714 E 53 E 3 E 56 R 669 R 1,894 November ............ 486 308 E 116 R 93 R 516 609 725 E 61 E 3 E 63 R 580 R 2,162 December ............ 677 393 E 118 R 98 R 543 641 759 E 70 E 3 E 72 R 600 R 2,500 Total .................... 4,180 2,907 E 1,393 R 1,149 R 5,989 7,138 8,531 E 715 E 33 E 748 R 9,111 R 25,476
2013 January ................ 881 478 E 118 102 573 675 792 E 80 E 3 E 83 629 2,863 February .............. 757 428 E 107 91 530 621 728 E 72 E 3 E 74 566 2,553 March ................... 670 393 E 118 98 554 652 770 E 70 E 3 E 73 602 2,508 April ..................... 369 247 E 115 90 506 596 711 E 55 E 3 E 57 563 1,948 May ...................... 194 168 E 120 94 498 592 712 E 49 E 3 E 52 615 1,739 June ..................... 129 136 E 116 93 466 559 675 E 48 E 3 E 51 736 1,726 July ...................... 113 136 E 121 98 480 578 699 E 54 E 3 E 56 907 1,911 August ................. 109 137 E 121 100 487 588 709 E 54 E 3 E 56 899 1,910 September ........... F 122 F 137 F 117 92 F 495 F 587 F 704 F 48 F 3 F 51 750 E 1,763 9-Month Total ..... E 3,343 E 2,258 E 1,052 858 E 4,590 E 5,448 E 6,500 E 529 E 25 E 554 6,267 E 18,922
2012 9-Month Total ..... 2,776 1,993 E 1,039 865 4,428 5,293 6,332 E 532 E 25 E 556 7,262 18,9192011 9-Month Total ..... 3,372 2,266 974 797 4,324 5,120 6,094 508 24 532 5,842 18,106
a All commercial sector fuel use, including that at commercialcombined-heat-and-power (CHP) and commercial electricity-only plants. See Table7.4c for CHP fuel use.
b Industrial combined-heat-and-power (CHP) and a small number of industrialelectricity-only plants.
c All industrial sector fuel use other than that in "Lease and Plant Fuel" and"CHP."
d Natural gas consumed in the operation of pipelines, primarily in compressors.e Natural gas used as fuel in the delivery of natural gas to consumers.f The electric power sector comprises electricity-only and
combined-heat-and-power (CHP) plants within the NAICS 22 category whoseprimary business is to sell electricity, or electricity and heat, to the public.
g Through 1988, data are for electric utilities only. Beginning in 1989, data arefor electric utilities and independent power producers.
h Included in "Non-CHP."i For 1989–1992, a small amount of consumption at independent power
producers may be counted in both "Other Industrial" and "Electric Power Sector."See Note 7, "Natural Gas Consumption, 1989–1992," at end of section.
R=Revised. E=Estimate. NA=Not available. F=Forecast. (s)=Less than 500million cubic feet.
Notes: • Data are for natural gas, plus a small amount of supplemental gaseousfuels. See Note 3, "Supplemental Gaseous Fuels," at end of section.• See Note 8, "Natural Gas Data Adjustments, 1993–2000," at end of section.• See Note 2, "Classification of Power Plants Into Energy-Use Sectors," at end of
Section 7. • Through 1964, all volumes are shown on a pressure base of 14.65psia (pounds per square inch absolute) at 60° Fahrenheit; beginning in 1965, thepressure base is 14.73 psia at 60° Fahrenheit. • Totals may not equal sum ofcomponents due to independent rounding. • Geographic coverage is the 50 statesand the District of Columbia.
Web Page: See http://www.eia.gov/totalenergy/data/monthly/#naturalgas (Exceland CSV files) for all available annual data beginning in 1949 and monthly databeginning in 1973.
Sources: • Residential, Commercial, Lease and Plant Fuel, Other IndustrialTotal and Pipelines and Distribution: 1949–2007—U.S. Energy InformationAdministration (EIA), Natural Gas Annual (NGA), annual reports and unpublishedrevisions. 2008 forward—EIA, Natural Gas Monthly (NGM), October 2013, Table2; and, for forecast values, EIA Short-Term Integrated Forecasting System (STIFS). • Industrial CHP: Table 7.4c. • Vehicle Fuel: 1990 and 1991—EIA, NGA2000, (November 2001), Table 95. 1992–1998—EIA, "Alternatives to TraditionalTransportation Fuels 1999" (October 1999), Table 10, and "Alternatives toTraditional Transportation Fuels 2003" (February 2004), Table 10. Data forcompressed natural gas and liquefied natural gas in gasoline-equivalent gallonswere converted to cubic feet by multiplying by the motor gasoline conversion factor(see Table A3) and dividing by the natural gas end-use sectors conversion factor(see Table A4). 1999–2007—EIA, NGA, annual reports. 2008 forward—EIA,NGM, October 2013, Table 2; and, for forecast values, STIFS. • Electric PowerSector: Table 7.4b.
For September 2013, data for non-electric data series were not available in timefor publication. In their place, forecast values are being used.
Selected years of data from 1949 through 1972 have been added to this table.For all years of data from 1949 through 2013, see the “Web Page” cited above.

72 U.S. Energy Information Administration / Monthly Energy Review December 2013
Table 4.4 Natural Gas in Underground Storage (Volumes in Billion Cubic Feet)
Natural Gas inUnderground Storage,
End of Period
Change in Working GasFrom Same Period
Previous Year Storage Activity
Base Gas Working Gas Totala Volume Percent Withdrawals Injections Netb,c
1950 Total .................... NA NA NA NA NA 175 230 -541955 Total .................... 863 505 1,368 40 8.7 437 505 -681960 Total .................... NA NA 2,184 NA NA 713 844 -1321965 Total .................... 1,848 1,242 3,090 83 7.2 960 1,078 -1181970 Total .................... 2,326 1,678 4,004 257 18.1 1,459 1,857 -3981975 Total .................... 3,162 2,212 5,374 162 7.9 1,760 2,104 -3441980 Total .................... 3,642 2,655 6,297 -99 -3.6 1,910 1,896 141985 Total .................... 3,842 2,607 6,448 -270 -9.4 2,359 2,128 2311990 Total .................... 3,868 3,068 6,936 555 22.1 1,934 2,433 -4991995 Total .................... 4,349 2,153 6,503 -453 -17.4 2,974 2,566 4082000 Total .................... 4,352 1,719 6,071 -806 -31.9 3,498 2,684 8142001 Total .................... 4,301 2,904 7,204 1,185 68.9 2,309 3,464 -1,1562002 Total .................... 4,340 2,375 6,715 -528 -18.2 3,138 2,670 4682003 Total .................... 4,303 2,563 6,866 187 7.9 3,099 3,292 -1932004 Total .................... 4,201 2,696 6,897 133 5.2 3,037 3,150 -1132005 Total .................... 4,200 2,635 6,835 -61 -2.3 3,057 3,002 552006 Total .................... 4,211 3,070 7,281 435 16.5 2,493 2,924 -4312007 Total .................... 4,234 2,879 7,113 -191 -6.2 3,325 3,133 1922008 Total .................... 4,232 2,840 7,073 -39 -1.4 3,374 3,340 342009 Total .................... 4,277 3,130 7,407 290 10.2 2,966 3,315 -3492010 Total .................... 4,301 3,111 7,412 -19 -.6 3,274 3,291 -17
2011 January ................ 4,303 2,306 6,609 2 .1 849 50 799 February .............. 4,302 1,722 6,024 39 2.3 666 82 584 March ................... 4,302 1,577 5,879 -75 -4.6 314 168 146 April ..................... 4,304 1,788 6,092 -223 -11.1 100 312 -212 May ...................... 4,304 2,187 6,491 -233 -9.6 58 458 -399 June ..................... 4,302 2,530 6,831 -210 -7.7 80 421 -340 July ...................... 4,300 2,775 7,075 -190 -6.4 116 359 -244 August ................. 4,300 3,019 7,319 -134 -4.2 126 370 -244 September ........... 4,301 3,416 7,717 -92 -2.6 55 454 -398 October ................ 4,302 3,804 8,106 -47 -1.2 52 437 -385 November ............ 4,300 3,843 8,143 74 2.0 184 221 -38 December ............ 4,302 3,462 7,764 351 11.3 474 90 383 Total .................... 4,302 3,462 7,764 351 11.3 3,074 3,422 -348
2012 January ................ 4,307 2,915 7,222 609 26.4 620 75 545 February .............. 4,307 2,455 6,762 733 42.5 515 56 459 March ................... 4,325 2,477 6,802 900 57.1 203 242 -39 April ..................... 4,329 2,613 6,942 825 46.1 126 264 -137 May ...................... 4,334 2,890 7,224 703 32.2 73 356 -283 June ..................... 4,337 3,118 7,456 589 23.3 91 321 -230 July ...................... 4,339 3,246 7,585 471 17.0 129 263 -134 August ................. 4,348 3,409 7,757 390 12.9 134 302 -168 September ........... 4,352 3,693 8,045 278 8.1 67 358 -291 October ................ 4,365 3,929 8,294 125 3.3 86 327 -241 November ............ 4,372 3,799 8,172 -43 -1.1 281 156 125 December ............ 4,371 3,413 7,784 -49 -1.4 490 105 385 Total .................... 4,371 3,413 7,784 -49 -1.4 2,815 2,824 -9
2013 January ................ 4,373 2,703 7,076 -212 -7.3 793 72 721 February .............. 4,379 2,103 6,483 -351 -14.3 648 44 604 March ................... 4,378 1,724 6,102 -753 -30.4 482 101 381 April ..................... 4,377 1,858 6,236 -755 -28.9 136 272 -136 May ...................... 4,381 2,272 6,653 -618 -21.4 49 467 -418 June ..................... 4,385 2,643 7,028 -475 -15.2 69 441 -372 July ...................... 4,365 2,937 7,303 -309 -9.5 99 373 -275 August ................. 4,362 3,211 7,573 -198 -5.8 102 372 -270 September ........... F 4,362 F 3,526 F 7,888 F -168 F -4.5 F 65 F 391 E -326 9-Month Total ..... – – – – – – – – – – E 2,442 E 2,534 E -91
2012 9-Month Total ..... – – – – – – – – – – 1,958 2,237 -2782011 9-Month Total ..... – – – – – – – – – – 2,365 2,673 -308
a For total underground storage capacity at the end of each calendar year, seeNote 4, "Natural Gas Storage," at end of section.
b For 1980–2011, data differ from those shown on Table 4.1, which includesliquefied natural gas storage for that period.
c Positive numbers indicate that withdrawals are greater than injections.Negative numbers indicate that injections are greater than withdrawals. Netwithdrawals or injections may not equal the difference between applicable endingstocks. See Note 4, "Natural Gas Storage," at end of section.
– – =Not applicable. NA=Not available. E=Estimate. F=Forecast. Notes: • Through 1964, all volumes are shown on a pressure base of 14.65
psia (pounds per square inch absolute) at 60° Fahrenheit; beginning in 1965, thepressure base is 14.73 psia at 60° Fahrenheit. • Totals may not equal sum ofcomponents due to independent rounding. • Geographic coverage is the 50 statesand the District of Columbia (except Alaska, which is excluded through 2012).
Web Page: See http://www.eia.gov/totalenergy/data/monthly/#naturalgas (Exceland CSV files) for all available annual data beginning in 1949 and monthly databeginning in 1973.
Sources: • Storage Activity: 1949–1975—U.S. Energy InformationAdministration (EIA), Natural Gas Annual 1994, Volume 2, Table 9.1976–1979—EIA, Natural Gas Production and Consumption 1979, Table 1.1980–1995—EIA, Historical Natural Gas Annual 1930 Through 2000, Table 11.1996–2007—EIA, Natural Gas Monthly (NGM), monthly issues. 2008forward—EIA, NGM, October 2013, Table 8; and, for forecast values, EIAShort-Term Integrated Forecasting System (STIFS). • All Other Data:1954–1974—American Gas Association, Gas Facts, annual issues. 1975 and1976—Federal Energy Administration (FEA), Form FEA-G318-M-0, "UndergroundGas Storage Report," and Federal Power Commission (FPC), Form FPC-8,"Underground Gas Storage Report." 1977 and 1978—EIA, Form FEA-G318-M-0,"Underground Gas Storage Report," and Federal Energy Regulatory Commission(FERC), Form FERC-8, "Underground Gas Storage Report." 1979–1995—EIA,Form EIA-191, "Underground Gas Storage Report," and FERC, Form FERC-8,"Underground Gas Storage Report." 1996–2007—EIA, NGM, monthly issues.2008 forward—EIA, NGM, October 2013, Table 8; and, for forecast values, STIFS.
For September 2013, data for this table were not available in time for publication.In their place, forecast values are being used.
Selected years of data from 1949 through 1972 have been added to this table.For all years of data from 1949 through 2013, see the “Web Page” cited above.

Natural Gas
Note 1. Natural Gas Production. Final annual data arefrom the U.S. Energy Information Administration’s (EIA)Natural Gas Annual (NGA).
Data for the two most recent months presented areestimated. Some of the data for earlier months are also esti-mated or computed. For a discussion of computation andestimation procedures, see EIA’s Natural Gas Monthly(NGM).
Monthly data are considered preliminary until after publicationof the NGA. Preliminary monthly data are gathered fromreports to the Interstate Oil Compact Commission and the U.S.Minerals Management Service. Volumetric data areconverted, as necessary, to a standard pressure base of 14.73psia (pounds per square inch absolute) at 60° Fahrenheit.Unless there are major changes, data are not revised until afterpublication of the NGA.
Differences between annual data in the NGA and the sumof preliminary monthly data (January–December) are allo-cated proportionally to the months to create final monthlydata.
Note 2. Natural Gas Extraction Loss. Extraction loss isthe reduction in volume of natural gas resulting from theremoval of natural gas liquid constituents at natural gasprocessing plants—these natural gas plant liquids are trans-ferred to petroleum supply.
Annual data are from EIA’s Natural Gas Annual (NGA),where they are estimated on the basis of the type and quan-tity of liquid products extracted from the gas stream and thecalculated volume of such products at standard conditions.For a detailed explanation of the calculations used to deriveestimated extraction losses, see the NGA.
Preliminary monthly data are estimated on the basis ofextraction loss as an annual percentage of marketedproduction. This percentage is applied to each month’smarketed production to estimate monthly extraction loss.
Monthly data are revised and considered final after publicationof the NGA. Final monthly data are estimated by allocatingannual extraction loss data to the months on the basis of totalnatural gas marketed production data from the NGA.
Note 3. Supplemental Gaseous Fuels. Supplementalgaseous fuels are any substances that, introduced into orcommingled with natural gas, increase the volume avail-able for disposition. Such substances include, but are notlimited to, propane-air, refinery gas, coke oven gas, stillgas, manufactured gas, biomass gas, and air or inert gasesadded for Btu stabilization.
Annual data beginning with 1980 are from EIA’s NaturalGas Annual (NGA). Unknown quantities of supplementalgaseous fuels are included in consumption data for 1979 andearlier years. Monthly data are considered preliminary until
after publication of the NGA. Monthly estimates are based onthe annual ratio of supplemental gaseous fuels to the sum ofdry gas production, net imports, and net withdrawals fromstorage. The ratio is applied to the monthly sum of the threeelements to compute a monthly supplemental gaseous fuelsfigure.
Although the total amount of supplemental gaseous fuelsconsumed is known for 1980 forward, the amount consumedby each energy-use sector is estimated by EIA. These estimatesare used to create natural gas (without supplemental gaseousfuels) data for Tables 1.3, 2.2, 2.3, 2.4, and 2.6 (note: to avoiddouble-counting in these tables, supplemental gaseous fuels areaccounted for in their primary energy category: “Coal,” “Petro-leum,” or “Biomass”). It is assumed that supplemental gaseousfuels are commingled with natural gas consumed by the resi-dential, commercial, other industrial, and electric powersectors, but are not commingled with natural gas used for leaseand plant fuel, pipelines and distribution, or vehicle fuel. Theestimated consumption of supplemental gaseous fuels by eachsector (residential, commercial, other industrial, and electricpower) is calculated as that sector’s natural gas consumption(see Table 4.3) divided by the sum of natural gas consumptionby the residential, commercial, other industrial, and electricpower sectors (see Table 4.3), and then multiplied by totalsupplemental gaseous fuels consumption (see Table 4.1). Forestimated sectoral consumption of supplemental gaseous fuelsin Btu, the residential, commercial, and other industrial valuesin cubic feet are multiplied by the “End-Use Sectors” conver-sion factors (see Table A4), and the electric power values incubic feet are multiplied by the “Electric Power Sector” conver-sion factors (see Table A4). Total supplemental gaseous fuelsconsumption in Btu is calculated as the sum of the Btu valuesfor the sectors.
Note 4. Natural Gas Storage. Natural gas in storage atthe end of a reporting period may not equal the quantityderived by adding or subtracting net injections or withdraw-als from the quantity in storage at the end of the previousperiod. The difference is due to changes in the quantity ofnative gas included in the base gas and/or losses in base gasdue to migration from storage reservoirs.
Total underground storage capacity, which includes bothactive and inactive fields, at the end of each calendar yearsince 1975 (first year data were available), in billion cubicfeet, was:
8,24120008,1241987 . . . . . .
P9,01120128,22919998,1451986 . . . . . . . . .8,84920118,17919988,0871985 . . . . . . . . .8,76420108,33219978,0431984 . . . . . . . . .8,65620097,98019967,9851983 . . . . . . . . .8,49920087,95319957,9151982 . . . . . . . . .8,40220078,04319947,8051981 . . . . . . . . .8,33020067,98919937,4341980 . . . . . . . . .8,26820057,93219926,9291979 . . . . . . . . .8,25520047,99319916,8901978 . . . . . . . . .8,20620037,79419906,6781977 . . . . . . . . .8,20720028,12019896,5441976 . . . . . . . . .8,18220018,12419886,2801975 . . . . . . . . .
P= Preliminary.
U.S. Energy Information Administration / Monthly Energy Review December 2013 73
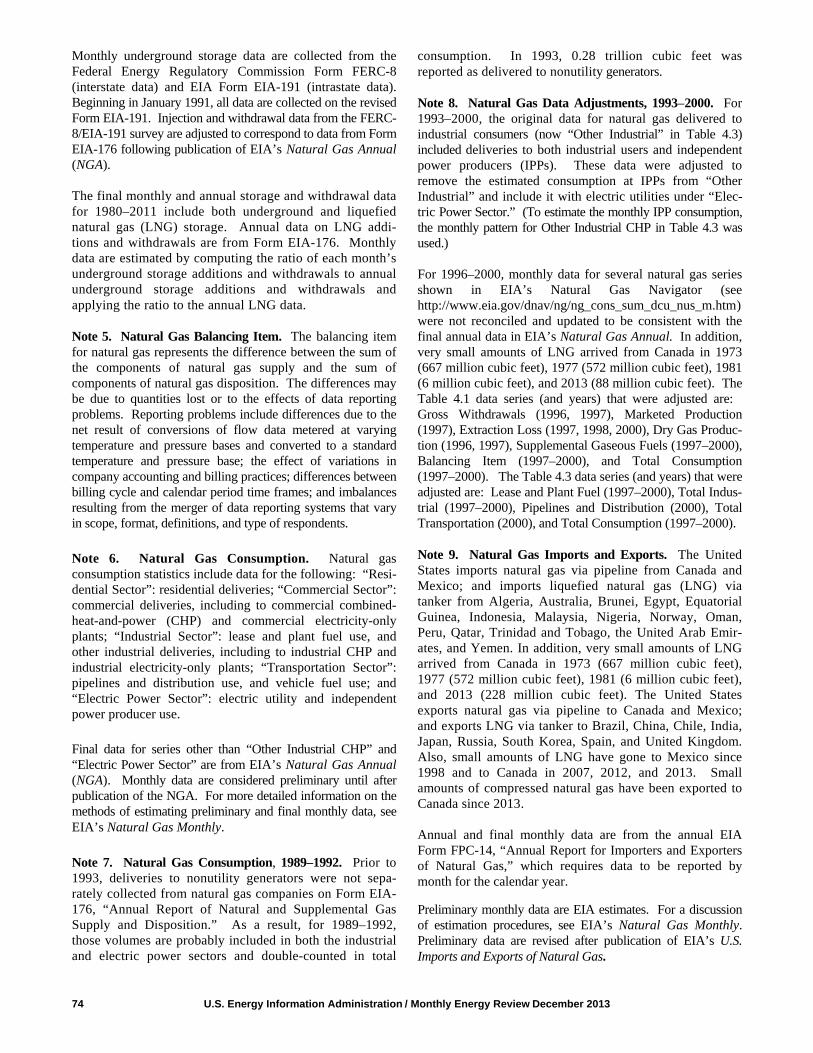
Monthly underground storage data are collected from theFederal Energy Regulatory Commission Form FERC-8(interstate data) and EIA Form EIA-191 (intrastate data).Beginning in January 1991, all data are collected on the revisedForm EIA-191. Injection and withdrawal data from the FERC-8/EIA-191 survey are adjusted to correspond to data from FormEIA-176 following publication of EIA’s Natural Gas Annual(NGA).
The final monthly and annual storage and withdrawal datafor 1980–2011 include both underground and liquefiednatural gas (LNG) storage. Annual data on LNG addi-tions and withdrawals are from Form EIA-176. Monthlydata are estimated by computing the ratio of each month’sunderground storage additions and withdrawals to annualunderground storage additions and withdrawals andapplying the ratio to the annual LNG data.
Note 5. Natural Gas Balancing Item. The balancing itemfor natural gas represents the difference between the sum ofthe components of natural gas supply and the sum ofcomponents of natural gas disposition. The differences maybe due to quantities lost or to the effects of data reportingproblems. Reporting problems include differences due to thenet result of conversions of flow data metered at varyingtemperature and pressure bases and converted to a standardtemperature and pressure base; the effect of variations incompany accounting and billing practices; differences betweenbilling cycle and calendar period time frames; and imbalancesresulting from the merger of data reporting systems that varyin scope, format, definitions, and type of respondents.
Note 6. Natural Gas Consumption. Natural gasconsumption statistics include data for the following: “Resi-dential Sector”: residential deliveries; “Commercial Sector”:commercial deliveries, including to commercial combined-heat-and-power (CHP) and commercial electricity-onlyplants; “Industrial Sector”: lease and plant fuel use, andother industrial deliveries, including to industrial CHP andindustrial electricity-only plants; “Transportation Sector”:pipelines and distribution use, and vehicle fuel use; and“Electric Power Sector”: electric utility and independentpower producer use.
Final data for series other than “Other Industrial CHP” and“Electric Power Sector” are from EIA’s Natural Gas Annual(NGA). Monthly data are considered preliminary until afterpublication of the NGA. For more detailed information on themethods of estimating preliminary and final monthly data, seeEIA’s Natural Gas Monthly.
Note 7. Natural Gas Consumption, 1989–1992. Prior to1993, deliveries to nonutility generators were not sepa-rately collected from natural gas companies on Form EIA-176, “Annual Report of Natural and Supplemental GasSupply and Disposition.” As a result, for 1989–1992,those volumes are probably included in both the industrialand electric power sectors and double-counted in total
consumption. In 1993, 0.28 trillion cubic feet wasreported as delivered to nonutility generators.
Note 8. Natural Gas Data Adjustments, 1993–2000. For1993–2000, the original data for natural gas delivered toindustrial consumers (now “Other Industrial” in Table 4.3)included deliveries to both industrial users and independentpower producers (IPPs). These data were adjusted toremove the estimated consumption at IPPs from “OtherIndustrial” and include it with electric utilities under “Elec-tric Power Sector.” (To estimate the monthly IPP consumption,the monthly pattern for Other Industrial CHP in Table 4.3 wasused.)
For 1996–2000, monthly data for several natural gas seriesshown in EIA’s Natural Gas Navigator (seehttp://www.eia.gov/dnav/ng/ng_cons_sum_dcu_nus_m.htm)were not reconciled and updated to be consistent with thefinal annual data in EIA’s Natural Gas Annual. In addition,very small amounts of LNG arrived from Canada in 1973(667 million cubic feet), 1977 (572 million cubic feet), 1981(6 million cubic feet), and 2013 (88 million cubic feet). TheTable 4.1 data series (and years) that were adjusted are: Gross Withdrawals (1996, 1997), Marketed Production(1997), Extraction Loss (1997, 1998, 2000), Dry Gas Produc-tion (1996, 1997), Supplemental Gaseous Fuels (1997–2000),Balancing Item (1997–2000), and Total Consumption(1997–2000). The Table 4.3 data series (and years) that wereadjusted are: Lease and Plant Fuel (1997–2000), Total Indus-trial (1997–2000), Pipelines and Distribution (2000), TotalTransportation (2000), and Total Consumption (1997–2000).
Note 9. Natural Gas Imports and Exports. The UnitedStates imports natural gas via pipeline from Canada andMexico; and imports liquefied natural gas (LNG) viatanker from Algeria, Australia, Brunei, Egypt, EquatorialGuinea, Indonesia, Malaysia, Nigeria, Norway, Oman,Peru, Qatar, Trinidad and Tobago, the United Arab Emir-ates, and Yemen. In addition, very small amounts of LNGarrived from Canada in 1973 (667 million cubic feet),1977 (572 million cubic feet), 1981 (6 million cubic feet),and 2013 (228 million cubic feet). The United Statesexports natural gas via pipeline to Canada and Mexico;and exports LNG via tanker to Brazil, China, Chile, India,Japan, Russia, South Korea, Spain, and United Kingdom.Also, small amounts of LNG have gone to Mexico since1998 and to Canada in 2007, 2012, and 2013. Smallamounts of compressed natural gas have been exported toCanada since 2013.
Annual and final monthly data are from the annual EIAForm FPC-14, “Annual Report for Importers and Exportersof Natural Gas,” which requires data to be reported bymonth for the calendar year.
Preliminary monthly data are EIA estimates. For a discussionof estimation procedures, see EIA’s Natural Gas Monthly.Preliminary data are revised after publication of EIA’s U.S.Imports and Exports of Natural Gas.
74 U.S. Energy Information Administration / Monthly Energy Review December 2013

5. Crude Oil and Natural Gas Resource Development
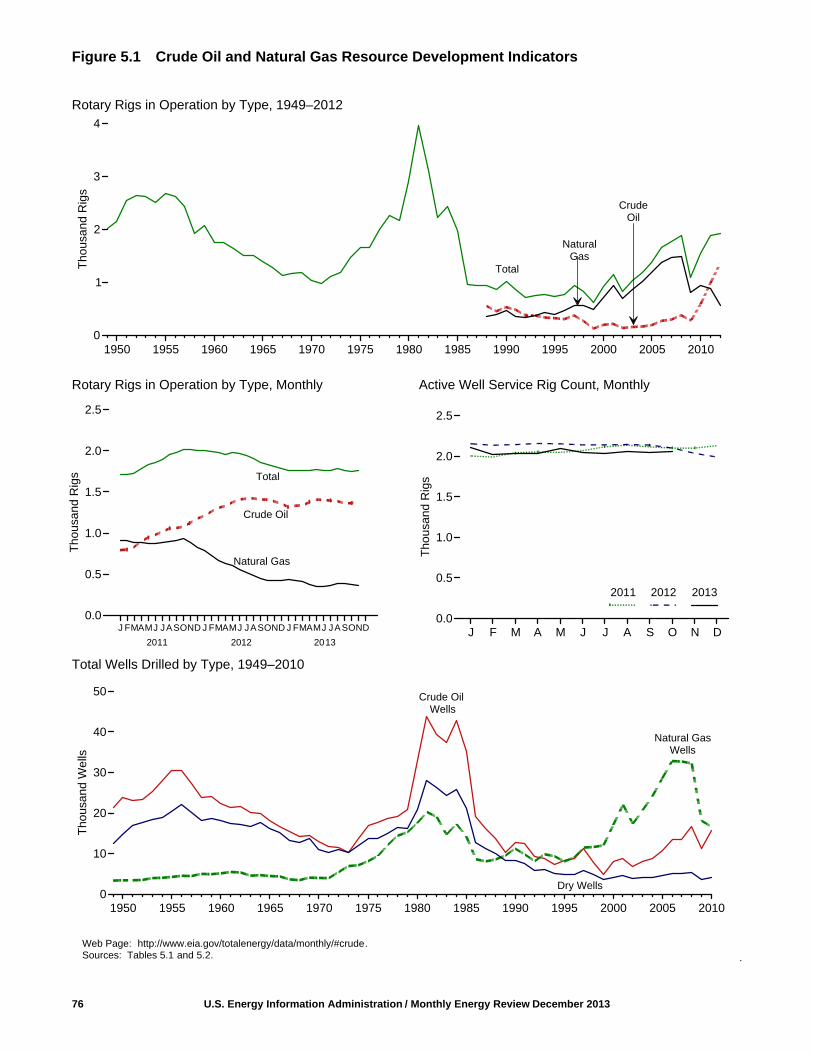
Figure 5.1 Crude Oil and Natural Gas Resource Development Indicators
Rotary Rigs in Operation by Type, 1949–2012
Rotary Rigs in Operation by Type, Monthly Active Well Service Rig Count, Monthly
Total Wells Drilled by Type, 1949–2010
.
76 U.S. Energy Information Administration / Monthly Energy Review December 2013
Total
1950 1955 1960 1965 1970 1975 1980 1985 1990 1995 2000 2005 20100
1
2
3
4
Tho
usan
d R
igs
1950 1955 1960 1965 1970 1975 1980 1985 1990 1995 2000 2005 20100
10
20
30
40
50
Tho
usan
d W
ells
Dry Wells
Crude OilWells
Web Page: http://www.eia.gov/totalenergy/data/monthly/#crude.Sources: Tables 5.1 and 5.2.
CrudeOil
J FMAMJ JASOND J FMAMJ JASOND J FMAMJ JASOND0.0
0.5
1.0
1.5
2.0
2.5
Tho
usan
d R
igs
Natural Gas
Total
Crude Oil
NaturalGas
J F M A M J J A S O N D0.0
0.5
1.0
1.5
2.0
2.5T
hous
and
Rig
s
2011 2012 2013
Natural GasWells
2011 2012 2013
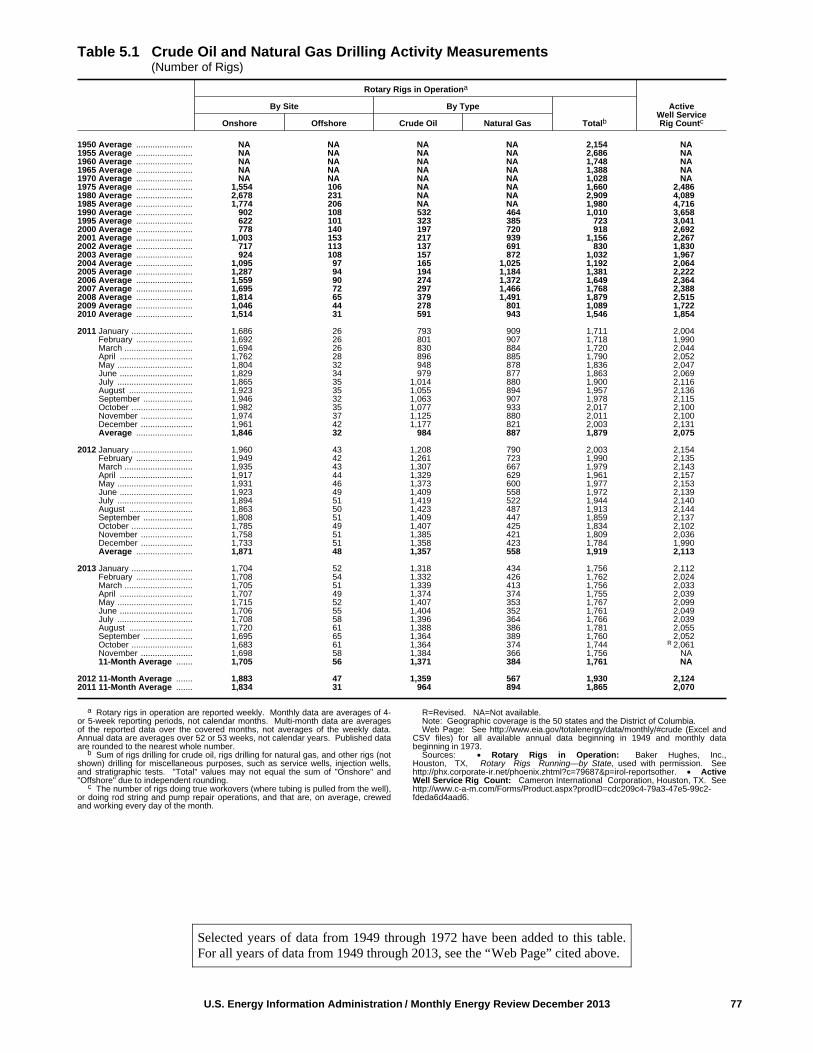
U.S. Energy Information Administration / Monthly Energy Review December 2013 77
Table 5.1 Crude Oil and Natural Gas Drilling Activity Measurements (Number of Rigs)
Rotary Rigs in Operationa
ActiveWell ServiceRig Countc
By Site By Type
TotalbOnshore Offshore Crude Oil Natural Gas
1950 Average ........................ NA NA NA NA 2,154 NA1955 Average ........................ NA NA NA NA 2,686 NA1960 Average ........................ NA NA NA NA 1,748 NA1965 Average ........................ NA NA NA NA 1,388 NA1970 Average ........................ NA NA NA NA 1,028 NA1975 Average ........................ 1,554 106 NA NA 1,660 2,4861980 Average ........................ 2,678 231 NA NA 2,909 4,0891985 Average ........................ 1,774 206 NA NA 1,980 4,7161990 Average ........................ 902 108 532 464 1,010 3,6581995 Average ........................ 622 101 323 385 723 3,0412000 Average ........................ 778 140 197 720 918 2,6922001 Average ........................ 1,003 153 217 939 1,156 2,2672002 Average ........................ 717 113 137 691 830 1,8302003 Average ........................ 924 108 157 872 1,032 1,9672004 Average ........................ 1,095 97 165 1,025 1,192 2,0642005 Average ........................ 1,287 94 194 1,184 1,381 2,2222006 Average ........................ 1,559 90 274 1,372 1,649 2,3642007 Average ........................ 1,695 72 297 1,466 1,768 2,3882008 Average ........................ 1,814 65 379 1,491 1,879 2,5152009 Average ........................ 1,046 44 278 801 1,089 1,7222010 Average ........................ 1,514 31 591 943 1,546 1,854
2011 January .......................... 1,686 26 793 909 1,711 2,004 February ........................ 1,692 26 801 907 1,718 1,990 March ............................. 1,694 26 830 884 1,720 2,044 April ............................... 1,762 28 896 885 1,790 2,052 May ................................ 1,804 32 948 878 1,836 2,047 June ............................... 1,829 34 979 877 1,863 2,069 July ................................ 1,865 35 1,014 880 1,900 2,116 August ........................... 1,923 35 1,055 894 1,957 2,136 September ..................... 1,946 32 1,063 907 1,978 2,115 October .......................... 1,982 35 1,077 933 2,017 2,100 November ...................... 1,974 37 1,125 880 2,011 2,100 December ...................... 1,961 42 1,177 821 2,003 2,131 Average ........................ 1,846 32 984 887 1,879 2,075
2012 January .......................... 1,960 43 1,208 790 2,003 2,154 February ........................ 1,949 42 1,261 723 1,990 2,135 March ............................. 1,935 43 1,307 667 1,979 2,143 April ............................... 1,917 44 1,329 629 1,961 2,157 May ................................ 1,931 46 1,373 600 1,977 2,153 June ............................... 1,923 49 1,409 558 1,972 2,139 July ................................ 1,894 51 1,419 522 1,944 2,140 August ........................... 1,863 50 1,423 487 1,913 2,144 September ..................... 1,808 51 1,409 447 1,859 2,137 October .......................... 1,785 49 1,407 425 1,834 2,102 November ...................... 1,758 51 1,385 421 1,809 2,036 December ...................... 1,733 51 1,358 423 1,784 1,990 Average ........................ 1,871 48 1,357 558 1,919 2,113
2013 January .......................... 1,704 52 1,318 434 1,756 2,112 February ........................ 1,708 54 1,332 426 1,762 2,024 March ............................. 1,705 51 1,339 413 1,756 2,033 April ............................... 1,707 49 1,374 374 1,755 2,039 May ................................ 1,715 52 1,407 353 1,767 2,099 June ............................... 1,706 55 1,404 352 1,761 2,049 July ................................ 1,708 58 1,396 364 1,766 2,039 August ........................... 1,720 61 1,388 386 1,781 2,055 September ..................... 1,695 65 1,364 389 1,760 2,052 October .......................... 1,683 61 1,364 374 1,744 R 2,061 November ...................... 1,698 58 1,384 366 1,756 NA 11-Month Average ....... 1,705 56 1,371 384 1,761 NA
2012 11-Month Average ....... 1,883 47 1,359 567 1,930 2,1242011 11-Month Average ....... 1,834 31 964 894 1,865 2,070
a Rotary rigs in operation are reported weekly. Monthly data are averages of 4-or 5-week reporting periods, not calendar months. Multi-month data are averagesof the reported data over the covered months, not averages of the weekly data.Annual data are averages over 52 or 53 weeks, not calendar years. Published dataare rounded to the nearest whole number.
b Sum of rigs drilling for crude oil, rigs drilling for natural gas, and other rigs (notshown) drilling for miscellaneous purposes, such as service wells, injection wells,and stratigraphic tests. "Total" values may not equal the sum of "Onshore" and"Offshore" due to independent rounding.
c The number of rigs doing true workovers (where tubing is pulled from the well),or doing rod string and pump repair operations, and that are, on average, crewedand working every day of the month.
R=Revised. NA=Not available. Note: Geographic coverage is the 50 states and the District of Columbia.Web Page: See http://www.eia.gov/totalenergy/data/monthly/#crude (Excel and
CSV files) for all available annual data beginning in 1949 and monthly databeginning in 1973.
Sources: • Rotary Rigs in Operation: Baker Hughes, Inc.,Houston, TX, Rotary Rigs Running—by State, used with permission. Seehttp://phx.corporate-ir.net/phoenix.zhtml?c=79687&p=irol-reportsother. • ActiveWell Service Rig Count: Cameron International Corporation, Houston, TX. Seehttp://www.c-a-m.com/Forms/Product.aspx?prodID=cdc209c4-79a3-47e5-99c2-fdeda6d4aad6.
Selected years of data from 1949 through 1972 have been added to this table.For all years of data from 1949 through 2013, see the “Web Page” cited above.

78 U.S. Energy Information Administration / Monthly Energy Review December 2013
Selected years of data from 1949 through 1972 have been added to this table.For all years of data from 1949 through 2010, see the “Web Page” cited above.
Data for 2011 forward in this table have been removed while EIA evaluates thequality of the data and the estimation methodology.
Table 5.2 Crude Oil and Natural Gas Exploratory and Development Wells
Wells Drilled
TotalFootageDrilled
Exploratory Development Total
CrudeOil
NaturalGas Dry Total
CrudeOil
NaturalGas Dry Total
CrudeOil
NaturalGas Dry Total
NumberThousand
Feet
1950 Total .................... 1,583 431 8,292 10,306 22,229 3,008 6,507 31,744 23,812 3,439 14,799 42,050 157,3581955 Total .................... 2,236 874 11,832 14,942 28,196 3,392 8,620 40,208 30,432 4,266 20,452 55,150 226,1821960 Total .................... 1,321 868 9,515 11,704 20,937 4,281 8,697 33,915 22,258 5,149 18,212 45,619 192,1761965 Total .................... 946 515 8,005 9,466 17,119 3,967 8,221 29,307 18,065 4,482 16,226 38,773 174,8821970 Total .................... 757 477 6,162 7,396 12,211 3,534 4,869 20,614 12,968 4,011 11,031 28,010 138,5561975 Total .................... 982 1,248 7,129 9,359 15,966 6,879 6,517 29,362 16,948 8,127 13,646 38,721 180,4941980 Total .................... 1,777 2,099 9,081 12,957 31,182 15,362 11,704 58,248 32,959 17,461 20,785 71,205 316,9431985 Total .................... 1,680 1,200 8,954 11,834 33,581 13,124 12,257 58,962 35,261 14,324 21,211 70,796 314,4091990 Total .................... 778 811 3,652 5,241 12,061 10,435 4,593 27,089 12,839 11,246 8,245 32,330 156,0441995 Total .................... 570 558 2,024 3,152 7,678 7,524 2,790 17,992 8,248 8,082 4,814 21,144 117,1562000 Total .................... 288 657 1,341 2,286 7,802 16,394 2,805 27,001 8,090 17,051 4,146 29,287 144,4252001 Total .................... 357 1,052 1,733 3,142 8,531 21,020 2,865 32,416 8,888 22,072 4,598 35,558 180,1412002 Total .................... 258 844 1,282 2,384 6,517 16,498 2,472 25,487 6,775 17,342 3,754 27,871 145,1592003 Total .................... 350 997 1,297 2,644 7,779 19,725 2,685 30,189 8,129 20,722 3,982 32,833 177,2392004 Total .................... 383 1,671 1,350 3,404 8,406 22,515 2,732 33,653 8,789 24,186 4,082 37,057 204,2792005 Total .................... 539 2,141 1,462 4,142 10,240 26,449 3,191 39,880 10,779 28,590 4,653 44,022 240,3072006 Total .................... 646 2,456 1,547 4,649 12,739 30,382 3,659 46,780 13,385 32,838 5,206 51,429 282,6752007 Total .................... 808 2,794 1,582 5,184 12,563 29,925 3,399 45,887 13,371 32,719 4,981 51,071 301,515
2008 January ................ 88 208 144 440 1,111 2,321 272 3,704 1,199 2,529 416 4,144 25,306 February .............. 82 230 107 419 1,080 2,261 247 3,588 1,162 2,491 354 4,007 24,958 March ................... 66 216 127 409 1,132 2,363 271 3,766 1,198 2,579 398 4,175 26,226 April ..................... 68 189 130 387 1,177 2,415 281 3,873 1,245 2,604 411 4,260 26,920 May ...................... 88 206 124 418 1,317 2,449 240 4,006 1,405 2,655 364 4,424 27,947 June ..................... 63 195 139 397 1,428 2,540 299 4,267 1,491 2,735 438 4,664 28,739 July ...................... 79 163 171 413 1,439 2,695 344 4,478 1,518 2,858 515 4,891 29,140 August ................. 67 165 144 376 1,448 2,735 379 4,562 1,515 2,900 523 4,938 28,942 September ........... 52 166 164 382 1,488 2,667 355 4,510 1,540 2,833 519 4,892 28,960 October ................ 80 243 173 496 1,549 2,841 373 4,763 1,629 3,084 546 5,259 31,505 November ............ 97 192 160 449 1,361 2,418 334 4,113 1,458 2,610 494 4,562 29,276 December ............ 67 172 132 371 1,206 2,196 313 3,715 1,273 2,368 445 4,086 26,222 Total .................... 897 2,345 1,715 4,957 15,736 29,901 3,708 49,345 16,633 32,246 5,423 54,302 334,141
2009 January ................ 80 171 99 350 1,192 2,253 250 3,695 1,272 2,424 349 4,045 28,077 February .............. 62 125 88 275 991 1,925 195 3,111 1,053 2,050 283 3,386 25,440 March ................... 59 146 88 293 867 1,771 210 2,848 926 1,917 298 3,141 25,304 April ..................... 36 68 93 197 755 1,396 205 2,356 791 1,464 298 2,553 21,406 May ...................... 47 90 80 217 584 1,136 156 1,876 631 1,226 236 2,093 20,055 June ..................... 44 91 75 210 804 1,297 189 2,290 848 1,388 264 2,500 16,301 July ...................... 40 100 101 241 789 1,188 217 2,194 829 1,288 318 2,435 13,543 August ................. 49 84 88 221 867 1,372 207 2,446 916 1,456 295 2,667 15,970 September ........... 61 71 96 228 945 1,170 207 2,322 1,006 1,241 303 2,550 15,547 October ................ 55 79 78 212 966 1,167 222 2,355 1,021 1,246 300 2,567 17,261 November ............ 38 83 85 206 931 1,133 199 2,263 969 1,216 284 2,469 16,236 December ............ 34 98 84 216 894 1,074 213 2,181 928 1,172 297 2,397 16,424 Total .................... 605 1,206 1,055 2,866 10,585 16,882 2,470 29,937 11,190 18,088 3,525 32,803 231,562
2010 January ................ 55 91 81 227 898 1,264 169 2,331 953 1,355 250 2,558 15,304 February .............. 44 71 67 182 871 1,096 144 2,111 915 1,167 211 2,293 16,862 March ................... 59 85 88 232 1,062 1,224 216 2,502 1,121 1,309 304 2,734 15,102 April ..................... 49 78 77 204 1,173 1,152 249 2,574 1,222 1,230 326 2,778 17,904 May ...................... 48 107 86 241 1,282 1,208 255 2,745 1,330 1,315 341 2,986 17,987 June ..................... 61 100 90 251 1,385 1,250 302 2,937 1,446 1,350 392 3,188 19,408 July ...................... 46 103 105 254 1,386 1,443 390 3,219 1,432 1,546 495 3,473 20,847 August ................. 56 104 94 254 1,434 1,402 314 3,150 1,490 1,506 408 3,404 22,923 September ........... 57 73 88 218 1,374 1,358 268 3,000 1,431 1,431 356 3,218 23,037 October ................ 75 87 117 279 1,502 1,463 283 3,248 1,577 1,550 400 3,527 22,123 November ............ 62 114 103 279 1,400 1,352 263 3,015 1,462 1,466 366 3,294 24,561 December ............ 57 92 70 219 1,317 1,379 243 2,939 1,374 1,471 313 3,158 23,189 Total .................... 669 1,105 1,066 2,840 15,084 15,591 3,096 33,771 15,753 16,696 4,162 36,611 239,247
Notes: • Data are estimates. • For 1960–1969, data are for well completionreports received by the American Petroleum Institute during the reporting year; forall other years, data are for well completions in a given year. • Through 1989,these well counts include only the original drilling of a hole intended to discover orfurther develop already discovered crude oil or natural gas resources. Other drillingactivities, such as drilling an old well deeper, drilling of laterals from the originalwell, drilling of service and injection wells, and drilling for resources other thancrude oil or natural gas are excluded. Beginning in 1990, a new well is defined asthe first hole in the ground whether it is lateral or not. Due to the methodology usedto estimate ultimate well counts from the available partially reported data, thecounts shown on this page are frequently revised. See Note, "Crude Oil and
Natural Gas Exploratory and Development Wells," at end of section. • Geographiccoverage is the 50 states and the District of Columbia.
Web Page: See http://www.eia.gov/totalenergy/data/monthly/#crude (Excel andCSV files) for all available annual data beginning in 1949 and monthly databeginning in 1973.
Sources: • 1949–1965: Gulf Publishing Company, World Oil,"Forecast-Review" issue. • 1966–1969: American Petroleum Institute (API),Quarterly Review of Drilling Statistics for the United States, annual summaries andmonthly reports. • 1970–1989: U.S. Energy Information Administration (EIA)computations based on well reports submitted to the API. • 1990 forward: EIAcomputations based on well reports submitted to IHS, Inc., Denver, CO.

Crude Oil and Natural Gas ResourceDevelopment
Note. Crude Oil and Natural Gas Exploratory andDevelopment Wells. Three well types are considered in theMonthly Energy Review (MER) drilling statistics:“completed for crude oil,” “completed for natural gas,” and“dry hole.” Wells that productively encounter both crudeoil and natural gas are categorized as “completed for crudeoil.” Both development wells and exploratory wells (newfield wildcats, new pool tests, and extension tests) areincluded in the statistics. All other classes of wells drilled inconnection with the search for producible hydrocarbons areexcluded. If a lateral is drilled at the same time as the originalhole it is not counted separately, but its footage is included.
Prior to the March 1985 MER, drilling statistics consisted of
completion data for the above types and classes of wells asreported to the American Petroleum Institute (API) during agiven month. Due to time lags between the date of wellcompletion and the date of completion reporting to the API,as-reported well completions proved to be an inaccurateindicator of drilling activity. During 1982, for example,as-reported well completions rose, while the number ofactual completions fell. Consequently, the drilling statisticspublished since the March 1985 MER are U.S. EnergyInformation Administration (EIA) estimates produced bystatistically imputing well counts and footage based on thepartial data available from the API. These estimates aresubject to continuous revision as new data, some of whichpertain to earlier months and years, become available.Additional information about the EIA estimationmethodology may be found in “Estimating WellCompletions,” a feature article published in the March 1985MER.
U.S. Energy Information Administration / Monthly Energy Review December 2013 79

THIS PAGE INTENTIONALLY LEFT BLANK
6. Coal
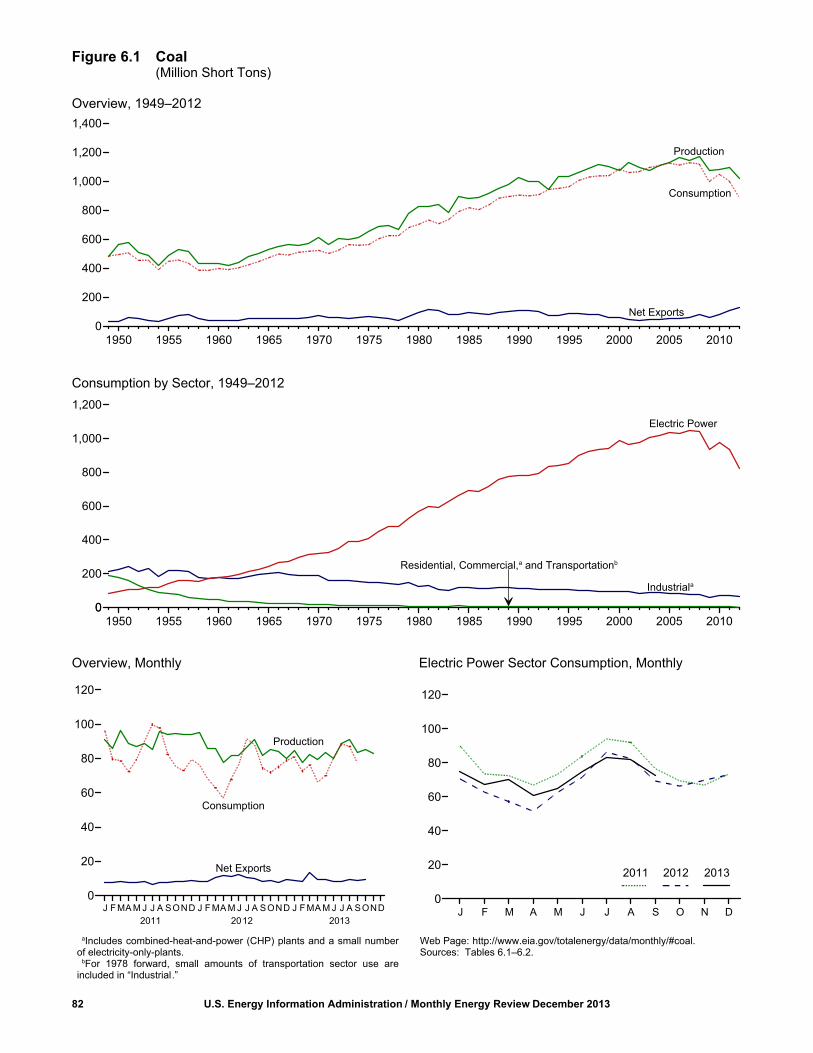
Figure 6.1 Coal(Million Short Tons)
Overview, 1949–2012
Consumption by Sector, 1949–2012
Overview, Monthly Electric Power Sector Consumption, Monthly
82 U.S. Energy Information Administration / Monthly Energy Review December 2013
2011 2012 2013
Electric Power
Consumption
J F MA M J J A SOND J F MA M J J A SOND J F MA M J J A SOND0
20
40
60
80
100
120
Net Exports
1950 1955 1960 1965 1970 1975 1980 1985 1990 1995 2000 2005 20100
200
400
600
800
1,000
1,200
1,400
aIncludes combined-heat-and-power (CHP) plants and a small numberof electricity-only-plants.
bFor 1978 forward, small amounts of transportation sector use areincluded in “Industrial.”
Web Page: http://www.eia.gov/totalenergy/data/monthly/#coal.Sources: Tables 6.1–6.2.
Production
Consumption
Net Exports
Production
1950 1955 1960 1965 1970 1975 1980 1985 1990 1995 2000 2005 20100
200
400
600
800
1,000
1,200
0
J F M A M J J A S O N D0
20
40
60
80
100
120
2011 2012 2013
Industriala
Residential, Commercial,a and Transportationb

U.S. Energy Information Administration / Monthly Energy Review December 2013 83
Table 6.1 Coal Overview (Thousand Short Tons)
Productiona
WasteCoal
Suppliedb
TradeStock
Changed,e
Losses andUnaccounted
fore,f ConsumptionImports Exports Net Importsc
1950 Total .................... 560,388 NA 365 29,360 -28,995 27,829 9,462 494,1021955 Total .................... 490,838 NA 337 54,429 -54,092 -3,974 -6,292 447,0121960 Total .................... 434,329 NA 262 37,981 -37,719 -3,194 1,722 398,0811965 Total .................... 526,954 NA 184 51,032 -50,848 1,897 2,244 471,9651970 Total .................... 612,661 NA 36 71,733 -71,697 11,100 6,633 523,2311975 Total .................... 654,641 NA 940 66,309 -65,369 32,154 -5,522 562,6401980 Total .................... 829,700 NA 1,194 91,742 -90,548 25,595 10,827 702,7301985 Total .................... 883,638 NA 1,952 92,680 -90,727 -27,934 2,796 818,0491990 Total .................... 1,029,076 3,339 2,699 105,804 -103,104 26,542 -1,730 904,4981995 Total .................... 1,032,974 8,561 9,473 88,547 -79,074 -275 632 962,1042000 Total .................... 1,073,612 9,089 12,513 58,489 -45,976 -48,309 938 1,084,0952001 Total .................... 1,127,689 10,085 19,787 48,666 -28,879 41,630 7,120 1,060,1462002 Total .................... 1,094,283 9,052 16,875 39,601 -22,726 10,215 4,040 1,066,3552003 Total .................... 1,071,753 10,016 25,044 43,014 -17,970 -26,659 -4,403 1,094,8612004 Total .................... 1,112,099 11,299 27,280 47,998 -20,718 -11,462 6,887 1,107,2552005 Total .................... 1,131,498 13,352 30,460 49,942 -19,482 -9,702 9,092 1,125,9782006 Total .................... 1,162,750 14,409 36,246 49,647 -13,401 42,642 8,824 1,112,2922007 Total .................... 1,146,635 14,076 36,347 59,163 -22,816 5,812 4,085 1,127,9982008 Total .................... 1,171,809 14,146 34,208 81,519 -47,311 12,354 5,740 1,120,5482009 Total .................... 1,074,923 13,666 22,639 59,097 -36,458 39,668 14,985 997,4782010 Total .................... 1,084,368 13,651 19,353 81,716 -62,363 -13,039 182 1,048,514
2011 January ................ 91,355 1,182 1,014 8,509 -7,496 -11,679 418 96,303 February .............. 85,575 1,046 843 8,275 -7,432 -3,306 2,917 79,577 March ................... 96,548 1,126 1,524 9,832 -8,308 3,991 6,608 78,767 April ..................... 88,563 996 1,136 8,843 -7,706 8,966 390 72,497 May ...................... 86,850 910 1,313 9,042 -7,730 2,393 -1,461 79,098 June ..................... 88,878 1,162 970 9,102 -8,132 -9,803 2,060 89,652 July ...................... 85,498 1,202 1,208 7,865 -6,657 -15,788 -3,788 99,618 August ................. 95,495 1,181 1,545 9,387 -7,843 -10,739 1,809 97,762 September ........... 94,013 1,117 835 8,723 -7,888 5,015 -113 82,341 October ................ 94,643 1,078 917 9,159 -8,242 13,552 -1,334 75,261 November ............ 94,109 1,133 807 8,808 -8,001 11,911 2,623 72,707 December ............ 94,101 1,076 976 9,713 -8,737 5,698 1,377 79,365 Total .................... 1,095,628 13,209 13,088 107,259 -94,171 211 11,506 1,002,948
2012 January ................ R 95,102 R 1,104 789 9,126 -8,337 R 3,832 R 7,745 R 76,292 February .............. R 85,914 R 926 534 8,460 -7,927 R 7,905 R 2,542 R 68,466 March ................... R 85,849 R 863 699 11,055 -10,356 R 9,618 R 3,663 R 63,075 April ..................... R 77,514 R 681 623 12,529 -11,905 R 7,132 R 2,260 R 56,899 May ...................... R 81,717 R 892 986 12,257 -11,271 R 419 R 2,905 R 68,015 June ..................... R 81,816 R 926 719 12,749 -12,030 R -5,461 R -469 R 76,642 July ...................... 86,321 R 1,058 894 11,623 -10,729 R -15,082 R 145 R 91,588 August ................. 90,816 R 1,039 667 10,597 -9,930 R -6,905 R 912 R 87,919 September ........... 81,818 R 885 855 9,344 -8,489 R 2,352 R -2,615 R 74,477 October ................ 85,239 R 796 868 9,421 -8,554 R 3,999 R 1,709 R 71,774 November ............ 84,147 R 1,090 798 8,516 -7,718 R 1,639 R 562 R 75,319 December ............ 80,205 R 934 727 10,068 -9,341 R -2,545 R -4,377 R 78,721 Total .................... R 1,016,458 R 11,196 9,159 125,746 -116,586 R 6,902 R 14,980 R 889,185
2013 January ................ 84,828 974 654 9,572 -8,917 R -6,615 R 2,767 80,732 February .............. 77,766 912 385 8,627 -8,242 -5,952 3,722 72,667 March ................... 82,464 1,101 390 13,637 -13,247 -5,677 -72 76,068 April ..................... 79,207 706 672 9,754 -9,082 R 1,188 R 3,394 66,249 May ...................... 83,664 983 870 10,478 -9,608 R 6,191 R -1,299 70,147 June ..................... 80,234 981 1,213 9,194 -7,981 R -8,501 R 1,278 80,458 July ...................... 88,909 F 1,069 874 9,125 -8,251 R -8,620 R 1,783 88,563 August ................. 90,830 F 1,069 710 10,073 -9,363 R -7,048 R 2,462 87,122 September ........... 83,770 RF 1,043 815 9,391 -8,576 R -2,323 R 890 R 77,670 October ................ 85,325 NA R 707 R 9,855 R -9,148 NA NA NA November ............ 82,815 NA NA NA NA NA NA NA 11-Month Total ... 919,812 NA NA NA NA NA NA NA
2012 11-Month Total ... 936,253 10,261 8,432 115,677 -107,246 9,447 19,357 810,4642011 11-Month Total ... 1,001,526 12,133 12,112 97,546 -85,434 -5,487 10,129 923,583
a Beginning in 2001, includes a small amount of refuse recovery (coalrecaptured from a refuse mine and cleaned to reduce the concentration ofnoncombustible materials).
b Waste coal (including fine coal, coal obtained from a refuse bank or slurrydam, anthracite culm, bituminous gob, and lignite waste) consumed by the electricpower and industrial sectors. Beginning in 1989, waste coal supplied is counted asa supply-side item to balance the same amount of waste coal included in"Consumption."
c Net imports equal imports minus exports. A minus sign indicates exports aregreater than imports.
d A negative value indicates a decrease in stocks and a positive value indicatesan increase. See Table 6.3 for stocks data coverage.
e In 1949, stock change is included in "Losses and Unaccounted for."f The difference between calculated coal supply and disposition, due to coal
quantities lost or to data reporting problems.R=Revised. NA=Not available. F=Forecast. Notes: • For methodology used to calculate production, consumption, and
stocks, see Note 1, "Coal Production," Note 2, "Coal Consumption," and Note 3,"Coal Stocks," at end of section. • Data values preceded by "F" are derived fromthe U.S. Energy Information Administration’s Short-Term Integrated ForecastingSystem. See Note 4, "Coal Forecast Values," at end of section. • Totals may notequal sum of components due to independent rounding. • Geographic coverage isthe 50 states and the District of Columbia.
Web Page: See http://www.eia.gov/totalenergy/data/monthly/#coal (Excel andCSV files) for all available annual data beginning in 1949 and monthly databeginning in 1973.
Sources: See end of section.
Selected years of data from 1949 through 1972 have been added to this table.For all years of data from 1949 through 2013, see the “Web Page” cited above.
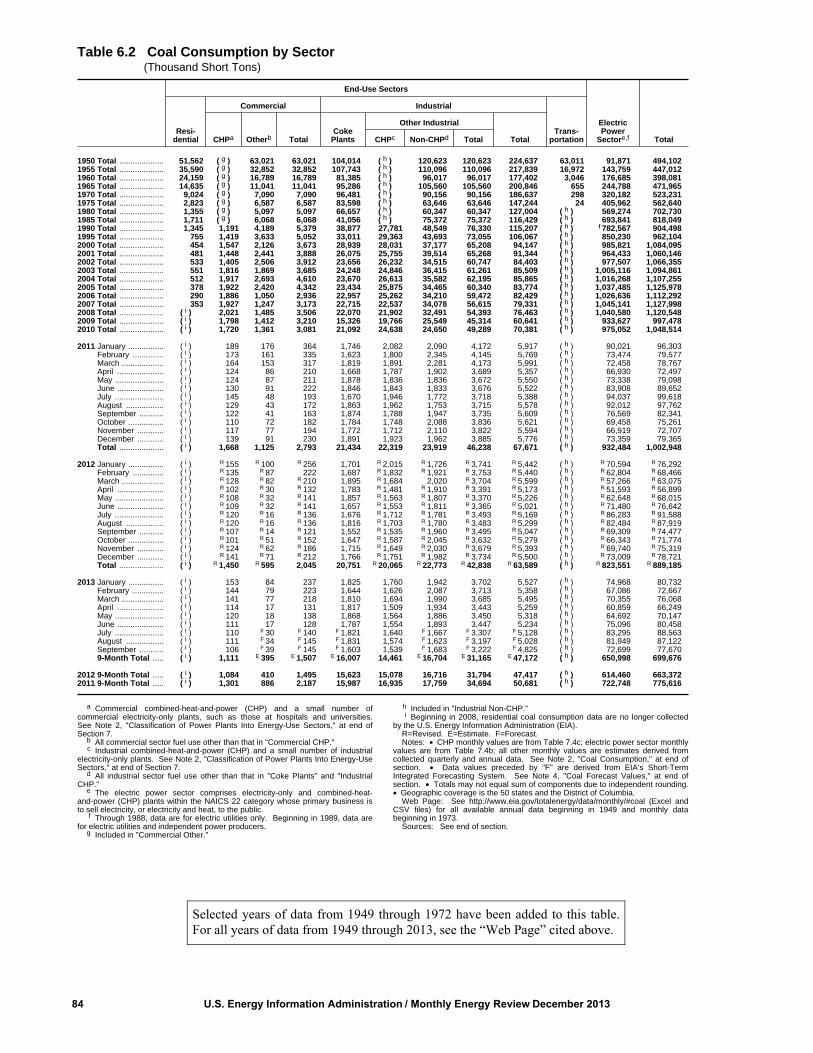
84 U.S. Energy Information Administration / Monthly Energy Review December 2013
Table 6.2 Coal Consumption by Sector (Thousand Short Tons)
End-Use Sectors
ElectricPower
Sectore,f TotalResi-
dential
Commercial Industrial
Trans-portationCHPa Otherb Total
CokePlants
Other Industrial
TotalCHPc Non-CHPd Total
1950 Total .................... 51,562 g( ) 63,021 63,021 104,014 h( ) 120,623 120,623 224,637 63,011 91,871 494,1021955 Total .................... 35,590 g( ) 32,852 32,852 107,743 h( ) 110,096 110,096 217,839 16,972 143,759 447,0121960 Total .................... 24,159 g( ) 16,789 16,789 81,385 h( ) 96,017 96,017 177,402 3,046 176,685 398,0811965 Total .................... 14,635 g( ) 11,041 11,041 95,286 h( ) 105,560 105,560 200,846 655 244,788 471,9651970 Total .................... 9,024 g( ) 7,090 7,090 96,481 h( ) 90,156 90,156 186,637 298 320,182 523,2311975 Total .................... 2,823 g( ) 6,587 6,587 83,598 h( ) 63,646 63,646 147,244 24 405,962 562,6401980 Total .................... 1,355 g( ) 5,097 5,097 66,657 h( ) 60,347 60,347 127,004 h( ) 569,274 702,7301985 Total .................... 1,711 g( ) 6,068 6,068 41,056 h( ) 75,372 75,372 116,429 h( ) 693,841 818,0491990 Total .................... 1,345 1,191 4,189 5,379 38,877 27,781 48,549 76,330 115,207 h( ) f 782,567 904,4981995 Total .................... 755 1,419 3,633 5,052 33,011 29,363 43,693 73,055 106,067 h( ) 850,230 962,1042000 Total .................... 454 1,547 2,126 3,673 28,939 28,031 37,177 65,208 94,147 h( ) 985,821 1,084,0952001 Total .................... 481 1,448 2,441 3,888 26,075 25,755 39,514 65,268 91,344 h( ) 964,433 1,060,1462002 Total .................... 533 1,405 2,506 3,912 23,656 26,232 34,515 60,747 84,403 h( ) 977,507 1,066,3552003 Total .................... 551 1,816 1,869 3,685 24,248 24,846 36,415 61,261 85,509 h( ) 1,005,116 1,094,8612004 Total .................... 512 1,917 2,693 4,610 23,670 26,613 35,582 62,195 85,865 h( ) 1,016,268 1,107,2552005 Total .................... 378 1,922 2,420 4,342 23,434 25,875 34,465 60,340 83,774 h( ) 1,037,485 1,125,9782006 Total .................... 290 1,886 1,050 2,936 22,957 25,262 34,210 59,472 82,429 h( ) 1,026,636 1,112,2922007 Total .................... 353 1,927 1,247 3,173 22,715 22,537 34,078 56,615 79,331 h( ) 1,045,141 1,127,9982008 Total .................... i( ) 2,021 1,485 3,506 22,070 21,902 32,491 54,393 76,463 h( ) 1,040,580 1,120,5482009 Total .................... i( ) 1,798 1,412 3,210 15,326 19,766 25,549 45,314 60,641 h( ) 933,627 997,4782010 Total .................... i( ) 1,720 1,361 3,081 21,092 24,638 24,650 49,289 70,381 h( ) 975,052 1,048,514
2011 January ................ i( ) 189 176 364 1,746 2,082 2,090 4,172 5,917 h( ) 90,021 96,303 February .............. i( ) 173 161 335 1,623 1,800 2,345 4,145 5,769 h( ) 73,474 79,577 March ................... i( ) 164 153 317 1,819 1,891 2,281 4,173 5,991 h( ) 72,458 78,767 April ..................... i( ) 124 86 210 1,668 1,787 1,902 3,689 5,357 h( ) 66,930 72,497 May ...................... i( ) 124 87 211 1,878 1,836 1,836 3,672 5,550 h( ) 73,338 79,098 June ..................... i( ) 130 91 222 1,846 1,843 1,833 3,676 5,522 h( ) 83,908 89,652 July ...................... i( ) 145 48 193 1,670 1,946 1,772 3,718 5,388 h( ) 94,037 99,618 August ................. i( ) 129 43 172 1,863 1,962 1,753 3,715 5,578 h( ) 92,012 97,762 September ........... i( ) 122 41 163 1,874 1,788 1,947 3,735 5,609 h( ) 76,569 82,341 October ................ i( ) 110 72 182 1,784 1,748 2,088 3,836 5,621 h( ) 69,458 75,261 November ............ i( ) 117 77 194 1,772 1,712 2,110 3,822 5,594 h( ) 66,919 72,707 December ............ i( ) 139 91 230 1,891 1,923 1,962 3,885 5,776 h( ) 73,359 79,365 Total .................... i( ) 1,668 1,125 2,793 21,434 22,319 23,919 46,238 67,671 h( ) 932,484 1,002,948
2012 January ................ i( ) R 155 R 100 R 256 1,701 R 2,015 R 1,726 R 3,741 R 5,442 h( ) R 70,594 R 76,292 February .............. i( ) R 135 R 87 222 1,687 R 1,832 R 1,921 R 3,753 R 5,440 h( ) R 62,804 R 68,466 March ................... i( ) R 128 R 82 R 210 1,895 R 1,684 2,020 R 3,704 R 5,599 h( ) R 57,266 R 63,075 April ..................... i( ) R 102 R 30 R 132 1,783 R 1,481 R 1,910 R 3,391 R 5,173 h( ) R 51,593 R 56,899 May ...................... i( ) R 108 R 32 R 141 1,857 R 1,563 R 1,807 R 3,370 R 5,226 h( ) R 62,648 R 68,015 June ..................... i( ) R 109 R 32 R 141 1,657 R 1,553 R 1,811 R 3,365 R 5,021 h( ) R 71,480 R 76,642 July ...................... i( ) R 120 R 16 R 136 1,676 R 1,712 R 1,781 R 3,493 R 5,169 h( ) R 86,283 R 91,588 August ................. i( ) R 120 R 16 R 136 1,816 R 1,703 R 1,780 R 3,483 R 5,299 h( ) R 82,484 R 87,919 September ........... i( ) R 107 R 14 R 121 1,552 R 1,535 R 1,960 R 3,495 R 5,047 h( ) R 69,309 R 74,477 October ................ i( ) R 101 R 51 R 152 1,647 R 1,587 R 2,045 R 3,632 R 5,279 h( ) R 66,343 R 71,774 November ............ i( ) R 124 R 62 R 186 1,715 R 1,649 R 2,030 R 3,679 R 5,393 h( ) R 69,740 R 75,319 December ............ i( ) R 141 R 71 R 212 1,766 R 1,751 R 1,982 R 3,734 R 5,500 h( ) R 73,009 R 78,721 Total .................... i( ) R 1,450 R 595 2,045 20,751 R 20,065 R 22,773 R 42,838 R 63,589 h( ) R 823,551 R 889,185
2013 January ................ i( ) 153 84 237 1,825 1,760 1,942 3,702 5,527 h( ) 74,968 80,732 February .............. i( ) 144 79 223 1,644 1,626 2,087 3,713 5,358 h( ) 67,086 72,667 March ................... i( ) 141 77 218 1,810 1,694 1,990 3,685 5,495 h( ) 70,355 76,068 April ..................... i( ) 114 17 131 1,817 1,509 1,934 3,443 5,259 h( ) 60,859 66,249 May ...................... i( ) 120 18 138 1,868 1,564 1,886 3,450 5,318 h( ) 64,692 70,147 June ..................... i( ) 111 17 128 1,787 1,554 1,893 3,447 5,234 h( ) 75,096 80,458 July ...................... i( ) 110 F 30 F 140 F 1,821 1,640 F 1,667 F 3,307 F 5,128 h( ) 83,295 88,563 August ................. i( ) 111 F 34 F 145 F 1,831 1,574 F 1,623 F 3,197 F 5,028 h( ) 81,949 87,122 September ........... i( ) 106 F 39 F 145 F 1,603 1,539 F 1,683 F 3,222 F 4,825 h( ) 72,699 77,670 9-Month Total ..... i( ) 1,111 E 395 E 1,507 E 16,007 14,461 E 16,704 E 31,165 E 47,172 h( ) 650,998 699,676
2012 9-Month Total ..... i( ) 1,084 410 1,495 15,623 15,078 16,716 31,794 47,417 h( ) 614,460 663,3722011 9-Month Total ..... i( ) 1,301 886 2,187 15,987 16,935 17,759 34,694 50,681 h( ) 722,748 775,616
a Commercial combined-heat-and-power (CHP) and a small number ofcommercial electricity-only plants, such as those at hospitals and universities.See Note 2, "Classification of Power Plants Into Energy-Use Sectors," at end ofSection 7.
b All commercial sector fuel use other than that in "Commercial CHP."c Industrial combined-heat-and-power (CHP) and a small number of industrial
electricity-only plants. See Note 2, "Classification of Power Plants Into Energy-UseSectors," at end of Section 7.
d All industrial sector fuel use other than that in "Coke Plants" and "IndustrialCHP."
e The electric power sector comprises electricity-only and combined-heat-and-power (CHP) plants within the NAICS 22 category whose primary business isto sell electricity, or electricity and heat, to the public.
f Through 1988, data are for electric utilities only. Beginning in 1989, data arefor electric utilities and independent power producers.
g Included in "Commercial Other."
h Included in "Industrial Non-CHP."i Beginning in 2008, residential coal consumption data are no longer collected
by the U.S. Energy Information Administration (EIA). R=Revised. E=Estimate. F=Forecast. Notes: • CHP monthly values are from Table 7.4c; electric power sector monthly
values are from Table 7.4b; all other monthly values are estimates derived fromcollected quarterly and annual data. See Note 2, "Coal Consumption," at end ofsection. • Data values preceded by "F" are derived from EIA’s Short-TermIntegrated Forecasting System. See Note 4, "Coal Forecast Values," at end ofsection. • Totals may not equal sum of components due to independent rounding.• Geographic coverage is the 50 states and the District of Columbia.
Web Page: See http://www.eia.gov/totalenergy/data/monthly/#coal (Excel andCSV files) for all available annual data beginning in 1949 and monthly databeginning in 1973.
Sources: See end of section.
Selected years of data from 1949 through 1972 have been added to this table.For all years of data from 1949 through 2013, see the “Web Page” cited above.

U.S. Energy Information Administration / Monthly Energy Review December 2013 85
Table 6.3 Coal Stocks by Sector (Thousand Short Tons)
Producersand
Distributors
End-Use Sectors
ElectricPower
Sectorc,d Total
Residentialaand
Commercial
Industrial
TotalCoke Plants Otherb Total
1950 Year ..................... NA 2,462 16,809 26,182 42,991 45,453 31,842 77,2951955 Year ..................... NA 998 13,422 15,880 29,302 30,300 41,391 71,6911960 Year ..................... NA 666 11,122 11,637 22,759 23,425 51,735 75,1601965 Year ..................... NA 353 10,640 13,122 23,762 24,115 54,525 78,6401970 Year ..................... NA 300 9,045 11,781 20,826 21,126 71,908 93,0341975 Year ..................... 12,108 233 8,797 8,529 17,326 17,559 110,724 140,3911980 Year ..................... 24,379 NA 9,067 11,951 21,018 21,018 183,010 228,4071985 Year ..................... 33,133 NA 3,420 10,438 13,857 13,857 156,376 203,3671990 Year ..................... 33,418 NA 3,329 8,716 12,044 12,044 156,166 201,6291995 Year ..................... 34,444 NA 2,632 5,702 8,334 8,334 126,304 169,0832000 Year ..................... 31,905 NA 1,494 4,587 6,081 6,081 d 102,296 140,2822001 Year ..................... 35,900 NA 1,510 6,006 7,516 7,516 138,496 181,9122002 Year ..................... 43,257 NA 1,364 5,792 7,156 7,156 141,714 192,1272003 Year ..................... 38,277 NA 905 4,718 5,623 5,623 121,567 165,4682004 Year ..................... 41,151 NA 1,344 4,842 6,186 6,186 106,669 154,0062005 Year ..................... 34,971 NA 2,615 5,582 8,196 8,196 101,137 144,3042006 Year ..................... 36,548 NA 2,928 6,506 9,434 9,434 140,964 186,9462007 Year ..................... 33,977 NA 1,936 5,624 7,560 7,560 151,221 192,7582008 Year ..................... 34,688 498 2,331 6,007 8,338 8,836 161,589 205,1122009 Year ..................... 47,718 529 1,957 5,109 7,066 7,595 189,467 244,7802010 Year ..................... 49,820 552 1,925 4,525 6,451 7,003 174,917 231,740
2011 January ................ 48,709 536 1,937 4,305 6,241 6,777 164,575 220,061 February .............. 49,140 520 1,948 4,084 6,032 6,552 161,064 216,755 March ................... 48,165 503 1,959 3,864 5,823 6,326 166,255 220,746 April ..................... 49,852 505 1,958 3,969 5,927 6,433 173,427 229,712 May ...................... 51,473 508 1,957 4,075 6,032 6,539 174,093 232,105 June ..................... 50,507 510 1,956 4,181 6,136 6,646 165,149 222,302 July ...................... 52,420 513 2,082 4,203 6,285 6,798 147,296 206,514 August ................. 50,287 515 2,221 4,225 6,446 6,961 138,527 195,775 September ........... 49,909 518 2,405 4,247 6,652 7,170 143,711 200,790 October ................ 50,810 546 2,473 4,316 6,790 7,336 156,196 214,342 November ............ 50,997 575 2,541 4,386 6,927 7,502 167,754 226,253 December ........... 51,897 603 2,610 4,455 7,065 7,668 172,387 231,951
2012 January ................ R 48,318 587 2,507 R 4,280 R 6,786 R 7,374 R 180,091 R 235,783 February .............. R 49,743 572 2,403 R 4,104 R 6,508 R 7,080 R 186,866 R 243,688 March ................... R 51,141 557 2,300 R 3,929 R 6,229 R 6,786 R 195,380 R 253,307 April ..................... R 51,283 566 2,299 R 4,025 R 6,324 R 6,890 R 202,265 R 260,439 May ...................... R 50,726 575 2,297 R 4,122 R 6,419 R 6,995 R 203,137 R 260,858 June ..................... R 50,374 585 2,295 R 4,219 R 6,514 R 7,099 R 197,924 R 255,397 July ...................... R 49,120 589 2,329 R 4,318 R 6,647 R 7,236 R 183,958 R 240,314 August ................. R 47,499 592 2,363 R 4,418 R 6,781 R 7,373 R 178,537 R 233,409 September ........... R 46,231 596 2,396 R 4,518 R 6,914 R 7,510 R 182,020 R 235,761 October ................ R 45,830 592 2,438 R 4,504 R 6,942 R 7,534 R 186,396 R 239,760 November ............ R 45,550 587 2,480 R 4,489 R 6,970 R 7,557 R 188,291 R 241,398 December ........... R 46,157 583 2,522 R 4,475 R 6,997 R 7,581 R 185,116 R 238,853
2013 January ................ RF 44,632 565 2,417 4,305 6,722 7,288 180,318 R 232,238 February .............. RF 42,087 548 2,312 4,132 6,444 6,991 177,208 R 226,286 March ................... RF 40,673 530 2,207 3,958 6,165 6,695 173,241 R 220,609 April ..................... RF 41,922 529 2,305 3,963 6,267 6,797 173,078 R 221,797 May ...................... RF 43,112 529 2,402 3,967 6,370 6,899 177,977 R 227,988 June ..................... RF 41,735 528 2,500 3,972 6,472 7,000 170,751 R 219,487 July ...................... RF 43,263 F 530 F 2,458 F 4,213 F 6,671 F 7,201 160,403 R 210,867 August ................. RF 40,782 F 531 F 2,418 F 4,448 F 6,866 F 7,397 155,640 R 203,819 September ........... F 40,100 F 532 F 2,370 F 4,681 F 7,051 F 7,583 153,813 201,496
a Through 1979, data are for the residential and commercial sectors. Beginningin 2008, data are for the commercial sector only.
b Through 1979, data are for manufacturing plants and the transportation sector. For 1980–2007, data are for manufacturing plants only. Beginning in 2008, dataare for manufacturing plants and coal transformation/processing plants.
c The electric power sector comprises electricity-only and combined-heat-and-power (CHP) plants within the NAICS 22 category whose primary business is to sellelectricity, or electricity and heat, to the public.
d Through 1998, data are for electric utilities only. Beginning in 1999, data arefor electric utilities and independent power producers.
R=Revised. NA=Not available. F=Forecast. Notes: • Stocks are at end of period. • Electric power sector monthly values
are from Table 7.5; producers and distributors monthly values are estimatesderived from collected annual data; all other monthly values are estimates derivedfrom collected quarterly values. • Data values preceded by "F" are derived fromthe U.S. Energy Information Administration’s Short-Term Integrated ForecastingSystem. See Note 4, "Coal Forecast Values," at end of section. • Totals may notequal sum of components due to independent rounding. • Geographic coverage isthe 50 states and the District of Columbia.
Web Page: See http://www.eia.gov/totalenergy/data/monthly/#coal (Excel andCSV files) for all available annual data beginning in 1949 and monthly databeginning in 1973.
Sources: See end of section.
Selected years of data from 1949 through 1972 have been added to this table.For all years of data from 1949 through 2013, see the “Web Page” cited above.

Coal
Note 1. Coal Production. Preliminary monthly estimatesof national coal production are the sum of weekly estimatesdeveloped by the U.S. Energy Information Administration(EIA) and published in the Weekly Coal Production report.When a week extends into a new month, production is allo-cated on a daily basis and added to the appropriate month.Weekly estimates are based on Association of AmericanRailroads (AAR) data showing the number of railcarsloaded with coal during the week by Class I and certainother railroads.
Through 2001, the weekly coal production model convertedAAR data into short tons of coal by using the averagenumber of short tons of coal per railcar loaded reported inthe “Quarterly Freight Commodity Statistics” from theSurface Transportation Board. If an average coal tonnageper railcar loaded was not available for a specific railroad,the national average was used. To derive the estimate oftotal weekly production, the total rail tonnage for the weekwas divided by the ratio of quarterly production shipped byrail and total quarterly production. Data for the correspond-ing quarter of previous years were used to derive this ratio.This method ensured that the seasonal variations werepreserved in the production estimates.
Beginning in 2002, the weekly coal production model usesstatistical autoregressive methods to estimate national coalproduction as a function of railcar loadings of coal, andheating degree-days and cooling degree-days. On Thursdayof each week, EIA receives from the AAR data for theprevious week. The latest weekly national data for heatingdegree-days and cooling degree-days are obtained from theNational Oceanic and Atmospheric Administration’sClimate Prediction Center. The weekly coal model is runand a national level coal production estimate is obtained.The weekly coal model is refit every quarter after prelimi-nary coal data are available.
When preliminary quarterly data become available, themonthly and weekly estimates are adjusted to conform to thequarterly figures. The adjustment procedure uses state-levelproduction data and is explained athttp://www.eia.gov/coal/production/weekly/. Initial esti-mates of annual production published in January of thefollowing year are based on preliminary production datacovering the first nine months (three quarters) andweekly/monthly estimates for the fourth quarter. All quar-terly, monthly, and weekly production figures are adjustedto conform to the final annual production data published inthe Monthly Energy Review in the fall of the following year.
Note 2. Coal Consumption. Forecast data (designated byan “F”) are derived from forecasted values shown in EIA’sShort-Term Energy Outlook (DOE/EIA-0202) table titled“U.S. Coal Supply and Demand: Base Case.” The monthlyestimates are based on the quarterly values, which arereleased in March, June, September, and December. The
estimates are revised quarterly as collected data become avail-able from the data sources. Sector-specific informationfollows.
Residential and Commercial—Through 2007, coal consump-tion by the residential and commercial sectors is reported toEIA for the two sectors combined; EIA estimates the amountconsumed by the sectors individually. To create theestimates, it is first assumed that an occupied coal-heatedhousing unit consumes fuel at the same Btu rate as an oil-heated housing unit. Then, for the years in which data areavailable on the number of occupied housing units by heat-ing source (1973–1981 and subsequent odd-numberedyears), residential consumption of coal is estimated usingthe following steps: a ratio is created of the number ofoccupied housing units heated by coal to the number ofoccupied housing units heated by oil; that ratio is then multi-plied by the Btu quantity of oil consumed by the residentialsector to derive an estimate of the Btu quantity of coalconsumed by the residential sector; and, finally, the amountestimated as the residential sector consumption is subtractedfrom the residential and commercial sectors’ combinedconsumption to derive the commercial sector’s estimatedconsumption. Beginning in 2008, residential coal consump-tion data are not collected by EIA, and commercial coalconsumption data are taken directly from reported data.
Industrial Coke Plants—Through 1979, monthly coke plantconsumption data were taken directly from reported data.For 1980–1987, coke plant consumption estimates werederived by proportioning reported quarterly data by usingthe ratios of monthly-to-quarterly consumption data in 1979,the last year in which monthly data were reported. Begin-ning in 1988, monthly coke plant consumption estimates arederived from the reported quarterly data by using monthlyratios of raw steel production data from the American Ironand Steel Institute. The ratios are the monthly raw steelproduction from open hearth and basic oxygen processfurnaces as a proportion of the quarterly production fromthose kinds of furnaces.
Industrial Other—Through 1977, monthly consumption datafor the other industrial sector (all industrial users minuscoke plants) were derived by using reported data to modifybaseline consumption figures from the most recent Bureauof the Census Annual Survey of Manufactures or Census ofManufactures. For 1978 and 1979, monthly estimateswere derived from data reported on Forms EIA-3 and EIA-6. For 1980–1987, monthly figures were estimated byproportioning quarterly data by using the ratios ofmonthly-to-quarterly consumption data in 1979, the lastyear in which monthly data were reported on Form EIA-3.Beginning in 1988, monthly consumption for the otherindustrial sector is estimated from reported quarterly databy using ratios derived from industrial production indicespublished by the Board of Governors of the FederalReserve System. Indices for six major industry groups areused as the basis for calculating the ratios: food manufac-turing, which is North American Industry ClassificationSystem (NAICS) code 311; paper manufacturing, NAICS
86 U.S. Energy Information Administration / Monthly Energy Review December 2013
322; chemical manufacturing, NAICS 325; petroleum andcoal products, NAICS 324; non-metallic mineral productsmanufacturing, NAICS 327; and primary metal manufactur-ing, NAICS 331. The monthly ratios are computed as themonthly sum of the weighted indices as a proportion of thequarterly sum of the weighted indices by using the 1977proportion as the weights. Through 2007, quarterlyconsumption data for the other industrial sector werederived by adding beginning stocks at manufacturing plantsto current receipts and subtracting ending stocks at manu-facturing plants. In this calculation, current receipts are thegreater of either reported receipts from manufacturingplants (Form EIA-3) or reported shipments to the otherindustrial sector (Form EIA-6), thereby ensuring that agri-culture, forestry, fishing, and construction consumptiondata were included where appropriate. Beginning in 2008,quarterly consumption totals for other industrial coalinclude data for manufacturing and mining only. Overtime, surveyed coal consumption data for agriculture,forestry, fishing, and construction dwindled to about20–30 thousand short tons annually. Therefore, in 2008,EIA consolidated its programs by eliminating agriculture,forestry, fishing, and construction as surveyed sectors.
Electric Power Sector—Monthly consumption data for elec-tric power plants are taken directly from reported data.
Note 3. Coal Stocks. Coal stocks data are reported bymajor end-use sector. Forecast data for the most recentmonths (designated by an “F”) are derived from forecastedvalues shown in EIA’s Short-Term Energy Outlook(DOE/EIA-0202) table titled “U.S. Coal Supply and Demand:Base Case.” The monthly estimates are based on the quar-terly values (released in March, June, September, and Decem-ber) or annual values. The estimates are revised as collecteddata become available from the data sources. Sector-specificinformation follows.
Producers and Distributors—Through 1997, quarterlystocks at producers and distributors were taken directlyfrom reported data. Monthly data were estimated byusing one-third of the current quarterly change to indicatethe monthly change in stocks. Beginning in 1998, end-of-year stocks are taken from reported data. Monthlystocks are estimated by a model.
Residential and Commercial—Through 1979, stock esti-mates for the residential and commercial sector weretaken directly from reported data. For 1980–2007, stockestimates were not collected. Beginning in 2008, quarterlycommercial (excluding residential) stocks data are collectedon Form EIA-3 (data for “Commercial and InstitutionalCoal Users”).
Industrial Coke Plants—Through 1979, monthly stocks atcoke plants were taken directly from reported data. Begin-ning in 1980, coke plant stocks are estimated by using one-third of the current quarterly change to indicate the monthly
change in stocks. Quarterly stocks are taken directly fromdata reported on Form EIA-5.
Industrial Other—Through 1977, stocks for the otherindustrial sector were derived by using reported data to modifybaseline figures from a one-time Bureau of Mines survey ofconsumers. For 1978–1982, monthly estimates were derivedby judgmentally proportioning reported quarterly data based onrepresentative seasonal patterns of supply and demand. Begin-ning in 1983, other industrial coal stocks are estimated as indi-cated above for coke plants. Quarterly stocks are taken directlyfrom data reported on Form EIA-3 and therefore include onlymanufacturing industries; data for agriculture, forestry, fishing,mining, and construction stocks are not available.
Electric Power Sector—Monthly stocks data at electricpower plants are taken directly from reported data.
Note 4. Coal Forecast Values. Data values preceded by “F”in this section are forecast values. They are derived from EIA’sShort-Term Integrated Forecasting System (STIFS). Themodel is driven primarily by data and assumptions about keymacroeconomic variables, the world oil price, and weather.The coal forecast relies on other variables as well, such as alter-native fuel prices (natural gas and oil) and power generation bysources other than fossil fuels, including nuclear and hydroelec-tric power. Each month, EIA staff review the model output andmake adjustments, if appropriate, based on their knowledge ofdevelopments in the coal industry.
The STIFS model results are published monthly in EIA’sShort-Term Energy Outlook, which is accessible on the Webat http://www.eia.gov/forecasts/steo/.
Table 6.1 Sources
Production1949–September 1977: U.S. Department of the Interior,Bureau of Mines, Minerals Yearbook and Minerals IndustrySurveys.October 1977 forward: U.S. Energy Information Admin-istration (EIA), Weekly Coal Production.
Waste Coal Supplied1989–1997: EIA, Form EIA-867, “Annual NonutilityPower Producer Report.”1998–2000: EIA, Form EIA-860B, “Annual ElectricGenerator Report—Nonutility.”2001–2003: EIA, Form EIA-906, “Power Plant Report,”and Form EIA-3, “Quarterly Coal Consumption and Qual-ity Report—Manufacturing Plants.”2004–2007: EIA, Form EIA-906, “Power Plant Report,” Form EIA-920, “Combined Heat and Power Plant Report,”and Form EIA-3, “Quarterly Coal Consumption and Qual-ity Report—Manufacturing Plants.” 2008 forward: EIA, Form EIA-923, “Power Plant OperationsReport,” and Form EIA-3, “Quarterly Coal Consumption andQuality Report—Manufacturing and Transformation/Processing
U.S. Energy Information Administration / Monthly Energy Review December 2013 87
Coal Plants and Commercial and Institutional Coal Users”; and,for forecast values, EIA, Short-Term Integrated ForecastingSystem.
Imports and Exports1949 forward: U.S. Department of Commerce, Bureau of theCensus, Monthly Reports IM 145 (Imports) and EM 545(Exports).
Stock Change1950 forward: Calculated from data in Table 6.3.
Losses and Unaccounted for1949 forward: Calculated as the sum of production, imports,and waste coal supplied, minus exports, stock change, andconsumption.
Consumption1949 forward: Table 6.2.
Table 6.2 Sources
Residential and Commercial TotalThrough 2007, coal consumption by the residential andcommercial sectors combined is reported to the U.S. EnergyInformation Administration (EIA). EIA estimates the sectorsindividually using the method described in Note 2, “Consump-tion,” at the end of Section 6. Data for the residential andcommercial sectors combined are from:
1949–1976: U.S. Department of the Interior (DOI), Bureau ofMines (BOM), Minerals Yearbook.January–September 1977: DOI, BOM, Form 6-1400, “MonthlyCoal Report, Retail Dealers—Upper Lake Docks.” October1977–1979: EIA, Form EIA-2, “Monthly Coal Report, RetailDealers—Upper Lake Docks.”1980–1997: EIA, Form EIA-6, “Coal Distribution Report,”quarterly.1998–2007: DOI, Mine Safety and Health Administration,Form 7000-2, “Quarterly Coal Consumption and QualityReport—Coke Plants.”
Commercial TotalBeginning in 2008, coal consumption by the commercial(excluding residential) sector is reported to EIA. Data for totalcommercial consumption are from:
2008 forward: EIA, Form EIA-3, “Quarterly Coal Consump-tion and Quality Report—Manufacturing andTransformation/Processing Coal Plants and Commercial andInstitutional Coal Users” (data for “Commercial and Institu-tional Coal Users”); and, for forecast values, EIA, Short-TermIntegrated Forecasting System (STIFS).
Commercial CHP1989 forward: Table 7.4c.
Commercial Other1949 forward: Calculated as “Commercial Total” minus“Commercial CHP.”
Industrial Coke Plants1949–September 1977: DOI, BOM, Minerals Yearbookand Minerals Industry Surveys.October 1977–1980: EIA, Form EIA-5/5A, “Coke andCoal Chemicals—Monthly/Annual Supplement.”1981–1984: EIA, Form EIA-5/5A, “Coke PlantReport—Quarterly/Annual Supplement.”1985 forward: EIA, Form EIA–5, “Quarterly CoalConsumption and Quality Report—Coke Plants”; and, forforecast values, EIA, STIFS.
Other Industrial Total 1949–September 1977: DOI, BOM, Minerals Yearbook andMinerals Industry Surveys.October 1977–1979: EIA, Form EIA-3, “Monthly CoalConsumption Report—Manufacturing Plants.”1980–1997: EIA, Form EIA-3, “Quarterly Coal Consump-tion Report—Manufacturing Plants,” and Form EIA-6,“Coal Distribution Report,” quarterly.1998–2007: EIA, Form EIA-3, “Quarterly Coal Consump-tion Report—Manufacturing Plants,” Form EIA-6A, “CoalDistribution Report,” annual, and Form EIA-7A, “CoalProduction Report,” annual. 2008 forward: EIA, Form EIA-3, “Quarterly CoalConsumption and Quality Report—Manufacturing andTransformation/Processing Coal Plants and Commercial andInstitutional Coal Users,” and Form EIA-7A, “Coal Produc-tion Report,” annual; and, for forecast values, EIA, STIFS.
Other Industrial CHP1989 forward: Table 7.4c.
Other Industrial Non-CHP1949 forward: Calculated as “Other Industrial Total” minus“Other Industrial CHP.”
Transportation1949–1976: DOI, BOM, Minerals Yearbook.January–September 1977: DOI, BOM, Form 6-1400,“Monthly Coal Report, Retail Dealers—Upper Lake Docks.”October–December 1977: EIA, Form EIA-6, “Coal Distri-bution Report,” quarterly.
Electric Power1949 forward: Table 7.4b.
Table 6.3 Sources
Producers and Distributors1973–1979: U.S. Department of the Interior (DOI), Bureauof Mines (BOM), Form 6-1419Q, “Distribution of Bitumi-nous Coal and Lignite Shipments.”1980–1997: U.S. Energy Information Administration (EIA),Form EIA-6, “Coal Distribution Report,” quarterly.1998–2007: EIA, Form EIA-6A, “Coal Distribution Report,”annual.2008 forward: EIA, Form EIA-7A, “Coal ProductionReport,” annual, and Form EIA-8A, “Coal Stocks Report,”
88 U.S. Energy Information Administration / Monthly Energy Review December 2013
annual; and, for forecast values, EIA, Short-Term IntegratedForecasting System (STIFS).
Residential and Commercial1949–1976: DOI, BOM, Minerals Yearbook.January–September 1977: DOI, BOM, Form 6-1400,“Monthly Coal Report, Retail Dealers—Upper Lake Docks.”October 1977–1979: EIA, Form EIA-2, “Monthly CoalReport, Retail Dealers—Upper Lake Docks.”2008 forward: EIA, Form EIA-3, “Quarterly CoalConsumption and Quality Report, Manufacturing andTransformation/Processing Coal Plants and Commercial andInstitutional Coal Users” (data for “Commercial and Institu-tional Coal Users”); and, for forecast values, EIA, STIFS.
Industrial Coke Plants1949–September 1977: DOI, BOM, Minerals Yearbook andMinerals Industry Surveys.October 1977–1980: EIA, Form EIA-5/5A, “Coke and CoalChemicals—Monthly/Annual.”
1981–1984: EIA, Form EIA 5/5A, “Coke PlantReport—Quarterly/Annual Supplement.” 1985 forward: EIA, Form EIA-5, “Quarterly CoalConsumption and Quality Report—Coke Plants” and, forforecast values, EIA, STIFS.
Industrial Other1949–September 1977: DOI, BOM, Minerals Yearbook andMinerals Industry Surveys. October 1977–1979: EIA, Form EIA-3, “Monthly CoalConsumption Report—Manufacturing Plants.”1998–2007: EIA, Form EIA-3, “Quarterly Coal Consump-tion Report—Manufacturing Plants.”2008 forward: EIA, Form EIA-3, “Quarterly CoalConsumption and Quality Report—Manufacturing andTransformation/Processing Coal Plants and Commer-cial and Institutional Coal Users”; and, for forecast values,EIA, STIFS.
Electric Power1949 forward: Table 7.5.
U.S. Energy Information Administration / Monthly Energy Review December 2013 89

THIS PAGE INTENTIONALLY LEFT BLANK

7. Electricity

Figure 7.1 Electricity Overview(Billion Kilowatthours)
Overview, 2012
Net Generation by Sector, 1989–2012 Net Generation by Sector, Monthly
Trade, 1949–2012
92 U.S. Energy Information Administration / Monthly Energy Review December 2013
Electric Power
Totalc
Imports
Exports
3,890
11 146 59 12
3,695
138
Electric Commercial Industrial Imports Exports Retail Direct0
1,000
2,000
3,000
4,000
5,000
End UseNet Generation Trade
Salesa UsebPower
1990 1995 2000 2005 20100
1,000
2,000
3,000
4,000
5,000
Totalc
Electric Power
J F M A M J J A S O N D J F M A M J J A S O N D J F M A M J J A S O N D0
100
200
300
400
500
Industrial
20132011
Industrial
2012
1950 1955 1960 1965 1970 1975 1980 1985 1990 1995 2000 2005 20100
10
20
30
40
50
60
70
a Electricity retail sales to ultimate customers reported by electric utili-ties and other energy service providers.
b See “Direct Use” in Glossary.
c Includes commercial sector.Web Page: http://www.eia.gov/totalenergy/data/monthly/#electricity.Source: Table 7.1.

U.S. Energy Information Administration / Monthly Energy Review December 2013 93
Table 7.1 Electricity Overview (Billion Kilowatthours)
Net Generation TradeT&D Lossese
andUnaccounted
forf
End Use
ElectricPower
Sectora
Com-mercialSectorb
Indus-trial
Sectorc Total Importsd ExportsdNet
ImportsdRetailSalesg
DirectUseh Total
1950 Total .................... 329 NA 5 334 2 (s) 2 44 291 NA 2911955 Total .................... 547 NA 3 550 5 (s) 4 58 497 NA 4971960 Total .................... 756 NA 4 759 5 1 5 76 688 NA 6881965 Total .................... 1,055 NA 3 1,058 4 4 (s) 104 954 NA 9541970 Total .................... 1,532 NA 3 1,535 6 4 2 145 1,392 NA 1,3921975 Total .................... 1,918 NA 3 1,921 11 5 6 180 1,747 NA 1,7471980 Total .................... 2,286 NA 3 2,290 25 4 21 216 2,094 NA 2,0941985 Total .................... 2,470 NA 3 2,473 46 5 41 190 2,324 NA 2,3241990 Total .................... 2,901 6 c 131 3,038 18 16 2 203 2,713 125 2,8371995 Total .................... 3,194 8 151 3,353 43 4 39 229 3,013 151 3,1642000 Total .................... 3,638 8 157 3,802 49 15 34 244 3,421 171 3,5922001 Total .................... 3,580 7 149 3,737 39 16 22 202 3,394 163 3,5572002 Total .................... 3,698 7 153 3,858 37 16 21 248 3,465 166 3,6322003 Total .................... 3,721 7 155 3,883 30 24 6 228 3,494 168 3,6622004 Total .................... 3,808 8 154 3,971 34 23 11 266 3,547 168 3,7162005 Total .................... 3,902 8 145 4,055 44 19 25 269 3,661 150 3,8112006 Total .................... 3,908 8 148 4,065 43 24 18 266 3,670 147 3,8172007 Total .................... 4,005 8 143 4,157 51 20 31 298 3,765 126 3,8902008 Total .................... 3,974 8 137 4,119 57 24 33 287 3,733 132 3,8652009 Total .................... 3,810 8 132 3,950 52 18 34 261 3,597 127 3,7242010 Total .................... 3,972 9 144 4,125 45 19 26 265 3,754 132 3,886
2011 January ................ 350 1 12 363 4 2 3 20 334 E 11 345 February .............. 302 1 11 313 4 2 2 R 8 297 E 10 307 March ................... 307 1 11 319 4 2 2 19 292 E 10 302 April ..................... 291 1 11 302 4 2 2 19 275 E 10 286 May ...................... 311 1 11 324 5 1 4 29 288 E 11 299 June ..................... 355 1 12 368 4 1 3 31 329 E 11 340 July ...................... 405 1 13 419 6 1 5 41 371 E 12 383 August ................. 392 1 13 407 6 1 5 26 373 E 12 385 September ........... 325 1 12 338 4 1 3 R 3 326 E 11 337 October ................ 297 1 11 309 4 1 3 13 288 E 11 299 November ............ 292 1 12 304 3 1 2 20 275 E 11 286 December ............ 322 1 13 336 4 1 3 R 25 302 E 12 314 Total .................... R 3,948 10 142 R 4,100 52 15 37 255 3,750 133 3,883
2012 January ................ R 326 1 12 R 340 4 1 3 R 20 311 E 12 323 February .............. R 297 1 12 R 309 4 1 3 R 14 R 287 E 11 R 298 March ................... R 296 1 R 12 309 4 1 3 R 17 R 284 E 11 R 295 April ..................... R 283 1 11 R 295 5 1 4 R 18 R 271 RE 11 281 May ...................... R 324 1 12 R 337 5 1 4 R 33 R 297 E 11 R 308 June ..................... R 348 1 12 R 361 5 1 4 R 28 R 325 E 11 R 337 July ...................... R 400 1 13 R 415 7 1 6 R 37 R 371 RE 13 R 383 August ................. R 381 1 13 396 6 1 5 R 24 R 365 E 12 R 377 September ........... 322 1 12 335 5 1 4 R 9 318 E 11 329 October ................ 299 1 12 312 4 1 4 R 13 R 291 E 11 R 302 November ............ 293 1 12 306 5 1 4 R 20 R 278 E 11 R 290 December ............ R 321 1 13 R 335 4 1 3 R 29 R 297 E 12 R 309 Total .................... R 3,890 11 R 146 R 4,048 59 12 47 R 263 R 3,695 R 138 R 3,832
2013 January ................ 335 1 13 349 5 1 4 23 317 E 12 R 330 February .............. 297 1 12 310 5 1 4 14 289 E 11 300 March ................... 312 1 12 325 5 1 4 23 294 E 12 306 April ..................... 286 1 11 298 5 1 3 16 275 E 10 285 May ...................... 309 1 12 322 5 1 5 29 286 E 11 297 June ..................... 343 1 12 356 6 1 5 32 317 E 11 329 July ...................... 380 1 13 394 6 1 5 32 354 E 12 367 August ................. 370 1 13 384 6 1 6 27 350 E 12 362 September ........... 327 1 12 340 5 1 4 12 321 E 11 332 9-Month Total ..... 2,960 8 110 3,078 49 8 40 211 2,805 E 103 2,908
2012 9-Month Total ..... 2,977 9 109 3,096 46 9 36 200 2,828 E 103 2,9322011 9-Month Total ..... 3,038 8 106 3,152 41 12 29 196 2,885 E 100 2,984
a Electricity-only and combined-heat-and-power (CHP) plants within the NAICS22 category whose primary business is to sell electricity, or electricity and heat, tothe public. Through 1988, data are for electric utilities only; beginning in 1989, dataare for electric utilities and independent power producers.
b Commercial combined-heat-and-power (CHP) and commercial electricity-onlyplants.
c Industrial combined-heat-and-power (CHP) and industrial electricity-onlyplants. Through 1988, data are for industrial hydroelectric power only.
d Electricity transmitted across U.S. borders. Net imports equal imports minusexports.
e Transmission and distribution losses (electricity losses that occur between thepoint of generation and delivery to the customer). See Note 2, "Electrical SystemEnergy Losses," at end of Section 2.
f Data collection frame differences and nonsampling error.g Electricity retail sales to ultimate customers by electric utilities and, beginning
in 1996, other energy service providers.h Use of electricity that is 1) self-generated, 2) produced by either the same
entity that consumes the power or an affiliate, and 3) used in direct support of aservice or industrial process located within the same facility or group of facilitiesthat house the generating equipment. Direct use is exclusive of station use.
R=Revised. E=Estimate. NA=Not available. (s)=Less than 0.5 billionkilowatthours.
Notes: • See Note 1, "Coverage of Electricity Statistics," and Note 2,"Classification of Power Plants Into Energy-Use Sectors," at end of section.• Totals may not equal sum of components due to independent rounding.• Geographic coverage is the 50 states and the District of Columbia.
Web Page: See http://www.eia.gov/totalenergy/data/monthly/#electricity (Exceland CSV files) for all available annual data beginning in 1949 and monthly databeginning in 1973.
Sources: See end of section.
Selected years of data from 1949 through 1972 have been added to this table.For all years of data from 1949 through 2013, see the “Web Page” cited above.
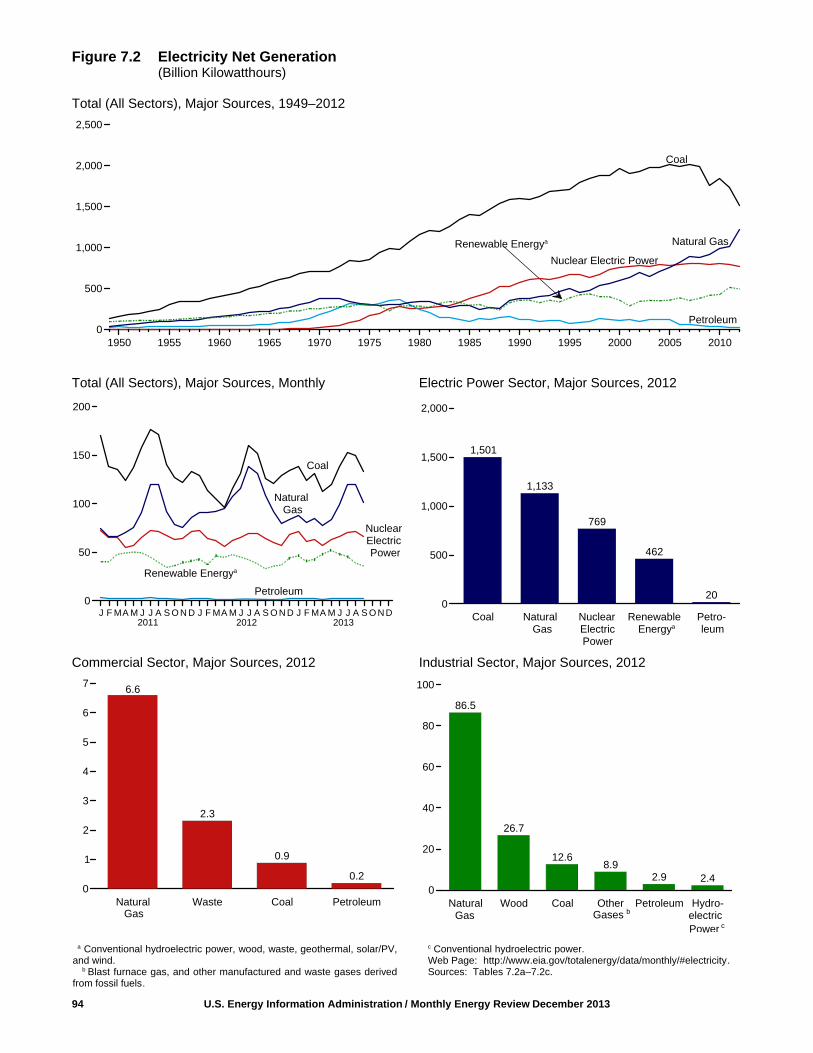
Figure 7.2 Electricity Net Generation(Billion Kilowatthours)
Total (All Sectors), Major Sources, 1949–2012
Total (All Sectors), Major Sources, Monthly Electric Power Sector, Major Sources, 2012
Commercial Sector, Major Sources, 2012 Industrial Sector, Major Sources, 2012
94 U.S. Energy Information Administration / Monthly Energy Review December 2013
Gases bGasGas electric Power c
Natural Gas
Petroleum
Renewable Energya Natural Gas
1950 1955 1960 1965 1970 1975 1980 1985 1990 1995 2000 2005 20100
500
1,000
1,500
2,000
2,500
Coal
Nuclear Electric Power
20132011 2012
Nuclear Electric Power
Renewable Energya
Coal
1,501
1,133
769
462
20
Coal Natural Nuclear Renewable Petro-0
500
1,000
1,500
2,000
J F MA M J J A S O N D J F MA M J J A S O N D J F MA M J J A S O N D0
50
100
150
200
Petroleum
EnergyaGas ElectricPower
leum
6.6
2.3
0.9
0.2
Natural Waste Coal Petroleum0
1
2
3
4
5
6
7
86.5
26.7
12.68.9
2.9 2.4
Natural Wood Coal Other Petroleum Hydro-0
20
40
60
80
100
a Conventional hydroelectric power, wood, waste, geothermal, solar/PV,and wind.
b Blast furnace gas, and other manufactured and waste gases derivedfrom fossil fuels.
c Conventional hydroelectric power.Web Page: http://www.eia.gov/totalenergy/data/monthly/#electricity.Sources: Tables 7.2a–7.2c.
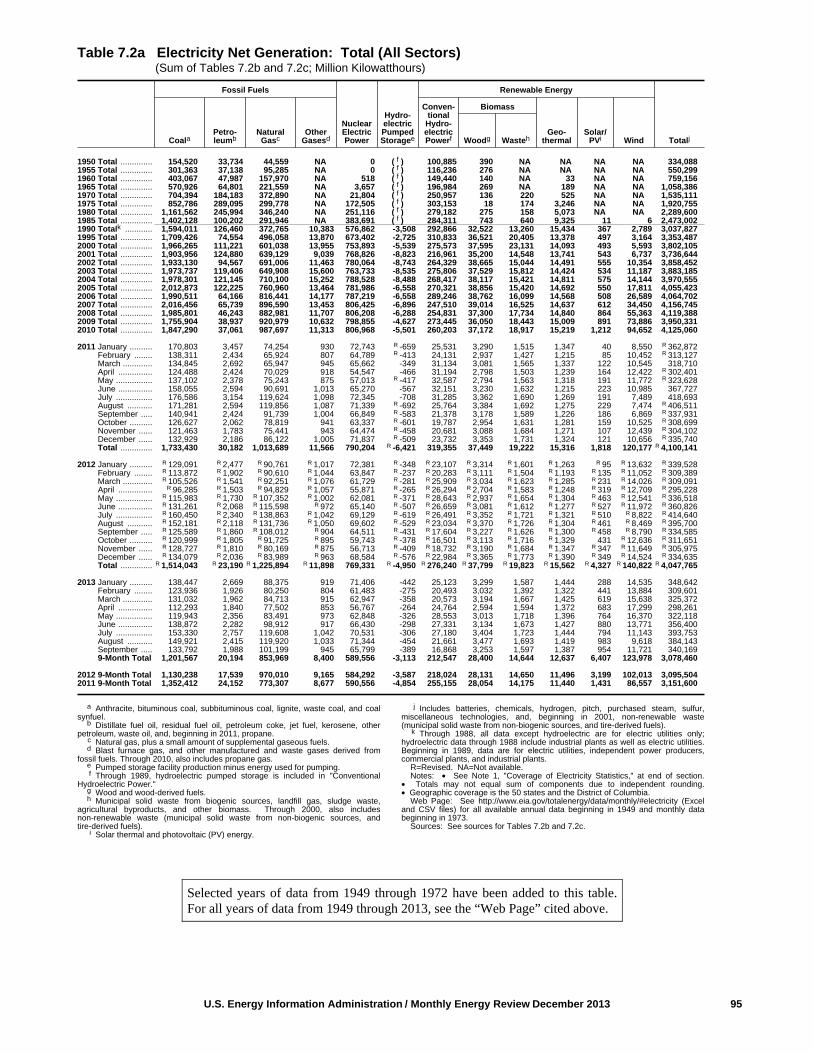
U.S. Energy Information Administration / Monthly Energy Review December 2013 95
Table 7.2a Electricity Net Generation: Total (All Sectors) (Sum of Tables 7.2b and 7.2c; Million Kilowatthours)
Fossil Fuels
NuclearElectricPower
Hydro-electricPumpedStoragee
Renewable Energy
TotaljCoalaPetro-leumb
NaturalGasc
OtherGasesd
Conven-tionalHydro-electricPowerf
Biomass
Geo-thermal
Solar/PVi WindWoodg Wasteh
1950 Total .............. 154,520 33,734 44,559 NA 0 f( ) 100,885 390 NA NA NA NA 334,0881955 Total .............. 301,363 37,138 95,285 NA 0 f( ) 116,236 276 NA NA NA NA 550,2991960 Total .............. 403,067 47,987 157,970 NA 518 f( ) 149,440 140 NA 33 NA NA 759,1561965 Total .............. 570,926 64,801 221,559 NA 3,657 f( ) 196,984 269 NA 189 NA NA 1,058,3861970 Total .............. 704,394 184,183 372,890 NA 21,804 f( ) 250,957 136 220 525 NA NA 1,535,1111975 Total .............. 852,786 289,095 299,778 NA 172,505 f( ) 303,153 18 174 3,246 NA NA 1,920,7551980 Total .............. 1,161,562 245,994 346,240 NA 251,116 f( ) 279,182 275 158 5,073 NA NA 2,289,6001985 Total .............. 1,402,128 100,202 291,946 NA 383,691 f( ) 284,311 743 640 9,325 11 6 2,473,0021990 Totalk ............ 1,594,011 126,460 372,765 10,383 576,862 -3,508 292,866 32,522 13,260 15,434 367 2,789 3,037,8271995 Total .............. 1,709,426 74,554 496,058 13,870 673,402 -2,725 310,833 36,521 20,405 13,378 497 3,164 3,353,4872000 Total .............. 1,966,265 111,221 601,038 13,955 753,893 -5,539 275,573 37,595 23,131 14,093 493 5,593 3,802,1052001 Total .............. 1,903,956 124,880 639,129 9,039 768,826 -8,823 216,961 35,200 14,548 13,741 543 6,737 3,736,6442002 Total .............. 1,933,130 94,567 691,006 11,463 780,064 -8,743 264,329 38,665 15,044 14,491 555 10,354 3,858,4522003 Total .............. 1,973,737 119,406 649,908 15,600 763,733 -8,535 275,806 37,529 15,812 14,424 534 11,187 3,883,1852004 Total .............. 1,978,301 121,145 710,100 15,252 788,528 -8,488 268,417 38,117 15,421 14,811 575 14,144 3,970,5552005 Total .............. 2,012,873 122,225 760,960 13,464 781,986 -6,558 270,321 38,856 15,420 14,692 550 17,811 4,055,4232006 Total .............. 1,990,511 64,166 816,441 14,177 787,219 -6,558 289,246 38,762 16,099 14,568 508 26,589 4,064,7022007 Total .............. 2,016,456 65,739 896,590 13,453 806,425 -6,896 247,510 39,014 16,525 14,637 612 34,450 4,156,7452008 Total .............. 1,985,801 46,243 882,981 11,707 806,208 -6,288 254,831 37,300 17,734 14,840 864 55,363 4,119,3882009 Total .............. 1,755,904 38,937 920,979 10,632 798,855 -4,627 273,445 36,050 18,443 15,009 891 73,886 3,950,3312010 Total .............. 1,847,290 37,061 987,697 11,313 806,968 -5,501 260,203 37,172 18,917 15,219 1,212 94,652 4,125,060
2011 January .......... 170,803 3,457 74,254 930 72,743 R -659 25,531 3,290 1,515 1,347 40 8,550 R 362,872 February ........ 138,311 2,434 65,924 807 64,789 R -413 24,131 2,937 1,427 1,215 85 10,452 R 313,127 March ............. 134,845 2,692 65,947 945 65,662 -349 31,134 3,081 1,565 1,337 122 10,545 318,710 April ............... 124,488 2,424 70,029 918 54,547 -466 31,194 2,798 1,503 1,239 164 12,422 R 302,401 May ................ 137,102 2,378 75,243 875 57,013 R -417 32,587 2,794 1,563 1,318 191 11,772 R 323,628 June ............... 158,055 2,594 90,691 1,013 65,270 -567 32,151 3,230 1,632 1,215 223 10,985 367,727 July ................ 176,586 3,154 119,624 1,098 72,345 -708 31,285 3,362 1,690 1,269 191 7,489 418,693 August ........... 171,281 2,594 119,856 1,087 71,339 R -692 25,764 3,384 1,692 1,275 229 7,474 R 406,511 September ..... 140,941 2,424 91,739 1,004 66,849 R -583 21,378 3,178 1,589 1,226 186 6,869 R 337,931 October .......... 126,627 2,062 78,819 941 63,337 R -601 19,787 2,954 1,631 1,281 159 10,525 R 308,699 November ...... 121,463 1,783 75,441 943 64,474 R -458 20,681 3,088 1,684 1,271 107 12,439 R 304,102 December ...... 132,929 2,186 86,122 1,005 71,837 R -509 23,732 3,353 1,731 1,324 121 10,656 R 335,740 Total .............. 1,733,430 30,182 1,013,689 11,566 790,204 R -6,421 319,355 37,449 19,222 15,316 1,818 120,177 R 4,100,141
2012 January .......... R 129,091 R 2,477 R 90,761 R 1,017 72,381 R -348 R 23,107 R 3,314 R 1,601 R 1,263 R 95 R 13,632 R 339,528 February ........ R 113,872 R 1,902 R 90,610 R 1,044 63,847 R -237 R 20,283 R 3,111 R 1,504 R 1,193 R 135 R 11,052 R 309,389 March ............. R 105,526 R 1,541 R 92,251 R 1,076 61,729 R -281 R 25,909 R 3,034 R 1,623 R 1,285 R 231 R 14,026 R 309,091 April ............... R 96,285 R 1,503 R 94,829 R 1,057 55,871 R -265 R 26,294 R 2,704 R 1,583 R 1,248 R 319 R 12,709 R 295,228 May ................ R 115,983 R 1,730 R 107,352 R 1,002 62,081 R -371 R 28,643 R 2,937 R 1,654 R 1,304 R 463 R 12,541 R 336,518 June ............... R 131,261 R 2,068 R 115,598 R 972 65,140 R -507 R 26,659 R 3,081 R 1,612 R 1,277 R 527 R 11,972 R 360,826 July ................ R 160,450 R 2,340 R 138,863 R 1,042 69,129 R -619 R 26,491 R 3,352 R 1,721 R 1,321 R 510 R 8,822 R 414,640 August ........... R 152,181 R 2,118 R 131,736 R 1,050 69,602 R -529 R 23,034 R 3,370 R 1,726 R 1,304 R 461 R 8,469 R 395,700 September ..... R 125,589 R 1,860 R 108,012 R 904 64,511 R -431 R 17,604 R 3,227 R 1,626 R 1,300 R 458 R 8,790 R 334,585 October .......... R 120,999 R 1,805 R 91,725 R 895 59,743 R -378 R 16,501 R 3,113 R 1,716 R 1,329 431 R 12,636 R 311,651 November ...... R 128,727 R 1,810 R 80,169 R 875 56,713 R -409 R 18,732 R 3,190 R 1,684 R 1,347 R 347 R 11,649 R 305,975 December ...... R 134,079 R 2,036 R 83,989 R 963 68,584 R -576 R 22,984 R 3,365 R 1,773 R 1,390 R 349 R 14,524 R 334,635 Total .............. R 1,514,043 R 23,190 R 1,225,894 R 11,898 769,331 R -4,950 R 276,240 R 37,799 R 19,823 R 15,562 R 4,327 R 140,822 R 4,047,765
2013 January .......... 138,447 2,669 88,375 919 71,406 -442 25,123 3,299 1,587 1,444 288 14,535 348,642 February ........ 123,936 1,926 80,250 804 61,483 -275 20,493 3,032 1,392 1,322 441 13,884 309,601 March ............. 131,032 1,962 84,713 915 62,947 -358 20,573 3,194 1,667 1,425 619 15,638 325,372 April ............... 112,293 1,840 77,502 853 56,767 -264 24,764 2,594 1,594 1,372 683 17,299 298,261 May ................ 119,943 2,356 83,491 973 62,848 -326 28,553 3,013 1,718 1,396 764 16,370 322,118 June ............... 138,872 2,282 98,912 917 66,430 -298 27,331 3,134 1,673 1,427 880 13,771 356,400 July ................ 153,330 2,757 119,608 1,042 70,531 -306 27,180 3,404 1,723 1,444 794 11,143 393,753 August ........... 149,921 2,415 119,920 1,033 71,344 -454 21,661 3,477 1,693 1,419 983 9,618 384,143 September ..... 133,792 1,988 101,199 945 65,799 -389 16,868 3,253 1,597 1,387 954 11,721 340,169 9-Month Total 1,201,567 20,194 853,969 8,400 589,556 -3,113 212,547 28,400 14,644 12,637 6,407 123,978 3,078,460
2012 9-Month Total 1,130,238 17,539 970,010 9,165 584,292 -3,587 218,024 28,131 14,650 11,496 3,199 102,013 3,095,5042011 9-Month Total 1,352,412 24,152 773,307 8,677 590,556 -4,854 255,155 28,054 14,175 11,440 1,431 86,557 3,151,600
a Anthracite, bituminous coal, subbituminous coal, lignite, waste coal, and coalsynfuel.
b Distillate fuel oil, residual fuel oil, petroleum coke, jet fuel, kerosene, otherpetroleum, waste oil, and, beginning in 2011, propane.
c Natural gas, plus a small amount of supplemental gaseous fuels.d Blast furnace gas, and other manufactured and waste gases derived from
fossil fuels. Through 2010, also includes propane gas.e Pumped storage facility production minus energy used for pumping.f Through 1989, hydroelectric pumped storage is included in "Conventional
Hydroelectric Power."g Wood and wood-derived fuels.h Municipal solid waste from biogenic sources, landfill gas, sludge waste,
agricultural byproducts, and other biomass. Through 2000, also includesnon-renewable waste (municipal solid waste from non-biogenic sources, andtire-derived fuels).
i Solar thermal and photovoltaic (PV) energy.
j Includes batteries, chemicals, hydrogen, pitch, purchased steam, sulfur,miscellaneous technologies, and, beginning in 2001, non-renewable waste(municipal solid waste from non-biogenic sources, and tire-derived fuels).
k Through 1988, all data except hydroelectric are for electric utilities only;hydroelectric data through 1988 include industrial plants as well as electric utilities.Beginning in 1989, data are for electric utilities, independent power producers,commercial plants, and industrial plants.
R=Revised. NA=Not available. Notes: • See Note 1, "Coverage of Electricity Statistics," at end of section.
• Totals may not equal sum of components due to independent rounding.• Geographic coverage is the 50 states and the District of Columbia.
Web Page: See http://www.eia.gov/totalenergy/data/monthly/#electricity (Exceland CSV files) for all available annual data beginning in 1949 and monthly databeginning in 1973.
Sources: See sources for Tables 7.2b and 7.2c.
Selected years of data from 1949 through 1972 have been added to this table.For all years of data from 1949 through 2013, see the “Web Page” cited above.
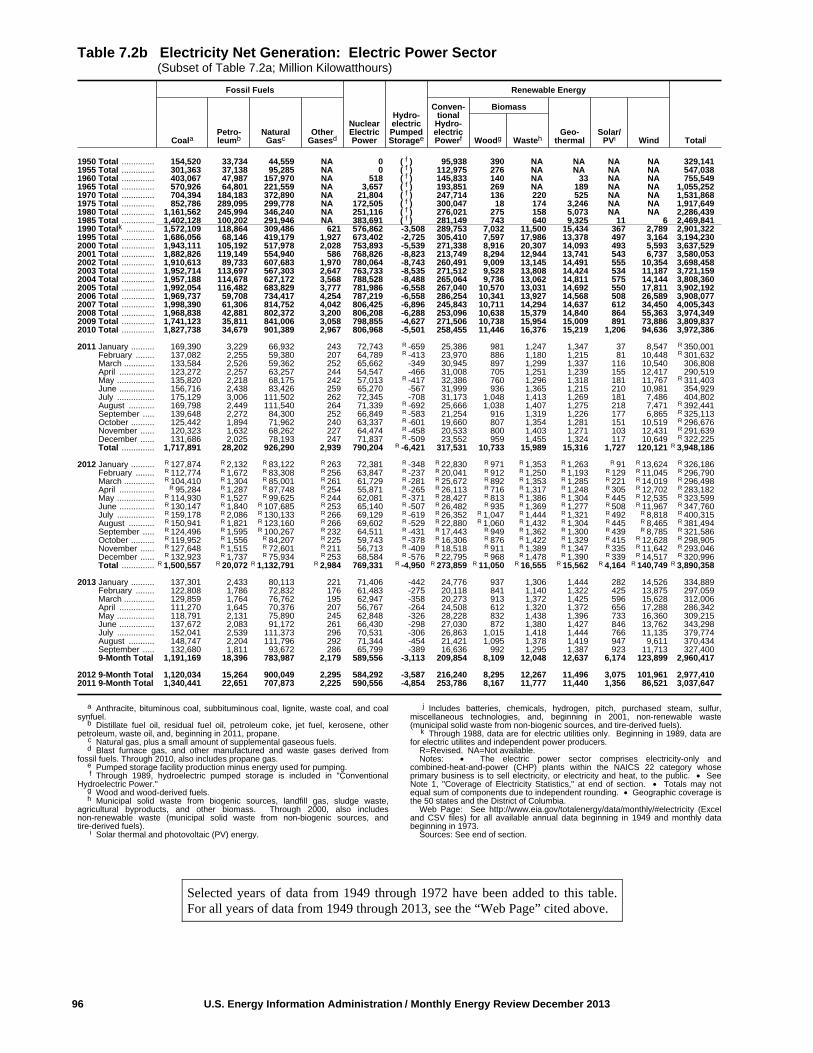
96 U.S. Energy Information Administration / Monthly Energy Review December 2013
Selected years of data from 1949 through 1972 have been added to this table.For all years of data from 1949 through 2013, see the “Web Page” cited above.
Table 7.2b Electricity Net Generation: Electric Power Sector (Subset of Table 7.2a; Million Kilowatthours)
Fossil Fuels
NuclearElectricPower
Hydro-electricPumpedStoragee
Renewable Energy
TotaljCoalaPetro-leumb
NaturalGasc
OtherGasesd
Conven-tionalHydro-electricPowerf
Biomass
Geo-thermal
Solar/PVi WindWoodg Wasteh
1950 Total .............. 154,520 33,734 44,559 NA 0 f( ) 95,938 390 NA NA NA NA 329,1411955 Total .............. 301,363 37,138 95,285 NA 0 f( ) 112,975 276 NA NA NA NA 547,0381960 Total .............. 403,067 47,987 157,970 NA 518 f( ) 145,833 140 NA 33 NA NA 755,5491965 Total .............. 570,926 64,801 221,559 NA 3,657 f( ) 193,851 269 NA 189 NA NA 1,055,2521970 Total .............. 704,394 184,183 372,890 NA 21,804 f( ) 247,714 136 220 525 NA NA 1,531,8681975 Total .............. 852,786 289,095 299,778 NA 172,505 f( ) 300,047 18 174 3,246 NA NA 1,917,6491980 Total .............. 1,161,562 245,994 346,240 NA 251,116 f( ) 276,021 275 158 5,073 NA NA 2,286,4391985 Total .............. 1,402,128 100,202 291,946 NA 383,691 f( ) 281,149 743 640 9,325 11 6 2,469,8411990 Totalk ............ 1,572,109 118,864 309,486 621 576,862 -3,508 289,753 7,032 11,500 15,434 367 2,789 2,901,3221995 Total .............. 1,686,056 68,146 419,179 1,927 673,402 -2,725 305,410 7,597 17,986 13,378 497 3,164 3,194,2302000 Total .............. 1,943,111 105,192 517,978 2,028 753,893 -5,539 271,338 8,916 20,307 14,093 493 5,593 3,637,5292001 Total .............. 1,882,826 119,149 554,940 586 768,826 -8,823 213,749 8,294 12,944 13,741 543 6,737 3,580,0532002 Total .............. 1,910,613 89,733 607,683 1,970 780,064 -8,743 260,491 9,009 13,145 14,491 555 10,354 3,698,4582003 Total .............. 1,952,714 113,697 567,303 2,647 763,733 -8,535 271,512 9,528 13,808 14,424 534 11,187 3,721,1592004 Total .............. 1,957,188 114,678 627,172 3,568 788,528 -8,488 265,064 9,736 13,062 14,811 575 14,144 3,808,3602005 Total .............. 1,992,054 116,482 683,829 3,777 781,986 -6,558 267,040 10,570 13,031 14,692 550 17,811 3,902,1922006 Total .............. 1,969,737 59,708 734,417 4,254 787,219 -6,558 286,254 10,341 13,927 14,568 508 26,589 3,908,0772007 Total .............. 1,998,390 61,306 814,752 4,042 806,425 -6,896 245,843 10,711 14,294 14,637 612 34,450 4,005,3432008 Total .............. 1,968,838 42,881 802,372 3,200 806,208 -6,288 253,096 10,638 15,379 14,840 864 55,363 3,974,3492009 Total .............. 1,741,123 35,811 841,006 3,058 798,855 -4,627 271,506 10,738 15,954 15,009 891 73,886 3,809,8372010 Total .............. 1,827,738 34,679 901,389 2,967 806,968 -5,501 258,455 11,446 16,376 15,219 1,206 94,636 3,972,386
2011 January .......... 169,390 3,229 66,932 243 72,743 R -659 25,386 981 1,247 1,347 37 8,547 R 350,001 February ........ 137,082 2,255 59,380 207 64,789 R -413 23,970 886 1,180 1,215 81 10,448 R 301,632 March ............. 133,584 2,526 59,362 252 65,662 -349 30,945 897 1,299 1,337 116 10,540 306,808 April ............... 123,272 2,257 63,257 244 54,547 -466 31,008 705 1,251 1,239 155 12,417 290,519 May ................ 135,820 2,218 68,175 242 57,013 R -417 32,386 760 1,296 1,318 181 11,767 R 311,403 June ............... 156,716 2,438 83,426 259 65,270 -567 31,999 936 1,365 1,215 210 10,981 354,929 July ................ 175,129 3,006 111,502 262 72,345 -708 31,173 1,048 1,413 1,269 181 7,486 404,802 August ........... 169,798 2,449 111,540 264 71,339 R -692 25,666 1,038 1,407 1,275 218 7,471 R 392,441 September ..... 139,648 2,272 84,300 252 66,849 R -583 21,254 916 1,319 1,226 177 6,865 R 325,113 October .......... 125,442 1,894 71,962 240 63,337 R -601 19,660 807 1,354 1,281 151 10,519 R 296,676 November ...... 120,323 1,632 68,262 227 64,474 R -458 20,533 800 1,403 1,271 103 12,431 R 291,639 December ...... 131,686 2,025 78,193 247 71,837 R -509 23,552 959 1,455 1,324 117 10,649 R 322,225 Total .............. 1,717,891 28,202 926,290 2,939 790,204 R -6,421 317,531 10,733 15,989 15,316 1,727 120,121 R 3,948,186
2012 January .......... R 127,874 R 2,132 R 83,122 R 263 72,381 R -348 R 22,830 R 971 R 1,353 R 1,263 R 91 R 13,624 R 326,186 February ........ R 112,774 R 1,672 R 83,308 R 256 63,847 R -237 R 20,041 R 912 R 1,250 R 1,193 R 129 R 11,045 R 296,790 March ............. R 104,410 R 1,304 R 85,001 R 261 61,729 R -281 R 25,672 R 892 R 1,353 R 1,285 R 221 R 14,019 R 296,498 April ............... R 95,284 R 1,287 R 87,748 R 254 55,871 R -265 R 26,113 R 716 R 1,317 R 1,248 R 305 R 12,702 R 283,182 May ................ R 114,930 R 1,527 R 99,625 R 244 62,081 R -371 R 28,427 R 813 R 1,386 R 1,304 R 445 R 12,535 R 323,599 June ............... R 130,147 R 1,840 R 107,685 R 253 65,140 R -507 R 26,482 R 935 R 1,369 R 1,277 R 508 R 11,967 R 347,760 July ................ R 159,178 R 2,086 R 130,133 R 266 69,129 R -619 R 26,352 R 1,047 R 1,444 R 1,321 R 492 R 8,818 R 400,315 August ........... R 150,941 R 1,821 R 123,160 R 266 69,602 R -529 R 22,880 R 1,060 R 1,432 R 1,304 R 445 R 8,465 R 381,494 September ..... R 124,496 R 1,595 R 100,267 R 232 64,511 R -431 R 17,443 R 949 R 1,362 R 1,300 R 439 R 8,785 R 321,586 October .......... R 119,952 R 1,556 R 84,207 R 225 59,743 R -378 R 16,306 R 876 R 1,422 R 1,329 R 415 R 12,628 R 298,905 November ...... R 127,648 R 1,515 R 72,601 R 211 56,713 R -409 R 18,518 R 911 R 1,389 R 1,347 R 335 R 11,642 R 293,046 December ...... R 132,923 R 1,737 R 75,934 R 253 68,584 R -576 R 22,795 R 968 R 1,478 R 1,390 R 339 R 14,517 R 320,996 Total .............. R 1,500,557 R 20,072 R 1,132,791 R 2,984 769,331 R -4,950 R 273,859 R 11,050 R 16,555 R 15,562 R 4,164 R 140,749 R 3,890,358
2013 January .......... 137,301 2,433 80,113 221 71,406 -442 24,776 937 1,306 1,444 282 14,526 334,889 February ........ 122,808 1,786 72,832 176 61,483 -275 20,118 841 1,140 1,322 425 13,875 297,059 March ............. 129,859 1,764 76,762 195 62,947 -358 20,273 913 1,372 1,425 596 15,628 312,006 April ............... 111,270 1,645 70,376 207 56,767 -264 24,508 612 1,320 1,372 656 17,288 286,342 May ................ 118,791 2,131 75,890 245 62,848 -326 28,228 832 1,438 1,396 733 16,360 309,215 June ............... 137,672 2,083 91,172 261 66,430 -298 27,030 872 1,380 1,427 846 13,762 343,298 July ................ 152,041 2,539 111,373 296 70,531 -306 26,863 1,015 1,418 1,444 766 11,135 379,774 August ........... 148,747 2,204 111,796 292 71,344 -454 21,421 1,095 1,378 1,419 947 9,611 370,434 September ..... 132,680 1,811 93,672 286 65,799 -389 16,636 992 1,295 1,387 923 11,713 327,400 9-Month Total 1,191,169 18,396 783,987 2,179 589,556 -3,113 209,854 8,109 12,048 12,637 6,174 123,899 2,960,417
2012 9-Month Total 1,120,034 15,264 900,049 2,295 584,292 -3,587 216,240 8,295 12,267 11,496 3,075 101,961 2,977,4102011 9-Month Total 1,340,441 22,651 707,873 2,225 590,556 -4,854 253,786 8,167 11,777 11,440 1,356 86,521 3,037,647
a Anthracite, bituminous coal, subbituminous coal, lignite, waste coal, and coalsynfuel.
b Distillate fuel oil, residual fuel oil, petroleum coke, jet fuel, kerosene, otherpetroleum, waste oil, and, beginning in 2011, propane.
c Natural gas, plus a small amount of supplemental gaseous fuels.d Blast furnace gas, and other manufactured and waste gases derived from
fossil fuels. Through 2010, also includes propane gas.e Pumped storage facility production minus energy used for pumping.f Through 1989, hydroelectric pumped storage is included in "Conventional
Hydroelectric Power."g Wood and wood-derived fuels.h Municipal solid waste from biogenic sources, landfill gas, sludge waste,
agricultural byproducts, and other biomass. Through 2000, also includesnon-renewable waste (municipal solid waste from non-biogenic sources, andtire-derived fuels).
i Solar thermal and photovoltaic (PV) energy.
j Includes batteries, chemicals, hydrogen, pitch, purchased steam, sulfur,miscellaneous technologies, and, beginning in 2001, non-renewable waste(municipal solid waste from non-biogenic sources, and tire-derived fuels).
k Through 1988, data are for electric utilities only. Beginning in 1989, data arefor electric utilites and independent power producers.
R=Revised. NA=Not available. Notes: • The electric power sector comprises electricity-only and
combined-heat-and-power (CHP) plants within the NAICS 22 category whoseprimary business is to sell electricity, or electricity and heat, to the public. • SeeNote 1, "Coverage of Electricity Statistics," at end of section. • Totals may notequal sum of components due to independent rounding. • Geographic coverage isthe 50 states and the District of Columbia.
Web Page: See http://www.eia.gov/totalenergy/data/monthly/#electricity (Exceland CSV files) for all available annual data beginning in 1949 and monthly databeginning in 1973.
Sources: See end of section.
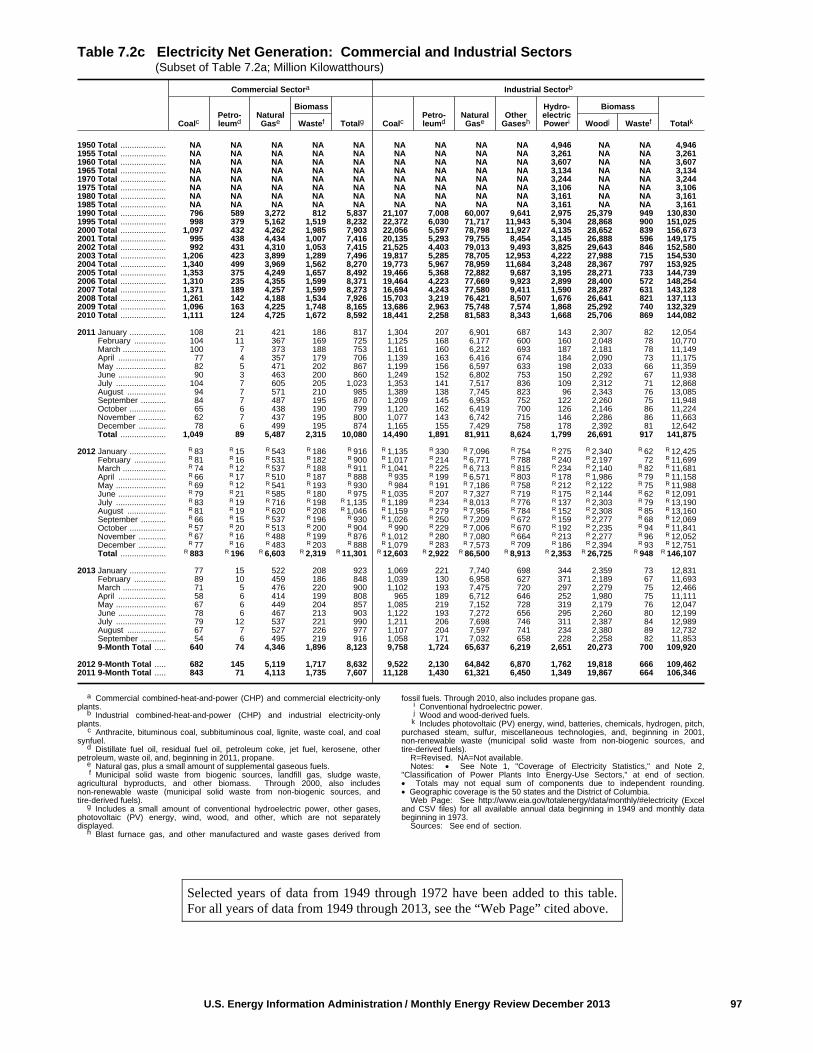
U.S. Energy Information Administration / Monthly Energy Review December 2013 97
Table 7.2c Electricity Net Generation: Commercial and Industrial Sectors (Subset of Table 7.2a; Million Kilowatthours)
Commercial Sectora Industrial Sectorb
CoalcPetro-leumd
NaturalGase
Biomass
Totalg CoalcPetro-leumd
NaturalGase
OtherGasesh
Hydro-electricPoweri
Biomass
TotalkWastef Woodj Wastef
1950 Total .................... NA NA NA NA NA NA NA NA NA 4,946 NA NA 4,9461955 Total .................... NA NA NA NA NA NA NA NA NA 3,261 NA NA 3,2611960 Total .................... NA NA NA NA NA NA NA NA NA 3,607 NA NA 3,6071965 Total .................... NA NA NA NA NA NA NA NA NA 3,134 NA NA 3,1341970 Total .................... NA NA NA NA NA NA NA NA NA 3,244 NA NA 3,2441975 Total .................... NA NA NA NA NA NA NA NA NA 3,106 NA NA 3,1061980 Total .................... NA NA NA NA NA NA NA NA NA 3,161 NA NA 3,1611985 Total .................... NA NA NA NA NA NA NA NA NA 3,161 NA NA 3,1611990 Total .................... 796 589 3,272 812 5,837 21,107 7,008 60,007 9,641 2,975 25,379 949 130,8301995 Total .................... 998 379 5,162 1,519 8,232 22,372 6,030 71,717 11,943 5,304 28,868 900 151,0252000 Total .................... 1,097 432 4,262 1,985 7,903 22,056 5,597 78,798 11,927 4,135 28,652 839 156,6732001 Total .................... 995 438 4,434 1,007 7,416 20,135 5,293 79,755 8,454 3,145 26,888 596 149,1752002 Total .................... 992 431 4,310 1,053 7,415 21,525 4,403 79,013 9,493 3,825 29,643 846 152,5802003 Total .................... 1,206 423 3,899 1,289 7,496 19,817 5,285 78,705 12,953 4,222 27,988 715 154,5302004 Total .................... 1,340 499 3,969 1,562 8,270 19,773 5,967 78,959 11,684 3,248 28,367 797 153,9252005 Total .................... 1,353 375 4,249 1,657 8,492 19,466 5,368 72,882 9,687 3,195 28,271 733 144,7392006 Total .................... 1,310 235 4,355 1,599 8,371 19,464 4,223 77,669 9,923 2,899 28,400 572 148,2542007 Total .................... 1,371 189 4,257 1,599 8,273 16,694 4,243 77,580 9,411 1,590 28,287 631 143,1282008 Total .................... 1,261 142 4,188 1,534 7,926 15,703 3,219 76,421 8,507 1,676 26,641 821 137,1132009 Total .................... 1,096 163 4,225 1,748 8,165 13,686 2,963 75,748 7,574 1,868 25,292 740 132,3292010 Total .................... 1,111 124 4,725 1,672 8,592 18,441 2,258 81,583 8,343 1,668 25,706 869 144,082
2011 January ................ 108 21 421 186 817 1,304 207 6,901 687 143 2,307 82 12,054 February .............. 104 11 367 169 725 1,125 168 6,177 600 160 2,048 78 10,770 March ................... 100 7 373 188 753 1,161 160 6,212 693 187 2,181 78 11,149 April ..................... 77 4 357 179 706 1,139 163 6,416 674 184 2,090 73 11,175 May ...................... 82 5 471 202 867 1,199 156 6,597 633 198 2,033 66 11,359 June ..................... 90 3 463 200 860 1,249 152 6,802 753 150 2,292 67 11,938 July ...................... 104 7 605 205 1,023 1,353 141 7,517 836 109 2,312 71 12,868 August ................. 94 7 571 210 985 1,389 138 7,745 823 96 2,343 76 13,085 September ........... 84 7 487 195 870 1,209 145 6,953 752 122 2,260 75 11,948 October ................ 65 6 438 190 799 1,120 162 6,419 700 126 2,146 86 11,224 November ............ 62 7 437 195 800 1,077 143 6,742 715 146 2,286 86 11,663 December ............ 78 6 499 195 874 1,165 155 7,429 758 178 2,392 81 12,642 Total .................... 1,049 89 5,487 2,315 10,080 14,490 1,891 81,911 8,624 1,799 26,691 917 141,875
2012 January ................ R 83 R 15 R 543 R 186 R 916 R 1,135 R 330 R 7,096 R 754 R 275 R 2,340 R 62 R 12,425 February .............. R 81 R 16 R 531 R 182 R 900 R 1,017 R 214 R 6,771 R 788 R 240 R 2,197 72 R 11,699 March ................... R 74 R 12 R 537 R 188 R 911 R 1,041 R 225 R 6,713 R 815 R 234 R 2,140 R 82 R 11,681 April ..................... R 66 R 17 R 510 R 187 R 888 R 935 R 199 R 6,571 R 803 R 178 R 1,986 R 79 R 11,158 May ...................... R 69 R 12 R 541 R 193 R 930 R 984 R 191 R 7,186 R 758 R 212 R 2,122 R 75 R 11,988 June ..................... R 79 R 21 R 585 R 180 R 975 R 1,035 R 207 R 7,327 R 719 R 175 R 2,144 R 62 R 12,091 July ...................... R 83 R 19 R 716 R 198 R 1,135 R 1,189 R 234 R 8,013 R 776 R 137 R 2,303 R 79 R 13,190 August ................. R 81 R 19 R 620 R 208 R 1,046 R 1,159 R 279 R 7,956 R 784 R 152 R 2,308 R 85 R 13,160 September ........... R 66 R 15 R 537 R 196 R 930 R 1,026 R 250 R 7,209 R 672 R 159 R 2,277 R 68 R 12,069 October ................ R 57 R 20 R 513 R 200 R 904 R 990 R 229 R 7,006 R 670 R 192 R 2,235 R 94 R 11,841 November ............ R 67 R 16 R 488 R 199 R 876 R 1,012 R 280 R 7,080 R 664 R 213 R 2,277 R 96 R 12,052 December ............ R 77 R 16 R 483 R 203 R 888 R 1,079 R 283 R 7,573 R 709 R 186 R 2,394 R 93 R 12,751 Total .................... R 883 R 196 R 6,603 R 2,319 R 11,301 R 12,603 R 2,922 R 86,500 R 8,913 R 2,353 R 26,725 R 948 R 146,107
2013 January ................ 77 15 522 208 923 1,069 221 7,740 698 344 2,359 73 12,831 February .............. 89 10 459 186 848 1,039 130 6,958 627 371 2,189 67 11,693 March ................... 71 5 476 220 900 1,102 193 7,475 720 297 2,279 75 12,466 April ..................... 58 6 414 199 808 965 189 6,712 646 252 1,980 75 11,111 May ...................... 67 6 449 204 857 1,085 219 7,152 728 319 2,179 76 12,047 June ..................... 78 6 467 213 903 1,122 193 7,272 656 295 2,260 80 12,199 July ...................... 79 12 537 221 990 1,211 206 7,698 746 311 2,387 84 12,989 August ................. 67 7 527 226 977 1,107 204 7,597 741 234 2,380 89 12,732 September ........... 54 6 495 219 916 1,058 171 7,032 658 228 2,258 82 11,853 9-Month Total ..... 640 74 4,346 1,896 8,123 9,758 1,724 65,637 6,219 2,651 20,273 700 109,920
2012 9-Month Total ..... 682 145 5,119 1,717 8,632 9,522 2,130 64,842 6,870 1,762 19,818 666 109,4622011 9-Month Total ..... 843 71 4,113 1,735 7,607 11,128 1,430 61,321 6,450 1,349 19,867 664 106,346
a Commercial combined-heat-and-power (CHP) and commercial electricity-onlyplants.
b Industrial combined-heat-and-power (CHP) and industrial electricity-onlyplants.
c Anthracite, bituminous coal, subbituminous coal, lignite, waste coal, and coalsynfuel.
d Distillate fuel oil, residual fuel oil, petroleum coke, jet fuel, kerosene, otherpetroleum, waste oil, and, beginning in 2011, propane.
e Natural gas, plus a small amount of supplemental gaseous fuels.f Municipal solid waste from biogenic sources, landfill gas, sludge waste,
agricultural byproducts, and other biomass. Through 2000, also includesnon-renewable waste (municipal solid waste from non-biogenic sources, andtire-derived fuels).
g Includes a small amount of conventional hydroelectric power, other gases,photovoltaic (PV) energy, wind, wood, and other, which are not separatelydisplayed.
h Blast furnace gas, and other manufactured and waste gases derived from
fossil fuels. Through 2010, also includes propane gas.i Conventional hydroelectric power.j Wood and wood-derived fuels.k Includes photovoltaic (PV) energy, wind, batteries, chemicals, hydrogen, pitch,
purchased steam, sulfur, miscellaneous technologies, and, beginning in 2001,non-renewable waste (municipal solid waste from non-biogenic sources, andtire-derived fuels).
R=Revised. NA=Not available. Notes: • See Note 1, "Coverage of Electricity Statistics," and Note 2,
"Classification of Power Plants Into Energy-Use Sectors," at end of section.• Totals may not equal sum of components due to independent rounding.• Geographic coverage is the 50 states and the District of Columbia.
Web Page: See http://www.eia.gov/totalenergy/data/monthly/#electricity (Exceland CSV files) for all available annual data beginning in 1949 and monthly databeginning in 1973.
Sources: See end of section.
Selected years of data from 1949 through 1972 have been added to this table.For all years of data from 1949 through 2013, see the “Web Page” cited above.
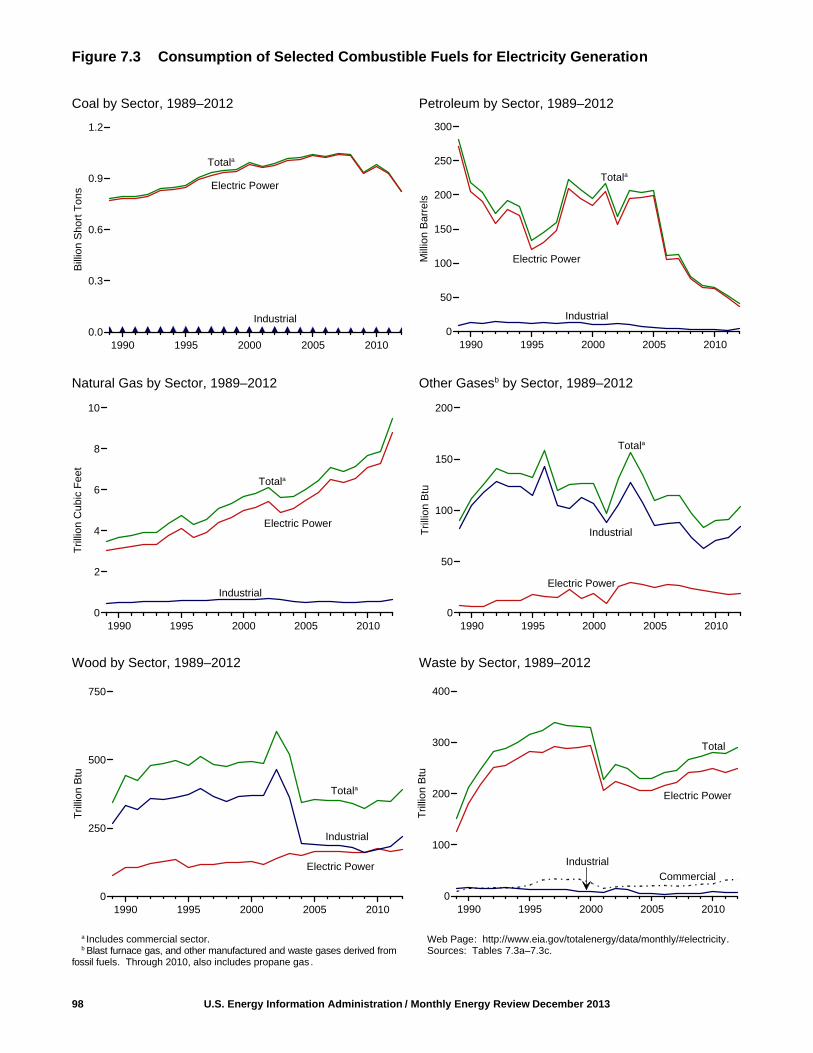
Figure 7.3 Consumption of Selected Combustible Fuels for Electricity Generation
Coal by Sector, 1989–2012 Petroleum by Sector, 1989–2012
Natural Gas by Sector, 1989–2012 Other Gasesb by Sector, 1989–2012
Wood by Sector, 1989–2012 Waste by Sector, 1989–2012
98 U.S. Energy Information Administration / Monthly Energy Review December 2013
Commercial
Industrial
Electric Power
Electric PowerIndustrial
Industrial
Totala
Totala
1990 1995 2000 2005 20100.0
0.3
0.6
0.9
1.2
Bill
ion
Sho
rt T
ons
Totala
Electric Power
1990 1995 2000 2005 20100
50
100
150
200
250
300
Mill
ion
Ba
rrel
s
Totala
Electric Power
Industrial
a Includes commercial sector.b Blast furnace gas, and other manufactured and waste gases derived from
fossil fuels. Through 2010, also includes propane gas .
Web Page: http://www.eia.gov/totalenergy/data/monthly/#electricity.Sources: Tables 7.3a–7.3c.
Industrial
1990 1995 2000 2005 20100
2
4
6
8
10
Tril
lion
Cub
ic F
eet
1990 1995 2000 2005 20100
50
100
150
200
Tril
lion
Btu
Totala
Total
Electric Power
1990 1995 2000 2005 20100
100
200
300
400
Tril
lion
Btu
Electric Power
Industrial
1990 1995 2000 2005 20100
250
500
750
Tril
lion
Btu
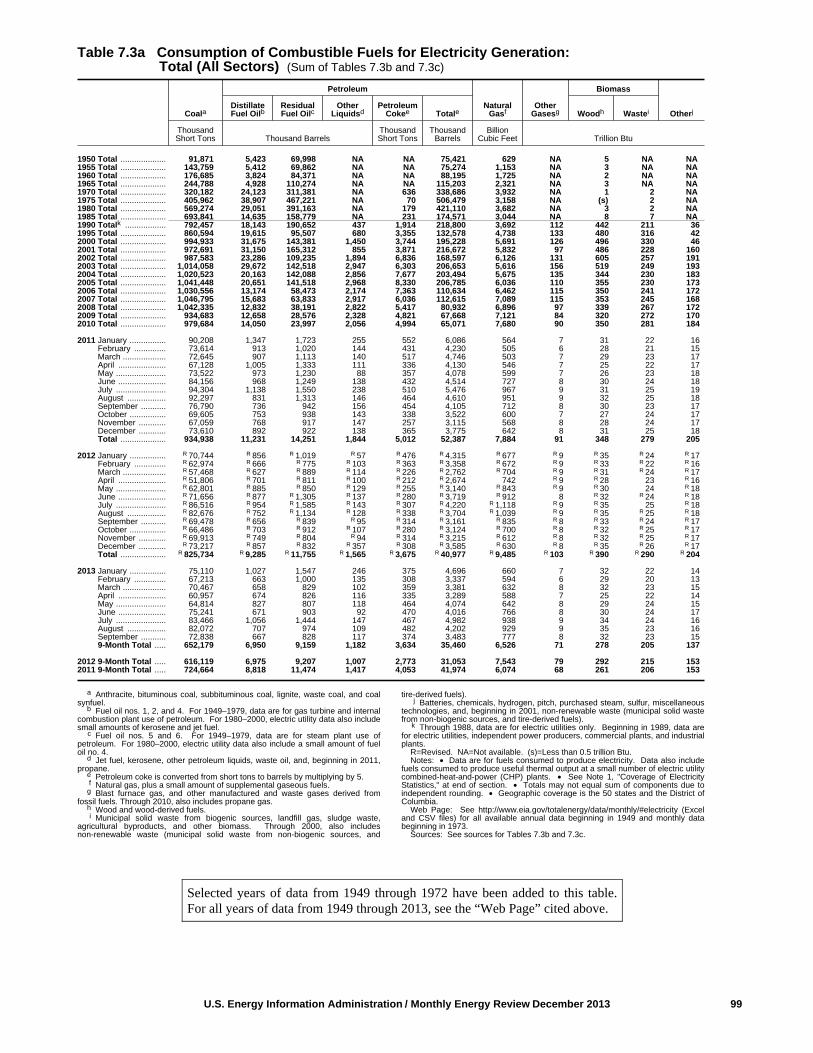
U.S. Energy Information Administration / Monthly Energy Review December 2013 99
Selected years of data from 1949 through 1972 have been added to this table.For all years of data from 1949 through 2013, see the “Web Page” cited above.
Table 7.3a Consumption of Combustible Fuels for Electricity Generation: Total (All Sectors) (Sum of Tables 7.3b and 7.3c)
Coala
Petroleum
NaturalGasf
OtherGasesg
Biomass
OtherjDistillateFuel Oilb
ResidualFuel Oilc
OtherLiquidsd
PetroleumCokee Totale Woodh Wastei
ThousandShort Tons Thousand Barrels
ThousandShort Tons
ThousandBarrels
BillionCubic Feet Trillion Btu
1950 Total .................... 91,871 5,423 69,998 NA NA 75,421 629 NA 5 NA NA1955 Total .................... 143,759 5,412 69,862 NA NA 75,274 1,153 NA 3 NA NA1960 Total .................... 176,685 3,824 84,371 NA NA 88,195 1,725 NA 2 NA NA1965 Total .................... 244,788 4,928 110,274 NA NA 115,203 2,321 NA 3 NA NA1970 Total .................... 320,182 24,123 311,381 NA 636 338,686 3,932 NA 1 2 NA1975 Total .................... 405,962 38,907 467,221 NA 70 506,479 3,158 NA (s) 2 NA1980 Total .................... 569,274 29,051 391,163 NA 179 421,110 3,682 NA 3 2 NA1985 Total .................... 693,841 14,635 158,779 NA 231 174,571 3,044 NA 8 7 NA1990 Totalk .................. 792,457 18,143 190,652 437 1,914 218,800 3,692 112 442 211 361995 Total .................... 860,594 19,615 95,507 680 3,355 132,578 4,738 133 480 316 422000 Total .................... 994,933 31,675 143,381 1,450 3,744 195,228 5,691 126 496 330 462001 Total .................... 972,691 31,150 165,312 855 3,871 216,672 5,832 97 486 228 1602002 Total .................... 987,583 23,286 109,235 1,894 6,836 168,597 6,126 131 605 257 1912003 Total .................... 1,014,058 29,672 142,518 2,947 6,303 206,653 5,616 156 519 249 1932004 Total .................... 1,020,523 20,163 142,088 2,856 7,677 203,494 5,675 135 344 230 1832005 Total .................... 1,041,448 20,651 141,518 2,968 8,330 206,785 6,036 110 355 230 1732006 Total .................... 1,030,556 13,174 58,473 2,174 7,363 110,634 6,462 115 350 241 1722007 Total .................... 1,046,795 15,683 63,833 2,917 6,036 112,615 7,089 115 353 245 1682008 Total .................... 1,042,335 12,832 38,191 2,822 5,417 80,932 6,896 97 339 267 1722009 Total .................... 934,683 12,658 28,576 2,328 4,821 67,668 7,121 84 320 272 1702010 Total .................... 979,684 14,050 23,997 2,056 4,994 65,071 7,680 90 350 281 184
2011 January ................ 90,208 1,347 1,723 255 552 6,086 564 7 31 22 16 February .............. 73,614 913 1,020 144 431 4,230 505 6 28 21 15 March ................... 72,645 907 1,113 140 517 4,746 503 7 29 23 17 April ..................... 67,128 1,005 1,333 111 336 4,130 546 7 25 22 17 May ...................... 73,522 973 1,230 88 357 4,078 599 7 26 23 18 June ..................... 84,156 968 1,249 138 432 4,514 727 8 30 24 18 July ...................... 94,304 1,138 1,550 238 510 5,476 967 9 31 25 19 August ................. 92,297 831 1,313 146 464 4,610 951 9 32 25 18 September ........... 76,790 736 942 156 454 4,105 712 8 30 23 17 October ................ 69,605 753 938 143 338 3,522 600 7 27 24 17 November ............ 67,059 768 917 147 257 3,115 568 8 28 24 17 December ............ 73,610 892 922 138 365 3,775 642 8 31 25 18 Total .................... 934,938 11,231 14,251 1,844 5,012 52,387 7,884 91 348 279 205
2012 January ................ R 70,744 R 856 R 1,019 R 57 R 476 R 4,315 R 677 R 9 R 35 R 24 R 17 February .............. R 62,974 R 666 R 775 R 103 R 363 R 3,358 R 672 R 9 R 33 R 22 R 16 March ................... R 57,468 R 627 R 889 R 114 R 226 R 2,762 R 704 R 9 R 31 R 24 R 17 April ..................... R 51,806 R 701 R 811 R 100 R 212 R 2,674 742 R 9 R 28 23 R 16 May ...................... R 62,801 R 885 R 850 R 129 R 255 R 3,140 R 843 R 9 R 30 24 R 18 June ..................... R 71,656 R 877 R 1,305 R 137 R 280 R 3,719 R 912 8 R 32 R 24 R 18 July ...................... R 86,516 R 954 R 1,585 R 143 R 307 R 4,220 R 1,118 R 9 R 35 25 R 18 August ................. R 82,676 R 752 R 1,134 R 128 R 338 R 3,704 R 1,039 R 9 R 35 R 25 R 18 September ........... R 69,478 R 656 R 839 R 95 R 314 R 3,161 R 835 R 8 R 33 R 24 R 17 October ................ R 66,486 R 703 R 912 R 107 R 280 R 3,124 R 700 R 8 R 32 R 25 R 17 November ............ R 69,913 R 749 R 804 R 94 R 314 R 3,215 R 612 R 8 R 32 R 25 R 17 December ............ R 73,217 R 857 R 832 R 357 R 308 R 3,585 R 630 R 8 R 35 R 26 R 17 Total .................... R 825,734 R 9,285 R 11,755 R 1,565 R 3,675 R 40,977 R 9,485 R 103 R 390 R 290 R 204
2013 January ................ 75,110 1,027 1,547 246 375 4,696 660 7 32 22 14 February .............. 67,213 663 1,000 135 308 3,337 594 6 29 20 13 March ................... 70,467 658 829 102 359 3,381 632 8 32 23 15 April ..................... 60,957 674 826 116 335 3,289 588 7 25 22 14 May ...................... 64,814 827 807 118 464 4,074 642 8 29 24 15 June ..................... 75,241 671 903 92 470 4,016 766 8 30 24 17 July ...................... 83,466 1,056 1,444 147 467 4,982 938 9 34 24 16 August ................. 82,072 707 974 109 482 4,202 929 9 35 23 16 September ........... 72,838 667 828 117 374 3,483 777 8 32 23 15 9-Month Total ..... 652,179 6,950 9,159 1,182 3,634 35,460 6,526 71 278 205 137
2012 9-Month Total ..... 616,119 6,975 9,207 1,007 2,773 31,053 7,543 79 292 215 1532011 9-Month Total ..... 724,664 8,818 11,474 1,417 4,053 41,974 6,074 68 261 206 153
a Anthracite, bituminous coal, subbituminous coal, lignite, waste coal, and coalsynfuel.
b Fuel oil nos. 1, 2, and 4. For 1949–1979, data are for gas turbine and internalcombustion plant use of petroleum. For 1980–2000, electric utility data also includesmall amounts of kerosene and jet fuel.
c Fuel oil nos. 5 and 6. For 1949–1979, data are for steam plant use ofpetroleum. For 1980–2000, electric utility data also include a small amount of fueloil no. 4.
d Jet fuel, kerosene, other petroleum liquids, waste oil, and, beginning in 2011,propane.
e Petroleum coke is converted from short tons to barrels by multiplying by 5.f Natural gas, plus a small amount of supplemental gaseous fuels.
g Blast furnace gas, and other manufactured and waste gases derived fromfossil fuels. Through 2010, also includes propane gas.
h Wood and wood-derived fuels.i Municipal solid waste from biogenic sources, landfill gas, sludge waste,
agricultural byproducts, and other biomass. Through 2000, also includesnon-renewable waste (municipal solid waste from non-biogenic sources, and
tire-derived fuels).j Batteries, chemicals, hydrogen, pitch, purchased steam, sulfur, miscellaneous
technologies, and, beginning in 2001, non-renewable waste (municipal solid wastefrom non-biogenic sources, and tire-derived fuels).
k Through 1988, data are for electric utilities only. Beginning in 1989, data arefor electric utilities, independent power producers, commercial plants, and industrialplants.
R=Revised. NA=Not available. (s)=Less than 0.5 trillion Btu. Notes: • Data are for fuels consumed to produce electricity. Data also include
fuels consumed to produce useful thermal output at a small number of electric utilitycombined-heat-and-power (CHP) plants. • See Note 1, "Coverage of ElectricityStatistics," at end of section. • Totals may not equal sum of components due toindependent rounding. • Geographic coverage is the 50 states and the District ofColumbia.
Web Page: See http://www.eia.gov/totalenergy/data/monthly/#electricity (Exceland CSV files) for all available annual data beginning in 1949 and monthly databeginning in 1973.
Sources: See sources for Tables 7.3b and 7.3c.
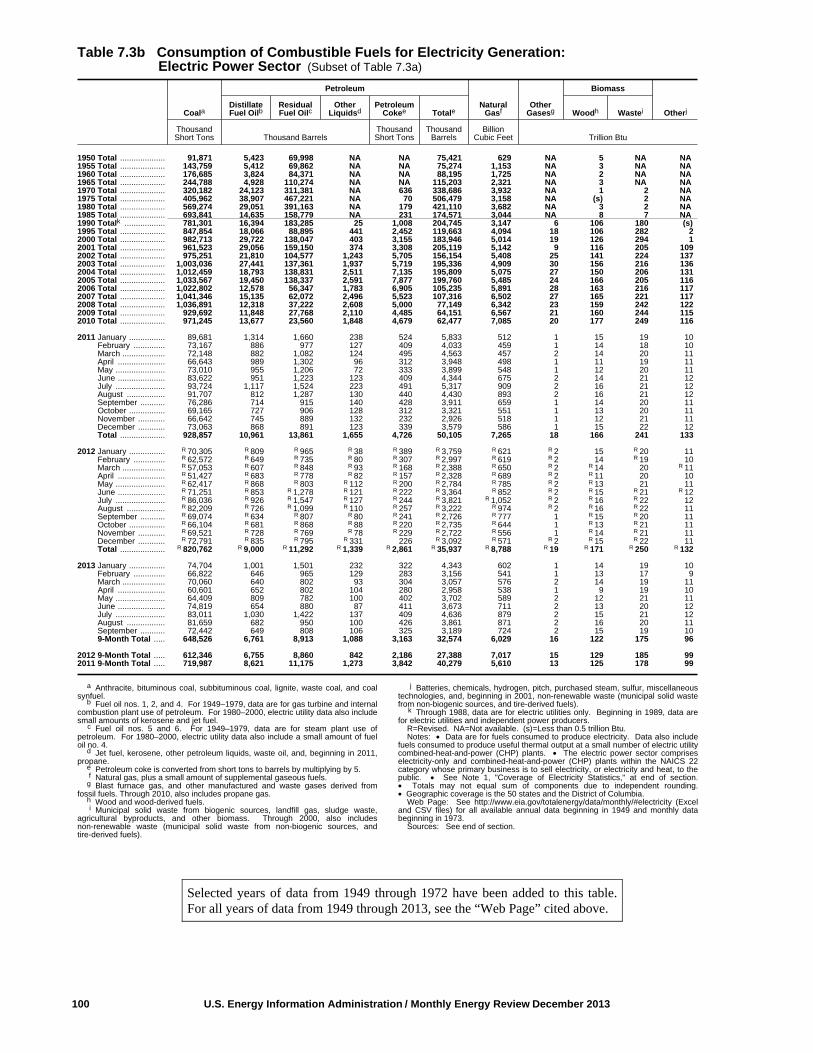
100 U.S. Energy Information Administration / Monthly Energy Review December 2013
Selected years of data from 1949 through 1972 have been added to this table.For all years of data from 1949 through 2013, see the “Web Page” cited above.
Table 7.3b Consumption of Combustible Fuels for Electricity Generation: Electric Power Sector (Subset of Table 7.3a)
Coala
Petroleum
NaturalGasf
OtherGasesg
Biomass
OtherjDistillateFuel Oilb
ResidualFuel Oilc
OtherLiquidsd
PetroleumCokee Totale Woodh Wastei
ThousandShort Tons Thousand Barrels
ThousandShort Tons
ThousandBarrels
BillionCubic Feet Trillion Btu
1950 Total .................... 91,871 5,423 69,998 NA NA 75,421 629 NA 5 NA NA1955 Total .................... 143,759 5,412 69,862 NA NA 75,274 1,153 NA 3 NA NA1960 Total .................... 176,685 3,824 84,371 NA NA 88,195 1,725 NA 2 NA NA1965 Total .................... 244,788 4,928 110,274 NA NA 115,203 2,321 NA 3 NA NA1970 Total .................... 320,182 24,123 311,381 NA 636 338,686 3,932 NA 1 2 NA1975 Total .................... 405,962 38,907 467,221 NA 70 506,479 3,158 NA (s) 2 NA1980 Total .................... 569,274 29,051 391,163 NA 179 421,110 3,682 NA 3 2 NA1985 Total .................... 693,841 14,635 158,779 NA 231 174,571 3,044 NA 8 7 NA1990 Totalk .................. 781,301 16,394 183,285 25 1,008 204,745 3,147 6 106 180 (s)1995 Total .................... 847,854 18,066 88,895 441 2,452 119,663 4,094 18 106 282 22000 Total .................... 982,713 29,722 138,047 403 3,155 183,946 5,014 19 126 294 12001 Total .................... 961,523 29,056 159,150 374 3,308 205,119 5,142 9 116 205 1092002 Total .................... 975,251 21,810 104,577 1,243 5,705 156,154 5,408 25 141 224 1372003 Total .................... 1,003,036 27,441 137,361 1,937 5,719 195,336 4,909 30 156 216 1362004 Total .................... 1,012,459 18,793 138,831 2,511 7,135 195,809 5,075 27 150 206 1312005 Total .................... 1,033,567 19,450 138,337 2,591 7,877 199,760 5,485 24 166 205 1162006 Total .................... 1,022,802 12,578 56,347 1,783 6,905 105,235 5,891 28 163 216 1172007 Total .................... 1,041,346 15,135 62,072 2,496 5,523 107,316 6,502 27 165 221 1172008 Total .................... 1,036,891 12,318 37,222 2,608 5,000 77,149 6,342 23 159 242 1222009 Total .................... 929,692 11,848 27,768 2,110 4,485 64,151 6,567 21 160 244 1152010 Total .................... 971,245 13,677 23,560 1,848 4,679 62,477 7,085 20 177 249 116
2011 January ................ 89,681 1,314 1,660 238 524 5,833 512 1 15 19 10 February .............. 73,167 886 977 127 409 4,033 459 1 14 18 10 March ................... 72,148 882 1,082 124 495 4,563 457 2 14 20 11 April ..................... 66,643 989 1,302 96 312 3,948 498 1 11 19 11 May ...................... 73,010 955 1,206 72 333 3,899 548 1 12 20 11 June ..................... 83,622 951 1,223 123 409 4,344 675 2 14 21 12 July ...................... 93,724 1,117 1,524 223 491 5,317 909 2 16 21 12 August ................. 91,707 812 1,287 130 440 4,430 893 2 16 21 12 September ........... 76,286 714 915 140 428 3,911 659 1 14 20 11 October ................ 69,165 727 906 128 312 3,321 551 1 13 20 11 November ............ 66,642 745 889 132 232 2,926 518 1 12 21 11 December ............ 73,063 868 891 123 339 3,579 586 1 15 22 12 Total .................... 928,857 10,961 13,861 1,655 4,726 50,105 7,265 18 166 241 133
2012 January ................ R 70,305 R 809 R 965 R 38 R 389 R 3,759 R 621 R 2 15 R 20 11 February .............. R 62,572 R 649 R 735 R 80 R 307 R 2,997 R 619 R 2 14 R 19 10 March ................... R 57,053 R 607 R 848 R 93 R 168 R 2,388 R 650 R 2 R 14 20 R 11 April ..................... R 51,427 R 683 R 778 R 82 R 157 R 2,328 R 689 R 2 R 11 20 10 May ...................... R 62,417 R 868 R 803 R 112 R 200 R 2,784 R 785 R 2 R 13 21 11 June ..................... R 71,251 R 853 R 1,278 R 121 R 222 R 3,364 R 852 R 2 R 15 R 21 R 12 July ...................... R 86,036 R 926 R 1,547 R 127 R 244 R 3,821 R 1,052 R 2 R 16 R 22 12 August ................. R 82,209 R 726 R 1,099 R 110 R 257 R 3,222 R 974 R 2 R 16 R 22 11 September ........... R 69,074 R 634 R 807 R 80 R 241 R 2,726 R 777 1 R 15 R 20 11 October ................ R 66,104 R 681 R 868 R 88 R 220 R 2,735 R 644 1 R 13 R 21 11 November ............ R 69,521 R 728 R 769 R 78 R 229 R 2,722 R 556 1 R 14 R 21 11 December ............ R 72,791 R 835 R 795 R 331 226 R 3,092 R 571 R 2 R 15 R 22 11 Total .................... R 820,762 R 9,000 R 11,292 R 1,339 R 2,861 R 35,937 R 8,788 R 19 R 171 R 250 R 132
2013 January ................ 74,704 1,001 1,501 232 322 4,343 602 1 14 19 10 February .............. 66,822 646 965 129 283 3,156 541 1 13 17 9 March ................... 70,060 640 802 93 304 3,057 576 2 14 19 11 April ..................... 60,601 652 802 104 280 2,958 538 1 9 19 10 May ...................... 64,409 809 782 100 402 3,702 589 2 12 21 11 June ..................... 74,819 654 880 87 411 3,673 711 2 13 20 12 July ...................... 83,011 1,030 1,422 137 409 4,636 879 2 15 21 12 August ................. 81,659 682 950 100 426 3,861 871 2 16 20 11 September ........... 72,442 649 808 106 325 3,189 724 2 15 19 10 9-Month Total ..... 648,526 6,761 8,913 1,088 3,163 32,574 6,029 16 122 175 96
2012 9-Month Total ..... 612,346 6,755 8,860 842 2,186 27,388 7,017 15 129 185 992011 9-Month Total ..... 719,987 8,621 11,175 1,273 3,842 40,279 5,610 13 125 178 99
a Anthracite, bituminous coal, subbituminous coal, lignite, waste coal, and coalsynfuel.
b Fuel oil nos. 1, 2, and 4. For 1949–1979, data are for gas turbine and internalcombustion plant use of petroleum. For 1980–2000, electric utility data also includesmall amounts of kerosene and jet fuel.
c Fuel oil nos. 5 and 6. For 1949–1979, data are for steam plant use ofpetroleum. For 1980–2000, electric utility data also include a small amount of fueloil no. 4.
d Jet fuel, kerosene, other petroleum liquids, waste oil, and, beginning in 2011,propane.
e Petroleum coke is converted from short tons to barrels by multiplying by 5.f Natural gas, plus a small amount of supplemental gaseous fuels.
g Blast furnace gas, and other manufactured and waste gases derived fromfossil fuels. Through 2010, also includes propane gas.
h Wood and wood-derived fuels.i Municipal solid waste from biogenic sources, landfill gas, sludge waste,
agricultural byproducts, and other biomass. Through 2000, also includesnon-renewable waste (municipal solid waste from non-biogenic sources, andtire-derived fuels).
j Batteries, chemicals, hydrogen, pitch, purchased steam, sulfur, miscellaneoustechnologies, and, beginning in 2001, non-renewable waste (municipal solid wastefrom non-biogenic sources, and tire-derived fuels).
k Through 1988, data are for electric utilities only. Beginning in 1989, data arefor electric utilities and independent power producers.
R=Revised. NA=Not available. (s)=Less than 0.5 trillion Btu. Notes: • Data are for fuels consumed to produce electricity. Data also include
fuels consumed to produce useful thermal output at a small number of electric utilitycombined-heat-and-power (CHP) plants. • The electric power sector compriseselectricity-only and combined-heat-and-power (CHP) plants within the NAICS 22category whose primary business is to sell electricity, or electricity and heat, to thepublic. • See Note 1, "Coverage of Electricity Statistics," at end of section.• Totals may not equal sum of components due to independent rounding.• Geographic coverage is the 50 states and the District of Columbia.
Web Page: See http://www.eia.gov/totalenergy/data/monthly/#electricity (Exceland CSV files) for all available annual data beginning in 1949 and monthly databeginning in 1973.
Sources: See end of section.

U.S. Energy Information Administration / Monthly Energy Review December 2013 101
Table 7.3c Consumption of Selected Combustible Fuels for Electricity Generation: Commercial and Industrial Sectors (Subset of Table 7.3a)
Commercial Sectora Industrial Sectorb
Coalc PetroleumdNaturalGase
Biomass
Coalc PetroleumdNaturalGase
OtherGasesg
Biomass
OtheriWastef Woodh Wastef
ThousandShort Tons
ThousandBarrels
BillionCubic Feet
TrillionBtu
ThousandShort Tons
ThousandBarrels
BillionCubic Feet Trillion Btu
1990 Total .................... 417 953 28 15 10,740 13,103 517 104 335 16 361995 Total .................... 569 649 43 21 12,171 12,265 601 114 373 13 402000 Total .................... 514 823 37 26 11,706 10,459 640 107 369 10 452001 Total .................... 532 1,023 36 15 10,636 10,530 654 88 370 7 442002 Total .................... 477 834 33 18 11,855 11,608 685 106 464 15 432003 Total .................... 582 894 38 19 10,440 10,424 668 127 362 13 462004 Total .................... 377 766 33 19 7,687 6,919 566 108 194 5 412005 Total .................... 377 585 34 20 7,504 6,440 518 85 189 5 462006 Total .................... 347 333 35 21 7,408 5,066 536 87 187 3 452007 Total .................... 361 258 34 19 5,089 5,041 554 88 188 4 412008 Total .................... 369 166 33 20 5,075 3,617 520 73 179 5 392009 Total .................... 317 190 34 23 4,674 3,328 520 62 160 4 422010 Total .................... 314 172 39 24 8,125 2,422 555 70 172 8 55
2011 January ................ 40 27 4 3 487 226 48 6 16 1 4 February .............. 39 16 3 2 409 180 43 5 14 1 4 March ................... 37 11 3 3 460 173 43 5 15 1 5 April ..................... 25 5 3 2 460 177 45 6 14 1 5 May ...................... 25 5 4 3 487 174 47 6 14 1 5 June ..................... 27 5 4 3 507 165 48 7 16 1 5 July ...................... 32 14 5 3 548 145 53 7 16 1 5 August ................. 29 12 5 3 562 168 54 7 16 1 5 September ........... 26 13 4 3 479 181 49 6 15 1 4 October ................ 21 10 4 3 419 191 45 6 15 1 5 November ............ 21 11 4 3 397 179 47 6 16 1 5 December ............ 26 9 4 3 521 187 51 6 16 1 5 Total .................... 347 137 47 31 5,735 2,145 572 74 182 7 57
2012 January ................ 29 R 29 R 5 3 R 410 R 528 R 51 R 7 R 19 1 R 4 February .............. 27 R 19 R 5 3 R 374 R 342 R 49 7 R 18 1 R 4 March ................... R 26 R 17 R 5 3 R 388 R 357 R 48 R 8 R 17 1 R 4 April ..................... R 23 R 17 R 5 R 3 R 356 R 329 R 48 R 7 R 17 1 R 4 May ...................... R 22 R 25 R 5 3 R 361 R 332 R 53 R 7 17 1 R 5 June ..................... 26 R 24 R 6 R 3 R 379 R 332 R 55 R 7 R 18 1 R 4 July ...................... R 28 R 33 R 7 3 R 452 R 367 R 59 R 7 R 19 1 R 5 August ................. 28 R 28 R 6 R 3 R 439 R 454 R 59 7 R 19 1 R 5 September ........... 24 R 19 R 5 3 R 381 R 417 R 53 R 7 R 18 1 R 4 October ................ R 21 R 22 R 5 3 R 361 R 366 R 52 R 6 R 18 1 R 4 November ............ R 25 R 24 4 3 R 366 R 469 51 R 6 R 19 1 R 5 December ............ R 27 R 24 4 3 R 398 R 469 55 R 7 R 20 1 R 4 Total .................... R 307 R 279 R 63 R 33 R 4,665 R 4,761 R 633 R 84 R 219 R 8 R 54
2013 January ................ 31 22 4 3 375 331 54 6 18 1 3 February .............. 29 13 4 3 362 168 49 5 17 (s) 3 March ................... 28 8 4 3 379 316 52 6 18 1 3 April ..................... 24 9 4 3 332 322 47 5 16 1 3 May ...................... 27 9 4 3 379 363 49 7 16 1 3 June ..................... 29 9 4 3 393 334 51 6 17 1 3 July ...................... 30 16 5 3 425 330 54 7 18 1 3 August ................. 27 11 4 3 386 330 54 7 18 1 4 September ........... 24 10 4 3 372 285 49 6 17 1 3 9-Month Total ..... 248 108 37 25 3,405 2,778 460 55 156 5 28
2012 9-Month Total ..... 233 208 50 24 3,540 3,457 476 65 162 6 402011 9-Month Total ..... 279 108 35 23 4,398 1,588 429 55 135 5 43
a Commercial combined-heat-and-power (CHP) and commercial electricity-onlyplants.
b Industrial combined-heat-and-power (CHP) and industrial electricity-onlyplants.
c Anthracite, bituminous coal, subbituminous coal, lignite, waste coal, and coalsynfuel.
d Distillate fuel oil, residual fuel oil, petroleum coke, jet fuel, kerosene, otherpetroleum, waste oil, and, beginning in 2011, propane.
e Natural gas, plus a small amount of supplemental gaseous fuels.f Municipal solid waste from biogenic sources, landfill gas, sludge waste,
agricultural byproducts, and other biomass. Through 2000, also includesnon-renewable waste (municipal solid waste from non-biogenic sources, andtire-derived fuels).
g Blast furnace gas, and other manufactured and waste gases derived fromfossil fuels. Through 2010, also includes propane gas.
h Wood and wood-derived fuels.i Batteries, chemicals, hydrogen, pitch, purchased steam, sulfur, miscellaneous
technologies, and, beginning in 2001, non-renewable waste (municipal solid wastefrom non-biogenic sources, and tire-derived fuels).
R=Revised. (s)=Less than 0.5 trillion Btu. Notes: • Data are for fuels consumed to produce electricity. Through 1988,
data are not available. • See Note 1, "Coverage of Electricity Statistics," and Note2, "Classification of Power Plants Into Energy-Use Sectors," at end of section.• Totals may not equal sum of components due to independent rounding.• Geographic coverage is the 50 states and the District of Columbia.
Web Page: See http://www.eia.gov/totalenergy/data/monthly/#electricity (Exceland CSV files) for all available annual and monthly data beginning in 1989.
Sources: • 1989–1997: U.S. Energy Information Administration (EIA), FormEIA-867, "Annual Nonutility Power Producer Report." • 1998–2000: EIA, FormEIA-860B, "Annual Electric Generator Report—Nonutility." • 2001–2003: EIA,Form EIA-906, "Power Plant Report." • 2004–2007: EIA, Form EIA-906, "PowerPlant Report," and Form EIA-920, "Combined Heat and Power Plant Report." • 2008 forward: EIA, Form EIA-923, "Power Plant Operations Report."
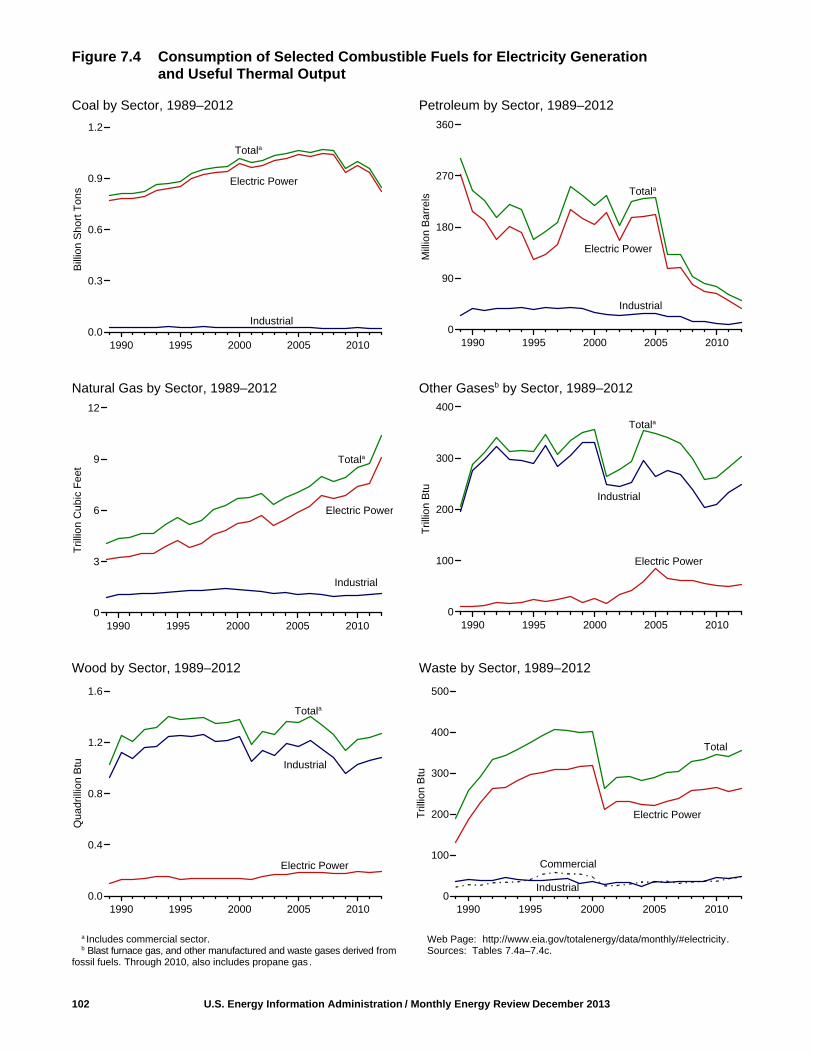
Figure 7.4 Consumption of Selected Combustible Fuels for Electricity Generationand Useful Thermal Output
Coal by Sector, 1989–2012 Petroleum by Sector, 1989–2012
Natural Gas by Sector, 1989–2012 Other Gasesb by Sector, 1989–2012
Wood by Sector, 1989–2012 Waste by Sector, 1989–2012
102 U.S. Energy Information Administration / Monthly Energy Review December 2013
Industrial
Commercial
Industrial
Electric Power
Industrial
Totala
1990 1995 2000 2005 20100.0
0.3
0.6
0.9
1.2
Bill
ion
Sho
rt T
ons
Totala
1990 1995 2000 2005 20100
90
180
270
360
Mill
ion
Ba
rrel
s
Electric Power
a Includes commercial sector.b Blast furnace gas, and other manufactured and waste gases derived from
fossil fuels. Through 2010, also includes propane gas .
Web Page: http://www.eia.gov/totalenergy/data/monthly/#electricity.Sources: Tables 7.4a–7.4c.
Industrial
Totala
1990 1995 2000 2005 20100
3
6
9
12
Tril
lion
Cub
ic F
eet
1990 1995 2000 2005 20100
100
200
300
400
Tril
lion
Btu
Electric Power
Industrial
Totala
Total
1990 1995 2000 2005 20100
100
200
300
400
500
Tril
lion
Btu
Electric Power
Electric Power
Electric Power
Industrial
Totala
1990 1995 2000 2005 20100.0
0.4
0.8
1.2
1.6
Qua
drill
ion
Btu
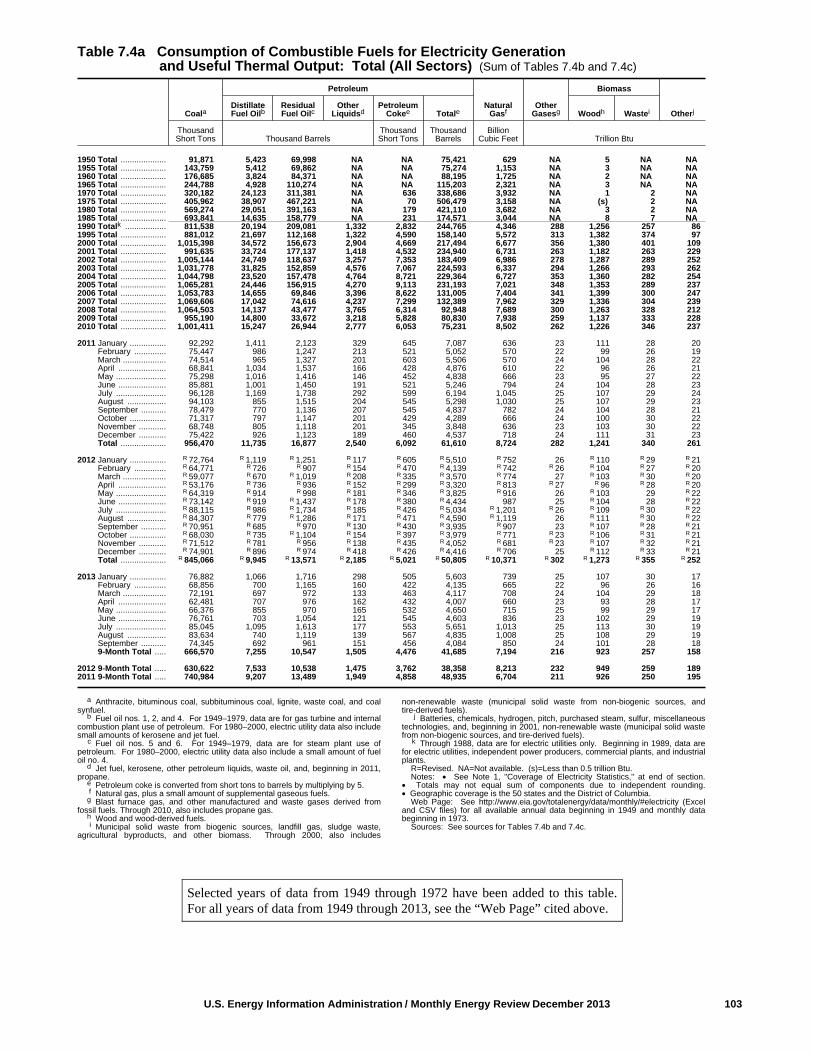
U.S. Energy Information Administration / Monthly Energy Review December 2013 103
Table 7.4a Consumption of Combustible Fuels for Electricity Generation and Useful Thermal Output: Total (All Sectors) (Sum of Tables 7.4b and 7.4c)
Coala
Petroleum
NaturalGasf
OtherGasesg
Biomass
OtherjDistillateFuel Oilb
ResidualFuel Oilc
OtherLiquidsd
PetroleumCokee Totale Woodh Wastei
ThousandShort Tons Thousand Barrels
ThousandShort Tons
ThousandBarrels
BillionCubic Feet Trillion Btu
1950 Total .................... 91,871 5,423 69,998 NA NA 75,421 629 NA 5 NA NA1955 Total .................... 143,759 5,412 69,862 NA NA 75,274 1,153 NA 3 NA NA1960 Total .................... 176,685 3,824 84,371 NA NA 88,195 1,725 NA 2 NA NA1965 Total .................... 244,788 4,928 110,274 NA NA 115,203 2,321 NA 3 NA NA1970 Total .................... 320,182 24,123 311,381 NA 636 338,686 3,932 NA 1 2 NA1975 Total .................... 405,962 38,907 467,221 NA 70 506,479 3,158 NA (s) 2 NA1980 Total .................... 569,274 29,051 391,163 NA 179 421,110 3,682 NA 3 2 NA1985 Total .................... 693,841 14,635 158,779 NA 231 174,571 3,044 NA 8 7 NA1990 Totalk .................. 811,538 20,194 209,081 1,332 2,832 244,765 4,346 288 1,256 257 861995 Total .................... 881,012 21,697 112,168 1,322 4,590 158,140 5,572 313 1,382 374 972000 Total .................... 1,015,398 34,572 156,673 2,904 4,669 217,494 6,677 356 1,380 401 1092001 Total .................... 991,635 33,724 177,137 1,418 4,532 234,940 6,731 263 1,182 263 2292002 Total .................... 1,005,144 24,749 118,637 3,257 7,353 183,409 6,986 278 1,287 289 2522003 Total .................... 1,031,778 31,825 152,859 4,576 7,067 224,593 6,337 294 1,266 293 2622004 Total .................... 1,044,798 23,520 157,478 4,764 8,721 229,364 6,727 353 1,360 282 2542005 Total .................... 1,065,281 24,446 156,915 4,270 9,113 231,193 7,021 348 1,353 289 2372006 Total .................... 1,053,783 14,655 69,846 3,396 8,622 131,005 7,404 341 1,399 300 2472007 Total .................... 1,069,606 17,042 74,616 4,237 7,299 132,389 7,962 329 1,336 304 2392008 Total .................... 1,064,503 14,137 43,477 3,765 6,314 92,948 7,689 300 1,263 328 2122009 Total .................... 955,190 14,800 33,672 3,218 5,828 80,830 7,938 259 1,137 333 2282010 Total .................... 1,001,411 15,247 26,944 2,777 6,053 75,231 8,502 262 1,226 346 237
2011 January ................ 92,292 1,411 2,123 329 645 7,087 636 23 111 28 20 February .............. 75,447 986 1,247 213 521 5,052 570 22 99 26 19 March ................... 74,514 965 1,327 201 603 5,506 570 24 104 28 22 April ..................... 68,841 1,034 1,537 166 428 4,876 610 22 96 26 21 May ...................... 75,298 1,016 1,416 146 452 4,838 666 23 95 27 22 June ..................... 85,881 1,001 1,450 191 521 5,246 794 24 104 28 23 July ...................... 96,128 1,169 1,738 292 599 6,194 1,045 25 107 29 24 August ................. 94,103 855 1,515 204 545 5,298 1,030 25 107 29 23 September ........... 78,479 770 1,136 207 545 4,837 782 24 104 28 21 October ................ 71,317 797 1,147 201 429 4,289 666 24 100 30 22 November ............ 68,748 805 1,118 201 345 3,848 636 23 103 30 22 December ............ 75,422 926 1,123 189 460 4,537 718 24 111 31 23 Total .................... 956,470 11,735 16,877 2,540 6,092 61,610 8,724 282 1,241 340 261
2012 January ................ R 72,764 R 1,119 R 1,251 R 117 R 605 R 5,510 R 752 26 R 110 R 29 R 21 February .............. R 64,771 R 726 R 907 R 154 R 470 R 4,139 R 742 R 26 R 104 R 27 R 20 March ................... R 59,077 R 670 R 1,019 R 208 R 335 R 3,570 R 774 27 R 103 R 30 R 20 April ..................... R 53,176 R 736 R 936 R 152 R 299 R 3,320 R 813 R 27 R 96 R 28 R 20 May ...................... R 64,319 R 914 R 998 R 181 R 346 R 3,825 R 916 26 R 103 29 R 22 June ..................... R 73,142 R 919 R 1,437 R 178 R 380 R 4,434 987 25 R 104 28 R 22 July ...................... R 88,115 R 986 R 1,734 R 185 R 426 R 5,034 R 1,201 R 26 R 109 R 30 R 22 August ................. R 84,307 R 779 R 1,286 R 171 R 471 R 4,590 R 1,119 26 R 111 R 30 R 22 September ........... R 70,951 R 685 R 970 R 130 R 430 R 3,935 R 907 23 R 107 R 28 R 21 October ................ R 68,030 R 735 R 1,104 R 154 R 397 R 3,979 R 771 R 23 R 106 R 31 R 21 November ............ R 71,512 R 781 R 956 R 138 R 435 R 4,052 R 681 R 23 R 107 R 32 R 21 December ............ R 74,901 R 896 R 974 R 418 R 426 R 4,416 R 706 25 R 112 R 33 R 21 Total .................... R 845,066 R 9,945 R 13,571 R 2,185 R 5,021 R 50,805 R 10,371 R 302 R 1,273 R 355 R 252
2013 January ................ 76,882 1,066 1,716 298 505 5,603 739 25 107 30 17 February .............. 68,856 700 1,165 160 422 4,135 665 22 96 26 16 March ................... 72,191 697 972 133 463 4,117 708 24 104 29 18 April ..................... 62,481 707 976 162 432 4,007 660 23 93 28 17 May ...................... 66,376 855 970 165 532 4,650 715 25 99 29 17 June ..................... 76,761 703 1,054 121 545 4,603 836 23 102 29 19 July ...................... 85,045 1,095 1,613 177 553 5,651 1,013 25 113 30 19 August ................. 83,634 740 1,119 139 567 4,835 1,008 25 108 29 19 September ........... 74,345 692 961 151 456 4,084 850 24 101 28 18 9-Month Total ..... 666,570 7,255 10,547 1,505 4,476 41,685 7,194 216 923 257 158
2012 9-Month Total ..... 630,622 7,533 10,538 1,475 3,762 38,358 8,213 232 949 259 1892011 9-Month Total ..... 740,984 9,207 13,489 1,949 4,858 48,935 6,704 211 926 250 195
a Anthracite, bituminous coal, subbituminous coal, lignite, waste coal, and coalsynfuel.
b Fuel oil nos. 1, 2, and 4. For 1949–1979, data are for gas turbine and internalcombustion plant use of petroleum. For 1980–2000, electric utility data also includesmall amounts of kerosene and jet fuel.
c Fuel oil nos. 5 and 6. For 1949–1979, data are for steam plant use ofpetroleum. For 1980–2000, electric utility data also include a small amount of fueloil no. 4.
d Jet fuel, kerosene, other petroleum liquids, waste oil, and, beginning in 2011,propane.
e Petroleum coke is converted from short tons to barrels by multiplying by 5.f Natural gas, plus a small amount of supplemental gaseous fuels.
g Blast furnace gas, and other manufactured and waste gases derived fromfossil fuels. Through 2010, also includes propane gas.
h Wood and wood-derived fuels.i Municipal solid waste from biogenic sources, landfill gas, sludge waste,
agricultural byproducts, and other biomass. Through 2000, also includes
non-renewable waste (municipal solid waste from non-biogenic sources, andtire-derived fuels).
j Batteries, chemicals, hydrogen, pitch, purchased steam, sulfur, miscellaneoustechnologies, and, beginning in 2001, non-renewable waste (municipal solid wastefrom non-biogenic sources, and tire-derived fuels).
k Through 1988, data are for electric utilities only. Beginning in 1989, data arefor electric utilities, independent power producers, commercial plants, and industrialplants.
R=Revised. NA=Not available. (s)=Less than 0.5 trillion Btu. Notes: • See Note 1, "Coverage of Electricity Statistics," at end of section.
• Totals may not equal sum of components due to independent rounding.• Geographic coverage is the 50 states and the District of Columbia.
Web Page: See http://www.eia.gov/totalenergy/data/monthly/#electricity (Exceland CSV files) for all available annual data beginning in 1949 and monthly databeginning in 1973.
Sources: See sources for Tables 7.4b and 7.4c.
Selected years of data from 1949 through 1972 have been added to this table.For all years of data from 1949 through 2013, see the “Web Page” cited above.

104 U.S. Energy Information Administration / Monthly Energy Review December 2013
Selected years of data from 1949 through 1972 have been added to this table.For all years of data from 1949 through 2013, see the “Web Page” cited above.
Table 7.4b Consumption of Combustible Fuels for Electricity Generation and Useful Thermal Output: Electric Power Sector (Subset of Table 7.4a)
Coala
Petroleum
NaturalGasf
OtherGasesg
Biomass
OtherjDistillateFuel Oilb
ResidualFuel Oilc
OtherLiquidsd
PetroleumCokee Totale Woodh Wastei
ThousandShort Tons Thousand Barrels
ThousandShort Tons
ThousandBarrels
BillionCubic Feet Trillion Btu
1950 Total .................... 91,871 5,423 69,998 NA NA 75,421 629 NA 5 NA NA1955 Total .................... 143,759 5,412 69,862 NA NA 75,274 1,153 NA 3 NA NA1960 Total .................... 176,685 3,824 84,371 NA NA 88,195 1,725 NA 2 NA NA1965 Total .................... 244,788 4,928 110,274 NA NA 115,203 2,321 NA 3 NA NA1970 Total .................... 320,182 24,123 311,381 NA 636 338,686 3,932 NA 1 2 NA1975 Total .................... 405,962 38,907 467,221 NA 70 506,479 3,158 NA (s) 2 NA1980 Total .................... 569,274 29,051 391,163 NA 179 421,110 3,682 NA 3 2 NA1985 Total .................... 693,841 14,635 158,779 NA 231 174,571 3,044 NA 8 7 NA1990 Totalk .................. 782,567 16,567 184,915 26 1,008 206,550 3,245 11 129 188 (s)1995 Total .................... 850,230 18,553 90,023 499 2,674 122,447 4,237 24 125 296 22000 Total .................... 985,821 30,016 138,513 454 3,275 185,358 5,206 25 134 318 12001 Total .................... 964,433 29,274 159,504 377 3,427 206,291 5,342 15 126 211 1132002 Total .................... 977,507 21,876 104,773 1,267 5,816 156,996 5,672 33 150 230 1432003 Total .................... 1,005,116 27,632 138,279 2,026 5,799 196,932 5,135 41 167 230 1402004 Total .................... 1,016,268 19,107 139,816 2,713 7,372 198,498 5,464 58 165 223 1382005 Total .................... 1,037,485 19,675 139,409 2,685 8,083 202,184 5,869 84 185 221 1232006 Total .................... 1,026,636 12,646 57,345 1,870 7,101 107,365 6,222 65 182 231 1252007 Total .................... 1,045,141 15,327 63,086 2,594 5,685 109,431 6,841 61 186 237 1242008 Total .................... 1,040,580 12,547 38,241 2,670 5,119 79,056 6,668 61 177 258 1312009 Total .................... 933,627 12,035 28,782 2,210 4,611 66,081 6,873 55 180 261 1242010 Total .................... 975,052 13,790 24,503 1,877 4,777 64,055 7,387 52 196 264 124
2011 January ................ 90,021 1,322 1,745 239 529 5,953 540 4 17 21 11 February .............. 73,474 911 1,024 127 417 4,148 484 4 16 19 11 March ................... 72,458 885 1,153 124 506 4,692 482 5 15 21 12 April ..................... 66,930 991 1,384 96 321 4,078 521 4 12 20 12 May ...................... 73,338 957 1,286 72 344 4,034 572 4 13 21 12 June ..................... 83,908 954 1,303 123 419 4,474 699 4 16 22 12 July ...................... 94,037 1,120 1,609 223 501 5,458 939 4 17 22 13 August ................. 92,012 816 1,375 130 451 4,575 921 4 17 22 13 September ........... 76,569 716 1,002 140 439 4,052 684 4 15 21 12 October ................ 69,458 730 990 128 319 3,445 575 4 14 22 12 November ............ 66,919 748 968 134 241 3,052 543 4 14 22 12 December ............ 73,359 870 965 123 350 3,707 614 4 16 23 12 Total .................... 932,484 11,021 14,803 1,658 4,837 51,667 7,574 50 182 255 143
2012 January ................ R 70,594 R 834 R 1,057 R 38 R 400 R 3,930 R 649 R 5 R 17 R 22 12 February .............. R 62,804 R 667 R 796 R 80 R 318 R 3,131 R 645 4 R 16 R 20 R 11 March ................... R 57,266 R 610 R 898 R 93 R 178 R 2,493 R 674 R 5 R 16 R 22 R 12 April ..................... R 51,593 R 686 R 841 R 82 R 166 R 2,439 R 714 R 5 R 13 R 21 11 May ...................... R 62,648 R 873 R 883 R 112 R 211 R 2,924 R 812 4 R 14 22 12 June ..................... R 71,480 R 856 R 1,364 R 121 R 228 R 3,481 R 880 4 R 16 R 22 12 July ...................... R 86,283 R 931 R 1,624 R 127 R 253 R 3,949 R 1,082 R 5 R 18 R 23 R 13 August ................. R 82,484 R 729 R 1,178 R 110 R 267 R 3,353 R 1,004 R 5 R 18 R 23 12 September ........... R 69,309 R 637 R 884 R 80 R 250 R 2,852 R 803 4 R 16 R 21 R 12 October ................ R 66,343 R 685 R 951 R 88 R 229 R 2,866 R 669 4 R 15 R 22 R 12 November ............ R 69,740 R 732 R 850 R 78 R 238 R 2,851 R 580 R 4 15 R 23 R 12 December ............ R 73,009 R 839 R 877 R 331 236 R 3,226 R 600 R 5 16 R 24 12 Total .................... R 823,551 R 9,080 R 12,203 R 1,339 R 2,974 R 37,495 R 9,111 R 54 R 190 R 262 R 143
2013 January ................ 74,968 1,007 1,551 232 332 4,449 629 4 16 21 11 February .............. 67,086 656 1,030 130 292 3,273 566 3 14 18 10 March ................... 70,355 644 883 93 314 3,191 602 3 15 21 11 April ..................... 60,859 656 884 105 290 3,095 563 4 11 20 11 May ...................... 64,692 811 868 100 411 3,833 615 4 14 21 12 June ..................... 75,096 656 959 87 417 3,785 736 4 15 21 13 July ...................... 83,295 1,031 1,506 137 419 4,771 907 4 17 22 12 August ................. 81,949 684 1,035 100 435 3,996 899 4 18 21 12 September ........... 72,699 650 896 106 333 3,316 750 4 16 20 11 9-Month Total ..... 650,998 6,796 9,612 1,089 3,242 33,709 6,267 35 135 187 103
2012 9-Month Total ..... 614,460 6,825 9,525 842 2,272 28,552 7,262 41 144 194 1072011 9-Month Total ..... 722,748 8,672 11,881 1,273 3,927 41,464 5,842 38 138 188 107
a Anthracite, bituminous coal, subbituminous coal, lignite, waste coal, and coalsynfuel.
b Fuel oil nos. 1, 2, and 4. For 1949–1979, data are for gas turbine and internalcombustion plant use of petroleum. For 1980–2000, electric utility data also includesmall amounts of kerosene and jet fuel.
c Fuel oil nos. 5 and 6. For 1949–1979, data are for steam plant use ofpetroleum. For 1980–2000, electric utility data also include a small amount of fueloil no. 4.
d Jet fuel, kerosene, other petroleum liquids, waste oil, and, beginning in 2011,propane.
e Petroleum coke is converted from short tons to barrels by multiplying by 5.f Natural gas, plus a small amount of supplemental gaseous fuels.
g Blast furnace gas, and other manufactured and waste gases derived fromfossil fuels. Through 2010, also includes propane gas.
h Wood and wood-derived fuels.i Municipal solid waste from biogenic sources, landfill gas, sludge waste,
agricultural byproducts, and other biomass. Through 2000, also includesnon-renewable waste (municipal solid waste from non-biogenic sources, and
tire-derived fuels).j Batteries, chemicals, hydrogen, pitch, purchased steam, sulfur, miscellaneous
technologies, and, beginning in 2001, non-renewable waste (municipal solid wastefrom non-biogenic sources, and tire-derived fuels).
k Through 1988, data are for electric utilities only. Beginning in 1989, data arefor electric utilities and independent power producers.
R=Revised. NA=Not available. (s)=Less than 0.5 trillion Btu. Notes: • The electric power sector comprises electricity-only and
combined-heat-and-power (CHP) plants within the NAICS 22 category whoseprimary business is to sell electricity, or electricity and heat, to the public. • SeeNote 1, "Coverage of Electricity Statistics," at end of section. • Totals may notequal sum of components due to independent rounding. • Geographic coverage isthe 50 states and the District of Columbia.
Web Page: See http://www.eia.gov/totalenergy/data/monthly/#electricity (Exceland CSV files) for all available annual data beginning in 1949 and monthly databeginning in 1973.
Sources: See end of section.
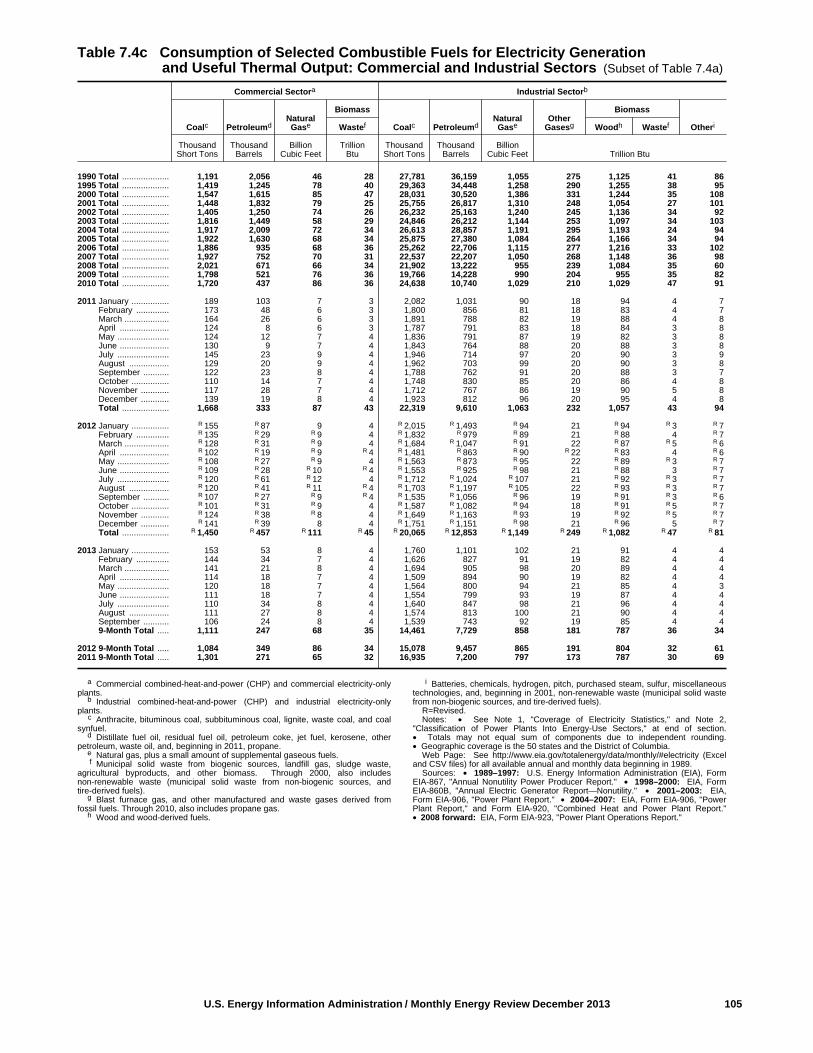
U.S. Energy Information Administration / Monthly Energy Review December 2013 105
Table 7.4c Consumption of Selected Combustible Fuels for Electricity Generation and Useful Thermal Output: Commercial and Industrial Sectors (Subset of Table 7.4a)
Commercial Sectora Industrial Sectorb
Coalc PetroleumdNaturalGase
Biomass
Coalc PetroleumdNaturalGase
OtherGasesg
Biomass
OtheriWastef Woodh Wastef
ThousandShort Tons
ThousandBarrels
BillionCubic Feet
TrillionBtu
ThousandShort Tons
ThousandBarrels
BillionCubic Feet Trillion Btu
1990 Total .................... 1,191 2,056 46 28 27,781 36,159 1,055 275 1,125 41 861995 Total .................... 1,419 1,245 78 40 29,363 34,448 1,258 290 1,255 38 952000 Total .................... 1,547 1,615 85 47 28,031 30,520 1,386 331 1,244 35 1082001 Total .................... 1,448 1,832 79 25 25,755 26,817 1,310 248 1,054 27 1012002 Total .................... 1,405 1,250 74 26 26,232 25,163 1,240 245 1,136 34 922003 Total .................... 1,816 1,449 58 29 24,846 26,212 1,144 253 1,097 34 1032004 Total .................... 1,917 2,009 72 34 26,613 28,857 1,191 295 1,193 24 942005 Total .................... 1,922 1,630 68 34 25,875 27,380 1,084 264 1,166 34 942006 Total .................... 1,886 935 68 36 25,262 22,706 1,115 277 1,216 33 1022007 Total .................... 1,927 752 70 31 22,537 22,207 1,050 268 1,148 36 982008 Total .................... 2,021 671 66 34 21,902 13,222 955 239 1,084 35 602009 Total .................... 1,798 521 76 36 19,766 14,228 990 204 955 35 822010 Total .................... 1,720 437 86 36 24,638 10,740 1,029 210 1,029 47 91
2011 January ................ 189 103 7 3 2,082 1,031 90 18 94 4 7 February .............. 173 48 6 3 1,800 856 81 18 83 4 7 March ................... 164 26 6 3 1,891 788 82 19 88 4 8 April ..................... 124 8 6 3 1,787 791 83 18 84 3 8 May ...................... 124 12 7 4 1,836 791 87 19 82 3 8 June ..................... 130 9 7 4 1,843 764 88 20 88 3 8 July ...................... 145 23 9 4 1,946 714 97 20 90 3 9 August ................. 129 20 9 4 1,962 703 99 20 90 3 8 September ........... 122 23 8 4 1,788 762 91 20 88 3 7 October ................ 110 14 7 4 1,748 830 85 20 86 4 8 November ............ 117 28 7 4 1,712 767 86 19 90 5 8 December ............ 139 19 8 4 1,923 812 96 20 95 4 8 Total .................... 1,668 333 87 43 22,319 9,610 1,063 232 1,057 43 94
2012 January ................ R 155 R 87 9 4 R 2,015 R 1,493 R 94 21 R 94 R 3 R 7 February .............. R 135 R 29 R 9 4 R 1,832 R 979 R 89 21 R 88 4 R 7 March ................... R 128 R 31 R 9 4 R 1,684 R 1,047 R 91 22 R 87 R 5 R 6 April ..................... R 102 R 19 R 9 R 4 R 1,481 R 863 R 90 R 22 R 83 4 R 6 May ...................... R 108 R 27 R 9 4 R 1,563 R 873 R 95 22 R 89 R 3 R 7 June ..................... R 109 R 28 R 10 R 4 R 1,553 R 925 R 98 21 R 88 3 R 7 July ...................... R 120 R 61 R 12 4 R 1,712 R 1,024 R 107 21 R 92 R 3 R 7 August ................. R 120 R 41 R 11 R 4 R 1,703 R 1,197 R 105 22 R 93 R 3 R 7 September ........... R 107 R 27 R 9 R 4 R 1,535 R 1,056 R 96 19 R 91 R 3 R 6 October ................ R 101 R 31 R 9 4 R 1,587 R 1,082 R 94 18 R 91 R 5 R 7 November ............ R 124 R 38 R 8 4 R 1,649 R 1,163 R 93 19 R 92 R 5 R 7 December ............ R 141 R 39 8 4 R 1,751 R 1,151 R 98 21 R 96 5 R 7 Total .................... R 1,450 R 457 R 111 R 45 R 20,065 R 12,853 R 1,149 R 249 R 1,082 R 47 R 81
2013 January ................ 153 53 8 4 1,760 1,101 102 21 91 4 4 February .............. 144 34 7 4 1,626 827 91 19 82 4 4 March ................... 141 21 8 4 1,694 905 98 20 89 4 4 April ..................... 114 18 7 4 1,509 894 90 19 82 4 4 May ...................... 120 18 7 4 1,564 800 94 21 85 4 3 June ..................... 111 18 7 4 1,554 799 93 19 87 4 4 July ...................... 110 34 8 4 1,640 847 98 21 96 4 4 August ................. 111 27 8 4 1,574 813 100 21 90 4 4 September ........... 106 24 8 4 1,539 743 92 19 85 4 4 9-Month Total ..... 1,111 247 68 35 14,461 7,729 858 181 787 36 34
2012 9-Month Total ..... 1,084 349 86 34 15,078 9,457 865 191 804 32 612011 9-Month Total ..... 1,301 271 65 32 16,935 7,200 797 173 787 30 69
a Commercial combined-heat-and-power (CHP) and commercial electricity-onlyplants.
b Industrial combined-heat-and-power (CHP) and industrial electricity-onlyplants.
c Anthracite, bituminous coal, subbituminous coal, lignite, waste coal, and coalsynfuel.
d Distillate fuel oil, residual fuel oil, petroleum coke, jet fuel, kerosene, otherpetroleum, waste oil, and, beginning in 2011, propane.
e Natural gas, plus a small amount of supplemental gaseous fuels.f Municipal solid waste from biogenic sources, landfill gas, sludge waste,
agricultural byproducts, and other biomass. Through 2000, also includesnon-renewable waste (municipal solid waste from non-biogenic sources, andtire-derived fuels).
g Blast furnace gas, and other manufactured and waste gases derived fromfossil fuels. Through 2010, also includes propane gas.
h Wood and wood-derived fuels.
i Batteries, chemicals, hydrogen, pitch, purchased steam, sulfur, miscellaneoustechnologies, and, beginning in 2001, non-renewable waste (municipal solid wastefrom non-biogenic sources, and tire-derived fuels).
R=Revised. Notes: • See Note 1, "Coverage of Electricity Statistics," and Note 2,
"Classification of Power Plants Into Energy-Use Sectors," at end of section.• Totals may not equal sum of components due to independent rounding.• Geographic coverage is the 50 states and the District of Columbia.
Web Page: See http://www.eia.gov/totalenergy/data/monthly/#electricity (Exceland CSV files) for all available annual and monthly data beginning in 1989.
Sources: • 1989–1997: U.S. Energy Information Administration (EIA), FormEIA-867, "Annual Nonutility Power Producer Report." • 1998–2000: EIA, FormEIA-860B, "Annual Electric Generator Report—Nonutility." • 2001–2003: EIA,Form EIA-906, "Power Plant Report." • 2004–2007: EIA, Form EIA-906, "PowerPlant Report," and Form EIA-920, "Combined Heat and Power Plant Report."• 2008 forward: EIA, Form EIA-923, "Power Plant Operations Report."
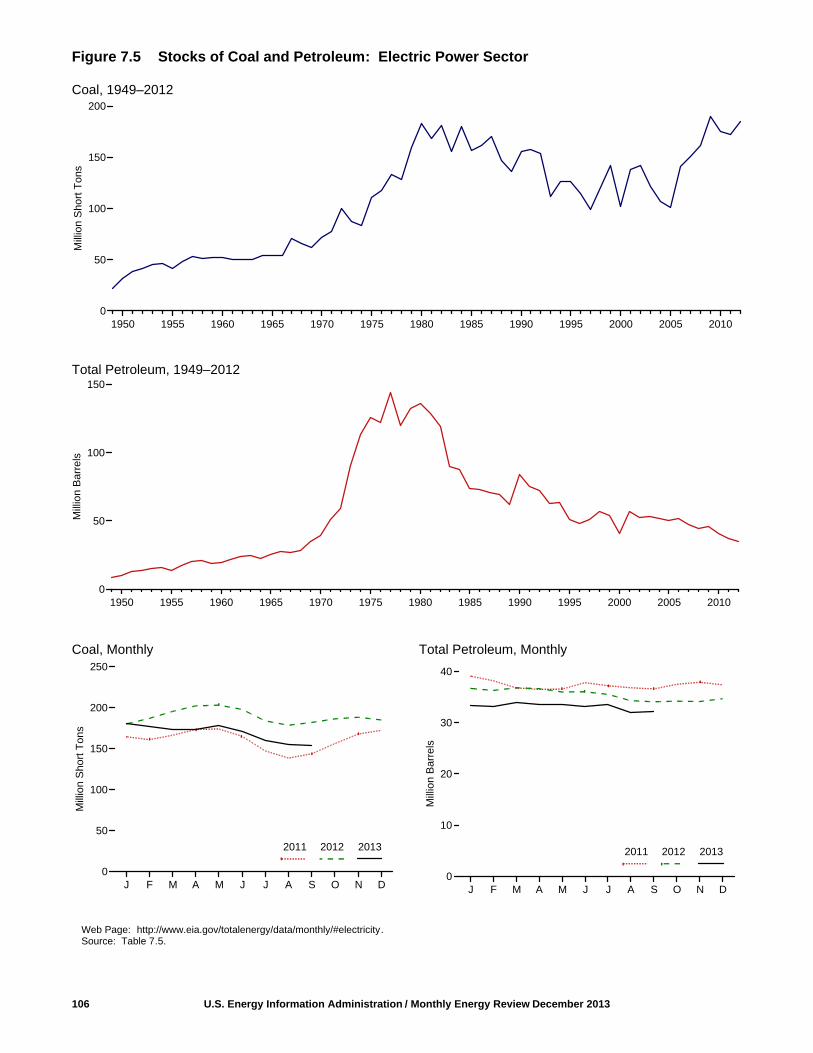
Figure 7.5 Stocks of Coal and Petroleum: Electric Power Sector
Coal, 1949–2012
Total Petroleum, 1949–2012
Coal, Monthly Total Petroleum, Monthly
106 U.S. Energy Information Administration / Monthly Energy Review December 2013
1950 1955 1960 1965 1970 1975 1980 1985 1990 1995 2000 2005 20100
50
100
150
Mill
ion
Ba
rrel
s
J F M A M J J A S O N D0
50
100
150
200
250
Mill
ion
Sho
rt T
ons
2011 2012 2013
1950 1955 1960 1965 1970 1975 1980 1985 1990 1995 2000 2005 20100
50
100
150
200
Mill
ion
Sho
rt T
ons
J F M A M J J A S O N D0
10
20
30
40
Mill
ion
Ba
rrel
s
2011 2012 2013
Web Page: http://www.eia.gov/totalenergy/data/monthly/#electricity.Source: Table 7.5.
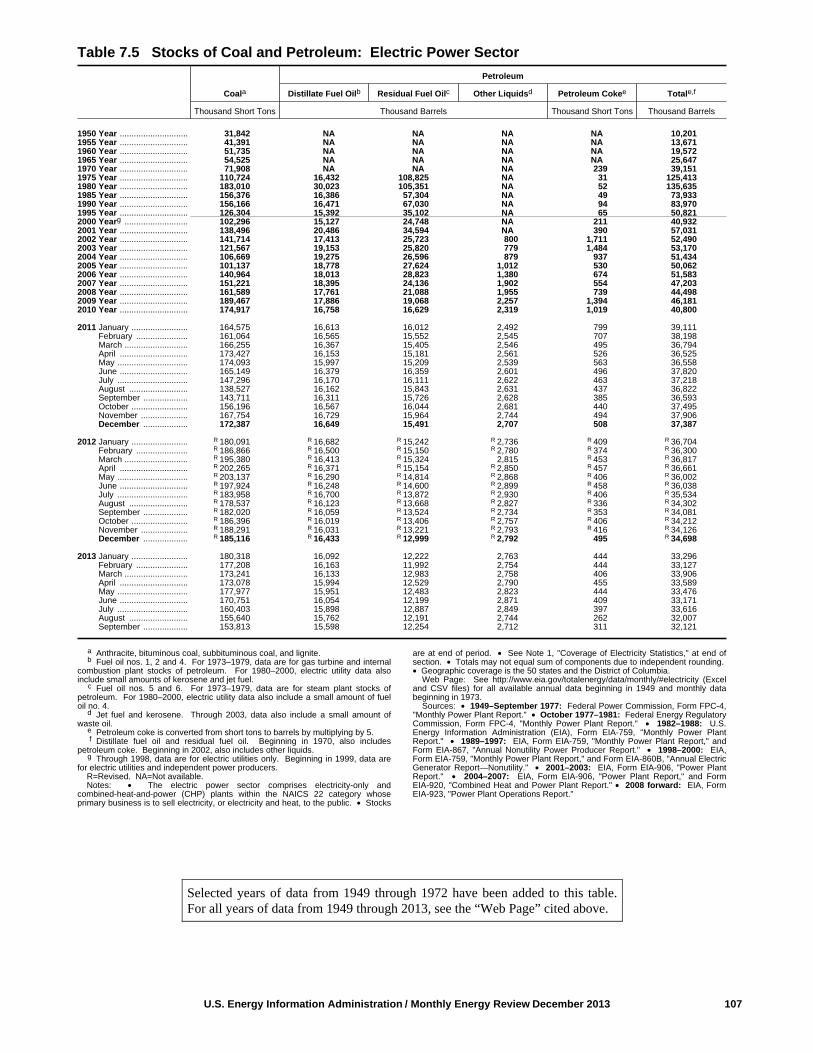
U.S. Energy Information Administration / Monthly Energy Review December 2013 107
Table 7.5 Stocks of Coal and Petroleum: Electric Power Sector
Coala
Petroleum
Distillate Fuel Oilb Residual Fuel Oilc Other Liquidsd Petroleum Cokee Totale,f
Thousand Short Tons Thousand Barrels Thousand Short Tons Thousand Barrels
1950 Year ............................. 31,842 NA NA NA NA 10,2011955 Year ............................. 41,391 NA NA NA NA 13,6711960 Year ............................. 51,735 NA NA NA NA 19,5721965 Year ............................. 54,525 NA NA NA NA 25,6471970 Year ............................. 71,908 NA NA NA 239 39,1511975 Year ............................. 110,724 16,432 108,825 NA 31 125,4131980 Year ............................. 183,010 30,023 105,351 NA 52 135,6351985 Year ............................. 156,376 16,386 57,304 NA 49 73,9331990 Year ............................. 156,166 16,471 67,030 NA 94 83,9701995 Year ............................. 126,304 15,392 35,102 NA 65 50,8212000 Yearg ........................... 102,296 15,127 24,748 NA 211 40,9322001 Year ............................. 138,496 20,486 34,594 NA 390 57,0312002 Year ............................. 141,714 17,413 25,723 800 1,711 52,4902003 Year ............................. 121,567 19,153 25,820 779 1,484 53,1702004 Year ............................. 106,669 19,275 26,596 879 937 51,4342005 Year ............................. 101,137 18,778 27,624 1,012 530 50,0622006 Year ............................. 140,964 18,013 28,823 1,380 674 51,5832007 Year ............................. 151,221 18,395 24,136 1,902 554 47,2032008 Year ............................. 161,589 17,761 21,088 1,955 739 44,4982009 Year ............................. 189,467 17,886 19,068 2,257 1,394 46,1812010 Year ............................. 174,917 16,758 16,629 2,319 1,019 40,800
2011 January ........................ 164,575 16,613 16,012 2,492 799 39,111 February ...................... 161,064 16,565 15,552 2,545 707 38,198 March ........................... 166,255 16,367 15,405 2,546 495 36,794 April ............................. 173,427 16,153 15,181 2,561 526 36,525 May .............................. 174,093 15,997 15,209 2,539 563 36,558 June ............................. 165,149 16,379 16,359 2,601 496 37,820 July .............................. 147,296 16,170 16,111 2,622 463 37,218 August ......................... 138,527 16,162 15,843 2,631 437 36,822 September ................... 143,711 16,311 15,726 2,628 385 36,593 October ........................ 156,196 16,567 16,044 2,681 440 37,495 November .................... 167,754 16,729 15,964 2,744 494 37,906 December ................... 172,387 16,649 15,491 2,707 508 37,387
2012 January ........................ R 180,091 R 16,682 R 15,242 R 2,736 R 409 R 36,704 February ...................... R 186,866 R 16,500 R 15,150 R 2,780 R 374 R 36,300 March ........................... R 195,380 R 16,413 R 15,324 2,815 R 453 R 36,817 April ............................. R 202,265 R 16,371 R 15,154 R 2,850 R 457 R 36,661 May .............................. R 203,137 R 16,290 R 14,814 R 2,868 R 406 R 36,002 June ............................. R 197,924 R 16,248 R 14,600 R 2,899 R 458 R 36,038 July .............................. R 183,958 R 16,700 R 13,872 R 2,930 R 406 R 35,534 August ......................... R 178,537 R 16,123 R 13,668 R 2,827 R 336 R 34,302 September ................... R 182,020 R 16,059 R 13,524 R 2,734 R 353 R 34,081 October ........................ R 186,396 R 16,019 R 13,406 R 2,757 R 406 R 34,212 November .................... R 188,291 R 16,031 R 13,221 R 2,793 R 416 R 34,126 December ................... R 185,116 R 16,433 R 12,999 R 2,792 495 R 34,698
2013 January ........................ 180,318 16,092 12,222 2,763 444 33,296 February ...................... 177,208 16,163 11,992 2,754 444 33,127 March ........................... 173,241 16,133 12,983 2,758 406 33,906 April ............................. 173,078 15,994 12,529 2,790 455 33,589 May .............................. 177,977 15,951 12,483 2,823 444 33,476 June ............................. 170,751 16,054 12,199 2,871 409 33,171 July .............................. 160,403 15,898 12,887 2,849 397 33,616 August ......................... 155,640 15,762 12,191 2,744 262 32,007 September ................... 153,813 15,598 12,254 2,712 311 32,121
a Anthracite, bituminous coal, subbituminous coal, and lignite.b Fuel oil nos. 1, 2 and 4. For 1973–1979, data are for gas turbine and internal
combustion plant stocks of petroleum. For 1980–2000, electric utility data alsoinclude small amounts of kerosene and jet fuel.
c Fuel oil nos. 5 and 6. For 1973–1979, data are for steam plant stocks ofpetroleum. For 1980–2000, electric utility data also include a small amount of fueloil no. 4.
d Jet fuel and kerosene. Through 2003, data also include a small amount ofwaste oil.
e Petroleum coke is converted from short tons to barrels by multiplying by 5.f Distillate fuel oil and residual fuel oil. Beginning in 1970, also includes
petroleum coke. Beginning in 2002, also includes other liquids.g Through 1998, data are for electric utilities only. Beginning in 1999, data are
for electric utilities and independent power producers.R=Revised. NA=Not available. Notes: • The electric power sector comprises electricity-only and
combined-heat-and-power (CHP) plants within the NAICS 22 category whoseprimary business is to sell electricity, or electricity and heat, to the public. • Stocks
are at end of period. • See Note 1, "Coverage of Electricity Statistics," at end ofsection. • Totals may not equal sum of components due to independent rounding. • Geographic coverage is the 50 states and the District of Columbia.
Web Page: See http://www.eia.gov/totalenergy/data/monthly/#electricity (Exceland CSV files) for all available annual data beginning in 1949 and monthly databeginning in 1973.
Sources: • 1949–September 1977: Federal Power Commission, Form FPC-4,"Monthly Power Plant Report." • October 1977–1981: Federal Energy RegulatoryCommission, Form FPC-4, "Monthly Power Plant Report." • 1982–1988: U.S.Energy Information Administration (EIA), Form EIA-759, "Monthly Power PlantReport." • 1989–1997: EIA, Form EIA-759, "Monthly Power Plant Report," andForm EIA-867, "Annual Nonutility Power Producer Report." • 1998–2000: EIA,Form EIA-759, "Monthly Power Plant Report," and Form EIA-860B, "Annual ElectricGenerator Report—Nonutility." • 2001–2003: EIA, Form EIA-906, "Power PlantReport." • 2004–2007: EIA, Form EIA-906, "Power Plant Report," and FormEIA-920, "Combined Heat and Power Plant Report." • 2008 forward: EIA, FormEIA-923, "Power Plant Operations Report."
Selected years of data from 1949 through 1972 have been added to this table.For all years of data from 1949 through 2013, see the “Web Page” cited above.

Figure 7.6 Electricity End Use(Billion Kilowatthours)
Electricity End Use Overview, 1989–2012 Retail Salesa by Sector, September 2013
Retail Salesa by Sector, 1949–2012
Retail Salesa by Sector, Monthly Retail Salesa Total, January–September
108 U.S. Energy Information Administration / Monthly Energy Review December 2013
1990 1995 2000 2005 20100
1,000
2,000
3,000
4,000
5,000
121.2 118.8
80.4
0.6
Residential Industrial0
25
50
75
100
125
150
Direct Useb
Total
Retail Salesa
TransportationdCommercialc
Transportationd
Commercialc
Commercialc
Residential
1950 1955 1960 1965 1970 1975 1980 1985 1990 1995 2000 2005 20100
500
1,000
1,500
Industrial
a Electricity retail sales to ultimate customers reported by utilities andother energy service providers.
b See “Direct Use” in Glossary.c Commercial sector, including public street and highway lighting, inte r-
departmental sales, and other sales to public authorites.d Transportation sector, including sales to railroads and railways.Web Page: http://www.eia.gov/totalenergy/data/monthly/#electricity.Source: Table 7.6.
Residential
J F MA M J J A S O N D J F MA M J J A S O N D J F MA M J J A S O N D0
25
50
75
100
125
150
175
2012
Industrial
2013
Transportationd
2011
2,885 2,828 2,805
2011 2012 20130
400
800
1,200
1,600
2,000
2,400
2,800
3,200
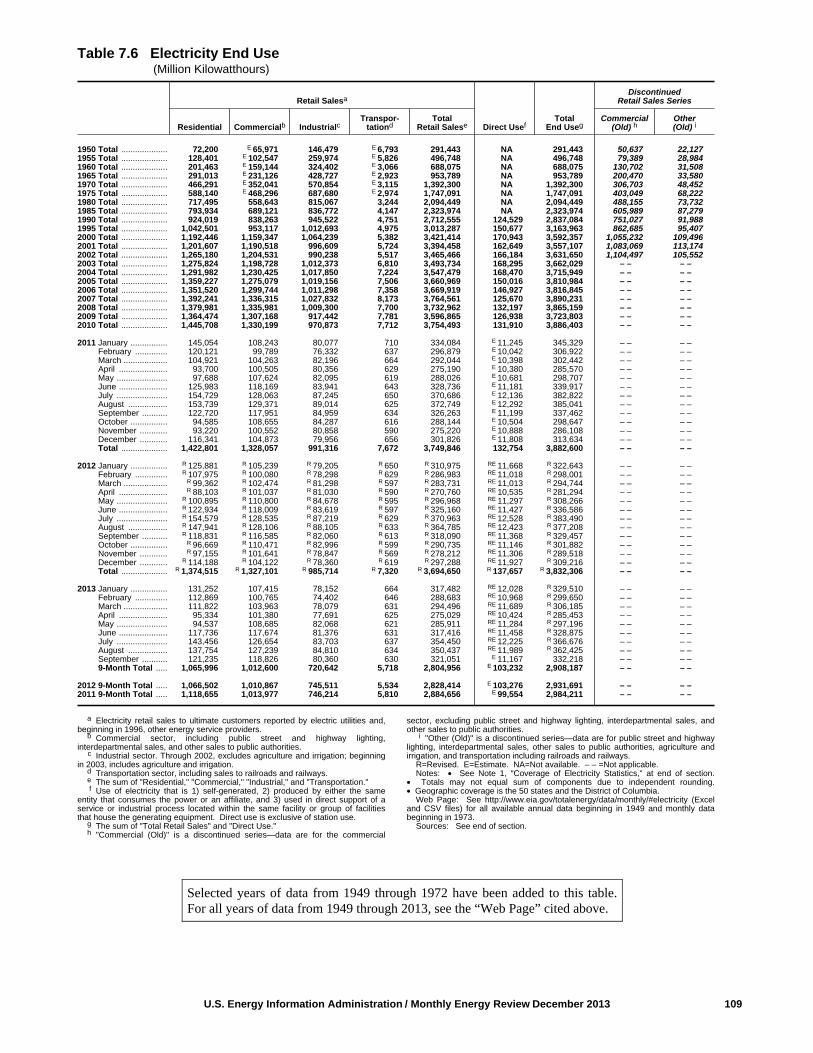
U.S. Energy Information Administration / Monthly Energy Review December 2013 109
Selected years of data from 1949 through 1972 have been added to this table.For all years of data from 1949 through 2013, see the “Web Page” cited above.
Table 7.6 Electricity End Use (Million Kilowatthours)
Retail Salesa
Direct UsefTotal
End Useg
DiscontinuedRetail Sales Series
Residential Commercialb IndustrialcTranspor-
tationdTotal
Retail SaleseCommercial
(Old) hOther(Old) i
1950 Total .................... 72,200 E 65,971 146,479 E 6,793 291,443 NA 291,443 50,637 22,1271955 Total .................... 128,401 E 102,547 259,974 E 5,826 496,748 NA 496,748 79,389 28,9841960 Total .................... 201,463 E 159,144 324,402 E 3,066 688,075 NA 688,075 130,702 31,5081965 Total .................... 291,013 E 231,126 428,727 E 2,923 953,789 NA 953,789 200,470 33,5801970 Total .................... 466,291 E 352,041 570,854 E 3,115 1,392,300 NA 1,392,300 306,703 48,4521975 Total .................... 588,140 E 468,296 687,680 E 2,974 1,747,091 NA 1,747,091 403,049 68,2221980 Total .................... 717,495 558,643 815,067 3,244 2,094,449 NA 2,094,449 488,155 73,7321985 Total .................... 793,934 689,121 836,772 4,147 2,323,974 NA 2,323,974 605,989 87,2791990 Total .................... 924,019 838,263 945,522 4,751 2,712,555 124,529 2,837,084 751,027 91,9881995 Total .................... 1,042,501 953,117 1,012,693 4,975 3,013,287 150,677 3,163,963 862,685 95,4072000 Total .................... 1,192,446 1,159,347 1,064,239 5,382 3,421,414 170,943 3,592,357 1,055,232 109,4962001 Total .................... 1,201,607 1,190,518 996,609 5,724 3,394,458 162,649 3,557,107 1,083,069 113,1742002 Total .................... 1,265,180 1,204,531 990,238 5,517 3,465,466 166,184 3,631,650 1,104,497 105,5522003 Total .................... 1,275,824 1,198,728 1,012,373 6,810 3,493,734 168,295 3,662,029 – – – –2004 Total .................... 1,291,982 1,230,425 1,017,850 7,224 3,547,479 168,470 3,715,949 – – – –2005 Total .................... 1,359,227 1,275,079 1,019,156 7,506 3,660,969 150,016 3,810,984 – – – –2006 Total .................... 1,351,520 1,299,744 1,011,298 7,358 3,669,919 146,927 3,816,845 – – – –2007 Total .................... 1,392,241 1,336,315 1,027,832 8,173 3,764,561 125,670 3,890,231 – – – –2008 Total .................... 1,379,981 1,335,981 1,009,300 7,700 3,732,962 132,197 3,865,159 – – – –2009 Total .................... 1,364,474 1,307,168 917,442 7,781 3,596,865 126,938 3,723,803 – – – –2010 Total .................... 1,445,708 1,330,199 970,873 7,712 3,754,493 131,910 3,886,403 – – – –
2011 January ................ 145,054 108,243 80,077 710 334,084 E 11,245 345,329 – – – – February .............. 120,121 99,789 76,332 637 296,879 E 10,042 306,922 – – – – March ................... 104,921 104,263 82,196 664 292,044 E 10,398 302,442 – – – – April ..................... 93,700 100,505 80,356 629 275,190 E 10,380 285,570 – – – – May ...................... 97,688 107,624 82,095 619 288,026 E 10,681 298,707 – – – – June ..................... 125,983 118,169 83,941 643 328,736 E 11,181 339,917 – – – – July ...................... 154,729 128,063 87,245 650 370,686 E 12,136 382,822 – – – – August ................. 153,739 129,371 89,014 625 372,749 E 12,292 385,041 – – – – September ........... 122,720 117,951 84,959 634 326,263 E 11,199 337,462 – – – – October ................ 94,585 108,655 84,287 616 288,144 E 10,504 298,647 – – – – November ............ 93,220 100,552 80,858 590 275,220 E 10,888 286,108 – – – – December ............ 116,341 104,873 79,956 656 301,826 E 11,808 313,634 – – – – Total .................... 1,422,801 1,328,057 991,316 7,672 3,749,846 132,754 3,882,600 – – – –
2012 January ................ R 125,881 R 105,239 R 79,205 R 650 R 310,975 RE 11,668 R 322,643 – – – – February .............. R 107,975 R 100,080 R 78,298 R 629 R 286,983 RE 11,018 R 298,001 – – – – March ................... R 99,362 R 102,474 R 81,298 R 597 R 283,731 RE 11,013 R 294,744 – – – – April ..................... R 88,103 R 101,037 R 81,030 R 590 R 270,760 RE 10,535 R 281,294 – – – – May ...................... R 100,895 R 110,800 R 84,678 R 595 R 296,968 RE 11,297 R 308,266 – – – – June ..................... R 122,934 R 118,009 R 83,619 R 597 R 325,160 RE 11,427 R 336,586 – – – – July ...................... R 154,579 R 128,535 R 87,219 R 629 R 370,963 RE 12,528 R 383,490 – – – – August ................. R 147,941 R 128,106 R 88,105 R 633 R 364,785 RE 12,423 R 377,208 – – – – September ........... R 118,831 R 116,585 R 82,060 R 613 R 318,090 RE 11,368 R 329,457 – – – – October ................ R 96,669 R 110,471 R 82,996 R 599 R 290,735 RE 11,146 R 301,882 – – – – November ............ R 97,155 R 101,641 R 78,847 R 569 R 278,212 RE 11,306 R 289,518 – – – – December ............ R 114,188 R 104,122 R 78,360 R 619 R 297,288 RE 11,927 R 309,216 – – – – Total .................... R 1,374,515 R 1,327,101 R 985,714 R 7,320 R 3,694,650 R 137,657 R 3,832,306 – – – –
2013 January ................ 131,252 107,415 78,152 664 317,482 RE 12,028 R 329,510 – – – – February .............. 112,869 100,765 74,402 646 288,683 RE 10,968 R 299,650 – – – – March ................... 111,822 103,963 78,079 631 294,496 RE 11,689 R 306,185 – – – – April ..................... 95,334 101,380 77,691 625 275,029 RE 10,424 R 285,453 – – – – May ...................... 94,537 108,685 82,068 621 285,911 RE 11,284 R 297,196 – – – – June ..................... 117,736 117,674 81,376 631 317,416 RE 11,458 R 328,875 – – – – July ...................... 143,456 126,654 83,703 637 354,450 RE 12,225 R 366,676 – – – – August ................. 137,754 127,239 84,810 634 350,437 RE 11,989 R 362,425 – – – – September ........... 121,235 118,826 80,360 630 321,051 E 11,167 332,218 – – – – 9-Month Total ..... 1,065,996 1,012,600 720,642 5,718 2,804,956 E 103,232 2,908,187 – – – –
2012 9-Month Total ..... 1,066,502 1,010,867 745,511 5,534 2,828,414 E 103,276 2,931,691 – – – –2011 9-Month Total ..... 1,118,655 1,013,977 746,214 5,810 2,884,656 E 99,554 2,984,211 – – – –
a Electricity retail sales to ultimate customers reported by electric utilities and,beginning in 1996, other energy service providers.
b Commercial sector, including public street and highway lighting,interdepartmental sales, and other sales to public authorities.
c Industrial sector. Through 2002, excludes agriculture and irrigation; beginningin 2003, includes agriculture and irrigation.
d Transportation sector, including sales to railroads and railways.e The sum of "Residential," "Commercial," "Industrial," and "Transportation."f Use of electricity that is 1) self-generated, 2) produced by either the same
entity that consumes the power or an affiliate, and 3) used in direct support of aservice or industrial process located within the same facility or group of facilitiesthat house the generating equipment. Direct use is exclusive of station use.
g The sum of "Total Retail Sales" and "Direct Use."h "Commercial (Old)" is a discontinued series—data are for the commercial
sector, excluding public street and highway lighting, interdepartmental sales, andother sales to public authorities.
i "Other (Old)" is a discontinued series—data are for public street and highwaylighting, interdepartmental sales, other sales to public authorities, agriculture andirrigation, and transportation including railroads and railways.
R=Revised. E=Estimate. NA=Not available. – – =Not applicable. Notes: • See Note 1, "Coverage of Electricity Statistics," at end of section.
• Totals may not equal sum of components due to independent rounding.• Geographic coverage is the 50 states and the District of Columbia.
Web Page: See http://www.eia.gov/totalenergy/data/monthly/#electricity (Exceland CSV files) for all available annual data beginning in 1949 and monthly databeginning in 1973.
Sources: See end of section.

ElectricityNote 1. Coverage of Electricity Statistics. Through1984, data for electric utilities also include institutions(such as universities) and military facilities that generatedelectricity primarily for their own use; beginning in 1985,data for electric utilities exclude institutions and militaryfacilities. Data for independent power producers, commer-cial plants, and industrial plants include plants with agenerator nameplate capacity of one megawatt or greater;they exclude plants with a generator nameplate capacityless than one megawatt. Also excluded from the electricitystatistics in Section 7 are data for residential and commer-cial self-generation from solar energy, except for the smallamount sold to the grid and included in data for the electricpower sector.
Note 2. Classification of Power Plants Into Energy-Use Sectors. The U.S. Energy Information Administra-tion (EIA) classifies power plants (both electricity-onlyand combined-heat-and-power plants) into energy-usesectors based on the North American Industry Classifica-tion System (NAICS), which replaced the Standard Indus-trial Classification (SIC) system in 1997. Plants with aNAICS code of 22 are assigned to the Electric PowerSector. Those with NAICS codes beginning with 11(agriculture, forestry, fishing, and hunting); 21 (mining,including oil and gas extraction); 23 (construction); 31–33(manufacturing); 2212 (natural gas distribution); and22131 (water supply and irrigation systems) are assignedto the Industrial Sector. Those with all other codes areassigned to the Commercial Sector. Form EIA-860,“Annual Electric Generator Report,” asks respondents toindicate the primary purpose of the facility by assigning aNAICS code from the list athttp://www.eia.gov/survey/form/eia_860/instructions.doc.
Table 7.1 Sources
Net Generation, Electric Power Sector1949 forward: Table 7.2b.
Net Generation, Commercial and Industrial Sectors1949 forward: Table 7.2c.
Trade1949–September 1977: Unpublished Federal PowerCommission data.October 1977–1980: Unpublished Economic RegulatoryAdministration (ERA) data. 1981: U.S. Department of Energy (DOE), Office ofEnergy Emergency Operations, “Report on Electric EnergyExchanges with Canada and Mexico for Calendar Year1981,” April 1982 (revised June 1982).1982 and 1983: DOE, ERA, Electricity Exchanges AcrossInternational Borders.
1984–1986: DOE, ERA, Electricity Transactions AcrossInternational Borders. 1987 and 1988: DOE, ERA, Form ERA-781R, “AnnualReport of International Electrical Export/Import Data.” 1989: DOE, Fossil Energy, Form FE-781R, “AnnualReport of International Electrical Export/Import Data.”1990–2000: National Energy Board of Canada; and DOE,Office of Electricity Delivery and Energy Reliability, FormFE-781R, “Annual Report of International ElectricalExport/Import Data.”2001–May 2011: National Energy Board of Canada; DOE,Office of Electricity Delivery and Energy Reliability, FormOE-781R, “Monthly Electricity Imports and ExportsReport,” and predecessor form; and California IndependentSystem Operator.June 2011 forward: National Energy Board of Canada;California Independent System Operator; and EIA estimatesfor Texas transfers.
T&D Losses and Unaccounted for1949 forward: Calculated as the sum of total net generationand imports minus end use and exports.
End Use1949 forward: Table 7.6.
Table 7.2b Sources1949–September 1977: Federal Power Commission, FormFPC-4, “Monthly Power Plant Report.” October 1977–1981: Federal Energy Regulatory Commis-sion, Form FPC-4, “Monthly Power Plant Report.” 1982–1988: U.S. Energy Information Administration(EIA), Form EIA-759, “Monthly Power Plant Report.”1989–1997: EIA, Form EIA-759, “Monthly Power PlantReport,” and Form EIA-867, “Annual Nonutility PowerProducer Report.”1998–2000: EIA, Form EIA-759, “Monthly Power PlantReport,” and Form EIA-860B, “Annual Electric Genera-tor Report—Nonutility.” 2001–2003: EIA, Form EIA-906, “Power Plant Report.” 2004–2007: EIA, Form EIA-906, “Power Plant Report,”and Form EIA-920, “Combined Heat and Power PlantReport.”2008 forward: EIA, Form EIA-923, “Power Plant Opera-tions Report.”
Table 7.2c Sources
Industrial Sector, Hydroelectric Power, 1949–19881949–September 1977: Federal Power Commission(FPC), Form FPC-4, “Monthly Power Plant Report,” forplants with generating capacity exceeding 10 megawatts,and FPC, Form FPC-12C, “Industrial Electric GeneratingCapacity,” for all other plants.October 1977–1978: Federal Energy Regulatory Commis-sion (FERC), Form FPC-4, “Monthly Power Plant
110 U.S. Energy Information Administration / Monthly Energy Review December 2013
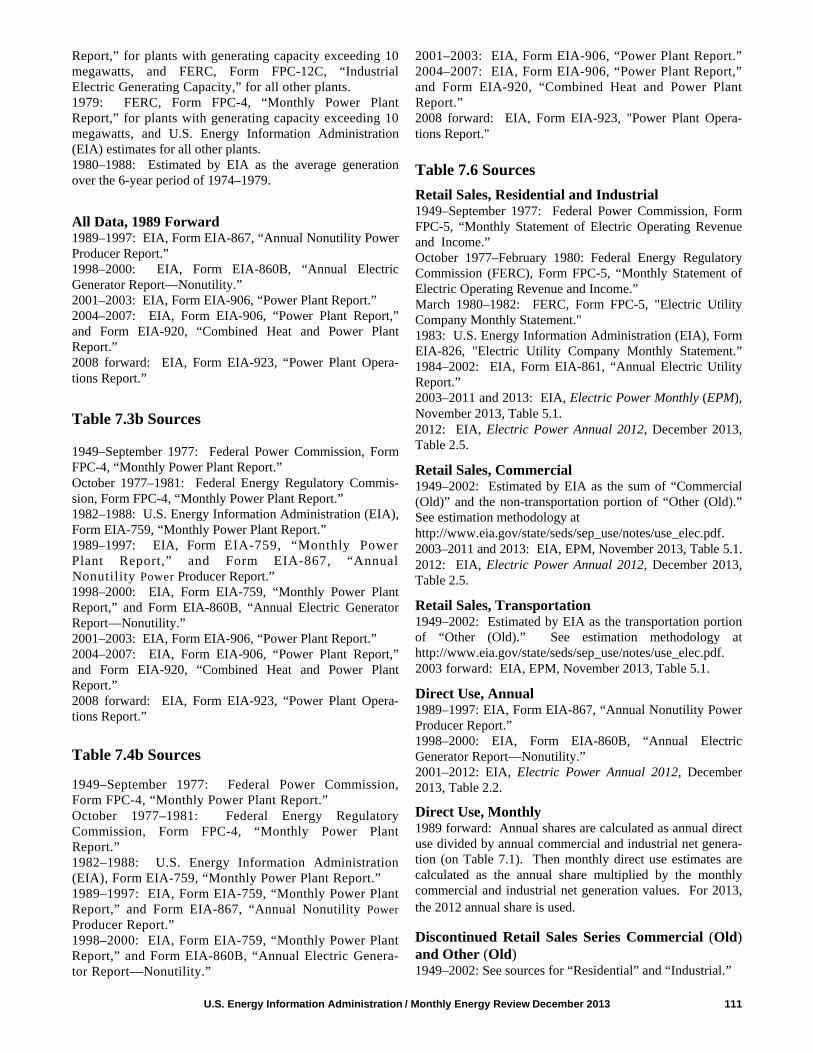
Report,” for plants with generating capacity exceeding 10megawatts, and FERC, Form FPC-12C, “IndustrialElectric Generating Capacity,” for all other plants.1979: FERC, Form FPC-4, “Monthly Power PlantReport,” for plants with generating capacity exceeding 10megawatts, and U.S. Energy Information Administration(EIA) estimates for all other plants.1980–1988: Estimated by EIA as the average generationover the 6-year period of 1974–1979.
All Data, 1989 Forward1989–1997: EIA, Form EIA-867, “Annual Nonutility PowerProducer Report.”1998–2000: EIA, Form EIA-860B, “Annual ElectricGenerator Report—Nonutility.”2001–2003: EIA, Form EIA-906, “Power Plant Report.”2004–2007: EIA, Form EIA-906, “Power Plant Report,”and Form EIA-920, “Combined Heat and Power PlantReport.”2008 forward: EIA, Form EIA-923, “Power Plant Opera-tions Report.”
Table 7.3b Sources
1949–September 1977: Federal Power Commission, FormFPC-4, “Monthly Power Plant Report.”October 1977–1981: Federal Energy Regulatory Commis-sion, Form FPC-4, “Monthly Power Plant Report.”1982–1988: U.S. Energy Information Administration (EIA),Form EIA-759, “Monthly Power Plant Report.”1989–1997: EIA, Form EIA-759, “Monthly PowerPlant Report,” and Form EIA-867, “AnnualNonutility Power Producer Report.”1998–2000: EIA, Form EIA-759, “Monthly Power PlantReport,” and Form EIA-860B, “Annual Electric GeneratorReport—Nonutility.”2001–2003: EIA, Form EIA-906, “Power Plant Report.”2004–2007: EIA, Form EIA-906, “Power Plant Report,”and Form EIA-920, “Combined Heat and Power PlantReport.”2008 forward: EIA, Form EIA-923, “Power Plant Opera-tions Report.”
Table 7.4b Sources
1949–September 1977: Federal Power Commission,Form FPC-4, “Monthly Power Plant Report.”October 1977–1981: Federal Energy RegulatoryCommission, Form FPC-4, “Monthly Power PlantReport.”1982–1988: U.S. Energy Information Administration(EIA), Form EIA-759, “Monthly Power Plant Report.”1989–1997: EIA, Form EIA-759, “Monthly Power PlantReport,” and Form EIA-867, “Annual Nonutility PowerProducer Report.”1998–2000: EIA, Form EIA-759, “Monthly Power PlantReport,” and Form EIA-860B, “Annual Electric Genera-tor Report—Nonutility.”
2001–2003: EIA, Form EIA-906, “Power Plant Report.”2004–2007: EIA, Form EIA-906, “Power Plant Report,”and Form EIA-920, “Combined Heat and Power PlantReport.”2008 forward: EIA, Form EIA-923, "Power Plant Opera-tions Report."
Table 7.6 SourcesRetail Sales, Residential and Industrial1949–September 1977: Federal Power Commission, FormFPC-5, “Monthly Statement of Electric Operating Revenueand Income.” October 1977–February 1980: Federal Energy RegulatoryCommission (FERC), Form FPC-5, “Monthly Statement ofElectric Operating Revenue and Income.” March 1980–1982: FERC, Form FPC-5, "Electric UtilityCompany Monthly Statement." 1983: U.S. Energy Information Administration (EIA), FormEIA-826, "Electric Utility Company Monthly Statement.”1984–2002: EIA, Form EIA-861, “Annual Electric UtilityReport.” 2003–2011 and 2013: EIA, Electric Power Monthly (EPM),November 2013, Table 5.1.2012: EIA, Electric Power Annual 2012, December 2013,Table 2.5.
Retail Sales, Commercial1949–2002: Estimated by EIA as the sum of “Commercial(Old)” and the non-transportation portion of “Other (Old).”See estimation methodology athttp://www.eia.gov/state/seds/sep_use/notes/use_elec.pdf.2003–2011 and 2013: EIA, EPM, November 2013, Table 5.1.2012: EIA, Electric Power Annual 2012, December 2013,Table 2.5.
Retail Sales, Transportation1949–2002: Estimated by EIA as the transportation portionof “Other (Old).” See estimation methodology athttp://www.eia.gov/state/seds/sep_use/notes/use_elec.pdf.2003 forward: EIA, EPM, November 2013, Table 5.1.
Direct Use, Annual1989–1997: EIA, Form EIA-867, “Annual Nonutility PowerProducer Report.”1998–2000: EIA, Form EIA-860B, “Annual ElectricGenerator Report—Nonutility.”2001–2012: EIA, Electric Power Annual 2012, December2013, Table 2.2.
Direct Use, Monthly1989 forward: Annual shares are calculated as annual directuse divided by annual commercial and industrial net genera-tion (on Table 7.1). Then monthly direct use estimates arecalculated as the annual share multiplied by the monthlycommercial and industrial net generation values. For 2013,the 2012 annual share is used.
Discontinued Retail Sales Series Commercial (Old)and Other (Old) 1949–2002: See sources for “Residential” and “Industrial.”
U.S. Energy Information Administration / Monthly Energy Review December 2013 111

THIS PAGE INTENTIONALLY LEFT BLANK

8. NuclearEnergy

Figure 8.1 Nuclear Energy Overview
Electricity Net Generation, 1957–2012
Nuclear Share of Electricity Net Generation, 1957–2012
Nuclear Electricity Net Generation Capacity Factor, Monthly
114 U.S. Energy Information Administration / Monthly Energy Review December 2013
Web Page: http://www.eia.gov/totalenergy/data/monthly/#nuclear.Sources: Tables 7.2a and 8.1.
1960 1965 1970 1975 1980 1985 1990 1995 2000 2005 20100
1
2
3
4
5
Tril
lion
Kilo
wat
thou
rs
Nuclear Electric Power
Total
1960 1965 1970 1975 1980 1985 1990 1995 2000 2005 20100
5
10
15
20
25
Per
cent
2011
66.84964.511 65.799
September September September0
20
40
60
80
Bill
ion
Kilo
wat
thou
rs
J F M A M J J A S O N D0
20
40
60
80
100
120
Per
cent
2011 2012 2013
2012 2013
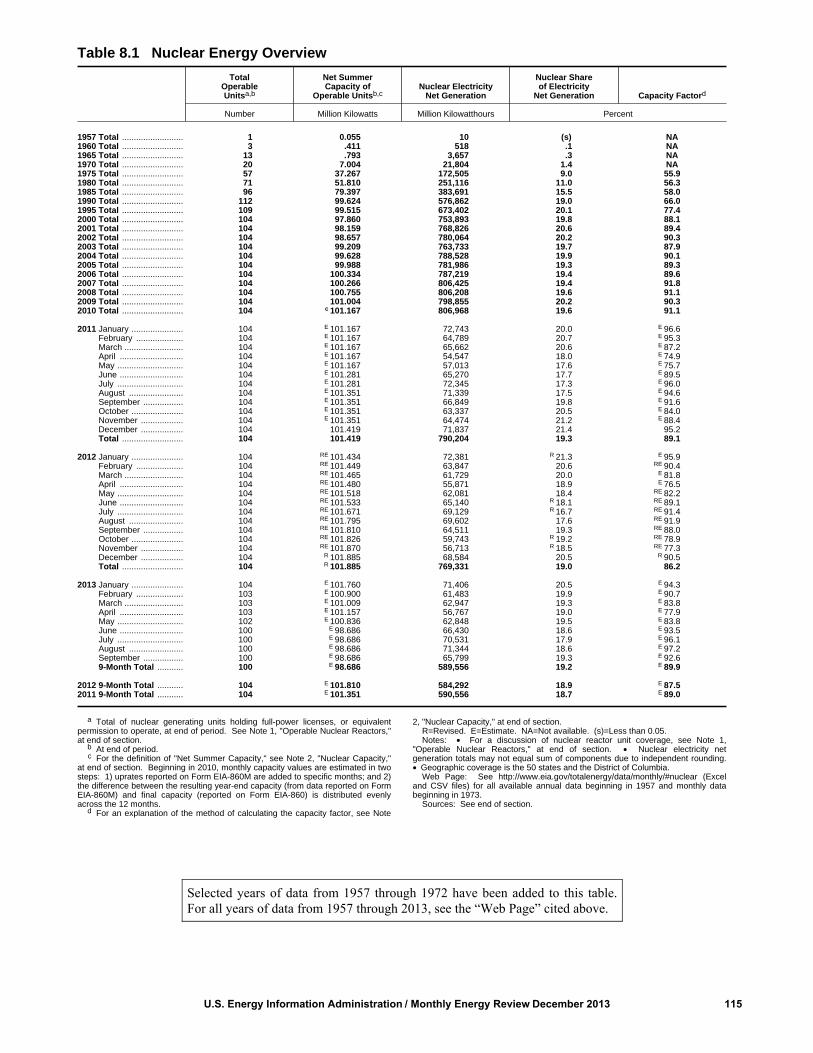
U.S. Energy Information Administration / Monthly Energy Review December 2013 115
Table 8.1 Nuclear Energy Overview
TotalOperableUnitsa,b
Net SummerCapacity of
Operable Unitsb,cNuclear Electricity
Net Generation
Nuclear Shareof Electricity
Net Generation Capacity Factord
Number Million Kilowatts Million Kilowatthours Percent
1957 Total .......................... 1 0.055 10 (s) NA1960 Total .......................... 3 .411 518 .1 NA1965 Total .......................... 13 .793 3,657 .3 NA1970 Total .......................... 20 7.004 21,804 1.4 NA1975 Total .......................... 57 37.267 172,505 9.0 55.91980 Total .......................... 71 51.810 251,116 11.0 56.31985 Total .......................... 96 79.397 383,691 15.5 58.01990 Total .......................... 112 99.624 576,862 19.0 66.01995 Total .......................... 109 99.515 673,402 20.1 77.42000 Total .......................... 104 97.860 753,893 19.8 88.12001 Total .......................... 104 98.159 768,826 20.6 89.42002 Total .......................... 104 98.657 780,064 20.2 90.32003 Total .......................... 104 99.209 763,733 19.7 87.92004 Total .......................... 104 99.628 788,528 19.9 90.12005 Total .......................... 104 99.988 781,986 19.3 89.32006 Total .......................... 104 100.334 787,219 19.4 89.62007 Total .......................... 104 100.266 806,425 19.4 91.82008 Total .......................... 104 100.755 806,208 19.6 91.12009 Total .......................... 104 101.004 798,855 20.2 90.32010 Total .......................... 104 c 101.167 806,968 19.6 91.1
2011 January ...................... 104 E 101.167 72,743 20.0 E 96.6 February .................... 104 E 101.167 64,789 20.7 E 95.3 March ......................... 104 E 101.167 65,662 20.6 E 87.2 April ........................... 104 E 101.167 54,547 18.0 E 74.9 May ............................ 104 E 101.167 57,013 17.6 E 75.7 June ........................... 104 E 101.281 65,270 17.7 E 89.5 July ............................ 104 E 101.281 72,345 17.3 E 96.0 August ....................... 104 E 101.351 71,339 17.5 E 94.6 September ................. 104 E 101.351 66,849 19.8 E 91.6 October ...................... 104 E 101.351 63,337 20.5 E 84.0 November .................. 104 E 101.351 64,474 21.2 E 88.4 December .................. 104 101.419 71,837 21.4 95.2 Total .......................... 104 101.419 790,204 19.3 89.1
2012 January ...................... 104 RE 101.434 72,381 R 21.3 E 95.9 February .................... 104 RE 101.449 63,847 20.6 RE 90.4 March ......................... 104 RE 101.465 61,729 20.0 E 81.8 April ........................... 104 RE 101.480 55,871 18.9 E 76.5 May ............................ 104 RE 101.518 62,081 18.4 RE 82.2 June ........................... 104 RE 101.533 65,140 R 18.1 RE 89.1 July ............................ 104 RE 101.671 69,129 R 16.7 RE 91.4 August ....................... 104 RE 101.795 69,602 17.6 RE 91.9 September ................. 104 RE 101.810 64,511 19.3 RE 88.0 October ...................... 104 RE 101.826 59,743 R 19.2 RE 78.9 November .................. 104 RE 101.870 56,713 R 18.5 RE 77.3 December .................. 104 R 101.885 68,584 20.5 R 90.5 Total .......................... 104 R 101.885 769,331 19.0 86.2
2013 January ...................... 104 E 101.760 71,406 20.5 E 94.3 February .................... 103 E 100.900 61,483 19.9 E 90.7 March ......................... 103 E 101.009 62,947 19.3 E 83.8 April ........................... 103 E 101.157 56,767 19.0 E 77.9 May ............................ 102 E 100.836 62,848 19.5 E 83.8 June ........................... 100 E 98.686 66,430 18.6 E 93.5 July ............................ 100 E 98.686 70,531 17.9 E 96.1 August ....................... 100 E 98.686 71,344 18.6 E 97.2 September ................. 100 E 98.686 65,799 19.3 E 92.6 9-Month Total ........... 100 E 98.686 589,556 19.2 E 89.9
2012 9-Month Total ........... 104 E 101.810 584,292 18.9 E 87.52011 9-Month Total ........... 104 E 101.351 590,556 18.7 E 89.0
a Total of nuclear generating units holding full-power licenses, or equivalentpermission to operate, at end of period. See Note 1, "Operable Nuclear Reactors,"at end of section.
b At end of period.c For the definition of "Net Summer Capacity," see Note 2, "Nuclear Capacity,"
at end of section. Beginning in 2010, monthly capacity values are estimated in twosteps: 1) uprates reported on Form EIA-860M are added to specific months; and 2)the difference between the resulting year-end capacity (from data reported on FormEIA-860M) and final capacity (reported on Form EIA-860) is distributed evenlyacross the 12 months.
d For an explanation of the method of calculating the capacity factor, see Note
2, "Nuclear Capacity," at end of section.R=Revised. E=Estimate. NA=Not available. (s)=Less than 0.05. Notes: • For a discussion of nuclear reactor unit coverage, see Note 1,
"Operable Nuclear Reactors," at end of section. • Nuclear electricity netgeneration totals may not equal sum of components due to independent rounding.• Geographic coverage is the 50 states and the District of Columbia.
Web Page: See http://www.eia.gov/totalenergy/data/monthly/#nuclear (Exceland CSV files) for all available annual data beginning in 1957 and monthly databeginning in 1973.
Sources: See end of section.
Selected years of data from 1957 through 1972 have been added to this table.For all years of data from 1957 through 2013, see the “Web Page” cited above.
Nuclear Energy
Note 1. Operable Nuclear Reactors. A reactor isgenerally defined as operable while it possessed a full-powerlicense from the Nuclear Regulatory Commission or itspredecessor the Atomic Energy Commission, or equivalentpermission to operate, at the end of the year or monthshown. The definition is liberal in that it does not excludeunits retaining full-power licenses during long, non-routineshutdowns that for a time rendered them unable to generateelectricity. Examples are:
(a) In 1985 the five then-active Tennessee Valley Authority(TVA) units (Browns Ferry 1, 2, and 3, and Sequoyah 1 and2) were shut down under a regulatory forced outage. Allfive units were idle for several years, restarting in 2007,1991, 1995, 1988, and 1988, respectively and were countedas operable during the shutdowns.
(b) Shippingport was shut down from 1974 through 1976for conversion to a light-water breeder reactor, but iscounted as operable from 1957 until its retirement in 1982.
(c) Calvert Cliffs 2 was shut down in 1989 and 1990 forreplacement of pressurizer heater sleeves but is counted asoperable during those years.
Exceptions to the definition are Shoreham and Three MileIsland 2. Shoreham was granted a full-power license in April1989, but was shut down two months later and neverrestarted. In 1991, the license was changed to PossessionOnly. Although not operable at the end of the year,Shoreham is counted as operable during 1989. A majoraccident closed Three Mile Island 2 in 1979, and althoughthe unit retained its full-power license for several years, it isconsidered permanently shut down since that year.
The following nuclear generating units have recently beenretired: Crystal River 3 in February 2013; Kewaunee in May2013; and San Onofre 2 and 3 in June 2013.
Note 2. Nuclear Capacity. Nuclear generating units mayhave more than one type of net capacity rating, including thefollowing:
(a) Net Summer Capacity—The steady hourly output thatgenerating equipment is expected to supply to system load,
exclusive of auxiliary power, as demonstrated by test at thetime of summer peak demand. Auxiliary power of a typicalnuclear power plant is about 5 percent of gross generation.
(b) Net Design Capacity or Net Design Electrical Rating(DER)—The nominal net electrical output of a unit,specified by the utility and used for plant design.
The monthly capacity factors are calculated as the monthlynuclear electricity net generation divided by the maximumpossible nuclear electricity net generation for that month. Themaximum possible nuclear electricity net generation is thenumber of hours in the month (assuming 24-hour days, withno adjustment for changes to or from Daylight Savings Time)multiplied by the net summer capacity of operable nucleargenerating units at the end of the month. That fraction is thenmultiplied by 100 to obtain a percentage. Annual capacityfactors are calculated as the annual nuclear electricity netgeneration divided by the annual maximum possible nuclearelectricity net generation (the sum of the monthly values formaximum possible nuclear electricity net generation).
Table 8.1 Sources
Total Operable Units and Net Summer Capacity ofOperable Units 1957–1982: Compiled from various sources, primarily U.S.Department of Energy, Office of Nuclear Reactor Programs,“U.S. Central Station Nuclear Electric Generating Units:Significant Milestones.”
1983 forward: U.S. Energy Information Administration(EIA), Form EIA-860, “Annual Electric GeneratorReport,” and predecessor forms; Form EIA-860M,“Monthly Update to the Annual Electric GeneratorReport”; and monthly updates as appropriate. For a listof operable units as of November 2011, seehttp://www.eia.gov/nuclear/reactors/stats_table1.html.
Nuclear Electricity Net Generation and Nuclear Share ofElectricity Net Generation1957 forward: Table 7.2a.
Capacity Factor1973 forward: Calculated by EIA using the methoddescribed above in Note 2.
116 U.S. Energy Information Administration / Monthly Energy Review December 2013
9. EnergyPrices
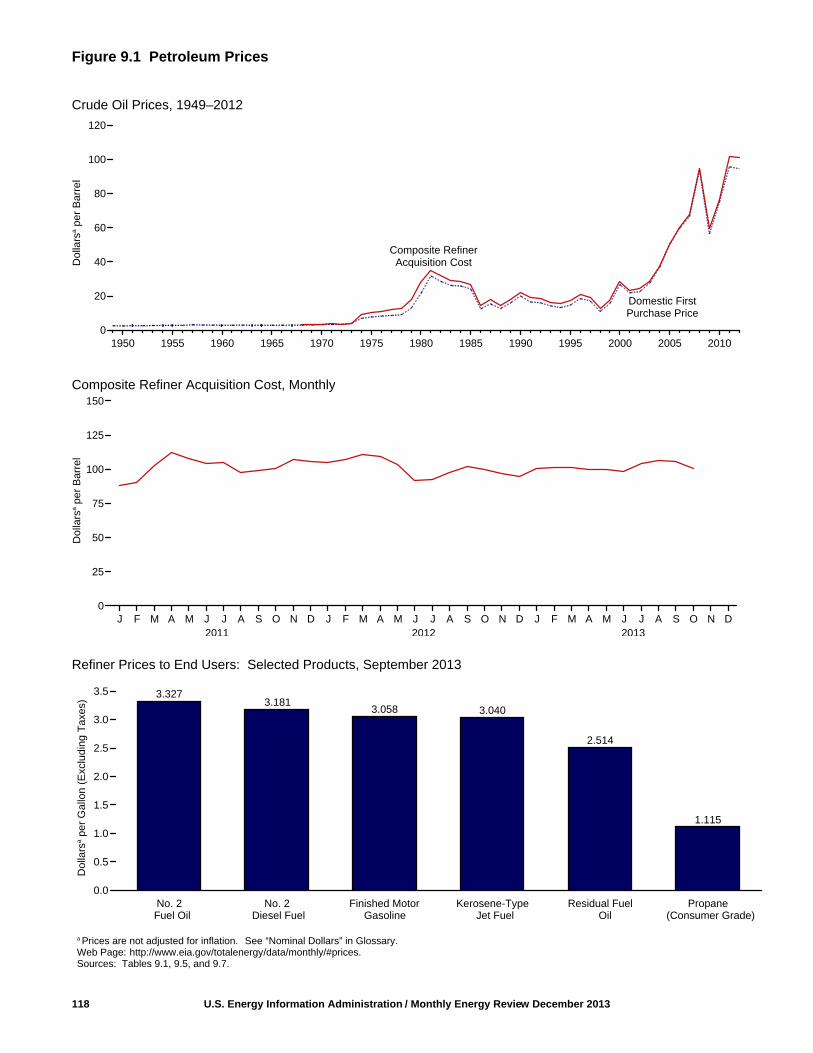
Figure 9.1 Petroleum Prices
Crude Oil Prices, 1949–2012
Composite Refiner Acquisition Cost, Monthly
Refiner Prices to End Users: Selected Products, September 2013
118 U.S. Energy Information Administration / Monthly Energy Review December 2013
a Prices are not adjusted for inflation. See “Nominal Dollars” in Glossary.Web Page: http://www.eia.gov/totalenergy/data/monthly/#prices.Sources: Tables 9.1, 9.5, and 9.7.
1950 1955 1960 1965 1970 1975 1980 1985 1990 1995 2000 2005 20100
20
40
60
80
100
120
Dol
lars
per
Bar
rel
Composite RefinerAcquisition Cost
Domestic FirstPurchase Price
Dol
lars
a pe
r B
arre
lD
olla
rsa
per
Bar
rel
J F M A M J J A S O N D J F M A M J J A S O N D J F M A M J J A S O N D0
25
50
75
100
125
150
2011 2012 2013
(Consumer Grade)
3.3273.181
3.058 3.040
2.514
1.115
No. 2 No. 2 Finished Motor Kerosene-Type Residual Fuel Propane0.0
0.5
1.0
1.5
2.0
2.5
3.0
3.5
Dol
lars
a pe
r G
allo
n (E
xclu
ding
Tax
es)
Diesel Fuel Gasoline Jet Fuel OilFuel Oil
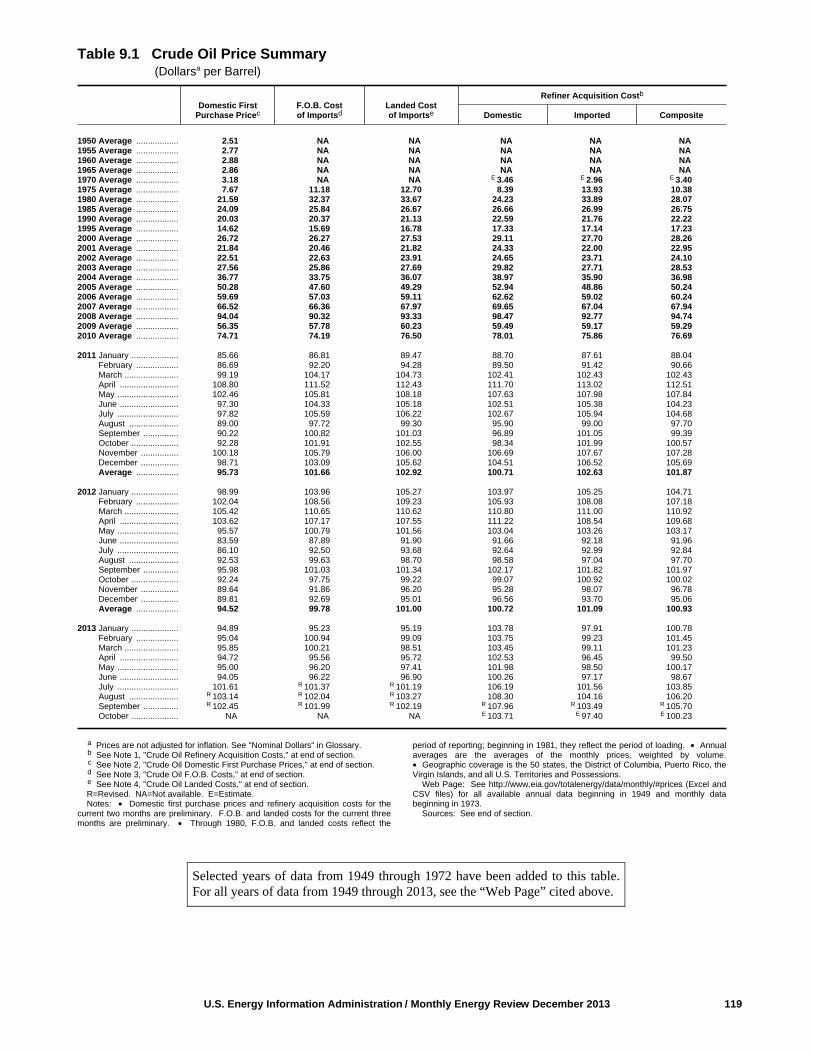
U.S. Energy Information Administration / Monthly Energy Review December 2013 119
Table 9.1 Crude Oil Price Summary (Dollarsa per Barrel)
Domestic FirstPurchase Pricec
F.O.B. Costof Importsd
Landed Costof Importse
Refiner Acquisition Costb
Domestic Imported Composite
1950 Average .................. 2.51 NA NA NA NA NA1955 Average .................. 2.77 NA NA NA NA NA1960 Average .................. 2.88 NA NA NA NA NA1965 Average .................. 2.86 NA NA NA NA NA1970 Average .................. 3.18 NA NA E 3.46 E 2.96 E 3.401975 Average .................. 7.67 11.18 12.70 8.39 13.93 10.381980 Average .................. 21.59 32.37 33.67 24.23 33.89 28.071985 Average .................. 24.09 25.84 26.67 26.66 26.99 26.751990 Average .................. 20.03 20.37 21.13 22.59 21.76 22.221995 Average .................. 14.62 15.69 16.78 17.33 17.14 17.232000 Average .................. 26.72 26.27 27.53 29.11 27.70 28.262001 Average .................. 21.84 20.46 21.82 24.33 22.00 22.952002 Average .................. 22.51 22.63 23.91 24.65 23.71 24.102003 Average .................. 27.56 25.86 27.69 29.82 27.71 28.532004 Average .................. 36.77 33.75 36.07 38.97 35.90 36.982005 Average .................. 50.28 47.60 49.29 52.94 48.86 50.242006 Average .................. 59.69 57.03 59.11 62.62 59.02 60.242007 Average .................. 66.52 66.36 67.97 69.65 67.04 67.942008 Average .................. 94.04 90.32 93.33 98.47 92.77 94.742009 Average .................. 56.35 57.78 60.23 59.49 59.17 59.292010 Average .................. 74.71 74.19 76.50 78.01 75.86 76.69
2011 January .................... 85.66 86.81 89.47 88.70 87.61 88.04 February .................. 86.69 92.20 94.28 89.50 91.42 90.66 March ....................... 99.19 104.17 104.73 102.41 102.43 102.43 April ......................... 108.80 111.52 112.43 111.70 113.02 112.51 May .......................... 102.46 105.81 108.18 107.63 107.98 107.84 June ......................... 97.30 104.33 105.18 102.51 105.38 104.23 July .......................... 97.82 105.59 106.22 102.67 105.94 104.68 August ..................... 89.00 97.72 99.30 95.90 99.00 97.70 September ............... 90.22 100.82 101.03 96.89 101.05 99.39 October .................... 92.28 101.91 102.55 98.34 101.99 100.57 November ................ 100.18 105.79 106.00 106.69 107.67 107.28 December ................ 98.71 103.09 105.62 104.51 106.52 105.69 Average .................. 95.73 101.66 102.92 100.71 102.63 101.87
2012 January .................... 98.99 103.96 105.27 103.97 105.25 104.71 February .................. 102.04 108.56 109.23 105.93 108.08 107.18 March ....................... 105.42 110.65 110.62 110.80 111.00 110.92 April ......................... 103.62 107.17 107.55 111.22 108.54 109.68 May .......................... 95.57 100.79 101.56 103.04 103.26 103.17 June ......................... 83.59 87.89 91.90 91.66 92.18 91.96 July .......................... 86.10 92.50 93.68 92.64 92.99 92.84 August ..................... 92.53 99.63 98.70 98.58 97.04 97.70 September ............... 95.98 101.03 101.34 102.17 101.82 101.97 October .................... 92.24 97.75 99.22 99.07 100.92 100.02 November ................ 89.64 91.86 96.20 95.28 98.07 96.78 December ................ 89.81 92.69 95.01 96.56 93.70 95.06 Average .................. 94.52 99.78 101.00 100.72 101.09 100.93
2013 January .................... 94.89 95.23 95.19 103.78 97.91 100.78 February .................. 95.04 100.94 99.09 103.75 99.23 101.45 March ....................... 95.85 100.21 98.51 103.45 99.11 101.23 April ......................... 94.72 95.56 95.72 102.53 96.45 99.50 May .......................... 95.00 96.20 97.41 101.98 98.50 100.17 June ......................... 94.05 96.22 96.90 100.26 97.17 98.67 July .......................... 101.61 R 101.37 R 101.19 106.19 101.56 103.85 August ..................... R 103.14 R 102.04 R 103.27 108.30 104.16 106.20 September ............... R 102.45 R 101.99 R 102.19 R 107.96 R 103.49 R 105.70 October .................... NA NA NA E 103.71 E 97.40 E 100.23
a Prices are not adjusted for inflation. See "Nominal Dollars" in Glossary.b See Note 1, "Crude Oil Refinery Acquisition Costs," at end of section.c See Note 2, "Crude Oil Domestic First Purchase Prices," at end of section.d See Note 3, "Crude Oil F.O.B. Costs," at end of section.e See Note 4, "Crude Oil Landed Costs," at end of section.R=Revised. NA=Not available. E=Estimate. Notes: • Domestic first purchase prices and refinery acquisition costs for the
current two months are preliminary. F.O.B. and landed costs for the current threemonths are preliminary. • Through 1980, F.O.B. and landed costs reflect the
period of reporting; beginning in 1981, they reflect the period of loading. • Annualaverages are the averages of the monthly prices, weighted by volume.• Geographic coverage is the 50 states, the District of Columbia, Puerto Rico, theVirgin Islands, and all U.S. Territories and Possessions.
Web Page: See http://www.eia.gov/totalenergy/data/monthly/#prices (Excel andCSV files) for all available annual data beginning in 1949 and monthly databeginning in 1973.
Sources: See end of section.
Selected years of data from 1949 through 1972 have been added to this table.For all years of data from 1949 through 2013, see the “Web Page” cited above.

120 U.S. Energy Information Administration / Monthly Energy Review December 2013
Table 9.2 F.O.B. Costs of Crude Oil Imports From Selected Countries (Dollarsa per Barrel)
Selected CountriesPersian
GulfNationsb
TotalOPECc
TotalNon-OPECcAngola Colombia Mexico Nigeria
SaudiArabia
UnitedKingdom Venezuela
1973 Averaged ................. W W – 7.81 3.25 – 5.39 3.68 5.43 4.801975 Average .................. 10.97 – 11.44 11.82 10.87 – 11.04 10.88 11.34 10.621980 Average .................. 33.45 W 31.06 35.93 28.17 34.36 24.81 28.92 32.21 32.851985 Average .................. 26.30 – 25.33 28.04 22.04 27.64 23.64 23.31 25.67 25.961990 Average .................. 20.23 20.75 19.26 22.46 20.36 23.43 19.55 18.54 20.40 20.321995 Average .................. 16.58 16.73 15.64 17.40 W 16.94 13.86 W 15.36 16.022000 Average .................. 27.90 29.04 25.39 28.70 24.62 27.21 24.45 24.72 25.56 26.772001 Average .................. 23.25 24.25 18.89 24.85 18.98 23.30 18.01 18.89 19.73 21.042002 Average .................. 24.09 24.64 21.60 25.38 23.92 24.50 20.13 23.38 22.18 22.932003 Average .................. 28.22 28.89 24.83 29.40 25.03 28.76 23.81 25.17 25.36 26.212004 Average .................. 37.26 37.73 31.55 38.71 34.08 37.30 31.78 33.08 33.95 33.582005 Average .................. 52.48 51.89 43.00 55.95 47.96 54.48 46.39 47.21 49.60 45.792006 Average .................. 62.23 59.77 52.91 65.69 56.09 66.03 55.80 56.02 59.18 55.352007 Average .................. 67.80 67.93 61.35 76.64 W 69.96 64.10 69.93 69.58 62.692008 Average .................. 95.66 91.17 84.61 102.06 93.03 96.33 88.06 91.44 93.15 87.152009 Average .................. 57.07 57.90 56.47 64.61 57.87 65.63 55.58 59.53 58.53 57.162010 Average .................. 78.18 72.56 72.46 80.83 76.44 W 70.30 75.65 75.23 73.24
2011 January .................... 95.97 83.36 84.45 99.86 W – 81.25 W 89.74 83.96 February .................. W 88.55 88.77 109.07 W – 85.11 97.25 96.01 88.99 March ....................... 113.63 101.29 102.55 117.98 W – 97.56 107.36 106.19 102.41 April ......................... 122.52 114.17 109.90 126.05 W – 106.56 114.82 115.15 107.71 May .......................... 113.33 106.15 105.13 117.66 W – 101.60 110.02 108.43 103.64 June ......................... 115.13 102.78 103.43 119.13 W – 100.59 106.39 108.22 100.37 July .......................... 114.80 100.30 104.84 119.68 W – 100.62 109.06 110.09 100.88 August ..................... W 95.01 98.21 115.61 W – 97.17 106.98 104.19 93.57 September ............... 112.49 97.45 100.28 115.43 109.99 – 95.72 108.41 105.82 97.06 October .................... 109.74 102.37 101.48 114.46 W – 96.93 105.62 105.20 98.64 November ................ 112.49 106.97 107.94 115.35 W – 105.44 106.51 108.16 104.17 December ................ 111.26 103.10 105.96 W W – 105.75 104.48 106.42 100.80 Average .................. 111.82 100.21 100.90 115.35 107.08 – 97.23 106.47 105.34 98.49
2012 January .................... 111.10 106.69 107.79 114.12 W – 105.08 107.51 107.51 101.40 February .................. 121.45 114.47 110.14 124.31 W – 110.37 111.12 113.85 103.42 March ....................... W 118.46 114.81 128.10 W – 112.76 118.06 117.06 104.65 April ......................... 118.84 114.06 110.54 W W – 109.33 115.02 113.85 101.42 May .......................... 110.79 101.27 103.12 110.79 W – 101.45 105.16 105.28 96.74 June ......................... 95.65 91.81 90.60 98.96 91.90 – 87.64 90.55 90.63 85.28 July .......................... W 96.83 95.03 103.86 W – 93.81 95.47 96.30 88.46 August ..................... W 106.16 101.12 114.62 W – 99.94 104.87 104.18 95.13 September ............... 112.75 108.59 102.49 111.74 107.14 – 101.00 105.58 105.05 97.52 October .................... W 105.77 98.98 W W – 98.10 102.70 101.29 95.05 November ................ W 103.75 93.45 – W – 93.15 101.91 95.94 89.37 December ................ – 101.24 94.19 W W – 92.99 102.93 98.04 87.64 Average .................. 111.23 106.43 101.84 114.51 106.65 – 100.15 105.45 104.39 95.71
2013 January .................... W 106.99 100.16 W W – 97.15 105.30 102.42 91.51 February .................. W 106.45 108.25 W W – 104.06 105.22 106.93 97.34 March ....................... W 101.31 105.16 111.03 W – 101.60 108.10 105.77 94.86 April ......................... W 99.58 99.95 W W – 95.01 100.50 98.68 93.04 May .......................... 103.46 98.97 99.21 106.45 W – 95.48 98.46 98.72 94.06 June ......................... 103.67 98.56 97.16 W W – 95.71 97.42 98.45 94.58 July .......................... W 102.20 101.27 W W W 100.32 R 101.21 R 102.36 R 100.56 August ..................... W R 105.59 R 100.97 R 111.28 W – R 101.12 R 104.10 R 103.70 R 100.69 September ............... 113.86 103.16 100.60 W 103.45 – 100.59 103.15 104.01 100.54
a Prices are not adjusted for inflation. See "Nominal Dollars" in Glossary.b Bahrain, Iran, Iraq, Kuwait, Qatar, Saudi Arabia, United Arab Emirates, and
the Neutral Zone (between Kuwait and Saudi Arabia).c See "Organization of the Petroleum Exporting Countries (OPEC)" in Glossary.
On this table, "Total OPEC" for all years includes Algeria, Iran, Iraq, Kuwait, Libya,Nigeria, Qatar, Saudi Arabia, United Arab Emirates, and Venezuela; for1973–2008, also includes Indonesia; for 1973–1992 and again beginning in 2008,also includes Ecuador (although Ecuador rejoined OPEC in November 2007, onthis table Ecuador is included in "Total Non-OPEC" for 2007); for 1974–1995, alsoincludes Gabon (although Gabon was a member of OPEC for only 1975–1994);and beginning in 2007, also includes Angola. Data for all countries not included in"Total OPEC" are included in "Total Non-OPEC."
d Based on October, November, and December data only.R=Revised. – =No data reported. W=Value withheld to avoid disclosure of
individual company data.
Notes: • The Free on Board (F.O.B.) cost at the country of origin excludes allcosts related to insurance and transportation. See "F.O.B. (Free on Board)" inGlossary, and Note 3, "Crude Oil F.O.B. Costs," at end of section. • Values for thecurrent two months are preliminary. • Through 1980, prices reflect the period ofreporting; beginning in 1981, prices reflect the period of loading.• Annual averages are averages of the monthly prices, including prices notpublished, weighted by volume. • Cargoes that are purchased on a "netback"basis, or under similar contractual arrangements whereby the actual purchase priceis not established at the time the crude oil is acquired for importation into the UnitedStates, are not included in the published data until the actual prices have beendetermined and reported. • U.S. geographic coverage is the 50 states and theDistrict of Columbia.
Web Page: See http://www.eia.gov/totalenergy/data/monthly/#prices (Excel andCSV files) for all available annual and monthly data beginning in 1973.
Sources: See end of section.
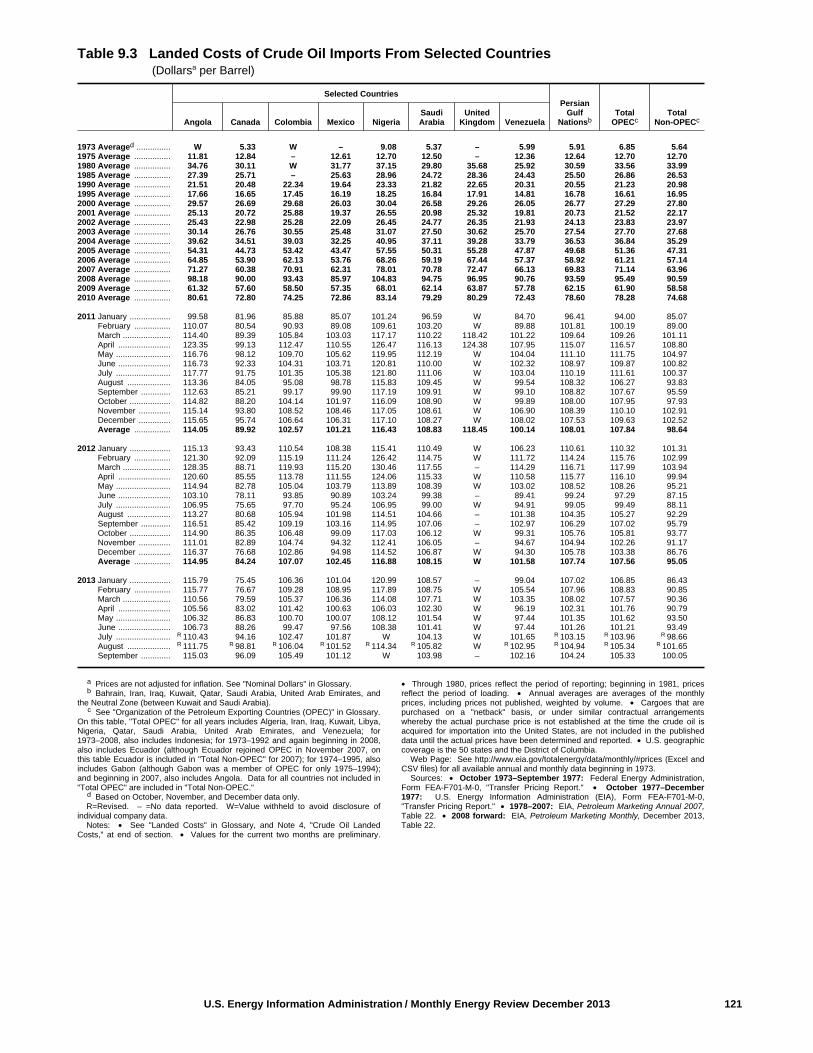
U.S. Energy Information Administration / Monthly Energy Review December 2013 121
Table 9.3 Landed Costs of Crude Oil Imports From Selected Countries (Dollarsa per Barrel)
Selected CountriesPersian
GulfNationsb
TotalOPECc
TotalNon-OPECcAngola Canada Colombia Mexico Nigeria
SaudiArabia
UnitedKingdom Venezuela
1973 Averaged ............... W 5.33 W – 9.08 5.37 – 5.99 5.91 6.85 5.641975 Average ................ 11.81 12.84 – 12.61 12.70 12.50 – 12.36 12.64 12.70 12.701980 Average ................ 34.76 30.11 W 31.77 37.15 29.80 35.68 25.92 30.59 33.56 33.991985 Average ................ 27.39 25.71 – 25.63 28.96 24.72 28.36 24.43 25.50 26.86 26.531990 Average ................ 21.51 20.48 22.34 19.64 23.33 21.82 22.65 20.31 20.55 21.23 20.981995 Average ................ 17.66 16.65 17.45 16.19 18.25 16.84 17.91 14.81 16.78 16.61 16.952000 Average ................ 29.57 26.69 29.68 26.03 30.04 26.58 29.26 26.05 26.77 27.29 27.802001 Average ................ 25.13 20.72 25.88 19.37 26.55 20.98 25.32 19.81 20.73 21.52 22.172002 Average ................ 25.43 22.98 25.28 22.09 26.45 24.77 26.35 21.93 24.13 23.83 23.972003 Average ................ 30.14 26.76 30.55 25.48 31.07 27.50 30.62 25.70 27.54 27.70 27.682004 Average ................ 39.62 34.51 39.03 32.25 40.95 37.11 39.28 33.79 36.53 36.84 35.292005 Average ................ 54.31 44.73 53.42 43.47 57.55 50.31 55.28 47.87 49.68 51.36 47.312006 Average ................ 64.85 53.90 62.13 53.76 68.26 59.19 67.44 57.37 58.92 61.21 57.142007 Average ................ 71.27 60.38 70.91 62.31 78.01 70.78 72.47 66.13 69.83 71.14 63.962008 Average ................ 98.18 90.00 93.43 85.97 104.83 94.75 96.95 90.76 93.59 95.49 90.592009 Average ................ 61.32 57.60 58.50 57.35 68.01 62.14 63.87 57.78 62.15 61.90 58.582010 Average ................ 80.61 72.80 74.25 72.86 83.14 79.29 80.29 72.43 78.60 78.28 74.68
2011 January .................. 99.58 81.96 85.88 85.07 101.24 96.59 W 84.70 96.41 94.00 85.07 February ................ 110.07 80.54 90.93 89.08 109.61 103.20 W 89.88 101.81 100.19 89.00 March ..................... 114.40 89.39 105.84 103.03 117.17 110.22 118.42 101.22 109.64 109.26 101.11 April ....................... 123.35 99.13 112.47 110.55 126.47 116.13 124.38 107.95 115.07 116.57 108.80 May ........................ 116.76 98.12 109.70 105.62 119.95 112.19 W 104.04 111.10 111.75 104.97 June ....................... 116.73 92.33 104.31 103.71 120.81 110.00 W 102.32 108.97 109.87 100.82 July ........................ 117.77 91.75 101.35 105.38 121.80 111.06 W 103.04 110.19 111.61 100.37 August ................... 113.36 84.05 95.08 98.78 115.83 109.45 W 99.54 108.32 106.27 93.83 September ............. 112.63 85.21 99.17 99.90 117.19 109.91 W 99.10 108.82 107.67 95.59 October .................. 114.82 88.20 104.14 101.97 116.09 108.90 W 99.89 108.00 107.95 97.93 November .............. 115.14 93.80 108.52 108.46 117.05 108.61 W 106.90 108.39 110.10 102.91 December .............. 115.65 95.74 106.64 106.31 117.10 108.27 W 108.02 107.53 109.63 102.52 Average ................ 114.05 89.92 102.57 101.21 116.43 108.83 118.45 100.14 108.01 107.84 98.64
2012 January .................. 115.13 93.43 110.54 108.38 115.41 110.49 W 106.23 110.61 110.32 101.31 February ................ 121.30 92.09 115.19 111.24 126.42 114.75 W 111.72 114.24 115.76 102.99 March ..................... 128.35 88.71 119.93 115.20 130.46 117.55 – 114.29 116.71 117.99 103.94 April ....................... 120.60 85.55 113.78 111.55 124.06 115.33 W 110.58 115.77 116.10 99.94 May ........................ 114.94 82.78 105.04 103.79 113.89 108.39 W 103.02 108.52 108.26 95.21 June ....................... 103.10 78.11 93.85 90.89 103.24 99.38 – 89.41 99.24 97.29 87.15 July ........................ 106.95 75.65 97.70 95.24 106.95 99.00 W 94.91 99.05 99.49 88.11 August ................... 113.27 80.68 105.94 101.98 114.51 104.66 – 101.38 104.35 105.27 92.29 September ............. 116.51 85.42 109.19 103.16 114.95 107.06 – 102.97 106.29 107.02 95.79 October .................. 114.90 86.35 106.48 99.09 117.03 106.12 W 99.31 105.76 105.81 93.77 November .............. 111.01 82.89 104.74 94.32 112.41 106.05 – 94.67 104.94 102.26 91.17 December .............. 116.37 76.68 102.86 94.98 114.52 106.87 W 94.30 105.78 103.38 86.76 Average ................ 114.95 84.24 107.07 102.45 116.88 108.15 W 101.58 107.74 107.56 95.05
2013 January .................. 115.79 75.45 106.36 101.04 120.99 108.57 – 99.04 107.02 106.85 86.43 February ................ 115.77 76.67 109.28 108.95 117.89 108.75 W 105.54 107.96 108.83 90.85 March ..................... 110.56 79.59 105.37 106.36 114.08 107.71 W 103.35 108.02 107.57 90.36 April ....................... 105.56 83.02 101.42 100.63 106.03 102.30 W 96.19 102.31 101.76 90.79 May ........................ 106.32 86.83 100.70 100.07 108.12 101.54 W 97.44 101.35 101.62 93.50 June ....................... 106.73 88.26 99.47 97.56 108.38 101.41 W 97.44 101.26 101.21 93.49 July ........................ R 110.43 94.16 102.47 101.87 W 104.13 W 101.65 R 103.15 R 103.96 R 98.66 August ................... R 111.75 R 98.81 R 106.04 R 101.52 R 114.34 R 105.82 W R 102.95 R 104.94 R 105.34 R 101.65 September ............. 115.03 96.09 105.49 101.12 W 103.98 – 102.16 104.24 105.33 100.05
a Prices are not adjusted for inflation. See "Nominal Dollars" in Glossary.b Bahrain, Iran, Iraq, Kuwait, Qatar, Saudi Arabia, United Arab Emirates, and
the Neutral Zone (between Kuwait and Saudi Arabia).c See "Organization of the Petroleum Exporting Countries (OPEC)" in Glossary.
On this table, "Total OPEC" for all years includes Algeria, Iran, Iraq, Kuwait, Libya,Nigeria, Qatar, Saudi Arabia, United Arab Emirates, and Venezuela; for1973–2008, also includes Indonesia; for 1973–1992 and again beginning in 2008,also includes Ecuador (although Ecuador rejoined OPEC in November 2007, onthis table Ecuador is included in "Total Non-OPEC" for 2007); for 1974–1995, alsoincludes Gabon (although Gabon was a member of OPEC for only 1975–1994);and beginning in 2007, also includes Angola. Data for all countries not included in"Total OPEC" are included in "Total Non-OPEC."
d Based on October, November, and December data only.R=Revised. – =No data reported. W=Value withheld to avoid disclosure of
individual company data.Notes: • See "Landed Costs" in Glossary, and Note 4, "Crude Oil Landed
Costs," at end of section. • Values for the current two months are preliminary.
• Through 1980, prices reflect the period of reporting; beginning in 1981, pricesreflect the period of loading. • Annual averages are averages of the monthlyprices, including prices not published, weighted by volume. • Cargoes that arepurchased on a "netback" basis, or under similar contractual arrangementswhereby the actual purchase price is not established at the time the crude oil isacquired for importation into the United States, are not included in the publisheddata until the actual prices have been determined and reported. • U.S. geographiccoverage is the 50 states and the District of Columbia.
Web Page: See http://www.eia.gov/totalenergy/data/monthly/#prices (Excel andCSV files) for all available annual and monthly data beginning in 1973.
Sources: • October 1973–September 1977: Federal Energy Administration,Form FEA-F701-M-0, "Transfer Pricing Report." • October 1977–December1977: U.S. Energy Information Administration (EIA), Form FEA-F701-M-0,"Transfer Pricing Report." • 1978–2007: EIA, Petroleum Marketing Annual 2007,Table 22. • 2008 forward: EIA, Petroleum Marketing Monthly, December 2013,Table 22.
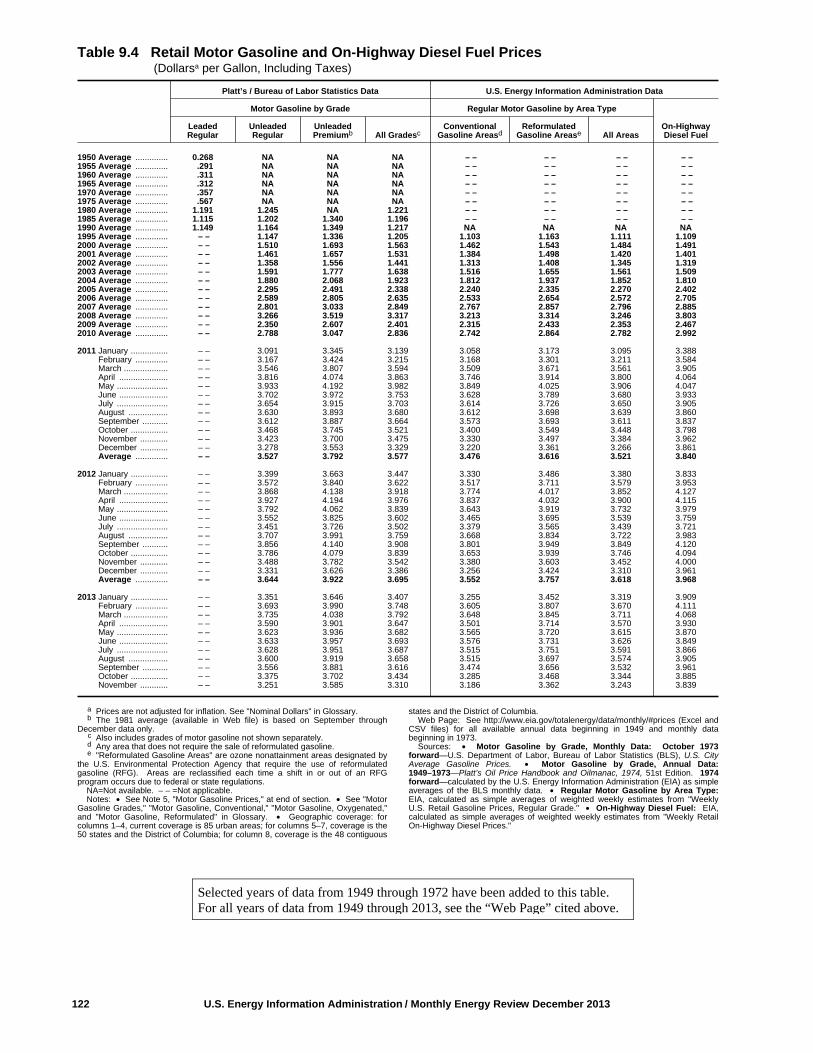
122 U.S. Energy Information Administration / Monthly Energy Review December 2013
Table 9.4 Retail Motor Gasoline and On-Highway Diesel Fuel Prices (Dollarsa per Gallon, Including Taxes)
Platt’s / Bureau of Labor Statistics Data U.S. Energy Information Administration Data
Motor Gasoline by Grade Regular Motor Gasoline by Area Type
On-HighwayDiesel Fuel
LeadedRegular
UnleadedRegular
UnleadedPremiumb All Gradesc
ConventionalGasoline Areasd
ReformulatedGasoline Arease All Areas
1950 Average .............. 0.268 NA NA NA – – – – – – – –1955 Average .............. .291 NA NA NA – – – – – – – –1960 Average .............. .311 NA NA NA – – – – – – – –1965 Average .............. .312 NA NA NA – – – – – – – –1970 Average .............. .357 NA NA NA – – – – – – – –1975 Average .............. .567 NA NA NA – – – – – – – –1980 Average .............. 1.191 1.245 NA 1.221 – – – – – – – –1985 Average .............. 1.115 1.202 1.340 1.196 – – – – – – – –1990 Average .............. 1.149 1.164 1.349 1.217 NA NA NA NA1995 Average .............. – – 1.147 1.336 1.205 1.103 1.163 1.111 1.1092000 Average .............. – – 1.510 1.693 1.563 1.462 1.543 1.484 1.4912001 Average .............. – – 1.461 1.657 1.531 1.384 1.498 1.420 1.4012002 Average .............. – – 1.358 1.556 1.441 1.313 1.408 1.345 1.3192003 Average .............. – – 1.591 1.777 1.638 1.516 1.655 1.561 1.5092004 Average .............. – – 1.880 2.068 1.923 1.812 1.937 1.852 1.8102005 Average .............. – – 2.295 2.491 2.338 2.240 2.335 2.270 2.4022006 Average .............. – – 2.589 2.805 2.635 2.533 2.654 2.572 2.7052007 Average .............. – – 2.801 3.033 2.849 2.767 2.857 2.796 2.8852008 Average .............. – – 3.266 3.519 3.317 3.213 3.314 3.246 3.8032009 Average .............. – – 2.350 2.607 2.401 2.315 2.433 2.353 2.4672010 Average .............. – – 2.788 3.047 2.836 2.742 2.864 2.782 2.992
2011 January ................ – – 3.091 3.345 3.139 3.058 3.173 3.095 3.388 February .............. – – 3.167 3.424 3.215 3.168 3.301 3.211 3.584 March ................... – – 3.546 3.807 3.594 3.509 3.671 3.561 3.905 April ..................... – – 3.816 4.074 3.863 3.746 3.914 3.800 4.064 May ...................... – – 3.933 4.192 3.982 3.849 4.025 3.906 4.047 June ..................... – – 3.702 3.972 3.753 3.628 3.789 3.680 3.933 July ...................... – – 3.654 3.915 3.703 3.614 3.726 3.650 3.905 August ................. – – 3.630 3.893 3.680 3.612 3.698 3.639 3.860 September ........... – – 3.612 3.887 3.664 3.573 3.693 3.611 3.837 October ................ – – 3.468 3.745 3.521 3.400 3.549 3.448 3.798 November ............ – – 3.423 3.700 3.475 3.330 3.497 3.384 3.962 December ............ – – 3.278 3.553 3.329 3.220 3.361 3.266 3.861 Average .............. – – 3.527 3.792 3.577 3.476 3.616 3.521 3.840
2012 January ................ – – 3.399 3.663 3.447 3.330 3.486 3.380 3.833 February .............. – – 3.572 3.840 3.622 3.517 3.711 3.579 3.953 March ................... – – 3.868 4.138 3.918 3.774 4.017 3.852 4.127 April ..................... – – 3.927 4.194 3.976 3.837 4.032 3.900 4.115 May ...................... – – 3.792 4.062 3.839 3.643 3.919 3.732 3.979 June ..................... – – 3.552 3.825 3.602 3.465 3.695 3.539 3.759 July ...................... – – 3.451 3.726 3.502 3.379 3.565 3.439 3.721 August ................. – – 3.707 3.991 3.759 3.668 3.834 3.722 3.983 September ........... – – 3.856 4.140 3.908 3.801 3.949 3.849 4.120 October ................ – – 3.786 4.079 3.839 3.653 3.939 3.746 4.094 November ............ – – 3.488 3.782 3.542 3.380 3.603 3.452 4.000 December ............ – – 3.331 3.626 3.386 3.256 3.424 3.310 3.961 Average .............. – – 3.644 3.922 3.695 3.552 3.757 3.618 3.968
2013 January ................ – – 3.351 3.646 3.407 3.255 3.452 3.319 3.909 February .............. – – 3.693 3.990 3.748 3.605 3.807 3.670 4.111 March ................... – – 3.735 4.038 3.792 3.648 3.845 3.711 4.068 April ..................... – – 3.590 3.901 3.647 3.501 3.714 3.570 3.930 May ...................... – – 3.623 3.936 3.682 3.565 3.720 3.615 3.870 June ..................... – – 3.633 3.957 3.693 3.576 3.731 3.626 3.849 July ...................... – – 3.628 3.951 3.687 3.515 3.751 3.591 3.866 August ................. – – 3.600 3.919 3.658 3.515 3.697 3.574 3.905 September ........... – – 3.556 3.881 3.616 3.474 3.656 3.532 3.961 October ................ – – 3.375 3.702 3.434 3.285 3.468 3.344 3.885 November ............ – – 3.251 3.585 3.310 3.186 3.362 3.243 3.839
a Prices are not adjusted for inflation. See "Nominal Dollars" in Glossary.b The 1981 average (available in Web file) is based on September through
December data only.c Also includes grades of motor gasoline not shown separately.d Any area that does not require the sale of reformulated gasoline.e "Reformulated Gasoline Areas" are ozone nonattainment areas designated by
the U.S. Environmental Protection Agency that require the use of reformulatedgasoline (RFG). Areas are reclassified each time a shift in or out of an RFGprogram occurs due to federal or state regulations.
NA=Not available. – – =Not applicable. Notes: • See Note 5, "Motor Gasoline Prices," at end of section. • See "Motor
Gasoline Grades," "Motor Gasoline, Conventional," "Motor Gasoline, Oxygenated,"and "Motor Gasoline, Reformulated" in Glossary. • Geographic coverage: forcolumns 1–4, current coverage is 85 urban areas; for columns 5–7, coverage is the50 states and the District of Columbia; for column 8, coverage is the 48 contiguous
states and the District of Columbia.Web Page: See http://www.eia.gov/totalenergy/data/monthly/#prices (Excel and
CSV files) for all available annual data beginning in 1949 and monthly databeginning in 1973.
Sources: • Motor Gasoline by Grade, Monthly Data: October 1973forward—U.S. Department of Labor, Bureau of Labor Statistics (BLS), U.S. CityAverage Gasoline Prices. • Motor Gasoline by Grade, Annual Data:1949–1973—Platt’s Oil Price Handbook and Oilmanac, 1974, 51st Edition. 1974forward—calculated by the U.S. Energy Information Administration (EIA) as simpleaverages of the BLS monthly data. • Regular Motor Gasoline by Area Type:EIA, calculated as simple averages of weighted weekly estimates from "WeeklyU.S. Retail Gasoline Prices, Regular Grade." • On-Highway Diesel Fuel: EIA,calculated as simple averages of weighted weekly estimates from "Weekly RetailOn-Highway Diesel Prices."
Selected years of data from 1949 through 1972 have been added to this table.For all years of data from 1949 through 2013, see the “Web Page” cited above.
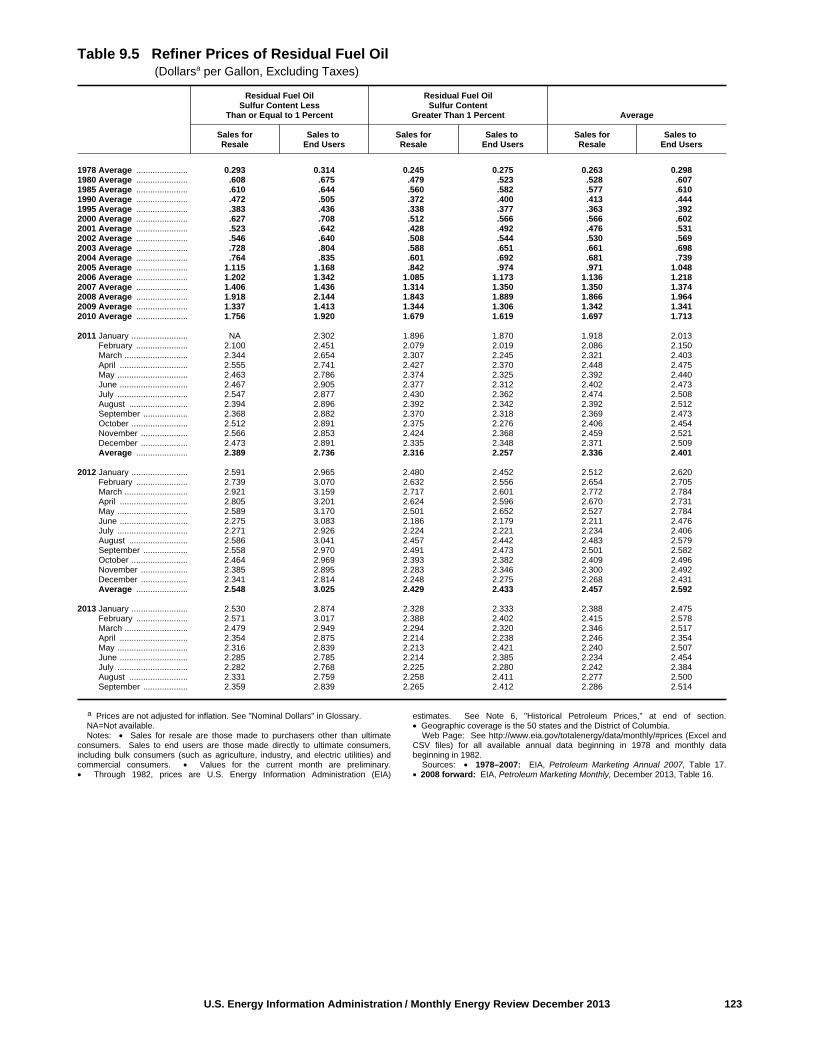
U.S. Energy Information Administration / Monthly Energy Review December 2013 123
Table 9.5 Refiner Prices of Residual Fuel Oil (Dollarsa per Gallon, Excluding Taxes)
Residual Fuel OilSulfur Content Less
Than or Equal to 1 Percent
Residual Fuel OilSulfur Content
Greater Than 1 Percent Average
Sales forResale
Sales to End Users
Sales forResale
Sales to End Users
Sales forResale
Sales to End Users
1978 Average ...................... 0.293 0.314 0.245 0.275 0.263 0.2981980 Average ...................... .608 .675 .479 .523 .528 .6071985 Average ...................... .610 .644 .560 .582 .577 .6101990 Average ...................... .472 .505 .372 .400 .413 .4441995 Average ...................... .383 .436 .338 .377 .363 .3922000 Average ...................... .627 .708 .512 .566 .566 .6022001 Average ...................... .523 .642 .428 .492 .476 .5312002 Average ...................... .546 .640 .508 .544 .530 .5692003 Average ...................... .728 .804 .588 .651 .661 .6982004 Average ...................... .764 .835 .601 .692 .681 .7392005 Average ...................... 1.115 1.168 .842 .974 .971 1.0482006 Average ...................... 1.202 1.342 1.085 1.173 1.136 1.2182007 Average ...................... 1.406 1.436 1.314 1.350 1.350 1.3742008 Average ...................... 1.918 2.144 1.843 1.889 1.866 1.9642009 Average ...................... 1.337 1.413 1.344 1.306 1.342 1.3412010 Average ...................... 1.756 1.920 1.679 1.619 1.697 1.713
2011 January ........................ NA 2.302 1.896 1.870 1.918 2.013 February ...................... 2.100 2.451 2.079 2.019 2.086 2.150 March ........................... 2.344 2.654 2.307 2.245 2.321 2.403 April ............................. 2.555 2.741 2.427 2.370 2.448 2.475 May .............................. 2.463 2.786 2.374 2.325 2.392 2.440 June ............................. 2.467 2.905 2.377 2.312 2.402 2.473 July .............................. 2.547 2.877 2.430 2.362 2.474 2.508 August ......................... 2.394 2.896 2.392 2.342 2.392 2.512 September ................... 2.368 2.882 2.370 2.318 2.369 2.473 October ........................ 2.512 2.891 2.375 2.276 2.406 2.454 November .................... 2.566 2.853 2.424 2.368 2.459 2.521 December .................... 2.473 2.891 2.335 2.348 2.371 2.509 Average ...................... 2.389 2.736 2.316 2.257 2.336 2.401
2012 January ........................ 2.591 2.965 2.480 2.452 2.512 2.620 February ...................... 2.739 3.070 2.632 2.556 2.654 2.705 March ........................... 2.921 3.159 2.717 2.601 2.772 2.784 April ............................. 2.805 3.201 2.624 2.596 2.670 2.731 May .............................. 2.589 3.170 2.501 2.652 2.527 2.784 June ............................. 2.275 3.083 2.186 2.179 2.211 2.476 July .............................. 2.271 2.926 2.224 2.221 2.234 2.406 August ......................... 2.586 3.041 2.457 2.442 2.483 2.579 September ................... 2.558 2.970 2.491 2.473 2.501 2.582 October ........................ 2.464 2.969 2.393 2.382 2.409 2.496 November .................... 2.385 2.895 2.283 2.346 2.300 2.492 December .................... 2.341 2.814 2.248 2.275 2.268 2.431 Average ...................... 2.548 3.025 2.429 2.433 2.457 2.592
2013 January ........................ 2.530 2.874 2.328 2.333 2.388 2.475 February ...................... 2.571 3.017 2.388 2.402 2.415 2.578 March ........................... 2.479 2.949 2.294 2.320 2.346 2.517 April ............................. 2.354 2.875 2.214 2.238 2.246 2.354 May .............................. 2.316 2.839 2.213 2.421 2.240 2.507 June ............................. 2.285 2.785 2.214 2.385 2.234 2.454 July .............................. 2.282 2.768 2.225 2.280 2.242 2.384 August ......................... 2.331 2.759 2.258 2.411 2.277 2.500 September ................... 2.359 2.839 2.265 2.412 2.286 2.514
a Prices are not adjusted for inflation. See "Nominal Dollars" in Glossary.NA=Not available. Notes: • Sales for resale are those made to purchasers other than ultimate
consumers. Sales to end users are those made directly to ultimate consumers,including bulk consumers (such as agriculture, industry, and electric utilities) andcommercial consumers. • Values for the current month are preliminary.• Through 1982, prices are U.S. Energy Information Administration (EIA)
estimates. See Note 6, "Historical Petroleum Prices," at end of section.• Geographic coverage is the 50 states and the District of Columbia.
Web Page: See http://www.eia.gov/totalenergy/data/monthly/#prices (Excel andCSV files) for all available annual data beginning in 1978 and monthly databeginning in 1982.
Sources: • 1978–2007: EIA, Petroleum Marketing Annual 2007, Table 17.• 2008 forward: EIA, Petroleum Marketing Monthly, December 2013, Table 16.

124 U.S. Energy Information Administration / Monthly Energy Review December 2013
Table 9.6 Refiner Prices of Petroleum Products for Resale (Dollarsa per Gallon, Excluding Taxes)
FinishedMotor
Gasolineb
FinishedAviationGasoline
Kerosene-Type
Jet Fuel Kerosene
No. 2FuelOil
No. 2DieselFuel
Propane(Consumer
Grade)
1978 Average ...................... 0.434 0.537 0.386 0.404 0.369 0.365 0.2371980 Average ...................... .941 1.128 .868 .864 .803 .801 .4151985 Average ...................... .835 1.130 .794 .874 .776 .772 .3981990 Average ...................... .786 1.063 .773 .839 .697 .694 .3861995 Average ...................... .626 .975 .539 .580 .511 .538 .3442000 Average ...................... .963 1.330 .880 .969 .886 .898 .5952001 Average ...................... .886 1.256 .763 .821 .756 .784 .5402002 Average ...................... .828 1.146 .716 .752 .694 .724 .4312003 Average ...................... 1.002 1.288 .871 .955 .881 .883 .6072004 Average ...................... 1.288 1.627 1.208 1.271 1.125 1.187 .7512005 Average ...................... 1.670 2.076 1.723 1.757 1.623 1.737 .9332006 Average ...................... 1.969 2.490 1.961 2.007 1.834 2.012 1.0312007 Average ...................... 2.182 2.758 2.171 2.249 2.072 2.203 1.1942008 Average ...................... 2.586 3.342 3.020 2.851 2.745 2.994 1.4372009 Average ...................... 1.767 2.480 1.719 1.844 1.657 1.713 .9212010 Average ...................... 2.165 2.874 2.185 2.299 2.147 2.214 1.212
2011 January ........................ 2.472 3.161 2.585 2.804 2.585 2.621 1.380 February ...................... 2.584 3.248 2.783 2.974 2.737 2.820 1.401 March ........................... 2.934 3.607 3.095 3.196 2.996 3.134 1.403 April ............................. 3.218 4.035 3.259 3.296 3.167 3.296 1.433 May .............................. 3.174 4.096 3.188 W 3.039 3.116 1.515 June ............................. 2.970 3.847 3.101 3.054 2.956 3.079 1.503 July .............................. 3.058 4.011 3.090 3.158 3.024 3.135 1.513 August ......................... 2.949 3.899 3.040 3.089 2.927 3.032 1.522 September ................... 2.896 3.878 3.025 3.073 2.927 3.035 1.557 October ........................ 2.805 3.616 2.962 3.096 2.915 3.035 1.511 November .................... 2.701 3.494 3.089 3.258 3.050 3.157 1.498 December .................... 2.614 3.424 2.951 3.006 2.928 2.927 1.444 Average ...................... 2.867 3.739 3.014 3.065 2.907 3.034 1.467
2012 January ........................ 2.747 3.576 3.059 3.197 3.027 3.018 1.341 February ...................... 2.936 3.788 3.186 3.293 3.166 3.163 1.282 March ........................... 3.203 4.052 3.296 3.306 3.211 3.308 1.293 April ............................. 3.189 4.157 3.255 3.243 3.153 3.252 1.163 May .............................. 3.016 4.004 3.076 3.008 2.976 3.039 .950 June ............................. 2.757 3.883 2.747 2.697 2.635 2.741 .762 July .............................. 2.806 3.877 2.850 2.936 2.774 2.907 .809 August ......................... 3.087 4.124 3.129 3.195 2.988 3.206 .875 September ................... 3.163 4.269 3.245 3.236 3.128 3.278 .910 October ........................ 2.941 4.002 3.182 3.250 3.155 3.265 .979 November .................... 2.713 3.508 3.015 3.221 3.049 3.117 .955 December .................... 2.590 3.518 2.982 3.145 3.003 3.022 .894 Average ...................... 2.929 3.919 3.080 3.163 3.031 3.109 1.033
2013 January ........................ 2.676 3.685 3.093 3.334 3.069 3.046 .928 February ...................... 3.020 4.058 3.250 3.474 3.168 3.259 .953 March ........................... 2.987 4.085 3.036 3.137 2.977 3.082 .952 April ............................. 2.853 3.962 2.884 2.889 2.793 2.969 .949 May .............................. 2.951 4.068 2.763 2.793 2.708 2.958 .932 June ............................. 2.882 3.950 2.784 2.806 2.741 2.923 .861 July .............................. 2.942 4.017 2.899 2.996 2.894 3.015 .903 August ......................... 2.890 R 4.025 2.995 3.055 2.954 3.084 1.059 September ................... 2.792 3.854 3.017 3.057 2.973 3.095 1.114
a Prices are not adjusted for inflation. See "Nominal Dollars" in Glossary.b See Note 5, "Motor Gasoline Prices," at end of section.R=Revised. W=Value withheld to avoid disclosure of individual company data.Notes: • Sales for resale are those made to purchasers other than ultimate
consumers. Sales to end users are shown in Table 9.7; they are sales madedirectly to ultimate consumers, including bulk consumers (such as agriculture,industry, and electric utilities) and residential and commercial consumers. • Valuesfor the current month are preliminary. • Through 1982, prices are U.S. Energy
Information Administration (EIA) estimates. See Note 6, "Historical PetroleumPrices," at end of section. • Geographic coverage is the 50 states and the Districtof Columbia.
Web Page: See http://www.eia.gov/totalenergy/data/monthly/#prices (Excel andCSV files) for all available annual data beginning in 1978 and monthly databeginning in 1982.
Sources: • 1978–2007: EIA, Petroleum Marketing Annual 2007, Table 4.• 2008 forward: EIA, Petroleum Marketing Monthly, December 2013, Table 4.

U.S. Energy Information Administration / Monthly Energy Review December 2013 125
Table 9.7 Refiner Prices of Petroleum Products to End Users (Dollarsa per Gallon, Excluding Taxes)
FinishedMotor
Gasolineb
FinishedAviationGasoline
Kerosene-Type
Jet Fuel Kerosene
No. 2FuelOil
No. 2DieselFuel
Propane(Consumer
Grade)
1978 Average ...................... 0.484 0.516 0.387 0.421 0.400 0.377 0.3351980 Average ...................... 1.035 1.084 .868 .902 .788 .818 .4821985 Average ...................... .912 1.201 .796 1.030 .849 .789 .7171990 Average ...................... .883 1.120 .766 .923 .734 .725 .7451995 Average ...................... .765 1.005 .540 .589 .562 .560 .4922000 Average ...................... 1.106 1.306 .899 1.123 .927 .935 .6032001 Average ...................... 1.032 1.323 .775 1.045 .829 .842 .5062002 Average ...................... .947 1.288 .721 .990 .737 .762 .4192003 Average ...................... 1.156 1.493 .872 1.224 .933 .944 .5772004 Average ...................... 1.435 1.819 1.207 1.160 1.173 1.243 .8392005 Average ...................... 1.829 2.231 1.735 1.957 1.705 1.786 1.0892006 Average ...................... 2.128 2.682 1.998 2.244 1.982 2.096 1.3582007 Average ...................... 2.345 2.849 2.165 2.263 2.241 2.267 1.4892008 Average ...................... 2.775 3.273 3.052 3.283 2.986 3.150 1.8922009 Average ...................... 1.888 2.442 1.704 2.675 1.962 1.834 1.2202010 Average ...................... 2.301 3.028 2.201 3.063 2.462 2.314 1.481
2011 January ........................ 2.615 3.323 2.623 3.358 2.889 2.681 NA February ...................... 2.712 3.374 2.818 3.506 3.020 2.867 1.823 March ........................... 3.072 3.767 3.161 3.697 3.255 3.189 1.763 April ............................. 3.340 4.132 3.306 3.796 3.430 3.370 NA May .............................. 3.419 4.091 3.220 3.894 3.337 3.231 1.648 June ............................. 3.184 3.913 3.138 3.802 3.193 3.183 1.681 July .............................. 3.172 4.027 3.118 3.812 3.294 3.214 1.620 August ......................... 3.134 3.920 3.057 3.851 3.251 3.143 1.650 September ................... 3.090 3.915 3.059 3.873 3.288 3.127 1.702 October ........................ 2.980 3.697 2.987 3.823 3.346 3.108 1.706 November .................... 2.922 3.620 3.124 3.892 3.403 3.225 1.773 December .................... 2.808 W 2.963 3.824 3.255 3.024 1.691 Average ...................... 3.050 3.803 3.054 3.616 3.193 3.117 1.709
2012 January ........................ 2.914 3.732 3.087 3.848 3.345 3.093 1.655 February ...................... 3.087 W 3.206 3.874 3.495 3.224 1.518 March ........................... 3.389 4.133 3.337 3.919 3.522 3.378 1.470 April ............................. 3.405 4.313 3.283 3.916 3.509 3.342 1.352 May .............................. 3.289 W 3.100 3.741 3.258 3.163 1.080 June ............................. 3.061 W 2.768 3.753 2.982 2.912 .902 July .............................. 2.981 W 2.856 3.612 3.041 2.989 .972 August ......................... 3.248 4.091 3.123 3.575 3.256 3.265 .916 September ................... 3.357 4.262 3.283 3.771 3.361 3.367 .932 October ........................ 3.261 4.064 3.211 3.864 3.486 3.364 .980 November .................... 2.994 3.561 3.045 3.854 3.403 3.206 .926 December .................... 2.828 3.599 3.008 3.789 3.321 3.115 .840 Average ...................... 3.154 3.971 3.104 3.843 3.358 3.202 1.139
2013 January ........................ 2.850 W 3.117 3.790 3.341 3.129 .891 February ...................... 3.221 4.060 3.294 3.887 3.498 3.339 .925 March ........................... 3.233 4.022 3.070 3.869 3.314 3.204 .943 April ............................. 3.102 3.860 2.922 3.836 3.217 3.090 .971 May .............................. 3.188 3.900 2.787 3.786 3.222 3.058 .953 June ............................. 3.184 4.191 2.813 3.634 3.172 3.028 .876 July .............................. 3.146 4.224 2.908 3.840 3.244 3.099 .935 August ......................... 3.097 R 4.298 3.002 3.707 3.314 3.169 1.074 September ................... 3.058 3.993 3.040 3.849 3.327 3.181 1.115
a Prices are not adjusted for inflation. See "Nominal Dollars" in Glossary.b See Note 5, "Motor Gasoline Prices," at end of section.R=Revised. NA=Not available. W=Value withheld to avoid disclosure of
individual company data.Notes: • Sales to end users are those made directly to ultimate consumers,
including bulk consumers (such as agriculture, industry, and electric utilities) andresidential and commercial consumers. Sales for resale are shown in Table 9.6;they are sales made to purchasers other than ultimate consumers. • Values forthe current month are preliminary. • Through 1982, prices are U.S. Energy
Information Administration (EIA) estimates. See Note 6, "Historical PetroleumPrices," at end of section. • Geographic coverage is the 50 states and the Districtof Columbia.
Web Page: See http://www.eia.gov/totalenergy/data/monthly/#prices (Excel andCSV files) for all available annual data beginning in 1978 and monthly databeginning in 1982.
Sources: • 1978–2007: EIA, Petroleum Marketing Annual 2007, Table 2.• 2008 forward: EIA, Petroleum Marketing Monthly, December 2013, Table 2.
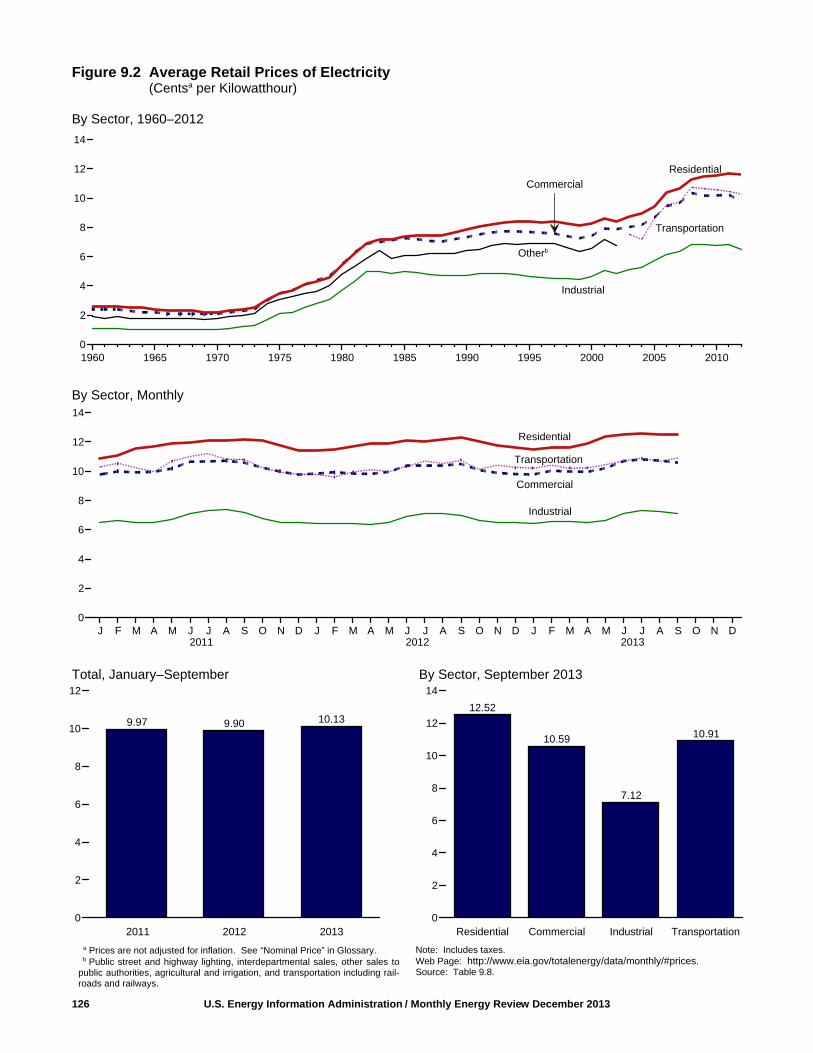
Figure 9.2 Average Retail Prices of Electricity (Centsa per Kilowatthour)
By Sector, 1960–2012
By Sector, Monthly
Total, January–September By Sector, September 2013
126 U.S. Energy Information Administration / Monthly Energy Review December 2013
a Prices are not adjusted for inflation. See “Nominal Price” in Glossary.b Public street and highway lighting, interdepartmental sales, other sales to
public authorities, agricultural and irrigation, and transportation including rail-roads and railways.
Note: Includes taxes. Web Page: http://www.eia.gov/totalenergy/data/monthly/#prices.Source: Table 9.8.
1960 1965 1970 1975 1980 1985 1990 1995 2000 2005 20100
2
4
6
8
10
12
14
Residential
Commercial
Otherb
Industrial
J F M A M J J A S O N D J F M A M J J A S O N D J F M A M J J A S O N D0
2
4
6
8
10
12
14
Transportation
2011 2012 2013
Residential
Industrial
Commercial
Transportation
9.97 9.90 10.13
2011 2012 20130
2
4
6
8
10
12
12.52
10.59
7.12
10.91
Residential Commercial Industrial Transportation0
2
4
6
8
10
12
14
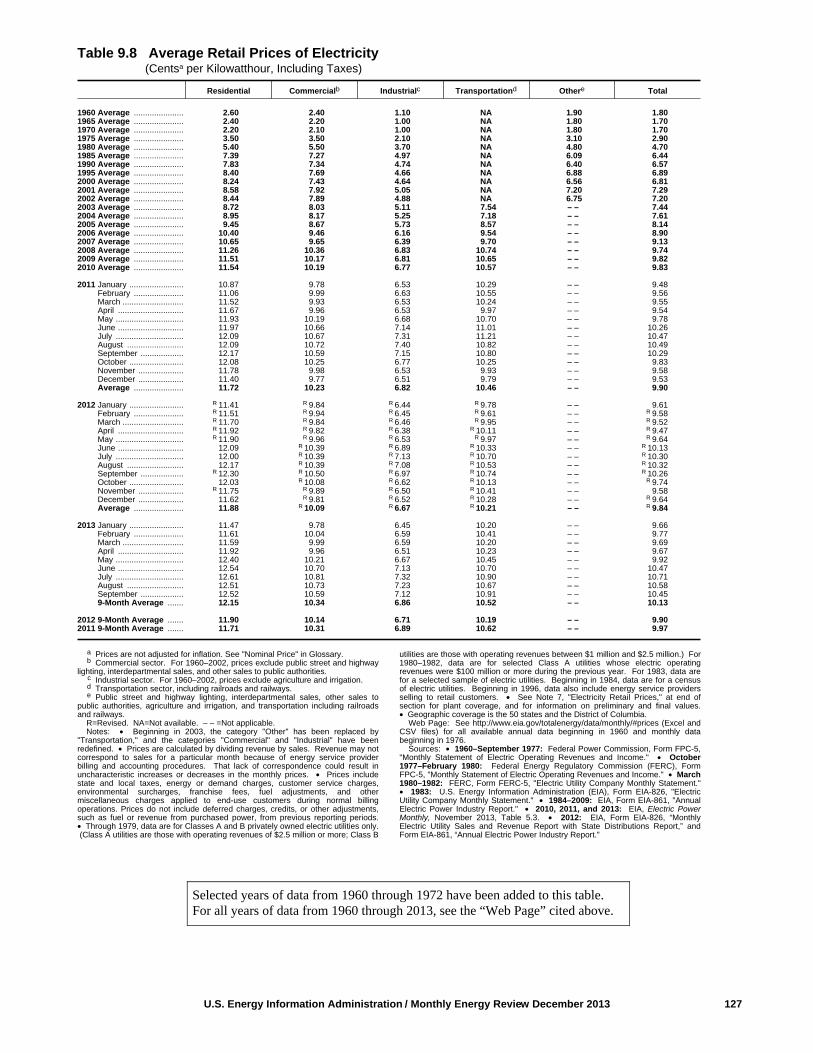
U.S. Energy Information Administration / Monthly Energy Review December 2013 127
Table 9.8 Average Retail Prices of Electricity (Centsa per Kilowatthour, Including Taxes)
Residential Commercialb Industrialc Transportationd Othere Total
1960 Average ...................... 2.60 2.40 1.10 NA 1.90 1.801965 Average ...................... 2.40 2.20 1.00 NA 1.80 1.701970 Average ...................... 2.20 2.10 1.00 NA 1.80 1.701975 Average ...................... 3.50 3.50 2.10 NA 3.10 2.901980 Average ...................... 5.40 5.50 3.70 NA 4.80 4.701985 Average ...................... 7.39 7.27 4.97 NA 6.09 6.441990 Average ...................... 7.83 7.34 4.74 NA 6.40 6.571995 Average ...................... 8.40 7.69 4.66 NA 6.88 6.892000 Average ...................... 8.24 7.43 4.64 NA 6.56 6.812001 Average ...................... 8.58 7.92 5.05 NA 7.20 7.292002 Average ...................... 8.44 7.89 4.88 NA 6.75 7.202003 Average ...................... 8.72 8.03 5.11 7.54 – – 7.442004 Average ...................... 8.95 8.17 5.25 7.18 – – 7.612005 Average ...................... 9.45 8.67 5.73 8.57 – – 8.142006 Average ...................... 10.40 9.46 6.16 9.54 – – 8.902007 Average ...................... 10.65 9.65 6.39 9.70 – – 9.132008 Average ...................... 11.26 10.36 6.83 10.74 – – 9.742009 Average ...................... 11.51 10.17 6.81 10.65 – – 9.822010 Average ...................... 11.54 10.19 6.77 10.57 – – 9.83
2011 January ........................ 10.87 9.78 6.53 10.29 – – 9.48 February ...................... 11.06 9.99 6.63 10.55 – – 9.56 March ........................... 11.52 9.93 6.53 10.24 – – 9.55 April ............................. 11.67 9.96 6.53 9.97 – – 9.54 May .............................. 11.93 10.19 6.68 10.70 – – 9.78 June ............................. 11.97 10.66 7.14 11.01 – – 10.26 July .............................. 12.09 10.67 7.31 11.21 – – 10.47 August ......................... 12.09 10.72 7.40 10.82 – – 10.49 September ................... 12.17 10.59 7.15 10.80 – – 10.29 October ........................ 12.08 10.25 6.77 10.25 – – 9.83 November .................... 11.78 9.98 6.53 9.93 – – 9.58 December .................... 11.40 9.77 6.51 9.79 – – 9.53 Average ...................... 11.72 10.23 6.82 10.46 – – 9.90
2012 January ........................ R 11.41 R 9.84 R 6.44 R 9.78 – – 9.61 February ...................... R 11.51 R 9.94 R 6.45 R 9.61 – – R 9.58 March ........................... R 11.70 R 9.84 R 6.46 R 9.95 – – R 9.52 April ............................. R 11.92 R 9.82 R 6.38 R 10.11 – – R 9.47 May .............................. R 11.90 R 9.96 R 6.53 R 9.97 – – R 9.64 June ............................. 12.09 R 10.39 R 6.89 R 10.33 – – R 10.13 July .............................. 12.00 R 10.39 R 7.13 R 10.70 – – R 10.30 August ......................... 12.17 R 10.39 R 7.08 R 10.53 – – R 10.32 September ................... R 12.30 R 10.50 R 6.97 R 10.74 – – R 10.26 October ........................ 12.03 R 10.08 R 6.62 R 10.13 – – R 9.74 November .................... R 11.75 R 9.89 R 6.50 R 10.41 – – 9.58 December .................... 11.62 R 9.81 R 6.52 R 10.28 – – R 9.64 Average ...................... 11.88 R 10.09 R 6.67 R 10.21 – – R 9.84
2013 January ........................ 11.47 9.78 6.45 10.20 – – 9.66 February ...................... 11.61 10.04 6.59 10.41 – – 9.77 March ........................... 11.59 9.99 6.59 10.20 – – 9.69 April ............................. 11.92 9.96 6.51 10.23 – – 9.67 May .............................. 12.40 10.21 6.67 10.45 – – 9.92 June ............................. 12.54 10.70 7.13 10.70 – – 10.47 July .............................. 12.61 10.81 7.32 10.90 – – 10.71 August ......................... 12.51 10.73 7.23 10.67 – – 10.58 September ................... 12.52 10.59 7.12 10.91 – – 10.45 9-Month Average ....... 12.15 10.34 6.86 10.52 – – 10.13
2012 9-Month Average ....... 11.90 10.14 6.71 10.19 – – 9.902011 9-Month Average ....... 11.71 10.31 6.89 10.62 – – 9.97
a Prices are not adjusted for inflation. See "Nominal Price" in Glossary.b Commercial sector. For 1960–2002, prices exclude public street and highway
lighting, interdepartmental sales, and other sales to public authorities.c Industrial sector. For 1960–2002, prices exclude agriculture and irrigation.d Transportation sector, including railroads and railways.e Public street and highway lighting, interdepartmental sales, other sales to
public authorities, agriculture and irrigation, and transportation including railroadsand railways.
R=Revised. NA=Not available. – – =Not applicable. Notes: • Beginning in 2003, the category "Other" has been replaced by
"Transportation," and the categories "Commercial" and "Industrial" have beenredefined. • Prices are calculated by dividing revenue by sales. Revenue may notcorrespond to sales for a particular month because of energy service providerbilling and accounting procedures. That lack of correspondence could result inuncharacteristic increases or decreases in the monthly prices. • Prices includestate and local taxes, energy or demand charges, customer service charges,environmental surcharges, franchise fees, fuel adjustments, and othermiscellaneous charges applied to end-use customers during normal billingoperations. Prices do not include deferred charges, credits, or other adjustments,such as fuel or revenue from purchased power, from previous reporting periods.• Through 1979, data are for Classes A and B privately owned electric utilities only. (Class A utilities are those with operating revenues of $2.5 million or more; Class B
utilities are those with operating revenues between $1 million and $2.5 million.) For1980–1982, data are for selected Class A utilities whose electric operatingrevenues were $100 million or more during the previous year. For 1983, data arefor a selected sample of electric utilities. Beginning in 1984, data are for a censusof electric utilities. Beginning in 1996, data also include energy service providersselling to retail customers. • See Note 7, "Electricity Retail Prices," at end ofsection for plant coverage, and for information on preliminary and final values.• Geographic coverage is the 50 states and the District of Columbia.
Web Page: See http://www.eia.gov/totalenergy/data/monthly/#prices (Excel andCSV files) for all available annual data beginning in 1960 and monthly databeginning in 1976.
Sources: • 1960–September 1977: Federal Power Commission, Form FPC-5,"Monthly Statement of Electric Operating Revenues and Income." • October1977–February 1980: Federal Energy Regulatory Commission (FERC), FormFPC-5, "Monthly Statement of Electric Operating Revenues and Income." • March1980–1982: FERC, Form FERC-5, "Electric Utility Company Monthly Statement."• 1983: U.S. Energy Information Administration (EIA), Form EIA-826, "ElectricUtility Company Monthly Statement." • 1984–2009: EIA, Form EIA-861, "AnnualElectric Power Industry Report." • 2010, 2011, and 2013: EIA, Electric PowerMonthly, November 2013, Table 5.3. • 2012: EIA, Form EIA-826, “MonthlyElectric Utility Sales and Revenue Report with State Distributions Report,” andForm EIA-861, “Annual Electric Power Industry Report.”
Selected years of data from 1960 through 1972 have been added to this table.For all years of data from 1960 through 2013, see the “Web Page” cited above.

Figure 9.3 Cost of Fossil-Fuel Receipts at Electric Generating Plants (Dollarsa per Million Btu, Including Taxes)
Costs, 1973–2012
Costs, Monthly
By Fuel Type
128 U.S. Energy Information Administration / Monthly Energy Review December 2013
1975 1980 1985 1990 1995 2000 2005 20100
5
10
15
20
25
Residual Fuel Oil
J F M A M J J A S O N D J F M A M J J A S O N D J F M A M J J A S O N D0
5
10
15
20
25
Natural Gas
Coal
Coal
Residual Fuel Oil
Natural Gas
2011 2012 2013
a Prices are not adjusted for inflation. See “Nominal Dollars” inGlossary.
Web Page: http://www.eia.gov/totalenergy/data/monthly/#prices.Source: Table 9.9.
23.50
18.93
4.082.15 2.35
24.42
20.90
3.412.39 2.38
22.73
19.66
4.562.93 2.44
Distillate Fuel Oil Residual Fuel Oil Natural Gas Petroleum Coke Coal0
5
10
15
20
25
30 September 2011 September 2012 September 2013
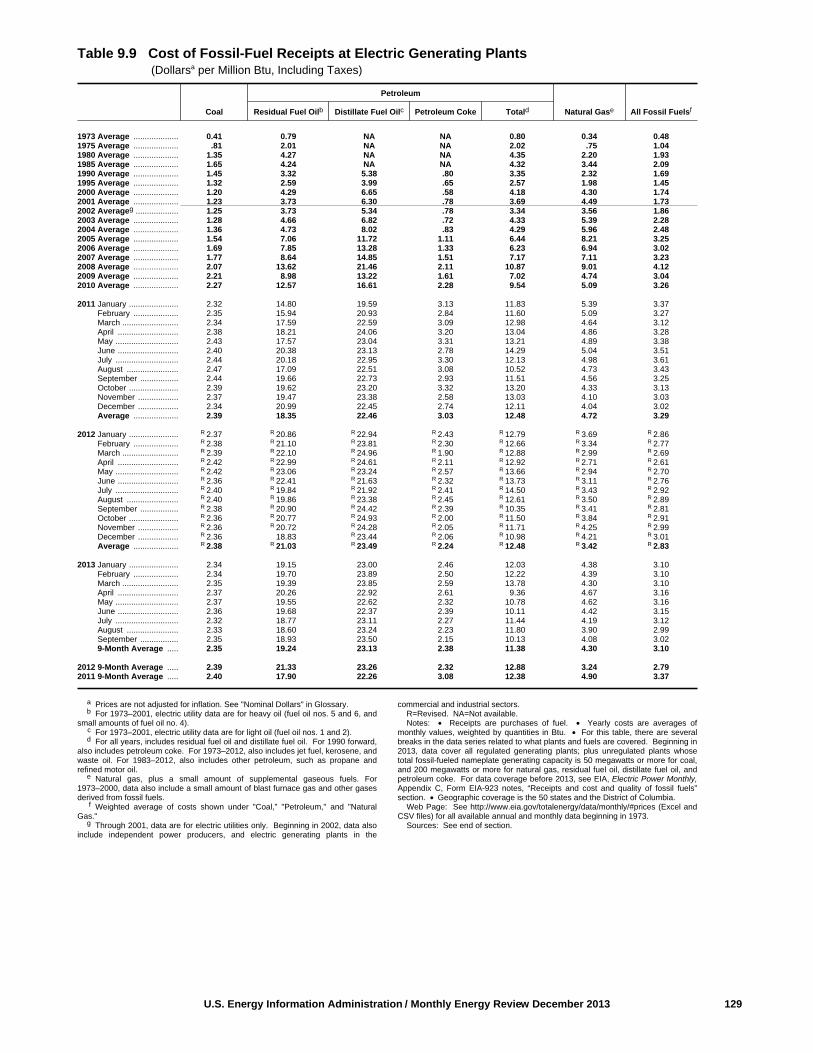
U.S. Energy Information Administration / Monthly Energy Review December 2013 129
Table 9.9 Cost of Fossil-Fuel Receipts at Electric Generating Plants (Dollarsa per Million Btu, Including Taxes)
Coal
Petroleum
Natural Gase All Fossil FuelsfResidual Fuel Oilb Distillate Fuel Oilc Petroleum Coke Totald
1973 Average .................... 0.41 0.79 NA NA 0.80 0.34 0.481975 Average .................... .81 2.01 NA NA 2.02 .75 1.041980 Average .................... 1.35 4.27 NA NA 4.35 2.20 1.931985 Average .................... 1.65 4.24 NA NA 4.32 3.44 2.091990 Average .................... 1.45 3.32 5.38 .80 3.35 2.32 1.691995 Average .................... 1.32 2.59 3.99 .65 2.57 1.98 1.452000 Average .................... 1.20 4.29 6.65 .58 4.18 4.30 1.742001 Average .................... 1.23 3.73 6.30 .78 3.69 4.49 1.732002 Averageg ................... 1.25 3.73 5.34 .78 3.34 3.56 1.862003 Average .................... 1.28 4.66 6.82 .72 4.33 5.39 2.282004 Average .................... 1.36 4.73 8.02 .83 4.29 5.96 2.482005 Average .................... 1.54 7.06 11.72 1.11 6.44 8.21 3.252006 Average .................... 1.69 7.85 13.28 1.33 6.23 6.94 3.022007 Average .................... 1.77 8.64 14.85 1.51 7.17 7.11 3.232008 Average .................... 2.07 13.62 21.46 2.11 10.87 9.01 4.122009 Average .................... 2.21 8.98 13.22 1.61 7.02 4.74 3.042010 Average .................... 2.27 12.57 16.61 2.28 9.54 5.09 3.26
2011 January ...................... 2.32 14.80 19.59 3.13 11.83 5.39 3.37 February .................... 2.35 15.94 20.93 2.84 11.60 5.09 3.27 March ......................... 2.34 17.59 22.59 3.09 12.98 4.64 3.12 April ........................... 2.38 18.21 24.06 3.20 13.04 4.86 3.28 May ............................ 2.43 17.57 23.04 3.31 13.21 4.89 3.38 June ........................... 2.40 20.38 23.13 2.78 14.29 5.04 3.51 July ............................ 2.44 20.18 22.95 3.30 12.13 4.98 3.61 August ....................... 2.47 17.09 22.51 3.08 10.52 4.73 3.43 September ................. 2.44 19.66 22.73 2.93 11.51 4.56 3.25 October ...................... 2.39 19.62 23.20 3.32 13.20 4.33 3.13 November .................. 2.37 19.47 23.38 2.58 13.03 4.10 3.03 December .................. 2.34 20.99 22.45 2.74 12.11 4.04 3.02 Average .................... 2.39 18.35 22.46 3.03 12.48 4.72 3.29
2012 January ...................... R 2.37 R 20.86 R 22.94 R 2.43 R 12.79 R 3.69 R 2.86 February .................... R 2.38 R 21.10 R 23.81 R 2.30 R 12.66 R 3.34 R 2.77 March ......................... R 2.39 R 22.10 R 24.96 R 1.90 R 12.88 R 2.99 R 2.69 April ........................... R 2.42 R 22.99 R 24.61 R 2.11 R 12.92 R 2.71 R 2.61 May ............................ R 2.42 R 23.06 R 23.24 R 2.57 R 13.66 R 2.94 R 2.70 June ........................... R 2.36 R 22.41 R 21.63 R 2.32 R 13.73 R 3.11 R 2.76 July ............................ R 2.40 R 19.84 R 21.92 R 2.41 R 14.50 R 3.43 R 2.92 August ....................... R 2.40 R 19.86 R 23.38 R 2.45 R 12.61 R 3.50 R 2.89 September ................. R 2.38 R 20.90 R 24.42 R 2.39 R 10.35 R 3.41 R 2.81 October ...................... R 2.36 R 20.77 R 24.93 R 2.00 R 11.50 R 3.84 R 2.91 November .................. R 2.36 R 20.72 R 24.28 R 2.05 R 11.71 R 4.25 R 2.99 December .................. R 2.36 18.83 R 23.44 R 2.06 R 10.98 R 4.21 R 3.01 Average .................... R 2.38 R 21.03 R 23.49 R 2.24 R 12.48 R 3.42 R 2.83
2013 January ...................... 2.34 19.15 23.00 2.46 12.03 4.38 3.10 February .................... 2.34 19.70 23.89 2.50 12.22 4.39 3.10 March ......................... 2.35 19.39 23.85 2.59 13.78 4.30 3.10 April ........................... 2.37 20.26 22.92 2.61 9.36 4.67 3.16 May ............................ 2.37 19.55 22.62 2.32 10.78 4.62 3.16 June ........................... 2.36 19.68 22.37 2.39 10.11 4.42 3.15 July ............................ 2.32 18.77 23.11 2.27 11.44 4.19 3.12 August ....................... 2.33 18.60 23.24 2.23 11.80 3.90 2.99 September ................. 2.35 18.93 23.50 2.15 10.13 4.08 3.02 9-Month Average ..... 2.35 19.24 23.13 2.38 11.38 4.30 3.10
2012 9-Month Average ..... 2.39 21.33 23.26 2.32 12.88 3.24 2.792011 9-Month Average ..... 2.40 17.90 22.26 3.08 12.38 4.90 3.37
a Prices are not adjusted for inflation. See "Nominal Dollars" in Glossary.b For 1973–2001, electric utility data are for heavy oil (fuel oil nos. 5 and 6, and
small amounts of fuel oil no. 4).c For 1973–2001, electric utility data are for light oil (fuel oil nos. 1 and 2).d For all years, includes residual fuel oil and distillate fuel oil. For 1990 forward,
also includes petroleum coke. For 1973–2012, also includes jet fuel, kerosene, andwaste oil. For 1983–2012, also includes other petroleum, such as propane andrefined motor oil.
e Natural gas, plus a small amount of supplemental gaseous fuels. For1973–2000, data also include a small amount of blast furnace gas and other gasesderived from fossil fuels.
f Weighted average of costs shown under "Coal," "Petroleum," and "NaturalGas."
g Through 2001, data are for electric utilities only. Beginning in 2002, data alsoinclude independent power producers, and electric generating plants in the
commercial and industrial sectors.R=Revised. NA=Not available. Notes: • Receipts are purchases of fuel. • Yearly costs are averages of
monthly values, weighted by quantities in Btu. • For this table, there are severalbreaks in the data series related to what plants and fuels are covered. Beginning in2013, data cover all regulated generating plants; plus unregulated plants whosetotal fossil-fueled nameplate generating capacity is 50 megawatts or more for coal,and 200 megawatts or more for natural gas, residual fuel oil, distillate fuel oil, andpetroleum coke. For data coverage before 2013, see EIA, Electric Power Monthly,Appendix C, Form EIA-923 notes, “Receipts and cost and quality of fossil fuels”section. • Geographic coverage is the 50 states and the District of Columbia.
Web Page: See http://www.eia.gov/totalenergy/data/monthly/#prices (Excel andCSV files) for all available annual and monthly data beginning in 1973.
Sources: See end of section.

Figure 9.4 Natural Gas Prices(Dollarsa per Thousand Cubic Feet)
Wellhead and Citygate, 1949–2012
Consuming Sectors, 1967–2012
Consuming Sectors, Monthly
130 U.S. Energy Information Administration / Monthly Energy Review December 2013
Citygate
Wellhead
Commercialb
Residentialb
Electric PowerbTransportation
Residentialb
Industrialb
Commercialb
Electric Powerb
a Prices are not adjusted for inflation. See “Nominal Dollars” in Glossary.b Includes taxes.
Web Page: http://www.eia.gov/totalenergy/data/monthly/#prices.Source: Table 9.10.
1950 1955 1960 1965 1970 1975 1980 1985 1990 1995 2000 2005 20100
2
4
6
8
10
1970 1975 1980 1985 1990 1995 2000 2005 20100
2
4
6
8
10
12
14
Industrialb
J F M A M J J A S O N D J F M A M J J A S O N D J F M A M J J A S O N D0
5
10
15
20
2011 2012 2013
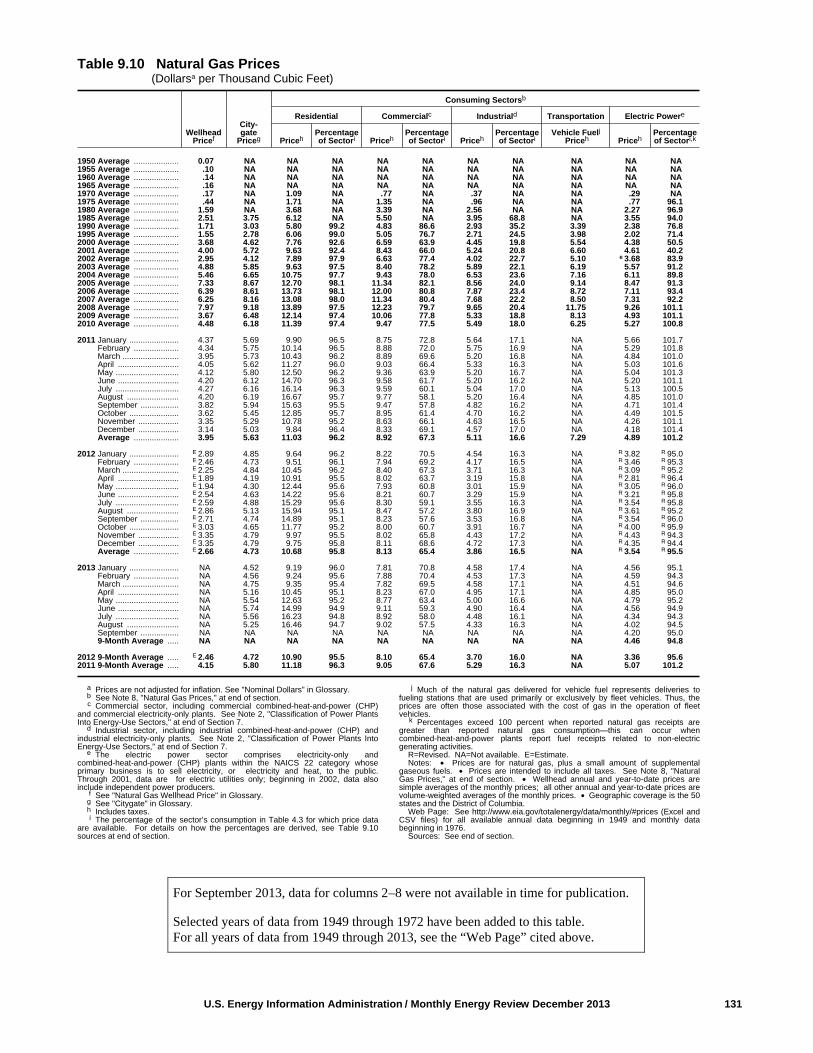
U.S. Energy Information Administration / Monthly Energy Review December 2013 131
Table 9.10 Natural Gas Prices (Dollarsa per Thousand Cubic Feet)
WellheadPricef
City-gate
Priceg
Consuming Sectorsb
Residential Commercialc Industriald Transportation Electric Powere
PricehPercentageof Sectori Priceh
Percentageof Sectori Priceh
Percentageof Sectori
Vehicle Fuelj Priceh Priceh
Percentageof Sectori,k
1950 Average .................... 0.07 NA NA NA NA NA NA NA NA NA NA1955 Average .................... .10 NA NA NA NA NA NA NA NA NA NA1960 Average .................... .14 NA NA NA NA NA NA NA NA NA NA1965 Average .................... .16 NA NA NA NA NA NA NA NA NA NA1970 Average .................... .17 NA 1.09 NA .77 NA .37 NA NA .29 NA1975 Average .................... .44 NA 1.71 NA 1.35 NA .96 NA NA .77 96.11980 Average .................... 1.59 NA 3.68 NA 3.39 NA 2.56 NA NA 2.27 96.91985 Average .................... 2.51 3.75 6.12 NA 5.50 NA 3.95 68.8 NA 3.55 94.01990 Average .................... 1.71 3.03 5.80 99.2 4.83 86.6 2.93 35.2 3.39 2.38 76.81995 Average .................... 1.55 2.78 6.06 99.0 5.05 76.7 2.71 24.5 3.98 2.02 71.42000 Average .................... 3.68 4.62 7.76 92.6 6.59 63.9 4.45 19.8 5.54 4.38 50.52001 Average .................... 4.00 5.72 9.63 92.4 8.43 66.0 5.24 20.8 6.60 4.61 40.22002 Average .................... 2.95 4.12 7.89 97.9 6.63 77.4 4.02 22.7 5.10 e 3.68 83.92003 Average .................... 4.88 5.85 9.63 97.5 8.40 78.2 5.89 22.1 6.19 5.57 91.22004 Average .................... 5.46 6.65 10.75 97.7 9.43 78.0 6.53 23.6 7.16 6.11 89.82005 Average .................... 7.33 8.67 12.70 98.1 11.34 82.1 8.56 24.0 9.14 8.47 91.32006 Average .................... 6.39 8.61 13.73 98.1 12.00 80.8 7.87 23.4 8.72 7.11 93.42007 Average .................... 6.25 8.16 13.08 98.0 11.34 80.4 7.68 22.2 8.50 7.31 92.22008 Average .................... 7.97 9.18 13.89 97.5 12.23 79.7 9.65 20.4 11.75 9.26 101.12009 Average .................... 3.67 6.48 12.14 97.4 10.06 77.8 5.33 18.8 8.13 4.93 101.12010 Average .................... 4.48 6.18 11.39 97.4 9.47 77.5 5.49 18.0 6.25 5.27 100.8
2011 January ...................... 4.37 5.69 9.90 96.5 8.75 72.8 5.64 17.1 NA 5.66 101.7 February .................... 4.34 5.75 10.14 96.5 8.88 72.0 5.75 16.9 NA 5.29 101.8 March ......................... 3.95 5.73 10.43 96.2 8.89 69.6 5.20 16.8 NA 4.84 101.0 April ........................... 4.05 5.62 11.27 96.0 9.03 66.4 5.33 16.3 NA 5.03 101.6 May ............................ 4.12 5.80 12.50 96.2 9.36 63.9 5.20 16.7 NA 5.04 101.3 June ........................... 4.20 6.12 14.70 96.3 9.58 61.7 5.20 16.2 NA 5.20 101.1 July ............................ 4.27 6.16 16.14 96.3 9.59 60.1 5.04 17.0 NA 5.13 100.5 August ....................... 4.20 6.19 16.67 95.7 9.77 58.1 5.20 16.4 NA 4.85 101.0 September ................. 3.82 5.94 15.63 95.5 9.47 57.8 4.82 16.2 NA 4.71 101.4 October ...................... 3.62 5.45 12.85 95.7 8.95 61.4 4.70 16.2 NA 4.49 101.5 November .................. 3.35 5.29 10.78 95.2 8.63 66.1 4.63 16.5 NA 4.26 101.1 December .................. 3.14 5.03 9.84 96.4 8.33 69.1 4.57 17.0 NA 4.18 101.4 Average .................... 3.95 5.63 11.03 96.2 8.92 67.3 5.11 16.6 7.29 4.89 101.2
2012 January ...................... E 2.89 4.85 9.64 96.2 8.22 70.5 4.54 16.3 NA R 3.82 R 95.0 February .................... E 2.46 4.73 9.51 96.1 7.94 69.2 4.17 16.5 NA R 3.46 R 95.3 March ......................... E 2.25 4.84 10.45 96.2 8.40 67.3 3.71 16.3 NA R 3.09 R 95.2 April ........................... E 1.89 4.19 10.91 95.5 8.02 63.7 3.19 15.8 NA R 2.81 R 96.4 May ............................ E 1.94 4.30 12.44 95.6 7.93 60.8 3.01 15.9 NA R 3.05 R 96.0 June ........................... E 2.54 4.63 14.22 95.6 8.21 60.7 3.29 15.9 NA R 3.21 R 95.8 July ............................ E 2.59 4.88 15.29 95.6 8.30 59.1 3.55 16.3 NA R 3.54 R 95.8 August ....................... E 2.86 5.13 15.94 95.1 8.47 57.2 3.80 16.9 NA R 3.61 R 95.2 September ................. E 2.71 4.74 14.89 95.1 8.23 57.6 3.53 16.8 NA R 3.54 R 96.0 October ...................... E 3.03 4.65 11.77 95.2 8.00 60.7 3.91 16.7 NA R 4.00 R 95.9 November .................. E 3.35 4.79 9.97 95.5 8.02 65.8 4.43 17.2 NA R 4.43 R 94.3 December .................. E 3.35 4.79 9.75 95.8 8.11 68.6 4.72 17.3 NA R 4.35 R 94.4 Average .................... E 2.66 4.73 10.68 95.8 8.13 65.4 3.86 16.5 NA R 3.54 R 95.5
2013 January ...................... NA 4.52 9.19 96.0 7.81 70.8 4.58 17.4 NA 4.56 95.1 February .................... NA 4.56 9.24 95.6 7.88 70.4 4.53 17.3 NA 4.59 94.3 March ......................... NA 4.75 9.35 95.4 7.82 69.5 4.58 17.1 NA 4.51 94.6 April ........................... NA 5.16 10.45 95.1 8.23 67.0 4.95 17.1 NA 4.85 95.0 May ............................ NA 5.54 12.63 95.2 8.77 63.4 5.00 16.6 NA 4.79 95.2 June ........................... NA 5.74 14.99 94.9 9.11 59.3 4.90 16.4 NA 4.56 94.9 July ............................ NA 5.56 16.23 94.8 8.92 58.0 4.48 16.1 NA 4.34 94.3 August ....................... NA 5.25 16.46 94.7 9.02 57.5 4.33 16.3 NA 4.02 94.5 September ................. NA NA NA NA NA NA NA NA NA 4.20 95.0 9-Month Average ..... NA NA NA NA NA NA NA NA NA 4.46 94.8
2012 9-Month Average ..... E 2.46 4.72 10.90 95.5 8.10 65.4 3.70 16.0 NA 3.36 95.62011 9-Month Average ..... 4.15 5.80 11.18 96.3 9.05 67.6 5.29 16.3 NA 5.07 101.2
a Prices are not adjusted for inflation. See "Nominal Dollars" in Glossary.b See Note 8, "Natural Gas Prices," at end of section.c Commercial sector, including commercial combined-heat-and-power (CHP)
and commercial electricity-only plants. See Note 2, "Classification of Power PlantsInto Energy-Use Sectors," at end of Section 7.
d Industrial sector, including industrial combined-heat-and-power (CHP) andindustrial electricity-only plants. See Note 2, "Classification of Power Plants IntoEnergy-Use Sectors," at end of Section 7.
e The electric power sector comprises electricity-only andcombined-heat-and-power (CHP) plants within the NAICS 22 category whoseprimary business is to sell electricity, or electricity and heat, to the public.Through 2001, data are for electric utilities only; beginning in 2002, data alsoinclude independent power producers.
f See "Natural Gas Wellhead Price" in Glossary.g See "Citygate" in Glossary.h Includes taxes.i The percentage of the sector’s consumption in Table 4.3 for which price data
are available. For details on how the percentages are derived, see Table 9.10sources at end of section.
j Much of the natural gas delivered for vehicle fuel represents deliveries tofueling stations that are used primarily or exclusively by fleet vehicles. Thus, theprices are often those associated with the cost of gas in the operation of fleetvehicles.
k Percentages exceed 100 percent when reported natural gas receipts aregreater than reported natural gas consumption—this can occur whencombined-heat-and-power plants report fuel receipts related to non-electricgenerating activities.
R=Revised. NA=Not available. E=Estimate. Notes: • Prices are for natural gas, plus a small amount of supplemental
gaseous fuels. • Prices are intended to include all taxes. See Note 8, "NaturalGas Prices," at end of section. • Wellhead annual and year-to-date prices aresimple averages of the monthly prices; all other annual and year-to-date prices arevolume-weighted averages of the monthly prices. • Geographic coverage is the 50states and the District of Columbia.
Web Page: See http://www.eia.gov/totalenergy/data/monthly/#prices (Excel andCSV files) for all available annual data beginning in 1949 and monthly databeginning in 1976.
Sources: See end of section.
For September 2013, data for columns 2–8 were not available in time for publication.
Selected years of data from 1949 through 1972 have been added to this table.For all years of data from 1949 through 2013, see the “Web Page” cited above.
Energy Prices Note 1. Crude Oil Refinery Acquisition Costs. Begin-ning with January 1981, refiner acquisition costs of crudeoil are from data collected on U.S. Energy InformationAdministration (EIA) Form EIA-14, “Refiners’ MonthlyCost Report.” Those costs were previously published fromdata collected on Economic Regulatory Administration(ERA) Form ERA-49, “Domestic Crude Oil EntitlementsProgram Refiners Monthly Report.” Form ERA-49 wasdiscontinued with the decontrol of crude oil on January 28,1981. Crude oil purchases and costs are defined for FormEIA-14 in accordance with conventions used for FormERA-49. The respondents for the two forms are also essen-tially the same. However, due to possible different interpre-tations of the filing requirements and a different method forhandling prior period adjustments, care must be taken whencomparing the data collected on the two forms.
The refiner acquisition cost of crude oil is the averageprice paid by refiners for crude oil booked into their refin-eries in accordance with accounting procedures generallyaccepted and consistently and historically applied by therefiners concerned. Domestic crude oil is that oil producedin the United States or from the outer continental shelf asdefined in 43 USC Section 1331. Imported crude oil iseither that oil reported on Form ERA-51, “Transfer PricingReport,” or any crude oil that is not domestic oil. Thecomposite cost is the weighted average of domestic andimported crude oil costs.
Crude oil costs and volumes reported on Form ERA-49excluded unfinished oils but included the Strategic Petro-leum Reserve (SPR). Crude oil costs and volumes reportedon Federal Energy Administration (FEA) Form FEA-P110-M-1, “Refiners’ Monthly Cost Allocation Report,” includedunfinished oils but excluded SPR. Imported averagesderived from Form ERA-49 exclude oil purchased for SPR,whereas the composite averages derived from Form ERA-49include SPR. None of the prices derived from Form EIA-14include either unfinished oils or SPR.
Note 2. Crude Oil Domestic First Purchase Prices. Theaverage domestic first purchase price represents the averageprice at which all domestic crude oil is purchased. Crude oildomestic first purchase prices were derived as follows: for1949–1973, weighted average domestic first purchasevalues as reported by state agencies and calculated by theBureau of Mines; for 1974 and 1975, weighted averages ofa sample survey of major first purchasers’ purchases; for1976 forward, weighted averages of all first purchasers’purchases. The data series was previously called “ActualDomestic Wellhead Price.”
Note 3. Crude Oil F.O.B. Costs. F.O.B. literally means“Free on Board.” It denotes a transaction whereby the sellermakes the product available with an agreement on a givenport at a given price; it is the responsibility of the buyer toarrange for the transportation and insurance.
Note 4. Crude Oil Landed Costs. The landed cost ofimported crude oil from selected countries does not repre-sent the total cost of all imported crude. Prior to April 1975,imported crude costs to U.S. company-owned refineries inthe Caribbean were not included in the landed cost, andcosts of crude oil from countries that export only smallamounts to the United States were also excluded. Beginningin April 1975, however, coverage was expanded to includeU.S. company-owned refineries in the Caribbean. Landedcosts do not include supplemental fees.
Note 5. Motor Gasoline Prices. Several different series ofmotor gasoline prices are published in this section. U.S. cityaverage retail prices of motor gasoline by grade are calcu-lated monthly by the Bureau of Labor Statistics during thedevelopment of the Consumer Price Index (CPI). Theseprices include all federal, state, and local taxes paid at thetime of sale. Prior to 1977, prices were collected in 56 urbanareas. From 1978 forward, prices are collected from a newsample of service stations in 85 urban areas selected torepresent all urban consumers—about 80 percent of the totalU.S. population. The service stations are selected initially,and on a replacement basis, in such a way that they repre-sent the purchasing habits of the CPI population. Servicestations in the current sample include those providing alltypes of service (i.e., full-, mini-, and self-serve).
Regular motor gasoline prices by area type are determinedby EIA in a weekly survey of retail motor gasoline outlets(Form EIA-878, “Motor Gasoline Price Survey”). Pricesinclude all federal, state, and local taxes paid at the time ofsale. A representative sample of outlets by geographic areaand size is randomly selected from a sampling frame ofapproximately 115,000 retail motor gasoline outlets.Monthly and annual prices are simple averages of weightedweekly estimates from "Weekly U.S. Retail Gasoline Prices,Regular Grade." For more information on the survey meth-odology, see EIA, Weekly Petroleum Status Report, Appen-dix B, “Weekly Petroleum Price Surveys” section.
Refiner prices of finished motor gasoline for resale and toend users are determined by EIA in a monthly survey ofrefiners and gas plant operators (Form EIA-782A). Theprices do not include any federal, state, or local taxes paid atthe time of sale. Estimates of prices prior to January 1983are based on Form FEA-P302-M-1/EIA-460, “PetroleumIndustry Monthly Report for Product Prices,” and alsoexclude all federal, state, or local taxes paid at the time ofsale. Sales for resale are those made to purchasers who areother-than-ultimate consumers. Sales to end users are salesmade directly to the consumer of the product, including bulkconsumers (such as agriculture, industry, and utilities) andresidential and commercial consumers.
Note 6. Historical Petroleum Prices. Starting in January1983, Form EIA-782, “Monthly Petroleum Product SalesReport,” replaced 10 previous surveys. Every attempt wasmade to continue the most important price series. However,prices published through December 1982 and those
132 U.S. Energy Information Administration / Monthly Energy Review December 2013
published since January 1983 do not necessarily formcontinuous data series due to changes in survey forms, defi-nitions, instructions, populations, samples, processingsystems, and statistical procedures. To provide historicaldata, continuous series were generated for annual data1978–1982 and for monthly data 1981 and 1982 by estimat-ing the prices that would have been published had FormEIA-782 survey and system been in operation at that time.This form of estimation was performed after detailed adjust-ment was made for product and sales type matching and fordiscontinuity due to other factors. An important differencebetween the previous and present prices is the distinctionbetween wholesale and resale and between retail and enduser. The resale category continues to include sales amongresellers. However, sales to bulk consumers, such as utility,industrial, and commercial accounts previously included inthe wholesale category, are now counted as made to endusers. The end-user category continues to include retailsales through company-owned and operated outlets butalso includes sales to the bulk consumers such as agricul-ture, industry, and electric utilities. Additional informa-tion may be found in “Estimated Historic Time Series forthe EIA-782,” a feature article by Paula Weir, printed inthe December 1983 [3] Petroleum Marketing Monthly,published by EIA.
Note 7. Electricity Retail Prices. Average annual retailprices of electricity have the following plant coverage:Through 1979, annual data are for Classes A and Bprivately owned electric utilities only. For 1980–1982,annual data are for selected Class A utilities whose electricoperating revenues were $100 million or more during theprevious year. For 1983, annual data are for a selectedsample of electric utilities. Beginning in 1984, data are fora census of electric utilities. Beginning in 1996, annualdata also include energy service providers selling to retailcustomers.
Average monthly retail prices of electricity have thefollowing plant coverage: Through 1985, monthly data arederived from selected privately owned electric utilitiesand, therefore, are not national averages. Beginning in1986, monthly data are based on a sample of publicly andprivately owned electric utilities. Beginning in 1996,monthly data also include energy service providers sellingto retail customers.
Preliminary monthly data are from Form EIA-826,"Monthly Electric Sales and Revenue Report With StateDistributions Report," which is a monthly collection ofdata from approximately 450 of the largest publicly andprivately owned electric utilities as well as a census ofenergy service providers with retail sales in deregulatedstates; a model is then applied to the collected data to esti-mate for the entire universe of U.S. electric utilities.Preliminary annual data are the sum of the monthly reve-nues divided by the sum of the monthly sales. When finalannual data become available each year from Form EIA-861, "Annual Electric Power Industry Report," their ratios
to the preliminary Form EIA-826 values are used to deriveadjusted final monthly values.
Note 8. Natural Gas Prices. Natural gas prices areintended to include all taxes. Instructions on the datacollection forms specifically direct that all federal, state,and local taxes, surcharges, and/or adjustments billed toconsumers are to be included. However, sales and othertaxes itemized on more than 3,000 consumers’ bills aresometimes excluded by the reporting utilities. Delivered-to-consumers prices for 1987 forward represent naturalgas delivered and sold to residential, commercial, indus-trial, vehicle fuel, and electric power consumers. They donot include the price of natural gas delivered on behalf ofthird parties to residential, commercial, industrial, and vehiclefuel customers except for certain states in the residential andcommercial sectors for 2002 forward. Volumes of natural gasdelivered on behalf of third parties are included in theconsumption data shown in Table 4.3. Additional informationis available in EIA, Natural Gas Monthly, Appendix C.
Table 9.1 Sources
Domestic First Purchase Price 1949–1976: U.S. Department of the Interior (DOI), Bureauof Mines (BOM), Minerals Yearbook, “Crude Petroleum andPetroleum Products” chapter.1977: Federal Energy Administration, based on Form FEA-P124, “Domestic Crude Oil Purchaser’s Monthly Report.”1978–2009: U.S. Energy Information Administration (EIA),Petroleum Marketing Annual 2009, Table 1.2010 forward: EIA, Petroleum Marketing Monthly, Decem-ber 2013, Table 1.
F.O.B. and Landed Cost of Imports October 1973–September 1977: Federal Energy Administra-tion, Form FEA-F701-M-0, “Transfer Pricing Report.”October–December 1977: EIA, Form FEA-F701-M-0,“Transfer Pricing Report.”1978–2009: EIA, Petroleum Marketing Annual 2009, Table1.2010 forward: EIA, Petroleum Marketing Monthly, Decem-ber 2013, Table 1.
Refiner Acquisition Cost1968–1973: EIA estimates. The cost of domestic crude oilwas derived by adding estimated transportation costs to thereported average domestic first purchase price. The cost ofimported crude oil was derived by adding an estimated oceantransport cost based on the published "Average Freight RateAssessment" to the average "Free Alongside Ship" valuepublished by the U.S. Bureau of the Census.1974–1976: DOI, BOM, Minerals Yearbook, “Crude Petro-leum and Petroleum Products” chapter.1977: January–September, FEA, based on Form FEA-P110-M-1, “Refiners’ Monthly Cost Allocation Report.”October–December, EIA, based on Form FEA-P110-M-1,“Refiners’ Monthly Cost Allocation Report.”
U.S. Energy Information Administration / Monthly Energy Review December 2013 133
1978–2007: EIA, Petroleum Marketing Annual 2007, Table1. 2008 forward: EIA, Petroleum Marketing Monthly, Decem-ber 2013, Table 1.
Table 9.2 Sources
October 1973–September 1977: Federal Energy Admin-istration, Form FEA-F701-M-0, “Transfer Pricing Report.”October 1977–December 1977: U.S. Energy InformationAdministration (EIA), Form FEA-F701-M-0, “TransferPricing Report.”1978–2007: EIA, Petroleum Marketing Annual 2007, Table21.2008 forward: EIA, Petroleum Marketing Monthly, Decem-ber 2013, Table 21.
Table 9.9 Sources
1973–September 1977: Federal Power Commission, FormFPC-423, “Monthly Report of Cost and Quality of Fuels forElectric Utility Plants.”October 1977–December 1977: Federal Energy RegulatoryCommission, Form FERC-423, “Monthly Report of Costand Quality of Fuels for Electric Utility Plants.”1978 and 1979: U.S. Energy Information Administration(EIA), Form FERC-423, “Monthly Report of Cost andQuality of Fuels for Electric Utility Plants.”1980–1989: EIA, Electric Power Monthly, May issues. 1990–2000: EIA, Electric Power Monthly, March 2003,Table 26.2001–2007: EIA, Electric Power Monthly, October 2008,Table 4.1; Federal Energy Regulatory Commission, FormFERC-423, “Monthly Report of Cost and Quality of Fuelsfor Electric Utility Plants”; and EIA, Form EIA-423,“Monthly Cost and Quality of Fuels for Electric PlantsReport.”2008 forward: EIA, Electric Power Monthly, November2013, Table 4.1; and Form EIA-923, ”Power Plant Opera-tions Report.”
Table 9.10 Sources
All Prices Except Vehicle Fuel and Electric Power1949–2006: U.S. Energy Information Administration (EIA),Natural Gas Annual (NGA), annual reports and unpublishedrevisions. 2007 forward: EIA, Natural Gas Monthly (NGM), Octo-ber 2013, Table 3.
Vehicle Fuel Price1989 forward: EIA, NGA, annual reports.
Electric Power Sector Price1967–1972: EIA, NGA, annual reports. 1973–1998: EIA, NGA 2000, Table 96.1999–2002: EIA, NGM, October 2004, Table 4. 2003–2007: Federal Energy Regulatory Commission, FormFERC-423, “Monthly Report of Cost and Quality of Fuels forElectric Utility Plants,” and EIA, Form EIA-423 “MonthlyCost and Quality of Fuels for Electric Plants Report.”2008 forward: Form EIA-923, ”Power Plant OperationsReport.”
Percentage of Residential Sector1989–2011: EIA, Form EIA-176, “Annual Report of Natu-ral and Supplemental Gas Supply and Disposition.”2012 and 2013: EIA, Form EIA-857, “Monthly Report ofNatural Gas Purchases and Deliveries to Consumers.”
Percentage of Commercial Sector1987–2006: EIA, NGA, annual reports. Calculated as thetotal amount of natural gas delivered to commercialconsumers minus the amount delivered for the account ofothers, and then divided by the total amount delivered tocommercial consumers.2007 forward: EIA, NGM, October 2013, Table 3.
Percentage of Industrial Sector1982–2006: EIA, NGA, annual reports. Calculated as thetotal amount of natural gas delivered to industrial consumersminus the amount delivered for the account of others, and thendivided by the total amount delivered to industrial consumers.2007 forward: EIA, NGM, October 2013, Table 3.
Percentage of Electric Power Sector1973–2001: Calculated by EIA as the quantity of naturalgas receipts by electric utilities reported on Form FERC-423,"Monthly Report of Cost and Quality of Fuels for Electric Util-ity Plants" (and predecessor forms) divided by the quantity ofnatural gas consumed by the electric power sector (for 1973–1988, see Monthly Energy Review (MER), Table 7.3b; for1989–2001, see MER, Table 7.4b).2002–2007: Calculated by EIA as the quantity of naturalgas receipts by electric utilities and independent powerproducers reported on Form FERC-423, "Monthly Reportof Cost and Quality of Fuels for Electric Utility Plants,"and EIA-423, “Monthly Cost and Quality of Fuels forElectric Plants Report,” divided by the quantity of naturalgas consumed by the electric power sector (see MER,Table 7.4b).2008 forward: Calculated by EIA as the quantity of natu-ral gas receipts by electric utilities and independent powerproducers reported on Form EIA-923, “Power Plant Opera-tions Report,” divided by the quantity of natural gasconsumed by the electric power sector (see MER, Table7.4b).
134 U.S. Energy Information Administration / Monthly Energy Review December 2013

10. Renewable Energy
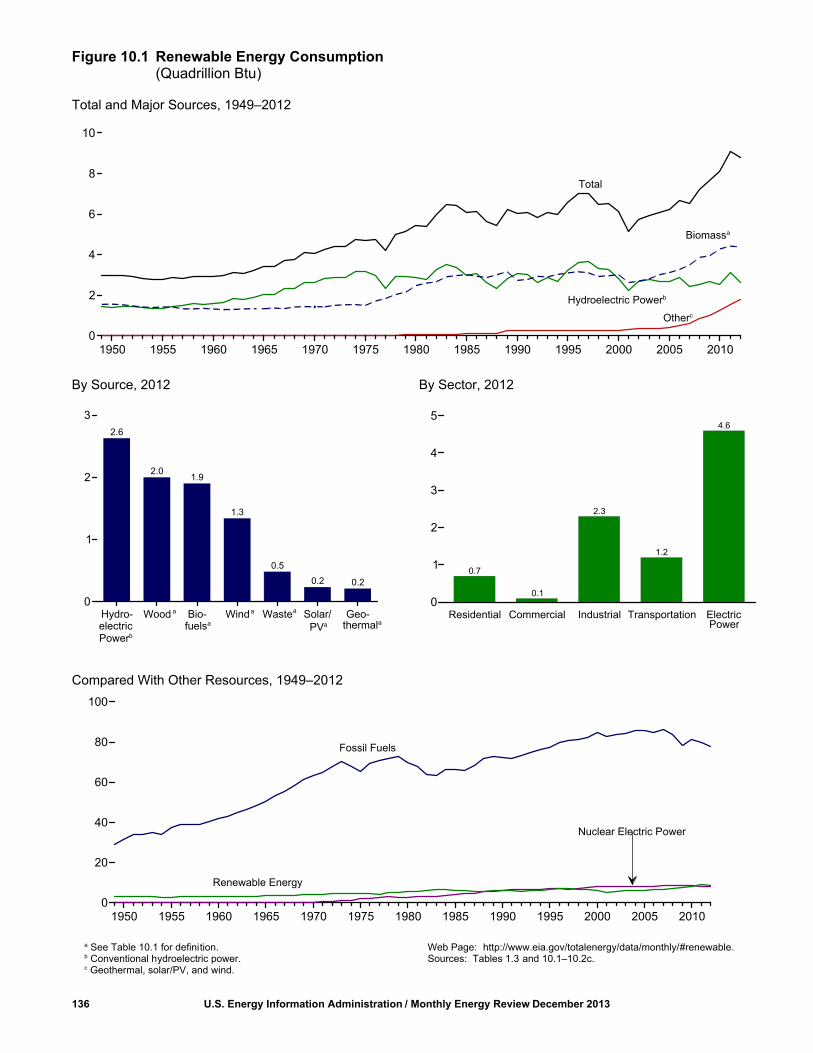
Figure 10.1 Renewable Energy Consumption(Quadrillion Btu)
Total and Major Sources, 1949–2012
By Source, 2012 By Sector, 2012
Compared With Other Resources, 1949–2012
136 U.S. Energy Information Administration / Monthly Energy Review December 2013
Total
Hydroelectric Powerb
Otherc
Renewable Energy
a See Table 10.1 for definition.b Conventional hydroelectric power.c Geothermal, solar/PV, and wind.
Web Page: http://www.eia.gov/totalenergy/data/monthly/#renewable.Sources: Tables 1.3 and 10.1–10.2c.
Powerfuelsa
Fossil Fuels
Biomassa
Nuclear Electric Power
1950 1955 1960 1965 1970 1975 1980 1985 1990 1995 2000 2005 20100
2
4
6
8
10
2.6
2.01.9
1.3
0.5
0.2 0.2
Hydro- Wood Bio- Wind Waste Solar/ Geo-0
1
2
3
0.7
0.1
2.3
1.2
4.6
Residential Commercial Industrial Transportation Electric 0
1
2
3
4
5
PVa
a aa
thermalaelectricPowerb
1950 1955 1960 1965 1970 1975 1980 1985 1990 1995 2000 2005 20100
20
40
60
80
100
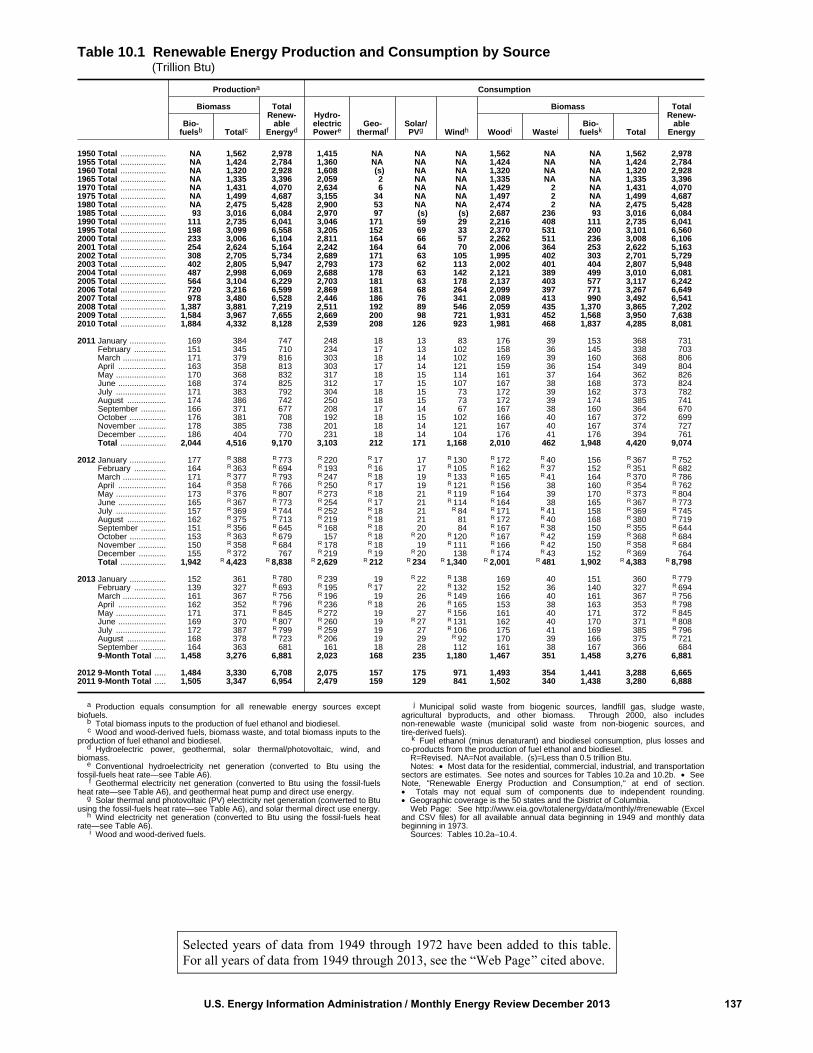
U.S. Energy Information Administration / Monthly Energy Review December 2013 137
Table 10.1 Renewable Energy Production and Consumption by Source (Trillion Btu)
Productiona Consumption
Biomass TotalRenew-
ableEnergyd
Hydro-electricPowere
Geo-thermalf
Solar/PVg Windh
Biomass TotalRenew-
ableEnergy
Bio-fuelsb Totalc Woodi Wastej
Bio-fuelsk Total
1950 Total .................... NA 1,562 2,978 1,415 NA NA NA 1,562 NA NA 1,562 2,9781955 Total .................... NA 1,424 2,784 1,360 NA NA NA 1,424 NA NA 1,424 2,7841960 Total .................... NA 1,320 2,928 1,608 (s) NA NA 1,320 NA NA 1,320 2,9281965 Total .................... NA 1,335 3,396 2,059 2 NA NA 1,335 NA NA 1,335 3,3961970 Total .................... NA 1,431 4,070 2,634 6 NA NA 1,429 2 NA 1,431 4,0701975 Total .................... NA 1,499 4,687 3,155 34 NA NA 1,497 2 NA 1,499 4,6871980 Total .................... NA 2,475 5,428 2,900 53 NA NA 2,474 2 NA 2,475 5,4281985 Total .................... 93 3,016 6,084 2,970 97 (s) (s) 2,687 236 93 3,016 6,0841990 Total .................... 111 2,735 6,041 3,046 171 59 29 2,216 408 111 2,735 6,0411995 Total .................... 198 3,099 6,558 3,205 152 69 33 2,370 531 200 3,101 6,5602000 Total .................... 233 3,006 6,104 2,811 164 66 57 2,262 511 236 3,008 6,1062001 Total .................... 254 2,624 5,164 2,242 164 64 70 2,006 364 253 2,622 5,1632002 Total .................... 308 2,705 5,734 2,689 171 63 105 1,995 402 303 2,701 5,7292003 Total .................... 402 2,805 5,947 2,793 173 62 113 2,002 401 404 2,807 5,9482004 Total .................... 487 2,998 6,069 2,688 178 63 142 2,121 389 499 3,010 6,0812005 Total .................... 564 3,104 6,229 2,703 181 63 178 2,137 403 577 3,117 6,2422006 Total .................... 720 3,216 6,599 2,869 181 68 264 2,099 397 771 3,267 6,6492007 Total .................... 978 3,480 6,528 2,446 186 76 341 2,089 413 990 3,492 6,5412008 Total .................... 1,387 3,881 7,219 2,511 192 89 546 2,059 435 1,370 3,865 7,2022009 Total .................... 1,584 3,967 7,655 2,669 200 98 721 1,931 452 1,568 3,950 7,6382010 Total .................... 1,884 4,332 8,128 2,539 208 126 923 1,981 468 1,837 4,285 8,081
2011 January ................ 169 384 747 248 18 13 83 176 39 153 368 731 February .............. 151 345 710 234 17 13 102 158 36 145 338 703 March ................... 171 379 816 303 18 14 102 169 39 160 368 806 April ..................... 163 358 813 303 17 14 121 159 36 154 349 804 May ...................... 170 368 832 317 18 15 114 161 37 164 362 826 June ..................... 168 374 825 312 17 15 107 167 38 168 373 824 July ...................... 171 383 792 304 18 15 73 172 39 162 373 782 August ................. 174 386 742 250 18 15 73 172 39 174 385 741 September ........... 166 371 677 208 17 14 67 167 38 160 364 670 October ................ 176 381 708 192 18 15 102 166 40 167 372 699 November ............ 178 385 738 201 18 14 121 167 40 167 374 727 December ............ 186 404 770 231 18 14 104 176 41 176 394 761 Total .................... 2,044 4,516 9,170 3,103 212 171 1,168 2,010 462 1,948 4,420 9,074
2012 January ................ 177 R 388 R 773 R 220 R 17 17 R 130 R 172 R 40 156 R 367 R 752 February .............. 164 R 363 R 694 R 193 R 16 17 R 105 R 162 R 37 152 R 351 R 682 March ................... 171 R 377 R 793 R 247 R 18 19 R 133 R 165 R 41 164 R 370 R 786 April ..................... 164 R 358 R 766 R 250 R 17 19 R 121 R 156 38 160 R 354 R 762 May ...................... 173 R 376 R 807 R 273 R 18 21 R 119 R 164 39 170 R 373 R 804 June ..................... 165 R 367 R 773 R 254 R 17 21 R 114 R 164 38 165 R 367 R 773 July ...................... 157 R 369 R 744 R 252 R 18 21 R 84 R 171 R 41 158 R 369 R 745 August ................. 162 R 375 R 713 R 219 R 18 21 81 R 172 R 40 168 R 380 R 719 September ........... 151 R 356 R 645 R 168 R 18 20 84 R 167 R 38 150 R 355 R 644 October ................ 153 R 363 R 679 157 R 18 R 20 R 120 R 167 R 42 159 R 368 R 684 November ............ 150 R 358 R 684 R 178 R 18 19 R 111 R 166 R 42 150 R 358 R 684 December ............ 155 R 372 767 R 219 R 19 R 20 138 R 174 R 43 152 R 369 764 Total .................... 1,942 R 4,423 R 8,838 R 2,629 R 212 R 234 R 1,340 R 2,001 R 481 1,902 R 4,383 R 8,798
2013 January ................ 152 361 R 780 R 239 19 R 22 R 138 169 40 151 360 R 779 February .............. 139 327 R 693 R 195 R 17 22 R 132 152 36 140 327 R 694 March ................... 161 367 R 756 R 196 19 26 R 149 166 40 161 367 R 756 April ..................... 162 352 R 796 R 236 R 18 26 R 165 153 38 163 353 R 798 May ...................... 171 371 R 845 R 272 19 27 R 156 161 40 171 372 R 845 June ..................... 169 370 R 807 R 260 19 R 27 R 131 162 40 170 371 R 808 July ...................... 172 387 R 799 R 259 19 27 R 106 175 41 169 385 R 796 August ................. 168 378 R 723 R 206 19 29 R 92 170 39 166 375 R 721 September ........... 164 363 681 161 18 28 112 161 38 167 366 684 9-Month Total ..... 1,458 3,276 6,881 2,023 168 235 1,180 1,467 351 1,458 3,276 6,881
2012 9-Month Total ..... 1,484 3,330 6,708 2,075 157 175 971 1,493 354 1,441 3,288 6,6652011 9-Month Total ..... 1,505 3,347 6,954 2,479 159 129 841 1,502 340 1,438 3,280 6,888
a Production equals consumption for all renewable energy sources exceptbiofuels.
b Total biomass inputs to the production of fuel ethanol and biodiesel.c Wood and wood-derived fuels, biomass waste, and total biomass inputs to the
production of fuel ethanol and biodiesel.d Hydroelectric power, geothermal, solar thermal/photovoltaic, wind, and
biomass.e Conventional hydroelectricity net generation (converted to Btu using the
fossil-fuels heat rate—see Table A6).f Geothermal electricity net generation (converted to Btu using the fossil-fuels
heat rate—see Table A6), and geothermal heat pump and direct use energy.g Solar thermal and photovoltaic (PV) electricity net generation (converted to Btu
using the fossil-fuels heat rate—see Table A6), and solar thermal direct use energy.h Wind electricity net generation (converted to Btu using the fossil-fuels heat
rate—see Table A6).i Wood and wood-derived fuels.
j Municipal solid waste from biogenic sources, landfill gas, sludge waste,agricultural byproducts, and other biomass. Through 2000, also includesnon-renewable waste (municipal solid waste from non-biogenic sources, andtire-derived fuels).
k Fuel ethanol (minus denaturant) and biodiesel consumption, plus losses andco-products from the production of fuel ethanol and biodiesel.
R=Revised. NA=Not available. (s)=Less than 0.5 trillion Btu.Notes: • Most data for the residential, commercial, industrial, and transportation
sectors are estimates. See notes and sources for Tables 10.2a and 10.2b. • SeeNote, "Renewable Energy Production and Consumption," at end of section.• Totals may not equal sum of components due to independent rounding.• Geographic coverage is the 50 states and the District of Columbia.
Web Page: See http://www.eia.gov/totalenergy/data/monthly/#renewable (Exceland CSV files) for all available annual data beginning in 1949 and monthly databeginning in 1973.
Sources: Tables 10.2a–10.4.
Selected years of data from 1949 through 1972 have been added to this table.For all years of data from 1949 through 2013, see the “Web Page” cited above.
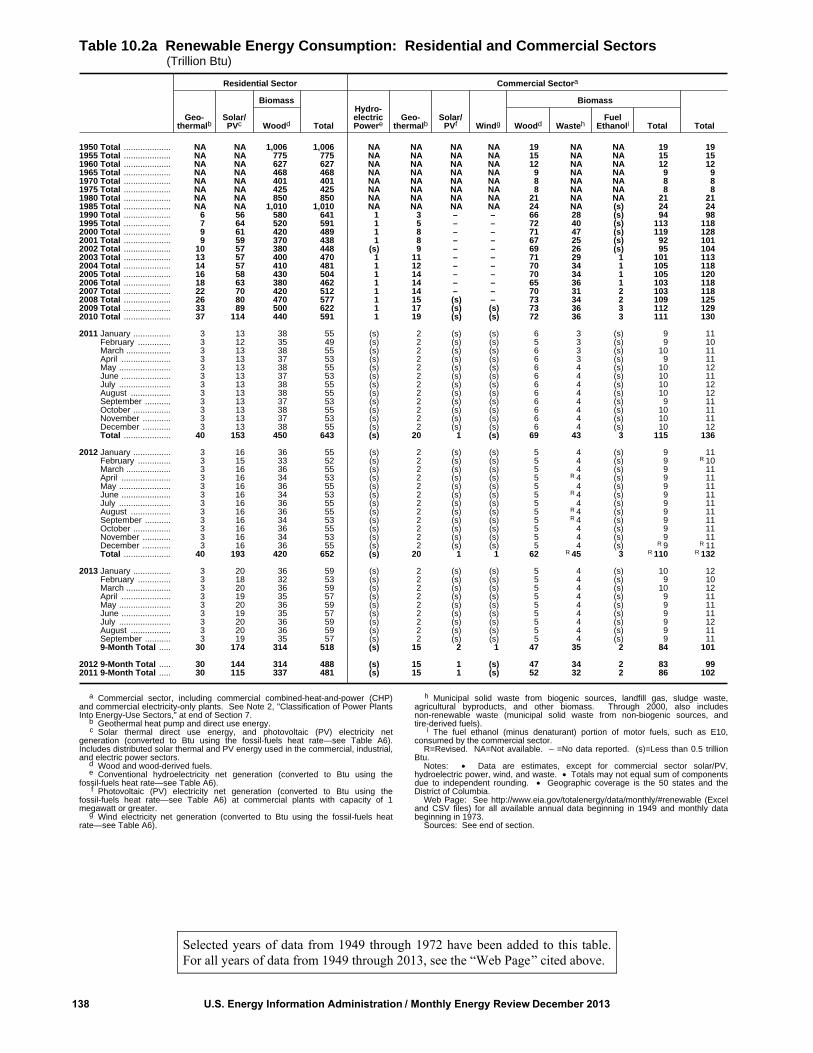
138 U.S. Energy Information Administration / Monthly Energy Review December 2013
Table 10.2a Renewable Energy Consumption: Residential and Commercial Sectors (Trillion Btu)
Residential Sector Commercial Sectora
Geo-thermalb
Solar/PVc
Biomass
Total
Hydro-electricPowere
Geo-thermalb
Solar/PVf Windg
Biomass
TotalWoodd Woodd WastehFuel
Ethanoli Total
1950 Total .................... NA NA 1,006 1,006 NA NA NA NA 19 NA NA 19 191955 Total .................... NA NA 775 775 NA NA NA NA 15 NA NA 15 151960 Total .................... NA NA 627 627 NA NA NA NA 12 NA NA 12 121965 Total .................... NA NA 468 468 NA NA NA NA 9 NA NA 9 91970 Total .................... NA NA 401 401 NA NA NA NA 8 NA NA 8 81975 Total .................... NA NA 425 425 NA NA NA NA 8 NA NA 8 81980 Total .................... NA NA 850 850 NA NA NA NA 21 NA NA 21 211985 Total .................... NA NA 1,010 1,010 NA NA NA NA 24 NA (s) 24 241990 Total .................... 6 56 580 641 1 3 – – 66 28 (s) 94 981995 Total .................... 7 64 520 591 1 5 – – 72 40 (s) 113 1182000 Total .................... 9 61 420 489 1 8 – – 71 47 (s) 119 1282001 Total .................... 9 59 370 438 1 8 – – 67 25 (s) 92 1012002 Total .................... 10 57 380 448 (s) 9 – – 69 26 (s) 95 1042003 Total .................... 13 57 400 470 1 11 – – 71 29 1 101 1132004 Total .................... 14 57 410 481 1 12 – – 70 34 1 105 1182005 Total .................... 16 58 430 504 1 14 – – 70 34 1 105 1202006 Total .................... 18 63 380 462 1 14 – – 65 36 1 103 1182007 Total .................... 22 70 420 512 1 14 – – 70 31 2 103 1182008 Total .................... 26 80 470 577 1 15 (s) – 73 34 2 109 1252009 Total .................... 33 89 500 622 1 17 (s) (s) 73 36 3 112 1292010 Total .................... 37 114 440 591 1 19 (s) (s) 72 36 3 111 130
2011 January ................ 3 13 38 55 (s) 2 (s) (s) 6 3 (s) 9 11 February .............. 3 12 35 49 (s) 2 (s) (s) 5 3 (s) 9 10 March ................... 3 13 38 55 (s) 2 (s) (s) 6 3 (s) 10 11 April ..................... 3 13 37 53 (s) 2 (s) (s) 6 3 (s) 9 11 May ...................... 3 13 38 55 (s) 2 (s) (s) 6 4 (s) 10 12 June ..................... 3 13 37 53 (s) 2 (s) (s) 6 4 (s) 10 11 July ...................... 3 13 38 55 (s) 2 (s) (s) 6 4 (s) 10 12 August ................. 3 13 38 55 (s) 2 (s) (s) 6 4 (s) 10 12 September ........... 3 13 37 53 (s) 2 (s) (s) 6 4 (s) 9 11 October ................ 3 13 38 55 (s) 2 (s) (s) 6 4 (s) 10 11 November ............ 3 13 37 53 (s) 2 (s) (s) 6 4 (s) 10 11 December ............ 3 13 38 55 (s) 2 (s) (s) 6 4 (s) 10 12 Total .................... 40 153 450 643 (s) 20 1 (s) 69 43 3 115 136
2012 January ................ 3 16 36 55 (s) 2 (s) (s) 5 4 (s) 9 11 February .............. 3 15 33 52 (s) 2 (s) (s) 5 4 (s) 9 R 10 March ................... 3 16 36 55 (s) 2 (s) (s) 5 4 (s) 9 11 April ..................... 3 16 34 53 (s) 2 (s) (s) 5 R 4 (s) 9 11 May ...................... 3 16 36 55 (s) 2 (s) (s) 5 4 (s) 9 11 June ..................... 3 16 34 53 (s) 2 (s) (s) 5 R 4 (s) 9 11 July ...................... 3 16 36 55 (s) 2 (s) (s) 5 4 (s) 9 11 August ................. 3 16 36 55 (s) 2 (s) (s) 5 R 4 (s) 9 11 September ........... 3 16 34 53 (s) 2 (s) (s) 5 R 4 (s) 9 11 October ................ 3 16 36 55 (s) 2 (s) (s) 5 4 (s) 9 11 November ............ 3 16 34 53 (s) 2 (s) (s) 5 4 (s) 9 11 December ............ 3 16 36 55 (s) 2 (s) (s) 5 4 (s) R 9 R 11 Total .................... 40 193 420 652 (s) 20 1 1 62 R 45 3 R 110 R 132
2013 January ................ 3 20 36 59 (s) 2 (s) (s) 5 4 (s) 10 12 February .............. 3 18 32 53 (s) 2 (s) (s) 5 4 (s) 9 10 March ................... 3 20 36 59 (s) 2 (s) (s) 5 4 (s) 10 12 April ..................... 3 19 35 57 (s) 2 (s) (s) 5 4 (s) 9 11 May ...................... 3 20 36 59 (s) 2 (s) (s) 5 4 (s) 9 11 June ..................... 3 19 35 57 (s) 2 (s) (s) 5 4 (s) 9 11 July ...................... 3 20 36 59 (s) 2 (s) (s) 5 4 (s) 9 12 August ................. 3 20 36 59 (s) 2 (s) (s) 5 4 (s) 9 11 September ........... 3 19 35 57 (s) 2 (s) (s) 5 4 (s) 9 11 9-Month Total ..... 30 174 314 518 (s) 15 2 1 47 35 2 84 101
2012 9-Month Total ..... 30 144 314 488 (s) 15 1 (s) 47 34 2 83 992011 9-Month Total ..... 30 115 337 481 (s) 15 1 (s) 52 32 2 86 102
a Commercial sector, including commercial combined-heat-and-power (CHP)and commercial electricity-only plants. See Note 2, "Classification of Power PlantsInto Energy-Use Sectors," at end of Section 7.
b Geothermal heat pump and direct use energy.c Solar thermal direct use energy, and photovoltaic (PV) electricity net
generation (converted to Btu using the fossil-fuels heat rate—see Table A6).Includes distributed solar thermal and PV energy used in the commercial, industrial,and electric power sectors.
d Wood and wood-derived fuels.e Conventional hydroelectricity net generation (converted to Btu using the
fossil-fuels heat rate—see Table A6).f Photovoltaic (PV) electricity net generation (converted to Btu using the
fossil-fuels heat rate—see Table A6) at commercial plants with capacity of 1megawatt or greater.
g Wind electricity net generation (converted to Btu using the fossil-fuels heatrate—see Table A6).
h Municipal solid waste from biogenic sources, landfill gas, sludge waste,agricultural byproducts, and other biomass. Through 2000, also includesnon-renewable waste (municipal solid waste from non-biogenic sources, andtire-derived fuels).
i The fuel ethanol (minus denaturant) portion of motor fuels, such as E10,consumed by the commercial sector.
R=Revised. NA=Not available. – =No data reported. (s)=Less than 0.5 trillionBtu.
Notes: • Data are estimates, except for commercial sector solar/PV,hydroelectric power, wind, and waste. • Totals may not equal sum of componentsdue to independent rounding. • Geographic coverage is the 50 states and theDistrict of Columbia.
Web Page: See http://www.eia.gov/totalenergy/data/monthly/#renewable (Exceland CSV files) for all available annual data beginning in 1949 and monthly databeginning in 1973.
Sources: See end of section.
Selected years of data from 1949 through 1972 have been added to this table.For all years of data from 1949 through 2013, see the “Web Page” cited above.
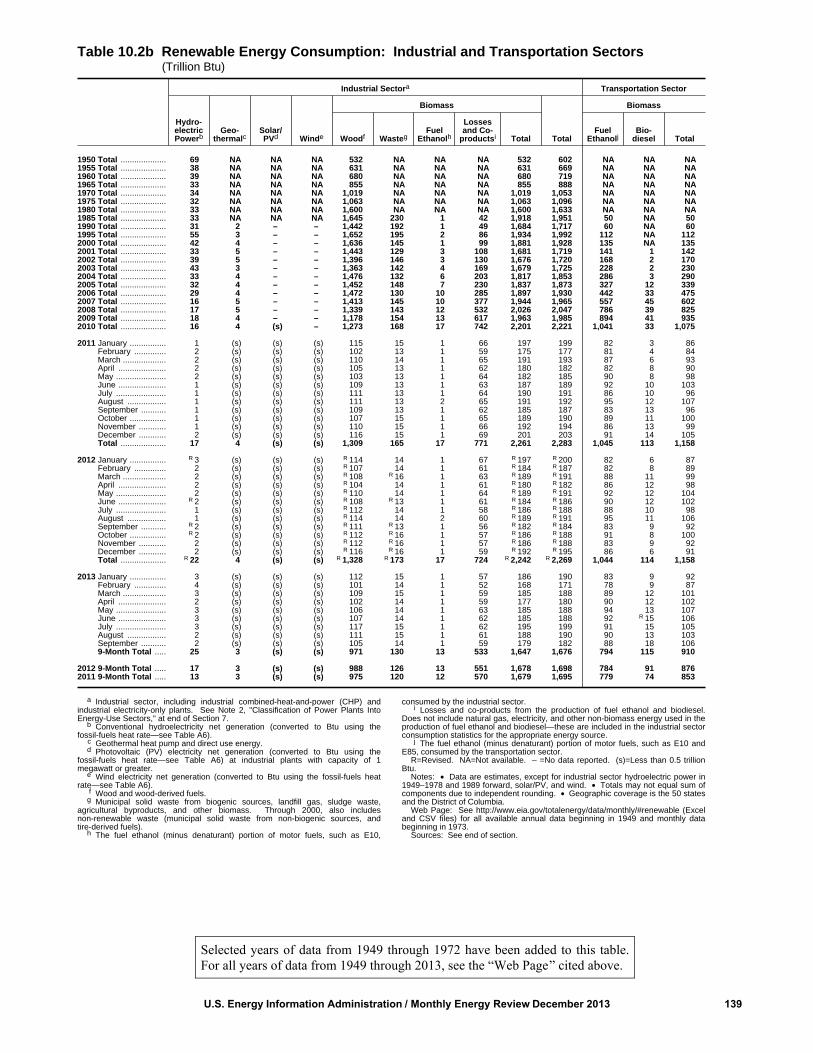
U.S. Energy Information Administration / Monthly Energy Review December 2013 139
Selected years of data from 1949 through 1972 have been added to this table.For all years of data from 1949 through 2013, see the “Web Page” cited above.
Table 10.2b Renewable Energy Consumption: Industrial and Transportation Sectors (Trillion Btu)
Industrial Sectora Transportation Sector
Hydro-electricPowerb
Geo-thermalc
Solar/PVd Winde
Biomass
Total
Biomass
Woodf WastegFuel
Ethanolh
Lossesand Co-
productsi TotalFuel
EthanoljBio-
diesel Total
1950 Total .................... 69 NA NA NA 532 NA NA NA 532 602 NA NA NA1955 Total .................... 38 NA NA NA 631 NA NA NA 631 669 NA NA NA1960 Total .................... 39 NA NA NA 680 NA NA NA 680 719 NA NA NA1965 Total .................... 33 NA NA NA 855 NA NA NA 855 888 NA NA NA1970 Total .................... 34 NA NA NA 1,019 NA NA NA 1,019 1,053 NA NA NA1975 Total .................... 32 NA NA NA 1,063 NA NA NA 1,063 1,096 NA NA NA1980 Total .................... 33 NA NA NA 1,600 NA NA NA 1,600 1,633 NA NA NA1985 Total .................... 33 NA NA NA 1,645 230 1 42 1,918 1,951 50 NA 501990 Total .................... 31 2 – – 1,442 192 1 49 1,684 1,717 60 NA 601995 Total .................... 55 3 – – 1,652 195 2 86 1,934 1,992 112 NA 1122000 Total .................... 42 4 – – 1,636 145 1 99 1,881 1,928 135 NA 1352001 Total .................... 33 5 – – 1,443 129 3 108 1,681 1,719 141 1 1422002 Total .................... 39 5 – – 1,396 146 3 130 1,676 1,720 168 2 1702003 Total .................... 43 3 – – 1,363 142 4 169 1,679 1,725 228 2 2302004 Total .................... 33 4 – – 1,476 132 6 203 1,817 1,853 286 3 2902005 Total .................... 32 4 – – 1,452 148 7 230 1,837 1,873 327 12 3392006 Total .................... 29 4 – – 1,472 130 10 285 1,897 1,930 442 33 4752007 Total .................... 16 5 – – 1,413 145 10 377 1,944 1,965 557 45 6022008 Total .................... 17 5 – – 1,339 143 12 532 2,026 2,047 786 39 8252009 Total .................... 18 4 – – 1,178 154 13 617 1,963 1,985 894 41 9352010 Total .................... 16 4 (s) – 1,273 168 17 742 2,201 2,221 1,041 33 1,075
2011 January ................ 1 (s) (s) (s) 115 15 1 66 197 199 82 3 86 February .............. 2 (s) (s) (s) 102 13 1 59 175 177 81 4 84 March ................... 2 (s) (s) (s) 110 14 1 65 191 193 87 6 93 April ..................... 2 (s) (s) (s) 105 13 1 62 180 182 82 8 90 May ...................... 2 (s) (s) (s) 103 13 1 64 182 185 90 8 98 June ..................... 1 (s) (s) (s) 109 13 1 63 187 189 92 10 103 July ...................... 1 (s) (s) (s) 111 13 1 64 190 191 86 10 96 August ................. 1 (s) (s) (s) 111 13 2 65 191 192 95 12 107 September ........... 1 (s) (s) (s) 109 13 1 62 185 187 83 13 96 October ................ 1 (s) (s) (s) 107 15 1 65 189 190 89 11 100 November ............ 1 (s) (s) (s) 110 15 1 66 192 194 86 13 99 December ............ 2 (s) (s) (s) 116 15 1 69 201 203 91 14 105 Total .................... 17 4 (s) (s) 1,309 165 17 771 2,261 2,283 1,045 113 1,158
2012 January ................ R 3 (s) (s) (s) R 114 14 1 67 R 197 R 200 82 6 87 February .............. 2 (s) (s) (s) R 107 14 1 61 R 184 R 187 82 8 89 March ................... 2 (s) (s) (s) R 108 R 16 1 63 R 189 R 191 88 11 99 April ..................... 2 (s) (s) (s) R 104 14 1 61 R 180 R 182 86 12 98 May ...................... 2 (s) (s) (s) R 110 14 1 64 R 189 R 191 92 12 104 June ..................... R 2 (s) (s) (s) R 108 R 13 1 61 R 184 R 186 90 12 102 July ...................... 1 (s) (s) (s) R 112 14 1 58 R 186 R 188 88 10 98 August ................. 1 (s) (s) (s) R 114 14 2 60 R 189 R 191 95 11 106 September ........... R 2 (s) (s) (s) R 111 R 13 1 56 R 182 R 184 83 9 92 October ................ R 2 (s) (s) (s) R 112 R 16 1 57 R 186 R 188 91 8 100 November ............ 2 (s) (s) (s) R 112 R 16 1 57 R 186 R 188 83 9 92 December ............ 2 (s) (s) (s) R 116 R 16 1 59 R 192 R 195 86 6 91 Total .................... R 22 4 (s) (s) R 1,328 R 173 17 724 R 2,242 R 2,269 1,044 114 1,158
2013 January ................ 3 (s) (s) (s) 112 15 1 57 186 190 83 9 92 February .............. 4 (s) (s) (s) 101 14 1 52 168 171 78 9 87 March ................... 3 (s) (s) (s) 109 15 1 59 185 188 89 12 101 April ..................... 2 (s) (s) (s) 102 14 1 59 177 180 90 12 102 May ...................... 3 (s) (s) (s) 106 14 1 63 185 188 94 13 107 June ..................... 3 (s) (s) (s) 107 14 1 62 185 188 92 R 15 106 July ...................... 3 (s) (s) (s) 117 15 1 62 195 199 91 15 105 August ................. 2 (s) (s) (s) 111 15 1 61 188 190 90 13 103 September ........... 2 (s) (s) (s) 105 14 1 59 179 182 88 18 106 9-Month Total ..... 25 3 (s) (s) 971 130 13 533 1,647 1,676 794 115 910
2012 9-Month Total ..... 17 3 (s) (s) 988 126 13 551 1,678 1,698 784 91 8762011 9-Month Total ..... 13 3 (s) (s) 975 120 12 570 1,679 1,695 779 74 853
a Industrial sector, including industrial combined-heat-and-power (CHP) andindustrial electricity-only plants. See Note 2, "Classification of Power Plants IntoEnergy-Use Sectors," at end of Section 7.
b Conventional hydroelectricity net generation (converted to Btu using thefossil-fuels heat rate—see Table A6).
c Geothermal heat pump and direct use energy.d Photovoltaic (PV) electricity net generation (converted to Btu using the
fossil-fuels heat rate—see Table A6) at industrial plants with capacity of 1megawatt or greater.
e Wind electricity net generation (converted to Btu using the fossil-fuels heatrate—see Table A6).
f Wood and wood-derived fuels.g Municipal solid waste from biogenic sources, landfill gas, sludge waste,
agricultural byproducts, and other biomass. Through 2000, also includesnon-renewable waste (municipal solid waste from non-biogenic sources, andtire-derived fuels).
h The fuel ethanol (minus denaturant) portion of motor fuels, such as E10,
consumed by the industrial sector.i Losses and co-products from the production of fuel ethanol and biodiesel.
Does not include natural gas, electricity, and other non-biomass energy used in theproduction of fuel ethanol and biodiesel—these are included in the industrial sectorconsumption statistics for the appropriate energy source.
j The fuel ethanol (minus denaturant) portion of motor fuels, such as E10 andE85, consumed by the transportation sector.
R=Revised. NA=Not available. – =No data reported. (s)=Less than 0.5 trillionBtu.
Notes: • Data are estimates, except for industrial sector hydroelectric power in1949–1978 and 1989 forward, solar/PV, and wind. • Totals may not equal sum ofcomponents due to independent rounding. • Geographic coverage is the 50 statesand the District of Columbia.
Web Page: See http://www.eia.gov/totalenergy/data/monthly/#renewable (Exceland CSV files) for all available annual data beginning in 1949 and monthly databeginning in 1973.
Sources: See end of section.

140 U.S. Energy Information Administration / Monthly Energy Review December 2013
Table 10.2c Renewable Energy Consumption: Electric Power Sector (Trillion Btu)
Hydro-electricPowera
Geo-thermalb Solar/PVc Windd
Biomass
TotalWoode Wastef Total
1950 Total .................... 1,346 NA NA NA 5 NA 5 1,3511955 Total .................... 1,322 NA NA NA 3 NA 3 1,3251960 Total .................... 1,569 (s) NA NA 2 NA 2 1,5711965 Total .................... 2,026 2 NA NA 3 NA 3 2,0311970 Total .................... 2,600 6 NA NA 1 2 4 2,6091975 Total .................... 3,122 34 NA NA (s) 2 2 3,1581980 Total .................... 2,867 53 NA NA 3 2 4 2,9251985 Total .................... 2,937 97 (s) (s) 8 7 14 3,0491990 Totalg .................. 3,014 161 4 29 129 188 317 3,5241995 Total .................... 3,149 138 5 33 125 296 422 3,7472000 Total .................... 2,768 144 5 57 134 318 453 3,4272001 Total .................... 2,209 142 6 70 126 211 337 2,7632002 Total .................... 2,650 147 6 105 150 230 380 3,2882003 Total .................... 2,749 146 5 113 167 230 397 3,4112004 Total .................... 2,655 148 6 142 165 223 388 3,3392005 Total .................... 2,670 147 6 178 185 221 406 3,4062006 Total .................... 2,839 145 5 264 182 231 412 3,6652007 Total .................... 2,430 145 6 341 186 237 423 3,3452008 Total .................... 2,494 146 9 546 177 258 435 3,6302009 Total .................... 2,650 146 9 721 180 261 441 3,9672010 Total .................... 2,521 148 12 923 196 264 459 4,064
2011 January ................ 247 13 (s) 83 17 21 37 381 February .............. 233 12 1 102 16 19 35 382 March ................... 301 13 1 102 15 21 36 453 April ..................... 301 12 2 121 12 20 32 467 May ...................... 315 13 2 114 13 21 34 477 June ..................... 311 12 2 107 16 22 37 469 July ...................... 303 12 2 73 17 22 39 429 August ................. 249 12 2 73 17 22 39 376 September ........... 207 12 2 67 15 21 37 323 October ................ 191 12 1 102 14 22 36 343 November ............ 199 12 1 121 14 22 36 369 December ............ 229 13 1 103 16 23 39 385 Total .................... 3,085 149 17 1,167 182 255 437 4,855
2012 January ................ R 217 R 12 1 R 130 R 17 R 22 R 39 R 398 February .............. R 191 R 11 1 R 105 R 16 R 20 R 36 R 344 March ................... R 244 R 12 2 R 133 R 16 R 22 R 37 R 429 April ..................... R 248 R 12 3 R 121 R 13 R 21 R 33 R 417 May ...................... R 271 R 12 R 4 R 119 R 14 22 R 36 R 442 June ..................... R 252 R 12 5 R 114 R 16 R 22 R 38 R 421 July ...................... R 251 R 13 5 R 84 R 18 R 23 R 40 R 392 August ................. R 218 R 12 4 R 81 R 18 R 23 R 40 R 355 September ........... R 166 R 12 4 84 R 16 R 21 R 38 R 304 October ................ R 155 R 13 4 R 120 R 15 R 22 R 38 330 November ............ R 176 R 13 3 R 111 15 R 23 R 38 R 341 December ............ R 217 R 13 R 3 138 16 R 24 R 40 R 412 Total .................... R 2,606 R 148 R 40 R 1,339 R 190 R 262 R 453 R 4,586
2013 January ................ R 236 14 3 R 138 16 21 37 R 427 February .............. R 191 13 4 R 132 14 18 32 R 373 March ................... R 193 14 6 R 149 15 21 37 R 397 April ..................... R 233 13 6 R 165 11 20 31 R 448 May ...................... R 269 R 13 7 R 156 14 21 35 R 480 June ..................... R 257 14 8 R 131 15 21 36 R 446 July ...................... R 256 14 7 R 106 17 22 39 R 422 August ................. R 204 14 9 R 91 18 21 39 R 357 September ........... 158 13 9 111 16 20 37 328 9-Month Total ..... 1,997 120 59 1,179 135 187 322 3,677
2012 9-Month Total ..... 2,058 109 29 970 144 194 337 3,5042011 9-Month Total ..... 2,466 111 13 841 138 188 326 3,757
a Conventional hydroelectricity net generation (converted to Btu using thefossil-fuels heat rate—see Table A6).
b Geothermal electricity net generation (converted to Btu using the fossil-fuelsheat rate—see Table A6).
c Solar thermal and photovoltaic (PV) electricity net generation (converted to Btuusing the fossil-fuels heat rate—see Table A6).
d Wind electricity net generation (converted to Btu using the fossil-fuels heatrate—see Table A6).
e Wood and wood-derived fuels.f Municipal solid waste from biogenic sources, landfill gas, sludge waste,
agricultural byproducts, and other biomass. Through 2000, also includesnon-renewable waste (municipal solid waste from non-biogenic sources, andtire-derived fuels).
g Through 1988, data are for electric utilities only. Beginning in 1989, data arefor electric utilities and independent power producers.
R=Revised. NA=Not available. (s)=Less than 0.5 trillion Btu.Notes: • The electric power sector comprises electricity-only and
combined-heat-and-power (CHP) plants within the NAICS 22 category whoseprimary business is to sell electricity, or electricity and heat, to the public. • Totalsmay not equal sum of components due to independent rounding. • Geographiccoverage is the 50 states and the District of Columbia.
Web Page: See http://www.eia.gov/totalenergy/data/monthly/#renewable (Exceland CSV files) for all available annual data beginning in 1949 and monthly databeginning in 1973.
Sources: Tables 7.2b, 7.4b, and A6.
Selected years of data from 1949 through 1972 have been added to this table.For all years of data from 1949 through 2013, see the “Web Page” cited above.

U.S. Energy Information Administration / Monthly Energy Review December 2013 141
Table 10.3 Fuel Ethanol Overview
Feed-stocka
Lossesand Co-
productsbDena-turantc Productiond
Traded
Stocksd,fStock
Changed,g Consumptiond
Consump-tion
MinusDenaturanth
NetImportse
TBtu TBtu Mbbl Mbbl MMgal TBtu Mbbl Mbbl Mbbl Mbbl MMgal TBtu TBtu
1981 Total .................. 13 6 40 1,978 83 7 NA NA NA 1,978 83 7 71985 Total .................. 93 42 294 14,693 617 52 NA NA NA 14,693 617 52 511990 Total .................. 111 49 356 17,802 748 63 NA NA NA 17,802 748 63 621995 Total .................. 198 86 647 32,325 1,358 115 387 2,186 -207 32,919 1,383 117 1142000 Total .................. 233 99 773 38,627 1,622 138 116 3,400 -624 39,367 1,653 140 1372001 Total .................. 253 108 841 42,028 1,765 150 315 4,298 898 41,445 1,741 148 1442002 Total .................. 307 130 1,019 50,956 2,140 182 306 6,200 1,902 49,360 2,073 176 1712003 Total .................. 400 169 1,335 66,772 2,804 238 292 5,978 -222 67,286 2,826 240 2332004 Total .................. 484 203 1,621 81,058 3,404 289 3,542 6,002 24 84,576 3,552 301 2932005 Total .................. 552 230 1,859 92,961 3,904 331 3,234 5,563 -439 96,634 4,059 344 3352006 Total .................. 688 285 2,326 116,294 4,884 414 17,408 8,760 3,197 130,505 5,481 465 4532007 Total .................. 914 376 3,105 155,263 6,521 553 10,457 10,535 1,775 163,945 6,886 584 5692008 Total .................. 1,300 531 4,433 221,637 9,309 790 12,610 14,226 3,691 230,556 9,683 821 8002009 Total .................. 1,517 616 5,688 260,424 10,938 928 4,720 16,594 2,368 262,776 11,037 936 9102010 Total .................. 1,839 742 6,506 316,617 13,298 1,127 -9,115 17,941 1,347 306,155 12,858 1,090 1,061
2011 January .............. 165 66 581 28,467 1,196 101 -1,359 20,826 2,885 24,223 1,017 86 84 February ............ 146 59 535 25,300 1,063 90 -1,425 21,016 190 23,685 995 84 82 March ................. 163 65 548 28,178 1,183 100 -2,003 21,593 577 25,598 1,075 91 89 April ................... 154 62 508 26,538 1,115 94 -2,865 21,065 -528 24,201 1,016 86 84 May .................... 160 64 550 27,720 1,164 99 -1,743 20,609 -456 26,433 1,110 94 92 June ................... 158 63 540 27,224 1,143 97 -1,533 19,217 -1,392 27,083 1,137 96 94 July .................... 159 64 555 27,541 1,157 98 -2,731 18,788 -429 25,239 1,060 90 88 August ............... 162 65 575 27,976 1,175 100 -665 18,123 -665 27,976 1,175 100 97 September ......... 154 62 525 26,588 1,117 95 -1,745 18,465 342 24,501 1,029 87 85 October .............. 162 65 557 28,013 1,177 100 -2,388 18,038 -427 26,052 1,094 93 90 November .......... 164 66 573 28,383 1,192 101 -2,911 18,308 270 25,202 1,058 90 87 December .......... 172 69 602 29,718 1,248 106 -2,997 18,238 -70 26,791 1,125 95 93 Total .................. 1,919 769 6,649 331,646 13,929 1,181 -24,365 18,238 297 306,984 12,893 1,093 1,065
2012 January .............. 167 67 584 29,038 1,220 103 -1,773 21,475 3,237 24,028 1,009 86 83 February ............ 154 61 531 26,647 1,119 95 -1,778 22,393 918 23,951 1,006 85 83 March ................. 159 63 518 27,548 1,157 98 -1,591 22,583 190 25,767 1,082 92 89 April ................... 152 61 495 26,346 1,107 94 -1,549 22,050 -533 25,330 1,064 90 88 May .................... 159 63 520 27,616 1,160 98 -1,013 21,635 -415 27,018 1,135 96 94 June ................... 153 61 502 26,513 1,114 94 -597 21,239 -396 26,312 1,105 94 91 July .................... 145 58 503 25,236 1,060 90 -489 20,224 -1,015 25,762 1,082 92 89 August ............... 150 60 526 26,092 1,096 93 654 19,180 -1,044 27,790 1,167 99 96 September ......... 140 56 496 24,376 1,024 87 699 19,921 741 24,334 1,022 87 84 October .............. 144 57 528 24,976 1,049 89 614 18,626 -1,295 26,885 1,129 96 93 November .......... 142 57 527 24,744 1,039 88 1,011 19,992 1,366 24,389 1,024 87 84 December .......... 147 59 534 25,582 1,074 91 -79 20,350 358 25,145 1,056 90 87 Total .................. 1,814 722 6,264 314,714 13,218 1,120 -5,891 20,350 2,112 306,711 12,882 1,092 1,064
2013 January .............. 144 57 504 24,935 1,047 89 -546 20,558 i -119 24,508 1,029 87 85 February ............ 130 52 462 22,645 951 81 -727 19,580 -978 22,896 962 82 79 March ................. 148 59 511 25,681 1,079 91 -264 18,941 -639 26,056 1,094 93 90 April ................... 148 59 515 25,662 1,078 91 -559 17,645 -1,296 26,399 1,109 94 92 May .................... 157 62 537 27,197 1,142 97 -535 16,810 -835 27,497 1,155 98 95 June ................... 154 61 509 26,722 1,122 95 -170 16,395 -415 26,967 1,133 96 94 July .................... 155 62 519 26,923 1,131 96 428 17,127 732 26,619 1,118 95 92 August ............... 152 60 495 26,320 1,105 94 -52 16,971 -156 26,424 1,110 94 92 September ......... 147 59 499 25,564 1,074 91 -584 16,040 -931 25,911 1,088 92 90 9-Month Total ... 1,335 532 4,551 231,649 9,729 825 -3,009 16,040 -4,637 233,277 9,798 830 809
2012 9-Month Total ... 1,380 550 4,675 239,412 10,055 852 -7,437 19,921 1,683 230,292 9,672 820 7992011 9-Month Total ... 1,421 569 4,917 245,532 10,312 874 -16,068 18,465 524 228,940 9,615 815 794
a Total corn and other biomass inputs to the production of undenatured ethanolused for fuel ethanol.
b Losses and co-products from the production of fuel ethanol. Does not includenatural gas, electricity, and other non-biomass energy used in the production of fuelethanol—these are included in the industrial sector consumption statistics for theappropriate energy source.
c The amount of denaturant in fuel ethanol produced.d Includes denaturant.e Through 2009, data are for fuel ethanol imports only; data for fuel ethanol
exports are not available. Beginning in 2010, data are for fuel ethanol importsminus fuel ethanol (including industrial alcohol) exports.
f Stocks are at end of period.g A negative value indicates a decrease in stocks and a positive value indicates
an increase.h Consumption of fuel ethanol minus denaturant. Data for fuel ethanol minus
denaturant are used to develop data for "Renewable Energy/Biomass" in Tables10.1–10.2b, as well as in Sections 1 and 2.
i Derived from the preliminary 2012 stocks value (20,677 thousand barrels), notthe final 2012 value (20,350 thousand barrels) that is shown under "Stocks."
NA=Not available. Notes: • Mbbl = thousand barrels. MMgal = million U.S. gallons. TBtu = trillion
Btu. • Fuel ethanol data in thousand barrels are converted to million gallons bymultiplying by 0.042, and are converted to Btu by multiplying by the approximateheat content of fuel ethanol—see Table A3. • Through 1980, data are notavailable. For 1981–1992, data are estimates. For 1993–2008, only data forfeedstock, losses and co-products, and denaturant are estimates.Beginning in 2009, only data for feedstock, and losses and co-products, areestimates. • See "Denaturant," "Ethanol," "Fuel Ethanol," and "Fuel Ethanol MinusDenaturant" in Glossary. • Totals may not equal sum of components due toindependent rounding. • Geographic coverage is the 50 states and the District ofColumbia.
Web Page: See http://www.eia.gov/totalenergy/data/monthly/#renewable (Exceland CSV files) for all available annual and monthly data beginning in 1981.
Sources: See end of section.
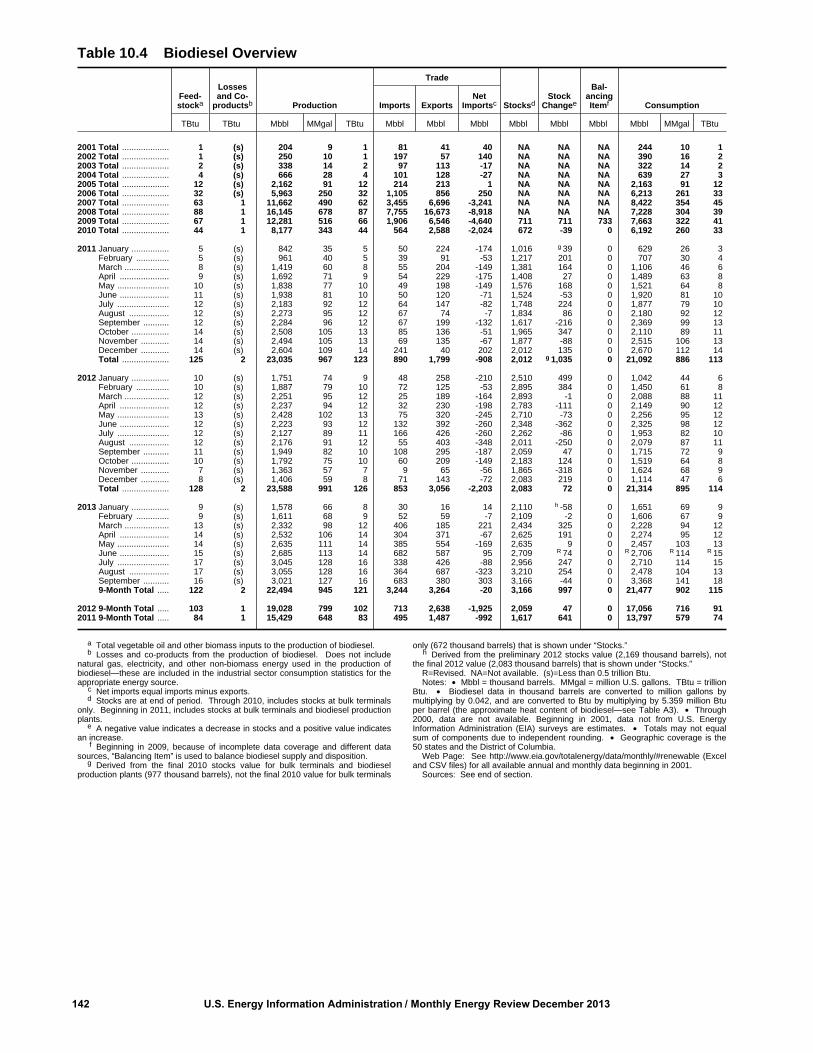
142 U.S. Energy Information Administration / Monthly Energy Review December 2013
Table 10.4 Biodiesel Overview
Feed-stocka
Lossesand Co-
productsb Production
Trade
StocksdStock
Changee
Bal-ancingItemf ConsumptionImports Exports
NetImportsc
TBtu TBtu Mbbl MMgal TBtu Mbbl Mbbl Mbbl Mbbl Mbbl Mbbl Mbbl MMgal TBtu
2001 Total .................... 1 (s) 204 9 1 81 41 40 NA NA NA 244 10 12002 Total .................... 1 (s) 250 10 1 197 57 140 NA NA NA 390 16 22003 Total .................... 2 (s) 338 14 2 97 113 -17 NA NA NA 322 14 22004 Total .................... 4 (s) 666 28 4 101 128 -27 NA NA NA 639 27 32005 Total .................... 12 (s) 2,162 91 12 214 213 1 NA NA NA 2,163 91 122006 Total .................... 32 (s) 5,963 250 32 1,105 856 250 NA NA NA 6,213 261 332007 Total .................... 63 1 11,662 490 62 3,455 6,696 -3,241 NA NA NA 8,422 354 452008 Total .................... 88 1 16,145 678 87 7,755 16,673 -8,918 NA NA NA 7,228 304 392009 Total .................... 67 1 12,281 516 66 1,906 6,546 -4,640 711 711 733 7,663 322 412010 Total .................... 44 1 8,177 343 44 564 2,588 -2,024 672 -39 0 6,192 260 33
2011 January ................ 5 (s) 842 35 5 50 224 -174 1,016 g 39 0 629 26 3 February .............. 5 (s) 961 40 5 39 91 -53 1,217 201 0 707 30 4 March ................... 8 (s) 1,419 60 8 55 204 -149 1,381 164 0 1,106 46 6 April ..................... 9 (s) 1,692 71 9 54 229 -175 1,408 27 0 1,489 63 8 May ...................... 10 (s) 1,838 77 10 49 198 -149 1,576 168 0 1,521 64 8 June ..................... 11 (s) 1,938 81 10 50 120 -71 1,524 -53 0 1,920 81 10 July ...................... 12 (s) 2,183 92 12 64 147 -82 1,748 224 0 1,877 79 10 August ................. 12 (s) 2,273 95 12 67 74 -7 1,834 86 0 2,180 92 12 September ........... 12 (s) 2,284 96 12 67 199 -132 1,617 -216 0 2,369 99 13 October ................ 14 (s) 2,508 105 13 85 136 -51 1,965 347 0 2,110 89 11 November ............ 14 (s) 2,494 105 13 69 135 -67 1,877 -88 0 2,515 106 13 December ............ 14 (s) 2,604 109 14 241 40 202 2,012 135 0 2,670 112 14 Total .................... 125 2 23,035 967 123 890 1,799 -908 2,012 g 1,035 0 21,092 886 113
2012 January ................ 10 (s) 1,751 74 9 48 258 -210 2,510 499 0 1,042 44 6 February .............. 10 (s) 1,887 79 10 72 125 -53 2,895 384 0 1,450 61 8 March ................... 12 (s) 2,251 95 12 25 189 -164 2,893 -1 0 2,088 88 11 April ..................... 12 (s) 2,237 94 12 32 230 -198 2,783 -111 0 2,149 90 12 May ...................... 13 (s) 2,428 102 13 75 320 -245 2,710 -73 0 2,256 95 12 June ..................... 12 (s) 2,223 93 12 132 392 -260 2,348 -362 0 2,325 98 12 July ...................... 12 (s) 2,127 89 11 166 426 -260 2,262 -86 0 1,953 82 10 August ................. 12 (s) 2,176 91 12 55 403 -348 2,011 -250 0 2,079 87 11 September ........... 11 (s) 1,949 82 10 108 295 -187 2,059 47 0 1,715 72 9 October ................ 10 (s) 1,792 75 10 60 209 -149 2,183 124 0 1,519 64 8 November ............ 7 (s) 1,363 57 7 9 65 -56 1,865 -318 0 1,624 68 9 December ............ 8 (s) 1,406 59 8 71 143 -72 2,083 219 0 1,114 47 6 Total .................... 128 2 23,588 991 126 853 3,056 -2,203 2,083 72 0 21,314 895 114
2013 January ................ 9 (s) 1,578 66 8 30 16 14 2,110 h -58 0 1,651 69 9 February .............. 9 (s) 1,611 68 9 52 59 -7 2,109 -2 0 1,606 67 9 March ................... 13 (s) 2,332 98 12 406 185 221 2,434 325 0 2,228 94 12 April ..................... 14 (s) 2,532 106 14 304 371 -67 2,625 191 0 2,274 95 12 May ...................... 14 (s) 2,635 111 14 385 554 -169 2,635 9 0 2,457 103 13 June ..................... 15 (s) 2,685 113 14 682 587 95 2,709 R 74 0 R 2,706 R 114 R 15 July ...................... 17 (s) 3,045 128 16 338 426 -88 2,956 247 0 2,710 114 15 August ................. 17 (s) 3,055 128 16 364 687 -323 3,210 254 0 2,478 104 13 September ........... 16 (s) 3,021 127 16 683 380 303 3,166 -44 0 3,368 141 18 9-Month Total ..... 122 2 22,494 945 121 3,244 3,264 -20 3,166 997 0 21,477 902 115
2012 9-Month Total ..... 103 1 19,028 799 102 713 2,638 -1,925 2,059 47 0 17,056 716 912011 9-Month Total ..... 84 1 15,429 648 83 495 1,487 -992 1,617 641 0 13,797 579 74
a Total vegetable oil and other biomass inputs to the production of biodiesel.b Losses and co-products from the production of biodiesel. Does not include
natural gas, electricity, and other non-biomass energy used in the production ofbiodiesel—these are included in the industrial sector consumption statistics for theappropriate energy source.
c Net imports equal imports minus exports.d Stocks are at end of period. Through 2010, includes stocks at bulk terminals
only. Beginning in 2011, includes stocks at bulk terminals and biodiesel productionplants.
e A negative value indicates a decrease in stocks and a positive value indicatesan increase.
f Beginning in 2009, because of incomplete data coverage and different datasources, “Balancing Item” is used to balance biodiesel supply and disposition.
g Derived from the final 2010 stocks value for bulk terminals and biodieselproduction plants (977 thousand barrels), not the final 2010 value for bulk terminals
only (672 thousand barrels) that is shown under “Stocks.” h Derived from the preliminary 2012 stocks value (2,169 thousand barrels), not
the final 2012 value (2,083 thousand barrels) that is shown under “Stocks.” R=Revised. NA=Not available. (s)=Less than 0.5 trillion Btu. Notes: • Mbbl = thousand barrels. MMgal = million U.S. gallons. TBtu = trillion
Btu. • Biodiesel data in thousand barrels are converted to million gallons bymultiplying by 0.042, and are converted to Btu by multiplying by 5.359 million Btuper barrel (the approximate heat content of biodiesel—see Table A3). • Through2000, data are not available. Beginning in 2001, data not from U.S. EnergyInformation Administration (EIA) surveys are estimates. • Totals may not equalsum of components due to independent rounding. • Geographic coverage is the50 states and the District of Columbia.
Web Page: See http://www.eia.gov/totalenergy/data/monthly/#renewable (Exceland CSV files) for all available annual and monthly data beginning in 2001.
Sources: See end of section.
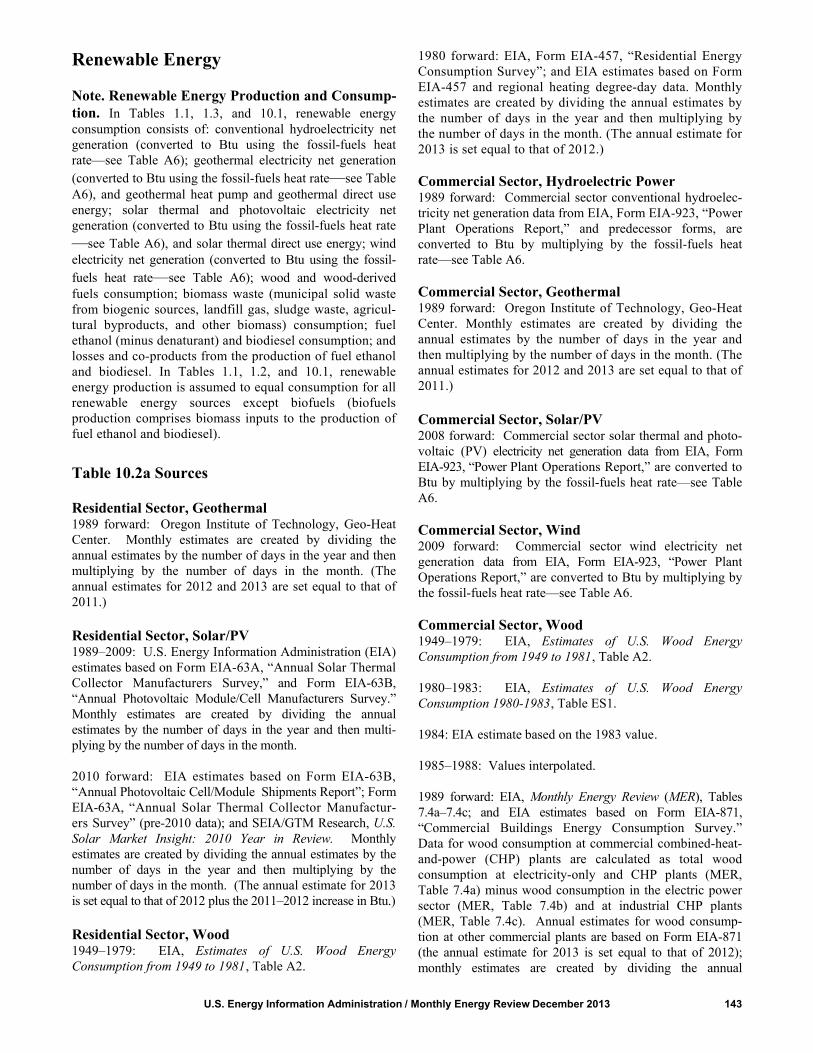
Renewable Energy
Note. Renewable Energy Production and Consump-tion. In Tables 1.1, 1.3, and 10.1, renewable energyconsumption consists of: conventional hydroelectricity netgeneration (converted to Btu using the fossil-fuels heatrate—see Table A6); geothermal electricity net generation(converted to Btu using the fossil-fuels heat rate—see TableA6), and geothermal heat pump and geothermal direct useenergy; solar thermal and photovoltaic electricity netgeneration (converted to Btu using the fossil-fuels heat rate—see Table A6), and solar thermal direct use energy; windelectricity net generation (converted to Btu using the fossil-fuels heat rate—see Table A6); wood and wood-derivedfuels consumption; biomass waste (municipal solid wastefrom biogenic sources, landfill gas, sludge waste, agricul-tural byproducts, and other biomass) consumption; fuelethanol (minus denaturant) and biodiesel consumption; andlosses and co-products from the production of fuel ethanoland biodiesel. In Tables 1.1, 1.2, and 10.1, renewableenergy production is assumed to equal consumption for allrenewable energy sources except biofuels (biofuelsproduction comprises biomass inputs to the production offuel ethanol and biodiesel).
Table 10.2a Sources
Residential Sector, Geothermal1989 forward: Oregon Institute of Technology, Geo-HeatCenter. Monthly estimates are created by dividing theannual estimates by the number of days in the year and thenmultiplying by the number of days in the month. (Theannual estimates for 2012 and 2013 are set equal to that of2011.)
Residential Sector, Solar/PV1989–2009: U.S. Energy Information Administration (EIA)estimates based on Form EIA-63A, “Annual Solar ThermalCollector Manufacturers Survey,” and Form EIA-63B,“Annual Photovoltaic Module/Cell Manufacturers Survey.”Monthly estimates are created by dividing the annualestimates by the number of days in the year and then multi-plying by the number of days in the month.
2010 forward: EIA estimates based on Form EIA-63B,“Annual Photovoltaic Cell/Module Shipments Report”; FormEIA-63A, “Annual Solar Thermal Collector Manufactur-ers Survey” (pre-2010 data); and SEIA/GTM Research, U.S.Solar Market Insight: 2010 Year in Review. Monthlyestimates are created by dividing the annual estimates by thenumber of days in the year and then multiplying by thenumber of days in the month. (The annual estimate for 2013is set equal to that of 2012 plus the 2011–2012 increase in Btu.)
Residential Sector, Wood1949–1979: EIA, Estimates of U.S. Wood EnergyConsumption from 1949 to 1981, Table A2.
1980 forward: EIA, Form EIA-457, “Residential EnergyConsumption Survey”; and EIA estimates based on FormEIA-457 and regional heating degree-day data. Monthlyestimates are created by dividing the annual estimates bythe number of days in the year and then multiplying bythe number of days in the month. (The annual estimate for2013 is set equal to that of 2012.)
Commercial Sector, Hydroelectric Power1989 forward: Commercial sector conventional hydroelec-tricity net generation data from EIA, Form EIA-923, “PowerPlant Operations Report,” and predecessor forms, areconverted to Btu by multiplying by the fossil-fuels heatrate—see Table A6.
Commercial Sector, Geothermal1989 forward: Oregon Institute of Technology, Geo-HeatCenter. Monthly estimates are created by dividing theannual estimates by the number of days in the year andthen multiplying by the number of days in the month. (Theannual estimates for 2012 and 2013 are set equal to that of2011.)
Commercial Sector, Solar/PV2008 forward: Commercial sector solar thermal and photo-voltaic (PV) electricity net generation data from EIA, FormEIA-923, “Power Plant Operations Report,” are converted toBtu by multiplying by the fossil-fuels heat rate—see TableA6.
Commercial Sector, Wind2009 forward: Commercial sector wind electricity netgeneration data from EIA, Form EIA-923, “Power PlantOperations Report,” are converted to Btu by multiplying bythe fossil-fuels heat rate—see Table A6.
Commercial Sector, Wood1949–1979: EIA, Estimates of U.S. Wood EnergyConsumption from 1949 to 1981, Table A2.
1980–1983: EIA, Estimates of U.S. Wood EnergyConsumption 1980-1983, Table ES1.
1984: EIA estimate based on the 1983 value.
1985–1988: Values interpolated.
1989 forward: EIA, Monthly Energy Review (MER), Tables7.4a–7.4c; and EIA estimates based on Form EIA-871,“Commercial Buildings Energy Consumption Survey.”Data for wood consumption at commercial combined-heat-and-power (CHP) plants are calculated as total woodconsumption at electricity-only and CHP plants (MER,Table 7.4a) minus wood consumption in the electric powersector (MER, Table 7.4b) and at industrial CHP plants(MER, Table 7.4c). Annual estimates for wood consump-tion at other commercial plants are based on Form EIA-871(the annual estimate for 2013 is set equal to that of 2012);monthly estimates are created by dividing the annual
U.S. Energy Information Administration / Monthly Energy Review December 2013 143

estimates by the number of days in the year and then multi-plying by the number of days in the month.
Commercial Sector, Biomass Waste1989 forward: EIA, MER, Table 7.4c.
Commercial Sector, Fuel Ethanol (Minus Denaturant)1981 forward: EIA, MER, Tables 3.5, 3.7a, and 10.3.Calculated as commercial sector motor gasoline consump-tion (Table 3.7a) divided by total motor gasoline productsupplied (Table 3.5), and then multiplied by fuel ethanol(minus denaturant) consumption (Table 10.3).
Table 10.2b Sources
Industrial Sector, Hydroelectric Power1949 forward: Industrial sector conventional hydroelectric-ity net generation data from Table 7.2c are converted to Btuby multiplying by the fossil-fuels heat rate—see Table A6.
Industrial Sector, Geothermal1989 forward: Oregon Institute of Technology, Geo-HeatCenter. Monthly estimates are created by dividing theannual estimates by the number of days in the year and thenmultiplying by the number of days in the month. (Theannual estimates for 2012 and 2013 are set equal to that of2011.)
Industrial Sector, Solar/PV2010 forward: Industrial sector solar thermal and photovol-taic (PV) electricity net generation data from the U.S.Energy Information Administration (EIA), Form EIA-923,"Power Plant Operations Report," are converted to Btu bymultiplying by the fossil-fuels heat rate—see Table A6.
Industrial Sector, Wind2011 forward: Industrial sector wind electricity net genera-tion data from EIA, Form EIA-923, "Power Plant Opera-tions Report," are converted to Btu by multiplying by thefossil-fuels heat rate—see Table A6.
Industrial Sector, Wood1949–1979: EIA, Estimates of U.S. Wood EnergyConsumption from 1949 to 1981, Table A2.
1980–1983: EIA, Estimates of U.S. Wood EnergyConsumption 1980-1983, Table ES1.
1984: EIA, Estimates of U.S. Biofuels Consumption 1990,Table 1.
1985 and 1986: Values interpolated.
1987: EIA, Estimates of Biofuels Consumption in the UnitedStates During 1987, Table 2.
1988: Value interpolated.
1989 forward: EIA, Monthly Energy Review (MER), Table7.4c; and EIA estimates based on Form EIA-846,“Manufacturing Energy Consumption Survey.” Data forwood consumption at industrial combined-heat-and-power(CHP) plants are from MER, Table 7.4c. Annual estimatesfor wood consumption at other industrial plants are based onForm EIA-846 (the annual estimate for 2013 is set equal tothat of 2012); monthly estimates are created by dividing theannual estimates by the number of days in the year and thenmultiplying by the number of days in the month.
Industrial Sector, Biomass Waste1981: EIA, Estimates of U.S. Biofuels Consumption 1990,Table 8; and EIA, MER, Table 10.2c. Estimates are calcu-lated as total waste consumption minus electric power sectorwaste consumption.
1982 and 1983: EIA estimates for total waste consumptionbased on Estimates of U.S. Biofuels Consumption 1990,Table 8; and EIA, MER, Table 10.2c. Estimates are calcu-lated as total waste consumption minus electric power sectorwaste consumption.
1984: EIA, Estimates of U.S. Biofuels Consumption 1990,Table 8; and EIA, MER, Table 10.2c. Estimates are calcu-lated as total waste consumption minus electric power sectorwaste consumption.
1985 and 1986: Values interpolated.
1987: EIA, Estimates of U.S. Biofuels Consumption 1990,Table 8; and EIA, MER, Table 10.2c. Estimates are calcu-lated as total waste consumption minus electric power sectorwaste consumption.
1988: Value interpolated.
1989 forward: EIA, MER, Table 7.4c; and EIA estimatesbased on information presented in Government AdvisoryAssociates, Resource Recovery Yearbook and MethaneRecovery Yearbook, and information provided by the U.S.Environmental Protection Agency, Landfill MethaneOutreach Program. Data for waste consumption at industrialCHP plants are from MER, Table 7.4c. Annual estimates forwaste consumption at other industrial plants are based onthe non-EIA sources listed above (the annual estimate for2013 is set equal to that of 2012); monthly estimates arecreated by dividing the annual estimates by the number ofdays in the year and then multiplying by the number of daysin the month.
Industrial Sector, Fuel Ethanol (Minus Denaturant)1981 forward: EIA, MER, Tables 3.5, 3.7b, and 10.3.Calculated as industrial sector motor gasoline consumption(Table 3.7b) divided by total motor gasoline product
144 U.S. Energy Information Administration / Monthly Energy Review December 2013
supplied (Table 3.5), and then multiplied by fuel ethanol(minus denaturant) consumption (Table 10.3).
Industrial Sector, Losses and Co-products1981 forward: Calculated as fuel ethanol losses andco-products (Table 10.3) plus biodiesel losses andco-products (Table 10.4).
Transportation Sector, Fuel Ethanol (MinusDenaturant)1981 forward: EIA, MER, Tables 3.5, 3.7c, and 10.3.Calculated as transportation sector motor gasoline consump-tion (Table 3.7c) divided by total motor gasoline productsupplied (Table 3.5), and then multiplied by fuel ethanol(minus denaturant) consumption (Table 10.3).
Transportation Sector, Biodiesel2001 forward: EIA, MER, Table 10.4. Transportation sectorbiodiesel consumption is assumed to equal total biodieselconsumption.
Table 10.3 Sources Feedstock1981 forward: Calculated as fuel ethanol production (inthousand barrels) minus denaturant, and then multiplied bythe fuel ethanol feedstock factor—see Table A3.
Losses and Co-products1981 forward: Calculated as fuel ethanol feedstock plusdenaturant minus fuel ethanol production.
Denaturant1981–2008: Data in thousand barrels for petroleumdenaturant in fuel ethanol produced are estimated as 2percent of fuel ethanol production; these data are convertedto Btu by multiplying by 4.645 million Btu per barrel (theestimated quantity-weighted factor of pentanes plus andconventional motor gasoline used as denaturant).
2009–2012: U.S. Energy Information Administration (EIA),Petroleum Supply Annual (PSA), annual reports, Table 1.Data in thousand barrels for net production of pentanes plusat renewable fuels and oxygenate plants are multiplied by-1; these data are converted to Btu by multiplying by 4.620million Btu per barrel (the approximate heat content ofpentanes plus). Data in thousand barrels for net productionof conventional motor gasoline and motor gasoline blendingcomponents at renewable fuels and oxygenate plants aremultiplied by -1; these data are converted to Btu by multi-plying by 5.253 million Btu per barrel (the approximate heatcontent of conventional motor gasoline). Total denaturant isthe sum of the values for pentanes plus, conventional motorgasoline, and motor gasoline blending components.
2013: EIA, Petroleum Supply Monthly (PSM), monthlyreports, Table 1. Data in thousand barrels for net productionof pentanes plus at renewable fuels and oxygenate plants are
multiplied by -1; these data are converted to Btu by multi-plying by 4.620 million Btu per barrel (the approximateheat content of pentanes plus). Data in thousand barrels fornet production of conventional motor gasoline and motorgasoline blending components at renewable fuels andoxygenate plants are multiplied by -1; these data areconverted to Btu by multiplying by 5.253 million Btu perbarrel (the approximate heat content of conventional motorgasoline). Total denaturant is the sum of the values forpentanes plus, conventional motor gasoline, and motorgasoline blending components.
Production1981–1992: Fuel ethanol production is assumed to equalfuel ethanol consumption—see sources for "Consumption."
1993–2004: Calculated as fuel ethanol consumption plusfuel ethanol stock change minus fuel ethanol net imports.These data differ slightly from the original production datafrom EIA, Form EIA-819, "Monthly Oxygenate Report,"and predecessor form, which were not reconciled andupdated to be consistent with the final balance.
2005–2008: EIA, Form EIA-819, "Monthly OxygenateReport."
2009–2012: EIA, PSA, annual reports, Table 1, data for netproduction of fuel ethanol at renewable fuels and oxygenate plants.
2013: EIA, PSM, monthly reports, Table 1, data for netproduction of fuel ethanol at renewable fuels and oxygenateplants.
Trade, Stocks, and Stock Change1992–2012: EIA, PSA, annual reports, Table 1.
2013: EIA, PSM, monthly reports, Table 1.
Consumption1981–1989: EIA, Estimates of U.S. Biofuels Consumption1990, Table 10; and interpolated values for 1982, 1983,1985, 1986, and 1988.
1990–1992: EIA, Estimates of U.S. Biomass EnergyConsumption 1992, Table D2; and interpolated value for1991.
1993–2004: EIA, PSA, annual reports, Tables 2 and 16.Calculated as 10 percent of oxygenated finished motorgasoline field production (Table 2), plus fuel ethanol refin-ery input (Table 16).
2005–2008: EIA, PSA, annual reports, Tables 1 and 15.Calculated as motor gasoline blending components adjustments(Table 1), plus finished motor gasoline adjustments (Table 1),plus fuel ethanol refinery and blender net inputs (Table 15).
U.S. Energy Information Administration / Monthly Energy Review December 2013 145
2009–2012: EIA, PSA, annual reports, Table 1. Calculatedas fuel ethanol refinery and blender net inputs minus fuelethanol adjustments.
2013: EIA, PSM, monthly reports, Table 1. Calculated asfuel ethanol refinery and blender net inputs minus fuelethanol adjustments.
Consumption Minus Denaturant1981 forward: Calculated as fuel ethanol consumptionminus the amount of denaturant in fuel ethanol consumed.Denaturant in fuel ethanol consumed is estimated by multi-plying denaturant in fuel ethanol produced by the fuelethanol consumption-to-production ratio.
Table 10.4 Sources
Feedstock2001 forward: Calculated as biodiesel production inthousand barrels multiplied by 5.433 million Btu per barrel(the biodiesel feedstock factor—see Table A3).
Losses and Co-products2001 forward: Calculated as biodiesel feedstock minusbiodiesel production.
Production2001–2005: U.S. Department of Agriculture, CommodityCredit Corporation, Bioenergy Program records. Annualdata are derived from quarterly data. Monthly data areestimated by dividing the annual data by the number of daysin the year and then multiplying by the number of days in themonth.
2006: U.S. Department of Commerce, Bureau of the Census,“M311K—Fats and Oils: Production, Consumption, andStocks,” data for soybean oil consumed in methyl esters(biodiesel). In addition, the U.S. Energy Information Admin-istration (EIA) estimates that 14.4 million gallons of yellowgrease were consumed in methyl esters (biodiesel).
2007: U.S. Department of Commerce, Bureau of theCensus, “M311K—Fats and Oils: Production,Consumption, and Stocks,” data for all fats and oilsconsumed in methyl esters (biodiesel).
2008: EIA, Monthly Biodiesel Production Report, Decem-ber 2009 (release date October 2010), Table 11. Monthlydata for 2008 are estimated based on U.S. Department ofCommerce, Bureau of the Census, M311K data, multipliedby the EIA 2008 annual value’s share of the M311K 2008 annualvalue.
2009 forward: EIA, Monthly Biodiesel Production Report,monthly reports, Table 1.
Trade2001–2011: For imports, U.S. Department of Agriculture,data for the following Harmonized Tariff Schedule codes:3824.90.40.20, “Fatty Esters Animal/Vegetable Mixture”(data through June 2010); and 3824.90.40.30,“Biodiesel/Mixes” (data for July 2010–2011). For exports,U.S. Department of Agriculture, data for the followingSchedule B codes: 3824.90.40.00, “Fatty SubstancesAnimal/Vegetable/Mixture” (data through 2010); and3824.90.40.30, “Biodiesel <70%” (data for 2011). (Thedata above are converted from pounds to gallons by divid-ing by 7.4.) Although these categories include productsother than biodiesel (such as biodiesel coprocessed withpetroleum feedstocks; and products destined for soaps,cosmetics, and other items), biodiesel is the largest compo-nent. In the absence of other reliable data for biodieseltrade, EIA sees these data as good substitutes.
2012: EIA, Petroleum Supply Annual (PSA), annualreport, Tables 25 and 31, data for biomass-based dieselfuel.
2013: EIA, Petroleum Supply Monthly (PSM), monthlyreports, Tables 37 and 49, data for biomass-based dieselfuel.
Stocks and Stock Change2009–2012: EIA, PSA, annual reports, Table 1, data forrenewable fuels except fuel ethanol.
2013: EIA, PSM, monthly reports, Table 1, data for renew-able fuels except fuel ethanol.
Balancing Item2009 forward: Calculated as biodiesel consumption andbiodiesel stock change minus biodiesel production andbiodiesel net imports.
Consumption2001–2008: Calculated as biodiesel production plus biodie-sel net imports.
January and February 2009: EIA, PSA, Table 1, data forrefinery and blender net inputs of renewable fuels exceptfuel ethanol.
March 2009 forward: Calculated as biodiesel productionplus biodiesel net imports minus biodiesel stock change.
146 U.S. Energy Information Administration / Monthly Energy Review December 2013

11. InternationalPetroleum

Figure 11.1a World Crude Oil Production Overview (Million Barrels per Day)
World Production, 1973–2012 World Production, Monthly
Selected Producers, 1973–2012 Selected Producers, Monthly
148 U.S. Energy Information Administration / Monthly Energy Review December 2013
United States
2011 2012 2013
2011 2012 2013
Non-OPEC
J F MA M J J A SOND J F MA M J J A SOND J F MA M J J A SOND
0
20
40
60
80
1975 1980 1985 1990 1995 2000 2005 2010
0
20
40
60
80
Non-OPEC
World
1975 1980 1985 1990 1995 2000 2005 2010
0
3
6
9
12
OPEC
J F MA M J J A S OND J F MA M J J A SOND J F MA M J J A SOND
0
3
6
9
12
0
World
United States
Russia
Persian Gulf Nations
OPEC
Saudi Arabia
China
Persian Gulf Nations
Russia
Iran
China
Saudi Arabia
Iran
Notes: • OPEC is the Organization of the Petroleum ExportingCountries. • The Persian Gulf Nations are Bahrain, Iran, Iraq, Kuwait,Qatar, Saudi Arabia, and the United Arab Emirates. Production fromthe Neutral Zone between Kuwait and Saudi Arabia is included in “Per-
sian Gulf Nations.”Web Page: http://www.eia.gov/totalenergy/data/monthly/#international.Sources: Tables 11.1a and 11.1b.

Figure 11.1b World Crude Oil Production by Selected Country (Million Barrels per Day)
U.S. Energy Information Administration / Monthly Energy Review December 2013 149
3.679
4.107
0.534
2.563
1.395
10.082
0.735
7.794
1.412
1.810
0.535
3.200
2.825
2.650
0.360
2.420
1.200
10.140
2.820
2.300
3.011
4.242
0.553
2.602
1.309
9.941
0.601
6.569
1.550
1.740
0.506
3.150
3.275
2.610
1.500
2.460
1.200
9.800
2.820
2.300
Canada
China
Egypt
Mexico
Norway
Russia
United Kingdom
United States
Algeria
Angola
Ecuador
Iran
Iraq
Kuwait
Libya
Nigeria
Qatar
Saudi Arabia
United Arab Emirates
Venezuela
0 2 4 6 8 10 12
September 2012September 2013
Sel
ecte
d N
on-O
PE
C C
ount
ries
OP
EC
Cou
ntrie
s
Note: OPEC is the Organization of the Petroleum Exporting Countries.Web Page: http://www.eia.gov/totalenergy/data/monthly/#international.Sources: Tables 11.1a and 11.1b.

150 U.S. Energy Information Administration / Monthly Energy Review December 2013
Table 11.1a World Crude Oil Production: OPEC Members (Thousand Barrels per Day)
Algeria Angola Ecuador Iran Iraq Kuwaita Libya Nigeria QatarSaudi
Arabiaa
UnitedArab
EmiratesVene-zuela
Total OPECb
1973 Average .................... 1,097 162 209 5,861 2,018 3,020 2,175 2,054 570 7,596 1,533 3,366 29,6611975 Average .................... 983 165 161 5,350 2,262 2,084 1,480 1,783 438 7,075 1,664 2,346 25,7901980 Average .................... 1,106 150 204 1,662 2,514 1,656 1,787 2,055 472 9,900 1,709 2,168 25,3831985 Average .................... 1,036 231 281 2,250 1,433 1,023 1,059 1,495 301 3,388 1,193 1,677 15,3671990 Average .................... 1,180 475 285 3,088 2,040 1,175 1,375 1,810 406 6,410 2,117 2,137 22,4981995 Average .................... 1,162 646 392 3,643 560 2,057 1,390 1,993 442 8,231 2,233 2,750 25,5001996 Average .................... 1,227 709 396 3,686 579 2,062 1,401 2,001 510 8,218 2,278 2,938 26,0031997 Average .................... 1,259 714 388 3,664 1,155 2,007 1,446 2,132 550 8,362 2,316 3,280 27,2741998 Average .................... 1,226 735 375 3,634 2,150 2,085 1,390 2,153 696 8,389 2,345 3,167 28,3461999 Average .................... 1,177 745 373 3,557 2,508 1,898 1,319 2,130 665 7,833 2,169 2,826 27,1992000 Average .................... 1,214 746 395 3,696 2,571 2,079 1,410 2,165 737 8,404 2,368 3,155 28,9402001 Average .................... 1,265 742 412 3,724 2,390 1,998 1,367 2,256 714 8,031 2,205 3,010 28,1142002 Average .................... 1,349 896 393 3,444 2,023 1,894 1,319 2,118 679 7,634 2,082 2,604 26,4352003 Average .................... 1,516 903 411 3,743 1,308 2,136 1,421 2,275 715 8,775 2,348 2,335 27,8852004 Average .................... 1,582 1,052 528 4,001 2,011 2,376 1,515 2,329 783 9,101 2,478 2,557 30,3132005 Average .................... 1,692 1,250 532 4,139 1,878 2,529 1,633 2,627 835 9,550 2,535 2,565 31,7662006 Average .................... 1,699 1,413 536 4,028 1,996 2,535 1,681 2,440 850 9,152 2,636 2,511 31,4762007 Average .................... 1,708 1,744 511 3,912 2,086 2,464 1,702 2,350 851 8,722 2,603 2,490 31,1432008 Average .................... 1,705 1,981 505 4,050 2,375 2,586 1,736 2,165 924 9,261 2,681 2,464 32,4332009 Average .................... 1,585 1,907 486 4,037 2,391 2,350 1,650 2,208 927 8,250 2,413 2,319 30,5222010 Average .................... 1,540 1,939 486 4,080 2,399 2,300 1,650 2,455 1,127 8,900 2,415 2,216 31,507
2011 January ...................... 1,540 1,790 500 4,076 2,625 2,350 1,650 2,616 1,280 9,140 2,520 2,300 32,387 February .................... 1,540 1,790 509 4,084 2,525 2,350 1,340 2,604 1,280 9,140 2,520 2,300 31,982 March ......................... 1,540 1,790 501 4,092 2,525 2,450 300 2,460 1,290 8,940 2,620 2,300 30,808 April ........................... 1,540 1,740 504 4,100 2,525 2,550 200 2,520 1,300 8,940 2,720 2,300 30,939 May ............................ 1,540 1,640 497 4,100 2,575 2,550 200 2,604 1,300 8,940 2,720 2,300 30,966 June ........................... 1,540 1,690 495 4,100 2,575 2,550 100 2,604 1,300 9,640 2,720 2,300 31,614 July ............................ 1,540 1,740 492 4,050 2,625 2,550 100 2,604 1,300 9,840 2,720 2,300 31,861 August ....................... 1,540 1,790 495 4,050 2,625 2,600 0 2,640 1,300 9,940 2,720 2,300 32,000 September ................. 1,540 1,840 496 4,050 2,725 2,600 100 2,640 1,300 9,740 2,720 2,300 32,051 October ...................... 1,540 1,790 502 4,000 2,725 2,600 300 2,400 1,300 9,540 2,720 2,300 31,717 November .................. 1,540 1,940 504 4,000 2,725 2,600 550 2,520 1,300 9,840 2,720 2,300 32,539 December .................. 1,540 1,890 501 3,950 2,725 2,600 800 2,400 1,300 9,840 2,720 2,300 32,566 Average .................... 1,540 1,786 500 4,054 2,626 2,530 465 2,550 1,296 9,458 2,679 2,300 31,784
2012 January ...................... 1,550 1,890 504 3,850 2,675 2,650 1,000 2,520 1,300 9,840 2,720 2,300 32,799 February .................... 1,550 1,940 503 3,800 2,575 2,650 1,200 2,580 1,300 10,040 2,720 2,300 33,158 March ......................... 1,550 1,790 499 3,750 2,725 2,640 1,350 2,520 1,200 10,030 2,820 2,300 33,174 April ........................... 1,550 1,890 500 3,600 2,965 2,640 1,400 2,640 1,190 9,930 2,820 2,300 33,425 May ............................ 1,550 1,840 498 3,525 2,925 2,640 1,400 2,580 1,200 9,730 2,820 2,300 33,008 June ........................... 1,544 1,790 502 3,350 2,975 2,630 1,400 2,580 1,200 10,020 2,820 2,300 33,111 July ............................ 1,546 1,740 508 3,200 3,075 2,625 1,400 2,580 1,200 10,015 2,820 2,300 33,009 August ....................... 1,548 1,840 512 3,100 3,175 2,625 1,450 2,640 1,200 10,015 2,820 2,300 33,225 September ................. 1,550 1,740 506 3,150 3,275 2,610 1,500 2,460 1,200 9,800 2,820 2,300 32,911 October ...................... 1,482 1,790 503 3,000 3,075 2,610 1,500 2,340 1,200 9,800 2,820 2,300 32,420 November .................. 1,483 1,770 504 3,000 3,225 2,650 1,450 2,280 1,200 9,540 2,820 2,300 32,222 December .................. 1,485 1,790 503 3,100 3,125 2,650 1,350 2,520 1,200 9,240 2,820 2,300 32,083 Average .................... 1,532 1,817 504 3,367 2,983 2,635 1,367 2,520 1,216 9,832 2,804 2,300 32,877
2013 January ...................... 1,490 1,840 505 3,200 3,075 2,650 1,350 2,410 1,200 9,140 2,820 2,300 31,980 February .................... 1,490 1,790 506 3,200 3,075 2,650 1,400 2,320 1,200 9,140 2,820 2,300 31,891 March ......................... 1,490 1,840 504 3,200 3,075 2,650 1,350 2,420 1,200 9,140 2,820 2,300 31,989 April ........................... 1,510 1,855 516 3,200 3,175 2,650 1,450 2,400 1,200 9,440 2,820 2,300 32,516 May ............................ 1,510 1,890 522 3,200 3,075 2,650 1,420 2,420 1,200 9,640 2,820 2,300 32,647 June ........................... 1,510 1,770 524 3,200 3,100 2,650 1,130 2,270 1,200 9,840 2,820 2,300 32,314 July ............................ 1,520 1,790 531 3,200 3,100 2,650 1,000 2,400 1,200 10,040 2,820 2,300 32,551 August ....................... 1,520 1,770 537 3,200 3,275 2,650 590 R 2,370 1,200 10,240 2,820 2,300 R 32,472 September ................. 1,412 1,810 535 3,200 2,825 2,650 360 2,420 1,200 10,140 2,820 2,300 31,672 9-Month Average ..... 1,495 1,818 520 3,200 3,087 2,650 1,115 2,382 1,200 9,644 2,820 2,300 32,230
2012 9-Month Average ..... 1,549 1,828 504 3,479 2,930 2,634 1,345 2,567 1,221 9,935 2,798 2,300 33,0902011 9-Month Average ..... 1,540 1,756 499 4,078 2,592 2,507 437 2,588 1,295 9,364 2,665 2,300 31,620
a Except for the period from August 1990 through May 1991, includes aboutone-half of the production in the Kuwait-Saudi Arabia Neutral Zone. Kuwaiti NeutralZone output was discontinued following Iraq’s invasion of Kuwait on August 2,1990, but was resumed in June 1991. In September 2013, Neutral Zone productionby both Kuwait and Saudi Arabia totaled about 520 thousand barrels per day. Datafor Saudi Arabia include approximately 150 thousand barrels per day from the AbuSafah field produced on behalf of Bahrain.
b See “Organization of the Petroleum Exporting Countries (OPEC)” in Glossary.On Tables 11.1a and 11.1b, countries are classified as "OPEC" or "Non-OPEC" inall years based on their status in the most current year. For example, Ecuadorrejoined OPEC in 2007, and is thus included in "Total OPEC" for all years; and
Indonesia left OPEC at the end of 2008, and is thus included in "Total Non-OPEC"for all years.
R=Revised. Notes: • Data are for crude oil and lease condensate; they exclude natural gas
plant liquids. • Monthly data are often preliminary figures and may not average tothe annual totals because of rounding or because updates to the preliminarymonthly data are not available.
Web Page: See http://www.eia.gov/totalenergy/data/monthly/#international(Excel and CSV files) for all available annual and monthly data beginning in 1973.
Sources: See end of section.
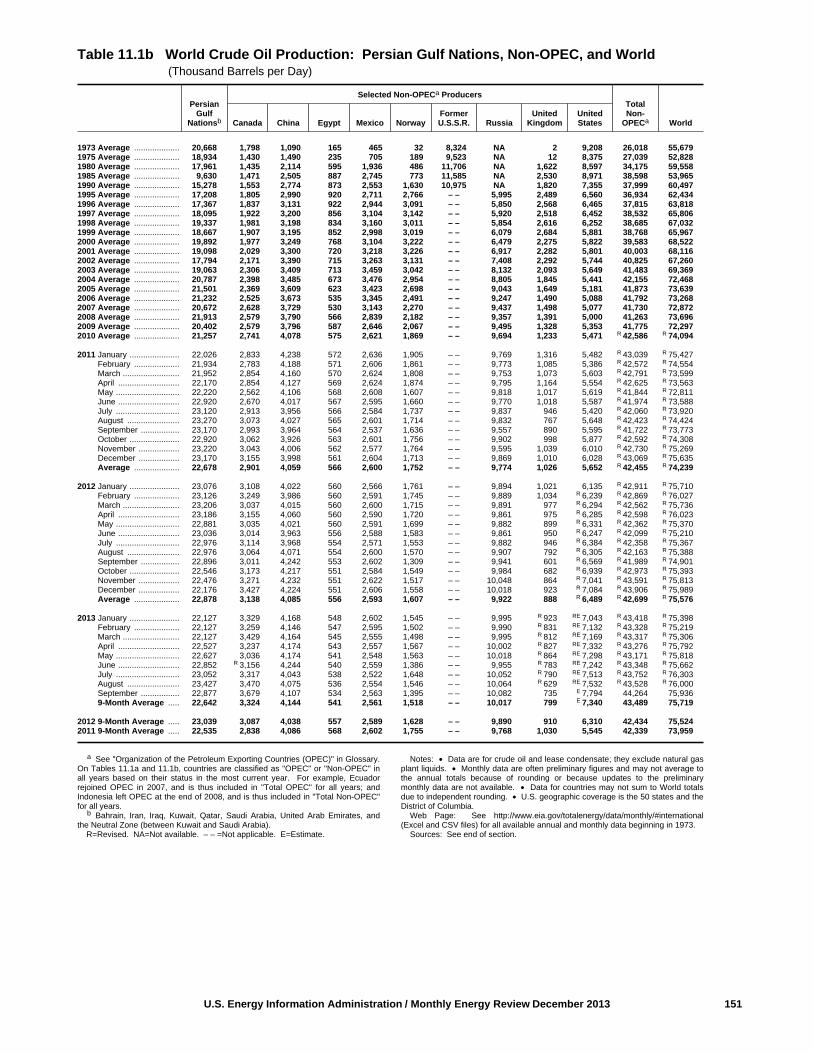
U.S. Energy Information Administration / Monthly Energy Review December 2013 151
Table 11.1b World Crude Oil Production: Persian Gulf Nations, Non-OPEC, and World (Thousand Barrels per Day)
PersianGulf
Nationsb
Selected Non-OPECa ProducersTotalNon-
OPECa WorldCanada China Egypt Mexico NorwayFormerU.S.S.R. Russia
UnitedKingdom
UnitedStates
1973 Average .................... 20,668 1,798 1,090 165 465 32 8,324 NA 2 9,208 26,018 55,6791975 Average .................... 18,934 1,430 1,490 235 705 189 9,523 NA 12 8,375 27,039 52,8281980 Average .................... 17,961 1,435 2,114 595 1,936 486 11,706 NA 1,622 8,597 34,175 59,5581985 Average .................... 9,630 1,471 2,505 887 2,745 773 11,585 NA 2,530 8,971 38,598 53,9651990 Average .................... 15,278 1,553 2,774 873 2,553 1,630 10,975 NA 1,820 7,355 37,999 60,4971995 Average .................... 17,208 1,805 2,990 920 2,711 2,766 – – 5,995 2,489 6,560 36,934 62,4341996 Average .................... 17,367 1,837 3,131 922 2,944 3,091 – – 5,850 2,568 6,465 37,815 63,8181997 Average .................... 18,095 1,922 3,200 856 3,104 3,142 – – 5,920 2,518 6,452 38,532 65,8061998 Average .................... 19,337 1,981 3,198 834 3,160 3,011 – – 5,854 2,616 6,252 38,685 67,0321999 Average .................... 18,667 1,907 3,195 852 2,998 3,019 – – 6,079 2,684 5,881 38,768 65,9672000 Average .................... 19,892 1,977 3,249 768 3,104 3,222 – – 6,479 2,275 5,822 39,583 68,5222001 Average .................... 19,098 2,029 3,300 720 3,218 3,226 – – 6,917 2,282 5,801 40,003 68,1162002 Average .................... 17,794 2,171 3,390 715 3,263 3,131 – – 7,408 2,292 5,744 40,825 67,2602003 Average .................... 19,063 2,306 3,409 713 3,459 3,042 – – 8,132 2,093 5,649 41,483 69,3692004 Average .................... 20,787 2,398 3,485 673 3,476 2,954 – – 8,805 1,845 5,441 42,155 72,4682005 Average .................... 21,501 2,369 3,609 623 3,423 2,698 – – 9,043 1,649 5,181 41,873 73,6392006 Average .................... 21,232 2,525 3,673 535 3,345 2,491 – – 9,247 1,490 5,088 41,792 73,2682007 Average .................... 20,672 2,628 3,729 530 3,143 2,270 – – 9,437 1,498 5,077 41,730 72,8722008 Average .................... 21,913 2,579 3,790 566 2,839 2,182 – – 9,357 1,391 5,000 41,263 73,6962009 Average .................... 20,402 2,579 3,796 587 2,646 2,067 – – 9,495 1,328 5,353 41,775 72,2972010 Average .................... 21,257 2,741 4,078 575 2,621 1,869 – – 9,694 1,233 5,471 R 42,586 R 74,094
2011 January ...................... 22,026 2,833 4,238 572 2,636 1,905 – – 9,769 1,316 5,482 R 43,039 R 75,427 February .................... 21,934 2,783 4,188 571 2,606 1,861 – – 9,773 1,085 5,386 R 42,572 R 74,554 March ......................... 21,952 2,854 4,160 570 2,624 1,808 – – 9,753 1,073 5,603 R 42,791 R 73,599 April ........................... 22,170 2,854 4,127 569 2,624 1,874 – – 9,795 1,164 5,554 R 42,625 R 73,563 May ............................ 22,220 2,562 4,106 568 2,608 1,607 – – 9,818 1,017 5,619 R 41,844 R 72,811 June ........................... 22,920 2,670 4,017 567 2,595 1,660 – – 9,770 1,018 5,587 R 41,974 R 73,588 July ............................ 23,120 2,913 3,956 566 2,584 1,737 – – 9,837 946 5,420 R 42,060 R 73,920 August ....................... 23,270 3,073 4,027 565 2,601 1,714 – – 9,832 767 5,648 R 42,423 R 74,424 September ................. 23,170 2,993 3,964 564 2,537 1,636 – – 9,557 890 5,595 R 41,722 R 73,773 October ...................... 22,920 3,062 3,926 563 2,601 1,756 – – 9,902 998 5,877 R 42,592 R 74,308 November .................. 23,220 3,043 4,006 562 2,577 1,764 – – 9,595 1,039 6,010 R 42,730 R 75,269 December .................. 23,170 3,155 3,998 561 2,604 1,713 – – 9,869 1,010 6,028 R 43,069 R 75,635 Average .................... 22,678 2,901 4,059 566 2,600 1,752 – – 9,774 1,026 5,652 R 42,455 R 74,239
2012 January ...................... 23,076 3,108 4,022 560 2,566 1,761 – – 9,894 1,021 6,135 R 42,911 R 75,710 February .................... 23,126 3,249 3,986 560 2,591 1,745 – – 9,889 1,034 R 6,239 R 42,869 R 76,027 March ......................... 23,206 3,037 4,015 560 2,600 1,715 – – 9,891 977 R 6,294 R 42,562 R 75,736 April ........................... 23,186 3,155 4,060 560 2,590 1,720 – – 9,861 975 R 6,285 R 42,598 R 76,023 May ............................ 22,881 3,035 4,021 560 2,591 1,699 – – 9,882 899 R 6,331 R 42,362 R 75,370 June ........................... 23,036 3,014 3,963 556 2,588 1,583 – – 9,861 950 R 6,247 R 42,099 R 75,210 July ............................ 22,976 3,114 3,968 554 2,571 1,553 – – 9,882 946 R 6,384 R 42,358 R 75,367 August ....................... 22,976 3,064 4,071 554 2,600 1,570 – – 9,907 792 R 6,305 R 42,163 R 75,388 September ................. 22,896 3,011 4,242 553 2,602 1,309 – – 9,941 601 R 6,569 R 41,989 R 74,901 October ...................... 22,546 3,173 4,217 551 2,584 1,549 – – 9,984 682 R 6,939 R 42,973 R 75,393 November .................. 22,476 3,271 4,232 551 2,622 1,517 – – 10,048 864 R 7,041 R 43,591 R 75,813 December .................. 22,176 3,427 4,224 551 2,606 1,558 – – 10,018 923 R 7,084 R 43,906 R 75,989 Average .................... 22,878 3,138 4,085 556 2,593 1,607 – – 9,922 888 R 6,489 R 42,699 R 75,576
2013 January ...................... 22,127 3,329 4,168 548 2,602 1,545 – – 9,995 R 923 RE 7,043 R 43,418 R 75,398 February .................... 22,127 3,259 4,146 547 2,595 1,502 – – 9,990 R 831 RE 7,132 R 43,328 R 75,219 March ......................... 22,127 3,429 4,164 545 2,555 1,498 – – 9,995 R 812 RE 7,169 R 43,317 R 75,306 April ........................... 22,527 3,237 4,174 543 2,557 1,567 – – 10,002 R 827 RE 7,332 R 43,276 R 75,792 May ............................ 22,627 3,036 4,174 541 2,548 1,563 – – 10,018 R 864 RE 7,298 R 43,171 R 75,818 June ........................... 22,852 R 3,156 4,244 540 2,559 1,386 – – 9,955 R 783 RE 7,242 R 43,348 R 75,662 July ............................ 23,052 3,317 4,043 538 2,522 1,648 – – 10,052 R 790 RE 7,513 R 43,752 R 76,303 August ....................... 23,427 3,470 4,075 536 2,554 1,546 – – 10,064 R 629 RE 7,532 R 43,528 R 76,000 September ................. 22,877 3,679 4,107 534 2,563 1,395 – – 10,082 735 E 7,794 44,264 75,936 9-Month Average ..... 22,642 3,324 4,144 541 2,561 1,518 – – 10,017 799 E 7,340 43,489 75,719
2012 9-Month Average ..... 23,039 3,087 4,038 557 2,589 1,628 – – 9,890 910 6,310 42,434 75,5242011 9-Month Average ..... 22,535 2,838 4,086 568 2,602 1,755 – – 9,768 1,030 5,545 42,339 73,959
a See "Organization of the Petroleum Exporting Countries (OPEC)" in Glossary.On Tables 11.1a and 11.1b, countries are classified as "OPEC" or "Non-OPEC" inall years based on their status in the most current year. For example, Ecuadorrejoined OPEC in 2007, and is thus included in "Total OPEC" for all years; andIndonesia left OPEC at the end of 2008, and is thus included in "Total Non-OPEC"for all years.
b Bahrain, Iran, Iraq, Kuwait, Qatar, Saudi Arabia, United Arab Emirates, andthe Neutral Zone (between Kuwait and Saudi Arabia).
R=Revised. NA=Not available. – – =Not applicable. E=Estimate.
Notes: • Data are for crude oil and lease condensate; they exclude natural gasplant liquids. • Monthly data are often preliminary figures and may not average tothe annual totals because of rounding or because updates to the preliminarymonthly data are not available. • Data for countries may not sum to World totalsdue to independent rounding. • U.S. geographic coverage is the 50 states and theDistrict of Columbia.
Web Page: See http://www.eia.gov/totalenergy/data/monthly/#international(Excel and CSV files) for all available annual and monthly data beginning in 1973.
Sources: See end of section.
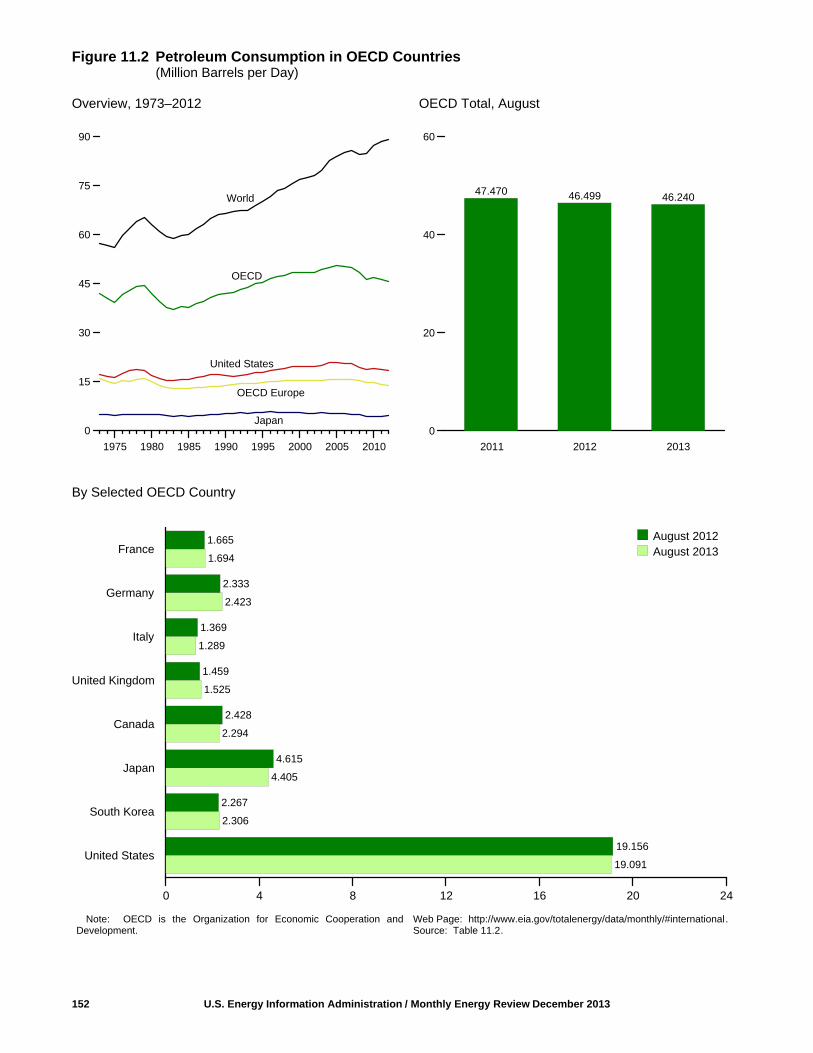
Figure 11.2 Petroleum Consumption in OECD Countries(Million Barrels per Day)
Overview, 1973–2012 OECD Total, August
By Selected OECD Country
152 U.S. Energy Information Administration / Monthly Energy Review December 2013
1975 1980 1985 1990 1995 2000 2005 2010
0
15
30
45
60
75
90
47.470 46.499 46.240
2011 2012 2013
0
20
40
60
World
OECD
United States
OECD Europe
Japan
1.694
2.423
1.289
1.525
2.294
4.405
2.306
19.091
1.665
2.333
1.369
1.459
2.428
4.615
2.267
19.156
France
Germany
Italy
United Kingdom
Canada
Japan
South Korea
United States
0 4 8 12 16 20 24
August 2012August 2013
Note: OECD is the Organization for Economic Cooperation andDevelopment.
Web Page: http://www.eia.gov/totalenergy/data/monthly/#international.Source: Table 11.2.
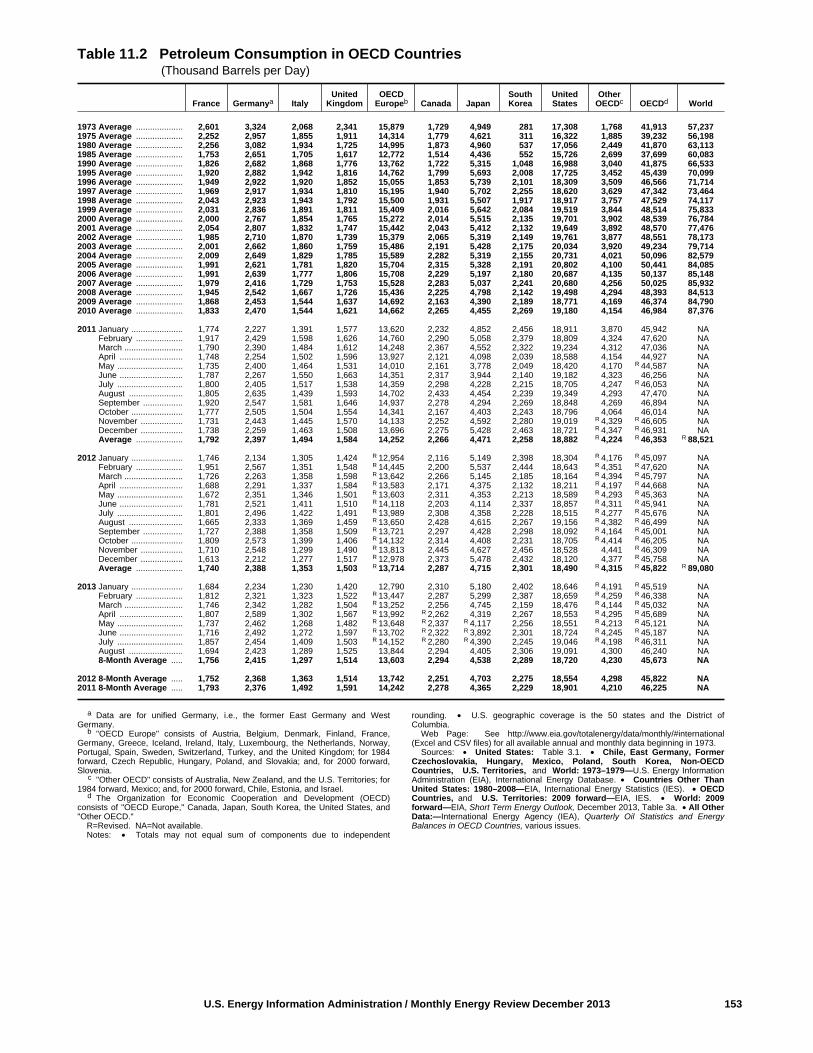
U.S. Energy Information Administration / Monthly Energy Review December 2013 153
Table 11.2 Petroleum Consumption in OECD Countries (Thousand Barrels per Day)
France Germanya ItalyUnited
KingdomOECD
Europeb Canada JapanSouthKorea
UnitedStates
OtherOECDc OECDd World
1973 Average .................... 2,601 3,324 2,068 2,341 15,879 1,729 4,949 281 17,308 1,768 41,913 57,2371975 Average .................... 2,252 2,957 1,855 1,911 14,314 1,779 4,621 311 16,322 1,885 39,232 56,1981980 Average .................... 2,256 3,082 1,934 1,725 14,995 1,873 4,960 537 17,056 2,449 41,870 63,1131985 Average .................... 1,753 2,651 1,705 1,617 12,772 1,514 4,436 552 15,726 2,699 37,699 60,0831990 Average .................... 1,826 2,682 1,868 1,776 13,762 1,722 5,315 1,048 16,988 3,040 41,875 66,5331995 Average .................... 1,920 2,882 1,942 1,816 14,762 1,799 5,693 2,008 17,725 3,452 45,439 70,0991996 Average .................... 1,949 2,922 1,920 1,852 15,055 1,853 5,739 2,101 18,309 3,509 46,566 71,7141997 Average .................... 1,969 2,917 1,934 1,810 15,195 1,940 5,702 2,255 18,620 3,629 47,342 73,4641998 Average .................... 2,043 2,923 1,943 1,792 15,500 1,931 5,507 1,917 18,917 3,757 47,529 74,1171999 Average .................... 2,031 2,836 1,891 1,811 15,409 2,016 5,642 2,084 19,519 3,844 48,514 75,8332000 Average .................... 2,000 2,767 1,854 1,765 15,272 2,014 5,515 2,135 19,701 3,902 48,539 76,7842001 Average .................... 2,054 2,807 1,832 1,747 15,442 2,043 5,412 2,132 19,649 3,892 48,570 77,4762002 Average .................... 1,985 2,710 1,870 1,739 15,379 2,065 5,319 2,149 19,761 3,877 48,551 78,1732003 Average .................... 2,001 2,662 1,860 1,759 15,486 2,191 5,428 2,175 20,034 3,920 49,234 79,7142004 Average .................... 2,009 2,649 1,829 1,785 15,589 2,282 5,319 2,155 20,731 4,021 50,096 82,5792005 Average .................... 1,991 2,621 1,781 1,820 15,704 2,315 5,328 2,191 20,802 4,100 50,441 84,0852006 Average .................... 1,991 2,639 1,777 1,806 15,708 2,229 5,197 2,180 20,687 4,135 50,137 85,1482007 Average .................... 1,979 2,416 1,729 1,753 15,528 2,283 5,037 2,241 20,680 4,256 50,025 85,9322008 Average .................... 1,945 2,542 1,667 1,726 15,436 2,225 4,798 2,142 19,498 4,294 48,393 84,5132009 Average .................... 1,868 2,453 1,544 1,637 14,692 2,163 4,390 2,189 18,771 4,169 46,374 84,7902010 Average .................... 1,833 2,470 1,544 1,621 14,662 2,265 4,455 2,269 19,180 4,154 46,984 87,376
2011 January ...................... 1,774 2,227 1,391 1,577 13,620 2,232 4,852 2,456 18,911 3,870 45,942 NA February .................... 1,917 2,429 1,598 1,626 14,760 2,290 5,058 2,379 18,809 4,324 47,620 NA March ......................... 1,790 2,390 1,484 1,612 14,248 2,367 4,552 2,322 19,234 4,312 47,036 NA April ........................... 1,748 2,254 1,502 1,596 13,927 2,121 4,098 2,039 18,588 4,154 44,927 NA May ............................ 1,735 2,400 1,464 1,531 14,010 2,161 3,778 2,049 18,420 4,170 R 44,587 NA June ........................... 1,787 2,267 1,550 1,663 14,351 2,317 3,944 2,140 19,182 4,323 46,256 NA July ............................ 1,800 2,405 1,517 1,538 14,359 2,298 4,228 2,215 18,705 4,247 R 46,053 NA August ....................... 1,805 2,635 1,439 1,593 14,702 2,433 4,454 2,239 19,349 4,293 47,470 NA September ................. 1,920 2,547 1,581 1,646 14,937 2,278 4,294 2,269 18,848 4,269 46,894 NA October ...................... 1,777 2,505 1,504 1,554 14,341 2,167 4,403 2,243 18,796 4,064 46,014 NA November .................. 1,731 2,443 1,445 1,570 14,133 2,252 4,592 2,280 19,019 R 4,329 R 46,605 NA December .................. 1,738 2,259 1,463 1,508 13,696 2,275 5,428 2,463 18,721 R 4,347 R 46,931 NA Average .................... 1,792 2,397 1,494 1,584 14,252 2,266 4,471 2,258 18,882 R 4,224 R 46,353 R 88,521
2012 January ...................... 1,746 2,134 1,305 1,424 R 12,954 2,116 5,149 2,398 18,304 R 4,176 R 45,097 NA February .................... 1,951 2,567 1,351 1,548 R 14,445 2,200 5,537 2,444 18,643 R 4,351 R 47,620 NA March ......................... 1,726 2,263 1,358 1,598 R 13,642 2,266 5,145 2,185 18,164 R 4,394 R 45,797 NA April ........................... 1,688 2,291 1,337 1,584 R 13,583 2,171 4,375 2,132 18,211 R 4,197 R 44,668 NA May ............................ 1,672 2,351 1,346 1,501 R 13,603 2,311 4,353 2,213 18,589 R 4,293 R 45,363 NA June ........................... 1,781 2,521 1,411 1,510 R 14,118 2,203 4,114 2,337 18,857 R 4,311 R 45,941 NA July ............................ 1,801 2,496 1,422 1,491 R 13,989 2,308 4,358 2,228 18,515 R 4,277 R 45,676 NA August ....................... 1,665 2,333 1,369 1,459 R 13,650 2,428 4,615 2,267 19,156 R 4,382 R 46,499 NA September ................. 1,727 2,388 1,358 1,509 R 13,721 2,297 4,428 2,298 18,092 R 4,164 R 45,001 NA October ...................... 1,809 2,573 1,399 1,406 R 14,132 2,314 4,408 2,231 18,705 R 4,414 R 46,205 NA November .................. 1,710 2,548 1,299 1,490 R 13,813 2,445 4,627 2,456 18,528 4,441 R 46,309 NA December .................. 1,613 2,212 1,277 1,517 R 12,978 2,373 5,478 2,432 18,120 4,377 R 45,758 NA Average .................... 1,740 2,388 1,353 1,503 R 13,714 2,287 4,715 2,301 18,490 R 4,315 R 45,822 R 89,080
2013 January ...................... 1,684 2,234 1,230 1,420 12,790 2,310 5,180 2,402 18,646 R 4,191 R 45,519 NA February .................... 1,812 2,321 1,323 1,522 R 13,447 2,287 5,299 2,387 18,659 R 4,259 R 46,338 NA March ......................... 1,746 2,342 1,282 1,504 R 13,252 2,256 4,745 2,159 18,476 R 4,144 R 45,032 NA April ........................... 1,807 2,589 1,302 1,567 R 13,992 R 2,262 4,319 2,267 18,553 R 4,295 R 45,689 NA May ............................ 1,737 2,462 1,268 1,482 R 13,648 R 2,337 R 4,117 2,256 18,551 R 4,213 R 45,121 NA June ........................... 1,716 2,492 1,272 1,597 R 13,702 R 2,322 R 3,892 2,301 18,724 R 4,245 R 45,187 NA July ............................ 1,857 2,454 1,409 1,503 R 14,152 R 2,280 R 4,390 2,245 19,046 R 4,198 R 46,311 NA August ....................... 1,694 2,423 1,289 1,525 13,844 2,294 4,405 2,306 19,091 4,300 46,240 NA 8-Month Average ..... 1,756 2,415 1,297 1,514 13,603 2,294 4,538 2,289 18,720 4,230 45,673 NA
2012 8-Month Average ..... 1,752 2,368 1,363 1,514 13,742 2,251 4,703 2,275 18,554 4,298 45,822 NA2011 8-Month Average ..... 1,793 2,376 1,492 1,591 14,242 2,278 4,365 2,229 18,901 4,210 46,225 NA
a Data are for unified Germany, i.e., the former East Germany and WestGermany.
b "OECD Europe" consists of Austria, Belgium, Denmark, Finland, France,Germany, Greece, Iceland, Ireland, Italy, Luxembourg, the Netherlands, Norway,Portugal, Spain, Sweden, Switzerland, Turkey, and the United Kingdom; for 1984forward, Czech Republic, Hungary, Poland, and Slovakia; and, for 2000 forward,Slovenia.
c "Other OECD" consists of Australia, New Zealand, and the U.S. Territories; for1984 forward, Mexico; and, for 2000 forward, Chile, Estonia, and Israel.
d The Organization for Economic Cooperation and Development (OECD)consists of "OECD Europe," Canada, Japan, South Korea, the United States, and"Other OECD."
R=Revised. NA=Not available. Notes: • Totals may not equal sum of components due to independent
rounding. • U.S. geographic coverage is the 50 states and the District ofColumbia.
Web Page: See http://www.eia.gov/totalenergy/data/monthly/#international(Excel and CSV files) for all available annual and monthly data beginning in 1973.
Sources: • United States: Table 3.1. • Chile, East Germany, FormerCzechoslovakia, Hungary, Mexico, Poland, South Korea, Non-OECDCountries, U.S. Territories, and World: 1973–1979—U.S. Energy InformationAdministration (EIA), International Energy Database. • Countries Other ThanUnited States: 1980–2008—EIA, International Energy Statistics (IES). • OECDCountries, and U.S. Territories: 2009 forward—EIA, IES. • World: 2009forward—EIA, Short Term Energy Outlook, December 2013, Table 3a. • All OtherData:—International Energy Agency (IEA), Quarterly Oil Statistics and EnergyBalances in OECD Countries, various issues.

Figure 11.3 Petroleum Stocks in OECD Countries(Billion Barrels)
Overview, End of Year, 1973–2012 OECD Stocks, End of Month, August
By Selected OECD Country, End of Month
154 U.S. Energy Information Administration / Monthly Energy Review December 2013
OECD Europe
1975 1980 1985 1990 1995 2000 2005 2010
0
1
2
3
4
5
4.223 4.241 4.225
2011 2012 2013
0
1
2
3
4
5
OECD
United States
Japan
0.167
0.288
0.126
0.083
0.176
0.576
0.188
1.821
0.168
0.284
0.138
0.082
0.177
0.603
0.179
1.801
France
Germany
Italy
United Kingdom
Canada
Japan
South Korea
United States
0.0 0.2 0.4 0.6 0.8 1.0 1.2 1.4 1.6 1.8 2.0
August 2012August 2013
Note: OECD is the Organization for Economic Cooperation and Development.Web Page: http://www.eia.gov/totalenergy/data/monthly/#international.Source: Table 11.3.

U.S. Energy Information Administration / Monthly Energy Review December 2013 155
Table 11.3 Petroleum Stocks in OECD Countries (Million Barrels)
France Germanya ItalyUnited
KingdomOECD
Europeb Canada JapanSouthKorea
UnitedStates
OtherOECDc OECDd
1973 Year ......................... 201 181 152 156 1,070 140 303 NA 1,008 67 2,5881975 Year ......................... 225 187 143 165 1,154 174 375 NA 1,133 67 2,9031980 Year ......................... 243 319 170 168 1,464 164 495 NA 1,392 72 3,5871985 Year ......................... 139 277 156 131 1,154 112 500 13 1,519 119 3,4171990 Year ......................... 143 280 171 103 1,222 143 572 64 1,621 126 3,7491995 Year ......................... 155 302 162 101 1,256 132 631 92 1,563 122 3,7951996 Year ......................... 154 303 152 103 1,259 127 651 123 1,507 127 3,7941997 Year ......................... 161 299 147 100 1,271 144 685 124 1,560 123 3,9071998 Year ......................... 169 323 153 104 1,355 139 649 129 1,647 120 4,0391999 Year ......................... 160 290 148 101 1,258 141 629 132 1,493 114 3,7662000 Year ......................... 170 272 157 100 1,318 143 634 140 1,468 126 3,8292001 Year ......................... 165 273 151 113 1,306 154 634 143 1,586 120 3,9442002 Year ......................... 170 253 156 104 1,273 155 615 140 1,548 112 3,8432003 Year ......................... 179 273 153 100 1,316 165 636 155 1,568 105 3,9452004 Year ......................... 177 267 154 101 1,319 154 635 149 1,645 108 4,0102005 Year ......................... 185 283 151 95 1,371 168 612 135 1,698 112 4,0952006 Year ......................... 182 283 153 103 1,404 169 631 152 1,720 113 4,1872007 Year ......................... 180 275 152 92 1,389 163 621 143 1,665 121 4,1032008 Year ......................... 179 279 148 93 1,431 162 629 135 1,737 124 4,2182009 Year ......................... 175 284 146 89 1,424 157 589 155 1,776 118 4,2192010 Year ......................... 168 287 143 83 1,385 184 587 165 1,794 120 4,234
2011 January .................... 173 291 148 90 1,425 174 596 168 1,809 120 4,291 February .................. 170 288 139 89 1,395 169 591 162 1,780 122 4,221 March ....................... 167 286 140 87 1,384 172 580 170 1,776 118 4,199 April ......................... 163 291 141 89 1,372 179 601 173 1,779 125 4,228 May .......................... 168 288 137 85 1,372 177 598 170 1,807 124 4,248 June ......................... 167 286 139 79 1,366 177 593 175 1,809 121 4,241 July .......................... 164 290 139 81 1,355 177 599 173 1,816 124 4,243 August ..................... 162 283 140 83 1,359 176 598 171 1,796 124 4,223 September ............... 160 277 138 78 1,337 176 601 174 1,781 121 4,190 October .................... 165 278 138 79 1,327 178 599 174 1,769 120 4,167 November ................ 164 277 140 86 1,342 179 603 170 1,770 117 4,182 December ............... 165 281 135 80 1,330 178 589 167 1,750 117 4,130
2012 January .................... 166 288 138 84 1,359 178 594 164 1,773 121 4,188 February .................. 165 286 138 84 1,356 180 583 171 1,767 113 4,172 March ....................... 165 284 139 82 1,367 171 580 164 1,783 113 4,178 April ......................... 163 284 137 85 1,359 170 592 174 1,784 115 4,195 May .......................... 162 281 137 82 1,338 172 597 183 1,796 117 4,202 June ......................... 164 280 134 82 1,340 170 601 177 1,810 112 4,210 July .......................... 163 285 132 80 1,350 173 608 181 1,813 116 4,241 August ..................... 168 284 138 82 1,367 177 603 179 1,801 114 4,241 September ............... 164 283 143 75 1,349 180 606 184 1,819 117 4,254 October .................... 160 282 141 75 1,330 175 614 180 1,810 110 4,219 November ................ 160 287 138 85 1,345 174 604 177 1,810 106 4,217 December ............... 162 287 126 81 1,337 R 174 590 175 1,808 108 R 4,192
2013 January .................... 162 292 130 86 R 1,381 R 172 591 179 1,812 105 4,242 February .................. 162 289 130 81 R 1,374 R 174 581 176 1,791 110 R 4,207 March ....................... 161 291 130 79 R 1,371 R 170 589 188 1,793 114 R 4,226 April ......................... 159 289 132 84 1,370 172 596 176 1,807 114 R 4,235 May .......................... 163 291 121 80 R 1,345 170 592 177 1,817 112 R 4,213 June ......................... 166 288 126 83 R 1,346 174 586 182 1,818 116 R 4,222 July .......................... 166 289 125 83 R 1,358 R 175 577 189 1,818 115 R 4,231 August ..................... 167 288 126 83 1,349 176 576 188 1,821 115 4,225
a Through December 1983, the data for Germany are for the former WestGermany only. Beginning with January 1984, the data for Germany are for theunified Germany, i.e., the former East Germany and West Germany.
b "OECD Europe" consists of Austria, Belgium, Denmark, Finland, France,Germany, Greece, Iceland, Ireland, Italy, Luxembourg, the Netherlands, Norway,Portugal, Spain, Sweden, Switzerland, Turkey, and the United Kingdom; for 1984forward, Czech Republic, Hungary, Poland, and Slovakia; and, for 2000 forward,Slovenia.
c "Other OECD" consists of Australia, New Zealand, and the U.S. Territories; for1984 forward, Mexico; and, for 2000 forward, Chile, Estonia, and Israel.
d The Organization for Economic Cooperation and Development (OECD)consists of "OECD Europe," Canada, Japan, South Korea, the United States, and"Other OECD."
R=Revised. NA=Not available. Notes: • Stocks are at end of period. • Petroleum stocks include crude oil
(including strategic reserves), unfinished oils, natural gas plant liquids, and refinedproducts. • In the United States in January 1975, 1981, and 1983, numerousrespondents were added to bulk terminal and pipeline surveys, thereby affectingsubsequent stocks reported. New-basis end-of-year U.S. stocks, in million barrels,would have been 1,121 in 1974, 1,425 in 1980, and 1,461 in 1982. • Totals maynot equal sum of components due to independent rounding. • U.S. geographiccoverage is the 50 states and the District of Columbia.
Web Page: See http://www.eia.gov/totalenergy/data/monthly/#international(Excel and CSV files) for all available annual and monthly data beginning in 1973.
Sources: • United States: Table 3.4. • U.S. Territories: 1983forward—U.S. Energy Information Administration, International Energy Database.• All Other Data: 1973–1982—International Energy Agency (IEA), Quarterly OilStatistics and Energy Balances, various issues. 1983—IEA, Monthly Oil and GasStatistics Database. 1984 forward—IEA, Monthly Oil Data Service, December 11,2013.

International Petroleum
Tables 11.1a and 11.1b Sources
United StatesTable 3.1.
All Other Countries and World, Annual Data1973–1979: U.S. Energy Information Administration (EIA),International Energy Annual 1981, Table 8. 1980 forward: EIA, International Energy Database, December2013.
All Other Countries and World, Monthly Data 1973–1980: Petroleum Intelligence Weekly (PIW), Oil &Gas Journal (OGJ), and EIA adjustments.1981–1993: PIW, OGJ, and other industry sources.1994 forward: EIA, International Energy Database, December2013.
156 U.S. Energy Information Administration / Monthly Energy Review December 2013

.
12. Environment
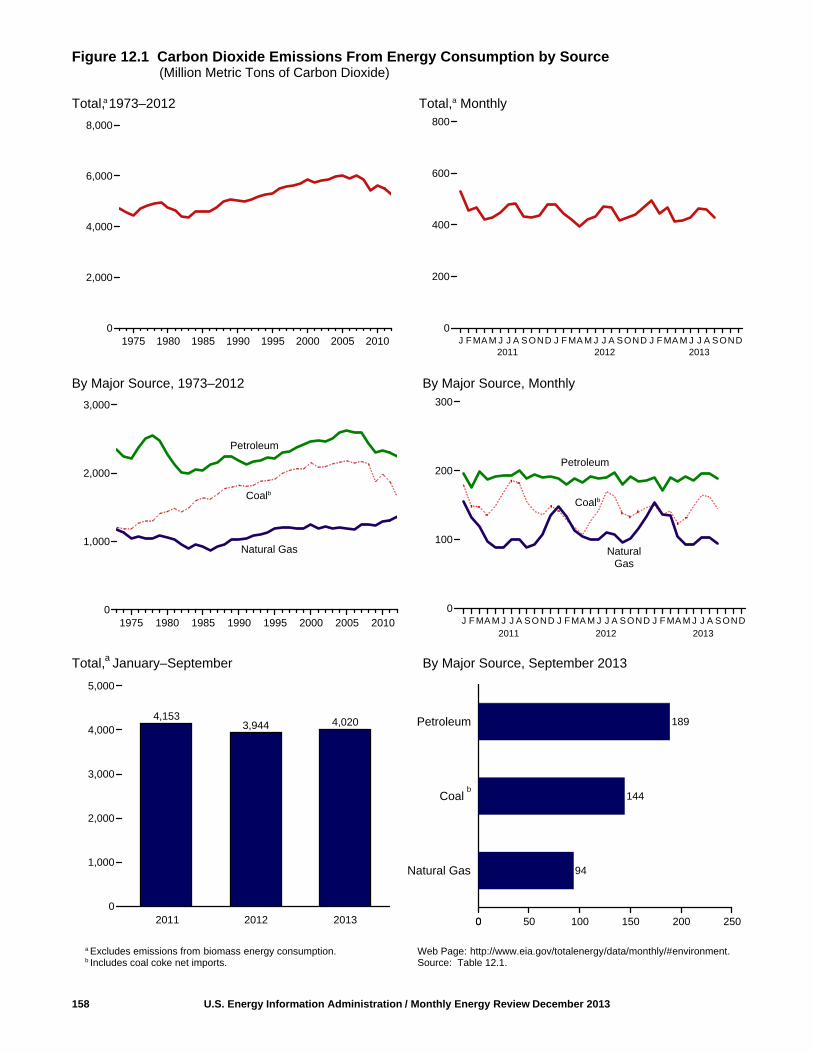
Figure 12.1 Carbon Dioxide Emissions From Energy Consumption by Source (Million Metric Tons of Carbon Dioxide)
Total, 1973–2012 Total,a Monthly
By Major Source, 1973–2012 By Major Source, Monthly
Total, January–September By Major Source, September 2013
158 U.S. Energy Information Administration / Monthly Energy Review December 2013
Natural Gas
189
144
94
Petroleum
Coal
Natural Gas
0 50 100 150 200 2500
J F MA M J J A SOND J F MA M J J A SOND J F MA M J J A SOND0
100
200
300
Coalb
Petroleum
b
a
a
1975 1980 1985 1990 1995 2000 2005 20100
2,000
4,000
6,000
8,000
J F MA M J J A SOND J F MA M J J A SOND J F MA M J J A SOND0
200
400
600
800
2011 2012 2013
1975 1980 1985 1990 1995 2000 2005 20100
1,000
2,000
3,000
Petroleum
Coalb
NaturalGas
2011 2012 2013
4,1533,944 4,020
2011 2012 20130
1,000
2,000
3,000
4,000
5,000
a Excludes emissions from biomass energy consumption.b Includes coal coke net imports.
Web Page: http://www.eia.gov/totalenergy/data/monthly/#environment.Source: Table 12.1.

U.S. Energy Information Administration / Monthly Energy Review December 2013 159
Table 12.1 Carbon Dioxide Emissions From Energy Consumption by Source (Million Metric Tons of Carbon Dioxidea)
CoalbNatural
Gasc
Petroleum
Totalh,iAviationGasoline
DistillateFuel Oild
JetFuel
Kero-sene LPGe
Lubri-cants
MotorGasolinef
PetroleumCoke
ResidualFuel Oil Otherg Total
1973 Total .................... 1,207 1,178 6 480 155 32 92 13 911 54 508 100 2,350 4,7351975 Total .................... 1,181 1,046 5 443 146 24 82 11 911 51 443 97 2,212 4,4391980 Total .................... 1,436 1,061 4 446 156 24 87 13 900 49 453 142 2,275 4,7711985 Total .................... 1,638 926 3 445 178 17 87 12 930 54 216 93 2,036 4,6001990 Total .................... 1,821 1,024 3 470 223 6 67 13 988 70 220 127 2,187 5,0391995 Total .................... 1,913 1,183 3 498 222 8 80 13 1,044 76 152 121 2,216 5,3231996 Total .................... 1,995 1,204 3 525 232 9 86 12 1,063 79 152 139 2,300 5,5101997 Total .................... 2,040 1,210 3 534 234 10 87 13 1,075 80 142 145 2,323 5,5841998 Total .................... 2,064 1,189 2 538 238 12 82 14 1,107 93 158 128 2,372 5,6351999 Total .................... 2,062 1,193 3 555 245 11 90 14 1,127 96 148 133 2,422 5,6882000 Total .................... 2,155 1,243 3 580 254 10 97 14 1,135 86 163 118 2,459 5,8682001 Total .................... 2,088 1,188 2 598 243 11 88 13 1,151 89 144 135 2,474 5,7612002 Total .................... 2,095 1,227 2 587 237 6 91 12 1,183 96 125 130 2,470 5,8042003 Total .................... 2,136 1,193 2 610 231 8 87 11 1,188 96 138 142 2,514 5,8552004 Total .................... 2,160 1,200 2 632 240 10 87 12 1,214 107 155 144 2,603 5,9752005 Total .................... 2,182 1,183 2 640 246 10 84 12 1,214 106 165 143 2,623 5,9992006 Total .................... 2,147 1,168 2 648 240 8 80 11 1,224 106 122 152 2,593 5,9202007 Total .................... 2,172 1,243 2 652 238 5 83 12 1,227 100 129 150 2,596 6,0232008 Total .................... 2,140 1,253 2 615 226 2 79 11 1,166 93 111 132 2,437 5,8422009 Total .................... 1,876 1,230 2 564 204 3 78 10 1,157 87 91 112 2,307 5,4242010 Total .................... 1,986 1,290 2 590 210 3 79 11 1,146 81 96 122 2,339 5,627
2011 January ................ 180 155 (s) 52 17 (s) 9 1 91 7 9 10 196 531 February .............. 149 131 (s) 47 15 1 8 1 84 5 8 8 175 456 March ................... 148 120 (s) 53 17 (s) 7 1 95 6 7 11 199 468 April ..................... 136 98 (s) 48 18 (s) 6 1 92 6 7 10 188 422 May ...................... 148 89 (s) 49 18 (s) 6 1 95 8 7 8 191 429 June ..................... 168 88 (s) 50 19 (s) 6 1 95 7 7 9 192 449 July ...................... 186 101 (s) 47 18 (s) 6 1 98 7 5 11 193 480 August ................. 183 101 (s) 53 19 (s) 6 1 96 8 5 10 200 484 September ........... 154 88 (s) 50 17 (s) 6 1 92 6 7 10 189 432 October ................ 141 93 (s) 53 17 (s) 7 1 93 7 6 10 194 429 November ............ 136 108 (s) 52 17 (s) 7 1 89 7 6 11 190 435 December ............ 149 135 (s) 51 17 (s) 8 1 94 4 8 10 192 477 Total .................... 1,876 1,306 2 603 209 2 84 10 1,113 78 82 118 2,301 5,494
2012 January ................ 142 148 (s) 51 16 (s) 8 1 89 7 7 9 189 R 479 February .............. 127 134 (s) 48 16 (s) 8 1 87 5 6 10 180 443 March ................... 118 114 (s) 49 17 (s) 7 1 93 6 6 9 188 421 April ..................... 107 R 104 (s) 47 16 (s) 6 1 91 6 6 8 182 395 May ...................... 127 100 (s) 49 18 (s) 7 1 97 7 5 8 191 R 419 June ..................... R 142 100 (s) 47 19 (s) 6 1 94 7 5 10 189 432 July ...................... 170 111 (s) 47 18 (s) 6 1 95 6 7 10 190 R 472 August ................. 163 107 (s) 49 18 (s) 7 1 99 7 6 10 197 R 468 September ........... 138 R 96 (s) 47 17 (s) 7 1 90 7 5 7 180 R 415 October ................ R 133 R 101 (s) 50 17 (s) 8 1 94 6 5 11 191 427 November ............ 140 116 (s) 49 17 (s) 8 1 89 7 5 11 185 441 December ............ 146 R 134 (s) 46 17 (s) 9 1 91 7 3 12 185 R 467 Total .................... R 1,654 R 1,365 2 579 206 1 87 9 1,107 78 66 114 2,248 R 5,279
2013 January ................ 150 154 (s) 53 16 (s) 10 1 89 7 5 10 191 496 February .............. 136 137 (s) 47 15 (s) 9 1 82 5 4 9 172 445 March ................... 142 134 (s) 49 17 (s) 9 1 93 6 7 8 190 467 April ..................... 124 104 (s) 49 17 (s) 7 1 91 5 4 10 185 414 May ...................... 131 93 (s) 49 18 (s) 6 1 97 7 3 11 192 417 June ..................... 150 92 (s) 46 17 (s) 6 1 93 7 4 10 186 429 July ...................... 165 102 (s) 46 19 (s) 7 1 98 7 5 12 195 463 August ................. 162 102 (s) 48 19 (s) 7 1 98 8 6 9 196 461 September ........... 144 94 (s) 47 17 (s) 7 1 93 7 5 12 189 429 9-Month Total ..... 1,303 1,014 1 435 155 1 68 8 835 57 44 92 1,695 4,020
2012 9-Month Total ..... 1,235 1,014 1 434 155 1 63 7 834 59 53 80 1,687 3,9442011 9-Month Total ..... 1,450 970 1 448 158 2 61 8 837 60 62 87 1,724 4,153
a Metric tons of carbon dioxide can be converted to metric tons of carbonequivalent by multiplying by 12/44.
b Includes coal coke net imports.c Natural gas, excluding supplemental gaseous fuels.d Distillate fuel oil, excluding biodiesel.e Liquefied petroleum gases.f Finished motor gasoline, excluding fuel ethanol.
g Aviation gasoline blending components, crude oil, motor gasoline blendingcomponents, pentanes plus, petrochemical feedstocks, special naphthas, still gas,unfinished oils, waxes, and miscellaneous petroleum products.
h Includes electric power sector use of geothermal energy and non-biomasswaste. See Table 12.6.
i Excludes emissions from biomass energy consumption. See Table 12.7.
R=Revised. (s)=Less than 0.5 million metric tons. Notes: • Data are estimates for carbon dioxide emissions from energy
consumption, including the nonfuel use of fossil fuels. See "Section 12Methodology and Sources" at end of section. • See "Carbon Dioxide" in Glossary.• See Note 1, "Emissions of Carbon Dioxide and Other Greenhouse Gases," atend of section. • Data exclude emissions from biomass energy consumption. SeeTable 12.7 and Note 2, "Accounting for Carbon Dioxide Emissions From BiomassEnergy Combustion," at end of section. • Totals may not equal sum ofcomponents due to independent rounding. • Geographic coverage is the 50 statesand the District of Columbia.
Web Page: See http://www.eia.gov/totalenergy/data/monthly/#environment(Excel and CSV files) for all available annual and monthly data beginning in 1973.
Sources: See end of section.
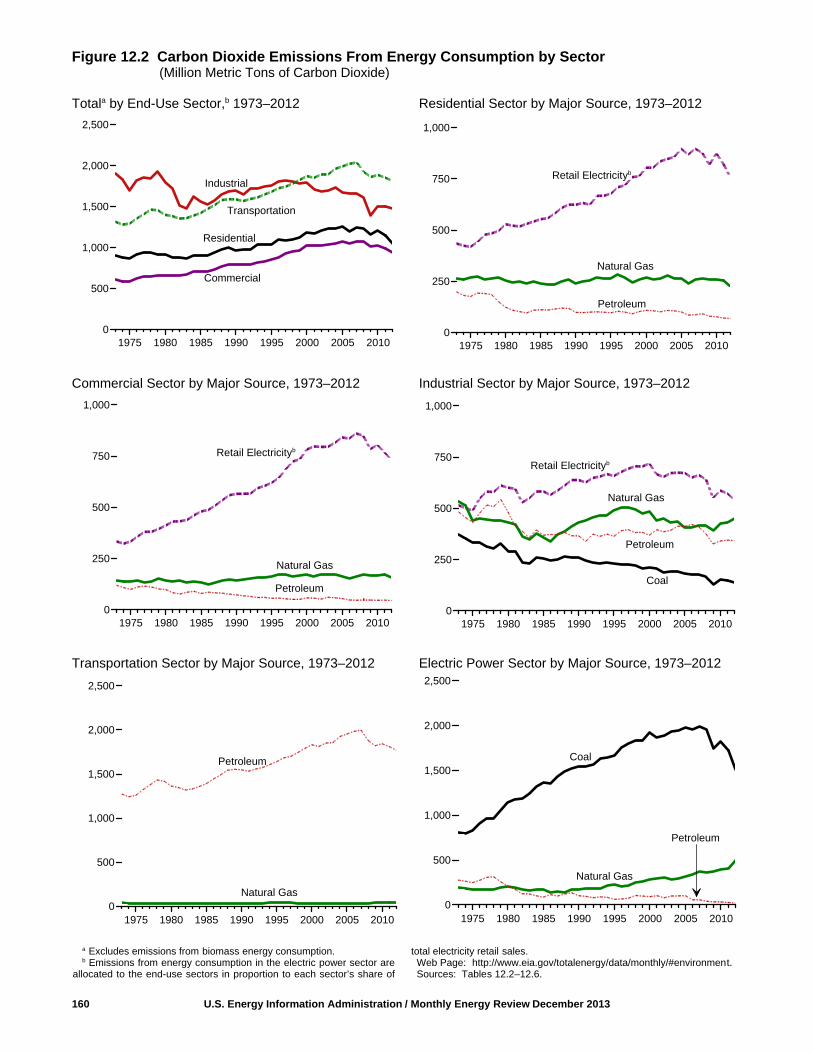
Figure 12.2 Carbon Dioxide Emissions From Energy Consumption by Sector (Million Metric Tons of Carbon Dioxide)
Totala by End-Use Sector,b 1973–2012 Residential Sector by Major Source, 1973–2012
Commercial Sector by Major Source, 1973–2012 Industrial Sector by Major Source, 1973–2012
Transportation Sector by Major Source, 1973–2012 Electric Power Sector by Major Source, 1973–2012
160 U.S. Energy Information Administration / Monthly Energy Review December 2013
1975 1980 1985 1990 1995 2000 2005 20100
500
1,000
1,500
2,000
2,500
1975 1980 1985 1990 1995 2000 2005 20100
250
500
750
1,000
Petroleum
Natural Gas
Retail Electricityb
Industrial
Transportation
Residential
Commercial
Retail Electricityb
1975 1980 1985 1990 1995 2000 2005 20100
250
500
750
1,000
1975 1980 1985 1990 1995 2000 2005 20100
250
500
750
1,000
Retail Electricityb
CoalPetroleum
Natural Gas
Natural Gas
1975 1980 1985 1990 1995 2000 2005 20100
500
1,000
1,500
2,000
2,500
Base Gas
1975 1980 1985 1990 1995 2000 2005 20100
500
1,000
1,500
2,000
2,500
Petroleum
Petroleum Coal
Natural Gas
Petroleum
Natural Gas
a Excludes emissions from biomass energy consumption.b Emissions from energy consumption in the electric power sector are
allocated to the end-use sectors in proportion to each sector’s share of
total electricity retail sales. Web Page: http://www.eia.gov/totalenergy/data/monthly/#environment. Sources: Tables 12.2–12.6.
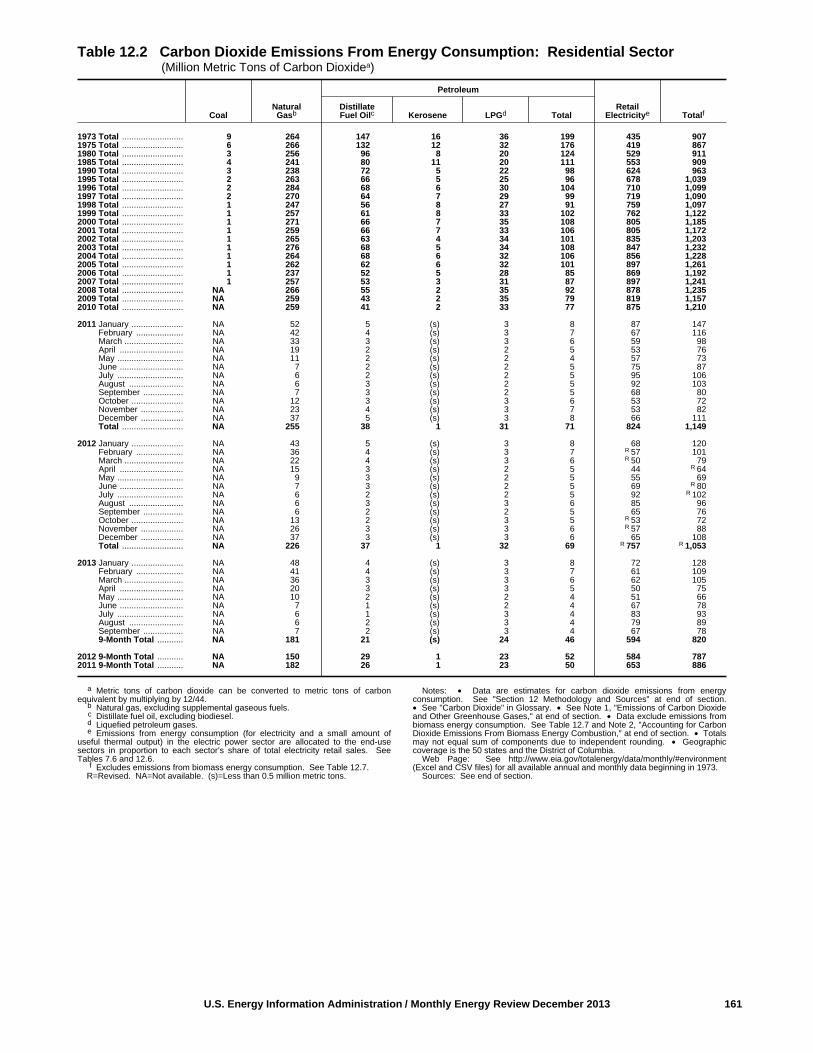
U.S. Energy Information Administration / Monthly Energy Review December 2013 161
Table 12.2 Carbon Dioxide Emissions From Energy Consumption: Residential Sector (Million Metric Tons of Carbon Dioxidea)
CoalNaturalGasb
Petroleum
RetailElectricitye Totalf
DistillateFuel Oilc Kerosene LPGd Total
1973 Total .......................... 9 264 147 16 36 199 435 9071975 Total .......................... 6 266 132 12 32 176 419 8671980 Total .......................... 3 256 96 8 20 124 529 9111985 Total .......................... 4 241 80 11 20 111 553 9091990 Total .......................... 3 238 72 5 22 98 624 9631995 Total .......................... 2 263 66 5 25 96 678 1,0391996 Total .......................... 2 284 68 6 30 104 710 1,0991997 Total .......................... 2 270 64 7 29 99 719 1,0901998 Total .......................... 1 247 56 8 27 91 759 1,0971999 Total .......................... 1 257 61 8 33 102 762 1,1222000 Total .......................... 1 271 66 7 35 108 805 1,1852001 Total .......................... 1 259 66 7 33 106 805 1,1722002 Total .......................... 1 265 63 4 34 101 835 1,2032003 Total .......................... 1 276 68 5 34 108 847 1,2322004 Total .......................... 1 264 68 6 32 106 856 1,2282005 Total .......................... 1 262 62 6 32 101 897 1,2612006 Total .......................... 1 237 52 5 28 85 869 1,1922007 Total .......................... 1 257 53 3 31 87 897 1,2412008 Total .......................... NA 266 55 2 35 92 878 1,2352009 Total .......................... NA 259 43 2 35 79 819 1,1572010 Total .......................... NA 259 41 2 33 77 875 1,210
2011 January ...................... NA 52 5 (s) 3 8 87 147 February .................... NA 42 4 (s) 3 7 67 116 March ......................... NA 33 3 (s) 3 6 59 98 April ........................... NA 19 2 (s) 2 5 53 76 May ............................ NA 11 2 (s) 2 4 57 73 June ........................... NA 7 2 (s) 2 5 75 87 July ............................ NA 6 2 (s) 2 5 95 106 August ....................... NA 6 3 (s) 2 5 92 103 September ................. NA 7 3 (s) 2 5 68 80 October ...................... NA 12 3 (s) 3 6 53 72 November .................. NA 23 4 (s) 3 7 53 82 December .................. NA 37 5 (s) 3 8 66 111 Total .......................... NA 255 38 1 31 71 824 1,149
2012 January ...................... NA 43 5 (s) 3 8 68 120 February .................... NA 36 4 (s) 3 7 R 57 101 March ......................... NA 22 4 (s) 3 6 R 50 79 April ........................... NA 15 3 (s) 2 5 44 R 64 May ............................ NA 9 3 (s) 2 5 55 69 June ........................... NA 7 3 (s) 2 5 69 R 80 July ............................ NA 6 2 (s) 2 5 92 R 102 August ....................... NA 6 3 (s) 3 6 85 96 September ................. NA 6 2 (s) 2 5 65 76 October ...................... NA 13 2 (s) 3 5 R 53 72 November .................. NA 26 3 (s) 3 6 R 57 88 December .................. NA 37 3 (s) 3 6 65 108 Total .......................... NA 226 37 1 32 69 R 757 R 1,053
2013 January ...................... NA 48 4 (s) 3 8 72 128 February .................... NA 41 4 (s) 3 7 61 109 March ......................... NA 36 3 (s) 3 6 62 105 April ........................... NA 20 3 (s) 3 5 50 75 May ............................ NA 10 2 (s) 2 4 51 66 June ........................... NA 7 1 (s) 2 4 67 78 July ............................ NA 6 1 (s) 3 4 83 93 August ....................... NA 6 2 (s) 3 4 79 89 September ................. NA 7 2 (s) 3 4 67 78 9-Month Total ........... NA 181 21 (s) 24 46 594 820
2012 9-Month Total ........... NA 150 29 1 23 52 584 7872011 9-Month Total ........... NA 182 26 1 23 50 653 886
a Metric tons of carbon dioxide can be converted to metric tons of carbonequivalent by multiplying by 12/44.
b Natural gas, excluding supplemental gaseous fuels.c Distillate fuel oil, excluding biodiesel.d Liquefied petroleum gases.e Emissions from energy consumption (for electricity and a small amount of
useful thermal output) in the electric power sector are allocated to the end-usesectors in proportion to each sector’s share of total electricity retail sales. SeeTables 7.6 and 12.6.
f Excludes emissions from biomass energy consumption. See Table 12.7.R=Revised. NA=Not available. (s)=Less than 0.5 million metric tons.
Notes: • Data are estimates for carbon dioxide emissions from energyconsumption. See "Section 12 Methodology and Sources" at end of section.• See "Carbon Dioxide" in Glossary. • See Note 1, "Emissions of Carbon Dioxideand Other Greenhouse Gases," at end of section. • Data exclude emissions frombiomass energy consumption. See Table 12.7 and Note 2, "Accounting for CarbonDioxide Emissions From Biomass Energy Combustion," at end of section. • Totalsmay not equal sum of components due to independent rounding. • Geographiccoverage is the 50 states and the District of Columbia.
Web Page: See http://www.eia.gov/totalenergy/data/monthly/#environment(Excel and CSV files) for all available annual and monthly data beginning in 1973.
Sources: See end of section.
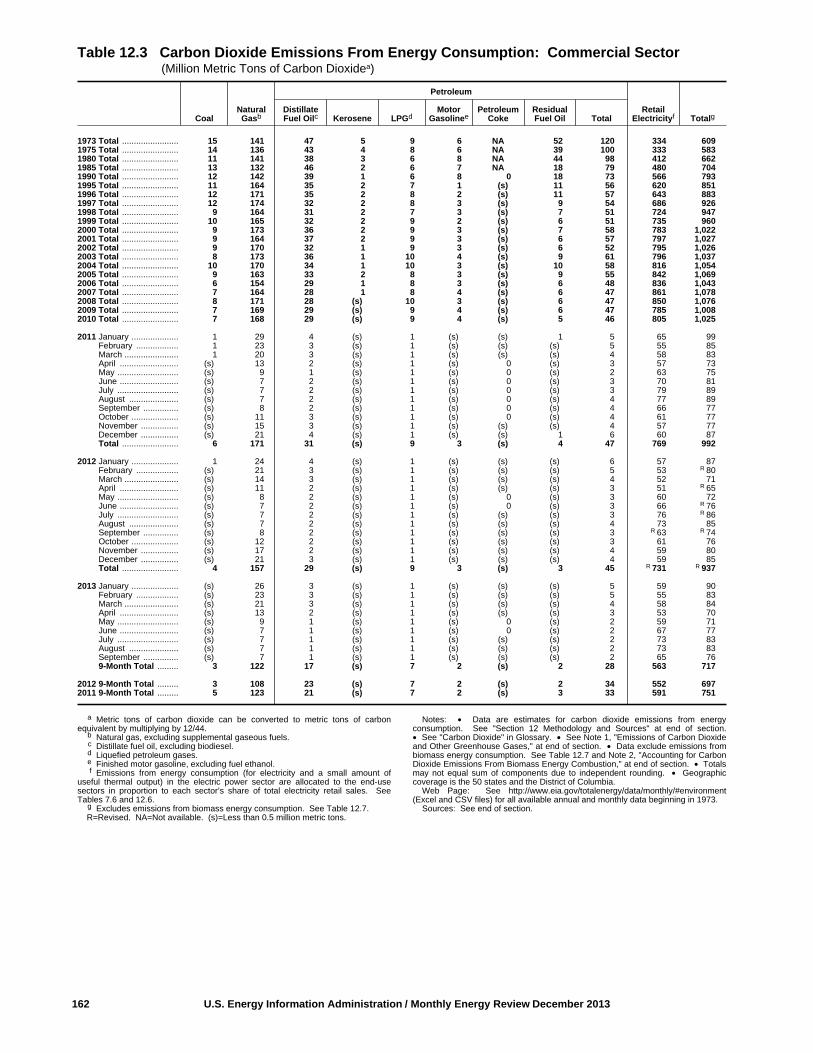
162 U.S. Energy Information Administration / Monthly Energy Review December 2013
Table 12.3 Carbon Dioxide Emissions From Energy Consumption: Commercial Sector (Million Metric Tons of Carbon Dioxidea)
CoalNaturalGasb
Petroleum
RetailElectricityf Totalg
DistillateFuel Oilc Kerosene LPGd
MotorGasolinee
PetroleumCoke
ResidualFuel Oil Total
1973 Total ........................ 15 141 47 5 9 6 NA 52 120 334 6091975 Total ........................ 14 136 43 4 8 6 NA 39 100 333 5831980 Total ........................ 11 141 38 3 6 8 NA 44 98 412 6621985 Total ........................ 13 132 46 2 6 7 NA 18 79 480 7041990 Total ........................ 12 142 39 1 6 8 0 18 73 566 7931995 Total ........................ 11 164 35 2 7 1 (s) 11 56 620 8511996 Total ........................ 12 171 35 2 8 2 (s) 11 57 643 8831997 Total ........................ 12 174 32 2 8 3 (s) 9 54 686 9261998 Total ........................ 9 164 31 2 7 3 (s) 7 51 724 9471999 Total ........................ 10 165 32 2 9 2 (s) 6 51 735 9602000 Total ........................ 9 173 36 2 9 3 (s) 7 58 783 1,0222001 Total ........................ 9 164 37 2 9 3 (s) 6 57 797 1,0272002 Total ........................ 9 170 32 1 9 3 (s) 6 52 795 1,0262003 Total ........................ 8 173 36 1 10 4 (s) 9 61 796 1,0372004 Total ........................ 10 170 34 1 10 3 (s) 10 58 816 1,0542005 Total ........................ 9 163 33 2 8 3 (s) 9 55 842 1,0692006 Total ........................ 6 154 29 1 8 3 (s) 6 48 836 1,0432007 Total ........................ 7 164 28 1 8 4 (s) 6 47 861 1,0782008 Total ........................ 8 171 28 (s) 10 3 (s) 6 47 850 1,0762009 Total ........................ 7 169 29 (s) 9 4 (s) 6 47 785 1,0082010 Total ........................ 7 168 29 (s) 9 4 (s) 5 46 805 1,025
2011 January .................... 1 29 4 (s) 1 (s) (s) 1 5 65 99 February .................. 1 23 3 (s) 1 (s) (s) (s) 5 55 85 March ....................... 1 20 3 (s) 1 (s) (s) (s) 4 58 83 April ......................... (s) 13 2 (s) 1 (s) 0 (s) 3 57 73 May .......................... (s) 9 1 (s) 1 (s) 0 (s) 2 63 75 June ......................... (s) 7 2 (s) 1 (s) 0 (s) 3 70 81 July .......................... (s) 7 2 (s) 1 (s) 0 (s) 3 79 89 August ..................... (s) 7 2 (s) 1 (s) 0 (s) 4 77 89 September ............... (s) 8 2 (s) 1 (s) 0 (s) 4 66 77 October .................... (s) 11 3 (s) 1 (s) 0 (s) 4 61 77 November ................ (s) 15 3 (s) 1 (s) (s) (s) 4 57 77 December ................ (s) 21 4 (s) 1 (s) (s) 1 6 60 87 Total ........................ 6 171 31 (s) 9 3 (s) 4 47 769 992
2012 January .................... 1 24 4 (s) 1 (s) (s) (s) 6 57 87 February .................. (s) 21 3 (s) 1 (s) (s) (s) 5 53 R 80 March ....................... (s) 14 3 (s) 1 (s) (s) (s) 4 52 71 April ......................... (s) 11 2 (s) 1 (s) (s) (s) 3 51 R 65 May .......................... (s) 8 2 (s) 1 (s) 0 (s) 3 60 72 June ......................... (s) 7 2 (s) 1 (s) 0 (s) 3 66 R 76 July .......................... (s) 7 2 (s) 1 (s) (s) (s) 3 76 R 86 August ..................... (s) 7 2 (s) 1 (s) (s) (s) 4 73 85 September ............... (s) 8 2 (s) 1 (s) (s) (s) 3 R 63 R 74 October .................... (s) 12 2 (s) 1 (s) (s) (s) 3 61 76 November ................ (s) 17 2 (s) 1 (s) (s) (s) 4 59 80 December ................ (s) 21 3 (s) 1 (s) (s) (s) 4 59 85 Total ........................ 4 157 29 (s) 9 3 (s) 3 45 R 731 R 937
2013 January .................... (s) 26 3 (s) 1 (s) (s) (s) 5 59 90 February .................. (s) 23 3 (s) 1 (s) (s) (s) 5 55 83 March ....................... (s) 21 3 (s) 1 (s) (s) (s) 4 58 84 April ......................... (s) 13 2 (s) 1 (s) (s) (s) 3 53 70 May .......................... (s) 9 1 (s) 1 (s) 0 (s) 2 59 71 June ......................... (s) 7 1 (s) 1 (s) 0 (s) 2 67 77 July .......................... (s) 7 1 (s) 1 (s) (s) (s) 2 73 83 August ..................... (s) 7 1 (s) 1 (s) (s) (s) 2 73 83 September ............... (s) 7 1 (s) 1 (s) (s) (s) 2 65 76 9-Month Total ......... 3 122 17 (s) 7 2 (s) 2 28 563 717
2012 9-Month Total ......... 3 108 23 (s) 7 2 (s) 2 34 552 6972011 9-Month Total ......... 5 123 21 (s) 7 2 (s) 3 33 591 751
a Metric tons of carbon dioxide can be converted to metric tons of carbonequivalent by multiplying by 12/44.
b Natural gas, excluding supplemental gaseous fuels.c Distillate fuel oil, excluding biodiesel.d Liquefied petroleum gases.e Finished motor gasoline, excluding fuel ethanol.f Emissions from energy consumption (for electricity and a small amount of
useful thermal output) in the electric power sector are allocated to the end-usesectors in proportion to each sector’s share of total electricity retail sales. SeeTables 7.6 and 12.6.
g Excludes emissions from biomass energy consumption. See Table 12.7.R=Revised. NA=Not available. (s)=Less than 0.5 million metric tons.
Notes: • Data are estimates for carbon dioxide emissions from energyconsumption. See "Section 12 Methodology and Sources" at end of section.• See "Carbon Dioxide" in Glossary. • See Note 1, "Emissions of Carbon Dioxideand Other Greenhouse Gases," at end of section. • Data exclude emissions frombiomass energy consumption. See Table 12.7 and Note 2, "Accounting for CarbonDioxide Emissions From Biomass Energy Combustion," at end of section. • Totalsmay not equal sum of components due to independent rounding. • Geographiccoverage is the 50 states and the District of Columbia.
Web Page: See http://www.eia.gov/totalenergy/data/monthly/#environment(Excel and CSV files) for all available annual and monthly data beginning in 1973.
Sources: See end of section.
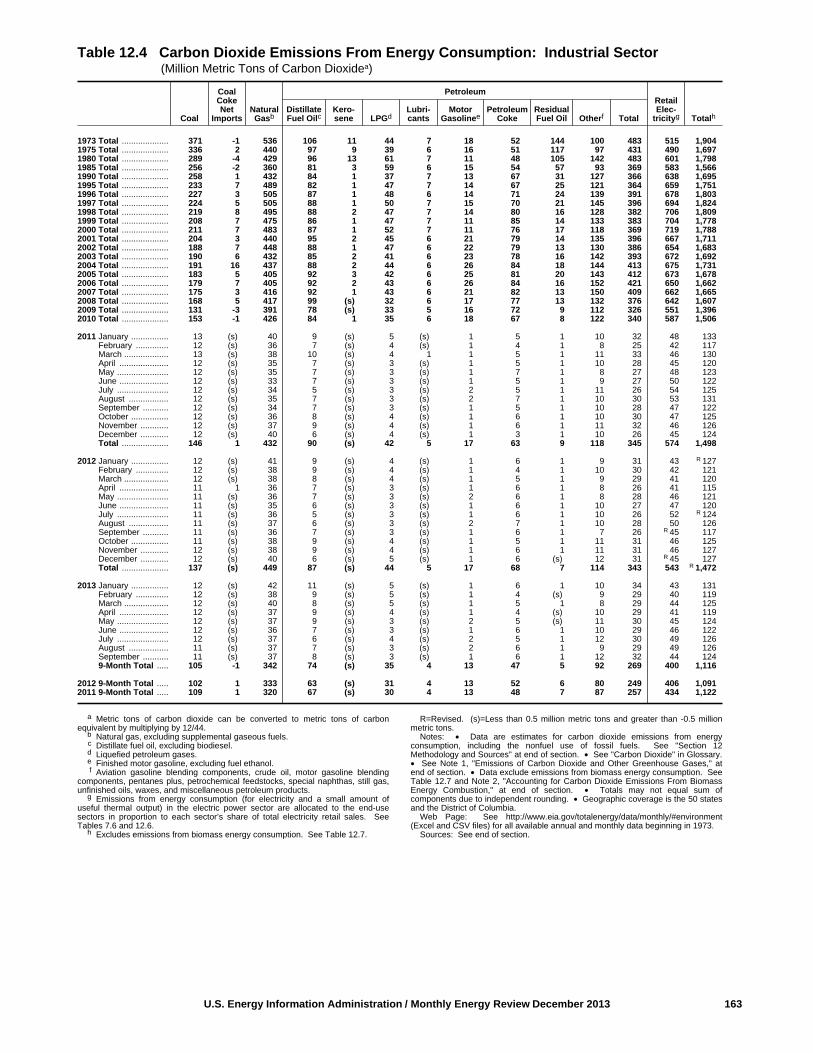
U.S. Energy Information Administration / Monthly Energy Review December 2013 163
Table 12.4 Carbon Dioxide Emissions From Energy Consumption: Industrial Sector (Million Metric Tons of Carbon Dioxidea)
Coal
CoalCokeNet
ImportsNaturalGasb
PetroleumRetailElec-
tricityg TotalhDistillateFuel Oilc
Kero-sene LPGd
Lubri-cants
MotorGasolinee
PetroleumCoke
ResidualFuel Oil Otherf Total
1973 Total .................... 371 -1 536 106 11 44 7 18 52 144 100 483 515 1,9041975 Total .................... 336 2 440 97 9 39 6 16 51 117 97 431 490 1,6971980 Total .................... 289 -4 429 96 13 61 7 11 48 105 142 483 601 1,7981985 Total .................... 256 -2 360 81 3 59 6 15 54 57 93 369 583 1,5661990 Total .................... 258 1 432 84 1 37 7 13 67 31 127 366 638 1,6951995 Total .................... 233 7 489 82 1 47 7 14 67 25 121 364 659 1,7511996 Total .................... 227 3 505 87 1 48 6 14 71 24 139 391 678 1,8031997 Total .................... 224 5 505 88 1 50 7 15 70 21 145 396 694 1,8241998 Total .................... 219 8 495 88 2 47 7 14 80 16 128 382 706 1,8091999 Total .................... 208 7 475 86 1 47 7 11 85 14 133 383 704 1,7782000 Total .................... 211 7 483 87 1 52 7 11 76 17 118 369 719 1,7882001 Total .................... 204 3 440 95 2 45 6 21 79 14 135 396 667 1,7112002 Total .................... 188 7 448 88 1 47 6 22 79 13 130 386 654 1,6832003 Total .................... 190 6 432 85 2 41 6 23 78 16 142 393 672 1,6922004 Total .................... 191 16 437 88 2 44 6 26 84 18 144 413 675 1,7312005 Total .................... 183 5 405 92 3 42 6 25 81 20 143 412 673 1,6782006 Total .................... 179 7 405 92 2 43 6 26 84 16 152 421 650 1,6622007 Total .................... 175 3 416 92 1 43 6 21 82 13 150 409 662 1,6652008 Total .................... 168 5 417 99 (s) 32 6 17 77 13 132 376 642 1,6072009 Total .................... 131 -3 391 78 (s) 33 5 16 72 9 112 326 551 1,3962010 Total .................... 153 -1 426 84 1 35 6 18 67 8 122 340 587 1,506
2011 January ................ 13 (s) 40 9 (s) 5 (s) 1 5 1 10 32 48 133 February .............. 12 (s) 36 7 (s) 4 (s) 1 4 1 8 25 42 117 March ................... 13 (s) 38 10 (s) 4 1 1 5 1 11 33 46 130 April ..................... 12 (s) 35 7 (s) 3 (s) 1 5 1 10 28 45 120 May ...................... 12 (s) 35 7 (s) 3 (s) 1 7 1 8 27 48 123 June ..................... 12 (s) 33 7 (s) 3 (s) 1 5 1 9 27 50 122 July ...................... 12 (s) 34 5 (s) 3 (s) 2 5 1 11 26 54 125 August ................. 12 (s) 35 7 (s) 3 (s) 2 7 1 10 30 53 131 September ........... 12 (s) 34 7 (s) 3 (s) 1 5 1 10 28 47 122 October ................ 12 (s) 36 8 (s) 4 (s) 1 6 1 10 30 47 125 November ............ 12 (s) 37 9 (s) 4 (s) 1 6 1 11 32 46 126 December ............ 12 (s) 40 6 (s) 4 (s) 1 3 1 10 26 45 124 Total .................... 146 1 432 90 (s) 42 5 17 63 9 118 345 574 1,498
2012 January ................ 12 (s) 41 9 (s) 4 (s) 1 6 1 9 31 43 R 127 February .............. 12 (s) 38 9 (s) 4 (s) 1 4 1 10 30 42 121 March ................... 12 (s) 38 8 (s) 4 (s) 1 5 1 9 29 41 120 April ..................... 11 1 36 7 (s) 3 (s) 1 6 1 8 26 41 115 May ...................... 11 (s) 36 7 (s) 3 (s) 2 6 1 8 28 46 121 June ..................... 11 (s) 35 6 (s) 3 (s) 1 6 1 10 27 47 120 July ...................... 11 (s) 36 5 (s) 3 (s) 1 6 1 10 26 52 R 124 August ................. 11 (s) 37 6 (s) 3 (s) 2 7 1 10 28 50 126 September ........... 11 (s) 36 7 (s) 3 (s) 1 6 1 7 26 R 45 117 October ................ 11 (s) 38 9 (s) 4 (s) 1 5 1 11 31 46 125 November ............ 12 (s) 38 9 (s) 4 (s) 1 6 1 11 31 46 127 December ............ 12 (s) 40 6 (s) 5 (s) 1 6 (s) 12 31 R 45 127 Total .................... 137 (s) 449 87 (s) 44 5 17 68 7 114 343 543 R 1,472
2013 January ................ 12 (s) 42 11 (s) 5 (s) 1 6 1 10 34 43 131 February .............. 12 (s) 38 9 (s) 5 (s) 1 4 (s) 9 29 40 119 March ................... 12 (s) 40 8 (s) 5 (s) 1 5 1 8 29 44 125 April ..................... 12 (s) 37 9 (s) 4 (s) 1 4 (s) 10 29 41 119 May ...................... 12 (s) 37 9 (s) 3 (s) 2 5 (s) 11 30 45 124 June ..................... 12 (s) 36 7 (s) 3 (s) 1 6 1 10 29 46 122 July ...................... 12 (s) 37 6 (s) 4 (s) 2 5 1 12 30 49 126 August ................. 11 (s) 37 7 (s) 3 (s) 2 6 1 9 29 49 126 September ........... 11 (s) 37 8 (s) 3 (s) 1 6 1 12 32 44 124 9-Month Total ..... 105 -1 342 74 (s) 35 4 13 47 5 92 269 400 1,116
2012 9-Month Total ..... 102 1 333 63 (s) 31 4 13 52 6 80 249 406 1,0912011 9-Month Total ..... 109 1 320 67 (s) 30 4 13 48 7 87 257 434 1,122
a Metric tons of carbon dioxide can be converted to metric tons of carbonequivalent by multiplying by 12/44.
b Natural gas, excluding supplemental gaseous fuels.c Distillate fuel oil, excluding biodiesel.d Liquefied petroleum gases.e Finished motor gasoline, excluding fuel ethanol.f Aviation gasoline blending components, crude oil, motor gasoline blending
components, pentanes plus, petrochemical feedstocks, special naphthas, still gas,unfinished oils, waxes, and miscellaneous petroleum products.
g Emissions from energy consumption (for electricity and a small amount ofuseful thermal output) in the electric power sector are allocated to the end-usesectors in proportion to each sector’s share of total electricity retail sales. SeeTables 7.6 and 12.6.
h Excludes emissions from biomass energy consumption. See Table 12.7.
R=Revised. (s)=Less than 0.5 million metric tons and greater than -0.5 millionmetric tons.
Notes: • Data are estimates for carbon dioxide emissions from energyconsumption, including the nonfuel use of fossil fuels. See "Section 12Methodology and Sources" at end of section. • See "Carbon Dioxide" in Glossary.• See Note 1, "Emissions of Carbon Dioxide and Other Greenhouse Gases," atend of section. • Data exclude emissions from biomass energy consumption. SeeTable 12.7 and Note 2, "Accounting for Carbon Dioxide Emissions From BiomassEnergy Combustion," at end of section. • Totals may not equal sum ofcomponents due to independent rounding. • Geographic coverage is the 50 statesand the District of Columbia.
Web Page: See http://www.eia.gov/totalenergy/data/monthly/#environment(Excel and CSV files) for all available annual and monthly data beginning in 1973.
Sources: See end of section.

164 U.S. Energy Information Administration / Monthly Energy Review December 2013
Table 12.5 Carbon Dioxide Emissions From Energy Consumption: Transportation Sector (Million Metric Tons of Carbon Dioxidea)
CoalNaturalGasb
PetroleumRetailElec-
tricityf TotalgAviationGasoline
DistillateFuel Oilc
JetFuel LPGd
Lubri-cants
MotorGasolinee
ResidualFuel Oil Total
1973 Total ........................ (s) 39 6 163 152 3 6 886 57 1,273 2 1,3151975 Total ........................ (s) 32 5 155 145 3 6 889 56 1,258 2 1,2921980 Total ........................ h( ) 34 4 204 155 1 6 881 110 1,363 2 1,4001985 Total ........................ h( ) 28 3 232 178 2 6 908 62 1,391 3 1,4211990 Total ........................ h( ) 36 3 268 223 1 7 967 80 1,548 3 1,5881995 Total ........................ h( ) 38 3 307 222 1 6 1,029 72 1,639 3 1,6811996 Total ........................ h( ) 39 3 327 232 1 6 1,047 67 1,683 3 1,7251997 Total ........................ h( ) 41 3 342 234 1 6 1,057 56 1,699 3 1,7441998 Total ........................ h( ) 35 2 352 238 1 7 1,090 53 1,743 3 1,7821999 Total ........................ h( ) 36 3 366 245 1 7 1,115 52 1,789 3 1,8282000 Total ........................ h( ) 36 3 378 254 1 7 1,121 70 1,833 4 1,8722001 Total ........................ h( ) 35 2 387 243 1 6 1,127 46 1,813 4 1,8522002 Total ........................ h( ) 37 2 394 237 1 6 1,158 53 1,851 4 1,8922003 Total ........................ h( ) 33 2 409 231 1 6 1,161 45 1,856 5 1,8932004 Total ........................ h( ) 32 2 434 240 1 6 1,185 58 1,926 5 1,9622005 Total ........................ h( ) 33 2 444 246 2 6 1,186 66 1,953 5 1,9912006 Total ........................ h( ) 33 2 469 240 2 5 1,194 71 1,984 5 2,0222007 Total ........................ h( ) 35 2 472 238 1 6 1,201 78 1,999 5 2,0402008 Total ........................ h( ) 37 2 427 226 3 5 1,146 73 1,882 5 1,9242009 Total ........................ h( ) 38 2 408 204 2 5 1,137 62 1,820 5 1,8632010 Total ........................ h( ) 38 2 429 210 2 5 1,125 70 1,843 5 1,886
2011 January .................... h( ) 5 (s) 34 17 (s) (s) 89 6 147 (s) 152 February .................. h( ) 4 (s) 31 15 (s) (s) 82 6 135 (s) 139 March ....................... h( ) 4 (s) 37 17 (s) 1 93 5 154 (s) 158 April ......................... h( ) 3 (s) 36 18 (s) (s) 91 5 150 (s) 154 May .......................... h( ) 3 (s) 38 18 (s) (s) 93 5 156 (s) 159 June ......................... h( ) 3 (s) 38 19 (s) (s) 93 5 156 (s) 159 July .......................... h( ) 3 (s) 38 18 (s) (s) 96 3 157 (s) 160 August ..................... h( ) 3 (s) 40 19 (s) (s) 94 4 158 (s) 162 September ............... h( ) 3 (s) 37 17 (s) (s) 90 6 150 (s) 153 October .................... h( ) 3 (s) 38 17 (s) (s) 92 5 152 (s) 156 November ................ h( ) 3 (s) 36 17 (s) (s) 87 5 146 (s) 150 December ................ h( ) 4 (s) 35 17 (s) (s) 92 6 150 (s) 155 Total ........................ h( ) 39 2 439 209 2 5 1,093 61 1,811 4 1,855
2012 January .................... h( ) 4 (s) 32 16 (s) (s) 87 5 141 (s) 146 February .................. h( ) 4 (s) 31 16 (s) (s) 85 4 137 (s) 142 March ....................... h( ) 3 (s) 34 17 (s) (s) 91 5 148 (s) 152 April ......................... h( ) 3 (s) 35 16 (s) (s) 90 5 147 (s) 150 May .......................... h( ) 3 (s) 37 18 (s) (s) 95 4 154 (s) 157 June ......................... h( ) 3 (s) 36 19 (s) (s) 92 4 152 (s) 155 July .......................... h( ) 3 (s) 37 18 (s) (s) 94 5 155 (s) 158 August ..................... h( ) 3 (s) 38 18 (s) (s) 97 5 158 (s) 162 September ............... h( ) 3 (s) 35 17 (s) (s) 88 4 145 (s) 148 October .................... h( ) 3 (s) 38 17 (s) (s) 92 3 151 (s) 154 November ................ h( ) 3 (s) 35 17 (s) (s) 87 4 143 (s) 147 December ................ h( ) 4 (s) 34 17 (s) (s) 89 2 142 (s) 147 Total ........................ h( ) 41 2 422 206 2 5 1,087 49 1,772 4 1,817
2013 January .................... h( ) 5 (s) 34 16 (s) (s) 87 4 142 (s) 147 February .................. h( ) 4 (s) 31 15 (s) (s) 81 3 130 (s) 134 March ....................... h( ) 4 (s) 35 17 (s) (s) 91 5 149 (s) 153 April ......................... h( ) 3 (s) 36 17 (s) (s) 90 3 146 (s) 149 May .......................... h( ) 3 (s) 37 18 (s) (s) 95 2 153 (s) 156 June ......................... h( ) 3 (s) 37 17 (s) (s) 92 3 150 (s) 153 July .......................... h( ) 3 (s) 37 19 (s) (s) 96 4 157 (s) 161 August ..................... h( ) 3 (s) 38 19 (s) (s) 97 5 159 (s) 163 September ............... h( ) 3 (s) 36 17 (s) (s) 91 4 149 (s) 152 9-Month Total ......... h( ) 30 1 320 155 2 4 820 33 1,334 3 1,368
2012 9-Month Total ......... h( ) 30 1 316 155 2 3 819 40 1,336 3 1,3692011 9-Month Total ......... h( ) 29 1 330 158 2 4 822 46 1,363 3 1,395
a Metric tons of carbon dioxide can be converted to metric tons of carbonequivalent by multiplying by 12/44.
b Natural gas, excluding supplemental gaseous fuels.c Distillate fuel oil, excluding biodiesel.d Liquefied petroleum gases.e Finished motor gasoline, excluding fuel ethanol.f Emissions from energy consumption (for electricity and a small amount of
useful thermal output) in the electric power sector are allocated to the end-usesectors in proportion to each sector’s share of total electricity retail sales. SeeTables 7.6 and 12.6.
g Excludes emissions from biomass energy consumption. See Table 12.7.h Beginning in 1978, the small amounts of coal consumed for transportation are
reported as industrial sector consumption.
(s)=Less than 0.5 million metric tons. Notes: • Data are estimates for carbon dioxide emissions from energy
consumption, including the nonfuel use of fossil fuels. See "Section 12Methodology and Sources" at end of section. • See "Carbon Dioxide" in Glossary.• See Note 1, "Emissions of Carbon Dioxide and Other Greenhouse Gases," atend of section. • Data exclude emissions from biomass energy consumption. SeeTable 12.7 and Note 2, "Accounting for Carbon Dioxide Emissions From BiomassEnergy Combustion," at end of section. • Totals may not equal sum ofcomponents due to independent rounding. • Geographic coverage is the 50 statesand the District of Columbia.
Web Page: See http://www.eia.gov/totalenergy/data/monthly/#environment(Excel and CSV files) for all available annual and monthly data beginning in 1973.
Sources: See end of section.
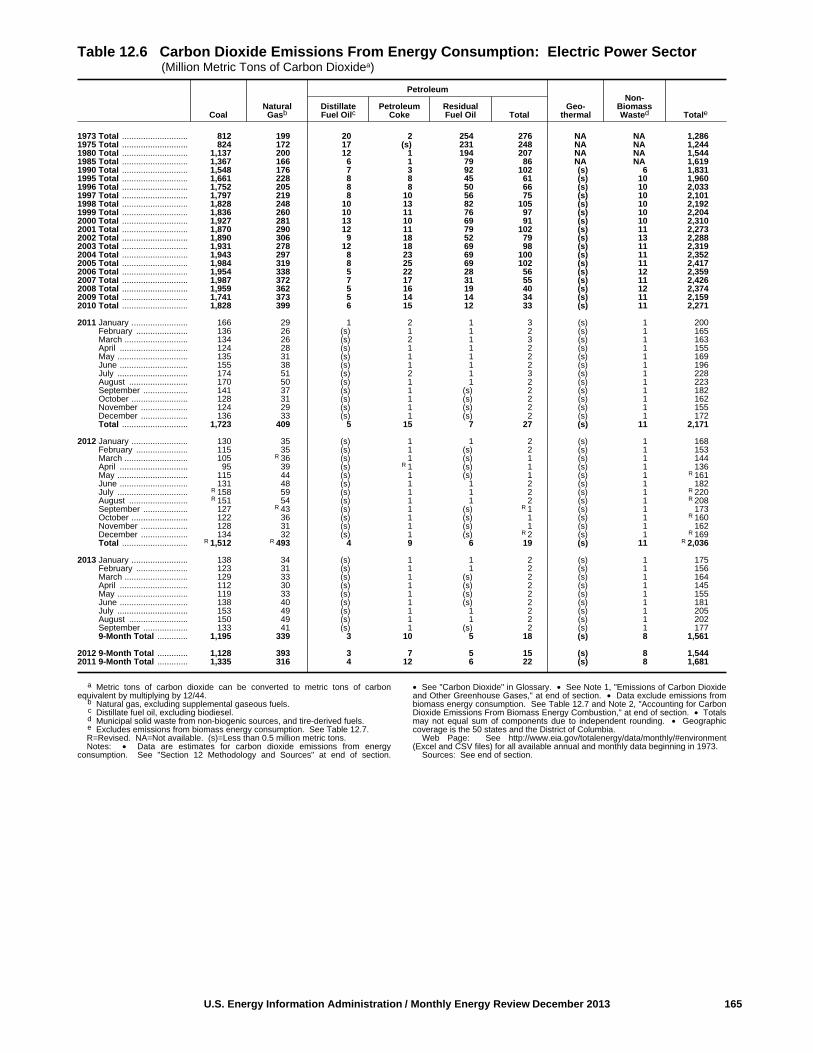
U.S. Energy Information Administration / Monthly Energy Review December 2013 165
Table 12.6 Carbon Dioxide Emissions From Energy Consumption: Electric Power Sector (Million Metric Tons of Carbon Dioxidea)
CoalNaturalGasb
Petroleum
Geo-thermal
Non-BiomassWasted Totale
DistillateFuel Oilc
PetroleumCoke
ResidualFuel Oil Total
1973 Total ............................ 812 199 20 2 254 276 NA NA 1,2861975 Total ............................ 824 172 17 (s) 231 248 NA NA 1,2441980 Total ............................ 1,137 200 12 1 194 207 NA NA 1,5441985 Total ............................ 1,367 166 6 1 79 86 NA NA 1,6191990 Total ............................ 1,548 176 7 3 92 102 (s) 6 1,8311995 Total ............................ 1,661 228 8 8 45 61 (s) 10 1,9601996 Total ............................ 1,752 205 8 8 50 66 (s) 10 2,0331997 Total ............................ 1,797 219 8 10 56 75 (s) 10 2,1011998 Total ............................ 1,828 248 10 13 82 105 (s) 10 2,1921999 Total ............................ 1,836 260 10 11 76 97 (s) 10 2,2042000 Total ............................ 1,927 281 13 10 69 91 (s) 10 2,3102001 Total ............................ 1,870 290 12 11 79 102 (s) 11 2,2732002 Total ............................ 1,890 306 9 18 52 79 (s) 13 2,2882003 Total ............................ 1,931 278 12 18 69 98 (s) 11 2,3192004 Total ............................ 1,943 297 8 23 69 100 (s) 11 2,3522005 Total ............................ 1,984 319 8 25 69 102 (s) 11 2,4172006 Total ............................ 1,954 338 5 22 28 56 (s) 12 2,3592007 Total ............................ 1,987 372 7 17 31 55 (s) 11 2,4262008 Total ............................ 1,959 362 5 16 19 40 (s) 12 2,3742009 Total ............................ 1,741 373 5 14 14 34 (s) 11 2,1592010 Total ............................ 1,828 399 6 15 12 33 (s) 11 2,271
2011 January ........................ 166 29 1 2 1 3 (s) 1 200 February ...................... 136 26 (s) 1 1 2 (s) 1 165 March ........................... 134 26 (s) 2 1 3 (s) 1 163 April ............................. 124 28 (s) 1 1 2 (s) 1 155 May .............................. 135 31 (s) 1 1 2 (s) 1 169 June ............................. 155 38 (s) 1 1 2 (s) 1 196 July .............................. 174 51 (s) 2 1 3 (s) 1 228 August ......................... 170 50 (s) 1 1 2 (s) 1 223 September ................... 141 37 (s) 1 (s) 2 (s) 1 182 October ........................ 128 31 (s) 1 (s) 2 (s) 1 162 November .................... 124 29 (s) 1 (s) 2 (s) 1 155 December .................... 136 33 (s) 1 (s) 2 (s) 1 172 Total ............................ 1,723 409 5 15 7 27 (s) 11 2,171
2012 January ........................ 130 35 (s) 1 1 2 (s) 1 168 February ...................... 115 35 (s) 1 (s) 2 (s) 1 153 March ........................... 105 R 36 (s) 1 (s) 1 (s) 1 144 April ............................. 95 39 (s) R 1 (s) 1 (s) 1 136 May .............................. 115 44 (s) 1 (s) 1 (s) 1 R 161 June ............................. 131 48 (s) 1 1 2 (s) 1 182 July .............................. R 158 59 (s) 1 1 2 (s) 1 R 220 August ......................... R 151 54 (s) 1 1 2 (s) 1 R 208 September ................... 127 R 43 (s) 1 (s) R 1 (s) 1 173 October ........................ 122 36 (s) 1 (s) 1 (s) 1 R 160 November .................... 128 31 (s) 1 (s) 1 (s) 1 162 December .................... 134 32 (s) 1 (s) R 2 (s) 1 R 169 Total ............................ R 1,512 R 493 4 9 6 19 (s) 11 R 2,036
2013 January ........................ 138 34 (s) 1 1 2 (s) 1 175 February ...................... 123 31 (s) 1 1 2 (s) 1 156 March ........................... 129 33 (s) 1 (s) 2 (s) 1 164 April ............................. 112 30 (s) 1 (s) 2 (s) 1 145 May .............................. 119 33 (s) 1 (s) 2 (s) 1 155 June ............................. 138 40 (s) 1 (s) 2 (s) 1 181 July .............................. 153 49 (s) 1 1 2 (s) 1 205 August ......................... 150 49 (s) 1 1 2 (s) 1 202 September ................... 133 41 (s) 1 (s) 2 (s) 1 177 9-Month Total ............. 1,195 339 3 10 5 18 (s) 8 1,561
2012 9-Month Total ............. 1,128 393 3 7 5 15 (s) 8 1,5442011 9-Month Total ............. 1,335 316 4 12 6 22 (s) 8 1,681
a Metric tons of carbon dioxide can be converted to metric tons of carbonequivalent by multiplying by 12/44.
b Natural gas, excluding supplemental gaseous fuels.c Distillate fuel oil, excluding biodiesel.d Municipal solid waste from non-biogenic sources, and tire-derived fuels.e Excludes emissions from biomass energy consumption. See Table 12.7.R=Revised. NA=Not available. (s)=Less than 0.5 million metric tons. Notes: • Data are estimates for carbon dioxide emissions from energy
consumption. See "Section 12 Methodology and Sources" at end of section.
• See "Carbon Dioxide" in Glossary. • See Note 1, "Emissions of Carbon Dioxideand Other Greenhouse Gases," at end of section. • Data exclude emissions frombiomass energy consumption. See Table 12.7 and Note 2, "Accounting for CarbonDioxide Emissions From Biomass Energy Combustion," at end of section. • Totalsmay not equal sum of components due to independent rounding. • Geographiccoverage is the 50 states and the District of Columbia.
Web Page: See http://www.eia.gov/totalenergy/data/monthly/#environment(Excel and CSV files) for all available annual and monthly data beginning in 1973.
Sources: See end of section.
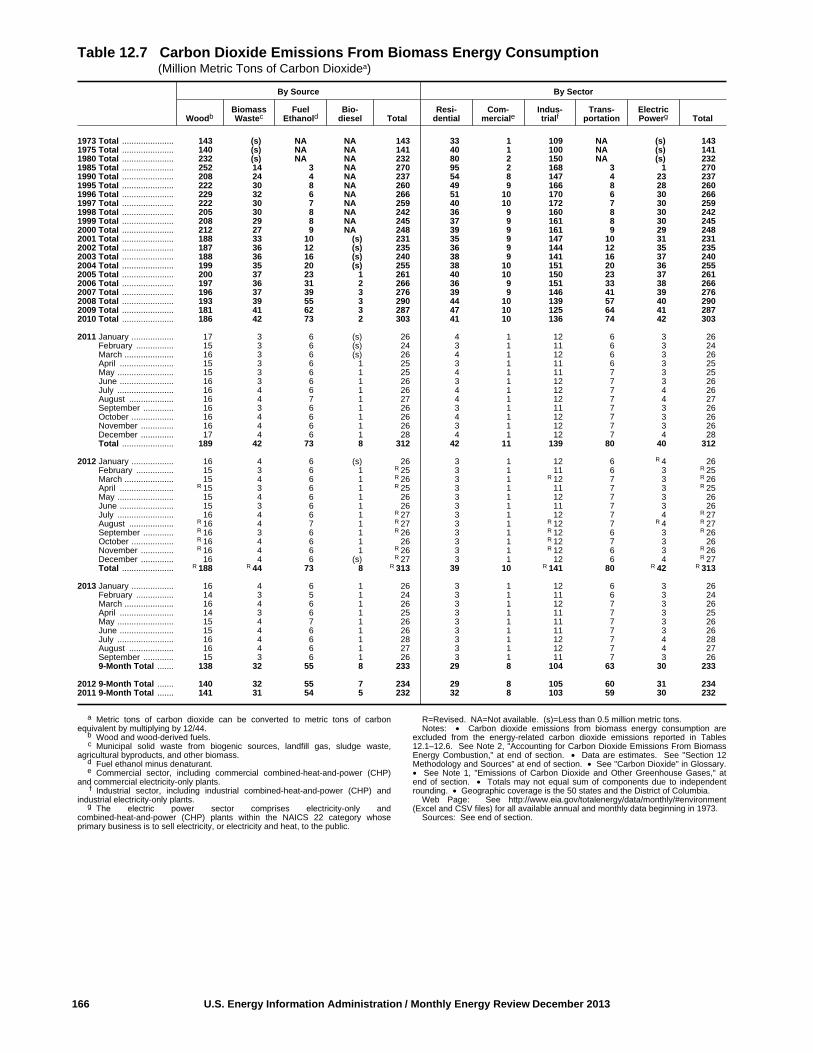
166 U.S. Energy Information Administration / Monthly Energy Review December 2013
Table 12.7 Carbon Dioxide Emissions From Biomass Energy Consumption (Million Metric Tons of Carbon Dioxidea)
By Source By Sector
WoodbBiomassWastec
FuelEthanold
Bio-diesel Total
Resi-dential
Com-merciale
Indus-trialf
Trans-portation
ElectricPowerg Total
1973 Total ...................... 143 (s) NA NA 143 33 1 109 NA (s) 1431975 Total ...................... 140 (s) NA NA 141 40 1 100 NA (s) 1411980 Total ...................... 232 (s) NA NA 232 80 2 150 NA (s) 2321985 Total ...................... 252 14 3 NA 270 95 2 168 3 1 2701990 Total ...................... 208 24 4 NA 237 54 8 147 4 23 2371995 Total ...................... 222 30 8 NA 260 49 9 166 8 28 2601996 Total ...................... 229 32 6 NA 266 51 10 170 6 30 2661997 Total ...................... 222 30 7 NA 259 40 10 172 7 30 2591998 Total ...................... 205 30 8 NA 242 36 9 160 8 30 2421999 Total ...................... 208 29 8 NA 245 37 9 161 8 30 2452000 Total ...................... 212 27 9 NA 248 39 9 161 9 29 2482001 Total ...................... 188 33 10 (s) 231 35 9 147 10 31 2312002 Total ...................... 187 36 12 (s) 235 36 9 144 12 35 2352003 Total ...................... 188 36 16 (s) 240 38 9 141 16 37 2402004 Total ...................... 199 35 20 (s) 255 38 10 151 20 36 2552005 Total ...................... 200 37 23 1 261 40 10 150 23 37 2612006 Total ...................... 197 36 31 2 266 36 9 151 33 38 2662007 Total ...................... 196 37 39 3 276 39 9 146 41 39 2762008 Total ...................... 193 39 55 3 290 44 10 139 57 40 2902009 Total ...................... 181 41 62 3 287 47 10 125 64 41 2872010 Total ...................... 186 42 73 2 303 41 10 136 74 42 303
2011 January .................. 17 3 6 (s) 26 4 1 12 6 3 26 February ................ 15 3 6 (s) 24 3 1 11 6 3 24 March ..................... 16 3 6 (s) 26 4 1 12 6 3 26 April ....................... 15 3 6 1 25 3 1 11 6 3 25 May ........................ 15 3 6 1 25 4 1 11 7 3 25 June ....................... 16 3 6 1 26 3 1 12 7 3 26 July ........................ 16 4 6 1 26 4 1 12 7 4 26 August ................... 16 4 7 1 27 4 1 12 7 4 27 September ............. 16 3 6 1 26 3 1 11 7 3 26 October .................. 16 4 6 1 26 4 1 12 7 3 26 November .............. 16 4 6 1 26 3 1 12 7 3 26 December .............. 17 4 6 1 28 4 1 12 7 4 28 Total ...................... 189 42 73 8 312 42 11 139 80 40 312
2012 January .................. 16 4 6 (s) 26 3 1 12 6 R 4 26 February ................ 15 3 6 1 R 25 3 1 11 6 3 R 25 March ..................... 15 4 6 1 R 26 3 1 R 12 7 3 R 26 April ....................... R 15 3 6 1 R 25 3 1 11 7 3 R 25 May ........................ 15 4 6 1 26 3 1 12 7 3 26 June ....................... 15 3 6 1 26 3 1 11 7 3 26 July ........................ 16 4 6 1 R 27 3 1 12 7 4 R 27 August ................... R 16 4 7 1 R 27 3 1 R 12 7 R 4 R 27 September ............. R 16 3 6 1 R 26 3 1 R 12 6 3 R 26 October .................. R 16 4 6 1 26 3 1 R 12 7 3 26 November .............. R 16 4 6 1 R 26 3 1 R 12 6 3 R 26 December .............. 16 4 6 (s) R 27 3 1 12 6 4 R 27 Total ...................... R 188 R 44 73 8 R 313 39 10 R 141 80 R 42 R 313
2013 January .................. 16 4 6 1 26 3 1 12 6 3 26 February ................ 14 3 5 1 24 3 1 11 6 3 24 March ..................... 16 4 6 1 26 3 1 12 7 3 26 April ....................... 14 3 6 1 25 3 1 11 7 3 25 May ........................ 15 4 7 1 26 3 1 11 7 3 26 June ....................... 15 4 6 1 26 3 1 11 7 3 26 July ........................ 16 4 6 1 28 3 1 12 7 4 28 August ................... 16 4 6 1 27 3 1 12 7 4 27 September ............. 15 3 6 1 26 3 1 11 7 3 26 9-Month Total ....... 138 32 55 8 233 29 8 104 63 30 233
2012 9-Month Total ....... 140 32 55 7 234 29 8 105 60 31 2342011 9-Month Total ....... 141 31 54 5 232 32 8 103 59 30 232
a Metric tons of carbon dioxide can be converted to metric tons of carbonequivalent by multiplying by 12/44.
b Wood and wood-derived fuels.c Municipal solid waste from biogenic sources, landfill gas, sludge waste,
agricultural byproducts, and other biomass.d Fuel ethanol minus denaturant.e Commercial sector, including commercial combined-heat-and-power (CHP)
and commercial electricity-only plants.f Industrial sector, including industrial combined-heat-and-power (CHP) and
industrial electricity-only plants.g The electric power sector comprises electricity-only and
combined-heat-and-power (CHP) plants within the NAICS 22 category whoseprimary business is to sell electricity, or electricity and heat, to the public.
R=Revised. NA=Not available. (s)=Less than 0.5 million metric tons. Notes: • Carbon dioxide emissions from biomass energy consumption are
excluded from the energy-related carbon dioxide emissions reported in Tables12.1–12.6. See Note 2, "Accounting for Carbon Dioxide Emissions From BiomassEnergy Combustion," at end of section. • Data are estimates. See "Section 12Methodology and Sources" at end of section. • See "Carbon Dioxide" in Glossary.• See Note 1, "Emissions of Carbon Dioxide and Other Greenhouse Gases," atend of section. • Totals may not equal sum of components due to independentrounding. • Geographic coverage is the 50 states and the District of Columbia.
Web Page: See http://www.eia.gov/totalenergy/data/monthly/#environment(Excel and CSV files) for all available annual and monthly data beginning in 1973.
Sources: See end of section.

Environment
Note 1. Emissions of Carbon Dioxide and Other Green-house Gases. Greenhouse gases are those gases—such aswater vapor, carbon dioxide (CO2), methane, nitrous oxide,hydrofluorocarbons (HFCs), perfluorocarbons (PFCs), andsulfur hexafluoride—that are transparent to solar (short-wave) radiation but opaque to long-wave (infrared) radiation,thus preventing long-wave radiant energy from leavingEarth's atmosphere. The net effect is a trapping of absorbedradiation and a tendency to warm the planet's surface.
Energy-related carbon dioxide emissions account for about98 percent of U.S. CO2 emissions. The vast majority of CO2
emissions come from fossil fuel combustion, with smalleramounts from the nonfuel use of fossil fuels, as well as fromelectricity generation using geothermal energy and non-biomass waste. Other sources of CO2 emissions includeindustrial processes, such as cement and limestone produc-tion. Data in the U.S. Energy Information Administration’s(EIA) Monthly Energy Review (MER) Tables 12.1–12.6 areestimates for U.S. CO2 emissions from energy consumption,including the nonfuel use of fossil fuels (excluded are esti-mates for CO2 emissions from biomass energy consumption,which appear in Table 12.7).
For annual U.S. estimates for emissions of CO2 from allsources, as well as for emissions of other greenhouse gases,see EIA’s Emissions of Greenhouse Gases Report athttp://www.eia.gov/environment/emissions/ghg_report/.
Note 2. Accounting for Carbon Dioxide Emissions FromBiomass Energy Combustion. Carbon dioxide (CO2)emissions from the combustion of biomass to produceenergy are excluded from the energy-related CO2 emissionsreported in MER Tables 12.1–12.6, but appear in Table12.7. According to current international convention (see theIntergovernmental Panel on Climate Change’s “2006 IPCCGuidelines for National Greenhouse Gas Inventories”),carbon released through biomass combustion is excludedfrom reported energy-related emissions. The release ofcarbon from biomass combustion is assumed to be balancedby the uptake of carbon when the feedstock is grown, resultingin zero net emissions over some period of time. (This is not tosay that biomass energy is carbon-neutral. Energy inputs arerequired in order to grow, fertilize, and harvest the feedstockand to produce and process the biomass into fuels.)
However, analysts have debated whether increased use ofbiomass energy may result in a decline in terrestrial carbonstocks, leading to a net positive release of carbon rather thanthe zero net release assumed by its exclusion from reportedenergy-related emissions. For example, the clearing offorests for biofuel crops could result in an initial release ofcarbon that is not fully recaptured in subsequent use of theland for agriculture.
To reflect the potential net emissions, the internationalconvention for greenhouse gas inventories is to report
biomass emissions in the category “agriculture, forestry, andother land use,” usually based on estimates of net changes incarbon stocks over time.
This indirect accounting of CO2 emissions from biomass canpotentially lead to confusion in accounting for and under-standing the flow of CO2 emissions within energy and non-energy systems. In recognition of this issue, reporting ofCO2 emissions from biomass combustion alongside otherenergy-related CO2 emissions offers an alternative account-ing treatment. It is important, however, to avoid misinter-preting emissions from fossil energy and biomass energysources as necessarily additive. Instead, the combined totalof direct CO2 emissions from biomass and energy-relatedCO2 emissions implicitly assumes that none of the carbonemitted was previously or subsequently reabsorbed in terres-trial sinks or that other emissions sources offset any suchsequestration.
Section 12 Methodology and Sources
To estimate carbon dioxide emissions from energy consump-tion for the Monthly Energy Review (MER), Tables 12.1–12.7,the U.S. Energy Information Administration (EIA) uses thefollowing methodology and sources:
Step 1. Determine Fuel Consumption
Coal—Coal sectoral (residential, commercial, coke plants,other industrial, transportation, electric power) consumptiondata in thousand short tons are from MER Table 6.2. Coalsectoral consumption data are converted to trillion Btu bymultiplying by the coal heat content factors in MER TableA5.
Coal Coke Net Imports—Coal coke net imports data in tril-lion Btu are derived from coal coke imports and exports datain MER Tables 1.4a and 1.4b.
Natural Gas (excluding supplemental gaseous fuels)—Natu-ral gas sectoral consumption data in trillion Btu are fromMER Tables 2.2–2.6.
Petroleum—Total and sectoral consumption (productsupplied) data in thousand barrels per day for asphalt androad oil, aviation gasoline, distillate fuel oil, jet fuel, kero-sene, liquefied petroleum gases (LPG), lubricants, motorgasoline, petroleum coke, and residual fuel oil are fromMER Tables 3.5 and 3.7a–3.7c. For the component prod-ucts of LPG (ethane/ethylene, propane/propylene, normalbutane/butylene, and isobutane/isobutylene) and “otherpetroleum” (aviation gasoline blending components, crudeoil, motor gasoline blending components, naphthas forpetrochemical feedstock use, other oils for petrochemicalfeedstock use, pentanes plus, special naphthas, still gas,unfinished oils, waxes, and miscellaneous petroleum prod-ucts), consumption (product supplied) data in thousandbarrels per day are from EIA’s Petroleum Supply Annual(PSA), Petroleum Supply Monthly (PSM), and earlier
U.S. Energy Information Administration / Monthly Energy Review December 2013 167
publications (see sources for MER Table 3.5). Petroleumconsumption data by product are converted to trillion Btu bymultiplying by the petroleum heat content factors in MERTable A1 (Table A3 for motor gasoline).
Biomass—Sectoral consumption data in trillion Btu forwood, biomass waste, fuel ethanol (minus denaturant), andbiodiesel are from MER Tables 10.2a–10.2c.
Step 2. Remove Biofuels From Petroleum
Distillate Fuel Oil—Beginning in 2009, the distillate fueloil data (for total and transportation sector) in Step 1include biodiesel, a non-fossil renewable fuel. To removethe biodiesel portion from distillate fuel oil, data in thou-sand barrels per day for refinery and blender net inputs ofrenewable diesel fuel (from the PSA/PSM) are convertedto trillion Btu by multiplying by the biodiesel heat contentfactor in MER Table A3, and then subtracted from thedistillate fuel oil consumption values.
Motor Gasoline—Beginning in 1993, the motor gasolinedata (for total, commercial sector, industrial sector, andtransportation sector) in Step 1 include fuel ethanol, a non-fossil renewable fuel. To remove the fuel ethanol portionfrom motor gasoline, data in trillion Btu for fuel ethanolconsumption (from MER Tables 10.2a, 10.2b, and 10.3)are subtracted from the motor gasoline consumptionvalues. (Note that about 2 percent of fuel ethanol is fossil-based petroleum denaturant, to make the fuel ethanolundrinkable. For 1993–2008, petroleum denaturant isdouble counted in the PSA product supplied statistics, inboth the original product category—e.g., pentanesplus—and also in the finished motor gasoline category; forthis time period for MER Section 12, petroleum denaturantis removed along with the fuel ethanol from motor gaso-line, but left in the original product. Beginning in 2009,petroleum denaturant is counted only in the PSA/PSMproduct supplied statistics for motor gasoline; for this timeperiod for MER Section 12, petroleum denaturant is left inmotor gasoline.)
Step 3. Remove Carbon Sequestered by Nonfuel Use
The following fuels have industrial nonfuel uses as chemi-cal feedstocks and other products: coal, natural gas, asphaltand road oil, distillate fuel oil, liquefied petroleum gases(ethane/ethylene, propane/propylene, normal butane/buty-lene, and isobutane/isobutylene), lubricants (which haveindustrial and transportation nonfuel uses), naphthas forpetrochemical feedstock use, other oils for petrochemicalfeedstock use, pentanes plus, petroleum coke, residual fueloil, special naphthas, still gas, waxes, and miscellaneouspetroleum products. In the nonfuel use of these fuels, someof the carbon is sequestered, and is thus subtracted from thefuel consumption values in Steps 1 and 2.
Estimates of annual nonfuel use and associated carbonsequestration are developed by EIA using the methodology
detailed in “Documentation for Emissions of GreenhouseGases in the United States 2008” athttp://www.eia.gov/oiaf/1605/ggrpt/documentation/pdf/0638(2006).pdf.
To obtain monthly estimates of nonfuel use and associatedcarbon sequestration, monthly patterns for industrialconsumption and product supplied data series are used. Forcoal nonfuel use, the monthly pattern for coke plants coalconsumption from MER Table 6.2 is used. For natural gas,the monthly pattern for other industrial non-CHP natural gasconsumption from MER Table 4.3 is used. For distillatefuel oil, petroleum coke, and residual fuel oil, the monthlypatterns for industrial consumption from MER Table 3.7bare used. For the other petroleum products, the monthlypatterns for product supplied from the PSA and PSM areused.
Step 4. Determine Carbon Dioxide Emissions FromEnergy Consumption
Carbon dioxide (CO2) emissions data in million metric tonsare calculated by multiplying consumption values in trillionBtu from Steps 1 and 2 (minus the carbon sequestered innonfuel use in Step 3) by the CO2 emissions factors athttp://www.eia.gov/oiaf/1605/ggrpt/excel/CO2_coeffs_09_v2.xls.Beginning in 2010, the 2009 factors are used.
Coal—CO2 emissions for coal are calculated for each sector(residential, commercial, coke plants, other industrial, trans-portation, electric power). Total coal emissions are the sumof the sectoral coal emissions.
Coal Coke Net Imports—CO2 emissions for coal coke netimports are calculated.
Natural Gas—CO2 emissions for natural gas are calculatedfor each sector (residential, commercial, industrial, transpor-tation, electric power). Total natural gas emissions are thesum of the sectoral natural gas emissions.
Petroleum—CO2 emissions are calculated for each petroleumproduct. Total petroleum emissions are the sum of the productemissions. Total LPG emissions are the sum of the emissionsfor the component products (ethane/ethylene, propane/propyl-ene, normal butane/butylene, and isobutane/isobutylene); resi-dential, commercial, and transportation sector LPG emissionsare estimated by multiplying consumption values in trillionBtu from MER Tables 3.8a and 3.8c by the propane emis-sions factor; industrial sector LPG emissions are estimated astotal LPG emissions minus emissions by the other sectors.
Geothermal and Non-Biomass Waste—Annual CO2 emis-sions data for geothermal and non-biomass waste are EIAestimates based on Form EIA-923, “Power Plant Opera-tions Report” (and predecessor forms). Monthly estimatesare created by dividing the annual data by the number ofdays in the year and then multiplying by the number ofdays in the month. (Annual estimates for the current yearare set equal to those of the previous year.)
168 U.S. Energy Information Administration / Monthly Energy Review December 2013

Biomass—CO2 emissions for wood, biomass waste, fuelethanol (minus denaturant), and biodiesel are calculated foreach sector. Total emissions for each biomass fuel are thesum of the sectoral emissions. The following factors, inmillion metric tons CO2 per quadrillion Btu, are used: wood—93.80; biomass waste—90.70; fuel ethanol—68.44; andbiodiesel—73.84. For 1973–1988, the biomass portion
of waste in MER Tables 10.2a–10.2c is estimated as 67percent; for 1989–2000, the biomass portion of waste is esti-mated as 67 percent in 1989 to 58 percent in 2000, based onthe biogenic shares of total municipal solid waste shown inEIA’s “Methodolology for Allocating Municipal SolidWaste to Biogenic and Non-Biogenic Energy,” Table 1 athttp://www.eia.gov/cneaf/solar.renewables/page/mswaste/msw.pdf.
U.S. Energy Information Administration / Monthly Energy Review December 2013 169

THIS PAGE INTENTIONALLY LEFT BLANK
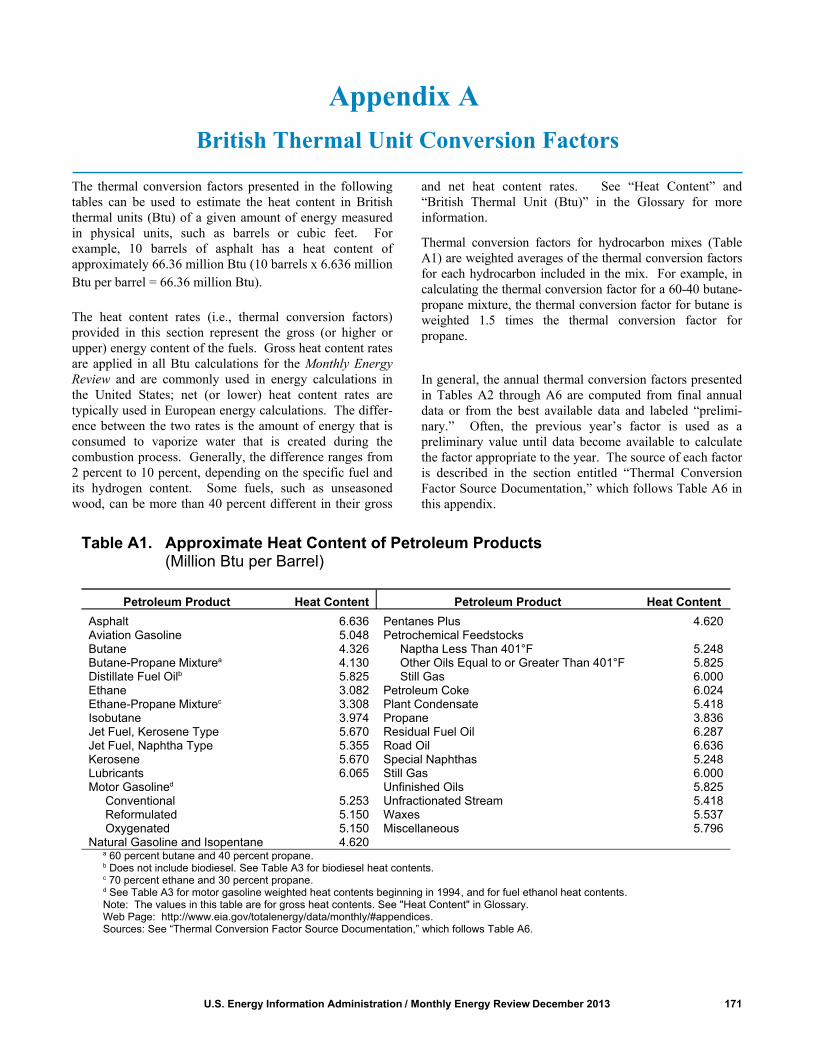
The thermal conversion factors presented in the followingtables can be used to estimate the heat content in Britishthermal units (Btu) of a given amount of energy measuredin physical units, such as barrels or cubic feet. Forexample, 10 barrels of asphalt has a heat content ofapproximately 66.36 million Btu (10 barrels x 6.636 millionBtu per barrel = 66.36 million Btu).
The heat content rates (i.e., thermal conversion factors)provided in this section represent the gross (or higher orupper) energy content of the fuels. Gross heat content ratesare applied in all Btu calculations for the Monthly EnergyReview and are commonly used in energy calculations inthe United States; net (or lower) heat content rates aretypically used in European energy calculations. The differ-ence between the two rates is the amount of energy that isconsumed to vaporize water that is created during thecombustion process. Generally, the difference ranges from2 percent to 10 percent, depending on the specific fuel andits hydrogen content. Some fuels, such as unseasonedwood, can be more than 40 percent different in their gross
and net heat content rates. See “Heat Content” and“British Thermal Unit (Btu)” in the Glossary for moreinformation.
Thermal conversion factors for hydrocarbon mixes (TableA1) are weighted averages of the thermal conversion factorsfor each hydrocarbon included in the mix. For example, incalculating the thermal conversion factor for a 60-40 butane-propane mixture, the thermal conversion factor for butane isweighted 1.5 times the thermal conversion factor forpropane.
In general, the annual thermal conversion factors presentedin Tables A2 through A6 are computed from final annualdata or from the best available data and labeled “prelimi-nary.” Often, the previous year’s factor is used as apreliminary value until data become available to calculatethe factor appropriate to the year. The source of each factoris described in the section entitled “Thermal ConversionFactor Source Documentation,” which follows Table A6 inthis appendix.
U.S. Energy Information Administration / Monthly Energy Review December 2013 171
Appendix A British Thermal Unit Conversion Factors
Table A1. Approximate Heat Content of Petroleum Products(Million Btu per Barrel)
a 60 percent butane and 40 percent propane.b Does not include biodiesel. See Table A3 for biodiesel heat contents.c 70 percent ethane and 30 percent propane.d See Table A3 for motor gasoline weighted heat contents beginning in 1994, and for fuel ethanol heat contents.Note: The values in this table are for gross heat contents. See "Heat Content" in Glossary.Web Page: http://www.eia.gov/totalenergy/data/monthly/#appendices.Sources: See “Thermal Conversion Factor Source Documentation,” which follows Table A6.
4.620Natural Gasoline and Isopentane5.796Miscellaneous5.150Oxygenated 5.537Waxes5.150Reformulated5.418Unfractionated Stream5.253Conventional 5.825Unfinished OilsMotor Gasolined6.000Still Gas6.065Lubricants5.248Special Naphthas5.670Kerosene6.636Road Oil5.355Jet Fuel, Naphtha Type6.287Residual Fuel Oil5.670Jet Fuel, Kerosene Type3.836Propane3.974Isobutane5.418Plant Condensate3.308Ethane-Propane Mixturec6.024Petroleum Coke3.082Ethane6.000Still Gas5.825Distillate Fuel Oilb5.825Other Oils Equal to or Greater Than 401°F4.130Butane-Propane Mixturea5.248Naptha Less Than 401°F4.326Butane
Petrochemical Feedstocks5.048Aviation Gasoline4.620Pentanes Plus6.636Asphalt
Heat ContentPetroleum ProductHeat ContentPetroleum Product
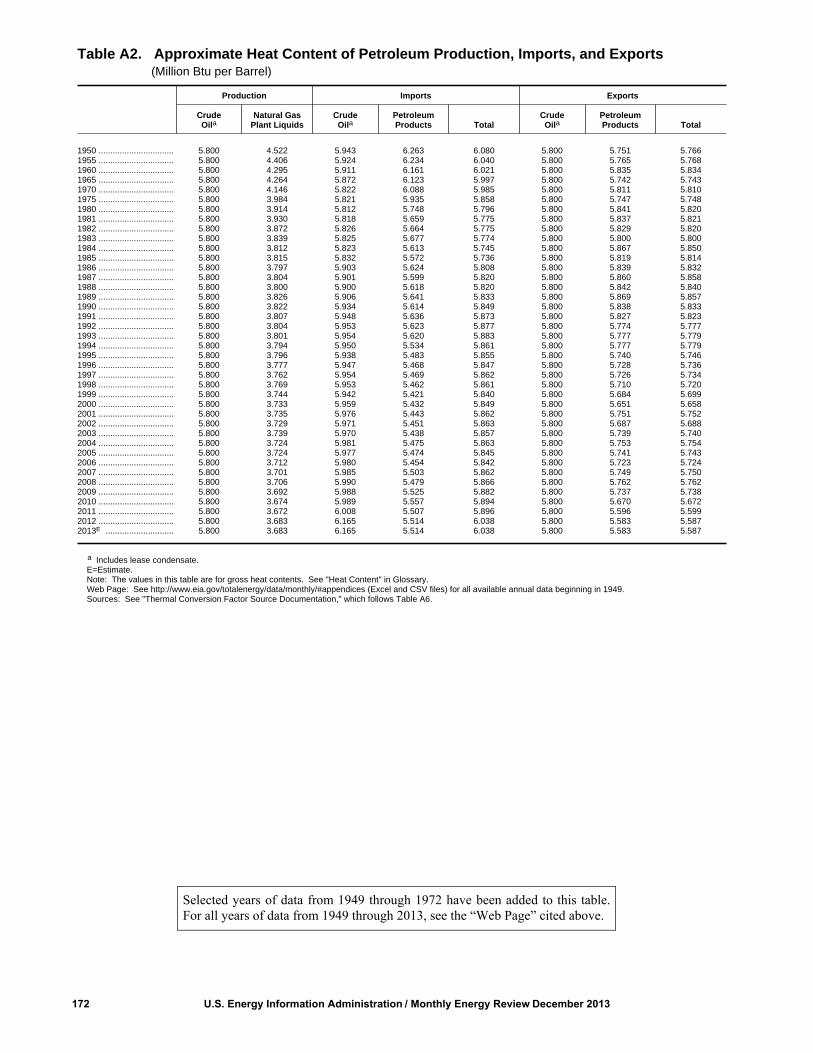
172 U.S. Energy Information Administration / Monthly Energy Review December 2013
Table A2. Approximate Heat Content of Petroleum Production, Imports, and Exports (Million Btu per Barrel)
Production Imports Exports
CrudeOila
Natural GasPlant Liquids
CrudeOila
PetroleumProducts Total
CrudeOila
PetroleumProducts Total
1950 ................................ 5.800 4.522 5.943 6.263 6.080 5.800 5.751 5.7661955 ................................ 5.800 4.406 5.924 6.234 6.040 5.800 5.765 5.7681960 ................................ 5.800 4.295 5.911 6.161 6.021 5.800 5.835 5.8341965 ................................ 5.800 4.264 5.872 6.123 5.997 5.800 5.742 5.7431970 ................................ 5.800 4.146 5.822 6.088 5.985 5.800 5.811 5.8101975 ................................ 5.800 3.984 5.821 5.935 5.858 5.800 5.747 5.7481980 ................................ 5.800 3.914 5.812 5.748 5.796 5.800 5.841 5.8201981 ................................ 5.800 3.930 5.818 5.659 5.775 5.800 5.837 5.8211982 ................................ 5.800 3.872 5.826 5.664 5.775 5.800 5.829 5.8201983 ................................ 5.800 3.839 5.825 5.677 5.774 5.800 5.800 5.8001984 ................................ 5.800 3.812 5.823 5.613 5.745 5.800 5.867 5.8501985 ................................ 5.800 3.815 5.832 5.572 5.736 5.800 5.819 5.8141986 ................................ 5.800 3.797 5.903 5.624 5.808 5.800 5.839 5.8321987 ................................ 5.800 3.804 5.901 5.599 5.820 5.800 5.860 5.8581988 ................................ 5.800 3.800 5.900 5.618 5.820 5.800 5.842 5.8401989 ................................ 5.800 3.826 5.906 5.641 5.833 5.800 5.869 5.8571990 ................................ 5.800 3.822 5.934 5.614 5.849 5.800 5.838 5.8331991 ................................ 5.800 3.807 5.948 5.636 5.873 5.800 5.827 5.8231992 ................................ 5.800 3.804 5.953 5.623 5.877 5.800 5.774 5.7771993 ................................ 5.800 3.801 5.954 5.620 5.883 5.800 5.777 5.7791994 ................................ 5.800 3.794 5.950 5.534 5.861 5.800 5.777 5.7791995 ................................ 5.800 3.796 5.938 5.483 5.855 5.800 5.740 5.7461996 ................................ 5.800 3.777 5.947 5.468 5.847 5.800 5.728 5.7361997 ................................ 5.800 3.762 5.954 5.469 5.862 5.800 5.726 5.7341998 ................................ 5.800 3.769 5.953 5.462 5.861 5.800 5.710 5.7201999 ................................ 5.800 3.744 5.942 5.421 5.840 5.800 5.684 5.6992000 ................................ 5.800 3.733 5.959 5.432 5.849 5.800 5.651 5.6582001 ................................ 5.800 3.735 5.976 5.443 5.862 5.800 5.751 5.7522002 ................................ 5.800 3.729 5.971 5.451 5.863 5.800 5.687 5.6882003 ................................ 5.800 3.739 5.970 5.438 5.857 5.800 5.739 5.7402004 ................................ 5.800 3.724 5.981 5.475 5.863 5.800 5.753 5.7542005 ................................ 5.800 3.724 5.977 5.474 5.845 5.800 5.741 5.7432006 ................................ 5.800 3.712 5.980 5.454 5.842 5.800 5.723 5.7242007 ................................ 5.800 3.701 5.985 5.503 5.862 5.800 5.749 5.7502008 ................................ 5.800 3.706 5.990 5.479 5.866 5.800 5.762 5.7622009 ................................ 5.800 3.692 5.988 5.525 5.882 5.800 5.737 5.7382010 ................................ 5.800 3.674 5.989 5.557 5.894 5.800 5.670 5.6722011 ................................ 5.800 3.672 6.008 5.507 5.896 5.800 5.596 5.5992012 ................................ 5.800 3.683 6.165 5.514 6.038 5.800 5.583 5.5872013E ............................. 5.800 3.683 6.165 5.514 6.038 5.800 5.583 5.587
a Includes lease condensate.E=Estimate.Note: The values in this table are for gross heat contents. See "Heat Content" in Glossary. Web Page: See http://www.eia.gov/totalenergy/data/monthly/#appendices (Excel and CSV files) for all available annual data beginning in 1949.Sources: See "Thermal Conversion Factor Source Documentation," which follows Table A6.
Selected years of data from 1949 through 1972 have been added to this table.For all years of data from 1949 through 2013, see the “Web Page” cited above.
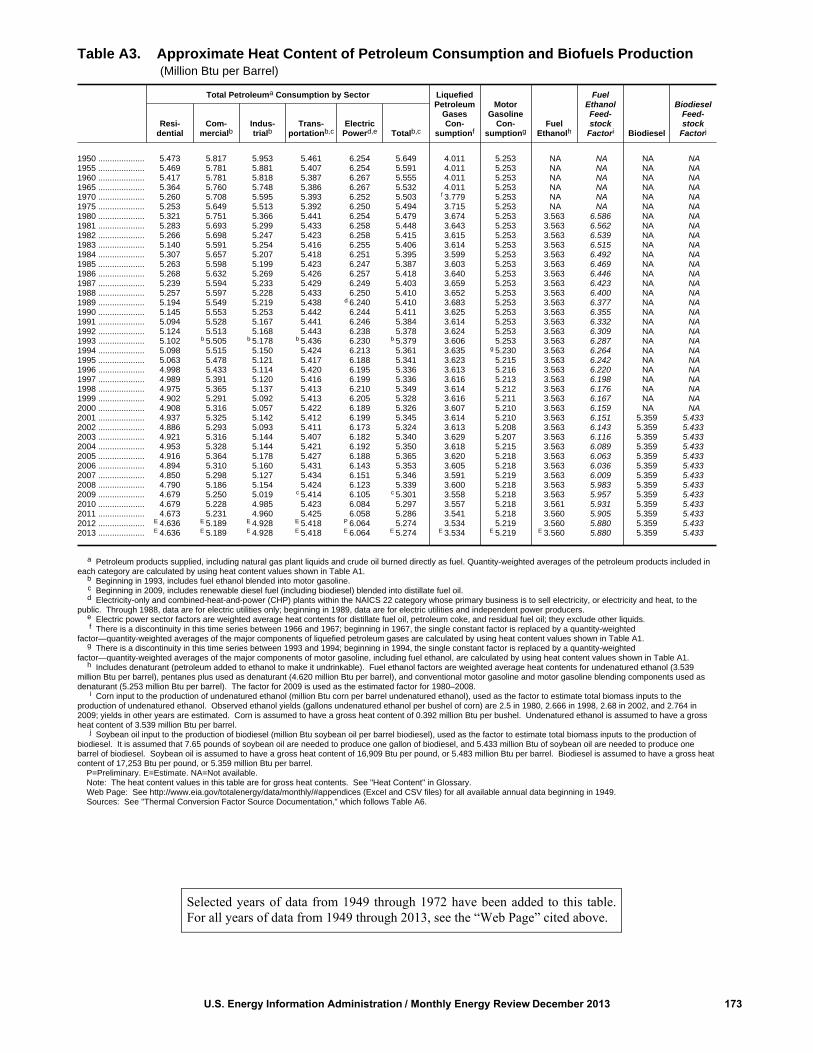
U.S. Energy Information Administration / Monthly Energy Review December 2013 173
Table A3. Approximate Heat Content of Petroleum Consumption and Biofuels Production (Million Btu per Barrel)
Total Petroleuma Consumption by Sector LiquefiedPetroleum
GasesCon-
sumptionf
MotorGasoline
Con-sumptiong
FuelEthanolh
FuelEthanolFeed-stock
Factori Biodiesel
BiodieselFeed-stock
FactorjResi-
dentialCom-
mercialbIndus-trialb
Trans-portationb,c
ElectricPowerd,e Totalb,c
1950 .................... 5.473 5.817 5.953 5.461 6.254 5.649 4.011 5.253 NA NA NA NA1955 .................... 5.469 5.781 5.881 5.407 6.254 5.591 4.011 5.253 NA NA NA NA1960 .................... 5.417 5.781 5.818 5.387 6.267 5.555 4.011 5.253 NA NA NA NA1965 .................... 5.364 5.760 5.748 5.386 6.267 5.532 4.011 5.253 NA NA NA NA1970 .................... 5.260 5.708 5.595 5.393 6.252 5.503 f 3.779 5.253 NA NA NA NA1975 .................... 5.253 5.649 5.513 5.392 6.250 5.494 3.715 5.253 NA NA NA NA1980 .................... 5.321 5.751 5.366 5.441 6.254 5.479 3.674 5.253 3.563 6.586 NA NA1981 .................... 5.283 5.693 5.299 5.433 6.258 5.448 3.643 5.253 3.563 6.562 NA NA1982 .................... 5.266 5.698 5.247 5.423 6.258 5.415 3.615 5.253 3.563 6.539 NA NA1983 .................... 5.140 5.591 5.254 5.416 6.255 5.406 3.614 5.253 3.563 6.515 NA NA1984 .................... 5.307 5.657 5.207 5.418 6.251 5.395 3.599 5.253 3.563 6.492 NA NA1985 .................... 5.263 5.598 5.199 5.423 6.247 5.387 3.603 5.253 3.563 6.469 NA NA1986 .................... 5.268 5.632 5.269 5.426 6.257 5.418 3.640 5.253 3.563 6.446 NA NA1987 .................... 5.239 5.594 5.233 5.429 6.249 5.403 3.659 5.253 3.563 6.423 NA NA1988 .................... 5.257 5.597 5.228 5.433 6.250 5.410 3.652 5.253 3.563 6.400 NA NA1989 .................... 5.194 5.549 5.219 5.438 d 6.240 5.410 3.683 5.253 3.563 6.377 NA NA1990 .................... 5.145 5.553 5.253 5.442 6.244 5.411 3.625 5.253 3.563 6.355 NA NA1991 .................... 5.094 5.528 5.167 5.441 6.246 5.384 3.614 5.253 3.563 6.332 NA NA1992 .................... 5.124 5.513 5.168 5.443 6.238 5.378 3.624 5.253 3.563 6.309 NA NA1993 .................... 5.102 b 5.505 b 5.178 b 5.436 6.230 b 5.379 3.606 5.253 3.563 6.287 NA NA1994 .................... 5.098 5.515 5.150 5.424 6.213 5.361 3.635 g 5.230 3.563 6.264 NA NA1995 .................... 5.063 5.478 5.121 5.417 6.188 5.341 3.623 5.215 3.563 6.242 NA NA1996 .................... 4.998 5.433 5.114 5.420 6.195 5.336 3.613 5.216 3.563 6.220 NA NA1997 .................... 4.989 5.391 5.120 5.416 6.199 5.336 3.616 5.213 3.563 6.198 NA NA1998 .................... 4.975 5.365 5.137 5.413 6.210 5.349 3.614 5.212 3.563 6.176 NA NA1999 .................... 4.902 5.291 5.092 5.413 6.205 5.328 3.616 5.211 3.563 6.167 NA NA2000 .................... 4.908 5.316 5.057 5.422 6.189 5.326 3.607 5.210 3.563 6.159 NA NA2001 .................... 4.937 5.325 5.142 5.412 6.199 5.345 3.614 5.210 3.563 6.151 5.359 5.4332002 .................... 4.886 5.293 5.093 5.411 6.173 5.324 3.613 5.208 3.563 6.143 5.359 5.4332003 .................... 4.921 5.316 5.144 5.407 6.182 5.340 3.629 5.207 3.563 6.116 5.359 5.4332004 .................... 4.953 5.328 5.144 5.421 6.192 5.350 3.618 5.215 3.563 6.089 5.359 5.4332005 .................... 4.916 5.364 5.178 5.427 6.188 5.365 3.620 5.218 3.563 6.063 5.359 5.4332006 .................... 4.894 5.310 5.160 5.431 6.143 5.353 3.605 5.218 3.563 6.036 5.359 5.4332007 .................... 4.850 5.298 5.127 5.434 6.151 5.346 3.591 5.219 3.563 6.009 5.359 5.4332008 .................... 4.790 5.186 5.154 5.424 6.123 5.339 3.600 5.218 3.563 5.983 5.359 5.4332009 .................... 4.679 5.250 5.019 c 5.414 6.105 c 5.301 3.558 5.218 3.563 5.957 5.359 5.4332010 .................... 4.679 5.228 4.985 5.423 6.084 5.297 3.557 5.218 3.561 5.931 5.359 5.4332011 .................... 4.673 5.231 4.960 5.425 6.058 5.286 3.541 5.218 3.560 5.905 5.359 5.4332012 .................... E 4.636 E 5.189 E 4.928 E 5.418 P 6.064 5.274 3.534 5.219 3.560 5.880 5.359 5.4332013 .................... E 4.636 E 5.189 E 4.928 E 5.418 E 6.064 E 5.274 E 3.534 E 5.219 E 3.560 5.880 5.359 5.433
a Petroleum products supplied, including natural gas plant liquids and crude oil burned directly as fuel. Quantity-weighted averages of the petroleum products included ineach category are calculated by using heat content values shown in Table A1.
b Beginning in 1993, includes fuel ethanol blended into motor gasoline. c Beginning in 2009, includes renewable diesel fuel (including biodiesel) blended into distillate fuel oil. d Electricity-only and combined-heat-and-power (CHP) plants within the NAICS 22 category whose primary business is to sell electricity, or electricity and heat, to the
public. Through 1988, data are for electric utilities only; beginning in 1989, data are for electric utilities and independent power producers.e Electric power sector factors are weighted average heat contents for distillate fuel oil, petroleum coke, and residual fuel oil; they exclude other liquids.f There is a discontinuity in this time series between 1966 and 1967; beginning in 1967, the single constant factor is replaced by a quantity-weighted
factor—quantity-weighted averages of the major components of liquefied petroleum gases are calculated by using heat content values shown in Table A1.g There is a discontinuity in this time series between 1993 and 1994; beginning in 1994, the single constant factor is replaced by a quantity-weighted
factor—quantity-weighted averages of the major components of motor gasoline, including fuel ethanol, are calculated by using heat content values shown in Table A1.h Includes denaturant (petroleum added to ethanol to make it undrinkable). Fuel ethanol factors are weighted average heat contents for undenatured ethanol (3.539
million Btu per barrel), pentanes plus used as denaturant (4.620 million Btu per barrel), and conventional motor gasoline and motor gasoline blending components used asdenaturant (5.253 million Btu per barrel). The factor for 2009 is used as the estimated factor for 1980–2008.
i Corn input to the production of undenatured ethanol (million Btu corn per barrel undenatured ethanol), used as the factor to estimate total biomass inputs to theproduction of undenatured ethanol. Observed ethanol yields (gallons undenatured ethanol per bushel of corn) are 2.5 in 1980, 2.666 in 1998, 2.68 in 2002, and 2.764 in2009; yields in other years are estimated. Corn is assumed to have a gross heat content of 0.392 million Btu per bushel. Undenatured ethanol is assumed to have a grossheat content of 3.539 million Btu per barrel.
j Soybean oil input to the production of biodiesel (million Btu soybean oil per barrel biodiesel), used as the factor to estimate total biomass inputs to the production ofbiodiesel. It is assumed that 7.65 pounds of soybean oil are needed to produce one gallon of biodiesel, and 5.433 million Btu of soybean oil are needed to produce onebarrel of biodiesel. Soybean oil is assumed to have a gross heat content of 16,909 Btu per pound, or 5.483 million Btu per barrel. Biodiesel is assumed to have a gross heatcontent of 17,253 Btu per pound, or 5.359 million Btu per barrel.
P=Preliminary. E=Estimate. NA=Not available. Note: The heat content values in this table are for gross heat contents. See "Heat Content" in Glossary. Web Page: See http://www.eia.gov/totalenergy/data/monthly/#appendices (Excel and CSV files) for all available annual data beginning in 1949.Sources: See "Thermal Conversion Factor Source Documentation," which follows Table A6.
Selected years of data from 1949 through 1972 have been added to this table.For all years of data from 1949 through 2013, see the “Web Page” cited above.
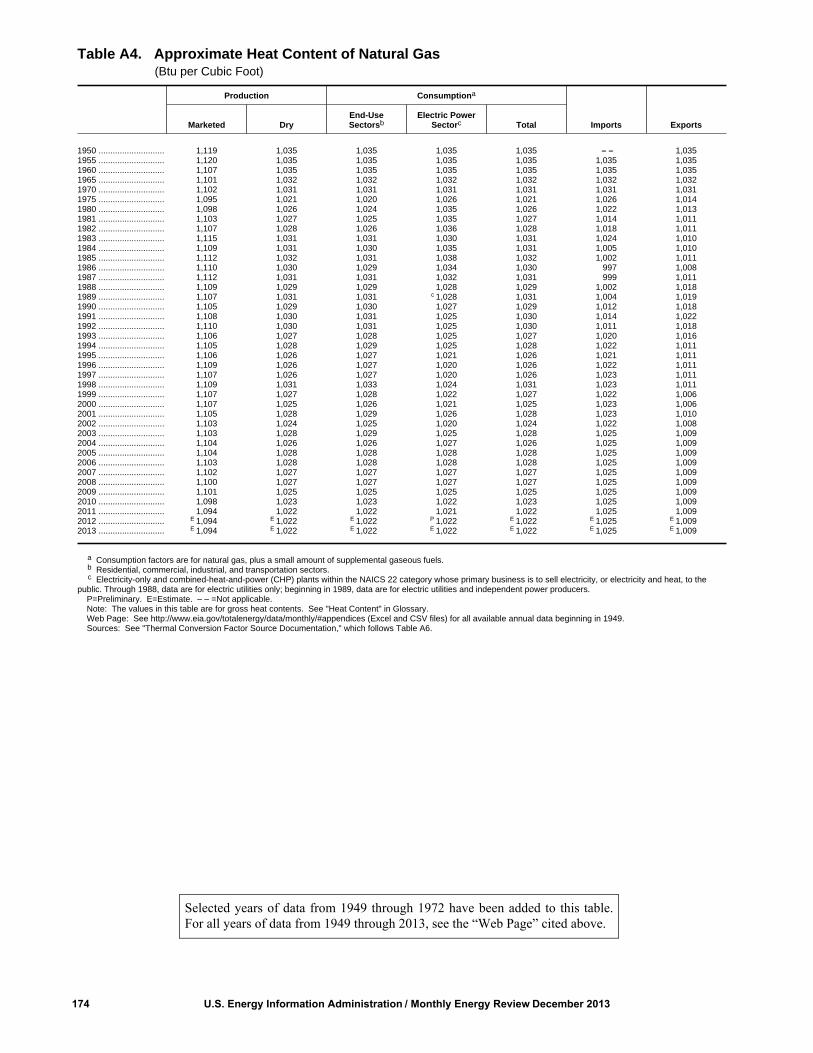
174 U.S. Energy Information Administration / Monthly Energy Review December 2013
Table A4. Approximate Heat Content of Natural Gas (Btu per Cubic Foot)
Production Consumptiona
Imports ExportsMarketed DryEnd-UseSectorsb
Electric PowerSectorc Total
1950 ............................ 1,119 1,035 1,035 1,035 1,035 – – 1,0351955 ............................ 1,120 1,035 1,035 1,035 1,035 1,035 1,0351960 ............................ 1,107 1,035 1,035 1,035 1,035 1,035 1,0351965 ............................ 1,101 1,032 1,032 1,032 1,032 1,032 1,0321970 ............................ 1,102 1,031 1,031 1,031 1,031 1,031 1,0311975 ............................ 1,095 1,021 1,020 1,026 1,021 1,026 1,0141980 ............................ 1,098 1,026 1,024 1,035 1,026 1,022 1,0131981 ............................ 1,103 1,027 1,025 1,035 1,027 1,014 1,0111982 ............................ 1,107 1,028 1,026 1,036 1,028 1,018 1,0111983 ............................ 1,115 1,031 1,031 1,030 1,031 1,024 1,0101984 ............................ 1,109 1,031 1,030 1,035 1,031 1,005 1,0101985 ............................ 1,112 1,032 1,031 1,038 1,032 1,002 1,0111986 ............................ 1,110 1,030 1,029 1,034 1,030 997 1,0081987 ............................ 1,112 1,031 1,031 1,032 1,031 999 1,0111988 ............................ 1,109 1,029 1,029 1,028 1,029 1,002 1,0181989 ............................ 1,107 1,031 1,031 c 1,028 1,031 1,004 1,0191990 ............................ 1,105 1,029 1,030 1,027 1,029 1,012 1,0181991 ............................ 1,108 1,030 1,031 1,025 1,030 1,014 1,0221992 ............................ 1,110 1,030 1,031 1,025 1,030 1,011 1,0181993 ............................ 1,106 1,027 1,028 1,025 1,027 1,020 1,0161994 ............................ 1,105 1,028 1,029 1,025 1,028 1,022 1,0111995 ............................ 1,106 1,026 1,027 1,021 1,026 1,021 1,0111996 ............................ 1,109 1,026 1,027 1,020 1,026 1,022 1,0111997 ............................ 1,107 1,026 1,027 1,020 1,026 1,023 1,0111998 ............................ 1,109 1,031 1,033 1,024 1,031 1,023 1,0111999 ............................ 1,107 1,027 1,028 1,022 1,027 1,022 1,0062000 ............................ 1,107 1,025 1,026 1,021 1,025 1,023 1,0062001 ............................ 1,105 1,028 1,029 1,026 1,028 1,023 1,0102002 ............................ 1,103 1,024 1,025 1,020 1,024 1,022 1,0082003 ............................ 1,103 1,028 1,029 1,025 1,028 1,025 1,0092004 ............................ 1,104 1,026 1,026 1,027 1,026 1,025 1,0092005 ............................ 1,104 1,028 1,028 1,028 1,028 1,025 1,0092006 ............................ 1,103 1,028 1,028 1,028 1,028 1,025 1,0092007 ............................ 1,102 1,027 1,027 1,027 1,027 1,025 1,0092008 ............................ 1,100 1,027 1,027 1,027 1,027 1,025 1,0092009 ............................ 1,101 1,025 1,025 1,025 1,025 1,025 1,0092010 ............................ 1,098 1,023 1,023 1,022 1,023 1,025 1,0092011 ............................ 1,094 1,022 1,022 1,021 1,022 1,025 1,0092012 ............................ E 1,094 E 1,022 E 1,022 P 1,022 E 1,022 E 1,025 E 1,0092013 ............................ E 1,094 E 1,022 E 1,022 E 1,022 E 1,022 E 1,025 E 1,009
a Consumption factors are for natural gas, plus a small amount of supplemental gaseous fuels.b Residential, commercial, industrial, and transportation sectors.c Electricity-only and combined-heat-and-power (CHP) plants within the NAICS 22 category whose primary business is to sell electricity, or electricity and heat, to the
public. Through 1988, data are for electric utilities only; beginning in 1989, data are for electric utilities and independent power producers.P=Preliminary. E=Estimate. – – =Not applicable. Note: The values in this table are for gross heat contents. See "Heat Content" in Glossary. Web Page: See http://www.eia.gov/totalenergy/data/monthly/#appendices (Excel and CSV files) for all available annual data beginning in 1949.Sources: See "Thermal Conversion Factor Source Documentation," which follows Table A6.
Selected years of data from 1949 through 1972 have been added to this table.For all years of data from 1949 through 2013, see the “Web Page” cited above.

U.S. Energy Information Administration / Monthly Energy Review December 2013 175
Table A5. Approximate Heat Content of Coal and Coal Coke (Million Btu per Short Ton)
Coal Coal Coke
Productiona
WasteCoal
Suppliedb
Consumption
Imports Exports
Importsand
Exports
Residentialand
CommercialSectorsc
Industrial SectorElectricPower
Sectore,f TotalCoke Plants Otherd
1950 ........................ 25.090 NA 24.461 26.798 24.820 23.937 24.989 25.020 26.788 24.8001955 ........................ 25.201 NA 24.373 26.794 24.821 24.056 24.982 25.000 26.907 24.8001960 ........................ 24.906 NA 24.226 26.791 24.609 23.927 24.713 25.003 26.939 24.8001965 ........................ 24.775 NA 24.028 26.787 24.385 23.780 24.537 25.000 26.973 24.8001970 ........................ 23.842 NA 23.203 26.784 22.983 22.573 23.440 25.000 26.982 24.8001975 ........................ 22.897 NA 22.261 26.782 22.436 21.642 22.506 25.000 26.562 24.8001980 ........................ 22.415 NA 22.543 26.790 22.690 21.295 21.947 25.000 26.384 24.8001981 ........................ 22.308 NA 22.474 26.794 22.585 21.085 21.713 25.000 26.160 24.8001982 ........................ 22.239 NA 22.695 26.797 22.712 21.194 21.674 25.000 26.223 24.8001983 ........................ 22.052 NA 22.775 26.798 22.691 21.133 21.576 25.000 26.291 24.8001984 ........................ 22.010 NA 22.844 26.799 22.543 21.101 21.573 25.000 26.402 24.8001985 ........................ 21.870 NA 22.646 26.798 22.020 20.959 21.366 25.000 26.307 24.8001986 ........................ 21.913 NA 22.947 26.798 22.198 21.084 21.462 25.000 26.292 24.8001987 ........................ 21.922 NA 23.404 26.799 22.381 21.136 21.517 25.000 26.291 24.8001988 ........................ 21.823 NA 23.571 26.799 22.360 20.900 21.328 25.000 26.299 24.8001989 ........................ 21.765 b 10.391 23.650 26.800 22.347 e 20.898 21.307 25.000 26.160 24.8001990 ........................ 21.822 9.303 23.137 26.799 22.457 20.779 21.197 25.000 26.202 24.8001991 ........................ 21.681 10.758 23.114 26.799 22.460 20.730 21.120 25.000 26.188 24.8001992 ........................ 21.682 10.396 23.105 26.799 22.250 20.709 21.068 25.000 26.161 24.8001993 ........................ 21.418 10.638 22.994 26.800 22.123 20.677 21.010 25.000 26.335 24.8001994 ........................ 21.394 11.097 23.112 26.800 22.068 20.589 20.929 25.000 26.329 24.8001995 ........................ 21.326 11.722 23.118 26.800 21.950 20.543 20.880 25.000 26.180 24.8001996 ........................ 21.322 12.147 23.011 26.800 22.105 20.547 20.870 25.000 26.174 24.8001997 ........................ 21.296 12.158 22.494 26.800 22.172 20.518 20.830 25.000 26.251 24.8001998 ........................ 21.418 12.639 21.620 27.426 23.164 20.516 20.881 25.000 26.800 24.8001999 ........................ 21.070 12.552 23.880 27.426 22.489 20.490 20.818 25.000 26.081 24.8002000 ........................ 21.072 12.360 25.020 27.426 22.433 20.511 20.828 25.000 26.117 24.8002001 ........................ a 20.772 12.169 24.909 27.426 22.622 20.337 20.671 25.000 25.998 24.8002002 ........................ 20.673 12.165 22.962 27.426 22.562 20.238 20.541 25.000 26.062 24.8002003 ........................ 20.499 12.360 22.242 27.425 22.468 20.082 20.387 25.000 25.972 24.8002004 ........................ 20.424 12.266 22.324 27.426 22.473 19.980 20.290 25.000 26.108 24.8002005 ........................ 20.348 12.093 22.342 26.279 22.178 19.988 20.246 25.000 25.494 24.8002006 ........................ 20.310 12.080 22.066 26.271 22.050 19.931 20.181 25.000 25.453 24.8002007 ........................ 20.340 12.090 22.069 26.329 22.371 19.909 20.168 25.000 25.466 24.8002008 ........................ 20.208 12.121 c 23.035 26.281 22.304 19.713 19.979 25.000 25.399 24.8002009 ........................ 19.963 12.076 22.852 26.334 21.823 19.521 19.741 25.000 25.633 24.8002010 ........................ 20.173 11.960 22.611 26.295 21.846 19.623 19.870 25.000 25.713 24.8002011 ........................ 20.142 11.604 22.099 26.299 21.568 19.341 19.600 25.000 25.645 24.8002012 ........................ P 20.236 P 12.106 P 21.300 P 26.302 P 21.458 P 19.223 P 19.500 P 23.128 P 24.557 P 24.8002013 ........................ E 20.236 E 12.106 E 21.300 E 28.721 E 21.458 E 19.223 E 19.500 E 23.128 E 24.557 E 24.800
a Beginning in 2001, includes a small amount of refuse recovery (coal recaptured from a refuse mine, and cleaned to reduce the concentration of noncombustiblematerials).
b Waste coal (including fine coal, coal obtained from a refuse bank or slurry dam, anthracite culm, bituminous gob, and lignite waste) consumed by the electric power andindustrial sectors. Beginning in 1989, waste coal supplied is counted as a supply-side item to balance the same amount of waste coal included in "Consumption."
c Through 2007, used as the thermal conversion factor for coal consumption by the residential and commercial sectors. Beginning in 2008, used as the thermalconversion factor for coal consumption by the commercial sector only.
d Includes transportation. Excludes coal synfuel plants.e Electricity-only and combined-heat-and-power (CHP) plants within the NAICS 22 category whose primary business is to sell electricity, or electricity and heat, to the
public. Through 1988, data are for electric utilities only; beginning in 1989, data are for electric utilities and independent power producers.f Electric power sector factors are for anthracite, bituminous coal, subbituminous coal, lignite, waste coal, and, beginning in 1998, coal synfuel.
P=Preliminary. E=Estimate. NA=Not available. Note: The values in this table are for gross heat contents. See "Heat Content" in Glossary. Web Page: See http://www.eia.gov/totalenergy/data/monthly/#appendices (Excel and CSV files) for all available annual data beginning in 1949.Sources: See "Thermal Conversion Factor Source Documentation," which follows Table A6.
Selected years of data from 1949 through 1972 have been added to this table.For all years of data from 1949 through 2013, see the “Web Page” cited above.
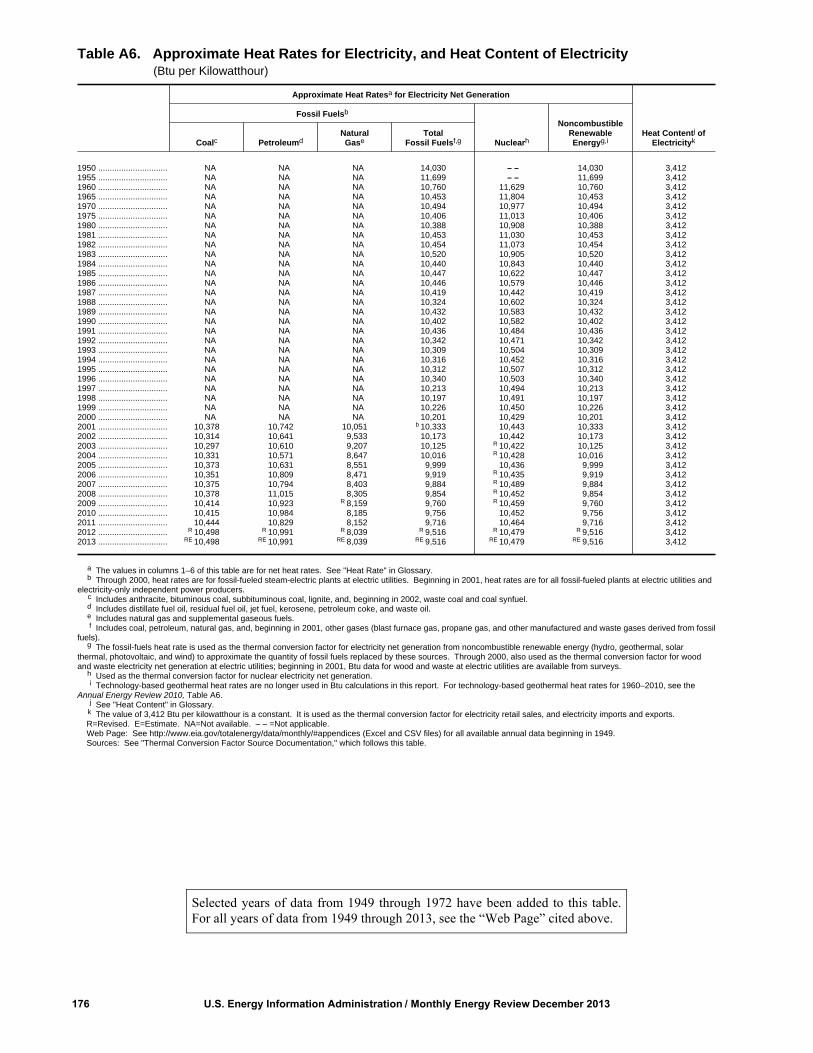
176 U.S. Energy Information Administration / Monthly Energy Review December 2013
Table A6. Approximate Heat Rates for Electricity, and Heat Content of Electricity (Btu per Kilowatthour)
Approximate Heat Ratesa for Electricity Net Generation
Heat Contentj ofElectricityk
Fossil Fuelsb
Nuclearh
NoncombustibleRenewableEnergyg,iCoalc Petroleumd
NaturalGase
TotalFossil Fuelsf,g
1950 .............................. NA NA NA 14,030 – – 14,030 3,4121955 .............................. NA NA NA 11,699 – – 11,699 3,4121960 .............................. NA NA NA 10,760 11,629 10,760 3,4121965 .............................. NA NA NA 10,453 11,804 10,453 3,4121970 .............................. NA NA NA 10,494 10,977 10,494 3,4121975 .............................. NA NA NA 10,406 11,013 10,406 3,4121980 .............................. NA NA NA 10,388 10,908 10,388 3,4121981 .............................. NA NA NA 10,453 11,030 10,453 3,4121982 .............................. NA NA NA 10,454 11,073 10,454 3,4121983 .............................. NA NA NA 10,520 10,905 10,520 3,4121984 .............................. NA NA NA 10,440 10,843 10,440 3,4121985 .............................. NA NA NA 10,447 10,622 10,447 3,4121986 .............................. NA NA NA 10,446 10,579 10,446 3,4121987 .............................. NA NA NA 10,419 10,442 10,419 3,4121988 .............................. NA NA NA 10,324 10,602 10,324 3,4121989 .............................. NA NA NA 10,432 10,583 10,432 3,4121990 .............................. NA NA NA 10,402 10,582 10,402 3,4121991 .............................. NA NA NA 10,436 10,484 10,436 3,4121992 .............................. NA NA NA 10,342 10,471 10,342 3,4121993 .............................. NA NA NA 10,309 10,504 10,309 3,4121994 .............................. NA NA NA 10,316 10,452 10,316 3,4121995 .............................. NA NA NA 10,312 10,507 10,312 3,4121996 .............................. NA NA NA 10,340 10,503 10,340 3,4121997 .............................. NA NA NA 10,213 10,494 10,213 3,4121998 .............................. NA NA NA 10,197 10,491 10,197 3,4121999 .............................. NA NA NA 10,226 10,450 10,226 3,4122000 .............................. NA NA NA 10,201 10,429 10,201 3,4122001 .............................. 10,378 10,742 10,051 b 10,333 10,443 10,333 3,4122002 .............................. 10,314 10,641 9,533 10,173 10,442 10,173 3,4122003 .............................. 10,297 10,610 9,207 10,125 R 10,422 10,125 3,4122004 .............................. 10,331 10,571 8,647 10,016 R 10,428 10,016 3,4122005 .............................. 10,373 10,631 8,551 9,999 10,436 9,999 3,4122006 .............................. 10,351 10,809 8,471 9,919 R 10,435 9,919 3,4122007 .............................. 10,375 10,794 8,403 9,884 R 10,489 9,884 3,4122008 .............................. 10,378 11,015 8,305 9,854 R 10,452 9,854 3,4122009 .............................. 10,414 10,923 R 8,159 9,760 R 10,459 9,760 3,4122010 .............................. 10,415 10,984 8,185 9,756 10,452 9,756 3,4122011 .............................. 10,444 10,829 8,152 9,716 10,464 9,716 3,4122012 .............................. R 10,498 R 10,991 R 8,039 R 9,516 R 10,479 R 9,516 3,4122013 .............................. RE 10,498 RE 10,991 RE 8,039 RE 9,516 RE 10,479 RE 9,516 3,412
a The values in columns 1–6 of this table are for net heat rates. See "Heat Rate" in Glossary.b Through 2000, heat rates are for fossil-fueled steam-electric plants at electric utilities. Beginning in 2001, heat rates are for all fossil-fueled plants at electric utilities and
electricity-only independent power producers.c Includes anthracite, bituminous coal, subbituminous coal, lignite, and, beginning in 2002, waste coal and coal synfuel.d Includes distillate fuel oil, residual fuel oil, jet fuel, kerosene, petroleum coke, and waste oil.e Includes natural gas and supplemental gaseous fuels.f Includes coal, petroleum, natural gas, and, beginning in 2001, other gases (blast furnace gas, propane gas, and other manufactured and waste gases derived from fossil
fuels).g The fossil-fuels heat rate is used as the thermal conversion factor for electricity net generation from noncombustible renewable energy (hydro, geothermal, solar
thermal, photovoltaic, and wind) to approximate the quantity of fossil fuels replaced by these sources. Through 2000, also used as the thermal conversion factor for woodand waste electricity net generation at electric utilities; beginning in 2001, Btu data for wood and waste at electric utilities are available from surveys.
h Used as the thermal conversion factor for nuclear electricity net generation.i Technology-based geothermal heat rates are no longer used in Btu calculations in this report. For technology-based geothermal heat rates for 1960–2010, see the
Annual Energy Review 2010, Table A6.j See "Heat Content" in Glossary.
k The value of 3,412 Btu per kilowatthour is a constant. It is used as the thermal conversion factor for electricity retail sales, and electricity imports and exports.R=Revised. E=Estimate. NA=Not available. – – =Not applicable. Web Page: See http://www.eia.gov/totalenergy/data/monthly/#appendices (Excel and CSV files) for all available annual data beginning in 1949.Sources: See "Thermal Conversion Factor Source Documentation," which follows this table.
Selected years of data from 1949 through 1972 have been added to this table.For all years of data from 1949 through 2013, see the “Web Page” cited above.
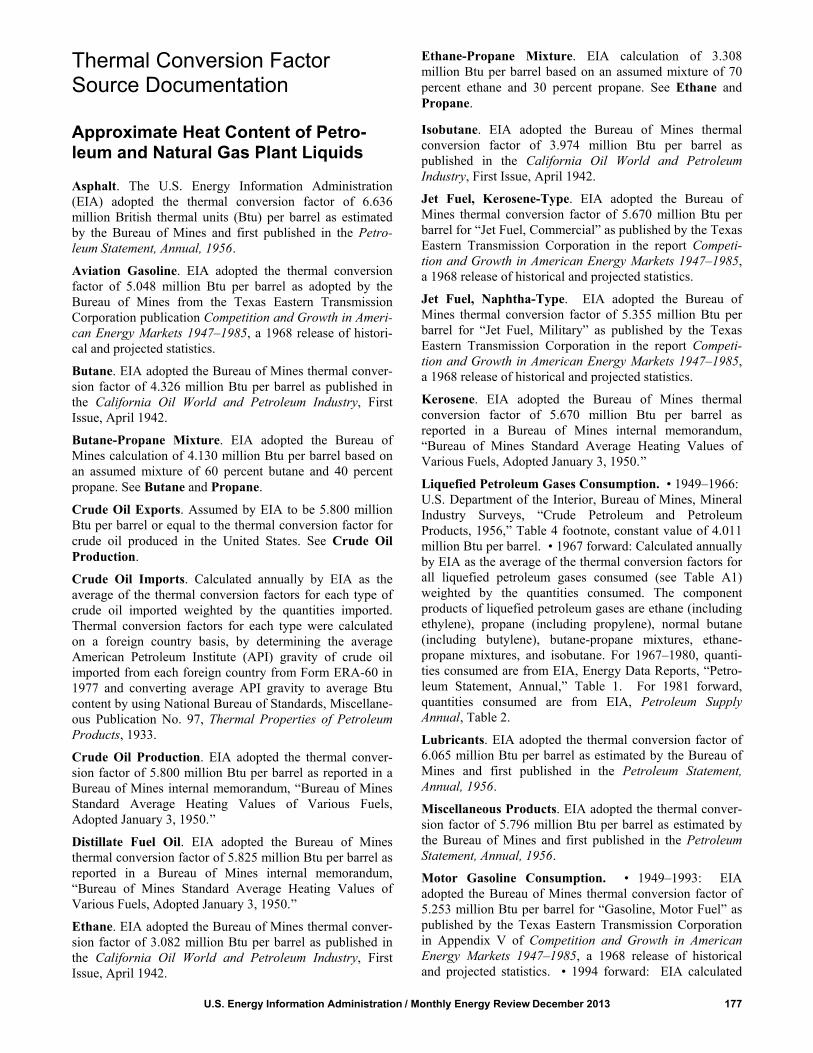
Thermal Conversion FactorSource Documentation
Approximate Heat Content of Petro-leum and Natural Gas Plant Liquids
Asphalt. The U.S. Energy Information Administration(EIA) adopted the thermal conversion factor of 6.636million British thermal units (Btu) per barrel as estimatedby the Bureau of Mines and first published in the Petro-leum Statement, Annual, 1956.
Aviation Gasoline. EIA adopted the thermal conversionfactor of 5.048 million Btu per barrel as adopted by theBureau of Mines from the Texas Eastern TransmissionCorporation publication Competition and Growth in Ameri-can Energy Markets 1947–1985, a 1968 release of histori-cal and projected statistics.
Butane. EIA adopted the Bureau of Mines thermal conver-sion factor of 4.326 million Btu per barrel as published inthe California Oil World and Petroleum Industry, FirstIssue, April 1942.
Butane-Propane Mixture. EIA adopted the Bureau ofMines calculation of 4.130 million Btu per barrel based onan assumed mixture of 60 percent butane and 40 percentpropane. See Butane and Propane.
Crude Oil Exports. Assumed by EIA to be 5.800 millionBtu per barrel or equal to the thermal conversion factor forcrude oil produced in the United States. See Crude OilProduction.
Crude Oil Imports. Calculated annually by EIA as theaverage of the thermal conversion factors for each type ofcrude oil imported weighted by the quantities imported.Thermal conversion factors for each type were calculatedon a foreign country basis, by determining the averageAmerican Petroleum Institute (API) gravity of crude oilimported from each foreign country from Form ERA-60 in1977 and converting average API gravity to average Btucontent by using National Bureau of Standards, Miscellane-ous Publication No. 97, Thermal Properties of PetroleumProducts, 1933.
Crude Oil Production. EIA adopted the thermal conver-sion factor of 5.800 million Btu per barrel as reported in aBureau of Mines internal memorandum, “Bureau of MinesStandard Average Heating Values of Various Fuels,Adopted January 3, 1950.”
Distillate Fuel Oil. EIA adopted the Bureau of Minesthermal conversion factor of 5.825 million Btu per barrel asreported in a Bureau of Mines internal memorandum,“Bureau of Mines Standard Average Heating Values ofVarious Fuels, Adopted January 3, 1950.”
Ethane. EIA adopted the Bureau of Mines thermal conver-sion factor of 3.082 million Btu per barrel as published inthe California Oil World and Petroleum Industry, FirstIssue, April 1942.
Ethane-Propane Mixture. EIA calculation of 3.308million Btu per barrel based on an assumed mixture of 70percent ethane and 30 percent propane. See Ethane andPropane.
Isobutane. EIA adopted the Bureau of Mines thermalconversion factor of 3.974 million Btu per barrel aspublished in the California Oil World and PetroleumIndustry, First Issue, April 1942.
Jet Fuel, Kerosene-Type. EIA adopted the Bureau ofMines thermal conversion factor of 5.670 million Btu perbarrel for “Jet Fuel, Commercial” as published by the TexasEastern Transmission Corporation in the report Competi-tion and Growth in American Energy Markets 1947–1985,a 1968 release of historical and projected statistics.
Jet Fuel, Naphtha-Type. EIA adopted the Bureau ofMines thermal conversion factor of 5.355 million Btu perbarrel for “Jet Fuel, Military” as published by the TexasEastern Transmission Corporation in the report Competi-tion and Growth in American Energy Markets 1947–1985,a 1968 release of historical and projected statistics.
Kerosene. EIA adopted the Bureau of Mines thermalconversion factor of 5.670 million Btu per barrel asreported in a Bureau of Mines internal memorandum,“Bureau of Mines Standard Average Heating Values ofVarious Fuels, Adopted January 3, 1950.”
Liquefied Petroleum Gases Consumption. • 1949–1966: U.S. Department of the Interior, Bureau of Mines, MineralIndustry Surveys, “Crude Petroleum and PetroleumProducts, 1956,” Table 4 footnote, constant value of 4.011million Btu per barrel. • 1967 forward: Calculated annuallyby EIA as the average of the thermal conversion factors forall liquefied petroleum gases consumed (see Table A1)weighted by the quantities consumed. The componentproducts of liquefied petroleum gases are ethane (includingethylene), propane (including propylene), normal butane(including butylene), butane-propane mixtures, ethane-propane mixtures, and isobutane. For 1967–1980, quanti-ties consumed are from EIA, Energy Data Reports, “Petro-leum Statement, Annual,” Table 1. For 1981 forward,quantities consumed are from EIA, Petroleum SupplyAnnual, Table 2.
Lubricants. EIA adopted the thermal conversion factor of6.065 million Btu per barrel as estimated by the Bureau ofMines and first published in the Petroleum Statement,Annual, 1956.
Miscellaneous Products. EIA adopted the thermal conver-sion factor of 5.796 million Btu per barrel as estimated bythe Bureau of Mines and first published in the PetroleumStatement, Annual, 1956.
Motor Gasoline Consumption. • 1949–1993: EIAadopted the Bureau of Mines thermal conversion factor of5.253 million Btu per barrel for “Gasoline, Motor Fuel” aspublished by the Texas Eastern Transmission Corporationin Appendix V of Competition and Growth in AmericanEnergy Markets 1947–1985, a 1968 release of historicaland projected statistics. • 1994 forward: EIA calculated
U.S. Energy Information Administration / Monthly Energy Review December 2013 177

national annual quantity-weighted average conversionfactors for conventional, reformulated, and oxygenatedmotor gasolines (see Table A3). The factor for conventionalmotor gasoline is 5.253 million Btu per barrel, as used forprevious years. The factors for reformulated and oxygen-ated gasolines, both currently 5.150 million Btu per barrel,are based on data published in Environmental ProtectionAgency, Office of Mobile Sources, National Vehicle andFuel Emissions Laboratory report EPA 420-F-95-003,“Fuel Economy Impact Analysis of ReformulatedGasoline.” See Fuel Ethanol (Denatured).
Natural Gas Plant Liquids Production. Calculatedannually by EIA as the average of the thermal conversionfactors for each natural gas plant liquid produced weightedby the quantities produced.
Natural Gasoline. EIA adopted the thermal conversionfactor of 4.620 million Btu per barrel as estimated by theBureau of Mines and first published in the Petroleum State-ment, Annual, 1956.
Pentanes Plus. EIA assumed the thermal conversion factorto be 4.620 million Btu or equal to that for natural gasoline.See Natural Gasoline.
Petrochemical Feedstocks, Naphtha less than 401° F.Assumed by EIA to be 5.248 million Btu per barrel or equalto the thermal conversion factor for special naphthas. SeeSpecial Naphthas.
Petrochemical Feedstocks, Other Oils equal to orgreater than 401° F. Assumed by EIA to be 5.825 millionBtu per barrel or equal to the thermal conversion factor fordistillate fuel oil. See Distillate Fuel Oil.
Petrochemical Feedstocks, Still Gas. Assumed by EIA tobe 6.000 million Btu per barrel or equal to the thermalconversion factor for still gas. See Still Gas.
Petroleum Coke. EIA adopted the thermal conversionfactor of 6.024 million Btu per barrel as reported in Btu pershort ton in the Bureau of Mines internal memorandum,“Bureau of Mines Standard Average Heating Values ofVarious Fuels, Adopted January 3, 1950.” The Bureau ofMines calculated this factor by dividing 30.120 million Btuper short ton, as given in the referenced Bureau of Minesinternal memorandum, by 5.0 barrels per short ton, as given inthe Bureau of Mines Form 6-1300-M and successor EIAforms.
Petroleum Consumption, Commercial Sector. Calculatedannually by EIA as the average of the thermal conversionfactors for all petroleum products consumed by thecommercial sector weighted by the estimated quantitiesconsumed by the commercial sector. The quantities ofpetroleum products consumed by the commercial sectorare estimated in the State Energy Data System—see
documentation athttp://www.eia.gov/state/seds/sep_use/notes/use_petrol.pdf.
Petroleum Consumption, Electric Power Sector. Calcu-lated annually by EIA as the average of the thermal conver-sion factors for all petroleum products consumed by theelectric power sector weighted by the quantities consumedby the electric power sector. Data are from Form EIA-923,“Power Plant Operations Report,” and predecessor forms.
Petroleum Consumption, Industrial Sector. Calculatedannually by EIA as the average of the thermal conversionfactors for all petroleum products consumed by the indus-trial sector weighted by the estimated quantities consumedby the industrial sector. The quantities of petroleumproducts consumed by the industrial sector are estimated inthe State Energy Data System—see documentation at http://www.eia.gov/state/seds/sep_use/notes/use_petrol.pdf.
Petroleum Consumption, Residential Sector. Calculatedannually by EIA as the average of the thermal conversionfactors for all petroleum products consumed by the residen-tial sector weighted by the estimated quantities consumedby the residential sector. The quantities of petroleumproducts consumed by the residential sector are estimated inthe State Energy Data System—see documentation at http://www.eia.gov/state/seds/sep_use/notes/use_petrol.pdf.
Petroleum Consumption, Total. Calculated annually byEIA as the average of the thermal conversion factors for allpetroleum products consumed weighted by the quantitiesconsumed.
Petroleum Consumption, Transportation Sector. Calcu-lated annually by EIA as the average of the thermal conver-sion factors for all petroleum products consumed by thetransportation sector weighted by the estimated quantitiesconsumed by the transportation sector. The quantities ofpetroleum products consumed by the transportation sectorare estimated in the State Energy Data System—seedocumentation athttp://www.eia.gov/state/seds/sep_use/notes/use_petrol.pdf.
Petroleum Products Exports. Calculated annually by EIAas the average of the thermal conversion factors for eachpetroleum product exported weighted by the quantitiesexported.
Petroleum Products Imports. Calculated annually by EIAas the average of the thermal conversion factors for eachpetroleum product imported weighted by the quantitiesimported.
Plant Condensate. Estimated to be 5.418 million Btu perbarrel by EIA from data provided by McClanahan Consult-ants, Inc., Houston, Texas.
Propane. EIA adopted the Bureau of Mines thermalconversion factor of 3.836 million Btu per barrel as
178 U.S. Energy Information Administration / Monthly Energy Review December 2013

published in the California Oil World and PetroleumIndustry, First Issue, April 1942.
Residual Fuel Oil. EIA adopted the thermal conversionfactor of 6.287 million Btu per barrel as reported in theBureau of Mines internal memorandum, “Bureau of MinesStandard Average Heating Values of Various Fuels,Adopted January 3, 1950.”
Road Oil. EIA adopted the Bureau of Mines thermalconversion factor of 6.636 million Btu per barrel, whichwas assumed to be equal to that of asphalt (see Asphalt)and was first published by the Bureau of Mines in thePetroleum Statement, Annual, 1970.
Special Naphthas. EIA adopted the Bureau of Minesthermal conversion factor of 5.248 million Btu per barrel,which was assumed to be equal to that of the total gasoline(aviation and motor) factor and was first published in thePetroleum Statement, Annual, 1970.
Still Gas. EIA adopted the Bureau of Mines estimatedthermal conversion factor of 6.000 million Btu per barrel,first published in the Petroleum Statement, Annual, 1970.
Total Petroleum Exports. Calculated annually by EIA asthe average of the thermal conversion factors for crude oiland each petroleum product exported weighted by thequantities exported. See Crude Oil Exports and Petro-leum Products Exports.
Total Petroleum Imports. Calculated annually by EIA asthe average of the thermal conversion factors for each typeof crude oil and petroleum product imported weighted bythe quantities imported. See Crude Oil Imports and Petro-leum Products Imports.
Unfinished Oils. EIA assumed the thermal conversionfactor to be 5.825 million Btu per barrel or equal to that fordistillate fuel oil (see Distillate Fuel Oil) and firstpublished it in EIA’s Annual Report to Congress, Volume3, 1977.
Unfractionated Stream. EIA assumed the thermal conver-sion factor to be 5.418 million Btu per barrel or equal tothat for plant condensate (see Plant Condensate) and firstpublished it in EIA’s Annual Report to Congress, Volume2, 1981.
Waxes. EIA adopted the thermal conversion factor of5.537 million Btu per barrel as estimated by the Bureauof Mines and first published in the Petroleum Statement,Annual, 1956.
Approximate Heat Content of Biofuels
Biodiesel. EIA estimated the thermal conversion factor forbiodiesel to be 5.359 million Btu per barrel, or 17,253 Btuper pound.
Biodiesel Feedstock. EIA used soybean oil input to theproduction of biodiesel (million Btu soybean oil per barrelbiodiesel) as the factor to estimate total biomass inputs tothe production of biodiesel. EIA assumed that 7.65 poundsof soybean oil are needed to produce one gallon of biodie-sel, and 5.433 million Btu of soybean oil are needed toproduce one barrel of biodiesel. EIA also assumed thatsoybean oil has a gross heat content of 16,909 Btu perpound, or 5.483 million Btu per barrel.
Ethanol (Undenatured). EIA adopted the thermalconversion factor of 3.539 million Btu per barrelpublished in “Oxygenate Flexibility for Future Fuels,” apaper presented by William J. Piel of the ARCO Chemi-cal Company at the National Conference on ReformulatedGasolines and Clean Air Act Implementation, Washington,D.C., October 1991.
Fuel Ethanol (Denatured). • 1981–2008: EIA used the2009 factor. • 2009 forward: Calculated by EIA as theannual quantity-weighted average of the thermal conver-sion factors for undenatured ethanol (3.539 million Btuper barrel), pentanes plus used as denaturant (4.620million Btu per barrel), and conventional motor gasolineand motor gasoline blending components used as denatur-ant (5.253 million Btu per barrel). The quantity ofethanol consumed is from EIA’s Petroleum SupplyAnnual (PSA) and Petroleum Supply Monthly (PSM),Table 1, data for renewable fuels and oxygenate plant netproduction of fuel ethanol. The quantity of pentanes plusused as denaturant is from PSA/PSM, Table 1, data forrenewable fuels and oxygenate plant net production ofpentanes plus, multiplied by -1. The quantity of conven-tional motor gasoline and motor gasoline blending compo-nents used as denaturant is from PSA/PSM, Table 1, datafor renewable fuels and oxygenate plant net production ofconventional motor gasoline and motor gasoline blendingcomponents, multiplied by -1.
Fuel Ethanol Feedstock. EIA used corn input to theproduction of undenatured ethanol (million Btu corn perbarrel undenatured ethanol) as the annual factor toestimate total biomass inputs to the production of undena-tured ethanol. U.S. Department of Agriculture observedethanol yields (gallons undenatured ethanol per bushel ofcorn) were 2.5 in 1980, 2.666 in 1998, 2.68 in 2002, and2.764 in 2009; EIA estimated the ethanol yields in otheryears. EIA also assumed that corn has a gross heatcontent of 0.392 million Btu per bushel.
U.S. Energy Information Administration / Monthly Energy Review December 2013 179
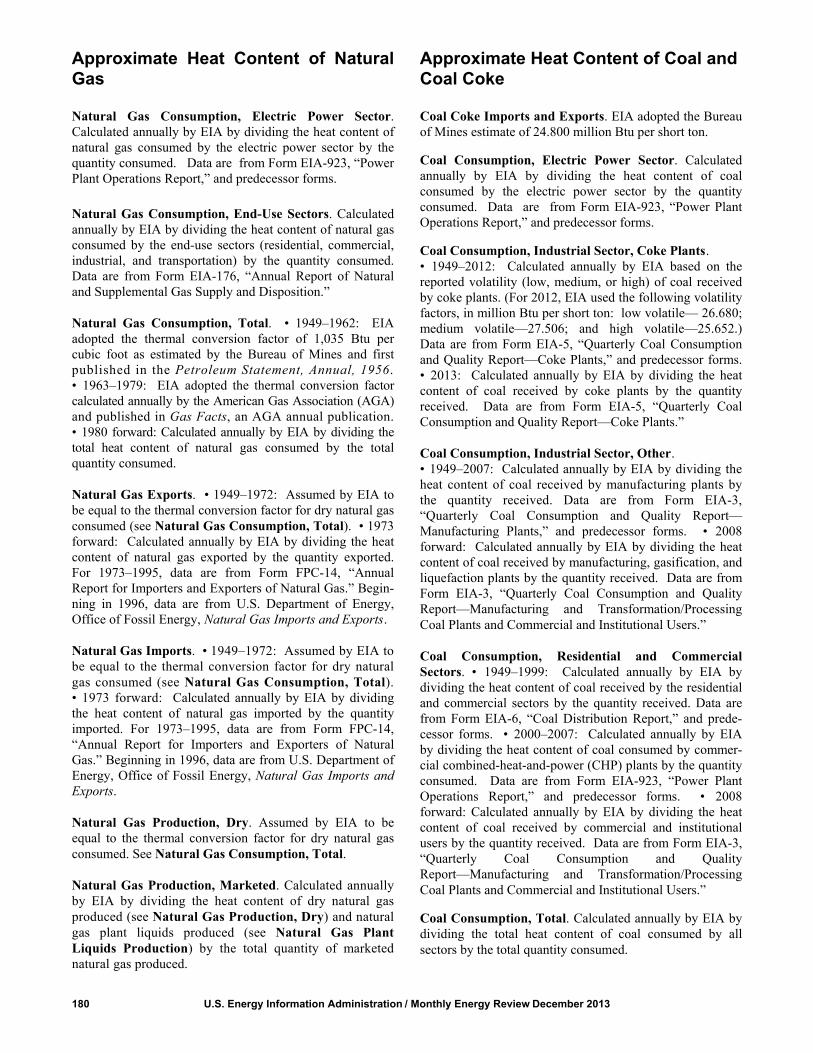
Approximate Heat Content of NaturalGas
Natural Gas Consumption, Electric Power Sector.Calculated annually by EIA by dividing the heat content ofnatural gas consumed by the electric power sector by thequantity consumed. Data are from Form EIA-923, “PowerPlant Operations Report,” and predecessor forms.
Natural Gas Consumption, End-Use Sectors. Calculatedannually by EIA by dividing the heat content of natural gasconsumed by the end-use sectors (residential, commercial,industrial, and transportation) by the quantity consumed.Data are from Form EIA-176, “Annual Report of Naturaland Supplemental Gas Supply and Disposition.”
Natural Gas Consumption, Total. • 1949–1962: EIAadopted the thermal conversion factor of 1,035 Btu percubic foot as estimated by the Bureau of Mines and firstpublished in the Petroleum Statement, Annual, 1956.• 1963–1979: EIA adopted the thermal conversion factorcalculated annually by the American Gas Association (AGA)and published in Gas Facts, an AGA annual publication.• 1980 forward: Calculated annually by EIA by dividing thetotal heat content of natural gas consumed by the totalquantity consumed.
Natural Gas Exports. • 1949–1972: Assumed by EIA tobe equal to the thermal conversion factor for dry natural gasconsumed (see Natural Gas Consumption, Total). • 1973forward: Calculated annually by EIA by dividing the heatcontent of natural gas exported by the quantity exported.For 1973–1995, data are from Form FPC-14, “AnnualReport for Importers and Exporters of Natural Gas.” Begin-ning in 1996, data are from U.S. Department of Energy,Office of Fossil Energy, Natural Gas Imports and Exports.
Natural Gas Imports. • 1949–1972: Assumed by EIA tobe equal to the thermal conversion factor for dry naturalgas consumed (see Natural Gas Consumption, Total).• 1973 forward: Calculated annually by EIA by dividingthe heat content of natural gas imported by the quantityimported. For 1973–1995, data are from Form FPC-14,“Annual Report for Importers and Exporters of NaturalGas.” Beginning in 1996, data are from U.S. Department ofEnergy, Office of Fossil Energy, Natural Gas Imports andExports.
Natural Gas Production, Dry. Assumed by EIA to beequal to the thermal conversion factor for dry natural gasconsumed. See Natural Gas Consumption, Total.
Natural Gas Production, Marketed. Calculated annuallyby EIA by dividing the heat content of dry natural gasproduced (see Natural Gas Production, Dry) and naturalgas plant liquids produced (see Natural Gas PlantLiquids Production) by the total quantity of marketednatural gas produced.
Approximate Heat Content of Coal andCoal Coke
Coal Coke Imports and Exports. EIA adopted the Bureauof Mines estimate of 24.800 million Btu per short ton.
Coal Consumption, Electric Power Sector. Calculatedannually by EIA by dividing the heat content of coalconsumed by the electric power sector by the quantityconsumed. Data are from Form EIA-923, “Power PlantOperations Report,” and predecessor forms.
Coal Consumption, Industrial Sector, Coke Plants. • 1949–2012: Calculated annually by EIA based on thereported volatility (low, medium, or high) of coal receivedby coke plants. (For 2012, EIA used the following volatilityfactors, in million Btu per short ton: low volatile— 26.680;medium volatile—27.506; and high volatile—25.652.)Data are from Form EIA-5, “Quarterly Coal Consumptionand Quality Report—Coke Plants,” and predecessor forms.• 2013: Calculated annually by EIA by dividing the heatcontent of coal received by coke plants by the quantityreceived. Data are from Form EIA-5, “Quarterly CoalConsumption and Quality Report—Coke Plants.”
Coal Consumption, Industrial Sector, Other. • 1949–2007: Calculated annually by EIA by dividing theheat content of coal received by manufacturing plants bythe quantity received. Data are from Form EIA-3,“Quarterly Coal Consumption and Quality Report—Manufacturing Plants,” and predecessor forms. • 2008forward: Calculated annually by EIA by dividing the heatcontent of coal received by manufacturing, gasification, andliquefaction plants by the quantity received. Data are fromForm EIA-3, “Quarterly Coal Consumption and QualityReport—Manufacturing and Transformation/ProcessingCoal Plants and Commercial and Institutional Users.”
Coal Consumption, Residential and CommercialSectors. • 1949–1999: Calculated annually by EIA bydividing the heat content of coal received by the residentialand commercial sectors by the quantity received. Data arefrom Form EIA-6, “Coal Distribution Report,” and prede-cessor forms. • 2000–2007: Calculated annually by EIAby dividing the heat content of coal consumed by commer-cial combined-heat-and-power (CHP) plants by the quantityconsumed. Data are from Form EIA-923, “Power PlantOperations Report,” and predecessor forms. • 2008forward: Calculated annually by EIA by dividing the heatcontent of coal received by commercial and institutionalusers by the quantity received. Data are from Form EIA-3,“Quarterly Coal Consumption and QualityReport—Manufacturing and Transformation/ProcessingCoal Plants and Commercial and Institutional Users.”
Coal Consumption, Total. Calculated annually by EIA bydividing the total heat content of coal consumed by allsectors by the total quantity consumed.
180 U.S. Energy Information Administration / Monthly Energy Review December 2013

Coal Exports. • 1949–2011: Calculated annually by EIAby dividing the heat content of steam coal and metallurgi-cal coal exported by the quantity exported. Data are fromU.S. Department of Commerce, Bureau of the Census,“Monthly Report EM 545,” and predecessor forms. • 2012forward: Calculated annually by EIA by dividing the heatcontent of steam coal and metallurgical coal exported bythe quantity exported. The average heat content of steamcoal is derived from receipts data from Form EIA-3,“Quarterly Coal Consumption and QualityReport—Manufacturing and Transformation/ProcessingCoal Plants and Commercial and Institutional Users,” andForm EIA-923, “Power Plant Operations Report.” Theaverage heat content of metallurgical coal is derived fromreceipts data from Form EIA-5, “Quarterly Coal Consump-tion and Quality Report—Coke Plants.” Data for exportquantities are from U.S. Department of Commerce, Bureauof the Census, “Monthly Report EM 545.”
Coal Imports. • 1949–1963: Calculated annually by EIAby dividing the heat content of coal imported by thequantity imported. Data are from U.S. Department ofCommerce, Bureau of the Census, “Monthly Report IM145,” and predecessor forms. • 1964–2011: Assumed byEIA to be 25.000 million Btu per short ton. • 2012forward: Calculated annually by EIA by dividing the heatcontent of coal imported (received) by the quantityimported (received). Data are from Form EIA-3,“Quarterly Coal Consumption and QualityReport—Manufacturing and Transformation/ProcessingCoal Plants and Commercial and Institutional Users”; FormEIA-5, “Quarterly Coal Consumption and Quality Report—Coke Plants”; and Form EIA-923, “Power Plant Opera-tions Report.”
Coal Production. • 1949–2011: Calculated annually byEIA by dividing the heat content of domestic coal (exclud-ing waste coal) received by the quantity received. Data arefrom Form EIA-3, “Quarterly Coal Consumption andQuality Report—Manufacturing and Transformation/Processing Coal Plants and Commercial and InstitutionalUsers”; Form EIA-5, “Quarterly Coal Consumption andQuality Report—Coke Plants”; Form EIA-923, “Power PlantOperations Report”; and predecessor forms. • 2012forward: Calculated annually by EIA by dividing the heatcontent of domestic coal (excluding waste coal) receivedand exported by the quantity received and exported. Dataare from Form EIA-3, “Quarterly Coal Consumption andQuality Report—Manufacturing andTransformation/Processing Coal Plants and Commercialand Institutional Users”; Form EIA-5, “Quarterly CoalConsumption and Quality Report—Coke Plants”; FormEIA-923, “Power Plant Operations Report”; U.S. Depart-ment of Commerce, Bureau of the Census, “Monthly ReportEM 545”; and predecessor forms.
Waste Coal Supplied. • 1989–2000: Calculated annuallyby EIA by dividing the heat content of waste coal consumedby the quantity consumed. Data are from Form EIA-860B,“Annual Electric Generator Report—Nonutility,” and
predecessor form. • 2001 forward: Calculated by EIA bydividing the heat content of waste coal received (orconsumed) by the quantity received (or consumed). Receiptsdata are from Form EIA-3, “Quarterly Coal Consumptionand Quality Report—Manufacturing andTransformation/Processing Coal Plants and Commercial andInstitutional Users,” and predecessor form. Consumptiondata are from Form EIA-923, “Power Plant OperationsReport,” and predecessor forms.
Approximate Heat Rates for Electricity
Electricity Net Generation, Coal. • 2001 forward: Calcu-lated annually by EIA by using fuel consumption and netgeneration data reported on Form EIA-923, “Power PlantOperations Report,” and predecessor forms. The computa-tion includes data for all electric utilities and electricity-only independent power producers using anthracite, bitumi-nous coal, subbituminous coal, lignite, and beginning in2002, waste coal and coal synfuel.
Electricity Net Generation, Natural Gas. • 2001forward: Calculated annually by EIA by using fuelconsumption and net generation data reported on FormEIA-923, “Power Plant Operations Report,” and predeces-sor forms. The computation includes data for all electricutilities and electricity-only independent power producersusing natural gas and supplemental gaseous fuels.
Electricity Net Generation, Noncombustible RenewableEnergy. There is no generally accepted practice formeasuring the thermal conversion rates for power plantsthat generate electricity from hydro, geothermal, solarthermal, photovoltaic, and wind energy sources. Therefore,EIA calculates a rate factor that is equal to the annualaverage heat rate factor for fossil-fueled power plants in theUnited States (see “Electricity Net Generation, Total FossilFuels”). By using that factor it is possible to evaluate fossilfuel requirements for replacing those sources duringperiods of interruption, such as droughts.
Electricity Net Generation, Nuclear. • 1957–1984:Calculated annually by dividing the total heat contentconsumed in nuclear generating units by the total (net)electricity generated by nuclear generating units. The heatcontent and electricity generation were reported on FormFERC-1, “Annual Report of Major Electric Utilities, Licen-sees, and Others”; Form EIA-412, “Annual Report of PublicElectric Utilities”; and predecessor forms. For 1982, thefactors were published in EIA, Historical Plant Cost andAnnual Production Expenses for Selected Electric Plants1982, page 215. For 1983 and 1984, the factors werepublished in EIA, Electric Plant Cost and Power ProductionExpenses 1991, Table 13. • 1985 forward: Calculatedannually by EIA by using the heat rate data reported onForm EIA-860, “Annual Electric Generator Report,” andpredecessor forms.
U.S. Energy Information Administration / Monthly Energy Review December 2013 181
Electricity Net Generation, Petroleum. • 2001 forward: Calculated annually by EIA by using fuel consumption andnet generation data reported on Form EIA-923, “PowerPlant Operations Report,” and predecessor forms. Thecomputation includes data for all electric utilities andelectricity-only independent power producers using distil-late fuel oil, residual fuel oil, jet fuel, kerosene, petroleumcoke, and waste oil.
Electricity Net Generation, Total Fossil Fuels. • 1949–1955: The weighted annual average heat rate forfossil-fueled steam-electric power plants in the United States,as published by EIA in Thermal-Electric Plant Construc-tion Cost and Annual Production Expenses—1981 andSteam-Electric Plant Construction Cost and AnnualProduction Expenses—1978. • 1956–1988: The weightedannual average heat rate for fossil-fueled steam-electric
power plants in the United States, as published in EIA,Electric Plant Cost and Power Production Expenses1991, Table 9. • 1989–2000: Calculated annually byEIA by using heat rate data reported on Form EIA-860,“Annual Electric Generator Report,” and predecessorforms; and net generation data reported on FormEIA-759, “Monthly Power Plant Report.” The computa-tion includes data for all electric utility steam-electricplants using fossil fuels. • 2001 forward: Calculatedannually by EIA by using fuel consumption and netgeneration data reported on Form EIA-923, “Power PlantOperations Report,” and predecessor forms. The compu-tation includes data for all electric utilities and electricity-only independent power producers using coal, petroleum,natural gas, and other gases (blast furnace gas, propanegas, and other manufactured and waste gases derivedfrom fossil fuels).
182 U.S. Energy Information Administration / Monthly Energy Review December 2013

Data presented in the Monthly Energy Review and in otherU.S. Energy Information Administration publications areexpressed predominately in units that historically have been usedin the United States, such as British thermal units, barrels, cubicfeet, and short tons. The metric conversion factors presented inTable B1 can be used to calculate the metric-unit equivalents ofvalues expressed in U.S. Customary units. For example, 500short tons are the equivalent of 453.6 metric tons (500 short tonsx 0.9071847 metric tons/short ton = 453.6 metric tons).
In the metric system of weights and measures, the namesof multiples and subdivisions of any unit may be derived
by combining the name of the unit with prefixes, such asdeka, hecto, and kilo, meaning, respectively, 10, 100,1,000, and deci, centi, and milli, meaning, respectively,one-tenth, one-hundredth, and one-thousandth. Commonmetric prefixes can be found in Table B2.
The conversion factors presented in Table B3 can be used tocalculate equivalents in various physical units commonlyused in energy analyses. For example, 10 barrels are theequivalent of 420 U.S. gallons (10 barrels x 42gallons/barrel = 420 gallons).
U.S. Energy Information Administration / Monthly Energy Review December 2013 183
Appendix BMetric Conversion Factors, Metric Prefixes, and Other Physical
Conversion Factors

184 U.S. Energy Information Administration / Monthly Energy Review December 2013
aExact conversion. bCalculated by the U.S. Energy Information Administration. cThe Btu used in this table is the International Table Btu adopted by the Fifth International Conference on Properties of Steam, London, 1956. dTo convert degrees Fahrenheit (ºF) to degrees Celsius (ºC) exactly, subtract 32, then multiply by 5/9. Notes: • Spaces have been inserted after every third digit to the right of the decimal for ease of reading. • Most metric units belong to the International System of Units (SI), and the liter, hectare, and metric ton are accepted for use with the SI units. For more information about the SIunits, see http://physics.nist.gov/cuu/Units/index.html. Web Page: http://www.eia.gov/totalenergy/data/monthly/#appendices. Sources: • General Services Administration, Federal Standard 376B, Preferred Metric Units for General Use by the Federal Government(Washington, DC, January 1993), pp. 9-11, 13, and 16. • U.S. Department of Commerce, National Institute of Standards and Technology,Special Publications 330, 811, and 814. • American National Standards Institute/Institute of Electrical and Electronic Engineers, ANSI/IEEE Std268-1992, pp. 28 and 29.
degrees Celsius (ºC) 100a =212 degrees Fahrenheit (ºF) degrees Celsius (ºC) 0a =32 degrees Fahrenheit (ºF)Temperatured
megajoules (MJ)3.6a=1 kilowatthour (kWh)joules (J)4.186 8a=1 calorie (cal) joules (J)1,055.055 852 62a=1 British thermal unit (Btu)cEnergy
square centimeters (cm2)6.451 6a=1 square inch (in2)square meters (m2)0.092 903 04a=1 square foot (ft2)square meters (m2)0.836 127 4=1 square yard (yd2)square kilometers (km2)2.589 988=1 square mile (mi2)hectares (ha)0.404 69=1 acreArea
centimeters (cm)2.54a=1 inch (in)meters (m)0.304 8a=1 foot (ft)meters (m)0.914 4a=1 yard (yd)kilometers (km)1.609 344a=1 mile (mi)Length
milliliters (mL)16.387 06=1 cubic inch (in3)milliliters (mL)29.573 53=1 ounce, fluid (fl oz)liters (L)3.785 412=1 U.S. gallon (gal)cubic meters (m3)0.028 316 85=1 cubic foot (ft3)cubic meters (m3)0.764 555=1 cubic yard (yd3)cubic meters (m3)0.158 987 3=1 barrel of oil (bbl)Volume
grams (g)28.349 52=1 ounce, avoirdupois (avdp oz)kilograms uranium (kgU) 0.384 647b=1 pound uranium oxide (lb U3O8)kilograms (kg)0.453 592 37a=1 pound (lb)metric tons (t) 1.016 047=1 long tonmetric tons (t)0.907 184 7= 1 short ton (2,000 lb)Mass
Metric Units Equivalent in U.S. UnitType of Unit
Table B1. Metric Conversion Factors
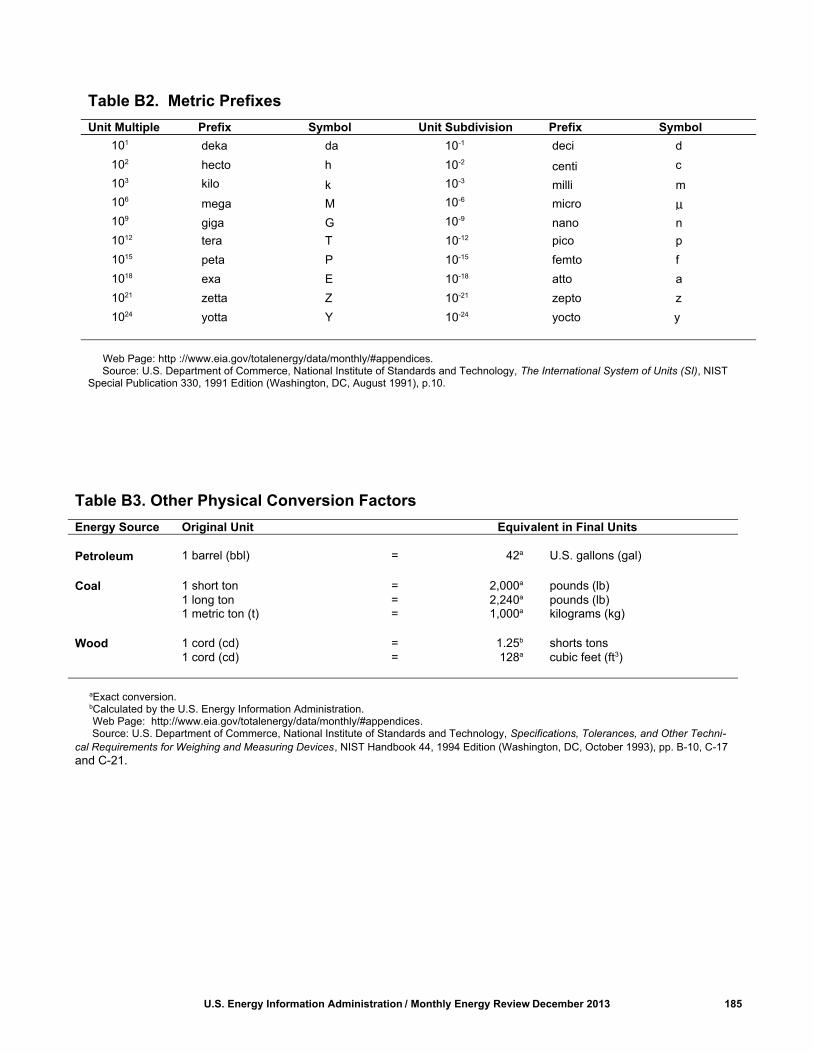
U.S. Energy Information Administration / Monthly Energy Review December 2013 185
aExact conversion.bCalculated by the U.S. Energy Information Administration.
Web Page: http://www.eia.gov/totalenergy/data/monthly/#appendices. Source: U.S. Department of Commerce, National Institute of Standards and Technology, Specifications, Tolerances, and Other Techni-
cal Requirements for Weighing and Measuring Devices, NIST Handbook 44, 1994 Edition (Washington, DC, October 1993), pp. B-10, C-17and C-21.
cubic feet (ft3)128a= 1 cord (cd)shorts tons1.25b = 1 cord (cd)Wood
kilograms (kg)1,000a = 1 metric ton (t)pounds (lb)2,240a = 1 long tonpounds (lb)2,000a = 1 short tonCoal
U.S. gallons (gal)42a= 1 barrel (bbl)Petroleum
alent in Final Units EquivOriginal UnitEnergy Source
Table B3. Other Physical Conversion Factors
Web Page: http ://www.eia.gov/totalenergy/data/monthly/#appendices.
Source: U.S. Department of Commerce, National Institute of Standards and Technology, The International System of Units (SI), NISTSpecial Publication 330, 1991 Edition (Washington, DC, August 1991), p.10.
y yocto 10-24 Y yotta 1024
z zepto 10-21 Z zetta 1021
a atto 10-18 E exa 1018
f femto 10-15 P peta 1015
p pico 10-12 T tera 1012
nnano 10-9 G giga 109
μmicro 10-6 M mega 106
mmilli 10-3 k kilo 103
ccenti 10-2 h hecto 102
d deci 10-1 da deka 101
SymbolPrefixUnit SubdivisionSymbolPrefixUnit Multiple
Table B2. Metric Prefixes

THIS PAGE INTENTIONALLY LEFT BLANK

Alcohol: The family name of a group of organic chemicalcompounds composed of carbon, hydrogen, and oxygen.The series of molecules vary in chain length and arecomposed of a hydrocarbon plus a hydroxyl group;CH(3)-(CH(2))n-OH (e.g., methanol, ethanol, and tertiarybutyl alcohol). See Fuel Ethanol.
Alternative Fuel: Alternative fuels, for transportationapplications, include the following: methanol; denaturedethanol, and other alcohols; fuel mixtures containing 85percent or more by volume of methanol, denatured ethanol,and other alcohols with motor gasoline or other fuels;natural gas; liquefied petroleum gas (propane); hydro-gen; coal-derived liquid fuels; fuels (other than alcohol)derived from biological materials (biofuels such as soydiesel fuel); electricity (including electricity from solarenergy); and "... any other fuel the Secretary determines,by rule, is substantially not petroleum and would yieldsubstantial energy security benefits and substantial envi-ronmental benefits." The term "alternative fuel" does notinclude alcohol or other blended portions of primarilypetroleum-based fuels used as oxygenates or extenders,i.e., MTBE, ETBE, other ethers, and the 10-percent ethanolportion of gasohol.
Alternative-Fuel Vehicle (AFV): A vehicle designed tooperate on an alternative fuel (e.g., compressed naturalgas, methane blend, or electricity). The vehicle could beeither a dedicated vehicle designed to operate exclusivelyon alternative fuel or a nondedicated vehicle designed tooperate on alternative fuel and/or a traditional fuel.
Anthracite: The highest rank of coal; used primarily forresidential and commercial space heating. It is a hard, brit-tle, and black lustrous coal, often referred to as hard coal,containing a high percentage of fixed carbon and a lowpercentage of volatile matter. The moisture content offresh-mined anthracite generally is less than 15 percent.The heat content of anthracite ranges from 22 to 28million Btu per short ton on a moist, mineral-matter-freebasis. The heat content of anthracite coal consumed in theUnited States averages 25 million Btu per short ton, on theas-received basis (i.e., containing both inherent moistureand mineral matter). Note: Since the 1980's, anthraciterefuse or mine waste has been used for steam-electricpower generation. This fuel typically has a heat content of15 million Btu per ton or less.
Anthropogenic: Made or generated by a human or causedby human activity. The term is used in the context of globalclimate change to refer to gaseous emissions that are theresult of human activities, as well as other potentiallyclimate-altering activities, such as deforestation.
Asphalt: A dark-brown-to-black cement-like materialcontaining bitumens as the predominant constituentsobtained by petroleum processing. The definition includescrude asphalt as well as the following finished products:cements, fluxes, the asphalt content of emulsions (exclu-sive of water), and petroleum distillates blended withasphalt to make cutback asphalts.
ASTM: The American Society for Testing and Materials.
Aviation Gasoline Blending Components: Naphthas thatwill be used for blending or compounding into finishedaviation gasoline (e.g., straight run gasoline, alkylate,reformate, benzene, toluene, and xylene). Excludesoxygenates (alcohols, ethers), butane, and pentanes plus.
Aviation Gasoline, Finished: A complex mixture of rela-tively volatile hydrocarbons with or without small quanti-ties of additives, blended to form a fuel suitable for use inaviation reciprocating engines. Fuel specifications areprovided in ASTM Specification D 910 and MilitarySpecification MIL-G-5572. Note: Data on blendingcomponents are not counted in data on finished aviationgasoline.
Barrel (Petroleum): A unit of volume equal to 42 U.S.Gallons.
Base Gas: The volume of gas needed as a permanent inven-tory to maintain adequate underground storage reservoir pres-sures and deliverability rates throughout the withdrawalseason. All native gas is included in the base gas volume.
Biodiesel: A fuel typically made from soybean, canola, orother vegetable oils; animal fats; and recycled grease. Itcan serve as a substitute for petroleum-derived diesel fuelor distillate fuel oil. For U.S. Energy Information Admin-istration reporting, it is a fuel composed of mono-alkylesters of long chain fatty acids derived from vegetable oilsor animal fats, designated B100, and meeting the require-ments of ASTM (American Society for Testing & Materials)D 6751.
Biofuels: Liquid fuels and blending components producedfrom biomass (plant) feedstocks, used primarily for trans-portation. See Biodiesel and Fuel Ethanol.
Biogenic: Produced by biological processes of living organ-isms. Note: EIA uses the term “biogenic” to refer only toorganic nonfossil material of biological origin.
Biomass: Organic non-fossil material of biological originconstituting a renewable energy source. See Biodiesel,
U.S. Energy Information Administration / Monthly Energy Review December 2013 187
Glossary

Biofuels, Biomass Waste, Fuel Ethanol, and Wood andWood-Derived Fuels.
Biomass Waste: Organic non-fossil material of biologi-cal origin that is a byproduct or a discarded product.“Biomass waste” includes municipal solid waste frombiogenic sources, landfill gas, sludge waste, agriculturalcrop byproducts, straw, and other biomass solids, liquids,and gases; but excludes wood and wood-derived fuels(including black liquor), biofuels feedstock, biodiesel,and fuel ethanol. Note: EIA “biomass waste” data alsoinclude energy crops grown specifically for energy produc-tion, which would not normally constitute waste.
Bituminous Coal: A dense coal, usually black, some-times dark brown, often with well-defined bands ofbright and dull material, used primarily as fuel in steam-electric power generation, with substantial quantities alsoused for heat and power applications in manufacturingand to make coke. Bituminous coal is the most abundantcoal in active U.S. mining regions. Its moisture contentusually is less than 20 percent. The heat content of bitu-minous coal ranges from 21 to 30 million Btu per shortton on a moist, mineral-matter-free basis. The heatcontent of bituminous coal consumed in the United Statesaverages 24 million Btu per short ton, on the as-receivedbasis (i.e., containing both inherent moisture and mineralmatter).
Black Liquor: A byproduct of the paper production proc-ess, alkaline spent liquor, that can be used as a source ofenergy. Alkaline spent liquor is removed from the diges-ters in the process of chemically pulping wood. Afterevaporation, the residual "black" liquor is burned as a fuelin a recovery furnace that permits the recovery of certainbasic chemicals.
British Thermal Unit (Btu): The quantity of heatrequired to raise the temperature of 1 pound of liquidwater by 1 degree Fahrenheit at the temperature at whichwater has its greatest density (approximately 39 degreesFahrenheit). See Heat Content.
Btu: See British Thermal Unit.
Btu Conversion Factor: A factor for converting energydata between one unit of measurement and British ther-mal units (Btu). Btu conversion factors are generallyused to convert energy data from physical units of meas-ure (such as barrels, cubic feet, or short tons) into theenergy-equivalent measure of Btu. (Seehttp://www.eia.gov/totalenergy/data/monthly/#appendicesfor further information on Btu conversion factors.)
Butane: A normally gaseous straight-chain or branched-chain hydrocarbon (C4H10). It is extracted from naturalgas or refinery gas streams. It includes isobutane andnormal butane and is designated in ASTM SpecificationD1835 and Gas Processors Association Specifications forcommercial butane.
Isobutane: A normally gaseous branched-chain hydrocarbon.It is a colorless paraffinic gas that boils at a temperature of10.9º F. It is extracted from natural gas or refinery gasstreams.
Normal Butane: A normally gaseous straight-chain hydro-carbon. It is a colorless paraffinic gas that boils at a tempera-ture of 31.1º F. It is extracted from natural gas or refinerygas streams.
Butylene: An olefinic hydrocarbon (C4H8) recovered fromrefinery processes.
Capacity Factor: The ratio of the electrical energyproduced by a generating unit for a given period of timeto the electrical energy that could have been produced atcontinuous full-power operation during the same period.
Carbon Dioxide (CO2): A colorless, odorless, non-poisonous gas that is a normal part of Earth's atmosphere.Carbon dioxide is a product of fossil-fuel combustion aswell as other processes. It is considered a greenhouse gasas it traps heat (infrared energy) radiated by the Earth intothe atmosphere and thereby contributes to the potentialfor global warming. The global warming potential(GWP) of other greenhouse gases is measured in relationto that of carbon dioxide, which by international scientificconvention is assigned a value of one (1).
Chained Dollars: A measure used to express real prices.Real prices are those that have been adjusted to remove theeffect of changes in the purchasing power of the dollar; theyusually reflect buying power relative to a reference year.Prior to 1996, real prices were expressed in constantdollars, a measure based on the weights of goods and serv-ices in a single year, usually a recent year. In 1996, theU.S. Department of Commerce introduced the chained-dollar measure. The new measure is based on the averageweights of goods and services in successive pairs of years.It is “chained” because the second year in each pair, withits weights, becomes the first year of the next pair. Theadvantage of using the chained-dollar measure is that it ismore closely related to any given period and is thereforesubject to less distortion over time.
CIF: See Cost, Insurance, Freight.
Citygate: A point or measuring station at which a distri-bution gas utility receives gas from a natural gas pipelinecompany or transmission system.
Climate Change: A term used to refer to all forms ofclimatic inconsistency, but especially to significant changefrom one prevailing climatic condition to another. Insome cases, "climate change" has been used synony-mously with the term "global warming"; scientists,however, tend to use the term in a wider sense inclusive ofnatural changes in climate, including climatic cooling.
188 U.S. Energy Information Administration / Monthly Energy Review December 2013

Coal: A readily combustible black or brownish-black rockwhose composition, including inherent moisture, consistsof more than 50 percent by weight and more than 70percent by volume of carbonaceous material. It is formedfrom plant remains that have been compacted, hardened,chemically altered, and metamorphosed by heat and pres-sure over geologic time. See Anthracite, BituminousCoal, Lignite, Subbituminous Coal, Waste Coal, andCoal Synfuel.
Coal Coke: See Coke, Coal.
Coal Stocks: Coal quantities that are held in storage forfuture use and disposition. Note: When coal data are collectedfor a particular reporting period (month, quarter, or year), coalstocks are commonly measured as of the last day of the period.
Coal Synfuel: Coal-based solid fuel that has been proc-essed by a coal synfuel plant; and coal-based fuels such asbriquettes, pellets, or extrusions, which are formed fromfresh or recycled coal and binding materials.
Coal Synfuel Plant: A plant engaged in the chemical trans-formation of coal into coal synfuel.
Coke, Coal: A solid carbonaceous residue derived fromlow-ash, low-sulfur bituminous coal from which the vola-tile constituents are driven off by baking in an oven attemperatures as high as 2,000º F so that the fixed carbonand residual ash are fused together. Coke is used as a fueland as a reducing agent in smelting iron ore in a blastfurnace. Coke (coal) has a heating value of 24.8 millionBtu per ton.
Coke, Petroleum: A residue high in carbon content andlow in hydrogen that is the final product of thermal decom-position in the condensation process in cracking. This prod-uct is reported as marketable coke or catalyst coke. Theconversion is 5 barrels (42 U.S. gallons each) per short ton.Coke (petroleum) has a heating value of 6.024 million Btuper barrel.
Coking Coal: Bituminous coal suitable for making coke.See Coke, Coal.
Combined-Heat-and-Power (CHP) Plant: A plantdesigned to produce both heat and electricity from a singleheat source. Note: This term is being used in place of theterm "cogenerator" that was used by EIA in the past. CHPbetter describes the facilities because some of the plantsincluded do not produce heat and power in a sequentialfashion and, as a result, do not meet the legal definition ofcogeneration specified in the Public Utility RegulatoryPolicies Act (PURPA).
Commercial Sector: An energy-consuming sector thatconsists of service-providing facilities and equipment of:businesses; federal, state, and local governments; andother private and public organizations, such as religious,
social, or fraternal groups. The commercial sector includesinstitutional living quarters. It also includes sewage treat-ment facilities. Common uses of energy associated withthis sector include space heating, water heating, air condi-tioning, lighting, refrigeration, cooking, and running a widevariety of other equipment. Note: This sector includesgenerators that produce electricity and/or useful thermaloutput primarily to support the activities of the above-mentioned commercial establishments. Various EIAprograms differ in sectoral coverage-for more informationsee http://www.eia.gov/neic/datadefinitions/Guideforwebcom.htm.See End-Use Sectors and Energy-Use Sectors.
Completion: The installation of permanent equipment forthe production of oil or gas. If a well is equipped toproduce only oil or gas from one zone or reservoir, thedefinition of a well (classified as an oil well or gas well)and the definition of a completion are identical. However,if a well is equipped to produce oil and/or gas separatelyfrom more than one reservoir, a well is not synonymouswith a completion.
Conventional Hydroelectric Power: Hydroelectric powergenerated from flowing water that is not created by hydroe-lectric pumped storage.
Conventional Motor Gasoline: See Motor GasolineConventional.
Conversion Factor: A factor for converting databetween one unit of measurement and another (such asbetween short tons and British thermal units, orbetween barrels and gallons). (Seehttp://www.eia.gov/totalenergy/data/monthly/#appendicesfor further information on conversion factors.) SeeBtu Conversion Factor and Thermal Conversion Factor.
Cost, Insurance, Freight (CIF): A sales transaction inwhich the seller pays for the transportation and insurance ofthe goods to the port of destination specified by the buyer.
Crude Oil: A mixture of hydrocarbons that exists inliquid phase in natural underground reservoirs andremains liquid at atmospheric pressure after passingthrough surface separating facilities. Depending upon thecharacteristics of the crude stream, it may also include: 1)small amounts of hydrocarbons that exist in gaseousphase in natural underground reservoirs but are liquid atatmospheric pressure after being recovered from oil well(casinghead) gas in lease separators and are subsequentlycommingled with the crude stream without being sepa-rately measured. Lease condensate recovered as a liquidfrom natural gas wells in lease or field separation facili-ties and later mixed into the crude stream is also included;2) small amounts of nonhydrocarbons produced with theoil, such as sulfur and various metals; and 3) drip gases,and liquid hydrocarbons produced from tar sands, oilsands, gilsonite, and oil shale.
U.S. Energy Information Administration / Monthly Energy Review December 2013 189

Liquids produced at natural gas processing plants areexcluded. Crude oil is refined to produce a wide array ofpetroleum products, including heating oils; gasoline,diesel and jet fuels; lubricants; asphalt; ethane, propane,and butane; and many other products used for their energyor chemical content.
Crude Oil F.O.B. Price: The crude oil price actuallycharged at the oil-producing country’s port of loading.Includes deductions for any rebates and discounts or addi-tions of premiums, where applicable. It is the actual pricepaid with no adjustment for credit terms.
Crude Oil (Including Lease Condensate): A mixture ofhydrocarbons that exists in liquid phase in undergroundreservoirs and remains liquid at atmospheric pressureafter passing through surface separating facilities.Included are lease condensate and liquid hydrocarbonsproduced from tar sands, gilsonite, and oil shale. Dripgases are also included, but topped crude oil (residualoil) and other unfinished oils are excluded. Where iden-tifiable, liquids produced at natural gas processing plantsand mixed with crude oil are likewise excluded.
Crude Oil Landed Cost: The price of crude oil at the portof discharge, including charges associated with thepurchase, transporting, and insuring of a cargo from thepurchase point to the port of discharge. The cost does notinclude charges incurred at the discharge port (e.g., importtariffs or fees, wharfage charges, and demurrage).
Crude Oil Refinery Input: The total crude oil put intoprocessing units at refineries.
Crude Oil Stocks: Stocks of crude oil and lease conden-sate held at refineries, in pipelines, at pipeline terminals,and on leases.
Crude Oil Used Directly: Crude oil consumed as fuel bycrude oil pipelines and on crude oil leases.
Crude Oil Well: A well completed for the production ofcrude oil from one or more oil zones or reservoirs. Wellsproducing both crude oil and natural gas are classified asoil wells.
Cubic Foot (Natural Gas): A unit of volume equal to 1cubic foot at a pressure base of 14.73 pounds standard persquare inch absolute and a temperature base of 60º F.
Degree-Day Normals: Simple arithmetic averages ofmonthly or annual degree-days over a long period of time(usually the 30-year period 1961-1990). The averagesmay be simple degree-day normals or population-weighted degree-day normals.
Degree-Days, Cooling (CDD): A measure of how warma location is over a period of time relative to a basetemperature, most commonly specified as 65 degrees
Fahrenheit. The measure is computed for each day bysubtracting the base temperature (65 degrees) from theaverage of the day’s high and low temperatures, withnegative values set equal to zero. Each day’s coolingdegree-days are summed to create a cooling degree-daymeasure for a specified reference period. Coolingdegree-days are used in energy analysis as an indicator ofair conditioning energy requirements or use.
Degree-Days, Heating (HDD): A measure of how cold alocation is over a period of time relative to a basetemperature, most commonly specified as 65 degreesFahrenheit. The measure is computed for each day bysubtracting the average of the day’s high and lowtemperatures from the base temperature (65 degrees), withnegative values set equal to zero. Each day’s heatingdegree-days are summed to create a heating degree-daymeasure for a specified reference period. Heating degree-days are used in energy analysis as an indicator of spaceheating energy requirements or use.
Degree-Days, Population-Weighted: Heating or coolingdegree-days weighted by the population of the area inwhich the degree-days are recorded. To compute statepopulation-weighted degree-days, each state is dividedinto from one to nine climatically homogeneous divisions,which are assigned weights based on the ratio of thepopulation of the division to the total population of thestate. Degree-day readings for each division are multi-plied by the corresponding population weight for eachdivision and those products are then summed to arrive atthe state population-weighted degree-day figure. Tocompute national population-weighted degree-days, thenation is divided into nine Census regions, eachcomprising from three to eight states, which are assignedweights based on the ratio of the population of theregion to the total population of the nation. Degree-dayreadings for each region are multiplied by the corre-sponding population weight for each region and thoseproducts are then summed to arrive at the nationalpopulation-weighted degree-day figure.
Denaturant: Petroleum, typically pentanes plus orconventional motor gasoline, added to fuel ethanol tomake it unfit for human consumption. Fuel ethanol is dena-tured, usually prior to transport from the ethanol productionfacility, by adding 2 to 5 volume percent denaturant. SeeFuel Ethanol and Fuel Ethanol Minus Denaturant.
Design Electrical Rating, Net: The nominal net electricaloutput of a nuclear unit as specified by the electric utilityfor the purpose of plant design.
Development Well: A well drilled within the proved areaof an oil or gas reservoir to the depth of a stratigraphichorizon known to be productive.
Diesel Fuel: A fuel composed of distillate fuel oilsobtained in petroleum refining operation or blends of such
190 U.S. Energy Information Administration / Monthly Energy Review December 2013

distillate fuel oils with residual fuel oil used in motor vehi-cles. The boiling point and specific gravity are higher fordiesel fuels than for gasoline.
Direct Use: Use of electricity that 1) is self-generated, 2) isproduced by either the same entity that consumes the poweror an affiliate, and 3) is used in direct support of a service orindustrial process located within the same facility or groupof facilities that house the generating equipment. Direct useis exclusive of station use.
Distillate Fuel Oil: A general classification for one of thepetroleum fractions produced in conventional distillationoperations. It includes diesel fuels and fuel oils. Productsknown as No. 1, No. 2, and No. 4 diesel fuel are used inon-highway diesel engines, such as those in trucks andautomobiles, as well as off-highway engines, such as thosein railroad locomotives and agricultural machinery. Prod-ucts known as No. 1, No. 2, and No. 4 fuel oils are usedprimarily for space heating and electricity generation.
Dry Hole: An exploratory or development well found to beincapable of producing either oil or gas in sufficient quanti-ties to justify completion as an oil or gas well.
Dry Natural Gas Production: See Natural Gas (Dry)Production.
E85: A fuel containing a mixture of 85 percent ethanol and15 percent motor gasoline.
Electric Power Plant: A station containing prime movers,electric generators, and auxiliary equipment for convertingmechanical, chemical, and/or fission energy into electric energy.
Electric Power Sector: An energy-consuming sector thatconsists of electricity-only and combined-heat-and-power(CHP) plants whose primary business is to sell electricity,or electricity and heat, to the public-i.e., North AmericanIndustry Classification System 22 plants. See alsoCombined-Heat-and-Power (CHP) Plant, Electricity-Only Plant, Electric Utility, and Independent PowerProducer.
Electric Utility: Any entity that generates, transmits, ordistributes electricity and recovers the cost of its genera-tion, transmission or distribution assets and operations,either directly or indirectly, through cost-based rates set bya separate regulatory authority (e.g., State Public ServiceCommission), or is owned by a governmental unit or theconsumers that the entity serves. Examples of these enti-ties include: investor-owned entities, public power districts,public utility districts, municipalities, rural electric coop-eratives, and state and federal agencies. Electric utilitiesmay have Federal Energy Regulatory Commission approvalfor interconnection agreements and wholesale trade tariffscovering either cost-of-service and/or market-based ratesunder the authority of the Federal Power Act. See ElectricPower Sector.
Electrical System Energy Losses: The amount of energylost during generation, transmission, and distribution of elec-tricity, including plant and unaccounted-for uses.
Electricity: A form of energy characterized by the presenceand motion of elementary charged particles generated byfriction, induction, or chemical change.
Electricity Generation: The process of producing electricenergy, or the amount of electric energy produced by trans-forming other forms of energy, commonly expressed in kilo-watthours (kWh) or megawatthours (Mwh).
Electricity Generation, Gross: The total amount of electricenergy produced by generating units and measured at thegenerating terminal in kilowatthours (kWh) or megawat-thours (MWh).
Electricity Generation, Net: The amount of gross electric-ity generation less station use (the electric energyconsumed at the generating station(s) for station service orauxiliaries). Note: Electricity required for pumping at hydroe-lectric pumped-storage plants is regarded as electricity forstation service and is deducted from gross generation.
Electricity-Only Plant: A plant designed to produce elec-tricity only. See also Combined-Heat-and-Power (CHP)Plant.
Electricity Retail Sales: The amount of electricity sold tocustomers purchasing electricity for their own use and notfor resale.
End-Use Sectors: The residential, commercial, industrial,and transportation sectors of the economy.
Energy: The capacity for doing work as measured by thecapability of doing work (potential energy) or the conversionof this capability to motion (kinetic energy). Energy hasseveral forms, some of which are easily convertible and can bechanged to another form useful for work. Most of theworld’s convertible energy comes from fossil fuels thatare burned to produce heat that is then used as a transfermedium to mechanical or other means in order to accom-plish tasks. Electrical energy is usually measured in kilo-watthours, while heat energy is usually measured inBritish thermal units.
Energy Consumption: The use of energy as a source ofheat or power or as an input in the manufacturing process.
Energy Service Provider: An energy entity that providesservice to a retail or end-use customer.
Energy-Use Sectors: A group of major energy-consumingcomponents of U.S. society developed to measure andanalyze energy use. The sectors most commonly referred toin EIA are: residential, commercial, industrial, transpor-tation, and electric power.
U.S. Energy Information Administration / Monthly Energy Review December 2013 191

Ethane: A normally gaseous straight-chain hydrocarbon(C2H6). It is a colorless, paraffinic gas that boils at atemperature of -127.48º F. It is extracted from natural gasand refinery gas streams.
Ethanol (C2H5OH): A clear, colorless, flammable alcohol.Ethanol is typically produced biologically from biomassfeedstocks such as agricultural crops and cellulosic residuesfrom agricultural crops or wood. Ethanol can also beproduced chemically from ethylene. See Biomass, FuelEthanol, and Fuel Ethanol Minus Denaturant.
Ethylene: An olefinic hydrocarbon (C2H4) recoveredfrom refinery processes or petrochemical processes.
Exploratory Well: A well drilled to find and produce oil orgas in an area previously considered an unproductive area, tofind a new reservoir in a known field (i.e., one previouslyfound to be producing oil or gas in another reservoir), or toextend the limit of a known oil or gas reservoir.
Exports: Shipments of goods from within the 50 statesand the District of Columbia to U.S. possessions and terri-tories or to foreign countries.
Extraction Loss: The reduction in volume of natural gasdue to the removal of natural gas liquid constituents, suchas ethane, propane, and butane, at natural gas processingplants.
Federal Energy Administration (FEA): A predecessorof the U.S. Energy Information Administration.
Federal Energy Regulatory Commission (FERC): TheFederal agency with jurisdiction over interstate electricitysales, wholesale electric rates, hydroelectric licensing,natural gas pricing, oil pipeline rates, and gas pipelinecertification. FERC is an independent regulatory agencywithin the U.S. Department of Energy and is the succes-sor to the Federal Power Commission.
Federal Power Commission (FPC): The predecessoragency of the Federal Energy Regulatory Commission. TheFederal Power Commission was created by an Act ofCongress under the Federal Water Power Act on June 10,1920. It was charged originally with regulating the elec-tric power and natural gas industries. It was abolished onSeptember 30, 1977, when the U.S. Department of Energywas created. Its functions were divided between the U.S.Department of Energy and the Federal Energy RegulatoryCommission, an independent regulatory agency.
First Purchase Price: The price for domestic crude oilreported by the company that owns the crude oil the firsttime it is removed from the lease boundary.
Flared Natural Gas: Natural gas burned in flares on thebase site or at gas processing plants.
F.O.B. (Free on Board): A sales transaction in which theseller makes the product available for pick up at a specifiedport or terminal at a specified price and the buyer pays forthe subsequent transportation and insurance.
Footage Drilled: Total footage for wells in various cate-gories, as reported for any specified period, includes (1)the deepest total depth (length of well bores) of all wellsdrilled from the surface, (2) the total of all bypassedfootage drilled in connection with reported wells, and(3) all new footage drilled for directional sidetrackwells. Footage reported for directional sidetrack wellsdoes not include footage in the common bore, which isreported as footage for the original well. In the case ofold wells drilled deeper, the reported footage is thatwhich was drilled below the total depth of the old well.
Former U.S.S.R.: See Union of Soviet Socialist Repub-lics (U.S.S.R.).
Fossil Fuel: An energy source formed in the Earth’s crustfrom decayed organic material, such as petroleum, coal,and natural gas.
Fossil-Fueled Steam-Electric Power Plant: An electricitygeneration plant in which the prime mover is a turbinerotated by high-pressure steam produced in a boiler by heatfrom burning fossil fuels.
Fuel Ethanol: Ethanol intended for fuel use. Fuel ethanolin the United States must be anhydrous (less than 1 percentwater). Fuel ethanol is denatured (made unfit for humanconsumption), usually prior to transport from the ethanolproduction facility, by adding 2 to 5 volume percent petro-leum, typically pentanes plus or conventional motorgasoline. Fuel ethanol is used principally for blending inlow concentrations with motor gasoline as an oxygenateor octane enhancer. In high concentrations, it is used tofuel alternative-fuel vehicles specially designed for itsuse. See Alternative-Fuel Vehicle, Denaturant, E85, Etha-nol, Fuel Ethanol Minus Denaturant, and Oxygenates.
Fuel Ethanol Minus Denaturant: An unobserved quantityof anhydrous, biomass-derived, undenatured ethanol forfuel use. The quantity is obtained by subtracting the esti-mated denaturant volume from fuel ethanol volume.Fuel ethanol minus denaturant is counted as renewableenergy, while denaturant is counted as nonrenewablefuel. See Denaturant, Ethanol, Fuel Ethanol, Nonre-newable Fuels, Oxygenates, and Renewable Energy.
Full-Power Operation: Operation of a nuclear generatingunit at 100 percent of its design capacity. Full-power opera-tion precedes commercial operation.
Gasohol: A blend of finished motor gasoline containingalcohol (generally ethanol but sometimes methanol) at a
192 U.S. Energy Information Administration / Monthly Energy Review December 2013

concentration between 5.7 percent and 10 percent byvolume. See Motor Gasoline, Oxygenated.
Gas Well: A well completed for the production of natural gasfrom one or more gas zones or reservoirs. (Wells producingboth crude oil and natural gas are classified as oil wells.)
Geothermal Energy: Hot water or steam extracted fromgeothermal reservoirs in the earth’s crust and used forgeothermal heat pumps, water heating, or electricitygeneration.
Global Warming: An increase in the near-surfacetemperature of the Earth. Global warming has occurred inthe distant past as the result of natural influences, but theterm is today most often used to refer to the warming somescientists predict will occur as a result of increased anthro-pogenic emissions of greenhouse gases. See ClimateChange.
Global Warming Potential (GWP): An index used tocompare the relative radiative forcing of different gaseswithout directly calculating the changes in atmosphericconcentrations. GWPs are calculated as the ratio of the radia-tive forcing that would result from the emission of one kilo-gram of a greenhouse gas to that from the emission of onekilogram of carbon dioxide over a fixed period of time,such as 100 years.
Greenhouse Gases: Those gases, such as water vapor,carbon dioxide, nitrous oxide, methane, hydrofluorocar-bons (HFCs), perfluorocarbons (PFCs) and sulfur hexafluo-ride, that are transparent to solar (short-wave) radiation butopaque to long-wave (infrared) radiation, thus preventinglong-wave radiant energy from leaving Earth's atmosphere.The net effect is a trapping of absorbed radiation and atendency to warm the planet's surface.
Gross Domestic Product (GDP): The total value of goodsand services produced by labor and property located in theUnited States. As long as the labor and property arelocated in the United States, the supplier (that is, the work-ers and, for property, the owners) may be either U.S. resi-dents or residents of foreign countries.
GT/IC: Gas turbine and internal combustion plants.
Heat Content: The amount of heat energy available to bereleased by the transformation or use of a specified physicalunit of an energy form (e.g., a ton of coal, a barrel of oil, akilowatthour of electricity, a cubic foot of natural gas, or apound of steam). The amount of heat energy is commonlyexpressed in British thermal units (Btu). Note: Heatcontent of combustible energy forms can be expressed interms of either gross heat content (higher or upper heatingvalue) or net heat content (lower heating value), dependingupon whether or not the available heat energy includes orexcludes the energy used to vaporize water (contained inthe original energy form or created during the combustion
process). The U.S. Energy Information Administration typi-cally uses gross heat content values.
Heat Rate: A measure of generating station thermal effi-ciency commonly stated as Btu per kilowatthour. Note:Heat rates can be expressed as either gross or net heat rates,depending whether the electricity output is gross or net genera-tion. Heat rates are typically expressed as net heat rates.
Hydrocarbon: An organic chemical compound of hydro-gen and carbon in the gaseous, liquid, or solid phase. Themolecular structure of hydrocarbon compounds varies fromthe simplest (methane, the primary constituent of naturalgas) to the very heavy and very complex.
Hydroelectric Power: The production of electricity fromthe kinetic energy of falling water.
Hydroelectric Power Plant: A plant in which the turbinegenerators are driven by falling water.
Hydroelectric Pumped Storage: Hydroelectricity that isgenerated during peak load periods by using water previ-ously pumped into an elevated storage reservoir duringoff-peak periods when excess generating capacity isavailable to do so. When additional generating capacityis needed, the water can be released from the reservoirthrough a conduit to turbine generators located in a powerplant at a lower level.
Hydrogen (H): The lightest of all gases, hydrogen occurschiefly in combination with oxygen in water. It also exists inacids, bases, alcohols, petroleum, and other hydrocarbons.
Imports: Receipts of goods into the 50 states and theDistrict of Columbia from U.S. possessions and territories orfrom foreign countries.
Independent Power Producer: A corporation, person,agency, authority, or other legal entity or instrumentality thatowns or operates facilities for the generation of electricity foruse primarily by the public, and that is not an electric utility.
Industrial Sector: An energy-consuming sector thatconsists of all facilities and equipment used forproducing, processing, or assembling goods. The indus-trial sector encompasses the following types of activity:manufacturing (NAICS codes 31-33); agriculture, forestry,fishing and hunting (NAICS code 11); mining, including oiland gas extraction (NAICS code 21); and construction(NAICS code 23). Overall energy use in this sector is largelyfor process heat and cooling and powering machinery,with lesser amounts used for facility heating, air condi-tioning, and lighting. Fossil fuels are also used as rawmaterial inputs to manufactured products. Note: Thissector includes generators that produce electricity and/oruseful thermal output primarily to support the above-mentioned industrial activities. Various EIA programsdiffer in sectoral coverage-for more information see
U.S. Energy Information Administration / Monthly Energy Review December 2013 193
http://www.eia.gov/neic/datadefinitions/Guideforwebind.htm.See End-Use Sectors and Energy-Use Sectors.
Injections (Natural Gas): Natural gas injected into stor-age reservoirs.
Isobutane: A normally gaseous branch-chain hydrocarbon.It is a colorless paraffinic gas that boils at a temperature of10.9° F. It is extracted from natural gas or refinery gasstreams. See Butane.
Isobutylene: An olefinic hydrocarbon recovered fromrefinery processes or petrochemical processes.
Isopentane: A saturated branched-chain hydrocarbonobtained by fractionation of natural gasoline or isomeriza-tion of normal pentane.
Jet Fuel: A refined petroleum product used in jetaircraft engines. It includes kerosene-type jet fuel andnaphtha-type jet fuel.
Jet Fuel, Kerosene-Type: A kerosene-based productwith a maximum distillation temperature of 400° F at the10-percent recovery point and a final maximum boilingpoint of 572° F. Fuel specifications are provided inASTM Specification D 1655 and Military SpecificationsMIL-T-5624P and MIL-T-83133D (Grades JP-5 andJP-8). It isused primarily for commercial turbojet andturboprop aircraft engines.
Jet Fuel, Naphtha-Type: A fuel in the heavy naphthaboiling range, with an average gravity of 52.8 degreesAPI, 20 to 90 percent distillation temperatures of 290° to470° F and meeting Military Specification MIL-T-5624L(Grade JP-4). It is used by the military for turbojet andturboprop engines.
Kerosene: A petroleum distillate having a maximumdistillation temperature of 401º F at the 10-percent recov-ery point, a final boiling point of 572º F, and a minimumflash point of 100º F. Included are the two grades designatedin ASTM D3699 (No. 1-K and No. 2-K) and all grades ofkerosene called range or stove oil. Kerosene is used in spaceheaters, cook stoves, and water heaters; it is suitable for useas an illuminant when burned in wick lamps.
Kilowatt: A unit of electrical power equal to 1,000 watts.
Kilowatthour (kWh): A measure of electricity defined asa unit of work or energy, measured as 1 kilowatt (1,000watts) of power expended for 1 hour. One kilowatthour isequivalent to 3,412 Btu. See Watthour.
Landed Costs: The dollar-per-barrel price of crude oil atthe port of discharge. Included are the charges associatedwith the purchase, transporting, and insuring of a cargofrom the purchase point to the port of discharge. Notincluded are charges incurred at the discharge port (e.g.,
import tariffs or fees, wharfage charges, and demurragecharges).
Lease and Plant Fuel: Natural gas used in well, field, andlease operations (such as gas used in drilling operations,heaters, dehydrators, and field compressors) and used asfuel in natural gas processing plants.
Lease Condensate: A mixture consisting primarily ofpentanes and heavier hydrocarbons, which is recovered as aliquid from natural gas in lease or field separation facilities.Note: This category excludes natural gas liquids, such asbutane and propane, which are recovered at natural gasprocessing plants or facilities.
Lignite: The lowest rank of coal, often referred to as browncoal, used almost exclusively as fuel for steam-electric powergeneration. It is brownish-black and has a high inherent mois-ture content, sometimes as high as 45 percent. The heatcontent of lignite ranges from 9 to 17 million Btu per shortton on a moist, mineral-matter-free basis. The heat content oflignite consumed in the United States averages 13 million Btuper short ton, on the as-received basis (i.e., containing bothinherent moisture and mineral matter).
Liquefied Natural Gas (LNG): Natural gas (primarilymethane) that has been liquefied by reducing its tempera-ture to -260º F at atmospheric pressure.
Liquefied Petroleum Gases (LPG): Ethane, ethylene,propane, propylene, normal butane, butylene, and isobutaneproduced at refineries or natural gas processing plants, includ-ing plants that fractionate new natural gas plant liquids.
Low-Power Testing: The period of time between a nucleargenerating unit’s initial fuel loading date and the issuanceof its operating (full-power) license. The maximum level ofoperation during that period is 5 percent of the unit’sdesign thermal rating.
Lubricants: Substances used to reduce friction betweenbearing surfaces or as process materials either incorporatedinto other materials used as processing aids in the manu-facturing of other products or as carriers of other materi-als. Petroleum lubricants may be produced either fromdistillates or residues. Other substances may be added toimpart or improve certain required properties. Excludedare byproducts of lubricating oil refining, such asaromatic extracts derived from solvent extraction or tarsderived from deasphalting. Included are all grades oflubricating oils from spindle oil to cylinder oil and thoseused in greases. Lubricant categories are paraffinic andnaphthenic.
Marketed Production (Natural Gas): Gross withdrawalsless gas used for repressuring, quantities vented andflared, and nonhydrocarbon gases removed in treating orprocessing operations. Includes all quantities of gas usedin field and processing operations.
194 U.S. Energy Information Administration / Monthly Energy Review December 2013

Methane: A colorless, flammable, odorless, hydrocarbongas (CH4) that is the principal constituent of natural gas. It isalso an important source of hydrogen in various industrialprocesses.
Methyl Tertiary Butyl Ether (MTBE): An ether,(CH3)3COCH3, intended for motor gasoline blending. SeeOxygenates.
Methanol: A light, volatile alcohol (CH3OH) eligible formotor gasoline blending. See Oxygenates.
Miscellaneous Petroleum Products: All finished petro-leum products not classified elsewhere-for example, petro-latum, lube refining byproducts (aromatic extracts andtars), absorption oils, ram-jet fuel, petroleum rocket fuels,synthetic natural gas feedstocks, and specialty oils.
Motor Gasoline Blending: Mechanical mixing of motorgasoline blending components and oxygenates asrequired, to produce finished motor gasoline. Finishedmotor gasoline may be further mixed with other motorgasoline blending components or oxygenates, resulting inincreased volumes of finished motor gasoline and/orchanges in the formulation of finished motor gasoline (e.g.,conventional motor gasoline mixed with MTBE to produceoxygenated motor gasoline).
Motor Gasoline Blending Components: Naphtha (e.g.,straight-run gasoline, alkylate, reformate, benzene, toluene,xylene) used for blending or compounding into finishedmotor gasoline. These components include reformulatedgasoline blendstock (RBOB) but exclude oxygenates (alco-hols, ethers), butane, and pentanes plus. Note: oxygenatesare reported as individual components and are included inthe total for other hydrocarbons, hydrogens, and oxygenates.
Motor Gasoline, Conventional: Finished motor gasolinenot included in the oxygenated or reformulated motorgasoline categories. Note: This category excludes reformu-lated gasoline blendstock for oxygenate blending (RBOB) aswell as other blendstock. Conventional motor gasoline canbe leaded or unleaded; regular, midgrade, or premium. SeeMotor Gasoline Grades.
Motor Gasoline, Finished: A complex mixture of relativelyvolatile hydrocarbons with or without small quantities ofadditives, blended to form a fuel suitable for use in spark-ignition. Motor gasoline, as defined in ASTM SpecificationD-4814 or Federal Specification VV-G-1690C, is character-ized as having a boiling range of 122ºF to 158ºF at the10-percent recovery point to 365ºF to 374ºF at the90-percent recovery point. “Motor gasoline” includesconventional gasoline, all types of oxygenated gasolineincluding gasohol, and reformulated gasoline, but excludesaviation gasoline. Note: Volumetric data on blendingcomponents, as well as oxygenates, are not counted in dataon finished motor gasoline until the blending componentsare blended into the gasoline.
Motor Gasoline Grades: The classification of gasoline byoctane ratings. Each type of gasoline (conventional,oxygenated, and reformulated) is classified by threegrades: regular, midgrade, and premium. Note: Gasolinesales are reported by grade in accordance with their classi-fication at the time of sale. In general, automotive octanerequirements are lower at high altitudes. Therefore, insome areas of the United States, such as the Rocky Moun-tain States, the octane ratings for the gasoline grades may be2 or more octane points lower.
Regular Gasoline: Gasoline having an antiknock index, i.e.,octane rating, greater than or equal to 85 and less than 88.Note: Octane requirements may vary by altitude. SeeMotor Gasoline Grades.
Midgrade Gasoline: Gasoline having an antiknock index,i.e., octane rating, greater than or equal to 88 and less than orequal to 90. Note: Octane requirements may vary byaltitude. See Motor Gasoline Grades.
Premium Gasoline: Gasoline having an antiknock index,i.e., octane rating, greater than 90. Note: Octane require-ments may vary by altitude. See Motor Gasoline Grades.
Motor Gasoline, Oxygenated: Finished motor gasoline,other than reformulated gasoline, having an oxygencontent of 2.7 percent or higher by weight and requiredby the U.S. Environmental Protection Agency (EPA) to besold in areas designated by EPA as carbon monoxide (CO)nonattainment areas. Note: Oxygenated gasoline excludesoxygenated fuels program reformulated gasoline (OPRG)and reformulated gasoline blendstock for oxygenate blend-ing (RBOB). Data on gasohol that has at least 2.7 percentoxygen, by weight, and is intended for sale inside COnonattainment areas are included in data on oxygenatedgasoline. Other data on gasohol are included in data onconventional gasoline.
Motor Gasoline, Reformulated: Finished motor gasolineformulated for use in motor vehicles, the composition andproperties of which meet the requirements of the reformu-lated gasoline regulations promulgated by the U.S. Envi-ronmental Protection Agency under Section 211(k) of theClean Air Act. Note: This category includes oxygenatedfuels program reformulated gasoline (OPRG) but excludesreformulated gasoline blendstock for oxygenate blending(RBOB).
Motor Gasoline Retail Prices: Motor gasoline prices calcu-lated each month by the Bureau of Labor Statistics (BLS) inconjunction with the construction of the Consumer PriceIndex (CPI). Those prices are collected in 85 urban areasselected to represent all urban consumers-about 80 percentof the total U.S. population. The service stations areselected initially, and on a replacement basis, in such a waythat they represent the purchasing habits of the CPI popula-tion. Service stations in the current sample include those
U.S. Energy Information Administration / Monthly Energy Review December 2013 195
providing all types of service (i.e., full-, mini-, and self-service.
Motor Gasoline (Total): For stock level data, a sumincluding finished motor gasoline stocks plus stocks ofmotor gasoline blending components but excluding stocksof oxygenates.
MTBE: See Methyl Tertiary Butyl Ether.
NAICS (North American Industry ClassificationSystem): A coding system developed jointly by theUnited States, Canada, and Mexico to classify businessesand industries according to the type of economic activityin which they are engaged. NAICS replaces the StandardIndustrial Classification (SIC) codes. For additionalinformation on NAICS, go tohttp://www.census.gov/eos/www/naics/.
Naphtha: A generic term applied to a petroleum fractionwith an approximate boiling range between 122 and 400º F.
Natural Gas: A gaseous mixture of hydrocarboncompounds, primarily methane, used as a fuel for electric-ity generation and in a variety of ways in buildings, and asraw material input and fuel for industrial processes.
Natural Gas, Dry: Natural gas which remains after: 1)the liquefiable hydrocarbon portion has been removedfrom the gas stream (i.e., gas after lease, field, and/orplant separation); and 2) any volumes of nonhydrocar-bon gases have been removed where they occur in suffi-cient quantity to render the gas unmarketable. Note: Drynatural gas is also known as consumer-grade natural gas.The parameters for measurement are cubic feet at 60degrees Fahrenheit and 14.73 pounds per square inchabsolute.
Natural Gas (Dry) Production: The process of produc-ing consumer-grade natural gas. Natural gas withdrawnfrom reservoirs is reduced by volumes used at theproduction (lease) site and by processing losses. Volumesused at the production site include 1) the volume returnedto reservoirs in cycling, repressuring of oil reservoirs,and conservation operations; and 2) gas vented andflared. Processing losses include 1) nonhydrocarbongases (e.g., water vapor, carbon dioxide, helium, hydro-gen sulfide, and nitrogen) removed from the gas stream;and 2) gas converted to liquid form, such as leasecondensate and plant liquids. Volumes of dry gas with-drawn from gas storage reservoirs are not considered partof production. Dry natural gas production equalsmarketed production less extraction loss.
Natural Gas Marketed Production: Gross withdrawals ofnatural gas from production reservoirs, less gas used forreservoir repressuring; nonhydrocarbon gases removed intreating and processing operations; and quantities ventedand flared.
Natural Gas Plant Liquids (NGPL): Natural gas liquidsrecovered from natural gas in processing plants and, insome situations, from natural gas field facilities, as wellas those extracted by fractionators. Natural gas plantliquids are defined according to the published specifica-tions of the Gas Processors Association and the AmericanSociety for Testing and Material as follows: ethane,propane, normal butane, isobutane, pentanes plus, and otherproducts from natural gas processing plants (i.e., productsmeeting the standards for finished petroleum productsproduced at natural gas processing plants, such as finishedmotor gasoline, finished aviation gasoline, special naphthas,kerosene, distillate fuel oil, and miscellaneous products).
Natural Gas Wellhead Price: The wellhead price ofnatural gas is calculated by dividing the total reportedvalue at the wellhead by the total quantity produced asreported by the appropriate agencies of individualproducing states and the U.S. Minerals ManagementService. The price includes all costs prior to shipmentfrom the lease, including gathering and compressioncosts, in addition to state production, severance, andsimilar charges.
Natural Gasoline: A mixture of hydrocarbons (mostlypentanes and heavier) extracted from natural gas thatmeets vapor pressure, end-point, and other specificationsfor natural gasoline set by the Gas ProcessorsAssociation. Includes isopentane, which is a saturatedbranch-chain hydrocarbon obtained by fractionation ofnatural gasoline or isomerization of normal pentane.
Net Summer Capacity: The maximum output,commonly expressed in kilowatts (kW) or megawatts(MW), that generating equipment can supply to systemload, as demonstrated by a multi-hour test, at the time ofsummer peak demand (period of June 1 through Septem-ber 30). This output reflects a reduction in capacity due toelectricity use for station service or auxiliaries.
Neutral Zone: A 6,200 square-mile area shared equallybetween Kuwait and Saudi Arabia under a 1992agreement. The Neutral Zone contains an estimated 5billion barrels of oil and 8 trillion cubic feet of natural gas.
Nominal Dollars: A measure used to express nominalprice.
Nominal Price: The price paid for a product or serviceat the time of the transaction. Nominal prices are thosethat have not been adjusted to remove the effect ofchanges in the purchasing power of the dollar; theyreflect buying power in the year in which the transactionoccurred.
Non-Biomass Waste: Material of non-biological originthat is a byproduct or a discarded product. “Non-biomasswaste” includes municipal solid waste from non-biogenicsources, such as plastics, and tire-derived fuels.
196 U.S. Energy Information Administration / Monthly Energy Review December 2013
Nonhydrocarbon Gases: Typical nonhydrocarbon gasesthat may be present in reservoir natural gas are carbondioxide, helium, hydrogen sulfide, and nitrogen.
Nonrenewable Fuels: Fuels that cannot be easily made or"renewed," such as crude oil, natural gas, and coal.
Nuclear Electric Power (Nuclear Power): Electricitygenerated by the use of the thermal energy released from thefission of nuclear fuel in a reactor.
Nuclear Electric Power Plant: A single-unit or multiunitfacility in which heat produced in one or more reactors bythe fissioning of nuclear fuel is used to drive one or moresteam turbines.
Nuclear Reactor: An apparatus in which a nuclear fissionchain reaction can be initiated, controlled, and sustained at aspecific rate. A reactor includes fuel (fissionable material),moderating material to control the rate of fission, a heavy-walled pressure vessel to house reactor components, shield-ing to protect personnel, a system to conduct heat away fromthe reactor, and instrumentation for monitoring and control-ling the reactor's systems.
OECD: See Organization for Economic Cooperationand Development.
Offshore: That geographic area that lies seaward of thecoastline. In general, the coastline is the line of ordinary lowwater along with that portion of the coast that is in directcontact with the open sea or the line marking the seawardlimit of inland water.
Oil: See Crude Oil.
OPEC: See Organization of the Petroleum ExportingCountries.
Operable Unit (Nuclear): In the United States, a nucleargenerating unit that has completed low-power testing andbeen issued a full-power operating license by the NuclearRegulatory Commission, or equivalent permission tooperate.
Organization for Economic Cooperation and Develop-ment (OECD): An international organization helpinggovernments tackle the economic, social and governancechallenges of a globalized economy. Its membershipcomprises about 30 member countries. With active relation-ships with some 70 other countries, non-governmentalorganizations (NGOs) and civil society, it has a global reach.For details about the organization, see http://www.oecd.org.
Organization of the Petroleum Exporting Countries(OPEC): An intergovernmental organization whose statedobjective is to "coordinate and unify the petroleum policiesof member countries." It was created at the BaghdadConference on September 10–14, 1960. Current members
(with years of membership) include Algeria (1969–present),Angola (2007–present), Ecuador (1973–1992 and2007–present), Iran (1960–present), Iraq (1960–present),Kuwait (1960–present), Libya (1962–present), Nigeria(1971–present), Qatar (1961–present), Saudi Arabia(1960–present), United Arab Emirates (1967–present), andVenezuela (1960–present). Countries no longer members ofOPEC include Gabon (1975–1994) and Indonesia(1962–2008).
Oxygenates: Substances which, when added to gasoline,increase the amount of oxygen in that gasoline blend.Ethanol, Methyl Tertiary Butyl Ether (MTBE), EthylTertiary Butyl Ether (ETBE), and methanol are commonoxygenates.
PAD Districts: Petroleum Administration for DefenseDistricts. Geographic aggregations of the 50 states and theDistrict of Columbia into five districts for the PetroleumAdministration for Defense in 1950. The districts wereoriginally instituted for economic and geographic reasons asPetroleum Administration for War (PAW) Districts, whichwere established in 1942.
Pentanes Plus: A mixture of hydrocarbons, mostly pentanesand heavier, extracted from natural gas. Includes isopentane,natural gasoline, and plant condensate.
Petrochemical Feedstocks: Chemical feedstocks derivedfrom petroleum principally for the manufacture of chemicals,synthetic rubber, and a variety of plastics.
Petroleum: A broadly defined class of liquid hydrocarbonmixtures. Included are crude oil, lease condensate, unfin-ished oils, refined products obtained from the processing ofcrude oil, and natural gas plant liquids. Note: Volumes offinished petroleum products include nonhydrocarboncompounds, such as additives and detergents, after they havebeen blended into the products.
Petroleum Coke: See Coke, Petroleum.
Petroleum Consumption: See Products Supplied(Petroleum).
Petroleum Imports: Imports of petroleum into the 50 statesand the District of Columbia from foreign countries andfrom Puerto Rico, the Virgin Islands, and other U.S. terri-tories and possessions. Included are imports for the Strate-gic Petroleum Reserve and withdrawals from bondedwarehouses for onshore consumption, offshore bunker use,and military use. Excluded are receipts of foreign petro-leum into bonded warehouses and into U.S. territories andU.S. Foreign Trade Zones.
Petroleum Products: Products obtained from the processingof crude oil (including lease condensate), natural gas, andother hydrocarbon compounds. Petroleum products include
U.S. Energy Information Administration / Monthly Energy Review December 2013 197

unfinished oils, liquefied petroleum gases, pentanesplus, aviation gasoline, motor gasoline, naphtha-type jetfuel, kerosene-type jet fuel, kerosene, distillate fuel oil,residual fuel oil, petrochemical feedstocks, special naph-thas, lubricants, waxes, petroleum coke, asphalt, road oil,still gas, and miscellaneous products.
Petroleum Stocks, Primary: For individual products,quantities that are held at refineries, in pipelines, and atbulk terminals that have a capacity of 50,000 barrels ormore, or that are in transit thereto. Stocks held by productretailers and resellers, as well as tertiary stocks held at thepoint of consumption, are excluded. Stocks of individualproducts held at gas processing plants are excluded fromindividual product estimates but are included in other oilsestimates and total.
Photovoltaic Energy: Direct-current electricity generatedfrom sunlight through solid-state semiconductor devicesthat have no moving parts.
Pipeline Fuel: Gas consumed in the operation ofpipelines, primarily in compressors.
Plant Condensate: One of the natural gas liquids, mostlypentanes and heavier hydrocarbons, recovered and separatedas liquid at gas inlet separators or scrubbers in processingplants.
Primary Energy: Energy in the form that it is firstaccounted for in a statistical energy balance, before anytransformation to secondary or tertiary forms ofenergy. For example, coal can be converted to syntheticgas, which can be converted to electricity; in this example,coal is primary energy, synthetic gas is secondary energy,and electricity is tertiary energy. See Primary EnergyProduction and Primary Energy Consumption.
Primary Energy Consumption: Consumption ofprimary energy. (Energy sources that are produced fromother energy sources—e.g., coal coke from coal—areincluded in primary energy consumption only if theirenergy content has not already been included as part of theoriginal energy source. Thus, U.S. primary energyconsumption does include net imports of coal coke, butnot the coal coke produced from domestic coal.) TheU.S. Energy Information Administration includes thefollowing in U.S. primary energy consumption: coalconsumption; coal coke net imports; petroleumconsumption (petroleum products supplied, includingnatural gas plant liquids and crude oil burned as fuel);dry natural gas—excluding supplemental gaseousfuels—consumption; nuclear electricity net generation(converted to Btu using the nuclear plants heat rate);conventional hydroelectricity net generation(converted to Btu using the fossil-fueled plants heatrate); geothermal electricity net generation (convertedto Btu using the fossil-fueled plants heat rate), andgeothermal heat pump energy and geothermal direct use
energy; solar thermal and photovoltaic electricity netgeneration (converted to Btu using the fossil-fueledplants heat rate), and solar thermal direct use energy;wind electricity net generation (converted to Btu usingthe fossil-fueled plants heat rate); wood and wood-derived fuels consumption; biomass waste consumption;fuel ethanol and biodiesel consumption; losses andco-products from the production of fuel ethanol and biodie-sel; and electricity net imports (converted to Btu using theelectricity heat content of 3,412 Btu per kilowatthour). SeeTotal Energy Consumption.
Primary Energy Production: Production of primaryenergy. The U.S. Energy Information Administrationincludes the following in U.S. primary energy production:coal production, waste coal supplied, and coal refuserecovery; crude oil and lease condensate production;natural gas plant liquids production; dry naturalgas—excluding supplemental gaseous fuels—production;nuclear electricity net generation (converted to Btu usingthe nuclear plants heat rate); conventional hydroelectric-ity net generation (converted to Btu using the fossil-fueledplants heat rate); geothermal electricity net generation(converted to Btu using the fossil-fueled plants heat rate),and geothermal heat pump energy and geothermal directuse energy; solar thermal and photovoltaic electricity netgeneration (converted to Btu using the fossil-fueled plantsheat rate), and solar thermal direct use energy; wind elec-tricity net generation (converted to Btu using the fossil-fueled plants heat rate); wood and wood-derived fuelsconsumption; biomass waste consumption; and biofuelsfeedstock.
Prime Mover: The engine, turbine, water wheel, or simi-lar machine that drives an electric generator; or, for report-ing purposes, a device that converts energy to electricitydirectly.
Products Supplied (Petroleum): Approximately repre-sents consumption of petroleum products because it meas-ures the disappearance of these products from primarysources, i.e., refineries, natural gas-processing plants,blending plants, pipelines, and bulk terminals. In general,product supplied of each product in any given period iscomputed as follows: field production, plus refineryproduction, plus imports, plus unaccounted-for crude oil(plus net receipts when calculated on a PAD Districtbasis) minus stock change, minus crude oil losses, minusrefinery inputs, and minus exports.
Propane: A normally gaseous straight-chain hydrocarbon(C3H8). It is a colorless paraffinic gas that boils at a tempera-ture of -43.67º F. It is extracted from natural gas or refinerygas streams. It includes all products designated in ASTMSpecification D1835 and Gas Processors Association Specifi-cations for commercial propane and HD-5 propane.
Propylene: An olefinic hydrocarbon (C3H6) recoveredfrom refinery or petrochemical processes.
198 U.S. Energy Information Administration / Monthly Energy Review December 2013

Real Dollars: These are dollars that have been adjusted forinflation. See Real Price.
Real Price: A price that has been adjusted to remove theeffect of changes in the purchasing power of the dollar. Realprices, which are expressed in constant dollars, usuallyreflect buying power relative to a base year.
Refiner Acquisition Cost of Crude Oil: The cost of crudeoil to the refiner, including transportation and fees. Thecomposite cost is the weighted average of domestic andimported crude oil costs.
Refinery and Blender Net Inputs: Raw materials, unfin-ished oils, and blending components processed at refineries,or blended at refineries or petroleum storage terminals toproduce finished petroleum products. Included are grossinputs of crude oil, natural gas plant liquids, other hydro-carbon raw materials, hydrogen, oxygenates (excludingfuel ethanol), and renewable fuels (including fuelethanol). Also included are net inputs of unfinished oils,motor gasoline blending components, and aviationgasoline blending components. Net inputs are calculatedas gross inputs minus gross production. Negative netinputs indicate gross inputs are less than gross production.Examples of negative net inputs include reformulatedgasoline blendstock for oxygenate blending (RBOB)produced at refineries for shipment to blending terminals,and unfinished oils produced and added to inventory inadvance of scheduled maintenance of a refinery crude oildistillation unit.
Refinery and Blender Net Production: Liquefied refinerygases, and finished petroleum products produced at arefinery or petroleum storage terminal blending facility.Net production equals gross production minus grossinputs. Negative net production indicates gross produc-tion is less than gross inputs for a finished petroleumproduct. Examples of negative net production includereclassification of one finished product to anotherfinished product, or reclassification of a finished productto unfinished oils or blending components.
Refinery (Petroleum): An installation that manufacturesfinished petroleum products from crude oil, unfinished oils,natural gas liquids, other hydrocarbons, and alcohol.
Refuse Mine: A surface site where coal is recovered frompreviously mined coal. It may also be known as a silt bank,culm bank, refuse bank, slurry dam, or dredge operation.
Refuse Recovery: The recapture of coal from a refusemine or the coal recaptured by that process. The resultingproduct has been cleaned to reduce the concentration ofnoncombustible materials.
Renewable Energy: Energy obtained from sources that areessentially inexhaustible (unlike, for example, the fossilfuels, of which there is a finite supply). Renewable sources
of energy include conventional hydrolectric power,biomass, geothermal, solar, and wind.
Repressuring: The injection of a pressurized fluid (such asair, gas, or water) into oil and gas reservoir formations toeffect greater ultimate recovery.
Residential Sector: An energy-consuming sector thatconsists of living quarters for private households. Commonuses of energy associated with this sector include space heat-ing, water heating, air conditioning, lighting, refrigeration,cooking, and running a variety of other appliances. Theresidential sector excludes institutional living quarters.Note: Various EIA programs differ in sectoral coverage formore information seehttp://www.eia.gov/neic/datadefinitions/Guideforwebres.htm. SeeEnd-Use Sectors and Energy-Use Sectors.
Residual Fuel Oil: The heavier oils that remain after thedistillate fuel oils and lighter hydrocarbons are distilledaway in refinery operations and that conform to ASTMSpecifications D396 and 975. Included are No. 5, a resid-ual fuel oil of medium viscosity; Navy Special, for use insteam-powered vessels in government service and in shorepower plants; and No. 6, which includes Bunker C fuel oiland is used for commercial and industrial heating, for elec-tricity generation, and to power ships. Imports of residualfuel oil include imported crude oil burned as fuel.
Road Oil: Any heavy petroleum oil, including residualasphaltic oil used as a dust palliative and surface treatmenton roads and highways. It is generally produced in sixgrades, from 0, the most liquid, to 5, the most viscous.
Rotary Rig: A machine used for drilling wells that employs arotating tube attached to a bit for boring holes through rock.
Short Ton (Coal): A unit of weight equal to 2,000 pounds.
SIC (Standard Industrial Classification): A set of codesdeveloped by the U.S. Office of Management and Budgetwhich categorizes industries into groups with similareconomic activities. Replaced by NAICS (North Ameri-can Industry Classification System).
Solar Energy: See Solar Thermal Energy and Photovol-taic Energy.
Solar Thermal Energy: The radiant energy of the sun thatcan be converted into other forms of energy, such as heat orelectricity.
Special Naphthas: All finished products within the naphthaboiling ranges that are used as paint thinner, cleaners orsolvents. Those products are refined to a specified flashpoint. Special naphthas include all commercial hexane andcleaning solvents conforming to ASTM SpecificationsD1836 and D484, respectively. Naphthas to be blended ormarketed as motor gasoline or aviation gasoline, or that are
U.S. Energy Information Administration / Monthly Energy Review December 2013 199

to be used as petrochemical and synthetic natural gas(SNG) feedstocks, are excluded.
Station Use: Energy that is used to operate an electricpower plant. It includes energy consumed for plant lighting,power, and auxiliary facilities, regardless of whether theenergy is produced at the plant or comes from another source.
Steam Coal: All nonmetallurgical coal.
Steam-Electric Power Plant: A plant in which the primemover is a steam turbine. The steam used to drive the turbineis produced in a boiler where fossil fuels are burned.
Still Gas (Refinery Gas): Any form or mixture of gasproduced in refineries by distillation, cracking, reforming,and other processes. The principal constituents are meth-ane, ethane, ethylene, normal butane, butylene, propane,and propylene. It is used primarily as refinery fuel and,petrochemical feedstock.
Stocks: See Coal Stocks, Crude Oil Stocks, or Petro-leum Stocks, Primary.
Strategic Petroleum Reserve (SPR): Petroleum stocksmaintained by the federal Government for use during peri-ods of major supply interruption.
Subbituminous Coal: A coal whose properties rangefrom those of lignite to those of bituminous coal andused primarily as fuel for steam-electric power genera-tion. It may be dull, dark brown to black, soft and crum-bly, at the lower end of the range, to bright, jet black,hard, and relatively strong, at the upper end. Subbitumi-nous coal contains 20 to 30 percent inherent moistureby weight. The heat content of subbituminous coalranges from 17 to 24 million Btu per short ton on amoist, mineral-matter-free basis. The heat content ofsubbituminous coal consumed in the United States aver-ages 17 to 18 million Btu per ton, on the as-receivedbasis (i.e., containing both inherent moisture andmineral matter).
Supplemental Gaseous Fuels: Synthetic natural gas,propane-air, coke oven gas, refinery gas, biomass gas, airinjected for Btu stabilization, and manufactured gascommingled and distributed with natural gas.
Synthetic Natural Gas (SNG): (Also referred to assubstitute natural gas) A manufactured product, chemi-cally similar in most respects to natural gas, resultingfrom the conversion or reforming of hydrocarbons thatmay easily be substituted for or interchanged withpipeline-quality natural gas.
Thermal Conversion Factor: A factor for converting databetween physical units of measure (such as barrels, cubicfeet, or short tons) and thermal units of measure (such asBritish thermal units, calories, or joules); or for
converting data between different thermal units of measure.See Btu Conversion Factor.
Total Energy Consumption: Primary energy consump-tion in the end-use sectors, plus electricity retail salesand electrical system energy losses.
Transportation Sector: An energy-consuming sector thatconsists of all vehicles whose primary purpose is transport-ing people and/or goods from one physical location toanother. Included are automobiles; trucks; buses;motorcycles; trains, subways, and other rail vehicles; aircraft;and ships, barges, and other waterborne vehicles. Vehicleswhose primary purpose is not transportation (e.g., construc-tion cranes and bulldozers, farming vehicles, and warehousetractors and forklifts) are classified in the sector of theirprimary use. Note: Various EIA programs differ in sectoralcoverage-for more information seehttp://www.eia.gov/neic/datadefinitions/Guideforwebtrans.htmSee End-Use Sectors and Energy-Use Sectors.
Underground Storage: The storage of natural gas inunderground reservoirs at a different location from which itwas produced.
Unfinished Oils: All oils requiring further refinery proc-essing except those requiring only mechanical blending.Includes naphthas and lighter oils, kerosene and light gasoils, heavy gas oils, and residuum.
Unfractionated Stream: Mixtures of unsegregated naturalgas liquid components, excluding those in plantcondensate. This product is extracted from natural gas.
Union of Soviet Socialist Republics (U.S.S.R.): A politi-cal entity that consisted of 15 constituent republics: Arme-nia, Azerbaijan, Belarus, Estonia, Georgia, Kazakhstan,Kyrgyzstan, Latvia, Lithuania, Moldova, Russia, Tajikistan,Turkmenistan, Ukraine, and Uzbekistan. The U.S.S.R. ceasedto exist as of December 31, 1991.
United States: The 50 states and the District of Columbia.Note: The United States has varying degrees of jurisdic-tion over a number of territories and other political entitiesoutside the 50 states and the District of Columbia, includ-ing Puerto Rico, the U.S. Virgin Islands, Guam, AmericanSamoa, Johnston Atoll, Midway Islands, Wake Island, andthe Northern Mariana Islands. EIA data programs mayinclude data from some or all of these areas in U.S. totals.For these programs, data products will contain notesexplaining the extent of geographic coverage includedunder the term "United States."
Useful Thermal Output: The thermal energy made avail-able in a combined-heat-and-power system for use in anyindustrial or commercial process, heating or coolingapplication, or delivered to other end users, i.e., total ther-mal energy made available for processes and applicationsother than electrical generation.
200 U.S. Energy Information Administration / Monthly Energy Review December 2013

U.S.S.R.: See Union of Soviet Socialist Republics(U.S.S.R.).
Vented Natural Gas: Gas released into the air on theproduction site or at processing plants.
Vessel Bunkering: Includes sales for the fueling ofcommercial or private boats, such as pleasure craft, fishingboats, tugboats, and ocean-going vessels, including vesselsoperated by oil companies. Excluded are volumes sold tothe U.S. Armed Forces.
Waste Coal: Usable material that is a byproduct of previ-ous coal processing operations. Waste coal is usuallycomposed of mixed coal, soil, and rock (mine waste). Mostwaste coal is burned as-is in unconventional fluidized-bedcombustors. For some uses, waste coal may be partiallycleaned by removing some extraneous noncombustibleconstituents. Examples of waste coal include fine coal, coalobtained from a refuse bank or slurry dam, anthracite culm,bituminous gob, and lignite waste.
Waste: See Biomass Waste and Non-Biomass Waste.
Watt (W): The unit of electrical power equal to one ampereunder a pressure of one volt. A watt is equal to 1/746 horse-power.
Watthour (Wh): The electrical energy unit of measureequal to one watt of power supplied to, or taken from, an
electric circuit steadily for one hour.
Waxes: Solid or semisolid material derived from petro-leum distillates or residues. Waxes are light-colored, moreor less translucent crystalline masses, slightly greasy to thetouch, consisting of a mixture of solid hydrocarbons inwhich the paraffin series predominates. Included are allmarketable waxes, whether crude scale or fully refined.Waxes are used primarily as industrial coating for surfaceprotection.
Wellhead Price: The value of crude oil or natural gas atthe mouth of the well.
Wind Energy: Kinetic energy present in wind motion thatcan be converted to mechanical energy for driving pumps,mills, and electric power generators.
Wood and Wood-Derived Fuels: Wood and productsderived from wood that are used as fuel, including roundwood (cord wood), limb wood, wood chips, bark, sawdust,forest residues, charcoal, paper pellets, railroad ties, utilitypoles, black liquor, red liquor, sludge wood, spent sulfiteliquor, and other wood-based solids and liquids.
Working Gas: The volume of gas in a reservoir that is inaddition to the base gas. It may or may not be completelywithdrawn during any particular withdrawal season.Conditions permitting, the total working capacity could beused more than once during any season.
U.S. Energy Information Administration / Monthly Energy Review December 2013 201