Monthly-Economic-Report-July-2015.pdf
15
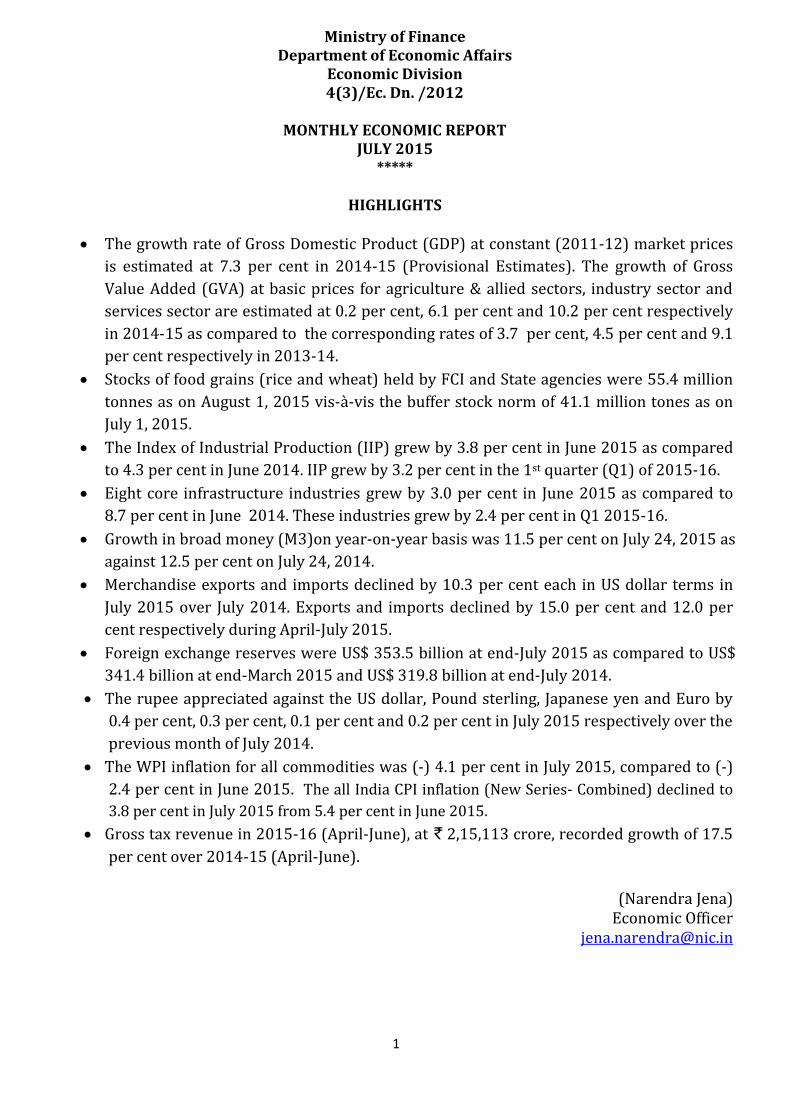
1 Ministry of Finance Department of Economic Affairs Economic Division 4(3)/Ec. Dn. /2012 MONTHLY ECONOMIC REPORT JULY 2015 ***** HIGHLIGHTS The growth rate of Gross Domestic Product (GDP) at constant (2011-12) market prices is estimated at 7.3 per cent in 2014-15 (Provisional Estimates). The growth of Gross Value Added (GVA) at basic prices for agriculture & allied sectors, industry sector and services sector are estimated at 0.2 per cent, 6.1 per cent and 10.2 per cent respectively in 2014-15 as compared to the corresponding rates of 3.7 per cent, 4.5 per cent and 9.1 per cent respectively in 2013-14. Stocks of food grains (rice and wheat) held by FCI and State agencies were 55.4 million tonnes as on August 1, 2015 vis-à-vis the buffer stock norm of 41.1 million tones as on July 1, 2015. The Index of Industrial Production (IIP) grew by 3.8 per cent in June 2015 as compared to 4.3 per cent in June 2014. IIP grew by 3.2 per cent in the 1 st quarter (Q1) of 2015-16. Eight core infrastructure industries grew by 3.0 per cent in June 2015 as compared to 8.7 per cent in June 2014. These industries grew by 2.4 per cent in Q1 2015-16. Growth in broad money (M3)on year-on-year basis was 11.5 per cent on July 24, 2015 as against 12.5 per cent on July 24, 2014. Merchandise exports and imports declined by 10.3 per cent each in US dollar terms in July 2015 over July 2014. Exports and imports declined by 15.0 per cent and 12.0 per cent respectively during April-July 2015. Foreign exchange reserves were US$ 353.5 billion at end-July 2015 as compared to US$ 341.4 billion at end-March 2015 and US$ 319.8 billion at end-July 2014. The rupee appreciated against the US dollar, Pound sterling, Japanese yen and Euro by 0.4 per cent, 0.3 per cent, 0.1 per cent and 0.2 per cent in July 2015 respectively over the previous month of July 2014. The WPI inflation for all commodities was (-) 4.1 per cent in July 2015, compared to (-) 2.4 per cent in June 2015. The all India CPI inflation (New Series- Combined) declined to 3.8 per cent in July 2015 from 5.4 per cent in June 2015. Gross tax revenue in 2015-16 (April-June), at ` 2,15,113 crore, recorded growth of 17.5 per cent over 2014-15 (April-June). (Narendra Jena) Economic Officer [email protected]
-
Upload
ashok-sharma -
Category
Documents
-
view
1 -
download
0
Transcript of Monthly-Economic-Report-July-2015.pdf
1
Ministry of Finance Department of Economic Affairs
Economic Division 4(3)/Ec. Dn. /2012
MONTHLY ECONOMIC REPORT
JULY 2015 *****
HIGHLIGHTS
The growth rate of Gross Domestic Product (GDP) at constant (2011-12) market prices
is estimated at 7.3 per cent in 2014-15 (Provisional Estimates). The growth of Gross
Value Added (GVA) at basic prices for agriculture & allied sectors, industry sector and
services sector are estimated at 0.2 per cent, 6.1 per cent and 10.2 per cent respectively
in 2014-15 as compared to the corresponding rates of 3.7 per cent, 4.5 per cent and 9.1
per cent respectively in 2013-14.
Stocks of food grains (rice and wheat) held by FCI and State agencies were 55.4 million
tonnes as on August 1, 2015 vis-à-vis the buffer stock norm of 41.1 million tones as on
July 1, 2015.
The Index of Industrial Production (IIP) grew by 3.8 per cent in June 2015 as compared
to 4.3 per cent in June 2014. IIP grew by 3.2 per cent in the 1st quarter (Q1) of 2015-16.
Eight core infrastructure industries grew by 3.0 per cent in June 2015 as compared to
8.7 per cent in June 2014. These industries grew by 2.4 per cent in Q1 2015-16.
Growth in broad money (M3)on year-on-year basis was 11.5 per cent on July 24, 2015 as
against 12.5 per cent on July 24, 2014.
Merchandise exports and imports declined by 10.3 per cent each in US dollar terms in
July 2015 over July 2014. Exports and imports declined by 15.0 per cent and 12.0 per
cent respectively during April-July 2015.
Foreign exchange reserves were US$ 353.5 billion at end-July 2015 as compared to US$
341.4 billion at end-March 2015 and US$ 319.8 billion at end-July 2014.
The rupee appreciated against the US dollar, Pound sterling, Japanese yen and Euro by
0.4 per cent, 0.3 per cent, 0.1 per cent and 0.2 per cent in July 2015 respectively over the
previous month of July 2014.
The WPI inflation for all commodities was (-) 4.1 per cent in July 2015, compared to (-)
2.4 per cent in June 2015. The all India CPI inflation (New Series- Combined) declined to
3.8 per cent in July 2015 from 5.4 per cent in June 2015.
Gross tax revenue in 2015-16 (April-June), at ` 2,15,113 crore, recorded growth of 17.5
per cent over 2014-15 (April-June).
(Narendra Jena)
Economic Officer [email protected]

2
1. ECONOMIC GROWTH
The growth rate of Gross Domestic Product (GDP) at constant (2011-12) market prices is
estimated at 7.3 percent in 2014-15 (provisional estimates), as compared to 6.9 per cent and
5.1 per cent in 2013-14 and 2012-13 respectively (Table 1).
The growth rate of Gross Value Added (GVA) at constant (2011-12) basic prices for
agriculture & allied sectors, industry sector and services sector are estimated to be at 0.2 per
cent, 6.1 per cent and 10.2 per cent respectively in 2014-15 compared to the corresponding
rate of 3.7 per cent, 4.5 per cent and 9.1 per cent respectively in 2013-14 (Table 1).
The growth rate of quarterly GDP at constant market prices for all four quarters of 2014-15
is estimated at 6.7 per cent (Q1), 8.4 per cent (Q2), 6.6 per cent (Q3) and 7.5 per cent (Q4),
compared to the corresponding rates of 7.0 per cent (Q1), 7.5 per cent (Q2) , 6.4 per cent
(Q3) and 6.7 per cent (Q4) in 2013-14 (Table 2).
The final consumption expenditure as a percentage of GDP increased from 69.8 per cent in
2012-13 to 71.0 per cent in 2013-14 and further to 71.5 per cent in 2014-15. Gross fixed
capital formation (GFCF) as a percentage of GDP declined from 31.4 per cent in 2012-13 to
29.7 per cent in 2013-14 to 28.7 per cent in 2014-15.
There was a decline in the rate of gross domestic saving from 33.9 per cent of the GDP in
2011-12 to 31.8 per cent in 2012-13 and further to 30.6 per cent in 2013-14. This was
caused mainly by the sharp decline in the rate of household physical savings.
2. AGRICULTURE AND FOOD MANAGEMENT
Rainfall: With respect to rainfall situation in India, the year is categorized into four seasons:
winter season (January-February); pre monsoon (March-May); south west monsoon (June-
September) and post monsoon (October-December). South west monsoon accounts for more
than 75 per cent of annual rainfall. The actual rainfall received during the monsoon period
from 01.06.2015 to 05.08.2015, has been 468.6 mm as against the normal at 499.8 mm.
Rainfall has been excess/normal in 21 sub divisions as compared to 20 during the
corresponding period last year.
All India production of food grains: As per the 4th advance estimates released by Ministry
of Agriculture on 17.08.2015, the production of total foodgrains during 2014-15 is estimated
3
at 252.7 million tonnes as compared to 265.0 million tonnes in 2013-14 and 257.1 million
tonnes in 2012-13 (Table 3).
Procurement: Procurement of rice as on 03.08.2015 was 31.7 million tonnes during Kharif
Marketing Season 2014-15 and procurement of wheat as on 03.08.2015 was 28.1 million
tonnes during Rabi Marketing Season 2015-16 (Table 4).
Off-take: Off-take of rice during the month of May, 2015 was 23.3 lakh tonnes and in respect
of wheat, the total off-take was 20.5 lakh tonnes.
Stocks: Stocks of food-grains (rice and wheat) held by FCI as on August 1, 2015 were 55.4
million tonnes, which is lower by 11.7 per cent compared to the level of 62.8 million tonnes
as on August1, 2014 (Table 5).
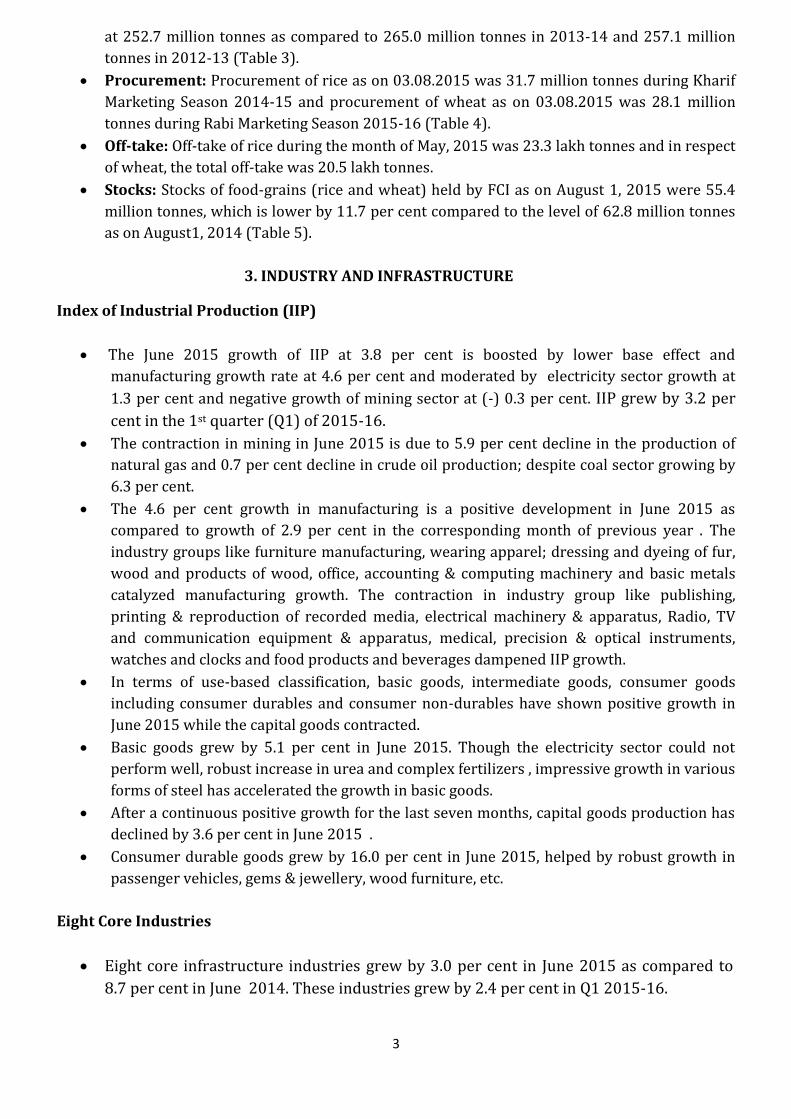
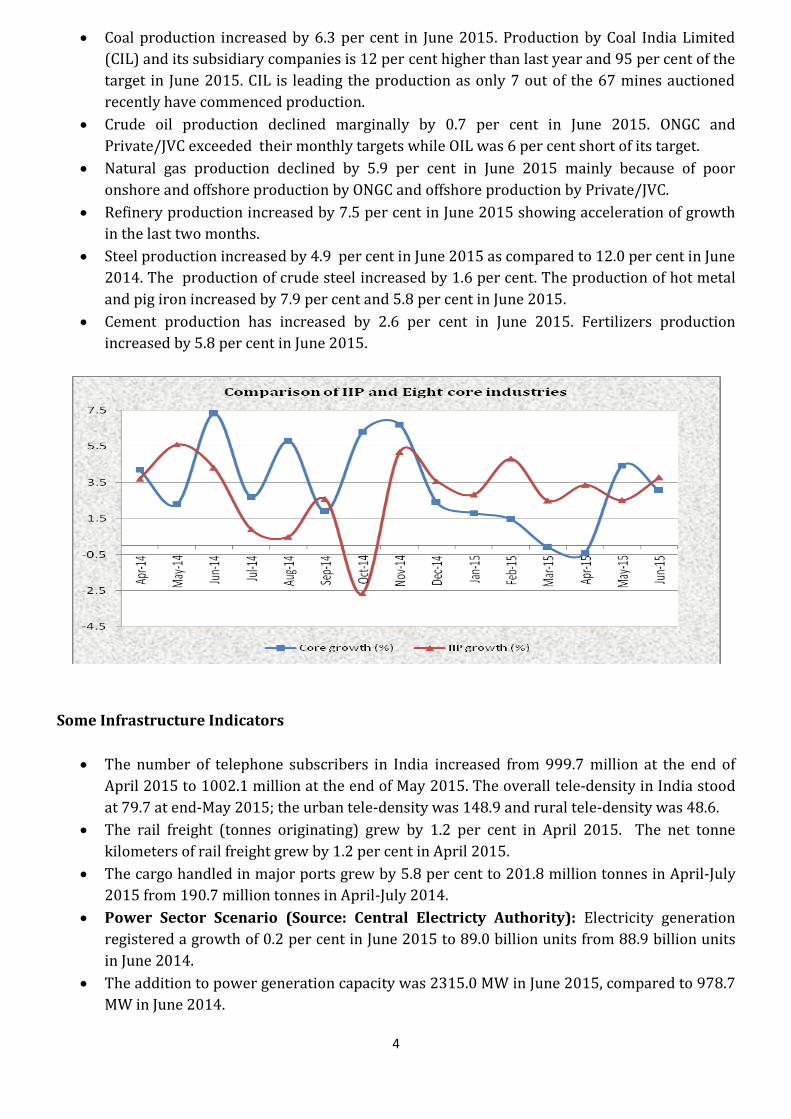
3. INDUSTRY AND INFRASTRUCTURE
Index of Industrial Production (IIP)
The June 2015 growth of IIP at 3.8 per cent is boosted by lower base effect and
manufacturing growth rate at 4.6 per cent and moderated by electricity sector growth at
1.3 per cent and negative growth of mining sector at (-) 0.3 per cent. IIP grew by 3.2 per
cent in the 1st quarter (Q1) of 2015-16.
The contraction in mining in June 2015 is due to 5.9 per cent decline in the production of
natural gas and 0.7 per cent decline in crude oil production; despite coal sector growing by
6.3 per cent.
The 4.6 per cent growth in manufacturing is a positive development in June 2015 as
compared to growth of 2.9 per cent in the corresponding month of previous year . The
industry groups like furniture manufacturing, wearing apparel; dressing and dyeing of fur,
wood and products of wood, office, accounting & computing machinery and basic metals
catalyzed manufacturing growth. The contraction in industry group like publishing,
printing & reproduction of recorded media, electrical machinery & apparatus, Radio, TV
and communication equipment & apparatus, medical, precision & optical instruments,
watches and clocks and food products and beverages dampened IIP growth.
In terms of use-based classification, basic goods, intermediate goods, consumer goods
including consumer durables and consumer non-durables have shown positive growth in
June 2015 while the capital goods contracted.
Basic goods grew by 5.1 per cent in June 2015. Though the electricity sector could not
perform well, robust increase in urea and complex fertilizers , impressive growth in various
forms of steel has accelerated the growth in basic goods.
After a continuous positive growth for the last seven months, capital goods production has
declined by 3.6 per cent in June 2015 .
Consumer durable goods grew by 16.0 per cent in June 2015, helped by robust growth in
passenger vehicles, gems & jewellery, wood furniture, etc.
Eight Core Industries
Eight core infrastructure industries grew by 3.0 per cent in June 2015 as compared to
8.7 per cent in June 2014. These industries grew by 2.4 per cent in Q1 2015-16.
4
Coal production increased by 6.3 per cent in June 2015. Production by Coal India Limited
(CIL) and its subsidiary companies is 12 per cent higher than last year and 95 per cent of the
target in June 2015. CIL is leading the production as only 7 out of the 67 mines auctioned
recently have commenced production.
Crude oil production declined marginally by 0.7 per cent in June 2015. ONGC and
Private/JVC exceeded their monthly targets while OIL was 6 per cent short of its target.
Natural gas production declined by 5.9 per cent in June 2015 mainly because of poor
onshore and offshore production by ONGC and offshore production by Private/JVC.
Refinery production increased by 7.5 per cent in June 2015 showing acceleration of growth
in the last two months.
Steel production increased by 4.9 per cent in June 2015 as compared to 12.0 per cent in June
2014. The production of crude steel increased by 1.6 per cent. The production of hot metal
and pig iron increased by 7.9 per cent and 5.8 per cent in June 2015.
Cement production has increased by 2.6 per cent in June 2015. Fertilizers production
increased by 5.8 per cent in June 2015.
Some Infrastructure Indicators
The number of telephone subscribers in India increased from 999.7 million at the end of
April 2015 to 1002.1 million at the end of May 2015. The overall tele-density in India stood
at 79.7 at end-May 2015; the urban tele-density was 148.9 and rural tele-density was 48.6.
The rail freight (tonnes originating) grew by 1.2 per cent in April 2015. The net tonne
kilometers of rail freight grew by 1.2 per cent in April 2015.
The cargo handled in major ports grew by 5.8 per cent to 201.8 million tonnes in April-July
2015 from 190.7 million tonnes in April-July 2014.
Power Sector Scenario (Source: Central Electricty Authority): Electricity generation
registered a growth of 0.2 per cent in June 2015 to 89.0 billion units from 88.9 billion units
in June 2014.
The addition to power generation capacity was 2315.0 MW in June 2015, compared to 978.7
MW in June 2014.

5
The total installed capacity for electricity was 274817.9 MW as on 30th June 2015 of which
the share of thermal, hydro, renewable and nuclear sources was 69.6 per cent, 15.3 per cent ,
13.0 per cent and 2.1 per cent respectively.
4. FINANCIAL MARKETS
Money and Banking
Broad Money(M3) or Money Supply: The total amount of monetary assets available in the
economy, stood at Rs. 109,432 billion as on July 24, 2015, as against Rs.98188.3 billion as on July
25, 2014, recording a year-on-year increase of 11.5 percent, which is less than the growth rate of
12.4 percent recorded in the corresponding period last year.
Among the various components of M3, time deposits registered a growth rate of 11.6 percent, while
the other main components viz. Currency with the Public and Demand Deposits with the Banks
grew at a rate of 10 percent and 11.4 percent respectively during the year. The share of time
deposits in total money supply has shown a consistently increased from about 74 percent in July
2010 to 78.6 per cent in July 2015, while that of Demand Deposits with the Banks has declined
consistently from 11.4 percent to 8.2 percent during the same period. The trend indicates that out
of total money stock, there has been a shift towards savings in time deposits with assured returns
bythe banks rather than investing in risky investment options.
Reserve Money (M0) or Monetary Base: Reserve Money stood at Rs. 18807.6 billion as on July
31, 2015, as against Rs.17152.8 billion as on July 25, 2014, recording a year-on-year increase of 9.6
percent, which is less than the growth rate of 11.3 per cent recorded in the corresponding period
last year.
Aggregate deposits: Aggregate deposits of Scheduled Commercial Banks (SCBs) as on July 24,
2015 stood at Rs 88833.2 billion, recording an increase of 11.8 per cent on year-on-year basis, as
compared to 12.5 per cent recorded on the corresponding date of the previous year.
Bank Credit:Bank credit extended by Scheduled Commercial Banks (SCBs), as on July 24, 2015
recorded an increase of 9.4 percent on year-on-year basis, compared to 12.8 per cent on the
corresponding date of the previous year. The year on year growth of non-food credit was 9.6
percent on July 24, 2015 as compared to 12.8 percent in the corresponding date of the previous
year. The details of growth of bank credit are given in the table below.
5. EXTERNAL SECTOR
Foreign trade: Exports and imports declined by 10.3 per cent in US$ terms in July 2015
over July 2014. Exports and imports declined by 15.0 per cent and 12.0 per cent
respectively during April-July 2015. During July 2015, oil imports declined by 34.9 per
cent and non-oil imports increased by 3.8 per cent over July 2014. Trade deficit was low at
US$ 12.8 billion in July, 2015 compared to US$ 14.3 billion in July 2014.
Balance of Payment Situation: Current Account Deficit (CAD) narrowed sharply to US$
27.9 billion (1.3 per cent of GDP) in 2014-15 from US$ 32.4 billion (1.7 per cent of GDP) in
the previous year. Net invisibles’ earning was placed at US$ 116.2 billion in 2014-15 as

6
against US$ 115.2 billion over the previous year. Net capital inflows, however, increased to
US$ 89.3 billion (4.4 per cent of GDP) in 2014-15 from US$ 47.9 billion (2.6 per cent of GDP)
in 2013 owing largely to higher net inflows of FDI, portfolio investment and NRI deposits.
Foreign Exchange Reserves: Foreign Exchange Reserves stood at US$ 353.5 billion at end-
July 2015 as compared to US$ 356.0 billion at end-June 2015.
Exchange Rate: The rupee appreciated against the US dollar, Pound sterling, Japanese yen
and Euro by 0.4 per cent, 0.3 per cent, 0.1 per cent and 0.2 per cent in July 2015 respectively
over the previous month of June 2015.
External Debt: India’s external debt remains within manageable limits as indicated by the
external debt-GDP ratio of 23.8 per cent at end-March 2015 vis-à-vis 23.6 per cent at end-
March 2014. External debt stock stood at US$ 475.8 billion at end-March 2015 recording an
increase of 6.6 per cent over the level at end-March 2014. Short-term external debt was US$
84.7 billion at end-March 2015, showing a decline of 7.6 per cent over the level at end-March
2014. Long-term debt accounted for 82.2 per cent of total external debt at end-March 2015
(79.5 per cent at end-March 2014).
External assistance and debt service payments: Gross external assistance stood at `
1650.9 crore in July 2015 as compared to ` 3277.1 crore in July 2014.

7
6. INFLATION
Wholesale Price Index (WPI 2004-05=100): The headline WPI inflation remained
negative for the ninth month in a row and reached a low of (-) 4.1 per cent in July 2015 from
(-) 2.4 per cent in June 2015. Inflation for food articles for the month of July 2015 declined to
(-)1.2 per cent from 2.9 per cent in the previous month on account of decline in inflation in
cereals, vegetables, fruits and condiments & spices. Food inflation (food articles+ food
products) declined to (-)1.4 per cent from 1.9 per cent in the previous month.
Inflation in fuel & power declined to (-)12.8 per cent in July 2015 from (-) 10.0 per cent in
the previous month. Inflation for manufactured products declined to (-)1.5 per cent in July
2015 as compared to (-)0.8 per cent in the previous month.
Non-food manufactured products inflation (core as defined by RBI) declined to (-)1.4 per
cent from (-)0.9 per cent in the previous month.
The all India CPI inflation (New Series- Combined) declined to 3.8 per cent in July 2015 from
5.4 per cent in June 2015. Inflation in terms of Consumer Food Price Index (CFPI) also
declined to 2.2 per cent in July 2015 from 5.5 per cent in the previous month on account of
decline in inflation in all sub-groups of food except pulses & products.
Inflation based on CPI-IW for June 2015 increased to 6.1 per cent from 5.7 per cent in May
2015. Inflation based on CPI-AL and CPI-RL was below 5 per cent in June 2015 .
Global commodity prices declined in the second quarter of 2015 due to ample supplies and
weak demand, especially in industrial commodities. Global year-on-year inflation was
negative for all broad groups in July 2015 (Table 15).
7. PUBLIC FINANCE
The budget estimate of the fiscal deficit for 2015-16 is 3.9 per cent as compared to 4.0 per
cent in 2014-15 (provisional actual). The budget estimate for revenue deficit for 2015-16 is
2.8 per cent, the same as the provisional actual in 2014-15.
8
The growth in the provisional actual figures for 2015-16 (April-June) over 2014-15 (April-
June), is the following;
Gross tax revenue, at ` 215113 crore, increased by 17.5 per cent in April-June 2015-
16.
Revenue Receipts (net to Centre), at ` 141204 crore, increased by 23.4 per cent in
April-June 2015-16.
Tax revenue (net to Centre), at ` 101685 crore, increased by 2.6 per cent.
Non-tax revenue, at ` 39519 crore, increased by 157.6 per cent.
Non-plan expenditure increased by 4.7 per cent.
Plan expenditure grew by 2.8 per cent.
Total expenditure, at ` 430993 crore, increased by 4.2 per cent.
8. SOME MAJOR ECONOMIC DECISIONS IN JULY 2015
The Union Cabinet gave its approval for introduction of common norms across all skill
development schemes being implemented by different Ministries/Departments of
Government of India.
The Cabinet Committee on Economic Affairs (CCEA), approved the scheme “Pradhan Mantri
Krishi Sinchayee Yojana”. It will have an outlay of Rs. 50,000 crore over a period of five
years (2015-16 to 2019-20).
CCEA approved a Central Sector Scheme for Promotion of National Agricultural Market
through Agri-Tech Infrastructure Fund.
National Floor Level Minimum Wage (NFLMU) has been revised upwards from existing Rs.
137/- to Rs. 160/-per day w.e.f. 01.07.2015.
Government approved ten proposals of Foreign Direct Investment (FDI) amounting to Rs.
1675 crore approximately.
CCEA approved development of the six laning of Eastern peripheral expressway (National
Highway No. NE-II) in Haryana and Uttar Pradesh.
The Government launched Deen Dayal Upadhyaya Gram Jyoti Yojana (DDUGJY), which is one
of the flagship programmes of the Ministry of Power.
CCEA approved the creation of an intra state transmission system in the States of Andhra
Pradesh, Gujarat, Himachal Pradesh, Karnataka, Madhya Pradesh, Maharashtra and
Rajasthan at an estimated cost of Rs 8548.7 crore with Government of India contribution
from National Clean Energy Fund of Rs 3419.5 crore.
The Government of India and the Asian Development Bank signed a $300 million loan to
support the National Urban Health Mission (NUHM).
****

9
TABLES
Table 1: Growth of GVA at Basic Prices by Economic Activity (at 2011-12 Prices) (in per cent)
Sector
Growth
Share in GVA
2012-13
2013-14
2014-15 (PE)
2012-13
2013-14
2014-15 (PE)
Agriculture, forestry & fishing 1.2 3.7 0.2
17.7 17.2 16.1
Industry 2.4 4.5 6.1
32.3 31.7 31.4
Mining & quarrying -0.2 5.4 2.4
3.0 3.0 2.9
Manufacturing 6.2 5.3 7.1
18.3 18.1 18.1
Electricity, gas ,water supply & other utility services
4.0 4.8 7.9
2.4 2.3 2.3
Construction -4.3 2.5 4.8
8.6 8.3 8.1
Services 8.0 9.1 10.2
50.0 51.1 52.5
Trade, hotels, transport, communication and services related to broadcasting
9.6 11.1 10.7
18 18.8 19.4
Financial, real estate & professional services
8.8 7.9 11.5
19.5 19.7 20.5
Public administration, defence and Other Services
4.7 7.9 7.2
12.5 12.6 12.6
GVA at basic prices 4.9 6.6 7.2
100.0 100.0 100.0 GDP at market prices 5.1 6.9 7.3
--- --- ---
Source: Central Statistics Office (CSO). PE: Provisional Estimates.
Table 2: Quarter-wise Growth of GVA at Constant (2011-12) Basic Prices (per cent)
Sectors
2013-14 2014-15
Q1 Q2 Q3 Q4 Q1 Q2 Q3 Q4 Agriculture, forestry & fishing 2.7 3.6 3.8 4.4 2.6 2.1 -1.1 -1.4 Industry 4.8 4.0 5.0 4.3 7.7 7.6 3.6 5.6
Mining & quarrying 0.8 4.5 4.2 11.5 4.3 1.4 1.5 2.3 Manufacturing 7.2 3.8 5.9 4.4 8.4 7.9 3.6 8.4 Electricity, gas ,water supply & other utility services 2.8 6.5 3.9 5.9 10.1 8.7 8.7 4.2 Construction 1.5 3.5 3.8 1.2 6.5 8.7 3.1 1.4
Services 10.2 10.6 9.1 6.4 8.7 10.4 12.5 9.2 Trade, hotels, transport, communication and services related to broadcasting 10.3 11.9 12.4 9.9 12.1 8.9 7.4 14.1 Financial, real estate & professional services 7.7 11.9 5.7 5.5 9.3 13.5 13.3 10.2 Public administration, defence and Other Services 14.4 6.9 9.1 2.4 2.8 7.1 19.7 0.1
GVA at basic prices 7.2 7.5 6.6 5.3 7.4 8.4 6.8 6.1 GDP at market prices 7.0 7.5 6.4 6.7 6.7 8.4 6.6 7.5
Source: Central Statistics Office (CSO).

10
Table 3: Production of Major Agricultural Crops (4th Adv. Est.)
Crops Production (in Million Tonnes)
2012-13
(Final)
2013-14
(Final)
2014-15
(4th AE)
Total Foodgrains 257.1 265.0 252.7
Rice 105.2 106.7 104.8
Wheat 93.5 95.9 88.9
Total Coarse Cereals 40.0 43.3 41.8
Total Pulses 18.3 19.3 17.2
Total Oilseeds 30.9 32.8 26.7
Sugarcane 341.2 352.1 359.3
Cotton 34.2 35.9 35.5
Table 4 : Procurement of Crops in Million Tonnes Crop 2010-11 2011-12 2012-13 2013-14 2014-15 2015-16 Rice# 34.2 35.0 34.0 31.8 31.7β -- Wheat@ 22.5 28.3 38.2 25.1 28.0 28.1β Total 56.7 63.4 72.2 56.9 59.7 28.1 # Kharip Marketing Season (October-September), @ Rabi Marketing Season (April-March), β Position as on 03.08.2015.
Table 5: Off-Take and Stocks of Food Grains (Million Tonnes)
Off-take Stocks
Crops 2012-13 2013-14 2014-15 August 1,
2014 August 1,
(Till May) 2015
1. Rice 32.6 29.2 6.4 19.3 15.3
2. Unmilled Paddy# 8.1 5.0
3. Converted Unmilled Paddy in terms of Rice
5.5 3.4
4. Wheat 33.2 30.6 6.0 38.1 36.8
Total (Rice & Wheat)(1+3+4) 65.9 59.8 12.4 62.8 55.4
# Since September, 2013, FCI gives separate figures for rice and unmilled paddy lying with FCI & state agencies in terms of rice.
Table 6: Percentage Change in Index of Industrial Production
Industry Group April-June,
2014-15
April-June,
2015-16
June 2014 June 2015
General index 4.5 3.2 4.3 3.8
Mining 2.9 0.7 4.8 -0.3
Manufacturing 3.9 3.6 2.9 4.6
Electricity 11.3 2.3 15.7 1.3
Basic goods 8.7 4.7 10.2 5.1
Capital goods 13.7 1.5 23.3 -3.6
Intermediate goods 3.0 1.6 2.6 0.8
Consumer goods -3.2 2.4 -8.8 6.6
Durables -9.5 3.7 -23.3 16.0
Non-durables 1.3 1.6 1.9 1.3

11
Table 7: Production growth (per cent) in Core Infrastructure-supportive industries
Industry April-June 2014-15 April-June, 2015-16 June-2014 June-2015
Coal 6.6 7.3 8.2 6.3
Crude oil -0.1 -0.9 0.0 -0.7
Natural Gas -3.9 -4.2 -1.7 -5.9
Refinery Products -1.3 4.2 -0.1 7.5
Fertilizers 8.6 2.4 -1.0 5.8
Steel 7.2 2.8 12.0 4.9
Cement 9.6 0.9 13.4 2.6
Electricity 11.3 1.5 15.7 0.2
Overall growth 6.0 2.4 8.7 3.0
Table 8: M3 and its Sources (Rs in Billion)
Date M3 Net Bank Credit to
Government
Bank Credit to
Commercial Sector
Net Foreign
Exchange Assets of Banking
Sector
Governments Currency
Liabilities to the Public
Banking Sectors Net
Non-monetary Liabilities
July 24,2015 109432.2 32859.6 71471.9 23702.8 199.9 18802.0
Jul 25, 2014 98188.3 29796.3 65551.7 20095.7 180.5 17436.0
Jul 26, 2013 87329.7 29691.3 58242.1 16399.9 160.4 17164.0
Jul 27, 2012 77666.7 25711.1 50828.4 16210.0 140.5 15223.5
Jul 29, 2011 68150.4 21466.0 43251.8 14181.4 123.6 10872.5
Jul 30, 2010 58423.8 17574.2 36417.0 13338.1 117.6 9023.1
Table 9: Growth rate of Bank credit (YoY) in the economy (in percent ) 2013-14 2014-15 2014-15 (as on July 25, 2014 ) 2015-16 (as on July 24, 2015 )
Bank credit 13.9 10.4 12.8 9.4
a)Food credit 2.1 -5.5 11.2 -3.5
b) Non-food credit 14.2 10.7 12.8 9.6
Table 10: Ratios and Rates( in percent)
Items/Week Ended
2014 2015
25-July 24-July
Cash Reserve Ratio 4.00 4.00
Statutory Liquidity Ratio 22.50 21.50
Policy Repo Rate 8.00 7.25
Reverse Repo Rate 7.00 6.25
Marginal Standing Facility (MSF) Rate 9.00 8.25
Bank Rate 9.00 8.25
Base Rate 10.00/10.25 9.70/10.00
Term Deposit Rate >1 Year 8.00/9.05 8.00/8.25
Savings Deposit Rate 4.00 4.00
Call Money Rate (Weighted Average) 8.67 7.03

12
Table 11: Exports and Imports (in US$ million)
Item 2014-15 2014-15 2015-16 2014 2015 % Change in July 2015 April-July July
Exports 309567 105726 89828 25793 23137 -10.3
Imports 447522 153275 134866 40068 35950 -10.3
Oil imports 138323 54991 34145 14574 9487 -34.9
Non-Oil imports
309199 98284 100721 25494 26463 3.8
Trade Balance
-137955 -47549 -45038 -14275 -12812 -
Source: Provisional data as per the Press Note of the Ministry of Commerce and Industry
Table 12: Foreign Exchange Reserves (in Billion)
End of Financial Year Foreign Exchange Reserves Variation
(Rupees ) (US Dollar) (Rupees ) (US Dollar )
At the end of year Variation over last year
2012-13 15884 292.0 823 -2.4
2013-14 18284 304.2 2400 12.2
2014-15 21376 341.6 3093 37.4
At the end of month Variation over last month
2015-16
April-2015 22110 351.9 733 10.2
May-2015 22437 352.5 328 0.6
June-2015 22660 356.0 222 3.5
July-2015 22580 353.5 -80 -2.5
Table 13 : Rupee per unit of foreign currency* US dollar Pound sterling Japanese yen Euro
March 2011 44.9684 72.7070 0.5498 62.9660
March, 2012 50.3213 79.6549 0.6103 66.4807
March 2013** 54.4046 82.0190 0.5744 70.5951
March 2014 61.0140 101.4083 0.5965 84.3621
2014-15 July 2014 60.0586 102.6220 0.5907 81.3943
August 2014 60.8952 101.8085 0.5917 81.1423
September 2014 60.8649 99.3131 0.5677 78.6014
October 2014 61.3420 98.7168 0.5687 77.9117
November 2014 61.7042 97.2826 0.5305 76.9857
December 2014 62.7530 98.1115 0.5260 77.3553
January 2015 62.2314 94.5460 0.5255 72.7682
February 2015 62.0376 95.0079 0.5233 70.4671
March 2015 62.4498 93.4422 0.5190 67.5548
2015-16
April 2015 62.7532 93.9083 0.5253 67.7934
May 2015 63.8003 98.8205 0.5283 71.2135
June 2015 63.8607 99.3620 0.5165 71.5874
July 2015 63.6350 99.0771 0.5161 70.0292
Source: Reserve Bank of India, * FEDAI Indicative Market Rates (on monthly average basis), ** Data from March, 2013 onwards are based on RBI’s reference rate.

13
Table 14: External Assistance and Debt Service Payments (` crore)*
July 2015 FY 2015-16 July 2014 FY 2014-15
External Assistance (Government Account)
1) Gross Disbursement 1,458.3 9,402.3 2,901.5 8,758.2
2) Repayments 1,931.5 7,677.3 1,751.7 6,688.4
3) Interest Payments 273.0 1,094.1 322.8 1,196.2
4) Net Disbursement (1-2) -473.3 1,725.0 1,149.9 2,069.8
5) Net Transfers (4-3) -746.2 630.9 827.1 873.7
External Assistance (Non-Government Account)
1) Gross Disbursement 0.0 1,475.0 120.2 1,194.4
2) Repayments 176.4 1,290.8 150.8 2,060.3
3) Interest Payments 24.1 155.8 43.2 196.8
4) Net Disbursement (1-2) -176.4 184.2 -30.6 -865.9
5) Net Transfers (4-3) -200.5 28.4 -73.8 -1,062.7
Government Grants
1) Gross Disbursement 192.6 952.0 255.4 412.8
2) Repayments 0.0 0.0 0.0 0.0
3) Interest Payments 0.0 0.0 0.0 0.0
4) Net Disbursement (1-2) 192.6 952.0 255.4 412.8
5) Net Transfers (4-3) 192.6 952.0 255.4 412.8
Non-Government Grants
1) Gross Disbursement 0.0 0.0 0.0 2.9
2) Repayments 0.0 0.0 0.0 0.0
3) Interest Payments 0.0 0.0 0.0 0.0
4) Net Disbursement (1-2) 0.0 0.0 0.0 2.9
5) Net Transfers (4-3) 0.0 0.0 0.0 2.9
Grand Total
1) Gross Disbursements 1,650.9 11,829.2 3,277.1 10,368.3
2) Repayments 2,108.0 8,968.0 1,902.5 8,748.7
3) Interest Payments 297.1 1,249.9 366.0 1,393.0
4) Net Disbursement (1-2) -457.1 2,861.2 1,374.7 1,619.6
5) Net Transfers (4-3) -754.1 1,611.3 1,008.7 226.7
*: Data are provisional.
Table 15: Year-on-year global inflation for major groups/sub-groups (Per cent) July-2014 May-2015 June-2015 July-2015 Energy -0.9 -39.7 -41.9 -45.8 Non-energy -1.3 -14.4 -14.3 -15.6 Agriculture -2.3 -16.0 -14.2 -12.1 Beverages 27.9 -11.1 -6.7 -7.8 Food -8.0 -19.1 -17.2 -13.6 Raw Materials 1.6 -10.0 -9.8 -10.3 Fertilizers -13.5 -0.2 1.6 -4.2 Metals & Minerals 2.9 -12.1 -16.6 -25.5 Precious Metals 2.8 -8.5 -10.2 -17.1

14
Table 16: Year-on-Year inflation based on WPI and CPI’s (per cent) WPI CPI-IW CPI-AL CPI-RL CPI (NS) Base : 2004-05 2001 1986-87 1986-87 2012 Jul-2014 5.4 7.2 8.0 8.1 7.4 Aug-2014 3.9 6.8 7.2 7.6 7.0 Sep-2014 2.4 6.3 6.9 7.1 5.6 Oct-2014 1.7 5.0 6.1 6.4 4.6 Nov-2014 -0.2 4.1 4.6 5.0 3.3 Dec-2014 -0.5 5.9 5.5 5.7 4.3 Jan-2015 -0.9 7.2 6.2 6.5 5.2 Feb-2015 -2.2 6.3 6.1 6.2 5.4 Mar-2015 -2.3 6.3 5.2 5.5 5.3 Apr-2015 -2.4 5.8 4.4 4.7 4.9 May-2015 -2.2 5.7 4.4 4.6 5.0 Jun-2015 -2.4 6.1 4.5 4.7 5.4 Jul-2015 -4.1 - - - 3.8 Note: WPI inflation for last two months and CPI (New Series) inflation for last one month are provisional.
Table 17: Fiscal Indicators- Rolling Targets as Percentage of GDP
(at current market prices)
Provisional
Actuals
Budget
Estimates
Targets for
2014-15 2015-16 2016-17 2017-18
Effective Revenue Deficit 1.8 2.0 1.5 0.0
Revenue Deficit 2.8 2.8 2.4 2.0
Fiscal Deficit 4.0 3.9 3.5 3.0
Gross Tax Revenue 9.8 10.3 10.5 10.7
Tax Revenue (net to Centre) 7.1 6.5 6.7 6.8
Non-Tax Revenue 1.6 1.6 1.5 1.4
Total Expenditure 13.0 12.6 12.1 11.6
Total outstanding liabilities at the end of the
year
--- 46.1 44.7 42.8
Notes:
1. The ratio to GDP at current market prices are based on the CSO’s National Accounts 2011-12 Series.
2. “Total outstanding liabilities” include external public debt at current exchange rates. For projections, constant exchange rates have been assumed. Liabilities do not include part of NSSF and total MSS liabilities which are not used for Central Government deficit.

15
Table 18: Trends in Central Government Finances : June, (2015-16)
Budget
Estimates
( ` Crore)
April-June Col.3 as
per
cent of
2014-
15 BE
Col.4 as
per cent
of
2015-16
BE
Per cent change
over preceding
year
(` Crore)
2015-16 2014-15 2015-16@ 2014-
15
2015-
16
(1) (2) (3) (4) (5) (6) (7) (8)
1.Revenue Receipts 1141575 114427 141204 9.6 12.4 -2.4 23.4
Gross tax revenue* 1449491 183028 215113 13.4 14.8 3.4 17.5
Tax (net to Centre) 919842 99087 101685 10.1 11.1 -2.8 2.6
Non Tax Revenue 221733 15340 39519 7.2 17.8 0.1 157.6
2.Capital Receipts 635902 299176 289789 49.4 45.6 12.9 -3.1
of which
Recovery of loans 10753 1208 1386 11.5 12.9 -22.9 14.7
Other Receipts 69500 109 1708 0.2 2.5 -82.0 1467.0
Borrowings and other
liabilities
555649 297859 286695 56.1 51.6 13.3 -3.7
3.Total Receipts (1+2) 1777477 413603 430993 23.0 24.2 8.2 4.2
4.Non-Plan Expenditure
(a)+(b)
1312200 301797 316031 24.7 24.1 12.9 4.7
(a) Revenue Account 1206027 274529 288473 24.6 23.9 17.5 5.1
of which:
Interest payments 456145 90694 95493 21.2 20.9 47.5 5.3
Major Subsidies 243811 81443 60301 32.4 24.7 3.3 -26.0
Pensions 88521 22449 30458 27.4 34.4 50.7 35.7
(b) Capital Account 106173 27268 27558 25.9 26.0 -19.4 1.1
5.Plan Expenditure (i)+(ii) 465277 111806 114962 19.4 24.7 -2.6 2.8
(i) Revenue Account 330020 89256 83911 19.7 25.4 -5.2 -6.0
(ii) Capital Account 135257 22550 31051 18.6 23.0 9.0 37.7
6.Total Expenditure
(4)+(5)
1777477 413603 430993 23.0 24.2 8.2 4.2
(a)Revenue Expenditure 1536047 363785 372384 23.2 24.2 11.0 2.4
(b) of which Grants for
creation of Capital Assets
110551 32274 35159 19.2 31.8 -13.2 8.9
(c)Capital Expenditure 241430 49818 58609 22.0 24.3 -8.6 17.6
7.Revenue Deficit 394472 249358 231180 65.9 58.6 18.5 -7.3
8.Effective Revenue
Deficit (7-6(b))
283921 217084 196021 103.3 69.0 25.3 -9.7
9.Fiscal Deficit 555649 297859 286695 56.1 51.6 13.3 -3.7
10.Primary Deficit 99504 207165 191202 198.9 192.2 2.9 -7.7
Source: Controller General of Accounts. @ Provisional actuals figures. * Gross Tax Revenue is prior to
devolution to the States.
******