
Monthly Economic Insight - media.tmbbank.com
31
Classification: Confidential (C-3) Monthly Economic Insight Prepared by TMB Analytics Date: 18 October 2017
Transcript of Monthly Economic Insight - media.tmbbank.com

Classification: Confidential (C-3)
Monthly Economic Insight
Prepared by TMB Analytics
Date: 18 October 2017

Executive Summary
▪ Global economic outlook was brightened up by strong growth among large economies leading
by US, EU and Japan. Additionally, global trades looked robust as shown in strong exports in
many countries, including Thailand. However, the China services sector started to show sign of
slower pace of expansion from downbeat PMI index (from 52.7 to 50.6).
▪ In August, Thai economic recovery has continued to broaden and gain momentum, buoyed by
growing export of goods and improving private demands.
▪ Private consumption continued to expand moderately, supported by strong growth in services.
Private investment expanded, though remained tepid, mainly from equipment investment.
▪ August exports continued expanding at 13.2% mainly due to trading partners’ economic
recovery. For the fist eight months of 2017, it grew by 9%, the highest growth rate in 6 years.
Export to all markets expanded constantly, and most of export products registered positive
growth. On import side, it grew by 14.9% in August. For the first eight months it grew by 15.4%
owing to an increase in both energy and export-related products.
-2-

Executive Summary
▪ Manufacturing production increased 3.7%yoy in August, export as key of growth, stronger
production from vehicle and part, electronics, rubber product and chemicals. Entrepreneurs
sentiment improve for the first time in five months from new orders both domestic and
export markets. However, most firms continued to be concern about currency appreciation.
▪ Number of foreign tourists were 3.13 million (+9%yoy). 8M17, arrivals recorded 23.5 million
(+5%yoy). Chinese has been and still is top source with 28% market shares. Positive
Drivers included more airlines link from sources market (China, Taiwan, Indonesia, India
and Turkey) to Thailand.
▪ September inflation rate increased to 0.9% from higher prices of energy, tobacco and
alcoholic drinks from excise tax reform, and some fresh food in flooded area.
▪ Year-to-date, Thai baht appreciated against the USD by 8.3% (strongest in Asian) due to
geopolitical risk over Korean peninsula, uncertainty over Fed’s rate hike outlook and strong
current account surplus (from exports of goods and services). However, major central
banks could start to tighten monetary policies which could boost fund outflows from
Thailand. For the rest of 2017, the dollar is expected to trade within ranges of 32.80-33.30
THB/USD.-3-

Classification: Confidential (C-3)
Economic Updates
Updates on Global Economy
Updates on Thai Economy

Classification: Confidential (C-3)Classification: Confidential (C-3)
Global Economy

-6-Source: IMF, Various Central Banks, Bloomberg, and TMB Analytics’ projection
Developed Economies Keep Expanding
Manufacturing in US and EU expand faster
2.22.1
2.0 1.8
-1.0
0.0
1.0
2.0
3.0
2011 2012 2013 2014 2015 2016 2017 2018
Services continue to grow with acceleration
US Real GDP growth YoY
EU Real GDP growth YoY
Real GDP growth outlook
%
45
50
55
60
Jan-15 Jul-15 Jan-16 Jul-16 Jan-17 Jul-17
US Manufacturing PMI
EU Manufacturing PMI
45
50
55
60
Jan-15 Jul-15 Jan-16 Jul-16 Jan-17 Jul-17
US services PMI
EU Services PMI
↑ Expansion
↓ Contraction
↑ Expansion
↓ Contraction

45
50
55
Jan-15 Jul-15 Jan-16 Jul-16 Jan-17 Jul-17
45
50
55
Jan-15 Jul-15 Jan-16 Jul-16 Jan-17 Jul-17
6.76.5
1.51.2
-1.0
0.0
1.0
2.0
3.0
6.0
7.0
8.0
9.0
10.0
2011 2012 2013 2014 2015 2016 2017 2018
-7-Source: IMF, Various Central Banks, Bloomberg, and TMB Analytics’ projection
Asian Economies Also Keep Growing
Japan Manufacturing expand rapidly Services sectors still grow in China and Japan
China Real GDP growth YoY
Japan Real GDP growth YoY
%
Japan Manufacturing PMI
China Manufacturing PMI*
China services PMI*
Japan Services PMI
↑ Expansion
↓ Contraction
China PMI* from Caixin
Real GDP growth outlook

-8-
EU Political Uncertainty
Delayed
Trumponomics
CB Ready to
Tighten Policy
Robust Thai
Economic growth
EM Fund Flows
THB
IN OUTIN
Bullish Bearish
Likelihood
Severity*
High Medium
Source: TMB Analytics
*Impact to financial market
Medium
IN
What Does Matter in 2017: Key Events to Keep Eyes on
Medium

1H2017 2H2017
UK trigger Article
50 German
Election
French
Election
-9-
Theresa May
failed to win
majority in
parliament (317/650 seats)
UK
ElectionItaly
Election
1Q2018
“Bye Bye EUSee you (Softer)Hard Brexit”
“En Marche!” (Forward!)
“Progressive Movement”
Emmanuel Macron beat Marine Le Pen in presidential election
and won 350/577 seats in parliament
Angela Merkel’s
CDU/CSU* party is
facing a new
challenge to form
3-way coalition
with FDP and Green
5 stars movement
party is losing popularity
Dutch
Election
Mark Rutte beat
Geert Wilders,
destroyed hope for Nethexit
*CDU = Christian Democratic Union of Germany
*CSU = Christian Social Union in Bavaria
Renewed Concerns Over German Election Result
September 24

-10-
Funding
Source: Bloomberg, ING, GovTrack, RealClearPolitics, FlatIcon, CBO, Wikipedia, and TMB Analytics
“39% of R-Congress are very Conservative … They will oppose my great plans !!!”
Trumpcare
Delayed!!
Tax Reform Infrastructure
Will also be Delayed!!
+0.3 Trillion USD over 10 years
Border
Adjustment Tax
-1 Trillion USD over 10 years
-1.2 Trillion USD over 10 years
+1.0 Trillion USD over 10 years
Trumponomics Likely Brings Disappointment This Year
Trump’s great stimulus plan timelines will be extended longer than market’s expectations as Healthcare reforms was delayed indefinitely.

-11-Source: Fed, BoJ, ECB, Bloomberg and TMB Analytics
Short-term rate: Fed Fund
Dovish Hawkish
Short-term rate: Refin RateDovish Hawkish
Short-term rate: PR-BalancesDovish Hawkish
2H/2017 1H/2018 2H/2018
FED
BOJ
ECB
1 Rate Hike 1 Rate Hike 1 Rate Hike
Start B/S run-off
$ -10 bn $ -20 bn $ -30 bn $ -40 bn $ -50 bn
0 Rate Hike 0 Rate Hike 1 Rate Hike
Start QE Tapering
EUR 60 bn EUR 40 bn
0 Rate Hike 0 Rate Hike 0 Rate Hike
Start QE Tapering
JPY 80 Trillion / year
EUR 20 bn
JPY 60 Trillion / year JPY 40 Trillion / year
ECB’s QE Tapering “Judgement Day” in October
“Real Game Changer”

-100
-50
0
50
100
150
Jan-16 Apr-16 Jul-16 Oct-16 Jan-17 Apr-17 Jul-17
ST Bonds (TTM < 1y) LT Bonds Net Equity Foreign Flows
-12-Source: Bloomberg, CEIC and TMB Analytics, As of Oct 2017
bn.THB
Allocations move from
DM to EM; debt to
equity as Brexit and Fed hike delay
EM outflows
from fear of
trade protectionism
Inflows to EM
from unclear Trumponomics
YTD Net Inflows = 298.8 bn. THB
Equity = 14.6 bn. THB (5%)Bond = 284 .2bn. THB (95%)
-3
8
18
28
38
South Korea China Indonesia Thailand Phillippines Malaysia
Equity Bond
bn.USD
Thailand
If Bond Rout is Coming … Risk of Fund Flow Reversal ? Foreign fund continuously flows into Thailand as US election reflected higher risk appetite
Asian Bonds: The dearest destiny of “Foreign” Investors
10
38
0
10
20
30
40
2015 2016 2017YTD
%Bond Outright Trading Activity
Fading’s Fed’s Hike probability

-2.0
-1.0
0.0
1.0
2.0
3.0
-10
-6
-2
2
6
10
14
-13-
THBBillion USD
BoP = Net Demand for THB
Net
Export
Goods
16%
Net
Export
Services
33%
Foreign net
buy 10%
FDI 10%
Thai net buy
18%
TDI
13%
Q1/2017 Source: BoT, CEIC, MoC and TMB Analytics; as of Sep 2017
2018 Outlook
Surplus
Deficit
Continual expansion of Thai tourism
Increasing EPS growth of listed firms
EEC, BOI attract more investment
No More Robust Trade Surplus
Brightening outlook of Foreign Investment Fund Industry
Growing economy lures more investments from Thai firms
Going Forward: Rising Balance of Payment Is Expected
BoP typically governs
THB’s direction

Source: CEIC and TMB Analytics; as of Sep 2017 -14-
Robust Thai economy
30
31
32
33
34
35
36
37
38
Jan Feb Mar Apr May Jun Jul Aug Sep Oct Nov Dec 2018Q1 2018Q2
2 Hikes & Robust Thai Economy
USDTHB 2010
USDTHB 2017
33.30period-end2017
32.50period-end2018
▪ 2 Fed’s rate hikes
▪ Continual fund
inflows
Geopolitical Risks
CB’s tightening monetary policies
Pro-growth Trumponomics
GDP
“Strong” THB Factors “Weak” THB Factors
Domestic Fundamentals Lessen External Impacts
1 Fed Hikes and
B/S reduction in December 2017
Macron won
French election
ECB’s
unintentionally
signalQE tapering?
Trump started presidency term
Fed hiked
policy rate by 25bps

-15-
Stronger Fundamental Self-Support Currencies Against USD
Prolong above-2% inflation will support the GBP.
But sell-off from “NO Deal” risk and dovish BOE
could push the pair below 1.25 USD/GBP
GBP/USD
1.291.341.301.25Next 4 quarters
4Q173Q172Q171Q17TMB Forecast
USD/CNY is expected to fluctuate around 6.80
yuan per USD as PBOC lets the pair to move
according to actual transactions
USD/CNY
6.606.656.786.89Next 4 quarters
4Q173Q172Q171Q17TMB Forecast
Stronger EU economy will gradually boost the
EUR, expected to stay above1.15 USD from
faded political rout and hopes for ECB tapering
EU disintegration,
banking problems
Less political risks
& ECB tapering
EUR/USD
1.211.181.141.07Next 4 quarters
4Q173Q172Q171Q17TMB Forecast
Global “risk-on” abandons JPY haven in 2017. the
pair is expected to stay around 110-115 while
dovish BoJ could suppress JPY’s rise in 2H17
Risk-On & yield
curves steepen
Weak US data &
risk-off market
112113112111Next 4 quarters
4Q173Q172Q171Q17TMB Forecast
USD/JPY
Brexit with No Deal,
Rate cut, More QE
Stronger economy &
no QE extension
Reserve outflows &
waning economy
Stable FX policy &
Improving economy
Source: CEIC and TMB Analytics; as of Sep 2017
Factors to Monitor Factors to Monitor
Factors to Monitor Factors to Monitor

70
101
178
6.4
6.8
7.2
7.6
0
50
100
150
200
2017 2018 2019
Average 5YCorporatebond yield
-16-Source: Bloomberg, PBOC, TradingEconomics and TMB Analytics; as of Aug 17
China Corporate Debt: Napping Black Swan
Rollover Risk Looms As Cost of Funds RiseCorporate debt is absurdly high (156% of GDP)
%to GDP
-500
500
1,500
2,500
3,500
Jan-16 Jul-16 Jan-17
Shadow loans MoMBank loans MoM
Could PBOC tame shadow loans rampages?
Billion Yuan
3
24
0
5
10
15
20
25
30
2008 2009 2010 2011 2012 2013 2014 2015 2016
Trillion Yuan
Shadow banking loans keep swelling up
Billion Yuan
Yearly amount due
on Corporate Bond
rated AA- or lower
Shadow loans = 13% of total debt
%
100162
73 85
160
257
0
100
200
300
400
500
600
2008 2016 2016 2016
Corporate Debt Household Debt
Bank Debt Government Debt
Private
Corp.
53%
SOE
109%

0.6
0.8
1
1.2
1.4
1.4
1.5
1.6
1.7
1.8
Jan-16 Jul-16 Jan-17 Jul-17
Russell 3K Value/Growth (LHS)
UST10Y-UST2Y (RHS)45.0
50.0
55.0
60.0
Jan-15 Jan-16 Jan-17
EU_Services_PMI
EU_Mfg_PMI
-17-
▪ New US government
policies create more
volatility to economic
projections
▪ Subdued inflation could be
persist until consumer
spending grows stronger
▪ Economy is projected to
expand 2.2% in 2017 from
1.6% in 2016
United States Eurozone
Activity
3.0%QoQ SAAR Real
GDP 2Q17
Price
1.9%YoY SA CPI
Aug 17
Labor Mkt
4.2%Unemployment
Rate Sep 17
▪ UK economy keep growing,
amid lessening economic
ramifications from Brexit
▪ Expansions among
manufacturing and service
sectors sustain EU’s growth
▪ Growth in 2017 is expected
to be around +2.0% better
than +1.6% in 2016
EU Activity
2.3%YoY SWDA GDP 2Q17
UK Activity
Industry
Latest Releases Latest Releases
Source: Bloomberg, and TMB Analytics’ projection
1.7%YoY SWDA GDP 2Q17
58.1EU Mfg. PMI
Sep 17
Fading Reflation: Flattening yields curve Steady Expansions in EU Mfg. and Services
Solid Growth Momentum Among Developed Economies
(%)
↑ Expansion
↓ Contraction
Trump’s
Victory spark
Reflation trades
Fading
Trumponomics
= Dying Reflation

+0.8%
+4.9%
-8%
90
95
100
105
110
Jan-17 Apr-17 Jul-17
Nikkei225
TOPIX
USDJPY
-18-Source: Bloomberg, and TMB Analytics’ projection
▪ Economy is likely to
sustain above 1.0%
expansion in 2017
▪ Inflation and consumer
spending gradually improve
▪ Recently, strong Yen could
hamper rising trend of
inflation and hurt Japanese
exporters’ profit margin
Japan China
Activity
2.5%YoY NSA
GDP 2Q17
Price
0.7%YoY SA Core
CPI Aug 17
Export
18.1%YoY NSA
Aug 17
▪ GDP is likely to grow by
6.3% in 2017 where growth
story still broadly unchanged
▪ Rebound in industrial sector
galvanize rising profits and
debt-repayment ability
▪ Inflation picks up, eases
concern over economic
growth
Activity
6.9%YoY Real
GDP 2Q17
Price
1.8%YoY CPI
Aug 17
Production
50.6Caixin Services
PMI Sep 17
Higher profits reflects higher producer prices
Latest Releases Latest Releases
Strong Yen punishes prospects of exporters
Stabilizing Asian Economies Amid Strengthening Currencies
(%)(%)
Rebased at 100-8.0
-4.0
0.0
4.0
8.0
-40
-20
0
20
40
Jan-12 Jan-13 Jan-14 Jan-15 Jan-16 Jan-17
China Industrial Enterprises total profits yoy
China PPI YoY
Thai Economy
6.6
8.0
3.13.3
1.81.6
5.1
2.0
7.2
5.1
3.2 3.2
2.2
3.8
4.9
2.2
GDP 2560E
GDP 2561F
3.5%
3.8%
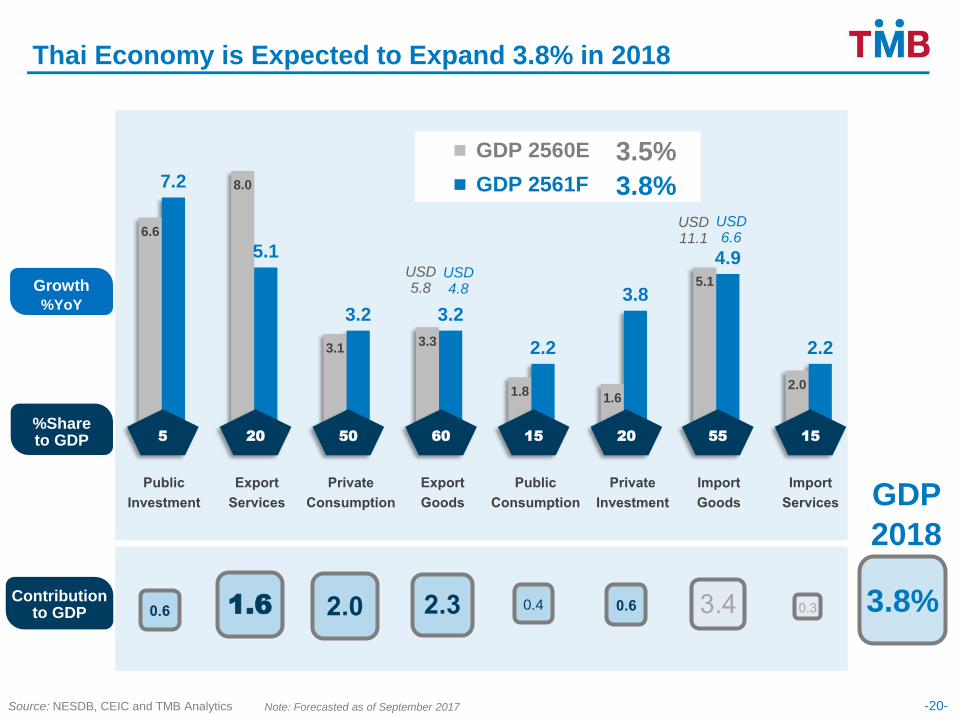
Thai Economy is Expected to Expand 3.8% in 2018
Source: NESDB, CEIC and TMB Analytics -20-
USD 5.8
USD 4.8
5 20 50 60 15 20 55 15
%Share to GDP
PublicInvestment
ExportServices
PrivateConsumption
ExportGoods
PublicConsumption
PrivateInvestment
ImportGoods
ImportServices
Note: Forecasted as of September 2017
Growth
%YoY
Contribution to GDP
USD 11.1
USD 6.6
1.6 2.3 0.4 0.33.40.62.00.6
GDP
2018
3.8%

65
70
75
80
85
-30
-20
-10
0
10
20
Aug-15 Feb-16 Aug-16 Feb-17 Aug-17
Services Durable Cons Confidence (RHS)
%yoy Index
Domestic Demand Continually Improved
Source: BOT, OAE and TMB Analytics
▪ Overall private consumption continued to
expand even though durable consumption
slowed down due to farm income contraction.
Consumer confidence remained low.
▪ Farm income contracted from the same period
last year as increase in agricultural production
was overwhelmed by decrease in the price.
▪ Private investment expanded slightly from last
year mainly from equipment investment
consistent with improving business sentiment.
Slow Down in Durable Consumption Growth Positive Private Investment Growth
Drop in Farm Income from Strong Price Plunge
44
47
50
53
-4
-1
2
5
Aug-15 Feb-16 Aug-16 Feb-17 Aug-17
Private Investment Biz Sentiment (RHS)
%yoy Index
-30
-15
0
15
30
45
Aug-15 Feb-16 Aug-16 Feb-17 Aug-17
Price Quantity Farm Income
%yoy
-21-

-22-Source: Ministry of Finance and TMB Analytics
Expect more mid-year budget disbursement in 4Q2017
Capital Budget Disbursement RateCapital Budget Disbursement
▪ In August, investment budget recorded higher level of disbursement in line with its cycle in
the final quarter of 2017FY. The total investment disbursement of the first 11 months of
FY2017 still edged up by 4% yoy.
▪ Investment contracts amounting to 50% of total mid-year capital budget has already been
sign. Therefore, we expect mid-year budget to be disbursed more rapidly in the rest of the
year.
Note : data include Mid-year budget since Apr 2017
10,000
20,000
30,000
40,000
50,000
60,000
Jan Feb Mar Apr May Jun Jul Aug Sep Oct Nov Dec
2015 2016 2017
57
0
20
40
60
80
100
Oct Nov Dec Jan Feb Mar Apr May Jun Jul Aug Sep
FY2015
FY2016
FY2017
FY2017 Target87%
Million THB

2.88
3.13
92k
42k
71k9k 17k 17k 1k 0k
-0k
+10%
+10%
+10%
-0% +11% +13% +19%+9% +0%
Au
g'1
6
Ch
ina (
31
%)
Ea
stA
sia
(E
xc
l.C
hin
a)
(15%
)
AS
EA
N (
25
%)
Eu
rop
e (
14
%)
Am
eri
ca
s (
3%
)
So
uth
Asia
(5%
)
Mid
dle
Eas
t (3
%)
Afr
ica
(1
%)
Oc
ean
ia (
2%
)
Au
g'1
7
Aug'16
Million
Million
Aug'17
Ch
ina
(3
1%
)
Source: Department of Tourism, BOT, and TMB Analytics
*Note:± x % represents the growth of tourist arrival (yoy)( %) represents the share of tourist arrivals
Inbound Market Showing Strong Growth
+9.0%
-23-
9%yoy…Tourism Sector Showing Healthy Growth Chinese Arrivals Exceed 3 Mill, 2nd Highest During 8M17
10.5 9.0
60.5 65.1
0
1,000
2,000
3,000
4,000
5,000
6,000
7,000
8,000
Dec-1
4
Ma
r-15
Jun
-15
Se
p-1
5
Dec-1
5
Ma
r-16
Jun
-16
Se
p-1
6
Dec-1
6
Ma
r-17
Jun
-17
Growth of No. of Tourists (%yoy)
Aug'17Aug'16
+250k
Occupancy Rate (%)
Number of Tourists (Mill people)
2.883.13
▪ August 2017, number of foreign tourists were 3.13 million (+9%yoy), East Asia and ASEAN represented 71% of
international tourists in this month.
▪ 8M17, arrivals were recorded 23.5 million (+5%yoy). Chinese has been and still is top source with 28% market shares,
followed by Malaysia, Korea, Laos, Japan, India, and Russia. Those 7 nations dominated 60% of inbound arrivals.
▪ Positive Drivers included more airlines link major Chinese cities with secondary tourist destinations in Thailand,
increasing flight from major supply cities in India and also new routes from Taiwan, Indonesia and Turkey to BKK
contributed the growth in number of international tourist arrivals.
▪ Occupancy rate gradually improved to 65.1%, hotel market seems to be recovering.

CLMV
(2016 -0.2)
+8.5
Rubber
+16.0(2016 -3.8)
-24-Source: MOC CEIC and TMB Analytics
What is 2017 outlook for Thai Export?
Total
(2016 +0.5)
+5.8
Japan
(2016 +2.4)
+6.0
China
(2016 -0.8)
+19.0
USA
(2016 +1.7)
+6.0EU
(2016 +0.5)
+5.0
Growth mainly from
global demand
recovery as less
uncertainty and political risk this year
Strong demand consumption
Oil price
recovery helps
raw mat and commodities
Recovered
investment in Asia
help supply chain with Japan
Continual
economic recovery
Protectionism
unlikely to take
an effect this year
Thai Export: Recovery….A Significant Boost
Computer&Parts
(2016 -2.0)
+9.0
Vehicle
+4.0(2016 +4.6)
Electrical appliances
+10.0(2016 -1.3)
Rising demand
for tire mfg from China
Same growth as
last year comes
mainly from supply of auto parts
Global economic recovery and increase in
oil price which is expected to be 55 dollar per barrel at the end of 2017
Market
Product
High
economic growth
Slightly Positive
mainly owing to
sugar both volume and price
ASEAN5
(2016 -1.4)
+4.5
Agro
Products
(2016 -6.5)
+2.0
Chemical
+10.0(2016 -7.5)

-25-

-26-
Key productsOutlook Major exporting market
Consumption & Commodity
Agricultural & Agro
%YTD Share
Rubber 5.0
2016 YTD Aug
• Vegetable & Fruits(34.7%), Sugar(34.2%)
• HDD (17.8%), Electrical Machinery (20.5), Electronics Parts (10.3%)
• Basic Metal (45.0), Basic Steel (27.2)
August Growth (%) % YTD Share
• Polymer Products (131.5), Glove (22.1),Smoked Rubber Sheet (21.3)
• China (68.6),ASEAN5 (30.8), USA(17.3)
• CLMV (71.6),CHINA (5.6), ASEAN5 (-9.6)Agro 4.1
Rice 2.1
Chemical 7.0
Electronic Com 17.6 • CHINA (21.5) USA(2.3),
EU(25)(12.3)
Steel 4.0 • EU25 (18%), USA (50.4), JAPAN (34.2)
Source: MOC, and TMB Analytics
10.6%8.6%
17.0%
30.7%
9.2%11.6%
8.5%
17.8%
13.2%
4.8%
17.4%
24.6%
11.6%
7.1%3.4%
-7.3%
-20%
-5%
10%
25%
40%
WORLD ASEAN5 CLMV CHINA JAPAN USA EU25 MIDDLEEAST
YTD Jul Aug
Thai Export to Major Markets
13.6 25.8
44.333.9
17.348.4
10.411.2
18.726.3
21.928.3
• Rice(48.4%)
• Basic Chemical (28.8)
• Middle East (148.3), China (39.1), Africa (28.6)
• China(29.8), CLMV(34.3) ASEAN(8.4)
TMBA’s View
• A drop in export to ASEAN5, EU(25)
and Middle East due to car producers,
which the overall car export this
month shrank by 33%.
• Slower export to USA came from a
shrank of Jewelry export (-10.1%) and
passenger car (-23%)
• While a drop in export to China mainly
came from steel ( -16.5%), and energy (-29.7%)
August Export Growth supported by both Agri.& Indus. especially Elec. Com.

-27-
Industrial Outputs Rose For Second Straight Month in August
80
85
90
95
100
105
Jan-14 Jan-15 Jan-16 Jan-17
Diffu
sio
n In
de
x
BA
DG
OO
D
▪ MPI increased 3.7%yoy with capacity utilization rate at 62.5% in
August, export as a key driver of growth, mainly supported by
vehicle and part, electronics, rubber products and chemicals.
▪ Entrepreneurs sentiment improve for the first time in five months
from new orders both domestic and export markets. However,
most firms continued to be concern about currency appreciation.
Manufacturing Product Index (MPI)
Negative gr.( MPI < 0%)
Low gr.( 0%<MPI < 3%)
Moderate gr.(3% <MPI<5%)
High gr.(MPI > 5%)
Source: OIE, BOT, FTI, classified industry group and calculated by TMB Analytics
-50
-30
-10
10
30
50
70
Jan-14 Jan-15 Jan-16 Jan-17
%Y
oY
Fuel Industry
Industry Indicator
II.Industrial Confidence
I.Raw Materials ImportAug-17
Q1 Q2 July Aug (%MoM,sa)
Capacity Utilization Rate (%) 100.0 60.0 62.6 59.1 60.0 62.5 2.6
Manufacturing Product Index (MPI) (%YoY) 100.0 1.6 0.3 -0.1 3.4 3.7 2.7
Food 15.3 2.7 2.8 4.9 10.1 0.1 -5.1
Vehicle 11.8 2.2 -4.8 -2.3 2.8 9.4 8.3
Electronic/Computer & Parts 11.2 2.7 13.9 9.4 6.5 4.5 2.0
Autopart 9.8 -1.0 -3.2 3.9 18.9 26.8 10.2
Fashion Products 9.8 -2.8 -5.4 -6.2 -6.0 -9.6 3.4
Steel Products 5.9 5.3 8.8 -11.0 0.5 -7.7 0.0
Rubber Products 5.8 -0.7 -2.6 5.3 17.2 13.7 11.0
Construction Material 5.6 -0.9 -1.2 -2.7 -11.3 -1.8 3.3
Electronic/Electric Home Appliance 4.3 15.1 -2.6 -6.9 -16.4 -14.7 5.1
Beverage 4.0 -0.2 -1.7 -6.8 14.1 10.0 4.7
Petroleum 3.3 2.4 -0.2 7.5 1.8 7.4 1.5
Plastics Products 3.1 4.2 -2.6 -1.7 1.3 2.5 0.6
Papers & Printing 2.7 5.2 -1.2 1.7 -0.7 5.6 4.7
Furniture and Household Products 1.8 -17.3 -2.0 -5.9 -22.9 12.8 49.8
Chemical 1.6 0.5 -1.5 -0.0 0.7 10.7 4.8
Healthcare 1.3 -1.2 13.4 3.9 -0.0 -9.8 0.3
Consumer Goods 1.3 1.1 -5.0 -7.2 -2.2 -2.0 2.0
Tabacco 1.1 -9.2 -5.0 -9.1 16.9 9.8 31.1
Agri.Machinery 0.1 5.8 -14.9 1.4 -26.9 -28.3 9.3
(%)
Weight2016
2017

-2.0
-1.0
0.0
1.0
2.0
15Q1 15Q2 15Q3 15Q4 16Q1 16Q2 16Q3 16Q4 17Q1 17Q2 17Q3
Expect Rate Normalization in 2018 and 1.50% Policy Rate in 2017
Source: MOC, CEIC and TMB Analytics
Headline Inflation Stands above Zero for 2 Consecutive Months
Policy Rate is Expected to be Held at 1.50% as Inflation Remains Low
Higher Inflation from Increase in Energy Price
▪ September inflation picked up due to higher
energy prices, increase in prices of tobacco
and alcoholic drinks from excise tax reform,
and higher price of some fresh food in flooded
area.
▪ We expect inflation rate to be averaged at
0.7% in 2017 from increase in energy price.
-29-
%yoy
Sep 2017 0.9%
Avg 2016 = 0.2%
▪ Policy rate is expected to be maintained at
1.50% throughout 2017 to accommodate
economic recovery especially private investment.
Moreover, inflationary pressure remained low.
▪ We expect the rate normalization to begin in
2018 as global interest rate is on an upward
trend following 3 expected fed rate hikes in 2017.
However, there is still concern over recovery of
private investment, which can delay Thai rate
normalization.
%

1.45
2.62
1.0
1.5
2.0
2.5
3.0
15Q1 15Q3 16Q1 16Q3 17Q1 17Q3
TGB2YTGB10Y
Source: MOC, CEIC and TMB Analytics -30-
% TMB’s Projection
0
1
2
3
4
5
15Q1 15Q3 16Q1 16Q3 17Q1 17Q3 18Q1 18Q3
2017 Policy Rate: 1.5%
%
2018 Policy Rate: 2.0%
2017 TGB 2Y: 1.45%
2017 TGB 10Y: 2.62%
Policy Rate will Reach 2.0% in 2018 amid Global Tightening Cycle
TGB yields will gradually rise as BoT hike rate
2018 TGB 2Y: 1.86%
2018 TGB 10Y: 3.05%

30
1.4
2.1
2.9 3 3
3 3
1.52
2.252.5
2.75
33.253.25
0
1
2
3
4
5
6
2004 2006 2008 2010 2012 2014 16 17 18 19 20 21 22 23 24
0.1-0.1
-0.7
-0.5-0.3
0.00.3 0.3
-1.5
-0.5
0.5
1.5
2.5
3.5
2004 2006 2008 2010 2012 2014 16 17 18 19 20 21 22 23 24
Source : Minute of FOMC March 14-15 ,2017 ; Bank of Thailand, TMB Analytics, as of Aug 2017
Federal Funds Rate
Entering rising rate
environment
*Projection of Fed funds rate is from FOMC’s projection as of March 2017
*Projection of Thai policy rate is from TMBA’s projection as of May 2017
Projection%year end
%year end
Thai-US Policy Rate Differentials
Projection
*Thai RP minus US Fed funds rate
▪ Thai economic expansion
leads to rising inflation.
▪ Acceleration in US rate hike
puts pressure on Thai
policy rate as fund outflows
could be intensified
Thai policy rate
Fed funds rate
US policy rate is higher
than Thai policy rate
▪ Thai policy rate uptrend to
begin in 2018
-31-
Brace Yourselves Negative Rate Differential Is Coming!
THANK YOU
Disclaimer
This document is issued by TMB Analytics, a division of TMB Bank PCL. All analyses are based on information available to
the public. Although the information contained herein is believed to be gathered from reliable sources, TMB makes no
guarantee to its accuracy and completeness. TMB may have issued, and may in the future issue, other reports that are
inconsistent with, and reach different conclusions from, the information presented in this report. Opinions or predictions
expressed herein reflect the authors’ views, not that of TMB, as of date of the analysis and are subject to change without
notice. TMB shall not be responsible for the use of contents and its implication.


![Monthly Economic Reviewbsl.gov.sl/MER October 2019- Finalised Version.pdf · Monthly Economic Review October 2019 Publisher: The Monthly Economic Review [MER] is published by the](https://static.fdocuments.us/doc/165x107/5eddde83ad6a402d66691757/monthly-economic-october-2019-finalised-versionpdf-monthly-economic-review-october.jpg)
