
Monitoring Urban Sprawl from historical aerial photographs ... · Monitoring Urban Sprawl from...
9
Monitoring Urban Sprawl from historical aerial photographs and satellite imagery using Texture analysis and mathematical morphology approaches Bahaaeddin Alhaddadª, Josep Roca Claderaª and Malcolm C. Burnsª (bahaa.alhaddad, josep.roca, malcolm.burns)@upc.edu ª Centre de Política de Sòl i Valoracions- CPSV, Universitat Polítècnica de Catalunya- UPC Av. Diagonal, 649, 4a planta, 08028 BARCELONA, SPAIN Abstract In the last few decades, Urban sprawl refers to the outgrowth of urban areas caused by uncontrolled, uncoordinated and unplanned growth. The rapidity of urban dynamics has a significant impact on the spatial patterns associated with the growth and expansion of metropolitan areas. Spain has been urbanizing large amounts of land, while the total population has hardly increased. Much of the expansion of (sub) urban development has come at the expense of farmland, forest land, and other areas of open space, mostly as the result of low-density, sprawling development. Sound land use planning and open space preservation are important issues in Spain, but currently very little quantitative information is available describing urban sprawl and land use change. Black and white aerial photography from 1956 and panchromatic satellite imagery from 2005 are used for studies of growth and change of informal settlements in various landscapes in Spain. The digital data is Ortho-rectified, corrected for brightness variations and mosaicked using ER Mapper and Global Mapper software. The texture analysis and mathematical morphology are applied with ENVI and MATLAB. The focus of this study is to evaluate the capability of using textural analysis for mapping the compact urban areas of Barcelona city in Spain. The significance of this study is due to (1) the use of historical aerial photographs and SPOT imagery for monitoring urban land use change; and (2) the research being on developing Spain cities, which have rapidity of urban dynamics. 1. Introduction The long-time historical evolution and recent rapid development of Spain, present before us a unique urban structure. Historical maps and Arial photographs exist for a number of epochs and are potentially invaluable in the analysis of the changing face of the Spain landscape. Many of these data exist purely in a hard copy format and as a result a great deal of potentially valuable information has been lost over time. The collation, scanning and geo- referencing of these data sources are crucial if further material is not to be lost. Whilst the digital output of the maps in itself is invaluable, classify and victories data of the urban settlement would allow a wider, more detailed use of the data. In this article we describe the application of texture feature extraction approach to classify different images from two main environments: urban and non urban landscapes. Texture analysis offers interesting possibilities to characterize the structural heterogeneity of classes. The texture of an image is related to the spatial distribution of the intensity values in the image, and as such contains
Transcript of Monitoring Urban Sprawl from historical aerial photographs ... · Monitoring Urban Sprawl from...
Monitoring Urban Sprawl from historical aerial photographs and satellite
imagery using Texture analysis and mathematical morphology approaches
Bahaaeddin Alhaddadª, Josep Roca Claderaª and Malcolm C. Burnsª
(bahaa.alhaddad, josep.roca, malcolm.burns)@upc.edu
ª Centre de Política de Sòl i Valoracions- CPSV, Universitat Polítècnica de Catalunya- UPC
Av. Diagonal, 649, 4a planta, 08028 BARCELONA, SPAIN
Abstract
In the last few decades, Urban sprawl refers to the outgrowth of urban areas caused by uncontrolled,
uncoordinated and unplanned growth. The rapidity of urban dynamics has a significant impact on the spatial
patterns associated with the growth and expansion of metropolitan areas. Spain has been urbanizing large
amounts of land, while the total population has hardly increased. Much of the expansion of (sub) urban
development has come at the expense of farmland, forest land, and other areas of open space, mostly as the result
of low-density, sprawling development. Sound land use planning and open space preservation are important
issues in Spain, but currently very little quantitative information is available describing urban sprawl and land
use change. Black and white aerial photography from 1956 and panchromatic satellite imagery from 2005 are
used for studies of growth and change of informal settlements in various landscapes in Spain. The digital data is
Ortho-rectified, corrected for brightness variations and mosaicked using ER Mapper and Global Mapper
software. The texture analysis and mathematical morphology are applied with ENVI and MATLAB.
The focus of this study is to evaluate the capability of using textural analysis for mapping the compact urban
areas of Barcelona city in Spain. The significance of this study is due to (1) the use of historical aerial
photographs and SPOT imagery for monitoring urban land use change; and (2) the research being on developing
Spain cities, which have rapidity of urban dynamics.
1. Introduction
The long-time historical evolution and recent rapid development of Spain, present before us a
unique urban structure. Historical maps and Arial photographs exist for a number of epochs
and are potentially invaluable in the analysis of the changing face of the Spain landscape.
Many of these data exist purely in a hard copy format and as a result a great deal of
potentially valuable information has been lost over time. The collation, scanning and geo-
referencing of these data sources are crucial if further material is not to be lost. Whilst the
digital output of the maps in itself is invaluable, classify and victories data of the urban
settlement would allow a wider, more detailed use of the data. In this article we describe the
application of texture feature extraction approach to classify different images from two main
environments: urban and non urban landscapes. Texture analysis offers interesting
possibilities to characterize the structural heterogeneity of classes. The texture of an image is
related to the spatial distribution of the intensity values in the image, and as such contains

information regarding contrast, uniformity, rugosity, regularity, etc. A considerable number of
quantitative texture features can be extracted from images using different methodologies in
order to characterize these properties, and then can be used to classify pixels following
analogous processes as with spectral classifications. Many texture comparative studies can be
found in the literature, usually carried out by employing standard image databases for the
testing process. Textural information has been an important factor in visual image
interpretation. It takes into consideration the distribution and variation of neighbourhood pixel
values. Haralick et al. (1973) developed a set of texture statistics for image classification
based on Grey Level Co-occurrence Matrix (GLCM) [1]. Studies by Marceau et al. (1990)
demonstrated that these textural statistics were useful to resolve spectral confusion between
land cover classes [2]. Most landscape forms do not have sharp boundaries on remotely
sensed imagery of various scales, but similar types of land cover may have similar spatial
patterns as manifested by gray-level variation in an image. The gray-level variability is
referred to as texture [3]. This paper approaches the measurement of municipal urban growth
from a strictly morphological perspective based on the texture analysis, drawing upon
historical aerial photographs and SPOT imagery dating from 1956 and 2005. The fundamental
goals of this study were:
• The ability of texture analysis approach for the extraction of texture features and change
detection from B&W historical Arial photographs in different environments, analyzing and
assessing the different methodological parameters involved in the process.
• Assess the increased accuracy afforded by texture analysis approach for the monitoring of
key urban development issues both within the confines and beyond the edge of the
municipal Areas.
• Provided a broad indication of the magnitude of change in urban land cover classes
experienced in the Barcelona city in Spain over the study period and to allow a cross-
border comparison of the respective urban regions under consideration.
With the claimed classification accuracy improvement using texture analysis, the study would
incorporate the measures with various texture analysis approaches to detect change detection
areas in several Mediterranean cities in Spain with multispectral satellite imagery and
Historical Arial photographs captured in time 2005 and 1956. As a baseline for the
comparison, a semi-automatic method using edge detection method is introduced to delineate
the boundaries and extracted the urban areas. Finally, a comprehensive comparison between
these approaches are presented with performance percents, visual analysis, a visual

interpretation approach is introduced to delineate the boundary manually for accuracy
masseur.
2. Study area
The chosen area is Barcelona, which is the regional capital of Catalonia, lying in the north-
east of Spain (see Figure 1). The physical limits of Barcelona extend to almost 100 Km2. and
the city had a population of some 1,595,110 inhabitants in January 2007 leading to a
population density of almost 16,000 inhabitants / Km2 [4]. Two data sets were used for the
study. One is subset of an SPOT5 scene, recorded on 2005. It is a fusion product of the
panchromatic band (10m spatial resolution), following the homogeneity of urban settlement
complexity high imagery resolution will not give a good results through mathematical
morphology process. The second data set is from an airborne (black and white photographs),
acquired on 1956, average resolution of 32cm spatial resolution, after test reduce pixel size
process already done to obtain 10m resolution for both datasets (see Figure 2).
3. Data Pre-Processing
The analysis of multitemporal/multisensoral remote sensing data sets can only be efficiently
done if the data present itself in a common geometry. Geocoding of the images therefore has
to meet extremely strict requirements if the data obtained at different acquisition dates with
different systems are processed multitemporally in one "data stack". Geocoding of the
individual images of such a data set to the geometry of a topographic map is the most
common procedure to accomplish comparability. However, Due to the lack of GIS data and
digital elevation model, Ortho-rectification for the pair of images could not be achieved.
Image-to-image registration has been carried out so that an identical image coordinate system
could be established for assessment. The overall registration error with 160 reference points
was less than 2 pixels.
Figure 2: SPOT5 scene panchromatic 10m, 2005 (left)
and 10m B&W historical photograph, 1956 (right).
Figure 1: The Autonomous Community of
Catalonia, Spain.
4. Visual Interpretation
A visual interpretation of remote sensing data means not to overlay transparencies on images,
in the way, how conventional airborne photographs were interpreted in former days. In
present days the digital images are mapped by screen digitizing. In spite of the digital image
the interpretation technique is similar to the conventional airborne analogue photograph
interpretation. The advantage of computer aided visual interpretation with geocoded airborne
photographs (digital aerial maps) is the availability of rectified thematic maps. These can be
integrated into a GIS based system and can be combined with computer-aided classification
of settlement structures. The quality of visual interpretation is connected with the skills of the
interpreter. The more the interpreter knows about the landscape that is investigated the more
information will be generated. The general advantage of a conventional visual interpretation is
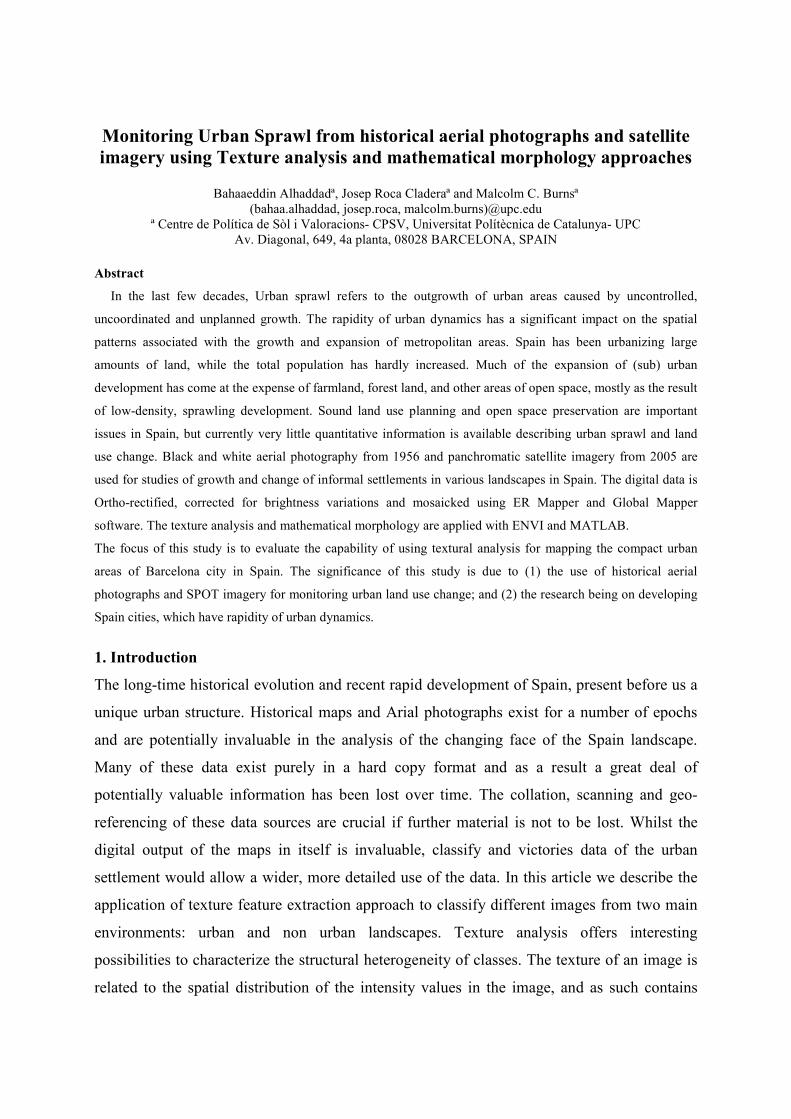
the high accuracy of the results. The pair of SPOT images and Arial Photographs was first
imported into ESRI ArcGIS 9.0 for digitizing the boundary of the artificial areas. After
completing image digitization, the GIS polygon layer representing the urban zones of the
above municipalities in 2005 was clipped by the one of 1956. The resulting GIS polygon layer
thus represents the change areas. The areas of these zones were calculated for assessing the
quality of the other image texture analysis
and classification approaches later. The
drawback of this methodology is the labour
intense and time-consumption, which may
take hours for the entire digitization process.
Figure 3 demonstrates the limits of visual
settlement structure interpretation with
conventional aerial map.
5. Working with texture analysis
Texture analysis can be categorized into structural level and statistical level textures and this
study would focus on the latter approach as it is more suitable for classification of natural
scenes, especially in satellite imagery [5]. In the statistical approach, the stochastic properties
of the spatial distribution of grey level (GL) in the image are characterized. The resultant
texture measures include statistics of grey level histograms, and autocorrelation and auto
regression models [6]. Amongst all popular algorithms, Grey Level Co-occurrence Matrix
(GLCM) is the widely adopted one [1]. First order and second order texture measures on
GLCM consists of Standard Deviation, Range, Minimum, Maximum and Mean. The second
Figure 3: digitized images for year 2005 (left) and 1956
(right).
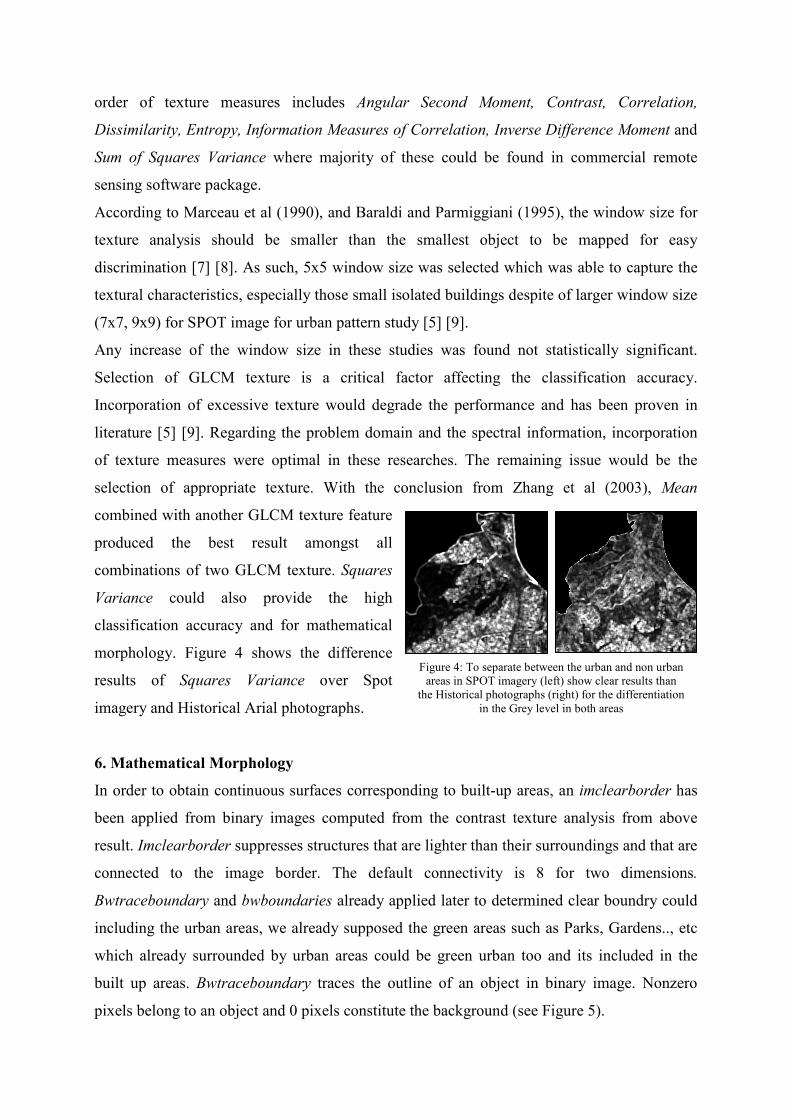
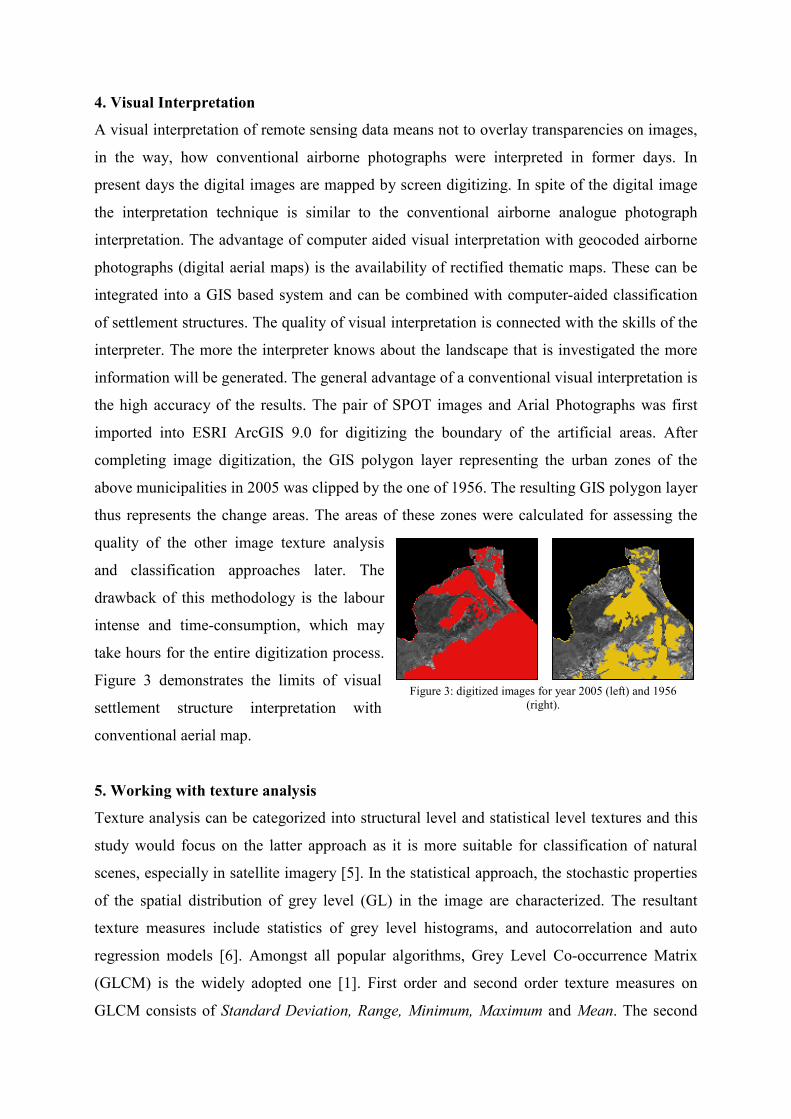
Figure 4: To separate between the urban and non urban
areas in SPOT imagery (left) show clear results than
the Historical photographs (right) for the differentiation
in the Grey level in both areas
order of texture measures includes Angular Second Moment, Contrast, Correlation,
Dissimilarity, Entropy, Information Measures of Correlation, Inverse Difference Moment and
Sum of Squares Variance where majority of these could be found in commercial remote
sensing software package.
According to Marceau et al (1990), and Baraldi and Parmiggiani (1995), the window size for
texture analysis should be smaller than the smallest object to be mapped for easy
discrimination [7] [8]. As such, 5x5 window size was selected which was able to capture the
textural characteristics, especially those small isolated buildings despite of larger window size
(7x7, 9x9) for SPOT image for urban pattern study [5] [9].
Any increase of the window size in these studies was found not statistically significant.
Selection of GLCM texture is a critical factor affecting the classification accuracy.
Incorporation of excessive texture would degrade the performance and has been proven in
literature [5] [9]. Regarding the problem domain and the spectral information, incorporation
of texture measures were optimal in these researches. The remaining issue would be the
selection of appropriate texture. With the conclusion from Zhang et al (2003), Mean
combined with another GLCM texture feature
produced the best result amongst all
combinations of two GLCM texture. Squares
Variance could also provide the high
classification accuracy and for mathematical
morphology. Figure 4 shows the difference
results of Squares Variance over Spot
imagery and Historical Arial photographs.
6. Mathematical Morphology
In order to obtain continuous surfaces corresponding to built-up areas, an imclearborder has
been applied from binary images computed from the contrast texture analysis from above
result. Imclearborder suppresses structures that are lighter than their surroundings and that are
connected to the image border. The default connectivity is 8 for two dimensions.
Bwtraceboundary and bwboundaries already applied later to determined clear boundry could
including the urban areas, we already supposed the green areas such as Parks, Gardens.., etc
which already surrounded by urban areas could be green urban too and its included in the
built up areas. Bwtraceboundary traces the outline of an object in binary image. Nonzero
pixels belong to an object and 0 pixels constitute the background (see Figure 5).

Bwboundaries traces the exterior boundaries of objects, as well as boundaries of holes inside
these objects, in the binary image BW. bwboundaries also descends into the outermost objects
(parents) and traces their children (objects
completely enclosed by the parents). Figure 6
illustrates these components.
Mathematical Morphology (MM) is based on
the set theory combined with topological
notions (like continuity or limit of a phase).
The general principle is to compare the object
studied with an object of known form, named
structuring element [10] [11]. Several
algorithms of MM were explored in order to
extract built-up regions from a SPOT image
[12] As a MATLAB result, all the surfaces
which are not materialized by any pixel on the
marker image will disappear (see Figure 7).
7. Result and Discussion
We compared the results of these approaches based on visual quality and change detection.
Figures 8 shows extracts of the urban areas derived from texture analysis and mathematical
morphology approaches as aforementioned. The majority of the results match the geometry
and appearance of the flooding zones
derived from image interpretation.
Table 1 shows the result of the
computed urban areas derived from
image analysis methods with inclusion
of the two datasets: PAN image and historical photographs in Variance in texture channel.
GLCM and MM / Km2 Digitized areas / Km2
Spot 2005 80 km2 81 km2
photos 1956 47 km2 52 km2
2005-1956 33 km2 29 km2
Figure 5: Bwtraceboundary, P will specify the row and
column coordinates of the point on the object boundary
where tracing start.
Figure 6: Bwboundaries, The image must be a binary
image where nonzero pixels belong to an object and 0
pixels constitute the background
Figure 7: the damage between GLCM and MM five a
good urban detection for years 2005 (left) and 1956
(right).
Table 1: Urban Areas due to Barcelona municipality Discharge in
Km Square

1956 2005
A) GLCM and MM
1956 2005
B) Interpretation
2005-1956 2005-1956
C)Change Detection
Figure 8: Result of PAN and Historical Imagery
using a) GLCM and MM. b) Interpretation C) Change
detection.
The area delineated by visual interpretation
method is regarded as the reference for the
comparison. Table 1 shows also the difference
change detection in unite square comparing to
the visual interpretation result.
Total municipality area is 101 km2, the area
derived from GLCM and MM for Spot
panchromatic imagery is 80 Km square,
which is approximately similar as the
reference of the visual interpretation. In terms
of GLCM and MM for historical photographs
seems to be less than the reference 47 km2.
The difficulty encountered in obtaining such
results is due to fact that, at this scale, even
the exhaustive use of relevant iconic criteria
such as grey level texture, used to recognise
built-up areas, do not provide as robust results
as it could be obtained for the extraction of
cultivates areas, forest and hydrographic
networks. The entity of built-up objects
corresponds to a very large variety of
elements in the image. For example, accuracy
of the results is not so good when considering
small built-up areas on rural zones, where
construction may be more dispersed or where there is a too small contrast between buildings
and their surrounding. The results and the analysis reveal that: firstly, the visual image
interpretation approach are not efficient in terms of processing time. However, visual image
interpretation is the most accurate technique to compute the flooding areas. To meet the
requirement for the area computation of the flooding areas, it was found that GLCM and MM
produced the closest result to the visual interpretation. Although the accuracy of urban
sattelment is high enough to be accepted.

References
[1] Haralick, R. M., Shanmugan, K., and Dinstein, I., 1973. “Textural Features for Image
Classification”. IEEE Transactions on Systems, Man and Cybernetics, 3 (6), 610-621.
[2] Marceau, D.J.; Howarth, P.J.; Dubois, J.M.; Gratton, D.J. 1990. “Evaluation of the grey-
level co-occurrence matrix method for land-cover classification using SPOT imagery”.
IEEE Transactions on Geoscience and Remote Sensing, 28: 513-519.
[3] Haralick 1979. Haralick, R.M., 1979. Statistical and structural approaches to texture. Proc.
IEEE 67 5, pp. 786–804
[4] Campaign against the Quart Cinturó of Barcelona, Land Use Planning and Transformation
of Space, the Barcelona fourth ring road project, Sabadell, Barcelona, Spain.
http://ccqc.pangea.org/eng/ocuterri/tereng.htm (accessed 1991)
[5] Shaban, M.A., and Dikshit, O., 2001. “Improvement of Classification in Urban areas by
the Use of Textural Features the Case Study of Lucknow City”, Uttar Pradesh.
International Journal of Remote Sensing, 22(4), pp. 565-593.
[6] Narasimha Rao, P.V., Sesha Sai, M.V.R., Sreenivas, K., Krishna Rao, M.V., Rao, B.R.M.,
Dwivedi, R.S., and Venkataratnam, L., 2002. “Textural Analysis of IRS 1D Panchromatic
Data for Land Cover Classification”. International Journal of Remote Sensing, 23(17), pp.
3327- 3345.
[7] Marceau, D.J., Howarth, P.J., Dubois, J-M. M. and Gratton, D.J. 1990. “Evaluation of the
Grey-Level Co-Occurrence Matrix Method for Land Cover Classification using SPOT
Imagery”. IEEE Transactions Geoscience and Remote Sensing, 28(4), pp. 513-519.
[8] Baraldi, A., and Parmiggiani, F., 1995. “An Investigation of the Textural Characteristics
Associated with Gray Level Cooccurrence Matrix Statistical Parameters”. IEEE
Transactions on Geoscience and Remote Sensing, 33(2), pp. 293-304.
[9] Zhang, Q., Wang, J., Gong, P., and Shi, P., 2003. “Study of Urban Spatial Patterns from
SPOT Panchromatic Imagery using Textural Analysis. International Journal of Remote
Sensing”, 24(21), pp. 4137-4160.
[10] Coster and Chermant, 1989. M. Coster and J.L. Chermant, “Précis d'Analyse d'Images”.
In: , C.N.R.S.,, Paris (1989), p. 560.
[11] Serra, 1982. J. Serra, “Image Analysis and Mathematical Morphology”. In: , Academic
Press, New York (1982), p. 610.
[12] DAVIE, M.F. and DROUOT, J-L., 2000, “La périphérie urbaine et les extensions de la
ville de Beyrouth (Liban): étude par traitement d'une image SPOT”, Cybergeo : Revue
Européenne de Géographie, No.157, 25/04/00. (http://www.cybergeo.presse.fr).

Acknowledgements
The authors of this paper gratefully acknowledge the research funding provided by both the
European Commission through the ERDF, by way of the INTERREG IIIB Programme andthe
Spanish Ministry of Science and Technology (ref. BIA2003-07176). Thanks to the referees
for their help.