Nutritional composition of Neglected Underutilized Green ...

Sydney, AUSTRALIA | Beijing, CHINA | Hyderabad, INDIA | London, UK
Affiliated with
Monitoring the nutritional composition of foods to
improve the global food supply
Dr Elizabeth Dunford
IUNS 20th International Congress of Nutrition, Granada, Spain
September 2013

2
Health benefits of improving the food supply
• Poor diet major contributor to
chronic disease worldwide
• Current food supply has excess
levels of nutrients total fat,
saturated fat, sugar and salt in
large serves of energy-dense
foods
• Driving global epidemics of
obesity, high blood pressure,
diabetes and dyslipidaemia,
leading to ↑ heart attacks, stroke
and cancer

Processed foods
Processed foods are major contributors to
dietary salt, sugar, saturated fat and energy
intakes both in developed and increasingly in
developing countries
Some multinational food companies have
started to reformulate a number of products,
however a monitoring system is key to
targeting reformulation strategies and to
monitoring progress
3

Outstanding scientific credibility
4
The importance of branded food
composition data

5 5
Sodium per serve: 155mg
Sodium per serve: 55mg
65% less salt!
Example – same brand in same country
Product
higher in
salt
Product
lower in
salt

6 6
USA: Sodium per 100g: 900mg
Australia: Sodium per100g: 620mg
35% less salt!
Example – same product in different countries
Product higher
in salt Product lower
in salt

7 7
Sodium per 100g: 600mg Sodium per 100g: 400mg
35% less salt!
Example – white bread – different
brands, same country
Brand
higher in
salt
Brand
lower in
salt
8
Typical
Australian
daily food
intake
• By switching
to different
brands of
processed
foods, 5g of
salt can be
removed
from the
daily diet

Global Food Monitoring Group
Aim To bring together data on nutrient information (or lack thereof) for processed foods that can be used to drive national and international improvements in the food supply
Design
• Collect nutrient information for processed food
products in each country (direct from manufacturer,
through analysis or from product labels)
• Enter data into a central system
• Compare information by:
• product and/or brand
• category
• manufacturer
• country
• over time
9
Established in January 2010

Countries involved in the Global Food Monitoring Group
countries in The Americas
10
•Argentina
•Australia
•Bangladesh
•Barbados
•Brazil
•Canada
•Chile
•China
•Costa Rica
•Cuba
•Ecuador
•Fiji
•France
•Guam
•Guatemala
•India
•Malaysia
•Mexico
•Mongolia
•New Zealand
•Panama
•Peru
•Singapore
•Solomon
Islands
•South Africa
•Spain
•The
Netherlands
•Tonga
•UK

What has been done so far?.......
11
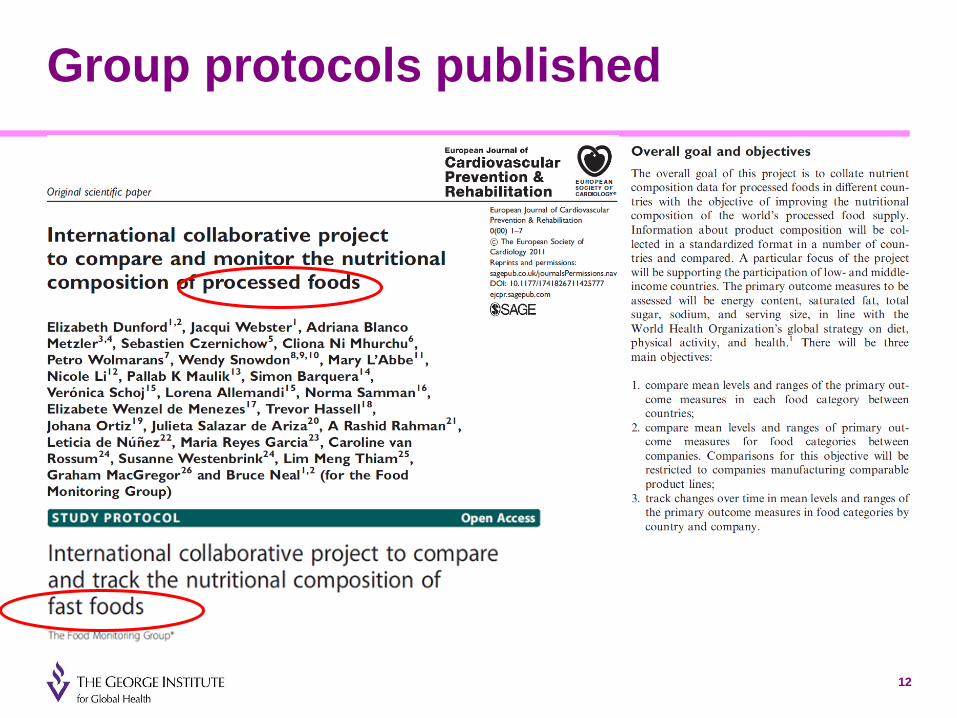
Group protocols published
12

Protocol for collecting data on processed foods
for Latin American countries
FIC-Argentina have developed a
guidance document for Latin
American countries in Spanish to
undertake data collection in line with
the global protocol
13 http://www.ficargentina.org/images/stories/biblioteca/guia_investigacion_alimentacion.pdf
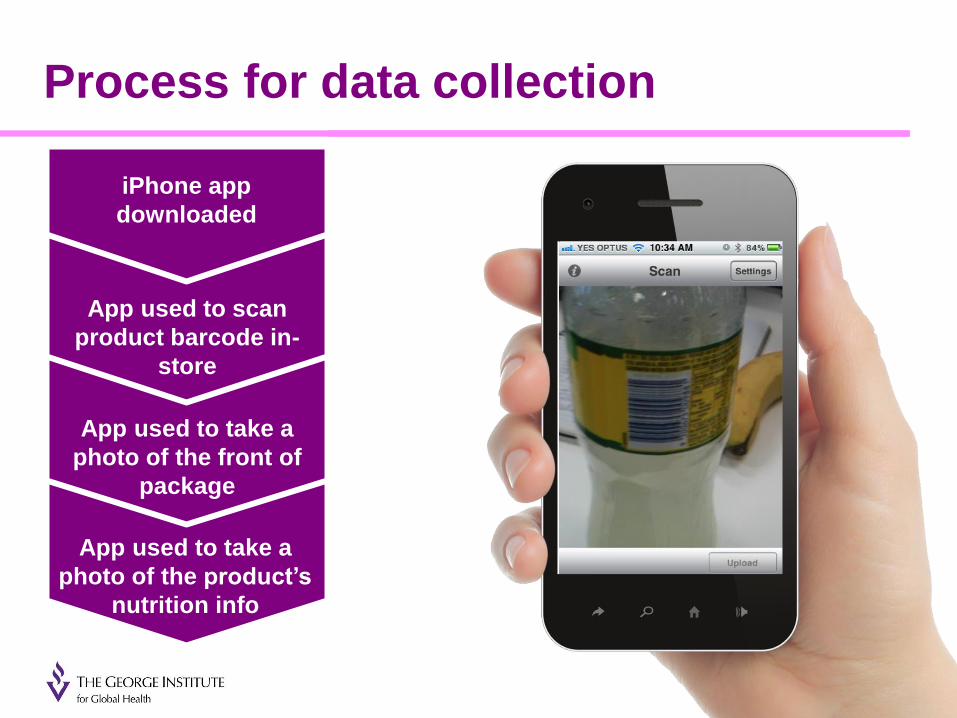
App used to take a
photo of the product’s
nutrition info
App used to take a
photo of the front of
package
App used to scan
product barcode in-
store
iPhone app
downloaded
Process for data collection

Photos of food products uploaded and nutrition
information entered into the FMG database
Photos uploaded
from iPhone
Photos stored in
Amazon cloud
Photos downloaded
to central data entry
system, data entered
by team in India
15

Branded food products currently in database
16
Country Number of products
Australia 60,000+
New Zealand 12,829
Costa Rica 5,079
Argentina 2,405
Canada 16,500+
China 11,157
India 8,700
UK 8,500 (+120,000 Brandbank)
Fiji 1,500
TOTAL 126,670 (+120,000 Brandbank)

Building capacity in Latin America to collect food composition data:
Training seminar held at the Latin American Nutrition Congress
Havana, Cuba -14 November 2012
17
Training items covered:
• Data collection using smartphone
technology in the supermarket
• Uploading and management of photos
• Creation of food categorisation system
appropriate to each country
• Data entry, checking and analysis Attended by 33 participants from
15 Latin American countries

UK and Australia comparison
18
Global branded food database was used to compare sodium levels in UK and Australia Publication: Ni Mhurchu C, Capelin C, Dunford EK, Webster JL, Neal BC, Jebb SA. Sodium content of processed foods in
the United Kingdom: analysis of 44,000 foods purchased by 21,000 households. Am J Clin Nutr. 2010:93(3);594-600.

19
In India, information on food labels was used to examine the presence of labelling
Figure shows proportion of
products from major food companies
meeting local (grey) and CODEX (black)
requirements for nutrition labelling

Regional Comparisons Example – Pacific Islands
20
Category Tonga Australia Solomon
Islands Fiji Mongolia
Soy sauce 3054 (880-7203)
6585 (5665-8420)
4017 (1180-7190)
5900 (5400-6800)
-
Tomato sauce 855 (505-1118)
989 (20-1350)
1004 (890-1118)
835 (490-1200)
-
Instant noodles 365 (235-900)
399 (190-1380)
- 342 (240-462)
1586 (1117-2140)
Canned meat 795 (625-1070)
621 (220-1179)
595 (530-630)
615 (550-645)
937 (542-1411)
Canned tuna - 384 (60-1032)
415 405 (224-564)
479 (257-558)
Sanitarium
Skippy Cornflakes 680 780 - - -
Sanitarium
Weet-Bix 285 290 - - -
We compared similar foods in different countries in one region
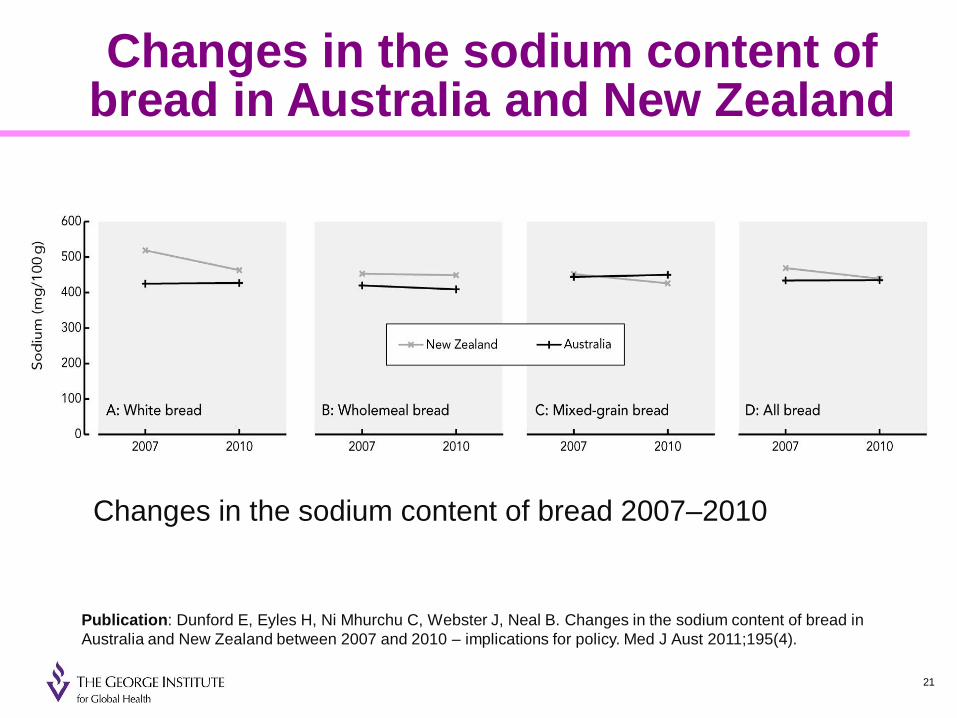
Changes in the sodium content of bread in Australia and New Zealand
21
Changes in the sodium content of bread 2007–2010
Publication: Dunford E, Eyles H, Ni Mhurchu C, Webster J, Neal B. Changes in the sodium content of bread in
Australia and New Zealand between 2007 and 2010 – implications for policy. Med J Aust 2011;195(4).

Comparison of sodium content of fast food products in 6 countries
Sodium per 100g
3 fold variation in fries
4 fold variation in chicken nuggets
5 fold variation in salads
Sodium per serve
Marked variation, reflecting non-standard
serving sizes between countries
>100-fold variation in salads
25-fold variation in pizzas
Results by country
Breakfast in US highest in sodium
(1061mg)
Burgers in Australia (1180mg)
Chicken products in France (994mg)
Sandwiches in Canada (790mg and
1292mg)
Publication: Dunford E, Webster J, Woodward M, Czernichow S, Yuan
WL, Jenner K, Ni Mhurchu C, Jacobson M, Campbell N, Neal C. The
variability of reported salt levels in fast foods across six countries and
opportunities for salt reduction. CMAJ 16 April [Epub ahead of print]. 22

FoodSwitch
The FoodSwitch app
means that for the first
time shoppers can:
• Scan the barcode of a
product to know how healthy
it is
• Switch for healthier food
choices
• Share information about
healthier food choices with
friends
23
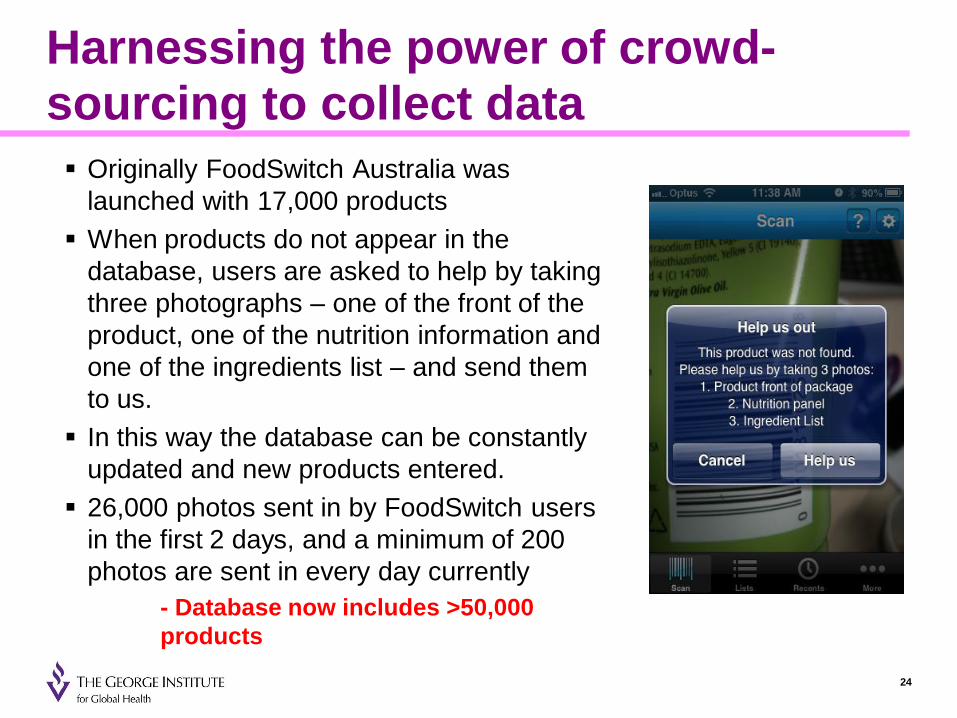
Harnessing the power of crowd-sourcing to collect data
Originally FoodSwitch Australia was
launched with 17,000 products
When products do not appear in the
database, users are asked to help by taking
three photographs – one of the front of the
product, one of the nutrition information and
one of the ingredients list – and send them
to us.
In this way the database can be constantly
updated and new products entered.
26,000 photos sent in by FoodSwitch users
in the first 2 days, and a minimum of 200
photos are sent in every day currently
- Database now includes >50,000
products
24

FoodSwitch – new filters added
25
SaltSwitch
November 2012
GlutenSwitch
May 2013

Countries developing FoodSwitch
New Zealand
Data for 8,000 products collected,
entered and categorised
Application launched for iPhone and
Android in August 2013
An additional 5,000 products sent in by
users in first 2 weeks
UK
Data entry for 8,000 products complete
UK-specific food categorisation system
developed
Brandbank data for 200,000+ foods
obtained
Launch date January 2014
26
China
Data collection underway
Launch date June 2014
India
Data for 8,000 foods complete
Launch date planned for
November 2013
USA, Canada, Argentina
and Costa Rica
In planning phase

Future plans and opportunities
Build capacity in LMICs to monitor the nutritional composition of
processed and fast foods
Partnership work with PAHO in Washington DC
Training of LMICs to utilise smartphone data collection technology
Use Global Branded Food Database to examine differences in
the nutritional content of processed foods in both high and low
income countries
• Identify collaborative projects
• Meeting of the Food Monitoring Group at the International Congress of
Nutrition in September 2013
• Support countries in the adaptation of the FoodSwitch
smartphone application
• Data collection planned for South Africa and USA in 2014
27

The George Institute Contact Details
Elizabeth Dunford Email: [email protected]
Phone: +61 2 8507 2529
Bruce Neal Email: [email protected]
28