Monitoring of Elemental Composition of Honey from Selected ...
148
i Monitoring of Elemental Composition of Honey from Selected Regions of Ghana Using Instrumental Neutron Activation Analysis and Atomic Absorption Spectroscopy A thesis submitted to the DEPARTMENT OF NUCLEAR SCIENCES AND APPLICATIONS, SCHOOL OF NUCLEAR AND ALLIED SCIENCES, COLLEGE OF BASIC AND APPLIED SCIENCES, UNIVERSITY OF GHANA By Randy Boateng 10277981 Bsc. Chemistry (Ghana), 2012 IN PARTIAL FULFILLMENT OF THE REQUIREMENTS FOR THE AWARD OF MASTER OF PHILOSOPHY IN NUCLEAR AND RADIOCHEMISTRY JULY, 2015 University of Ghana http://ugspace.ug.edu.gh
Transcript of Monitoring of Elemental Composition of Honey from Selected ...

i
Monitoring of Elemental Composition of Honey from
Selected Regions of Ghana Using Instrumental Neutron
Activation Analysis and Atomic Absorption Spectroscopy
A thesis submitted to the
DEPARTMENT OF NUCLEAR SCIENCES AND APPLICATIONS,
SCHOOL OF NUCLEAR AND ALLIED SCIENCES,
COLLEGE OF BASIC AND APPLIED SCIENCES,
UNIVERSITY OF GHANA
By
Randy Boateng
10277981
Bsc. Chemistry (Ghana), 2012
IN PARTIAL FULFILLMENT OF THE REQUIREMENTS FOR THE AWARD OF
MASTER OF PHILOSOPHY
IN
NUCLEAR AND RADIOCHEMISTRY
JULY, 2015
University of Ghana http://ugspace.ug.edu.gh
ii
TABLE OF CONTENT
TABLE OF CONTENT ...................................................................................................... ii
DECLARATION ............................................................................................................... vi
DEDICATION .................................................................................................................. vii
ACKNOWLEDGMENT.................................................................................................. viii
LIST OF TABLE ............................................................................................................... ix
LIST OF FIGURES ........................................................................................................... xi
LIST OF ABBREVIATIONS .......................................................................................... xiii
ABSTRACT ...................................................................................................................... xv
CHAPTER ONE ............................................................................................................... 1
INTRODUCTION .............................................................................................................. 1
1.1 Background ............................................................................................................. 1
1.2 Statement of the Problem ......................................................................................... 4
1.3 Objectives of the Study ............................................................................................ 5
1.3.1 General Objective .............................................................................................. 5
1.3.2 Specific Objectives ............................................................................................ 5
1.4 Relevance and Justification ..................................................................................... 6
1.5 Scope and Delimitation .......................................................................................... 8
CHAPTER TWO ............................................................................................................ 10
LITERATURE REVIEW ................................................................................................. 10
2.1 Definition of Honey .............................................................................................. 10
2.2 Composition of Honey .......................................................................................... 10
2.3 Production of Honey by Bees................................................................................. 13
2.4 Classification of Honey .......................................................................................... 14
2.5 Nutritional and Health Benefits of Honey.............................................................. 15
2.5.1 Energy Food .................................................................................................... 15
2.5.2 Sweetener......................................................................................................... 15
2.5.4 Skin Care ......................................................................................................... 16
2.5.5 Cough Suppressant .......................................................................................... 16
University of Ghana http://ugspace.ug.edu.gh

iii
2.5.6 Source of Antioxidants .................................................................................... 16
2.5.7 Children Nutrition............................................................................................ 17
2.6 The Honey Industry in Ghana ................................................................................ 18
2.6.1 Traditional Test for Determining the “Purity” of Honey ................................ 18
2.6.2 Production Levels and Trends ......................................................................... 19
2.7 Possible Contaminants and Toxic Compounds in Honey ...................................... 21
2.7.1 Heavy Metals .................................................................................................. 21
2.7.2 Classification of Heavy Metals Based on Their Importance .......................... 22
2.7.3 Occurrence and Toxicity of Selected Heavy Metals ...................................... 23
2.7.3.1 Arsenic (As) .................................................................................................. 23
2.7.3.2 Lead (Pb) ...................................................................................................... 24
2.7.3.3 Cadmium (Cd) .............................................................................................. 25
2.7.3.4 Chromium (Cr) ............................................................................................. 26
2.7.3.5 Mercury (Hg) ................................................................................................ 26
2.7.3.6 Copper (Cu) .................................................................................................. 27
2.7.3.7 Zinc (Zn) ...................................................................................................... 28
2.7.3.8 Manganese (Mn) ........................................................................................... 28
2.7.3.9 Vanadium (V) ............................................................................................... 29
2.7.3.10 Cobalt (Co) ................................................................................................. 30
2.8 Studies on the Composition of Honey.................................................................... 31
2.9 Neutron Activation Analysis Technique ................................................................ 35
2.10 Atomic Absorption Spectroscopy Analysis Technique ....................................... 38
CHAPTER THREE ........................................................................................................ 40
MATERIALS AND METHODS ...................................................................................... 40
3.1 Honey Sample Collection Sites .............................................................................. 40
3.2 Social Experiment (Questionnaire Administration) ............................................... 43
3.3 Physicochemical Analysis ...................................................................................... 43
3.3.1 Apparatus ......................................................................................................... 43
3.3.2 Instruments ...................................................................................................... 44
3.3.3 Experimental Procedure ................................................................................. 44
3.3.3.1 Preparation of 10% (w/v) Honey Solution .................................................. 44
University of Ghana http://ugspace.ug.edu.gh
iv
3.3.3.2 Determination of pH ..................................................................................... 44
3.3.3.3 Determination of Electrical Conductivity ..................................................... 44
3.3.3.4 Determination of Relative Density (Specific Gravity) ................................. 45
3.4 Determination of Heavy/Trace Metals ................................................................... 46
3.4.1 Instrumental Neutron Activation Analysis ...................................................... 46
3.4.2 Instrumentation ................................................................................................ 46
3.4.3 Standard Reference Materials ......................................................................... 47
3.4.4 Apparatus ......................................................................................................... 47
3.4.5 Procedure for Sample Preparation ................................................................... 47
3.4.6 Irradiation of samples and standards ............................................................... 48
3.4.7 Measurement of γ-radiation Intensity (Counting) ........................................... 48
3.4.8 γ-ray Spectrum Acquisition and Quantification .............................................. 49
3.4.9 Calculation of Concentration .......................................................................... 49
3.4.10 Validation of the INAA Technique ............................................................... 50
3.5 Determination of Pb, Cr, Co and Fe Using Atomic Absorption Spectroscopy ..... 50
3.5.1 Instrumentation ............................................................................................... 50
3.5.2 Chemicals and Standards ................................................................................. 51
3.5.3 Procedure for Digestion of Samples with the Hot Plate .................................. 51
3.5.4 Chemical Reactions that Occurred During Digestion ..................................... 52
3.5.5 Calibration of Atomic Absorption Spectrophotometer ................................... 53
3.5.6 Determination of Concentration of Honey Sample ......................................... 54
3.5.7 Calculation of Concentration ........................................................................... 55
3.6 DATA ANALYSIS ............................................................................................... 56
CHAPTER FOUR ........................................................................................................... 58
4.0 RESULTS AND DISCUSSION ................................................................................ 58
4.1 Response From Administered Questionnaires ....................................................... 58
4.2 Physicochemical Studies ........................................................................................ 60
4.2.1 pH of Honey ................................................................................................... 60
4.2.2 The Electrical Conductivity of Honey ............................................................. 63
4.2.3 The Specific Gravity of Honey ....................................................................... 64
4.3 Results of Elemental Concentration Determination ............................................ 64
University of Ghana http://ugspace.ug.edu.gh
v
4.3.1 Validation of INAA Results ........................................................................... 64
4.3.2 Elemental Content of Honey from the Three Regions of Ghana .................. 66
4.3.3 Elemental Concentrations of Honey from Brong Ahafo Region ................... 71
4.3.4 Elemental Concentrations of Honey from Ashanti Region ................................ 77
4.3.5 Elemental Concentrations of Honey from Greater Accra Region...................... 85
4.4 Comparison of Elemental Compositions of Ghanaian Honey at the Various
Sampling Site ................................................................................................................ 91
4.5 Variations of Metal Content of Ghanaian Honey as it goes Through the Various
Processes ....................................................................................................................... 92
4.6 Comparison of Elemental Composition of Honey from the Three Regions Studied
With Other Locations .................................................................................................... 98
CHAPTER FIVE .......................................................................................................... 101
5.0 CONCLUSIONS AND RECOMMENDATIONS ................................................ 101
5.1 CONCLUSIONS ................................................................................................. 101
5.2 RECOMMENDATIONS ................................................................................... 102
LIST OF REFERENCES ............................................................................................. 104
APPENDIX ..................................................................................................................... 116
APPENDIX A ............................................................................................................. 116
APPENDIX B ............................................................................................................. 118
APPENDIX C ............................................................................................................. 123
APPENDIX D1 ........................................................................................................... 126
APPENDIX D2 ........................................................................................................... 129
University of Ghana http://ugspace.ug.edu.gh

vi
DECLARATION
I, Randy Boateng, do declare hereby that the work presented in this dissertation was carried
out by me at the Department of Nuclear Sciences and Applications, School of Nuclear and
Allied Sciences, College of Basic and Applied Sciences, University of Ghana, Legon,
under the supervision of Dr. Charles Kofi Klutse and Dr. Dennis Kpakpo Adotey.
Signed........................................
RANDY BOATENG
(STUDENT)
DATE.......................................
Signed......................................... Signed............................................
DR. CHARLES K. KLUTSE DR. DENNIS K. ADOTEY
(SUPERVISOR) (SUPERVISOR)
DATE......................................... DATE............................................
University of Ghana http://ugspace.ug.edu.gh

vii
DEDICATION
This work is dedicated to my Father, Mr. Twene Adane and my Mother, Mrs. Elizabeth
Durowaa Boateng whose prayers, encouragement, assistance and hard work have brought
me this far.
University of Ghana http://ugspace.ug.edu.gh

viii
ACKNOWLEDGMENT
My sincere gratitude goes to the Almighty God Jehovah for taking me through this
institution and for his guidance in making this project a success.
I am also grateful for the good will and generosity of my supervisors Dr. Charles Kofi
Klutse and Dr. Dennis Kpakpo Adotey for their excellent work done in supervising me
throughout this work, and the strong sense of fairness and openness they exhibited as
lecturers. It is through them that the nucleus of this work was drawn.
I am very grateful to the West African Agricultural Productivity Programme (WAAPP) for
financially sponsoring my studies.
I also wish to extend a depth of gratitude to Mr. Twene Adane, Mrs. Elizabeth Boateng,
Twene Adu-Asare, Cindy Nketia and Barbara Efua Buckman, who supported and prayed
for me to come this far.
I will also like to thank all the staff at National Nuclear Research Institute (NNRI),
especially Mr. N. S. Opata, Mr. Isaac Baidoo and Mr. Ekow Quagraine who assisted me in
analysing my samples at the neutron activation analysis (NAA) laboratory of GAEC.
Thanks also to Mr. Nash Bentil, Mr. Michael Ackah and Mr. Sheriff Enti-Brown at the
atomic absorption spectrometry laboratory, GAEC, for their support and perceptive advice.
Finally, I would like to acknowledge the debt I owe my course mates for their immense
contribution towards this work especially David Larbi, John Andrew Gyenfie and Suraj
Issaka. Their commitment, ideas and enthusiasm motivated me a lot in this work.
University of Ghana http://ugspace.ug.edu.gh

ix
LIST OF TABLES
Table 2.1: Honey Composition (data in g/100 g) ............................................................ 12
Table 2.2: Estimated Production Levels of Honey in Ghana ........................................... 19
Table 2.4: The Toxicity of Certain Heavy/Trace Metals to Humans ............................... 31
Table 3.1: The sampling sites of the honey samples in the various regions ................... 41
Table 3.2: Irradiation and Counting Schemes ................................................................. 48
Table 3.3: Standards Prepared for the Calibration of the AAS ....................................... 54
Table 3.4: Flame AAS Instrument parameter for Pb, Fe, Cr, Co Analysis ..................... 55
Table 3.6: Detection Limit of Elements Determined by AAS ........................................ 56
Table 4.1: The pH, Electrical Conductivity, and Specific Gravity .................................. 62
Table 4.2: Comparison of pH of Ghanaian honey with that from other parts of the world
........................................................................................................................................... 63
Table 4.3: Comparison of Measured and Prepared Standards - Results of 10 mg/L and 20
mg/L Single Standard Elements used for the Validation .................................................. 65
Table 4.4: Mean Elemental Composition of Honey from Brong Ahafo .......................... 68
Table 4.5: Mean Elemental Composition of Honey from Ashanti region ....................... 69
Table 4.6: Mean Elemental Composition of Honey from Greater Accra ........................ 70
Table 4.7: Accepted levels of some parameters in honey ................................................ 94
Table 4.8: Comparison of Elemental Composition of Honey from the three Regions
Studied with other Locations .......................................................................................... 100
Table B1: Results of the elemental composition of honey from the Brong Ahafo region
......................................................................................................................................... 118
Table B2: Results of the elemental composition of honey from the Ashanti region ..... 120
University of Ghana http://ugspace.ug.edu.gh

x
Table B3: Results of the elemental composition in honey from the Greater Accra region
......................................................................................................................................... 122
Table C1: P- Values calculated for the variations of the elements in the samples (Brong
Ahafo Region) ................................................................................................................. 123
Table C2: P- Values calculated for the variations of the elements in the samples (Ashanti
Region) ............................................................................................................................ 124
Table C3: P- Values calculated for the variations of the elements in the samples (Greater
Accra Region) ................................................................................................................. 125
University of Ghana http://ugspace.ug.edu.gh

xi
LIST OF FIGURES
Figure 2.1: Gender distribution of beekeepers in Ghana (Source: SNV Ghana, 2010) ... 21
Figure 2.3: A typical Gamma ray Spectra (source; Hamidatou et al., 2013) ................... 38
Figure 3.1: Sample collection chart ................................................................................ 40
Figure 3.2: Map of Ghana showing the sampling sites ................................................... 42
Figure 4.1: Response to questions about the location apiaries ....................................... 58
Figure 4.2: Response to questions about addition of additives ....................................... 59
Figure 4.3: Response to questions about packaging materials used for storing honey ... 60
Figure 4.4: Variation of Pb concentrations in honey from selected sampling sites ......... 67
Figure 4.5: Concentration of Co in all the samples analysed.......................................... 72
Figure 4.6: Concentration of Pb in all the samples analysed .......................................... 73
Figure 4.7: Concentration of Cr in all the samples ......................................................... 75
Figure 4.8: Concentration of Fe in all the samples analysed .......................................... 76
Figure 4.9: Concentration of Mg in all the samples analysed ......................................... 79
Figure 4.10: Concentration of V in all the samples analysed ......................................... 80
Figure 4.11: Concentration of Cu in all the samples analysed........................................ 81
Figure 4.12: Concentration of Al in all the samples analysed ........................................ 82
Figure 4.13: Concentration of Ca in all the samples analysed ........................................ 87
Figure 4.14: Concentration of Mn in all the samples analysed ....................................... 88
Figure 4.15: Concentration of K in all the samples analysed ......................................... 89
Figure 4.16: Concentration of Na in all the samples analysed........................................ 90
Figure A1: Linear Regression Line for Calibration of AAS for Analysis of Co ........... 116
Figure A2: Linear Regression Line for Calibration of AAS for Analysis of Pb ........... 116
University of Ghana http://ugspace.ug.edu.gh

xii
Figure A3: Linear Regression Line for Calibration of AAS for Analysis of Cr ............ 117
Figure A4: Linear Regression Line for Calibration of AAS for Analysis of Fe ............ 117
University of Ghana http://ugspace.ug.edu.gh

xiii
LIST OF ABBREVIATIONS
A/R Ashanti Region
AAS Atomic Absorption Spectroscopy
AES Atomic Emission Spectroscopy
ANOVA Analysis of Variance
AP After Processing
ATSDR Agency for Toxic Substances and Disease Registry
B/A Brong Ahafo Region
BP Before Processing
EPA Environmental Protection Agency
EU European Union
FAO Food and Agricultural Organisation
FDA Food and Drugs Authority
G/R Greater Accra Region
GSA Ghana Standard Authority
GHARR-1 Ghana Research Reactor -1
HPGe High Purity Germanium
IARC International Agency for Research on Cancer
INAA Instrumental Neutron Activation Analysis
LSD Least Significant Difference
MoFA Ministry of Food and Agriculture
NHB National Honey Board
NIST National Institute of Science and Technology (USA)
RT Retailers
University of Ghana http://ugspace.ug.edu.gh

xiv
SNV Stichting Nederlandse Vrijwilligers (Netherlands
Development Organisation, Ghana)
TRXRFS Total Reflection X-ray Florescence spectrometer
US NRC United States Nuclear Regulatory Commission
USA United States of America
WHO World Health Organisation
University of Ghana http://ugspace.ug.edu.gh
xv
ABSTRACT
Honey is a sweet, thick and viscid fluid collected from beehives and usually found in cells
of the honey comb. It is produced from nectar collected from various flowers by honeybees
and processed. Among the important uses, pure and undiluted honey serves as natural
sweetener and contains a broad variety of vitamins for human consumption. Due to its
global demand, monitoring of the quality of honey is of great significance. In this study,
honey samples were collected systematically from farmers and retailers in the Brong
Ahafo, Ashanti and Greater Accra regions of Ghana. The sampling was done along the
farmer-to-trader channels, to assess the quality of honey produced from various regions
and to trace the sources of elemental contamination. Physicochemical studies; pH,
electrical conductivity and specific gravity were done. The levels of selected toxic heavy
metals (Hg, Pb, Cd, V, Cr, As) and essential metals (K, Na, Ca, Mg, Mn, Cu, Fe, Co) in
the honey samples were analysed using instrumental neutron activation analysis (INAA).
Flame atomic absorption spectrophotometry (FAAS) was also employed to determine
elements such as Pb, Co, Cr and Fe. All the honey samples were found to be acidic, with
pH ranging from 3.60 to 6.10. The acidity of honey is significant as it inhibits the growth
of microorganisms. The values agrees favourably with the permitted pH limits of 3.40 to
3.60 for good quality honey, set by the National Honey Board of United States. The
electrical conductivities measured ranged from 11.9 µS/cm to 44.4 µS/cm. The values were
within the acceptable limits set by Ghana Standards Authority and other organizations
(<800 µS/cm). The specific gravity of the honey samples analysed ranged from 1.297 to
2.031. These values were higher than the values (1.2081 to 1.2270) reported in Libyan
University of Ghana http://ugspace.ug.edu.gh

xvi
Honey. However, these values were closer to the average specific gravity (1.425) value
reported in other studies. These variations in the specific gravity may be related to the
differences in the chemical composition of the honey. The results indicated that the metal
contents of the honey were in the order: K > Ca > Na > Mn > Al > Mg > Cu > V > Fe > Pb
> Co > Cr, in the selected sampling sites evaluated in the three regions. The values ranged
from 0.009 – 0.094 mg/kg for Co; 0.010 – 0.423 mg/kg for Pb; 0.010 – 0.423 mg/kg for
Cr; 1.548 – 11.052 mg/kg for Fe; 0.490 – 35.021 mg/kg for V; 4.524 – 288.298 mg/kg for
Cu; 75.697 - 681.236 mg/kg for Mg; 60.159 – 1186.369 mg/kg for Al; 145.668 – 3501.004
mg/kg for Mn; 900.214 – 8277.351 mg/kg for Na; 2.393 – 283.690 g/kg for Ca and 112.933
– 1770.770 g/kg for K. With the exception of Cu, the concentrations of the metals were
below the permitted limits sets by Ghana Standards Authority, Codex Alimentarius and the
Polish Standards. The metal contents of the honey in the various regions considered were
similar. There were significant differences in concentrations in most of the samples as
monitored from one sampling site to the other. Significant differences in concentrations
was also observed as the honey goes through treatment processes. This affirms that the
various processes honey goes through prior to reaching the consumer significantly affects
its composition.
University of Ghana http://ugspace.ug.edu.gh

1
CHAPTER ONE
INTRODUCTION
1.1 Background
Honey is a sweet, thick and viscid fluid collected from beehives and usually found in cells
of the honey comb. It is produced from nectar collected from various flowers by honey
bees and processed. Among the important uses, pure and undiluted honey serves as natural
sweetener and contains a broad variety of vitamins for human consumption (Dustmann,
1993). Food authenticity is of great economic significance for the sectors involved in food
production, marketing and for the consumers, who are looking for guaranteeing the quality
of their food. Honey cannot be an exception in this case (Chalhoub et al., 2007). To ensure
that the consumer rips the intended benefit of honey consumption, the quality of the honey
with regard to its elemental composition and some physicochemical parameters should be
assessed.
Honey has a lot of health benefits for toddlers and children. It helps in faster wound healing,
offers liver protection, sustains energy for longer periods of time and controls cough in
children. It is also used for therapeutic, nutritional, medicinal and cosmetic purposes
(Ajibola et al., 2012). For instance, it is used as an ingredient in numerous manufactured
foods, mainly in cereal based products, for its sweetness, colour, flavour, caramelization,
and viscosity (de Rodrı´guez et al., 2004).
In addition to the vitamins and minerals, honey also contains other substances necessary to
sustain life, including enzymes, proteins, amino acids, minerals, trace elements, aromatic
University of Ghana http://ugspace.ug.edu.gh

2
compounds, polyphenols, and water. It also contains “pinocembrin”, an antioxidant
associated with improved brain functioning. In general, honey contains approximately 70
- 80% sugar, mainly from fructose and glucose (Kucuk et al., 2007; Karaman et al., 2010).
Some of the components in honey are due to the maturation process, which are added by
the bees whiles others are derived from the plants, which in turn, absorb several
components from the environment such as soil, air and water.
Honey is an excellent and widely used food that is popular all over the world. As a result
of its good properties (anti-inflamatory, curative, medicinal and nutritional), honey is
consumed globally. The colour and flavour of honey differ depending on the nectar source.
In general, lighter coloured honeys are mild in flavor, while darker honeys are usually more
robust in flavor. The consumption of honey also differs strongly from country to country.
At present the annual world honey production is about 1.2 million tones, which is less than
1% of the total sugar production. In Africa, though reliable production and trade statistics
on honey do not exist, it is believed that the consumption of honey on the continent far
exceeds production (FAO, 2003).
Due to the variation of botanical and geographical origin, honey differs in appearance,
sensory, perception consistency, characteristics and composition. Its composition and
quality is affected by several environmental factors during production such as weather and
humidity inside the hive, nectar conditions and treatment of honey during extraction,
treatment and storage. The composition of honey even varies with the type of food bees
feed on (Guler et al., 2007).
University of Ghana http://ugspace.ug.edu.gh
3
Minerals or elemental content seem to be good indicators for a classification system of
honey, mainly because they are stable. Bees are estimated to forage on plants growing in a
relatively large area of more than 7 km2. It is because of this large forage area that honey
bees and their products have been proposed as suitable bio-indicators of chemical pollution
(Tuzen et al., 2007). It is known that different unifloral honeys contain varying amounts of
minerals and trace elements (Yilmaz et al., 1999). From the nutritional point of view,
chromium, manganese and selenium are important, especially for children. The elements;
sulphur, boron, cobalt, fluoride, iodide, molybdenum and silicon can be important in
human nutrition too, although there are no recommended daily intake values proposed for
these elements (Bogdanov et al., 2008).
The evaluation of heavy metals content in honey has a two-fold significance: the toxicity
of these metals and the consequent necessity to develop adequate analytical procedures for
their monitoring (Tong et al., 1975).
Honey can be characterized based on its chemical, physical or biological properties.
Physicochemical parameters such as electrical conductivity, specific gravity, water
content, free acid and pH can all be used as criteria for characterizing honey (Gomes et al.,
2010). The electrical conductivity of the honey is closely related to the concentration of
mineral salts, organic acids and proteins; and has proved useful for discriminating honeys
of different floral origins (Acquarone et al., 2007). Most honeys are acidic in nature with
low pH between 3.1 and 6.1. This value could be due to the presence of some weak organic
University of Ghana http://ugspace.ug.edu.gh

4
acids primarily gluconic acids, ascorbic acid and even acetic acid. This relatively acidic pH
level prevents the growth of many bacteria (Cui et al., 2008; Kebede et al., 2012).
In this study, elemental composition of honey was monitored from some regions of Ghana.
The monitoring was done on the farmer-to-trader routes to ascertain how botanical origin
and subsequent handling of honey affects its composition prior to reaching the consumer.
1.2 Statement of the Problem
According to the Food and Agricultural Organisation (FAO, 2012), it does not matter
where bees are living – in their own nest built in the wild or in any type of hive – bees
always store clean and perfect honey. The place where bees live has no effect upon the
quality of honey they make. It is only subsequent handling by humans that leads to
reduction in quality.
The type of equipment used to extract honey as well as the quality of the equipment used
to store honey after harvesting are possible sources of honey contamination. For example,
storing honey in galvanize containers can be a major source of zinc contamination
(Bogdanov et al., 2003).
For the uninformed consumer, the important features of honey are its aroma, flavour,
colour and consistency, all of which depend upon the species of plants being foraged by
the bees. However, these factors are not enough in ascertaining the quality of honey. This
University of Ghana http://ugspace.ug.edu.gh
5
is because literature has shown that honey content can vary greatly even within one nation,
let alone between regions and continents (Bibi et al., 2008). Importantly, there is inadequate
published information on the quality and elemental composition of Ghanaian honey.
Ghanaian honey may therefore not be as “pure” as it is always proclaimed by beekeepers
and retailers. It is therefore necessary to do a comprehensive assessment of Ghanaian honey
to ascertain its quality.
In this study, honey samples were collected from farmers and traders in the Brong Ahafo,
Ashanti, and Greater Accra regions of Ghana and monitored along the farmer-to-trader
channels. This was done in order to trace the levels of elemental compositions. The levels
of selected toxic heavy metals (Hg, Pb, Cd, As, V) and essential metals (K, Na, Mn, Al,
Ca, Mg, Fe, Cr, Co, Cu) in the samples were analysed using instrumental neutron activation
analysis and atomic absorption spectroscopy. A physicochemical study was done prior to
metal content analysis of honey.
1.3 Objectives of the Study
1.3.1 General Objective
The study endeavours to assess the quality of honey produced from various regions in
Ghana with respect to variation in elemental composition along farmers-to-traders route.
1.3.2 Specific Objectives
In achieving the primary objective, the following specific objectives were pursued;
University of Ghana http://ugspace.ug.edu.gh

6
a. To evaluate the variation of trace element content in honey from production on the
farm to the market.
b. To investigate the sources of contamination of trace elements and heavy metals in
honey.
c. To investigate how botanical and geographical origin affects the composition of
Ghanaian honey.
d. To generate a useful baseline data for comparative analysis of the elemental levels
of Ghanaian honey with respect to national and international compositional
standards of honey specifications.
1.4 Relevance and Justification
According to the FAO (2012), honey is not a simple commodity with a single, standard
composition. It is a product that is harvested and marketed in nearly every country, yet
there is no single international standard for honey quality. Nations and market regions set
their own criteria for honey, defining what honey is, and what its composition should be.
The metal composition is geographically significant, as the majority of metals in honey are
transferred from the soil to the plant or flower from which the nectar is collected. Metals
can also be transferred from other sources such as water aerosol spray and atmospheric
pollution. Heavy metals and high concentration levels of essential metals can be toxic both
to man and animals. For example, extensive exposure to zinc chloride can cause respiratory
disorders (Saeed, 1998). Rapid increase in industrialization in Ghana can also lead to
environmental pollution, hence the possibility of increase of these metals in honey.
University of Ghana http://ugspace.ug.edu.gh

7
When the toxic heavy metals present in honey are above the permissible levels, they are
threats to humans, through the possible negative effect of the contaminants. It has been
reported that lead can cause damage of brain, kidney, nervous system and red blood cells.
Other problems caused by heavy metals include metabolic anomalies, respiratory
disorders, nausea and vomiting (Hase, 1973; Wotton, 1976, 1978).
In the recent past, news about “contaminated honey” has been circulated by the mass
media. The most recent example is the news about Ghanaian honey diluted with white
sugar and other additives. (www.modernghana.com/generalnews/fakehoneysoldinGhana,
12th March, 2014, 13:56 CET). Such messages will damage the good image of honey.
Thus, it is of utmost importance for beekeepers and retailers to localise and rid honey of
different contamination sources.
The results of physical and chemical measurements and analyses touch on practically every
aspect of modern life. People demand proof that foodstuffs are not adulterated. They feel
threatened by environmental pollution when they cannot perceive pollutants directly with
their own senses and instead picture in their imagination food, water, soil, and air quality
based on a system of threshold values and analytical results. Even our own bodies become
the object of analytical examination when, whether preventatively or in case of actual
illness, we undergo clinical diagnosis (Funk et al., 2007).
Beekeepers and processors in Ghana continue to rely heavily on their own experience and
observation to determine whether their products meet consumer’s expectations. Regarding
quality issues, majority of Beekeepers across the country indicated that their packaged
University of Ghana http://ugspace.ug.edu.gh

8
honey for the market is not certified or analysed. The only test for honey quality in most
cases is based on traditional methods, visual colour and viscosity (thickness). The
elemental profile of honey is therefore significantly three main reasons – for evidence of
provenance, nutritional benefit and toxicological implications.
This research work monitored the composition of Ghanaian honey along the farmer-to-
trader routes to ascertain its quality. The knowledge will be transferred to the bee farmers
and retailers, so that they can produce and sell “clean” bee products respectively. The
findings will also be used to advice beekeepers and retailers on the best ways to handle
their products to reduce the level of contamination. It will also serve as guidelines for some
industries and organizations in formulating policy decisions.
1.5 Scope and Delimitation
Once harvested, honey does not require further processing. On a small scale, simple
equipment as used in other forms of food preparation is adequate: plastic buckets, bowls,
sieves, straining cloths and containers. Honey is a stable commodity with a long shelf life:
if harvested carefully and stored in containers with tight-fitting lids, it will remain
wholesome for several years (FAO, 2012).
This study assesses whether the various processes honey goes through, before it reaches
the consumer affects its composition, and if it does, by how much. The work was carried
out in three of the largest honey producing regions in Ghana (Brong Ahafo, Ashanti, and
University of Ghana http://ugspace.ug.edu.gh
9
Greater Accra). The results were compared with what other researchers have published in
Ghana and elsewhere in the world. Instrumental neutron activation analysis (INAA) and
atomic absorption spectrometry (AAS) were used as analytical techniques. INAA method
has several advantages which include; high sensitivity, high precision and accuracy, little
or no elaborate sample preparation, non-destructive and give multi-element capability. For
the AAS technique, sample preparation is generally simple and frequently involves little
more than dissolution in an appropriate acid. The instrument is also easy to tune and
operate. Elements of interest are trace elements and heavy metals because of their toxicity,
health reasons, honey’s quality assessment, and environmental pollution monitoring.
University of Ghana http://ugspace.ug.edu.gh
10
CHAPTER TWO
LITERATURE REVIEW
2.1 Definition of Honey
Honey is the natural sweet substance produced by honey bees from the nectar of plants or
from secretions of living parts of plants (CODEX, 2001). Honey can also be produced from
excretions of plant sucking insects on the living parts of plants, which honey bees collect,
transform by combining with specific substances of their own, deposit, dehydrate, store
and leave in the honey comb to ripen and mature (CODEX, 2001).
The two types of honey are:
a) Blossom honey or nectar honey
Honey which comes from nectars of plants.
b) Honeydew honey
Honey which comes mainly from excretions of plant-sucking insects
(Hemiptera) on the living parts of plants or secretions of living parts of
plants (CODEX, 2001).
2.2 Composition of Honey
Honey consists essentially of different sugars, predominantly fructose and glucose as well
as other substances such as organic acids, enzymes and solid particles derived from honey
collection. The colour of honey varies from nearly colourless to dark brown. The
consistency can be fluid, viscous or partly to entirely crystallised. The flavour and aroma
vary, but are derived from the plant origin (CODEX, 2001).
University of Ghana http://ugspace.ug.edu.gh

11
Honey may be composed of multiple materials. In addition, honey is one of the most
complex mixtures of carbohydrates produced in nature. In common honey, mono- and di-
saccharides constitute 80–85% (w/w), water is around 15–20% (w/ w) and other organic
compounds and inorganic ions being present to a minor extent (Sanna et al., 2000).
However, the minor components are often of great importance from many points of view.
Honey contains varying amounts of mineral substances, ranging from 0.02 to 1.03 g/100g.
Potassium, with an average of about one third of the total, is the main mineral element, but
there is a wide variety of trace elements (White, 1975).
Research conducted by Bogdanov et al., (2008) at the Swiss Bee Research Centre
(Switzerland) validated the average composition of the nutrients in honey. The overall
composition of honey analyzed is shown in Table 2.1. The carbohydrates were the main
constituents, comprising about 95% of the honey dry weight. Beyond carbohydrates, honey
contains numerous compounds such as organic acids, proteins, amino acids, minerals,
polyphenols, vitamins and aroma compounds. However, it should be noted that the
composition of honey depends greatly on the botanical origin, a fact that has been seldom
considered in the nutritional and physiological studies (Persano and Piro, 2004).
University of Ghana http://ugspace.ug.edu.gh

12
Table 2.1: Honey Composition (data in g/100 g)
Souce: Bogdavov et al., (2008)
The specific mineral composition of honey, as analyzed by White (1975) and Conti (2000)
include: sodium 1.6-17 g/100g, calcium 3-31 g/100g, potassium 40-3500 g/100g,
magnesium 0.7-13 g/100g, phosphorus 2-15 g/100g, zinc 0.05-2 g/100g, copper 0.02-0.6
g/100g, iron 0.03-4 g/100g, manganese 0.02-2 g/100g, chromium 0.01-0.3g/100g,
selenium 0.002-0.01 g/100g.
Other trace elements in honey (mg/100g) also include: aluminium 0.01-2.4, arsenic 0.014
- 0.026, barium 0.01-0.08, boron 0.05 - 0.3, bromine 0.4 - 1.3, cadmium 0 - 0.001, chlorine
0.4 - 56, cobalt 0.1 - 0.35, fluorine 0.41.34, iodine 10-100 (Terrab et al., 2004).
Honey composition Blossom honey Honey dew
Average Range Average Range
Water
Monosaccharides
Fructose
Glucose
Disaccharides
Sucrose
Others
Trisaccharides
Melezitose
Erlose
Others
Undetermined oligosaccharides
Total sugars
Minerals
Amino acids, proteins
Acids
17.2
38.2
31.3
0.7
5.0
<0.1
0.8
0.5
3.1
79.7
0.2
0.3
0.5
15-20
30-45
24-40
0.1-4.8
2-8
0.5-6
0.5-1
0.1-0.5
0.2-0.4
0.2-0.8
3.5-4.5
16.3
31.8
26.1
0.5
4.0
4.0
1.0
3.0
10.1
80.5
0.9
0.6
1.1
15-20
28-40
19-32
0.1-4.7
1-6
0.3-22.0
0.1-6
0.1-6
0.6-2.0
0.4-0.7
0.8-1.5
4.5-6.5
University of Ghana http://ugspace.ug.edu.gh
13
2.3 Production of Honey by Bees
Bees make honey from the nectar that they collect from flowers. Plant saps and honeydew
are also used to a minor extent. Forager honeybees are always female worker bees. After
visiting a flower, the foraging honeybee flies back to its nest that may be in a hollow tree
or other natural cavity, or inside a man-made hive. The nectar that it collected is carried in
its honey sac, a modified part of the gut (FAO, 2012).
Once inside the nest, it regurgitates the fluid and passes it through its mouth to one or more
'house' bees, which in turn swallow it and regurgitate it. As each bee sucks the fluid up
through its proboscis and into its honey sac, a small amount of protein is added while water
is evaporated. The proteins are enzymes, which convert sugars in the nectar into different
types of sugars (FAO, 2012). The liquid travels through a chain of bees in this way before
it is placed in a cell of honeycomb. After the liquid has been placed in the cell, bees
continue to process it, and further water evaporates as they do so (FAO, 2012).
The temperature of the nest near the honey storage area is usually around 35 °C. This
temperature, and the ventilation produced by fanning bees, causes further evaporation of
water from the honey. When the water content is less than 20%, the bees seal the cell with
a wax capping: the honey is now considered 'ripe' and will not ferment. The bees have
prepared for themselves a concentrated food store, packed in minimal space that can be
stored until they need it during any future period when there are no flowers, for example
winter periods. The honey is produced and stored in such a way that it will not significantly
University of Ghana http://ugspace.ug.edu.gh
14
deteriorate in quality – it will not go mouldy, and there will be no problem of fermentation
during storage (FAO, 2012).
2.4 Classification of Honey
Several ways of classifying honey based on its source, mode of extraction, flavor, colour,
consistency and origin have been proposed by different organizations.
According to the US Department of Agriculture (CODEX, 2001), honey can be classified
as;
Liquid honey: honey that is free of visible crystals.
Crystallized honey: honey that is solidly granulated, irrespective of whether
candied, fondant, creamed, or spread.
Partially crystallized honey: honey that is a mixture of liquid honey and
crystallized honey.
Filtered honey: honey of any type that has been filtered to the extent that all or
most of the fine particles, pollen grains, air bubbles, or other materials normally
found in suspension, have been removed.
Strained honey: honey of any type that has been strained to the extent that most
of the particles, including comb, propolis, or other defects normally found in
honey have been removed. Grains of pollen, small air bubbles, and very fine
particles would not normally be removed.
University of Ghana http://ugspace.ug.edu.gh
15
2.5 Nutritional and Health Benefits of Honey
Honey has enormous benefits. Some of its nutritional and health benefits for toddlers,
children and adults include sustained energy for longer period of time, as a sweetener, skin
care, cough suppressant and source of antioxidants (NHB, 2015).
2.5.1 Energy Food
Honey is a source of carbohydrates, providing 17 grams of carbohydrate per tablespoon,
which makes it ideal for working muscles since carbohydrates are the primary fuel the body
uses for energy. Carbohydrates are necessary in the diet to help maintain muscle glycogen,
also known as stored carbohydrates, which are the most important fuel source for athletes
to help them keep going. When honey is eaten before a workout or athletic activity, it is
released into the system at a steady rate throughout the event. Consuming carbohydrates,
such as honey, during a workout helps the muscles stay nourished longer and delays fatigue
(NHB, 2015).
2.5.2 Sweetener
Honey is slightly sweeter than sugar, so less can be used to achieve the same sweetness
intensity. It contains different types of sugar; glucose, sucrose and fructose. When taken,
these sugars are easily digested, and enters the blood stream easily. They supply energy for
longer durations. As a flavor, it does not only imparts a unique flavor to any dish, but it
also balances and enhances the flavor profiles of other ingredients used in a recipe. Honey
acts as a binder and thickener for sauces, dressings, marinades and dips. As a humectant,
University of Ghana http://ugspace.ug.edu.gh

16
it provides and retains moisture to a variety of dishes and can even extend the shelf life of
baked goods (NHB, 2015).
2.5.4 Skin Care
Honey is a humectant, which means it attracts and retains moisture. This makes honey a
natural fit in a variety of moisturizing products including cleansers, creams, shampoos and
conditioners. Manufacturers have used honey in everything from hand lotions and
moisturizers to bar soaps and bubble baths. One reason they use honey is for its
wholesomeness (NHB, 2015)
2.5.5 Cough Suppressant
Honey has been used for centuries to help alleviate some of the symptoms associated with
a common cold. In the year 2007, a study by Penn State College of Medicine research team
found that honey may offer parents an effective alternative to over-the-counter cough
medicine. The study found that a small dose of buckwheat honey given before bedtime
provided better relief of nighttime cough and sleep difficulty in children than no treatment
or dextromethorphan, a cough suppressant found in many over-the-counter cold
medications (NHB, 2015). Apart from irritating cough, honey is also useful in reducing
difficulties associated with swallowing (Ashkin et al., 2013).
2.5.6 Source of Antioxidants
Antioxidants are chemicals that block the activity of other chemicals known as free
radicals. The presence of free radicals and reactive oxygen species are culpable in the
University of Ghana http://ugspace.ug.edu.gh

17
processes of cellular dysfunction, pathogenesis of metabolic and cardiovascular diseases
as well as aging. The consumption of foods and substances rich in antioxidant can protect
the body against these pathological changes and consequently prevent the pathogenesis of
these and other chronic ailments. Researches indicate that honey contains several important
compounds, and these include antioxidants (Al-Waili, 2003; Schramm et al., 2003). The
colour of honey also influences its antioxidant content, as darker honeys are known to have
higher amount than lighter honeys (Frankel et al., 1998; Ajibola et al., 2012).
2.5.7 Children Nutrition
There are anecdotal evidences encouraging the feeding of honey to new born babies by
some customs and traditions. It is now an established fact that feeding honey to infants will
improve memory and growth, reduce anxiety and enhance the children’s performance in
later life. In 2009, Chepulis and coworkers gave scientific credence to this beneficial
practice in behavioural study in animals (Chepulis et al., 2009). They fed 8 weeks old rats
with diet supplemented with either honeydew honey or sucrose, and control group with
sugar-free diet. These workers noted improved spatial memory and reduced anxiety in the
honey-fed rodents better than the other groups over the twelve months trial period. The
authors concluded that early introduction of honey diet is beneficial and can improve
memory loss and cognitive decline associated with aging (Chepulis et al., 2009; Ajibola et
al., 2012). Honey contains several amino acids and vitamins that are very good for physical
development of children.
University of Ghana http://ugspace.ug.edu.gh

18
2.6 The Honey Industry in Ghana
2.6.1 Traditional Test for Determining the “Purity” of Honey
Information obtained through interaction with the honey farmers in the three regions
chosen for the study revealed some traditional methods usually used to test for “pure”
honey. As a way of determining whether water, glucose or any additives have been added
to honey, most traders and consumers of honey in Ghana employ any of these simple tests.
However, these tests are not sufficient enough to ascertain the wholesomeness and quality
of honey, especially with regard to its elemental composition.
Dissolution test: Put a teaspoonful of honey into a glass of water. If the honey does
not dissolve at the bottom of the glass, it is likely “pure” honey
Absorption test: Put a drop of honey on some cotton cloth or a piece of low-grade
paper. If the honey spreads on the paper or seeps through, then it is not “pure”
honey.
Wash test: Put a drop of honey on a cloth and wash it. If there is a stain left, then
it is most likely “fake” honey.
Water content test: There is very little water in honey. Fake honey has higher
water content. Take a piece of bread and put it in the honey. If the bread hardens,
then the honey is most likely “pure”. However, if the bread softens or falls apart
then the honey has additives.
Dip test: Dip a cotton pad or the cotton wick of a candle into a bit of honey, and
shake off the excess. Attempt to light the cotton pad or wick. If it burns easily, then
it probably has no added water but may or may not have other substances added. If
it does not burn or it makes a cracking sound, water may have been added.
University of Ghana http://ugspace.ug.edu.gh

19
2.6.2 Production Levels and Trends
Although, information on the sub-sector is insufficient, it has been observed that honey
production throughout the country has been increasing annually (Table 2.2). For example,
in the Greater Accra region, honey production levels doubled from 7,400 kg in 2004 to
15,300 kg in 2008. Production levels of honey in the Central region increased by about
207%, from 17,900 kg in 2004 to 54,800 kg in 2008. However, in 2007 there were no data
available for production levels of honey in Eastern and Volta regions (SNV Ghana, 2010).
Total honey production in all regions increased from 236,795 kg in 2007 to 428,836 kg in
2008.
Table 2.2: Estimated Production Levels of Honey in Ghana
REGION Total Production (kg)
2007 2008
Greater Accra 11500 15300
Western 20 600 42 900
Central 52 400 54 800
Brong Ahafo 65 205 74 088
Ashanti 46 536 51 961
Eastern - 43 000
Northern 27 727 29 834
Volta - 94 000
Upper West 12 397 12 222
Upper East 10 430 10 731
TOTAL 236 795 428 836
Source; (SNV Ghana, 2010).
University of Ghana http://ugspace.ug.edu.gh

20
The production of beeswax is directly linked to honey production, averaging about 14% of
honey produced. Total bee wax production, therefore, increased from 34,552 kg in 2007 to
60,031 kg in 2008. There are a total of about 52,883 beehives in production in the 10
regions. The Volta region has the highest number of beehives (24,065), followed by
Eastern region (8,000) and Central region (5,400) (SNV Ghana, 2010).
The national average holding is about five beehives per Beekeeper. Based on the number
of beehives and production levels, average annual yield per hive is greater in the Brong
Ahafo (34 kg) and Ashanti (23 kg) regions. The national average yield per hive is about 14
kg per annum (Aidoo, 2005).
In 2008, Ghana’s traditional honey production yield was estimated to be 428 836 kg in one
harvesting season and is growing between 2% and 3% per annum. Based on production
levels and number of hives, the average yield per hive is about 14 kg. However, the yields
per hive in Western region (15 kg), Brong Ahafo (34 kg) and Ashanti (23 kg) regions were
higher compared to Eastern (5 kg) and Volta (4 kg) regions (SNV Ghana, 2010). The
gender distribution of Beekeepers in all ten regions of Ghana is presented in Figure 2.1.
This study was done in Brong Ahafo, Ashanti and Greater Accra regions where most of
the Ghanaian honey are produced.
University of Ghana http://ugspace.ug.edu.gh

21
Figure 2.1: Gender distribution of beekeepers in Ghana (Source: SNV Ghana, 2010)
2.7 Possible Contaminants and Toxic Compounds in Honey
Honey and bee products have the characteristic of being natural, healthy and clean. But
like any other natural food, honey can also be contaminated. This may primarily be due to
the fact that bee products are produced in an environment, polluted by different sources of
contaminants. The main sources of contaminants within the environment, and from
beekeepers are heavy metals, pesticides, antibiotics, radioactivity, bee repellents during
honey harvest (Bogdanov, 2006).
2.7.1 Heavy Metals
The United States Environmental Protection Agency (US EPA, 2011) defines heavy metals
as “any metallic chemical element that has a relatively high density (superior to 5 g/cm3);
most of which are toxic or carcinogenic even at low concentrations, can damage living
0
500
1000
1500
2000
2500
3000
3500
4000N
um
ber
of
bee
kee
per
s
Region
Gender Distribution of beekeepers in Ghana
Male Female
University of Ghana http://ugspace.ug.edu.gh

22
things and tend to accumulate in the food chain: example mercury, cadmium, arsenic, lead
and chromium”.
The fundamental aspect that differentiates heavy metals from other pollutants, like
pesticides, is their introduction into the environment and their environmental fate. Heavy
metals are released in a continuous manner into the environment by various natural and
anthropogenic sources. They do not decay and are characterized by latent toxicity. They
are continuously present in the environment and enter into the biological cycles (Porrini,
et al., 2003). They are predominately transferred as molecules or particulate matter via the
atmosphere, mostly on a large scale. The amounts of anthropogenically derived heavy
metals have increased continuously since the beginning of the industrial revolution
(Komarnicki, 2005). Generally, they do not cause honeybee mortality, but they can be
deposited on the body hairs and taken back to the hive with the pollen, or they might be
absorbed together with the nectar of the flowers, or through the honeydew produced by
aphids (Ruschioni et al., 2013). Air and soil contain heavy metals, mainly from industry
and traffic which can also contaminate the bee colony and its products.
2.7.2 Classification of Heavy Metals Based on Their Importance
Heavy Metals can be classified into two major groups based on their importance;
I. Essential: these are metals vital to at least some organisms (micronutrients). They
are Cu, Co, Ni, Fe, Zn and Mn. Micronutrients helps in the regulation of osmotic
pressure, redox processes and enzyme co-factors. They are also significant in the
preservation of protein structure (Vallee and Auld, 1990). For instance, Zn is an
University of Ghana http://ugspace.ug.edu.gh

23
essential co-factor for numerous enzymatic reactions in the human body. Similarly,
Mg and Cu are all trace elements, which are vital in human diet. However, even
essential metals such as Zn and Cu are toxic at high concentrations (Sedgwick,
2005).
II. Non-essential: these heavy metals have no known biological functions. Metals
such as Cd and Pb do not play any known physiological function, and are, in fact,
toxic to cells (Denton et al., 2001). Cd is extremely toxic and has been shown to
induce DNA breakage, while Pb reacts with the Sulphydryl groups of proteins and
restrains their function (Ron et al., 1992).
2.7.3 Occurrence and Toxicity of Selected Heavy Metals
2.7.3.1 Arsenic (As)
Arsenic is present in the environment as a naturally occurring substance or as a result of
contamination from human activity. It is found in water, air, food, and soil in organic and
inorganic forms. There are over 150 arsenic-bearing minerals (Carapella, 1992). Food is
typically the largest source of exposure to arsenic. The largest sources are seafood, bee
products, rice and some rice products, mushrooms and chicken. Arsenic concentrations in
food typically range from 20 - 140 µg/kg. Its concentration in the earth’s crust is 1.8 mg/kg
(Taylor, 1964).
US EPA (2011) reports that, ingesting lower doses can cause irritation of the digestive
tract, decreased blood cell production, fatigue, abnormal heart rhythms, damage to blood
University of Ghana http://ugspace.ug.edu.gh

24
vessels, and/or a pins-and-needles feeling in hands and feet. Ingesting inorganic arsenic
over long periods affects the skin. Breathing high levels of inorganic arsenic may cause
sore throat, lung irritation, and lung cancer. U.S. EPA's IRIS database classifies inorganic
arsenic as a human carcinogen. It notes increased lung cancer mortality from inhalation
exposure, increased mortality from cancers of the liver, kidney, lung, and bladder due to
ingestion of inorganic arsenic in drinking water, and an increased incidence of skin cancer
due to consumption of drinking water or food containing inorganic arsenic. The
International Agency for Research on Cancer (IARC, 1980) has determined that arsenic
and inorganic arsenic compounds are carcinogenic to humans.
2.7.3.2 Lead (Pb)
As reported by the ATSDR (1999), U.S. Department of Health and Human Services, lead
is a toxic substance present in our environment in small amounts and everyone is exposed
to some lead from daily actions such as inhaling dust, eating food, or drinking water.
Human activities (such as use of "leaded" gasoline) have spread lead and substances that
contain lead to all parts of the environment. For example, lead is in air, drinking water,
foods (not excluding honey), rivers, lakes, oceans, dust, and soil. Lead is also in plants and
animals that people may eat. Other sources of lead released to the air include burning fuel,
such as coal or oil, industrial processes, and burning solid waste.
Lead gets into foods from dust that contains lead falling onto them during processing. Lead
may also enter foods if they are put into improperly glazed pottery and from leaded-crystal
glassware. Shortly after lead gets into the body, it travels in the blood to the soft tissues,
University of Ghana http://ugspace.ug.edu.gh

25
(such as the liver, kidneys, lungs, brain, spleen, muscles, and heart). Lead, contained in the
air and originating mainly from motor traffic can contaminate air and then directly nectar
and honeydew. Generally, Pb is not transported by plants. The main target for lead toxicity
is the nervous system, both in adults and in children. Lead exposure or injection may cause
weakness in fingers, wrists, or ankles. Lead exposure may also cause anemia, a low number
of blood cells. At high levels of exposure, lead can severely damage the brain and kidneys
in adults or children. In pregnant women, high levels of exposure to lead may cause
miscarriage. High-level exposure in men can damage the organs responsible for sperm
production (ATSDR, 1999).
2.7.3.3 Cadmium (Cd)
Cd is an element that occurs naturally in the earth's crust. Cd is not usually found in the
environment as a metal. Cd is typically present as complex oxides, sulfides, and carbonates
in Zn, Pb and copper ores (Finkelman, 2005). Spills and leaks from hazardous waste sites
can also cause cadmium to enter soil, water or foods, including bee products depending on
the location of apiaries. The average Concentration of Cd in the earth’s crust is 0.2 mg/kg
and it occurs in soil from 0.1 to 0.5 mg/kg (Taylor, 1964). Food is one of the potential
sources of cadmium exposure for members of the general population. Only a small portion
of Cd might reach honey by air, mainly in the vicinity of incinerators. The major sources
of Cd include waste from municipal effluents, sewage sludge and mine waste,
metallurgical; industries, fossil fuels, and some phosphorous containing fertilizers (Denton
et al., 2001). Eating food or drinking water with very high Cd levels severely irritates the
stomach, leading to vomiting and diarrhea (Young, 2005). Eating small amounts of Cd
University of Ghana http://ugspace.ug.edu.gh
26
over a long period of time can lead to a build-up of cadmium in the kidneys. This Cd build-
up causes kidney damage, and also causes bones to become fragile and break easily (Goyer,
1991). The U.S. Department of Health and Human Services has determined that Cd and
Cd compounds may reasonably be anticipated to be carcinogens.
2.7.3.4 Chromium (Cr)
Cr is one of the most abundant heavy metals in the lithosphere (Callender, 2003). Cr (III)
occurs naturally in the environment and is an essential nutrient required by the human body
to promote the action of insulin in body tissues so that sugar, protein, and fat can be used
by the body. The average concentration of Cr in the earth crust is 100 mg/kg (Taylor, 1964).
Various methods of processing, storage, and preparation can alter the chromium content of
food. Cr (III) is an essential nutrient that helps the body use sugar, protein, and fat. An
intake of 50 to 200 µg of Cr (III) per day is recommended for adults. Because some Cr (VI)
compounds have been associated with lung cancer, the Department of Health and Human
Services has determined that certain Cr (VI) compounds are known carcinogens. Exposure
to Cr (VI) salts for a period of 2-26 years will cause cancer of the digestive tract
(Finkelman, 2005).
2.7.3.5 Mercury (Hg)
Mercury is a chemical (element) that occurs naturally in the environment in several forms.
Mercury can combine with other elements, such as chlorine, carbon, or oxygen, to form
mercury compounds. All forms of mercury are considered poisonous. Because mercury
occurs naturally in the environment, everyone is exposed to very low levels of mercury in
University of Ghana http://ugspace.ug.edu.gh
27
air, water, and food (including honey). The U.S. Food and Drug Administration (FDA) has
estimated that, on average, most people are exposed to about 50 ng of mercury per kilogram
of body weight per day in the food they eat.
People who eat foods (including honey) containing organic mercury can have permanent
damage to the brain, kidneys, and the growing fetus. There is no information to show that
mercury causes cancer in humans or animals (ATSDR, 1992).
2.7.3.6 Copper (Cu)
Copper is a reddish metal that occurs naturally in rock, soil, water, sediment, some foods
and air. Its average concentration in the earth's crust is about 55 mg/kg, and in soil it is 15
g/kg soil (Taylor, 1964). It is an essential element for all known living organisms including
humans and other animals. Copper is common in the environment. One may be exposed to
copper by breathing air, drinking water, eating food, and by skin contact with soil, water,
and other copper-containing substances. Food (including honey) naturally contains copper.
A person eats and drinks about 1 mg of copper every day. Copper is necessary in diets for
good health. Copper rapidly enters the bloodstream and is distributed throughout the body
after eating or drinking it. Callender, (2003) reported that that the adsorption behavior of
Cu in natural systems is strongly dependent on the type and concentration of inorganic and
organic ligands.
Copper is necessary for good health. However, very large single or daily intakes of copper
can harm one’s health. Intentionally high intakes of copper can cause liver and kidney
University of Ghana http://ugspace.ug.edu.gh

28
damage, nausea, stomach cramps and even death (Kegley et al., 2009; MDH, 2006). Very
young children are sensitive to copper, and long-term exposure to high levels of copper in
food or water may cause liver damage and death. Copper is not known to cause cancer.
2.7.3.7 Zinc (Zn)
Zinc is a naturally-occurring element. Pure zinc is a metal, and in combination with other
elements is a widespread and common part of the earth's crust. Zinc is a minor but essential
nutrient: too little can lead to reproductive, immune, and other health problems. On the
other hand, too much zinc can be poisonous. Zinc enters the air, water, and soil as a result
of both natural processes and human activities.
According to US EPA's IRIS database, it is not currently possible to tell whether zinc
exposure causes cancer in humans. Large doses of taken by mouth, even for a short time,
can cause stomach cramps, nausea, and vomiting. Ingesting high levels of zinc for several
months may cause anemia, damage the pancreas, and decrease levels of high-density
lipoprotein (HDL) cholesterol (Finkelman, 2005).
2.7.3.8 Manganese (Mn)
Manganese does not occur in the environment as the pure metal. Rather, it occurs combined
with other chemicals such as oxygen, sulfur, and chlorine (NAS, 1973). Because
manganese is a natural component in the environment, people are always exposed to low
levels of it in water, air, soil, and food. Its average concentration in the earth's crust is about
950 mg/kg (Taylor, 1964).
University of Ghana http://ugspace.ug.edu.gh

29
Eating a small amount of manganese each day is important in maintaining one’s health.
The amount of manganese in a normal diet (about 2,000-9,000 µg/day) seems to be enough
to meet a person’s daily need, and no cases of illness from eating too little manganese have
been reported in humans. Too much manganese, however, can cause serious illness.
Although there are some differences between different kinds of manganese, most
manganese compounds seem to cause the same effects, which may include mental and
emotional disturbances, brain injury, slow and clumsy body movements and so on. Toxic
exposures occur mainly due to particulate material in the air from mining and industrialized
activities (Francis and Forsyth, 2005). Symptoms of manganese poisoning are
hallucinations, forgetfulness, and nerve damage. Manganese can also cause Parkinson’s
disease, lung embolism and bronchitis (Lenntech, 2011).
2.7.3.9 Vanadium (V)
Vanadium is a compound that occurs in nature as a white-to-gray metal, and is often found
as crystals. It usually combines with other elements such as oxygen, sodium, sulfur, or
chloride. Vanadium and vanadium compounds can be found in the earth's crust, with an
average of about 135 mg/kg and in rocks, some iron ores, and crude petroleum deposits.
Vanadium mainly enters the environment from natural sources and from the burning of
fuel oils. It combines with other elements and particles and can find their way into certain
foods including honey (ATSDR, 1999).
University of Ghana http://ugspace.ug.edu.gh

30
It is not yet known, the health effects in people of ingesting vanadium. The health risks
associated with exposure to vanadium are dependent on its oxidation state. An intake of
over 10 mg of V per day can be toxic for adults; the source is usually airborne
anthropogenic V (WHO, 1996). Some animals that ingested vanadium over a long term
had minor kidney and liver changes. The Department of Health and Human Services, the
International Agency for Research on Cancer, and the EPA have not classified vanadium
as to its human carcinogenicity.
2.7.3.10 Cobalt (Co)
Co does not exist naturally as a base metal, but it is a constituent of more than 70 naturally
occurring minerals. The most common cobalt minerals are arsenosulfide, arsenide and
sulphide (IARC, 1991). The average concentration of Co in the earth crust is about 25
mg/kg. Sources of Co are both natural and anthropogenic (Barceloux, 1999). The mobility
of Co is moderately high and is limited in early stages by co-precipitation with limonite
and MnO2. As pH decreases, adsorption of Co by particulate matter also decreases, since
H+ concentrations compete with metal binding sites. Therefore, levels of dissolved Co will
be increased at low pH (ATSDR, 2004).
Cobalt is used in the treatment of anaemia in pregnant women, because it stimulates the
manufacture of red blood cells (ANL, 2005). Cobalt is Valuable for humans because it is
part of Vitamin B12, which is essential for human health elevated concentrations may result
in serious liver and kidney damage, gastrointestinal distress and, on a lesser scale, vomiting
and nausea (Virkutyte and Silampaa, 2006).
University of Ghana http://ugspace.ug.edu.gh
31
The effects of the heavy/trace metals on humans is presented in Table 2.3.
Table 2.3: The Toxicity of Certain Heavy/Trace Metals to Humans
Heavy metals/Trace element
Effects on Humans
As, Cd, Hg, Pb, U
As, Pb
As, Bi, Cu, Cr, Fe, Mn, Sb
As, Bi, Pb
As, Hg, Mn, Pb, Ti
As, Cr, Hg
Pb, Hg
As, Be, Cd, Cr, Ni, U
Impair the function of the kidney
Impair the function of hematopoiesis system
Impair liver function
Cause illness of the heart – circulatory system, or illnesss
of the respiratory system
Cause damage of the central and peripheral nervous
system
Cause mutagenicity
Cause teratogenicity
Cause human carcinogens
Source: Merian (1984) and Geldmacher et al., (2004)
2.8 Studies on the Composition of Honey
The mineral, nutritive, medicinal and chemical or elemental compositions of honey have
been of considerable interest for both man and animals. In view of this, qualitative and
quantitative analysis of the elements in honey is of great importance to many research
groups.
University of Ghana http://ugspace.ug.edu.gh
32
Research has been carried out in many countries to determine the mineral composition of
honey. For instance, using atomic absorption and emission spectroscopy honey samples
collected from different parts of Kenya were analysed (Mbiri et al., 2011) to determine the
levels of selected heavy metals (Pb, Cd, Zn, Cu, As) and essential metals (K, Na, Ca, Mg,
Fe). Results obtained from this study showed that, although most of the samples had a high
level of Zn, Cu, K, Na, Ca, Cd, As and Mg, they were all within the acceptable limit.
However, the concentration of Pb in most samples, was found to be above the World Health
Organisation (WHO) and Kenya Bureau of Standards (KEBS) limits of 0.1 mg/kg in food
products. In Spain, Emma and Susana (2006) have determined heavy metals (Zn, Cd and
Pb) in honey by potentiometric stripping analysis. All the samples analysed presented
concentration values lower than permitted limits.
Antioxidant activities and total phenolics of different types of honey have also been studied
(Al-Mamary et al., 2002). In the studies, nine types of honey were evaluated. Yemeni
honey samples had significantly higher total phenolic content as compared to the imported
honey samples. The level of antioxidants increased with increased volume of honey
samples, and a positive correlation between percentage antioxidant and total phenolics was
observed, which increased with the higher level of samples.
The elements Al, B, Ca, Cu, Mg, Mn, Ni, and Zn were determined in nectar and honeydew
honey samples from Czech Republic. Lachman et. al., (2007) drew the conclusion that the
composition relies on both the nature and environmental contamination of the honey.
University of Ghana http://ugspace.ug.edu.gh

33
Blasa et al., (2006) also studied antioxidants in raw Millefiori honey. Five types of honey
were tested. Raw Millefiori honey was rich in both the amount and variety of antioxidants.
In addition, darker coloured and more crystallized honeys had stronger antioxidant activity
compared to lighter transparent honeys.
Gonzales (1999) and his colleagues also monitored color changes during storage of honeys
in relation to their composition and initial color. The outcome was that, floral origin,
polyphenolic components and deteriorative reactions all affected the stability of color of
honeys during storage. The initial colour was the parameter, which better defined the rate
of darkening in the sampled honeys.
Agaja (2014) has also used instrumental neutron activation to analyze honey samples from
Lokoja and Suleija North Central Nigeria. The concentrations of the nine elements
determined in the honey samples; Al, Br, Ca, Cl, K, Mg, Mn, Na and V, were all in
agreement with other previous workers’ result within Nigeria and in Europe.
The mineral content of Greek and German honey was investigated by Chalhoub et al.,
(2007) and Bogdanov et al., (2003) respectively, using inductively coupled plasma atomic
emission spectroscopy. They found that the variation in the concentrations of Ca, Cr, Ni,
Mg, Cu, Mn, Zn and P were similar to the values found in other recent studies and within
acceptable limits. Pb, Cd, Zn, Cu, Cr, Ni, Fe and Mn are well known as potential air or soil
contaminants of anthropogenic origin, and also found as natural ingredients of soil
minerals, indicating that honey can be used as tool for environmental, botanical and
University of Ghana http://ugspace.ug.edu.gh

34
geographical discriminations. In the study, variation in trace element content in different
honey types was observed to be primarily due to botanical origin rather than geographical
exposition of nectar sources.
Determination of the extent of bioaccumulation of the toxic elements: Zn, Cu, Pb , As, and
Cd in propolis and multiflower honey collected from Wroclaw area (Poland) has also been
investigated by Roman et al., (2011). Lead was found to be the most problematic element
in the honey because its average content exceeded the maximum acceptable over two fold.
Also the lead level was exceeded in 85% of the studied samples. This was attributed to the
significant contamination of soils by chemical industries and extensive urban areas.
The physical properties and chemical composition of honey from different sources have
been published by many scientists (Andrade et al., (1999); Anklam, (1998); Costa et al.,
(1999); Pe´rez-Arquillue et al., (1995); Singh and Kaur, (1997); Sporns et al., (1992);
Swallow and Low, (1990); White et al., (1975)).
Compared to other countries, there are few published research on Ghanaian honey. Some
date back to the 1990’s. Ankrah (1997) showed that Ghanaian honey samples contained
18.8% moisture, 0.8% ash, 57.0% reducing sugars calculated as invert sugar and 3.0%
sucrose sugars calculated as invert sugar and 3.0% sucrose. The results compared
favourably with those reported in the Codex Alimentarius, making the Ghanaian honey
samples acceptable for domestic and international trade. Comparative antibacterial activity
of stingless bee honey and standard antibiotics against common eye pathogens has also
University of Ghana http://ugspace.ug.edu.gh

35
been studied by Kwapong et al., (2013). Nevertheless, based on the available literature,
there is no information about the elemental composition of honey in Ghana.
This work focused on quantitative and qualitative analysis of the essential elements (Al,
K, Na, Ca, Mg, Fe, Cr, Co, Cu ) and heavy metals ( Hg, Pb, Cd, As) in honey samples from
Brong Ahafo, Ashanti and Greater Accra regions of Ghana using instrumental neutron
activation analysis, and atomic absorption spectroscopy to ascertain the actual
concentration of these elements.
2.9 Neutron Activation Analysis Technique
Neutron activation analysis allows for the qualitative and quantitative determination of
elements. The method is based upon the conversion of stable atomic nuclei into radioactive
nuclei by irradiation with neutrons and the subsequent measurement of the radiation
released by these radioactive nuclei (Figure 2.2). Among several types of radiation that can
be emitted, gamma radiation offers the best characteristics for the selective and
simultaneous determination of elements (IAEA TECDOC, 2001).
University of Ghana http://ugspace.ug.edu.gh

36
Figure 2.2: Summary of INAA procedure
By neutron activation, radionuclides may be produced from all elements present in the
sample, sometimes at very different production rates. For analysis, the resulting radioactive
sample is kept intact and the radionuclides present are determined by taking advantage of
differences in the decay rates and measuring the samples at different decay intervals,
utilizing equipment with a high energy resolution for gamma radiation. This is called non-
destructive or instrumental neutron activation analysis (INAA) (IAEA TECDOC, 2001).
An INAA procedure is characterized by;
i. activation via irradiation with reactor neutrons,
ii. measurement of the gamma radiation after one or more decay intervals,
and
iii. interpretation of the resulting gamma ray spectra in terms of the elements
present and their concentrations.
University of Ghana http://ugspace.ug.edu.gh
37
INAA was employed in this work because the samples do not have to undergo any chemical
treatment, prior to, nor after the activation. Because of the limited sample handling
operations, there is also a lower risk of contamination during sample preparation compared
to element analysis methods in which the sample has to be dissolved (IAEA TECDOC,
2001). Light elements such as H, C, N, O, Si which in many materials belong to the major
matrix components, do not produce radioactive products upon neutron activation. This
means that they cannot interfere with the determination of the other activities. This often
enables the observation of trace elements at detection limits in the mg/kg to µg/kg level in
matrices composed of these light elements. In addition, the high selectivity of gamma ray
spectrometry allows for simultaneous evaluation of many radionuclides. Since the signals
(Figure 2.3) in INAA are related to the properties of the atomic nucleus, the results in INAA
are not affected by the chemical and physical state of the elements. The method is well
described by physical laws and selectivity is unambiguous for all elements. The reason is
that the combination of the nuclear properties such as the decay constant (often converted
to half-life) and the energies and intensities of the gamma radiation is uniquely
characteristic for each radionuclide. This all contributes to a high degree of accuracy that
makes INAA well acknowledged for analyses related to such areas as the certification of
reference materials (IAEA TECDOC, 2001).
University of Ghana http://ugspace.ug.edu.gh

38
Figure 2.3: A typical Gamma-ray Spectra (Source: Hamidatou et al., 2013)
2.10 Atomic Absorption Spectroscopy Analysis Technique
An atomic absorption spectrometer is an instrument which is used to analyze the
concentrations of metals in solution. Sixty eight elements can be determined directly over
a wide range of concentrations from µg/kg to per cent levels, with good precision–typically
better than 1 % relative standard deviation. Sample preparation is generally simple and
frequently involves little more than dissolution in an appropriate acid. The instrument is
easy to tune and operate (Varian booklet, Introducing Atomic Absorption Analysis, 1997).
The basic principles of atomic absorption spectroscopy can be expressed by three simple
statements:
a) All atoms can absorb light.
University of Ghana http://ugspace.ug.edu.gh

39
b) The wavelength at which light is absorbed is specific for each element. If a
sample containing nickel, for example, together with elements such as lead
and copper is exposed to light at the characteristic wavelength for nickel,
then only the nickel atoms will absorb this light.
c) The amount of light absorbed at this wavelength will increase as the number
of atoms of the selected element in the light path increases, and is
proportional to the concentration of absorbing atoms.
d) The relationship between the amount of light absorbed and the
concentration of the analyte present in known standards can be used to
determine unknown concentrations by measuring the amount of light they
absorb. An atomic absorption spectrometer is simply an instrument in which
these basic principles are applied to practical quantitative analysis (Varian
booklet, Introducing Atomic Absorption Analysis, 1997).
University of Ghana http://ugspace.ug.edu.gh

40
CHAPTER THREE
MATERIALS AND METHODS
3.1 Honey Sample Collection Sites
Sampling was done in three regions of Ghana where honey is mostly produced; Brong
Ahafo, Ashanti and Greater Accra regions. The sampling of honey in the various regions
was carried out from August, 2014 to January, 2015. In the Brong Ahafo region, the
collection sites were Atebubu, Berekum, Drobo, Fiapre, Dumasua, Mantukwa, Nsoatre,
Kintampo, Techiman and Tanoso. In the Ashanti region, the collection sites were Jamasi,
Ntonso, Aboaso, Nkwanta, Manpongten, Fawode, Ahwiaa, Pankrono, Asenua, and Agona.
In the Greater Accra region, the collection sites were Afienya, Akweteyman, Amasaman,
Pokuase, Ablekuma, Awoshie, Oyibi, Weija, Adenta and Ayimensa (Table 3.1). To assess
the variation of metal content of the honey from the farmer to the market, the sampling was
done along the farmer-to-trader route.
Figure 3.1: Sample collection chart
(a) Honey collected from beekeepers after extraction
(before processing-BP)
(b) Honey collected from beekeepers after processing-
AP (decanting, filtration, sieving, packaging)
(c) Honey collected from retailers-RT, who
purchase directly from beekeepers
University of Ghana http://ugspace.ug.edu.gh

41
First batch of samples were taken directly from the beekeepers right after extraction, at the
site. Second batch of samples were taken from the beekeepers after processing (decanting,
filtering and packaging). Third batch of samples were taken from the retailers who buy
directly from the beekeepers and sell to consumers (Figure 3.1). At each sampling route,
three samples were taken. Thirty sampling sites were visited. In all, there were ninety
samples.
The samples were given respective codes that comprised acronyms of the regions, sampling
site and number, collection date and the researcher’s name. Prior to analysis, the honey
samples were stored in clean plastic bottles and tightly covered. The samples were double-
bagged and placed in hermetically closed polyethylene bags and stored at room
temperature in the dark.
Table 3.1: The sampling sites of the honey samples in the various regions
REGION SAMPLING SITES
BRONG
AHAFO
Atebubu, Berekum, Drobo, Fiapre, Dumasua, Mantukwa, Nsoatre,
Kintampo, Techiman and Tanoso
ASHANTI Jamasi, Ntonso, Aboaso, Nkwanta, Manpongten, Fawode, Ahwiaa,
Pankrono, Asenua, and Agona.
GREATER
ACCRA
Afienya, Akweteyman, Amasaman, Pokuase, Ablekuma, Awoshie,
Oyibi, Weija, Adenta and Ayimensa
University of Ghana http://ugspace.ug.edu.gh

42
Figure 3.2: Map of Ghana showing the sampling sites
University of Ghana http://ugspace.ug.edu.gh

43
3.2 Social Experiment (Questionnaire Administration)
Prior to the collection of samples, preliminary information was solicited from the
beekeepers and retailers through the administration of questionnaires. This was done in
order to have a broader view of the various extraction methods and treatment processes
employed by the farmers during honey extraction, as well as the storage conditions and
packaging materials used by the retailers. Some of the questions asked were about how
long they have been in the honey business, which people they normally sell their products
to, where the location of their apiary is, how many colonies they have, the equipment they
usually use during honey extraction, the kind of safety equipments they use. Other
questions were about the containers used for keeping or storing the products, treatment of
containers before honey storage, the source of the honey, the colour of the honey,
consistency of honey, aroma and flavor of the honey.
In addition, questions on the treatment methods used after extraction, additives added
before selling them, the type of additive added to the honey, how pest and diseases are
controlled, the chemicals employed, measures normally taken to reduce contamination of
the honey and how is it packaged before it is sold to consumers. A sample questionnaire is
at Appendix D (Table D1).
3.3 Physicochemical Analysis
3.3.1 Apparatus
Glassware
The glassware used were 30 cm stirring rod, 100 mL beakers, 10 mL and 25 mL pipette
and 50 mL pycnometer (density bottle).
University of Ghana http://ugspace.ug.edu.gh

44
3.3.2 Instruments
The instruments used included: pH meter (Model ECO Testr pH 2, Eutech Instrument),
Electrical Conductivity meter (Model ECO Testr 11, Eutech Instrument), Analytical
Balance with 0.001 g precision (Intell-Lab Balance, Model PM-300).
3.3.3 Experimental Procedure
Determination of pH, electrical conductivity and relative density were carried out in
triplicate for each sample.
3.3.3.1 Preparation of 10% (w/v) Honey Solution
About 1.0 g aliquot of the sample was weighed into the 100 mL beaker. This was followed
by the addition of about 10 mL of boiled deionised water (100 ºC). The mixture was then
stirred for complete dissolution of the honey samples to form a 10% (w/v) homogenized
solution. The pH and electrical conductivity of the deionised water used were 7.0 and 0
µS/cm respectively.
3.3.3.2 Determination of pH
The pH of the 10% (w/v) solution of homogenized honey prepared in boiled warm water
was then measured by a pH-meter. The pH meter was calibrated using standard buffer
solutions of pH 4.0, 7.0 and 10.0 prior to measuring the pH of the samples.
3.3.3.3 Determination of Electrical Conductivity
The conductivity of the 10% (w/v) solution of homogenized honey prepared in boiled warm
water was measured with the conductivity meter. Prior to that, the conductivity meter was
calibrated by direct comparison of EUT with conductivity meter serial number 08260033
University of Ghana http://ugspace.ug.edu.gh

45
using a reference electrolytic conductivity solution Lot No. 40610636025 at a temperature
of 25.42 °C and a relative humidity of 51.3 %.
3.3.3.4 Determination of Relative Density (Specific Gravity)
The relative densities of the honey samples were determined according to the procedure
below;
The empty 50 mL density bottle was weighed and filled to the brim with deionised water.
Its weight was measured again. The bottle was then filled to the brim with the honey
sample, and the weight was measured. The procedure was repeated for all the other honey
samples. The method below was then used to quantify the relative densities of the honey
samples.
RDhoney =ρhoney
ρwater
Where:
ρhoney
=Mhoney
Vhoney
ρwater
=Mwater
Vwater
But Vwater= Vhoney = 50mL
Therefore:RDhoney =Mhoney
Mwater
Where:
RDhoney = Relative Density of honey
ρhoney
= Density of honey
M honey= Mass of honey
Vhoney= Volume of honey
University of Ghana http://ugspace.ug.edu.gh

46
ρwater
= Density of water
Mwater= Mass of honey
Vwater= Volume of water
3.4 Determination of Heavy/Trace Metals
The heavy/trace metal contents in the honey samples were determined by two analytical
techniques; neutron activation analysis (NAA) and atomic absorption spectrometry (AAS).
3.4.1 Instrumental Neutron Activation Analysis
The following elements were determined by INAA; Cd, Cu, As, Hg, Na, Al, Mn, Ca, Mg,
K, and V.
3.4.2 Instrumentation
The Mettler Toledo XS603S digital analytical balance was used for the weighing of
samples for irradiation. Irradiation of honey samples was done in Ghana’s 30 kW miniature
neutron source reactor (MNSR), situated at the Ghana Atomic Energy Commission,
Kwabenya, Accra. Samples and the standards were irradiated at a thermal neutron flux of
5 x 10¹¹ncm-2s-1. Samples and standards were transferred into the reactor through the
pneumatic transfer system operating at 25.0 atmospheres. Measurement of γ-irradiation
intensity of the induced radionuclides was performed on a coaxial high purity germanium
detector (HPGe) γ-ray semiconductor detector (ORTEC). The detector has an efficiency of
25% relative to the 1332.5 keV γ-line of 60Co, a resolution of 1.8 keV at 1332.5 keV γ-
lines of 60Co and a peak-to-campton ratio of 55:1.
University of Ghana http://ugspace.ug.edu.gh

47
The Ortec Maestro-32 γ-ray spectrum acquisition software was used for γ-ray spectrum
acquisition and quantification
3.4.3 Standard Reference Materials
Single Standard Reference Materials, NIST SRM 1643E (Estuarine sediment) from the
National Institute of Standards and Technology (USA) were used.
3.4.4 Apparatus
1.2 mL polyethylene vial, 7 mL vial, 1 mL pipette cotton wool and soldering iron rod
3.4.5 Procedure for Sample Preparation
The honey samples were homogenized in their containers to ensure uniformity before
weighing. Samples were prepared by weighing 500 mg aliquot of the sample into the 1.2
mL polyethylene vial, covered, thermally sealed with a soldering rod and labeled. The
sample-containing vials were then placed in the 7 mL vial. Cotton wool was plugged in to
make the sample firm and stable. A sample each was placed in the capsule, for the short-
lived radionuclides and for medium-lived radionuclides. NIST single standard reference
materials of concentration 10 mg/L and 20 mg/L as well as blanks, were prepared the same
way as the samples and irradiated together with the samples. Since the quantification of
concentration was based on the comparator method of neutron activation analysis, the
standards were used as comparator standards.
University of Ghana http://ugspace.ug.edu.gh
48
3.4.6 Irradiation of samples and standards
Before an irradiation scheme was established, preliminary studies were carried out in order
to get an accurate irradiation scheme which included the right amount of sample to
irradiate. Table 3.2 shows the irradiation schemes considered for short-lived radionuclides
before arriving at a favourable scheme (Scheme 4).
The irradiation was categorized according to the half-life of the element of interest. For
short-lived radionuclides (Al, Mg, Cu, V, Mn, Ca), samples were irradiated for two minutes
and counted for ten minutes on the detector. For medium lived radionuclides (Hg, As, Cd,
Na, K), samples were irradiated for one hour and delayed for twenty four hours followed
by ten minutes counting,
Table 3.2: Irradiation and Counting Schemes
Scheme Sample
mass (g)
Irradiation time
(min)
Delay time
(min)
Counting time (min)
1 0.5 1 5 10
2 0.5 1 0 10
3 0.5 2 5 10
4 0.5 2 0 10
3.4.7 Measurement of γ-radiation Intensity (Counting)
After irradiation, γ-radiation intensity measurement of induced radionuclide was
performed by a PC-based γ-ray spectrometry set-up. After irradiation, the γ-radiation
intensity of the short-lived radionuclides was measured immediately. For the medium-lived
radionuclides, the samples and standards were measured after 24 hour delay time to allow
University of Ghana http://ugspace.ug.edu.gh

49
the intensity of the radiation to decay to safe levels for human handling. The samples were
placed on the coaxial Ortec HPGe γ-ray detector connected to a multichannel analyzer
(MCA). Similarly, under the same conditions, the γ-radiation intensity of the NIST
standards irradiated together with the samples was measured at the same geometrical
distance with respect to the detector. A plexiglass source support was mounted on the
detector during the measurement in order to ensure easy and reproducible source
positioning (De Corte, 1987).
3.4.8 γ-ray Spectrum Acquisition and Quantification
Identification of γ-ray of product radionuclide was identified through the energies and
quantitative analysis of the concentration was achieved using the γ-ray spectrum analysis
software, ORTEC MEASTRO-32. Quantitative analysis was done via relative comparator
method. The peak area determinations, processing and concentration calculation were done
by Multipurpose γ-ray Spectrum Analysis 93 Software; winSPAN-2010 version 2.10.
3.4.9 Calculation of Concentration
Calculation of the concentration was done based on the relative standardization method
of NAA (Comparator Method) according to the equation:
Csamp
Cstd= (
Astd
ASamp) / (
Msamp
Mstd)
Csamp = [(Asamp
Msamp) / (
Astd
Mstd)] × Cstd
University of Ghana http://ugspace.ug.edu.gh

50
Where:
Csamp = Concentration of the sample
Cstd = Concentration of the standard
Asamp = Area of sample’s peak
Astd = Area of standard’s peak
Msamp = Mass of the sample
Mstd= Mass of the standard
3.4.10 Validation of the INAA Technique
To ascertain the reliability of the results, the INAA technique was validated using NIST
(USA) single standard reference materials (SRM 1643E) of concentrations 10 mg/kg and
20 mg/kg, of the various elements of interest. The results are presented in Table 4.3 (page
65).
3.5 Determination of Pb, Cr, Co and Fe Using Atomic Absorption Spectroscopy
3.5.1 Instrumentation
The Mettler Toledo XS603S digital analytical balance was used for the weighing of
samples before digestion. Digestion of samples was performed in 100 mL beakers using a
conventional Hot Plate (BIBBY-290). Atomic absorption spectrometer (VARIAN, AA 240
FS, Australia) equipped with deuterium background corrector was used for determining
the concentrations of the analytes of interest. The flame atomizer was made up of air
(oxygen) as oxidant and acetylene gas as fuel, with 13.5 Lmin-1 and 2.0 Lmin-1 flow rates
respectively.
University of Ghana http://ugspace.ug.edu.gh

51
3.5.2 Chemicals and Standards
65% nitric acid (HNO3) and 30% hydrogen peroxide (H2O2) were used for the digestion of
the honey samples. De-ionised water was used for all dilutions.
3.5.3 Procedure for Digestion of Samples with the Hot Plate
All digestion vessels and associated glassware were detergent washed, nitric acid
washed, and rinsed with deionized water three times prior to use. The glassware were then
dried in an oven at a temperature of 40 °C, for four hours before used (Radojevic and
Bashkin, 1999).
The samples were first prepared for determination of their metal contents by acid digestion.
The purpose was to degrade and solubilize the matrix, to release all metals for analysis, to
concentrate metals present at very low levels to bring them into a concentration range
suitable for analysis, to separate a single analyte or group of analytes from other species
that might interfere in the analysis, to dilute the matrix sufficiently so that the effect of the
matrix on the analysis will be constant and measurable and to separate different chemical
forms of the analytes for individual determination of the species present. (Patnaik, 2004).
Aggressive acid digestion usually renders all the metals into the same form and destroys
any information about the species originally present.
The samples, prior to analysis for elemental metal content were prepared by digesting the
matrix in a strong acid. Nitric acid was used, because there is no chance of forming
insoluble salts as might happen with HCl or H2SO4. Hydrogen peroxide (H2O2) was added
to increase the oxidizing power of the digestion solution. Nitric acid oxidizes the sample
University of Ghana http://ugspace.ug.edu.gh

52
and was therefore used before the stronger oxidizer, perchloric acid, to remove the more
readily oxidized material.
Samples were weighed directly in individually tarred digestion vessels. The honey samples
were prepared by weighing 5000 mg of each of the samples into100 mL beakers. This was
followed by the addition of 25 mL of 65% nitric acid (HNO3) and 2.5 mL of 30% (w/v)
hydrogen peroxide (H2O2). The digestion of the samples were done according to the
protocol for digestion of honey (Microwave Acid Digestion Cookbook, 1996; Jorham and
Engman, 2000).
The reaction was carried out in a fume chamber. The beakers were covered with a clean
film to reduce the evolution of poisonous gases during heating. The mixtures were then
heated on a hot plate at a temperature range of 60 – 90 ºC for 3 hours. After heating the
digestates were cooled at room temperature and quantitatively filtered under gravity using
a Whatman filter paper, diluted to 30 mL with distilled water. They were then transferred
into clean bottles, labelled appropriately and corked, for analysis with the atomic
absorption spectrometer. Using deionized water, blanks were also prepared similarly and
under the same conditions.
3.5.4 Chemical Reactions that Occurred During Digestion
The lead in the honey samples dissolved in the concentrated nitric acid, producing lead
ions and a colourless nitrogen oxide gas which oxidized to nitrogen dioxide gas (red) in
the presence of air (oxygen)
University of Ghana http://ugspace.ug.edu.gh

53
3Pb + 8HNO3 3Pb 2+ + 6NO3- + 2NO + 4H2O
The iron in the honey samples dissolved in the concentrated nitric acid, producing iron ions
and a colourless nitrogen oxide gas.
4Fe + HNO3 + 3H+ 4Fe3+ + NO + 2H20
3Fe + 2HNO3 + 6H+ 3Fe2+ + 2NO + 4H20
The chromium in the honey samples dissolved in the concentrated nitric acid, producing
chromium ions and a colourless nitrogen oxide gas which oxidizes to nitrogen dioxide gas
(red) in the presence of oxygen.
Cr + 4HNO3 Cr 3+ + 3NO3- + NO + 2H2O
The cobalt in the honey samples dissolved in the concentrated nitric acid, accompanied by
the formation of cobalt ions and a colourless nitrogen oxide.
3Co + 2HNO3 + 6H+ 3Co 3+ + 2NO + 4H2O
3.5.5 Calibration of Atomic Absorption Spectrophotometer
The commercially available standard stock solutions used for the calibration were: 1000±4
mgPbL-1 in 2% (w/w) HNO3; 1000±4 mgCrL-1 in 2% (w/w) HNO3; 1000±4 mgFeL-1 in
2% (w/w) HNO3; 1000±4 mgCoL-1 in 2% (w/w). Standards of known concentrations for
the various elements of interest were prepared from the commercial stock standard
solutions and used for the calibration of the atomic absorption spectrometer.
University of Ghana http://ugspace.ug.edu.gh

54
The absorbances measured for the various standard solutions were used to prepare a linear
regression line and the concentration of each element was deduced from their respective
lines as shown in Figures A1–A4 (Appendix A). The equations compared absorbance with
concentration. It therefore enabled quantitative analysis to be carried out. Three blanks
solutions were prepared in a similar way as that of the sample. The sample solutions were
corrected for absorbances before actual calculations were done. The calibration solution
data obtained for Pb, Cr, Co and Fe are presented in Table 3.3.
Table 3.3: Standards Prepared for the Calibration of the AAS
Analyte Concentration of the Calibration Standard (mg/L)
Calibrant 1 Calibrant 2 Calibrant 3
Pb 2.00 5.00 10.00
Cr 1.00 2.00 5.00
Co 1.00 2.00 5.00
Fe 2.00 5.00 10.00
3.5.6 Determination of Concentration of Honey Sample
The instrumental parameters for the AAS are presented in Table 3.4.
University of Ghana http://ugspace.ug.edu.gh

55
Table 3.4: Flame AAS Instrument parameter for Pb, Fe, Cr, Co Analysis
Instrument
parameter
Analyte
Pb Cr Co Fe
Wavelength (nm) 217.0 357.9 240.7 248.3
Slit with (nm) 1.0 0.2 0.2 0.2
Lamp current (mA) 5.0 7.0 7.0 7.0
Air flow (L/min) 13.5 13.5 13.5 13.5
The absorbances of the digested honey samples were determined after the calibration of
the instrument. The concentrations of the elements of interest were deduced from their
respective regression lines, and the actual concentrations were then calculated.
3.5.7 Calculation of Concentration
The equation below was used to calculate the actual concentrations of the elements
Csamp_actual =Csamp_calib × Df × Vn
Msamp
Where;
Csamp_actual= Actual concentration of sample
Csamp_calib= Sample concentration (Calibration curve)
Df = Dilution Factor
Vn=Norminal Volume
Msamp=Mass of Sample
University of Ghana http://ugspace.ug.edu.gh
56
Table 3.5: Detection Limit of Elements Determined by AAS
ELEMENT DETECTION LIMIT (mg/L)
Pb 0.040
Fe 0.240
Cr 0.006
Co 0.005
3.6 DATA ANALYSIS
Data organization and graphical plots of results was done with Microsoft Excel version
2010. One way ANOVA (analysis of variance) was performed using IBM SPSS Statistics
Version 20. ANOVA was used to test and determine whether there were significance
differences in the concentration of the samples as it passes through the various processes
or whether at least one of the groups tested differs from the other groups. However, the
ANOVA cannot tell from the test which group differs.
Least Significant Difference (LSD) and Tukey test were therefore done to determine which
process significantly affects the honey’s composition. The LSD calculates the smallest
significant between means as if a test had been run on those means (as opposed to all of
the groups together). This enables direct comparisons between two means from two
individual groups to be made. Any difference larger than the LSD is considered a
significant result (Fisher, 1935).
The formula for the least significant difference is:
LSDA,B = t0.05/2DFw√MSw(1nA
⁄ + 1nB
⁄ )
University of Ghana http://ugspace.ug.edu.gh

57
Where:
t = Critical value from a t-distribution table
n = Number of scores used to calculate the means
MSw = Mean Square within, obtained from the results of the ANOVA test
DFw = Degrees of Freedom
The Tukey method, is a single-step multiple comparison procedure and statistical test also
used to find means that are significantly different from each other. It is based on a formula
very similar to that of the t-test. Tukey's test is essentially a t-test, except that it corrects for
experiment-wise error rate (when there are multiple comparisons being made, the
probability of making a type I error increases -Tukey's test corrects for that, and is thus
more suitable for multiple comparisons than doing a number of t-tests would be) (Tukey,
1949; Linton et al., 2007).
The formula for Tukey's test is:
qs =YA−YB
SE,
Where;
YA = the larger of the two means being compared,
YB = the smaller of the two means being compared, and
SE= the standard error of the data in question.
This ‘qs’ value can then be compared to a ‘q’ value from the studentized range distribution.
If the ‘qs’ value is larger than the ‘qcritical’ value obtained from the distribution, the two
means are said to be significantly different (Linton et al., 2007).
University of Ghana http://ugspace.ug.edu.gh
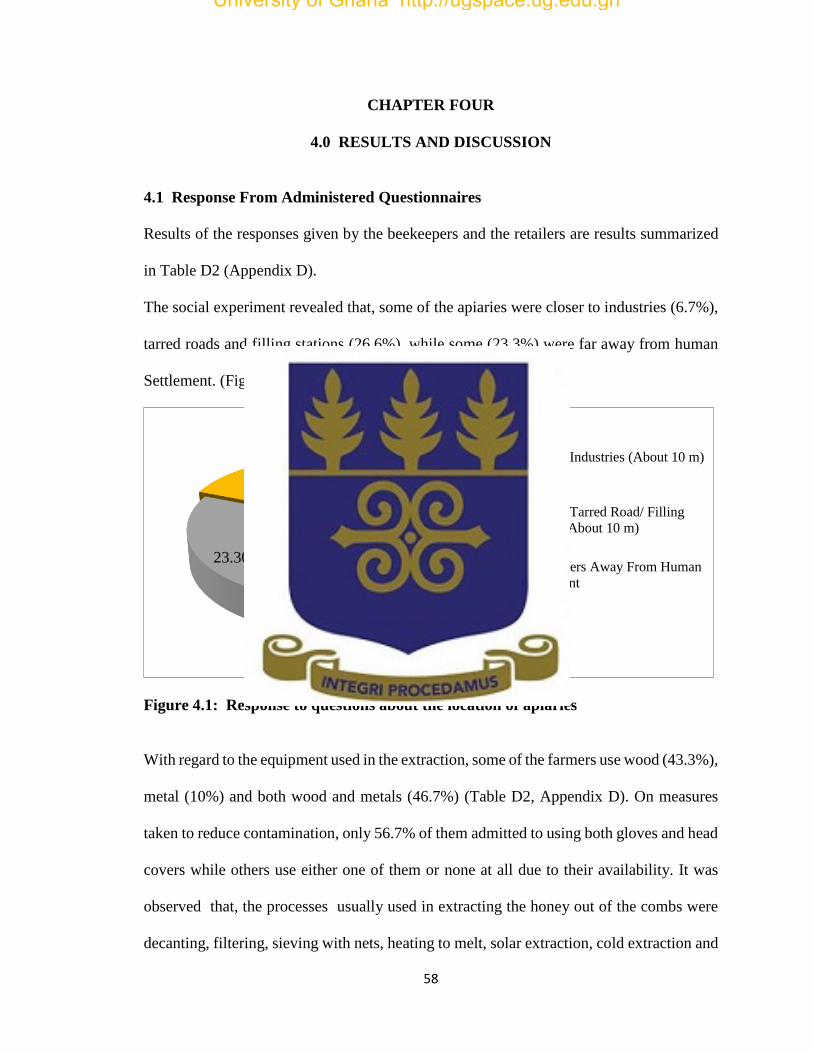
58
CHAPTER FOUR
4.0 RESULTS AND DISCUSSION
4.1 Response From Administered Questionnaires
Results of the responses given by the beekeepers and the retailers are results summarized
in Table D2 (Appendix D).
The social experiment revealed that, some of the apiaries were closer to industries (6.7%),
tarred roads and filling stations (26.6%), while some (23.3%) were far away from human
Settlement. (Figure 4.1).
Figure 4.1: Response to questions about the location of apiaries
With regard to the equipment used in the extraction, some of the farmers use wood (43.3%),
metal (10%) and both wood and metals (46.7%) (Table D2, Appendix D). On measures
taken to reduce contamination, only 56.7% of them admitted to using both gloves and head
covers while others use either one of them or none at all due to their availability. It was
observed that, the processes usually used in extracting the honey out of the combs were
decanting, filtering, sieving with nets, heating to melt, solar extraction, cold extraction and
6.70%
26.70%
23.30%
13.30%
Location of Apiaries
Close to Industries (About 10 m)
Close to Tarred Road/ Filling
Station (About 10 m)
Few Meters Away From Human
Settlement
Others
University of Ghana http://ugspace.ug.edu.gh
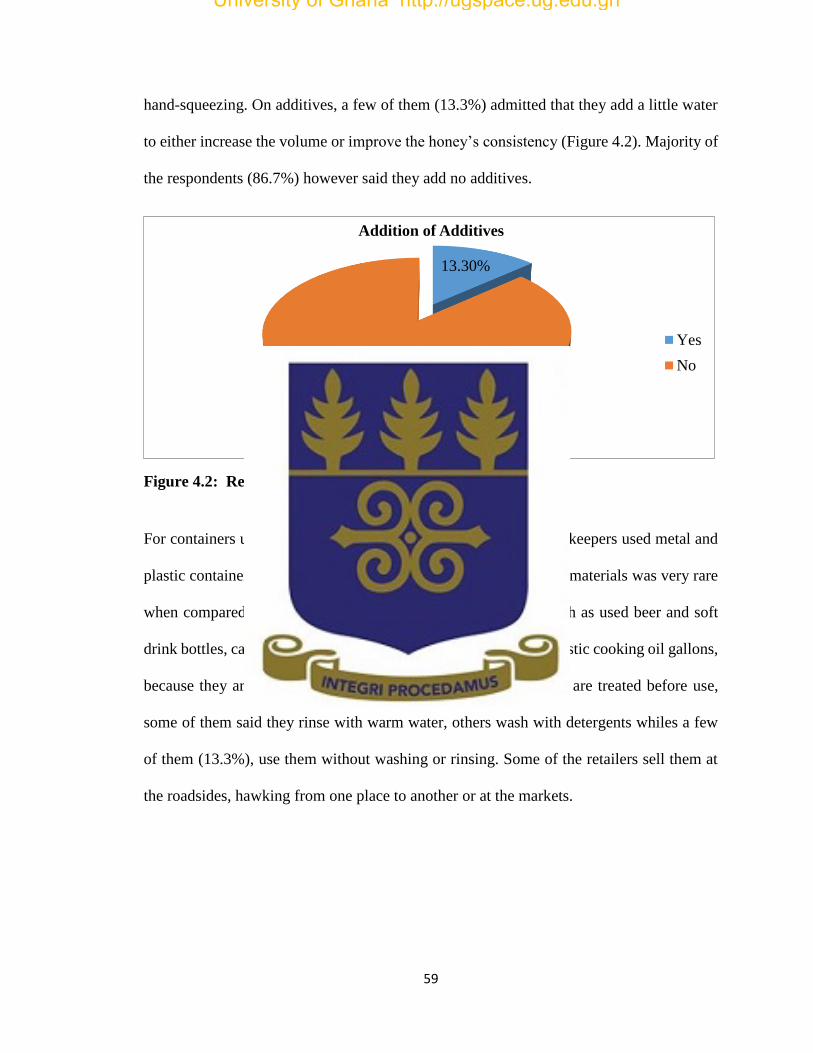
59
hand-squeezing. On additives, a few of them (13.3%) admitted that they add a little water
to either increase the volume or improve the honey’s consistency (Figure 4.2). Majority of
the respondents (86.7%) however said they add no additives.
Figure 4.2: Response to questions about addition of additives
For containers used in storing the honey, 20% and 60% of the beekeepers used metal and
plastic containers respectively. The use of fresh or new packaging materials was very rare
when compared to the use of recycled materials (Figure 4.3), such as used beer and soft
drink bottles, calabashes, used plastic mineral water bottles and plastic cooking oil gallons,
because they are cheap and affordable. As to how the containers are treated before use,
some of them said they rinse with warm water, others wash with detergents whiles a few
of them (13.3%), use them without washing or rinsing. Some of the retailers sell them at
the roadsides, hawking from one place to another or at the markets.
13.30%
86.70%
Addition of Additives
Yes
No
University of Ghana http://ugspace.ug.edu.gh

60
Figure 4.3: Response to questions about packaging materials used for storing honey
4.2 Physicochemical Studies
Results for physicochemical parameters (pH, electrical conductivity, and specific gravity)
are summarized in Table 4.1.
4.2.1 pH of Honey
All the honey samples analyzed were found to be acidic. The acidity of honey may be due
to the presence of organic acids, particularly gluconic acid and inorganic ions such as
phosphate and chloride (Nandaa et al., 2003). Generally, in the Brong Ahafo region, pH
ranged from 3.8 (Kintampo) to 6.0 (Tanoso) (Table 4.1). For Ashanti, pH varies from 4.8
(Asenua) to 6.1 (Manpongten). The pH of honey from the Greater Accra region varied from
3.6 (Weija) to 6.1 (Ablekuma). The measured pH values agree with the limits set by the
25.00%
56.00%
19.00%
Containers for Keeping or Packaging Honey
New Plastics Containers
Used or Recycled Plastic
Containers
Metal or Glass Containers
University of Ghana http://ugspace.ug.edu.gh

61
National Honey Board of United States (3.4 to 6.1) and also compares favourably with the
pH of honey from other parts of the world (Table 4.2).
University of Ghana http://ugspace.ug.edu.gh

62
Table 4.1: The pH, Electrical Conductivity, and Specific Gravity
Regions Towns Physicochemical Parameters
pH Electrical Conductivity (µS/cm) Specific Gravity
Brong Ahafo Atebubu 5.3 ± 0.2 16.7 ± 0.3 1.399 ± 0.001
Fiapre 5.5 ± 0.1 44.4 ± 0.7 1.443 ± 0.002
Drobo 5.9 ± 0.2 17.2 ± 0.4 1.415 ± 0.002
Dumasua 5.6 ± 0.1 25.9 ± 0.3 1.418 ± 0.001
Mantukwa 5.5 ± 0.1 14.3 ± 0.1 2.031 ± 0.006
Nsoatre 5.6 ± 0.3 22.4 ± 0.2 1.563 ±0.002
Kintampo 3.8 ± 0.2 12.0 ± 0.5 1.425 ± 0.005
Techiman 5.3 ± 0.1 11.9 ± 0.3 1.368 ± 0.004
Tanoso 6.0 ± 0.2 31.8 ± 0.4 1.644 ± 0.003
Berekum 5.9 ± 0.3 12.7 ± 0.1 1.426 ± 0.001
Ashanti Ntonso 5.7 ± 0.3 18.3 ± 0.1 2.016 ± 0.005
Jamasi 5.9 ± 0.2 12.5 ± 0.2 1.875 ± 0.004
Aboaso 5.6 ± 0.1 16.0 ± 0.6 1.900 ± 0.004
Manpongten 6.1 ± 0.2 12.7 ± 0.2 1.430 ± 0.002
Nkwanta 5.5 ± 0.1 41.6 ± 0.5 1.424± 0.002
Fawode 5.5 ± 0.1 13.0 ± 0.2 1.297 ± 0.005
Ahwiaa 5.2 ± .02 34.1 ± 0.2 1.423 ± 0.007
Agona 5.6 ± 0..3 15.2 ± 0.4 1.616± 0.002
Pankrono 6.0 ± 0.2 12.3 ± 0.5 1.429 ± 0.005
Asenua 4.8 ± 0.3 14.8 ± 0.3 1.422 ± 0.003
Greater Accra Ayimensa 6.0 ± 0.6 13.2 ± 0.2 1.419 ± 0.003
Akweteyman 4.9 ± 0.5 32.4 ± 0.5 1.538± 0.003
Amasaman 6.0 ± 0.4 13.7 ± 0.4 1.525± 0.005
Pokuase 3.7 ± 0.3 23.3 ± 0.4 1.642 ± 0.004
Awoshie 5.9 ± 0.2 12.4 ± 0.2 1.433 ± 0.001
Weija 3.6 ± 0.2 12.8 ± 0.2 1.409 ± 0.003
Adenta 4.5 ± 0.3 22.5 ± 0.2 1.426 ± 0.003
Ablekuma 6.1 ± 0.3 21.5 ± 0.3 2.001± 0.002
Oyibi 5.5 ± 0.4 34.6 ± 0.3 1.404 ± 0.002
Afienya 5.3 ± 0.3 14.0 ± 0.1 1.412 ± 0.004
University of Ghana http://ugspace.ug.edu.gh

63
The pH values of honey are of great significance during extraction, processing and storage
as they influence texture, stability and shelf-life (Baroni et al., 2009). The acidic nature of
the honey is important because it inhibits the presence and growth of microorganisms
(Gomes et al., 2010).
Table 4.2: Comparison of pH of Ghanaian honey with that from other parts of the
world
Country pH Range Reference
Ghana 3.60-6.10 This study
Algeria 3.49-4.53 Ouchemoukh et al., (2007)
Brazil 3.10-4.05 Saxena et al., (2010)
Spain 3.63-5.01 Saxena et al., (2010)
Ethiopia 3.82-4.45 Kebede et al., (2012)
India 3.70-4.70 Saxena et al., (2010)
Turkey 3.67-4.57 Saxena et al., (2010)
Portugal 3.70-4.30 Gomes et al., (2010)
4.2.2 The Electrical Conductivity of Honey
Electrical conductivity of honey from the three Regions varied with sampling sites. The
electrical conductivity values recorded ranges from 11.9 µS/cm (Techiman) to 44.4 µS/cm
(Fiapre) in the Brong Ahafo region (Table 4.1). For Ashanti, electrical conductivity varies
from 12.3µS/cm (Pankrono) to 41.6 µS/cm (Nkwanta). The electrical conductivity of
honey from the Greater Accra region varied from 12.4 µS/cm (Awoshie) to 34.6 µS/cm
(Oyibi). These values agree with the limits set by Ghana Standards Authority, Codex
Alimentarius and Council of European Union (CODEX, 2001). The electrical conductivity
depends on the contents of ash, inorganic acids, proteins, some complex sugars and polyols
content in addition to the mineral content which varies with botanical origin (Singh and
Bath, 1997).
University of Ghana http://ugspace.ug.edu.gh
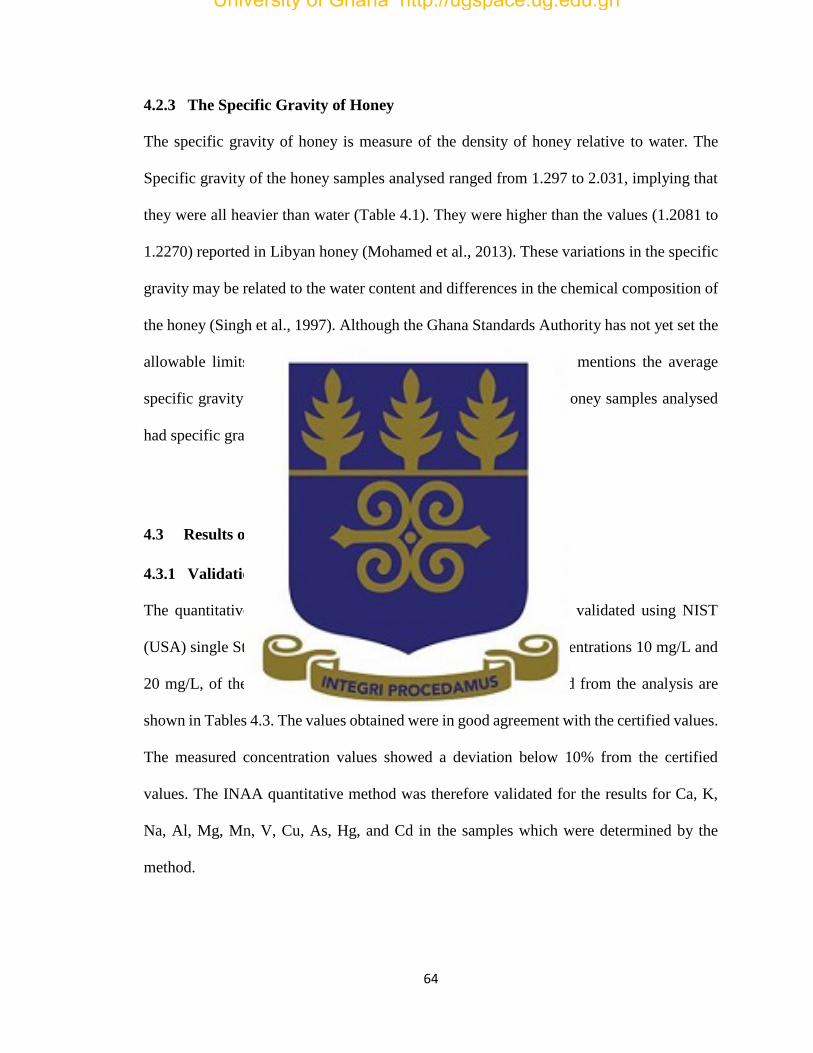
64
4.2.3 The Specific Gravity of Honey
The specific gravity of honey is measure of the density of honey relative to water. The
Specific gravity of the honey samples analysed ranged from 1.297 to 2.031, implying that
they were all heavier than water (Table 4.1). They were higher than the values (1.2081 to
1.2270) reported in Libyan honey (Mohamed et al., 2013). These variations in the specific
gravity may be related to the water content and differences in the chemical composition of
the honey (Singh et al., 1997). Although the Ghana Standards Authority has not yet set the
allowable limits, the Food and Agricultural Organisation (2007) mentions the average
specific gravity of honey to be approximately 1.44. Most of the honey samples analysed
had specific gravity levels closer to this value.
4.3 Results of Elemental Concentration Determination
4.3.1 Validation of INAA Results
The quantitative method of the INAA analytical Technique was validated using NIST
(USA) single Standard Reference Materials (SRM 1643E) of concentrations 10 mg/L and
20 mg/L, of the various elements of interest. The results obtained from the analysis are
shown in Tables 4.3. The values obtained were in good agreement with the certified values.
The measured concentration values showed a deviation below 10% from the certified
values. The INAA quantitative method was therefore validated for the results for Ca, K,
Na, Al, Mg, Mn, V, Cu, As, Hg, and Cd in the samples which were determined by the
method.
University of Ghana http://ugspace.ug.edu.gh

65
Table 4.3: Comparison of Measured and Prepared Standards - Results of 10 mg/L and 20 mg/L Single Standard Elements
used for the Validation
Element Concentration(mg/L)
Measured Prepared Recovery (%) Measured Prepared Recovery (%)
Ca 9.51 ± 0.03 10.00 95.10 19.03 ± 0.04 20.00 95.15
K 9.88 ± 0.04 10.00 98.80 19.73 ± 0.02 20.00 98.65
Na 10.24 ± 0.02 10.00 102.40 20.47 ± 0.03 20.00 102.35
Al 9.80 ± 0.03 10.00 98.00 19.60 ± 0.02 20.00 98.00
Mg 9.37 ± 0.02 10.00 93.70 18.84 ± 0.01 20.00 94.20
Mn 9.93 ± 0.04 10.00 99.30 19.82 ± 0.04 20.00 99.10
V 9.76 ± 0.06 10.00 97.60 19.66 ± 0.06 20.00 98.30
Cu 10.06 ± 0.04 10.00 100.60 20.04 ± 0.03 20.00 100.20
As 9.94 ± 0.06 10.00 99.40 19.91 ± 0.07 20.00 99.55
Hg 10.16 ± 0.04 10.00 101.60 20.38 ± 0.04 20.00 101.90
Cd 9.81 ± 0.05 10.00 98.10 19.68 ± 0.05 20.00 98.40
University of Ghana http://ugspace.ug.edu.gh

66
4.3.2 Elemental Content of Honey from the Three Regions of Ghana
Results obtained from the analysis were reported in mg/kg since permitted levels of most
elemental concentrations are declared in mg/kg by various organizations. However,
because the concentration values obtained for Ca and K were very high, they were
converted to g/kg using the formula below:
Elemental concentration (g/kg) = Calculated concentration (mg/kg)
1000
The elemental content in honey from the selected sampling areas in the various regions is
presented in Table B1 (Appendix B). The results of the mean concentrations and the
standard deviations obtained as the honey samples move through the various processes are
presented in Tables 4.4 – 4.6. The elemental levels were also monitored from one sampling
site to another. The concentrations of most of the elements in the honey were significantly
different from each other depending on the sampling area. An example is shown (Figure
4.4) for Pb concentration in honey from selected sampling areas.
University of Ghana http://ugspace.ug.edu.gh
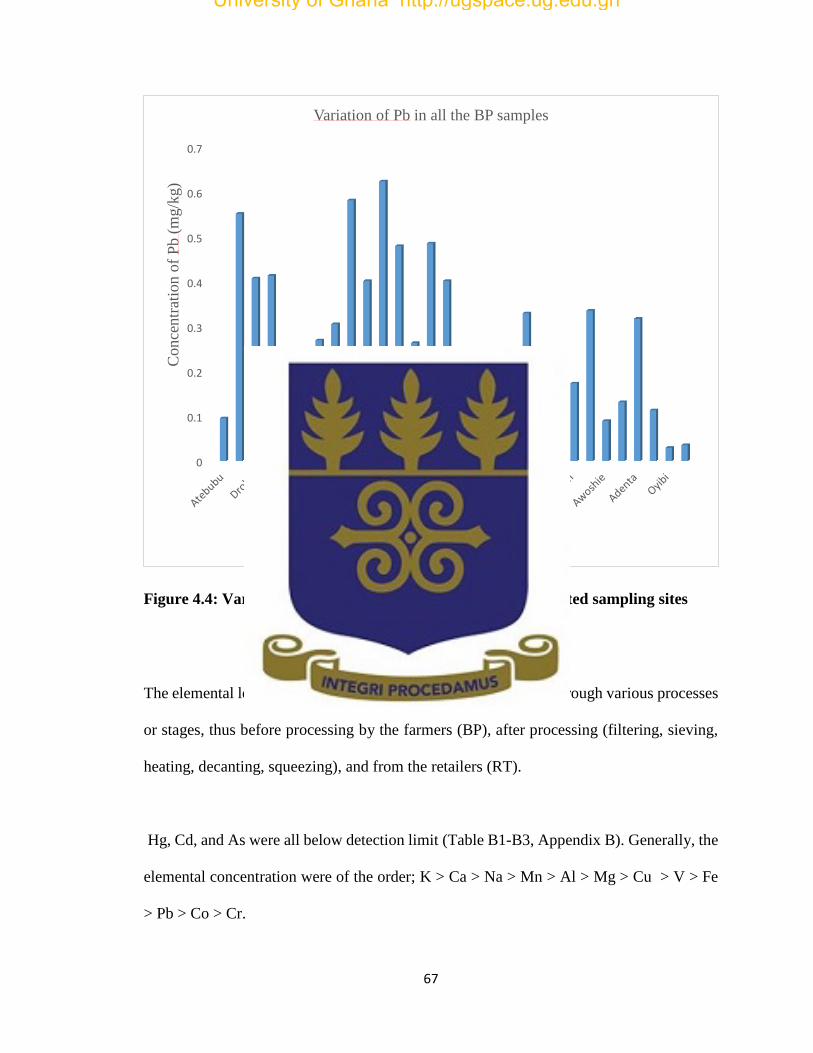
67
Figure 4.4: Variation of Pb concentrations in honey from selected sampling sites
The elemental levels were also monitored as the samples passed through various processes
or stages, thus before processing by the farmers (BP), after processing (filtering, sieving,
heating, decanting, squeezing), and from the retailers (RT).
Hg, Cd, and As were all below detection limit (Table B1-B3, Appendix B). Generally, the
elemental concentration were of the order; K > Ca > Na > Mn > Al > Mg > Cu > V > Fe
> Pb > Co > Cr.
0
0.1
0.2
0.3
0.4
0.5
0.6
0.7
Co
nce
ntr
atio
n o
f P
b (
mg/k
g)
Sampling Sites
Variation of Pb in all the BP samples
University of Ghana http://ugspace.ug.edu.gh

68
Table 4.4: Mean Elemental Composition of Honey from Brong Ahafo
*-concentration in g/kg
BRONG AHAFO REGION
Element
(mg/kg)
Atebubu Fiapre Drobo Dumasua Mantukwa Nsoatre Kintampo Techiman Tanoso Berekum
Co Mean 0.0357 0.0363 0.0400 0.0370 0.0260 0.0340 0.0530 0.0297 0.0113 0.0300
S.D 0.0006 0.0006 0.0000 0.0050 0.0000 0.0017 0.0286 0.0065 0.0021 0.0052
Pb Mean 0.2180 0.6200 0.4840 0.4800 0.3280 0.2620 0.4700 0.4200 0.6220 0.5300
S.D 0.1148 0.0615 0.0682 0.0591 0.1397 0.0781 0.1741 0.1041 0.0500 0.1123
Cr Mean 0.0467 0.0450 0.0870 0.1686 0.0413 0.0383 0.2973 0.0367 0.0367 0.0433
S.D 0.0058 0.0017 0.0728 0.2203 0.0050 0.0068 0.2177 0.0100 0.0100 0.0230
Fe Mean 3.9080 4.9880 3.1800 5.8920 3.4820 3.9200 3.2420 4.6100 2.6900 3.3800
S.D 0.4022 1.5968 0.5495 0.3986 0.4128 0.3779 0.1570 0.6144 0.1693 0.2631
Mg Mean 542.4640 541.0550 395.6321 339.7967 430.4143 405.3100 308.4627 383.6543 385.7790 383.2133
S.D 2.5729 9.8081 4.5614 3.2242 5.9471 3.6732 6.1896 3.8094 4.0316 17.0224
V Mean 33.2817 29.9560 20.7887 21.1967 8.9260 25.4073 30.8617 17.588 31.2320 20.3197
S.D 2.6276 7.5348 4.8927 1.1115 1.0122 3.2800 1.1258 0.3230 1.6231 4.2643
Cu Mean 197.7827 20.2270 13.2587 6.8350 22.6147 86.3010 9.6827 106.7940 101.6483 81.5510
S.D 4.7480 2.6033 2.6119 1.4735 3.0496 1.5987 7.9975 1.1547 0.2689 7.0331
Al Mean 1174.5233 247.0793 439.2717 484.5793 194.6703 179.3197 591.014 445.3960 312.4480 205.1417
S.D 11.6759 14.0442 26.0707 4.2408 5.8756 6.0833 45.5349 1.7131 3.0821 12.3834
Ca* Mean 247.1807 197.3467 176.6833 171.9433 63.3110 59.7103 177.4467 151.9367 91.9300 141.4300
S.D 32.4599 28.3855 8.6574 17.3000 4.4043 26.4403 15.2994 0.1201 1.6956 53.5398
Mn Mean 1822.7750 1653.4533 3467.5883 1843.3847 1356.5773 1455.2943 1993.5473 2139.2213 1506.6863 2004.1577
S.D 12.6003 44.5709 7.1601 147.9600 25.8739 42.0040 3.0223 32.4124 6.6413 4.3472
K* Mean 282.4567 294.6753 1453.4310 475.1277 187.5967 562.2890 112.9793 341.1573 425.2020 1101.5650
S.D 1.0987 0.1986 0.0301 0.1498 4.3146 3.7203 0.0510 1.0164 0.7097 0.0044
Na Mean 4657.3620 4737.7720 5880.6033 3946.8863 4845.2267 4210.4463 3777.6533 3810.0236 3000.3900 4775.4903
S.D 39.1503 10.6335 51.4924 4.2662 49.3571 96.6931 57.2630 14.0179 9.4550 22.2575
University of Ghana http://ugspace.ug.edu.gh

69
Table 4.5: Mean Elemental Composition of Honey from Ashanti region
*-concentration in g/kg
ASHANTI REGION
Element
(mg/kg)
Ntonso Jamasi Aboaso Mampong-
ten
Nkwanta Fawode Ahwiaa Agona Pankrono Asenua
Co Mean 0.0130 0.0267 0.0327 0.0347 0.0650 0.0370 0.0663 0.0307 0.0253 0.0620
S.D 0.0000 0.0114 0.0058 0.0040 0.0017 0.0231 0.0552 0.0050 0.0107 0.0236
Pb Mean 0.7100 0.5080 0.1520 0.3800 0.3640 0.5160 0.5400 0.3360 0.22240 0.3000
S.D 0.1057 0.0250 0.0577 0.1006 0.0330 0.1041 0.0540 0.1917 0.1026 0.0908
Cr Mean 0.0317 0.0349 0.0343 0.2173 0.0477 0.0457 0.0423 0.0500 0.0290 0.0277
S.D 0.0188 0.0252 0.0023 0.1415 0.0006 0.0072 0.0023 0.0035 0.0072 0.0116
Fe Mean 1.9500 4.4620 4.1560 3.3180 1.7300 3.3980 2.2200 2.9980 3.2000 4.4620
S.D 0.4987 0.3064 0.0976 1.0716 0.1337 0.3412 0.1324 0.1142 0.1752 0.1230
Mg Mean 418.6156 330.2323 100.0001 195.1350 318.9280 211.6340 440.6633 514.9543 671.544 157.2753
S.D 25.0464 10.3771 3.004 3.5554 12.4204 6.7312 9.9946 5.1355 11.2443 3.6585
V Mean 4.9856 11.9867 6.1073 15.6793 10.8983 5.1563 9.2680 0.5037 5.7290 3.8473
S.D 1.7740 3.7009 0.0821 3.1704 2.0811 2.7058 2.7125 0.0172 1.3822 1.1709
Cu Mean 15.0090 190.3077 84.3117 8.2970 74.9140 53.8947 24.1037 15.2230 10.4060 107.5417
S.D 1.6881 3.3890 3.6199 3.0369 2.2600 4.1751 0.0879 3.5117 1.0351 4.7473
Al Mean 279.6383 251.4637 317.3800 229.2820 303.1423 282.8387 252.842 249.3027 530.6137 244.5623
S.D 19.2713 4.1989 0.7625 6.3122 6.9782 2.5205 13.5076 24.1836 39.6420 2.5200
Ca* Mean 72.6733 190.9293 121.8033 120.2153 67.1590 102.2143 58.4980 47.9207 146.2220 74.8833
S.D 2.3255 69.8371 1.3162 3.4519 4.2855 19.2318 0.6632 12.7023 32.5773 4.2997
Mn Mean 3137.7000 1069.6100 1725.8800 1163.9900 1404.2400 1550.1600 2842.6400 2534.0800 3477.4300 1940.5600
S.D 72.8965 54.2460 6.9726 50.9762 54.5700 45.6547 40.5790 38.1607 2020.6138 17.9672
K* Mean 260.4087 364.6210 588.2210 1703.0633 146.7010 963.6800 461.2683 1271.8577 585.8680 855.2023
S.D 1.4527 0.0772 1.8282 58.6373 0.0598 0.4073 0.1712 0.2666 0.1184 0.7521
Na Mean 5529.5887 6176.7757 5113.9673 4858.9260 8254.2360 6927.9407 4073.4293 5845.7257 5777.8963 4426.3760
S.D 27.4145 10.8066 5.9912 51.9602 300.4345 30.1026 10.0650 55.6901 63.1348 11.2527
University of Ghana http://ugspace.ug.edu.gh

70
Table 4.6: Mean Elemental Composition of Honey from Greater Accra
GREATER ACCRA REGION
Element
(mg/kg)
Ayime-
nsa
Akwetey-
man
Amasam-
an
Pokuase Awoshie Weija Adenta Ablekuma Oyibi Afienya
Co Mean 0.0380 0.0380 0.0473 0.0363 0.0193 0.0360 0.0420 0.0360 0.0410 0.0637
S.D 0.0017 0.0026 0.0023 0.0023 0.0021 0.0000 0.0000 0.0000 0.0000 0.0287
Pb Mean 0.3500 0.2960 0.3680 0.4840 0.1960 0.3560 0.4700 0.1500 0.2320 0.1740
S.D 0.1805 0.1762 0.1712 0.1638 0.1265 0.1941 0.1350 0.0360 0.2446 0.1277
Cr Mean 0.0413 0.0373 0.0410 0.0503 0.0447 0.0493 0.0407 0.0420 0.0460 0.0610
S.D 0.0012 0.0012 0.0017 0.0067 0.0072 0.0025 0.0050 0.0000 0.0035 0.0154
Fe Mean 2.7800 2.7300 5.6480 2.7940 3.0820 2.9000 3.3700 3.0420 4.2500 4.6680
S.D 0.9176 0.6663 4.6878 0.2863 0.7404 0.2806 1.0367 0.4315 0.2793 2.5214
Mg Mean 92.5180 311.8213 228.6547 329.9510 81.9697 128.8803 196.0753 146.7843 80.1720 242.8413
S.D 0.5432 10.2334 2.1899 17.8537 6.3757 5.6825 18.6497 2.9045 3.9183 4.1836
V Mean 1.2193 6.8247 912.7723 3.1043 1.4440 5.7353 5.2080 7.1883 1.7227 4.4370
S.D 0.2127 1.2389 3.9491 0.0679 0.2690 1.3934 0.8032 4.3207 1.2959 4.1395
Cu Mean 152.2703 30.9353 254.6657 5.5353 27.3097 80.1523 274.6233 67.9913 16.2833 61.7223
S.D 3.4260 0.8467 5.5395 1.1862 7.7304 3.5696 12.3676 4.1289 5.6608 5.7159
Al Mean 227.1263 509.3520 254.9110 379.2083 64.6103 196.1067 86.6410 77.0860 105.5190 102.4607
S.D 20.8868 12.0049 39.2325 10.7243 3.8583 3.0030 2.6875 1.3155 6.2140 4.7072
Ca* Mean 45.6503 75.2987 73.8903 109.8590 56.0767 62.8880 25.2557 155.1310 238.0643 58.1713
S.D 5.1620 1.5653 0.3067 1.2384 5.3052 0.6315 1.4881 2.2202 7.0471 0.5684
Mn Mean 2540.1500 839.1570 2261.5600 2495.0400 1297.6400 970.1210 1164.3700 1382.5000 906.4910 1372.5000
S.D 26.3693 55.1474 31.2977 15.1567 5.5976 6.1121 36.7713 60.9132 0.6716 17.9205
K* Mean 317.4070 430.0830 181.5580 323.5480 167.0830 332.4610 681.5480 456.2200 231.1830 408.6290
S.D 0.1238 0.0404 0.0418 0.1554 0.1007 1.2107 0.1695 0.0494 0.0751 0.0442
Na Mean 5727.2407 4196.0680 3307.8437 912.5870 1269.1213 1980.7493 4693.3287 2582.4847 3157.1637 4215.1917
S.D 49.4495 9.3945 46.2541 13.1610 7.4207 9.7254 28.1226 6.2825 5.0700 4.7223
*-concentration in g/kg
University of Ghana http://ugspace.ug.edu.gh

71
University of Ghana http://ugspace.ug.edu.gh

71
4.3.3 Elemental Concentrations of Honey from Brong Ahafo Region
The concentration observed in the region were K (112.933-1453.454 g/kg); Ca (62.135 –
283.690 g/kg); Na (2993.418-5919.315 mg/kg); Mn (1339.216-3474.237 mg/kg); Al
(175.369-1186.369 mg/kg); Mg (302.015 – 545.336 mg/kg); Cu (4.991-203.265 mg/kg),
V (8.032-35.021mg/kg); Fe (2.496-6.792 mg/kg); Pb (0.096-0.678 mg/kg); Cr (0.026-
0.423 mg/kg) and Co (0.009-0.086 mg/kg).
With the exception of Al (in the Berekum samples) where there was a decrease in
concentration, all the other elements increased in concentration along the supply chain
(before processing, after processing, and from the retailer) (Figures 4.5 to 4.16).
To monitor which of the subsequent handling processes significantly affects the honey’s
composition, the data were subjected to Analysis of Variance (ANOVA) at 95% confidence
interval. With the exception Co (with P>0.05, Table C1, Appendix C), the samples taken
from Atebubu showed statistically significant differences in concentrations of all the other
elements (K, Ca, Na, Mn, Al, Mg, Cu, V, Fe, Cr, Pb) at 95% confidence interval (P<0.05,
ANOVA). They were therefore subjected to Least Significant Difference and Tukey
analysis to determine where the differences arose from. The analysis revealed that, for Cr
and K, the BP values were far less than the mean concentration (Table 4.4), but the AP and
RT values were closer to the mean, implying that the changes in composition of these
elements can be attributed to how the farmer treated the honey, after extraction. The other
elements however, all had their before processing, after processing and retailer values
significantly deviating from their respective mean concentrations (Table 4.4). Similar trend
was observed in the results of the samples taken from Dumasua, Mantukwa, and Techiman.
University of Ghana http://ugspace.ug.edu.gh

72
Figure 4.5: Concentration of Co in all the samples analysed
-0.05
0
0.05
0.1
0.15
0.2C
once
ntr
atio
n o
f C
o (m
g/k
g)
Sampling Site
Concentration of Co in all the samples
Before Proc. After Proc. Retailer
University of Ghana http://ugspace.ug.edu.gh
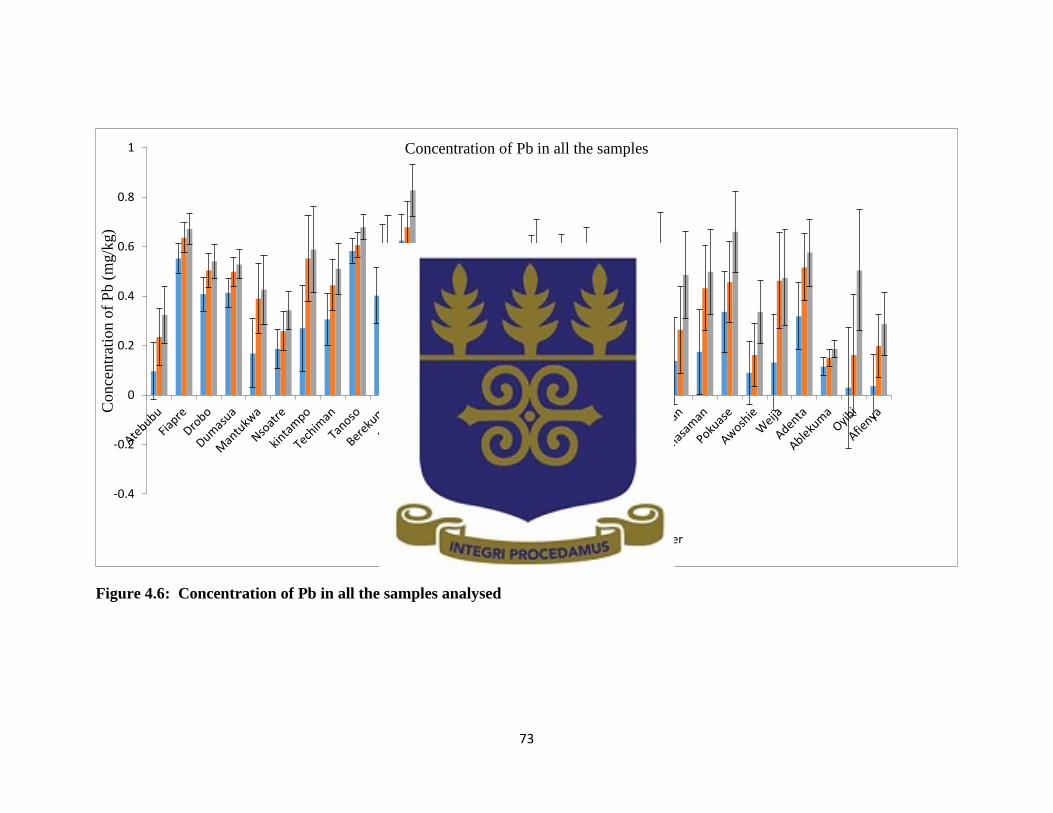
73
Figure 4.6: Concentration of Pb in all the samples analysed
-0.4
-0.2
0
0.2
0.4
0.6
0.8
1
Conce
ntr
atio
n o
f P
b (
mg/k
g)
Sampling Sites
Concentration of Pb in all the samples
Before Proc. After Proc Retailer
University of Ghana http://ugspace.ug.edu.gh
74
With the exception of Co and Cr in the samples taken from Fiapre, (with P>0.05, ANOVA),
the differences in concentration of all the other elements (K, Ca, Na, Mn, Al, Mg, Cu, V,
Fe, Pb) were statistically significant at 95% confidence interval (P<0.05, ANOVA). The
LSD and Tukey analysis revealed that, for K, the RT value deviated significantly from the
mean, but the BP and AP values were closer to the mean, implying that the changes in
composition of these elements can be attributed to how the Retailer treated the honey, after
buying it from the farmer. The other elements however, all had their BP, AP and RT values
significantly deviating from their respective mean concentrations. Similar trend was
observed in the results from Drobo, Nsoatre and Berekum.
The statistical analysis of results from Kintampo and Techiman were similar. The
differences in concentration of all the elements were statistically significant at 95%
confidence interval (P<0.05, ANOVA). However, the LSD and Tukey analysis revealed
that, in the results of Kintampo, for Cr and K, the BP values were far less than the mean,
but the AP and RT values were closer to the mean, implying that the changes in
composition of these elements can be attributed to how the farmer treated the honey after
extraction. In the results of Tanoso, for V and K, the LSD and Tukey analysis revealed
that, in both metals the RT value deviated significantly from the mean, but the BP and AP
values were closer to the mean, signifying that the changes in composition of these
elements can be attributed to how the Retailer handled the honey, after buying it from the
farmer. The other elements however, all had BP, AP and RT values significantly deviating
from their respective mean concentrations.
The null hypothesis (that the subsequent handling processes honey goes through after
harvesting has no significant effect on its composition) was therefore rejected.
University of Ghana http://ugspace.ug.edu.gh
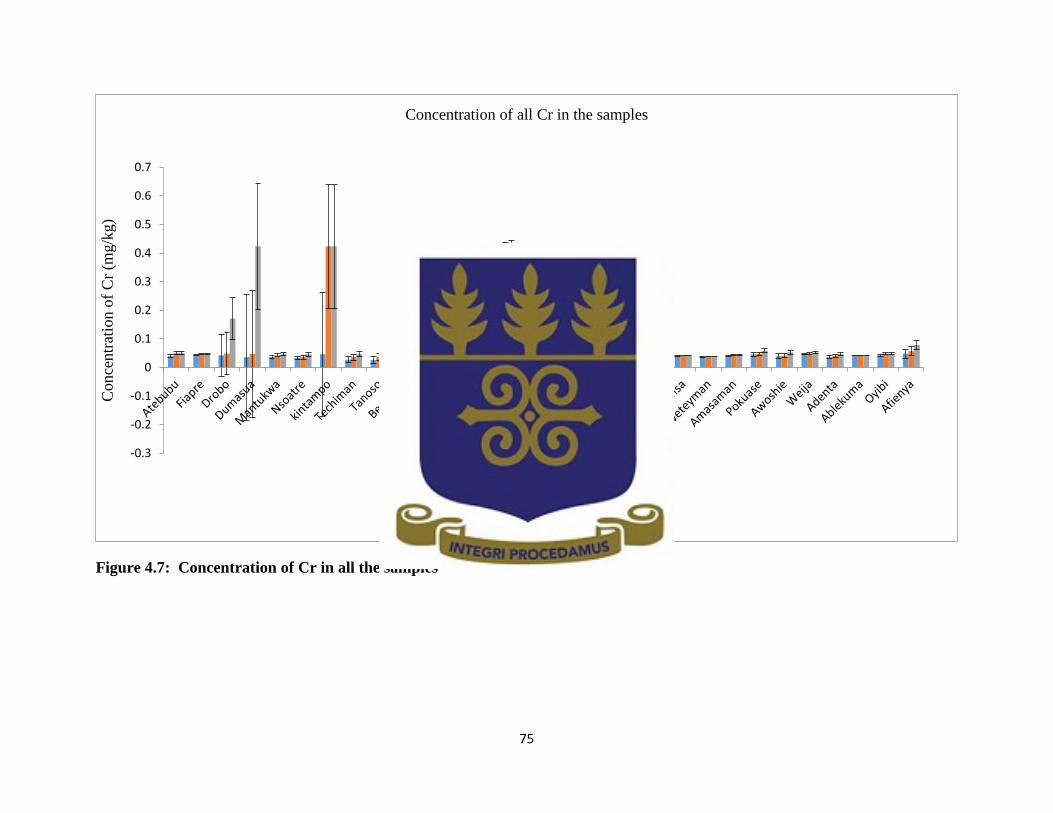
75
Figure 4.7: Concentration of Cr in all the samples
-0.3
-0.2
-0.1
0
0.1
0.2
0.3
0.4
0.5
0.6
0.7
Conce
ntr
atio
n o
f C
r (m
g/k
g)
Sampling Sites
Concentration of all Cr in the samples
Before Proc. After Proc. Retailer
University of Ghana http://ugspace.ug.edu.gh

76
Figure 4.8: Concentration of Fe in all the samples analysed
-4.000
-2.000
0.000
2.000
4.000
6.000
8.000
10.000
12.000
14.000
16.000
18.000
Conce
ntr
atio
n o
f F
e (m
g/k
g)
Sampling Site
Concentration of Fe in all the samples
Before Proc. After Proc Retailer
University of Ghana http://ugspace.ug.edu.gh
77
4.3.4 Elemental Concentrations of Honey from Ashanti Region
The highest concentration was observed for K (146.666-1770.770 g/kg); Ca (39.917 –
271.566 g/kg); Na (4062.321-8277.351 mg/kg); Mn (1009.020-3501.004 mg/kg); Al
(223.687-576.354 mg/kg); Mg (97.369 – 681.236 mg/kg); Cu (5.186-192.666 mg/kg); V
(0.490-19.268 mg/kg); Fe (1.548-4.812 mg/kg); Pb (0.090-0.828 mg/kg); Cr( 0.010-0.378
mg/kg) and Co (0.013-0.130 mg/kg) in that order.
With the exception of Cu (in the samples collected at Agona and Ntonso) and Ca (in the
Manpongten samples), where there was a decrease in concentration, all the elements in the
samples increased in concentration as they moved through the various stages or processes
(before processing, after processing, and from the retailer) (Figures 4.5 to 4.16).
To monitor which of the subsequent handling processes significantly affects the honey’s
composition, the data were subjected to Analysis of Variance (ANOVA) at 95% confidence
interval.
With the exception Co and Pb (with P > 0.05, ANOVA), the samples taken from Ntonso
showed statistically significant differences in concentrations of all the other elements (K,
Ca, Na, Mn, Al, Mg, Cu, V, Fe, Cr) at 95% confidence interval (P<0.05, ANOVA). They
were therefore subjected to LSD and Tukey analysis to determine where the differences
arose from. The analysis revealed that, for Cr the BP values were far less than the mean,
but the AP and RT values were closer to the mean concentration (Table 4.5). This implies
that the changes in composition of these elements can be attributed to how the farmer
treated the commodity after extraction. The other elements however, all had their BP, AP
University of Ghana http://ugspace.ug.edu.gh

78
and RT values significantly deviating from their respective mean concentrations (Table
4.5), implying that the variations in composition of these elements can be attributed to both
the farmer and the retailers, with regard to how they treated and stored the honey samples.
With the exception Cr and K (with P>0.05), the samples taken from Jamasi showed
statistically significant differences in concentrations of all the other elements (Ca, Na, Mn,
Al, Mg, Cu, V, Fe, Pb) at 95% confidence interval (P<0.05, ANOVA). The LSD and Tukey
analysis revealed that, in Co and Pb, BP values were far less than the mean, but the AP and
RT values were closer to the mean, implying that the changes in composition of these
elements can be attributed to how the farmer treated the honey after extraction. The other
elements however, all had their BP, AP and RT values significantly deviating from their
respective mean concentrations.
The statistical analysis results of samples from Aboaso and Manpongten samples were
similar. With the exception Co and Cr (with P>0.05, ANOVA) the differences in
concentration of all the elements were statistically significant at 95% confidence interval
(P<0.05, Table C2: Appendix C). LSD and Tukey analysis revealed that, the other
elements however, all had their BP, AP and RT values significantly deviating from their
respective mean concentrations, implying that the variations in composition of these
elements can be attributed to both the farmer and the retailers with regard to how they
treated and stored the honey samples.
University of Ghana http://ugspace.ug.edu.gh

79
Figure 4.9: Concentration of Mg in all the samples analysed
0
100
200
300
400
500
600
700
800
Conce
ntr
atio
n o
f M
g (
mg/k
g)
Sampling Site
Concentration of Mg in all the samples
Before Proc. After Proc. Retailer
University of Ghana http://ugspace.ug.edu.gh

80
Figure 4.10: Concentration of V in all the samples analysed
-5
0
5
10
15
20
25
30
35
40
45C
once
ntr
atio
n o
f V
(m
g/k
g)
Sampling Sites
Concentration of V in all the samples
Before Proc. After Proc. Retailer
University of Ghana http://ugspace.ug.edu.gh

81
Figure 4.11: Concentration of Cu in all the samples analysed
-50
0
50
100
150
200
250C
once
ntr
atio
n o
f C
u (
mg/k
g)
Sampling Sites
Concentration of Cu in all the samples
Before Proc. After Proc. Retailer
University of Ghana http://ugspace.ug.edu.gh
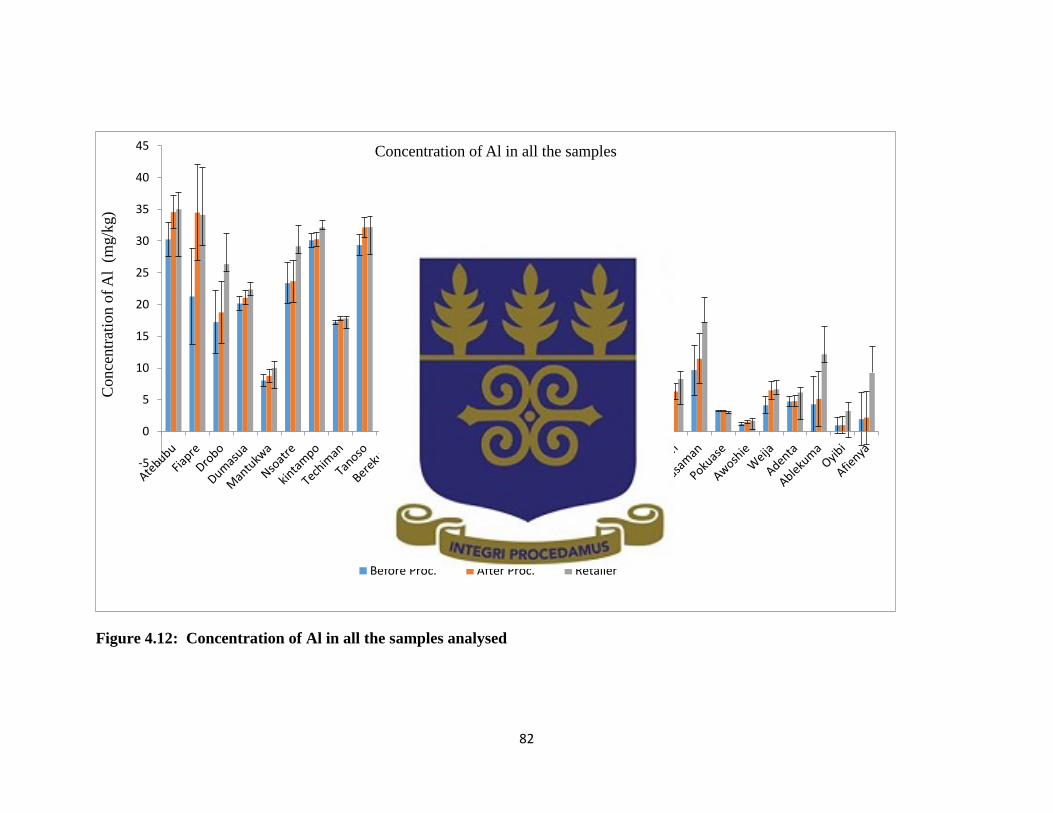
82
Figure 4.12: Concentration of Al in all the samples analysed
-5
0
5
10
15
20
25
30
35
40
45
Conce
ntr
atio
n o
f A
l (
mg/k
g)
Sampling Sites
Concentration of Al in all the samples
Before Proc. After Proc. Retailer
University of Ghana http://ugspace.ug.edu.gh
83
The statistical analysis results of the samples from Agona and Asenua samples were also
similar. With the exception Co (with P>0.05) the differences in concentration of all the
elements were statistically significant at 95% confidence interval (P<0.05, ANOVA). The
LSD and Tukey analysis revealed that, for Cr ( in both of them), the RT values were far
more than the mean, but the BP and AP values were closer to the mean (Table 4.6),
signifying that the changes in composition of these elements can be attributed to how the
retailer treated the honey, after buying it from the farmer.
At Fawode, with the exception Co and V (with P>0.05) the differences in concentration of
all the elements were statistically significant at 95% confidence interval (P<0.05,
ANOVA). For K, the LSD and Tukey analysis revealed that, BP values were far less than
the mean, but the AP and RT values were closer to the mean (Table 4.5), implying that the
changes in composition of these elements can be attributed to how the farmer treated the
honey after extraction. The other elements however, all had their BP, AP and RT values
significantly deviating from their respective mean concentrations, implying that the
variations in composition of these elements can be attributed to both the farmer and the
retailers with regard to how they treated and stored the honey samples.
For Nkwanta, with the exception Co, Cr and K (with P>0.05) the differences in
concentration of all the elements were statistically significant at 95% confidence interval
(P<0.05). The LSD and Tukey analysis revealed that the other elements however, all had
their BP, AP and RT values significantly deviating from their respective mean
concentrations, implying that the variations in composition of these elements can be
University of Ghana http://ugspace.ug.edu.gh
84
attributed to both the farmer and the retailers with regard to how they treated and stored
the honey samples.
With the exception Cr and Cu (with P>0.05) the samples taken from Pankrono showed
statistically significant differences in concentrations of all the other elements (K, Ca, Na,
Mn, Al, Mg, V, Fe, Pb, Cr) at 95% confidence interval (P<0.05, ANOVA). For Co, the
LSD and Tukey analysis revealed that the RT values were far more than the mean, but the
BP and AP values were closer to the mean, implying that the changes in composition of
these elements can be attributed to how the Retailer treated the honey, after buying it from
the farmer. The other elements however, all had BP, AP and RT values significantly
deviating from their respective mean concentrations, implying that the variations in
composition of these elements can be attributed to both the farmer and the retailers with
regard to how they treated and stored the honey samples.
With the exception of Cr (with P>0.05) the samples taken from Ahwiaa showed statistically
significant differences in concentrations of all the other elements (K, Ca, Na, Mn, Al, Mg,
Cu, V, Fe, Cr) at 95% confidence interval (P<0.05, ANOVA). For K, the LSD and Tukey
analysis revealed that, BP values were far less than the mean, but the AP and RT values
were closer to the mean, implying that the changes in composition of these elements can
be attributed to how the farmer treated it, after extraction. For Cr, the RT values were far
more than the mean, but the BP and AP values were closer to the mean, implying that the
changes in composition of these elements can be attributed to how the Retailer treated it,
after buying it from the farmer. The other elements however, all had BP, AP and RT values
University of Ghana http://ugspace.ug.edu.gh

85
significantly deviating from their respective mean concentrations, implying that the
variations in composition of these elements can be attributed to both the farmer and the
retailers with regard to how they treated and stored the honey samples.
The null hypothesis (that the subsequent handling processes honey goes through after
harvesting has no significant effect on its composition) was therefore rejected.
4.3.5 Elemental Concentrations of Honey from Greater Accra Region
The highest concentration was observed for K (166.990-681.743 g/kg); Ca (23.926 –
157.577 g/kg); Na (900.214-5784.012 mg/kg); Mn (145.668-2566.847 mg/kg); Al (60.159-
523.148 mg/kg); Mg (75.697 – 350.144 mg/kg); Cu (4.524-288.298 mg/kg); V (1.001-
17.215 mg/kg); Fe (1.824-11.052 mg/kg); Pb (0.030-0.660 mg/kg); Co( 0.017-0.094
mg/kg) and Cr (0.036-0.078 mg/kg) in that order.
With the exception of Mg (Amasaman samples) , V (Pokuase samples), Cu (Adenta
samples) and Al (Adenta samples) where there was a decrease in concentration, all the
samples increased in concentration levels as they moved through the various routes (before
processing, after processing, and from the retailer) (Figures 4.5 to 4.116). The data were
subjected to Analysis of Variance (ANOVA) at 95% confidence Interval.
The variations in the concentrations of Pb, Fe, Mg, V, Cu, Al, Ca, Mn, and Na in all the
samples were statistically significant at 95% confidence Interval (P<0.05, ANOVA) (Table
B3, Appendix B). However, Co (in all the samples), Cr (Weija samples, Adenta samples,
Ablekuma samples) and K (sampled at Awoshie, Ablekuma, Afienya and Oyibi) did not
University of Ghana http://ugspace.ug.edu.gh

86
show significant variations in concentrations levels at 95% confidence interval. (P>0.05,
Table C3, Appendix C).
Those with significant differences in concentrations were further subjected to LSD and
Tukey analysis to determine whether the difference can be attributed to the samples
obtained from the farmer before processing, from the farmer after processing or from the
retailer (i.e those that deviated largely from the mean concentrations). It was found that,
the differences in concentrations of Pb, Fe, Mg, V and Cu, all deviated significantly from
their respective mean concentrations (Table 4.6). The null hypothesis (the processes honey
goes through after harvesting has no significant effect on its composition) was then
rejected. Similar deviations from the mean were also observed for Na, Ca, Mn, and K,
except the Na and Ca in samples collected at Oyibi, Mn in samples collected at Afienya,
and K in samples collected at Pokuase, Weija and Ayimensa, where only the samples
obtained from the retailer and from the farmer before processing deviated from the mean
concentrations (Table 4.6) respectively.
University of Ghana http://ugspace.ug.edu.gh

87
Figure 4.13: Concentration of Ca in all the samples analysed
-5
0
5
10
15
20
25
30
35
40
45
Conce
ntr
atio
n o
f C
a (g
/kg)
Sampling Sites
Concentration of Ca in all the Samples
Before Proc. After Proc. Retailer
University of Ghana http://ugspace.ug.edu.gh

88
Figure 4.14: Concentration of Mn in all the samples analysed
-5
0
5
10
15
20
25
30
35
40
45C
once
ntr
atio
n o
f M
n (
mg/k
g)
Sampling Sites
Concentration of Mn in all the Samples
Before Proc. After Proc. Retailer
University of Ghana http://ugspace.ug.edu.gh
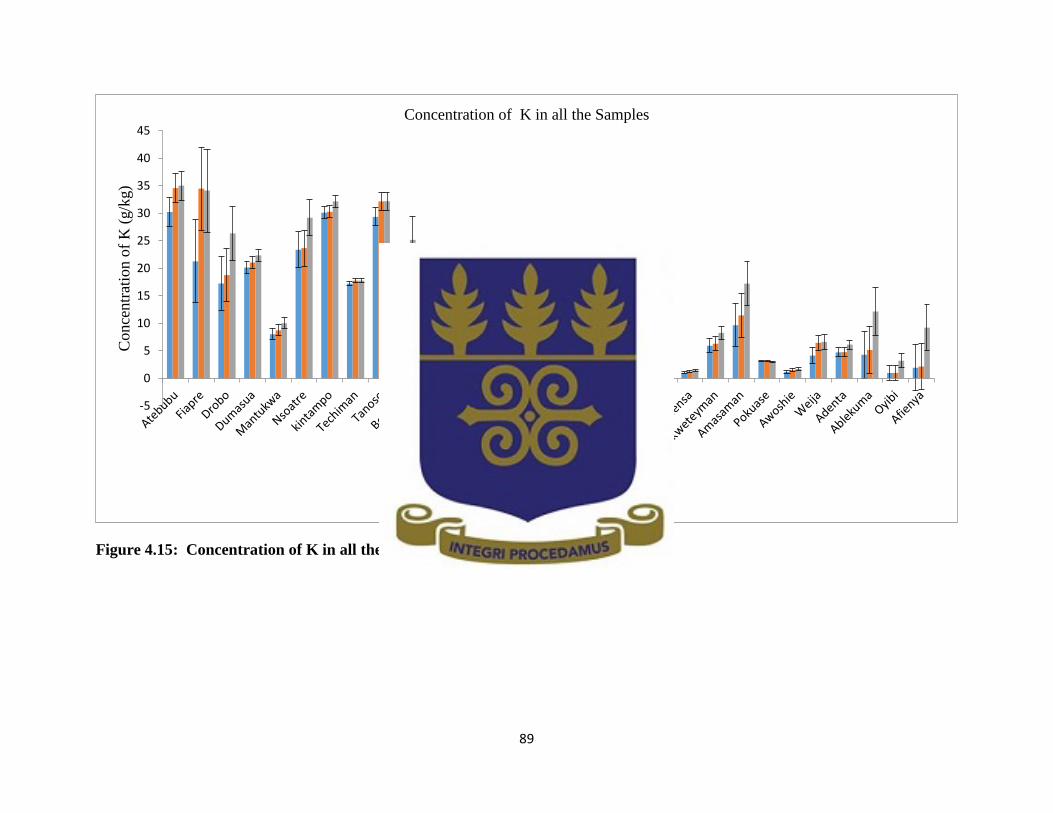
89
Figure 4.15: Concentration of K in all the samples analysed
-5
0
5
10
15
20
25
30
35
40
45C
once
ntr
atio
n o
f K
(g/k
g)
Sampling Sites
Concentration of K in all the Samples
Before Proc. After Proc. Retailer
University of Ghana http://ugspace.ug.edu.gh

90
Figure 4.16: Concentration of Na in all the samples analysed
-5
0
5
10
15
20
25
30
35
40
45
Conce
ntr
atio
n o
f N
a (m
g/k
g)
Sampling Sites
Concentration of Na in all the Samples
Before Proc. After Proc. Retailer
University of Ghana http://ugspace.ug.edu.gh
91
4.4 Comparison of Elemental Compositions of Ghanaian Honey at the Various
Sampling Site
The samples collected from Brong Ahafo region recorded the highest levels of Ca, Al, V
and Cr. Since these essential elements are abundant in the earth’s crust (Taylor, 1964), they
may have been directly added by the bees during the honey production. The wooding and
metallic equipments used by the beekeepers might also have contributed to presence of
some metal levels in the honey. The levels of all the Co and Fe in the samples taken from
the various sampling sites in the Brong Ahafo region, showed significant deviations from
their respective mean concentrations, except the samples collected at Atebubu.
With the exception of the samples collected at Dumansua and Mantukwa, the
concentrations of all Cr, also deviated significantly from the mean concentrations. The
levels of Pb, V, Cu, Al, Ca, Mn, K and Na in all the sampling sites in the Brong Ahafo
region deviated significantly from the their respective mean concentrations. This imply that
the elemental composition of honey depends greatly on the environment in which the
samples are taken from, a fact that has been often considered in the elemental and
physiological studies of honey by researchers (Persano et al., 2004).
The samples collected from Ashanti region recorded the highest levels of Pb, Mg, K, Na
and Mn. The Pb may have been added from exhausts of automobiles due to the closeness
of most of the apiaries in the region to tarred roads. Mg, K, Na and Mn may have been
picked up by the bees during foraging, and added to the honey during production. With the
exception of Co (collected at Aboaso and Agona), Fe (collected at Pankrono), V (collected
University of Ghana http://ugspace.ug.edu.gh

92
at Aboaso), Al and Ca (collected at Fawode) all the other metals in the samples collected
from the various sites varied significantly from their respective mean concentrations.
The samples collected from Greater Accra region recorded the highest levels of Cu, Fe and
Co. Whiles some of these metals may have been added by the bees to the honey during
production, some may also have been added by the farmers during extraction. The Co and
Cr content in most of the samples did not differ significantly from their respective mean
concentrations. However, with the exception of Pb (collected at Amasaman), Fe (collected
at Weija and Ablekuma) and Al (collected at Weija), all the other metals in the honey
samples collected from the various sites varied significantly from their respective mean
concentrations. This also affirms that geographical origin has a significant effect on
honey’s composition (Persano et al., 2004).
4.5 Variations of Metal Content of Ghanaian Honey as it goes Through the Various
Processes
In general, potassium and calcium were the main elements, accounting for the majority of
the honey’s composition. Cadmium, mercury and arsenic were all below detection limit.
This might be because none of the sampling sites visited were in the vicinity of a
metallurgical or mining industry (Pendias et al., 1999).
There were some differences and similarities among the results. It was observed that, the
metal composition in most of samples analysed increased as the honey goes through
various processes or channels (from the farmers to the retailers). For instance, in the
University of Ghana http://ugspace.ug.edu.gh

93
samples taken from Atebubu in the Brong Ahafo region, Fe concentration before
processing was 3.756 mg/kg. The Fe concentration increased to 4.416 mg/kg after the same
honey was filtered into metal containers and later transferred into a gallon. When the same
honey was collected from a retailer who bought it directly from farmer, the Fe
concentration recorded was 6.792 mg/kg.
On the other hand, few of the samples analysed showed reduction in concentration along
the sampling chain. For instance, in the samples taken from Manpongten in the Ashanti
region, Ca concentration before processing was 120.960 g/kg. The Ca concentration
increased slightly to 121.130 g/kg after the same honey has been extracted from the comb
and sieved to remove bees and other bee products from it. When aliquots of the same honey
were sampled from a retailer who bought it directly from the farmer, the Ca concentration
recorded was 116.248 g/kg. The decrease in concentration may be attributed to adsorption
of the metals onto their storage containers.
As the Ghana Standard Authority (GSA) has not yet set allowable limits for the presence
of some metals (such as K, Cu, Fe, Ca, Na, V etc) in honey, noticeable contents of trace
metals cannot ascertain contamination with these metals.
Lead was detected in the entire sample, with the levels varying from 0.030 to 0.828 mg/kg.
However, these levels were less than the maximum limit sets by Ghana Standard Authority
(GSA) and Codex Alimentarius (1.0 mg/kg) for lead in honey. Presence of lead in the
freshly extracted honey may have been introduced into the honey from the emissions of
automobile exhaust gases (Kebede et al., 2012). Dust (containing lead particles) falling on
University of Ghana http://ugspace.ug.edu.gh

94
the unprocessed honey may have also contributed the levels of lead recorded in the samples
taken before processing.
Table 4.7: Accepted levels of some parameters in honey
Parameter/Element Limit/Range Organisations
pH 3.6-6.1 National Honey Board of USA
Electrical Conductivity <800µS/cm Council of European Union
Specific Gravity ~ 1.44 Food and Agricultural Organisation
Pb 1.0 mg/kg GSA/ Codex Alimentarius/WHO
As 0.1 mg/kg GSA/ Codex Alimentarius
Cd 0.1 mg/kg GSA/ Codex Alimentarius
Hg 0.1 mg/kg GSA/ Codex Alimentarius
Cu 0.216 mg/kg Italian Legislation
Cu 35 mg/kg Nigerian Standards
Mg 2 - 9 mg/day U.S. Department of Health and
Human Services
Fe 200-250 mg/kg of body
weight (lethal dose)
US Nuclear Regulatory Commision
Cr 20 – 50 µg/adults U.S. Dept. of Health and Human
Services
Source: GS Codex Stan 193:1995, Published by GSA in 2014; Mohamed et al., (2010); U.S. Dept. of Health
and Human Services (1999); USNRC (1979); Food and Agricultural Organisation (2007).
Increase in lead concentrations after processing maybe related to metal containers used or
from dust that contains lead falling onto them during processing. Further increase in the
lead concentrations of the honey bought from the retailers may be attributed to their storage
in improperly glazed pottery or leaded-crystal containers. (ATSDR, 1999).
University of Ghana http://ugspace.ug.edu.gh

95
Copper also was detected in all honey samples. As reported by the Agency for Toxic
Substances and Disease Registry, U.S. Department of Health and Human Services, copper
is necessary for good health. However, very large single or daily intakes of copper can
harm human health. It is one of the essential metals present in honey. It is not toxic if it is
present in a limited amount (Mohamed et al., 2010). Its concentration levels in this study
ranges from 4.524 to 288.298 mg/kg. Italian Standards set the allowable limit for the
presence of copper in honey at 0.216 mg/kg (Caroli et al., 1999) implying that all the honey
samples collected from the three regions were contaminated. On other hand, Polish
Standards and Nigerian Regulations have set a limit of 10 mg/kg (Roman et al., 2011) and
35 mg/kg (Adebiyi et al., 2004) for the presence of copper in honey sample. This also
implies that most of the honey samples collected from the three regions was contaminated.
Some of the Cu may have been picked up from the environment by the bees and added to
the honey during production. The increase in concentrations along the sampling routes may
be related to the medium and metal containers used by the beekeepers to process the honey
before they were sold in the market.
Vanadium was recorded in all the samples analyzed with a concentration range of 0.490 –
35.021 mg/kg. It is not yet known, the health effects in people of ingesting vanadium.
However, it is reported that an intake of over 10 mg of V per day can be toxic for adults;
the source is usually airborne anthropogenic V (WHO, 1996). Vanadium may have entered
the honey from natural sources; added by the bees during production, or from the burning
of fuel oils. The levels increased as it moved through the various processes. It may have
combine with other elements and particles, and found its way into the honey during
University of Ghana http://ugspace.ug.edu.gh
96
processing (ATSDR, 1992). There were few instances where the V concentration in the
honey from the retailers were lesser that of the freshly extracted honey. This may be as
result of the additives (mostly water) added to dilute the honey to increase its volume. The
reduction may also be attributed to adsorption of metals in the honey onto the containing
vessels or onto other contaminants such as charcoal. Heating of samples during heat-
extraction introduced contaminants such as charcoal into few of the honey samples
analysed.
Manganese is a component of living things, including both plants and animals, so
manganese is present in foods (including honey). Manganese was present in all the samples
analyzed with a concentration range of 75.697 – 681.236 mg/kg. The U.S. Department of
Health and Human Services reports that usual daily intakes range from about 2 to 9 mg/day.
Since manganese is abundant in the earth’s crust (Taylor, 1964), it may have also have been
added by the bees during production. Its levels increased along the farmer-to-trader routes.
Mg in the environment might have combined with other chemicals such as oxygen, sulfur,
and chlorine (NAS, 1973). As these can become suspended in air along with small dust
particles, they can find their way into the honey during processing.
Calcium and potassium are essential for living organisms. They are very reactive and
abundant in the earth’s crust (Taylor, 1964). They have numerous applications in the
chemical industries. All the honey samples analysed were rich in Ca and K with
concentration range from 2.393 – 283.690 g/kg and 112.933–1770.770 g/kg respectively.
Their levels increased slightly along the farmer-to-trader routes. The increment may be
attributed to the metals and woods used during extraction. At the sales point, recycled
mineral water bottles and gallons were used in honey’s storage. This may have accounted
University of Ghana http://ugspace.ug.edu.gh
97
for the further increase in Ca and K levels in honeys collected from the retailers, since some
of the containers were used without washing, or rinsed with water only. Washing containers
with soap and not rinsing properly can also affect the composition of the honey stored in
them since metals, such as Ca and Na are components of soap.
The Na, Mg, Cr levels recorded in honey may have also have been added by the bees during
production, since they are also abundant in the earth’s crust (Taylor, 1964). The increase
in the concentrations of these metals (Na, Mg, Cr) as the honey goes through the various
processes can be related to the extraction and treatment processes, equipment used and
nearness of apiaries to industries. Also, honey that comes into contact with metal containers
or equipments during storage or processing may have elevated levels of some metals
(Kebede et al., 2012). The mobility of some metals such as Co is moderately high at low
pH (ATSDR, 2004). All the honey samples analysed were acidic in character, therefore
some of the metals may have been absorbed from their storage containers into the honey
samples during storage.
With the exception of Cu, the levels of metals are in general within permitted limits set by
Ghana Standards Authority and other organizations such as Codex Alimentarius (Table
4.7). Any heavy metals present in honey above admitted levels by pollution standards, are
threats to human body through the possible negative effect of the contaminants (Kebede et
al., 2012). Therefore Ghanaian honey is therefore safe for human consumption with respect
to the elemental contamination.
University of Ghana http://ugspace.ug.edu.gh

98
4.6 Comparison of Elemental Composition of Honey from the Three Regions Studied
With Other Locations
A comparative analysis of the results obtained in this study with results of other studies
within and outside Ghana show that the range of elemental concentrations of honey from
these three regions of Ghana was averagely higher (Tables 4.8). Co and Hg in honey were
not reported by other studies that this work was compared to.
The levels of Ca in this study were higher than the concentration of Ca reported for honey
samples elsewhere in Ghana by Ankrah (1997). The concentrations of Fe recorded in this
studies (1.548 – 11.052 mg/kg) were however less than those recorded by Ankrah (1997)
(0.10 – 0.18 mg/kg). The levels of Ca and Fe in Ghanaian honey (this study) was
significantly higher than the concentration of Fe and Ca reported for honey samples outside
Ghana by other workers whose work this studies was compared with (Tables 4.8).
However, the values were far below what is considered to be a lethal dose of Fe in food
(200-250 mg/kg of body weight) as reported by US NRC (1979).
Only Agaja (2014) reported levels for Cr, which was higher than the values recorded in
this study for Cr in all the samples. The concentrations of V, Mg, Na, Ca and K in the
Ghanaian honey (this study) were also higher than their respective concentrations reported
for honey samples outside Ghana by other workers whose work this studies was compared.
The highest concentration of Al reported in honey samples in Nigerian honey (Agaja, 2014)
were far less than the values reported for this study. Al in honey was not reported by others,
but it was considered in this study. Of the workers compared with, only Mbiri et al., (2011)
reported levels of Cd, and As in honey samples in Kenyan honey. The values obtained in
University of Ghana http://ugspace.ug.edu.gh

99
this study for Cd and As were all less than 0.01 mg/kg, and also below the 0.02 mg/kg and
0.01 mg/kg respectively, reported in the Kenyan honey (Table 4.8).
University of Ghana http://ugspace.ug.edu.gh
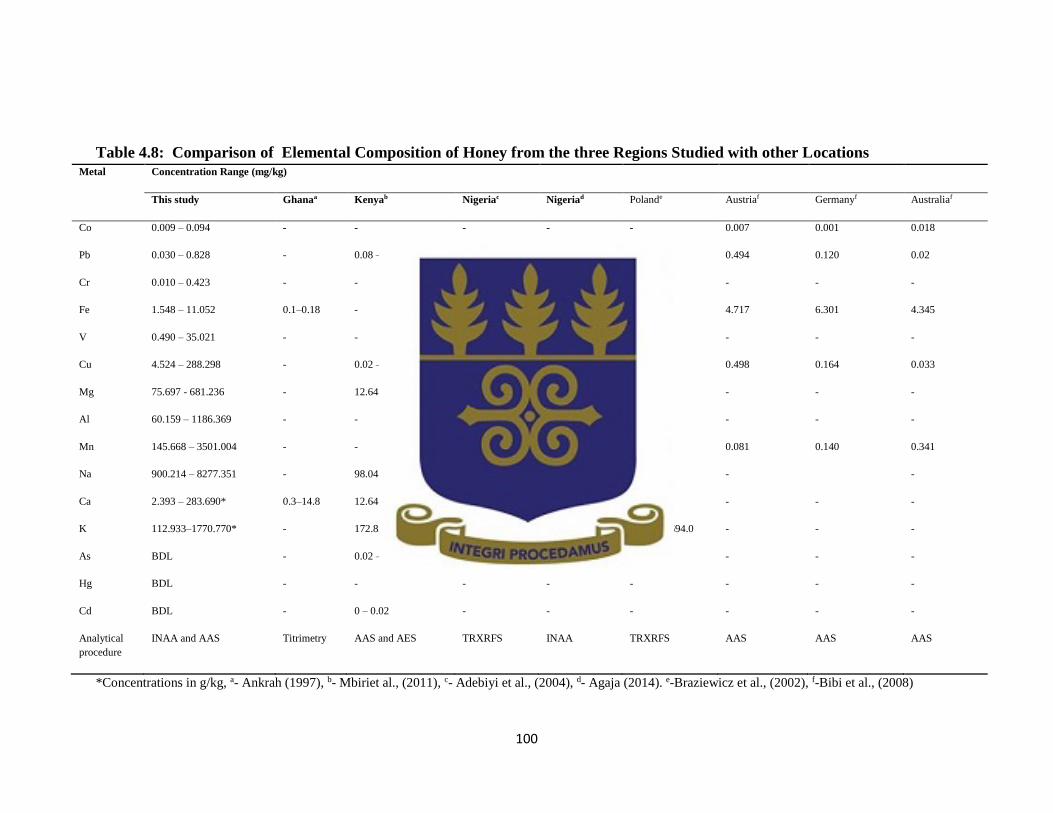
100
Table 4.8: Comparison of Elemental Composition of Honey from the three Regions Studied with other Locations Metal Concentration Range (mg/kg)
This study Ghanaa Kenyab Nigeriac Nigeriad Polande Austriaf Germanyf Australiaf
Co 0.009 – 0.094 - - - - - 0.007 0.001 0.018
Pb 0.030 – 0.828 - 0.08 – 0.28 - - - 0.494 0.120 0.02
Cr 0.010 – 0.423 - - - - 0.0-6.1 - - -
Fe 1.548 – 11.052 0.1–0.18 - 136 - 407 - 0.0-18.6 4.717 6.301 4.345
V 0.490 – 35.021 - - - 4 - 13 - - - -
Cu 4.524 – 288.298 - 0.02 – 0.05 10 – 35 - - 0.498 0.164 0.033
Mg 75.697 - 681.236 - 12.64 – 41.88 - 21 -30 - - - -
Al 60.159 – 1186.369 - - - 7.0 - 25.0 - - - -
Mn 145.668 – 3501.004 - - 1 - 5 10 - 35 0.4 – 5.4 0.081 0.140 0.341
Na 900.214 – 8277.351 - 98.04 – 269.1 - 8 -1 2 - - -
Ca 2.393 – 283.690* 0.3–14.8 12.64 – 19.33 152 - 265 16.0 - 86.0 - - - -
K 112.933–1770.770* - 172.83– 781.52 1100- 21600 3.2-216 435.0 – 2694.0 - - -
As BDL - 0.02 – 0.03 - - - - - -
Hg BDL - - - - - - - -
Cd BDL - 0 – 0.02 - - - - - -
Analytical
procedure
INAA and AAS Titrimetry AAS and AES TRXRFS INAA TRXRFS AAS AAS AAS
*Concentrations in g/kg, a- Ankrah (1997), b- Mbiriet al., (2011), c- Adebiyi et al., (2004), d- Agaja (2014). e-Braziewicz et al., (2002), f-Bibi et al., (2008)
University of Ghana http://ugspace.ug.edu.gh
101
CHAPTER FIVE
5.0 CONCLUSIONS AND RECOMMENDATIONS
5.1 CONCLUSIONS
Fifteen elements comprising 8 essential elements (K, Fe, Mn, Ca, Cu, Na, Al, Mg) and 7
heavy metals (Cd, As, Hg, V, Co, Cr, Pb) were considered in this studies. Physicochemical
studies: pH, electrical conductivity and specific gravity were done prior to the elemental
analysis. All the honey samples were found to be acidic, with pH ranging from 3.6 to 6.1.
The acidity of honey is significant as it inhibits the growth of microorganisms. The
electrical conductivities ranged from 11.9 µS/cm to 44.4 µS/cm. They were within the
acceptable limits set by GSA and other organizations (< 800 µS/cm). The specific gravity
of the honey samples analysed ranged from 1.297 to 2.031. They were higher than the
values (1.2081 to 1.2270) reported in Libyan Honey (Mohamed et al., 2013). However,
these values were closer to the average specific gravity (1.44) value reported by the Food
and Agricultural Organisation (FAO, 2007). Cd, Hg and As in all the honey samples
analysed were below detection limit of 0.001 mg/kg.
In general, the concentrations of the metals in the honey samples analysed were observed
to differ significantly from one sampling site to another. This may be related to the
environment in which the apiaries are located. The honey samples analysed showed
significant variations in the concentrations of the metals as the honey goes through various
processes after extraction. Elemental concentrations in most of the honey samples
increased in concentration from the production line to the retailers. There were few
instances where the elemental concentrations of the honey samples reduced in
University of Ghana http://ugspace.ug.edu.gh

102
concentration along the sampling route. The variations may be related to the extraction
procedures and treatment processes such as filtering, sieving, hand-squeezing and heating
employed by the beekeepers during honey processing. The storage conditions and
packaging materials used by retailers are also possible sources of metals contaminants that
affects the composition of honey. Concentration of potassium in all the samples monitored
was the highest, followed by Ca. Concentrations of Co and Cr in all the samples were
generally low (< 1.0 mg/kg).
The concentrations of Mn, Na, K, Mg and Pb were highest in Ashanti region. The
concentrations of Ca, Al and Cr were highest in the Brong Ahafo region, whiles the samples
taken from Greater Accra region the highest concentrations of Cu, Fe, and Co. The metal
compositions of the honey in the various regions were of the order: K > Ca > Na > Mn >
Al > Mg > Cu > V > Fe > Pb > Co > Cr. The concentrations of the elements in the Ghanaian
honey studied were higher than results of metal concentrations in honey from other parts
of the world that this studies was compared with. All the metals studied, with the exception
of Cu were within the allowable limits set by various organizations (GSA, Codex
Alimentarius, WHO).
5.2 RECOMMENDATIONS
This study monitored the elemental composition of some Ghanaian honey from one
sampling site to another and as it goes from farmers to retailers. It has provided a
background data of how the various extraction, treatment, storage and handling processes
University of Ghana http://ugspace.ug.edu.gh

103
affects honey’s composition and consistency prior to reaching the consumer. The following
are recommended:
a. Due to high levels of some metals above recommended standards, it is suggested
that the Ghana Standards Authority, Ministry of Food and Agriculture, Food and
Drugs Authority and Food Research Institute should educate farmers on the best
ways of handling honey after extraction, to reduce the level of contamination.
b. Further studies should be conducted to investigate the sources of contaminants, the
rate at which the levels are accumulating, and its impacts on the quality of Ghanaian
honey.
c. A more comprehensive studies which would take into consideration how days,
times and seasons in which honey is harvested and processed affects its elemental
composition. This will provide background data on how these parameters affect the
composition of honey.
d. A study investigating heavy metals and physicochemical properties such as
moisture content, ash content, total acidity, reducing and non-reducing sugars, to
provide more data on the quality of Ghanaian honey.
e. A study, investigating other contaminants like pesticides, antibiotics,
polychlorinated biphenyls (PCBs), polynuclear aromatic hydrocarbons (PAHs),
microorganism levels in honey from all other regions of Ghana should be
conducted.
f. A more comprehensive (nationwide) sampling campaign recommended.
University of Ghana http://ugspace.ug.edu.gh

104
LIST OF REFERENCES
Acquarone, C., Buera, P. and Elizalde, B. (2007). Pattern of pH and electrical conductivity
upon honey dilution as a complementary tool for discriminating geographical origin of
honeys. Food Chemistry Vol. 101, p. 695-703.
Adebiyi, F. M., Akpan, I., Obiajunwa E. I. and Olaniyi H. B. (2004). Chemical/Physical
Characterization of Nigerian Honey. Pakistan Journal of Nutrition 3(5):278-291.
Adeyemo, D. J., Umar, I. M., Jonah S. A., Thomas, S. A., Agbaji, E. B and Akaho, E. H.
K. (2004). Trace elemental analysis of Nigerian Crude Oils by INAA using miniature
neutron source reactor. Journal of Radio Analytical and Nuclear Chemistry 261(1):229-
231.
Agaja, S. A. (2014). Instrumental Neutron Activation Analysis of Honey samples from
Lokoja and Suleija North Central Nigeria. Journal of Scientific Research and Reports 3(3):
419-426.
Agbagwa, O. E., Otokunefor, T.V. and Frank-peterside, N. (2011). Quality assessment of
Nigeria honey and Manuka Honey. Journal of Microbiology and Biotechnology Research
1(3):20-31.
Aidoo K (2005). ‘Bees for Development Honey Trade’. A Workshop held in Dublin,
Ireland in August 2005 and organised by Sasakawa Centre, University of Cape Coast. 1-4.
Ajibola A., Chamunorwa, J. P and Erlwanger, K. H. (2012). Nutraceutical values of natural
honey and its contribution to human health and wealth. Nutrition & Metabolism 9:61.
Al-Mamary, M., Al-Meeri, A., Al-Habori, M., 2002. Antioxidant activities and total
phenolics of different types of honey. Nutrition Research 22, 1041–1047.
Al-Waili, N.S. (2003). Effects of daily consumption of honey solution on hematological
indices and blood levels of minerals and enzymes in normal individuals. Journal of
Medicinal Food 6:135–140.
Andrade, P., Amaral, M., Isabel, P., Carvalho, J., Seabra, R., and Cunha, A. (1999).
Physicochemical attributes and pollen spectrum of Portuguese heather honeys. Food
Chemistry 66, 503–510.
University of Ghana http://ugspace.ug.edu.gh

105
Anklam, E. (1998). A review of the analytical methods to determine the geographical and
botanical origin of honey. Food Chemistry 63,549–562.
Ankrah, E. K. (1997). Chemical composition of some Ghanaian honey samples. Ghana
Journal of Agricultural Science Vol. 31, p119-131. Apidologie 35:S38-S81.
ANL (Argonne National Laboratory). (2005). Human Health Fact Sheet.
Ashkin, E. and Mounsey, A. (2013). A spoonful of honey helps a coughing child sleep.
The Journal of Family Practice 62(3): 145–147.
ATSDR (Agency for Toxic Substances and Diseases Registry). (1992, 1999, 2004).
Toxicological Profile for Elements. Atlanta, GA, United States Department of Health and
Human Services, Public Health Service.
Barceloux, D. C. (1999). Cobalt. Clinical Toxicology 37(2); 201-216.
Baroni, M. V., Arrua, C., Nores, M. L., Fayé, P., Díaz, M. D. P., Chiabrando, G. A. and
Wunderlin, D. A. (2009). Composition of honey from Córdoba (Argentina): Assessment
of North/South provenance by chemometrics. Food Chemistry. 114, 727.
Bibi, S., Husain, S. Z. and Malik, N. R. (2008). Pollen analysis and heavy metals detection
in honey samples from seven selected countries. Pakistan Journal of Botany 40(2): 507-
516.
Blasa, M., Candiracci, M., Accorsi, A., Picentini, M. P., Albertini, M. C. and Piatti, E.
(2006). Raw Millefiori honey is packed full of antioxidants. Food Chemistry 97, 217-222.
Bogdanov, S. (2006). Contaminants of bee products. Apidologie, Springer Verlag
(Germany). 37 (1), pp.1-18. <hal-00892166>
Bogdanov, S., Jurendic, T., Sieber, R. and Gallmann, P. (2008). Honey for nutrition and
health: a review. The Journal of the American College of Nutrition 27(6):677-89.
Bogdanov, S.A., Indorf, J., Charriere, P., Fluri, and Kilchermann, V. (2003). The
contaminants of the bee colony. Swiss bee Research Centre. Bern, Switzerland. pp 12.
Braziewicz, J., Fijal, I., Czyziewski T., Jaskola, M., Korman, A., Banas, D., Kubala-Kukus
A., Majewska, U. and Zemlo, L. (2002). PIXE and XRF analysis of honey samples.
Nuclear Instruments and Methods in Physics Research 187; 231-237.
University of Ghana http://ugspace.ug.edu.gh

106
Buldini, P. L., Cavali, A., Mevoli, and Sharma, J.L. (2001). Ion Chromatographic and
Voltammetric determination of heavy and transition metals in honey. Food chemistry
(73):487-495.
Callender, E. (2003). Treatise on Geochemistry. In B. S. Lollar, H. D. Holland and K. K.
Turekian(Ed.). 9:67-105. Amsterdam: Elsevier Science Publishers.
Carapella, S. C. (1992). Arsenic and Arsenic Alloys. In J. K. Kroschwitz and M. Howe-
Grant. (Eds.) Kirk-Othmer Encyclopaedia of Chemical Technology 3:624-633.
Caroli, S., Forte, G., Iamiceli, A. L., and Galoppi, B. (1999). Determination of essential
and potentially toxic trace elements in honey by inductively coupled plasma-based
techniques. Talanta 50(2), 327–336.
Celli, G., Maccagnani. (2003). Honey bee as bioindicators of environmental pollution.
Bulletin of Insectology (56):137-139.
Chepulis, L. M., Starkey, N. J., Waas, J. R. and Molan, P. C. (2009). The effects of long
term honey, sucrose or sugar-free diets on memory and anxiety in rats. Physiology and
Behaviour 97:359–368.
Chalhoub, C., Lydakis – Simantiris, N., Naxakis, G., Arvanitoyannis, I. and Gotsiou, P.
( 2007). Mineral Content Analysis of Greek Honey by Inductively Coupled Plasma Atomic
Emission Spectroscopy (icp-aes): a Tool for Botanical and Geographical Discriminations.
(Assessed on August 15, 2014 13:50 CET.
lydakis.chania.teicrete.gr/Δημοσιεύσεις/.../metals_poster_Rio_2007.ppt)
Codex Almentarius Commission. (1983/84). Proposed Codex Standard for Honey. (Rome:
FAO/WHO) CX/PFV84/13.
Codex Alimentarius Commission. (2001). Codex Alimentarius Standard for Honey,
CODEX STAN 12-1981, FAO and WHO, Rome. 1-8.
Conti, M. E. (2000). Lazio region (Central Italy) Honeys: A Survey of Mineral Content
and Typical Quality Parameters. Food Control 11: 459-463.
University of Ghana http://ugspace.ug.edu.gh
107
Costa, L., Albuquerque, M., Trugo, L., Quinteiro, L., Barth, O.,Ribeiro, M., & De Maria,
C. (1999). Determination of non-volatile compounds of different botanical origin Brazilian
honeys. Food Chemistry 65, 347–352.
Cui, R., Li, B., Suemaru, K., Watanabe, S., Okihara, K., Hashimoto, K., Yamada, H., and
Araki, H. (2008). Topical application of royal jelly has a healing effect for 5-fluorouracil
induced experimental oralmucositis in hamsters. Methods and Findings in Experimental
and Clinical Pharmacology. 30(2):103–6.
De-Corte, F., A. Simonits, A. De-Wispelaere and Hoste, J. (1987). Accuracy and
applicability of the k standardization method. Journal of Radioanalytical and Nuclear
Chemistry. 113:145-165.
Denton, G. R. W., Bearden, B. G., Concepcion, L. P., Siegrist, H. G., Vann, D. T. and
Wood, H. R. (2001). Contaminant Assessment of Surface Sediment from Tanapag Lagoon,
Saipan. Water and Environmental Research Institute of the Western Pacific. Univeristy of
Guam, Mangilao, Guam. Techical Report No. 93.
De-Rodrı´guez, G.O., de Ferrer, B.S., Ferrer, A. and Rodrı´guez, B. (2004).
Characterization of honey produced in Venezuela. Food Chemistry 84: 499-502.
Dustmann, J. H. (1993). Honey, quality and its control. American Bee Journal 133(9),
648–651.
Emma, M. and Susana, P. (2006). Determination of heavy metals in honey by
potentiometric stripping analysis and using a continuous flow methodology. Food
Chemistry 94; 478–483.
Encyclopedia Britannica. (2012). Ultimate Reference Suite. Encyclopedia Britannica Inc.,
London, 15th Ed.
EPA (Environmental Protection Agency). (1984, 2011). Final Assessment Document for
Elements. Final Draft. Cincinnati, OH: US. Environmental Protection Agency, Office of
Research and Development.
Finkelman, R. B. (2005). Sources and Health Effects of Metals and Trace Elements in Our
Environment: An Overview. In T.A Moore,A. Black, J. A Centeno, J. S Harding and D. A.
Trumm.
University of Ghana http://ugspace.ug.edu.gh

108
Fisher, R. A. (1971) (1935). The Design of Experiments. (9th edition). Macmillan. ISBN
0-02-844690-9.
FAO (Food and Agricultural Organisation). (2012). Bees and their role in forest
livelihoods. Pp. 1-8. Available at: ftp://ftp.fao.org/docrep/fao/012/i0842e/i0842e10.pdf.
(Assessed on 18th November, 2014, 15:00 CET).
FAO (Food and Agricultural Organisation), Corporate Document Repository. (2003). Non-
Wood Forest Products In Ethiopia. Pp. 1-5. Available at:
http://www.fao.org/docrep/003/x6690e/X6690E01.htm. (Assessed on 18th November,
2014, 14:42 CET).
FAO (Food and Agricultural Organisation), Corporate Document Repository. (2007).
Value-added Products From Beekeeping. Pp 1-15. Available at:
http://www.fao.org/docrep/w0076e/w0076e04.htm. (Assessed on 18th November, 2014,
14:39 CET).
Francis, C. D. and Forsyth, C. (2005). Toxicity Profile of Manganese. (Viewed on
November 1, 2014. 14;12 CET. Available at: http://rais.ornl.gov/tox/profiles/mn.shtml).
(Assessed on 18th November, 2014, 14:43 CET).
Frankel, S.M., Robbinson, G.E. and Berenbaum, M.R. (1998). Antioxidant capacity and
correlated characteristics of 14 unifloral honeys. Journal of Apicultural Research 37:27–
31.
Funk, W., Dammann, V. and Donnevert, G. (2007). Quality Assurance in Analytical
Chemistry: Applications in Environmental, Food, and Materials Analysis, Biotechnology,
and Medical Engineering. 2nd Edition. Pp. 115-194.
Gomes, S., Dias, L. G., Moreira, L. L., Rodrigues, P. and Estevinho, L. (2010).
Physicochemical, microbiological and antimicrobial properties of commercial honeys from
Portugal. Food and Chemical Toxicology 48: 544–548.
University of Ghana http://ugspace.ug.edu.gh
109
Gonzales, A. P., Burin, L. and del Pilar Buera, M. (1999). Color changes during storage of
honeys in relation to their composition and initial color. Food Research International 32,
185-191.
Goyer, R. (1991). Toxic Effects of Metals. In: M. O. Amdur, J. D. Duoll and C, D. Klassen,
Eds. Casarett and Duoll’s Toxicology. 4th ed. Pergamon Press, New York, pp. 623-680.
Guler, A., Bakan, A., Nisbet, C. and Yavuz, O. (2007). Determination of important
biochemical properties of honey to discriminate pure and adulterated honey with sucrose
(Succharum officinarum L.) syrup. Food Chemistry 105, 1119-1125.
Hamidatou, L., Slamene, H., Akhal, T., Begaa, S., Messaoudi, M. and Boussaad, Z. (2013).
NAA Algerian Laboratory Evaluation Processed by WEPAL and IAEA during 2011-2012.
Journal of Analytical Sciences, Methods and Instrumentation 3, 184-192.
Hase, S., Suzuki, O., Odate, M. and Suzuki S. (1973). Changes in quality of honey on
heating and storage. I. Changes in hydroxymethylfurfural (HMF) content of honey. Journal
of Food Science and Technology 20:248–256.
IAEA-TECDOC. (2001). Quality aspects of research reactor operations for instrumental
neutron activation analysis held in Accra, Ghana. Report of an Advisory Group meeting
18–22 October, 2001; 1218.
IARC (International Agency for Research on Cancer). (1991). International Agency for
Research on Cancer Monographs on the Evaluation of Carcinogenic Risks to Humans.
Chlorinated Drinking-water, Chlorination by-product, some other halogenated
compounds; cobalt and cobalt compounds. Lyon, France. Vol. 86.
IARC (International Agency for Research on Cancer). (1980). International Agency for
Research on Cancer Monographs on the Evaluation of Carcinogenic Risks to Humans.
Some Metals and Metallic compounds. Lyon, France. Vol. 23.
Jones, K. C. (1987). Honey as an indicator of heavy-metal contamination. Water Air and
Soil Pollution 33(1-2), 179–189.
University of Ghana http://ugspace.ug.edu.gh

110
Kabata-Pendias, A. and Pendias H. Biogeochemistry of Trace Elements. 1999, PWN,
Warszawa. 74-288.
Karaman, T., Buyukunal, S. K., Vurali, A. and Altunatmaz, S. S. (2010). Physico-chemical
properties in honey from different regions of Turkey. Food Chemistry 123:41-44.
Kebede, N., Subramanian, P.A. and Gebrekidan, M. (2012). Physicochemical analysis of
tigray honey: An attempt to determine major quality markers of honey. Bulletin of the
Chemical Society of Ethiopia 26(1), 127-133.
Kegley, S. E., Hill, B. R., Orme, S. and Choi, A. H. (2009). Copper. PAN Pesticide
Database. North America (San Francisco, CA): Pesticide Action Network. Available at:
http:www.pesticideinfo.org. (Assessed on November 22, 2014).
Komarnicki, G. J. K. (2005). Lead and Cadmium in Indoor Air and the Urban Environment.
Environmental Pollution 136: 47-61
Kpeglo, D. O., Lawluvi, H., Faanu, A., Awudu, A. R., Arwui, C.C., Deatanyah, P.,
Wotorchi-Gordon S., Darko, E. O., Emi-Reynolds, G., Opata, N. S. and Baidoo, I. K.
(2012). Radiochemical Pollutants Concentration in Ghana Cement by Instrumental
Neutron Activation Analysis and Gamma-Ray Spectrometry. Research Journal of
Environmental and Earth Sciences 4(1):99-104.
Kucuk, M., Kolayli, S., Karaoglu, S., Ulusoy, E., Baltaci, C. and Candan, F. (2007).
Biological Activities and Chemical Composition of three Honeys of Different Types from
Anatolia. Food Chemistry. 100: 526 - 534
Kwapong, P. K., Ilechie, A. A. and Kusi, R.J. (2013). Comparative antibacterial activity of
stingless bee honey and standard antibiotics against common eye pathogens. Journal of
Microbiology and Biotechnology Research 3(2):9-15.
Lachman, J., Kolihova, D., Miholova, D., Kosata, J., and Titera, D. and Kult, K. (2007).
Analysis of minority honey components: possible use for the evaluation of honey quality.
Food Chemistry 101, 973-979.
Linton, L.R. and Harder, L.D. (2007). Biology 315 – Quantitative Biology Lecture Notes.
University of Calgary, Calgary, AB.
University of Ghana http://ugspace.ug.edu.gh

111
Mbiri, A., Onditi, A., Oyaro, N., and Murago, E. (2011). Determination of essential and
heavy metals in Kenyan honey. Journal Of Agriculture, Science And Technology Vol.
13(1), 108-115.
MDH (Minnesota Department of Health). (2006). Copper in Drinking water, Health Effects
and How to Reduce Exposure. Available at:
http://healthstate.mn.us/dirs/eh/water/com/fs/copper.html. (Assessed on November 22,
2014).
Merian, E. (1984). Introduction on Environmental Chemistry and Global Cycles of
chromium, nickel, cobalt, beryllium, arsenic, cadmium and selenium and their Derivatives.
Toxicology and Environmental Chemistry Vol. 8.No. 1. Pp. 9-38.
Milestone’s Application Note; Microwave Acid digestion Cookbook. (1996). Milestone
Lab Systems. Report Codes 23 and 99.
Mohamed, H. S. A., Saleh, E., Ali A., Mohamed, E. and Nagwa, H. S. A. (2013).
Physicochemical, Heavy Metals and Phenolic Compounds Analysis of Libyan Honey
Samples Collected from Benghazi during 2009-2010. Food and Nutrition Sciences 4, 33-
40.
NAS (National Academy of Science). (1973). Manganese in Ecosystem. Medical and
Biological Effects of environmental Pollutants: Manganese. Washington, DC: National
Academy of Science 3-50.
NHB (2015). “Honey’s Natural Benefit”. National Honey Board, Longmont Colorado.
www.nhb.org. Retrieved March, 2015.
Ouchemoukh, S., Louaileche, H. and Schweitzer, P. (2007). Physicochemical
characteristics and pollen spectrum of some Algerian honeys. Food Control 18, 52-58.
Patnaik, P. (2004). Preliminary Operations of Analysis. Dean’s Analytical Chemistry
Handbook, Chapter (McGraw-Hill Professional). Access Engineering. 2nd Ed. pp. 204-
500.
University of Ghana http://ugspace.ug.edu.gh

112
Pérez-Arquillué, C., Conchello, P., Ariño, A., Juan, T., and Herrera, A. (1995).
Physicochemical attributes and pollen spectrum of some unifloral Spanish honeys. Food
Chemistry 54, 167–172.
Persano, O. L. and Piro, R. (2004). Main European unifloral honeys. Descriptive sheets.
Apidologie. 35: S38–S81.
Pohl, P. (2009). Determination of metal content in honey by atomic absorption and
emission spectrometries. TraC Trends in Analytical Chemistry. Vol. 28, No. 1. pp. 117-
128.
Porrini, C., Sabatini, A.G., Girotti S., Ghini, S., Medrzycki, P., Grillenzoni, F., Bortolotti,
L., Gattavecchia, E. and Celli, G. (2003). Honeybees and bee products as monitors of the
environmental contamination. Apiacta 38:63–70.
Radojevic, M. and Bashkin, V. N. (1999). Practical Environmental Ananlysis. RSC, UK.
300-469
Rodriguez-Otero, J., Paseiro, P., Simal, J., Terradillos, L., & Cepada,A. (1992).
Determination of Na, K, Ca, Mg, Cu, Fe, Mn and total cationic milliequivalents in spanish
commercial honeys. Journal of Apicultural Research 31(2), 65–69.
Roman, A., Madras-Majewska, B. and Popiela-Plebau, E. (2011). Comparative Study Of
Selected Toxic Elements in Propolis and Honey. Journal of apicultural Science Vol. 55.
No. 2.
Ron, E. Z., Minz, D., Finkelstein, N. and Rosecnberg, E. (1992). Introduction of Bacteria
with Cadmium. Biodegradation 3: 161-171.
Ruschioni, S., Riolo, P., Minuz, R. L., Stefano, M., Cannella, M., Porrini, C. and Isidoro,
N. (2013). Biomonitoring with Honeybees of Heavy Metalsand Pesticides in Nature
University of Ghana http://ugspace.ug.edu.gh
113
Reserves of the Marche Region (Italy). Biological Trace Elements Research DOI
10.1007/s12011-013-9732-6
Sadia, B., Syed, Z. H. and Riffat, N. M., (2008). Pollen Analysis and Heavy Metals
Detection in Honey Samples From Seven Selected Countries. Pakistan Journal of Botany
40(2): 507-516.
Saeed, H. M. (1998). Application of new technologies in Canary honeys for typing and
quality control. Bulletin of Environmental Contamination and Toxicology 80, pp 30–33.
Sanna, G. M., Pilo, P., Piu, A., Tapparo, A. and Seeber, R. (2000). Determination of heavy
metals in honey by anodic stripping voltammetry at microelectrodes. Analytica Chimica
Acta 415:165-173.
Saxena, S., Gautam, S., Sharma, A. (2010). Physical, biochemical and antioxidant
properties of some Indian honeys. Food Chemistry 118, 391-397.
Schetz, Joseph A.; Allen E. Fuhs (1999-02-05). Fundamentals of fluid mechanics. Wiley,
John & Sons, Incorporated. pp. 109-144.
Schramm, D.D., Karim, M., Schrader, H.R., Holt, R.R., Cardetti, M., and Keen, C.L.
(2003). Honey with high levels of antioxidants can provide protection to healthy human
subjects. Journal of Agricultural and Food Chemistry 51:1732–1735.
Sedgwick, J. S. (2005). Contamination and Remediation of Soil at a Former Orchard Site,
Hamilton, North Island, New Zealand. Thesis, University of Waikato.
Singh, N. and Bath, P. K. (1997). Quality Evaluation of Different Types of Indian honey.
Food Chemistry 58; No. 1-2. pp. 129-133.
University of Ghana http://ugspace.ug.edu.gh

114
SNV (Stichting Nederlandse Vrijwilligers, Netherlands Development Organisation,
Ghana). (2010). The Honey Industry in Ghana: An Overview. Synthesis Report. Final
Version pp. 6-48.
Somenath, M. (2003). Sample Preparation Techniques in Analytical Chemistry. ISBN 0-
471-32845-6. John Wiley & Sons, Inc.
Sporns, P., Plhak, L., aand Friedrich, J. (1992). Alberta honey composition. Food
Research International 25, 93–100.
Swallow, K., and Low, N. (1990). Analysis and quantitation of the carbohydrates in honey
using high-performance liquid chromatography. Journal of Agricultural Food Chemistry
38, 1828–1832
Taylor, S. R. (1964). Abundance of Chemical Elements in the Continental Crust: A New
Table. Geochimica et Cosmochimica Acta 28: 1273-1285.
Terrab, A., Hernanz, D., and Heredia, F.J. (2004). Inductively coupled plasma optical
emission spectrometric determination of minerals in thyme honeys and their contribution
to geographical discrimination. Journal of Agricultural and Food Chemistry 52:3441-
3445.
The Council of the European Union. Council Directive 2001/110/EC of 20 December
2001 Relating to Honey. Official Journal of the European Communities Vol. L10, 2002,
pp.47-52. Available at:
http://eurlex.europa.eu/LexUriServ/LexUriServ.do?uri=OJ:L:2002:010:0047:0052:EN:P
DF. (Assessed on November 12, 2015. 13:56 CET)
Tong, S.C., Morse, R.A., Bache, C.A. and Lisk, D.J. (1975). Elemental analysis of honey
as an indicator of pollution; Forty-seven elements in honeys produced near highway,
industrial, and mining areas. Archives of Environmental Health 30 (7):329-32.
Tukey, J. (1949). "Comparing Individual Means in the Analysis of Variance". Biometrics
5 (2): 99–114. JSTOR 3001913.
University of Ghana http://ugspace.ug.edu.gh
115
Tuzen, M. Silici, S. Mendil, D. and Soylak, M. (2007) Trace element levels in honeys from
different regions of Turkey. Food Chemistry 103; 325-330.
US NRC (National Research Council). (1979). Iron. Baltimore, MD: University Park Press.
Vallee, B. L. and Auld, D. S. (1990). Zinc Coordination, Function and Structure of Zinc
Enzymes and Other Proteins. Biochemistry 29: 5647-5659.
Varian booklet. (1997). Introducing Atomic Absorption Analysis, Publication number
8510055700, Varian Australia Pty Ltd, A.C.N. 004 559 540, January 1997. pp, 1-4
Virkutyte, J. and Sillanpa, M. (2006). Clinical Evaluation of Potable Water in Eastern
Qinghai Province, China: Human Health Aspects. Environment International 32:80-86.
Wikipedia (2015). Post hoc Analysis. Available at:
https://en.wikipedia.org/wiki/Post_hoc_analysis (Assessed on 18th November, 2014,
15:30 CET).
White, J.W. Jr. (1975). Composition of Honey. In: Honey – A Comprehensive Survey
(Crane, E. Editor). Heinemann, London UK. pp. 157–206.
WHO (World Health Organisation). (1996). Trace Elements in Human Nutrition and
Health. Geneva. pp. 72-143
Wotton, M. (1976, 1978). Effect of accelerated storage conditions on the chemical
composition and properties of Australian honeys. 23-28, 167-172.
Yilmaz, H., and Yavuz, O. (1999). Content of some trace metals in honey from south-
eastern Anatolia. Food Chemistry 65:475-476.
Young, R. (2005). Toxicity Profile of Cadmium. Available at:
http://rais.ornl.gov/tox/profiles/cadmium.html. (Assessed on Januanry 25, 2015. 14:12
CET).
University of Ghana http://ugspace.ug.edu.gh

116
APPENDIX
APPENDIX A
Figure A1: Linear Regression Line for Calibration of AAS for Analysis of Co
Figure A2: Linear Regression Line for Calibration of AAS for Analysis of Pb
0
0.0688
0.1407
0.3488y = 0.0698x - 8E-05
R² = 1
-0.05
0
0.05
0.1
0.15
0.2
0.25
0.3
0.35
0.4
0 1 2 3 4 5 6
Abso
rban
ce
Concentration of Co (mg/L)
Linear Regression Line for Calibration of AAS for Analysis of Co
0
0.1429
0.3879
0.7751y = 0.078x - 0.005
R² = 0.9997
-0.1
0
0.1
0.2
0.3
0.4
0.5
0.6
0.7
0.8
0.9
0 2 4 6 8 10 12
Abso
rban
ce
Concentration of Pb (mg/L)
Linear Regression Line for Calibration of AAS for Analysis of Pb
University of Ghana http://ugspace.ug.edu.gh

117
APPENDIX A
Figure A3: Linear Regression Line for Calibration of AAS for Analysis of Cr
Figure A4: Linear Regression Line for Calibration of AAS for Analysis of Fe
0
0.072
0.1405
0.3376y = 0.0672x + 0.0031R² = 0.9996
0
0.05
0.1
0.15
0.2
0.25
0.3
0.35
0.4
0 1 2 3 4 5 6
Abso
rban
ce
Concentration of Cr (mg/L)
Linear Regression Line for Calibration of AAS for Analysis of Cr
0
0.1375
0.3518
0.6976y = 0.0699x - 0.0003
R² = 1
-0.1
0
0.1
0.2
0.3
0.4
0.5
0.6
0.7
0.8
0 2 4 6 8 10 12
Abso
rban
ce
Concentration of Fe (mg/L)
Linear Regression Line for Calibration of AAS for Analysis of Fe
University of Ghana http://ugspace.ug.edu.gh

118
APPENDIX B
Table B1: Results of the elemental composition of honey from the Brong Ahafo region
BRONG AHAFO REGION
ELEMENT Atebubu Fiapre Drobo Dumasua Mantukwa Nsoatre Kintampo Techiman Tanoso Berekum
Co BP 0.029 0.036 0.040 0.037 0.026 0.033 0.036 0.023 0.009 0.027
(mg/kg) AP 0.039 0.036 0.040 0.037 0.026 0.033 0.037 0.030 0.012 0.027
RT 0.039 0.036 0.040 0.037 0.026 0.036 0.086 0.036 0.013 0.036
Pb BP 0.096 0.552 0.408 0.414 0.168 0.186 0.270 0.306 0.582 0.402
(mg/kg) AP 0.234 0.636 0.504 0.498 0.390 0.258 0.552 0.444 0.606 0.576
RT 0.324 0.672 0.540 0.523 0.426 0.342 0.588 0.510 0.678 0.612
Cr BP 0.040 0.043 0.042 0.036 0.036 0.033 0.046 0.027 0.026 0.042
(mg/kg) AP 0.050 0.046 0.048 0.047 0.042 0.036 0.423 0.036 0.036 0.042
RT 0.050 0.046 0.171 0.423 0.046 0.046 0.423 0.047 0.048 0.046
Fe BP 3.498 3.756 2.598 5.436 3.012 3.504 3.096 4.116 2.496 3.180
(mg/kg) AP 3.924 4.416 3.252 6.066 3.648 4.014 3.222 4.416 2.766 3.282
RT 4.302 6.792 3.690 6.174 3.786 4.242 3.408 5.298 2.808 3.678
Mg BP 540.369 534.958 391.115 336.147 424.369 401.236 302.015 379.256 381.224 368.055
(mg/kg) AP 541.688 535.838 395.545 340.985 430.616 406.325 309.016 385.805 387.224 379.956
RT 545.336 552.369 400.2365 342.258 436.258 408.369 314.357 385.902 388.889 401.629
V BP 30.259 21.258 17.235 20.158 8.032 23.369 30.142 17.215 29.358 17.125
(mg/kg) AP 34.565 34.485 18.762 21.063 8.721 23.662 30.284 17.772 32.148 18.672
RT 35.021 34.125 26.369 22.369 10.025 29.191 32.159 17.777 32.190 25.162
Cu BP 195.001 18.063 11.418 5.325 20.147 85.369 4.991 106.047 101.365 74.148
(mg/kg) AP 195.082 19.502 12.110 6.911 21.673 85.387 5.140 106.211 101.680 82.361
RT 203.265 23.116 16.248 8.269 26.024 88.147 18.917 108.124 101.900 88.144
Al BP 1163.025 238.027 421.774 481.302 190.365 175.369 553.478 444.018 310.258 200.115
(mg/kg) AP 1174.176 239.953 426.806 483.067 192.282 176.265 577.896 444.856 311.201 196.062
RT 1186.369 263.258 469.235 489.369 201.364 186.325 641.668 447.314 316.005 219.248
University of Ghana http://ugspace.ug.edu.gh
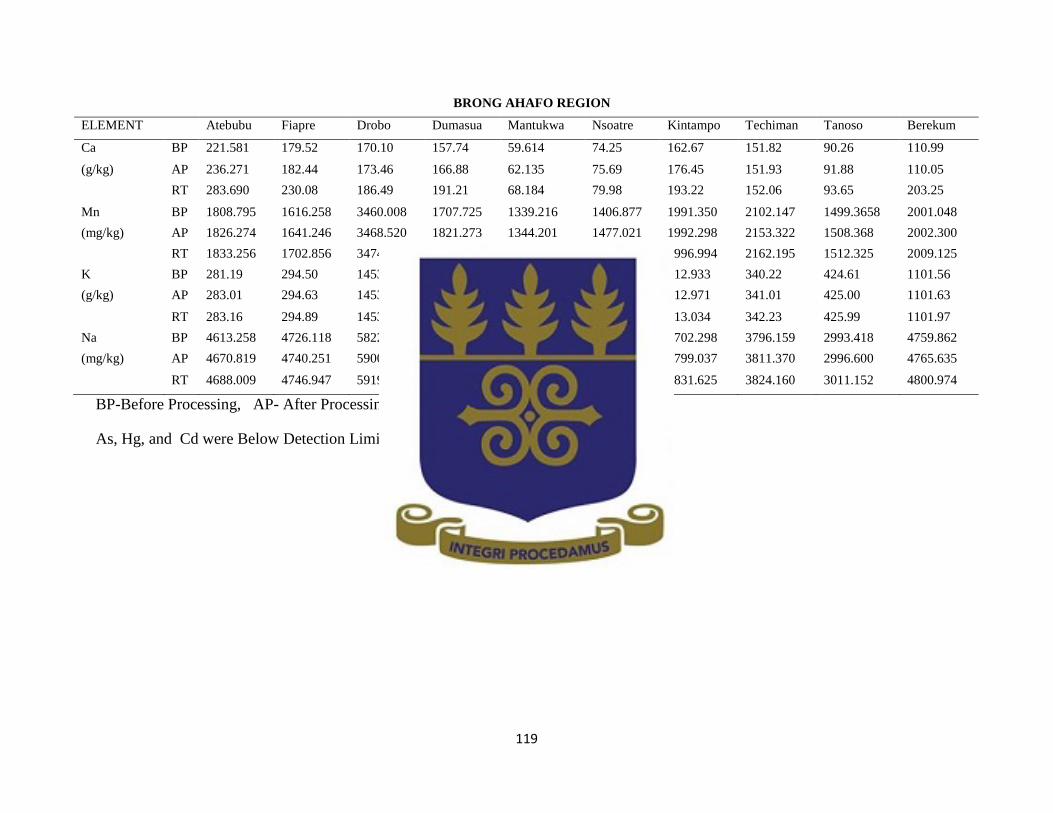
119
BP-Before Processing, AP- After Processing, RT-Retailer
As, Hg, and Cd were Below Detection Limit of 0.001 mg/kg
BRONG AHAFO REGION
ELEMENT Atebubu Fiapre Drobo Dumasua Mantukwa Nsoatre Kintampo Techiman Tanoso Berekum
Ca BP 221.581 179.52 170.10 157.74 59.614 74.25 162.67 151.82 90.26 110.99
(g/kg) AP 236.271 182.44 173.46 166.88 62.135 75.69 176.45 151.93 91.88 110.05
RT 283.690 230.08 186.49 191.21 68.184 79.98 193.22 152.06 93.65 203.25
Mn BP 1808.795 1616.258 3460.008 1707.725 1339.216 1406.877 1991.350 2102.147 1499.3658 2001.048
(mg/kg) AP 1826.274 1641.246 3468.520 1821.273 1344.201 1477.021 1992.298 2153.322 1508.368 2002.300
RT 1833.256 1702.856 3474.237 2001.156 1386.315 1481.985 1996.994 2162.195 1512.325 2009.125
K BP 281.19 294.50 1453.397 475.00 182.64 560.07 112.933 340.22 424.61 1101.56
(g/kg) AP 283.01 294.63 1453.442 475.08 189.63 560.21 112.971 341.01 425.00 1101.63
RT 283.16 294.89 1453.454 475.29 190.51 566.58 113.034 342.23 425.99 1101.97
Na BP 4613.258 4726.118 5822.164 3942.023 4809.166 4111.024 3702.298 3796.159 2993.418 4759.862
(mg/kg) AP 4670.819 4740.251 5900.331 3948.639 4825.036 4216.158 3799.037 3811.370 2996.600 4765.635
RT 4688.009 4746.947 5919.315 3949.997 4901.478 4304.157 3831.625 3824.160 3011.152 4800.974
University of Ghana http://ugspace.ug.edu.gh

120
APPENDIX B
Table B2: Results of the elemental composition of honey from the Ashanti region
ASHANTI REGION
ELEMENT Ntonso Jamasi Aboaso Mampong-
ten
Nkwanta Fawode Ahwiaa Agona Pankro-
no
Asenua
Co BP 0.013 0.014 0.026 0.030 0.063 0.013 0.033 0.026 0.016 0.040
(mg/kg) AP 0.013 0.030 0.036 0.037 0.066 0.039 0.036 0.030 0.023 0.059
RT 0.013 0.036 0.036 0.037 0.066 0.059 0.130 0.036 0.037 0.087
Pb BP 0.624 0.480 0.090 0.264 0.330 0.402 0.486 0.120 0.156 0.228
(mg/kg) AP 0.678 0.516 0.162 0.432 0.366 0.540 0.540 0.402 0.174 0.270
RT 0.828 0.528 0.204 0.444 0.396 0.606 0.594 0.486 0.342 0.402
Cr BP 0.010 0.333 0.033 0.054 0.047 0.041 0.041 0.048 0.023 0.017
(mg/kg) AP 0.042 0.336 0.033 0.297 0.048 0.042 0.041 0.048 0.027 0.026
RT 0.043 0.378 0.037 0.301 0.048 0.054 0.045 0.054 0.037 0.040
Fe BP 1.548 4.242 4.080 2.496 1.644 3.198 2.094 2.880 3.090 4.338
(mg/kg) AP 1.794 4.332 4.112 2.928 1.662 3.204 2.208 3.006 3.108 4.464
RT 2.508 4.812 4.226 4.530 1.884 3.792 2.358 3.108 3.402 4.584
Mg BP 401.236 323.158 97.369 192.902 311.258 207.158 429.369 509.265 659.216 144.325
(mg/kg) AP 407.286 325.394 99.365 193.268 312.268 208.369 444.256 516.351 674.181 146.132
RT 447.325 342.145 103.268 199.235 333.258 219.375 448.365 519.247 681.236 151.369
V BP 3.128 9.711 6.020 13.258 9.325 3.254 7.325 0.490 4.930 3.120
(mg/kg) AP 5.167 9.992 6.119 14.512 10.112 3.961 8.112 0.498 4.932 3.224
RT 6.662 16.257 6.183 19.268 13.258 8.254 12.367 0.523 7.325 5.198
Cu BP 15.256 186.424 80.135 5.186 73.152 49.214 24.003 17.249 9.226 102.135
(mg/kg) AP 16.560 191.833 86.258 8.451 74.128 55.235 24.143 17.252 10.831 109.462
RT 13.211 192.666 86.542 11.254 77.462 57.235 24.165 11.168 11.161 111.028
Al BP 261.862 249.003 316.884 223.687 304.100 280.157 243.117 233.926 509.279 242.369
(mg/kg) AP 276.934 249.076 316.998 228.034 304.127 283.200 247.144 236.804 506.208 244.003
RT 300.119 256.312 318.258 236.125 316.200 285.159 268.265 277.178 576.354 247.315
Ca BP 70.032 149.891 120.960 121.866 62.224 86.543 58.060 39.917 124.582 69.924
(g/kg) AP 73.575 151.331 121.130 122.532 69.311 96.424 58.173 41.278 130.395 77.161
RT 74.413 271.566 123.320 116.248 69.942 123.676 59.261 62.567 183.689 77.565
Mn BP 3055.887 1009.020 1719.269 1130.169 1354.258 1523.595 2806.147 2510.745 3462.776 1927.364
(mg/kg) AP 3161.474 1086.162 1725.214 1139.184 1396.008 1524.008 2835.425 2513.377 3468.520 1933.290
RT 3195.745 1113.657 1733.166 1222.624 1462.462 1602.877 2886.338 2578.118 3501.004 1961.021
University of Ghana http://ugspace.ug.edu.gh

121
BP-Before Processing, AP- After Processing, RT-Retailer
As, Hg, and Cd were Below Detection Limit of 0.001 mg/kg
ELEMENT Ntonso Jamasi Aboaso Mampong-
ten
Nkwanta Fawode Ahwiaa Agona Pankro-
no
Asenua
K BP 258.753 364.533 586.473 1668.780 146.666 963.21 461.107 1271.550 585.740 854.537
(g/kg) AP 261.003 364.653 588.070 1669.640 146.667 963.90 461.250 1272.003 585.893 855.050
RT 261.470 364.677 590.120 1770.770 146.770 963.93 461.448 1272.020 585.973 856.020
Na BP 5512.350 6164.657 5109.217 4799.194 8219.754 6893.246 4062.321 5781.442 5705.513 4414.710
(mg/kg) AP 5515.215 6180.259 5111.987 4883.900 8265.603 6943.451 4076.024 5876.419 5806.572 4427.254
RT 5561.201 6185.411 5120.698 4893.684 8277.351 6947.125 4081.943 5879.316 5821.604 4437.164
University of Ghana http://ugspace.ug.edu.gh

122
Table B3: Results of the elemental composition in honey from the Greater Accra region
GREATER ACCRA REGION
ELEMENT Ayimen-sa Akwetey-man Amasaman Pokuase Awoshie Weija Adenta Ableku-ma Oyibi Afienya
Co BP 0.037 0.036 0.046 0.035 0.017 0.036 0.042 0.036 0.041 0.037
(mg/kg) AP 0.037 0.037 0.050 0.035 0.020 0.036 0.042 0.036 0.041 0.060
RT 0.040 0.041 0.050 0.039 0.021 0.036 0.042 0.036 0.041 0.094
Pb BP 0.234 0.138 0.174 0.336 0.090 0.132 0.318 0.114 0.030 0.036
(mg/kg) AP 0.258 0.264 0.432 0.456 0.162 0.462 0.516 0.150 0.162 0.198
RT 0.558 0.486 0.498 0.660 0.336 0.473 0.576 0.186 0.504 0.288
Cr BP 0.040 0.036 0.039 0.046 0.040 0.047 0.036 0.042 0.042 0.048
(mg/kg) AP 0.042 0.038 0.042 0.047 0.041 0.049 0.040 0.042 0.048 0.057
RT 0.042 0.038 0.042 0.058 0.053 0.052 0.046 0.042 0.048 0.078
Fe BP 1.824 2.076 2.676 2.466 2.310 2.586 2.184 2.586 3.978 3.036
(mg/kg) AP 2.862 2.706 3.216 2.922 3.150 2.988 3.822 3.096 4.236 3.396
RT 3.654 3.408 11.052 2.994 3.786 3.126 4.104 3.444 4.536 7.572
Mg BP 92.191 300.125 229.918 316.258 76.895 122.319 179.214 145.003 75.697 239.265
(mg/kg) AP 92.218 316.214 229.920 323.451 79.888 132.214 192.905 145.214 81.832 241.817
RT 93.145 319.125 226.126 350.144 89.126 132.108 216.107 150.136 82.987 247.442
V BP 1.001 5.942 9.661 3.145 1.158 4.129 4.718 4.271 0.962 1.932
(mg/kg) AP 1.231 6.291 11.441 3.142 1.482 6.459 4.771 5.142 0.987 2.164
RT 1.426 8.241 17.215 3.026 1.692 6.618 6.135 12.152 3.219 9.215
Cu BP 150.246 30.451 249.113 4.524 21.672 77.217 288.298 63.456 11.924 55.123
(mg/kg) AP 150.339 30.442 254.692 5.241 24.135 79.114 264.221 68.986 14.245 64.932
RT 156.226 31.913 260.192 6.841 36.122 84.126 271.351 71.532 22.681 65.112
Al BP 212.137 501.284 224.248 372.365 60.159 192.697 89.741 75.667 100.254 99.125
(mg/kg) AP 218.258 503.624 241.363 373.692 66.661 197.265 85.214 77.326 103.935 100.412
RT 250.984 523.148 299.122 391.568 67.011 198.358 84.968 78.265 112.368 107.845
Ca BP 42.137 73.567 73.567 108.867 52.267 62.16 23.926 153.243 29.927 57.778
(g/kg) AP 43.237 75.716 73.927 109.463 53.827 63.216 24.978 154.573 42.130 57.913
RT 51.577 76.613 74.177 111.247 62.136 63.288 26.863 157.577 42.136 58.823
Mn BP 2514.121 803.155 2240.872 2484.151 1290.411 965.356 1125.349 1324.124 906.054 1357.754
(mg/kg) AP 2539.483 811.671 2246.246 2488.623 1298.245 967.994 1169.384 1377.717 906.154 1366.241
RT 2566.847 902.646 2297.568 2512.352 1301.254 977.012 1198.377 1445.668 907.264 1392.154
K BP 317.267 430.040 181.525 323.453 166.990 331.063 681.440 456.163 231.137 408.620
(g/kg) AP 317.450 430.090 181.544 323.463 167.070 333.157 681.460 456.247 231.143 408.590
RT 317.503 430.120 181.605 323.727 167.190 333.163 681.743 456.250 231.270 408.677
Na BP 5693.562 4185.411 3278.903 900.214 1262.638 1974.021 4662.016 2575.330 3154.232 4210.030
(mg/kg) AP 5704.148 4199.642 3283.439 911.132 1267.511 1976.327 4701.534 2585.024 3154.241 4216.250
RT 5784.012 4203.151 3361.189 926.415 1277.215 1991.900 4716.436 2587.100 3163.018 4219.295
BP-Before Processing, AP- After Processing, RT-Retailer (As, Hg, and Cd were Below Detection Limit of 0.001 mg/kg)
University of Ghana http://ugspace.ug.edu.gh

123
APPENDIX C
Table C1: P- Values calculated for the variations of the elements in the samples (Brong Ahafo Region)
BRONG AHAFO REGION
Element Atebubu Fiapre Drobo Dumasua Mantukwa Nsoatre Kintampo Techiman Tanoso Berekum
Co(mg/kg) P-
value P=0.125 P=1.000 P=1.000 P=1.000 P=1.000 P=0.729 P=0.000 P=0.037 P=0.000 P=0.125
Pb( mg/kg) P-
value
P=0.000 P=0.000 P=0.000 P=0.000 P=0.000 P=0.000 P=0.000 P=0.000 P=0.000 P=0.000
Cr( mg/kg) P-
value
P=0.000 P=0.729 P=0.438 P=0.000 P=0.000 P=0.068 P=0.000 P=0.000 P=0.016 P=0.191
Fe( mg/kg) P-
value
P=0.000 P=0.000 P=0.000 P=0.000 P=0.000 P=0.000 P=0.000 P=0.000 P=0.000 P=0.000
Mg( mg/kg) P-
value
P=0.000 P=0.000 P=0.000 P=0.000 P=0.000 P=0.000 P=0.000 P=0.000 P=0.000 P=0.000
V(ppm) P-
value
P=0.000 P=0.000 P=0.000 P=0.000 P=0.000 P=0.000 P=0.000 P=0.000 P=0.000 P=0.000
Cu( mg/kg) P-
value
P=0.000 P=0.000 P=0.000 P=0.000 P=0.000 P=0.000 P=0.000 P=0.000 P=0.000 P=0.000
Al( mg/kg) P-
value
P=0.000 P=0.000 P=0.000 P=0.000 P=0.000 P=0.000 P=0.000 P=0.000 P=0.000 P=0.000
Ca (g/kg) P-
value
P=0.000 P=0.000 P=0.000 P=0.000 P=0.000 P=0.000 P=0.000 P=0.000 P=0.000 P=0.000
Mn( mg/kg) P-
value
P=0.000 P=0.000 P=0.000 P=0.000 P=0.000 P=0.000 P=0.000 P=0.000 P=0.000 P=0.000
K (g/kg) P-
value
P=0.000 P=0.001 P=0.108 P=0.002 P=0.000 P=0.000 P=0.034 P=0.000 P=0.000 P=0.000
Na( mg/kg) P-
value
P=0.000 P=0.000 P=0.000 P=0.000 P=0.000 P=0.000 P=0.000 P=0.000 P=0.000 P=0.000
University of Ghana http://ugspace.ug.edu.gh
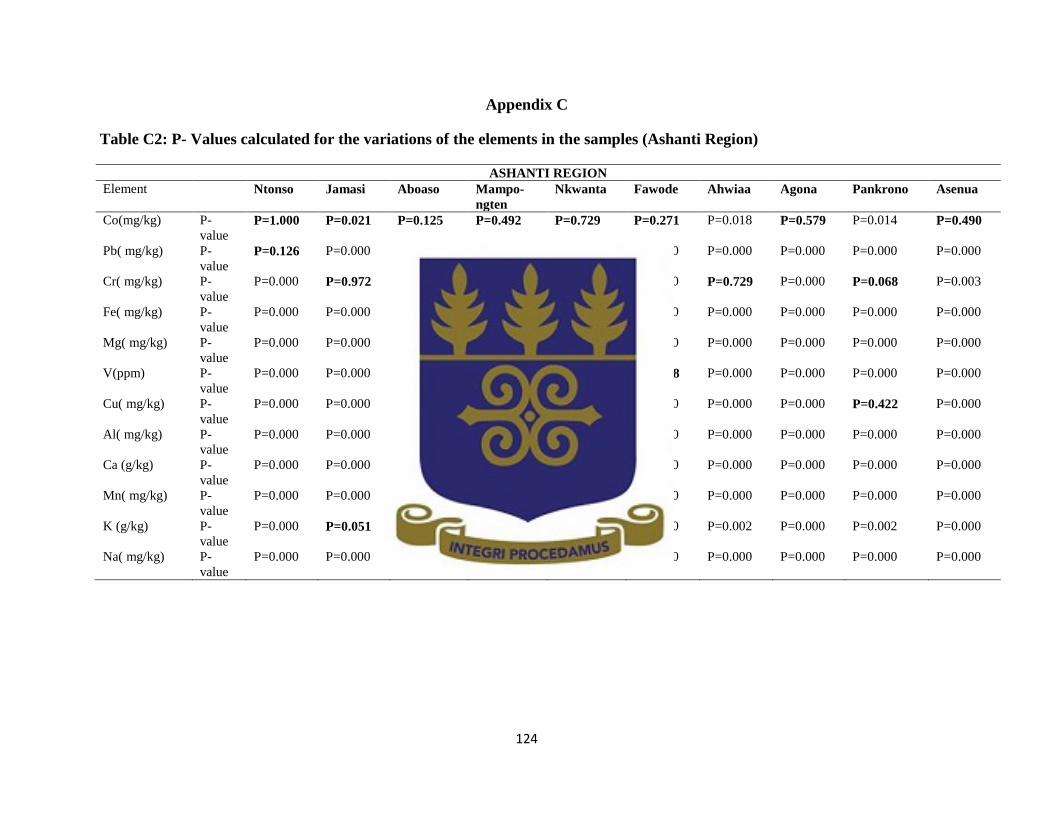
124
Appendix C
Table C2: P- Values calculated for the variations of the elements in the samples (Ashanti Region)
ASHANTI REGION
Element Ntonso Jamasi Aboaso Mampo-
ngten
Nkwanta Fawode Ahwiaa Agona Pankrono Asenua
Co(mg/kg) P-
value P=1.000 P=0.021 P=0.125 P=0.492 P=0.729 P=0.271 P=0.018 P=0.579 P=0.014 P=0.490
Pb( mg/kg) P-
value P=0.126
P=0.000
P=0.000
P=0.972
P=0.000 P=0.000 P=0.000 P=0.000 P=0.000 P=0.000 P=0.000 P=0.000
Cr( mg/kg) P-
value P=0.729 P=0.242 P=0.824 P=0.000 P=0.729 P=0.000 P=0.068 P=0.003
Fe( mg/kg) P-
value
P=0.000 P=0.000 P=0.000 P=0.000 P=0.000 P=0.000 P=0.000 P=0.000 P=0.000 P=0.000
Mg( mg/kg) P-
value
P=0.000 P=0.000 P=0.000 P=0.000 P=0.000 P=0.000 P=0.000 P=0.000 P=0.000 P=0.000
V(ppm) P-
value
P=0.000 P=0.000 P=0.000 P=0.000 P=0.000 P=0.238 P=0.000 P=0.000 P=0.000 P=0.000
Cu( mg/kg) P-
value
P=0.000 P=0.000 P=0.000 P=0.000 P=0.000 P=0.000 P=0.000 P=0.000 P=0.422 P=0.000
Al( mg/kg) P-
value
P=0.000 P=0.000 P=0.000 P=0.000 P=0.000 P=0.000 P=0.000 P=0.000 P=0.000 P=0.000
Ca (g/kg) P-
value
P=0.000 P=0.000 P=0.000 P=0.000 P=0.000 P=0.000 P=0.000 P=0.000 P=0.000 P=0.000
Mn( mg/kg) P-
value
P=0.000 P=0.000 P=0.000 P=0.000 P=0.000 P=0.000 P=0.000 P=0.000 P=0.000 P=0.000
K (g/kg) P-
value
P=0.000 P=0.051 P=0.000 P=0.000 P=0.162 P=0.000 P=0.002 P=0.000 P=0.002 P=0.000
Na( mg/kg) P-
value
P=0.000 P=0.000 P=0.000 P=0.000 P=0.000 P=0.000 P=0.000 P=0.000 P=0.000 P=0.000
University of Ghana http://ugspace.ug.edu.gh

125
Appendix C
Table C3: P- Values calculated for the variations of the elements in the samples (Greater Accra Region)
GREATER ACCRA REGION
Element Ayimen-
sa
Akwete-
yman
Amasam-an Pokuase Awoshie Weija Adenta Ableku-
ma
Oyibi Afienya
Co(mg/kg) P-
value P=0.630 P=0.630 P=0.630 P=0.630 P=0.630 P=1.000 P=1.000 P=1.000 P=1.000 P=0.395
Pb( mg/kg) P-
value
P=0.000 P=0.000 P=0.000 P=0.000 P=0.000 P=0.000 P=0.000 P=0.000 P=0.000 P=0.000
Cr( mg/kg) P-
value
P=0.047 P=0.047 P=0.047 P=0.000 P=0.000 P=0.317 P=0.317 P=1.000 P=0.000 P=0.000
Fe( mg/kg) P-
value
P=0.000 P=0.000 P=0.000 P=0.000 P=0.000 P=0.000 P=0.000 P=0.000 P=0.000 P=0.000
Mg( mg/kg) P-
value
P=0.000 P=0.000 P=0.000 P=0.000 P=0.000 P=0.000 P=0.000 P=0.000 P=0.000 P=0.000
V(ppm) P-
value
P=0.000 P=0.000 P=0.000 P=0.000 P=0.000 P=0.000 P=0.000 P=0.000 P=0.000 P=0.000
Cu( mg/kg) P-
value
P=0.000 P=0.000 P=0.000 P=0.000 P=0.000 P=0.000 P=0.000 P=0.000 P=0.000 P=0.000
Al( mg/kg) P-
value
P=0.000 P=0.000 P=0.000 P=0.021 P=0.000 P=0.000 P=0.000 P=0.000 P=0.000 P=0.000
Ca (g/kg) P-
value
P=0.000 P=0.000 P=0.000 P=0.000 P=0.000 P=0.000 P=0.000 P=0.000 P=0.000 P=0.000
Mn( mg/kg) P-
value
P=0.000 P=0.000 P=0.000 P=0.000 P=0.000 P=0.000 P=0.000 P=0.000 P=0.000 P=0.000
K (g/kg) P-
value
P=0.001 P=0.410 P=0.111 P=0.002 P=0.317 P=0.000 P=0.001 P=0.244 P=0.050 P=0.167
Na( mg/kg) P-
value
P=0.000 P=0.000 P=0.000 P=0.000 P=0.000 P=0.000 P=0.000 P=0.000 P=0.000 P=0.000
University of Ghana http://ugspace.ug.edu.gh

126
APPENDIX D1
SAMPLE QUESTIONNAIRES
PERSONAL INFORMATION
GENDER: Male Female
AGE RANGE: 10– 20 years 21 – 30 years 31 – 40years 41 – 50 years
51 – 60 years 61– 70 years 71– 80 years 81– 90 years
LEVEL OF EDUCATION: basic secondary tertiary post graduate none
OCCUPATION:…………………...REGION……………DISTRICT………………….
Commercial bee keeping……..………………… Bee hunting………………………….
1) How long have you been in the honey business?
(a) 0-5 years
(b) 6-10 years
(c) 11-20 years
(d) 21-30 years
(e) Above 30 years
2) How many colonies do you have? (where applicable)
3) Which people do you normally sell your products to?
(a) Individuals
(b) Traders
(c) Both
(d) Others, e.g………………………………
4) What is the location of your honey farm (Apiaries)?
(a) Close to an industry
(b) Close to a tarred road/ filling station
(c) Few meters away from human settlement
(d) Other
5) What equipment do you usually use during honey extraction
(a) Wood
(b) Metal
(c) Both (wood and metal)
(d) others
6) What kind of safety equipment do you use/Measures taken to reduce contamination
(a) Gloves
(b) Goggles
(c) Head cover
(d) Others
7) Containers for keeping the products
(a) New plastic containers
(b) Used plastic containers
University of Ghana http://ugspace.ug.edu.gh
127
(c) Metal containers
8) Treatment of Containers before honey storage
(a) Rinsing
(b) Thorough washing with soap or detergents
(c) No washingorrinsing
(d) others
9) What is the color of your honey?
(a) Brown
(b) Colourless
(c) Dark brown
(d) Other
10) Honey’s consistency?
(a) Fluid
(b) Viscous
(c) Partly to entirely crystallized
11) Aroma or flavor of the honey?
(a) Sweet scented
(b) Foul smell
(c) Fermented
(d) Other
12) What treatment method do you use after extraction?
(a) Filtering
(b) Removal of contaminants
(c) Heating
(d) Sieving
(e) Other
13) Do you add any additives before selling them?
(a) Yes
(b) No
14) If yes what is the additive?
15) (If yes), why do you add them?
(a) To improve the flavor
(b) To change the colour
(c) To increase the volume
(d) To change honey's consistency
(e) Others
16) Do you have particular days and times that you usually do the extraction?
(a) Yes
(b) No
17) (If yes), why?………………………………………
18) How are the bees deployed for pollination?
(a) On a small scale
University of Ghana http://ugspace.ug.edu.gh

128
(b) On commercial basis.
(c) Others
19) What food do you normally feed the bee colonies on?
(a) Protein supplements
(b) Pollen supplements
(c) Others
20) What methods are employed for feeding such foods to the bee colonies?
(a) You collect pollen from flowers and bring back to the hive
(b) From nitrogenous food-stuffs provided by the beekeeper
(c) Others
21) How do you control Pest and disease, and the chemical employed?
(a) Use of oxytetracycline and fumagillin as aids in the control and prevention of
bee diseases
(b) Diagnosis and treatment of disease in the laboratory
(c) Others
22) Bees’ foraging activities and the size of the area normally covered.
(a) On a stand of honeysuckle in the farm
(b) Brightly colored flowers in the farm
(c) Other
23) Which place do you normally sell the honey?
(a) Hawking
(b) Market
(c) Home
(d) Roadside
(e) Schools
(f) Other
University of Ghana http://ugspace.ug.edu.gh

129
APPENDIX D2
RESPONSE TO QUESTIONNAIRES
Concern Response
Frequency Percent
How old are you? 10-20years 1 3.3
21-30years 5 16.7
31-40years 1 3.3
41-50years 7 23.3
51-60years 7 23.3
51-60years 7 23.3
61-70years 8 26.7
81-90years 1 3.3
Total 30 100.0
How long have you been in
the Honey business? 0-5 years 4 13.3
6-10 years 9 30.0
11-20 years 11 36.7
21-30 years 3 10.0
more than 30 years 3 10.0
Total 30 100.0
Equipment used in honey’s
extraction wood 13 43.3
metal 3 10.0
both (wood and metal) 14 46.7
Total 30 100.0
Measures taken to reduce
contamination Gloves only 8 26.7
University of Ghana http://ugspace.ug.edu.gh

130
Concern Response
Frequency Percent
Head cover only 3 10.0
head cover and gloves 17 56.7
other 2 6.7
Total 30 100.0
Containers for keeping or
storing honey New Plastic containers 6 20.0
Used plastic containers 18 60.0
Metal containers 6 20.0
Total 30 100.0
Treatment of containers prior
to storage Rinsing 19 63.3
Thorough washing with soap or
detergents 7 23.3
No washing or rinsing 4 13.3
Total 30 100.0
Treatment method do used
after extraction? Filtering 21 70.0
Heating 7 23.3
Other (sieving, decanting, hand
squeezing etc) 2 6.7
Total 30 100
Additives? yes 4 13.3
no 26 86.7
Total 30 100.0
Why add them? To increase volume 2 6.7
University of Ghana http://ugspace.ug.edu.gh

131
Concern Response
Frequency Percent
To change honey's consistency 2 6.7
Total 4 13.3
System(missing) 26 86.7
Total 30 100.0
What additive? water 4 13.3
none 26 86.7
Total 30 100.0
Selling Place? hawking 8 26.7
market 7 23.3
home 4 13.3
roadside 7 23.3
schools 4 13.3
Total 30 100.0
Apiary’s location? Close to an industry 2 6.7
Close to a tarred road/ filling stations 8 26.7
Few meters away from human
settlement 16 53.3
others 4 13.3
Total 30 100.0
University of Ghana http://ugspace.ug.edu.gh