

Monitoring for Transition Cow Issues Todd Duffield, DVM, DVSc [email protected].
59
-
Upload
derek-allison -
Category
Documents
-
view
232 -
download
0
Transcript of Monitoring for Transition Cow Issues Todd Duffield, DVM, DVSc [email protected].

Monitoring for Transition Cow Issues
• What are the Issues ?• How do we find them ?• Do they matter ?• What can we do about them ?
FOCUS ON ENERGY METABOLISM

What are the Major Transition Cow Issues?

Goals
Calve without problems
Avoid disease
Make lots of milk
Get pregnant by 120 DIM
Impediments
RP
Dystocia
Metritis
Ketosis
DA
Mastitis
Rumen acidosis
Lameness
Endometritis
Anestrus
Insemination
Severity, timing,and duration of
negative energy balance
HypocalcemiaImmune function
Cow environment
Feed intake
Ways to gain insight into the success of the processClinical disease
Production Measure DMIBCSUnderstanding cow experienceFeed access
Lying timeHousing design
NEFA, BHBA, etc

Time for transitions• Development of
lactation in mammary gland ~ 3 weeks
• Rumen microflora adaptation ~ 10 – 14 days
• Altering metabolic set-point ~ 6 weeks (?)
• Social adjustment to new group 2 d to 1 week

Monitoring Transition Cow Issues
• What are the Issues ?• How do we find them ?

Disease Incidence 2006 NA Study (Carson, 2008)
Northeast
n=650Midwest
n=570Southeast
n=465West n=668 Total
Milk Fever 2% 3.3% 2.0% 2.5% 2.5%
Ketosis 6.0% 10.5% 6.4% 15.3% 9.6%
RP 5.2% 7.9% 7.9% 9.4% 7.6%
Metritis 5.7% 6.3% 19.5% 34.5% 16.5%
DA 4.5% 5.1% 4.6% 0.5% 3.7%

Problems with Clinical Disease?
• Frequently Poorly Recorded
• Disease Definitions not Standardized
• “After the Fact” in an Ideal Monitoring Program
• Probably LESS Sensitive than Metabolic “Subclinical” Tests

Clinical ketosis treatment rate is a poor estimate of ketosis
0
20
40
60
80
Herd
% S
ub
clin
ical
Ket
osi
s
012345678910
% C
lin
ical
Ket
osi
s In
cid
ence
SCK 1400 BHBA Clinical Ketosis
(Duffield et al 1998)

What about Milk Components?
• Subclinical Ketosis Associated with:– ↓ Milk protein %– ↑ Milk fat %At First DHI test postcalving
But…• Best test is PFR ≤ 0.75
– Sensitivity: 58%– Specificity: 69%
BOTTOMLINE: The test is CRAP.
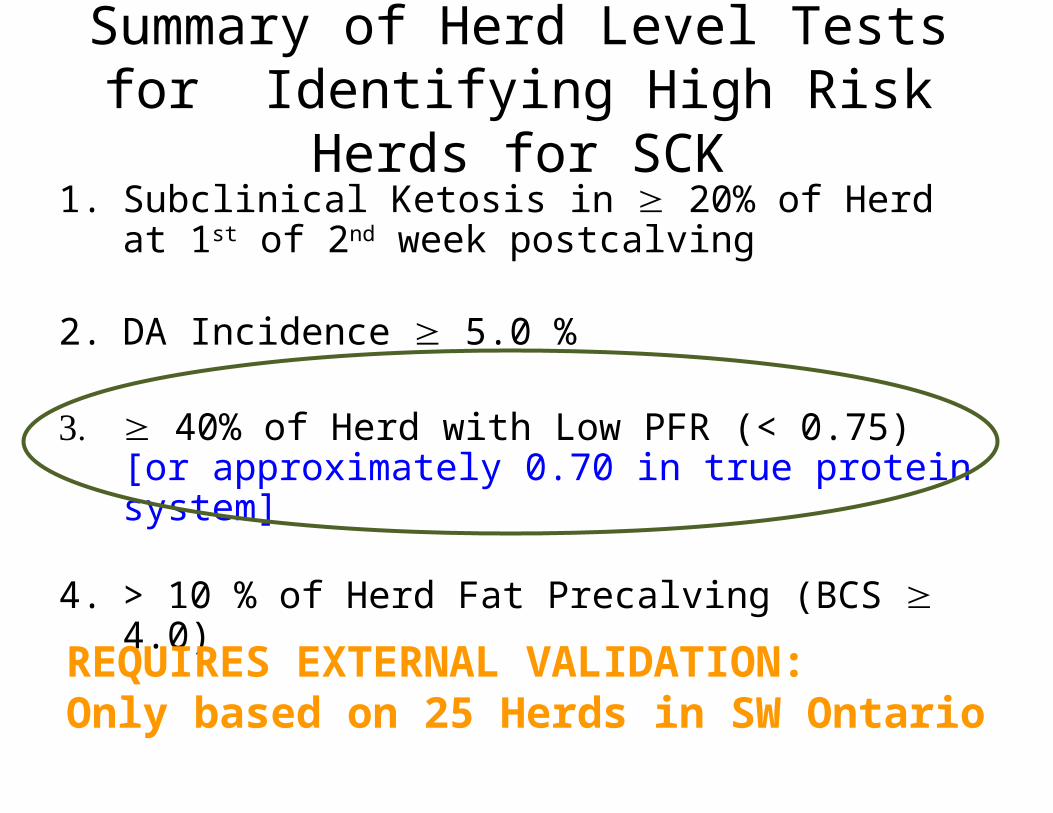
Summary of Herd Level Tests for Identifying High Risk Herds for
SCK1. Subclinical Ketosis in 20% of Herd
at 1st of 2nd week postcalving
2. DA Incidence 5.0 %
3. 40% of Herd with Low PFR (< 0.75)[or approximately 0.70 in true protein system]
4. > 10 % of Herd Fat Precalving (BCS 4.0)
REQUIRES EXTERNAL VALIDATION: Only based on 25 Herds in SW Ontario

What about DMI?
• Precalving DMI a good predictor of SCK postcalving.
• U of G research:– < 12 kg DMI in last 3 weeks
= 6X Increased Risk of SCK.
• Problems– Getting it Measured– Demographics in Group
• Heifers• Lot’s close to calving

Frequency Distribution of DMI for 160 Holstein Cow and Heifers
during Last 3 Weeks Precalving
0
200
400
600
800
1000
1200
1400
Number of Occurrences
Kg
DMI
IndividualGOAL
2 S.D’s
1 S.D16.5% lower
Mean50% lower
Group Target

Typical patterns of DMI and NEFA
Overton/Burhans, 2001

Serum/Blood Metabolic TestsWhat Does Work?
• Energy Monitors in Transition Cows:– Precalving – NEFA– Postcalving – BHBA
• Calcium status within a few days of calving– hypocalcemia
• Haptoglobin– inflammation
• DO NOT USE AVERAGES – looking for EXCEPTIONS –Therefore % above or below a cutpoint for group interpretation
Focus ofTalk
↓ Ca, ↑ Culling risk but need more research
Non-specific but associated with metritis, need more data
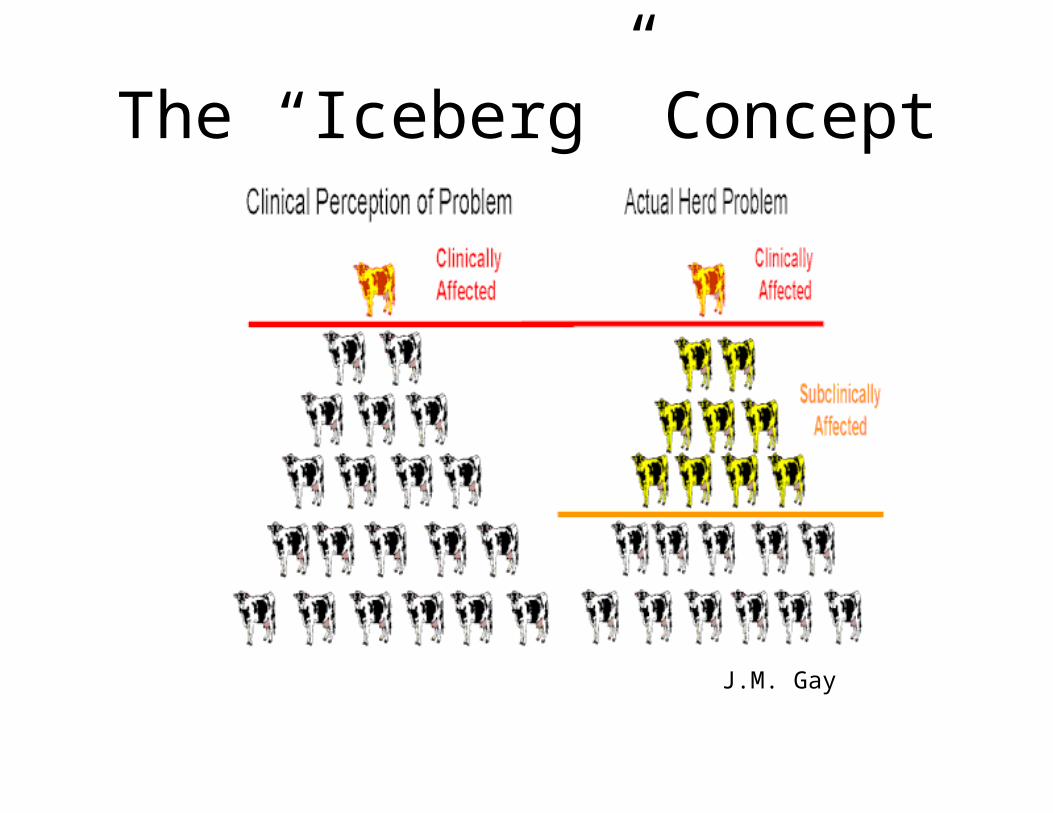
J.M. Gay
The “Iceberg” Concept

Monitoring Transition Cow Issues
• What are the Issues ?• How do we find them ?• Do they matter ?
FOCUS ON ENERGY METABOLISM

Investigating or Monitoring Energy Metabolism in Transition Cows
• PreCalving - NEFA
• PostCalving - Ketones

Relationship between Precalving DMI and
serum NEFA
0
2
4
6
8
10
12
14
0 0.2 0.4 0.6 0.8 1 1.2
NEFA (U/L)
DM
I (k
g)
DMI
R2 = 0.29
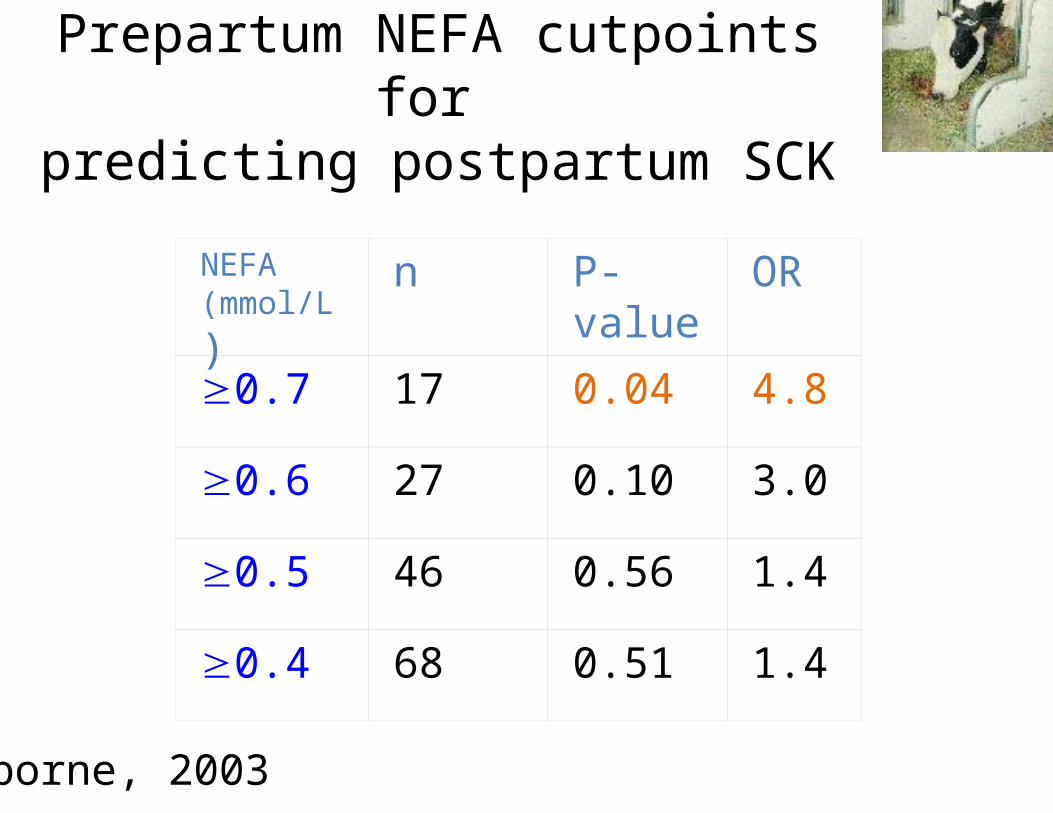
Prepartum NEFA cutpoints for predicting postpartum SCK
0.6
NEFA
(mmol/L)n P-
valueOR
0.7 17 0.04 4.8
27 0.10 3.0
0.5 46 0.56 1.4
0.4 68 0.51 1.4
Osborne, 2003
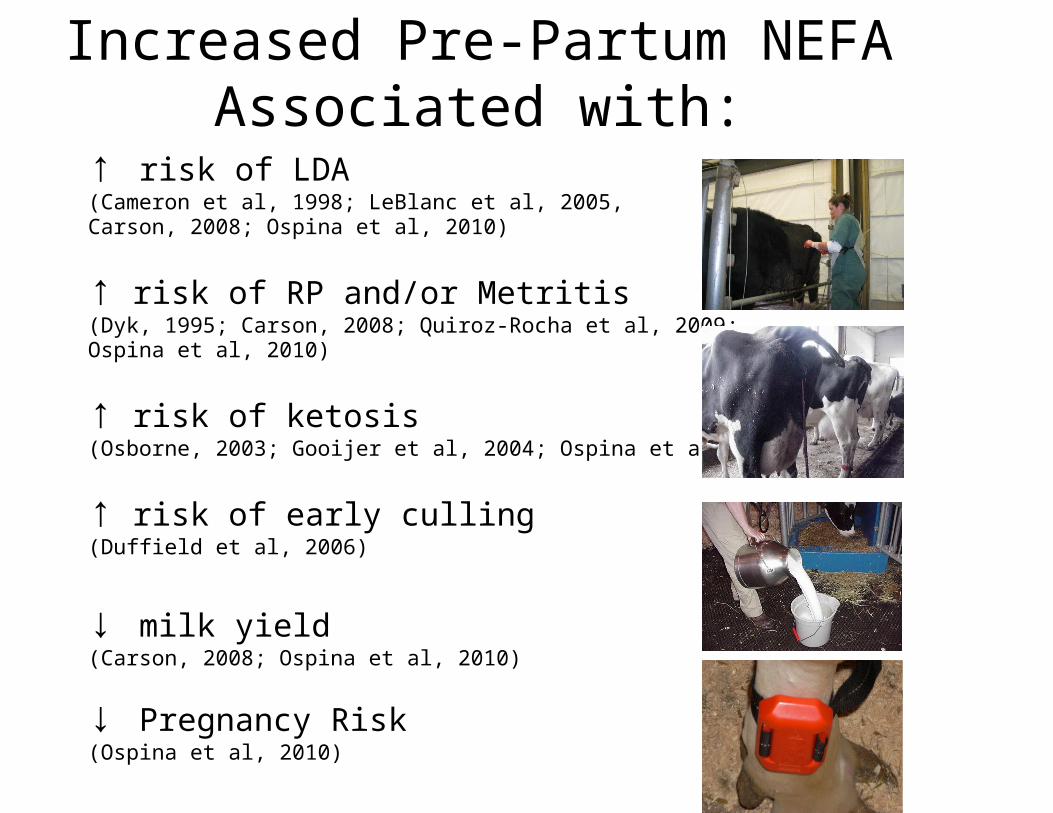
Increased Pre-Partum NEFA Associated with:
↑ risk of LDA(Cameron et al, 1998; LeBlanc et al, 2005, Carson, 2008; Ospina et al, 2010)
↑ risk of RP and/or Metritis(Dyk, 1995; Carson, 2008; Quiroz-Rocha et al, 2009;Ospina et al, 2010)
↑ risk of ketosis(Osborne, 2003; Gooijer et al, 2004; Ospina et al, 2010)
↑ risk of early culling(Duffield et al, 2006)
↓ milk yield(Carson, 2008; Ospina et al, 2010)
↓ Pregnancy Risk(Ospina et al, 2010)

Cow-Level Associations of Pre-calving NEFA (mmol/L) with Disease/Production Outcomes
Weeks relative
to Calving
Author, Year Cut-point Outcome Impact P-Value
-1 Carson, 2008 0.3 Retained Placenta OR = 1.8 <0.001
-1Quiroz-Rocha, 2007 0.4 Retained Placenta OR = 1.2 <0.01
-1 Carson, 2008 0.3 Metritis OR = 1.8 <0.001-1 Carson, 2008 0.5 Displaced Abomasum OR = 2.4 <0.001-1 Leblanc, 2005 0.5 Displaced Abomasum OR = 3.6 <0.001-2 Ospina, 2010 0.3 DA, CK, Metritis OR > 1.8 <0.01-1 Carson, 2008 0.5 Milk Yield ↓ 1.6 kg/d 0.02-2 Ospina, 2010 0.3 Milk Yield ↓ 2.2 kg/d <0.01-1 Carson, 2008 0.3 1st Test LS ↑ 0.24 0.03-2 Ospina, 2010 0.3 Pregnancy Risk ↓ 18% <0.01

Days from calving
-20 -15 -10 -5 0 5 10
Se
ru
m N
EF
A (
mE
q/L
)
0.0
0.5
1.0
1.5
2.0
Cows without DA (n = 1078)Cows with DA (n = 53)
LeBlanc et al, 2005

Precalving NEFA and Subsequent DHI Milk Yield
Carson, 2008
0 1 2 3 4 532
33
34
35
36
37
38
39
40
41NEFA <0.5NEFA ≥0.5
DHI Test Number
Milk
Yie
ld (k
g/da
y)

Investigating or Monitoring Energy Metabolism in Transition Cows
• PreCalving - NEFA
• PostCalving - Ketones

Summary of Objective Serum BHBA Thresholds for
HyperketonaemiaThreshold Measure Risk Author
umol/L mg/dL
1200 12 LDA 8X LeBlanc
1400 14 LDA 3X Geishauser
1200 12 LDA/Ketosis 3X Duffield
1000 10 LDA/Ketosis/Metritis 2X Ospina
1400 12 Repro (CR) 40% Walsh
1400 14 Repro (CR) 55% Whitaker
1000 10 Repro (Pregnancy risk)
13% Ospina
1400 14 Culling 2X Duffield
1400 14 Milk Loss 1.9 kg Duffield
1000 10 Milk Loss 1.3 kg OspinaNOTES: 1. Minimum Threshold = 1000 umol/L BHBA
2. Effect Increases with increasing BHBA concentration.3. Optimum Cutpoint 1000 to 1400 umol/L BHBA

When Do I Test?
02468
101214161820222426
-3 0 3 6 9
Weeks from Calving
% Subclinical Ketosis
MonensinPlacebo
Weeks: 1, 2, +/- 3 PostcalvingFrequency: every 1 to 2 weeksWho: ALL cows and 1st lactation heifers

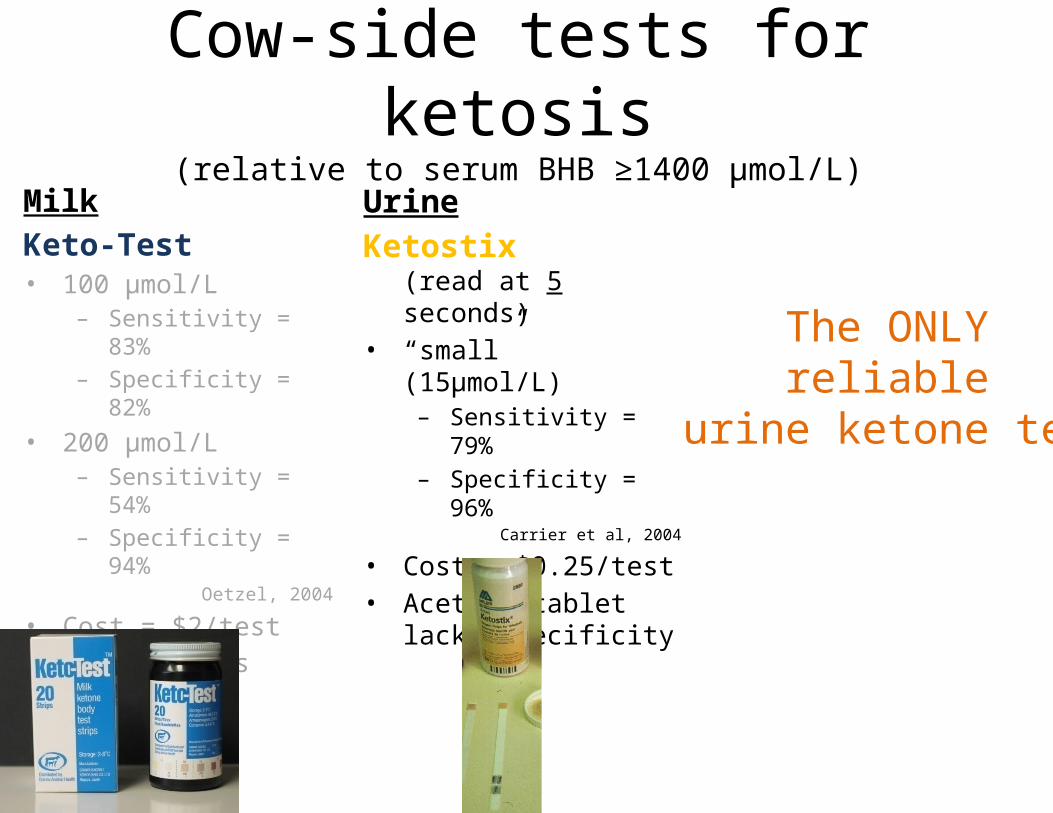
Cow-side tests for ketosis(relative to serum BHB ≥1400 µmol/L)
MilkKeto-Test• 100 µmol/L
– Sensitivity = 83%– Specificity = 82%
• 200 µmol/L– Sensitivity = 54%– Specificity = 94%
Oetzel, 2004
• Cost = $2/test• Powder lacks
sensitivity
The ONLY reliable milk ketone test
Cow-side tests for ketosis(relative to serum BHB ≥1400 µmol/L)
MilkKeto-Test• 100 µmol/L
– Sensitivity = 83%– Specificity = 82%
• 200 µmol/L– Sensitivity = 54%– Specificity = 94%
Oetzel, 2004
• Cost = $2/test• Powder lacks
sensitivity
UrineKetostix
(read at 5 seconds)• “small” (15µmol/L)
– Sensitivity = 79%– Specificity = 96%
Carrier et al, 2004
• Cost = $0.25/test• Acetest tablet lacks
specificity
The ONLY reliable
urine ketone test

Cow-side tests for ketosis(relative to serum BHB ≥1400 µmol/L)
MilkKeto-Test• 100 µmol/L
– Sensitivity = 83%– Specificity = 82%
• 200 µmol/L– Sensitivity = 54%– Specificity = 94%
Oetzel, 2004
• Cost = $2/test• Powder lacks
sensitivity
UrineKetostix
(read at 5 seconds)• “small” (15µmol/L)
– Sensitivity = 79%– Specificity = 96%
Carrier et al, 2004
• Cost = $0.25/test• Acetest tablet lacks
specificity
Blood
Precision XTRA BHBA
• Sensitivity = 87-93%• Specificity = 93-100%
Heuweiser,2007Oetzel, 2008
Burke,2008
• Cost = $2/test
Precision XTRA:- Highly Accurate test- Like having the Lab in your Hand!

How do you know where you are
unless you look?

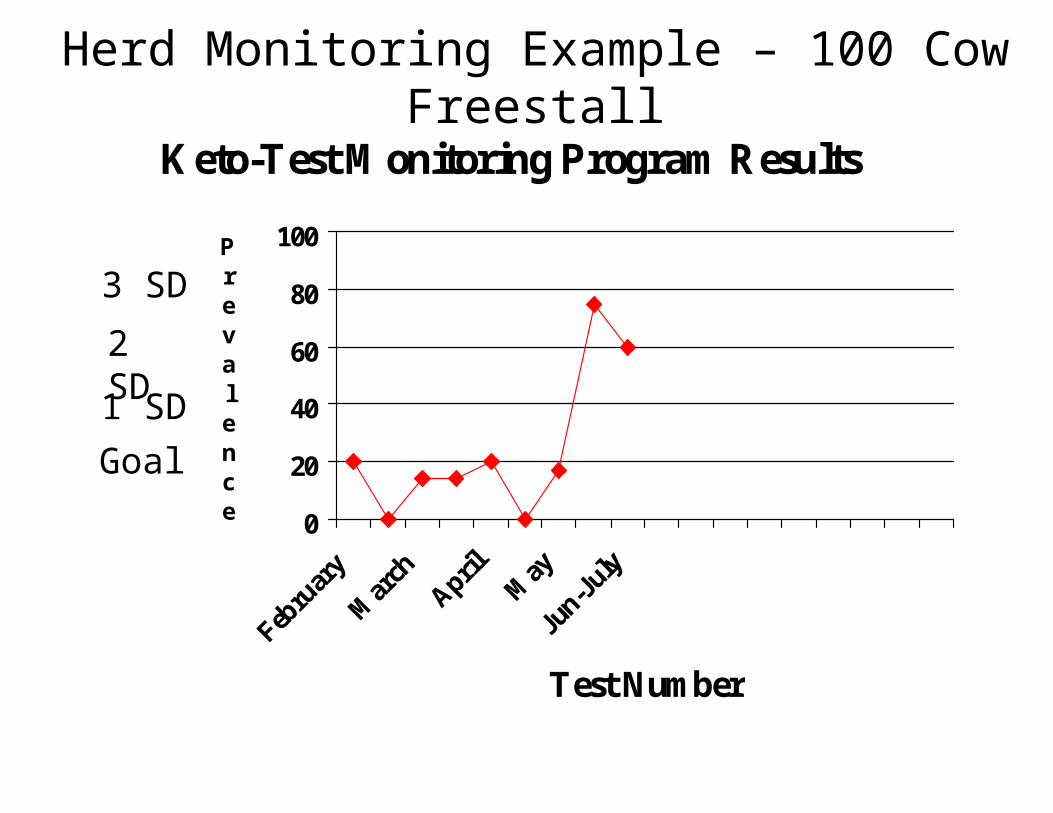
Keto-Test Monitoring Program Results
0
20
40
60
80
100
Febru
ary
Mar
chApril
May
Jun-J
uly
Test Number
Prevalence
Herd Monitoring Example – 100 Cow Freestall
1 SD
Goal
2 SD
3 SD

Keto-Test Monitoring Program Results
0
20
40
60
80
100
Febru
ary
Mar
chApril
May
July
August
Septe
mber
Octo
ber
Decem
ber
Month
Prevalence
Herd Monitoring Example – 100 Cow Freestall
1 SD
Goal
2 SD
3 SD
2 DA’s, 4 RP’s

What Do I Do With the Data?
A. MonitoringB. Problem Investigation
1. Group Interpretation - HERD LEVEL
– Identify/Dx problems and make changes prior to major losses
– Proactive rather than Reactive (if monitoring)
2. Individual Interpretation- INDIVIDUAL LEVEL
– Early treatment may ward off Clinical Disease
Purpose of Data Gathering
Level of Interpretation
Prevention
Treatment

Case Example 1A- Individual
• 80 Milking Cows in a Tiestall– Owner starts a weekly Keto-Test
monitoring program 1st week of September
• Tests all cows 3 weeks fresh Tuesday mornings
– Week 1: 0/6– Week 2: 0/5– Week 3: 1 / 4
• Owner calls because +ve Cow has a PING– I go – It’s an LDA– Farmer didn’t know she had a problem until he
tested!

Case Example 1B- Herd
• 80 Milking Cows in a Tiestall– Owner starts a weekly Keto-Test
monitoring program 1st week of September
• Tests all cows 3 weeks fresh Tuesday mornings
– Week 1: 0/6– Week 2: 0/5– Week 3: 1 / 4– Week 4: 0/5– Week 5: 1/6– Week 6: 1/8– Week 7: 7/10
Now What?

Herd Example 1B
• Change was Real– Testing was being done correctly
• Of the 7 +ve:– 1 was 500 umol/L– 3 were 200 umol/L– 3 were 100 umol/L
– CUD cows eating well– Changed to higher fiber, lower energy
Baleage– All cases were > 11 DIM

What’s Normal?
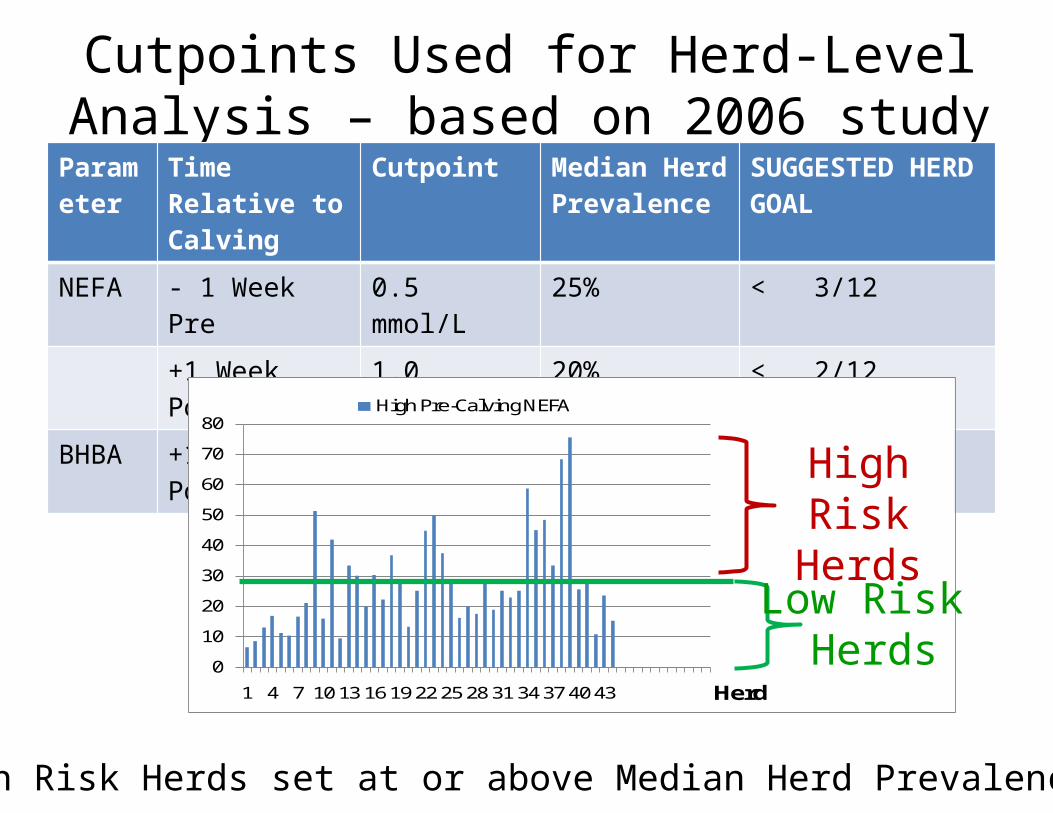
Cutpoints Used for Herd-Level Analysis – based on 2006 study
Parameter
Time Relative to Calving
Cutpoint Median Herd Prevalence
SUGGESTED HERD GOAL
NEFA - 1 Week Pre 0.5 mmol/L 25% < 3/12
+1 Week Post
1.0 mmol/L 20% < 2/12
BHBA +1 Week Post
1400 umol/L
15% < 2/12
High Risk Herds set at or above Median Herd Prevalence
0
10
20
30
40
50
60
70
80
1 4 7 10 13 16 19 22 25 28 31 34 37 40 43 Herd
High Pre-Calving NEFA
High Risk Herds
Low Risk Herds

Validated* Herd-Alarm Levels
(Ospina et al, 2010)Time Relative to Calving
Parameter Cutpoint Alarm Level Prevalence
Mean Proportion of Herds Above Alarm Level
Prepartum NEFA (mEq/L)
≥ 0.3 15% 75%
Postpartum NEFA (mEq/L)
≥ 0.7 15% 65%
Postpartum BHBA (mg/dL)
≥ 12 15% 40%
*Alarm levels associated with:• ↑risk of DA & CK, ↓Pregnancy Rate, and ↓Milk Yield at the Herd-Level

Weekly prevalence of Subclinical Ketosis in Four
Large New York Dairies
14/04/2
010
23/04/2
010
02/05/2
010
11/05/2
010
20/05/2
010
29/05/2
010
07/06/2
010
16/06/2
010
25/06/2
010
04/07/2
010
13/07/2
010
22/07/2
010
31/07/2
010
09/08/2
010
18/08/2
010
27/08/2
010
05/09/2
010
14/09/2
010
23/09/2
010
02/10/2
010
11/10/2
010
20/10/2
010
29/10/2
010
07/11/2
010
16/11/2
010
25/11/2
010
04/12/2
010
13/12/2
010
22/12/2
010
31/12/2
010
09/01/2
011
18/01/2
011
27/01/2
011
-10%
0%
10%
20%
30%
40%
50%
60%
Herd LHerd E
Using Precision Xtra BHBA ≥ 1.3 mmol/L(13 mg/dL)

Weekly prevalence of Subclinical Ketosis in Four
Large New York Dairies
14/04/2
010
23/04/2
010
02/05/2
010
11/05/2
010
20/05/2
010
29/05/2
010
07/06/2
010
16/06/2
010
25/06/2
010
04/07/2
010
13/07/2
010
22/07/2
010
31/07/2
010
09/08/2
010
18/08/2
010
27/08/2
010
05/09/2
010
14/09/2
010
23/09/2
010
02/10/2
010
11/10/2
010
20/10/2
010
29/10/2
010
07/11/2
010
16/11/2
010
25/11/2
010
04/12/2
010
13/12/2
010
22/12/2
010
31/12/2
010
09/01/2
011
18/01/2
011
27/01/2
0110%
10%
20%
30%
40%
50%
60%
Herd LHerd EHerd DHerd S

Monitoring Transition Cow Issues
• What are the Issues ?• How do we find them ?• Do they matter ?• What can we do about them ?
FOCUS ON ENERGY METABOLISM

1. MONITOR
– Need to Know Where You Are– Need to Detect Change
Transition Cow IssuesKey Prevention Strategies

Cutpoints Used for Herd-Level Analysis
Parameter
Time Relative to Calving
Cutpoint Median Herd Prevalence
HERD GOAL
NEFA - 1 Week Pre 0.5 mmol/L 25% < 3/12
+1 Week Post
1.0 mmol/L 20% < 2/12
BHBA +1 Week Post
1400 umol/L
15% < 2/12
High Risk Herds set at or above Median Herd Prevalence
0
10
20
30
40
50
60
70
80
1 4 7 10 13 16 19 22 25 28 31 34 37 40 43 Herd
High Pre-Calving NEFA
High Risk Herds
Low Risk Herds

Variables Associated with High Risk Herds
Variable Odds Ratio’s (p-value) for High Risk Herds Classified by:
> 25% Wk -1 NEFA ≥ 0.5
> 20% Wk +1 NEFA ≥1.0
> 15% Wk +1 BHBA ≥ 1.4
Wreck (All 3 categories)
Fresh Group 6.0 (P=0.03)
4.3 (P=0.04)
9.0 (P=0.01)
3 Transition Rations
0.17 (P=0.04)
Heifers and Cows mixed in Close-up Group
5.0 (0.07) 9.0 (0.05) --- data too sparse---
Anionic diet fed to Close-ups
0.21 (0.02) 0.22 (P=0.02)
0.16 (P=0.03)
Cows calve in Maternity pens
3.7 (0.04)
= “Social Stress”

Relationship Between Mean Herd Precalving NEFA and Close-up Diet NDF
R2 = 0.30
20.0% 30.0% 40.0% 50.0% 60.0%0.00
0.10
0.20
0.30
0.40
0.50
0.60
0.70
0.80
NEFA versus NDFLinear (NEFA versus NDF)
NDF %
NEF
A (m
mol
/L)
High NDF Limits Intake

Relationship Between Mean Herd Precalving NEFA and Close-up Diet NDF
R2 = 0.30
High NDF Limits Intake
20.0% 25.0% 30.0% 35.0% 40.0% 45.0% 50.0% 55.0% 60.0% 65.0%0.00
0.10
0.20
0.30
0.40
0.50
0.60
0.70
StrawNo Straw
NDF %
NEF
A (m
mol
/L)
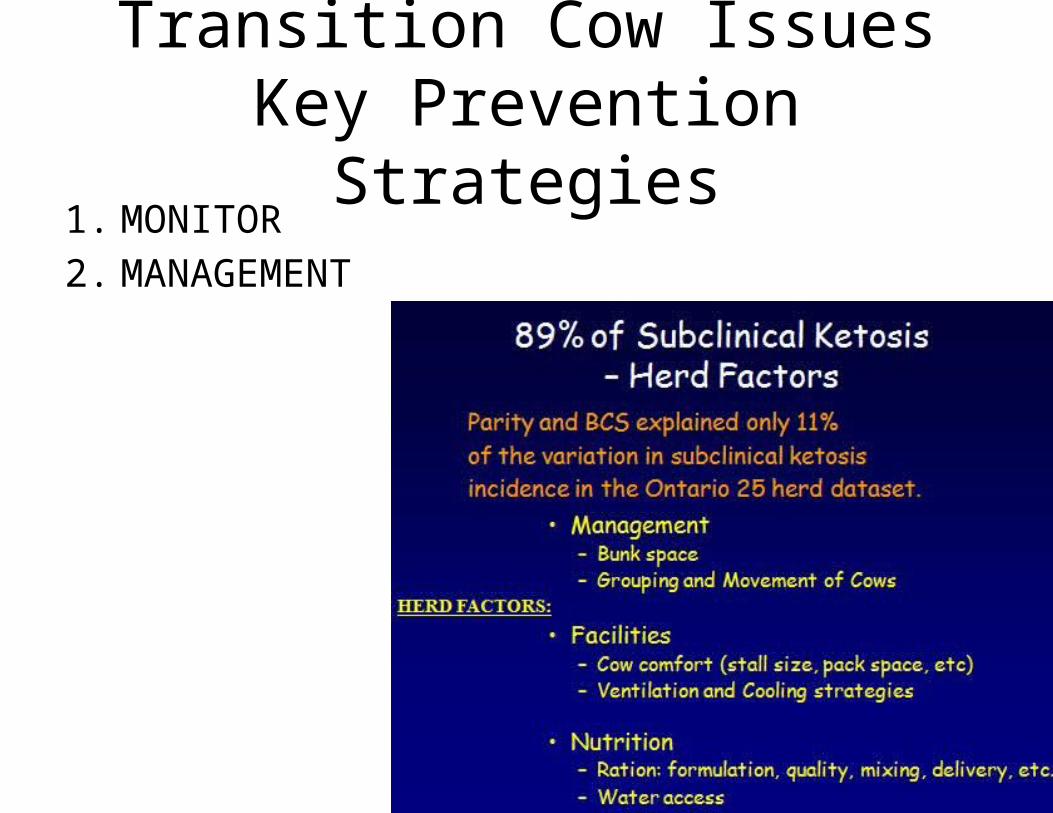
1. MONITOR2. MANAGEMENT
Transition Cow IssuesKey Prevention Strategies

Transition Cow IssuesKey Prevention Strategies
1. MONITOR2. MANAGEMENT 3. MANAGEMENT

1. MONITOR2. MANAGEMENT 3. MANAGEMENT4. MANAGEMENT
Dry Matter Intake
Transition Cow IssuesKey Prevention Strategies

Failure to ALLOW cows to eatis an International problem
Australia
Canada
Mexico

1. MONITOR 2. MANAGEMENT3. MANAGEMENT4. MANAGEMENT
5. Feed Additives1. Rumensin2. Propylene Glycol3. Rumen protected choline4. Yeast5. Others?
Transition Cow IssuesKey Prevention Strategies
Definitely Maybe – Temporary Fix Selected Use – Fat Cows Transition Cows Benefit? Efficacy / Economics?
↑ Dry Matter Intake

A Poor Transition Matters:1. Reduced Health2. Lost production3. Impaired Reproduction4. Risk of Culling
LOOK! To see where you are MONITOR
CONCLUSIONSTRANSITION COW ISSUES

1. MONITOR
ENERGY METABOLISM :
- Precalving: Need to use NEFA - Need a Cowside NEFA test to improve practicality
- Postcalving: Choose a KETONE test that suits you.
CONCLUSIONSTRANSITION COW ISSUESKey Prevention Strategies

1. MONITOR 2. MANAGEMENT3. MANAGEMENT4. MANAGEMENT
CONCLUSIONSTRANSITION COW ISSUESKey Prevention Strategies
DMI ↑ =
Social Stress ↓Feed Quality ↑BCS ↓Feed Access ↑

1. MONITOR 2. MANAGEMENT3. MANAGEMENT4. MANAGEMENT
5. Feed Additives ?-use the ones withproven Science.
CONCLUSIONSTRANSITION COW ISSUESKey Prevention Strategies
DMI ↑ =
Social Stress ↓Feed Quality ↑BCS ↓Feed Access ↑

Questions? or
Discussion


