MONITORING CO PLUME MIGRATION FOR A CARBON …
155
MONITORING CO2 PLUME MIGRATION FOR A CARBON STORAGE-ENHANCED COALBED METHANE RECOVERY TEST IN CENTRAL APPALACHIA ANDREW KYLE LOUK Dissertation submitted to the faculty of the Virginia Polytechnic Institute and State University in partial fulfillment of the requirements for the degree of Doctor of Philosophy In Mining Engineering Nino S. Ripepi, Chair Kray D. Luxbacher Ellen S. Gilliland Michael E. Karmis December 7, 2018 Blacksburg, Virginia Keywords: CO2 sequestration, coal, enhanced coalbed methane, tracers
Transcript of MONITORING CO PLUME MIGRATION FOR A CARBON …

MONITORING CO2 PLUME MIGRATION FOR A CARBON STORAGE-ENHANCED
COALBED METHANE RECOVERY TEST IN CENTRAL APPALACHIA
ANDREW KYLE LOUK
Dissertation submitted to the faculty of the Virginia Polytechnic Institute and State University in
partial fulfillment of the requirements for the degree of
Doctor of Philosophy
In
Mining Engineering
Nino S. Ripepi, Chair
Kray D. Luxbacher
Ellen S. Gilliland
Michael E. Karmis
December 7, 2018
Blacksburg, Virginia
Keywords: CO2 sequestration, coal, enhanced coalbed methane, tracers

MONITORING CO2 PLUME MIGRATION FOR A CARBON STORAGE-ENHANCED
COALBED METHANE RECOVERY TEST IN CENTRAL APPALACHIA
ANDREW KYLE LOUK
ABSTRACT
A small-scale CO2 injection test was conducted in 2015 to determine the storage and
enhanced coalbed methane (ECBM) recovery potential of CO2 in a stacked coal reservoir in
Buchanan County, Virginia. Phase I of the injection test was conducted from July 2, 2015 to April
15, 2016 when a total of 10,601 tons of CO2 were injected. Phase II of the injection was conducted
from December 14, 2016 to January 30, 2017 when an additional 2,662 tons of CO2 were injected,
for a total of 13,263 total tons of CO2 injected. The soaking period between the two phases lasted
for eight months and the wells were flowed back in early January 2018. A customized monitoring,
verification, and accounting (MVA) plan was created to monitor CO2 injection activities, including
surface, near-surface, and subsurface technologies. As part of this MVA plan, chemical tracers
were used as a tool to help track CO2 plume migration within the reservoir and determine interwell
connectivity. The work presented in this dissertation will discuss the development and
implementation of tracers as a monitoring tool, detail wellbore-scale tests performed to
characterize CO2 breakthrough and interwell connectivity, and present results from both phases of
the CO2 injection test.

MONITORING CO2 PLUME MIGRATION FOR A CARBON STORAGE-ENHANCED
COALBED METHANE RECOVERY TEST IN CENTRAL APPALACHIA
ANDREW KYLE LOUK
GENERAL AUDIENCE ABSTRACT
During the past decade, carbon capture, utilization, and storage (CCUS) has gained
considerable recognition as a viable option to mitigate carbon dioxide (CO2) emissions. This
process involves capturing CO2 at emission sources such as power plants, refineries, and
processing plants, and safely and permanently storing it in underground geologic formations.
Many CO2 injection tests have been successfully conducted to assess the storage potential of CO2
in saline formations, oil and natural gas reservoirs, organic-rich shales, and unmineable coal
reservoirs. Coal seams are an attractive reservoir for CO2 storage due to coal’s large capacity to
store gas within its microporous structure, as well as its ability to preferentially adsorb CO2 over
naturally occurring methane resulting in enhanced coalbed methane (ECBM) recovery.
A small-scale CO2 injection test was conducted in Southwest Virginia to assess the storage
and ECBM recovery potential of CO2 in a coalbed methane reservoir. The goal of this test was to
inject up to 20,000 tons of CO2 into a stacked coal reservoir of approximately 15-20 coal seams.
Phase I of the injection test was conducted from July 2, 2015 to April 15, 2016 when a total of
10,601 tons of CO2 were injected. Phase II of the injection was conducted from December 14,
2016 to January 30, 2017 when an additional 2,662 tons of CO2 were injected, for a total of 13,263
total tons of CO2 injected. A customized monitoring, verification, and accounting (MVA) plan was
created to monitor CO2 injection activities, including surface, near-surface, and subsurface
technologies. As part of this MVA plan, chemical tracers were used as a tool to help track CO2
plume migration within the reservoir and determine interwell connectivity. The work presented in
this dissertation will discuss the development and implementation of chemical tracers as a
monitoring tool, detail wellbore-scale tests performed to characterize CO2 breakthrough and
interwell connectivity, and present results from both phases of the CO2 injection test.

iv
MONITORING CO2 PLUME MIGRATION FOR A CARBON STORAGE-ENHANCED
COALBED METHANE RECOVERY TEST IN CENTRAL APPALACHIA
ANDREW KYLE LOUK
DEDICATION
This dissertation is dedicated to my father, Don, and my mother, Leeta.

v
MONITORING CO2 PLUME MIGRATION FOR A CARBON STORAGE-ENHANCED
COALBED METHANE RECOVERY TEST IN CENTRAL APPALACHIA
ANDREW KYLE LOUK
ACKNOWLEDGEMENT
First, I would like to thank my advisor and committee chairman, Dr. Nino S. Ripepi, for
providing me every opportunity to be successful in completing this dissertation.
I would like to thank my committee members, Dr. Kray Luxbacher, Dr. Ellen Gilliland,
and Dr. Michael Karmis for their guidance and support over the past years. I would like to extend
a special thanks to Dr. Matthew Hall at the University of Nottingham for providing both a warm
welcome while I was studying overseas and his expertise on gas adsorption. I would also like to
express my extreme gratitude to Dr. Harold McNair for being a great mentor and sharing his
expertise in the field of gas chromatography.
Due to the collaborative nature of this research, there are a number of industrial partners,
research partners, and collaborators that I would like to thank: The Virginia Center for Coal and
Energy Research (VCCER), the Virginia Tech Mining and Minerals Engineering Department,
Marshall Miller and Associates, the Virginia Department of Mines, Minerals, and Energy
(DMME), and CNX Gas.
I would like to thank special individuals and great friends within the Mining Engineering
Department at Virginia Tech and the Virginia Center for Coal and Energy Research (VCCER) that
were involved with this project: Charlie Schlosser, Joseph Amante, Xu Tang, Cigdem Keles, and
Scott Jeter.
Finally, I would like to thank my family for their continuous love and support throughout
my entire academic journey.

vi
TABLE OF CONTENTS
CHAPTER 1 – INTRODUCTION .............................................................................................. 1
CHAPTER 2 – DEVELOPMENT OF FLUORINATED TRACERS AS A QUALITATIVE
MONITORING TOOL FOR A CO2 STORAGE-ENHANCED COALBED METHANE
RECOVERY TEST ...................................................................................................................... 5
ABSTRACT ................................................................................................................................ 5
2.1 – INTRODUCTION ............................................................................................................. 6
2.2 – BACKGROUND ............................................................................................................... 8
2.2.1 – Motivation ................................................................................................................... 8
2.2.2 – 2009 CO2-ECBM Test in Russell County, Virginia ................................................. 11
2.2.3 – 2014 CO2-EGR Test in Morgan County, Tennessee ................................................ 13
2.3 – TRACER DEVELOPMENT FOR CO2-ECBM RECOVERY TEST IN BUCHANAN
COUNTY, VIRGINIA .............................................................................................................. 15
2.3.1 – Objective ................................................................................................................... 15
2.3.2 – Tracer Selection ........................................................................................................ 15
2.3.3 – Perfluorocarbon Tracers............................................................................................ 16
2.3.4 – Sulfur Hexafluoride .................................................................................................. 17
2.3.5 – Halocarbons .............................................................................................................. 18
2.3.6 – Equipment Selection and Analysis Method Development ....................................... 18
2.3.7 – Field Sampling Methods ........................................................................................... 20
2.4 – CO2-ECBM RECOVERY TEST IN BUCHANAN COUNTY, VIRGINIA .................. 21
2.4.1 – Overview ................................................................................................................... 21
2.4.2 – CO2 injection Operations .......................................................................................... 23
2.5 – TRACER IMPLEMENTATION FOR CO2-ECBM RECOVERY TEST IN
BUCHANAN COUNTY, VIRGINIA ...................................................................................... 25
2.6 – RESULTS ........................................................................................................................ 29
2.7 – CONCLUSIONS.............................................................................................................. 30
ACKNOWLEDGEMENTS ...................................................................................................... 33
REFERENCES ......................................................................................................................... 33

vii
CHAPTER 3 – AN UPDATE OF MONITORING RESULTS FROM A CO2-ECBM
RECOVERY TEST IN BUCHANAN COUNTY, VIRGINIA: PHASE I, PHASE II, AND
FLOWBACK ............................................................................................................................... 40
ABSTRACT .............................................................................................................................. 40
3.1 – INTRODUCTION ........................................................................................................... 41
3.2 – CO2-ECBM TEST IN BUCHANAN COUNTY, VA ..................................................... 42
3.2.1 – Overview ................................................................................................................... 42
3.2.2 – CO2 Injection Operations .......................................................................................... 43
3.2.3 – Monitoring, Verification, and Accounting (MVA)................................................... 45
3.2.4 – Pre-Injection Reservoir Modeling............................................................................. 48
3.3 – PHASE I RESULTS ........................................................................................................ 50
3.4 – PHASE II AND FLOWBACK RESULTS ...................................................................... 53
3.4.1 – CO2 Injection ............................................................................................................ 53
3.4.2 – Flowback Results ...................................................................................................... 55
3.4.3 – Adsorption Isotherm of SF6 on Coal ......................................................................... 58
3.4.4 – Post-Injection Reservoir Modeling ........................................................................... 60
3.5 – CONCLUSIONS.............................................................................................................. 63
ACKNOWLEDGEMENTS ...................................................................................................... 64
REFERENCES ......................................................................................................................... 64
CHAPTER 4 – DELINEATING CO2 PLUME MIGRATION IN A STACKED COALBED
METHANE RERVOIR USING MULTIPLE WELLBORE-SCALE TESTS...................... 67
ABSTRACT .............................................................................................................................. 67
4.1 – INTRODUCTION ........................................................................................................... 68
4.2 – CO2 INJECTION TEST IN BUCHANAN COUNTY, VIRGINIA: PHASE I ............... 69
4.2.1 – Overview ................................................................................................................... 69
4.2.2 – Geologic Characterization ........................................................................................ 70
4.2.3 – Monitoring Verification and Accounting (MVA) Plan ............................................ 72
4.2.4 – Phase I Results .......................................................................................................... 74
4.3 – DOWNHOLE VIDEO CAMERA ................................................................................... 75
4.3.1 – Background ............................................................................................................... 75
4.3.2 – Methodology ............................................................................................................. 75

viii
4.3.3 – Results ....................................................................................................................... 76
4.4 – WELL KILL TEST .......................................................................................................... 78
4.4.1 – Background ............................................................................................................... 78
4.4.2 – Methodology ............................................................................................................. 78
4.4.3 – Results ....................................................................................................................... 80
4.5 – DOWNHOLE INJECTION LOGGING .......................................................................... 86
4.5.1 – Background ............................................................................................................... 86
4.5.2 – Methodology ............................................................................................................. 86
4.5.3 – Results ....................................................................................................................... 87
4.6 – DOWNHOLE RAMAN SPECTROMETER .................................................................. 87
4.6.1 – Background ............................................................................................................... 87
4.6.2 – Methodology ............................................................................................................. 89
4.6.3 – Results ....................................................................................................................... 90
4.7 - CONCLUSIONS .............................................................................................................. 91
ACKNOWLEDGEMENTS ...................................................................................................... 94
REFERENCES ......................................................................................................................... 94
CHAPTER 5 – CONCLUSIONS ............................................................................................... 99

ix
LIST OF FIGURES
Figure 2.1: Tracer concentrations at offset production wells for the Russell Co., VA CO2 injection
test [48]. ........................................................................................................................................ 12
Figure 2.2: Russell County, VA post-injection production and regression analysis [50]. ............ 12
Figure 2.3: Morgan County, TN injection site layout. ................................................................. 13
Figure 2.4: Morgan County, TN post injection gas composition [51]. ......................................... 14
Figure 2.5: Phase diagram for perfluorocarbon tracers. ............................................................... 17
Figure 2.6: Chromatogram displaying PFTs using HP-AL/S column. ......................................... 19
Figure 2.7: Chromatogram displaying SF6 and halocarbon tracers using GS-GASPRO column. 20
Figure 2.8: Tracer concentration sample being collected using Vacutainer. ................................ 21
Figure 2.9: Wellhead adapter for tracer concentration sampling. ................................................. 21
Figure 2.10: Buchanan County CO2 injection test study area. ..................................................... 22
Figure 2.11: Buchanan County CO2 injection test site. The three injection wells are denoted by a
yellow symbol. The three monitoring wells are denoted by an orange symbol. The ¼-mile
boundary is denoted by a white line and shaded green. The ½ mile boundary is denoted by a blue
line. The offset production wells located within this boundary that were used as monitoring wells
for this test are denoted by a blue symbol..................................................................................... 23
Figure 2.12: Injection operations at the DD-7 well pad. Background: CO2 storage tanks.
Middleground: Injection skid. Foreground (Left): DD-7 wellhead. Foreground (Right): Pipeline to
DD-7A and DD-8. ......................................................................................................................... 24
Figure 2.13: PVC assembly for PFT added to wellbore fluid....................................................... 26
Figure 2.14: Gaseous tracer injection method. ............................................................................. 27
Figure 2.15: Teledyne Isco syringe pump..................................................................................... 28
Figure 2.16: Tracer arrival at offset monitoring and production wells. ........................................ 29
Figure 3.1: Central Appalachia coalbed methane fields [7]. ........................................................ 42
Figure 3.2: Historical and projected gas production for the three injection wells DD-7, DD-7A,
and DD-8. ...................................................................................................................................... 43
Figure 3.3: Well schematic of the three injection wells after conversion for CO2 injection
operations. ..................................................................................................................................... 44
Figure 3.4: Injection wellhead schematic. .................................................................................... 44

x
Figure 3.5: Injection operations at the DD-7 well pad. Background: CO2 storage tanks.
Middleground: Injection skid. Foreground (Left): DD-7 wellhead. Foreground (Right): Pipeline to
DD-7A and DD-8. ......................................................................................................................... 45
Figure 3.6: Overview map of MVA Plan. ..................................................................................... 47
Figure 3.7: Well Schematic of M-1, M-2, and C-1, showing location of packer and downhole
pressure and temperature gauges. ................................................................................................. 48
Figure 3.8: Adsorption profile (gmole/ft3) for four-well scenario with three cases (a), (b), and (c).
....................................................................................................................................................... 50
Figure 3.9: SF6 and PMCP tracer arrival at offset monitoring and production wells. .................. 52
Figure 3.10: CH4 (grey), CO2 (blue), and N2 (gold) gas composition of the DD-8A offset
production well for Phase I (purple) of the CO2 injection test. .................................................... 53
Figure 3.11: Phase I (yellow) and II (blue) CO2 injection parameters. ........................................ 54
Figure 3.12: CH4 (grey), CO2 (blue), and N2 (gold) gas composition of the DD-8A offset
production well for Phase I (purple) and Phase II (red) of the CO2 injection test. ....................... 55
Figure 3.13: DD-7, DD-7A, and DD-8 flowback. ........................................................................ 57
Figure 3.14: DD-7, DD-7A, and DD-8 CO2 Retention................................................................. 58
Figure 3.16: Adsorption isotherms of CO2 and SF6 on the Pocahontas 3 coal seam. ................... 59
Figure 3.17: Reservoir model with varying injection wells, injection rates, and injection periods.
....................................................................................................................................................... 61
Figure 3.18: Active fracture network from tomographic imaging (A) and associated permeability
values (B) for post-injection modeling. ........................................................................................ 62
Figure 3.19: SF6 plume migration for four coal layers 1 hour, 6 days, 10 days, and 18 days after
tracer injection. ............................................................................................................................. 63
Figure 4.1: Map of CO2 injection study area. The grey shaded area is an active underground coal
mine............................................................................................................................................... 70
Figure 4.2: Generalized stratigraphic column for the Oakwood CBM field. ............................... 72
Figure 4.3: Map of CO2 injection test site. Injection wells are denoted by a yellow symbol. Offset
monitoring wells are denoted by an orange symbol. Offset production wells located inside of the
monitoring boundary that were sampled are denoted by a blue symbol. Offset production wells
located outside of the monitoring boundary that were not sampled are denoted by a grey symbol.
....................................................................................................................................................... 73

xi
Figure 4.4: CH4 (grey), CO2 (blue), and N2 (gold) gas composition of the DD-8A offset production
well for Phase I (purple) of the CO2 injection test. ....................................................................... 74
Figure 4.5: DD-8 and DD-8A interwell connectivity. Completed coals seams denoted by asterisk
(red). .............................................................................................................................................. 77
Figure 4.6: Water injection test to determine gas production from individual coal seams. ......... 79
Figure 4.7: Echometer results from the DD-8A water injection test. ........................................... 81
Figure 4.8: a) total comingled gas production. b) gas production by zone. c) coal thickness by zone.
d) gas production per foot of coal thickness by zone. ................................................................... 83
Figure 4.9: a) Comingled gas composition at each water injection level. b) CO2 composition at
each water injection level.............................................................................................................. 84
Figure 4.10: SF6 calibration curve. ............................................................................................... 85
Figure 4.11: SF6 concentration at each water injection level. ....................................................... 85

xii
LIST OF TABLES
Table 2.1: Atmospheric, near-surface, and subsurface applications for tracers (adapted from [42]).
....................................................................................................................................................... 10
Table 2.2: Selected tracers. ........................................................................................................... 16
Table 2.3: GC and MS method parameters for HP-AL/S column. ............................................... 19
Table 2.4: GC and MS method parameters for GS-GASPRO column. ........................................ 19
Table 3.1: Overview of atmospheric, near-surface, and subsurface technologies. The bolded
techniques were selected as part of the MVA plan for the Buchanan County injection test [9]. . 46
Table 3.2: Langmuir constants for SF6 on Pocahontas 3 coal. ..................................................... 60
Table 4.1: Assessment of DD-8 perforations from downhole camera. ......................................... 76
Table 4.2: NICI analysis results. .................................................................................................. 85
Table 4.3: Summary of DD-8 testing with downhole Raman Spectroscopy. .............................. 91

1
CHAPTER 1 – INTRODUCTION
Carbon capture, utilization, and storage (CCUS) has recently emerged as a viable option to
mitigate anthropogenic carbon dioxide (CO2) emissions. This process involves capturing CO2 at
point sources such as power plants, refineries, and processing plants, and safely and permanently
storing it in underground geologic formations. Under the U.S. Department of Energy’s (DOE)
Carbon Storage Program, seven Regional Carbon Sequestration Partnerships (RCSPs) were
created to research, develop, and test technologies for CO2 storage for their specific region’s
geologic reservoirs. Currently, the major types of geologic reservoirs being investigated for CO2
storage are saline formations, oil and natural gas reservoirs, unmineable coal, organic-rich shale
basins, and basalt formations.
Unmineable coal seams are an attractive reservoir for CCUS due to coal’s microporous
structure which allow it to store large quantities of gas. Coal provides an additional benefit that
when introduced to CO2, it will preferentially adsorb the CO2 over the naturally occurring methane
(CH4). The release and production of this methane results in enhanced coalbed methane (ECBM)
recovery which can extend the life of mature CBM fields and help offset the cost of CO2 storage.
An award was given by the U.S. DOE through the National Energy Technology Laboratory
(NETL) to the Virginia Center for Coal and Energy Research (VCCER) and the Mining and
Minerals Engineering Department at Virginia Tech to conduct a small-scale CO2 injection test in
in Buchanan County, Virginia. The objective of this test was to inject up to 20,000 tons of CO2 to
test the injectivity, storage, and ECBM recovery potential of CO2 in a stacked coal reservoir. Phase
I of the test was conducted from July 2, 2015 to April 15, 2016 when a total of 10,601 tons of CO2
were injected. Phase II was conducted from December 14, 2016 to January 30, 2017 when an
additional 2,662 tons of CO2 were injected. As part of an extensive monitoring, verification, and

2
accounting (MVA) plan, a multi-tracer program was created to help monitor CO2 plume migration
within the reservoir and determine interwell connectivity throughout the study area.
The research presented in this dissertation encompasses multiple aspects of the CO2
injection test in Buchanan County, Virginia, including the development and implementation of the
multi-tracer program and key findings from Phase I and Phase II of CO2 injection operations.
Chapter 2 –Development of Fluorinated Tracers as a Qualitative Monitoring Tool for a
CO2 Storage-Enhanced Coalbed Methane Recovery Test, presents a background on the uses of
tracers as a monitoring tool for CCUS projects, including the implementation of tracers used in
previous tests conducted by this research team. The major focus of this chapter will be on the
development and implementation of a unique multi-tracer program to track CO2 plume migration
for a CO2 injection test in Buchanan County, Virginia. The following contributions were made by
the co-authors:
Kray Luxbacher Virginia Tech Department of Mining and Minerals Engineering
Provided funding and oversight for the Subsurface Atmospheres Laboratory
Nino Ripepi Virginia Tech Department of Mining and Minerals Engineering
Provided funding and oversight for the CO2 injection test in Buchanan County, Virginia
Ellen Gilliland Virginia Tech Department of Mining and Minerals Engineering
Oversaw design and implementation of the MVA Plan
Harold McNair Virginia Tech Department of Chemistry
Provided expertise in gas chromatography and separation techniques
Chapter 3 – An Update of Monitoring Results from a CO2-ECBM Recovery Test in
Buchanan County, Virginia: Phase II and Flowback, provides an overview and results of a
designed 20,000-ton CO2 injection test in a stacked coalbed methane reservoir in Central
Appalachia. Phase I of the injection test commenced on July 2, 2015 when a total of 10,601 tons

3
of CO2 were injected. Phase II commenced on December 14, 2016 when an additional 2,662, tons
were injected. This paper highlights key results from Phase I and presents new findings from Phase
II of CO2 injection operations and the flowback of the injection wells into normal production. The
following contributions were made by the co-authors:
Ellen Gilliland Virginia Tech Department of Mining and Minerals Engineering
Oversaw design and implementation of the MVA Plan
Nino Ripepi Virginia Tech Department of Mining and Minerals Engineering
Provided funding and oversight for the CO2 injection test in Buchanan County, Virginia
Xu Tang Virginia Center for Coal and Energy Research
Provided field work assistance, sample analysis, and editing
Charlie Schlosser Virginia Center for Coal and Energy Research and Virginia Tech Department of Mining and Minerals Engineering
Provided field work assistance and data compilation
Cigdem Keles Virginia Tech Department of Mining and Minerals Engineering
Constructed pre- and post-injection reservoir model
Michael Karmis Virginia Center for Coal and Energy Research and Virginia Tech Department of Mining and Minerals Engineering
Provided expertise in CCUS technologies
Chapter 4 – Delineating CO2 Plume Migration in a Stacked Coalbed Methane Reservoir
Using Multiple Wellbore-Scale Tests, describes an effort to determine which seams in a stacked
coal reservoir the injected CO2 plume was migrating through. During Phase I of the CO2 injection
test, increased concentrations of an injected tracer were detected at the closest offset production
well from the injection well where the tracer was introduced. Later during Phase I, CO2 was
detected above baseline levels at the same offset well. In order to determine which coal seams or
production zones the CO2 was migrating through, multiple wellbore-scale tests were conducted. A

4
downhole video camera was used as a qualitative method to determine the condition of the
perforations created when the well was first drilled and completed. Next, a water injection test
used increasing water levels to kill gas production and assign contributions of quantity and quality
of gas flow to individual coal seams. After that, a continuous spinner survey was utilized to
determine flow profile changes versus depth of the injection wells during CO2 injection operations.
Finally, a downhole Raman spectrometer test was conducted on the injection wells after CO2
injection operations were completed and the wells were placed back into normal production.
Results from this test were used to create a composition profile versus depth in the injection wells.
The following contributions were made by the co-authors:
Nino Ripepi Virginia Tech Department of Mining and Minerals Engineering
Provided funding and oversight for the CO2 injection test in Buchanan County, Virginia
Ellen Gilliland Virginia Tech Department of Mining and Minerals Engineering
Oversaw design and implementation of the MVA Plan
Xu Tang Virginia Center for Coal and Energy Research
Provided field work assistance on the Well Kill Test
Grant Myers Carbon GeoCycle Inc. Provided oversight for the Downhole Raman Spectrometer Test
Ed Diminick Marshall Miller & Associates Provided management for the CO2 injection site in Buchanan County, Virginia
Mike McClure Marshall Miller & Associates Provided geologic characterization for the CO2 injection test in Buchanan County, Virginia
Michael Karmis Virginia Center for Coal and Energy Research and Virginia Tech Department of Mining and Minerals Engineering
Provided expertise in CCUS technologies

5
CHAPTER 2 – DEVELOPMENT OF FLUORINATED TRACERS AS A QUALITATIVE MONITORING TOOL FOR A CO2 STORAGE-ENHANCED COALBED METHANE RECOVERY TEST Kyle Louk 1, 2, Kray Luxbacher 2, Nino Ripepi 2, Ellen Gilliland 2, Harold McNair 3
1 Virginia Center for Coal and Energy Research, Blacksburg, Virginia, USA 2 Virginia Tech Department of Mining and Minerals Engineering, Blacksburg, Virginia, USA 3 Virginia Tech Department of Chemistry, Blacksburg, Virginia, USA ABSTRACT
A small-scale carbon dioxide (CO2) injection test was conducted in order to demonstrate
the storage and enhanced coalbed methane (ECBM) recovery potential of CO2 in a stacked coal
reservoir in Southwest Virginia. A total of 13,263 tons of CO2 were injected during two phases.
Phase I was conducted from July 2, 2015 to April 15, 2016, when a total of 10,601 tons of CO2
were injected. After a soaking period of eight months, Phase II was conducted from December 14,
2016 to Jan 30, 2017, when an additional 2,662 tons of CO2 were injected. As part of an extensive
monitoring, verification, and accounting (MVA) plan, a multi-tracer program was developed to
track CO2 plume migration within the reservoir. This paper will provide a brief overview of the
CO2 injection test, detail the tracer program including tracer selection and laboratory development,
and finally, give a plan for field implementation of the selected tracers.

6
2.1 – INTRODUCTION
Tracers have been used in a variety of industries including civil engineering, building
construction, environmental management, mining, and oil and gas primarily to understand and
measure mass transport in a system of interest. While there is no universally accepted classification
for tracers, they can generally be divided into two categories: natural and artificial. Natural tracers,
also known as environmental tracers, are substances that are inherently present in the environment.
Common natural tracers include elemental isotopes or changes in chemical composition due to the
process of interest. Artificial tracers, also known as chemical tracers, are chemical substances that
are added to the environment as a proxy for a process variable that cannot be measured directly.
In order for chemical tracers to be effective, they must be: 1) non-toxic and non-reactive; 2) easily
transported and deployed; and 3) easily sampled and detected.
For these reasons, fluorinated tracers such as sulfur hexafluoride (SF6), perfluorocarbons
tracers (PFTs), and halocarbons are among the most commonly used chemical tracers. A major
advantage of fluorinated tracers is their high molecular electronegativity, which allows them to be
detected using common analytical techniques such as gas chromatography (GC) coupled with
negative-ion chemical ionization mass spectrometry (NICI-MS). Another advantage of fluorinated
tracers is their low, almost negligible, background concentrations in the atmosphere and
subsurface. This low background presence further increases detection sensitivity by limiting
interference caused by environmental contamination. PFTs have the added benefit in that they can
be used as a suite of similar-property tracers to be deployed simultaneously within the same study
area. SF6 and PFTs have been successfully used in the past as a qualitative and quantitative tool to
help characterize fluid flow in atmospheric, marine, groundwater, and reservoir studies. Major
advantages for the use of tracers in these studies are that they can be deployed in areas that are

7
difficult to access (e.g. underground reservoirs, pipes) and areas that span large distances (e.g.
geologic basins, oceans, airspaces) [1].
Fluorinated tracers, most commonly SF6, have been used in the mining industry as early as
the mid-1970s in the U.S. as a critical tool in evaluating underground mining ventilation systems
[2]-[4]. Underground mining environments are dynamic in nature as daily production causes
advancement, and in some cases retreat, of the working face. This causes changes in the
requirements of the ventilation system and often the need for new ventilation controls. Evaluating
the effectiveness of these controls on air quantity using traditional ventilation surveys involves
measuring the air velocity and cross-sectional area of a mine opening. Because this measurement
is only valid at a point in space, these traditional surveys are often time and resource intensive, and
can sometimes be inaccurate due to a number of environmental factors, such as irregular shaped
mine openings, obstructions, and turbulence [5]. Tracer gas surveys are desirable in these
environments as air quantity can be measured without the measuring the cross-sectional area.
Additionally, tracer gases are currently used in mines for a variety of applications such as:
determining air leakages across stoppings, doors, and overcasts, characterizing the exchange of
gases between active and sealed areas, understanding airflow within inactive workings and gobbed
areas, evaluation of auxiliary ventilation, effectiveness of scrubber and spray systems on mining
equipment, and use in inaccessible areas.
Numerous tracers, including SF6 and PFTs, have been used in the oil and natural gas
industry to detect leakage at natural gas facilities such as gathering pipelines, compressor stations,
transmission pipelines and processing facilities [6]-[11]. They have also been widely used in
reservoir engineering to help optimize production [12]-[14], characterize fluid flow within a
reservoir [15]-[18], and reduce uncertainties in flow pathways (both horizontal and vertical) and

8
reservoir continuity [19]-[23]. Tracers are useful in enhanced recovery operations where a fluid is
injected into one or multiple wells and the hydrocarbons are produced out of offset production
wells. Introducing a chemical tracer with the injected fluid and monitoring the concentration
response curve at offset wells can provide information about the reservoir and determine flow
pathways and interwell communication [24]-[26]. Using different chemical tracers at multiple
injector wells and/or at different timelines over the span of a project can greatly increase the quality
of information about the reservoir. While there has been a wide use of tracers in the oil and gas
industry since the 1950s [27], many of the tests are qualitative in nature, with little emphasis on
choice of tracers, design, and implementation.
Tracers have also been used as a viable monitoring tool in emerging geologic carbon
sequestration projects with a focus on the detection and quantification of CO2 leakage and
monitoring CO2 plume migration within the reservoir. Fluorinated tracers have been used in
multiple, large-scale projects throughout the United States including the Cranfield Test site in
Mississippi [28],[29], the Frio Injection Test in Texas [30]-[32], the ZERT Injection Project in
Montana [33]-[36] and the West Queen Pearl Site in New Mexico [37],[38]. In 2015, an award
was given to Virginia Tech and the Virginia Center for Coal and Energy Research (VCCER) by
the U.S. Department of Energy through the National Energy Technology Laboratory to conduct a
small-scale CO2 injection test in Southwest Virginia. This paper describes the development and
implementation of fluorinated tracers as part of an extensive monitoring plan for this test.
2.2 – BACKGROUND
2.2.1 – Motivation
Carbon capture, utilization, and storage (CCUS) has emerged as a viable option for
mitigating CO2 emissions. In 2003, the U.S. Department of Energy (DOE), under its Carbon

9
Storage program, created seven Regional Carbon Sequestration Partnerships (RCSPs) tasked to
develop and test technologies for CO2 storage for their specific regions [39],[40]. In 2009, based
on a number of successful CO2 storage tests, the U.S. DOE collaborated with the RCSPs to release
its first edition of best practice manuals for geologic CO2 storage. These manuals were updated in
2013 and again in 2017. Of these manuals, BEST PRACTICES: Monitoring, Verification, and
Accounting (MVA) for Geologic Storage Projects was intended to increase awareness of existing
and emerging MVA techniques, and ultimately, ensure safe and permanent geologic storage of
CO2 [41]. This MVA manual is broken into three sections, atmospheric, near-surface, and
subsurface monitoring which include implemented techniques, and lessons learned from applied
research and field demonstrations. Tracers play a role as a viable monitoring tool in all three
sections to help detect CO2 leakage into the atmosphere, soil, and groundwater, and to track CO2
migration within the reservoir. Table 2.1 below displays monitoring applications of tracers for
each section of the best practice manual, including a description, benefits, and challenges for each.

10
Table 2.1: Atmospheric, near-surface, and subsurface applications for tracers (adapted from [42]).
Unconventional reservoirs such as organic-rich shale basins and unmineable coal seams
are an attractive reservoir for CCUS due to their unique gas storage properties combined with the
potential for enhanced gas recovery. The microporous structure of coal allows for large quantities
of gases to be adsorbed onto the coal surface. Additionally, when introduced to CO2, coal will
preferentially adsorb the CO2 over naturally occurring methane, resulting in enhanced coalbed
methane (ECBM) recovery [42]-[44]. It is estimated that up to 113 billion tons of CO2 could be
stored in unmineable coal seams in America [45]. Similar to coals, the organic-rich clays found in
gas-bearing shale formations have a preferential absorptive capacity of CO2 approximately 2-5
Atmospheric Tracers
Description: Natural and injected chemical compounds that are monitored in air to help detect CO2 released to the atmosphere.
Benefits: Used as a proxy for CO2, when direct observation of a CO2 release is not adequate. Also used to track potential CO2 plumes.
Challenges: In some cases, analytical equipment is not available onsite, and samples need to be analyzed offsite. Background/baseline levels must be established. Tracers may not behave the same as CO2 along the migration pathway.
Geochemical Monitoring in the Soil and Vadose Zone
Description: Sampling of soil gas for CO2, natural chemical tracers, and introduced tracers. Measurements are made by extracting gas samples from shallow wells or from/with flux accumulation chambers placed on the soil surface and/or with sensors inserted into the soil.
Benefits: Soil-gas measurements detect shifts in gas ratios or elevated CO2 concentrations above background levels that may provide indications of gas releases from depth. Tracers aid in identification of native vs. injected CO2. Flux chambers can quickly and accurately measure local CO2 fluxes from soil to air.
Challenges: Potential for interference from surface processes producing false positives as well as missing signal is significant. Significant effort for potential lack of significant results. Relatively late detection of release. Considerable effort is required to avoid cross-contamination of tracer samples. Natural analogs suggest that migration may be focused in small areas and flux chambers provide measurements for a limited area.
Geochemical Monitoring of
Shallow Groundwater
Description: Geochemical sampling of shallow groundwater above CO2 storage reservoir to demonstrate isolation of the reservoir from USDWs. Chemical analyses may include pH, alkalinity, electrical conductivity, major and minor elements, dissolved gasses, tracers, and many other parameters. Sensor probes/meters, as well as titration test kits, can be used to test/ sample in the field.
Benefits: Mature technology, samples collected with shallow monitoring wells. Sensors may be inserted into the aquifer. Address major regulatory concern regarding migration reaching USDWs, and may have value in responding to local concerns, which typically elevate concerns about groundwater.
Challenges: Significant effort for potential lack of significant results. Reactive transport modeling of CO2 migration shows that signal may be retarded and attenuated so that high well density and long sampling periods are required to reach an insignificant result. Many factors other than fluids from depth can change or damage aquifer water quality, and detailed assessment of aquifer flow system may be needed to attribute a change to signal either to migration or to other factors. Gas solubility and associated parameters (pH, alkalinity) are pressure sensitive, so that obtaining samples representative of the aquifer fluids requires careful sampling. Carbon isotopes may be difficult to interpret due to complex interactions with carbonate minerals in shallow formations.
Emerging Wellbore Tools
Description: Emerging wellbore technologies include smart sensors for geologic storage monitoring applications and subsurface tracer applications. Tools include harmonic pulse testing of reservoirs, modular borehole monitoring, and novel tracers.
Benefits: Demonstrate reservoir integrity through pressure response during pulse testing. The modular borehole monitoring (MBM) concept is a multi-functional suite of instruments designed to optimize subsurface monitoring. Geochemical changes associated with the interaction of injected tracers and supercritical CO2 provide insight concerning migration of CO2 through the reservoir.
Challenges: Reservoir noise interference and signal-to-noise ratio may be an issue.
ATMOSPHERIC
NEAR-SURFACE
SUBSURFACE

11
times higher than that of methane [46],[47]. Advances in horizontal drilling and hydraulic
fracturing of gas-bearing shale formations have made the U.S. a worldwide leader in natural gas
production. The increasing infrastructure that results from developing plays along with the
increased permeability from the induced fractures have made shale formations a viable reservoir
for CO2 storage.
The research team at Virginia Tech and the VCCER has previously conducted two small-
scale CO2 injection tests in order to demonstrate the storage and enhanced gas recovery potential
of CO2 in unconventional reservoirs. The first test injected 1,000 tons of CO2 into a CBM well is
Russell County, Virginia. The second test injected 500 tons of CO2 into a horizontal shale gas well
in Morgan County, Tennessee. For both of these tests, fluorinated tracers were used as a qualitative
tool to help monitor CO2 plume migration.
2.2.2 – 2009 CO2-ECBM Test in Russell County, Virginia
In 2009, a CO2-ECBM test was conducted in the Oakwood CBM field in Russell County,
Virginia. Approximately 1,000 tons of CO2 was injected into a depleted CBM well over a one-
month period. As part of the monitoring plan, perfluorotrimethylcyclohexane (PTMCH)(C9F18)
was injected with the CO2 stream within the first week of injection operation to help determine
migration pathways within the coal reservoir to offset production wells.
PTMCH was detected at all of the immediate offset production wells and at several
peripheral wells up to 3,500 ft. from the injection well (Figure 2.1). Increased CO2 concentrations
were detected at two monitoring wells that were drilled in close proximity to the injection well
(135 and 285 ft.) but were not found at any other offset well. Detection of tracers at the offset wells
confirms that the wells are interconnected and could provide a network for the CO2 to migrate if
injected at a higher quantity.

12
Figure 2.1: Tracer concentrations at offset production wells for the Russell Co., VA CO2 injection test [48].
To date, it is estimated that 65% of the injected CO2 has been stored within the reservoir
and the estimated ultimate recovery (EUR) for the injection well has increased by 85% (Figure
2.2). Additional details for this test can be found in [49].
Figure 2.2: Russell County, VA post-injection production and regression analysis [50].

13
2.2.3 – 2014 CO2-EGR Test in Morgan County, Tennessee
In March 2014, a small-scale CO2 injection test was conducted in Morgan County,
Tennessee to demonstrate the storage and enhanced gas recovery potential of CO2 in shale
formations (Figure 2.3). Approximately 510 tons of CO2 were injected over a period of 13 days
into a horizontal shale gas well in the Devonian Chattanooga Shale. As part of the CO2 injection,
multiple fluorinated tracers were added at different time periods to help monitor CO2 plume
migration within the reservoir. For this test, sulfur hexafluoride (SF6) and two PFTs,
perfluoromethylcyclopentane (PMCP) (C6F12), and perfluorometylcyclohexane (PMCH) (C7F14)
were used. SF6 and PMCP were injected with the first 50 tons of CO2 to simulate the initial plume
movement through the reservoir and to compare the performance of the two tracers. PMCH was
injected at the 350 tons of CO2 mark to compare the two similar PFTs at different phases of the
project.
Figure 2.3: Morgan County, TN injection site layout.
Gas samples were collected at thirteen offset production wells in the area and analyzed for
composition and tracer concentration and it was determined that there was no increased
concentration of CO2 and no detection of the three tracers at any of the offset wells. Designed as a
‘huff-and-puff’ test, the injection well was shut in for a soaking period of approximately four

14
months before it was put back into normal production. Gas composition analysis of the injection
well once it was put back into normal production concluded an increase in heavier hydrocarbons
(C2H6, C3H8, C4H10) for a period of seven months before returning to baseline levels (Figure 2.4).
Monitoring the gas flow rate of the injection well also concluded a significant increase in
production for a period of five months before returning to historical production levels. A regression
analysis was performed on the pre- and post-injection flowrates and combined with the CO2
concentrations in the production stream. It is estimated that greater than 50% of the injected CO2
has been stored within the reservoir.
Figure 2.4: Morgan County, TN post injection gas composition [51].
The Morgan County, Tennessee CO2 injection test represents the first successful injection
of CO2 into an organic shale formation to monitor for storage and enhanced gas recovery potential
in Central Appalachia. This test demonstrated the potential for injected CO2 to enhance gas
production and stimulate additional heavier hydrocarbon recovery in shale gas reservoirs.
Additional details from this test can be found in [51],[52].
0.0
5.0
10.0
15.0
20.0
0.0
10.0
20.0
30.0
40.0
50.0
60.0
70.0
80.0
90.0
100.0
07/08 08/05 09/02 09/30 10/28 11/25 12/23 01/20 02/17 03/17 04/14 05/12 06/09 07/07 08/04 09/01 09/29 10/27 11/24
% C
ompo
sitio
n(E
than
e, P
ropa
ne,
But
ane)
% C
ompo
sitio
n(C
O₂,
Met
hane
)
CO2 Methane Baseline Methane Ethane Baseline Ethane Propane Baseline Propane Butane Baseline Butane
Soak
ing
Phas
e

15
2.3 – TRACER DEVELOPMENT FOR CO2-ECBM RECOVERY TEST IN BUCHANAN
COUNTY, VIRGINIA
2.3.1 – Objective
The objective of this test was to inject 20,000 tons of CO2 in Southwest Virginia into
multiple wells over two distinct phases. An extensive MVA plan was created to select specific
monitoring techniques to be implemented during each phase of the test. As part of this MVA plan,
a customized tracer program was developed to track CO2 plume migration within the reservoir. By
injecting tracers with the CO2 and monitoring for breakthrough at offset productions wells, flow
pathways and interwell connectivity can be determined. For this test, multiple tracers were needed
to differentiate results between: 1) the multiple injection wells; and 2) the multiple injection
phases.
All tracer development and analysis was conducted in the Virginia Tech Mining and
Minerals Engineering’s Subsurface Atmospheres Laboratory. Much of the tracer development for
the CO2-ECBM test has evolved over time stemming from a number of sponsored projects and
years of graduate student research in this laboratory.
2.3.2 – Tracer Selection
A number of factors went into selecting the chemicals tracers used to track CO2 plume
migration for this test. Some properties of the tracer itself, such as vaporization pressure, solubility
in water, and adsorption characteristics on coal will determine how the tracers will perform within
the reservoir. Other factors such as cost and availability will dictate how easily deployable the
tracers are. Finally, a major factor will be in the ability to detect and quantify the tracers once
deployed. Table 2.2 displays the tracers that were chosen for this test and selected properties.

16
Table 2.2: Selected tracers.
2.3.3 – Perfluorocarbon Tracers
The six PFTs listed were selected as they can be deployed as a suite of similar-property,
yet uniquely identifiable tracers. PFTs are classified as perfluoroalkanes with an empirical formula
of CnF2n+2. Cyclic perfluoroalkanes (CnF2n) form when two fluorine atoms are removed from the
chain to form the cyclic structure [53]. Perfluoroalkanes are similar in structure to hydrocarbons
(CnH2n+2), however, since the hydrogen atoms are replaced by fluorine, the molecular weight of
PFTs are much higher than their corresponding hydrocarbon, ranging from 300 to 400 g/mol. As
fluorine forms one of the strongest bond to carbon, PFTs are very stable. Also, PFTs exhibit very
low intermolecular forces, which cause them to have high volatility with a low boiling point. This
high volatility allows them to readily vaporize, and makes them difficult to condense once in the
vapor state, even at low temperatures (Figure 2.5). As the PFTs increase in molecular weight, their
vaporization pressure decreases.
Formula Name CAS No. M.W.Density (kg/L)
Vap. Press. (bar)
Solubility (kg/L)
C₆F₁₂ perfluoromethylcyclopentane (PMCP) 1805-22-7 300 1.707 0.368 1.707x10⁻⁶ to 1.707x10⁻¹⁰
C₆F₁₄ perfluoromeythylpentane (PMP) 355-04-4 338 1.682 0.294 1.682x10⁻⁶ to 1.682x10⁻¹⁰
C₇F₁₄ perfluoromethylcyclohexane (PMCH) 355-02-2 350 1.788 0.141 1.788x10⁻⁶ to 1.788x10⁻¹⁰
C₇F₁₆ perfuloroethylpentane (PEP) 2690-05-3 388 1.78 0.092 1.780x10⁻⁶ to 1.780x10⁻¹⁰
C₈F₁₆ perfluoroethylcyclohexane (PECH) 335-21-7 400 1.829 0.048 1.829x10⁻⁶ to 1.829x10⁻¹⁰
C₈F₁₆ perfluorodimethylcheclohexane (PDMCH) 306-98-9 400 1.828 0.047 1.828x10⁻⁶ to 1.828x10⁻¹⁰
SF₆ sulfur hexafluoride 2551-62-4 146 0.006 21.78 3.78x10⁻⁵
CHF₃ trifluoromethane 75-46-7 70 0.003 47.09 4.09x10⁻³
CF₄ tetrafluoromethane 75-73-0 88 0.004 233.32 1.88x10⁻⁵
C₃F₈ octafluoropropane 76-19-7 188 0.008 8.82 5.7x10⁻⁶

17
Figure 2.5: Phase diagram for perfluorocarbon tracers.
Along with phase change data, PFTs solubility in water can determine how the tracer will
partition in waters naturally found in coal reservoirs. While there is not much literature on the
solubility of PFTs in water, it is estimated to be about 10-6 to 10-10 mL/mL [54],[55]. It is also
generalized that solubility in water decreases with the addition of each normal CF2 group and
increases with branching and ring formations for the same number of carbons. The PFTs selected
are non-polar, non-toxic, non-flammable, colorless, and odorless. Logistically, PFTs are relatively
inexpensive, readily available, stored as a liquid at room temperature and pressure, and easily
deployable through a number of systems.
2.3.4 – Sulfur Hexafluoride
SF6 was selected due to its detectability at very low concentrations and its demonstrated
reliability in multiple field tests. SF6 is artificially produced which results in naturally low
background concentrations in the atmosphere and subsurface. Like the PFTs, the fluorine bond
with sulfur is very strong creating weak intermolecular forces, which allows SF6 to exist as a gas
at room temperature and pressure. It is odorless, colorless, and non-toxic. SF6 is inexpensive and
readily available as a liquefied compressed gas in a number of sizes of standardized gas cylinders.
0.00001
0.0001
0.001
0.01
0.1
1
10
100
-100 -50 0 50 100 150 200 250 300
Pres
sure
(bar
)
Temperature (C)
PMCP
PMP
PMCH
PEP
PECH
PDMCH
PTMCH

18
2.3.5 – Halocarbons
Trifluoromethane (CHF3) (also known as halocarbon 23), tetrafluoromethane (CF4) (also
known as halocarbon 14), and octafluoropropane (C3F8) (also known as halocarbon 218) were
selected for their differing molecular weight from the previous selected tracers. The fluorine
compounds increase their electronegativity which will enhance detection and quantification.
Similar to SF6, the halocarbons are colorless, odorless, non-toxic, and are readily available in
compressed gas cylinders.
2.3.6 – Equipment Selection and Analysis Method Development
For this study, a Shimadzu GC/MS QP2010 equipped with a NICI source was used. NICI
was selected due to the high electronegativity of PFTs, SF6, and halocarbons, and their tendency
to form negative ions [56]. NICI was also selected as it has been demonstrated to detect and
quantify fluorinated compounds at the ultra-trace level [57]-[60]. This system utilizes research
grade (99.999%) CH4 as the reagent gas and ultra-high purity (99.9995%) helium as the carrier
gas.
The main goal in developing the method for tracer detection will be timely separation of
all ten of the tracers. This will help decrease the costs of analyzing a large number of samples
taken over a long projected timeline. Two methods were developed to analyze the multiple tracers
implemented in the CO2 injection test. The first method uses an Agilent J&W HP-Al/S column
(30m., 0.32mm, 5 μm.) to separate the six PFTs (Table 2.3). This column is a porous layer open
tubular (PLOT) column with an aluminum oxide (Al2O3) stationary phase deactivated with sodium
sulfate. The second method used an Agilent J&W GS-GASPRO column (30m., 0.32mm) to
separate SF6 and the three halocarbon tracers (Table 2.4). This column is also a PLOT column

19
with a proprietary bonded silica-based stationary phase. Figures 2.6 and 2.7 display sample
chromatograms with the individual tracer separation for each methods.
Table 2.3: GC and MS method parameters for HP-AL/S column.
Table 2.4: GC and MS method parameters for GS-GASPRO column.
Figure 2.6: Chromatogram displaying PFTs using HP-AL/S column.
Column oven temperature 80°C, isothermalInjection port temperature 185°CInjection mode SplitSplit ratio 50Pressure 153.2 kPaTotal Flow 104.0 mL/minColumn flow 2.00 mL/minLinear velocity 52.1 cm/secPurge flow 2 mL/minIon source temperature 200°CInterface temperature 185°CIonization mode NCI
Column oven temperature 150°C, isothermalInjection port temperature 150°CInjection mode SplitSplit ratio 50Pressure 194.5 kPaTotal Flow 103.9 mL/minColumn flow 2.00 mL/minLinear velocity 53.7 cm/secPurge flow 2 mL/minIon source temperature 200°CInterface temperature 185°CIonization mode NCI

20
Figure 2.7: Chromatogram displaying SF6 and halocarbon tracers using GS-GASPRO column.
2.3.7 – Field Sampling Methods
Gas composition sample were collected using DOT-compliant stainless steel gas cylinders.
The gas cylinders are equipped at both end with a nonrotating-stem needle valve. Gas samples are
collected by connecting one end to the sampling port located at the wellhead and following the
GPA Standard 2166 for natural gas spot sampling [61]. Tracer concentration samples were
collected using 10mL glass BD Vacutainers. These glass vials have a rubber septum and come
from the manufacturer with a vacuum to allow for rapid collection of gas or liquid samples. Tracer
samples were collected at the wellhead using a double-sided needle and a plastic holder (Figure
2.8). An adapter was made for the wellhead sampling port using a fitting and a rubber septum
(Figure 2.9). The needle could then pierce this rubber septum on the wellhead and the rubber
septum on the glass vial to collect a sample without any outside contamination. More details on
the sampling procedures for gas composition and tracer sampling can be found in [52].

21
Figure 2.8: Tracer concentration sample being collected using Vacutainer.
Figure 2.9: Wellhead adapter for tracer concentration sampling.
2.4 – CO2-ECBM RECOVERY TEST IN BUCHANAN COUNTY, VIRGINIA
2.4.1 – Overview
In July, 2015, a small-scale CO2 injection test was conducted to demonstrate the storage
and ECBM recovery potential in a stacked coal reservoir. The test site is located in Buchanan
County, Virginia, approximately 7.5 miles from the 2009 Russell County CO2 injection test
(Figure 2.10). The injection site is located within the Oakwood CBM field, one of the largest in
Central Appalachia. The coal reservoir within the Oakwood CBM field consists of 15 to 20

22
Pennsylvanian-aged coal seams distributed from a depth of approximately 1,000 to 2,000 ft. and
averaging 1.0 ft. in thickness.
Figure 2.10: Buchanan County CO2 injection test study area.
Three wells, DD-7, DD-7A, and DD-8, were selected as injection well candidates (Figure
2.11). Three monitoring wells, M-1, M-2, and C-1, were drilled prior to the test for additional
reservoir characterization. An overlapping ¼-mile radius boundary from each well was established
where a majority of the monitoring efforts would take place. This boundary was based on the
results of a preliminary model which simulated the extents of the CO2 plume at the target 20,000
tons [62]. A ½-mile radius boundary was extended beyond this initial boundary to include all
monitoring activities for the test. More details on the MVA plan can be found in [63].

23
Figure 2.11: Buchanan County CO2 injection test site. The three injection wells are denoted by a yellow symbol.
The three monitoring wells are denoted by an orange symbol. The ¼-mile boundary is denoted by a white line and shaded green. The ½ mile boundary is denoted by a blue line. The offset production wells located within this
boundary that were used as monitoring wells for this test are denoted by a blue symbol. 2.4.2 – CO2 injection Operations
The three CO2 injection wells were issued an EPA Class II Underground Injection Control
(UIC) permit. The wells were converted for CO2 injection operations by first removing the 2.375-
inch tubing, sucker rods, and pumps used for dewatering. Next, a downhole camera was run in
each well to assess the condition of the perforations created during the initial drilling and
completion of the wells. Finally, a new 2.375-inch tubing and inflatable packer assembly was
installed just above the first perforations in each well to assure CO2 injection into the target
formations.
CO2 injection operations were conducted on the DD-7 well pad (Figure 2.12). CO2 was
delivered by truck and stored on site in 70-ton storage vessels. An injection skid was constructed
on site to be able to control the CO2 injection operations at each well separately. The injection skid

24
connected directly to the DD-7 wellhead, and to the DD-7A and DD-8 wells via pipeline. Each
line of the skid contained motorized valves to control flowrates, Coriolis flowmeters to measure
injection rates, and a supervisory control and data acquisition (SCADA) system to record data
continuously every 60 seconds and be able to monitor and control injection parameters remotely.
Figure 2.12: Injection operations at the DD-7 well pad. Background: CO2 storage tanks. Middleground: Injection
skid. Foreground (Left): DD-7 wellhead. Foreground (Right): Pipeline to DD-7A and DD-8.
CO2 injection operations were conducted over two phases. Phase I was conducted from
July 2, 2015 to April 15, 2016 when a total of 10,601 tons of CO2 was injected. The injection wells
were shut in for a period of eight months to allow the reservoir to equilibrate. Phase II commenced
on December 14, 2016 and was completed on January 30, 2017. During Phase II a total of 2,662
tons of CO2 was injected. The wells were again allowed to soak for a period of eight months. The
wells were put back into normal production and flowed back on September 5, 2017.

25
2.5 – TRACER IMPLEMENTATION FOR CO2-ECBM RECOVERY TEST IN
BUCHANAN COUNTY, VIRGINIA
The chemical tracers were deployed at different stages during the CO2 injection test to
accurately track plume migration throughout both phases of CO2 injection operations and to
simulate changing reservoir conditions across both phases. In total, tracers were injected at 4
different stages:
1) prior to/start of Phase I CO2 injection to track the initial CO2 plume migration;
2) during Phase I to simulate reservoir conditions when CO2 injection pressures were
relatively low;
3) during Phase I to simulate reservoir conditions when CO2 injection pressures were
relatively high; and
4) start of Phase II CO2 injection to compare initial CO2 plume migration at the start of
each Phase.
Prior to the start of CO2 injection, the three injection wells were shut-in so they could be
converted for CO2 injection operations. During this time, the wells filled with natural water from
the formation. The liquid PFTs were added to the water in these wells using a PVC pipe filled with
the tracer and dropped to the bottom of each wells. The PVC pipes were capped at one end with a
brass fitting drilled with holes. The assembly was filled with a small volume of water and frozen
to create an ice plug. The liquid PFT was measured and filled offsite to reduce contamination at
the site. The other end of the assembly was capped with a brass fitting. Once lowered into the
wellbore, the ice will melt and the liquid PFTs will mix with the water at the bottom of the well
through the drilled holes (Figure 2.13). On July 2, 2015, 150 mL of perfluoromethylcyclohexane
(PMCH) was added to the DD-7A injection well. On July 8, 2015 150 mL of

26
perfluoromethylcyclopentane (PMCP) was added to DD-7 and 250 mL of
perfluoroethylcyclohexane (PECH) was added to DD-8.
Figure 2.13: PVC assembly for PFT added to wellbore fluid.
On July 17, 2015, 15 days after the start of Phase I CO2 injection operations, 2,000 cm3 of
sulfur hexafluoride (SF6) was added to the CO2 stream in the DD-8 injection well. At this point in
the project 132 tons of CO2 had been injected into DD-8 and a total of 663 tons in all three wells.
SF6 was injected using 500 cm3 DOT-compliant stainless steel gas sampling cylinders. The tracer
was transferred from its gas cylinder into multiple stainless steel cylinders in a laboratory to reduce
contamination at the site. These individual cylinders were connected to the CO2 stream at the
wellhead and were flushed with a high-pressure compressed air tank regulated at a pressure higher
than the CO2 injection pressure to ensure successful injection of the tracer (Figure 2.14). These
cylinders were flushed and cleaned after the tracer injection before they were put back to use for
gas composition samples.
ICE
PFT

27
Figure 2.14: Gaseous tracer injection method.
The second round of tracers were administered on October 14, 2015. A volume of 2,500
cm3 of trifluoromethane (CHF3) was added with the CO2 stream at DD-7. A volume of 2,000 cm3
of tetrafluoromethane (CF4) was added with the CO2 stream at DD-7A. A volume of 4,000 cm3 of
octafluoropropane (C3F8) was injected with the CO2 stream at DD-8. At this stage in the CO2
injection test, 913, 1,031, and 1,070 tons of CO2 had been injected into DD-7, DD-7A, and DD-8,
respectively. These gaseous tracers were injected the same way SF6 was injected as previously
mentioned.
The third round of tracers was injected on March 29, 2016. A volume of 500mL of
perfluoromethylpentane (PMP) was added with the CO2 stream at DD-7. A volume of 500mL
perfluoroethylpentane (PEP) was added with the CO2 stream at DD-7A. A volume of 500 mL of
perfluorodimethylcyclohexane (PDMCH) was injected with the CO2 stream at DD-8. These PFTs
were chosen to correspond to their cyclic perfluoroalkane counterpart injected at the start of CO2

28
injection operations and expected to behave similarly within the reservoir. At this stage in the CO2
injection test, 3,306, 3,030, and 3,478 tons of CO2 had been injected into DD-7, DD-7A, and DD-
8, respectively. This round of liquid PFTs were injected using a Teledyne Isco 500D Syringe
Pump (Figure 2.15). This pump has a 500 mL capacity and can be programmed to inject at a
constant flow rate or a constant pressure. For this test, constant flow rate was selected. More
information can be found in [52].
Figure 2.15: Teledyne Isco syringe pump.
Finally, on January 11, 2017, 28 days after the start of Phase II CO2 injection operations, a
volume of 5,000 cm3 of SF6 was injected with the CO2 stream at DD-8. At this stage in the CO2
injection test, 4,326 tons of CO2 had been injected into DD-8 and 12,361 total tons of CO2 had
been injected in all three wells for the entire test.

29
2.6 – RESULTS
Gas samples were routinely collected at the offset monitoring and production wells and
analyzed for tracer concentrations. The samples were analyzed in triplicate to determine percent
relative standard deviation (%RSD). A %RSD of 5% or less was used as a standard to ensure GC
analysis precision. Only two tracers from the first stage of tracer injections were discovered at
offset wells. SF6, which was added at the start of injection at DD-8, was discovered at five offset
wells. PMCP, which was added to DD-7 prior to the start of injection, was discovered at three
offset production wells. Figure 2.16 displays the tracer arrival at the offset wells and the number
of days between tracer injection and detection. It is important to note that these arrival times are
estimates, as it is possible that the tracers could have arrived earlier, but due to sampling frequency,
were detected at a later date. It is also important to note that negative findings of tracer arrival at
offset wells could have been due to the sampling frequency, where the tracer arrived earlier and
was undetected when sampled at a later date. Lastly, negative findings of tracer arrival could be
due to concentrations lower than the limits of detection for the equipment and analysis method
selected.
Figure 2.16: Tracer arrival at offset monitoring and production wells.

30
The SF6 that was injected in the DD-8 well was detected at M-1 to the southwest, DD-8A
to the southeast, CC-8 to the northeast, CC-7A to the northwest, and DD-9 to the east. The pattern
and extent of tracer detection coincides with the extent of the ¼-mile MVA boundary associated
with the DD-8 injection well, which was established based on the pre-injection simulation of the
extents of the CO2 plume. One likely explanation for this outward trend could be the influence of
the overlapping pressure fronts created by the CO2 injection at all three wells. Assuming that the
tracer moved as a uniform plume outwards from the DD-8 injection well, the pressure fronts from
DD-7A and DD-7 would have kept SF6 from moving to wells such as EE-8, M-2, and other wells
to the West. The detection of SF6 at M-1 does not support this explanation, however, it is important
to note that SF6 was detected almost immediately (6 days) after CO2 injection, when injection
pressures would have been relatively low. Also, M-1 is located in the typical hydraulic fracture
direction and fracture length for CBM wells in this area which would increase the direct pathway
for the tracer to migrate. This explanation is further supported when the PMCP that was injected
in the DD-7 well was detected at CC-7A to the northeast, CC-6A to the northwest, and EE-6 to the
northwest. This pattern also coincides with the extent of the ¼-mile boundary associated with the
DD-7 injection well. Factors such as missed arrival due to sampling frequency or undetectable
concentrations could explain why PMCP was not found at other wells along this pattern such as
CC-7, DD-6, and DD-6A.
2.7 – CONCLUSIONS
As part of an extensive MVA plan for a CO2-ECBM recovery test in Buchanan County,
Virginia, a unique multi-tracer program was developed to track CO2 plume migration within a
stacked coalbed methane reservoir. For this test, ten fluorinated tracers (Six PFTS, SF6, and three

31
halocarbon tracers) were selected based on a number of physical properties as well as their
demonstration as viable tracers in a number of other CCUS projects.
Due to the high electronegativity of fluorinated compounds, GC-NICI-MS was utilized to
successfully develop two trace analytical methods to detect the selected tracers simultaneously.
Both methods successfully separate the tracers in a timely manner which can help reduce the
analysis costs of running numerous samples.
The selected fluorinated tracers were successfully injected at four distinct phases during
the CO2 injection test to track CO2 plume migration under changing injection operations and
reservoir conditions. Three PFTs were introduced with the water in the injection wells prior to the
start of Phase I CO2 injection operation to simulate the initial plume movement. One of these
tracers, PMCP, which was injected into the DD-7 well, was detected at three offset production
wells. SF6 was also injected with the CO2 stream in DD-8 at the start of Phase I. SF6 was detected
at five offset production wells. The outward pattern of detection for both tracers suggests a major
influence from the overlapping CO2 plume from the three injection wells. None of the tracers
introduced during the second, third, or fourth round of tracer injection were detected at any of the
offset wells. This could be due to a number of factors including, missed breakthrough due to
sampling frequency, detectability too low due to insufficient amount of tracer injected, complex
reservoir conditions resulting from CO2 injection operations such as adsorption or coal matrix
swelling. The breakthrough of multiple fluorinated tracers at multiple offset wells prove them to
be a viable monitoring tool to detect interwell connectivity. Monitoring for subsequent CO2
breakthrough at these offset wells where tracers were detected will further validate them as a tool
to predict migration pathways within the reservoir.

32
It is recommended for future tests that similar property tracers be used to reduce
uncertainty in field results. For this test, three types of fluorinated tracers were injected: PFTs,
halocarbons, and SF6. Two different types were detected at offset wells, a PFT (PMCP) and SF6.
Had two different tracers of the same type been injected into different wells at the same time, the
breakthrough results could be more easily compared. Likewise, had two different tracers of the
same type been injected into the same well but at different times (e.g. Phase I and II) during the
project, breakthrough results for each phase could be more easily compared. Therefore it is
recommended that PFTs be used for future tests as they exist as a suite of similar property,
relatively inexpensive, easily deployed, and easily detectible tracers.
A number of implementation techniques were also used to administer the tracers. By
selecting one type of tracer such as PFTs, one single method of implementation can be used to
further reduce uncertainty in results. The Teledyne Isco Syringe Pump is an easy to operate pump
that can be programmed to create customized tracer injection operations. Its capability to inject
liquids make it one of the best options to inject PFTs and its range of models can be selected for
larger volume capacity and higher injection pressures.
Selection of one type of tracer will also reduce the requirements of the analysis method
used for detection, as all six PFTs were detected using one GC/NICI/MS method. Reducing
analysis to one method will cut down on analysis time and therefore the costs associated with
analysis. It is recommended that future work be conducted to determine the limits of detection for
the tracers that were selected for this test. This could eliminate the uncertainty in negative findings
of breakthrough at offset wells due to too low of concentration. This could also aid in predicting
the amount of tracer needed during injection to have successful detection of breakthrough at offset
wells.

33
ACKNOWLEDGEMENTS
Financial assistance for this work was provided by the U.S. Department of Energy through
the National Energy Technology Laboratory’s program under contract no. DE-FE0006827.
REFERENCES
[1] M. Myers, L. Stalker, B. Pejcic, and A. Ross, “Tracers – past, present, and future applications in CO2 geosequestration,” Applied Geochemistry, vol.30, pp.125-135, 2013.
[2] R. Patterson and K. Luxbacher, “Tracer gas applications in mining and implications for improved ventilation characteristics,” International Journal of Mining Reclamation and Environment, vol.26, no.4, pp.337-250, 2011.
[3] E.D. Thimons and F.N. Kissell, "Tracer gas as an aid in mine ventilation analysis," U.S. Bureau of Mines, Pittsburgh, PA, 1974.
[4] E.D. Thimons, R.J. Bielicki, and F.N. Kissell, "Using sulfur hexafluoride as a gaseous tracer to study ventilation systems in mines," U.S. Bureau of Mines, Pittsburgh, PA, 1974.
[5] R.S. Suglo and S. Frimpong, “Accuracy of tracer gas surveys in auxiliary ventilation systems in coal mines," Proceeding of the North American / Ninth US Mine Ventilation Symposium, pp.169-175, 2002.
[6] D.T. Allen, V.M. Torres, J. Thomas, D.W. Sullivan, M. Harrison, A. Hendler, S.C. Herdon, C.E. Kolb, M.P. Fraser, A.D. Hill, B.K. Lamb, J. Miskimins, R.F. Sawyer, and J.H. Seinfeld, "Measurements of methane emissions at natural gas production sites in the United States," Proceedings of the National Academy of Sciences of the United Sates of America, vol.110, no.4, pp.17768-17773, 2013.
[7] A.J. Marchese, T.L. Vaughn, D. Zimmerle, D. Martinez, L. Willimas, A.L. Robinson, A.L. Mitchell, R. Subramanian, D.S. Tkacik, J.R. Roscioli, and S.C. Herdon, "Methane emissions from United States natural gas gathering and processing," Environmental Science and Technology, vol.49, no.17, pp.10718-10727, 2015.
[8] A.L. Mitchell, D.S. Tkacik, J.R. Roscioli, S.C. Herndon, T.I. Yacovitch, D.M. Martinez, T.L. Vaughn, M. Sullivan, C. Floerchinger, A. Marchese, and A.L. Robinson, "Measurements of methane emissions from natural gas gathering facilities and processing plants: measurement results," Environmental Science and Technology, vol.49, no.5, pp.3219-3227, 2015.
[9] R. Subramanian, L. Williams, T.L. Vaughn, D. Zimmerle, J.R. Roscioli, S.C. Herndon, T.I. Yacovitvh, C. Floerchinger, D.S. Tkacik, A.L. Mitchell, M. Sullivan, and A.L.

34
Robinson, "Methane emissions from natural gas compressor stations in the trasmission and storage sector: measurements and comparisons with the EPA Greenhouse Gas Reporting Program protocol," Environmental Science and Technology, vol.49, no.5, pp.3252-3261, 2014.
[10] J.H. Shorter, J.B. McManus, and C.E. Kolb, "Collection of leakage statistics in the natural gas system by tracer methods," Environmental Science and Technology, vol.31, no.7, pp.2012-2019, 1997.
[11] B. Lamb, J.B. McManus, J.H. Shorter, C.E. Kolb, B. Mosher, R.C. Harriss, E. Allwine, D. Blaha, T. Howard, A. Guenther, R.A. Lott, R. Siverson, H. Westberg, and P. Zimmerman, "Development of atmospheric tracer methods to measure methane emissions from natural gas facilities and urban areas," Environmental Science and Technology, vol.29, no.6, pp.1468-1479, 1995.
[12] G.I. Senum, R. Fajer, W.E. DeRose, B.R. Harris, and W.L. Ottaviani, "Petroleum reservoir characterization be perfluorocarbon tracers", SPE/DOE Enhanced Oil Recovery Symposium, Tulsa, OK, 1992.
[13] C. Hernandez, C. Alvarez, A. Daman, A. DeJong, and A. Audemand, “Monitoring WAG Pilot at VLE Field, Maracaibo Lake, by perfluorocarbon and fluorinated benzoic acids tracers,” SPE/DOE Improved Oil Recovery Symposium, Tulsa, OK, 2002.
[14] D.L. Kuehne, D.I. Ehman, A.S. Emanuel, and C.F. Magnani, “Design and evaluation of a nitrogen-foam field trial,” Journal of Petroleum Technology, vol.45, no.4, pp.504-512
[15] O. Dugstad, T. Arudal, C. Galdiga, I. Hundere, and H.J. Torgersen, “Application of tracers to monitor fluid flow in the Snorre Field: a field study,” SPE Annual Technical Conference and Exhibition, Houston, TX, 1999.
[16] E. Ali, C. Chatzichristos, T. Arudal, and J. Muller, “Tracer simulation to improve the reservoir model in the Snorre Field,” SPE International Oil and Gas Conference and Exhibition, Beijing, CN, 2000.
[17] T. Arudal, N. Cheng, J. Sagen, and J. Muller, “History matching of gas tracer data to identify and estimate gas storage volume in a North Sea oil field,” Petroleum Society’s Canadian International Petroleum Conference, Calgaray, AB, CA, 2001.
[18] Z.S. Omoregie, S.L. Vasicek, G.R. Jackson, and L.A. Martinson, “Monitoring the Mitsue hydrocarbon miscible flood: program design, implementation, and preliminary results,” Journal of Canadian Petroleum Technology, vol.27, no.6, pp.51-62, 1988.

35
[19] R. Kleven, O. Hovring, S.T. Opdal, T. Bjornstad, O. Dugstad, and I.A. Hundere, “Non-radioactive tracing of injection gas in reservoirs,” SPE Gas Technology Symposium, Calgary, AB, CA, 1996.
[20] E. Ljosland, T. Bjornstad, O. Dugstad, and I. Hundere, “Perfluorocarbon tracer studies at the Gullfaks field in the North Sea,” Journal of Petroleum Science and Engineering, vol.10, no.1, pp.27-38, 1993.
[21] S.A. Rodge, “Interpretation of radioactive tracer observations in the Gullfaks field,” International Energy Agency Symposium on Reservoir Engineering, Paris, FR, 1990.
[22] M. Mercado, C.E. Perez, M. Asadi, and D.R. Casas,“Gas flood-flow pattern evaluation: a successful interwell field study,” SPE Latin American and Carribbean Petroleum Engineering Conference, Port-of-Spain, TT, WI, 2003.
[23] O.R. Wagner, “The use of tracers in diagnosing interwell reservoir heterogeneities - field results,” Journal of Petroleum Technology, vol.29, no.11, pp.1410-1416, 1977.
[24] J.S. Tang, “Interwell tracer test to determine residual oil saturation in a gas-saturated reservoir. Part II: field applications,” Journal of Canada Petroleum Technology, vol.30, no.4, pp.34-42, 1991.
[25] G.J. Lichtenberger, “Field application of interwell tracers for reservoir characterization of enhnaced oil recovery pilot areas,” SPE Production Operations Symposium, Oklahoma City, OK, 1991.
[26] O.R. Wagner, L.E. Baker, and, R.S. Gordon, “The design and implementation of multiple tracer program for multifluid, multiwell injection projects,” 49th Annual Fall Meeting of Scoiety of Petroleum Engineers of AIME, Houston, TX, 1974.
[27] Y. Du and L.Guan, “Interwell tracer tests: lessons learned from past field studies,” SPE Asia Pacific Oil & Gas Conference and Exhibition, Jakarta, ID, 2005
[28] S.D. Hovorka, T.A. Meckel, and R.H. Trevino, “Monitoring a large-volume injection at Cranfield Mississippi – project design and recommendations,” International Journal of Greenhouse Gas Control, vol.18, pp.345-360, 2013
[29] S.D. Hovorka, T.A. Meckel, R.H. Trevino, J. Lu, J.P. Nicot, J.W. Choi, D. Freeman, P. Cook, T.M. Daley, J.B. Ajo-Franklin, B.M. Freifeld, C. Doughty, C.R. Carrigan, D.L. Brecque, Y.K. Kharaka, J.J. Thordsen, T.J. Phelps, C. Yang, K.D. Romanak, T. Zhang, R.M. Holt, J.S. Lindler, and R.J. Butsch, “Monitoring a large volume CO2 injection: year two results from SECARB project at Danbury’s Cranfield, Mississippi, USA,” Energy Procedia, vol.4, pp.3478-3485, 2011.

36
[30] B.M. Freifeld, R.C. Trautz, Y.K. Kharaka, T.J. Phelps, L.R. Myer, S.D. Hovorka, and D.J. Collins, “The U-tube: a novel system for acquiring borehole fluid samples from a deep geologic CO2 sequestration experiment,” Journal of Geophysical Research, vol.110, 2005.
[31] H.S. Nance, H. Rauch, B. Strazisar, G. Bromhal, A. Wells, R. Diehl, R. Klusman, J. Lewicki, C. Oldenburg, Y.K. Kharaka, and E. Kakouros, “Surface environmental monitoring at the Frio CO2 sequestration test site, Texas,” DOE/NETL Annual Conference on Carbon Capture and Sequestration, 2005.
[32] Y.K. Kharaka, J.J. Thordsen, S.D. Hovorka, H.S. Nance, D.R. Cole, T.J. Phelps, and K.G. Knauss,” Potential environmental issues of CO2 storage in deep saline aquifers: geochemical results from the Frio I Brine Pilot Test, Texas, US,” Applied Geochemistry, vol.24, no.6, pp.1106-1112, 2009.
[33] B.R. Strazisar, A.W. Wells, J.R. Diehl, R.W. Hammack, and G.A. Veloski, “Near-surface monitoring for the ZERT shallow CO2 injection project,” International Journal of Greenhouse Gas Control, vol.3, no.6, pp.736-744, 2009.
[34] L.H. Spangler, L.M. Dobeck, K.S. Repasky, A.R. Nehrir, S.D. Humphries, J.L. Barr, C.J. Keith, J.A. Shaw, J.H. Rouse, A.B. Cunningham, S.M. Benson, C.M. Oldenburg, J.L. Lewicki, A.W. Wells, J.R. Diehl, B.R. Strazisar, J.E. Fessenden, T.A. Rahn, J.E. Amonette, J.L. Barr, W.L. Pickles, J.D. Jacobson, E.A. Silver, E.J. Male, H.W. Rauch, K.S. Gullickson, R. Trautz, Y. Kharaka, J. Birkholzer, and L. Wielopolski, “A shallow subsurface controlled release facility in Bozeman, Montana, USA, for testing near surface CO2 detection techniques and transport models,” Environmental Earth Sciences, vol.60, no.2, pp.227-239, 2010.
[35] A. Wells, B. Strazisar, R. Diehl, and G. Veloski, “Atmospheric monitoring and surface plume development at the ZERT pilot test in Bozeman, Montana, USA,” Environmental Earth Sciences, vol.60, no.2, pp.299-305, 2010.
[36] N. Pekney, A. Wells, J.R. Diehl, M. McNeil, N. Lesko, J. Armstrong, and R. Ference, “Atmospheric monitoring of a perfluorocarbon tracer at the 2009 ZERT Center experiment,” Atmospheric Environment, vol.47, pp.124-132, 2012
[37] A.W. Wells, J.R. Diehl, G. Bromhal, B.R. Strazisar, T.H. Wilson, and C.M. White, “The use of tracers to assess leakage from the sequestration of CO2 in a depleted oil reservoir, New Mexico, USA,” Applied Geochemistry, vol.22, no.5, pp.996-1016, 2007.
[38] T.H. Wilson, A.W. Wells, J.R. Diehl, G.S. Bromhal, D.H. Smith, W. Carpenter, and C. White, “Ground-penetrating radar survey and tracer observations at the West Queen Pearl carbon sequestration pilot site, New Mexico,” The Leading Edge, vol.24, no.7, pp.718-722.

37
[39] J.T. Litynski, S.M. Klara, H.G. McIlvried, and R.D. Srivastava, "The United States Department of Energy's Regional Carbon Sequestration Partnerships program: A collaborative approach to carbon management," Environmental International, vol.32, pp.128-144, 2006.
[40] U.S. Department of Energy, "Carbon storage technology program plan," Available: https://www.netl.doe.gov/File%20Library/Research/Coal/carbon-storage/Program-Plan-Carbon-Storage.pdf, 2014.
[41] U.S. Department of Energy, “Best practices: monitoring, verification, and accounting (MVA) for geologic storage projects (2017 revised edition),” Available: https://www.netl.doe.gov/File%20Library/Research/Carbon-Storage/Project-Portfolio/BPM-MVA-2012.pdf, 2017.
[42] K.C. Schepers, A. Oudinot, and N. Ripepi, “Enhanced gas recovery and CO2 storage reservoirs: optimized injected gas for mature basins of various coal rank,” SPE International Conference on CO2 Capture, Storage, and Utilization, New Orleans, LA, 2010.
[43] J.Q. Shi and S. Durucan, “CO2 storage in deep unminable coal seams,” Oil and Gas Science and Technology, vol.60, no.3, pp.547-558, 2006.
[44] S. Harpalani, B.K. Prusty, and P. Dutta, “Methane/CO2 sorption modeling for coalbed methane production and CO2 sequestration, Energy Fuels, vol.20, no.4, pp.1591-1599.
[45] U.S. Department of Energy, “Carbon storage atlas (5th edition)”, Available: https://www.netl.doe.gov/File%20Library/Research/Coal/carbon-storage/atlasv/ATLAS-V-2015.pdf, 2015.
[46] M. Godec, G. Koperna, R. Petrusak, and A. Oudinot, “Potential for enhanced gas recovery and CO2 storage in the Marcellus Shale in the Eastern United Sates,” International Journal of Coal Geology, vol.118, pp.95-104, 2013.
[47] R. Heller and M. Zoback, “Adsorption of methane and carbon dioxide on gas shale and pure mineral samples,” Journal of Unconventional Oil and Gas Resources, vol.8, pp.14-24, 2014.
[48] I. Miskovic, “A data-driven approach for the development of a decision making framework for geological CO2 sequestration in unmineable coal seams,” Ph.D. dissertation, Department of Mining and Minerals Engineering, Virginia Polytechnic Institute and State University, Blacksburg, VA, 2011.
[49] N.S. Ripepi, “Carbon dioxide storage in coal seams with enhanced coal bed methane recovery geologic evaluation, capacity assessment and field validation of the Central

38
Appalachian Basin,” Ph.D. dissertation, Department of Mining and Minerals Engineering, Virginia Polytechnic Institute and State University, Blacksburg, VA, 2009.
[50] M. Karmis, N. Ripepi, E. Gilliland, A.K. Louk, X. Tang, C. Keles, C. Schlosser, E. Diminick, M. McClure, J. Hill, and B. Hill, “Central Appalachian basin unconventional (coal/organic shale) reservoir small scale CO2 injection test,” [Online] doi: 10.2172/1439921, 2018.
[51] A.K. Louk, N. Ripepi, K. Luxbacher, E. Gilliland, X. Tang, C. Keles, C. Schlosser, E. Diminick, S. Keim, J. Amante, and M. Karmis, “Monitoring CO2 storage and enhanced gas recovery in unconventional shale reservoirs: Results from the Morgan County, Tennessee injection test,” Journal of Natural Gas Science and Engineering, vol.45, pp.11-25, 2017.
[52] A.K. Louk, “Monitoring for enhanced gas and liquids recovery from a CO2 ‘huff-and-puff’ injection test in a horizontal Chattanooga Shale well,” M.S. thesis, Department of Mining and Minerals Engineering, Virginia Polytechnic Institute and State University, Blacksburg, VA, 2015.
[53] G. Sandford, “Perfluoroalkanes,” Tetrahedron, vol.59, no.4, pp.437-454, 2003.
[54] A.S. Kabalnov, K.N. Makarov, O.V. Shcherbakova, and A.N. Nesmeyanov, “Solubility of fluorocarbons in water as a key parameter determining fluorocarbon emulsion stability,” Journal of Fluorine Chemistry, vol.50, no.3, pp.271-284, 1990.
[55] M.G. Freire, P.J. Carvalho, L. Santos, L.R. Gomes, I.M. Marrucho, J. Coutinho, “Solubility of water in fluorocarbons: experimental and COSMO-RS prediction results,” The Journal of Chemical Thermodynamics, vol.42, no.2, pp.213-219, 2010.
[56] E.P. Grimsrud, S. Chowdhury, and P. Kerbarle, “Electron affinity of SF6 and perfluoromethylcyclohexane. The unusual kinetics of electron transfer reactions A– + B = A + B-, where A = SF6 or perfluorinated cyclo-alkanes,” Journal of Chemical Physics, vol.83, no.3, pp.1059-1069, 1985.
[57] P. Begley, B. Foulger, and P. Simmonds, “Femtogram detection of perfluorocarbon tracers using capillary gas chromatography electron capture negative ion chemical ionization mass spectrometry,” Journal of Chromatography, vol.445, pp.119-128, 1988
[58] K.M. Cooke, P.G. Simmonds, G. Nickless, and A.P. Makepeace, “Use of capillary gas chromatography with negative ion-chemical ionization mass spectrometry for the determination of perfluorocarbon tracers in the atmosphere,” Analytical Chemistry, vol.37, no.17, pp.4295-4300, 2001

39
[59] P.G. Simmonds, B.R. Greally, S. Olivier, G. Nickless, K.M. Cooke, and R.N. Dietz, “The background atmospheric concentrations of cyclic perfluorocarbon tracers determined by negative ion-chemical ionization mass spectrometry,” Atmospheric Environment, vol.36, no.13, pp2147-2156, 2002
[60] E.C. Jong, P.V. Macek, I.E. Perera, K.D. Luxbacher, and H.M. McNair, “An ultra-trace analysis technique for SF6 using gas chromatography with negative ion chemical ionization mass spectrometry,” Journal of Chromatographic Science, pp.1-6, 2014.
[61] Gas Processors Association, “Obtaning natural gas samples for analysis by gas chromatography,” available online: http://www.ptplab.net/upfile/201411/17/144643548 .pdf
[62] C. Keles, N. Ripepi, C. Schlosser, A.K. Louk, E. Gilliland, J. Amante, and M. Karmis, “Sensitivity analysis for optimizing carbon dioxide injection to improve enhanced coalbed methane recovery and carbon dioxide storage capacity,” SME Annual Conference and Exhibition, Phoenix, AZ, 2016.
[63] E.S. Gilliland, “Integrative geophysical and environmental monitoring of a CO2 sequestration and enhanced coalbed methane recovery test in Central Appalachia,” Ph.D. dissertation, Department of Mining and Minerals Engineering, Virginia Polytechnic Institute and State University, Blacksburg, VA, 2017.

40
CHAPTER 3 – AN UPDATE OF MONITORING RESULTS FROM A CO2-ECBM RECOVERY TEST IN BUCHANAN COUNTY, VIRGINIA: PHASE I, PHASE II, AND FLOWBACK Kyle Louk 1, 2, Ellen Gilliland 2, Nino Ripepi 2, Xu Tang 1, Charlie Schlosser 1, 2, Cigdem Keles 2, Michael Karmis 1, 2 1 Virginia Center for Coal and Energy Research, Blacksburg, Virginia, USA 2 Virginia Tech Department of Mining and Minerals Engineering, Blacksburg, Virginia, USA ABSTRACT
In 2015, a small-scale carbon dioxide (CO2) injection test was conducted in a stacked coal
reservoir Buchanan County, Virginia. The objective of this test was to determine the storage and
enhanced coalbed methane (ECBM) recovery potential of CO2 in Central Appalachian coals. The
design of this test was to inject up to 20,000 tons of CO2 over two phases. Phase I was conducted
from July 2, 2015 to April 15, 2016 when a total of 10,601 tons of CO2 were injected into three
wells. The injection wells were shut in for a period of eight months when Phase II commenced on
December 14, 2016. A number of monitoring, verification, and accounting (MVA) technologies
were implemented to track CO2 plume migration and determine interwell connectivity, as well as
to determine any changes caused by CO2 injection operations. This paper will provide a brief
overview of this injection test and the implemented MVA plan, highlight key results from Phase
I, and present findings from Phase II of CO2 injection operations and the flowback of the injections
wells into normal production.

41
3.1 – INTRODUCTION
Carbon capture, utilization, and storage (CCUS) technologies have the potential to
effectively reduce greenhouse gas emissions and mitigate anthropogenic climate change by
capturing CO2 at emission sources and permanently sequestering it in underground geologic
formations. In 1997, the U.S. Department of Energy (DOE) created its Carbon Storage program
tasked to advance CCUS technologies through applied research projects. In 2003, as part of this
program, seven Regional Carbon Sequestration Partnerships (RCSPs) were created to develop
approaches to safely and effectively store CO2 in their specific region. As a result of these
partnerships, over 17 million tons of CO2 have been injected in the U.S. in a number of target
reservoirs including saline formations, oil and natural gas reservoirs, unmineable coal seams,
organic-rich shale basins, and basalt formations.
Because of their unique storage properties and potential for enhanced gas recovery,
unconventional reservoirs such as coalbed methane (CBM) and organic shale reservoirs are a
viable option for CO2 storage. Coal’s microporous structure allows it to store large quantities of
gases and its preferential affinity for CO2 over naturally occurring methane allow it to enhance
coalbed methane (ECBM) recovery [1]. Multiple tests have been conducted to determine the
storage and ECBM recovery potential of CO2 in coal seams, including the Pump Canyon Project
in the San Juan Basin, New Mexico, CONSOL Energy’s CO2 injection test in Marshall County,
West Virginia, SECARB’s CO2 injection test in the Black Warrior Basin, Alabama, and Virginia
Tech’s CO2 injection test in Russell County, Virginia [2]-[5].
An award was given to the Virginia Center for Coal and Energy Research (VCCER) and
the Mining and Minerals Engineering Department at Virginia Tech by the U.S. DOE through the
National Energy Technology Laboratory (NETL) to conduct a small-scale CO2 injection test in

42
unconventional reservoirs in Central Appalachia. This paper will provide an overview of this
injection test, highlight key results from Phase I of CO2 injection operations, and present findings
from Phase II of CO2 injection operations and from the flowback of the injection wells into normal
production.
3.2 – CO2-ECBM TEST IN BUCHANAN COUNTY, VA
3.2.1 – Overview
Central Appalachian CBM fields are among the highest producing fields in the U.S. and
have approximately 2,000 BCF of proven reserves left and an estimated 2.4 TCF of estimated
recoverable resource [6]. The CO2 injection test study area is located in the Oakwood CBM field
(Figure 3.1). The Oakwood CBM field is one of the largest in Central Appalachia and spans
portions of Buchanan, Russell, and Tazewell Counties. The coal reservoir in the Oakwood field is
composed of 15-20 stacked coal seams from the Pennsylvanian aged Pocahontas and Lee
formations. Gas production in the Oakwood CBM field began in the early 1990s by CNX Gas
Company and Equitable Gas Company.
Figure 3.1: Central Appalachia coalbed methane fields [7].

43
3.2.2 – CO2 Injection Operations
The goal of this test was to inject 20,000 tons of CO2 into multiple CBM wells over two
phases. Three wells that are owned and operated by CNX Gas were selected for CO2 injection.
DD-7 and DD-8 were initially drilled on 80-acre grids in 2000 and 2001, respectively. DD-7A was
drilled as an infill well on the DD-7 unit in 2007. Historic and projected gas production for the
three injection wells is shown in Figure 3.2.
Figure 3.2: Historical and projected gas production for the three injection wells DD-7, DD-7A, and DD-8.
The three injection wells were issued an EPA Underground Injection Control (UIC) permit
which regulates the maximum flow rate and pressure of the CO2 injection. The wells were taken
offline and converted for CO2 injection operations by removing the water production tubing and
pumps and running a downhole camera in each well to assess the condition of the perforations. A
bridge plug was installed at the bottom of the wells to create an open-hole injection and a packer
and tubing assembly was installed just above the first perforations to ensure direct CO2 injection
into the target coals seams (Figure 3.3). Each injection wellhead was outfitted with an assembly
for pressure and temperature sensors, a tracer injection port, and sampling ports (Figure 3.4).
0
1,000
2,000
3,000
4,000
5,000
6,000
2000 2000 2001 2002 2004 2004 2005 2006 2008 2008 2009 2010 2012 2012 2013 2014 2016 2016 2017 2018 2020 2020
Prod
uctio
n (M
CF/
Mon
th)
Date
DD-7 DD-7A DD-8

44
Figure 3.3: Well schematic of the three injection wells after conversion for CO2 injection operations.
Figure 3.4: Injection wellhead schematic.
All CO2 injection operations were conducted on the DD-7 well pad (Figure 3.5). CO2 was
delivered by truck and stored in 70-ton storage vessels on site. An injection skid specifically built
to inject CO2 into the three wells was located on site and connected directly to the DD-7 wellhead
and to DD-7A and DD-8 via pipeline. Located on each injection line of the skid are Coriolis

45
flowmeters to measure flowrate, motorized pumps to control flowrate, and a supervisory control
and data acquisition (SCADA) system to record data continuously and control injection operations
remotely.
Figure 3.5: Injection operations at the DD-7 well pad. Background: CO2 storage tanks. Middleground: Injection
skid. Foreground (Left): DD-7 wellhead. Foreground (Right): Pipeline to DD-7A and DD-8. 3.2.3 – Monitoring, Verification, and Accounting (MVA)
An extensive monitoring, verification, and accounting (MVA) plan was created combining
atmospheric, near-surface, and subsurface technologies to identify and quantify any changes
caused by CO2 injection operations [8]. Table 3.1 summarizes the MVA technologies deployed
during this test. Atmospheric monitoring technologies include pre- and post-injection ambient air
sampling. Near surface technologies include CO2 soil flux, groundwater sampling, and geospatial
monitoring including interferometric synthetic aperture radar (InSAR) and GPS stations.
Subsurface technologies include using three monitoring and characterization wells for reservoir
pressure and temperature monitoring, gas composition, and well logging. Offset production wells
will be monitored for any flow rate and gas composition changes. A buried array of geophone

46
stations will monitor for any passive microseismic activity. Finally, a multi-tracer program will be
implemented to track CO2 plume migration and monitor interwell connectivity. Table 3.1: Overview of atmospheric, near-surface, and subsurface technologies. The bolded techniques were
selected as part of the MVA plan for the Buchanan County injection test [9].
Figure 3.6 displays a map of the injection test site and the location of deployed technologies
in the MVA plan. The white boundary (shaded green) is where monitoring efforts were
concentrated. This roughly ¼-mile radius, overlapping boundary was based on a preliminary
reservoir model that simulated the extents of the CO2 plume for the total 20,000 ton target injection.
This reservoir model will be discussed in a following section. The blue boundary, which extends

47
roughly ½ mile from the injection wells, defines the overall project boundary where all monitoring
activities occurred.
Figure 3.6: Overview map of MVA Plan.
Three offset monitoring wells, M-1, M-2, and C-1, were drilled prior to CO2 injection
operations. The locations of these wells were carefully selected based on proximity to the injection
wells and surrounding offset wells, orientation to the typical direction and length of hydraulic
fractures of the injection wells, and monitoring needs and predicted outcomes. These wells were
outfitted with a tubing and packer assembly to divide the wells into two zones: deep and shallow
producing coal seams (Figure 3.7). Surface and downhole pressure and temperature gauges were
installed for each zone and set to continuously monitor any changes that may occur during CO2
injection operations. Sampling ports were installed at the surface for both zones so that gas samples

48
could be collected and analyzed for composition changes that may occur. It is important to note
that the packer was set at the same reference location (within the Basal Lee Sandstone, below the
Pocahontas 7 coal seam) in each well not only to compare the two zones to each other, but to also
compare the two zones to their corresponding zone in each monitoring well.
Figure 3.7: Well Schematic of M-1, M-2, and C-1, showing location of packer and downhole pressure and
temperature gauges.
3.2.4 – Pre-Injection Reservoir Modeling
Preliminary reservoir modeling was completed using CMG’s GEM software to build three
different dual porosity-single permeability models. The first model used data from a CO2 injection
test conducted in 2009 in Russell County, Virginia. This data was used to gain experience with the
software as well as to help build an initial model with similar reservoir parameters to those
expected in Buchanan County. Once this initial model was build the next two models involved
CO2 injection simulations for Buchanan County.
The first model used data from the 2009 SECARB CO2 injection test in Russell County,
Virginia. The geology and extraction operations in this area (7.5 miles from the Buchanan County
test) are expected to be the same with vertically drilled wells intersecting 15-20 thin coal seams

49
completed in multiple stages (typically 3-5). This model included three scenarios: the first was a
base model, the second included a skin factor defined for each well to simulate enhanced gas flow
around the wellbore, and the third introduced a hydraulic fracture effect by assigning matrix
permeability in the typical orientation and length of the fractures.
The second model was developed as a single-well model to identify how the variation of
selected reservoir parameters and properties affected the model results. This sensitivity analysis
focused on: 1) the effect of selected initial conditions (e.g. pressure gradient, adsorption isotherms,
and porosity); 2) the influence of production mechanisms (e.g. permeability, relative permeability,
and compressibility); and 3) the contribution of well characteristics (e.g. hydraulically stimulated
wells versus skin factors). The primary goal for each variation was to match historic water and gas
production for one of the selected injection wells.
The third model consisted of two scenarios, a 20-well scenario including the three selected
injection wells and the surrounding offset production wells, and a smaller 4-well scenario
including the three injection wells and the closest offset production well. The primary focus of
these scenarios was to predict the amount of CO2 that can be stored in multiple stacked coal seams,
the extent of the CO2 plume, the potential for breakthrough at offset wells, and the amount of CO2
stored after the wells were put back into normal production. Each scenario was based on pre-
injection inputs such as historic gas and water production, a simulated 1-year/20,000-ton CO2
injection, and a flowback after a 1-year soaking period. For the smaller, 4-well scenario, 3 cases
were considered. The first case (a) assumed that all 18 of the coal seams were perforated but not
hydraulically fractured. In the second case (b), a negative skin was assigned to each well to account
for enhanced flow around the wellbore. Finally, in the third case (c), the hydraulic fractures were
explicitly modeled. For all cases in this third model, CO2 breakthrough is predicted at the nearest

50
offset production well (Figure 3.8). More details about the pre-injection modeling can be found in
[10]-[12].
Figure 3.8: Adsorption profile (gmole/ft3) for four-well scenario with three cases (a), (b), and (c).
3.3 – PHASE I RESULTS
Phase I of CO2 injection operations began on July 2, 2015. Injection operations were
staggered such that each wells was brought online at different times. CO2 injection began with
DD-7A on July 2, and followed with DD-7 and DD-8 on July 8 and 9, respectively. A total of
10,601 tons of CO2 were injected during Phase I.
Multiple fluorinated chemical tracers were injected to help monitor CO2 plume migration
within the reservoir. Sampling for concentration increases at offset production wells can help
identify interwell connectivity and predict migration pathways for the injected CO2. The tracers
were deployed at different stages during the CO2 injection to simulate the changing reservoir

51
conditions. Tracer were deployed at three different stages during Phase I: 1) prior to/start of CO2
injection to track the initial CO2 plume migration; 2) when CO2 volumes reached 3,000 total tons
(approximately 15% of proposed 20,000 tons) and injection pressures were relatively low; and 3)
when CO2 volumes reached 9,800 total tons (approximately 50% of proposed 20,000 tons) and
injection pressures were relatively high.
Prior to the start of CO2 injection, the three injection wells were shut-in so they could be
converted for CO2 injection operations. During this time, the wells filled with natural water from
the formation. Liquid PFTs were added to the water in these wells using a PVC pipe filled with
the tracer and dropped to the bottom of each wells. Approximately 150 mL of
perfluoromethylcyclopentane (PMCP), 150 mL of perfluoromethylcyclohexane (PMCH), and 250
mL of perfluoroethylcyclohexane (PECH) was added to DD-7, DD-7A, and DD-8, respectively.
The second round of tracers were administered on October 14, 2015. A volume of 2,500 cm3 of
trifluoromethane (CHF3), 2,000 cm3 of tetrafluoromethane (CF4), and 4,000 cm3 of
octafluoropropane (C3F8) was injected with the CO2 stream at DD-7, DD-7A, and DD-8,
respectively. The third round of tracers was injected on March 29, 2016. A volume of 500mL of
perfluoromethylpentane (PMP), 500 mL perfluoroethylpentane (PEP), and 500 mL of
perfluorodimethylcyclohexane (PDMCH) was injected with the CO2 stream at DD-7, DD-7A, and
DD-8, respectively.
The SF6 that was injected in the DD-8 well was detected at five offset wells: M-1 to the
southwest, DD-8A to the southeast, CC-8 to the northeast, CC-7A to the northwest, and DD-9 to
the east. The PMCP that was injected in the DD-7 well was detected at three offset wells: CC-7A
to the northeast, CC-6A to the northwest, and EE-6 to the northwest (Figure 3.9). The outward
pattern and extents of breakthrough for both tracers coincides with the shape of the overlapping

52
¼-mile MVA boundary that simulates the extents of the CO2 plume. One likely explanation for
this outward trend could be the influence of the overlapping pressure fronts created by the CO2
injection operations at all three wells. SF6 detection at M-1 does not support this explanation, but
it is important to note that SF6 was detected almost immediately (6 days) after CO2 injection, when
injection pressures would have been relatively low. Also, M-1 is located in the typical hydraulic
fracture direction and fracture length for CBM wells in this area which would increase the
pathways for the tracer to migrate.
Figure 3.9: SF6 and PMCP tracer arrival at offset monitoring and production wells.
Gas samples were collected and analyzed for composition at all of the offset monitoring
and production wells within the ½-mile MVA boundary. On November 10, 2015, approximately
four months after the start of CO2 injection operations, increased concentrations of CO2 were
detected at DD-8A (Figure 3.10). CO2 concentrations continued to increase reaching a maximum
of 12.9%.

53
Figure 3.10: CH4 (grey), CO2
(blue), and N2 (gold) gas composition of the DD-8A offset production well for Phase I (purple) of the CO2 injection test.
3.4 – PHASE II AND FLOWBACK RESULTS
3.4.1 – CO2 Injection
Phase II of CO2 injection operations was conducted from December 14, 2016 to Jan 30,
2017 when an additional 2,662 tons of CO2 were injected. All three injection wells behaved very
similarly with respect to pressure, injection rate, and cumulative volume of CO2 injected during
both phases (Figure 3.11). After each injection phase, wellhead pressure rapidly decreased and
leveled off at approximately 100 psi. Injection temperatures follow a seasonal trend with the
higher temperatures occurring from May to August and the lower temperatures occurring from
November through February. During these low temperature months, there is an uptick in
temperature which is due to the use of a propane heater in accordance to the standard operating
procedures of Praxair and to reduce equipment malfunction.
0
5
10
15
20
25
65
70
75
80
85
90
95
100
Perc
ent C
O2,
N2
Perc
ent C
H4
CH4 CO2 N2
CO2 Injection Phase I

54
Figure 3.11: Phase I (yellow) and II (blue) CO2 injection parameters.
0
5
10
15
20
25
30
35
40
45
7/1/2015 10/29/2015 2/26/2016 6/25/2016 10/23/2016 2/20/2017
Inje
ctio
n Ra
te (t
ons/
day)
Date
DD7 DD7A DD8
0100200300400500600700800900
7/1/2015 10/29/2015 2/26/2016 6/25/2016 10/23/2016 2/20/2017
Pres
sure
(psi
)
Date
DD7 DD7A DD8
0102030405060708090
100
7/1/2015 10/29/2015 2/26/2016 6/25/2016 10/23/2016 2/20/2017
Tem
pera
ture
(F)
Date
DD7 DD7A DD8
020406080
100120140160180200
7/1/2015 10/29/2015 2/26/2016 6/25/2016 10/23/2016 2/20/2017
Inje
ctiv
ity (i
njec
tion
rate
/pre
ssur
e)
Date
DD7 DD7A DD8

55
During this second phase of CO2 injection, a fourth round of tracers were injected. On
January 11, 2017, 28 days after the start of Phase II CO2 injection operations, a volume of 5,000
cm3 of SF6 was injected with the CO2 stream at DD-8. At this stage in the CO2 injection test, 4,326
tons of CO2 had been injected into DD-8 and 12,361 total tons of CO2 had been injected in all three
wells for the entire test. Gas samples were collected at the offset monitoring and production wells
and analyzed for tracer concentrations. This round of tracers was not detected at any of the offset
wells.
The gas samples collected were also analyzed for composition. As expected, CO2 was
again detected at DD-8A (Figure 3.12). CO2 composition had decreased to less than 2.0% after
the end of Phase I. Shortly after the beginning of Phase II, CO2 concentrations increased reaching
a maximum of 3.7% by the end of Phase II. CO2 was not detected at any of the other offset wells.
Figure 3.12: CH4 (grey), CO2
(blue), and N2 (gold) gas composition of the DD-8A offset production well for Phase I (purple) and Phase II (red) of the CO2 injection test.
3.4.2 – Flowback Results
The three injection were put back into normal production on January 9, 2018, after a
soaking period of 12 months. Daily flow rates were recorded and gas composition samples were
0
5
10
15
20
25
65
70
75
80
85
90
95
100
Perc
ent C
O2,
N2
Perc
ent C
H4
CH4 CO2 N2
CO2 Injection Phase ICO2 Injection Phase I CO2 Injection Phase IICO2 Injection Phase ICO2 Injection Phase I CO2 Injection Phase II

56
collected periodically and analyzed for CO2 and methane composition (Figure 3.13). CO2
dominated the methane stream in all three wells at 79.6, 76.4, and 79.3% for DD-7, DD-7A, and
DD-8, respectively. CO2 composition reached a maximum of 83.5, 85.7, and 86.3% for the three
wells, respectively. The last gas composition sample was collected on December 7, 2018. At this
point, the CO2 composition were similar but decreasing at 70.6, 71.5, and 77.9%, respectively. To
estimate the amount of CO2 that has been produced by this date, flow rates were projected using
decline curve analysis. On December 7, 2018, a total of 1,740 tons of CO2 had been flowed back
out of the three injection wells. This represents 13.1% of the total CO2 injected. In order to
calculate the amount of CO2 that has been flowed back from each well, the flow rate was multiplied
by the CO2 composition. Figure 3.14 displays the amount of CO2 retained within the reservoir for
each well. On December 7, 2018, approximately 81.5, 87.9, and 90.9% of the injected volume of
CO2 for DD-7, DD-A, and DD-8 had been retained within the reservoir, respectively.

57
Figure 3.13: DD-7, DD-7A, and DD-8 flowback.
0102030405060708090100
0102030405060708090
100
1/1/2018 3/2/2018 5/2/2018 7/2/2018 9/1/2018 11/1/2018 12/31/2018
% C
ompo
sitio
n (C
O₂a
nd C
H₄)
Flow
rate
(MCF
/day
)
Date
DD-7 Flowback
CO2 CH4 Flowrate
0102030405060708090100
0102030405060708090
100
1/1/2018 3/2/2018 5/2/2018 7/2/2018 9/1/2018 11/1/2018 12/31/2018
% C
ompo
sitio
n (C
O₂a
nd C
H₄)
Flow
rate
(MCF
/day
)
Date
DD-7A Flowback
CO2 CH4 Flowrate
0102030405060708090100
0102030405060708090
100
1/1/2018 3/2/2018 5/2/2018 7/2/2018 9/1/2018 11/1/2018 12/31/2018
% C
ompo
sitio
n (C
O₂a
nd C
H₄)
Flow
rate
(MCF
/day
)
Date
DD-8 Flowback
CO2 CH4 Flowrate

58
Figure 3.14: DD-7, DD-7A, and DD-8 CO2 Retention
3.4.3 – Adsorption Isotherm of SF6 on Coal
To understand how the tracers will behave within the reservoir, adsorption tests were
conducted with SF6 and CO2 on crushed coal samples. The tests were conducted at the University
50
60
70
80
90
100
0102030405060708090
100
1/1/2018 3/2/2018 5/2/2018 7/2/2018 9/1/2018 11/1/2018 12/31/2018
CO₂R
eten
tion
(%)
Flow
rate
(MCF
/day
)
Date
DD-7 Flowback
Flowrate Retention
50
60
70
80
90
100
0102030405060708090
100
1/1/2018 3/2/2018 5/2/2018 7/2/2018 9/1/2018 11/1/2018 12/31/2018
CO₂R
eten
tion
(%)
Flow
rate
(MCF
/day
)
Date
DD-7A Flowback
Flowrate Retention
50
60
70
80
90
100
0102030405060708090
100
1/1/2018 3/2/2018 5/2/2018 7/2/2018 9/1/2018 11/1/2018 12/31/2018
CO₂R
eten
tion
(%)
Flow
rate
(MCF
/day
)
Date
DD-8 Flowback
Flowrate Retention

59
of Nottingham using a Hiden Isochema’s Xemis gravimetric sorption analyzer. The following
isotherms (Figure 3.16) show a comparison of CO2 and SF6 at different temperatures on the
Pocahontas 3 coal seam. The results conclude that CO2 has a higher excess adsorption on coal
approximately 3 to 3.5 times that of SF6. Currently, there is no literature on the adsorptive
behaviors of fluorinated tracers on coal.
Figure 3.16: Adsorption isotherms of CO2 and SF6 on the Pocahontas 3 coal seam.
The Langmuir volume and pressure were calculated using both SF6 isotherm curves to be
used as input for the post-injection reservoir modeling. The Langmuir volume is the maximum
amount of gas that can adsorb onto the coal. The Langmuir pressure is the pressure at which the
storage capacity of coal is equal to one-half the Langmuir volume. Langmuir isotherms assume
adsorption as a monolayer on the surface of the coal. The equation can be calculated as follows:
𝐺𝐺𝐺𝐺 =𝑉𝑉𝐿𝐿𝑝𝑝𝑝𝑝𝐿𝐿 + 𝑝𝑝
Where GC is the gas content, VL is the Langmuir volume and pL is the Langmuir pressure.
Based on the SF6 isotherms, the following Langmuir constants were used as input parameters for
the post-injection reservoir model (Table 3.2).
.0000
.0500
.1000
.1500
.2000
.2500
.3000
.3500
.4000
.4500
.0 100.0 200.0 300.0 400.0 500.0 600.0 700.0 800.0 900.0 1000.0
Exce
ss A
dsor
ptio
n (m
mol
/g)
Pressure (mbar)CO2 20C CO2 15C CO2 10C
SF6 20C SF6 15C

60
Table 3.2: Langmuir constants for SF6 on Pocahontas 3 coal. Pocahontas 3
T VL PL
59°F (15°C) 155 scf/ton 12.5 psi 68°F (20°C) 107 scf/ton 8.3 psi
3.4.4 – Post-Injection Reservoir Modeling
Similar to the pre-injection reservoir modeling, CMG’s GEM software was used to
simulate the dual porosity-single permeability post-injection reservoir models. For the post-
injection simulation, two complex models were developed based on regional geologic data,
historic gas and water production, and the CO2 injection data. The first model included all of the
gas wells within the ½-mile radius overlapping MVA boundary around the injection wells. The
second model focused on the wells within the ¼-mile MVA boundary. Sensitivity studies were
conducted for both post-injection models to assess the CO2 plume behavior under different
conditions.
The first post-injection reservoir model was constructed with the three CO2 injection wells
and 17 offset production wells within the ½-mile MVA boundary. This model consists of 16 coal
seams layers using elevation and thickness data from the wells’ drilling and completion reports.
For this model, a number of cases were created with differing injection parameters such as number
of injection wells, different injection well candidates, and time and rate of CO2 injection (Figure
3.17). In cases 1, 2, and 3 the injection rates were higher for DD-7, DD-8, and DD-7A, respectfully.
In cases 4, 5, and 6, the CO2 was only injected into one well. In cases 7, 8, and 9, the CO2 was
injected into two wells. Cases 10, 11, and 12 had the same injection had the same amount of CO2
injection with different injection periods (longer). The last four cases (13-16) simulated the CO2
injection in different wells in the area.

61
Figure 3.17: Reservoir model with varying injection wells, injection rates, and injection periods.
The second post-injection model included the three injection wells and the two offset
production wells within the ¼-mile MVA boundary. This model consists of the same 16 layers
used in the previous model, but for this model, only the perforated seams from the drilling and
completion report were included for each well. Gas composition data (CH4, C2H6, N2, and CO2)
was also used in this model. The gas composition samples taken at the offset production wells was
comingled (mixed from each coal seam producing in that well) so gas composition could not be
attributed to each coal seam. For this model two different values for gas composition were assigned
to shallow and deep coal seams based on the results from the deep and shallow coal zones in the

62
monitoring and characterization wells M-1, M-2, and C-1. The permeability in the cleats was also
varied in wells and coal seams based on active fracture network results from the tomographic
fracture imaging conducted (Figure 3.18).
Figure 3.18: Active fracture network from tomographic imaging (A) and associated permeability values (B) for post-
injection modeling.
For this model, both CO2 and the SF6 tracer injection were modeled together using the
Langmuir constants (volume and pressure) calculated from the isotherms as an input to simulate
the tracer plume migration for different layers. Based on the field and lab results, SF6 reached M-
1 and DD-8A after 6 and 18 days, respectively. Snapshots taken of the model after 1 hour, 6 days,
10 days, and 18 days show the same results (Figure 3.19). The injection of CO2 into DD-7A cause
a buildup of SF6 concentration at M-1 and cause the SF6 plume to radiate outwards from DD-8.
Using the adsorption characteristics of the injected gases, the well perforations, and the fracture
network as inputs significantly increased the accuracy of the model. Creating a model with a
smaller area allowed for parameters to be changed easily and reduced computational time and
energy. More details on the post-injection reservoir model can be found in [13],[14].

63
Figure 3.19: SF6 plume migration for four coal layers 1 hour, 6 days, 10 days, and 18 days after tracer injection.
3.5 – CONCLUSIONS
A total of 13,263 tons of CO2 were injected into three vertical coalbed methane wells over
two distinct injection phases. Phase I was conducted from July 2, 2015 to April 15, 2016 when a
total of 10,601 tons of CO2 were injected. Phase II was conducted from December 14, 2016 to
January 30, 2017 when an additional 2,662 tons of CO2 were injected. During both phases, all
three wells behaved similarly with respect to pressure, temperature, and cumulative volume of CO2
injected. After both injection phases, pressures decreased and leveled off at approximately 100
psi. This pressure fall-off suggests that injectivity for the reservoir was restored during both of the
soaking phases.
The pre-injection reservoir model that was created to predict the extents of the CO2 plume
was refined and additional inputs such as completion information, gas composition, and fracture
network. Adsorption tests were conducted for SF6 on crushed coal samples and the resulting

64
isotherms were also used as an input parameter for the model. A literature review concluded that
this is the first known test for SF6 adsorption on coals. The resulting model showed significant
breakthrough of SF6 at M-1 after 6 days, confirming field results. This model shows the SF6 plume
moving as a ring outward from the DD-8 injection well. This plume appears to have a confining
barrier to the Southwest in the Seaboard (20) and Pocahontas 9 coal seams, but not the Pocahontas
11 and Pocahontas 5 coal seam. The completion report for DD-7A shows the completion of the
entire Seaboard (20) and Pocahontas 9 coal seams, but only partial completion of the Pocahontas
11 (Pocahontas 11 (30)) and Pocahontas 5 (Pocahontas 5 (30)). This barrier confirms the influence
of injected CO2 from the other two injection wells on the direction of SF6 breakthrough at offset
wells.
The three injection wells were flowed back into normal production on January 9, 2018. On
December 7, 2018, 11 months after flowback, approximately 1,740 tons of CO2 had been flowed
back out of the wells. This represents approximately 13% of the injected CO2 volume. By
comparison, the 2009 Russell County injection test reached 15% flowback after 10 months. DD-
7, DD-7A, and DD-8 have retained approximately 81.5, 87.9, and 90.9% of their injected volume
of CO2, respectively.
ACKNOWLEDGEMENTS
Financial assistance for this work was provided by the U.S. Department of Energy through
the National Energy Technology Laboratory’s program under contract no. DE-FE0006827.
REFERENCES
[1] S. Harpalani, B.K. Prusty, and P. Dutta, "Methane/CO2 sorption modeling for coalbed methane production and CO2 sequestration," Energy Fuels, vol. 20, no. 4, pp. 1591-1599, 2006.

65
[2] A.Y. Oudinot, G.J. Koperna, Z.G. Philip, N. Liu, J.E. Heath, A. Wells, G.B. Young, and T. Wilson, "CO2 injection performance in the Fruitland Coal Fairway, San Juan Basin: results of a field pilot," SPE, vol. 16, no. 4, pp. 864-879, 2011.
[3] J. Locke and R. Winchel, "CO2 sequestration in unmineable coal with enhanced coal bed methane recovery," in DOE-NETL Carbon Storage R&D Project Review, Pittsburgh, PA , 2012.
[4] J.C. Pashin, P.E. Clark, M.R. McIntyre-Redden, R.E. Carroll, R.A. Esposito, A.Y. Oudinot, and G.J. Koperna, "SECARB CO2 injection test in mature coalbed methane reservoirs of the Black Warrior Basin, Blue Creek Field, Alabama," International Journal of Coal Geology, Vols. 144-145, pp. 71-87, 2015.
[5] N.S. Ripepi, “Carbon dioxide storage in coal seams with enhanced coal bed methane recovery geologic evaluation, capacity assessment and field validation of the Central Appalachian Basin,” Ph.D. dissertation, Department of Mining and Minerals Engineering, Virginia Polytechnic Institute and State University, Blacksburg, VA, 2009.
[6] U.S. Energy Information Administration, “U.S. coalbed methane: past, present, and future,” available: https://www.eia.gov/oil_gas/rpd/cbmusa2.pdf
[7] U.S. Energy Information Administration, “U.S. Coalbed Methane,” available: https://www.eia.gov/oil_gas/rpd/cbmusa1.pdf
[8] E.S. Gilliland, “Integrative geophysical and environmental monitoring of a CO2 sequestration and enhanced coalbed methane recovery test in Central Appalachia,” Ph.D. dissertation, Ph.D. dissertation, Department of Mining and Minerals Engineering, Virginia Polytechnic Institute and State University, Blacksburg, VA, 2017.
[9] E.S. Gilliland, N. Ripepi, M. Conrad, M.J. Miller, and M. Karmis, “Selection of monitoring techniques for a carbon storage and enhanced coalbed methane recovery pilot test in the Central Appalachian Basin,” International Journal of Coal Geology, vol. 118, no.1, pp.105-112, 2013.
[10] Virginia Center for Coal ad Energy Research, “Characterization and field validation of the carbon sequestration potential of coal seams in the Central Appalachian Basin: Final technical report,” Blacksburg, VA, 2011.
[11] F. Vasilikou, “Modeling CO2 sequestration and enhanced gas recovery in complex unconventional reservoirs,” Ph.D. dissertation, Department of Mining and Minerals Engineering, Virginia Polytechnic Institute and State University, Blacksburg, VA, 2013.
[12] C. Keles, N. Ripepi, C. Schlosser, A.K. Louk, E. Gilliland, J. Amante, and M. Karmis, “Sensitivity analysis for optimizing carbon dioxide injection to improve enhanced coalbed

66
methane recovery and carbon dioxide storage capacity,” SME Annual Conference and Exhibition, Phoenix, AZ, 2016.
[13] C. Keles, A.K. Louk, and N. Ripepi, “Modeling of CO2 and tracer injection in deep unmineable coal seams,” SME Annual Conference and Exhibition, Denver, CO, 2017.
[14] M. Karmis, N. Ripepi, E. Gilliland, A.K. Louk, X. Tang, C. Keles, C. Schlosser, E. Diminick, M. McClure, J. Hill, and B. Hill, “Central Appalachian basin unconventional (coal/organic shale) reservoir small scale CO2 injection test,” [Online] doi: 10.2172/1439921, 2018.

67
CHAPTER 4 – DELINEATING CO2 PLUME MIGRATION IN A STACKED COALBED METHANE RERVOIR USING MULTIPLE WELLBORE-SCALE TESTS A. Kyle Louk 1, 2, Nino Ripepi 2, Ellen Gilliland 2, Xu Tang 1, Grant Myers 3, Ed Diminick 4, Mike McClure 4, Michael Karmis 1, 2 1 Virginia Center for Coal and Energy Research, Blacksburg, Virginia, USA 2 Virginia Tech Department of Mining and Minerals Engineering, Blacksburg, Virginia, USA 3 WellDog, Laramie, Wyoming, USA 4 Marshall Miller & Associates Inc., Bluefield, Virginia, USA ABSTRACT
A small-scale carbon dioxide (CO2) injection test was designed to store up to 20,000 tons
of CO2 to demonstrate the storage and enhanced coalbed methane (ECBM) recovery potential in
a stacked coal reservoir in Southwest Virginia. Phase I of the injection test was conducted from
July 2, 2015, to April 15, 2016, when a total of 10,601 tons of CO2 were injected into three coalbed
methane wells. As part of the monitoring, verification, and accounting (MVA) plan for the project,
a tracer gas, sulfur hexafluoride (SF6), was introduced with the CO2 in one of the injection wells
to help track CO2 plume migration. Shortly after the beginning of Phase I injection operations,
both CO2 and SF6 were detected at a nearby production well. To delineate which coal seams the
CO2 was migrating through, four unique, wellbore-scale tests were performed; a downhole video
camera, a well kill test, a downhole injection logging test, and a downhole Raman spectrometer
test. This paper will give an overview of the CO2 injection test, as well as a description of each
test performed, including the methodology and results.

68
4.1 – INTRODUCTION
During the past decade, carbon capture, utilization, and storage (CCUS) has gained
considerable recognition as a viable option to mitigate CO2 emissions. This process involves
capturing CO2 at emission sources such as power plants, refineries, and processing plants, and
securely and permanently storing it in underground geologic formations. The United States
Department of Energy (DOE) has created a Carbon Storage Program, whose aim is to develop and
advance CCUS technologies to make them more cost effective for widespread commercial
deployment [1].
In 2003, as part of the Carbon Storage program, seven Regional Carbon Sequestration
Partnerships (RCSPs) were created to research and determine the best technologies to store CO2
for their specific regions [2]. As a result of these partnerships, many injection tests have been
conducted to assess the storage potential of CO2 in saline formations, oil and natural gas reservoirs,
organic rich shales, and unmineable coal seams. Large-scale CO2 injection projects for storage in
saline aquifers include the Kevin Dome Project in Montana, the Citronelle Project in Alabama,
and the Illinois Basin-Decatur Project in Illinois [3]-[5]. Additionally, injection projects for CO2-
enhanced oil recovery (EOR) include the Bell Creek Field Project in Montana, the Michigan Basin
Project in Michigan, the Cranfield Project in Mississippi, and the Farnsworth Unit Project in Texas
[6]-[9].
Unmineable coal seams are also an attractive reservoir for CO2 storage due to coal’s
microporous structure and ability to adsorb CO2 in large capacities. The DOE has estimated a total
of 54 to 113 billion metric tons of CO2 could be stored in unmineable coal seams [10]. Coal also
provides an additional benefit in that, when introduced to CO2, it will preferentially adsorb CO2
over the naturally occurring methane (CH4) at a ratio of 2:1 or higher [11]-[14]. Injecting CO2 into

69
unmineable coal seams can enhance coalbed methane (ECBM) recovery which could help offset
the cost of CO2 storage. Injection projects to test the CO2 storage and ECBM recovery potential of
coal seams include the Pump Canyon Project in the San Juan Basin, New Mexico, CONSOL
Energy’s CO2 injection test in Marshall County, West Virginia, SECARB’s CO2 injection test in
the Black Warrior Basin, Alabama, and Virginia Tech’s CO2 injection test in Russell County,
Virginia [15]-[18]. In 2015, an award was granted to Virginia Tech and the Virginia Center for
Coal and Energy Research (VCCER) by the U.S. Department of Energy through the National
Energy Technology Laboratory to conduct a small-scale CO2 injection test in Buchanan County,
Virginia. The following section will describe this CO2 injection test and provide initial Phase I
results.
4.2 – CO2 INJECTION TEST IN BUCHANAN COUNTY, VIRGINIA: PHASE I
4.2.1 – Overview
Up to 20,000 tons of CO2 will be injected into three coalbed methane wells to test the
injectivity, storage, and ECBM recovery potential of CO2 in a stacked coal reservoir. The test site
is located in Buchanan County, Virginia, approximately 7.5 miles from the aforementioned 2009
Russell County CO2 injection site (Figure 4.1). The injection site is located within the Oakwood
coalbed methane field, one of the largest fields in Central Appalachia. The Oakwood CBM field
spans portions of Buchanan, Russell, and Tazewell Counties. Gas production in the Oakwood
CBM field began in the early 1990s primarily by CNX Gas Company and Equitable Gas Company.
Initial drilling began on 80-acre units with infill wells being drilled in the early- to mid-2000s [19].
The majority of wells in this area are vertically drilled and cased and are typically perforated and
hydraulically fractured in several zones using nitrogen foam and sand proppant. Each zone can
contain anywhere from 2 to 10 coals.

70
Figure 4.1: Map of CO2 injection study area. The grey shaded area is an active underground coal mine.
4.2.2 – Geologic Characterization
The Oakwood CBM field is located within the Cumberland Overthrust Block, a large, well-
defined northeast-southwest trending geologic feature that covers parts of Tennessee, Kentucky,
West Virginia, and Virginia. Development of the block involved differential movement of up to
seven miles along the Pine Mountain thrust fault, an extensive plane-derived fault, which resulted
in complex internal structures characterized by the presence of thrust, strike-slip, and normal
faults, as well as anticlinal and synclinal features [20]. The study area is located on the northeastern
edge of the block and is defined to the south by the Russell Fork and Boissevain faults. The CO2
injection site is positioned between the Hurricane Creek Anticline and Syncline.
Site-specific geologic cross sections were developed for the study area (Appendix A).
Information garnered from these cross sections includes the identification of lithological features
within the CBM-producing intervals such as individual coal seams, confining units, and regional
seals. Also important is individual well-specific information such as drilling and completion dates,

71
perforated and completed coal seams, total depth of wells, and geophysical logs performed
including gamma, density, and/or caliper.
The coal reservoir in the study area consist of 15 to 25 individual, stacked coal seams from
the Pennsylvanian-aged Pocahontas and Lee formations. The average coal thickness in the study
area is 1.0 ft. and the coal seams are distributed from a depth of 1,000 ft. to over 2,000 ft.
Significant coal seams in the area include the Seaboard, Horsepen and Pocahontas 1-11 coal seams.
Interbeds consists of low permeability sandstones and shales. One key geologic feature in the study
area is the Basal Lee Sandstone. The Basal Lee Sandstone is a well-cemented, low permeability
sandstone that divides the deeper Pocahontas coal seams from the shallower Pocahontas,
Horsepen, and Seaboard coal seams. The Basal Lee sandstone is approximately 200 ft. thick in the
study area and acts as a confining unit between the deep and shallow injection target coal seams.
Another key feature in the study area are three low permeability shales, including the Hensley
Shale, that overlie the shallowest coal seams in the area. The Hensley shale has been identified as
an effective regional seal due to its low permeability (0.001 to 0.1 md), its thickness (30 ft.), and
its lateral continuity throughout the entire study area [21]. A generalized stratigraphic column for
the study area is shown in Figure 4.2.

72
Figure 4.2: Generalized stratigraphic column for the Oakwood CBM field.
4.2.3 – Monitoring Verification and Accounting (MVA) Plan
A map of the injection site is shown in Figure 4.4. The three wells selected for CO2
injection, DD-7, DD-7A, and DD-8, are indicated with yellow symbols. DD-7 and DD-8 were both
drilled as initial wells in 2000 and 2001, respectively. DD-7A was drilled as an infill well on the
DD-7 unit in 2007. These three wells were taken offline and converted for CO2 injection
operations. The production tubing was taken out of each injection well and a bridge plug was
inserted at the bottom of the well to create an open-hole injection of the CO2. A packer was set
just above the first perforation to ensure injection of CO2 into the target formations.
A customized monitoring, verification, and accounting (MVA) program was created for
this injection test to monitor atmospheric, near-surface, and subsurface changes that may occur
during CO2 injection operations [22]. The white (shaded), ¼-mile overlapping boundary is where
monitoring efforts were concentrated. This boundary was based on a preliminary model that

73
simulated the extents of the CO2 plume for the total target injection volume for the test. The blue,
½-mile boundary, which was extended beyond the white boundary, defines the overall project site
where all monitoring activities will occur.
Three monitoring wells, M-1, M-2, and C-1, indicated with orange symbols, were drilled
prior to CO2 injection. Gas samples were collected routinely at these wells and analyzed for
composition. These wells were also outfitted with surface and downhole temperature and pressure
gauges, which were set up to record continuously. Gas samples were also routinely collected and
analyzed at offset production wells within the MVA boundary, denoted by blue symbols, to detect
any changes in gas composition over time and gas flow rates and pressures were recorded to
monitor for any changes during CO2 injection operations. More details on the sampling program
can be found in [23].
Figure 4.3: Map of CO2 injection test site. Injection wells are denoted by a yellow symbol. Offset monitoring wells
are denoted by an orange symbol. Offset production wells located inside of the monitoring boundary that were sampled are denoted by a blue symbol. Offset production wells located outside of the monitoring boundary that were
not sampled are denoted by a grey symbol.

74
4.2.4 – Phase I Results
Phase I of the CO2 injection test was conducted from July 2, 2015, to April 15, 2016, when
a total of 10,601 tons of CO2 were injected. As part of the MVA plan, multiple fluorinated tracers
were added with the CO2 stream at different times in each injection well to help determine interwell
connectivity and migration pathways within the coal reservoir [24]. On July 17, 2015, 15 days
after the start of CO2 injection, sulfur hexafluoride (SF6), was injected with the CO2 stream at the
DD-8 injection well.
On August 4, 18 days after tracer injection, SF6 was detected at the nearest offset
production well, DD-8A. Analysis of comingled gas composition at the surface of the DD-8A
showed subsequent breakthrough of CO2 approximately four months after the start of CO2
injection (Figure 4.4). Baseline CO2 concentrations taken up to 20 months prior to CO2 injection
at this offset well were less than 1.0%. On, November 10, 2015, CO2 concentrations showed the
first significant increase above 1.0% and steadily increased until the end of Phase I injection. On
April 12, 2016, the concentration of CO2 at DD-8A was measured at its peak of 12.9%.
Figure 4.4: CH4 (grey), CO2
(blue), and N2 (gold) gas composition of the DD-8A offset production well for Phase I (purple) of the CO2 injection test.
0
5
10
15
20
25
65
70
75
80
85
90
95
100
Perc
ent C
O2,
N2
Perc
ent C
H4
CH4 CO2 N2
CO2 Injection Phase I

75
Analysis of gas composition and tracer samples taken at the offset wells were successful
in detecting the breakthrough of the CO2 and SF6, but because the samples taken were comingled
gas at the surface, it was not able to be determined which coal seams or perforation zones the CO2
was migrating through. The tests described in the following sections were performed to understand
the connectivity between DD-8 and DD-8A and to delineate the CO2 plume migration by coal
seams or zones.
4.3 – DOWNHOLE VIDEO CAMERA
4.3.1 – Background
A downhole video camera was utilized in the injection wells as a qualitative method to
determine the condition of the perforations created when the well was initially drilled and
completed. It was important to assess whether the perforations were open or closed to determine
which coal seams had successfully been completed and could potentially accept the injected CO2.
4.3.2 – Methodology
The downhole video camera test was performed while the wells were being converted for
CO2 injection. Each well had 2-3/8” tubing installed with a downhole pump and sucker rod to
remove water. The pumps and rods were removed and the wells were swabbed to remove any
additional water. Once as much water as possible was removed via swabbing, the tubing was pulled
out of the well and the camera was then lowered down to the bottom of the well and raised to
inspect the perforations on the side wall of the casing. Perforations were determined to be open or
closed based on visual inspection of the video log. Open perforations were indicated by a hole in
the casing roughly 0.5” in diameter. The hole was also smooth and rounded along its edge, likely
due to abrasion from the sand proppant entering the perforation. In many of the perforations

76
deemed open, sand could also be observed indicating that individual perforation had accepted the
completion treatment.
4.3.3 – Results
Table 4.1 displays the number of open perforations viewed vs. total perforations for each
coal seam (and bench) based on visual inspection. In total, of the perforations that could be viewed,
64 of 70 were determined to be open.
Table 4.1: Assessment of DD-8 perforations from downhole camera.
Coal Seam Depth (ft.)
No. of Open Perfs
Viewed
No. of Perfs
Viewed
No. of Perfs Viewed/Total
Perfs* Seaboard (20) 871 7 7
36/64
L. Seaboard (20) 912 4 4 U. Horsepen (10) 984 4 4 U. Horsepen (20) 1031 5 6 Middle Horsepen 1068 6 6
Pocahontas 11 1165 4 5 Pocahontas 10 (10) 1198 4 4 Pocahontas 9 (10) 1311 2 4
34/56
Unknown Coal 1397 5 5 Pocahontas 7 (10) 1422 3 4 Pocahontas 5 (10) 1591 4 5 Pocahontas 4 (10) 1637 8 8 Pocahontas 4 (20) 1677 8 8
Pocahontas 3 (10, 20) 1711 Unable to view
0/32 Pocahontas 3 (30) 1721 Unable to view
Pocahontas 3 (40, 50) 1731 Unable to view Pocahontas 2 1746 Unable to view Pocahontas 1 1802 Unable to view
* from drilling and completion report
Using the downhole camera log in DD-8 and the drilling and completion reports in DD-8
and DD-8A, perforated and completed coal seams were determined in each well. It is important to
note that the perforations in the bottommost completion zone in DD-8 (Pocahontas 3 (10, 20) down
to Pocahontas 1 coal seams) could not be viewed due to water build up in the well. Although visual
confirmation was not achieved, it is assumed that all of the coals listed on the completion report
were successfully completed. Likewise, although a downhole camera was not used in DD-8A, it
is assumed that all of the coals listed as completed in the report were successfully completed. Coal
seams that were successfully perforated and completed in both wells have the potential to provide

77
favorable connectivity over coal seams that were not. Figure 4.5 shows the coal seams present in
each well, and which coal seams were successfully completed in each well. There are 23 coal
seams present in the DD-8 injection well, 20 of which were perforated and completed. There are
only 16 coal seams present in DD-8A, 10 of which were perforated and completed. Of the 10
completed coals in DD-8A, all 10 were also perforated and completed in DD-8 suggesting
favorable connectivity.
Figure 4.5: DD-8 and DD-8A interwell connectivity. Completed coals seams denoted by asterisk (red).
Pocahontas 5 (20)
*
Hensley Shale
Seaboard (20)
*
Pocahontas 5 (10)
*
*
*
*
*
*
*
Upper Horsepen (10)
Lower Seaboard (10)
*
DD-8A
7" Casing to 223'
4 1/2" Casing to 1822'
*Not to Scale
DD-8
Pocahontas 4 (20)
Pocahontas 3 (10,20)
Pocahontas 3 (30)
*
*Pocahontas 3 (40,50)
12 3/4" Casing to 21'
Total Well Depth 1868'
Basal Lee Sandstone
Unknown Coal
Pocahontas 9 (10)
Pocahontas 9 (20)
Pocahontas 7 (10)
Pocahontas 10 (10)
Pocahontas 10 (20)
Lower Seaboard (20)
* Upper Horsepen (20)
Packer @ 771'
Pocahontas 7 (20)
12 3/4" Casing to 20'
7" Casing to 309'
4 1/2" Casing to 1634'
Total Well Depth 1880'
Unknown Coal
*
*
*
*
*
*
Hensley Shale
Unkown Coal
Middle Horsepen (10)
Pocahontas 11
Hensley Shale
Bridge plug @ 1806'
*
*
*
*
*
*
*
*
*
*
*
Pocahontas 2
Pocahontas 1

78
4.4 – WELL KILL TEST
4.4.1 – Background
Most coalbeds are naturally saturated with water [25],[26]. The presence of water
significantly hinders gas transport through coal seams and contributes to pressure in coal seams
that keeps methane adsorbed on coal surfaces [27],[28]. Water exists in coal seams in different
states including bulk water in coal cleats and fractures, chemical-bonded water in clay minerals,
and adsorbed water on coal surfaces within the coal matrix [29]. Because hydrocarbons are poorly
soluble in water, cleats and fractures filled with water are poor transport pathways. For water-
saturated coal seams, the removal of bulk water in cleats and fractures will create more flow
pathways and improve gas flow by increasing relative permeability [30]. Therefore, coalbed
methane production relies heavily on the dewatering of the coal seams to lower the water pressure
head below the gas desorption pressure of the reservoir. Over time, the production of CBM can
increase as the coal seams become more dewatered.
The goal of this specific test is to inject a volume of water on the annulus of the DD-8A
well, covering individual coal seams or known perforation zones at different intervals. By injecting
water at multiple intervals in the wellbore, gas production from coal seams that are below the water
level will be terminated due to the increased hydraulic pressure created by the water column, which
will be higher than the low desorption pressures typically found in coal seams [31].
4.4.2 – Methodology
The well kill test was conducted on December 16, 2015 approximately five months after
CO2 injection operations began. At this point in the project, a total of 5,804 tons of CO2 had been
injected into the three-injection wells. A total of 1,960 tons of CO2 had been injected into DD-8 at

79
an average rate of 16.2 tons/day. The CO2 concentration at the DD-8A well was approximately
2.5%.
The test is designed to inject water directly on the annulus of the DD-8A well. At each
water injection level, flow rates will be measured and gas samples will be collected and analyzed
for composition. This general process is illustrated in Figure 4.6 below. In step 1, the depth of the
water, d1, is measured and the gas flowrate, Q1, and comingled gas composition, c1, for this interval
is contributed from coal seams A, B, and C. In step 2, a volume of water is injected and the depth
of the water, d2, is measured. The gas flowrate, Q2, and comingled gas composition, c2, for this
interval and contributed from coal seams A and B. In step 3, more water is injected and the depth
of the water, d3, is measured. The gas flowrate, Q3, and gas composition, c3, for this interval is
contributed from only coal seam A. Finally, in step 4, water is injected to cover up all coal seams.
At this step, the gas flowrate, Q4, is expected to equal zero.
Figure 4.6: Water injection test to determine gas production from individual coal seams.
c₁
1 2 3 4
B B
C C
Q₁ Q₂ Q₃ Q₄ = 0c₂ c₃
*Not to scale
d₄
A
B
C
B
C
A A A
d₂ d₃d₁

80
To determine the downhole liquid level in the wellbore after each water injection, an
Echometer Remote Fire Gas Gun coupled with the Total Well Management (TWM) software was
used. The Echometer gun generates a pressure pulse that travels down the annulus of the wellbore
and reflects off each individual collar and the liquid level. The reflected pulse is picked up by a
microphone located in the gun and transmitted via electric signal to the TWM software. The
software then counts the number of collar reflections detected, and with the input of known collar
lengths, can calculate the depth of the liquid level.
4.4.3 – Results
A total of eight water injections were performed for this test. Figure 4.7 below shows a
generalized schematic of the DD-8A well, including the depth of each water injection level (blue
lines) with respect to the location of each coal seam and geologic feature found in the well. Six
zones, Z1-Z6, were created by the injected water, some of which contain multiple perforated coal
seams. It is important to note that the water injections with measurements at 1,341 ft. and 963 ft.
did not cover any additional perforated coals from the level below. For these water levels, the gas
flow rate did not change, as there was no change in perforated coal seams contributing to those
zones. Therefore, data from these water levels were not considered in the analysis of this test.

81
Figure 4.7: Echometer results from the DD-8A water injection test.
To determine individual flow rates for each zone, flow rates were measured at the surface
for each water interval. These surface measurements are comingled, meaning as gas flows from
each zone, it mixes with the gas from the zones above. As each water interval was added the
production from the submerged zone is terminated, assuming the hydrostatic head exceeds the
desorption pressure of gases in the submerged seams. Therefore, the measured total rate of gas
exiting the well decreases by the rate of the submerged zones. This relationship is represented in
1,880'
*
Unknown Coal
Pocahontas 9 (10)
Pocahontas 9 (20)
Pocahontas 7 (10)
Pocahontas 2
Basal Lee Sandstone
Pocahontas 5 (10)
Pocahontas 3 (10,20)
Pocahontas 3 (40,50)
Upper Horsepen (10)
Upper Horsepen (20)
Pocahontas 11
Pocahontas 10 (10)
Pocahontas 10 (20)
DD-8A
12 3/4" Casing to 20'
7" Casing to 309'
4 1/2" Casing to 1634'
Z2
Z1
*
*
*
*
*
*1,133'
1,012'963'
1,341'
1,559'
1,267'
*
*Not to Scale
Z5
Z4
Z3
744'
Z6658'
Lower Seaboard (20)
Lower Seaboard (10)
*
Total Well Depth 1880'
Hensley Shale
Hensley Shale
Hensley Shale
Seaboard (20) *

82
the equations below with zones n=1 to N, where n=1 is the deepest zone and n=N is the shallowest
zone, and individual flow rates given by rn and total flow rate measures at the surface given by Qn:
𝑄𝑄𝑛𝑛 = �𝑟𝑟𝑖𝑖
𝑁𝑁
𝑖𝑖=𝑛𝑛
Thus, the first flow rate measurement of the test, where none of the zones have been
submerged, Q1 is the sum of the individual flow rates of all N zones:
𝑄𝑄1 = �𝑟𝑟𝑖𝑖
𝑁𝑁
𝑖𝑖=1
= 𝑟𝑟1 + 𝑟𝑟2+. . . +𝑟𝑟𝑁𝑁
Similarly, the final flow rate measurement of the test, where production from all but the
shallowest zone has been stopped, QN, is simply the flow rate of the shallowest zone:
𝑄𝑄𝑁𝑁 = �𝑟𝑟𝑖𝑖 =𝑁𝑁
𝑖𝑖=𝑁𝑁
𝑟𝑟𝑁𝑁
It can be shown that the individual flow rate of the nth zone for n<N is given by:
𝑟𝑟𝑛𝑛 = 𝑄𝑄𝑛𝑛 − 𝑄𝑄𝑛𝑛+1
Where:
𝑟𝑟𝑛𝑛 = �𝑟𝑟𝑖𝑖 − � 𝑟𝑟𝑖𝑖
𝑁𝑁
𝑖𝑖=𝑛𝑛+1
𝑁𝑁
𝑖𝑖=𝑛𝑛
= (𝑟𝑟𝑛𝑛 + 𝑟𝑟𝑛𝑛+1 + 𝑟𝑟𝑛𝑛+2+. . . +𝑟𝑟𝑁𝑁) − (𝑟𝑟𝑛𝑛+1 + 𝑟𝑟𝑛𝑛+2+. . . +𝑟𝑟𝑁𝑁) = 𝑟𝑟𝑛𝑛
Figure 4.8a displays the raw data for the total comingled flow rates measured at the surface
for each water level. Using this raw data and the above calculations, it was determined that Zone
6, which contains gas solely produced from the Seaboard (20) coal seam, and Zone 1, which
contains gas produced solely from the Pocahontas 3 coal seam, have the highest individual gas
production (Figure 4.8b). In order to compare gas production per zone, each zone was normalized
by the thickness of completed coal for each zone (Figure 4.8c). While Zone 6 contained the highest

83
rate of gas produced, it also contained the least amount of coal. Gas production per unit of coal
thickness (Figure 4.8d) shows that Zone 6 has the highest gas production per foot of coal thickness.
Figure 4.8: a) total comingled gas production. b) gas production by zone. c) coal thickness by zone. d) gas
production per foot of coal thickness by zone.
For each water injection level, comingled gas samples were taken at the surface and
analyzed for composition. Samples were collected in high pressure rated stainless steel gas
cylinders. Samples were analyzed using an ABB NGC8206 natural gas chromatograph. Based on
the results, methane dominates the content of the gas at each water level (Figure 4.9a). By
considering the smaller components of the gas stream (Figure 4.9b), it was determined that CO2
compositions increased after each water injection. The CO2 concentration was the highest (6.9%)
at the 744 ft. water level. This trend suggests that the majority of CO2 is being produced from the
shallowest zone and that the concentration is being diluted by comingled gas from the zones below.
0 10 20 30 40 50 60
1880'1341'1267'1133'963'744'
Comingled Production at each Water Level (MCF/d)
a)
0.0 5.0 10.0 15.0 20.0 25.0
Z1Z2Z3Z4Z5Z6
Production for each Zone (MCF/d)
b)
0.0 0.5 1.0 1.5 2.0 2.5
Z1Z2Z3Z4Z5Z6
Coal Thickness for each Zone (ft)
c)
0.0 10.0 20.0 30.0 40.0
Z1Z2Z3Z4Z5Z6
Production per Foot of Coal for each Zone (MCF/d-ft)
d)

84
Figure 4.9: a) Comingled gas composition at each water injection level. b) CO2 composition at each water injection
level.
The comingled gas samples taken at the surface for each water level were also analyzed
for tracer composition. The samples were analyzed on a Shimadzu QP2010 gas chromatograph
with a negative-ion chemical ionization mass spectrometer (GC-NICI-MS). The resulting peak
areas are counted (Table 4.2) and a calibration curve with known concentrations is created. The
resulting peak areas are fit to the calibration curve to determine concentration (Figure 4.10).
Similar to the CO2 composition trend, SF6 concentrations increased after each water injection
(Figure 4.11). The highest concentration of SF6 was measured at the 744 ft. water level, which is
solely attributed to the Seaboard (20) coal seam. This trend again suggests that a majority of the
tracer being produced by the shallowest zone and that the tracer concentration is being diluted by
comingled gas from zones below.
0% 25% 50% 75% 100%
1880'
1341'
1267'
1133'
963'
744'
a)
Ethane
CO2
Methane
0.0% 2.0% 4.0% 6.0% 8.0%
1880'
1341'
1267'
1133'
963'
744'
b)
Ethane
CO2
Methane

85
Table 4.2: NICI analysis results. Water Level
Peak Area Avg %RSD
744' 142380
141677 0.67 142050 140601
963' 56961
55310.3 4.62 55885 53085
1133' 36292
36024 0.68 35813 35967
1267' 22939
22306.3 2.79 22283 21697
1341' 22756
21618.7 4.56 21016 21084
1880' 16626
17290 4.35 17690 17554
Figure 4.10: SF6 calibration curve.
Figure 4.11: SF6 concentration at each water injection level.
y = 123.18x + 9036.5R² = 0.9961
020000400006000080000
100000120000140000160000180000
0 200 400 600 800 1000 1200
Peak
Are
a
Concentration (pptv)
0 200 400 600 800 1000 12001880'
1341'
1267'
1133'
963'
744'
Concentration (pptv)

86
4.5 – DOWNHOLE INJECTION LOGGING
4.5.1 – Background
A continuous spinner survey is a common method used to determine fluid-flow profiles in
natural gas wells. The spinner tool consists of rotating elements that, when placed in a flowing gas
stream, will rotate at a rate proportional to the velocity of the gas stream. The spinner tool is
moved up and down the well at a constant rate to provide a continuous flow profile of the entire
well. Any change in gas flow will cause a change in rotation rate, which is recorded versus the
depth of the tool. Spinner tools are often deployed on a wireline and are usually accompanied with
other production logging tools.
4.5.2 – Methodology
On March 23, 2016, approximately eight months after CO2 injection operations began and
four months after the breakthrough of CO2 was observed in the offset production well DD-8A,
Weatherford Wireline Services conducted and logging test on the injection wells to determine the
injection zones for the CO2. The logging tool string consisted of a full-bore spinner tool, a gamma
ray density tool, a casing collar locator, a temperature gauge, a pressure gauge, and a radioactive
density tool.
At the time of logging, approximately 3,385 tons of CO2 had been injected in the DD-8
well. Two round trip logging passes from 820 ft. to 1,806 ft. were conducted at different logging
speeds, 100 and 150 ft. per minute (fpm). A calibration pass from 1,205 ft. to 1,311 and back was
conducted at 50 fpm. All passes were run while CO2 was being injected. The average CO2 injection
rate during logging was 61 tons/day.

87
4.5.3 – Results
A Weatherford engineer prepared the report by filtering and analyzing the flow meter data
to compute the injection profile, to determine the injection zones, and estimate the flow per
injection zone based on the surface flow rate. The down pass at 150 feet per minute (fpm) was
used to estimate the injection profile due to its average consistency in the overall data. The
injection zones were determined by the deflection in the spinner curves. The percent flow to each
zone was calculated by the change in revolutions per second on the spinner as it passed each coal
seam.
The interpretation of the logging suggests that the most active perforations are in the
shallowest interval, which was originally stimulated from 871 ft. to 1,205 ft. Based on these results,
the spinner survey suggests that a majority of the CO2 injection occurred into the Seaboard (20)
coal seam. It is likely that deflections in the spinner curves due to the low rates of flow of injected
gas into deeper seams fall short of the instrument sensitivity limit. The pressure and temperature
recorded at all depths below the tubing indicate the wellbore was filled with supercritical CO2.
More details about the injection logging can be found in Appendix B.
4.6 – DOWNHOLE RAMAN SPECTROMETER
4.6.1 – Background
Raman spectroscopy is a widely used, analytical chemistry technique that uses
monochromatic illumination, usually by an intense laser beam in the ultraviolet-to-visible region,
to illuminate a sample. Interactions between photons and molecules in the sample result in
Rayleigh scattering (elastic) and Raman scattering (inelastic). Inelastic scattering is associated
with a change in the scattered photon energy, which indicates a change in photon frequency (and
thus color). This change in frequency, or Raman shift, with respect to the original frequency of the

88
excitation laser provides information about the vibrational, rotational, and other low frequency
properties of the illuminated sample. These properties provide a unique rovibrational fingerprint
by which the molecules within a sample can be identified, differentiated, and quantified.
Raman spectroscopy is extremely useful not only to identify multiple components in a
chemical mixture, but also to precisely quantify the amount of each component in the mixture. A
major advantage of Raman spectroscopy is that unlike the related infrared-absorption
spectroscopy, it is not overly sensitive to water. This is useful in the natural gas industry to be able
to analyze mixtures containing solubilized gas (hydrocarbon and non-hydrocarbon) and other
liquid hydrocarbons, and especially in coalbed methane reservoirs where the system contains
water.
Laser excitation and sensitive detector requirements for Raman spectroscopy historically
confined application of the technique to a laboratory setting. Recent advances in miniaturization
have enabled compact, portable, and even hand-held systems for field work. A novel, downhole
reservoir Raman system (DRRS) was developed by Welldog Inc. to measure the concentration of
various gases, including natural gas liquids, as well as higher hydrocarbons solubilized or diluted
in fluids extracted from carbonaceous strata including coal seams and shale [32],[33]. The DRRS
incorporates a full spectrum Raman spectrometer and an analog sensor package to measure fluid
conductivity, temperature, and pressure. The instrument package is integrated into a single housing
and is deployed downhole on multi-core wireline to acquire real-time borehole fluid concentration
profiles. Unlike a typical logging tool, the DRRS functions both while moving through the
wellbore as well as when held stationary. Thus, a conventional log of the borehole gas composition
versus depth can be measured, as well as a temporal log of the dynamics of borehole gas
composition while the system is held in place during stationary scanning mode. Data is collected

89
in-situ and communicated to the surface for near-real-time analysis. The DRRS has been
historically used for determining gas saturation and gas content of coal seams. [34]-[36]. This test
represents the first ever application of the DRRS to characterize dry gasses flowing out of
individual coal seams. The goal of the test was to the use the DRRS to identify changes in CH4
and CO2 vs. depth in the three injection wells post-injection to help determine which individual
coal seams or zones the CO2 is migrating through.
4.6.2 – Methodology
The downhole Raman spectrometer test was conducted on November 10-11, 2017 during
the flowback phase of the project, approximately 10 months after being in normal production. Prior
to this test, the packer used to isolate the coal seams was retrieved and consequently, packer fluid
was released and fell to the bridge plug at the bottom of the well. This plug was drilled out and the
wellbore cleaned out using compressed air to remove as much fluid as possible.
The logging program for DD-8 included: an initial run of the DRRS to log the gas
composition, pressure, and temperature for the entire length of the well from surface to the drilled-
out bridge plug just above the rathole; to perform stationary scans above the perforation zones (for
DD-8, three zones consisting of 5-6 coals); and then the instrument was pulled out of hole. Data
collection rate was nominally 2.5 Raman spectra collected per minute continuously from entry in
hole until pulled out of hole. After the entire well was logged, a temporary bridge plug was set to
block production from the bottommost zone. The DRRS was then redeployed to log from surface
to the temporary plug, to perform stationary scans again above the perforation zones, and then
pulled out of hole. This process was repeated two more times, as two more temporary plugs were
placed to block production from underlying coal seams and similar logs were performed. A total
of four runs of the DRRS were performed in DD-8.

90
An important concept to understand borehole composition logs is that gas flows out of
lower active seams and upwards, comingling with gases that flow from active seams above. When
a change in gas composition is recorded as the DRRS is moved past a seam during a logging run,
it can be inferred that the seam is actively producing gases that are different from those flowing
up from below. However, unless that seam is the lowest active seam, it is impossible to tell the
exact composition of gases being produced from that seam because of comingling. It is only
possible to tell if that seam is producing more or less CO2 or CH4 than the aggregate of seams
below. On the other hand, if no change in gas composition is recorded upon moving past a seam,
then there are two possibilities: Either that seam is negligibly active, or it is producing a
composition of gases that are indistinguishable from those flowing upwards from active seams
below. Ideally, the gas composition change when logging past a seam would be combined with a
measurement of the net flow contribution from that individual seam to determine the actual
composition of gases produces from the seam.
4.6.3 – Results
During the initial log of DD-8, the DRRS was lowered to 1,805 feet below surface,
performing stationary scans at 870, 1,160, 1,310, and 1,590 ft. on the way down. The tool was then
raised to perform scans at each station again and then pulled out of the hole. It was determined that
there was a buildup of water over the Pocahontas 4 (20) coal seam at 1,677 ft. There was also a
buildup of “foam” on top of the water column to 1,585 ft., covering the Pocahontas 5 (10) coal
seam at 1591 ft. Due to the water and foam layer obscuring results from the DRRS, the first
temporary bridge plug was set just above these layers at 1,490 ft. The second temporary bridge
plug was set at 1,288 ft. (just above the second perforation zone and the Pocahontas 9 (10) coal
seam). The third temporary bridge plug was set at 1,132 ft. (above the Pocahontas 11 coal seam

91
and below the Middle Horsepen (10) coal seam). Data from all four runs was compiled and general
observations and conclusion are compiled in Table 4.3 below. More details about the downhole
Raman spectrometer test can be found in Appendix C.
Table 4.3: Summary of DD-8 testing with downhole Raman Spectroscopy.
4.7 - CONCLUSIONS
Phase I of a CO2 injection test to demonstrate the storage and ECBM recovery potential in
a stacked coal reservoir was successful in injecting approximately 10,600 tons of CO2 into three
coalbed methane wells. As part of a multiple tracer program to help track CO2 plume migration,
the tracer gas SF6 was added with the CO2 stream at the DD-8 injection well. Shortly after the start
of CO2 injection operations, increased concentrations of both SF6 and CO2 were detected at the
Zone / Depth FT / Thickness FT / Active? / Composition of gases exiting seam: Delta %CO 2
Surface - / 88% CO2: - / After plug @1132Seaboard-20 A / 871 / 1.3 / Yes >CO2 / >UH-20 CO2 : +10%
A / 902 / 0.2 (LS-10) / No or Eq. / - : -A / 912 / 1.6 (LS-20) / Yes >CO2 / >UH-20 CO2 : +7%A / 984 / 1.4 (UH-10) / Yes >CO2 / >UH-20 CO2 : +26%A / 1031 / 0.6 (UH-20) / Yes >CH4 / <79% CO2 : -24%
Unknown A / 1054 / 0.4 / No or Eq. / 79% CO2 : - Middle Horsepen-10 A / 1068 / 0.7 / No or Eq. / 79% CO2 : - Temporary Plug Prior to this plug at 1132, composition at surface was 88% CO2
Pocahontas 11 A / 1165 / 0.8 / No or Eq. / - : - / -A / 1198 / 0.4 (P10-10) / No or Eq. / - : - A / 1204 / 0.8 (P10-20) / No or Eq. / - : -
Temporary Plug Prior to this plug at 1288, composition at surface was 84% CO2
B / 1311 / 1.9 (P9-10) / No or Eq. / - : - B / 1314 / 0.5 (P9-20) / No or Eq. / - : -
Unknown B / 1397 / 0.9 / Yes >CH4 / ~86% CO2 : -2%B / 1422 / 0.6 (P7-10) / Yes >CO2 / >86% CO2: +2% B / 1467 / 0.7 (P7-20) / No or Eq. / 86% CO2 : -
Temporary Plug Prior to this plug at 1490 composition at surface was 87% CO2
Pocahontas 5 B / 1591 / 0.6 (P5-10) / Unknown / - : - / Obscured by foamB / 1637 / 1.6 (P4-10) / Unknown / - : - / Obscured by foamB / 1677 / 0.6 (P4-20 ) / Unknown / - : - / Obscured by waterC / 1711 / 2.4 (P3-10,20) / Unknown / - : - / Obscured by waterC / 1721 / 0.6 (P3-30) / Unknown / - : - / Obscured by waterC / 1731 / 2.0 (P3-40) / Unknown / - : - / Obscured by water
Pocahontas 2 C / 1746 / 0.8 (P3-50) / Unknown / - : - / Obscured by waterPocahontas 1 C / 1802 / 0.8 Unknown / - : - / Obscured by waterSeams below 1806 Bridge plug / 1822 to 1868 / end of casing to TD
Active Seam producing more
CH4 than flowing seams below
Uncertain composition and
activity : No change in
composition on logs past the seam
Uncertain: obscured by water/foam
Active Seam producing more
CO 2 than flowing seams below
Coal Seam Color Code
Division: Surface, plug, etc.
Lower Seaboard
Upper Horsepen
Pocahontas 10
Pocahontas 9
Pocahontas 7
Pocahontas 4
Pocahontas 3

92
closest offset production well, DD-8A. To delineate which coal seams the CO2 was migrating
through, four unique, wellbore-scale tests were performed successfully during different timelines
of the CO2 injection test.
A downhole video camera was used on the three injection wells while they were being
converted for CO2 injection operations. The perforations were visually inspected to assess their
condition and determine which coal seams had been successfully completed. This test confirmed
that over 90% (64/70) of perforations that were viewed in the DD-8 injection well were
successfully completed. It was determined that all 10 perforated and completed coals that are
present in DD-8A, are also present and completed in the DD-8 injection well. Assuming the same
rate of success for perforations in DD-8A as in DD-8, it can be concluded that there is evidence
suggesting favorable connectivity between DD-8 and DD-8A. This connectivity was confirmed
later by the breakthrough of CO2 and SF6 at DD-8A shortly after injection operations began.
Approximately five months after CO2 injection began, a well kill test was conducted on
the DD-8A well. Water was injected on the annulus of the well at multiple intervals to detect
changes in flow rate and gas composition at each interval. Individual flow rates were attributed to
each zone created by the water injection levels and it was determined that the shallowest zone
containing the Seaboard (20) coal seam had the highest rate of gas production. Composition
analysis of the comingled production at each water level also concluded that the Seaboard (20)
coal seam was the largest overall contributor to CO2 composition. Tracer analysis confirmed the
same results that the shallowest zone containing the Seaboard (20) coal seam had the highest
concentrations of SF6. These result was later supported when Weatherford Wireline Services
conducted a continuous spinner survey to determine injection zones for the CO2. Results from this
test for the DD-8 injection well concluded the based on the higher active flow profile, most of the

93
CO2 was injected into the top perforations from 871 ft. to 1,205 ft. It was also observed that within
this profile, there was higher activity from 871 ft. to 1,040 ft. This is from the Seaboard (20) coal
seam down to, and including, the Upper Horsepen (20) coal seam.
Ten months after the end of CO2 injection operations, the DD-8 well was logged using the
DRRS a total of four times downhole over two days in conjunction with the setting of three
temporary bridge plugs to stop flow from underlying seams. Relatively small changes in gas
composition were observed when logging past the Pocahontas 7 (10) (>CO2 than aggregate of
seams below) and the unnamed coal seam just above (>CH4 than aggregate of seams below). Most
other perforations in the well registered insignificant changes in gas composition during logs. The
most dramatic activity in the well was observed from the shallowest coal seams. Activity from
seams above the Upper Horsepen (20) dilute that methane from ~55% down to ~30% (Upper
Horsepen (10)), then 20% (Lower Seaboard (20)) and 13% methane (Seaboard (20)), successively,
with the balance of CO2. It should be noted that this dramatic spike in methane was muted to some
extent by comingling with the production of gases from seams below the Upper Horsepen (20)
prior to the setting of the temporary bridge plug at 1,132 ft. To draw definitive conclusions about
the sequestration of carbon dioxide it would be important to combine the gas composition changes
observed during DRRS logs with measurements of the net flow contributions from individual
seams.
Analyzing the results from the four wellbore-scale tests, in conjunction with the overall
Phase I and II results, the following can be concluded:
1. Breakthrough of SF6 during Phase I, and CO2 during both phases at the nearest offset
production well DD-8A confirm interwell connectivity in stacked coal reservoirs.

94
2. Fluorinated tracers such as SF6 can be used to help monitor CO2 plume migration and even
predict migration pathways within a stacked coal reservoir as CO2 was detected shortly after
the arrival of SF6 at the same offset production well.
3. Multiple intervals of injected water on the annulus of DD-8A was successful in determining
individual flow rates from zones containing multiple perforated coal seams and determining
which zones contributed the highest concentrations of CO2 and SF6.
4. Downhole Raman spectroscopy is a viable option to verify CO2 sequestration in stacked coal
reservoirs by characterizing gas composition from individual coal seams.
5. A majority of the CO2 and SF6 were being injected into, and migrating through, the shallowest
coal seams, predominantly the Seaboard (20) coal seam.
ACKNOWLEDGEMENTS
Financial assistance for this work was provided by the U.S. Department of Energy through
the National Energy Technology Laboratory’s program under contract no. DE-FE0006827.
REFERENCES
All oil and natural gas related terms in this paper can be found in the Schlumberger Oilfield Glossary: https://www.glossary.oilfield.slb.com/
[1] U.S. Department of Energy, "Carbon Storage Technology Program Plan," December 2014. [Online]. Available: https://www.netl.doe.gov/File%20Library/Research/Coal/carbon-storage/Program-Plan-Carbon-Storage.pdf.
[2] J.T. Litynski, S.M. Klara, H.G. McIlvried, and R.D. Srivastava, "The United States Department of Energy's Regional Carbon Sequestration Partnerships program: A collaborative approach to carbon management," Environmental International, vol. 32, pp. 128-144, 2006.
[3] National Energy Technology Laboratory, “Kevin Dome Project,” July 2017. [Online]. Available: https://www.netl.doe.gov/File%20Library/Research/Carbon-Storage/Kevin-Dome-Project.PDF

95
[4] National Energy Technology Laboratory, “Illinois Basin-Decatur Project,” July 2017. [Online]. Available: https://www.netl.doe.gov/File%20Library/Research/Carbon-Storage/Illinois-Basin-Decatur-Project.pdf
[5] National Energy Technology Laboratory, “Citronelle Project,” July 2017. [Online]. Available: https://www.netl.doe.gov/File%20Library/Research/Carbon-Storage/Citronelle-SECARB-Project.PDF
[6] National Energy Technology Laboratory, “Bell Creek Field Project,” July 2017. [Online]. Available:https://www.netl.doe.gov/File%20Library/Research/Carbon-Storage/Bell-Creek-Project.pdf
[7] National Energy Technology Laboratory, “Michigan Basin Project,” July 2016. [Online]. Available: https://www.netl.doe.gov/File%20Library/Research/Carbon-Storage/Michigan-Basin-Project.pdf
[8] National Energy Technology Laboratory, “Cranfield Project,” July 2017. [Online]. Available: https://www.netl.doe.gov/File%20Library/Research/Carbon-Storage/Cranfield-Project.PDF
[9] National Energy Technology Laboratory, “Farnsworth Unit Project,” July 2017. [Online]. Available:https://www.netl.doe.gov/File%20Library/Research/Carbon-Storage/Farnsworth-Unit-Project.pdf
[10] U.S. Department of Energy, “Carbon Storage Atlas (5th Edition)”, August 2015. [Online]. Available:https://www.netl.doe.gov/File%20Library/Research/Coal/carbon-storage/atlasv/ ATLAS-V-2015.pdf
[11] J.Q. Shi and S. Durucan, "CO2 storage in deep unminable coal seams," Oil & Gas Science and Technology, vol. 60, no. 3, pp. 547-558, 2005.
[12] H. Marsh, "Adsorption methods to study microporosity in coals and carbons - a critique," Carbon, vol. 25, no. 1, pp. 49-58, 1987.
[13] S. Harpalani, B.K. Prusty, and P. Dutta, "Methane/CO2 sorption modeling for coalbed methane production and CO2 sequestration," Energy Fuels, vol. 20, no. 4, pp. 1591-1599, 2006.
[14] P. Weniger, W. Kalkreuth, A. Busch, and B.M. Krooss, "High-pressure methane and carbon dioxide sorption on coal and shale samples from the Paraná Basin, Brazil," International Journal of Coal Geology, vol. 84, pp. 190-205, 2010.

96
[15] A.Y. Oudinot, G.J. Koperna, Z.G. Philip, N. Liu, J.E. Heath, A. Wells, G.B. Young, and T. Wilson, "CO2 injection performance in the Fruitland Coal Fairway, San Juan Basin: results of a field pilot," SPE, vol. 16, no. 4, pp. 864-879, 2011.
[16] J. Locke and R. Winchel, "CO2 sequestration in unmineable coal with enhanced coal bed methane recovery," in DOE-NETL Carbon Storage R&D Project Review, Pittsburgh, PA , 2012.
[17] J.C. Pashin, P.E. Clark, M.R. McIntyre-Redden, R.E. Carroll, R.A. Esposito, A.Y. Oudinot, and G.J. Koperna, "SECARB CO2 injection test in mature coalbed methane reservoirs of the Black Warrior Basin, Blue Creek Field, Alabama," International Journal of Coal Geology, Vols. 144-145, pp. 71-87, 2015.
[18] N.S. Ripepi, “Carbon dioxide storage in coal seams with enhanced coal bed methane recovery geologic evaluation, capacity assessment and field validation of the Central Appalachian Basin,” Ph.D. dissertation, Department of Mining and Minerals Engineering, Virginia Polytechnic Institute and State University, Blacksburg, VA, 2009.
[19] J.E. Nolde and D. Spears, "A preliminary assessment of in place coal bed methane resources in the Virginia portion of the central Appalachian Basin," International Journal of Coal Geology, vol. 38, pp. 115-136, 1998.
[20] W.S. Henika, “Internal structure of the coal-bearing portion of the Cumberland Overthrust Block in southwest Virginia and adjoining areas,” Virginia Division of Mineral Resources, vol. 131, pp. 100-120, 1994.
[21] R.P. Grimm, K.A. Eriksson, N.S. Ripepi, C. Eble, and S.F. Greb, “Seal evaluation and confinement screening criteria for beneficial carbon dioxide storage with enhanced coal bed methane recovery in the Pocahontas Basin, Virginia,” International Journal of Coal Geology, Vols. 90-91, pp. 110-125, 2011.
[22] E.S. Gilliland, “Integrative geophysical and environmental monitoring of a CO2 sequestration and enhanced coalbed methane recovery test in Central Appalachia,” Ph.D. dissertation, Department of Mining and Minerals Engineering, Virginia Polytechnic Institute and State University, Blacksburg, VA, 2017.
[23] A.K. Louk, “Monitoring for enhanced gas and liquids recovery from a CO2 ‘huff-and-puff’ injection test in a horizontal Chattanooga Shale well,” M.S. thesis, Department of Mining and Minerals Engineering, Virginia Polytechnic Institute and State University, Blacksburg, VA, 2015.
[24] A.K. Louk, K. Luxbacher, N. Ripepi, E. Gilliland, S. Jeter, and H. McNair, “Development and implementation of fluorinated tracers as a monitoring tool for a CO2 storage – enhanced coalbed methane recovery test,” under review by authors for publication, 2018.

97
[25] M. Zuber, "Production characteristics and reservoir analysis of coal bed methane reservoirs," International Journal of Coal Geology, vol. 38, pp. 27-45, 1998.
[26] L.V. Lehman, M.E. Blauch, and R.M. Lavelle, "Desorption enhancement in fracture-stimulated coalbed methane wells," in SPE Eastern Regional Conference, Pittsburgh, PA, 1998.
[27] B.W. Gash, "Measurement of 'rock properties' in coal for coaled methane production," in 66th Annual Technical Conference and Exhibition of the Society of Petroleum Engineers, Dallas, TX, 1991.
[28] M.A. McCabe, L.M. Robert, M.E. Blauch, J.M. Terracina, and L.V. Lehman, "Investigation of a new fracturing fluid and conductivity enhancement technology on coalbed methane production," in Mid-Continent Operations Symposium, Oklahoma City, OK, 1999.
[29] S. Durucan, M. Ahsan, J.Q. Shi, and A. Korre, “Two phase relative permeability of gas and water in coal for enhanced coalbed methane recovery and CO2 storage,” Energy Procedia, vol. 37, pp.6730-6737, 2014.
[30] D. Chen, J.Q. Shi, S. Durucan, and A. Korre, “Gas and water relative permeability in different coals: Model match and new insights,” International Journal of Coal Geology, vol. 122, pp.37-49, 2014.
[31] N. Ripepi, A.K. Louk, J. Amante, C. Schlosser, X. Tang, and E. Gilliland, “Determining coalbed methane production and composition from individual stacked coal seams in a multi-zone completed gas well,” Energies, vol. 10, pp. 1533-1540, 2017.
[32] J. Pope and J Herries, “In-situ detection and analysis of methane in coal bed methane formations with spectrometers,” U.S. Patent 6 678 050, May 11, 2000
[33] R.A. Lamarre and J. Pope, “Critical-gas-content technology provides coalbed-methane-reservoir data,” Journal of Petroleum Technology, vol. 59, no. 11, pp. 108-113, 2007.
[34] J. Pope, D. Buttry, R Lamarre, B. Noecker, S. MacDonald, B. LaReau, P. Malone, N. VanLieu, D. Perosli, M. Accurso, D. Harak, R. Kutz, S. Luker, and R. Martin, “Downhole geochemical analysis of gas content and critical desorption pressure for carbonaceous reservoirs,” in West Texas Geological Society Fall Symposium, 2005.
[35] E. Koval and J. Pope, “Seeing a reservoirs’ character from solution gas,” World Oil, pp.144-146, November 2006.
[36] J. Pope and Q. Morgan, “A new in-situ method for measuring simultaneously coal seam gas content and permeability,” in 13th Coal Operators’ Conference, University of Wollongong,

98
The Australasian Institute of Mining and Metallurgy & Managers Association of Australia, pp. 284-290, 2014.

99
CHAPTER 5 – CONCLUSIONS
A CO2 injection test in Buchanan County, Virginia was successful in injecting 13,263 tons
of CO2 into multiple coalbed methane (CBM) wells. The objective of this test was to determine
the storage and ECBM recovery potential of CO2 in a stacked coal reservoir in Central Appalachia.
Three CBM wells were taken offline and converted for CO2 injection operations. Phase I of CO2
injection operations began on July 2, 2015 when 10,601 tons of CO2 were injected. Phase I ended
on April 15, 2016 and the three wells were shut in for a soaking period of eight months. Phase II
of CO2 injection operations were conducted from December 14, 2016 to January 30, 2017 when
an additional 2,662 tons of CO2 were injected.
As part of the monitoring, verification, and accounting (MVA) plan, chemical tracers were
used to track the CO2 plume migration and determine flow pathways and interwell connectivity
for the study area. In order to distinguish results from the multiple injection wells over multiple
injection phases, a multi-tracer program was created. For this test, ten fluorinated tracers were
selected: six perfluorocarbon tracers (PFTs), three halocarbon tracers, and sulfur hexafluoride
(SF6). These tracers were successfully injected at four distinct phases throughout the project. Two
unique analytical methods were developed using gas chromatography coupled with negative-ion
chemical ionization mass spectrometry (GC-NICI-MS) to detect and separate the tracers in a
timely manner.
During Phase I of CO2 injection operations, two of the chemical tracers injected were
detected at multiple offset production and monitoring wells. PMCP that was injected in DD-7
prior to CO2 injection was detected at three offset wells: CC-7A, CC-6A, and EE-6. SF6 that was
injected at the start of Phase I was detected at five offset wells: M-1, DD-8A, CC-8, CC-7A, and
DD-9. Detection of these tracers at multiple offset wells confirms interwell connectivity in coalbed

100
methane reservoirs. The detection of SF6 at DD-8A before the arrival of CO2 makes tracers a
viable option to predict migration pathways. The detection of only two out of the ten injected
tracers could be due to a number of factors including insufficient amount of tracer injected such
that it could not be detected, missed breakthrough due to sampling frequency, or the tracer was
unable to move through the reservoir due to adsorbed CO2 or coal swelling. The two tracers that
were detected were injected at the beginning of CO2 injection operations making them a viable
tool for the initial plume movement and migration prediction. It is recommended that future tests
implement a multi-tracer program such as the one presented, and consider multi-zone injection of
tracers to determine differences in migration pathways and times for deep and shallow coal
seams/zones. It is recommended that for future tests only one type of tracer be used to reduce
uncertainties in results. PFTs are a great option as they can be selected as a suite of similar-
property tracers that are relatively inexpensive, easily deployed, and easily detected. Another
advantages of selecting one type of chemical tracers, such as PFTs, are that a single, reliable
method can be developed for analysis of these tracers which can reduce the costs and resources
associated with analysis.
Approximately four months after the start of injection, CO2 was detected above baseline
levels and one of the nearest offset well, DD-8A. CO2 concentrations in this well reached a
maximum of 12.9% at the end of Phase I. During the first soaking phase, these concentrations
decreased. As expected, CO2 concentrations increased in DD-8A at the beginning of Phase II,
reaching a maximum of 4.7% at the end of Phase II. Detection of a tracer at this offset well
followed by the breakthrough of CO2 confirms tracers as a viable tool to predict migration
pathways for CO2 injection tests. Based on this result, had more CO2 been injected, breakthrough

101
of CO2 could be expected at the other wells where SF6 was detected and likely in the order in
which it was detected.
In order to delineate which coal seams the CO2 was migrating through, multiple wellbore-
scale tests were conducted on the DD-8A well where CO2 breakthrough was detected and the DD-
8 injection well where the CO2 was determined to originate. A downhole camera was successfully
lowered into the three injection wells while they were being converted for CO2 injection operations
to assess the condition of the perforations created during the initial drilling and completion.
Inspection of the DD-8 video concluded that over 90% of the perforations that were able to be
viewed were determined to be open and successfully completed. It was also determined that all of
the coal seams that were completed in DD-8A were also successfully completed in DD-8, creating
favorable connectivity between the two wells. A well kill test was conducted on the DD-8A well.
Water was injected into the annulus of the well at multiple interval to detect changes in flow rate
and composition, and attribute those to zones containing multiple coal seams. Results from this
test conclude that a majority of the CO2 was migrating through the shallowest zone containing the
Seaboard (20) coal seam. Next, a downhole injection log was conducted in the injection wells
using a continuous spinner tool. Interpretation of these logs concluded that a majority of the CO2
injection occurred in the shallowest interval from 871-1,205 ft., including the Seaboard (20) coal
seam. Finally, a downhole Raman spectrometer test was conducted to create a composition versus
depth profile for the injection wells. Results from this test conclude that three coal seams were
producing more CO2 than the aggregate of the seams below them: Upper Horsepen (10), Lower
Seaboard (20), and Seaboard (20).
The three injection wells were put back into normal production in January, 2018. Gas
composition samples collected and analyzed at these wells up to December 7, 2018 determine that

102
the gas stream is primarily CO2 (>~70%). It is estimated that a total of 1,740 tons of CO2 have
been produced out of the three injection wells. This represents approximately 13.1% of the total
CO2 injected. By comparison, the 2009 Russell County injection test reached 15% flowback after
10 months and the Morgan County injection test reached 15% flowback after only 4 months. DD-
7, DD-7A, and DD-8 have retained approximately 81.5, 87.9, and 90.9% of their injected volume
of CO2, respectively. It is recommended that further monitoring of the flowback be conducted on
both the flowrates of the injection wells and the gas composition. Analysis of the flowback should
be conducted to determine how much CO2 has been stored during this test.
Based on the successful injection of over 13,000 tons of CO2 into three coalbed methane
wells during this test, it is recommended that a larger-scale test be performed in Central Appalachia
to validate the potential for CO2 storage and ECBM recovery in stacked coal seams at the
regional/field level. The U.S. Department of Energy has estimated a total of 54-113 billion tons
of CO2 can be stored in coal seams in the U.S. Based on current EPA estimates this could mitigate
up to 20 years’ worth of CO2 emissions in the U.S., with over 1.3 billion tons of CO2 able to be
stored in Central Appalachia alone. ECBM recovery can also extend the life of the mature fields
typically found in Central Appalachia by adding recoverable reserves.
A larger-scale test should utilize varying injection schemes in order to maximize the
storage and ECBM recovery potential at the field level. From a storage perspective, the
breakthrough of CO2 at offset wells is cause for concern. However, a larger test could be designed
to reduce or eliminate the breakthrough of CO2. For this test, it was determined that the CO2 was
migrating through the shallow, and likely more depleted, coal seams. Multi-zone injection of CO2
would allow for a higher quantity and more even distribution of CO2 injection. For this test, the
three injection wells were located next to each other. For a larger test, the injection well candidates

103
should be spaced based on the estimated extent of the CO2 plume for the target amount of CO2 to
be injected into each well. Reservoir modeling could be used to estimate the extents of this CO2
plume and determine which offset wells could be affected by the plume migration. The injection
well candidates could be selected based on drilling schedule (initial vs infill), historic gas and
water production for an area, or individual wells known to have a high depletion percentage. Wells
that have a higher depletion could be more readily taken offline and plugged after CO2 injection
operations, ensuring CO2 storage. From an ECBM recovery perspective, multi-zone CO2
injections would allow for the recovery of heavier hydrocarbons that are typically found in deeper
coal seams. The initial completion of a well with CO2 could yield a higher initial recovery and
increase the estimated ultimate recovery.
In order to determine the commercial potential for CO2-ECBM recovery in Central
Appalachia, an in-depth economic analysis should be conducted using results from this test and
compared with results from previous tests such as the 2009 Russell County test and the 2014
Morgan County test. Continued monitoring of flow rates and CO2 concentrations from the
injections wells will determine the amount of CO2 that was successfully stored underground the
enhanced coalbed methane production due to CO2 injection. Flow rate and gas composition should
also be collected at surrounding offset production wells to see any changes to peripheral wells due
to CO2 injection operations. Results of the ECBM recovery and the amount of CO2 injected/stored
should be compared and the injection volumes should be optimized for future tests.
Ultimately the proceeds must outweigh the costs for a future test to be commercially viable.
Reducing the cost of CO2 and operating costs is critical. Applicable tax credits such as 45Q for
carbon capture and storage could help alleviate the cost of CO2 injection operations. Market factors
such as higher gas prices will also provide favorable conditions for commercial viability.

104
The research team at the Virginia Center for Coal and Energy Research has now partnered
with the Southeast Regional Carbon Sequestration Partnership (SECARB) on two CO2 injection
tests in Central Appalachia (2009) and the Black Warrior Basin (2010) and has recently conducted
two small-scale CO2 injections, one in an organic shale reservoir in Morgan County, Tennessee
(2014) and another in a coalbed methane reservoir in Buchanan County, Virginia (2015). Results
from each of these tests have concluded that CO2 can stimulate hydrocarbon production in coal
and shale reservoirs and the trapping mechanisms of unconventional reservoirs can retain the bulk
of injected CO2 for long-term storage. While much information is garnered from these CO2
injection field tests, additional field laboratory research will reduced existing gaps in data and
information related to enhanced coalbed methane and shale gas recovery associated with CO2
storage.


CB-DD5A CB-DD5 CB-DD7 CB-DD7ACB-DD8
Ties to B1-B2CB-DD6
A1West
Poca #2 - 10
Poca #3 - 50Poca #3 - 40
Greasy Creek - 20
U.Seaboard 2
U.Seaboard 1
Tiller
Tiller 1
***
**
*
*
*
**
**
**
*
Basal Lee Sandstone
Hensley ShaleUpper Confining Unit
Middle Confining Unit
Lower Confining Unit
Injection Well Injection Well Injection WellMonitoring Well
(Spot Core)
M-1(Completed March 2015)
Desorption
Poca #3 - 30
Water running downside of casing
855' 1781' 1614' 1000' 642' 791'
Gamma Density
A2
Gamma Caliper Gamma Caliper Gamma DensityGamma CaliperGamma Density
Gamma Density
*
*
*
*
*
*
*
**
*
*
** *
*
*
**
*
**
*
*
*
**
*
T.D. 1949.50 T.D. 1948.60 T.D. 2319.00 T.D. 2000.00
T.D. 1868.50
T.D. 2078.16
?
Poca #3 - 10 & 20
Seaboard - 20
Lower Seaboard - 10 & 20
Upper Horsepen - 10
Upper Horsepen - 30
Poca #11
Poca # 10 - 10
Poca #10 - 20
Poca #9 - 10
Poca #9 - 20Poca #8 - 10
Poca #7 - 10
Poca #7 - 20
Poca #5 - 10
Poca #5 - 20
Poca #4
Water running downside of casing
3
3 4
4
2
1
2
1
3
2
1
3
2
1
3
3
2
1
2
1
2008 2000 2000
2000 2007 1998
6 perfs; 4 of 6 open;1st video segment
2 perfs; 1 of 2 open
1 perf; closed
3 perfs; all open
2 perfs; all open
3 perfs; all open
3 perfs; all open
3 perfs; all open
Water filled at 1762' -perfs not visible
7 perfs; all open
4 perfs; all open
4 perfs; all open
6 perfs; 5 of 6 open
6 perfs; all open
5 perfs; 4 of 5 open
4 perfs; all open
4 perfs; 2 of 4 open
one very large5 perfs; all open -
4 perfs; 3 of 4 open
5 perfs; 4 of 5 open
8 perfs; 7 of 8 open
8 perfs; 5 of 8 open
8 perfs; all open
Water filled at 1690' -perfs not visible
Weatherford CO Injection Analysis3/23/2016(See Exhibit 5)
2
Weatherford CO Injection Analysis3/22/2016(See Exhibit 4)
2
3 perfs; 2 of 3 open
8 perfs; all open
8 perfs; all open
8 perfs; 7 of 8 open
2 perfs; 1 open; 1 partially open;2nd video segment
7 perfs; 6 of 7 open
8 perfs; all open; gassy;3rd video segment
6 perfs; 2 of 6 open
1 perf; foaming, not open;perhaps perf gun did not fire;
11 perfs; 5 or 6 open of 11
8 perfs; 7 of 8 open;
Water filled at 2035' -perfs not visible -
8 perfs; 4 of 8 open
(water not rising)
perf depth off 9'
2 perfs; all open
5 perfs; 4 of 5 open
2 perfs; all open -
6 perfs; all open
Scale on walls;camera unable to view perfs
145.42 : H-82; G-24
170.03: G-42; G-4
157.33: H-54
Fireclay
Dark Shale
Coal with Shale
Coal
Bone
Shale With Sandstone Streak(s)
Lithologies
Hard Sandstone
Sandstone
Sandstone with Coal Spar(s)
Sandstone with Shale Streak(s)
Sandy Shale
Unknown
Blank
Unknown Lithology
Completed Coal Seam
Shale Confining Unit
Quartz Arenite
CO Injection Zone With Description*
Gas Content Test
2
Water Observed By Video Camera
scf/t204.3
Canister ID212
1 CBM Well Completion Zone
2007 CBM Well Completion Year
8 perfs; all open
A1 - A2 (Injection Site)Cross Section Exhibit E1
of Perforations
Desorption
7/18/15 - 4/16/1612/13/16 - 1/29/17
7/6/15 - 4/16/1612/13/16 - 1/29/17
2015 7/18/15 - 4/16/1612/13/16 - 1/29/17
7/18/15 - 4/16/16
in 2015
CO Injection Dates2
Notes:
East
2
3
1
MM&A Video Camera Log3/31/2015 With Workover Report MM&A Video Camera
Log 4/10/2015 WithWorkover Report
MM&A VideoCamera Log
4/13/2015 WithWorkover Report
1. See Map A1 for location.2. See Exhibit E4 video segments
for CB-DD7.
1 Location of 2015 Video Segment3. Datum: Pocahontas No. 9 Seam

CB-DD8
L-236 CB-DD8ATies to A1-A2 and B1-B2 CB-EE10
A3East
Poca #2 - 10
Poca #3 - 50 Poca #3 - 40
Poca #11
Poca #3 - 10
Poca #4
U.Seaboard 1
U.Seaboard 2
Tiller
Tiller 1
M.Horsepen - 10
CB-DD9Core Hole
M.Horsepen - 10
675' 148' 1283' 2734'
A2
Gamma Density
Gamma Density Gamma Density
Hensley ShaleUpper Confining Unit
Middle Confining Unit
Lower Confining Unit
T.D. 1868.50
T.D. 1880.00 T.D. 2125.70 T.D. 2417.53
??
L.Seaboard - 10
?
3
*
**
*
**
***
*
*
*
**
*
*
*
**
*
*
**
*
*
*
*
*
**
*
*
***
*
2
1
Basal Lee Sandstone
1
2
3
Greasy Creek - 20
Seaboard - 20
L.Seaboard - 20
U.Horsepen - 10
U.Horsepen - 30
4
Poca #10 - 10
Poca #10 - 20
Poca #9 - 10Poca #9 - 20
3
? Note: Completion report does not show that this seam was perforated.
Poca #7 - 10
Poca #5 - 20
Poca #5 - 10
2
Poca #3 - 20
1 1
2
3
4
2008 2001 2009
7 perfs; all open
4 perfs; all open
4 perfs; all open
6 perfs; 5 of 6 open
6 perfs; all open
5 perfs; 4 of 5 open
4 perfs; all open
4 perfs; 2 of 4 open
one very large5 perfs; all open -
4 perfs; 3 of 4 open
5 perfs; 4 of 5 open
8 perfs; 7 of 8 open
8 perfs; 5 of 8 open
8 perfs; all open
Water filled at 1690' -perfs not visible
4/13/2015With Workover Report
MM&A Video Camera Log Weatherford CO Injection Analysis3/23/2016(See Exhibit 5)
2
Core HoleL-236
Fireclay
Dark Shale
Coal with Shale
Coal
Bone
Shale With Sandstone Streak(s)
Lithologies
Hard Sandstone
Sandstone
Sandstone with Coal Spar(s)
Sandstone with Shale Streak(s)
Sandy Shale
Unknown
Blank
Unknown Lithology
Completed Coal Seam
Shale Confining Unit
Quartz Arenite
CO Injection Zone With Description*
2
Water Observed By Video Camera
1 CBM Well Completion Zone
2007 CBM Well Completion Year
8 perfs; all open
of Perforations
7/18/15 - 4/16/16
in 2015
CO Injection Dates2
Injection Well
19987/18/15 - 4/16/16
12/13/16 - 1/29/17
A2 - A3 (Injection Site)Cross Section Exhibit E2
West
Notes:1. See Map A1 for location.2. Datum: Pocahontas No. 9 Seam

L-239
T.D.1847.08
CB-EE7
T.D.2262.20
CB-DD8
T.D.1867.50
CB-CC9B L-231
B1West B2
East
Poca #2 - 10
Tiller 1
Tiller
U.Seaboard 1
Greasy Creek - 20
Seaboard - 20
L.Seaboard - 20
U.Horsepen - 10
U.Horsepen - 20
Poca #11
Poca #10 - 10
Poca #10 - 20
Poca #9 - 10
Poca #9 - 20
Poca #7 - 10
Poca #5 - 10
Poca #5 - 20
Poca #4
Poca #3 - 50
Poca #3 - 40
Poca #3 - 10 & 20
L.Seaboard - 10
L.Horsepen - 30
Poca #4
Poca #7 - 20
U.Horsepen - 30
M.Horsepen - 10
Poca #1 - 10
BASALLEE SANDSTONE
M-2 (CBM-EE7A)(Drilling March 2015)
Core Hole Core Hole
Poca #8 - 10
Ties to A1-A2 and A2-A3
Squire Jim 2
CH-1R-2014
Core Hole
(Drilled July-Sept 2014) Monitoring Well C-1-15Located ~16 feetfrom CH-1-2014
1610' 1551' 1516' 1205' 1781' 2122'
Gamma Density
Gamma Density
CH-1-2014 and
A2
Gamma Density
Gamma Density
Gamma Density
Basal Lee Sandstone
Hensley ShaleUpper Confining Unit
Lower Confining Unit
Middle Confining Unit
T.D. 2213.55
T.D. 1847.15
T.D. 2370.00
T.D. 1900.48
Poca #3 - 40
Poca #3 - 10, 20 & 30
?
Poca #3 - 30
**
**
***
*
*
*
*
**
*
*
*
**
***
**
*
**
******
4
3
2000
3
7 perfs; all open
4 perfs; all open
4 perfs; all open
6 perfs; 5 of 6 open
6 perfs; all open
5 perfs; 4 of 5 open
4 perfs; all open
4 perfs; 2 of 4 open
one very large5 perfs; all open -
4 perfs; 3 of 4 open
5 perfs; 4 of 5 open
8 perfs; 7 of 8 open
8 perfs; 5 of 8 open
8 perfs; all open
Water filled at 1690' -perfs not visible
4/13/2015With Workover Report
MM&A Video Camera Log Weatherford CO Injection Analysis3/22/2016(See Exhibit 4)
2
204.3 : 212
409.12 : G-17
350.93 : H-54
323.41 : 219
464.73 : G-46
207.67 : F-26
340.54 : F-68
385.25 : H-43
379.22 : H-10
328.60 : H-7
104.08 : H-60
217.76 : G-38
108.12 : G-23
159.24 : G-23
226.18 : G-21
241.10 : H-38; H-7
2
1
2
1
2007
3
2
1
Core HoleL-239
Fireclay
Dark Shale
Coal With Shale
Boney Coal
Bone with Coal
Black Shale
Coal
Bone
Shale with Coal Streak(s)
Shale with Sandstone Streak(s)
Shale
Lithologies
Crystallized Sandstone
Hard Sandstone
Sandstone
Sandstone with Coal Spar(s)
Sandstone with Shale Streak(s)
Sandy Shale
Coal With Bone
Blank
Unknown Lithology
Completed Coal Seam
Shale Confining Unit
Quartz Arenite
CO Injection Zone With Description*
Gas Content Test
2
Water Observed By Video Camera
scf/t204.3
Canister ID212
1 CBM Well Completion Zone
2007 CBM Well Completion Year
8 perfs; all open
of Perforations
Desorption
7/18/15 - 4/16/16
in 2015
CO Injection Dates2
Monitoring Well(Spot Core)
Desorption2015
Injection Well
19987/18/15 - 4/16/16
12/13/16 - 1/29/17 Desorption2014
B1 - B2 (Injection Site)Cross Section Exhibit E3
Notes:1. See Map A1 for location.2. Datum: Pocahontas No. 9 Seam

APPENDIX B

In making inmeasurements, w
.
nterpretations of data ouwe cannot and we do no
Pro
ur employees will give ot guarantee the accurac
c
ductiW
1
the customer the benecy of any interpretationcustomer resulting from
Weatherford In15710 J
ion LWell Repo
C
Field:
3/
PDa
5710 JFK Bl83
fit of their best judgemn. We shall not be liablm any interpretation ma
nterpretation & Proces
JFK Blvd, Houston TX,
Page 1
og Inort Revi
CARDNODD‐8
: OAKW
/29/201
Prepared byahiana Mejilvd, Housto32.284.373
ment, but since all interple or responsible for anade by our employees.
ssing Services 77032
nterpriew Cop
O
WOOD
16
y: ia n TX, 770321
pretations are based onny loss, cost, damage, o
retatpy
2
n interfaces from electrior expenses whatsoever
tion
ical or other r incurred by the

WEATHERFORD INTERPRETATION PROCESSING SERVICES
CUSTOMER : CARDNO WELL No. : DD8
FIELD : OAKWOOD LOCATION : VIRGINIA
DATE : MARCH 23, 2016 REPORT NO. : 2016-006
In making interpretations of data our employees will give the customer the benefit of their best judgement, but since all interpretations are based on interfaces from electrical or other measurements, we cannot and we do not guarantee the accuracy of any interpretation. We shall not be liable or responsible for any loss, cost, damage, or expenses whatsoever incurred by the customer resulting from any interpretation made by our employees.
Weatherford Interpretation & Processing Services 15710 JFK Blvd, Houston TX, 77032
Page 2
TABLE OF CONTENTS
1. EXECUTIVE SUMMARY 4
2. LOGGING OBJECTIVES FOR PLT 5
3. LOGGING PROCEDURE 5
4. SEQUENCE OF EVENTS 6
5. TOOL DIAGRAM 7
6. INJECTION LOG INTERPRETATION 8 6.1 DATA QUALITY CONTROL AND DISCUSSION 8 6.2 PROFILE CALCULATION 10 7. DENSITY PROFILE 12
APPENDIX I: Well Diagram 13 APPENDIX II – Curve Mnemonics 14

WEATHERFORD INTERPRETATION PROCESSING SERVICES
CUSTOMER : CARDNO WELL No. : DD8
FIELD : OAKWOOD LOCATION : VIRGINIA
DATE : MARCH 23, 2016 REPORT NO. : 2016-006
In making interpretations of data our employees will give the customer the benefit of their best judgement, but since all interpretations are based on interfaces from electrical or other measurements, we cannot and we do not guarantee the accuracy of any interpretation. We shall not be liable or responsible for any loss, cost, damage, or expenses whatsoever incurred by the customer resulting from any interpretation made by our employees.
Weatherford Interpretation & Processing Services 15710 JFK Blvd, Houston TX, 77032
Page 3
LIST OF FIGURES
Figure 1: Injection log procedure Figure 2: Sequence of Events Figure 3: Tool String Diagram Tool OD: 1.693” Figure 4: Injection passes‐ DD8 Figure 5: Injection Profile Computed Figure 6: Injection flow profile Figure 7: Density Curve from 1800ft to surface

WEATHERFORD INTERPRETATION PROCESSING SERVICES
CUSTOMER : CARDNO WELL No. : DD8
FIELD : OAKWOOD LOCATION : VIRGINIA
DATE : MARCH 23, 2016 REPORT NO. : 2016-006
In making interpretations of data our employees will give the customer the benefit of their best judgement, but since all interpretations are based on interfaces from electrical or other measurements, we cannot and we do not guarantee the accuracy of any interpretation. We shall not be liable or responsible for any loss, cost, damage, or expenses whatsoever incurred by the customer resulting from any interpretation made by our employees.
Weatherford Interpretation & Processing Services 15710 JFK Blvd, Houston TX, 77032
Page 4
1. EXECUTIVE SUMMARY Weatherford Wireline Services were commissioned to perform an injection log (PLT) survey on DD8 for Cardno on March 23, 2016. The objective of the survey was to determine injecting zones. A Weatherford PLT tool string consisting of GR, CCL, temperature, pressure, radioactive density, 1.69” jewel spinner was used in the logging job. Conclusions:
Raw data shows qualitatively active perforations between 871ft and 1040ft.
Majority of CO2 went to the top of perforation at (871‐1205)ft (had the highest change in injection profile).
Spinner data was affected by yo‐yo making difficult to detect injecting zones with low injection rate at the time of logging.
Density curve is provided from surface to the bottom of the logging interval to show CO2 density changes against pressure and temperature. See figure 7.
Bottom perforation was partially logged due to the tag depth.
The injection profile was calculated from the 150B down pass.
Table 1: Total Injection rate
DW_150 (RPS) %_DW 150B Tons/day
871 1205 1.3 100 58
1311 1677 0 0 0
1710 1802 0 0 0
Perforations (ft)

WEATHERFORD INTERPRETATION PROCESSING SERVICES
CUSTOMER : CARDNO WELL No. : DD8
FIELD : OAKWOOD LOCATION : VIRGINIA
DATE : MARCH 23, 2016 REPORT NO. : 2016-006
In making interpretations of data our employees will give the customer the benefit of their best judgement, but since all interpretations are based on interfaces from electrical or other measurements, we cannot and we do not guarantee the accuracy of any interpretation. We shall not be liable or responsible for any loss, cost, damage, or expenses whatsoever incurred by the customer resulting from any interpretation made by our employees.
Weatherford Interpretation & Processing Services 15710 JFK Blvd, Houston TX, 77032
Page 5
2. LOGGING OBJECTIVES FOR PLT
The aim of the survey was to identify injection zones
3. LOGGING PROCEDURE
The tool string was composed as follows from top to bottom of E‐line:
Weight bars
CCL
GR
Pressure Gauge
Density
Temperature sensor/ Jewel Flowmeter.
Job Procedure
String Direction Cable Speed
Interval Well
condition BH
contents Remarks
PLT Down RIH Surface to 820ft_MD
Injecting CO2 Looking for interfaces
Take a 5 minutes station at 820ft
PLT Down 100 820ft_MD (EOT) to
1806ft_MD Injecting CO2
Check spinner response, if
necessary repeat the pass
PLT Up 100 1806ft_MD to 820ft
(EOT)_MD Injecting CO2
Check spinner response, if
necessary repeat the pass
PLT Down 150 820ft_MD (EOT) to
1806ft_MD Injecting CO2
Check spinner response, if
necessary repeat the pass
PLT Up 150 1806ft_MD to 820ft
(EOT)_MD Injecting CO2
Check spinner response, if
necessary repeat the pass
Calibration Passes
PLT Down 50 1205ft_MD to
1311ft_MD Injecting CO2
PLT Up 50 1311ft_MD to
1205ft_MD Injecting CO2
Take a 5 minutes station at 1700ft and 1800ft Figure 1: Injection log procedure

WEATHERFORD INTERPRETATION PROCESSING SERVICES
CUSTOMER : CARDNO WELL No. : DD8
FIELD : OAKWOOD LOCATION : VIRGINIA
DATE : MARCH 23, 2016 REPORT NO. : 2016-006
In making interpretations of data our employees will give the customer the benefit of their best judgement, but since all interpretations are based on interfaces from electrical or other measurements, we cannot and we do not guarantee the accuracy of any interpretation. We shall not be liable or responsible for any loss, cost, damage, or expenses whatsoever incurred by the customer resulting from any interpretation made by our employees.
Weatherford Interpretation & Processing Services 15710 JFK Blvd, Houston TX, 77032
Page 6
4. SEQUENCE OF EVENTS (Provided by T. Pawliuk, Weatherford US Specialty Engineer)
Figure 2: Sequence of Events
Company
Well Name
Field
Date
Field Engineer
Correlation Log Used
Pressure Tested
Lubricator Test 650
Gas (TPD) Oil (BPD) Water (BPD) Pressure (PSI) Temperature (F)
Flow Rates 58
Surface Pressure while logging 650
Hours well was flowing before logging
Flowing Passes Times are in Texas time because it matches up with the laptop
Passes Time Date150 DOWN
150 UP 14:05
RATE CHANGE 58 TON/DAY
150 DOWN b 14:53
150 up c 15:02
100 down
150 UP D100 DOWN B 15:33
100 UP70 DOWN 15:58
100 UP B 16:15
Stationary Data
Depth (ft) Time Date
820 13:50 23‐Mar‐16
RATE CHANGE
820 14:42
1700
1800 17:00
11:45 dummy run
12:43 power up to fdt in prep of cal
12:53 cal fluid density
13:08 TEST TOOL
13:13 STAB ON
13:15 EQUILIZE 650PSI
13:22 RIH
13:35 AT 820
13:50 STAT820
14:15 THEY HAD TO DROP INJECTION RATE
14:40 RESTART LOGGING PASSES ATT NEW INJECTION RATE
INJECTING ABOUT 60 TONS, TRY TO GET THEM TO BUMP IT UP TO 80,
858PSI, .67G/CC,0.6RPS
MY SPINNER HAD STALLED DURING THE UP PASS AS WELL SO I CAME INTO TUBING
ANYWAYS TO GIVE IT A CLEANING
DENSITY CALS BEFORE: AIR‐15188.5 WATER‐6352.1, AFTER: AIR‐15157.2WATER‐6339.9
PL RAW DATA file name shall be of the form XX_YY_ZZ.LAS, where:
XX: well condition, SI (shut in) or absent if flowing conditions
YY= logging direction DN (down pass) or UP (up pass)
ZZ= Cable speed in feet per minute (fpm)
Remarks (Include any issues while logging)
Production Logging Job Notes
Cardno
DD‐8
OAKWOOD
23‐Mar‐16
T. PAWLIUK
Geological Logging Systems Gamma‐Caliper Log dated 12/16/2001
REDUCED LOGGING INTERVAL TO A MAX DEPTH OF
1740' BECAUSE WE HAD ISSUES WITH THE FM
PICKING UP STUFF AND DYING
NO FM 1720‐1400, AND FM NOT TURNING WHILE
STATIONARY AT TOP OF INTERVAL. PULL INTO
TUBING TO TRY TO CLEAN
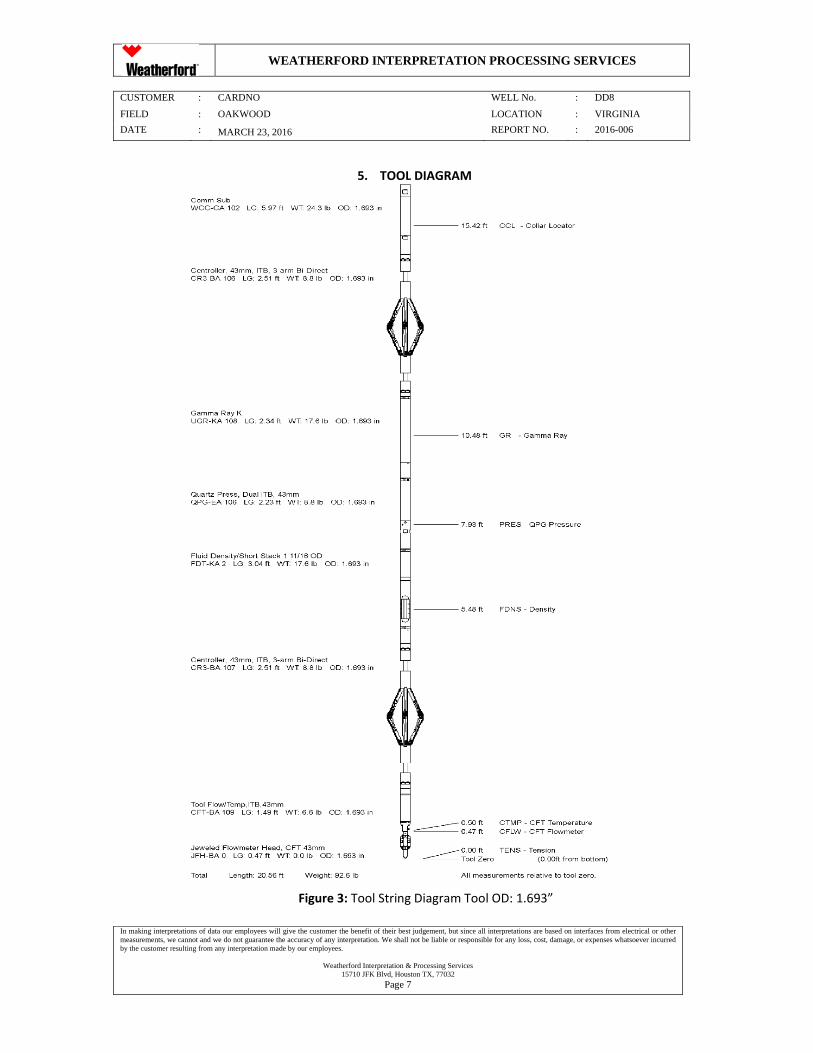
WEATHERFORD INTERPRETATION PROCESSING SERVICES
CUSTOMER : CARDNO WELL No. : DD8
FIELD : OAKWOOD LOCATION : VIRGINIA
DATE : MARCH 23, 2016 REPORT NO. : 2016-006
In making interpretations of data our employees will give the customer the benefit of their best judgement, but since all interpretations are based on interfaces from electrical or other measurements, we cannot and we do not guarantee the accuracy of any interpretation. We shall not be liable or responsible for any loss, cost, damage, or expenses whatsoever incurred by the customer resulting from any interpretation made by our employees.
Weatherford Interpretation & Processing Services 15710 JFK Blvd, Houston TX, 77032
Page 7
5. TOOL DIAGRAM
Figure 3: Tool String Diagram Tool OD: 1.693”

WEATHERFORD INTERPRETATION PROCESSING SERVICES
CUSTOMER : CARDNO WELL No. : DD8
FIELD : OAKWOOD LOCATION : VIRGINIA
DATE : MARCH 23, 2016 REPORT NO. : 2016-006
In making interpretations of data our employees will give the customer the benefit of their best judgement, but since all interpretations are based on interfaces from electrical or other measurements, we cannot and we do not guarantee the accuracy of any interpretation. We shall not be liable or responsible for any loss, cost, damage, or expenses whatsoever incurred by the customer resulting from any interpretation made by our employees.
Weatherford Interpretation & Processing Services 15710 JFK Blvd, Houston TX, 77032
Page 8
6. INJECTION LOG INTERPRETATION OVERVIEW The analysis was performed as follow:
The data preparation to filter the data.
The flow meter analysis to compute the injection profile.
The profile determination to identify the potential injecting zones.
The computation of percentage per injecting zones based on surface flow rate reported by client. 6.1 DATA QUALITY CONTROL AND DISCUSSION
The main sensors are:
Spinner flowmeter: for an estimate of mixture flow rate.
Temperature: mainly for qualitative interpretation, but is sometimes very useful and can confirm or deny conclusions drawn from other measurements.
Pressure: needed for calculation of fluid properties and can be used to compute fluid density in wellbore.
Caliper, CCL and Gamma Ray: needed for depth control or casing ID. The gamma ray curve can additionally help identify reservoir zones and scaling problems.
Log Quality Check –Figure 4: Injection passes‐ DD8
Gamma Ray: The curves generally stack.
Pressure: Repeatability pass to pass.
Spinner: The spinner data was affected by yo‐yo, seem in the erratic motion of the tension, making difficult to identify low injecting zones.
Line Speed: Line speed data was very spiky.
Density: Density remains consistent over whole logging interval. Good repeatability pass to pass.
Temperature: Cannot be determined from temperature data clear injecting zones.

WEATHERFORD INTERPRETATION PROCESSING SERVICES
CUSTOMER : CARDNO WELL No. : DD8
FIELD : OAKWOOD LOCATION : VIRGINIA
DATE : MARCH 23, 2016 REPORT NO. : 2016-006
In making interpretations of data our employees will give the customer the benefit of their best judgement, but since all interpretations are based on interfaces from electrical or other measurements, we cannot and we do not guarantee the accuracy of any interpretation. We shall not be liable or responsible for any loss, cost, damage, or expenses whatsoever incurred by the customer resulting from any interpretation made by our employees.
Weatherford Interpretation & Processing Services 15710 JFK Blvd, Houston TX, 77032
Page 9
Figure 4: Injection passes‐ DD8

WEATHERFORD INTERPRETATION PROCESSING SERVICES
CUSTOMER : CARDNO WELL No. : DD8
FIELD : OAKWOOD LOCATION : VIRGINIA
DATE : MARCH 23, 2016 REPORT NO. : 2016-006
In making interpretations of data our employees will give the customer the benefit of their best judgement, but since all interpretations are based on interfaces from electrical or other measurements, we cannot and we do not guarantee the accuracy of any interpretation. We shall not be liable or responsible for any loss, cost, damage, or expenses whatsoever incurred by the customer resulting from any interpretation made by our employees.
Weatherford Interpretation & Processing Services 15710 JFK Blvd, Houston TX, 77032
Page 10
6.2 PROFILE CALCULATION The down pass at 150B was used to get the injection profile. Where the spinner is showing the minimum value is the total flow rate, 100% flow. The maximum value for spinner is 0% flow.
Figure 5: Injection Profile Computed

WEATHERFORD INTERPRETATION PROCESSING SERVICES
CUSTOMER : CARDNO WELL No. : DD8
FIELD : OAKWOOD LOCATION : VIRGINIA
DATE : MARCH 23, 2016 REPORT NO. : 2016-006
In making interpretations of data our employees will give the customer the benefit of their best judgement, but since all interpretations are based on interfaces from electrical or other measurements, we cannot and we do not guarantee the accuracy of any interpretation. We shall not be liable or responsible for any loss, cost, damage, or expenses whatsoever incurred by the customer resulting from any interpretation made by our employees.
Weatherford Interpretation & Processing Services 15710 JFK Blvd, Houston TX, 77032
Page 11
Figure 6: Injection flow profile

CUSTOMER
FIELD
DATE
In making interpmeasurements, wby the customer
7. DE
R : CAR
: OAK
: MAR
pretations of data our ewe cannot and we do nresulting from any inte
ENSITY PROF
WEAT
RDNO
KWOOD
RCH 23, 2016
employees will give thnot guarantee the accurerpretation made by ou
FILE
Figure
THERFORD
he customer the benefitracy of any interpretatiour employees.
Weatherford Int15710 JFK
Table 2: Per
e 7: Density
INTERPRET
t of their best judgemeon. We shall not be lia
terpretation & ProcessiK Blvd, Houston TX, 7
Page 12
centage Inje
Curve from
TATION PR
WE
LOC
REP
ent, but since all interprable or responsible for a
ng Services 77032
ecting Zones
1800ft to su
ROCESSING
ELL No.
CATION
PORT NO.
retations are based on any loss, cost, damage
rface
SERVICES
: DD8
: VIRGINIA
: 2016-006
interfaces from electrie, or expenses whatsoev
A
ical or other ver incurred

WEATHERFORD INTERPRETATION PROCESSING SERVICES
CUSTOMER : CARDNO WELL No. : DD8
FIELD : OAKWOOD LOCATION : VIRGINIA
DATE : MARCH 23, 2016 REPORT NO. : 2016-006
In making interpretations of data our employees will give the customer the benefit of their best judgement, but since all interpretations are based on interfaces from electrical or other measurements, we cannot and we do not guarantee the accuracy of any interpretation. We shall not be liable or responsible for any loss, cost, damage, or expenses whatsoever incurred by the customer resulting from any interpretation made by our employees.
Weatherford Interpretation & Processing Services 15710 JFK Blvd, Houston TX, 77032
Page 13
APPENDIX I: Well Diagram

WEATHERFORD INTERPRETATION PROCESSING SERVICES
CUSTOMER : CARDNO WELL No. : DD8
FIELD : OAKWOOD LOCATION : VIRGINIA
DATE : MARCH 23, 2016 REPORT NO. : 2016-006
In making interpretations of data our employees will give the customer the benefit of their best judgement, but since all interpretations are based on interfaces from electrical or other measurements, we cannot and we do not guarantee the accuracy of any interpretation. We shall not be liable or responsible for any loss, cost, damage, or expenses whatsoever incurred by the customer resulting from any interpretation made by our employees.
Weatherford Interpretation & Processing Services 15710 JFK Blvd, Houston TX, 77032
Page 14
APPENDIX II – Curve Mnemonics
MNEMONICS UNITS DESCRIPTION
DEPTH FT LOGGED DEPTH
CCL MV COLLAR LOCATOR
GR GAPI GAMMA RAY
PRES PSI PRESSURE
FDNS C/CC RADIOACTIVE DENSITY
CTMP DEGF TEMPERATURE
CFLW RPS FLOWMETER/SPINNER
TENS LB TENSION
LSPD FPM LINE SPEED


+1
(307
) 74
2 63
40in
fo@
wel
ldog
.com
ww
w.w
elld
og.c
om
Res
ervo
ir T
echn
olog
y Cen
ter
1525
Ind
ustr
y D
rive
Lara
mie
, W
yom
ing
8207
0 U
SA
Carb
on T
rack
er S
ervi
ces:
In
ject
ion
Wel
l DD8
10-1
1 No
vem
ber 2
017
Near
Gru
ndy
VA
Com
preh
ensiv
e Su
mm
ary

+1
(307
) 74
2 63
40in
fo@
wel
ldog
.com
ww
w.w
elld
og.c
om
Res
ervo
ir T
echn
olog
y Cen
ter
1525
Ind
ustr
y D
rive
Lara
mie
, W
yom
ing
8207
0 U
SA
Tabl
e of
Con
tent
s
Sect
ion
Page
Com
preh
ensiv
e Su
mm
ary
2W
ell C
ompl
etio
n3
Logg
ing
prog
ram
s4
Day
5 an
alys
is an
d lo
gs5
Day
6 an
alys
is an
d lo
gs11
1

+1
(307
) 74
2 63
40in
fo@
wel
ldog
.com
ww
w.w
elld
og.c
om
Res
ervo
ir T
echn
olog
y Cen
ter
1525
Ind
ustr
y D
rive
Lara
mie
, W
yom
ing
8207
0 U
SA
Com
preh
ensiv
e Su
mm
ary
of D
ays
5 an
d 6:
an
alys
is of
Wel
l DD8
•O
ver t
wo
days
, a to
tal o
f fou
r run
s of t
he D
RRS
inst
rum
ent d
ownh
ole
wer
e ac
com
plish
ed in
cludi
ng: a
n in
itial
run
in h
ole
to ch
arac
teriz
e th
e w
ell f
rom
surfa
ce to
th
e dr
illed
-out
brid
ge p
lug
at 1
806
ft-be
low
surfa
ce (F
BS),
a ru
n af
ter s
ettin
g a
brid
ge
plug
at 1
490
FBS,
a ru
n af
ter s
ettin
g a
seco
nd b
ridge
plu
g at
128
8 FB
S, a
nd a
fina
l run
af
ter s
ettin
g a
brid
ge p
lug
at 1
132
FBS.
As i
n W
ell D
D7, l
ogge
d a
few
day
s pre
viou
s, th
is w
ell c
onsis
ted
a co
lum
n of
mixe
d ga
ses a
top
a co
lum
n of
foam
ato
p a
colu
mn
of
liqui
d w
ater
. In
this
case
the
foam
laye
r was
100
ft. h
igh,
and
the
salin
ity o
f the
liqu
id
wat
er re
ad a
t 100
mS.
The
foam
and
und
erly
ing
wat
er o
bscu
red
half
of p
erfo
ratio
n zo
ne B
and
all
of zo
ne C
as i
dent
ified
in th
e w
ell c
ompl
etio
n re
port
. •
The
logs
dow
nhol
e on
the
first
day
indi
cate
d an
ave
rage
gas
com
posit
ion
cons
istin
g of
87
% C
O2
and
rem
aind
er C
H4 w
ith a
mod
erat
e in
crea
se in
met
hane
, up
to 2
0% o
f to
tal,
asso
ciate
d w
ith th
e up
per s
eam
s in
perfo
ratio
n zo
ne A
, bet
wee
n 98
4 an
d 87
0 FB
S. A
fter s
ettin
g a
brid
ge p
lug
abov
e zo
ne B
ove
rnig
ht, o
n th
e ne
xt d
ay’s
logs
, a
dram
atic
incr
ease
in m
etha
ne w
as o
bser
ved
to b
e as
socia
ted
with
the
coal
seam
s be
twee
n 10
31 a
nd 8
70 F
BS, w
here
the
met
hane
frac
tion
was
as h
igh
as 5
0%.
Com
posit
ion
abov
e an
d be
low
thes
e se
ams w
as 8
5-87
% C
O2,
with
the
rem
aind
er C
H4.
A ca
refu
l 10-
ft/m
in lo
g fro
m 1
100
to 8
00 F
BS o
n pu
ll-ou
t of h
ole
indi
cate
s tha
t the
se
am a
t 103
1 em
its in
crea
sed
met
hane
rela
tive
to th
e av
erag
e bo
reho
le co
mpo
sitio
n,
whi
ch is
succ
essiv
ely
dilu
ted
by C
O2
emitt
ed fr
om th
e su
bseq
uent
seam
s at 9
84, 9
12
and
871
FBS.

+1
(307
) 74
2 63
40in
fo@
wel
ldog
.com
ww
w.w
elld
og.c
om
Res
ervo
ir T
echn
olog
y Cen
ter
1525
Ind
ustr
y D
rive
Lara
mie
, W
yom
ing
8207
0 U
SA
DD8
Wel
l Com
plet
ion

+1
(307
) 74
2 63
40in
fo@
wel
ldog
.com
ww
w.w
elld
og.c
om
Res
ervo
ir T
echn
olog
y Cen
ter
1525
Ind
ustr
y D
rive
Lara
mie
, W
yom
ing
8207
0 U
SA
Days
5-6
: 1
0-11
Nov
–DD
8: L
oggi
ng p
rogr
ams
9-No
v•
Brid
ge p
lug
was
dril
led
out a
nd b
low
ing
dow
n fro
m b
otto
m o
f cas
ing
•Ra
thol
e is
shor
t on
this
wel
l rel
ativ
e to
the
othe
r tw
o in
ject
ion
wel
ls lo
gged
pre
viou
sly10
Nov
•To
dep
th•
Stat
iona
ry sc
ans a
t 870
, 116
0, 1
310,
159
0, a
nd 1
805
•Th
en p
lug
at 1
490,
repe
at st
atio
ns, s
et p
lug
at 1
288
11 N
ov•
1288
Plu
g•
Log
to 8
70 ft
-bel
ow su
rface
(FBS
) at 6
0 ft-
per-m
inut
e (fp
m)
•th
en 1
250
at 3
0 fp
m, s
tatio
nary
•Up
to 8
70 a
t 30
fpm
, sta
tiona
ry•
Dow
n to
116
0 FB
S at
10
fpm
, sta
tiona
ry•
Pull
out o
f hol
e (P
OO
H) a
t 60
fpm
•11
32 p
lug
•Lo
g to
dow
n 87
0 at
60
fpm
, the
n to
110
0 at
30
fpm
, sta
tiona
ry•
Log
up to
400
at 3
0 fp
m•
Log
dow
n to
100
at 6
0 fp
m, s
tatio
n•
Log
to 8
00 a
t 10
fpm
, sta
tion
•PO
OH
at 6
0 fp
m

+1
(307
) 74
2 63
40in
fo@
wel
ldog
.com
ww
w.w
elld
og.c
om
Res
ervo
ir T
echn
olog
y Cen
ter
1525
Ind
ustr
y D
rive
Lara
mie
, W
yom
ing
8207
0 U
SA
Day
5 :
10 N
ov –
DD8-
Firs
t log
to T
D•
Sum
mar
y: S
urfa
ce to
stat
ions
and
TD
and
POO
H•
Colu
mn
of G
as: A
t sur
face
, pro
duce
d ga
s com
posit
ion
mea
sure
d 87
% C
O2
and
13%
CH4
and
on
log
to fi
rst
stat
ion
abov
e zo
ne A
, fog
was
enc
ount
ered
at 2
00 F
BS, w
here
Abs
olut
e ga
s com
posit
ion
show
ed a
n ap
pare
nt d
eclin
e do
wn
to th
e zo
ne a
nd b
elow
. Fra
ctio
n ga
s com
posit
ion
was
rela
tivel
y st
eady
exc
ept o
n ap
proa
ch to
zone
whe
re m
etha
ne b
egan
to fa
ll be
low
the
limit
of d
etec
tion.
In
gene
ral,
durin
g th
e lo
gs
dow
n to
the
othe
r sta
tions
, CO
2 Ab
solu
te m
easu
red
betw
een
2-3
PSI a
nd C
H4 le
ss th
an 1
PSI
(or b
elow
the
limit
of d
etec
tion)
, whi
ch re
nder
s Fra
ctio
n co
mpo
sitio
n in
accu
rate
. As t
he lo
g do
wnw
ards
was
cont
inue
d, a
fo
am la
yer w
as e
ncou
nter
ed a
t 158
5 FB
5, a
nd d
urin
g st
atio
nary
scan
s at 1
590
FBS,
spec
tra
indi
cate
a h
ighl
y flu
ores
cent
or h
ighl
y sc
atte
ring
med
ium
with
spor
adic
indi
catio
ns o
f CH4
and
CO
2 th
at w
eren
’t qu
antif
iabl
e.
On
log
to fi
nal s
tatio
n at
180
5 FB
S, li
quid
wat
er w
as e
ncou
nter
ed a
t 167
0 FB
S, w
hich
the
onbo
ard
cond
uctiv
ity m
eter
mea
sure
d at
~10
0 m
S.Sp
ectr
a in
dica
ted
a hi
ghly
fluo
resc
ent o
r hig
hly
scat
terin
g m
ediu
m w
ith C
H4 a
nd C
O2
spor
adica
lly v
isibl
e bu
t not
qua
ntifi
able
ato
p a
vary
ing
wat
er b
ackg
roun
d. I
n co
ntra
st to
wel
l DD7
, the
re d
id n
ot a
ppea
r to
be a
ctiv
e hi
gh-p
ress
ure
gas b
ubbl
es in
the
fluid
. Du
ring
the
log
to d
epth
and
stat
iona
ry sc
ans,
onbo
ard
tem
pera
ture
met
er re
adin
g ro
se fr
om 1
5 to
21°
C.
Onb
oard
pre
ssur
e m
eter
read
ing
incr
ease
d st
eadi
ly fr
om 1
3 to
15
PSI a
bove
the
foam
and
then
up
to 8
0 PS
I du
ring
the
stat
iona
ry sc
ans i
n flu
id a
t 180
5 FB
S. I
nter
estin
gly
upon
exi
ting
the
fluid
laye
rs, o
nboa
rd
pres
sure
regi
ster
ed a
t 21
PSI.
On
pull
out o
f hol
e, a
fter e
xitin
g th
e fo
am la
yers
, spe
ctra
indi
cate
fluo
resc
ent
resid
ue b
ut q
uant
ifiab
le le
vels
of C
O2
and
CH4:
CO
2 ar
ound
10
PSI a
nd C
H4 1
.5 P
SI o
r mor
e in
Abs
olut
e co
mpo
sitio
n m
easu
rem
ents
. W
hen
mov
ing
up p
ast t
he co
al se
am a
t 984
FBS
(Upp
er H
orse
pen-
10)
met
hane
incr
ease
d, a
nd th
en a
bove
the
top
coal
seam
of z
one
A at
871
FBS
(Sea
boar
d-20
), m
etha
ne
decr
ease
d an
d CO
2 in
crea
sed
sligh
tly.
Both
wer
e th
en st
eady
up
to su
rface
.

+1
(307
) 74
2 63
40in
fo@
wel
ldog
.com
ww
w.w
elld
og.c
om
Res
ervo
ir T
echn
olog
y Cen
ter
1525
Ind
ustr
y D
rive
Lara
mie
, W
yom
ing
8207
0 U
SA
Day
5 :
10 N
ov –
DD8-
Firs
t log
to T
D0
200
400
600
800
1000
1200
1400
1600
1800
05
1015
20
Depth (ft)
CO2
Pres
sure
(PSI
)
Day5
_TD-
1st D
own:
Abs
olut
e
Day5
_TD-
1st D
own:
Fra
ctio
n
Day5
_TD-
1st u
p: A
bsol
ute
Day5
_TD-
1st u
p: F
ract
ion
PerfZ
ones
Seam
s
01
23
4CH
4 Pr
essu
re (P
SI)
Day5
_TD-
1st D
own:
Fra
ctio
n
Day5
_TD-
1st D
own:
Abs
olut
e
Day5
_TD-
1st u
p: A
bsol
ute
Day5
_TD-
1st u
p: F
ract
ion
Perf
Zone
s
Seam
s
1014
1822
Tem
pera
ture
(°C)
Day5
_TD-
1st D
own
Day5
_TD-
1st U
p
PerfZ
ones
Seam
s
2240
5876
94
0 200
400
600
800
1000
1200
1400
1600
1800
1215
1821
Gaug
e pr
essu
re (P
SI)
Day5
_TD-
1st D
own
Day5
_TD-
1st U
pPe
rfZon
esSe
ams

+1
(307
) 74
2 63
40in
fo@
wel
ldog
.com
ww
w.w
elld
og.c
om
Res
ervo
ir T
echn
olog
y Cen
ter
1525
Ind
ustr
y D
rive
Lara
mie
, W
yom
ing
8207
0 U
SA
Day
5 :
10 N
ov –
DD8-
Firs
t log
to T
D: Z
ones
850
1050
1250
1450
1650
1850
05
1015
20
Depth (ft)
CO2
Pres
sure
(PSI
)
Day5
_TD-
1st D
own:
Abs
olut
e
Day5
_TD-
1st D
own:
Fra
ctio
n
Day5
_TD-
1st u
p: A
bsol
ute
Day5
_TD-
1st u
p: F
ract
ion
PerfZ
ones
Seam
s
01
23
4CH
4 Pr
essu
re (P
SI)
Day5
_TD-
1st D
own
Day5
_TD-
1st D
own
Day5
_TD-
1st u
pDa
y5_T
D-1s
t up
Perf
Zone
sSe
ams
1619
22Te
mpe
ratu
re (°
C)
Day5
_TD-
1st D
own
Day5
_TD-
1st U
p
PerfZ
ones
Seam
s
2240
5876
94
850
1050
1250
1450
1650
1850
1215
1821
Gaug
e pr
essu
re (P
SI)
Day5
_TD-
1st D
own
Day5
_TD-
1st U
pPe
rfZon
esSe
ams
Day5
_TD-
1st D
own

+1
(307
) 74
2 63
40in
fo@
wel
ldog
.com
ww
w.w
elld
og.c
om
Res
ervo
ir T
echn
olog
y Cen
ter
1525
Ind
ustr
y D
rive
Lara
mie
, W
yom
ing
8207
0 U
SA
Day
5 :
10 N
ov –
DD8-
1490
Plu
g•
Sum
mar
y: S
urfa
ce to
stat
ions
and
TD
and
POO
H•
Colu
mn
of G
as: A
t sur
face
, pro
duce
d ga
s com
posit
ion
mea
sure
d 84
% C
O2
and
16%
CH4
. O
n do
wnw
ard
log,
th
e fo
g ef
fect
was
obs
erve
d be
twee
n 30
0 FB
S an
d to
the
stat
ion
at 8
70 F
BS, w
here
CO
2 dr
oppe
d fro
m 1
0 PS
I dow
n to
4.5
and
CH4
from
1.7
dow
n to
1 P
SI in
Abs
olut
e co
mpo
sitio
n bu
t Fra
ctio
n co
mpo
sitio
n sh
owed
lit
tle c
hang
e ov
er th
e sa
me
inte
rval
. Du
ring
the
stat
iona
ry sc
ans a
t 870
FBS
, the
fog
was
par
tially
clea
red.
O
n m
ovin
g do
wn
to th
e ne
xt st
atio
n at
115
4 FB
S, u
pon
mov
ing
belo
w th
e se
am a
t 984
FBS
, met
hane
dr
oppe
d. T
he re
st o
f the
log
dow
nwar
ds a
nd st
atio
nary
scan
s wer
e no
ndes
crip
t, th
e ex
cept
ion
of a
pos
sible
di
p in
CH4
afte
r mov
ing
dow
n pa
st th
e se
am a
t 142
2 FB
S (P
ocoh
onta
s#7-
10) a
nd th
en a
spike
aga
in a
fter
mov
ing
dow
n pa
st th
e se
am a
t 146
7 FB
S (P
ocoh
onta
s#7-
20).
Pul
l out
of h
ole
conf
irmed
thes
e tr
ends
in
met
hane
ove
r the
se se
ams i
n zo
ne B
, as w
ell a
s the
upp
er se
ams i
n zo
ne A
. No
flui
d w
as o
bser
ved
accu
mul
ated
on
top
of th
e br
idge
plu
g at
149
0 FB
S.

+1
(307
) 74
2 63
40in
fo@
wel
ldog
.com
ww
w.w
elld
og.c
om
Res
ervo
ir T
echn
olog
y Cen
ter
1525
Ind
ustr
y D
rive
Lara
mie
, W
yom
ing
8207
0 U
SA
Day
5 :
10 N
ov –
DD8-
1490
plu
g
0
200
400
600
800
1000
1200
1400
1600
4.5
6.5
8.5
10.5
12.5
Depth (ft)
CO2
Pres
sure
(PSI
)
1490
Plu
g-Do
wn:
Abs
olut
e14
90 P
lug
-Dow
n: F
ract
ion
1490
Plu
g -U
p: A
bsol
ute
1490
Plu
g -U
p: A
bsol
ute
PerfZ
ones
Seam
s
0.5
1.5
2.5
CH4
Pres
sure
(PSI
)
1490
Plu
g-Do
wn:
Abs
olut
e14
90 P
lug-
Dow
n: F
ract
ion
1490
Plu
g -U
p: A
bsol
ute
1490
Plu
g -U
p: F
ract
ion
PerfZ
ones
Seam
s
711
1519
Tem
pera
ture
(°C)
1490
Plu
g-Do
wn:
Abs
olut
e14
90 P
lug
-Up:
Abs
olut
ePe
rfZon
esSe
ams
0 200
400
600
800
1000
1200
1400
1600
1213
1415
Gaug
e pr
essu
re (P
SI)
1490
Plu
g-Do
wn:
Abs
olut
e14
90 P
lug
-Up:
Abs
olut
ePe
rfZon
esSe
ams

+1
(307
) 74
2 63
40in
fo@
wel
ldog
.com
ww
w.w
elld
og.c
om
Res
ervo
ir T
echn
olog
y Cen
ter
1525
Ind
ustr
y D
rive
Lara
mie
, W
yom
ing
8207
0 U
SA
Day
5 :
10 N
ov –
DD8-
1490
plu
g -S
tatio
ns85
0
950
1050
1150
1250
1350
1450
1550
4.5
6.5
8.5
10.5
12.5
14.5
Depth (ft)
CO2
Pres
sure
(PSI
)
1490
Plu
g-Do
wn:
Abs
olut
e
1490
Plu
g -D
own:
Fra
ctio
n
1490
Plu
g -U
p: A
bsol
ute
1490
Plu
g -U
p: A
bsol
ute
PerfZ
ones
Seam
s
0.5
1.5
2.5
CH4
Pres
sure
(PSI
)
1490
Plu
g-Do
wn:
Abs
olut
e14
90 P
lug-
Dow
n: F
ract
ion
1490
Plu
g -U
p: A
bsol
ute
1490
Plu
g -U
p: F
ract
ion
PerfZ
ones
Seam
s
1317
21Te
mpe
ratu
re (°
C)
1490
Plu
g-Do
wn
1490
Plu
g -U
p
PerfZ
ones
Seam
s
850
950
1050
1150
1250
1350
1450
1550
1313
.514
14.5
15Ga
uge
pres
sure
(PSI
)
1490
Plu
g-Do
wn
1490
Plu
g -U
p
PerfZ
ones
Seam
s

+1
(307
) 74
2 63
40in
fo@
wel
ldog
.com
ww
w.w
elld
og.c
om
Res
ervo
ir T
echn
olog
y Cen
ter
1525
Ind
ustr
y D
rive
Lara
mie
, W
yom
ing
8207
0 U
SA
Day
6 :
11 N
ov –
DD8:
Plu
g at
128
8 an
d 11
32
•Pl
ug w
as se
t at 1
288
FBS
last
nig
ht•
Log
to 8
70 F
BS a
t 60
fpm
, •
then
125
0 at
30
fpm
, sta
tiona
ry•
Up to
870
at 3
0 fp
m, s
tatio
nary
•Do
wn
to 1
160
FBS
at 1
0 fp
m, s
tatio
nary
•PO
OH
at 6
0 fp
m•
Plug
set a
t 113
2, b
ack
in th
e ho
le a
t noo
n•
Log
to d
own
870
at 6
0 fp
m, t
hen
to 1
100
at 3
0 fp
m, s
tatio
nary
•Lo
g up
to 4
00 a
t 30
fpm
•Lo
g do
wn
to 1
00 a
t 60
fpm
, sta
tion
•Lo
g to
800
at 1
0 fp
m, s
tatio
n•
POO
H at
60
fpm

+1
(307
) 74
2 63
40in
fo@
wel
ldog
.com
ww
w.w
elld
og.c
om
Res
ervo
ir T
echn
olog
y Cen
ter
1525
Ind
ustr
y D
rive
Lara
mie
, W
yom
ing
8207
0 U
SA
Day
6 :
11 N
ov –
DD8-
1288
Plu
g•
Sum
mar
y: S
urfa
ce to
dep
th, s
tatio
ns a
nd P
OO
H•
Colu
mn
of G
as:A
t sur
face
, gas
com
posit
ion
mea
sure
d 88
% C
O2
and
12%
CH4
. Du
ring
the
log
to d
epth
, Ab
solu
te g
as co
mpo
sitio
ns sh
owed
a su
dden
incr
ease
d at
450
FBS
, tho
ugh
rela
tive
Frac
tion
com
posit
ion
show
ed o
nly
a st
eady
gra
dual
incr
ease
from
surfa
ce to
just
abo
ve th
e fir
st p
erfo
ratio
n zo
ne.
Upon
pas
sing
dow
nwar
ds th
e co
al se
am a
t 871
FBS
, CO
2 di
pped
and
CH4
incr
ease
d. C
H4 a
gain
trad
ed w
ith C
O2
upon
pa
ssin
g th
e co
al se
am a
t 912
FBS
and
aga
in a
fter p
assin
g th
e se
am a
t 984
FBS
. Re
mar
kabl
y, th
e co
mpo
sitio
n of
gas
es a
t thi
s poi
nt w
as 5
0/50
CO
2/CH
4. C
ontin
uing
dow
nwar
ds, a
fter p
assin
g th
e se
am a
t 10
31, C
O2
incr
ease
d an
d m
etha
ne d
ecre
ased
. Th
e co
mpo
sitio
n be
low
this
poin
t was
bac
k to
the
norm
, 87
% C
O2
and
rem
aind
er C
H4, a
s it a
vera
ged
durin
g th
e st
atio
nary
scan
s at 1
250
FBS.
Dur
ing
the
asce
nt to
87
0 FB
S fo
r sta
tiona
ry sc
ans,
the
pock
et o
f hig
h m
etha
ne g
as co
mpo
sitio
n w
as co
nfirm
ed, a
s wer
e th
e st
eps
in m
etha
ne u
pon
pass
ing
abov
e th
e up
per s
eam
s of z
one
A. T
wo
mor
e pa
sses
of t
he m
etha
ne sp
ike w
ere
acco
mpl
ished
upo
n m
ovin
g do
wnw
ards
to st
atio
nary
scan
s at 1
154
FBS
and
then
on
the
log
to su
rface
.

+1
(307
) 74
2 63
40in
fo@
wel
ldog
.com
ww
w.w
elld
og.c
om
Res
ervo
ir T
echn
olog
y Cen
ter
1525
Ind
ustr
y D
rive
Lara
mie
, W
yom
ing
8207
0 U
SA
Day
6 :
11 N
ov –
DD8-
1288
Plu
g0
200
400
600
800
1000
1200
1400
4.5
9.5
14.5
Depth (ft)
CO2
Pres
sure
(PSI
)
1288
Plu
g-Do
wn:
Abs
olut
e12
88 P
lug-
Dow
n: F
ract
ion
1288
Plu
g-up
1: A
bsol
ute
1288
Plu
g-up
1: F
ract
ion
1288
Plu
g-do
wn2
: Abs
olut
e12
88 P
lug-
dow
n2: F
ract
ion
1288
Plu
g-PO
OH:
Abs
olut
e12
88 P
lug-
POO
H: F
ract
ion
PerfZ
ones
Seam
s
03
69
CH4
Pres
sure
(PSI
)
1288
Plu
g-Do
wn:
Abs
olut
e12
88 P
lug-
Dow
n: F
ract
ion
1288
Plu
g-up
1: A
bsol
ute
1288
Plu
g-up
1: F
ract
ion
1288
Plu
g-do
wn2
: Abs
olut
e12
88 P
lug-
dow
n2: F
ract
ion
1288
Plu
g-PO
OH:
Abs
olut
e12
88 P
lug-
POO
H: F
ract
ion
PerfZ
ones
Seam
s
04
812
1620
Tem
pera
ture
(°C)
1288
Plu
g-Do
wn
1288
Plu
g-up
112
88 P
lug-
dow
n212
88 P
lug-
POO
HPe
rfZon
esSe
ams
0 200
400
600
800
1000
1200
1400
1112
1314
15Ga
uge
pres
sure
(PSI
)
1288
Plu
g-Do
wn
1288
Plu
g-up
112
88 P
lug-
dow
n212
88 P
lug-
POO
HPe
rfZon
esSe
ams

+1
(307
) 74
2 63
40in
fo@
wel
ldog
.com
ww
w.w
elld
og.c
om
Res
ervo
ir T
echn
olog
y Cen
ter
1525
Ind
ustr
y D
rive
Lara
mie
, W
yom
ing
8207
0 U
SA
Day
6 :
11 N
ov –
DD8-
1288
Plu
g: S
tatio
ns
800
900
1000
1100
1200
1300
69
1215
Depth (ft)
CO2
Pres
sure
(PSI
)
1288
Plu
g-Do
wn:
Abs
olut
e12
88 P
lug-
Dow
n: F
ract
ion
1288
Plu
g-up
1: A
bsol
ute
1288
Plu
g-up
1: F
ract
ion
1288
Plu
g-do
wn2
: Abs
olut
e12
88 P
lug-
dow
n2: F
ract
ion
1288
Plu
g-PO
OH:
Abs
olut
e12
88 P
lug-
POO
H: F
ract
ion
PerfZ
ones
Seam
s
800
900
1000
1100
1200
1300
1.5
3.5
5.5
7.5
CH4
Pres
sure
(PSI
)
1288
Plu
g-Do
wn:
Abs
olut
e12
88 P
lug-
Dow
n: F
ract
ion
1288
Plu
g-up
1: A
bsol
ute
1288
Plu
g-up
1: F
ract
ion
1288
Plu
g-do
wn2
: Abs
olut
e12
88 P
lug-
dow
n2: F
ract
ion
1288
Plu
g-PO
OH:
Abs
olut
e12
88 P
lug-
POO
H: F
ract
ion
PerfZ
ones
Seam
s
800
900
1000
1100
1200
1300
812
16Te
mpe
ratu
re (°
C)
1288
Plu
g-Do
wn
1288
Plu
g-up
112
88 P
lug-
dow
n212
88 P
lug-
POO
HPe
rfZon
esSe
ams
800
900
1000
1100
1200
1300
12.5
1313
.514
Gaug
e pr
essu
re (P
SI)
1288
Plu
g-Do
wn
1288
Plu
g-up
112
88 P
lug-
dow
n212
88 P
lug-
POO
HPe
rfZon
esSe
ams

+1
(307
) 74
2 63
40in
fo@
wel
ldog
.com
ww
w.w
elld
og.c
om
Res
ervo
ir T
echn
olog
y Cen
ter
1525
Ind
ustr
y D
rive
Lara
mie
, W
yom
ing
8207
0 U
SA
Day
6 :
11 N
ov –
DD8-
1132
Plu
g•
Sum
mar
y: S
urfa
ce to
dep
th, s
tatio
ns a
nd P
OO
H•
Colu
mn
of G
as:A
t sur
face
, gas
com
posit
ion
mea
sure
d 88
% C
O2
and
12%
CH4
. Du
ring
the
log
to d
epth
, Ab
solu
te g
as co
mpo
sitio
ns d
eclin
ed st
eepl
y be
low
400
FBS
due
to th
e fo
g ef
fect
. Fra
ctio
n co
mpo
sitio
n w
as
rela
tivel
y st
eady
. Up
on p
assin
g do
wnw
ards
the
coal
seam
at 8
71 F
BS, t
he F
ract
ion
CO2
dipp
ed a
nd C
H4
incr
ease
d as
in th
e m
orni
ng ru
n do
wnh
ole.
Aga
in th
e m
etha
ne F
ract
ion
incr
ease
d an
d CO
2 de
crea
sed
in
step
s upo
n pa
ssin
g do
wnw
ards
pas
t the
upp
er se
ams o
f zon
e A.
Bey
ond
the
pock
et o
f met
hane
and
dow
n to
the
plug
, ave
rage
gas
com
posit
ion
was
80%
CO
2 an
d 20
% C
H4.
In m
ultip
le p
asse
s acr
oss t
he u
pper
se
ams o
f zon
e A,
the
prof
ile o
f inc
reas
ed m
etha
ne w
as co
nfirm
ed, i
nclu
ding
on
pull-
out o
f hol
e, a
de
liber
ate,
10
ft/m
in lo
g fro
m th
e pl
ug to
800
FBS
. In
this
final
log,
CO
2:CH
4 w
as 8
4%:1
6% b
etw
een
1100
an
d 10
46 F
BS, t
hen
afte
r pas
sing
abov
e th
e se
am a
t 103
1 FB
S (U
pper
Hor
sepe
n-20
), th
e CH
4 co
nten
t in
crea
sed
and
the
com
posit
ion
was
48%
:52%
up
until
pas
sing
the
seam
at 9
84, w
hen
CH4
drop
ped
and
the
com
posit
ion
was
72%
:28%
unt
il pa
ssin
g th
e se
am a
t 912
FBS
(Low
er S
eabo
ard-
20),
whe
n CH
4 dr
oppe
d ag
ain
and
the
com
posit
ion
was
80%
:20%
unt
il fin
ally
pas
sing
abov
e th
e se
am a
t 871
FBS
(Sea
boar
d-20
), w
hen
CH4
drop
ped
and
the
com
posit
ion
was
87%
:13%
up
to su
rface
.

+1
(307
) 74
2 63
40in
fo@
wel
ldog
.com
ww
w.w
elld
og.c
om
Res
ervo
ir T
echn
olog
y Cen
ter
1525
Ind
ustr
y D
rive
Lara
mie
, W
yom
ing
8207
0 U
SA
Day
6 :
11 N
ov –
DD8-
1132
Plu
g0
200
400
600
800
1000
1200
27
12
Depth (ft)
CO2
Pres
sure
(PSI
)
1132
Plu
g-Do
wn:
Abs
olut
e11
32 P
lug
-Dow
n: F
ract
ion
1132
Plu
g-up
: Abs
olut
e11
32 P
lug-
up: F
ract
ion
1132
Plu
g-Do
wn:
Abs
olut
e11
32 P
lug-
Dow
n: F
ract
ion
1132
Plu
g-Up
: Abs
olut
e11
32 P
lug-
Up: F
ract
ion
PerfZ
ones
Seam
s
02
46
8CH
4 Pr
essu
re (P
SI)
1132
Plu
g-Do
wn:
Abs
olut
e11
32 P
lug
-Dow
n: F
ract
ion
1132
Plu
g-up
: Abs
olut
e11
32 P
lug-
up: F
ract
ion
1132
Plu
g-Do
wn:
Abs
olut
e11
32 P
lug-
Dow
n: F
ract
ion
1132
Plu
g-Up
: Abs
olut
e11
32 P
lug-
Up: F
ract
ion
PerfZ
ones
Seam
s
13.5
15.5
17.5
19.5
Tem
pera
ture
(°C)
1132
Plu
g-Do
wn
1132
Plu
g-up
1132
Plu
g-Do
wn
1132
Plu
g-up
PerfZ
ones
Seam
s
0 200
400
600
800
1000
1200
12.5
1313
.514
14.5
Gaug
e pr
essu
re (P
SI)
1132
Plu
g-Do
wn
1132
Plu
g-up
1132
Plu
g-Do
wn
1132
Plu
g-up
PerfZ
ones
Seam
s

+1
(307
) 74
2 63
40in
fo@
wel
ldog
.com
ww
w.w
elld
og.c
om
Res
ervo
ir T
echn
olog
y Cen
ter
1525
Ind
ustr
y D
rive
Lara
mie
, W
yom
ing
8207
0 U
SA
Day
6 :
11 N
ov –
DD8-
1132
Plu
g: S
tatio
ns80
0
850
900
950
1000
1050
1100
1150
24
68
1012
14
Depth (ft)
CO2
Pres
sure
(PSI
)
1132
Plu
g-Do
wn:
Abs
olut
e11
32 P
lug
-Dow
n: F
ract
ion
1132
Plu
g-up
: Abs
olut
e11
32 P
lug-
up: F
ract
ion
1132
Plu
g-Do
wn:
Abs
olut
e11
32 P
lug-
Dow
n: F
ract
ion
1132
Plu
g-Up
: Abs
olut
e11
32 P
lug-
Up: F
ract
ion
PerfZ
ones
Seam
s
02
46
8CH
4 Pr
essu
re (P
SI)
1132
Plu
g-Do
wn:
Abs
olut
e11
32 P
lug
-Dow
n: F
ract
ion
1132
Plu
g-up
: Abs
olut
e11
32 P
lug-
up: F
ract
ion
1132
Plu
g-Do
wn:
Abs
olut
e11
32 P
lug-
Dow
n: F
ract
ion
1132
Plu
g-Up
: Abs
olut
e11
32 P
lug-
Up: F
ract
ion
PerfZ
ones
Seam
s
13.5
17.5
Tem
pera
ture
(°C)
1132
Plu
g-Do
wn
1132
Plu
g-up
1132
Plu
g-Do
wn
1132
Plu
g-up
PerfZ
ones
Seam
s
800
850
900
950
1000
1050
1100
1150
12.5
1313
.514
14.5
Gaug
e pr
essu
re (P
SI)
1132
Plu
g-Do
wn
1132
Plu
g-up
1132
Plu
g-Do
wn
1132
Plu
g-up
PerfZ
ones
Seam
s

+1
(307
) 74
2 63
40in
fo@
wel
ldog
.com
ww
w.w
elld
og.c
om
Res
ervo
ir T
echn
olog
y Cen
ter
1525
Ind
ustr
y D
rive
Lara
mie
, W
yom
ing
8207
0 U
SA
Day
6 :
11 N
ov –
DD8-
1132
Plu
g: F
inal
10
fpm
log
800
850
900
950
1000
1050
1100
1150
24
68
1012
14
Depth (ft)
CO2
Pres
sure
(PSI
)
1132
Plu
g-Up
: Abs
olut
e
1132
Plu
g-Up
: Fra
ctio
n
PerfZ
ones
Seam
s
02
46
8CH
4 Pr
essu
re (P
SI)
1132
Plu
g-Up
: Abs
olut
e
1132
Plu
g-Up
: Fra
ctio
n
PerfZ
ones
Seam
s
1919
.520
20.5
Tem
pera
ture
(°C)
1132
Plu
g-up
PerfZ
ones
Seam
s
800
850
900
950
1000
1050
1100
1150
1414
.114
.2Ga
uge
pres
sure
(PSI
)
1132
Plu
g-up
PerfZ
ones
Seam
s