Monetary Policy Report - Bank of Thailand · The Monetary Policy Report is prepared quarterly by...
65
Monetary Policy Report June 2015 Monetary Policy Report June 2015
Transcript of Monetary Policy Report - Bank of Thailand · The Monetary Policy Report is prepared quarterly by...
Monetary Policy Report June 2015
Monetary Policy Report
June 2015
Monetary Policy Report June 2015
Monetary Policy Report
The Monetary Policy Report is prepared quarterly by staff of the
Bank of Thailand with the approval of the Monetary Policy Committee
(MPC). It serves two purposes: (1) to communicate to the public the
MPC’s consideration and rationales for the conduct of monetary policy,
and (2) to present the latest set of economic and inflation forecasts, based
on which the monetary policy decisions were made.
The Monetary Policy Committee
June 2015
Mr. Prasarn Trairatvorakul Chairman
Mrs. Pongpen Ruengvirayudh Vice Chairman
Mr. Paiboon Kittisrikangwan Member
Mr. Jamlong Atikul Member
Mr. Porametee Vimolsiri Member
Mr. Veerathai Santiprabhob Member
Mr. Sethaput Suthiwart-Narueput Member
Monetary Policy Report June 2015
Monetary Policy in Thailand
The Monetary Policy Committee
Under the Bank of Thailand Act, the Monetary Policy Committee (MPC) comprises the
Governor and two deputy Governors, as well as four distinguished external members
representing various sectors of the country, with the aim of ensuring that monetary policy
decisions are effective and transparent.
The Monetary Policy Objective
The MPC sets monetary policy to promote the objective of supporting sustainable and full
potential economic growth, without causing inflationary problems or economic and financial
imbalances or bubbles.
The Monetary Policy Target
The Cabinet approved the annual average headline inflation target of 2.5 + 1.5 percent as the
monetary policy target for 2015, in place of the quarterly average core inflation target of 0.5 – 3.0
percent. The new inflation target was jointly proposed by the MPC and the Minister of
Finance. In the event that headline inflation deviates from the target, the MPC shall explain
the reasons behind the target breach to the public, together with measures taken and
estimated time to bring inflation back to the target.
The Monetary Policy Instrument
The MPC utilizes the 1-day bilateral repurchase transaction rate as the policy interest rate to
signal the monetary policy stance.
Evaluation of Economic Conditions and Forecasts
The Bank of Thailand takes into account information from all sources, the macroeconomic
model, data from each economic sector, as well as surveys of large enterprises, together with
small and medium-sized enterprises from all over the country, and various financial institutions
to ensure that economic evaluations and forecasts are accurate and cover all aspects, both at
the macro and micro levels.
Monetary Policy Communication
Recognizing the importance of monetary policy communication to the public, the MPC
employs various channels of communication, both in Thai and English, such as (1) organizing
a press statement at 14.00 on the day of the Committee meeting, (2) publishing edited
minutes of the MPC meeting two weeks after the meeting, and (3) publishing the Monetary
Policy Report every quarter.

Monetary Policy Report June 2015
Monetary Policy Report
June 2015
Contents
1. Growth and Inflation Prospects and Monetary Policy 1
1.1 Growth and inflation prospects 1
1.2 Monetary policy decision 9
1.3 Appendix: Tables for supporting assumptions and forecasts 13
BOX: The changing global trade structure and implications 17
for exports of ASEAN-5 countries
2. Recent Economic Developments 21
2.1 The global economy 21
2.2 The domestic economy 25
2.3 Production cost and price conditions 30
BOX: Structural problems within the Thai exports sector 34
BOX: Changes in household income and implications 37
for economic recovery
BOX: Assessing the probability of deflation risks in Thailand 39
3. Monetary and Financial Stability 43
3.1 Financial markets 43
3.2 Financial institutions 47
3.3 Non-financial sectors 51

Growth and Inflation Prospects
and Monetary Policy
Monetary Policy Report June 2015 1
1. Growth and Inflation Prospects
and Monetary Policy
1.1 Growth and inflation prospects
The economy is projected to recover at a
slower pace than assessed in the previous
Monetary Policy Report. Thai exports fell short of
expectation due to a combination of factors. First,
global economic recovery was held back by
subdued growth in the U.S., China and Asia. The
changing global trade structure also prompted
Thailand’s major trading partners to rely less on
imports (Article in Box 1: The Changing Global
Trade Structure and Implications on Exports of the
ASEAN-5 Countries). Moreover, the Thai exports
sector continued to suffer from structural problems.
The Thai economy is likely to expand at a slower pace than the previous
projection mainly on the back of weaker-than-anticipated exports. Sluggish global
economic recovery, changing global trade structure, and more pronounced
structural constraints in the Thai exports sector together contributed to the
subdued exports. The continued decline in exports adversely affected Thailand’s
economic recovery through lower income, confidence and private spending.
Meanwhile, robust tourism sector and higher public spending, particularly
investment expenditure, provided support to the economy, but could not fully
offset the impacts of aforementioned negative factors.
Inflationary pressures subsided mainly from supply-side factors, causing
headline inflation to remain in a negative territory for longer than previously
assessed. However, headline inflation is expected to pick up in the second half of
2015 and move closer to the inflation target in 2016, as the base effects of high
oil price begins to wane, coupled with expected rises in oil and raw food prices. In
the light of higher economic downside risks and muted inflationary pressure, the
MPC lowered the policy rate at the April meeting to support economic recovery.

2 Monetary Policy Report June 2015
Falling exports had adverse impacts on employment,
incomes and household confidence, thereby
offsetting the positive effects of low oil prices
and more accommodative monetary conditions.
In addition, financial institutions remained cautious in
lending to households, contributing to slower-than-
expected recovery of household consumption.
Private investment is projected to rebound at
a slower pace than previously assessed due to
weakening external and internal demands. Feeble
demands dampened private sector confidence,
prompting firms to delay their new investment until
clearer signs of demand recovery emerged. Public
spending, especially investment expenditure picked
up more strongly than projected, helping to spur
investment by private firms benefitting from
government investment projects. Meanwhile, tourism
is projected to post a solid growth throughout the
forecast period, especially in 2015.
However, accelerating fiscal spending and
robust tourism growth could not offset the negative
impacts from contracting exports and private
spending. The MPC thus projected the Thai
economy to grow by 3.0 percent and 4.1 percent in
2015 and 2016 respectively (Table 1.1).
With inflationary pressures having
dropped below the assessment in the last
Monetary Policy Report, the Committee revised
down headline and core inflation forecasts
throughout the forecast period. Headline inflation
forecast is adjusted downwards primarily because of
supply-side factors, particularly with oil prices
remaining at low levels. The reduction of the
contribution rate to the Oil Fund caused retail oil
prices to increase by less than the rise in global oil
prices. Moreover, raw food prices posted a larger
drop than projected due to an oversupply of
Table 1.1 Forecast summary
Percent 2014* 2015 2016
GDP growth** 0.9 3.0 4.1
(3.8) (3.9)
Headline inflation 1.9 -0.5 1.6
(0.2) (2.2)
Core inflation 1.6 1.0 1.0
(1.2) (1.2)
Note: * Outturn
** Forecast based on database of GDP-CVM (chain volume measure)
( ) MPR Mar 2015
Source: Office of the National Economic and Social Development Board,
Ministry of Commerce and forecast by Bank of Thailand

Monetary Policy Report June 2015 3
agricultural products, especially meat and eggs.
At the same time, demand-side inflationary pressures
weakened in line with slower-than-expected recovery.
Negative headline inflation is thus likely to persist
longer in 2015. Nevertheless, headline inflation is
expected to pick up gradually in the second half of
the year and move closer to the inflation target
in 2016, on the expectation that the base effects of
high oil price will begin to wane while energy and
raw food prices will increase. Core inflation remains
positive but is projected to decline, in line with weak
demand-side pressures resulting from the persistent
negative output gap. The MPC considered deflation
risks to be low, as private consumption continued
to expand, prices of most goods and services
remained stable or rose, and inflation expectations
were close to the target (Table 1.1 and Chart 1.1).
The Committee factored the following key
developments into the growth and inflation forecasts.
(1) The global economy is projected to
grow at slower rate than formerly forecast, due
to a slowdown in the U.S., Chinese and Asian
economies, along with shifting global trade
structure (Table 1.2).
Throughout the forecast period, the quantity
of Thai exports was hit by the slower-than-
expected global recovery, along with the recent
changes in global trade structure that caused
Thailand’s main trading partners to reduce their
reliance on imports and switch to locally made
products. This reduced Thailand’s benefits from
the global economic recovery. The prices of Thai
exports are projected to remain steady at low
levels due to soft demand. Moreover, Thai exports
suffered from structural constraints. The lack of
new investment and product development to
meet the demands of the global market lowered
-12
-10
-8
-6
-4
-2
0
2
4
Q12011
Q12012
Q12013
Q12014
Q12015
Q12016
Q12017
Chart 1.1 Output Gap
Percent
MPR Jun 15 forecast
Note: * Weighted by each trading partner’s share in Thailand’s total exports in 2014
(7 countries: Singapore (6.5%), Hong Kong (7.9%), Malaysia (8.0%), Taiwan
(2.5%), Indonesia (5.9%), South Korea (2.8%) and the Philippines (3.7%)
** Weighted by each trading partner’s share in Thailand’s total exports in 2014
(13 countries)
Table 1.2 Growth assumptions for Thailand’s trading partners
Annual percentage change
(%YoY)
Weight
(%)2014
2015 2016
Mar
2015
Jun
2015
Mar
2015
Jun
2015
The U.S. 14.9 2.4 3.2 2.1 2.9 2.9
The euro area 10.0 0.9 1.1 1.3 1.5 1.6
Japan 13.6 0.0 1.0 0.8 1.4 1.4
China 15.7 7.4 7.0 6.9 6.9 6.8
Asia (excluding Japan and China)*
37.4 4.1 4.2 4.0 4.4 4.4
Total** 100 3.5 3.7 3.3 3.9 3.8
Note: * Weighted by each trading partner’s share in Thailand’s total exports in 2014
(7 countries: Singapore (6.5%), Hong Kong (7.9%), Malaysia (8.0%), Taiwan (2.5%),
Indonesia (5.9%), South Korea (2.8%) and the Philippines (3.7%)
** Weighted by each trading partner’s share in Thailand’s total exports in 2014
(13 countries)
4 Monetary Policy Report June 2015
Thailand’s competitiveness. Rectifying these
structural problems will take time.
Moreover, in recent periods certain groups
of Thai exports were affected by exchange rate
movements, particularly for goods where Thailand
competed with other countries whose currencies
had become significantly weaker against the baht.
Nonetheless, the weaker baht in 2015 Q2 following
the policy rate cut, coupled with the ensuing
announcement of BOT’s measures on capital flows
relaxation, should boost exporters’ profits in baht
terms and provide additional support for the price-
sensitive exports sectors somewhat. However, the
positive effects may not be immediately felt because
it takes time for foreign buyers to revise their orders.
In addition, the prices of Thai exports may have to
be lowered in some product categories where Thai
exporters have weak negotiation powers over prices,
thereby limiting the positive impacts of the weaker
baht.
Exports of services posted a solid expansion
from the growing number of Chinese tourists,
supporting the economy. The lifting of martial law in
April 2015 and more apparent signs of recovery
in the euro area economies pointed to a brighter
outlook for the tourism sector in periods ahead.
The contraction of exports curbed
employment in the manufacturing exports sector.
Falling household incomes and eroding confidence
prompted consumers to be more cautious with
spending. Slow economic recovery further weakened
business confidence which, combined with sizable
excess production capacity, led the private sector to
delay investment plans. Meanwhile, sluggish global
recovery continued to weigh down commodity
prices, especially agricultural prices, and continued

Monetary Policy Report June 2015 5
to impact farm incomes and private consumption in
the next periods.
In the MPC’s view, global economic
growth could turn out to be below the base case
scenario for the following reasons: (1) The economic
slowdown in China could be worse than assessed
due to the lower-than-expected impact from
government stimulus; (2) China’s economic
slowdown could weigh down ASEAN economies
more than expected; and (3) The recovery of the
euro area economies could be slower than expected,
should Greece’s default cause excessive volatility
in financial markets and erode investor confidence.
(2) The government provides additional
boost to the economy through public investment.
The Committee revised upwards the
assumptions on public spending as the central
government managed to accelerate the disbursement
of public investment expenditure in early 2015. This
was partly because the public sector had entered
into contracts for investment projects more quickly
and in greater amounts than expected, which helped
sustain public investment spending. Moreover, the
government announced further extra-budgetary
spending under the second phase of the fiscal
stimulus. Major investment plans, including water
management system and urgent road transport
infrastructure development, are likely to provide
ongoing boost to the economy. However, there were
delays and revisions of plan in some state enterprise
investment projects, such as the second phase of
the Suvarnabhumi Airport development plan.
Going forward, higher and sustained public
spending will underpin private sector confidence and
shore up private investment by firms involved in the
government projects. The impacts are likely to be
more pronounced in late 2015 and 2016 when the

6 Monetary Policy Report June 2015
construction of public infrastructure projects is
scheduled to begin and larger budget disbursements
are expected. Moreover, the water management and
road transport development plans consist mostly of
small and medium spending projects which can be
implemented relatively swiftly. These projects can
thus provide an immediate boost to employment and
incomes in local areas, thereby helping to revitalize
household consumption to some extent.
The Committee assessed the risk of public
spending overshooting the baseline projection to be
higher than that of public spending undershooting it.
The central government might be able to expedite
extra-budgetary spending through the water
management and road transport development
projects more quickly than currently assessed.
This will alleviate some of the labor constraints in
the construction sector especially in the later part of
the forecast period, as well as facilitate the
implementation of projects under the normal
budgetary process. Nonetheless, the downside risk
that budget disbursement capacity might not keep
pace with the budget increase requires ongoing
monitoring.
(3) The increase in global oil prices in
2015 Q2.
The Committee slightly revised upwards the
baseline assumption for crude oil price in 2015 from
60 to 61.7 U.S. dollars per barrel. The revision
followed the larger-than-expected increase in oil
prices in 2015 Q2, fueled by stronger global demand
amidst global economic recovery as well as
moderating rate of increase in U.S. oil production
from closures of some oil fields. Meanwhile, crude
stockpiles began to decline, contributing to the
higher oil prices. Looking ahead, however, the rise in
crude prices are likely to be limited on the following

Monetary Policy Report June 2015 7
grounds: (1) Demand remains soft amidst slow
global recovery. (2) Supply should increase as shale
oil production in the U.S. resumes, with higher oil
prices making production viable again. The MPC
therefore maintains the crude price baseline
assumption for 2016 at 70 U.S. dollars per barrel
(Chart 1.2).
Higher oil prices will put upward pressure
on the prices of other commodities that exhibit a
high degree of comovements with oil prices, giving
a boost to our exports. Moreover, higher crude price
will translate into higher domestic retail oil prices,
which will in turn push headline inflation up to
positive territory in Q4 2015 and subsequently to a
level close to the inflation target in 2016.
According to the MPC’s evaluation, the
crude price could undershoot the baseline
assumption, on the back of higher-than-expected
oil supply driven by the following factors: (1) Iran
could resume exporting oil if the negotiation on the
lifting of sanctions is successful. (2) OPEC
countries could raise oil production by more than
previously assessed in order to maintain market
share. (3) Shale oil producers could further
expand production due to greater production
efficiency. Meanwhile, demand for oil could fall
below the expected level, in line with the pace of
global recovery which may fall short of the
baseline assumption.
Downside Risks to Growth and Inflation Forecasts
According to the MPC’s assessment,
the probability that growth will be below our
baseline projection is higher than the probability
that it will be above the baseline projection.
This assessment is depicted in the growth fan
chart, which is skewed downwards throughout
the forecast period (Chart 1.3).
20
40
60
80
100
120
Q12012
Q12013
Q12014
Q1 2015
Q12016
Q12017
Chart 1.2 Assumptions on Dubai oil price
Mar 2015 (baseline) Jun 2015 (high case 1.0 S.D.)
Jun 2015 (baseline) Jun 2015 (low case 1.5 S.D.)
U.S. dollars per barrel

8 Monetary Policy Report June 2015
Downside risks to economic growth stem
from the following: (1) The pace of global economic
recovery could be slower than anticipated, especially
in China and Asia. (2) The negative impacts of the
shifting global trade structure on Thai exports
could be greater than expected. (3) Public spending
could fall short of anticipation due to limitations in
disbursements, especially for investment projects.
Upside Risk factors to growth could arise
from the following sources: (1) Public spending
could exceed the previous forecast due to quicker
implementation of second-round fiscal stimulus
measures, which could in turn spur more private
investment. (2) Crude oil prices could be below
the baseline projection, providing support to the
pick-up in household spending.
The Committee judges that headline and
core inflation are more likely to fall below
the central projection than to surpass it.
The greater downside risk is reflected in the
inflation fan charts that are skewed downwards
throughout the forecast period (Charts 1.4
and 1.5). The assessment is based on the risk
factors concerning crude oil prices and the
possibility that economic growth would be lower
than the baseline projection.
-10
-5
0
5
10
15
-10
-5
0
5
10
15
Chart 1.3 GDP growth forecast
Annual percentage change
Note: The fan chart covers 90 percent of the probability distribution.
Q1 Q1 Q1 Q1
2014 2015 2016 2017
-2
-1
0
1
2
3
4
-2
-1
0
1
2
3
4
Q1 Q1 Q1 Q1
2014
Chart 1 5 Core inflation forecast
Annual percentage change
Note: The fan chart covers 90 percent of the probability distribution.
2015 2016 2017
-4
-2
0
2
4
6
-4
-2
0
2
4
6
Headline inflation target (2.5% 1.5% yearly average)
Chart 1.4 Headline inflation forecast
Annual percentage change
Note: The fan chart covers 90 percent of the probability distribution.
Q1 Q1 Q1 Q1
2014 2015 2016 2017

Monetary Policy Report June 2015 9
1.2 Monetary policy decision
Monetary policy stance has become
more accommodative.
Monetary policy has played a greater role
in supporting economic recovery during 2015 Q2,
amidst greater downside risks and subdued
inflationary pressures. At the meeting on April 29,
2015, the MPC voted to reduce the policy interest
rate by 0.25 percent, following the previous rate
cut in March.
After the MPC’s decision to lower the
policy rate by 0.25 percent at the meeting on
March 11, 2015, the overall monetary conditions
became more accommodative. Commercial banks’
deposit and lending rates gradually declined,
accompanied by lower government bond yields
across all maturities. These adjustments partly
eased the financial burden and financing costs
faced by the business and household sectors.
The baht depreciated for brief periods following
the reduction in the policy rate, but subsequently
rose due to external factors.
At the meeting on April 29, 2015, the MPC
agreed that Thailand’s economic growth in 2015
would fall short of the earlier assessment, and that
various monetary policy tools must be used to
further ease financial conditions. The Committee
thus voted 5 to 2 to reduce the policy interest rate
by 0.25 percent, from 1.75 percent to 1.50 percent.
The MPC had a thorough deliberation on
monetary policy space, in the light of the uncertain
prospects of internal and external factors. The
Committee considered the effective lower bound
of the policy rate to be above zero percent. Should
the policy rate move to very low levels, the interest

10 Monetary Policy Report June 2015
rate transmission mechanism could become more
limited. This is because, even if the policy rate
were to fall below the effective lower bound,
commercial banks might not be able to cut lending
rates any further given the constraints of their
asset composition and funding structure.
Furthermore, despite the historically low
rate of 1.25 percent in the wake of the global
financial crisis in 2009, the Committee judged that
the effective lower bound of the policy rate
depends on the prevailing economic and financial
environment at particular moments. These
conditions, such as loan quality outlook, saving
alternatives and level of competition in the
financial sector, could deviate from the past.
Aside from the above policy deliberation,
the MPC discussed the possibility of stronger
growth momentum in 2015 Q2. The Committee
paid considerable attention to the fiscal boost and
the risks posed to Thai exports stemming from the
slowdown in Thailand’s major trading partners and
structural changes in global trade. In the light of
these downside risks, the majority of the MPC
members deemed a policy rate reduction
necessary as a pre-emptive measure to bolster to
the economy. They judged that the rate cut would
not only reduce the financial burden of business
and household sectors, but also lead to exchange
rate adjustments that are more conducive to
economic recovery. Moreover, given that headline
inflation could remain below the lower bound of
the target for longer than expected, the policy rate
cut would help anchor inflation expectations and
ease deflation risks which, although still low, had
increased slightly since the previous MPC meeting.

Monetary Policy Report June 2015 11
Nonetheless, the minority of the MPC
members believed that policy space should be
preserved for countering future risks, such as the
slowdown of the Chinese economy and domestic
political uncertainties. Furthermore, the effects of
the policy rate reduction on March 11 had not
been fully transmitted to the real economy,
highlighting the need to evaluate the impacts on
the economy and financial stability before any
additional easing monetary policy. Meanwhile,
higher fiscal spending and more accommodative
monetary conditions should help foster the
economic recovery to a certain degree.
The decision to reduce the policy interest
rate this time further eased monetary conditions,
particularly through the exchange rate adjustment.
The baht depreciation was partly a result of the
ensuing announcement of BOT’s measures on
capital flows relaxation on April 30, 2015. The
MPC noted and agreed with the BOT’s plans to
relax foreign exchange regulations under the
Capital Account Liberalization Master Plan. The
Committee also realized the importance of the
BOT’s effective communication with the public to
promote better understanding of exchange rate
movement and its economic impacts. This would
help the business sector adapt and manage
exchange rate risks more effectively under
different circumstances.
Subsequently at the meeting on June 10,
2015, the Committee unanimously decided to
maintain the policy rate at 1.50 percent. The MPC
believed that the pace of Thailand’s economic
recovery was still close to the assessment made
in the previous meeting. Growth momentum in
2015 Q1 and April softened from feeble private
spending and continued contraction in exports,
in part a result of a slowdown in the Chinese
12 Monetary Policy Report June 2015
and Asian economies as well as a shift in the
global trade structure. Nevertheless, improved
disbursements of public investment expenditure
and robust tourism growth continued to provide
support to the economy.
Headline inflation continued to stay in a
negative territory due mainly to energy costs and
raw food prices. Core inflation remained positive
but edged slightly downward due to subdued
demand-side pressure. The MPC considered
deflation risks to remain low on the grounds that
private consumption continued to expand, prices
of most goods and services were stable or rose,
and inflation expectations remained close to the
inflation target.
The Committee judged that the conduct of
monetary policy had thus far eased monetary
conditions, while the direction of exchange rate
movement had become more conducive to
the economic recovery. Nonetheless, the Thai
economy still faced downside risks, especially
those stemming from sluggish global recovery,
especially China and other Asian economies.
Going forward, the Committee will closely monitor
Thailand’s economic and financial developments
and stand ready to utilize the available policy
space appropriately to ensure sufficiently
accommodative monetary conditions to foster a
recovery of the Thai economy. The MPC will also
assess financial imbalances that could build up in
a prolonged low interest rate environment, thereby
ensuring the country’s long-term financial stability.
Monetary Policy Report June 2015 13
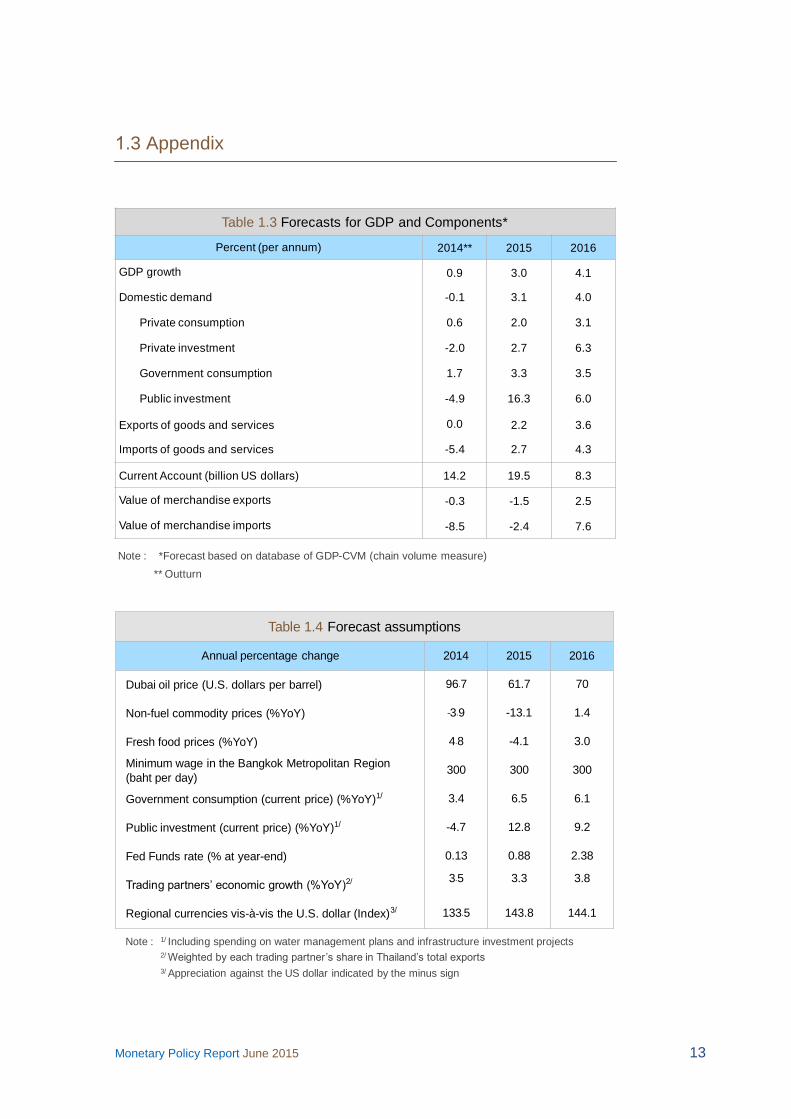
1.3 Appendix
Table 1.3 Forecasts for GDP and Components*
Percent (per annum) 2014** 2015 2016
GDP growth 0.9 3.0 4.1
Domestic demand -0.1 3.1 4.0
Private consumption 0.6 2.0 3.1
Private investment -2.0 2.7 6.3
Government consumption 1.7 3.3 3.5
Public investment -4.9 16.3 6.0
Exports of goods and services 0.0 2.2 3.6
Imports of goods and services -5.4 2.7 4.3
Current Account (billion US dollars) 14.2 19.5 8.3
Value of merchandise exports -0.3 -1.5 2.5
Value of merchandise imports -8.5 -2.4 7.6
Note : *Forecast based on database of GDP-CVM (chain volume measure)
** Outturn
Table 1.4 Forecast assumptions
Annual percentage change 2014 2015 2016
Dubai oil price (U.S. dollars per barrel) 96 7 61.7 70
Non-fuel commodity prices (%YoY) -3 9 -13.1 1.4
Fresh food prices (%YoY) 4 8 -4.1 3.0
Minimum wage in the Bangkok Metropolitan Region
(baht per day)300 300 300
Government consumption (current price) (%YoY)1/ 3.4 6.5 6.1
Public investment (current price) (%YoY)1/ -4.7 12.8 9.2
Fed Funds rate (% at year-end) 0.13 0.88 2.38
Trading partners’ economic growth (%YoY)2 3 5 3.3 3.8
Regional currencies vis-à-vis the U.S. dollar (Index) 133 5 143.8 144.1
Note : 1/ Including spending on water management plans and infrastructure investment projects2/ Weighted by each trading partner’s share in Thailand’s total exports
3/ Appreciation against the US dollar indicated by the minus sign

14 Monetary Policy Report June 2015
Table 1.5 GDP growth forecasts by research houses
2015 2016
Standard Chartered 4.1 4.8
Barclays 3.7 4.5
FPO1/ 3.7 -
HSBC 3.6 3.1
Maybank Kim Eng 3.5 4.5
JP Morgan 3.5 3.8
NESDB2/ 3.0-4.0 -
Kiatnakin Bank 3.3 3.7
Phatra 3.3 3.7
DBS Bank 3.2 4.5
Tisco Securities 3.2 4.0
Credit Suisse 3.1 3.8
BOT 3.0 4.1
Capital Economics 3.0 3.5
Kasikorn Research 2.8 3.5
Nomura 2.7 3.5
Note: Compiled and published by Reuters on June 8, 2015, except:1/ Published on April 29, 20152/ Published on May 18, 2015, with the release of GDP data for 2015 Q1
Presented in descending order of 2015’s forecast
Table 1. Headline inflation forecasts by research houses
2015 2016
Kasikorn Research 0.5 2.7
Standard Chartered 0.5 2.5
Nomura 0.3 1.2
Credit Suisse 0.3 -
Barclays 0.2 2.5
Kiatnakin Bank 0.2 2.3
Phatra 0.2 2.3
FPO1/ 0.2 -
NESDB2 (-0.3)-0.7 -
HSBC 0.0 2.6
DBS Bank -0.2 2.0
BOT -0.5 1.6
JP Morgan -0.7 2.0
Note: Compiled and published by Reuters on June 8, 2015, except:1/ Published on April 29, 20152/ Published on May 18, 2015, with the release of GDP data for 2015 Q1
Presented in descending order of 2015’s forecast

Monetary Policy Report June 2015 15
2017
Q2 Q3 Q4 Q1 Q2 Q3 Q4 Q1
> 12 0 0 0 0 0 0 0 0
10-12 0 0 0 1 2 2 1 2
8-10 0 0 1 5 7 6 5 6
6-8 0 5 9 16 19 16 14 13
4-6 10 25 27 28 28 25 23 21
2-4 51 42 34 27 25 25 25 24
0-2 35 23 21 15 14 16 18 18
(-2)-0 4 5 6 5 5 7 9 10
< (-2) 0 0 1 1 1 2 4 6
Percent
Table 1.7 Probability distribution of GDP growth forecast
20162015
2017
Q2 Q3 Q4 Q1 Q2 Q3 Q4 Q1
6-7 0 0 0 0 1 1 1 1
5-6 0 0 0 1 3 3 3 3
4-5 0 0 0 4 7 7 7 7
3-4 0 0 2 10 14 13 12 13
2-3 0 2 7 17 20 19 18 18
1-2 1 8 16 22 21 21 20 20
0-1 10 21 24 20 17 17 18 17
(-1)-(0) 34 31 24 14 10 11 12 11
(-2)-(-1) 39 25 16 7 5 5 6 6
(-3)-(-2) 15 11 7 3 2 2 3 3
(-4)-(-3) 2 3 2 1 0 1 1 1
Table 1.8 Probability distribution of headline inflation forecast
Percent20162015

16 Monetary Policy Report June 2015
2017
Q2 Q3 Q4 Q1 Q2 Q3 Q4 Q1
3.5-4.0 0 0 0 0 0 0 0 1
3.0-3.5 0 0 0 0 0 1 2 3
2.5-3.0 0 0 0 1 2 3 5 7
2.0-2.5 0 1 3 4 6 9 11 13
1.5-2.0 7 9 10 11 14 17 18 19
1.0-1.5 37 27 23 20 22 22 22 21
0.5-1.0 42 35 29 25 23 21 19 17
0.0-0.5 12 21 22 21 17 15 13 11
(-1)-0.0 1 6 10 12 9 8 6 6
(-2)-(-1) 0 1 3 5 4 3 2 2
< -2 0 0 0 2 1 1 1 1
Table 1.9 Probability distribution of core inflation forecast
Percent20162015
Monetary Policy Report June 2015 17
The changing global trade structure and implications for exports
of ASEAN-5 countries1/
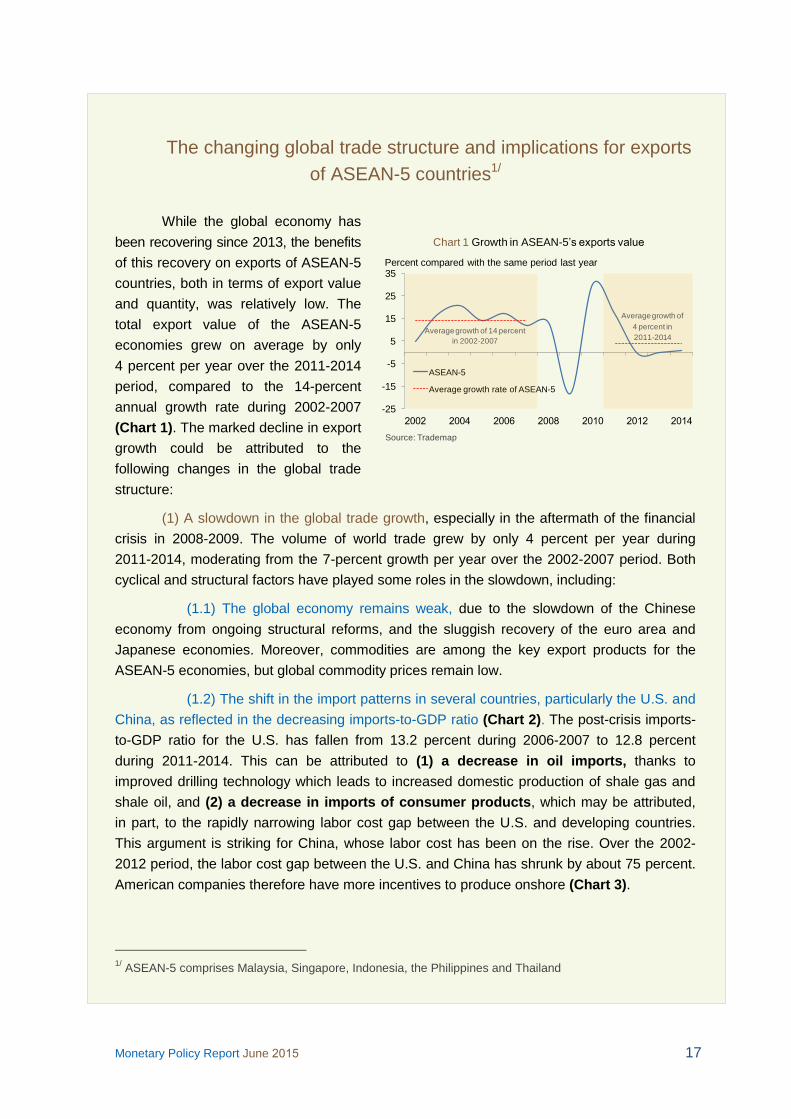
While the global economy has
been recovering since 2013, the benefits
of this recovery on exports of ASEAN-5
countries, both in terms of export value
and quantity, was relatively low. The
total export value of the ASEAN-5
economies grew on average by only
4 percent per year over the 2011-2014
period, compared to the 14-percent
annual growth rate during 2002-2007
(Chart 1). The marked decline in export
growth could be attributed to the
following changes in the global trade
structure:
(1) A slowdown in the global trade growth, especially in the aftermath of the financial
crisis in 2008-2009. The volume of world trade grew by only 4 percent per year during
2011-2014, moderating from the 7-percent growth per year over the 2002-2007 period. Both
cyclical and structural factors have played some roles in the slowdown, including:
(1.1) The global economy remains weak, due to the slowdown of the Chinese
economy from ongoing structural reforms, and the sluggish recovery of the euro area and
Japanese economies. Moreover, commodities are among the key export products for the
ASEAN-5 economies, but global commodity prices remain low.
(1.2) The shift in the import patterns in several countries, particularly the U.S. and
China, as reflected in the decreasing imports-to-GDP ratio (Chart 2). The post-crisis imports-
to-GDP ratio for the U.S. has fallen from 13.2 percent during 2006-2007 to 12.8 percent
during 2011-2014. This can be attributed to (1) a decrease in oil imports, thanks to
improved drilling technology which leads to increased domestic production of shale gas and
shale oil, and (2) a decrease in imports of consumer products, which may be attributed,
in part, to the rapidly narrowing labor cost gap between the U.S. and developing countries.
This argument is striking for China, whose labor cost has been on the rise. Over the 2002-
2012 period, the labor cost gap between the U.S. and China has shrunk by about 75 percent.
American companies therefore have more incentives to produce onshore (Chart 3).
1/
ASEAN-5 comprises Malaysia, Singapore, Indonesia, the Philippines and Thailand
-25
-15
-5
5
15
25
35
ASEAN-5
Average growth rate of ASEAN-5
Percent compared with the same period last year
Average growth of 14 percent
in 2002-2007
Average growth of
4 percent in
2011-2014
Chart 1 Growth in ASEAN-5’s exports value
Source: Trademap

18 Monetary Policy Report June 2015
Meanwhile, China has increased its share of spending on domestically produced
goods including raw materials, intermediate goods, and consumer goods in response to the
country’s ongoing economic reforms which promotes the development of domestic industrial
clusters. The result of the reform policies is reflected by the increase in the ratio of goods
produced for domestic consumption to total production in China across all goods categories
(Chart 4). Moreover, since 2011, the reforms have shifted the growth driver for the Chinese
economy from an investment-led growth model to a consumption-led one. This has reduced
China’s reliance on commodity imports, which constitute the majority of imports from ASEAN-5.
Indeed, China is the world’s largest importer of commodities, with its share making up -60
percent of total global imports. Imported commodities are mostly used for investment purposes,
i.e. steel, coal, aluminum and copper (Chart 5).
(1.3) The development of industrial clusters in the ASEAN-5 countries. Foreign
direct investment (FDI) in emerging markets over the past 10 years, which had gone into the
development of upstream, midstream and downstream industries, have brought about a
decline in the exports of intermediate goods by Asian countries. (For more detailed analysis,
please refer to the article “The Shifting Global Trade Structure” in the June 2014 Monetary
Policy Report.)
0
2
4
6
8
10
12
14
10
15
20
25
30
35
1997 1999 2001 2003 2005 2007 2009 2011 2013
Euro area China
U.S. (right axis) Japan (right axis)
China’s accession to the WTO
Chart 2 Imports volume to the size of the real economy ratio
PercentPercent
Source: CEIC, Oxford Model
Chart 4 Ratio of domestic consumption
and exports to total production in China
Rationale: The figures show the ratio of domestic consumption to total production
Source: NBS
0
2,000
4,000
6,000
8,000
10,000
12,000
14,000
Total
0
500
1,000
1,500
2,000
2,500
Non-metals Apparels Food Chemicals Metals Machinery
For domestic consumption For export
95.3 67.974.0
95.4
96.7 88.3
89.988.9
93.3
72.2
79.0
88.3
91.1
93.5
Ten billion RMB Ten billion RMB
65
50 48 4745
10
27 27
4.5
0
10
20
30
40
50
60
70
Metals Coal Steel Aluminum Bronze Petroleum Cotton Rubber Rice
Chart 5 Ratio of China’s commodity imports
to total global imports
Source: IMF’s article titled “China’s Impact on World Commodity Markets”
Percent
Chart 3 Ratio of relocation of U.S. production base to
other countries in various sectors
Source: U.S. Bureau of Economic Analysis and HKMA staff estimate
Percentage of total domestic consumption
Miscellaneous Computers & electronics
Appliances & electrical
Textiles & fabrics
Clothing & footwares
2000–2007 2007–201330
25
20
15
10
5
0
-5
Monetary Policy Report June 2015 19
(2) A decline in the share of ASEAN-5 exports in the global market, dropping from 6.1
percent of total global exports in 2011 to 5.9 percent in 2014. By contrast, the global market
share of exports from Emerging and Developing Europe2/ grew from 3.1 percent to 3.4
percent, while the global market share of exports from CLMV countries3/ increased from 0.6
percent to 1.1 percent during the same period. The decline in market share of exports of
ASEAN-5 countries could be attributed to the following factors:
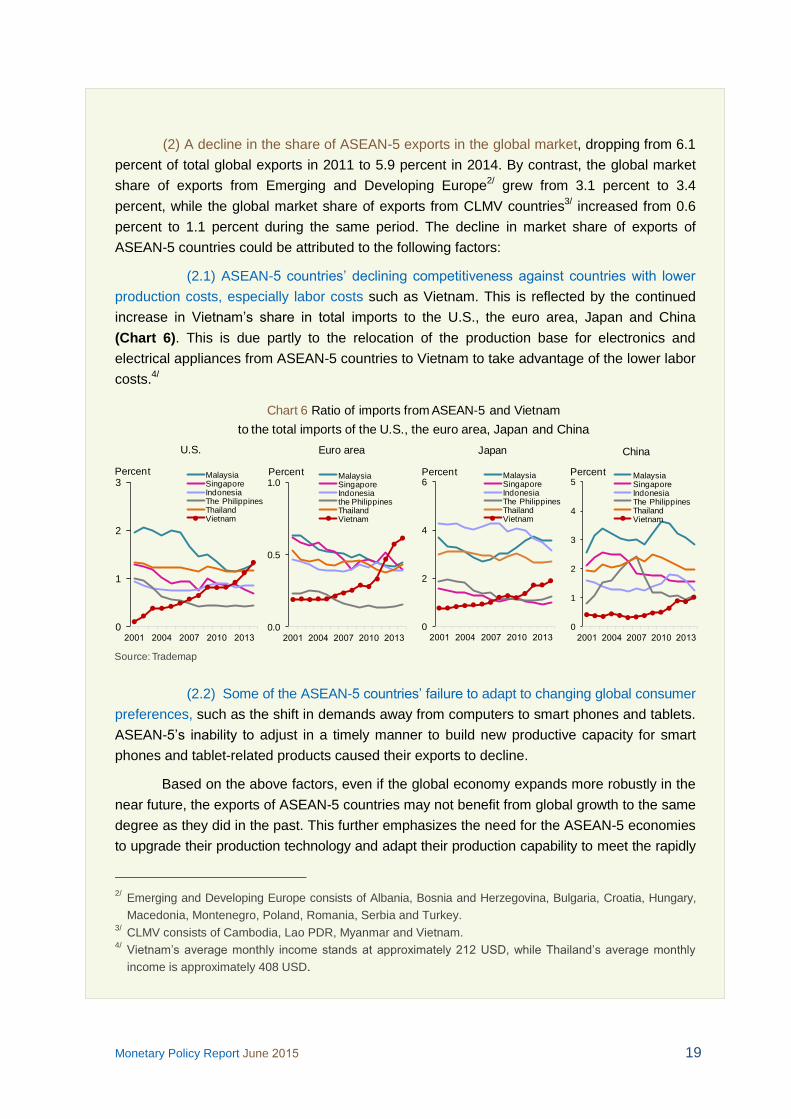
(2.1) ASEAN-5 countries’ declining competitiveness against countries with lower
production costs, especially labor costs such as Vietnam. This is reflected by the continued
increase in Vietnam’s share in total imports to the U.S., the euro area, Japan and China
(Chart 6). This is due partly to the relocation of the production base for electronics and
electrical appliances from ASEAN-5 countries to Vietnam to take advantage of the lower labor
costs.4/
(2.2) Some of the ASEAN-5 countries’ failure to adapt to changing global consumer
preferences, such as the shift in demands away from computers to smart phones and tablets.
ASEAN-5’s inability to adjust in a timely manner to build new productive capacity for smart
phones and tablet-related products caused their exports to decline.
Based on the above factors, even if the global economy expands more robustly in the
near future, the exports of ASEAN-5 countries may not benefit from global growth to the same
degree as they did in the past. This further emphasizes the need for the ASEAN-5 economies
to upgrade their production technology and adapt their production capability to meet the rapidly
2/
Emerging and Developing Europe consists of Albania, Bosnia and Herzegovina, Bulgaria, Croatia, Hungary,
Macedonia, Montenegro, Poland, Romania, Serbia and Turkey. 3/
CLMV consists of Cambodia, Lao PDR, Myanmar and Vietnam. 4/
Vietnam’s average monthly income stands at approximately USD, while Thailand’s average monthly
income is approximately 408 USD.
0
1
2
3
MalaysiaSingaporeIndonesiaThe PhilippinesThailandVietnam
U.S.
0.0
0.5
1.0
MalaysiaSingaporeIndonesiathe PhilippinesThailandVietnam
Euro area
0
2
4
6
MalaysiaSingaporeIndonesiaThe PhilippinesThailandVietnam
Japan
0
1
2
3
4
5
MalaysiaSingaporeIndonesiaThe PhilippinesThailandVietnam
China
Chart 6 Ratio of imports from ASEAN-5 and Vietnam
to the total imports of the U.S., the euro area, Japan and China
Source: Trademap
Percent Percent Percent Percent

20 Monetary Policy Report June 2015
changing consumer preferences. Such adjustment would improve ASEAN-5’s competitiveness
and help maintain its market share in global exports, thus allowing the group to maximize the
benefits from global economic recovery. It is, however, worth noting that some ASEAN-5
countries have already implemented economic reforms in response to the changing global
trade structure. Singapore places a strong emphasis on the exports of services, which yield
higher value-added than the exports of goods. Singapore is also striving to become the region’s
supply chain management hub. Malaysia has implemented its Economic Transformation
Program (ETP) since 2010, with a goal to upgrade its production capability, boosting export
values, and be more responsive to the rapidly changing global demand. Likewise, Thailand
should place priorities on upgrading country’s exports structure, in order to enhance its
production capabilities and competitiveness in the global market.
Recent Economic Developments
Monetary Policy Report June 2015 21
2. Recent Economic Developments
2.1 The global economy
The global economy expanded at a slower
pace than assessed in the last monetary policy
report due to slower growth in the U.S., Chinese
and Asian economies. Meanwhile, the euro area
economies exhibited clearer signs of recovery.
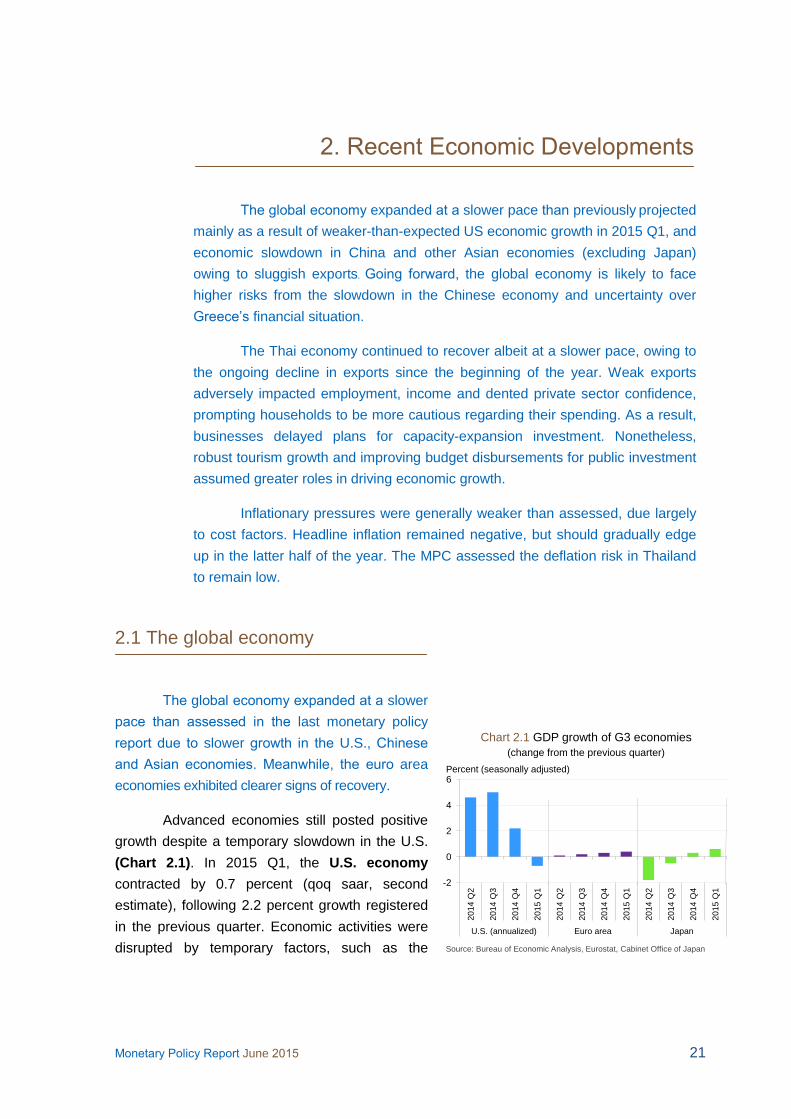
Advanced economies still posted positive
growth despite a temporary slowdown in the U.S.
(Chart 2.1). In 2015 Q1, the U.S. economy
contracted by 0.7 percent (qoq saar, second
estimate), following 2.2 percent growth registered
in the previous quarter. Economic activities were
disrupted by temporary factors, such as the
The global economy expanded at a slower pace than previously projected
mainly as a result of weaker-than-expected US economic growth in 2015 Q1, and
economic slowdown in China and other Asian economies (excluding Japan)
owing to sluggish exports. Going forward, the global economy is likely to face
higher risks from the slowdown in the Chinese economy and uncertainty over
Greece’s financial situation.
The Thai economy continued to recover albeit at a slower pace, owing to
the ongoing decline in exports since the beginning of the year. Weak exports
adversely impacted employment, income and dented private sector confidence,
prompting households to be more cautious regarding their spending. As a result,
businesses delayed plans for capacity-expansion investment. Nonetheless,
robust tourism growth and improving budget disbursements for public investment
assumed greater roles in driving economic growth.
Inflationary pressures were generally weaker than assessed, due largely
to cost factors. Headline inflation remained negative, but should gradually edge
up in the latter half of the year. The MPC assessed the deflation risk in Thailand
to remain low.
-2
0
2
4
6
2014 Q
2
2014 Q
3
2014 Q
4
2015 Q
1
2014 Q
2
2014 Q
3
2014 Q
4
2015 Q
1
2014 Q
2
2014 Q
3
2014 Q
4
2015 Q
1
U.S. (annualized) Euro area Japan
Source: Bureau of Economic Analysis, Eurostat, Cabinet Office of Japan
Chart 2.1 GDP growth of G3 economies
(change from the previous quarter)
Percent (seasonally adjusted)
22 Monetary Policy Report June 2015
severe winter weather and dock workers protests
at the West Coast ports. Moreover, stronger U.S.
dollar increasingly weighed down net exports.
Investment in the energy sector also declined by
falling oil prices.
In contrast, the euro area economy1/
expanded by 0.4 percent (qoq sa) in 2015 Q1, up
from 0.3 percent recorded in the previous quarter
as Spain, France and Italy posted higher growth.
Meanwhile, the German economy grew at a
decelerated pace. Overall growth pickup in the
euro area economy was owing to higher private
consumption, which benefited from low oil prices
and more accommodative monetary conditions as
well as improved exports in line with the weaker euro.
The Japanese economy continued to
gradually recover, posting a positive growth of 0.6
percent (qoq sa) in 2015 Q1, up from 0.4 percent
recorded in the previous quarter. Growth was
driven mainly from higher inventory build-up, while
consumption and private investment growth
remained subdued. Exports continued to edge up
in line with demands from major trading partners,
particularly the U.S.
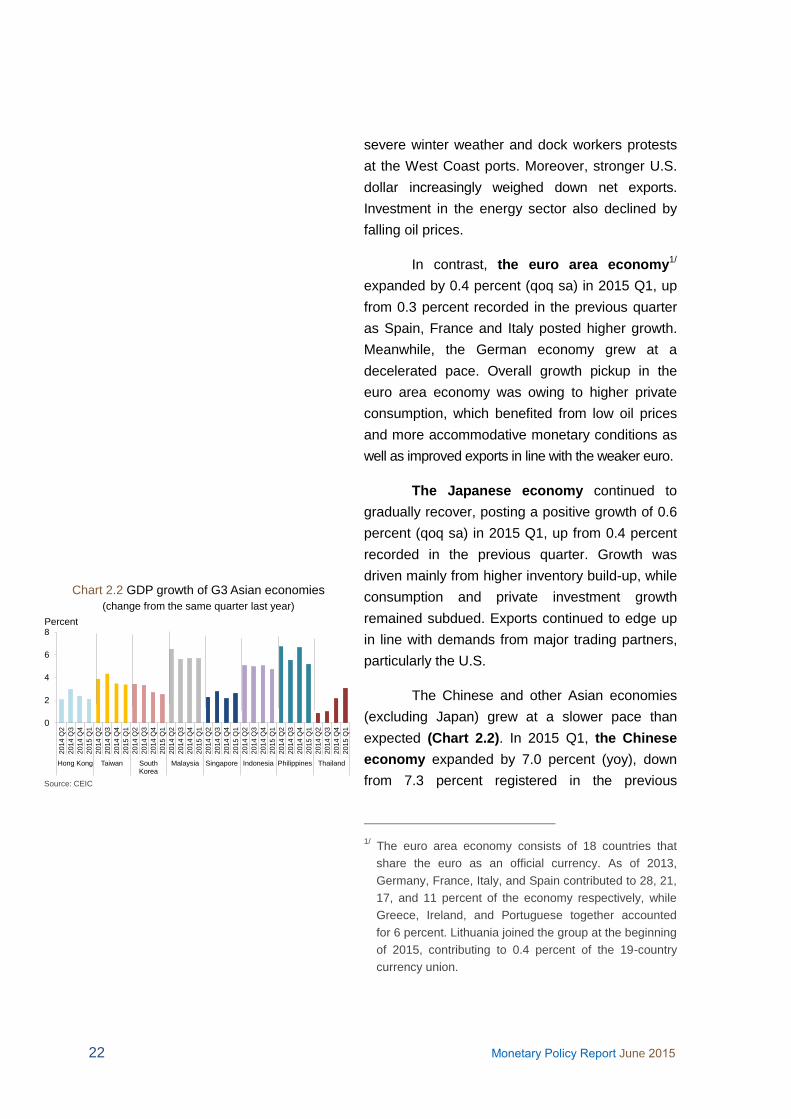
The Chinese and other Asian economies
(excluding Japan) grew at a slower pace than
expected (Chart 2.2). In 2015 Q1, the Chinese
economy expanded by 7.0 percent (yoy), down
from 7.3 percent registered in the previous
1/
The euro area economy consists of 18 countries that
share the euro as an official currency. As of 2013,
Germany, France, Italy, and Spain contributed to 28, 21,
17, and 11 percent of the economy respectively, while
Greece, Ireland, and Portuguese together accounted
for 6 percent. Lithuania joined the group at the beginning
of 2015, contributing to 0.4 percent of the 19-country
currency union.
0
2
4
6
8
2014 Q
2
2014 Q
3
2014 Q
4
2015 Q
1
2014 Q
2
2014 Q
3
2014 Q
4
2015 Q
1
2014 Q
2
2014 Q
3
2014 Q
4
2015 Q
1
2014 Q
2
2014 Q
3
2014 Q
4
2015 Q
1
2014 Q
2
2014 Q
3
2014 Q
4
2015 Q
1
2014 Q
2
2014 Q
3
2014 Q
4
2015 Q
1
2014 Q
2
2014 Q
3
2014 Q
4
2015 Q
1
2014 Q
2
2014 Q
3
2014 Q
4
2015 Q
1
Hong Kong Taiwan South Korea
Malaysia Singapore Indonesia Philippines Thailand
Percent
Chart 2.2 GDP growth of G3 Asian economies
(change from the same quarter last year)
Source: CEIC

Monetary Policy Report June 2015 23
quarter, mainly due to moderating investment.
Based on recent economic indicators at the
beginning of 2015 Q2, investment, consumption
and exports growth looked set to decelerate
and fall below the targets set by the Chinese
government. The government therefore introduced
more expansionary monetary and fiscal measures
to boost growth, such as the policy interest rate
reduction on May 10, 2015, and efforts to expedite
infrastructure investments by local governments.
The other Asian economies (excluding
Japan) exhibited slower growth in 2015 Q1, owing
primarily to weaker exports. In particular, exports
to China and regional economies continued to
decline, on the back of weak demands from
trading partners and changes in global trade
structure (Article in Box 1: The Changing Global
Trade Structure and Implications for Exports of
ASEAN-5 Countries). Preliminary economic data in
2015 Q2 indicated that the continued weakness in
export growth has had adverse impacts on the real
economy. Manufacturing production has continued
to slow since the beginning of 2015, consistent with
the Purchasing Managers’ Index (PMI) being below
50 in almost every country in the region. Domestic
demand in Asian economies (excluding China and
Japan) began to show signs of moderating, with
falling investment in machinery and equipment
reflected by the decline in imports of machinery and
equipment in several countries. Despite sharply
lower oil prices, private consumption began to fall
because declining manufacturing employment and
weaker consumer confidence led the private sector
to be more cautious with spending.
Looking ahead, the Committee judged that
the global economy would continue to recover, albeit
at a more modest pace. Downside risks to growth
are now more than previously assessed, especially

24 Monetary Policy Report June 2015
from the Chinese economic slowdown. Additional
risks are from the uncertainty over finding a resolution
to Greece’s financial rescue plan, and divergent
monetary policies of major advanced economies,
which could lead to greater volatility in the financial
markets.
The U.S. economy will gain momentum
from improving economic fundamentals, especially
from the continued recovery of the labor market
where employment and wages are picking up. The
private sector balance sheet will also strengthen as
a result of continued deleveraging. Nonetheless,
further risks remain from the sustained strength of
the U.S. dollar and greater financial market volatility
stemming from the expectation of the Fed’s interest
rate hike.
The euro area economy are projected to
recover gradually from the ECB’s continuation of
easing monetary policy. Going forward, however,
economic activities and confidence in the euro area
could weaken if the Greek government and its
creditors fail to reach an agreement on debt bailout
terms and structural reforms.
The Japanese economy is expected to
expand at a gradual pace. The conclusion of the
negotiation on annual wage rise could lead to a
significant increase in wages in mid-2015, which
should provide a boost to consumption. Export
growth should benefit from continued yen weakness,
but could be curtailed by the slowdown in China and
the rest of Asia. However, the Japanese economic
growth in the long run is largely dependent on the
outcome of structural reforms.
The Chinese and other Asian economies
are likely to grow at a slower pace, due mainly to
weaker exports. In the periods ahead, exports from
China and other Asian countries (excluding Japan)
Monetary Policy Report June 2015 25
are projected to edge up slowly. However, exports
growth is expected to be lower than the rate
recorded in the years preceding the global economic
crisis, because of the ongoing slowdown in China
and the shifts in global trade structure.
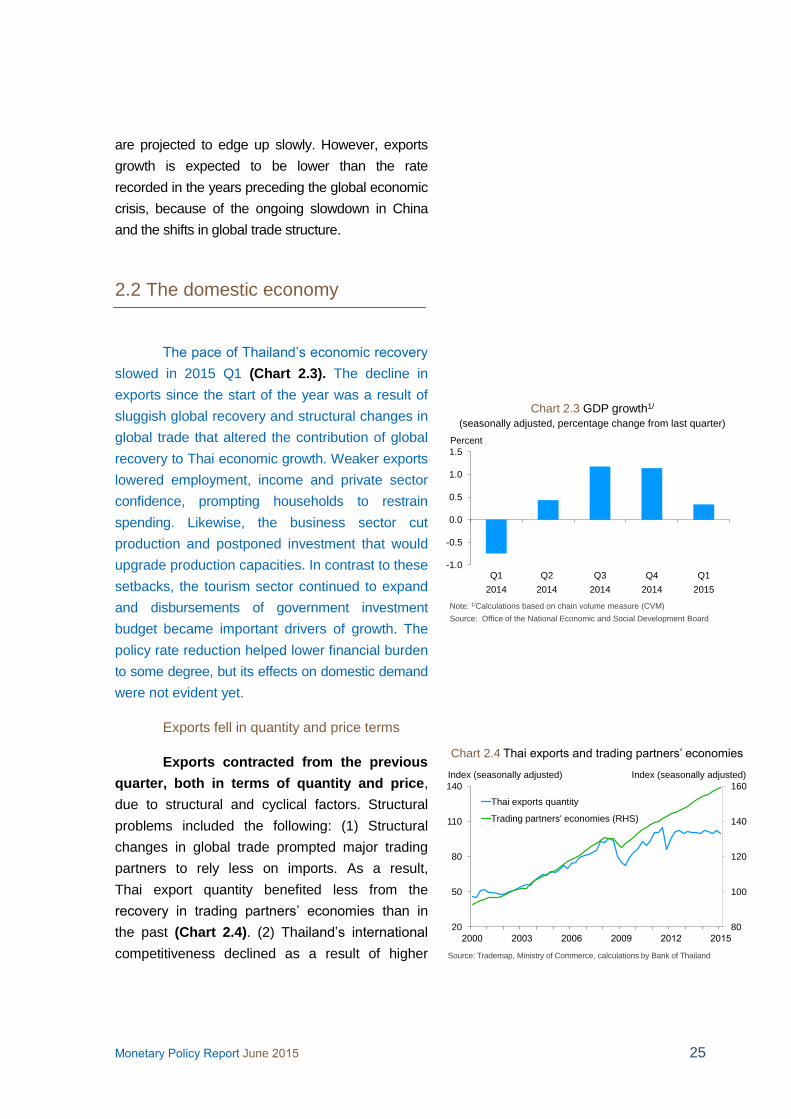
2.2 The domestic economy
The pace of Thailand’s economic recovery
slowed in 2015 Q1 (Chart 2.3). The decline in
exports since the start of the year was a result of
sluggish global recovery and structural changes in
global trade that altered the contribution of global
recovery to Thai economic growth. Weaker exports
lowered employment, income and private sector
confidence, prompting households to restrain
spending. Likewise, the business sector cut
production and postponed investment that would
upgrade production capacities. In contrast to these
setbacks, the tourism sector continued to expand
and disbursements of government investment
budget became important drivers of growth. The
policy rate reduction helped lower financial burden
to some degree, but its effects on domestic demand
were not evident yet.
Exports fell in quantity and price terms
Exports contracted from the previous
quarter, both in terms of quantity and price,
due to structural and cyclical factors. Structural
problems included the following: (1) Structural
changes in global trade prompted major trading
partners to rely less on imports. As a result,
Thai export quantity benefited less from the
recovery in trading partners’ economies than in
the past (Chart 2.4). (2) Thailand’s international
competitiveness declined as a result of higher
-1.0
-0.5
0.0
0.5
1.0
1.5
Q1
2014
Q2
2014
Q3
2014
Q4
2014
Q1
2015
Chart 2.3 GDP growth1/
(seasonally adjusted, percentage change from last quarter)
Note: 1/Calculations based on chain volume measure (CVM)
Source: Office of the National Economic and Social Development Board
Percent
Chart 2.4 Thai exports and trading partners’ economies
80
100
120
140
160
20
50
80
110
140
Thai exports quantity
Trading partners' economies (RHS)
Source: Trademap, Ministry of Commerce, calculations by Bank of Thailand
Index (seasonally adjusted) Index (seasonally adjusted)

26 Monetary Policy Report June 2015
wages, constraints in production technology, and
termination of GSP privileges for Thai exports to
the euro area (Article in Box: Structural Problems
in Thai Exports Sector). Cyclical factors were:
(1) The slowdown in trading partners’ economies,
especially China, hurt exports of ASEAN countries.
(2) Prices of several export products, such as
commodities, plastics and chemicals, remained
low in line with crude oil price.
Going forward, the Thai exports are
constrained by both the slowdown in trading
partners’ economies and structural issues. Exporters
need time to explore new markets and develop
higher value-added products. However, in the
short term, the recent baht depreciation should
help increase liquidity for Thai exporters somewhat
via higher revenue in baht term.
Households remain cautious with regards
to spending
Private spending recovery remained
sluggish as non-farm incomes fell (Article in Box:
Changes in Household Incomes and Implications
for Economic Recovery). Other factors, i.e. falling
farm incomes and private sector confidence,
continued to weigh on private consumption (Chart
2.5). Household debt levels were persistently high,
while financial institutions remained strict with
lending standards to households as the quality of
consumer loans worsened (Chart 2.6). In the
periods ahead, consumption is likely to pick up
slowly amidst these existing constraints. Although
employment in 2015 Q2 edged up slightly from
the past quarter, the increase was mostly in
the sectors with relatively low wage per hour.
Therefore, consumers continued to remain cautious
with their spending amidst concerns over future
income prospect. Nonetheless, the decline in
0
10
20
30
40
50
60
Jan Jul Jan Jul Jan
3-month ahead consumer confidence
Current consumer confidence
Source: Ministry of Commerce, calculations by Bank of Thailand.
2013 2014 2015
Chart 2.5 Consumer Confidence Index
Diffusion Index
-75
-50
-25
0
25
50
20
13
Q1
20
13
Q2
20
13
Q3
20
13
Q4
20
14
Q1
2014 Q
22
01
4 Q
32
01
4 Q
42
01
5 Q
12
01
5 Q
2
20
13
Q1
2013 Q
22
01
3 Q
32
01
3 Q
42
01
4 Q
12
01
4 Q
22
01
4 Q
32014 Q
42
01
5 Q
12
01
5 Q
2
20
13
Q1
20
13
Q2
2013 Q
32
01
3 Q
42
01
4 Q
12
01
4 Q
22
01
4 Q
32
01
4 Q
42
01
5 Q
12015 Q
2
20
14
Q3
20
14
Q4
20
15
Q1
20
15
Q2
Actual
Expected
Other creditsHousing Credit card Auto
Chart 2.6 Lending standards to household sector
Note: Index > 0 indicates less strict standards; Index = 0 indicates stable standards; Index < 0 indicates stricter standards
Source: Survey of credit conditions, Bank of Thailand.
Index
Monetary Policy Report June 2015 27
40
60
80
100
Jan
2012
Jul Jan
2013
Jul Jan
2014
Jul Jan
2015
Exports<30% 30%<Exports<60% Exports>60%
Chart 2.9 Production capacity by exports
(seasonally adjusted, 3-month moving average)Percent
Average 30%<Exports<60%
Average Exports<3 %
Average Exports>60%
Source: Office of Industrial Economics, Ministry of Industry,
calculation by Bank of Thailand
commercial banks’ lending rates following the
policy rate reduction should alleviate some of the
debt burden for households. In addition, some
public financial institutions are also preparing
to relax their lending standards in 2015 Q2 to
provide support to private consumption, in line
with government policy.
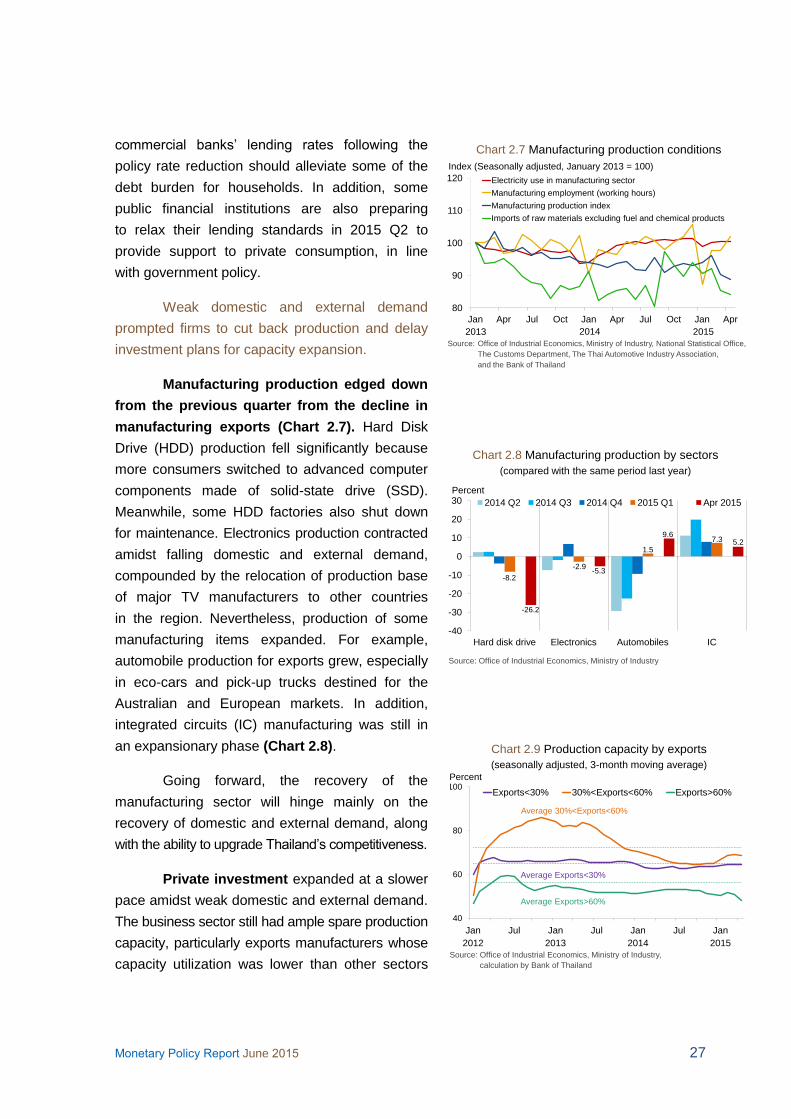
Weak domestic and external demand
prompted firms to cut back production and delay
investment plans for capacity expansion.
Manufacturing production edged down
from the previous quarter from the decline in
manufacturing exports (Chart 2.7). Hard Disk
Drive (HDD) production fell significantly because
more consumers switched to advanced computer
components made of solid-state drive (SSD).
Meanwhile, some HDD factories also shut down
for maintenance. Electronics production contracted
amidst falling domestic and external demand,
compounded by the relocation of production base
of major TV manufacturers to other countries
in the region. Nevertheless, production of some
manufacturing items expanded. For example,
automobile production for exports grew, especially
in eco-cars and pick-up trucks destined for the
Australian and European markets. In addition,
integrated circuits (IC) manufacturing was still in
an expansionary phase (Chart 2.8).
Going forward, the recovery of the
manufacturing sector will hinge mainly on the
recovery of domestic and external demand, along
with the ability to upgrade Thailand’s competitiveness.
Private investment expanded at a slower
pace amidst weak domestic and external demand.
The business sector still had ample spare production
capacity, particularly exports manufacturers whose
capacity utilization was lower than other sectors
Chart 2.7 Manufacturing production conditions
Source: Office of Industrial Economics, Ministry of Industry, National Statistical Office,
The Customs Department, The Thai Automotive Industry Association,
and the Bank of Thailand
Index (Seasonally adjusted, January 2013 = 100)
2013 2014 2015
80
90
100
110
120
Jan Apr Jul Oct Jan Apr Jul Oct Jan Apr
Electricity use in manufacturing sector
Manufacturing employment (working hours)
Manufacturing production index
Imports of raw materials excluding fuel and chemical products
-8.2
-2.9
1.5
7.3
-26.2
-5.3
9.65.2
-40
-30
-20
-10
0
10
20
30
Hard disk drive Electronics Automobiles IC
2014 Q2 2014 Q3 2014 Q4 2015 Q1 Apr 2015
Chart 2.8 Manufacturing production by sectors
(compared with the same period last year)
Source: Office of Industrial Economics, Ministry of Industry
Percent

28 Monetary Policy Report June 2015
(Chart 2.9). The private sector also held back on
new investment, awaiting greater clarity on
economic recovery and government plans on
infrastructure investment. This is consistent with
declining private sector confidence and private
credit (Chart 2.10).
Imports dropped in line with subdued
production and investment
Imports edged down from the previous
quarter (Chart 2.11). Imports of raw materials,
excluding fuels and chemicals, contracted in line
with declining manufacturing production. Imports
of capital goods continued to shrink, consistent
with subdued investments. Fuel imports remained
at very low level due to weak crude oil prices.
Imports of consumption goods edged up slightly
because the rise in the number of foreign tourists
led to higher imports of some consumer products,
such as cosmetics and watches.
Tourism growth and public spending,
especially investment expenditure, became important driving forces for the economy.
Public spending, particularly investment
expenditure, rose from the past quarter (Chart
2.12). Broadly consistent with the government’s
policy, public agencies were urged to expedite
government procurement before the enactment of
the Annual Budget Expenditure Act and to enter
into contracts for public projects before December
2014. Consequently, disbursements picked up pace
in February and March 2015. However, public
investment spending moderated slightly in April
because it was not the period scheduled for the
project handover and budget disbursement of
investment projects.
0
5
10
15
20
25
Jan
2013
Jul Jan
2014
Jul Jan
2015
Percent from the same period last year
Source: Ministry of Commerce, calculations by Bank of Thailand
Chart 2.10 Commercial banks’ credit for investment in fixed assets
Chart 2.11 Imports index, by product groups
(seasonally adjusted, 3-month moving average, Jan 2013 = 100)
60
80
100
120
140
160
Jan
2013
Jul Jan
2014
Jul Jan
2015
Total imports Consumer goods
Raw materials excluding fuels* Fuels
Capital goods
Index
Note: *Auto parts included
Source: Customs Department (data processed by Bank of Thailand)
Chart 2.12 Public spending
60
90
120
150
Oct Jan Apr Jul
Budget year 2013 Budget year 2014 Budget year 2015
Current expenditure excluding central government transfers
Investment expenditure excluding central government transfers
Billion baht
0
20
40
60
Oct Jan Apr Jul
Budget year 2013 Budget year 2014 Budget year 2015
Billion baht
Source: Bureau of Budget and Fiscal Policy Office

Monetary Policy Report June 2015 29
Going forward, public spending will continue
to play a key supportive role for economic growth.
The government already approved the second
phase of economic stimulus comprising road
transport infrastructure and water management
system projects. Quick disbursements for these
investment plans are likely because they consist
mostly of small and medium projects with most
completion due within one year. Local government
spending is expected to pick up slightly in the
second half of the budget year, due to the
expedited signing of contracts for government
projects and the tendency that disbursements of
subsidies are normally back-loaded. However,
several government megaprojects are still in their
initial phase and will take some time to materialize.
Examples of ongoing projects are rail system
development, inter-city motorway construction,
and highway development linking the East-West
Corridor.
Tourism posted a solid growth owing to the growing number of Chinese and Malaysian
tourists, which helped offset the drop of Russian
tourists attributed to Russia’s economic woes and
sharp ruble weakness (Chart 2.13).
Looking ahead, tourism is projected to
continue growing despite a downside risk
concerning Thailand’s international aviation safety
standards.2/ This concern is unlikely to significantly
impact the number of foreign tourists because this
issue mainly centers on charter flights. Foreign
tourists will be able to travel by scheduled flights
2/
In March 2015, the International Civil Aviation Organization
(ICAO) announced that a safety oversight audit conducted
in Thailand found “Significant Safety Concerns” (SSC) in
two areas, namely (1) air operator certification procedures
and (2) transport of dangerous goods.
Chart 2.13 Number of tourists by origins
(Indices, January 2013 = )
0
50
100
150
200
250
300
Jan
2013
Jul Jan
2014
Jul Jan
2015
Total foreign tourists
China (19%)
Malaysia (11%)
Russia (7%)
Europe excluding Russia (18%)
Asia excluding China and Malaysia (37%)
Index
Note: Parentheses ( ) indicate shares of total foreign tourists in 2014
Source: Department of Tourism

30 Monetary Policy Report June 2015
operated by domestic airlines or any other flights
operated by foreign airlines. Moreover, the tourism
sector is likely to benefit from the lifting of martial
law on April 1, 2015, as some foreign governments
have removed warnings against travel to Thailand
and as a result, tourists are now able to purchase
travel insurance.
Service sector posted a solid growth on
robust tourism industry
Tourism-related service sectors saw
a strong growth. Hotels, restaurants and
transportation, especially air transport, posted
a solid growth. These businesses benefited from
the rise in the number of foreign tourists and
added support to the retail sector through tourists’
spending. Other service sectors also exhibited an
elevated growth. The telecommunications sector
grew from increased demand for data services.
Financial intermediaries saw the expansion of
services by other depository institutions, as well as
by insurance and life insurance companies (Chart
2.14).
2.3 Production cost and price
conditions
Inflationary pressure was weaker than
previously assessed. Headline inflation edged
down and is expected to remain in negative
territory for a longer period, mostly due to
depressed energy and fresh food costs. However,
headline inflation is expected to pick up in the
second half of the year, bottoming out in Q2
before gradually rising in Q3 and turning positive
in 2015 Q4. Although core inflation edged down
mainly from food costs, it is expected to remain
13.5
3.9
7.1
9.6
-10
-5
0
5
10
15
20
Hotels and restaurants
Trade Transportation Financial intermediaries
2014 Q2 2014 Q3 2014 Q4 2015 Q1
Chart 2.14 Growth of the service sectors
Source: Office of the National Economic and Social Development Board
Percent

Monetary Policy Report June 2015 31
positive throughout the forecast period. The
Committee considered the overall deflation risk
to be low.
Recently, inflation readings in several
countries including those in Asia began to stabilize,
consistent with global crude oil prices and clearer
signs of economic recovery especially in the euro
area (Chart 2.15). Thailand’s general price level
continued to decline, with headline inflation
recording an average of negative 1.16 percent for
the first two months of 2015 Q2 (Chart 2.16),
mainly due to cost factors. Despite a pickup in
global oil prices and recent baht depreciation,
domestic retail oil prices remained stable at low
levels following the government’s decision to lower
the contribution to the Oil Fund.3/ Moreover,
declining headline inflation also reflected the
reduction in the fuel adjustment charge (FT)
during May-August 2015 by 0.0935 baht per unit,
in line with lower fuel costs. Falling raw food prices
from an oversupply of meat and eggs, combined
with weaker-than-expected demand recovery, also
contributed to the persistence of negative headline
inflation. Negative headline inflation was previously
projected to remain until 2015 Q2, but is now
expected to last well into 2015 Q3. Meanwhile,
core inflation edged down to 0.94 percent in May
2015, mostly from lower raw food costs that
contributed to subdued food prices. Prices of other
goods and services rose from the same period last
year, but remained mostly stable relative to
2015 Q1, in line with weak domestic demand
(Chart 2.17). This was consistent with underlying
3/
The government cut contribution to the Oil Fund 4 times
during March–May 2015. Consequently, the prices of
benzene, namely gasohol 95, E20 and gasohol 91, and
diesel fell by 3.00, 2.80, 2.10 and 2.30 baht per liter
respectively.
-2
-1
0
1
2
3
4
5
Jan
2014
Apr
2014
Jul
2014
Oct
2014
Jan
2015
Apr
2015
Chart 2.15 Domestic and foreign headline inflation
Percent
Notes: Foreign headline inflation calculated from unweighted averages of
individual countries inflation
Source: Bureau of Trade and Economic Indices, Ministry of Commerce, CEIC,
and calculations by Bank of Thailand
Asia (excluding Japan)
The U.S.
Thailand
Euro area
0
1
2
3
Q1
2012
Q1
2013
Q1
2014
Q1
2015
Non-food and beverages
Food and beverages
Core inflation
Percent
Source: Bureau of Trade and Economic Indices, Ministry of Commerce,
and calculations by Bank of Thailand
Chart 2.17 Contributions to core inflation
(Apr – May)
-2
0
2
4
6
Q1
2012
Q1
2013
Q1
2014
Q1
2015
Core inflation (excluding raw food and energy)
Food
Energy
Headline inflation
Chart 2.16 Contributions to headline inflation
Source: Bureau of Trade and Economic Indices, Ministry of Commerce,
and calculations by Bank of Thailand
Percent
(Apr–May)
32 Monetary Policy Report June 2015
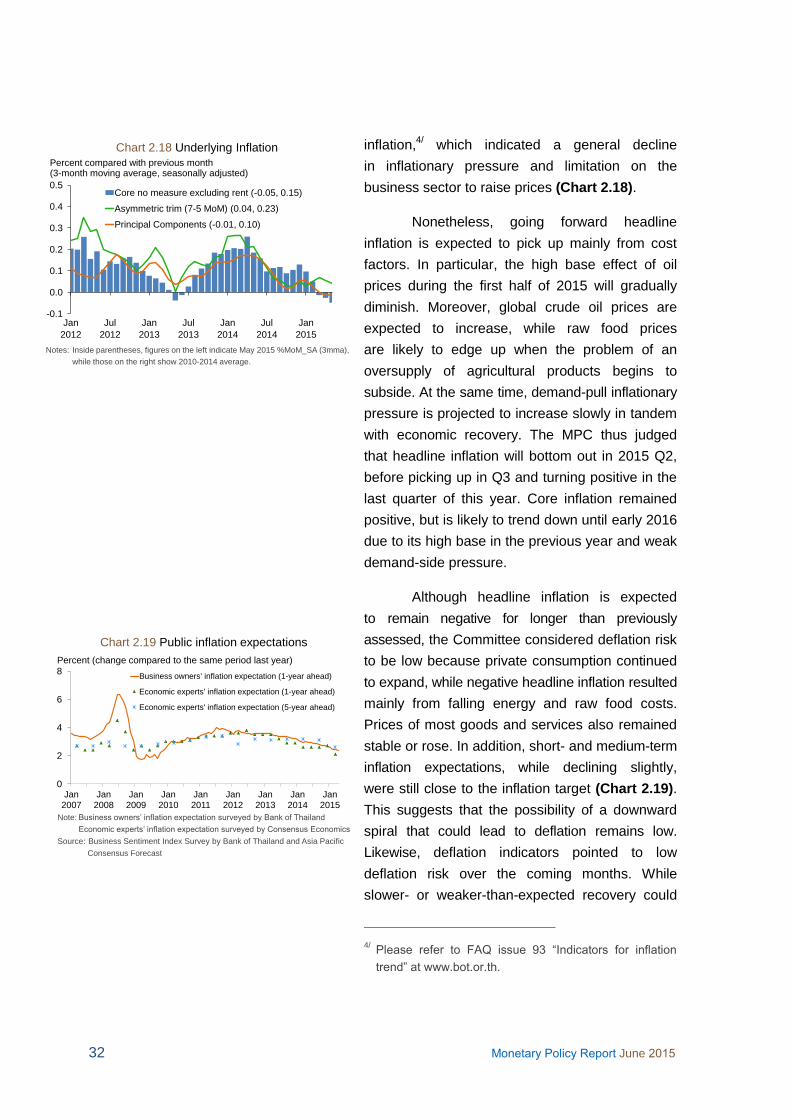
inflation,4/ which indicated a general decline
in inflationary pressure and limitation on the
business sector to raise prices (Chart 2.18).
Nonetheless, going forward headline
inflation is expected to pick up mainly from cost
factors. In particular, the high base effect of oil
prices during the first half of 2015 will gradually
diminish. Moreover, global crude oil prices are
expected to increase, while raw food prices
are likely to edge up when the problem of an
oversupply of agricultural products begins to
subside. At the same time, demand-pull inflationary
pressure is projected to increase slowly in tandem
with economic recovery. The MPC thus judged
that headline inflation will bottom out in 2015 Q2,
before picking up in Q3 and turning positive in the
last quarter of this year. Core inflation remained
positive, but is likely to trend down until early 2016
due to its high base in the previous year and weak
demand-side pressure.
Although headline inflation is expected
to remain negative for longer than previously
assessed, the Committee considered deflation risk
to be low because private consumption continued
to expand, while negative headline inflation resulted
mainly from falling energy and raw food costs.
Prices of most goods and services also remained
stable or rose. In addition, short- and medium-term
inflation expectations, while declining slightly,
were still close to the inflation target (Chart 2.19).
This suggests that the possibility of a downward
spiral that could lead to deflation remains low.
Likewise, deflation indicators pointed to low
deflation risk over the coming months. While
slower- or weaker-than-expected recovery could
4/ Please refer to FAQ issue “Indicators for inflation
trend” at www.bot.or.th.
-2
0
2
4
6
Q1
2012
Q1
2013
Q1
2014
Q1
2015
Core inflation (excluding raw food and energy)
Food
Energy
Headline inflation
Chart 2.16 Contributions to headline inflation
Source: Bureau of Trade and Economic Indices, Ministry of Commerce,
and calculations by Bank of Thailand
Percent
(Apr–May)
Notes: Inside parentheses, figures on the left indicate May 2015 %MoM_SA (3mma),
while those on the right show 2010-2014 average.
-0.1
0.0
0.1
0.2
0.3
0.4
0.5
Jan
2012
Jul
2012
Jan
2013
Jul
2013
Jan
2014
Jul
2014
Jan
2015
Core no measure excluding rent (-0.05, 0.15)
Asymmetric trim (7-5 MoM) (0.04, 0.23)
Principal Components (-0.01, 0.10)
Chart 2.18 Underlying Inflation
Percent compared with previous month (3-month moving average, seasonally adjusted)
0
2
4
6
8
Jan
2007
Jan
2008
Jan
2009
Jan
2010
Jan
2011
Jan
2012
Jan
2013
Jan
2014
Jan
2015
Business owners' inflation expectation (1-year ahead)
Economic experts' inflation expectation (1-year ahead)
Economic experts' inflation expectation (5-year ahead)
Chart 2.19 Public inflation expectations
Percent (change compared to the same period last year)
Note: Business owners’ inflation expectation surveyed by Bank of Thailand
Economic experts’ inflation expectation surveyed by Consensus Economics
Source: Business Sentiment Index Survey by Bank of Thailand and Asia Pacific
Consensus Forecast

Monetary Policy Report June 2015 33
give rise to higher deflation risk in the future, the
overall risk level is deemed not to be a cause for
concern (Article in Box: Assessing Deflation Risks
in Thailand).
Table 2.1 Quarterly inflation
Unit: Percent 2 2015
Q Q Q Q Q Apr-May
Percentage change from previous year (%yoy)
- Headline Consumer Price Index 2.18 2.00 2.47 2.00 1.11 -0.50 -1.16
Core Consumer Price Index 1.00 1.19 1.70 1.79 1.65 1.47 0.98
Raw food 5.54 5.34 3.91 2.78 1.88 0.30 -0.54
Energy 4.79 2.55 5.13 2.20 -3.11 -13.0 -14.3
Percentage change from previous quarter (%qoq_sa)
- Headline Consumer Price Index - 0.8 0.5 0.0 -0.2 -0.8 -
Core Consumer Price Index - 0.5 0.6 0.3 0.2 0.3 -
Raw food - 1.9 0.1 -0.6 0.5 0.3 -
Energy - 0.5 0.6 -0.7 -3.5 -9.7 -
Source: Bureau of Trade and Economic Indices, Ministry of Commerce, and seasonally adjusted
quarter-on-quarter percentage change calculations by Bank of Thailand.

34 Monetary Policy Report June 2015
Structural problems within the Thai exports sector
The slowdown of Thai exports over the past three years has been in part attributed to
the global trade slowdown, an external factor. It also, however, stemmed from a number of
domestic structural problems within the Thai exports sector that undermined the
country’s competitiveness. The Thai export recovery was therefore more sluggish than that
of other countries in the region (Chart 1). Moreover, the share of Thai exports in the global
market has constantly declined (Chart 2), while Chinese, Vietnamese and the Philippines
exports continue to gain market shares. In case of Malaysian and Indonesian, though their
market shares for global exports have fallen, the decline is due mainly to lower prices of
energy commodities, which are their key exports
Domestic structural problems could result from the following factors:
1. Thai export quantity expanded at a lower rate than the past average because of a
persistent lack of new investment to expand existing capacities. Since 2012, Foreign Direct
Investment (FDI) flows have slowed in several industries (Chart 3). By contrast, Vietnam, the
Philippines, and Indonesia have managed to consistently attract FDI inflows from large Multi-
National Corporations (MNCs), due largely to lower labor costs, large labor forces, vast
domestic markets and abundant natural resources.
At the same time, outward direct investment by Thai businesses rose steadily.
The steady increase in Thai investment abroad in capital-intensive industries, such as
petrochemicals and chemicals, was motivated by the environmental concerns of these
industries in Thailand. Labor-intensive industries, such as textiles and apparels, have also
relocated to neighboring countries like Vietnam and Cambodia, to take advantage of lower
wages and greater tax incentives under Generalized Scheme of Preferences (GSP) and
bilateral Free Trade Agreements (FTAs). Thai exports of these products, therefore, either
stagnated or declined steadily.
70
90
110
130
150
170
190
210
230
90
100
110
120
130
140
150
Q1
2005
Q1
2007
Q1
2009
Q1
2011
Q1
2013
Q1
2015
GDP of trading partners
Asian export volume index (RHS)
Thai export volume index (RHS)
Source: WTO and Bank of Thailand
Chart 1 GDP of trading partners and
comparison between Asian and Thai exports
Index (Seasonally adjusted)
(2005 Q1 = 100) Index (Seasonally adjusted)
(2005 Q1 = 100)
0
2
4
6
8
10
12
14
0.00
0.50
1.00
1.50
2.00
Thailand Malaysia
The Philippines Indonesia
Vietnam China (RHS)
Percent
Chart 2 Share of developing Asian countries
in the global export value
Source: Trademap
Percent
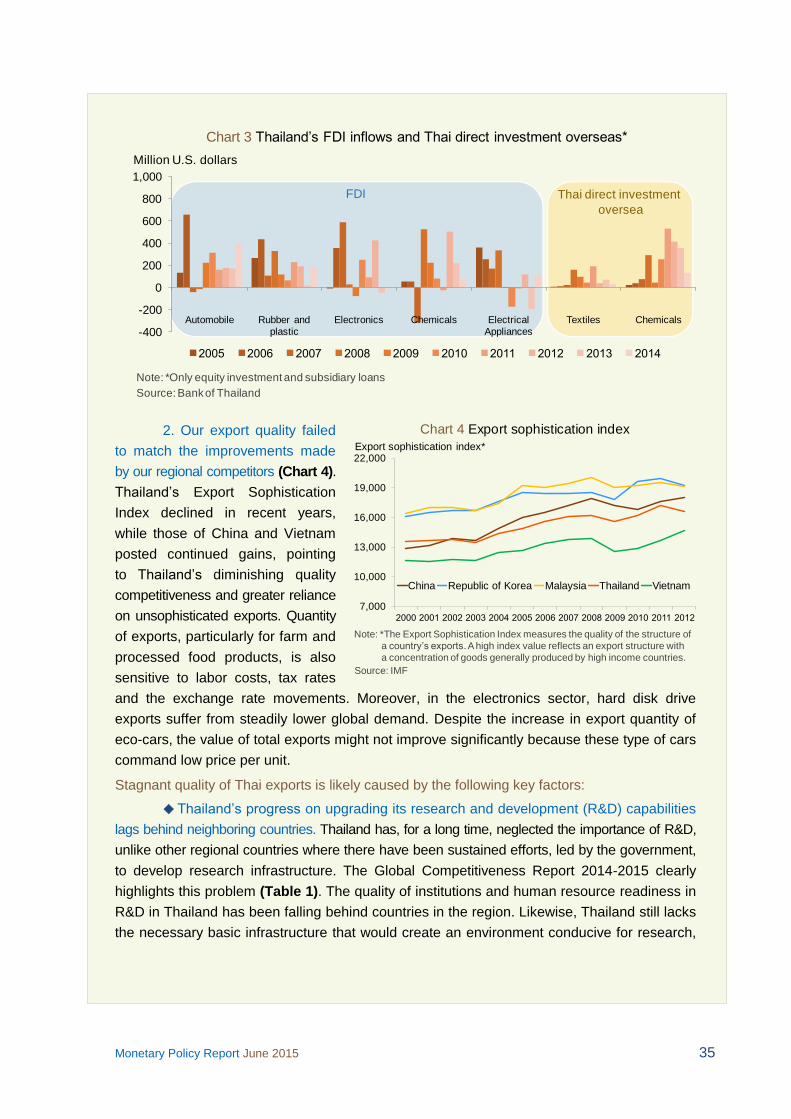
Monetary Policy Report June 2015 35
2. Our export quality failed
to match the improvements made
by our regional competitors (Chart 4).
Thailand’s Export Sophistication
Index declined in recent years,
while those of China and Vietnam
posted continued gains, pointing
to Thailand’s diminishing quality
competitiveness and greater reliance
on unsophisticated exports. Quantity
of exports, particularly for farm and
processed food products, is also
sensitive to labor costs, tax rates
and the exchange rate movements. Moreover, in the electronics sector, hard disk drive
exports suffer from steadily lower global demand. Despite the increase in export quantity of
eco-cars, the value of total exports might not improve significantly because these type of cars
command low price per unit.
Stagnant quality of Thai exports is likely caused by the following key factors:
Thailand’s progress on upgrading its research and development (R&D) capabilities
lags behind neighboring countries. Thailand has, for a long time, neglected the importance of R&D,
unlike other regional countries where there have been sustained efforts, led by the government,
to develop research infrastructure. The Global Competitiveness Report 2014-2015 clearly
highlights this problem (Table 1). The quality of institutions and human resource readiness in
R&D in Thailand has been falling behind countries in the region. Likewise, Thailand still lacks
the necessary basic infrastructure that would create an environment conducive for research,
7,000
10,000
13,000
16,000
19,000
22,000
China Republic of Korea Malaysia Thailand Vietnam
Note: *The Export Sophistication Index measures the quality of the structure of
a country’s exports. A high index value reflects an export structure with
a concentration of goods generally produced by high income countries.
Source: IMF
Export sophistication index*
Chart 4 Export sophistication index
FDI
-400
-200
0
200
400
600
800
1,000
Automobile Rubber and
plastic
Electronics Chemicals Electrical
Appliances
Textiles Chemicals
Million U.S. dollars
Chart 3 Thailand’s FDI inflows and Thai direct investment overseas*
Source: Bank of Thailand
Note: *Only equity investment and subsidiary loans
Thai direct investment
oversea

36 Monetary Policy Report June 2015
namely effective protection
of intellectual property
rights as well as clear
and concrete government
policies to promote
innovation.
The quality of
human capital in Thailand
is lower than many other
countries in the region.
According to the 2015 human capital index, Thailand was ranked 57th out of a total of 124
countries, well below neighboring countries like the Philippines and Malaysia. Despite a
higher rank than Vietnam, China and Indonesia, Thailand’s score does not differ significantly
from them. These countries also have larger populations than Thailand. Thailand’s score
highlights the inadequate development of
education quality and labor skills. These
human capital factors are vital for both
improving export sophistication and attracting
FDI inflows into high value-added industries
(Table 2).
These structural problems have been
accumulating for quite some time, but the
consequence has become much more visible
today. In addition to these domestic issues,
structural changes in global trade have
weakened the links between the volume of
international trade and global growth. These
internal and external constraints severely
limit the ability of Thai exports to enjoy the
high growth rates like in the past. While structural changes in global trade are an external
factor, beyond our control, the domestic structural constraints can be addressed, which will
undoubtedly take some time. Rectifying these problems requires close multi-sectoral
cooperation, guided by a clear and coordinated reform plan. The academic sector should
play a role in conducting research and formulating clear approaches to solutions, while the
government should support labor skills development and encourage investment that would
enhance production capabilities and improve product quality. In addition, the private sector
should be proactive in upgrading their competitiveness and product quality in order to avoid
price competition in the long term. Unless these internal structural problems are firmly
addressed, it will be difficult for the Thai exports sector to resume its usual role as the main
driver of growth, which will hurt Thailand’s long-term economic potential.
Company
spending on
R&D
Quality of
scientific
research
institutions
Availability of
scientists and
engineers
Patent
Cooperation
Treaty (PCT)
application
Government
procurement
of advanced
technology
products
Thailand 56 61 54 104 114
Malaysia 9 20 9 25 3
Indonesia 24 41 31 43 13
China 23 39 43 53 10
Source: World Economic Forum
Table 1 Innovation components of the Global Competitiveness Index
(Rank / 144 countries)
Rank Country Score
5 Japan 82.74
24 Singapore 78.15
30 Republic of Korea 76.84
46 The Philippines 71.24
52 Malaysia 70.24
57 Thailand 68.78
59 Vietnam 68.48
64 China 67.47
69 Indonesia 66.99
Note: *Measures the quality of education and employment
among 5 age groups
Source: World Economic Forum (Human Capital Report 2015)
Table 2 Human Capital Index 2015*

Monetary Policy Report June 2015 37
Changes in household income and implications for economic recovery
Household income is an important determinant of private consumption, a major driver
of the Thai economy. In recent years, however, household income was hit by the global
economic slowdown, causing low agricultural prices and weak demand for Thai exports. Farm
income, therefore, remained subdued in tandem with weak agricultural prices. Moreover,
employment in the manufacturing sector recovered only slowly, further depressing household
non-farm income. Weaker fundamentals of both farm and non-farm sectors played major role
in impeding the recovery of private consumption in recent years.
Farm income1/ remained low.
Farm income has continuously declined
over the past two years (Chart 1), due
mostly to dwindling income from rice and
rubber sales, which together accounted
for 45 percent of total farm income.
Domestic rice prices plunged following
the end of the rice pledging scheme in
February 2014. Demand for rubber from
large consumers, especially China and
Malaysia, posted a significant drop, causing
rubber prices to have fallen since June
2014. Moreover, drought and low levels of irrigation water in 2014 prohibited off-season rice
farming in almost half of the cultivated areas, further depressing farm income. Going forward,
the impacts of these drawbacks will be felt for some time, putting downward pressure on
the purchasing power of farm households for the remaining of this year.
Non-farm income2/ started to edge down (Chart 1) in 2015 Q1, against the backdrop
of falling exports. In contrast, the overall non-farm employment rebounded, in line with strong
tourism growth and gradual recovery of domestic spending. However, most of recent
non-farm employment took place in sectors with low to medium hourly wages (Chart 2 and
Chart 3), such as computers and electronics, food and beverages, hotels and restaurants,
retail and land transport. While employment recovered only slowly in industries with high
hourly wages, for example automobiles, hard disk drives and chemicals, as well as in service
sectors, such as telecommunications and financial intermediaries. Therefore, improved
1/
The agricultural sector employs 12.7 million people (33 percent of total employed in 2014). The three most
grown crops are rice, rubber and cassava, which account for 65, 25 and 10 percent of farm households
respectively. Each farm household grows an average of 1.6 types of crops. 2/
The non-farm sectors employ 25.3 million people (67 percent of total employed in 2014) across a number
of sectors: 6.4 million in manufacturing, 6.2 million in trade, 2.6 million in hotels and restaurants, 2.3 million
in construction, 1.3 million in transport and telecommunications, and 6.5 million in others.
50
60
70
80
90
100
110
Jan
2013
Jul Jan
2014
Jul Jan
2015
Rice farmers' income
(12-month average, seasonally adjusted)
Rubber growers' income
(12-month average, seasonally adjusted)
Farm income
(12-month average, seasonally adjusted)
Non-farm income
(3-month average, seasonally adjusted)
Rice Pledging Scheme
Index 100 = January 2013
Chart 1 Farm and non-farm income
Source: Office of Agricultural Economics, National Statistical Office,
and calculations by Bank of Thailand

38 Monetary Policy Report June 2015
conditions for employment have not
materially boosted non-farm income.
Over the coming months, constraints
on exports recovery will continue to
weigh on non-farm income and private
consumption.
Looking ahead, the overall
recovery of farm and non-farm income
will be subject to these constraints,
unable to provide a major boost for
private consumption. Nevertheless,
employment fundamentals generally
remain sound, helping households
retain some degree of spending power.
Moreover, the migration of labor
from farm to non-farm sectors, both
manufacturing and services, leads to
higher income for workers. Although
these business sectors tend to pay low
to medium wages, non-farm pay is still
higher than farm income during this
period of subdued agricultural prices,
contributing to higher income and
purchasing power for these workers.
Furthermore, Thailand enjoys higher
productivity gains due to the migration
of labor from farm sector, characterized
by low productivity, to manufacturing
and service sectors with higher
productivity. However, over the long term, the lifting of our labor income requires rising labor
productivity, both in farm and non-farm sectors. This can be done through labor skill
development and adoption of appropriate innovation in production.
Chart 2 Employment growth in manufacturing sector
-2.5
-1.5
-0.5
0.5
1.5
2.5
Jan
2013
Apr Jul Oct Jan
2014
Apr Jul Oct Jan
2015
Apr
High Medium Low
Note: Employment growth in manufacturing sector categorized by hourly wage
High = 76-100 Percentile, e.g. automobile industry
Medium = 34-75 Percentile, e.g. paper industry
Low = 0-33 Percentile, e.g. food and beverages
*The hourly wage for each industry is the average hourly wage during
the Jan 2014 – April 2015 period.
Source: National Statistical Office and calculations by Bank of Thailand
Percentage change from previous month
(3-month moving average, seasonally adjusted)
Chart 3 Employment growth in service
and construction sectors
-2.5
-1.5
-0.5
0.5
1.5
2.5
Jan
2013
Apr Jul Oct Jan
2014
Apr Jul Oct Jan
2015
Apr
High Medium Low
Note: Employment growth in manufacturing sector categorized by hourly wage
High = 76-100 Percentile, e.g. financial intermediaries sector
Medium = 21-75 Percentile, e.g. retail
Low = 0-20 Percentile, e.g. restaurants
* The hourly wage for each industry is the average hourly wage during
the Jan 2014 – April 2015 period.
Source: National Statistical Office and calculations by Bank of Thailand
Percentage change from previous month
(3-month moving average, seasonally adjusted)

Monetary Policy Report June 2015 39
Assessing the probability of deflation risks in Thailand
With headline inflation remaining negative and declining by an average of 0.8 percent
for the first five months of 2015, there could be mounting concerns over the risks of deflation
in the Thai economy. The MPC recognizes the importance of communicating with the public
the definition, causes and impacts of deflation on the economy and financial stability—and the
assessment of the probability of deflation risks in Thailand.
There are narrow and broad definitions of deflation.1/ Defined narrowly, deflation
refers to a sustained contraction of overall prices. However, this narrow definition is rather
incomplete because it does not factor in the causes and consequences of deflation. On the
one hand, deflation may arise from supply-side factors. For example, higher labor
productivity, more advanced technology, and lower costs of inputs could translate into lower
production costs and a general decline in prices, which are beneficial to the economy. On the
other hand, deflation may be driven by demand-side factors. For example, in a prolonged
recession, people may expect a fall in future prices and, therefore, delay consumption. This
will discourage production and private investment, lowering employment, wages and income,
and ultimately creating a deflationary spiral. Therefore, an assessment of deflation risks
should make use of the broader perspectives that take into account the causes and
consequences of deflation. Broadly defined, deflation arises when the price level is
persistently falling across a broad-based range of goods and services, and when the central
bank fails to anchor public inflation expectations. In this broader view, deflation often occurs
during a period of a prolonged contraction of demand and employment, as was the case of
the U.S. and the UK in the 1930s and Japan from the late 1990s to the early 2000s.
Taking this broader perspective, the Thai economy is not experiencing deflation.
This is because the current negative headline inflation stems mostly from the sharp decline
in global crude oil prices given the excess supply of oil. This development benefits the Thai
economy, given the country’s heavy dependence on imports of oil. Subdued oil prices also
reduced costs for household and business sectors, while helping to support private
consumption. In addition, the fall in prices is concentrated in energy and food categories from
supply-side factors. Although the public’s inflation expectations moderated, they remain close
to the inflation target. More importantly, consumption continued to expand. Looking ahead into
the second half of the year, the effects of a high base of oil prices will gradually diminish,
while global oil prices and fresh food prices are expected to pick up. Taking into account
these factors, the Committee projected headline inflation to bottom out in 2015 Q2, before
picking up and finally turning positive in 2015 Q4.
1/
For details on definition of deflation, refer to the article by European Central Bank (2014), Monthly Bulletin,
June 2014.
40 Monetary Policy Report June 2015
Core inflation edged down in early 2015 but remains positive. The decline in core
inflation stemmed from lower food prices, amidst an oversupply of meat and eggs, as well as,
feeble demand. If domestic demand turns out to be weaker than the current projection,
it could put downward pressure on core inflation to drop further in the future.
Apart from assessing the outlook for inflation, the Committee considers other factors
that could elevate the risks of deflation as broadly defined. The BOT has developed the
Combined Deflation Risk Index (CDRI) as a tool for evaluating the probability of deflation
risks in Thailand. In developing the index, the BOT integrated the concepts for index
construction used by the ECB and the IMF2/. The index calculation is based on different risk
factors that could give rise to the kind of deflation which undermines economic and financial
stability. There are a total of 15 variables divided into 5 categories as follows:
(1) Costs and prices including changes in price of goods and services, producer price
index, real wages, and GDP deflator. The broadness and persistence of the decline of prices
are taken into account.
(2) Inflation expectation is measured by the difference between current inflation and
inflation expectation 12-month ahead. A significant fall in inflation expectation reflects
the unanchoring of public inflation expectation, which encourage households to delay
consumption in anticipation of lower prices, thereby reducing current business earnings.
(3) Excess capacity including the output gap and the average real GDP growth in the
medium term relative to the long term. If there is large excess capacity, there will be little
incentive to invest.
(4) Asset prices and exchange rate including changes in the stock exchange index
and the real effective exchange rate (REER). A fall in asset prices suggests declining wealth,
while a rise in the REER reflects lower competitiveness, affecting exports revenue.
(5) Financial factors including credit and money supply growth. Slow growth of credit
and money supply point to sluggish economic activities.
Each variable is assessed against a criteria.3/
A score of 1 is given to a variable that
meets the criteria, and a score of 0 otherwise. The unweighted average4/ is then multiplied by
100 to obtain an index with a possible value ranging from 0 to 100, with the value of 50 and
2/
For more details on conceptual frameworks, see Norges Bank (2014) Deflation Indicator for the Euro Area,
Economic Commentaries No.1/2014, and Decressin, J., and Douglas L. (2009) Gauging Risks for Deflation,
IMF Staff Position Note. SPN/09/01. 3/
Criteria used are drawn from an IMF study (2009), which evaluated the experiences of countries that faced
or are facing deflation problem. 4/
The index calculation based on an unweighted average may fail to capture the varying importance of each
variable. However, when calculating a weighted average, quite a lot of detailed data are required to
determine the appropriate weights for different variables. Further studies will be conducted for this purpose.
Nonetheless, in using the current index, the BOT uses discretion in interpreting the calculated average
index, attaching greater importance to some variables that contribute significantly to deflation risks, such as
public inflation expectations.

Monetary Policy Report June 2015 41
higher indicating high probability of
deflation. To test whether the index
can accurately captures risk of deflation
in practice, the index for Japan over
the 2009-2012 period, where the
Japanese economy was in deflation,
was calculated. The index had a
value greater than 50, with almost all
categories of factors signifying higher
deflation risks (Chart 1).
In the case of Thailand, the
index suggests that the probability
of deflation in Thailand in 2015 is
low. The index edged up in 2015
from lower energy and raw food
prices, causing negative headline
inflation. However, our assessment
of the horizon until the end of the
year points to lower probability of
deflation (Chart 2) in line with higher
costs. The effects of the high base of
oil prices will gradually subside, while
global oil prices is expected to rise
somewhat in the second half of this
year. In the meantime, domestic raw
food prices are projected to pick up after the oversupply of meat and eggs begins to abate.
Demand-side inflationary pressure is also projected to slowly increase as the economy
recovers. Nonetheless, slower- or weaker-than-expected economic recovery could contribute
to higher deflation risks ahead. Hence, the MPC continues to closely monitor Thailand’s
economic and financial developments, in particular those factors affecting private consumption
including income, wages and employment, as well as consumer and business confidence.
-5
-3
-1
1
3
50
10
20
30
40
50
60
70
80
90
100
Jan
2008
Jan
2009
Jan
2010
Jan
2011
Jan
2012
Jan
2013
Jan
2014
Jan
2015
Combined Deflation Risk Index
Headline inflation (RHS)
Index Percentage change from the same period last year
Chart 1 Japan’s Combined Deflation Risk Index
Source: Calculations by Bank of Thailand
Low
Very low
High risk
Medium
-5
-3
-1
1
3
50
10
20
30
40
50
60
70
80
90
100
Jan
2008
Jan
2009
Jan
2010
Jan
2011
Jan
2012
Jan
2013
Jan
2014
Jan
2015
Combined Deflation Risk Index
Headline inflation (RHS)
Chart 2 Thailand’s Combined Deflation Risk Index
Source: Calculations by Bank of Thailand
Low
Very low
High risk
Medium
Percentage change from the same period last yearIndex

Monetary and Financial Stability
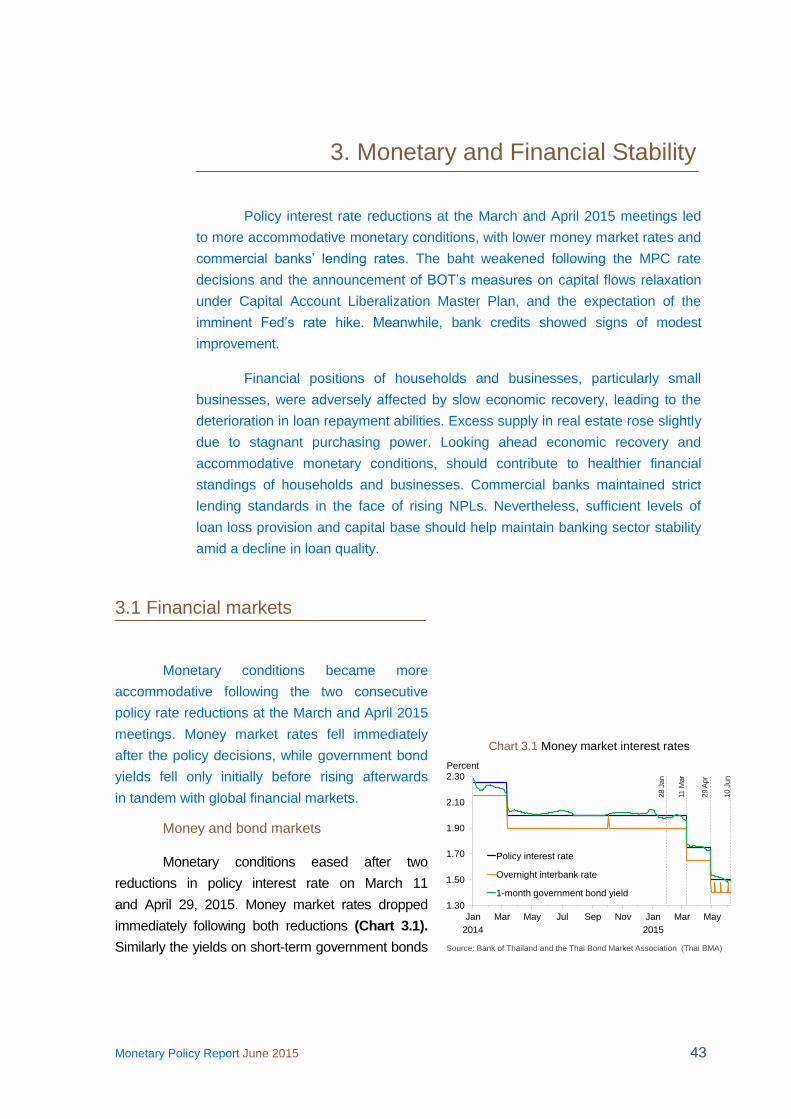
Monetary Policy Report June 2015 43
3. Monetary and Financial Stability
3.1 Financial markets
Monetary conditions became more
accommodative following the two consecutive
policy rate reductions at the March and April 2015
meetings. Money market rates fell immediately
after the policy decisions, while government bond
yields fell only initially before rising afterwards
in tandem with global financial markets.
Money and bond markets
Monetary conditions eased after two
reductions in policy interest rate on March 11
and April 29, 2015. Money market rates dropped
immediately following both reductions (Chart 3.1).
Similarly the yields on short-term government bonds
Policy interest rate reductions at the March and April 2015 meetings led
to more accommodative monetary conditions, with lower money market rates and
commercial banks’ lending rates. The baht weakened following the MPC rate
decisions and the announcement of BOT’s measures on capital flows relaxation
under Capital Account Liberalization Master Plan, and the expectation of the
imminent Fed’s rate hike. Meanwhile, bank credits showed signs of modest
improvement.
Financial positions of households and businesses, particularly small
businesses, were adversely affected by slow economic recovery, leading to the
deterioration in loan repayment abilities. Excess supply in real estate rose slightly
due to stagnant purchasing power. Looking ahead economic recovery and
accommodative monetary conditions, should contribute to healthier financial
standings of households and businesses. Commercial banks maintained strict
lending standards in the face of rising NPLs. Nevertheless, sufficient levels of
loan loss provision and capital base should help maintain banking sector stability
amid a decline in loan quality.
Source: Bank of Thailand and the Thai Bond Market Association (Thai BMA)
1.30
1.50
1.70
1.90
2.10
2.30
Jan Mar May Jul Sep Nov Jan Mar May
Policy interest rate
Overnight interbank rate
1-month government bond yield
Chart 3.1 Money market interest rates
Percent
2014 2015
28 J
an
11 M
ar
29 A
pr
10 J
un

44 Monetary Policy Report June 2015
(up to-2-year sector) declined due to the MPC’s
decisions, weaker economic momentum, as well as
persistently subdued inflation (Chart 3.2).
In May 2015, however, yields on government
bonds of medium to long maturities rose rapidly
(Chart 3.2), in line with other regional bond yields (Chart 3.3), following comments by the Fed’s
Chairwoman on possible overvaluation of the U.S.
equities and treasury bonds. The remark immediately
triggered sell-offs of assets across emerging markets.
In sum, government bond yields up to the 5-year
sector declined, whereas those of longer maturities
increased from the pre-March 11, 2015 meeting
levels (Chart 3.4). As a result, funding costs of
short-term corporate bonds fell steadily, unlike that
of medium to long-term ones, which edged up from
the previous quarter (Chart 3.5).
Equity market
The equity market became less overheated
compared to the previous quarter, due to government
measures to curb speculation as well as sluggish
economic growth. Although valuations of small-
capitalization stocks remained elevated compared
to historical average, risk to financial stability was
deemed limited.
Compared to the first quarter, activities in
the equity market became less overheated during
the first two months of the second quarter, in line
with sluggish economic activity. The Stock Exchange
of Thailand (SET) index remained steady, while
the Market for Alternative Investment (MAI) index
fell. In April and May 2015, retail investors were
net sellers in the SET market (Chart 3.6), and
they also reduced new purchases in the MAI
(Chart 3.7). On the other hand, foreign investors,
who were net sellers in the first quarter, became
net buyers in the SET during the second quarter.
1.40
1.60
1.80
2.00
2.20
2.40
2.60
2.80
3.00
3.20
5-J
an
-15
13
-Jan
-15
21-J
an
-15
29
-Jan
-15
6-F
eb
-15
16
-Feb
-15
24
-Feb
-15
5-M
ar-
15
13-M
ar-
15
23-M
ar-
15
31-M
ar-
15
9-A
pr-
15
22-A
pr-
15
30-A
pr-
15
13-M
ay-
15
21-M
ay-
15
29-M
ay-
15
9-J
un
-15
Percent
10-Year 5-Year 3-Year
2-Year 1 -Year
Chart 3.2 Government bond yields in 1 to 10-year sector
Thai and global economies
recovered at slower pace
than expected
Global concern on
bonds overvaluation
Source: Bank of Thailand and the Thai Bond Market Association (Thai BMA)
11 M
ar
29 A
pr
2
3
4
5
6
7
8
9
Jan
2012
Jul Jan
2013
Jul Jan
2014
Jul Jan
2015
South Korea Malaysia Indonesia Phillippines India Thailand
Source: Bloomberg
Chart 3.3 10-year government bond yields
in regional countries
Percent June 10, 2015
-60
-40
-20
0
20
40
1.0
1.5
2.0
2.5
3.0
3.5
1M 3M 6M 1Y 2Y 3Y 5Y 7Y 10Y 12Y 14Y 15Y
Chart 3.4 Changes in government bond yield curves
Source: Bank of Thailand and the Thai Bond Market Association (Thai BMA)
Percent Basis points
March 10, 2015
June 10, 2015
Change from March 10, 2015
(RHS)
2.00
2.50
3.00
3.50
4.00
4.50
5.00
5.50
6.00
6.50
Jan
2013
Jul Jan
2014
Jul Jan
2015
AAA AA A BBB
Chart 3.5 Thai corporate bond yields
Source: Thai Bond Market Association (Thai BMA)
Percent
3-year corporate bonds 5-year corporate bonds
2.00
2.50
3.00
3.50
4.00
4.50
5.00
5.50
6.00
6.50
Jan
2013
Jul Jan
2014
Jul Jan
2015
AAA AA A BBB
Percent
Quart
er
2
Quart
er
2
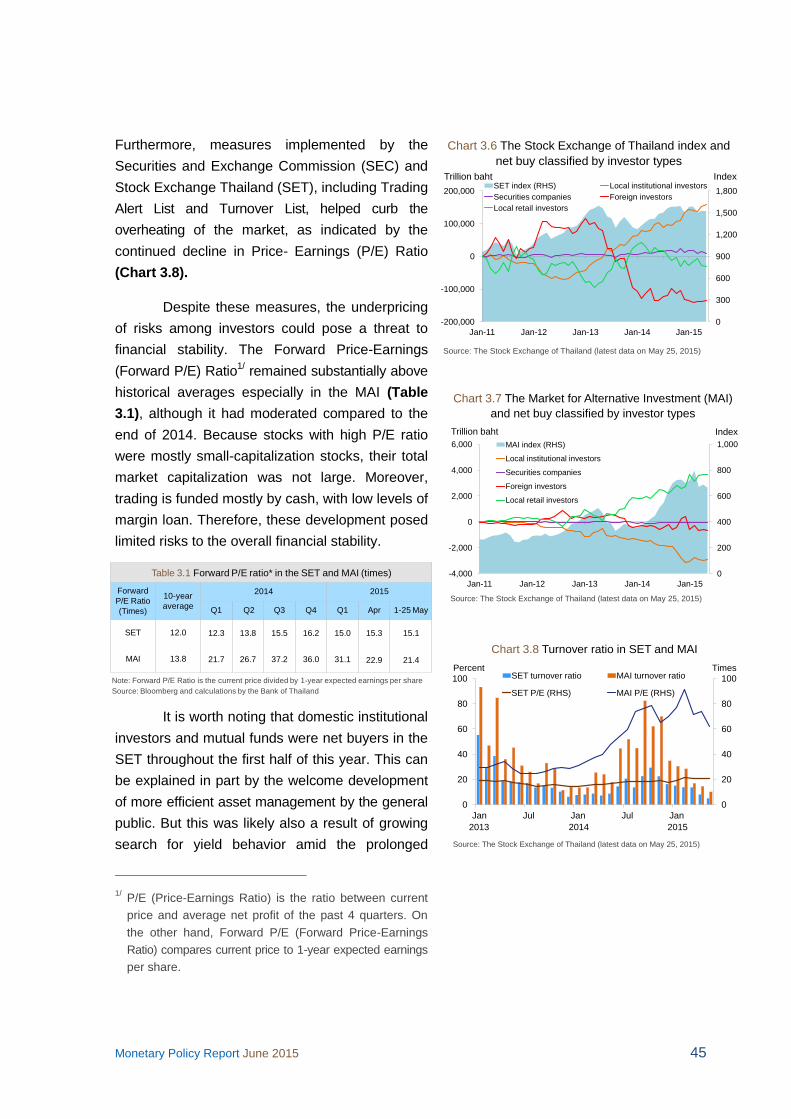
Monetary Policy Report June 2015 45
Furthermore, measures implemented by the
Securities and Exchange Commission (SEC) and
Stock Exchange Thailand (SET), including Trading
Alert List and Turnover List, helped curb the
overheating of the market, as indicated by the
continued decline in Price- Earnings (P/E) Ratio
(Chart 3.8).
Despite these measures, the underpricing
of risks among investors could pose a threat to
financial stability. The Forward Price-Earnings
(Forward P/E) Ratio1/ remained substantially above
historical averages especially in the MAI (Table
3.1), although it had moderated compared to the
end of 2014. Because stocks with high P/E ratio
were mostly small-capitalization stocks, their total
market capitalization was not large. Moreover,
trading is funded mostly by cash, with low levels of
margin loan. Therefore, these development posed
limited risks to the overall financial stability.
It is worth noting that domestic institutional
investors and mutual funds were net buyers in the
SET throughout the first half of this year. This can
be explained in part by the welcome development
of more efficient asset management by the general
public. But this was likely also a result of growing
search for yield behavior amid the prolonged
1/
P/E (Price-Earnings Ratio) is the ratio between current
price and average net profit of the past 4 quarters. On
the other hand, Forward P/E (Forward Price-Earnings
Ratio) compares current price to 1-year expected earnings
per share.
26
Trillion baht
Chart 3.6 The Stock Exchange of Thailand index and
net buy classified by investor types
Source: The Stock Exchange of Thailand (latest data on May 25, 2015)
0
300
600
900
1,200
1,500
1,800
-200,000
-100,000
0
100,000
200,000
Jan-11 Jan-12 Jan-13 Jan-14 Jan-15
SET index (RHS) Local institutional investors
Securities companies Foreign investors
Local retail investors
Index
26
Trillion baht
Chart 3.7 The Market for Alternative Investment (MAI)
and net buy classified by investor types
Source: The Stock Exchange of Thailand (latest data on May 25, 2015)
0
200
400
600
800
1,000
-4,000
-2,000
0
2,000
4,000
6,000
Jan-11 Jan-12 Jan-13 Jan-14 Jan-15
MAI index (RHS)
Local institutional investors
Securities companies
Foreign investors
Local retail investors
Index
0
20
40
60
80
100
0
20
40
60
80
100
Jan Jul Jan Jul Jan
SET turnover ratio MAI turnover ratio
SET P/E (RHS) MAI P/E (RHS)
Chart 3.8 Turnover ratio in SET and MAI
Source: The Stock Exchange of Thailand (latest data on May 25, 2015)
TimesPercent
2013 2014 2015
Table 3.1 Forward P/E ratio* in the SET and MAI (times)
Forward
P/E Ratio
(Times)
10-year
average
2014 2015
Q1 Q2 Q3 Q4 Q1 Apr 1-25 May
SET 12.0 12.3 13.8 15.5 16.2 15.0 15.3 15.1
MAI 13.8 21.7 26.7 37.2 36.0 31.1 22.9 21.4
Note: Forward P/E Ratio is the current price divided by 1-year expected earnings per share
Source: Bloomberg and calculations by the Bank of Thailand

46 Monetary Policy Report June 2015
period of low-interest environment. Trading activities
in equities and other asset classes, as well as
their implications on financial stability, will continue
to be closely monitored going forward.
Foreign exchange market
The Thai baht against U.S. dollar exchange
rate stabilized in April 2015, before weakening
steadily starting from the end of the month (Chart
3.9) as a result of the unexpected rate reduction
on April 29, 2015. The ensuing announcement of
BOT’s measures on capital flows relaxation on
April 30, 2015 also contributed to the continued
weakening of the baht.
In May, asset sell-offs by non-residents
across emerging economies, including Thailand,
led to massive net outflows from the bond
market. As a result, the baht depreciated further against U.S. dollar, closing at 33.66 baht per
U.S. dollar on June 10, 2015, a 3.3 percent
depreciation from the end of the first quarter. Also, the baht volatility surged compared to
those of regional currencies during the same
period (Chart 3.10).
Depreciation of the baht against major and
most regional currencies led to a decline in
Nominal Effective Exchange Rate (NEER) and
Real Effective Exchange Rate (REER) in May
2015. In particular, the NEER fell by 2.8 percent from the last quarter (Chart 3.11)
Chart 3.9 Movements in USDTHB and
exchange rate indices
Note: DXY is an index of USD compared to a basket of EUR JPY GBP CAD SEK and CHF
ADXY is an index of Asian currencies (CNY KRW SGD HKD INR TWD THB MYR IDR and PHP) against USD
Source: USDTHB index from the Bank of Thailand, DXY and ADXY from Bloomberg
Index (December 30, 2014 = 100)
95
100
105
110
115
30-D
ec-1
4
06-J
an-1
5
13-J
an-1
5
20-J
an-1
5
27-J
an-1
5
03-F
eb-1
5
10-F
eb-1
5
17-F
eb-1
5
24-F
eb-1
5
03-M
ar-
15
10-M
ar-
15
17-M
ar-
15
24-M
ar-
15
31-M
ar-
15
07-A
pr-
15
14-A
pr-
15
21-A
pr-
15
28-A
pr-
15
05-M
ay-1
5
12-M
ay-1
5
19-M
ay-1
5
26-M
ay-1
5
02-J
un-1
5
09-J
un-1
5
ADXYA
pr
29 (
MP
C)
May 7
(Yellen’s
com
ment)
Mar
11 (
MP
C)
Mar
18
(Dovis
h F
OM
C S
tate
ment)
Appreciation
USDTHB
DXY
Note: DXY is an index of USD compared to a basket of EUR JPY GBP CAD SEK and CHF ADXY is an index of Asian currencies (CNY KRW SGD HKD INR TWD THB MYR IDR and PHP) against USD
Source: USDTHB index from the Bank of Thailand, DXY and ADXY from Bloomberg
0%
2%
4%
6%
8%
10%
12%
Jan Mar May Jul Sep Nov Jan Mar May
MYR
KRW
THB
TWDINR
IDR
PHP
Chart 3.10 Volatility of the baht and regional currencies
Note: Volatility is computed by Exponentially Weighted Moving Average
(EWMA) method
Source: The Bank of Thailand and Reuters
2014 2015
95
100
105
110
115
Jan-1
3
Ma
r-13
May-1
3
Jul-13
Sep-1
3
Nov-1
3
Jan-1
4
Mar-
14
Ma
y-1
4
Jul-14
Sep-1
4
Nov-1
4
Jan-1
5
Mar-
15
May-1
5
Chart 3.11 NEER and REER
Index (Base year = 2012)
NEER .
REER
108.46
Baht appreciation against trading partners’ currencies
May
Note: *Preliminary data using NEER from May 2015, and inflation from April 2015
as a proxy for May 2015 inflation
Source: Bank of Thailand
Monetary Policy Report June 2015 47
3.2 Financial institutions
Following the monetary policy easing in
March and April 2015, private sector’s funding
costs and returns on deposits declined. Commercial
banks’ benchmark loan rates and deposit rates
dropped, although the degree to which loan rates
responded to the policy rate cut on April 29, 2015
was more limited and slower than past averages.
Meanwhile, credit expansion showed signs of
some improvements. On the other hand, deposit
growth continued to be subdued as ample liquidity
amongst financial institutions reduced the competition
for deposits.
Interest rates, credits, and deposits
Funding costs of commercial bank loans
declined following lower policy interest rate,
especially after the March 11, 2015 decision. The
majority of commercial banks reduced their
Minimum Lending Rates (MLR) within the two weeks
following the policy decision, although other
benchmark rates, including Minimum Retail Rate
(MRR), were kept constant (Table 3.2). Actual
funding costs, however, would depend on each loan
applicant’s credit risk while commercial banks
tighten their lending standards for both business and
household.
The degree with which loan rates followed
lower policy rate at the April 29, 2015 meeting was
relatively slow and limited only to a few large
commercial banks. This was because most banks
were concerned over the outlook of bank earnings
amid weaker-than-expected economic prospect and
rising NPLs. More recently, however, the lending
rates to creditworthy retail borrowers (MRR), offered
by some large commercial banks, have been
adjusted lower in line with the policy rate reductions.

48 Monetary Policy Report June 2015
Meanwhile, commercial banks reduced their
deposit rates in line with the fall in the policy rate
(Chart 3.12). The reduction was also partly driven by
ample liquidity among banks stemming from
sluggish demand for credits. A more detailed look
revealed that most banks cut the interest rates on
fixed deposit and special deposit products, while
leaving those on current deposit and savings
accounts unchanged, both of which constitute the
majority of total deposits.
Private credit growth accelerated slightly
in 2015 Q1, up to 5.4 percent from 4.5 percent in
the last quarter of 2014 (Chart 3.13). Signs of
improvements in credit issuance became evident for
both household and business, although growth in
business loans was limited to just a few sectors
(Chart 3.14).
Chart 3.2 Benchmark loans and deposits rates of commercial banks*
Percent 20132014 2015
Q1 Q2 Q3 Q4 Q1 Apr 30 Jun 9
12-month deposits
Average of the 4 largest commercial banks** 2.23 . . 1.73 1.73 1.53 1.53 1.50
Average of remaining banks 2.61 . . 2.19 2.22 1.93 1.90 1.77
Minimum lending rate (MLR)
Average of the 4 largest commercial banks 6.84 . . 6.75 6.75 6.63 6.63 6.51
Average of remaining banks 7.62 . . 7.45 7.44 7.37 7.34 7.27
Minimum retail rate (MRR)
Average of the 4 largest commercial banks . . . . . . . .
Average of remaining banks . . . . . . . .
Note: *Benchmark rates averaged across commercial banks at the end of the period
** Four largest commercial banks namely BBL, KTB, KBANK and SCB
*** Since August 2014, Bank of China (Thailand) became a domestically-registered commercial bank.
Therefore, its interest rates are included in the Average of remaining banks rates in the table above .
1.5
1.7
1.9
2.1
2.3
2.5
2.7
2.9
3.1
March 10, 2015 May 21, 2015
Chart 3.12 Special deposit rates*
Note: *Maximum rates offered
March 10, 2015
May 21, 2015
Percent
Source: Bank of Thailand
Months
Chart 3.13 Other Depository Institutions’ private credits
Annual percentage change
Source: Bank of Thailand
7.1
0
5
10
15
20
Jan
2011
Jan
2012
Jan
2013
Jan
2014
Jan
2015
Private credits Corporate credits
Household credits
Apr
5.4
3.0

Monetary Policy Report June 2015 49
Credits to the private sector by depository
institutions2/ grew from 2014 Q4. However, new
loan issuance was largely working capital loans,
whereas fixed assets loans continued to slow in
line with weak private investment. New issuances
were also concentrated in a few business sectors,
likely a result of transitory factors. For example,
anticipated rise in the excise tax brought forward
production and hence accelerated credit demands
by the food and beverages industry in February.
With regards to the capital markets, businesses
obtained more funding via the bond market
compared to the previous quarter (Chart 3.15).
The fall in short-term yields following policy rate
cuts in March and April 2015 spurred the corporate
bond issuance in the 1-3 year sector. Similarly,
equity issuances rose sharply in March 2015,
led by construction materials, real estate, and
transportation sectors.
New issuance of household credits also
expanded somewhat compared to the last quarter
of 2014, driven partly by credits that Specialized
Financial Institutions extended to village funds and
farmers under the Ministry of Finance’s initiatives.
But given subdued economic recovery and
uncertainty over future income, consumers
remained cautious with regards to their spending.
Thus, there is great uncertainty over the degree
which consumption spending will benefit from
these new credits. Meanwhile, household credit
approval rate dropped from the previous quarter
2/ Depository institutions include domestically-registered
commercial banks, branches of foreign banks, international
banking facilities (ceased operations in 2006), financial
companies, specialized financial institutions, savings
cooperatives, and money market mutual funds, excluding
the Bank of Thailand.
Chart 3.15 Corporate financing*
Source: Bank of Thailand and Thai BMA
-25
0
25
50
75
100
Oct
2014
Nov Dec Jan
2015
Feb Mar Apr
Corporate loans Corporate bonds Newly issued equity
Billion baht
Note: *Newly issued equities, change in corporate loans (seasonally adjusted)
and corporate bonds
0.0
0.2
0.4
0.6
0.8
1.0
0
50
100
150
Oct2014
Nov Dec Jan2015
Feb Mar Apr Oct 2014
Nov Dec Jan2015
Feb Mar Apr
Chart 3.14 New private credits
(Changes in credit balance, seasonally adjusted)
Billion baht
Source: Bank of Thailand
Household CorporatePercent

50 Monetary Policy Report June 2015
as some financial institutions tightened their credit
standards.
Looking ahead, the latest Senior Loan
Officers’ Survey indicates that demand for
business credits will pick up slightly. Most of the
increased demand is for working capital in sectors
that mainly produce for the domestic market, as
well as tourism-related industries, such as food
and beverages, hotels and restaurants, and
wholesale and retail trade. Household credits are
also expected to grow, especially those for other
consumption categories. Nevertheless, given the
concerns over weak economic prospects and
worsening credit quality, financial institutions will
likely remain cautious in lending.
Since 2014 Q4, the liquidity position of
commercial banks has increased, as indicated by
loan to deposit (including bills of exchange (B/E))
ratio falling from 98.3 percent in June 2014 to 94.5
percent at the end of April 2015 (Chart 3.16)3/.
That, coupled with slower-than-expected economic
recovery, led to a decline in competition for deposits
among banks, resulting in lower interest rates on
special deposit products. As a result, the amount
of new deposits shrank in 2015 Q1 and in April
(Chart 3.17). Yet deposits and bills of exchange
(B/E) for other depository institutions rose by 5.8
percent from the same period last year, and by 4.0
percent from the previous quarter (Chart 3.18).
3/
Although credits accelerated and competition for deposits
among financial institutions eased, loan to deposit including
bills of exchange (B/E) ratio declined from the previous
quarter because deposits constitute a large base.
Chart 3.16 Loans to deposits and B/E ratio of
commercial banksPercent
Source: Bank of Thailand
Apr
94.5
80
85
90
95
100
Jan
2011
Jul Jan
2012
Jul Jan
2013
Jul Jan
2014
Jul Jan
2015
-2
-1
0
1
2
3
4
-100
-50
0
50
100
150
200
Oct
2014
Nov Dec Jan
2015
Feb Mar Apr Oct
2014
Nov Dec Jan
2015
Feb Mar Apr
Chart 3.17 New deposits*
Billion baht
Household Corporate
Note: *Change in outstanding deposits at all depository institutions (excluding
the Bank of Thailand). This includes neither transfers of deposits within
and among banks, nor rollovers of deposits.
Percent
Chart 3.18 Other Depository Institutions’ deposits
Annual percentage change
Source: Bank of Thailand
-10
0
10
20
30
40
50
0
5
10
15
20
25
Jan
2011
Jul Jan
2012
Jul Jan
2013
Jul Jan
2014
Jul Jan
2015
Corporate (RHS)Deposits
including B/E
Household4.6
Apr
11.2
5.8

Monetary Policy Report June 2015 51
Stability of financial institutions
Earnings and stability of financial institution
system remained resilient, although loan quality
deteriorated somewhat from the end of 2014
due to the slow economic recovery. Nevertheless,
commercial banks have maintained high level of
loan loss provision and capital base that would
serve as cushion against economic uncertainties.
Overall loan quality worsened, reflected by
the delinquency and NPL Ratio (those loans with more than one month overdue) that climbing to 6.0
percent (Chart 3.19). Worsening loan quality were
detected among the SME credits and all types of
consumer credits (Table 3.3). Nonetheless, sound
risk management and high level of provision have
continued to ensure the stability of financial
institutions. The ratio of Actual to Regulatory Loan
Loss Provision Ratio stood at 165.9 percent, while
Capital Adequacy Ratio was at 16.6 percent, both
indicating strong financial position which should be
able to absorb shocks from deteriorating loan
quality.
3.3 Non-financial sectors
Household sector
Sluggish economic recovery resulted in
lower household income, thus weakening household
financial positions. Therefore, consumers have
become more guarded with respect to spending
and incurring new debts. More cautious lending
standard by financial institutions also contributed
to the slowdown in household debt accumulation.
Furthermore, repayment ability among households
with high debt outstanding was negatively impacted
by the weak economy, reflected by the rising
4.5
5.5
6.5
Jan
2012
Jul Jan
2013
Jul Jan
2014
Jul Jan
2015
Total private credits Corporate loans Consumer loans
Chart 3.19 Delinquency and NPL Ratio (more than 1 month overdue)
Percent
Note: Excluding loans to government and Interbank loans
Source: Bank of Thailand
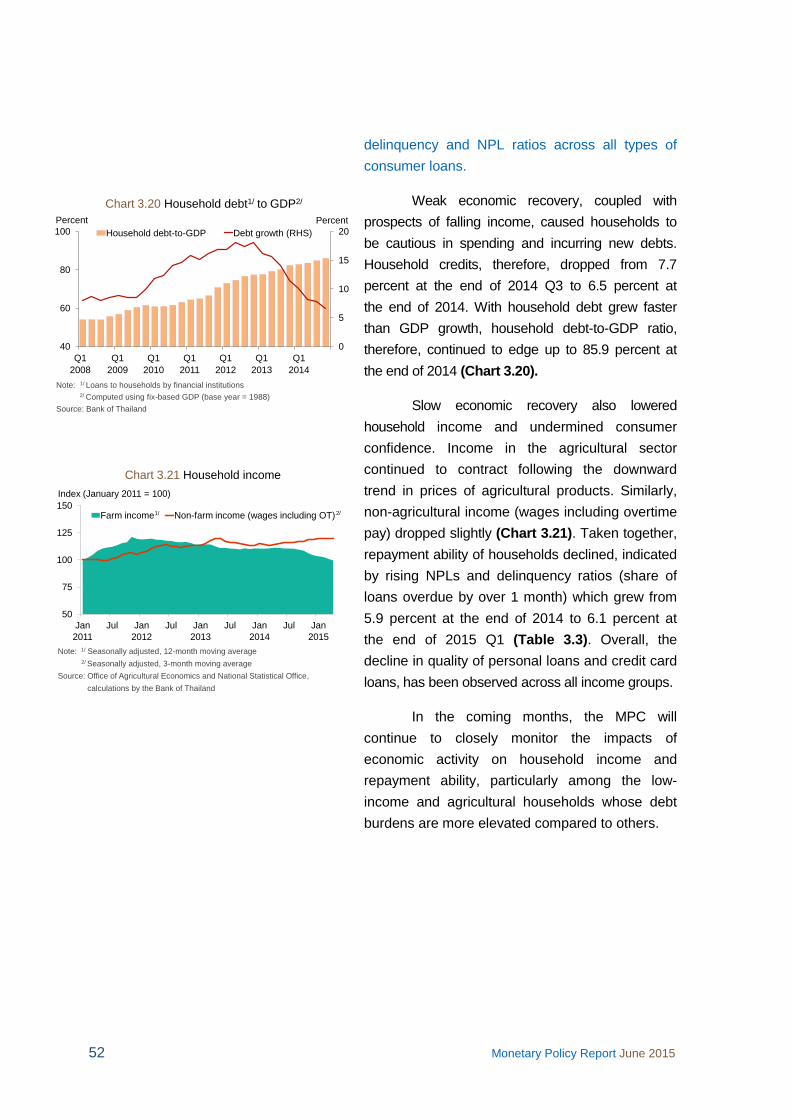
52 Monetary Policy Report June 2015
delinquency and NPL ratios across all types of
consumer loans.
Weak economic recovery, coupled with
prospects of falling income, caused households to
be cautious in spending and incurring new debts.
Household credits, therefore, dropped from 7.7
percent at the end of 2014 Q3 to 6.5 percent at
the end of 2014. With household debt grew faster
than GDP growth, household debt-to-GDP ratio,
therefore, continued to edge up to 85.9 percent at
the end of 2014 (Chart 3.20).
Slow economic recovery also lowered
household income and undermined consumer
confidence. Income in the agricultural sector
continued to contract following the downward
trend in prices of agricultural products. Similarly,
non-agricultural income (wages including overtime
pay) dropped slightly (Chart 3.21). Taken together,
repayment ability of households declined, indicated
by rising NPLs and delinquency ratios (share of
loans overdue by over 1 month) which grew from
5.9 percent at the end of 2014 to 6.1 percent at
the end of 2015 Q1 (Table 3.3). Overall, the
decline in quality of personal loans and credit card
loans, has been observed across all income groups.
In the coming months, the MPC will
continue to closely monitor the impacts of
economic activity on household income and
repayment ability, particularly among the low-
income and agricultural households whose debt
burdens are more elevated compared to others.
0
5
10
15
20
40
60
80
100
Q1
2008
Q1
2009
Q1
2010
Q1
2011
Q1
2012
Q1
2013
Q1
2014
Household debt-to-GDP Debt growth (RHS)
Note: 1/ Loans to households by financial institutions
2/ Computed using fix-based GDP (base year = 1988)
Source: Bank of Thailand
Chart 3.20 Household debt1/ to GDP2/
Percent Percent
Note: 1/ Seasonally adjusted, 12-month moving average
2/ Seasonally adjusted, 3-month moving average
Source: Office of Agricultural Economics and National Statistical Office,
calculations by the Bank of Thailand
Chart 3.21 Household income
Index (January 2011 = 100)
50
75
100
125
150
Jan
2011
Jul Jan
2012
Jul Jan
2013
Jul Jan
2014
Jul Jan
2015
Farm income Non-farm income (wages including OT)1/ 2/

Monetary Policy Report June 2015 53
Corporate sector
Earnings of corporate sector declined
slightly from the previous quarter. Moreover,
financial standing of households and businesses,
especially small businesses, were affected by
slow economic recovery, causing a decline in
repayment ability.
In 2015 Q1, earnings of listed companies
showed signs of slowing down from the previous
quarter, indicated by a decline in the Return on
Asset ratio (ROA) (Chart 3.22). In the real estate
sector, sluggish economic recovery led to lower
sales, while firms incurred surges in marketing
and operational expenses. As a result, Net Profit
Margin (NPM) for the real estate sector fell. (Chart
3.23). Likewise, construction firms have not benefited
significantly from government’s infrastructure
investment. Meanwhile, the petroleum sector
continued to be undermined by the subdued
global crude oil prices, resulting in the decline of
the Asset Turnover Ratio (ATO) (Chart 3.24).
Nevertheless, their earnings were partly improved
from the fact that stock losses and asset impairments
had been realised in the previous accounting
periods. On the other hand, growing tourism sector
benefited hotels and restaurants, as well as
transportation industries, particularly the airline
industry. Declining oil prices also boosted the
earnings of transportation group.
Despite these developments, risks to the
stability of the corporate sector remain low,
evidenced by the stable Debt-to-Equity ratio
(Chart 3.25). Overall the repayment ability fell
slightly, indicated by a small drop in Interest
Coverage Ratio (ICR), but at levels still considered
robust (Chart 3.26). A closer look at firms across
different sizes (5 groups classified by sizes),
Note: *Average financial ratio of each sector
**Excluding petrochemical
Source: The Stock Exchange of Thailand. Calculations by the Bank of Thailand.
Chart 3.22 Return on Asset* (ROA)
classified by business sectors
0
1
2
3
4
Q12012
Q32012
Q12013
Q32013
Q12014
Q32014
Q12015
Overall Manufacturing**
Petrochemical Construction
Real estate Retail and wholesale
Percent
Note: *Average financial ratio of each sector
**Excluding petrochemical
Source: The Stock Exchange of Thailand. Calculations by the Bank of Thailand.
Chart 3.23 Net Profit Margin* classified by sectors
-5
0
5
10
15
20
Q1
2012
Q3
2012
Q1
2013
Q3
2013
Q1
2014
Q3
2014
Q1
2015
Overall Manufacturing**
Petrochemical Construction
Real estate Retail and wholesale
Percent
Note: *Average financial ratio of each sector
**Excluding petrochemical
Source: The Stock Exchange of Thailand,. Calculations by the Bank of Thailand.
0
10
20
30
40
50
Q12012
Q32012
Q12013
Q32013
Q12014
Q32014
Q12015
Overall Manufacturing**
Petrochemical Construction
Real estate Retail and wholesale
Percent
Chart 3.24 Asset Turnover Ratio*
classified by business sectors

54 Monetary Policy Report June 2015
however, revealed that medium to large listed
companies maintained high repayment ability, with
high ICR (Chart 3.27). On the other hand, the
smallest firm group exhibited sharp declines in
ICR, signaling potential liquidity risks. If these
small listed firms are taken to reflect the situations
of the non-listed firms which tend to be small and
medium sized firms, this may indicate the worsening
liquidity positions and lower repayment ability of
SMEs as a result of the lethargic economy as well.
Thus, the MPC will continue to closely monitor this
issue going forward (Table 3.3).
Real estate sector
Excess supply in the real estate sector
continued to rise, particularly for condominiums,
as consumer purchasing power was adversely
affected by slow economic growth and banks’
cautious stance towards new issuance of mortgage
loans. Nevertheless, the real estate sector, which
is dominated by large firms, possessed solid
financial position and continued to adapt to the
changing business conditions. Thus, the sector is
likely to pose limited stability risk to overall
financial system at the moment.
Demand in real estate market slowed
markedly over the first five months of 2015, as
a result of weak economic recovery, subdued
household incomes, persistently elevated level of
household debt, and more stringent lending
standards applied to the sector by financial
institutions. As such, most real estate firms
postponed new project launches, although on
balance the number of project launches rose
because some large firms decided to relaunch
shelved projects in April (Chart 3.28). The majority
of these new projects were condominiums along
mass transit rail routes, for which developers
0
1
2
3
4
Overall Manufacturing** Petrochemical Construction Real estate Retail and wholesale
2014 Q3 2014 Q4 2015 Q1
Times
Chart 3.25 Debt-to-Equity Ratio*
classified by business sectors
0
2
4
6
8
10
Overall Manufacturing** Petrochemical Construction Real estate Retail and wholesale
2014 Q3 2014 Q4 2015 Q1
Times
Chart 3.26 Interest Coverage Ratio*
Classified by business sectors
Chart 3.27 Interest Coverage Ratio*
Classified by firm sizes**
0
2
4
6
8
10
Quintile 1 Quintile 2 Quintile 3 Quintile 4 Quintile 5
2014 Q3 2014 Q4 2015 Q1Times
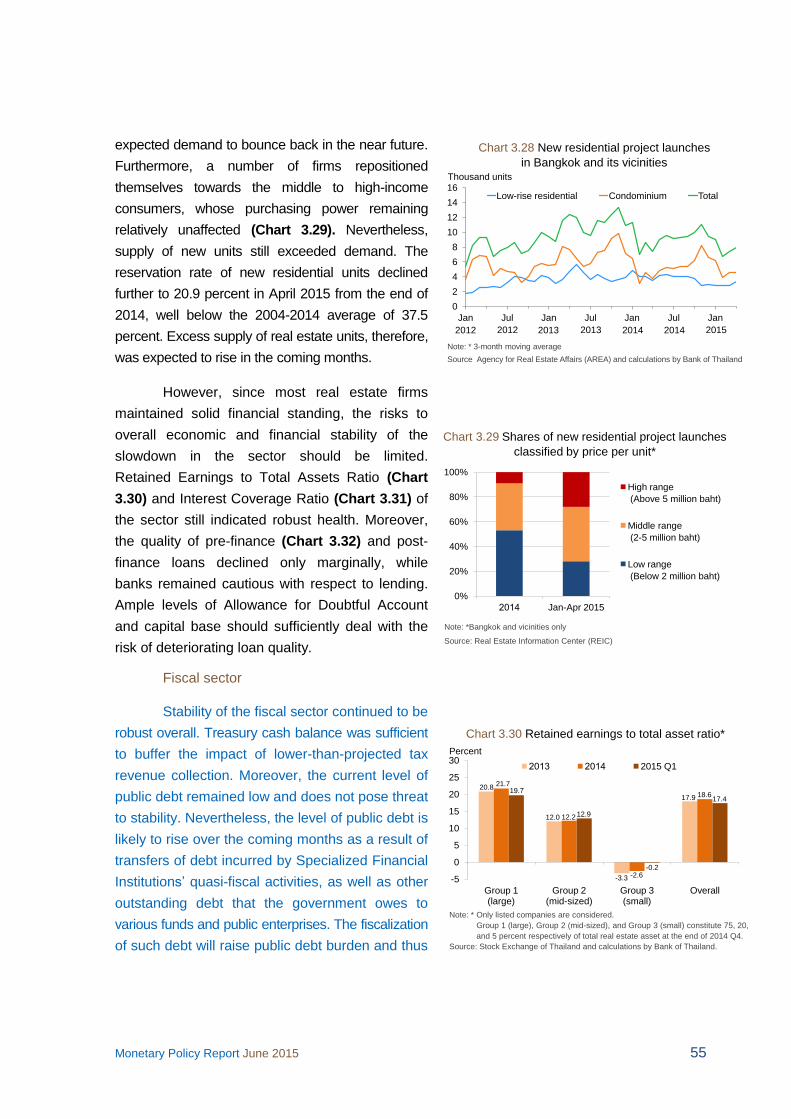
Monetary Policy Report June 2015 55
expected demand to bounce back in the near future.
Furthermore, a number of firms repositioned
themselves towards the middle to high-income
consumers, whose purchasing power remaining
relatively unaffected (Chart 3.29). Nevertheless,
supply of new units still exceeded demand. The
reservation rate of new residential units declined
further to 20.9 percent in April 2015 from the end of
2014, well below the 2004-2014 average of 37.5
percent. Excess supply of real estate units, therefore,
was expected to rise in the coming months.
However, since most real estate firms
maintained solid financial standing, the risks to
overall economic and financial stability of the
slowdown in the sector should be limited.
Retained Earnings to Total Assets Ratio (Chart
3.30) and Interest Coverage Ratio (Chart 3.31) of
the sector still indicated robust health. Moreover,
the quality of pre-finance (Chart 3.32) and post-
finance loans declined only marginally, while
banks remained cautious with respect to lending.
Ample levels of Allowance for Doubtful Account
and capital base should sufficiently deal with the
risk of deteriorating loan quality.
Fiscal sector
Stability of the fiscal sector continued to be
robust overall. Treasury cash balance was sufficient
to buffer the impact of lower-than-projected tax
revenue collection. Moreover, the current level of
public debt remained low and does not pose threat
to stability. Nevertheless, the level of public debt is
likely to rise over the coming months as a result of
transfers of debt incurred by Specialized Financial
Institutions’ quasi-fiscal activities, as well as other
outstanding debt that the government owes to
various funds and public enterprises. The fiscalization
of such debt will raise public debt burden and thus
0
2
4
6
8
10
12
14
16
Jan Jul Jan Jul Jan Jul Jan
Low-rise residential Condominium Total
Thousand units
Note: * 3-month moving average
Source Agency for Real Estate Affairs (AREA) and calculations by Bank of Thailand
Chart 3.28 New residential project launches
in Bangkok and its vicinities
2012 2012 2013 2013 2014 2014 2015
Chart 3.29 Shares of new residential project launches
classified by price per unit*
0%
20%
40%
60%
80%
100%
Jan-Apr 2015
High range
(Above 5 million baht)
Middle range
(2-5 million baht)
Low range
(Below 2 million baht)
Note: *Bangkok and vicinities only
Source: Real Estate Information Center (REIC)
Chart 3.30 Retained earnings to total asset ratio*
Note: * Only listed companies are considered.
Group 1 (large), Group 2 (mid-sized), and Group 3 (small) constitute 75, 20,
and 5 percent respectively of total real estate asset at the end of 2014 Q4.
Source: Stock Exchange of Thailand and calculations by Bank of Thailand.
20.8
12.0
-3.3
17.9
21.7
12.2
-2.6
18.619.7
12.9
-0.2
17.4
-5
0
5
10
15
20
25
30
Group 1 (large)
Group 2 (mid-sized)
Group 3 (small)
Overall
2015 Q1
Percent

56 Monetary Policy Report June 2015
will be one of the key issues that needs to be
monitored going forward.
The outlook for fiscal sector remained
stable, as reflected by a number of indicators. (1)
Treasury budget balance had increased and was
sufficient to meet necessary demand of liquidity as
well as offset the projected shortfall of revenue
collection this year, marking two consecutive
years of revenue shortfall in line with economic
slowdown. Treasury budget balance at the end of
April 2015 stood at 126 billion baht, up from 116
billion baht in January 2015. The increase was a
result of the fact that the government had
borrowed more than needed to cover for monthly
budget deficits. (2) The ratio of public debt to
GDP*/ grew slightly, but remained well below
the fiscal sustainability threshold of 60 percent.
In March 2015, the ratio recorded at 43.3 percent,
up from 42.8 percent in December 2014 (Chart
3.33). New borrowings that covered for budget
deficits and those provisioned for the restructuring
of debt due on May 22, 2015 contributed to the
increase in the public debt to GDP ratio.
Going forward, a major risk factor that
requires close monitoring is the potential surge in public debt following the debt transfer plan. First,
debts incurred by SFIs for quasi-fiscal measures
will be transferred to the government. Moreover,
further outstanding debt burden includes the amounts that the government owes to various
funds and public enterprises, such as rice subsidy
*/ Debt-to-GDP ratio is disseminated by the Public Debt
Management Office of the Ministry of Finance. The
current series is constructed using the new chained
volume measure GDP, publicized on May 18, 2015. The
ratios in this series are significantly smaller than those
constructed using the former GDP series (with fixed
base year).
9.4
7.8
3.7
8.98.9
6.1
3.5
8.18.8
6.0
2.8
8.0
0
2
4
6
8
10
Group 1 (large)
Group 2 (mid-sized)
Group 3 (small)
Overall
2015 Q1
Chart 3.31 Interest Coverage Ratio*
Note: *Considers only listed companies
Group 1 (large), Group 2 (mid-sized), and Group 3 (small) constitute 75, 20,
and 5 percent respectively of total real estate asset at the end of 2014 Q4.
Source: Stock Exchange of Thailand and calculations by Bank of Thailand.
Percent
0
2
4
6
8
10
0
10
20
30
40
50
Q1 Q1 Q1 Q1 Q1
NPL SM NPL ratio SM ratio
Billion baht
2011
Percent to pre-finance
2.7
4.3
Source: Bank of Thailand
Chart 3.32 Mortgage loan quality of commercial banks
(Pre-finance)
2012 2013 2014 2015
4.3
3.0
38
.53
8.2 3
9.3 4
0.2
40
.44
1.6 4
2.4
42
.84
1.9
40
.64
0.4
40
.2 40
.64
0.7
40
.84
0.7
40
.74
1.0
40
.94
1.2 4
2.2
41
.74
1.8
42
.24
2.3
46
.9
42
.94
3.0
42
.4 43
.44
3.3
43
.14
3.5
43
.14
2.9
42
.84
2.9
43
.34
3.3
36
38
40
42
44
46
48
50
Jan
2012
Apr Jul Oct Jan
2013
Apr Jul Oct Jan
2014
Apr Jul Oct Jan
2015
Debt-to-GDP ratio (Chained-volume measure GDP)
Debt-to-GDP ratio (Fixed-base GDP)
Note: (1) Chart shows calendar years, (2) Official figures for Debt-to-GDP ratio
based on Chained-Volume Measure GDP are only available for February
and March 2015. The figures prior to this period are calculated by the
Bank of Thailand.
Source: Public Debt Management Office
Chart 3.33 Public Debt to GDP ratio*Percent of GDP

Monetary Policy Report June 2015 57
scheme, crop price guarantee scheme, social
security fund, and other state-owned enterprises.
Nevertheless, new policy which requires existing
revolving funds to return excess liquidity to the
treasury, which amounts to 30 billion baht in total,
would partly lessen the risk to fiscal stability
emerging from the imbalance between revenue
and spending.
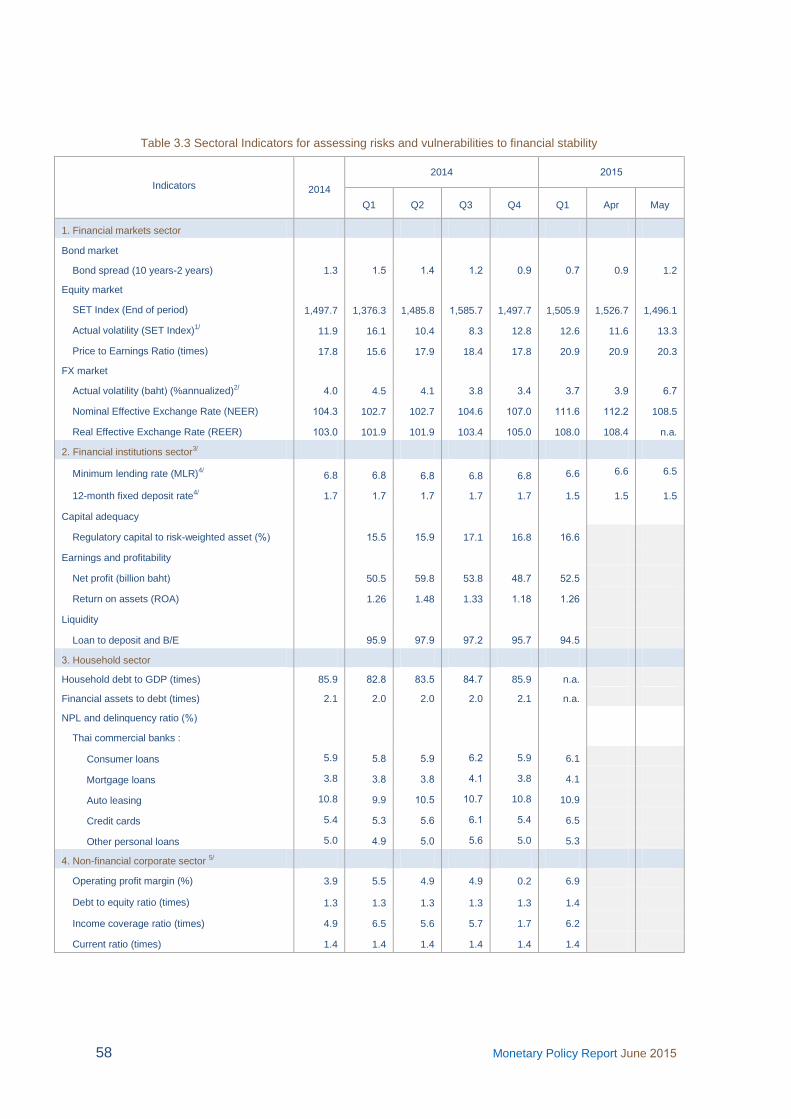
58 Monetary Policy Report June 2015
Table 3.3 Sectoral Indicators for assessing risks and vulnerabilities to financial stability
Indicators 2014
2014 2015
Q1 Q2 Q3 Q4 Q1 Apr May
1. Financial markets sector
Bond market
Bond spread (10 years-2 years) 1.3 1.5 1.4 1.2 0.9 0.7 0.9 1.2
Equity market
SET Index (End of period) 1,497.7 1,376.3 1,485.8 1,585.7 1,497.7 1,505.9 1,526.7 1,496.1
Actual volatility (SET Index)1/ 11.9 16.1 10.4 8.3 12.8 12.6 11.6 13.3
Price to Earnings Ratio (times) 17.8 15.6 17.9 18.4 17.8 20.9 20.9 20.3
FX market
Actual volatility (baht) (%annualized)2/ 4.0 4.5 4.1 3.8 3.4 3.7 3.9 6.7
Nominal Effective Exchange Rate (NEER) 104.3 102.7 102.7 104.6 107.0 111.6 112.2 108.5
Real Effective Exchange Rate (REER) 103.0 101.9 101.9 103.4 105.0 108.0 108.4 n.a.
2. Financial institutions sector3/
Minimum lending rate (MLR)4/ 6.8 6.8 6.8 6.8 6.8 6.6 6.6 6.5
12-month fixed deposit rate4/ 1.7 1.7 1.7 1.7 1.7 1.5 1.5 1.5
Capital adequacy
Regulatory capital to risk-weighted asset (%) 15.5 15.9 17.1 16.8 16.6
Earnings and profitability
Net profit (billion baht) 50.5 59.8 53.8 48.7 52.5
Return on assets (ROA) 1.26 1.48 1.33 1.18 1.26
Liquidity
Loan to deposit and B/E 95.9 97.9 97.2 95.7 94.5
3. Household sector
Household debt to GDP (times) 85.9 82.8 83.5 84.7 85.9 n.a.
Financial assets to debt (times) 2.1 2.0 2.0 2.0 2.1 n.a.
NPL and delinquency ratio (%)
Thai commercial banks :
Consumer loans 5.9 5.8 5.9 6.2 5.9 6.1
Mortgage loans 3.8 3.8 3.8 4.1 3.8 4.1
Auto leasing 10.8 9.9 10.5 10.7 10.8 10.9
Credit cards 5.4 5.3 5.6 6.1 5.4 6.5
Other personal loans 5.0 4.9 5.0 5.6 5.0 5.3
4. Non-financial corporate sector 5/
Operating profit margin (%) 3.9 5.5 4.9 4.9 0.2 6.9
Debt to equity ratio (times) 1.3 1.3 1.3 1.3 1.3 1.4
Income coverage ratio (times) 4.9 6.5 5.6 5.7 1.7 6.2
Current ratio (times) 1.4 1.4 1.4 1.4 1.4 1.4
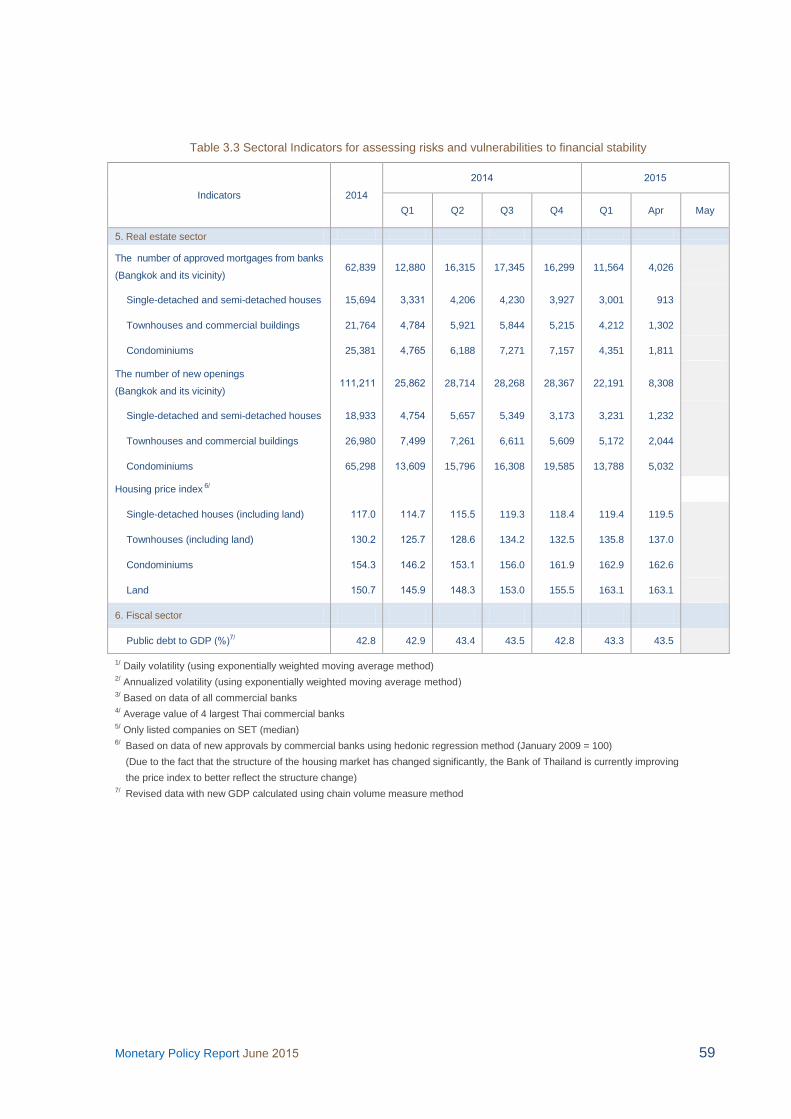
Monetary Policy Report June 2015 59
Table 3.3 Sectoral Indicators for assessing risks and vulnerabilities to financial stability
Indicators 2014
2014 2015
Q1 Q2 Q3 Q4 Q1 Apr May
5. Real estate sector
The number of approved mortgages from banks
(Bangkok and its vicinity) 62,839 12,880 16,315 17,345 16,299 11,564 4,026
Single-detached and semi-detached houses 15,694 3,331 4,206 4,230 3,927 3,001 913
Townhouses and commercial buildings 21,764 4,784 5,921 5,844 5,215 4,212 1,302
Condominiums 25,381 4,765 6,188 7,271 7,157 4,351 1,811
The number of new openings
(Bangkok and its vicinity) 111,211 25,862 28,714 28,268 28,367 22,191 8,308
Single-detached and semi-detached houses 18,933 4,754 5,657 5,349 3,173 3,231 1,232
Townhouses and commercial buildings 26,980 7,499 7,261 6,611 5,609 5,172 2,044
Condominiums 65,298 13,609 15,796 16,308 19,585 13,788 5,032
Housing price index 6/
Single-detached houses (including land) 117.0 114.7 115.5 119.3 118.4 119.4 119.5
Townhouses (including land) 130.2 125.7 128.6 134.2 132.5 135.8 137.0
Condominiums 154.3 146.2 153.1 156.0 161.9 162.9 162.6
Land 150.7 145.9 148.3 153.0 155.5 163.1 163.1
6. Fiscal sector
Public debt to GDP (%)7/ 42.8 42.9 43.4 43.5 42.8 43.3 43.5
1/ Daily volatility (using exponentially weighted moving average method) 2/ Annualized volatility (using exponentially weighted moving average method) 3/ Based on data of all commercial banks 4/ Average value of 4 largest Thai commercial banks 5/ Only listed companies on SET (median) 6/ Based on data of new approvals by commercial banks using hedonic regression method (January 2009 = 100)
(Due to the fact that the structure of the housing market has changed significantly, the Bank of Thailand is currently improving
the price index to better reflect the structure change)
7/ Revised data with new GDP calculated using chain volume measure method