Monetary Policy Report - Bank of Canada
36
Monetary Policy Report April 2021
Transcript of Monetary Policy Report - Bank of Canada

Monetary PolicyReportApril 2021

Canada’s infl ation‑control strategyCanada’s infl ation‑control strategy1
Infl ation targeting and the economy The Bank’s mandate is to conduct monetary policy to promote the
economic and fi nancial well-being of Canadians.
Canada’s experience with infl ation targeting since 1991 has shown that the best way to foster confi dence in the value of money and to contribute to sustained economic growth, employment gains and improved living standards is by keeping infl ation low, stable and predictable.
In 2016, the Government and the Bank of Canada renewed Canada’s infl ation-control target for a further fi ve-year period, ending December 31, 2021. The target, as measured by the rate of infl ation of the consumer price index (CPI), remains at the 2 percent midpoint of the control range of 1 to 3 percent.
Monetary policy tools Monetary policy actions take time—usually from six to eight
quarters—to work their way through the economy and have their full effect on infl ation. For this reason, monetary policy must be forward-looking.
The Bank normally carries out monetary policy through changes in the target for the overnight rate of interest (the policy rate).2 The Bank also has a range of other monetary policy tools it can use when the policy rate is at very low levels. These tools consist of guidance on the future evolution of the policy rate, large-scale asset purchases (quantitative easing and credit easing), funding for credit measures, and negative policy rates. The potential use and sequencing of these additional tools would depend on the economic and fi nancial market context.
All of the Bank’s monetary policy tools affect total demand for Canadian goods and services through their infl uence on market interest rates, domestic asset prices and the exchange rate. The balance between this demand and the economy’s production capacity is, over time, the main factor that determines infl ation pressures in the economy.
Consistent with its commitment to clear, transparent communications, the Bank regularly reports its perspectives on the economy and infl ation. Policy decisions are typically announced on eight pre-set days during the year, and full updates of the Bank’s outlook are published four times each year in the Monetary Policy Report.
Infl ation targeting is symmetric and fl exible Canada’s infl ation-targeting approach is symmetric, which means
that the Bank is equally concerned about infl ation rising above or falling below the 2 percent target.
Canada’s infl ation-targeting framework is fl exible. Typically, the Bank seeks to return infl ation to target over a horizon of six to eight quarters. However, the most appropriate horizon for returning infl ation to target will vary depending on the nature and persistence of the shocks buffeting the economy.
Monitoring infl ation In the short run, the prices of certain CPI components can be
particularly volatile. These components, as well as changes in indirect taxes such as the goods and services tax/harmonized sales tax, can cause sizable fl uctuations in CPI infl ation.
In setting monetary policy, the Bank seeks to look through such transitory movements in CPI infl ation and focuses on a set of “core” infl ation measures that better refl ect the underlying trend of infl ation. In this sense, these measures act as an operational guide to help the Bank achieve the CPI infl ation target. They are not a replacement for CPI infl ation.
The Bank’s three preferred measures of core infl ation are CPI-trim, which excludes CPI components whose rates of change in a given month are the most extreme; CPI-median, which corresponds to the price change located at the 50th percentile (in terms of basket weight) of the distribution of price changes; and CPI-common, which uses a statistical procedure to track common price changes across categories in the CPI basket.
1 See Joint Statement of the Government of Canada and the Bank of Canada on the Renewal of the Infl ation-Control Target (October 24, 2016) and Renewal of the Infl ation-Control Target: Background Information—October 2016, which are both available on the Bank’s website.
2 The Framework for Conducting Monetary Policy at Low Interest Rates, available on the Bank’s website, describes these measures and the principles guiding their use.
The Monetary Policy Report is available on the Bank of Canada’s website at bankofcanada.ca.
For further information, contact:
Public InformationCommunications DepartmentBank of Canada234 Wellington StreetOttawa, Ontario K1A 0G9
Telephone: 613-782-8111;1-800-303-1282 (toll-free in North America)Email: [email protected] Website: bankofcanada.ca
ISSN 1201-8783 (Print)ISSN 1490-1234 (Online)© Bank of Canada 2021
Monetary Policy ReportMonetary Policy ReportApril 2021
This is a report of the Governing Council of the Bank of Canada:
Tiff Macklem, Timothy Lane, Lawrence Schembri, Paul Beaudry and Toni Gravelle.

ContentsContentsOverview . . . . . . . . . . . . . . . . . . . . . . . . . . . . . . . . . . . . . . . . . . . . . . . . . . . . . . . . . . . . . . . . . . . . . . . . . . 1
Key messages . . . . . . . . . . . . . . . . . . . . . . . . . . . . . . . . . . . . . . . . . . . . . . . . . . . . . . . . . . . . . . . . . 2
Box 1: Key inputs to the projection . . . . . . . . . . . . . . . . . . . . . . . . . . . . . . . . . . . . . . . . . . 3
Global economy . . . . . . . . . . . . . . . . . . . . . . . . . . . . . . . . . . . . . . . . . . . . . . . . . . . . . . . . . . . . . . . . . 4
Box 2: Changes to the global projection since the January Report . . . . . . . 4
Oil prices considerably higher . . . . . . . . . . . . . . . . . . . . . . . . . . . . . . . . . . . . . . . . . . . . . . . . 5
Bond yields higher with improved global outlook . . . . . . . . . . . . . . . . . . . . . . . . . . 6
Substantial fiscal stimulus boosting growth in the United States . . . . . . . . . 7
Additional lockdowns to constrain euro area recovery . . . . . . . . . . . . . . . . . . . . 8
Growth to moderate in China and emerging markets . . . . . . . . . . . . . . . . . . . . . 8
Canadian economy . . . . . . . . . . . . . . . . . . . . . . . . . . . . . . . . . . . . . . . . . . . . . . . . . . . . . . . . . . . . 10
Box 3: Changes to the Canadian projection since the January Report . . 11
Economic activity more resilient to rising cases . . . . . . . . . . . . . . . . . . . . . . . . . . . 12
Box 4: Drivers of the strength in Canadian housing . . . . . . . . . . . . . . . . . . . . . . . 14
Significant economic slack in some sectors . . . . . . . . . . . . . . . . . . . . . . . . . . . . . . . 15
CPI inflation boosted by temporary factors . . . . . . . . . . . . . . . . . . . . . . . . . . . . . . . 17
Productivity gains positive for potential output . . . . . . . . . . . . . . . . . . . . . . . . . . . 17
Box 5: Diverging measures of core inflation under COVID‑19 . . . . . . . . . . . . 18
Strong rebound in 2021 followed by moderate growth . . . . . . . . . . . . . . . . . . 19
Household spending to underpin the recovery . . . . . . . . . . . . . . . . . . . . . . . . . . . . 20
Foreign demand to drive a solid recovery in exports . . . . . . . . . . . . . . . . . . . . . 21
Business investment to strengthen . . . . . . . . . . . . . . . . . . . . . . . . . . . . . . . . . . . . . . . . 22
Economic slack to weigh on inflation over 2021 and 2022 . . . . . . . . . . . . . . . 23
Evolution of the Bank’s balance sheet . . . . . . . . . . . . . . . . . . . . . . . . . . . . . . . . . . . 25
Risks to the inflation outlook . . . . . . . . . . . . . . . . . . . . . . . . . . . . . . . . . . . . . . . . . . . . . . . 28
Appendix 1: Potential output . . . . . . . . . . . . . . . . . . . . . . . . . . . . . . . . . . . . . . . . . . . . . . . 30
Global potential output growth to pick up . . . . . . . . . . . . . . . . . . . . . . . . . . . . . . . . . 30
Stronger trend labour productivity growth in Canada . . . . . . . . . . . . . . . . . . . . 31

OverviewOverviewConfidence in the economic recovery in Canada and other major economies has improved. However, COVID-19 variants are leading to renewed lockdowns in many countries, dampening near-term activity.
Economic activity in recent months has been more resilient than anticipated, with consumers and businesses learning new ways to adapt to public health measures. The rollout of COVID-19 vaccines is also progressing faster in some jurisdictions than previously expected (Chart 1, Box 1). Governments, most importantly in the United States, have announced new fiscal stimulus. Overall, the outlook has been revised up for the Canadian and global economies.
Achieving full recovery will take time, and the impacts of the pandemic remain uneven. As well, uncertainty remains elevated, particularly around the implications of variants of the virus. In this context, fiscal and monetary policy are providing important support to economic activity in Canada and globally.
Chart 1: New cases are increasing, but so are vaccinations
a. Daily new cases per million people, 7-day moving average
Canada United States Euro area
Japan United Kingdom Mexico
India Russia China
South Africa Brazil
b. Percentage of population that has received at least one dose of a COVID-19 vaccine*
Before January Report After January Report
* Vaccination data shown for China consist of vaccine doses administered as a percentage of the population.
Sources: World Health Organization, national sources via Our World in Data and Bank of Canada calculations Last observations: panel a, April 16, 2021; panel b, April 13–16, 2021
0
200
400
600
800
2020 2021
1,000
Jan Apr Jul Oct Jan Apr
Number of cases
0 10 20 30 40 50 %
South Africa
Japan
Russia
India
Mexico
Brazil
China
France
Germany
Canada
United States
United KingdomJanuary Report
OVERVIEw 1 BANK OF CANADA • MONEtARy POlICy REPORt • APRIl 2021

Key messages � The Canadian economy showed impressive resilience during the second
wave of the pandemic, and estimates of growth in the first quarter have been revised up significantly.
� Nevertheless, many Canadians remain out of work, particularly low-wage workers, young people and women. Although recent job numbers have been encouraging, it may take considerable time for overall employment to recover.
� The current resurgence of the virus presents a new setback. Health care systems are under strain, and workers in hard-to-distance sectors will bear the brunt of the new restrictions. The economic impact of the third wave is expected to be material but temporary. Without the adaptation seen in the second wave and the increasing number of people vaccinated, the effects of the third wave would be more severe and long lasting.
� With the greater resilience of the Canadian and global economies, progress on vaccinations, continued fiscal and monetary policy support, and higher commodity prices, the overall Canadian outlook has been revised up from the January Report.
� In light of the stronger outlook and increased digitalization, the Bank now estimates that the pandemic will be less detrimental to the economy’s potential output than previously assessed.
� In the near term, inflation is expected to rise temporarily to around the top of the 1 to 3 percent inflation-control target range, largely reflecting base-year effects and gasoline price dynamics. The Bank tends to look through such temporary movements.
� In view of the more favourable economic outlook, the Bank now expects slack will be absorbed and inflation will sustainably return to target some time in the second half of 2022. This timing is more uncertain than usual, however, given the uncertainty around potential output and the highly uneven impacts of the pandemic.
OVERVIEw 2 BANK OF CANADA • MONEtARy POlICy REPORt • APRIl 2021
Box 1
Key inputs to the projectionThe Bank of Canada’s projection is always conditional on several key assumptions, and changes to them will affect the outlook for the Canadian economy. The Bank regularly reviews these assumptions and assesses the sensitivity of the economic projection to them. The key inputs into the Bank’s projection are as follows:
� The global vaccination rollout is progressing. Broad immunity is assumed to be achieved by mid-2021 in the United States; later in 2021 in Canada, other advanced economies and China; and in 2022 in other emerging-market economies.
� The more stringent restrictions imposed in Canada in response to the spike in COVID-19 cases near the end of the fi rst quarter and at the start of the second quarter are assumed to begin easing by the end of May. Consumer caution is expected to diminish gradually through the latter part of the year. Nonetheless, some caution continues over the rest of the projection horizon.
� The projection incorporates $85 billion in federal fi scal stimulus, the midpoint of the $70 billion to $100 billion range announced in the Fall Economic Statement 2020. In January, fi scal stimulus was assumed to be $70 billion, the lower end of the announced range.
� Oil prices are assumed to remain near recent levels. The per-barrel prices in US dollars are assumed to be $65 for Brent, $60 for West Texas Intermediate and $50 for Western Canadian Select, about $15, $10 and $15 higher, respectively, than assumed in the January Report.
� By convention, the Bank does not forecast the exchange rate in the Monetary Policy Report. The Canadian dollar is assumed to remain at 80 cents US over the projection horizon, close to its recent average and higher than the 78 cents US assumed in the January Report.
� The pandemic and related containment measures have both lasting and temporary negative effects on the Canadian economy.1
The Bank’s assessment of potential output growth, a longer-term concept, looks through the short-lived impacts of containment
1 As in the previous three reports, the Bank makes the distinction between supply and potential output in the near term to account for the relatively short-lived nature of some of the decrease in supply.
measures. Over 2021–23, potential output growth is estimated to average about 1.6 percent per year, about 0.5 percentage points higher than estimated in October 2020 (Appendix 1). This change refl ects stronger expected investment—including in automation and digitalization—and reduced scarring effects from the pandemic.
Containment measures implemented by governments have been having signifi cant short-term effects on the supply of goods and services. In particular, supply fell sharply in early 2020 when some businesses were forced to temporarily suspend or reduce operations. The estimated size of the effects of containment measures on supply has been revised down in the second half of 2020 and into 2021. These effects are expected to dissipate by the end of the year.
Estimates of supply can be obtained by combining the estimates of the temporary effects of the containment measures with the assessment of potential output. The Bank estimates that growth in real gross domestic product (GDP) exceeded that of revised supply in the fi rst quarter. As a result, the output gap—the difference between GDP and supply—was about -3.0 to -2.0 percent in the fi rst quarter of 2021, somewhat narrower than the revised range of -4.25 to -3.25 percent in the fourth quarter.
� The neutral nominal interest rate is defi ned as the real rate consistent with output remaining sustainably at its potential and with infl ation at target, on an ongoing basis, plus 2 percent for infl ation. It is a medium- to long-term equilibrium concept. For this Report, the Bank reassessed its estimate of the neutral interest rate, but the estimated range remains at 1.75 to 2.75 percent.2 The economic projection is based on an assumption that the neutral rate is at the midpoint of this range.
2 For more details, see T. Carter, X. S. Chen, A. Jaffery, C. Hajzler, J. Lachaine, P. Shannon, S. Sarker, G. Westwood and B. Yan, “Assessing Global Potential Output Growth and the US Neutral Rate: April 2021,” Bank of Canada Staff Analytical Note No. 2021-5 (April 2021); and D. Brouillette, G. Faucher, M. Kuncl, A. McWhirter and Y. Park, “Potential Output and the Neutral Rate in Canada: 2021 Update,” Bank of Canada Staff Analytical Note No. 2021-6 (April 2021).
OVERVIEw 3 BANK OF CANADA • MONEtARy POlICy REPORt • APRIl 2021
Global economyGlobal economyThe global economy has been more resilient to the pandemic than previously assessed, and the global outlook is revised up from the January Report (Box 2). Global economic activity is set to ramp up in mid-2021, as policy support and the expansion of vaccination programs enable stronger growth, notably in service sectors. Currently, however, the spread of new COVID-19 variants and the renewal of lockdowns, together with challenges to supply chains, are weighing on activity in many economies.
The pace of the economic recovery varies considerably across countries. In the United States, exceptionally large, front-loaded fiscal stimulus and rapid vaccination rollouts are expected to lift growth to 7 percent in 2021. In most other regions, recovery is slower than in the United States. Overall, the Bank projects global growth in gross domestic product (GDP) to surge to 6.8 percent in 2021, after contracting by 2.4 percent in 2020 (Table 1). The projected rate of global growth then moderates to about 4 percent in 2022, as the rebound in activity eases and the effects of fiscal stimulus fade.
The global recovery has sparked an increase in commodity prices. Recent increases in energy prices are raising inflation in several countries. Base-year effects are also expected to boost inflation in the coming months. These effects are caused by sharp declines in some prices a year ago. US inflation is anticipated to average more than 2 percent over the projection horizon as a result of these transitory factors as well as inflationary pressures arising from the rapid US recovery.
Box 2
Changes to the global projection since the January Report The global outlook is considerably stronger than it was in the January Report. The level of global gross domestic product (GDP) is revised up by 1.6 percent in 2021 and remains 0.5 percent higher in 2023. Key factors behind the revisions include the following:
� Stronger-than-expected data in the fourth quarter of 2020 and the fi rst quarter of 2021 have raised the forecast for GDP in almost all regions. This is seen especially in the emerging-market-economy and rest-of-the-world groupings. Overall, global GDP in the fi rst quarter of 2021 is 1.3 percent higher than in the January Report.
� More fi scal stimulus has boosted US and global output. In the United States, the fi scal stimulus of
US$900 billion announced in December 2020 was deployed more quickly than expected. As well, by the end of 2021, the American Rescue Plan (ARP) is expected to raise US GDP by 2.4 percent and global GDP by about 0.5 percent.
US personal consumption expenditure infl ation was higher than expected in recent months. As a result, it is now estimated to be 1.7 percent in the fi rst quarter—0.5 percentage points higher than forecast in the January Report. In addition, stronger growth associated with the ARP is expected to raise US infl ation by as much as 0.3 percentage points. This will bring it to 2.4 percent by the end of 2023.
GlOBAl ECONOMy 4 BANK OF CANADA • MONEtARy POlICy REPORt • APRIl 2021

Oil prices considerably higherStronger global demand prospects, together with supply restraints, have driven oil prices considerably higher since the January Report. The prices of Brent, West Texas Intermediate and Western Canadian Select oil are US$10 to US$15 higher than assumed in January (Box 1).
The Organization of the Petroleum Exporting Countries plus several other major oil-exporting countries (OPEC+) extended most of their previous production cuts through April and agreed to gradually increase output starting in May. Supply increases by US producers have been limited, despite the rise in oil prices in recent months. Levels of spare capacity remain very high (Chart 2).
In the near term, risks to the assumption of flat oil prices are mostly to the upside since the demand for oil could rise faster than the supply as global growth picks up. Over the projection horizon, however, this risk is roughly balanced by the risk that a rapid return of previously idled capacity to production could reduce oil prices.
The Bank’s non-energy commodity price index has risen 11 percent since the January Report. Strong housing demand in North America has pushed already-elevated lumber prices up about 35 percent—to record highs. Base metals have seen a 7 percent increase, partly reflecting prospects for higher global growth.
Table 1: Projection for global economic growthShare of real global GDP*
(percent)
Projected growth† (percent)
2020 2021 2022 2023
United States 16 -3.5 (-3.5) 7.0 (5.0) 4.1 (3.9) 1.3 (2.0)
Euro area 12 -6.8 (-7.1) 4.5 (4.4) 4.5 (4.5) 2.3 (2.7)
Japan 4 -4.9 (-5.2) 3.0 (2.8) 1.3 (1.9) 0.8 (1.0)
China 17 2.3 (1.7) 9.5 (8.4) 5.3 (5.4) 5.3 (5.9)
Oil-importing EMEs‡ 34 -2.6 (-3.4) 7.5 (6.5) 4.3 (5.3) 4.0 (4.9)
Rest of the world§ 17 -3.8 (-4.3) 3.7 (2.0) 3.1 (4.0) 3.0 (3.2)
World 100 -2.4 (-2.9) 6.8 (5.6) 4.1 (4.6) 3.3 (3.9)
* GDP shares are based on International Monetary Fund (IMF) estimates of the purchasing-power-parity valuation of country GDPs for 2019 from the IMF’s October 2020 World Economic Outlook.
† Numbers in parentheses are projections used in the previous Report.
‡ The oil-importing emerging-market-economy (EME) grouping excludes China. It is composed of large EMEs from Asia, Latin America, the Middle East, emerging Europe and Africa (such as India, Brazil and South Africa), as well as newly industrialized economies (such as South Korea).
§ “Rest of the world” is a grouping of all other economies not included in the fi rst fi ve regions. It is composed of oil-exporting EMEs (such as Russia, Nigeria and Saudi Arabia) and other advanced economies (such as Canada, the United Kingdom and Australia).
Source: Bank of Canada
GlOBAl ECONOMy 5 BANK OF CANADA • MONEtARy POlICy REPORt • APRIl 2021

Bond yields higher with improved global outlookNominal yields on benchmark US 10-year bonds have risen about 50 basis points since the January Report. Market-based measures of US inflation expectations have been rising for several months. Since January, US real yields have moved up in response to improved growth prospects, and they account for over one-half of the total increase in the US 10-year yield. However, real 10-year yields still remain negative and close to historical lows. Sovereign bond yields for other economies, including Canada, have also increased since the January Report, as financial markets responded to improved growth prospects (Chart 3).
Risk appetite has remained relatively robust, contributing to accommodative financial conditions. Equity price indexes in most advanced economies have increased since January and remain near recent highs. Corporate credit spreads have narrowed considerably since the onset of the pandemic and, as in January, are close to their pre-pandemic levels. Some emerging-market economies (EMEs), however, have faced tighter financial conditions in recent months.
The US dollar has strengthened against the currencies of most US trading partners since the January Report, and the Canadian dollar has appreciated by about 1 percent against the US dollar. Higher oil and other commodity prices have contributed to the recent rise in the Canadian dollar.
Chart 2: Oil prices have risen strongly, but spare capacity is high
a. Oil prices, daily data
Western Canadian Select West Texas Intermediate Brent
b. OPEC spare capacity and US oil rigs, quarterly and weekly data
OPEC spare capacity (left scale)
Active oil rigs in the United States (right scale)
Note: Oil price data for April 20, 2020, are excluded because disruptions in the oil futures market led to negative values of around -US$48 for West Texas Intermediate and -US$38 for Western Canadian Select on that day. Price data for all other days in the date range are included in the chart. OPEC is the Organization of the Petroleum Exporting Countries.
Sources: Baker Hughes, US Energy Information Administration Last observations: oil prices, April 16, 2021;and Bloomberg Finance LP OPEC spare capacity, 2021Q1; US oil rigs, April 16, 2021
0
20
40
60
80
2019 2020 2021
US$ per barrel
0
2
4
6
8
10
2001 2006 2011 2016 20210
400
800
1,200
1,600
2,000
RigsMillion barrels per day
January Report
GlOBAl ECONOMy 6 BANK OF CANADA • MONEtARy POlICy REPORt • APRIl 2021

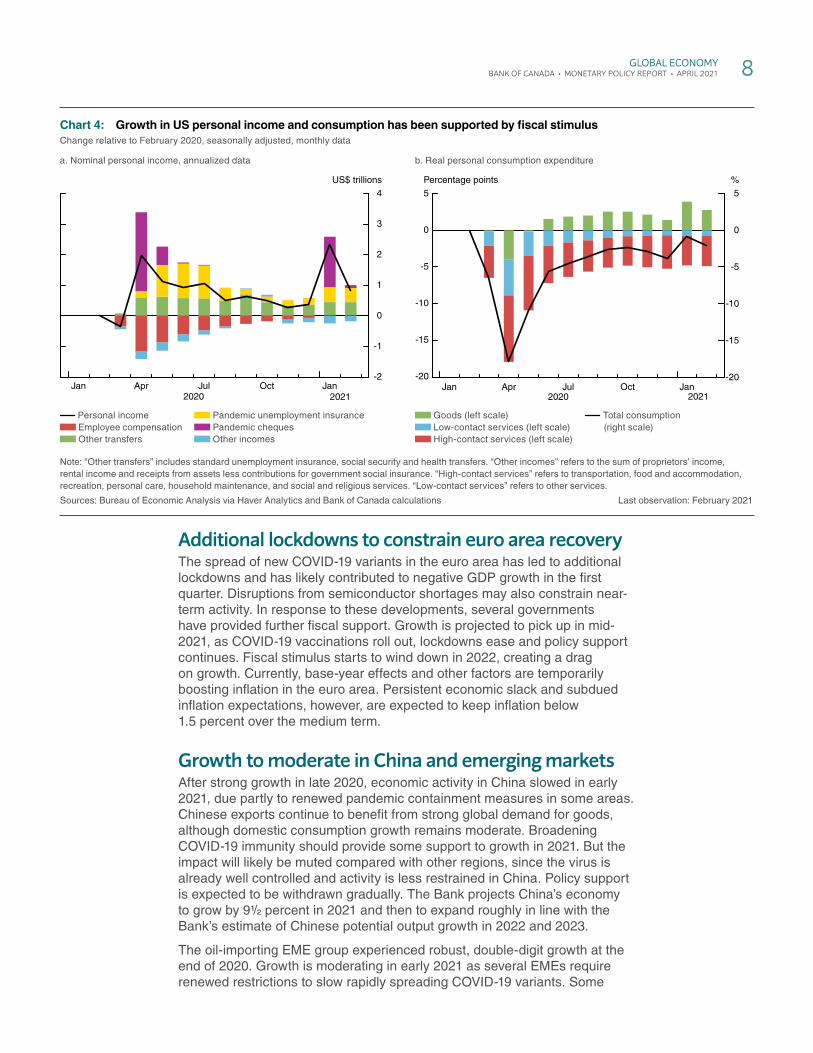
Substantial fiscal stimulus boosting growth in the United StatesThe US$900 billion fiscal package announced by the United States in December last year boosted incomes and consumption in early 2021 (Chart 4). The US$1.9 trillion American Rescue Plan (ARP) approved in March provides substantial additional fiscal support, primarily through government spending and transfers to households. Now that most cheques have already been sent out, the Bank expects US growth could reach about 10 percent annualized in the second quarter.
Progress on COVID-19 vaccinations is leading to the easing of containment measures, boosting confidence and supporting growth (Chart 1). The rapid vaccination rollout is also expected to help limit the scarring effects on the level of potential GDP (Appendix 1).
Overall, the Bank projects US GDP to grow by 7 percent in 2021. Consumption—including demand for high-contact services—is driving most of the growth as the economy reopens and fiscal transfers continue to provide income support. Robust demand, ARP stimulus and low interest rates are also expected to boost growth in business and housing investment. These components are important sources of demand for Canadian exports. In 2022, US GDP growth moderates to about 4 percent as the effects of fiscal policy fade. Since fiscal policy is front loaded, its contribution to GDP growth is negative in 2023, and growth slows to 1.3 percent.
US personal consumption expenditure inflation is expected to rise to close to 3 percent in the near term, reflecting increases in energy prices, health care fees, shelter costs and base-year effects. Rapid output growth is expected to absorb slack and create excess demand. This will keep inflation somewhat above 2 percent through 2023, consistent with the US Federal Reserve’s average inflation targeting strategy.
Chart 3: Bond yields have risen in most regions, and the Canadian dollar has strengthenedDaily data
a. Bond yields
Canada 10-year sovereign yield (left scale) United States 10-year sovereign yield (left scale) Germany 10-year sovereign yield (left scale)
United States A–BBB corporate yield (right scale)
b. Canadian dollar
CEER (left scale) CEER, excluding United States (left scale)
Canada–United States exchange rate (right scale)
Note: CEER is the Canadian Effective Exchange Rate index.
Sources: US Department of the Treasury, Deutsche Bundesbank, BofA Securities and Bank of Canada via Haver Analytics Last observation: April 16, 2021
-300
0
300
600
-100
0
100
200
2020 2021Jan Apr Jul Oct Jan Apr
Basis pointsBasis points
2020 2021
110
115
120
125
130
0.68
0.72
0.76
0.80
0.84
Jan Apr Jul Oct Jan Apr
Index US$
January Report January Report
GlOBAl ECONOMy 7 BANK OF CANADA • MONEtARy POlICy REPORt • APRIl 2021
Additional lockdowns to constrain euro area recoveryThe spread of new COVID-19 variants in the euro area has led to additional lockdowns and has likely contributed to negative GDP growth in the first quarter. Disruptions from semiconductor shortages may also constrain near-term activity. In response to these developments, several governments have provided further fiscal support. Growth is projected to pick up in mid-2021, as COVID-19 vaccinations roll out, lockdowns ease and policy support continues. Fiscal stimulus starts to wind down in 2022, creating a drag on growth. Currently, base-year effects and other factors are temporarily boosting inflation in the euro area. Persistent economic slack and subdued inflation expectations, however, are expected to keep inflation below 1.5 percent over the medium term.
Growth to moderate in China and emerging marketsAfter strong growth in late 2020, economic activity in China slowed in early 2021, due partly to renewed pandemic containment measures in some areas. Chinese exports continue to benefit from strong global demand for goods, although domestic consumption growth remains moderate. Broadening COVID-19 immunity should provide some support to growth in 2021. But the impact will likely be muted compared with other regions, since the virus is already well controlled and activity is less restrained in China. Policy support is expected to be withdrawn gradually. The Bank projects China’s economy to grow by 911/22 percent in 2021 and then to expand roughly in line with the Bank’s estimate of Chinese potential output growth in 2022 and 2023.
The oil-importing EME group experienced robust, double-digit growth at the end of 2020. Growth is moderating in early 2021 as several EMEs require renewed restrictions to slow rapidly spreading COVID-19 variants. Some
Chart 4: Growth in US personal income and consumption has been supported by fi scal stimulusChange relative to February 2020, seasonally adjusted, monthly data
a. Nominal personal income, annualized data
Personal income Employee compensation Other transfers
Pandemic unemployment insurance Pandemic cheques Other incomes
b. Real personal consumption expenditure
Goods (left scale) Low-contact services (left scale) High-contact services (left scale)
Total consumption(right scale)
Note: “Other transfers” includes standard unemployment insurance, social security and health transfers. “Other incomes” refers to the sum of proprietors’ income, rental income and receipts from assets less contributions for government social insurance. “High-contact services” refers to transportation, food and accommodation, recreation, personal care, household maintenance, and social and religious services. “Low-contact services” refers to other services.
Sources: Bureau of Economic Analysis via Haver Analytics and Bank of Canada calculations Last observation: February 2021
-2
-1
0
1
2
3
4
2020 2021
US$ trillions
Jan Apr Jul Oct Jan-20
-15
-10
-5
0
5
-20
-15
-10
-5
0
5%
2020 2021
Percentage points
Jan Apr Jul Oct Jan
GlOBAl ECONOMy 8 BANK OF CANADA • MONEtARy POlICy REPORt • APRIl 2021

EMEs have recently tightened monetary policy because their depreciating currencies were contributing to rising inflation. Growth for the EME group is projected to slow in 2022 and 2023 when initial rebound effects will have faded. Slow vaccination rollouts are expected to restrain the recovery through 2023.
In the rest-of-the-world group, activity has been quite resilient despite some recent pandemic-related lockdowns. GDP growth is forecast to pick up in mid-2021 as economies reopen and recent increases in oil prices provide a tailwind to growth for oil exporters. Growth is anticipated to slow in 2022 and 2023 as activity normalizes and policy support recedes.
GlOBAl ECONOMy 9 BANK OF CANADA • MONEtARy POlICy REPORt • APRIl 2021

Canadian economyCanadian economyThe Canadian economy continues to recover from the pandemic’s devastating effects. Economic activity proved much more resilient during the second wave, reflecting the ability of consumers to adapt and ingenuity on the part of businesses to function under restrictions. As a result, growth is estimated to be significantly higher in the first quarter of 2021 than anticipated in the January Report.
Even as new containment restrictions will restrain growth in the near term, the rollout of vaccines, fiscal and monetary policy support, strong foreign demand and higher commodity prices should contribute to robust growth in 2021 (Chart 5). Nevertheless, considerable uncertainty remains concerning the evolution of the pandemic, particularly given the rapid spread of more contagious variants of the virus.
Achieving full recovery will take time. Strong and sustained growth is needed to overcome the pandemic’s severe economic impacts. A significant amount of economic slack remains in high-contact service sectors, where workers and businesses have suffered the most. Moreover, the situations in these sectors will worsen before they get better because many provinces are seeing rising infection rates and are tightening public health restrictions.
Chart 5: New cases are increasing, but so are vaccinations
a. New COVID-19 cases, 7-day moving average, daily data
Cases
b. Cumulative percentage of key populations who have received at least one dose of a COVID-19 vaccine in Canada, weekly data
Health care workers Group living settings for seniors
Adults, age 80 and older Total population
Sources: Public Health Agency of Canada and Bank of Canada calculations Last observations: cases, April 19, 2021; vaccines, April 10, 2021
2020 2021
0
2,000
4,000
6,000
8,000
10,000
Jan Apr Jul Oct Jan Apr
Number of cases
0
20
40
60
80
100
%
2020 2021Dec Jan Feb Mar Apr
January Report
CANADIAN ECONOMy 10 BANK OF CANADA • MONEtARy POlICy REPORt • APRIl 2021

Over the medium term, consumption should recover strongly when restrictions ease and jobs are recouped. Progress toward broad immunity, domestically and globally, will also help reduce uncertainty and improve household and business confidence. This in turn will support business investment and exports. As a result, the recovery is expected to become more broad-based.
Overall, the outlook is stronger than in the January Report (Box 3). Economic activity is now forecast to grow at a robust pace of around 6½ percent in 2021. GDP growth is projected to then moderate to around 3¾ percent in 2022 and around 3¼ percent in 2023 (Table 2).
Considerable uncertainty surrounds the medium-term outlook for GDP and potential output. Many issues remain unclear, including the persistence of changes in consumer preferences, the extent of labour market scarring, the implications of weak investment early in the pandemic and the productivity benefits of faster deployment of new digital technologies. Because these factors tend to affect both demand and supply, estimates of when the output gap will close are particularly uncertain.
Box 3
Changes to the Canadian projection since the January ReportThe profi le for gross domestic product (GDP) is higher than projected in the January Report (Chart 3-A). GDP growth is revised up by 2½ percentage points in 2021, to about 6½ percent (Table 2). As a result, the level of real GDP is about 2½ percent higher in 2021, 1½ percent higher in 2022 and 2 percent higher in 2023. Domestic and foreign data have been stronger than anticipated—notably for Canadian housing and employment.
� GDP growth has been revised up by about 9½ percentage points in the fi rst quarter of 2021 and is now expected to be around 7 percent (Table 3). Growth in the second quarter is forecast to be about 3½ percent, leaving the level of GDP at the end of the quarter about 2½ percent higher than previously estimated.
� Improved terms of trade, higher potential output and additional fi scal stimulus, combined with an earlier recovery of consumer confi dence, will contribute to stronger projected domestic demand.
� Stronger foreign demand, higher commodity prices and improved business confi dence lead to higher expected levels of exports and investment than in the January Report.
Compared with the January Report, consumer price index (CPI) infl ation is revised up by 0.7 percentage points in 2021 and by 0.2 percentage points in 2022
and 2023. CPI infl ation has been stronger than expected in recent months, partly refl ecting higher oil prices. This source of additional infl ationary strength continues throughout 2021. The upward revisions for 2022 and 2023 mostly refl ect the improved outlook.
The forecast for Canadian GDP has been revised upSeasonally adjusted at annual rates, chained 2012 dollars, quarterly data
GDP GDP projection from the January Report
Sources: Statistics Canada and Bank of Canada calculations and projections
Chart 3-A:
2018 2019 2020 2021 2022 2023
Can$ billions
1,800
1,900
2,000
2,100
2,200
2,300
CANADIAN ECONOMy 11 BANK OF CANADA • MONEtARy POlICy REPORt • APRIl 2021

Economic slack and gasoline price dynamics are the main factors influencing consumer price index (CPI) inflation. Over the course of 2021, upward pressure on inflation coming in large part from higher gasoline prices is expected to temporarily outweigh downward pressure from economic slack. Subsequently, inflation is anticipated to be around 2 percent.
Economic activity more resilient to rising casesEconomic activity is expected to grow by about 5¼ percent on average over the first half of 2021 (Table 3), following a stronger-than-anticipated growth rate of 9.6 percent in the fourth quarter of 2020. While overall growth is robust, activity in the hardest-hit sectors remains weak in the near term due to the latest wave of the virus and related containment measures (Chart 6).
Table 2: Contributions to average annual real GDP growthPercentage points*†
2020 2021 2022 2023
Consumption -3.5 (-3.7) 2.3 (1.7) 2.8 (3.1) 2.2 (1.9)
Housing 0.3 (0.3) 1.9 (0.7) -0.4 (0.0) -0.1 (0.0)
Government -0.1 (0.0) 1.5 (1.3) 0.9 (0.6) 0.7 (0.4)
Business fi xed investment -1.3 (-1.2) 0.5 (0.3) 0.7 (0.8) 0.7 (0.5)
Subtotal: fi nal domestic demand -4.5 (-4.6) 6.2 (4.0) 4.0 (4.5) 3.5 (2.8)
Exports -3.1 (-3.0) 1.7 (1.7) 2.0 (1.9) 1.3 (1.0)
Imports 3.8 (3.9) -2.3 (-2.8) -2.5 (-1.9) -1.6 (-1.3)
Subtotal: net exports 0.7 (0.9) -0.6 (-1.1) -0.5 (0.0) -0.3 (-0.3)
Inventories -1.6 (-1.8) 0.9 (1.1) 0.2 (0.3) 0.0 (0.0)
GDP -5.4 (-5.5) 6.5 (4.0) 3.7 (4.8) 3.2 (2.5)
Memo items (percentage change):
Range for potential output
0.8–2.0 (0.1–1.3)
0.8–2.2 (0.2–1.6)
0.4–2.2 (0.3–1.9)
1.0–3.0 (0.2–2.2)
Real gross domestic income (GDI) -6.4 (-6.5) 8.6 (5.2) 3.8 (4.9) 3.2 (2.3)
CPI infl ation 0.7 (0.7) 2.3 (1.6) 1.9 (1.7) 2.3 (2.1)
* Numbers in parentheses are from the projection in the previous Report.
† Numbers may not add to total because of rounding.
Table 3: Summary of the quarterly projection for Canada* 2020 2021 2019 2020 2021 2022 2023
Q3 Q4 Q1 Q2 Q4 Q4 Q4 Q4 Q4
CPI infl ation (year-over-year percentage change)
0.2(0.2)
0.7 (0.7)
1.5 (0.9)
2.9 2.1 (2.1)
0.7 (0.7)
2.2 (1.5)
2.0(1.9)
2.4(2.1)
Real GDP (year-over-year percentage change)
-5.3(-5.2)
-3.2(-4.1)
0.4 (-2.9)
14.3 1.7 (1.7)
-3.2(-4.1)
5.4 (4.6)
3.1 (2.9)
2.9(2.7)
Real GDP (quarter-over-quarter percentage change at annual rates)†
40.6(40.5)
9.6(4.8)
7.0 (-2.5)
3.5
* Details on the key inputs to the base-case projection are provided in Box 1. Numbers in parentheses are from the projection in the previous Report.
† Over the projection horizon, 2021Q1 and 2021Q2 are the only quarters for which some information about real GDP growth was available at the time the projection was conducted. For longer horizons, fourth-quarter-over-fourth-quarter percentage changes are presented. They show the Bank’s projected growth rates of CPI and real GDP within a given year. As such, they can differ from the growth rates of annual averages shown in Table 2.
CANADIAN ECONOMy 12 BANK OF CANADA • MONEtARy POlICy REPORt • APRIl 2021
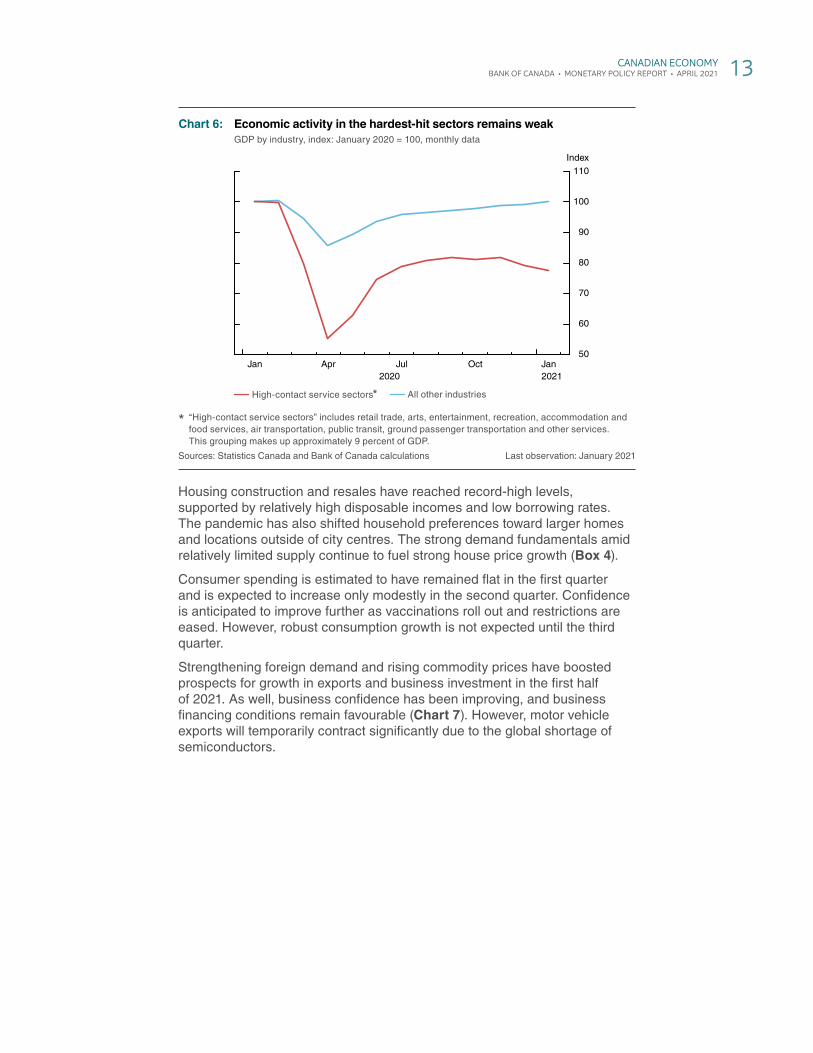
Housing construction and resales have reached record-high levels, supported by relatively high disposable incomes and low borrowing rates. The pandemic has also shifted household preferences toward larger homes and locations outside of city centres. The strong demand fundamentals amid relatively limited supply continue to fuel strong house price growth (Box 4).
Consumer spending is estimated to have remained flat in the first quarter and is expected to increase only modestly in the second quarter. Confidence is anticipated to improve further as vaccinations roll out and restrictions are eased. However, robust consumption growth is not expected until the third quarter.
Strengthening foreign demand and rising commodity prices have boosted prospects for growth in exports and business investment in the first half of 2021. As well, business confidence has been improving, and business financing conditions remain favourable (Chart 7). However, motor vehicle exports will temporarily contract significantly due to the global shortage of semiconductors.
Chart 6: Economic activity in the hardest-hit sectors remains weakGDP by industry, index: January 2020 = 100, monthly data
High-contact service sectors* All other industries
* “High-contact service sectors” includes retail trade, arts, entertainment, recreation, accommodation and food services, air transportation, public transit, ground passenger transportation and other services. This grouping makes up approximately 9 percent of GDP.
Sources: Statistics Canada and Bank of Canada calculations Last observation: January 2021
50
60
70
80
90
100
110
2020 2021
Index
Jan Apr Jul Oct Jan
CANADIAN ECONOMy 13 BANK OF CANADA • MONEtARy POlICy REPORt • APRIl 2021

Box 4
Drivers of the strength in Canadian housingHousing market activity and price growth have continued to be exceptionally strong. National resales have hit record highs, inventories of existing homes have reached record lows, and prices have increased rapidly. This has occurred despite elevated unemployment and lower immigration levels. Several demand and supply factors explain this strength.
Demand has been supported by relatively high disposable incomes and low mortgage rates. While job losses have risen during the pandemic, they have been concentrated among low-wage earners who tend to rent their homes rather than buy them. Remote work and more time spent at home have led to stronger demand for larger, single-family homes and toward housing in suburban and rural areas (Chart 4-A). One implication of this shift in demand is a pickup in new housing construction in regions with fewer supply constraints, such as a limited availability of land.
In the short run, however, supply cannot fully adjust to a sudden increase in housing demand of this size. It takes time for new units to come to market. The pace of construction over the past year has been hampered
House prices have risen more rapidly outside city centresYear-over-year house price growth in 2020Q4 and distance from city centre
Toronto Vancouver
Montréal Ottawa
Calgary Halifax
Note: Each dot represents a forward sortation area—a geographical unit based on the fi rst three characters in a Canadian postal code. The lines are trendlines that illustrate the average relationship in each city between house price growth and distance from city centre.
Sources: Teranet and Bank of Canada calculations Last observation: 2020Q4
Chart 4-A:
-5
0
5
10
15
20
25
30
%
0 10 20 30 40 50 60 70 80Distance from city centre (kilometres)
(continued…)
Chart 7: Business sentiment continues to improveQuarterly data
Business investment (year-over-year percentage change, left scale)
BOS indicator*† (right scale) Range of indicators in selected business surveys† (right scale)
* This measure is a summary of the responses to the main questions in the Business Outlook Survey (BOS).
† The range of indicators and BOS indicator are expressed as deviations from their historical averages, scaled by their standard deviations.
Sources: Statistics Canada, Business Development Bank of Canada, The Conference Board of Canada, Canadian Federation of Last observations:Independent Business, IHS Markit, Ivey School of Business, business investment, 2020Q4;Chartered Professional Accountants of Canada, Export Development BOS indicator and range of selectedCanada, Bank of Canada and Bank of Canada calculations surveys, 2021Q1 or most recent data point
2008 2010 2012 2014 2016 2018 2020-5
-4
-3
-2
-1
0
1
2
3
-50
-40
-30
-20
-10
0
10
20
30
% Standardized units
CANADIAN ECONOMy 14 BANK OF CANADA • MONEtARy POlICy REPORt • APRIl 2021

Significant economic slack in some sectorsThe labour market remains difficult for many Canadians. Strong job gains in February and March 2021 followed large losses in previous months, with the swings driven mostly by changes in pandemic-related restrictions. The tightening of containment measures in April is expected to lead to another wave of job losses, mostly in low-wage and part-time work, before employment rebounds later in the second quarter.
Box 4 (continued)
by containment measures and shortages of materials and skilled workers. These factors are also putting upward pressure on construction costs. In addition, some potential sellers have been reluctant to show their homes during the pandemic, limiting the supply of existing houses for sale.
This combination of a strong increase in demand and a relatively limited supply of new and existing housing has contributed to the rapid price growth. Over time, supply is expected to adjust. A large number of building permits have been issued, with a growing share for single-family homes. Housing starts have also risen signifi cantly in recent months, most notably in rural areas (Chart 4-B). Ultimately, this greater supply and the anticipated moderation in demand should help rebalance housing markets and contribute to more sustainable price dynamics.
While the strength in the housing market is rooted in a fundamental increase in demand, past experience shows that what starts out as fundamentals-based behaviour can turn into more speculative, extrapolative behaviour. This poses several risks. High prices could result in stretched borrowing and lending, leaving some households and fi nancial institutions more fi nancially vulnerable to an economic downturn. Recent proposed revisions to the Guideline B-20 by the Offi ce of the Superintendent of Financial Institutions are welcome steps to help reduce these risks.
If excess housing is built relative to a more durable level of long-term demand, there could be an exaggerated cycle in housing activity. As a result, house prices, residential investment and consumption spending could decline.
Chart 4-B: Builders are responding to demandMonthly data, seasonally adjusted at annual rates
a. Building permits by structure, units
Multiple-family buildings (level difference relative to 2018–19 average, left scale)
Single-family buildings (level difference relative to 2018–19 average, left scale)
Total permits (right scale)
b. Housing starts by area, three-month moving average, index: February 2020 = 100
Rural areas Urban areas
Sources: Canada Mortgage and Housing Corporation, Last observations: building permits, February 2021;Statistics Canada and Bank of Canada calculations housing starts, March 2021
180
200
220
240
260
280
300
320
-40
-20
0
20
40
60
80
100
2020 2021Jan Apr Jul Oct Jan
ThousandsThousands
60
100
140
180
220
260
300
2020 2021Jan Apr AprJul Oct Jan
Index
CANADIAN ECONOMy 15 BANK OF CANADA • MONEtARy POlICy REPORt • APRIl 2021

Unemployment remains highest in sectors such as accommodation and food services and retail. Low-wage workers, women and young people continue to be the most affected (Chart 8). The latest spike in COVID-19 cases will likely delay the recovery in high-contact sectors, prolonging unevenness in the labour market recovery.
Roughly 300,000 additional people would need to be hired just to reach the pre-pandemic employment level.1 However, given population growth, to return the employment rate to where it was before the pandemic, the increase in jobs would actually need to be larger—roughly 475,000. Meanwhile, the unemployment rate has declined from its peak of 13.7 percent in May 2020 to 7.5 percent in March 2021. Despite this improvement, the share of unemployed people who have been without a job for 27 weeks or more remains elevated, at about 30 percent. This is particularly concerning because long periods of unemployment have been associated with skill erosion and lower attachment to the labour market.
Indicators from the spring 2021 Business Outlook Survey provide evidence of unevenness in economic slack across sectors. Businesses facing stronger demand commonly reported capacity pressures. However, survey responses point to continued weakness in sectors such as accommodation, food and recreational services.
Looking at the economy as a whole, despite the strong estimated growth in the first quarter of 2021, considerable excess supply still exists. The Bank estimates that the output gap narrowed to between -3.0 percent and -2.0 percent in the first quarter (Box 1). Uncertainty around this range remains elevated.
1 The estimate of 300,000 is based on March 2021 employment.
Chart 8: Impacts on employment remain unevenMonthly data
a. Employment by age and gender, index: February 2020 = 100, seasonally adjusted
Women, age 15–24 Men, age 15–24 Adults, age 25 and older
b. Employment* by wage level, index: February 2020 = 100, not seasonally adjusted
Low-wage employees Other employees
* Data are for employees only and exclude those who are self-employed. Low-wage employees are those who earn less than $16.03 per hour (two-thirds of the 2019 annual median wage of $24.04 per hour). Seasonal factors may have contributed to the monthly dynamics.
Sources: Statistics Canada and Bank of Canada calculations Last observation: March 2021
60
70
80
90
110
100
20212020Feb Apr Jun Aug Oct Dec Feb
Index
60
70
80
90
100
110
20212020Feb Apr Jun Aug Oct Dec Feb
Index
CANADIAN ECONOMy 16 BANK OF CANADA • MONEtARy POlICy REPORt • APRIl 2021

CPI inflation boosted by temporary factorsOver the next few months, inflation is expected to rise temporarily to around the top of the 1 to 3 percent inflation-control target range. The transitory increase reflects the fact that the prices of some goods and services fell sharply with the sudden drop in demand at the onset of the pandemic. This results in base-year effects—CPI inflation appears higher on a year-over-year basis because prices of gasoline, motor vehicles and traveller accommodations fell in early 2020. In addition, the increase in oil prices since December has driven gasoline prices above their pre-pandemic levels (Chart 9). In setting monetary policy, the Bank looks through such temporary movements in inflation.
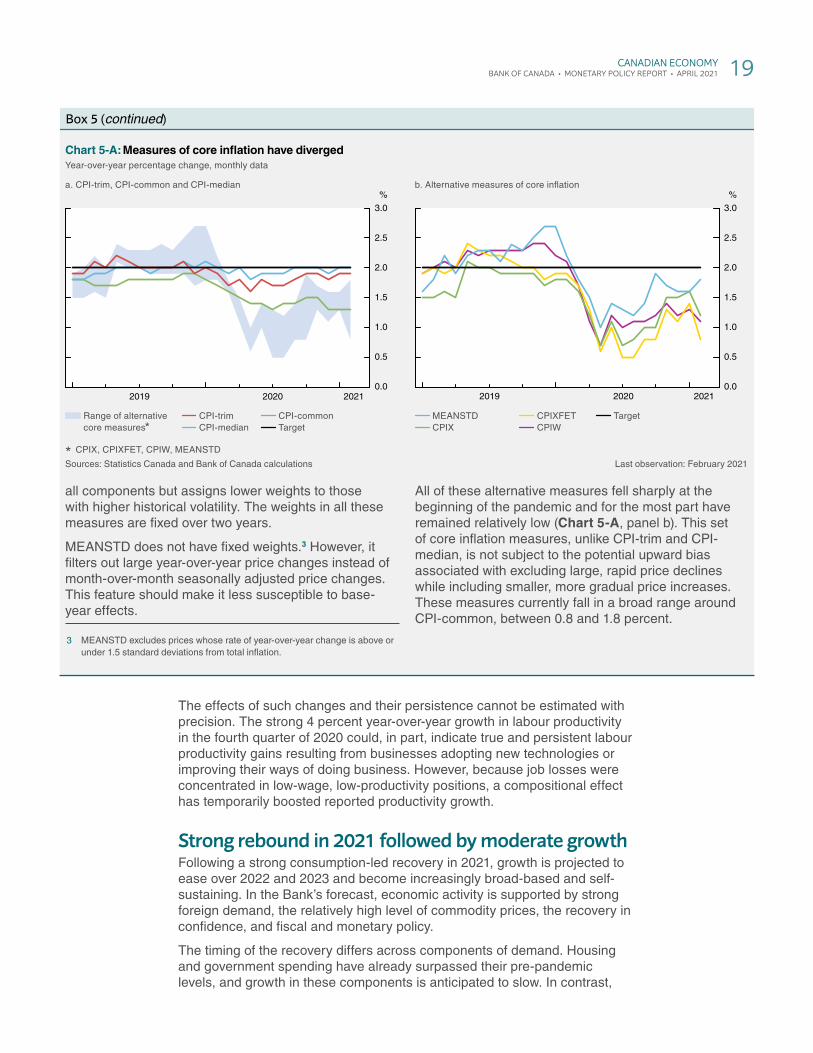
Measures of core inflation have remained at or below 2 percent and have diverged since the first wave. Two measures—CPI-median and CPI-trim—likely overstate underlying inflation given the unusual price movements that have occurred since the start of the pandemic (Box 5).
Productivity gains positive for potential outputIn this Report, the Bank has returned to the usual timing of its annual assessment of potential output (Appendix 1). The profile for potential output is stronger than in the October 2020 Report, reflecting the improved outlook and the greater-than-expected resilience of economic activity. Despite this positive reassessment, potential output remains below levels estimated before the pandemic.
Potential output growth is projected to pick up over the projection horizon. The continued robust recovery in investment should strengthen trend labour productivity growth. Meanwhile, trend labour input growth is anticipated to be roughly flat, with population aging and labour market scarring offsetting gains from immigration.
The pandemic and related structural changes are expected to have lasting effects on potential output and GDP. These changes include more investment in digitalization, as reported in the spring 2021 Business Outlook Survey, as well as the shift toward remote work and online shopping.
Chart 9: Gasoline prices are expected to boost CPI infl ationYear-over-year percentage change, monthly data
CPI CPI, excluding gasoline Target
Sources: Statistics Canada and Bank of Canada calculations and estimates Last data plotted: June 2021
-1
0
1
2
3
4
2019 2020 2021
%
CANADIAN ECONOMy 17 BANK OF CANADA • MONEtARy POlICy REPORt • APRIl 2021

Box 5
Diverging measures of core infl ation under COVID-19The pandemic is having unique impacts on prices and measures of total and core infl ation. In particular, the economic effects of COVID-19 have been highly uneven. Large shifts in consumption patterns have been accompanied by extreme price movements.1 In the most affected parts of the economy, such as travel services, drops in demand have resulted in sharp price declines. These hardest-hit sectors continue to show signs of considerable economic slack. In contrast, some components of the consumer price index (CPI) have seen price jumps due to relatively strong demand amid supply limitations.
Given the unique shifts in demand and supply and the resulting price movements caused by the pandemic and related containment measures, alternative measures of core infl ation may provide additional useful insights into the assessment of underlying infl ation.2
CPI-trim and CPI-medianCPI-median and CPI-trim fi lter out extreme price movements that might be caused by factors limited to specifi c components. CPI-trim does this by excluding components whose price changes fall in the top and bottom 20 percent in a given month. CPI-median excludes all monthly price changes except for the component at the midpoint of the distribution. In normal circumstances, this fi ltering helps give a better sense of overall infl ationary pressures by reducing the impact of large changes in the prices of individual components.
These measures have seen little movement since COVID-19 hit (Chart 5-A, panel a). Early in the pandemic, both CPI-median and CPI-trim excluded components with large, sudden price declines. These declines were felt in the most heavily affected sectors of the economy. By excluding these components, the measures had been putting more weight on components that were not affected (e.g., property taxes). However, when the prices of hard-hit components stopped falling and started to recover gradually, these measures tended
1 For more details, see Box 2 of the July 2020 Monetary Policy Report.
2 The other core measures examined are taken from M. Khan, L. Morel and P. Sabourin, “A Comprehensive Evaluation of Measures of Core Infl ation for Canada,” Bank of Canada Staff Discussion Paper No. 2015-12 (October 2015) and H. Lao and C. Steyn, “A Comprehensive Evaluation of Measures of Core Infl ation in Canada: An Update,” Bank of Canada Staff Discussion Paper No. 2019-9 (September 2019).
to include the associated increases. This resulted in an asymmetry. Because their composition is based on monthly price movements, these measures do not account for the fact that the price increases have been from particularly low levels. Consequently, CPI-median and CPI-trim have likely been overestimating underlying infl ation.
CPI-commonCPI-common tracks common price changes across multiple categories in the CPI basket. Common price movements indicate changes to overall demand. The weights are estimated using a statistical procedure called a factor model to detect these common variations. As a result, idiosyncratic price movements are averaged out.
CPI-common’s design means this measure tends to refl ect aggregate slack in the economy when spending patterns do not shift signifi cantly. Because the weights adjust very slowly over time, CPI-common treats price changes symmetrically on the way down and on the way up.
CPI-common is also more susceptible to base-year effects than the other two preferred measures because it is calculated using year-over-year price changes. Notably, sharp declines in the prices of electricity, clothing and footwear accounted for about three-quarters of the fall in CPI-common between February and April 2020. A year later, base-year effects are working in the opposite direction and are expected to contribute about 0.2 percentage points to the pickup in CPI-common from February to April 2021.
A broader set of core measuresAlternative measures of core infl ation exclude or reduce the impact of some relatively volatile components, but they do so in different ways.
CPIX and CPIXFET each exclude a fi xed set of historically volatile components, such as food and energy in the case of CPIXFET, and adjust the remaining components to exclude the effects of changes in indirect taxes. Other countries commonly assess underlying infl ation using similar types of exclusion measures of core infl ation. CPIW includes
(continued…)
CANADIAN ECONOMy 18 BANK OF CANADA • MONEtARy POlICy REPORt • APRIl 2021
The effects of such changes and their persistence cannot be estimated with precision. The strong 4 percent year-over-year growth in labour productivity in the fourth quarter of 2020 could, in part, indicate true and persistent labour productivity gains resulting from businesses adopting new technologies or improving their ways of doing business. However, because job losses were concentrated in low-wage, low-productivity positions, a compositional effect has temporarily boosted reported productivity growth.
Strong rebound in 2021 followed by moderate growthFollowing a strong consumption-led recovery in 2021, growth is projected to ease over 2022 and 2023 and become increasingly broad-based and self-sustaining. In the Bank’s forecast, economic activity is supported by strong foreign demand, the relatively high level of commodity prices, the recovery in confidence, and fiscal and monetary policy.
The timing of the recovery differs across components of demand. Housing and government spending have already surpassed their pre-pandemic levels, and growth in these components is anticipated to slow. In contrast,
Box 5 (continued)
all components but assigns lower weights to those with higher historical volatility. The weights in all these measures are fi xed over two years.
MEANSTD does not have fi xed weights.3 However, it fi lters out large year-over-year price changes instead of month-over-month seasonally adjusted price changes. This feature should make it less susceptible to base-year effects.
3 MEANSTD excludes prices whose rate of year-over-year change is above or under 1.5 standard deviations from total infl ation.
All of these alternative measures fell sharply at the beginning of the pandemic and for the most part have remained relatively low (Chart 5-A, panel b). This set of core infl ation measures, unlike CPI-trim and CPI-median, is not subject to the potential upward bias associated with excluding large, rapid price declines while including smaller, more gradual price increases. These measures currently fall in a broad range around CPI-common, between 0.8 and 1.8 percent.
Chart 5-A:Measures of core infl ation have divergedYear-over-year percentage change, monthly data
a. CPI-trim, CPI-common and CPI-median
Range of alternative core measures*
CPI-trim CPI-median
CPI-common Target
b. Alternative measures of core infl ation
MEANSTD CPIX
CPIXFET CPIW
Target
* CPIX, CPIXFET, CPIW, MEANSTD
Sources: Statistics Canada and Bank of Canada calculations Last observation: February 2021
2019 2020 2021
%
0.0
0.5
1.0
1.5
2.0
2.5
3.0
2019 2020 2021
%
0.0
0.5
1.0
1.5
2.0
2.5
3.0
CANADIAN ECONOMy 19 BANK OF CANADA • MONEtARy POlICy REPORt • APRIl 2021
consumption, investment and exports have yet to reach their pre-pandemic levels and are expected to first strengthen before their growth rates moderate later in the projection horizon.
Household spending to underpin the recoveryConsumption is anticipated to rebound in the second half of 2021 when spending on high-contact services increases. Growth of consumer expenditures is expected to remain strong over the projection horizon. Projected spending is supported by improved confidence, relatively high disposable income and low interest rates. As labour income and employment continue to recover, government transfers will become a decreasingly important source of support to disposable income.
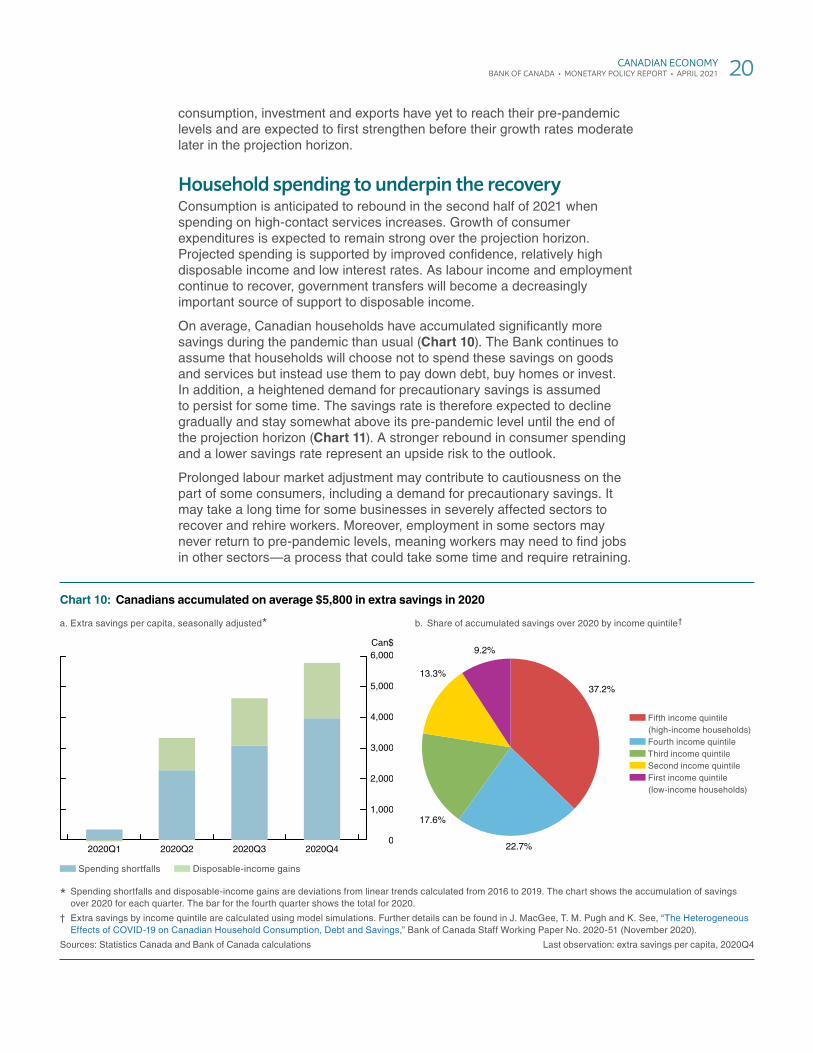
On average, Canadian households have accumulated significantly more savings during the pandemic than usual (Chart 10). The Bank continues to assume that households will choose not to spend these savings on goods and services but instead use them to pay down debt, buy homes or invest. In addition, a heightened demand for precautionary savings is assumed to persist for some time. The savings rate is therefore expected to decline gradually and stay somewhat above its pre-pandemic level until the end of the projection horizon (Chart 11). A stronger rebound in consumer spending and a lower savings rate represent an upside risk to the outlook.
Prolonged labour market adjustment may contribute to cautiousness on the part of some consumers, including a demand for precautionary savings. It may take a long time for some businesses in severely affected sectors to recover and rehire workers. Moreover, employment in some sectors may never return to pre-pandemic levels, meaning workers may need to find jobs in other sectors—a process that could take some time and require retraining.
Chart 10: Canadians accumulated on average $5,800 in extra savings in 2020
a. Extra savings per capita, seasonally adjusted*
Spending shortfalls Disposable-income gains
b. Share of accumulated savings over 2020 by income quintile†
Fifth income quintile (high-income households)
Fourth income quintile Third income quintile Second income quintile First income quintile (low-income households)
* Spending shortfalls and disposable-income gains are deviations from linear trends calculated from 2016 to 2019. The chart shows the accumulation of savings over 2020 for each quarter. The bar for the fourth quarter shows the total for 2020.
† Extra savings by income quintile are calculated using model simulations. Further details can be found in J. MacGee, T. M. Pugh and K. See, “The Heterogeneous Effects of COVID-19 on Canadian Household Consumption, Debt and Savings,” Bank of Canada Staff Working Paper No. 2020-51 (November 2020).
Sources: Statistics Canada and Bank of Canada calculations Last observation: extra savings per capita, 2020Q4
0
1,000
2,000
3,000
4,000
5,000
6,000
2020Q1 2020Q2 2020Q3 2020Q4
Can$
37.2%
22.7%
17.6%
13.3%
9.2%
CANADIAN ECONOMy 20 BANK OF CANADA • MONEtARy POlICy REPORt • APRIl 2021

Housing activity is expected to soften but remain well above pre-pandemic levels over the projection horizon. The preference for larger homes will likely remain a factor affecting the housing market after the pandemic given the expected permanent rise in remote work. In addition, higher levels of immigration are expected to contribute to strong population growth later in the projection horizon. These sources of demand should support elevated levels of new home construction and renovation spending. Housing resales are projected to soften from very high levels. This is partly because some homebuyers may have moved their purchases forward to lock in low mortgage rates, especially given expectations of rising prices.2
Foreign demand to drive a solid recovery in exportsA strong US recovery is projected to support robust export growth (Chart 12). Goods exports are expected to strengthen because of improving global demand and higher prices for a wide range of commodities. These positive effects are likely to substantially exceed the adverse impacts of the recent appreciation of the Canadian dollar. The healthy rebound in US industrial production should boost demand for Canadian exports of machinery and equipment and non-energy commodities. Meanwhile, motor vehicle exports will likely remain below pre-pandemic levels, mostly due to scheduled reductions in production mandates.
Services exports should rebound from weak levels as travel restrictions are eased. However, evidence from surveys suggests the recovery will be drawn out for some services, such as business travel.3 Businesses may reduce travel budgets in favour of more teleconferencing and a smaller carbon footprint.
2 The results of the Canadian Survey of Consumer Expectations for the first quarter of 2021 show that consumers’ expectations for house price growth edged up across the country.
3 For example, 61 percent of respondents in the latest Conference Board of Canada survey of business leaders (February 2021) expect their business travel to remain below pre-pandemic levels indefinitely.
Chart 11: The savings rate is expected to decline graduallyNominal quarterly data
Household consumption(index: 2019Q4 = 100, left scale)
Disposable income(index: 2019Q4 = 100, left scale)
Savings rate(right scale)
Average savings rate (2000–19, right scale)
Sources: Statistics Canada and Bank of Canada calculations and projections
0
5
10
15
20
25
30
80
90
100
110
120
%
2022 20232019 2020 2021
Index
CANADIAN ECONOMy 21 BANK OF CANADA • MONEtARy POlICy REPORt • APRIl 2021

Current levels of oil prices and solid US refinery demand for Canadian crude oil should support moderate growth in energy exports. Crude-by-rail exports are expected to become more prevalent in the near term until additional pipeline capacity comes online at the end of 2021.
Imports are projected to grow in line with strong domestic demand.
Business investment to strengthenInvestment growth outside the oil and gas sector is expected to pick up in 2021 as domestic and foreign demand increase and capacity pressures mount (Chart 13). The spring 2021 Business Outlook Survey revealed that one-quarter of firms are resuming or catching up with their investment plans, including spending on automation and digitalization. The accelerated trend toward e-commerce is expected to support stronger investment in machinery and equipment as well as in warehouses and related structures.
The recovery in business investment will likely be uneven, however. Increased remote work and online shopping may lead to reduced demand for office and retail space.
Investment growth in the oil and gas sector is expected to pick up, reflecting the recent rise in oil and natural gas prices. At current prices, most existing oil projects can cover businesses’ operational and transportation expenses. However, the desire to reduce leverage, uncertainty about future prices and a heightened focus on climate change will continue to challenge the sector. As a result, investment in the sector is expected to remain below its pre-pandemic level throughout the projection horizon.
Inventory investment is projected to rise and contribute about 1 percentage point to real GDP growth in 2021. Businesses are anticipated to continue rebuilding their low retail inventories after unprecedented drawdowns in 2020.
Chart 12: Foreign demand drives a solid recovery in exportsContribution to the deviation of real total exports from the 2019Q4 level, in percentage points, quarterly data
Total exports (percentage change since 2019Q4,left scale)
Services exports (right scale) Non-commodity goods exports (right scale) Commodity exports (right scale)
Sources: Statistics Canada and Bank of Canada calculations and projections
-25
-20
-15
-10
-5
0
5
10
-25
-20
-15
-10
-5
0
5
10%
2021 2022 20232019 2020
Percentage points
CANADIAN ECONOMy 22 BANK OF CANADA • MONEtARy POlICy REPORt • APRIl 2021

Economic slack to weigh on inflation over 2021 and 2022After rising to around 3 percent—the top of the inflation-control range—CPI inflation is expected to decline toward 2 percent over the second half of 2021. This easing largely reflects diminishing base-year effects from gasoline prices.
Inflation is projected to decline further in the first half of 2022. This reflects commodity prices no longer being a source of upward pressures, while economic slack continues to be a drag on inflation. Although the timing is highly uncertain, inflation is expected to be at around 2 percent in the second half of 2022, as economic slack is absorbed (Chart 14).
The uncertainty around the inflation outlook is greater than usual. This partly reflects the different impacts the virus and lockdowns have had on sectors, businesses and groups of workers, creating an unusual degree of uncertainty about the amount of slack in the economy. As discussed earlier, estimates of when the output gap will close are highly uncertain. As well, the concentration of job losses in sectors where job reallocation prospects are typically weak may imply that labour market slack will be absorbed more slowly than usual, possibly putting ongoing downward pressure on inflation.
This projection is consistent with medium- and long-term inflation expectations remaining well anchored at the 2 percent target. Most firms that participated in the spring 2021 Business Outlook Survey expect that inflation over the next two years will remain within the Bank’s inflation-control target range of 1 to 3 percent. More respondents than in the previous survey expect inflation to be in the upper half of that range. Firms’ views reflect strong anticipated demand related to fiscal and monetary policy support and the future easing of restrictions. As in recent years, most respondents to
Chart 13: Business sentiment has improved further, and investment is expected to strengthenQuarterly data
a. Regional BOS indicator and regional contributions
Ontario Quebec British Columbia
Atlantic provinces Prairies Regional BOS indicator*
b. Contribution to the deviation of real total business investment from the 2019Q4 level, in percentage points
Total business investment (percentage change since 2019Q4, left scale)
Oil and gas investment (right scale) Non-oil and gas investment (right scale)
* This indicator may differ from the overall Business Outlook Survey (BOS) indicator because the common variations are extracted from more variables. These variables are more volatile because they are based on responses from smaller samples of fi rms. See the Business Outlook Survey for more details.
Sources: Statistics Canada, Bank of Canada and Bank of Canada calculations and projections Last observation: BOS, 2021Q1
-12
-10
-8
-6
-4
-2
0
2
4
2019 2020 2021
Standardized units
-20
-15
-10
-5
0
5
10
15
-20
-15
-10
-5
0
5
10
15
%
2021 2022 20232019 2020
Percentage points
CANADIAN ECONOMy 23 BANK OF CANADA • MONEtARy POlICy REPORt • APRIl 2021

the Canadian Survey of Consumer Expectations in the first quarter of 2021 anticipate that inflation will be within or slightly above the 1 to 3 percent target range over the next two years. The January 2021 Consensus Economics forecast for long-term inflation expectations shows an average of 2 percent through 2031.
Chart 14: Economic slack is expected to weigh on infl ation over 2021 and 2022Contribution to the deviation of infl ation from 2 percent, quarterly data
CPI infl ation (year-over-year percentage change, left scale)
Output gap (right scale) Exchange rate pass-through (ERPT) (right scale) Commodity prices, excluding ERPT (right scale) Carbon pollution charge (right scale) Other factors (right scale)
Note: Numbers may not add to total because of rounding.
Sources: Statistics Canada and Bank of Canada estimates, calculations and projections
-3
-2
-1
0
1
2
3
-1
0
1
2
3
4
5
2019 2020 2021 2022 2023
% Percentage points
CANADIAN ECONOMy 24 BANK OF CANADA • MONEtARy POlICy REPORt • APRIl 2021

Evolution of the Bank’s Evolution of the Bank’s balance sheet balance sheet Since March 2020, the Bank has used balance sheet tools to provide extraordinary liquidity support and monetary stimulus to the Canadian economy. In the early stages of the pandemic, programs and facilities were focused on restoring market functioning and bolstering funding liquidity to keep credit flowing.4 Initially, purchases of Government of Canada (GoC) bonds through the Government Bond Purchase Program aimed to ease strains in the GoC bond market. These purchases also enhanced the effectiveness of other policy actions.
As liquidity conditions in the GoC bond market improved, the primary objective of bond purchases shifted toward a focus on monetary stimulus. The cumulative stock, the flow and the composition of quantitative easing (QE) purchases continue to put downward pressure on borrowing rates, supporting economic activity. QE also reinforces monetary stimulus provided by the Bank’s forward guidance. This guidance has committed to holding the policy interest rate at the effective lower bound until economic slack is absorbed, so the inflation target is sustainably achieved.
The evolution in the size and composition of the Bank’s balance sheet reflects the transition between these two objectives—market functioning and monetary stimulus—of the GoC bond purchase program (Chart 15). The liquidity and other asset purchase programs were successful in restoring well-functioning markets and have been gradually wound down since October. As a result, by the end of April, the value of total assets on the Bank’s balance sheet is expected to decline to about $475 billion, compared with $575 billion in February. This is largely because over $140 billion in shorter-term assets will have matured. Notably, about $120 billion in extended term repos will have expired. As the total value of assets has decreased, so has the level of settlement balances, which are expected to decline from close to $400 billion in early March to roughly $290 billion by the end of April. More recently, the Bank announced that the remaining programs that support market functioning will expire on schedule in April and May. The Bank will also suspend term repo operations, which will further limit growth of the balance sheet.5
4 See “COVID-19: Actions to Support the Economy and Financial System” for more detailed information on the various programs.
5 See T. Gravelle, “Market Stress Relief: The Role of the Bank of Canada’s Balance Sheet” (speech delivered virtually to the CFA Society, Toronto, March 23, 2021).
EVOlUtION OF tHE BANK’S BAlANCE SHEEt 25 BANK OF CANADA • MONEtARy POlICy REPORt • APRIl 2021
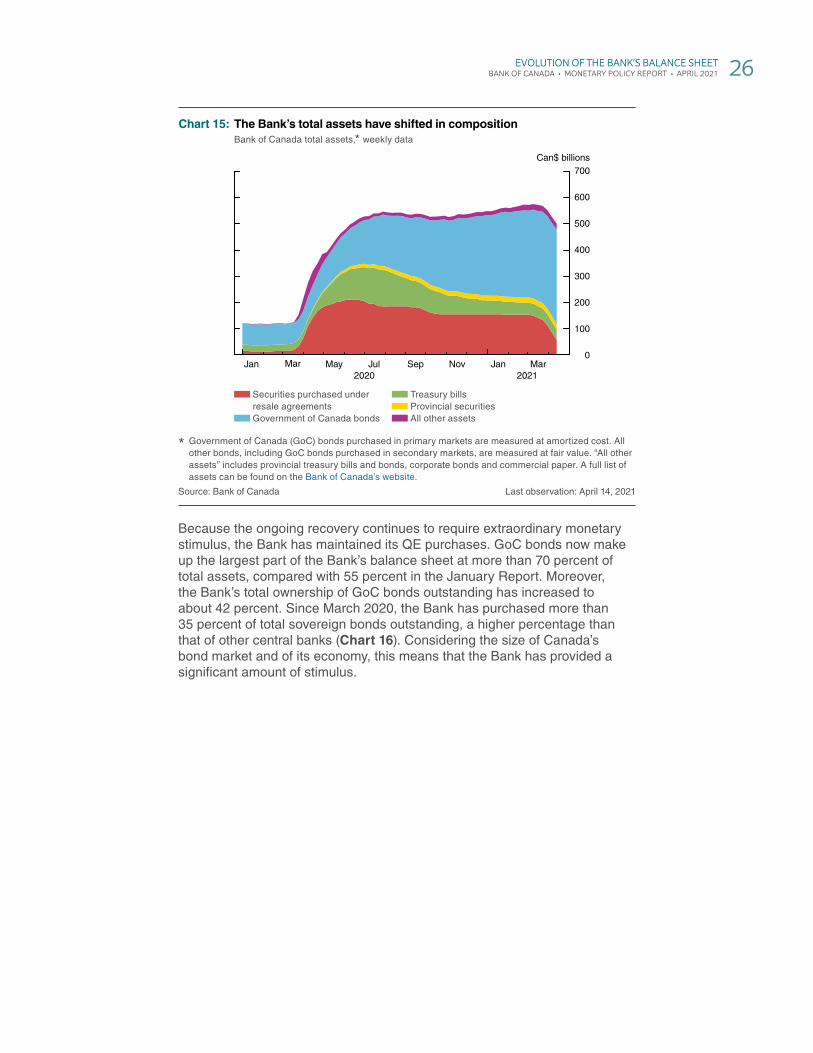
Because the ongoing recovery continues to require extraordinary monetary stimulus, the Bank has maintained its QE purchases. GoC bonds now make up the largest part of the Bank’s balance sheet at more than 70 percent of total assets, compared with 55 percent in the January Report. Moreover, the Bank’s total ownership of GoC bonds outstanding has increased to about 42 percent. Since March 2020, the Bank has purchased more than 35 percent of total sovereign bonds outstanding, a higher percentage than that of other central banks (Chart 16). Considering the size of Canada’s bond market and of its economy, this means that the Bank has provided a significant amount of stimulus.
Chart 15: The Bank’s total assets have shifted in composition Bank of Canada total assets,* weekly data
Securities purchased under resale agreements
Government of Canada bonds
Treasury bills Provincial securities All other assets
* Government of Canada (GoC) bonds purchased in primary markets are measured at amortized cost. All other bonds, including GoC bonds purchased in secondary markets, are measured at fair value. “All other assets” includes provincial treasury bills and bonds, corporate bonds and commercial paper. A full list of assets can be found on the Bank of Canada’s website.
Source: Bank of Canada Last observation: April 14, 2021
0
100
200
300
400
500
600
700
20212020Jan Mar May Jul Sep Nov Jan Mar
Can$ billions
EVOlUtION OF tHE BANK’S BAlANCE SHEEt 26 BANK OF CANADA • MONEtARy POlICy REPORt • APRIl 2021

Chart 16: The Bank’s sovereign bond holdings increased markedly compared with those of other jurisdictionsHoldings of government bonds as a share of government bonds outstanding
Before March 2020 Since March 2020
Note: All nominal sovereign bond purchases include purchases at primary auctions for balance sheet management. The last observation for the euro area purchases is March 2021. Data for Sweden and the euro area may also include infl ation-protected securities. Last observation for government bonds outstanding is February 2021, except for the euro area, which is at 2020Q3.
Sources: Bank of England, Bloomberg, European Central Bank, Sveriges Riksbank, US Federal Reserve Bank and Bank of Canada Last observation: See note
0
10
20
30
40
50
%
Sweden UnitedKingdom
Canada UnitedStates
Euro area
EVOlUtION OF tHE BANK’S BAlANCE SHEEt 27 BANK OF CANADA • MONEtARy POlICy REPORt • APRIl 2021
Risks to the inflation outlookRisks to the inflation outlookUncertainty around the projection remains unusually high. The projection still depends considerably on how the pandemic evolves, most notably with respect to vaccination rollouts and the spread of COVID-19 variants.
Several risks identified in previous reports have materialized. In particular, the timeline for broad-based immunity has shortened in the United States, the rate of vaccination has picked up in Canada, and strong Canadian data in the first quarter indicate greater economic resilience to containment measures. As well, the US administration has approved a large fiscal stimulus package. However, a third wave of the virus in Canada has led provincial authorities to reimpose lockdowns.
The outlook for inflation is subject to several upside and downside risks. The Bank presents a selection of risks identified as most important for the projected path of inflation, drawing from a larger set of risks considered in the base-case projection. The Bank views these risks as roughly balanced.
(i) More severe third wave and more persistent pandemic (↓)Since January, some upside risks associated with the ability to limit the impacts of the virus have been realized and are now embedded in the base-case projection. As a result, pandemic-related risks are now skewed to the downside. The spread of more contagious variants may be more severe than expected, leading authorities to impose stricter and longer-lasting containment measures. In addition, vaccines may be less effective at containing the disease than assumed. It may also take longer to achieve broad-based immunity. A more severe third wave or a more persistent pandemic would lead to additional weakness in output and employment as well as more adverse and persistent effects on confidence. With a more prolonged period of weak economic activity, some risks that have diminished over time, such as labour market scarring and corporate financial stress, could re-emerge.
(ii) Stronger household spending in Canada (↑)Household savings have increased dramatically since the pandemic began, particularly for higher-income households. This reflects fewer opportunities to spend and increased precautionary savings. Households could spend some of these extra savings on goods and services rather than use them to pay down debt or invest in financial assets. Households could also revert to their pre-pandemic savings rates sooner. In either case, consumption and residential investment would be stronger, contributing to inflationary pressures.6
6 For a detailed analysis of this risk, see L. Schembri, “COVID-19, Savings and Household Spending” (speech delivered virtually to Restaurants Canada, Toronto, March 11, 2021).
RISKS tO tHE INFlAtION OUtlOOK 28 BANK OF CANADA • MONEtARy POlICy REPORt • APRIl 2021

(iii) Stronger growth in the United States (↑)US economic growth could be materially stronger if people spend some of the extra savings built up during the pandemic. Moreover, there could be additional fiscal stimulus, for example, from the proposed American Jobs Plan.
(iv) More persistent cost pressures (↑)Businesses are facing rising costs, such as higher prices for raw material inputs. Possible labour shortages in specific sectors and occupations could also play a role. In addition, disruptions to business operations brought about by the pandemic may lead firms to adjust their supply chains and production processes in ways that could increase costs. In an environment of strong demand, businesses may find that they are better able to raise prices to pass along higher expenses to consumers or to rebuild their margins.
(v) Higher Canadian potential output (↓)The profile for potential output growth in Canada is stronger than that in the October 2020 Report. However, given the nature of the shock and elevated uncertainty, potential output could be even stronger than assumed. Strong productivity growth in 2020 may indicate that accelerated automation and digitalization have played a more important role than assumed, implying higher trend productivity in recent quarters and over the projection horizon. All else equal, stronger potential output eases inflationary pressures in the economy.
(vi) Weaker exports (↓)Canadian exports could be weaker than in the base-case projection. The Canadian dollar has reached its highest level since early 2018. The decrease in competitiveness associated with a stronger Canadian dollar could further weigh on Canadian exports. At the same time, Buy American provisions in the United States could mute the benefit to Canadian exporters of strong US demand.
RISKS tO tHE INFlAtION OUtlOOK 29 BANK OF CANADA • MONEtARy POlICy REPORt • APRIl 2021

Appendix 1: Potential outputAppendix 1: Potential output
7 To calculate the pre-pandemic estimate for the level in 2023, we extend the January 2020 projection for potential output by two years, to 2022 and 2023. We use the potential growth estimate for 2021 provided in the January 2020 Report.
8 For more details, see T. Carter, X. S. Chen, A. Jaffery, C. Hajzler, J. Lachaine, P. Shannon, S. Sarker, G. Westwood and B. Yan, “Assessing Global Potential Output Growth and the US Neutral Rate: April 2021,” Bank of Canada Staff Analytical Note No. 2021-5 (April 2021).
The Bank’s estimates of potential output in Canada and globally have been revised up compared with the estimates presented in the October 2020 Report (Table A1-1 and Table A1-2). While significant, these positive revisions leave the projected level of potential output below the levels Bank staff estimated before the pandemic. By 2023, Canada’s potential output level is expected to be about 1 percent below the pre-pandemic estimate.7
Global potential output growth to pick upThe COVID-19 pandemic caused a sharp slowdown in potential output growth in 2020 around the world (Table A1-1). However, looking ahead, global potential output growth is expected to recover from 2.3 percent in 2020 to 3.0 percent in 2022 and 2023, as the disruptive effects of the pandemic fade.8
Table A1-1: Projection for potential output growth
Projected growth* (percent)
2019 2020 2021 2022 2023
Canada
Excluding temporary effects of the pandemic 1.9 (1.8) 1.4 (0.7) 1.5 (0.9) 1.3 (1.1) 2.0
Including temporary effects of the pandemic 1.9 (1.8) -1.1 (-1.7) 3.7 (3.0) 1.6 (1.5) 2.0
World 3.2 (3.3) 2.3 (2.1) 2.7 (2.4) 3.0 (2.7) 3.0
United States 1.8 (1.8) 1.2 (1.1) 1.3 (1.1) 1.8 (1.5) 1.8
Euro area 1.4 (1.4) 0.9 (0.8) 1.1 (1.0) 1.2 (1.1) 1.1
Japan 1.0 (0.9) 0.5 (0.4) 0.6 (0.6) 0.7 (0.6) 0.7
China 6.2 (6.1) 5.5 (5.1) 5.5 (5.3) 5.4 (5.3) 5.4
Oil-importing EMEs† 4.0 (4.1) 2.5 (2.3) 3.2 (2.9) 3.8 (3.4) 3.8
Rest of the world‡ 1.9 (1.8) 1.3 (0.9) 1.5 (1.3) 1.8 (1.5) 1.9
* Numbers in parentheses are projections used in the October 2020 Monetary Policy Report.
† The oil-importing emerging-market-economy (EME) grouping excludes China. It is composed of large EMEs from Asia, Latin America, the Middle East, emerging Europe and Africa (such as India, Brazil and South Africa), as well as newly industrialized economies (such as South Korea).
‡ “Rest of the world” is a grouping of all other economies not included in the fi rst fi ve regions. It is composed of oil-exporting EMEs (such as Russia, Nigeria and Saudi Arabia) and other advanced economies (such as Canada, the United Kingdom and Australia).
Source: Bank of Canada
APPENDIx 1: POtENtIAl OUtPUt 30 BANK OF CANADA • MONEtARy POlICy REPORt • APRIl 2021

Improvement in trend total factor productivity growth in all regions explains a large part of that recovery. Drags from physical distancing protocols are expected to dissipate. In addition, the pandemic has accelerated the reallocation of labour and capital to more productive firms and encouraged a faster adoption of digital technologies. Trend labour input growth is also anticipated to rise, especially in advanced economies. However, ongoing headwinds from population aging across most regions should continue to weigh on potential output growth over the projection horizon.
Compared with the October 2020 assessment, potential output growth has been revised up in all regions. This adjustment is due mainly to the positive implications of vaccination for the global economy. The availability of vaccines and their faster-than-expected delivery, especially in advanced economies, has shortened the estimated duration of the pandemic. This should result in less long-term unemployment and fewer permanent withdrawals from the labour force. It should also reduce the costs of physical distancing imposed on firms. The negative economic impacts of the pandemic have also been less severe than expected in several regions. In particular, the persistent adverse effects on the capital stock and trend productivity are now estimated to be less significant than assessed in the October Report.
9 For more details, see D. Brouillette, G. Faucher, M. Kuncl, A. McWhirter and Y. Park, “Potential Output and the Neutral Rate in Canada: 2021 Update,” Bank of Canada Staff Analytical Note No. 2021-6 (April 2021).
Stronger trend labour productivity growth in CanadaThe profile for potential output growth in Canada has also been revised up compared with the October 2020 assessment. This is due to the improvement in economic prospects and the greater-than-expected resilience of the economy to the pandemic (Table A1-2). On average, from 2021 to 2023, potential output growth is 0.5 percentage points higher than in the October Report.9
The main driver of the revision is a stronger investment profile, which has boosted trend labour productivity growth over the projection horizon. Business investment levels are forecast to be higher than was expected in October because of reduced uncertainty and stronger anticipated demand once the pandemic ends. Public investment in capital is also revised up to capture increased fiscal spending and positive historical revisions.
Table A1-2: Projected growth rate of potential output, excluding temporary effects of the pandemicYear-over-year percentage change*†
Potential output growth
Trend labour input
Trend labour productivity
Range for potential
output growth
2010–18 1.8 (1.8) 0.9 (0.9) 0.9 (0.9)
2019 1.9 (1.8) 1.3 (1.2) 0.6 (0.6) 1.6–2.2
2020 1.4 (0.7) 0.8 (1.1) 0.6 (-0.3) 0.8–2.0
2021 1.5 (0.9) 0.4 (0.7) 1.1 (0.1) 0.8–2.2
2022 1.3 (1.1) 0.7 (0.7) 0.7 (0.5) 0.4–2.2
2023 2.0 (1.2) 0.7 (0.6) 1.3 (0.6) 1.0–3.0
2024 2.2 0.7 1.4 1.2–3.2
* Numbers in parentheses are from the October 2020 Monetary Policy Report.
† Numbers may not add to total due to rounding.
APPENDIx 1: POtENtIAl OUtPUt 31 BANK OF CANADA • MONEtARy POlICy REPORt • APRIl 2021

The Bank no longer assumes total factor productivity will be negatively affected by the pandemic. The more favourable economic conditions imply less destruction of both firms and intangible capital. In addition, automation and digitalization, which have been increasing at a faster pace since the beginning of the pandemic, enhance total factor productivity growth. These effects are relevant over both the past year and coming years.
Potential output growth is expected to pick up over the projection horizon because of stronger trend labour productivity growth. In particular, investment will continue to recover at a robust pace.
Trend labour input growth is expected to be flat from 2022 to 2024. This reflects two opposing forces. Population growth should increase after 2021, supported by higher immigration targets and an anticipated return to pre-pandemic levels of flows of non-permanent residents in 2022. However, labour market scarring and population aging offset the gains from stronger population growth.
APPENDIx 1: POtENtIAl OUtPUt 32 BANK OF CANADA • MONEtARy POlICy REPORt • APRIl 2021