Monetary Policy of Nepal (ENGLISH)--2012-13 Report
60
Monetary Policy for Fiscal Year 2012/13 Nepal Rastra Bank Central Office Baluwatar, Kathmandu Unofficial Translation
-
Upload
sanjeev-acharya -
Category
Documents
-
view
12 -
download
2
description
Monetary Policy of Nepal (ENGLISH)--2012-13 Report
Transcript of Monetary Policy of Nepal (ENGLISH)--2012-13 Report

Monetary Policy for
Fiscal Year 2012/13
Nepal Rastra Bank Central Office
Baluwatar, Kathmandu
Unofficial Translation

Monetary Policy for
Fiscal Year 2012/13
Delivered by Governor Dr. Yuba Raj Khatiwada on 25 July 2012
Nepal Rastra Bank Central Office
Baluwatar, Kathmandu
www.nrb.org.np

ACRONYMS
BFIs = Banks and Financial Institutions BOP = Balance of Payments CBS = Central Bureau of Statistics CRR = Cash Reserve Ratio GDP = Gross Domestic Product GoN = Government of Nepal INR = Indian Rupee KYC = Know Your Customer LC = Letter of Credit LIBOR = London Iner-bank Offer Rate LMFF = Liquidity Monitoring and Forecasting Framework NEPSE = Nepal Stock Exchange NPL = Non-Performing Loan NRB = Nepal Rastra Bank NRN = Non-Resident Nepali SLF = Standing Liquidity Facility SLR = Statutory Liquidity Ratio USD = US Dollar y-o-y = year on year

Table of Contents Background 1 International Economic Outlook 2 Domestic Economic Situation 3
Domestic Product 3 Price 4 Government Finance 5 External Sector 5 Financial Market 7 Monetary Situation 10 Liquidity Management 12
Monetary Policy and Financial Sector Program of FY 2012/13 13
Monetary Policy Stance 13 Economic and Monetary Objectives 15 Monetary Policy Instruments 16
Financial Sector Reform, Regulation and Supervision 17 Foreign Exchange Management 22 Micro Finance and Financial Access 24 Appendix 1: Annual Progress Matrix of Policy Measures as Outlined in
Monetary Policy of FY 2011/12 26 Appendix 2: Progress Matrix of Policies and Program Pertaining to
Financial Sector and Foreign Exchange Outlined in Monetary Policy of FY 2011/12 27-35
Statistical Tables

Monetary Policy for 2012/13
Background 1. As envisaged by Nepal Rastra Bank Act, 2002, monetary policy for FY 2012/13
has been formulated with the objectives of maintaining price stability, external and financial sector stability, promoting financial access to the general public and facilitating high and sustainable economic growth. Even though a full fledged budget was not announced timely by Government of Nepal (GoN), policies and programs such as macroeconomic stability, economic growth, employment, social and inclusive development and other programs and policies outlined in the three-year plan and adopted by government in latter periods have also been considered while formulating this monetary policy.
2. The macroeconomic indicators of the country remained satisfactory in FY 2011/12. Economic growth remained higher in comparison to the past two years. Inflation stood at lower level and the government revenue mobilization remained higher than the previous year. Budget deficit is within the desired limit. Export growth remained higher compared to previous year and import growth also remained at desired level. Despite the high trade deficit, current account surplus remained at higher level and BOP surplus reached a historical level, leading to remarkable increase in foreign exchange reserve. A positive sign has been seen in sluggish share market and real estate transactions. Increased deposit mobilization of BFIs has put an end to liquidity crunch in banking system. The declining trend in the lending rates is creating a favorable environment for investment.
3. Despite favorable economic scenario, as mentioned above, the expansion of credit toward productive sector has not been at the desired level. Gradually easing liquidity situation in the money market has led the short term interest rate to a lower level. In this situation, adopting tight monetary policy may adversely affect the investment environment which might lead to contraction in economic growth. Likewise, loose monetary policy may stimulate the credit flow towards unproductive sectors and consumption leading to inflationary pressure from excess demand. Besides, adopting loose monetary policy may be risky due to adverse effect on deposit mobilization arising from the fall in interest rate. There is a risk of further inflationary pressure from import prices due to unstable price of crude oil in international market, depreciation of Nepalese currency with USD, and monetary easing in India and China to stimulate economic growth.
4. Monetary management is to be carried out cautiously by considering risk to inflation from unstable oil price in international market and excess domestic demand on one hand and possible adverse impact on economic growth and financial sector stability from inadequate monetary liquidity and credit growth on the other. For financial stability, monetary policy should also be directed toward addressing the issues related to productive uses of credit, promotion of financial access and governance.

2 Nepal Rastra Bank 5. The monetary policy for 2012/13 is made public together with the review of current
economic and financial situation of the country and implementation status of previous monetary policy. Necessary adjustment has been made in the policy stance, targets and instruments in the current monetary policy on the basis of analysis of the domestic and external economic outlook. With a view to make the activities of this bank more transparent, programs related to financial sector reform; regulation and supervision; foreign exchange and micro finance are also included in this monetary policy document. Provision has been made for periodic review of monetary and financial measures so as to address changes in money and financial market.
6. Current monetary policy incorporates the suggestions from the interaction with different stakeholders: Nepal government, Nepal Bankers' Association, Development Bankers' Association, Nepal Financial Institutions' Association, Nepal Micro Finance Bankers' Association, commerce and industries associations, Credit Consumers' Association, entrepreneurs and businessmen.
International Economic Outlook
7. Although the signs of improvement in economic situation have been witnessed along with the gradually decreasing impact of economic contraction following the global financial crisis, there still remain some challenges and risks in the world economy in the direction of controlling inflation and maintaining economic expansion and financial stability. Even though the US economy, which had been reeled in the financial crisis, is gradually recovering, the economic growth of Euro Zone and other developed countries is still in feeble condition. Accordingly, the pace of global economic growth is at risk because of the lowest economic growth of India in this decade and sluggish economic growth of China among the emerging and developing economies.
8. Taking into account the deepening sovereign debt crisis of Euro Zone and the risks associated with the economic expansion of emerging economies such as India and China, the International Monetary Fund (IMF) has recently reduced the forecast of world economic growth rate. While world economic growth was 3.9 percent in 2011, it is projected to be just 3.5 percent in 2012. The world economic growth is projected to be 3.9 percent in 2013, if the European crisis moves toward retrieval and the recovery in the US economy continues leading to positive impact on other economies.1
9. The economic growth of developed countries, which stood at 1.6 percent in 2011, is projected to be 1.4 percent in 2012. Among the developed economies, the US growth is projected to be 2.0 percent in 2012 compared to a growth of 1.7 percent in the previous year. However, output of Euro zone is projected to decrease by 0.3 percent in 2012 compared to a growth of 1.5 percent in the previous year. The economic growth of emerging and developing countries stood at 6.2 percent in 2011, and it is projected to grow by 5.6 percent in 2012. The Indian economy that
1 World Economic Outlook Updates, July 16, 2012

Unofficial Translation of Monetary Policy for Fiscal Year 2012/13 3
grew by 7.1 percent in 2011 is projected to grow by 6.1 percent in 2012. Likewise, the Chinese economy that grew by 9.2 percent in 2011 is projected to grow by 8.0 percent in 2012.
10. Some improvement in world inflation is observed because of the impact of economic reform programs adopted after the global financial crisis. According to the IMF, the consumer price inflation of developed countries stood at 2.7 percent in 2011; it is projected to be 2.0 percent in 2012 and 1.6 percent in 2013. Similarly, the inflation rate of emerging and developing economies was 7.2 percent in 2011, and it is projected to be 6.3 percent in 2012 and 5.6 percent in 2013. Among the neighboring countries, India’s inflation, based on wholesale price index stood at 7.3 percent in June 2012 compared to 9.5 percent in corresponding period of last year while consumer price inflation of China stood at 3 percent in May 2012.
11. The emerging and advanced countries that had been adopting balanced monetary policy, based on the experiences from the financial and debt crises of the Western countries, started to readopt flexible monetary policy to address low rate of economic growth. The Reserve Bank of India reduced the cash reserve ratio from 5.5 percent to 4.75 percent in April 2012. Similarly, the central bank of China also lowered the cash reserve ratio by 0.5 percent to 20 percent recently. Controlling inflationary pressure seems to be difficult in the days ahead because of the adoption of liberal monetary policy by the developed and emerging economies, volatile price of crude oil in the international market and weakening of other currencies against the US dollar.
Domestic Economic Outlook
Domestic Product
12. The pace of economic growth of Nepal has been remained sluggish for many years. On the one hand, performance of agriculture sector, which contributes more than one third in the national economy, largely depends on monsoon and, on the other; the non-agriculture sector is also adversely affected by various structural bottlenecks. This reflects that the overall performance of the Nepalese economy is highly affected by non-economic factors. However, improvement in performance of agriculture sector due mainly to favorable weather condition and the policy initiatives for extending credit to productive sector contributed in maintaining the satisfactory performance of the overall economy.
13. According to the preliminary estimates of the Central Bureau of Statistics, the real gross domestic product (GDP) at basic price grew by 4.6 percent in FY 2011/12 compared to 3.8 percent last year. In the review year, the growth rates of agriculture and non-agriculture sector are estimated at 4.9 percent and 4.3 percent respectively. In the previous year, agriculture and non-agriculture sector grew by 4.5 percent and 3.4 percent respectively.
14. Last year, the better performance of agriculture sector was attributed to favorable weather condition along with the increased use of chemical fertilizer, improved seeds and technology. However, the adverse impacts of various structural bottlenecks including power and fuel shortage, political instability, among others,

4 Nepal Rastra Bank
constrained the growth rate of industrial sector in the review year. The improvement in the growth rate of service sub-sectors like hotel and restaurant; transport, storage and communication; health and social services contributed to the better performance of non-agriculture sector in the review year compared to the previous year.
15. In the review year, the growth rate of industrial sector is estimated at 1.7 percent compared to 2.9 percent in the previous year. With the sluggish performance of the real estate sector, the growth rate of construction sector is estimated to decline by 0.1 percent in the review year as against the growth rate of 4.8 percent in the previous year. In the review year, the growth rate of wholesale and retail trade is estimated at 3.8 percent compared to 1.2 percent in the previous year.
16. During the first eleven months of FY 2011/12, the number of tourist arrivals via air route increased by 19.3 percent compared to 21.1 percent in corresponding period of the previous year. With the continuing inflow of tourists, the growth rate of hotel and restaurant sector is estimated at 8.3 percent in the review year compared to 7.4 percent in the previous year.
17. In the review year, growth rate of transport, storage and communication sector is estimated at 6.8 percent compared to 5.7 percent in the previous year. The improvement in the growth performance of this sector is attributed to the expansion in network of telecommunication and internet services by Nepal Telecom and Ncell. Compared to the previous year, financial intermediation sector is estimated to have grown marginally in the review year.
18. Total consumption to GDP ratio is estimated to have dropped to 90.0 percent in FY 2011/12 compared to 91.4 percent in the previous year. Likewise, total investment to GDP is estimated to have increased marginally to 32.8 percent in the review year compared to 32.5 percent in the previous year.
Price
19. The rate of inflation moderated in FY 2011/12 as compared to the previous year on account of positive impact of moderate monetary expansion in previous year and decline in food inflation to single digit in current year from double digit during the last four years. The moderation in food inflation is attributed to favourable weather conditions leading to better crops and drop in food inflation in India. However, upward adjustment in petroleum prices and depreciation of Nepalese currency against US dollar caused non-food inflation to remain at the higher side.
20. The average inflation rate during ten months of FY 2011/12 had stood at 7.8 percent as compared to the annual average inflation rate of 9.6 percent in the previous year. The y-o-y inflation in mid-June of 2012 remained at 9.9 percent as against 8.8 percent during the same period of the previous year. As a result, the average inflation rate during the eleven months of 2011/12 has stood at 8 percent. In the review period, the inflation rate of food as well as non-food and services groups remained at 9.9 percent. Such rates were 14.3 percent and 4.3 percent respectively during the same period of the previous year.

Unofficial Translation of Monetary Policy for Fiscal Year 2012/13 5
21. The y-o-y wholesale price index has increased by 9.2 percent in mid-June 2012 as against 8.9 percent in the same period of the previous year. The wholesale price index of imported goods and domestic manufactured goods has risen by 11.9 percent and 6.6 percent respectively in the review period as compared to 9.7 percent and 11.7 percent respectively in the same period of the previous year. Similarly, the price index of agricultural commodities, which had increased by 7.6 percent previous year, has risen by 8.7 percent in mid-June 2012.
22. The salary and wages index has increased by 21.3 percent in mid-June 2012 as compared to 23.3 percent in the same period of the previous year. In review period, the salary index has increased by 19.3 percent, while the wage index has increased by 21.8 percent. In the same period of previous year, the salary index had remained unchanged and the wage rate index had increased by 30.7 percent.
23. Since the average price inflation for the eleven months in the current fiscal year has remained 8.0 percent, it seems challenging to keep the annual inflation rate within the target of 7.0 percent due to supply constraints, frequent price rise of petroleum products, continuous rise in wage rate and pressure from rising food prices in recent period. In addition, the prolonged political instability and lack of investment friendly climate have caused the productivity to decline. Hence, the role of monetary policy seems tough to control the inflation rate within desired level.
Government Finance
24. Despite timely announcement and implementation, government budget remained at significant surplus in FY 2011/12 due to low capital expenditure relative to resource mobilization.
25. During the review year, on cash basis, total government spending increased by 12.9 percent to Rs. 305.92 billion compared to an increase of 12.6 percent in the previous year. Out of total expenditure, recurrent expenditure stood at Rs. 231.79 billion while capital expenditure stood at Rs. 40.83 billion. Similarly, financial expenditure stood at Rs. 33.31 billion in the review year.
26. Resource mobilization of the Government of Nepal is estimated to have grown by 30.0 percent to Rs. 297.89 billion in FY 2011/12 compared to an increase of 10.6 percent in the previous year. Out of total resources, revenue collection is estimated to have grown by 22.2 percent to Rs. 244.15 billion. Import growth and the expansion of economic activities due to timely announcement of the budget for the FY 2011/12 contributed to such a growth in government revenue collection during the review year. In line with the budget provision, internal debt of Rs. 36.41 billion was mobilized by Government of Nepal in this year. As per preliminary estimate, government deposit with Nepal Rastra Bank stood at Rs. 31.77 billion in mid-July 2012.
External Sector
27. The overall balance of payments (BOP) recorded its highest ever surplus of Rs. 113.22 billion during the eleven months of FY 2011/12 due to the noteworthy

6 Nepal Rastra Bank
improvement in the external sector transactions. The overall BOP had witnessed a deficit of Rs. 335.6 million during the corresponding period of the previous year. The overall BOP surplus stood at its historic high during the review period mainly due to the improvement in world economic outlook, high surplus (Rs. 61.56 billion) in the current account arising from the amelioration in merchandise exports and inflows of remittances due to the depreciation of Nepalese rupee against the US dollar and surplus in the net services coupled with the substantial surplus (Rs. 15.15 billion) in the capital account.
28. Despite an improvement in the merchandise exports due to the persistent depreciation of Nepalese currency vis-à-vis US dollar during the review period, trade deficit could not be checked as expected due to an increase in the import volume and price of petroleum products and raw materials. Total trade deficit during the eleven months of FY 2011/12 reached Rs. 352.36 billion. The share of India in total trade deficit stood at 64.4 percent.
29. As a result of increase in exports to India and other countries by 16.7 percent and 15.6 percent respectively, the total merchandise exports increased by 16.3 percent during the eleven months of FY 2011/12. While exports to India had risen by 7.5 percent, exports to other countries could not rise during the corresponding period of the previous year. Total merchandise imports increased by 16.8 percent during the eleven months of FY 2011/12. Of the total imports, imports from India and other countries increased by 13.6 percent and 23.1 percent respectively. While imports from India had risen by 22.8 percent, imports from other countries declined by 16.8 percent during the corresponding period of the previous year. The export-import ratio decreased to 16.0 percent in the eleven months of FY 2010/11 from 16.1 percent during the corresponding period of the previous year due mainly to the high growth and big volume of imports compared to exports.
30. Total merchandise imports continued to increase in the last few years mainly due to the significant rise in the imports of petroleum products and gold. During the eleven months of FY 2011/12, the imports of petroleum products increased by 23.6 percent to Rs. 86.12 billion from Rs. 69.67 billion during the same period of the previous year. The share of petroleum products in total merchandise imports stood at 20.5 percent. Likewise, the imports of gold reached Rs. 22.82 billion during the eleven months of FY 2011/12 from Rs. 9.08 billion during the corresponding period of the previous year. Total imports, excluding gold and petroleum products, increased by 10.7 percent during the eleven months of FY 2011/12 compared to a growth of 11.3 percent during the corresponding period of the previous year.
31. Net service income which had witnessed an incessant deficit in the last few years recorded a surplus of Rs. 14.23 billion during the eleven months of FY 2011/12. The surplus in net service income arose primarily from the remarkable increment in tourism receipt and other income including reduction in the expenses of foreign currency on education and passport facility, among others.
32. Remittance income, which has been the main source of foreign exchange earnings since a decade and significantly contributing to the external sector transactions, surged by 39.6 percent to Rs. 320.38 billion during the eleven months of FY

Unofficial Translation of Monetary Policy for Fiscal Year 2012/13 7
2011/12 compared to a growth of 10.1 percent during the corresponding period of the previous year. In dollar terms, remittance income grow by 25.8 percent to US$ 4 billion in the review period from growth of 13.5 percent in corresponding period of last year in dollar terms. Remittance income increased significantly during the review period mainly because of sharp increment in the number of people going abroad for foreign employment, rise in the salary of workers in the destination countries and depreciation of Nepalese currency vis-à-vis the US dollar. The number of workers obtaining approval for foreign employment rose by 8.3 percent to 384,000 during the eleven months of FY 2011/12 compared to 355,000 during the corresponding period of the previous year. The major destinations for foreign employment have been Qatar, Saudi Arabia, Malaysia, United Arab Emirates and Kuwait.
33. The gross foreign exchange reserves rose during the eleven months of FY 2011/12 because of the significant rise in the BOP surplus. The gross foreign exchange reserves surged by 56.9 percent to Rs. 427.01 billion in mid-June 2012 from Rs. 272.15 billion as at mid-July 2011. Foreign exchange reserves increased by 25.6 percent to US$ 4.82 billion in mid-June 2012 from US$ 3.84 billion in mid-July 2011 in dollar terms. Based on the import trend of eleven months of the current fiscal year, the existing level of foreign exchange reserves is sufficient for financing merchandise imports of 11 months and merchandise and service imports of 10 months. Such reserve was sufficient for financing merchandise imports of 8.4 months and merchandise and service imports of 7.3 months during the corresponding period of the previous year.
34. Nepalese currency vis-à-vis the USD depreciated by 19.9 percent to Rs. 88.60 per USD as at mid-June 2012 from the level of mid-July 2011. In the context of fixed exchange rate of Nepalese rupee vis-à-vis the Indian currency, with the depreciation of the Indian rupee vis-à-vis the USD, the Nepalese rupee depreciated accordingly.
Financial Market
35. According to policy of this bank to promote merger and acquisition among BFIs, three finance companies have been merged into two commercial banks in FY 2011/12. With the merger of seven development banks and five finance companies with each other, six development banks were formed. In addition, letter of intent has been given by this bank to form one development bank and two finance companies with merger of one development bank and five finance companies with each other. As some other banks and financial institutions (BFIs) are also in the merger process, this activity is expected to accelerate in current fiscal year.
36. In FY 2011/12, two financial institutions have been upgraded. Three additional financial institutions comprising two "B" class development banks and one "D" class microfinance development bank have come into operation. Accordingly, as of mid-July 2012, the total number of institutions stood at 213 comprising 32 commercial banks, 88 development banks, 70 finance companies and 23 microfinance development banks. The number of such BFIs was 220 at mid-July 2011. The number of branches of commercial banks reached 1369 at mid-June

8 Nepal Rastra Bank
2012 whereas the number of branches of development banks, finance companies and microfinance development banks were 686, 331 and 550 respectively in mid-June 2012. The number of branches of commercial banks was 1098 as at mid-July 2011, whereas the number of branches of development banks, finance companies and microfinance development bank had stood to 495, 281 and 425 respectively in mid-July 2011. On the basis of the number of branches as of mid-June 2012, each branch has covered approximately 9000 people on the average.
37. In addition to BFIs licensed by NRB, there is an enormous presence of the saving and credit cooperatives established under the Cooperative Act, 1992. As per the latest data from Department of Cooperatives, the number of saving and credit cooperatives reached 11,392 in mid-April 2012. They have mobilized Rs. 101.1 billion savings and disbursed Rs. 96.2 billion as loan till mid-April 2012.
38. A provision of interest free loan up to Rs. 5 million and Rs.10 million to BFIs for opening a branch in district head quarter and outside district headquarter of 22 remote districts specified by the GoN has been made for a specified period to enhance financial inclusion through expansion of financial institutions in areas where there is lack of access to finance. Similarly, provision has been made to provide interest free loan up to Rs. 1.5 million for class “D” financial institutions on extending their financial services by opening a new branch in the 9 specified districts with limited financial access. Under this provision, Rs. 60.65 million has been provided to BFIs comprising Rs. 40 million to five commercial banks for their seven newly opened branches, Rs.2.5 million to two development banks for their three newly opened branches and Rs. 1.5 million to one microfinance development bank for a new branch opened in FY 2011/12 compared to Rs. 150 million to six commercial banks and five development banks in FY 2010/11.
39. Policy provision has been introduced, with the motive of enhancing public confidence towards the financial system, for insuring deposit up to Rs. 2,00,000 of small and medium size depositors. Deposit amounting Rs. 194 billion of 6.9 million depositors have been insured till mid-April 2012 from 193 BFIs that comprises around 35 percent of total individuals’ deposits.
40. Despite a slowdown in real estate and capital market, the non-performing loan (NPL) of BFIs has increased marginally due to improved policies on credit expansion and its recovery. The NPL of commercial banks, which was 3.2 percent in mid-July 2011, reached 3.5 percent in mid-April 2012. The NPL of Nepal Bank Limited and Rastrya Banijya Bank Limited which were under Financial Sector Reform Program stood at 5.9 percent and 10.6 percent respectively in mid-April 2012. The NPL of these two banks were 5.3 and 10.9 percent respectively in mid-July 2011.
41. Legal action against willful defaulters accessing loan more than Rs. 10 million will be made more effective to improve quality of loan and advances of BFIs. With the coordination of GoN, the essential procedure has been prepared in order to bring within legal framework those borrowers not investing borrowed fund in specified sectors and registering dummy firm to borrow against it as well as not repaying the

Unofficial Translation of Monetary Policy for Fiscal Year 2012/13 9
loan willfully. It is expected that this will help to strengthen financial sector stability along with reducing the NPL of BFIs in the days ahead.
42. A policy provision has been made that promoters, chief executive officers or managerial level officials of licensed institutions are barred from borrowing any personal loan except education loan, over draft loan, home loan or home appliance loan from any licensed institutions to avoid systemic risk arising from conflict of interest of banker and entrepreneur.
43. The short-term and long term interest rates remained at lower level in FY 2011/12 compared to the previous year due to improved liquidity situation as a result of elevated growth of deposit mobilization of BFIs. The weighted average 91-day Treasury bill rate declined to 1.3 percent in FY 2011/12 compared to 7.4 percent in the corresponding period of the previous year. The weighted average inter-bank rate declined to 1.3 percent in FY 2011/12 compared to 8.4 percent in the corresponding period of the previous year.
44. Development bond amounting to Rs. 14 billion was issued though auction in FY 2011/12 comprising of Rs. 3.5 billion with maturity of 2 years, Rs. 6.5 million with maturity of 3 years and Rs. 4 billion with maturity of 4 years. The coupon rate of the 4-year and 3-year maturity bonds was 8.5 percent and coupon rate of the 2-year maturity bonds was 8.0 percent. However, the bidding rate of interest of these bonds was about 4-5 percent.
45. Considering the probability of erosion in investors' confidence and adverse impact on economic stability from fluctuation in share prices, liberal policies have been initiated by NRB relating to loan renewal and margin call. Accordingly, loan against share could be extended based on average share price of last 180 days or latest market price whichever was lower by BFIs would determine margin themselves to minimize the risk while extending such loans. A positive sign has been seen in the capital market after implementation of this provision. So, a measuring rod of the capital market, NEPSE index, bounced back to 389.7 point in mid-July 2012 which was 362.9 point in mid-July 2011.
46. Provision has been made under which credit can be extended on the guarantee of broker and on the basis of share sale/purchase bill, with appropriate margin, for maximum period of one year by BFIs by changing existing provision of pledging original share certificate to access such type of loan.
47. A provision has been made whereby licensed “A”, ”B” and “C” class BFIs could establish a subsidiary company with at least 51 percent ownership for mutual fund or merchant banking activities after approval from Nepal Stock Exchange Ltd and following existing policy provisions on investment.
48. The market capitalization on y-o-y basis increased by 30.0 percent to Rs. 344 billion in mid-June 2012 which stands at 25.2 percent of GDP. Of the total, the market capitalization of BFIs accounted for 69.2 percent; manufacturing and processing sectors 3.4 percent; hotels 1.9 percent; business entities 0.3 percent; hydropower 4.9 percent; and other sectors 20.3 percent.

10 Nepal Rastra Bank 49. Some positive signals have been observed in real estate business because of
policies adopted by this bank for sustainable improvement of this sector. NRB already had raised the ceiling for individual residential home loan up to Rs. 10 million from existing ceiling of Rs. 8 million. The time limit to bring down the real estate loan to 25 percent by BFIs has been extended by one more year to mid-July 2013. Real estate borrowers are allowed for renewal of such loan up to mid-July 2013 upon the payment of all interest dues.
Monetary Situation 50. In the context of increasing share of development banks and finance companies in
banking sector transaction, broad monetary survey has begun to be prepared by incorporating the balance sheet of development banks and finance companies in addition to balance sheet of NRB and commercial banks since the fourth month (mid-November 2011) of FY 2011/12. Since this survey incorporates net deposit and credit of the banking sector after netting out inter-bank deposit as well as lending, the measurement of liquidity situation of the financial sector has become more realistic.
51. As per the broad monetary survey, broad money supply, an important indicator of the monetary liquidity, increased by 17.9 percent in the eleven months of FY 2011/12 compared to the growth of 8.5 percent in the corresponding period of the previous year. Broad money has expanded during the review period on account of remarkable increase in NFA led by high BOP surplus. Broad money supply is estimated to have increased by 22.5 percent by the end of FY 2011/12 on account of increased government expenditure and high BOP surplus towards the end of the fiscal year as compared to the initial target of 12.5 percent.
52. The total domestic credit increased by 6.0 percent in the eleven months of FY 2011/12 as compared to initial annual estimate of 13.7 percent. Low level of government spending compared to resource mobilization led to cash balance of government amounting to Rs. 31.77 billion. It caused reduction of claims on government. The slower growth in domestic credit is also attributed to lower growth of private sector credit on account of BFIs’ hesitation to extend credit in new areas instead of traditional ones, continuation of high lending rate despite comfortable liquidity situation and compliance pressure on sectoral credit ceiling by BFIs. However, the growth of domestic credit is estimated to have increased by 10 percent by the end of the year as a result of acceleration in government expenditure and improvement in private sector credit toward the end of the year.
53. In eleven months of FY 2011/12, claims on private sector increased by 11.6 percent compared to 14.5 percent in the corresponding period of the previous year. It is estimated to have increased by 12.5 percent at the end of the review year on account of improvement of credit-deposit ratio of BFIs and decreasing trend of lending rate.
54. The reserve money increased by 20 percent in eleven months of the FY 2011/12 compared to an increment of 2.6 percent in corresponding period of the previous

Unofficial Translation of Monetary Policy for Fiscal Year 2012/13 11
year. In the review period, though the NRB's claims on government and BFIs decreased, surge in growth of reserve money is due to increased NFA contributed by high BOP surplus.
55. The deposit mobilization of “A”, ”B” and “C” class BFIs increased by 18.2 percent (Rs. 149.92 billion) in eleven months of FY 2011/12. In the corresponding period of the previous year, such deposit had increased by only 8.9 percent (Rs. 64.63 billion). In the review period, deposit mobilization remained favorable due to increased flow of remittance, acceleration in economic activities and strengthened public confidence on BFIs.
56. In the eleven months of the review year, deposit mobilization of commercial banks and developments banks increased by 20.4 percent and 24.3 percent respectively whereas the deposit mobilization of finance companies could not increase. In the corresponding period of the previous year, the deposit mobilization of commercial banks, development banks and finance companies had increased by 4.8 percent, 14.3 percent and 9.9 percent respectively. The major factors behind the stagnation in deposit mobilization of finance companies are reduction in the number of finance companies due to merger of some finance companies with development banks and change in institutional deposit policy.
57. In the eleven months of FY 2011/12, loans and advances of BFIs increased by 14.1 percent (Rs. 120.14 billion), the same rate as that in the corresponding period of the previous year. Loans and advances of commercial banks and development banks increased by 16.9 percent and 17.9 percent respectively while that of finance companies decreased by 1.7 percent during the review period.
58. In the eleven months of FY 2011/12, private sector credit from BFIs increased by 10.3 percent (Rs. 71.50 billion) compared to a growth of 13.6 percent (Rs. 82.38 billion) in the corresponding period of previous year. During the review period, credit extended by commercial banks and development banks increased by 14.0 percent and 8.3 percent respectively while that of finance companies dropped by 10.5 percent. Credit extension by finance companies decreased in the review period due to the decline in the number of institutions and the need to bring improvements in the high credit to deposit ratio.
59. Policies adopted by NRB to channelize credit to productive sectors like agriculture; energy etc. by reducing credit to unproductive sectors have begun to show positive results. Accordingly in the first eleven months of FY 2011/12, banks' credit to agriculture sector increased by 60 percent to Rs. 22.70 billion as against a decline by 15.7 percent in the corresponding period of the previous year. Credit to construction sector increased by 17.4 percent in eleven months of review year as compared to a growth of 5.7 percent in the corresponding period of the last year. Similarly, credit to industrial production sector increased by 22.8 percent, wholesale and retail trade by 13.6 percent and transportation, communication and public services by 18.6 percent during the review period.

12 Nepal Rastra Bank 60. Liquidity ratio of BFIs has improved in the review period. Liquid assets /deposit
ratio of BFIs increased to 32.5 percent in mid-June 2012 from 30.6 percent in mid-July 2011.
Liquidity Management 61. BFIs remained in comfortable liquidity position in FY 2011/12. This position was
mainly due to continuous increase in deposit mobilization of commercial banks and development banks arising from the impressive growth in export, remittances inflow, net services income and capital transfer as well as slowdown in credit expansion. The liquidity situation also improved due to surge in government expenditure at the end of the review period. Apart from this, policies adopted to bring informal financial transactions into formal channel and improved economic growth were also responsible for deposit growth of the BFIs. This has created favorable situation for BFIs to maintain the required credit-deposit ratio as per this bank's directives and to extend credit by lowering lending rate.
62. To avoid systemic risk on payment system, NRB has been providing liquidity to BFIs facing liquidity problem due to systemic and structural reasons through open market operation, lender of last resort facility, refinance facility and standing liquidity facility. In addition, macro prudential regulations are also put in place to address problems associated with weak balance sheet and structural liquidity stress emerging from assets and liabilities mismatch.
63. NRB has been using open market operations as the main instrument to manage liquidity in the banking system. Liquidity is managed through open market operations on the basis of liquidity indicated by weekly liquidity monitoring and forecasting framework. NRB mopped up net liquidity of Rs. 7.66 billion through open market operations in FY 2011/12 of which Rs. 8.40 billion was mopped up through outright sale auction and Rs. 0.74 billion was injected through repo auction.
64. Standing liquidity facility (SLF) of Rs. 5.57 billion was provided to BFIs to support their short term liquidity management in FY 2011/12. In the review year, development banks and finance companies were provided Rs. 57.60 million and Rs. 2.07 billion respectively under this facility.
65. Commercial banks have been primarily using inter-bank transactions for their short-term liquidity management. Total inter-bank transaction of commercial banks stood at Rs. 212.77 billion in FY 2011/12. For further easing of liquidity management through inter-bank transactions, continuity has been given to prevailing provision under which "A”, "B” and "C” class licensed institutions could involve in inter-bank transactions among each other against good loan or any other acceptable collateral under specified conditions. However, such loan and advances from inter-bank transaction can only be used for short term liquidity management and for making payment to depositors. This provision is helpful to manage systemic liquidity problem and to reduce risk related to inter-bank transactions.

Unofficial Translation of Monetary Policy for Fiscal Year 2012/13 13
66. NRB has been selling/purchasing foreign exchange to maintain exchange rate stability and to facilitate liquidity management. NRB injected liquidity of Rs. 258.28 billion through the purchase of USD 3.19 billion from commercial banks in FY 2011/12. It had injected Rs. 174.30 billion through the purchase of USD 2.41 billion in the previous year. Similarly, NRB purchased INR 133.72 billion from Indian market through the sale of USD 2.66 billion.
67. In FY 2011/12, NRB provided general refinance facility amounting to Rs. 868.6 million to BFIs against the collateral of good loan to increase credit to productive sector. The outstanding amount of such refinance as at mid-July 2012 stood at Rs. 331.9 million. This facility was used by two commercial banks and a finance company in the review period. Productive sector credit has been gaining momentum from the fund available from this facility. Similarly, NRB provided Rs. 1.28 billion refinance to hydropower projects in FY 2011/12 of which outstanding amount was Rs. 406 million at mid-July 2012.
68. If the loan issued by licensed BFIs is guaranteed from Deposit Insurance and Credit Guarantee Corporation or if it is insured from other parties, the provision has been made to make loan loss provision of only 25 percent with an exemption of remaining 75 percent.
69. If any BFIs used refinance for the hydro power projects of up to 25 MW, the amount used in that period could be accounted in the source for the purpose of credit-deposit ratio. Likewise, if BFIs accessed long-term credit in foreign currency for the period of five years or more then such long-term loan can be accounted in the source for the purpose of credit-deposit ratio.
70. Considering the fact that foreign currency balance with BFIs has not been used for national priority projects like hydropower and infrastructure development and is invested in the foreign instruments with low interest rate, a provision has been made that BFIs could provide credit in foreign currency to hydropower related projects and make investment in different instruments issued in foreign currency after obtaining NRB's approval.
Monetary Policy and Financial Sector Program of 2012/13 71. Monetary policy for FY 2012/13 is formulated on the basis of analysis of current
situation of domestic economy and financial sector, international economic outlook and policies and programs adopted by government of Nepal for overall economic stability and achieving targeted economic growth. The policy stance, targets, monetary instruments and programs have been set with the central focus on maintaining monetary and financial stability, and increasing financial access among others.
Monetary Policy Stance
72. Despite some improvements on inflation last year, tight monetary policy is essential to control possible inflationary pressure in the days ahead arising from monetary

14 Nepal Rastra Bank
expansion of last year, instability on price of petroleum product and devaluation of Nepali currency with US dollar. On the other hand, at this juncture of improved real effective exchange rate of Nepalese currency and record high BOP surplus and comfortable foreign currency reserve, loose monetary policy is equally important for achieving high economic growth through credit expansion and boosting economic activities. Cautious and balanced policy stance has been adopted by remaining vigilant about possible inflationary pressure from expansionary monetary policy and contraction in economic growth from contractionary monetary policy.
73. Financial sector stability is essential for monetary stability. Monetary policy is concentrated towards qualitative improvement in balance sheet and governance of BFIs through necessary revision and effective implementation of macro prudential regulation along with early warning system, prompt corrective action, risk based supervision, stress testing, and contingency planning. Monetary policy will play an active role on enhancing public confidence towards BFIs by encouraging their merger and by promptly resolving their liquidity and payment problems arising from poor corporate governance.
74. In the context of majority of people being out of access to formal financial services, promotion of financial access to general public is a major concern of monetary and financial policies. A policy of encouraging establishment of 'D' class financial institutions and branches of BFIs in inadequately banked areas has been continued. Similarly, expansion of branchless banking service has also been encouraged. Besides, monetary policy has been oriented to enhance financial literacy and to increase the credit to deprived sector.
75. Competitiveness of Nepalese products has been increasing in international market due to improvement in real effective exchange rate in later period. In such scenario, monetary policy is directed towards attaining external sector stability by reducing trade deficit via export promotion by availing credit to export oriented industries in domestic as well as foreign currency. Likewise, with comfortable position of foreign currency reserve at present, policy relating to foreign exchange facilities has been made simplified to facilitate the foreign trade. Besides, additional flexibility has been adopted in use of foreign currency deposits of Nepalese citizens to encourage such savings.
76. Saving and investment are affected and monetary policy transmission mechanism is weakened due to high fluctuation in short term interest rate, low rate of interest, weak interrelationship of short term interest rate with deposit and lending rate, negative real interest rate on saving and high spread in lending and deposit in the latter period. The short term interest rate, therefore, needs to be contained within certain band to enhance the effectiveness of monetary policy by interest rate stability and transparency. Similarly, lending rate needs to be determined on the basis of certain criterion by BFIs. Considering this fact, a base rate system will be introduced in lending and process of implementing interest rate corridor will gradually be initiated in order to stabilize short term money market rates within certain band.

Unofficial Translation of Monetary Policy for Fiscal Year 2012/13 15
77. Expansion of credit to productive sector and its proper use could be helpful to achieve monetary goal through output growth. In the current favorable liquidity situation in the banking system, along with general instruments, the monetary policy has emphasized on refinance facilities and sectoral credit instruments for credit expansion to productive sector by BFIs.
Economic and Monetary Objectives 78. The monetary policy for FY 2012/13 has set the target of attaining economic
growth of 5.5 percent, limiting inflation at 7.5 percent and maintaining foreign exchange reserves sufficient to cover imports of goods and services of at least eight months. In addition, to ensure adequate credit flow broad money growth will be maintained at 15 percent. In the context of fixed exchange rate of Nepalese rupees with Indian currency, exchange rate has been taken as intermediate target to achieve monetary policy objectives. Excess liquidity estimated by this bank using Liquidity Monitoring and Forecasting Framework (LMFF) and private sector credit from BFIs are taken as operating targets of monetary policy. The intermediate target and operating target of monetary policy will be reviewed by considering newly developed monetary theories and practice of different countries.
79. Achieving targeted inflation from monetary policy implementation is tough since Nepalese inflation is affected by Indian price and non-monetary factors. Monetary control and conducive supply sides are essential for achieving targeted inflation. Despite preliminary estimate of lower agricultural growth, higher growth of government capital expenditure and improvement in supply side from industrial and service sector growth due to improved labour relation and supply of electricity is expected to have positive impact on controlling inflation.
80. The field work of household budget survey which provides input for updating weights to make consumer price index more realistic will be completed within this fiscal year.
81. Foreign exchange reserve target is set on the basis of preliminary estimation of sources of foreign exchange income and trend of expenditure, especially no deterioration on competitiveness of export, normal expansion of trade deficit and expected remittance growth at the average rate of last few years.
82. Total domestic credit is projected to increase by 16.0 percent in 2012/13. Private sector credit by BFIs is expected to increase by 16 percent in FY 2012/13 as compared to 12.5 percent in FY 2011/12. This level of private sector credit growth is expected to be supportive for achievement of 5.5 percent of economic growth. Credit to government from banking sector for FY 2012/13 is projected to grow by 15.8 percent by considering government total expenditure and mobilization of domestic debt.
83. On the basis of likely positive impact of targeted economic growth and BOP surplus on deposit mobilization, the total deposits of BFIs is projected to increase by 15.1 percent to about Rs. 1160 billion in 2012/13.

16 Nepal Rastra Bank
Monetary Policy Instruments
84. Considering the likely impact of higher money growth of last year in current year, monetary instruments and regulatory measures will be effectively implemented to keep monetary expansion within the limit.
85. Open market operations will be used as major instruments for monetary policy implementation based on the status of policy targets, liquidity situation and its projection. The use of instruments such as repo and reverse repo for short term liquidity management and outright sales and outright purchase for medium term liquidity management will be continued.
86. Bank rate has been redefined by specifying its use so as to make it an effective instrument of money market. Provision has been made to use bank rate for lender of last resort (LOLR) facility and discounting government securities. Bank rate is set at 8 percent for now. New provision has been made to provide standing liquidity facility (SLF) at the bank rate. The existing provision of determining rate by adding 3 percentage penal rate on weighted average of 91-days treasury bills rate or prevailing bank rate, whichever is higher, has been repealed. Subject to economic and financial indicators, bank rate will be changed for making it an effective instrument in the implementation of monetary policy.
87. To encourage credit flow to productive sector, general refinance rate is reduced to 6 percent from existing rate of 6.5 percent in agriculture and hydropower and 7 percent on other specified productive sector. This facility will be available for the maximum period of 6 months against good loans of BFIs. BFIs shall not charge more than 9.0 percent from clients.
88. Provision has been made to provide refinance facility to BFIs at 6 percent for providing credit to farmers having land as well as having no land to generate income and employment through promotion of milk and meat related business. BFIs shall not charge more than 9.0 percent from clients.
89. Special refinance rate applicable to sick industry, small and cottage industry, export and foreign employment of specified class of people is maintained at 1.5 percent. Base of special refinance facility will be widened by making provision of such loans to women entrepreneurs in specified areas and operational modality will be simplified. While utilizing this facility, BFIs shall not charge more than 4.5 percent from concerned clients.
90. Refinance rate on export credit made available to the commercial banks in foreign currency will be determined by adding 25 basis points to prevailing Libor as earlier and simplification will be made on such provision.
91. Commercial banks, development banks and finance companies should maintain deprived sector lending at 4 percent, 3.5 percent and 3 percent respectively in current fiscal year in line with the policy provision of gradually increasing deprived sector lending by BFIs over the next three years.
92. Considering improved liquidity situation and rapid growth of money supply, cash reserve ratio (CRR) to be maintained by BFIs has been revised as 6 percent for “A”

Unofficial Translation of Monetary Policy for Fiscal Year 2012/13 17
class financial institutions, 5.5 percent for “B” class financial institutions and 5 percent for “C” class financial institutions from existing 5 percent to all categories. Penal rate on noncompliance of CRR has been changed as bank rate for the first time, one and half times bank rate for second time and double the bank rate for third or more times. Other policy provisions relating to it has not been changed.
93. The provision of statutory liquidity ratio (SLR) which provide with an automatic adjustment of liquid asset in asset portfolio along with growth of deposit of BFIs has been continued.
94. In addition to commercial banks, development banks and finance companies will also be included in LMFF for monitoring and forecasting excess liquidity. Daily returns like deposit, credit, cash reserve and interbank rate of commercial banks, development banks and finance companies will be used in monitoring liquidity situation by collecting such returns daily from those institutions. Earlier, daily returns of only commercial banks were used for this purpose previously.
95. Maximum period of repo and reverse repo auction is reduced to 28 days from existing 45 days by considering the comfortable liquidity situation of money market. Conduct of repo and reverse repo auction against the collateral of development bonds in addition to treasury bills will be continued.
96. Maximum maturity period of interbank transaction among commercial banks, development banks and finance companies is set at 7 days.
97. Online bidding system will be initiated on auction of treasury bills and development bond. Feasibility study will be conducted to activate secondary market of government securities.
Financial Sector Reform, Regulation and Supervision 98. The tenure of financial sector reform program initiated in FY 2002/03 and carried
out under the financial assistance of World Bank, Department for International Development and Government of Nepal has been terminated. At this juncture, the financial sector reform programs will be pushed forward for further improvement by consolidating previous achievements. In this process, initiative will be taken in the following issues and areas: (a) strengthening the capital base of BFIs, (b) promoting financial access to general public by extending financial services., (c) implementing risk based supervision system (d) enhancing regulatory and supervisory capacity to monitor information and technology based financial transactions, (e) coordination with other regulatory authorities associated with financial sector in addition to BFIs for financial sector stability, (f) enhancing corporate governance of BFIs, (g) maintaining effective demarcation between banker and entrepreneur/industrialists, (i) timely amendment of act, bylaws and licensing policies, (j) enhancing financial intelligence for transparency in financial transaction and (k) maintaining financial discipline.
99. In the current context of comfortable liquidity situation in the economy, the following actions will be carried out to utilize the situation for productive purpose:

18 Nepal Rastra Bank
(a) necessary adjustments on macro prudential regulatory measures will be made including credit-deposit ratio, (b) initiative will be taken to promote investment in national priority sector by mopping up short term liquidity through long-term instruments making necessary coordination with government of Nepal, international agencies and BFIs to facilitate issuance of long term bond in domestic currency and development of secondary bond market, and (c) the concept of base rate will be implemented to maintain lending rate at an appropriate level.
100. Recapitalization will be carried out in fully state-owned Rastriya Banijya Bank Limited and partially owned Nepal Bank Ltd., which have negative capital. It is expected that competitiveness of those banks will be enhanced through capital improvement and it will contribute to overall financial stability.
101. Moratorium of licensing to commercial banks, development banks and finance companies has been continued. This resolution shall not be applicable for those special financial institutions contributing to national priority sectors such as agriculture, energy and infrastructure development.
102. Licensing to class "D" financial institutions will be continued in order to enhance financial access and financial inclusion. Priority will be given for establishment of "D" class financial institutions in those rural areas where financial access is poor. Low operational cost banking providing modern technology based mobile banking and branchless banking services will be encouraged to enhance financial access in rural areas.
103. Both the number of BFIs and the share of banking transaction are highly concentrated in Kathmandu valley. According to a study recently conducted by this bank, the share of Kathmandu valley in total deposit and outstanding credit of BFIs stood at 60 percent and 44 percent respectively. In this context, provision to allow opening a branch in Kathmandu valley by commercial banks and national level development banks only after opening two branches including at least a branch in the specified districts where the presence of banks is low has been continued. Existing policy provision regarding opening branches abroad by domestic banks and permitting foreign banks to open their branches in Nepal will be reviewed.
104. The provision of providing interest free loan for a specified period to commercial banks and national level development banks to expand their branches in the specified regions will be reviewed and such loan facility will be provided for opening branches in thereafter listed regions with low intensity of BFIs.
105. Current provision of establishing "D" class microfinance subsidiary company by commercial banks, development banks and finance companies with their 51 to 70 percent ownership to provide deprived sector lending, will be reviewed to allow establishing of such subsidiary companies only in the specified geographical regions having low financial access.
106. BFIs will be encouraged for merger and acquisition in order to raise their capital base and enhance capacity. Especially for financial stability and corporate governance, merger and acquisition of BFIs promoted by the same group will be

Unofficial Translation of Monetary Policy for Fiscal Year 2012/13 19
made more effective. Necessary action will be taken to introduce policy for acquisition of assets by BFIs.
107. With an objective of enhancing financial access to the deprived sector people, five rural development banks are in operation. Merger and acquisition of rural development banks will be completed in order to raise their capital base and strengthen their capacity to extend their financial services to deprived sector.
108. Non-government organizations licensed by Nepal Rastra Bank for financial intermediation will be awarded opportunity to upgrade as microfinance development bank within stipulated time frame.
109. BFIs will be required to publish base rate calculated as per NRB guideline. This will enhance transparency on lending operations and strengthen monetary policy transmission mechanism. BFIs could determine their lending rate based on base rate after implementation of this provision. This is expected to increase transparency and competitiveness in the determination of lending rate by BFIs.
110. Since interest spread reflects efficiency and competitiveness of financial intermediation, it will be regularly monitored and steps will be taken for its correction in case it is observed above the desired level. After implementation of the base rate concept in lending rate, its monitoring would be easier.
111. For inclusive financial system, good governance and balanced development in financial sector through increased financial literacy among people of various communities and general public, various public awareness programs will be initiated as well as a national financial literacy policy will be formulated by examining current status of financial literacy and their problems.
112. Financial sector development strategy will be formulated in order to develop inclusive financial system that reflects collective vision of all stakeholders about the future trend of the financial sector.
113. An amended draft of Nepal Rastra Bank Act, 2002 will be submitted to the Government of Nepal for making the role of Nepal Rastra Bank more effective. Initiation will be taken for cabinet approval of Bank and Financial Institutions Act, 2006, submitted to the parliament of that time.
114. In line with the policy of gradually increasing threshold of deposit guarantee limit to Rs. 5,00,000 for protecting the interest of small depositors, the threshold will be increased to Rs. 3,00,000 in FY 2012/13.
115. Work plan submitted by BFIs to increase productive sector lending to 20 percent of loan especially in agriculture, energy, tourism, small and medium enterprises will be effectively monitored.
116. With the continuation of policy of encouraging the credit flow of BFIs in the productive sector, agricultural sector will be redefined to incorporate the agricultural tools, fertilizers, seeds, animal feeds, irrigation and storages and specified agriculture processing which directly foster the agricultural production.

20 Nepal Rastra Bank 117. A provision will be made to account fund borrowed from Government of Nepal or
international financial institutions for three or more than three years to carry out specified credit program in resource mobilization.
118. A provision has been made to arrange separate desk in BFIs to increase credit in small and medium enterprises (SMEs) and to enhance financial access including its effective monitoring. In coordination with programs adopted by government, the necessary credit for SMEs will be expediently managed. An appropriate mechanism will be formed to coordinate among commercial banks, development banks and microfinance development banks to provide credit in excess of microcredit limit to entrepreneurs who have successfully run the business by taking credit from microfinance development banks if they want to extend their businesses.
119. Industries have not been established as expected since the last few years. At the same time, some industries have turned sick and some have been shut down due to various reasons. In this context, the loan restructuring and other facilities will be reviewed as per the recommendations of high level committee for the upliftment of sick industries.
120. Necessary regulation will be issued for minimizing risk associated with multiple banking transactions by effective arrangement of credit information system including pari-pasu.
121. Guidelines on Internal Capital Adequacy Assessment Process (ICAAP) would be introduced to address risk identified by BASEL II and inherent risk associated with individual banks.
122. A new capital standard based on BASEL II and existing capital standard that have been implemented on a parallel basis for national level development banks since last year has been continued.
123. In the process of transition form compliance based inspection and supervision system to risk-based supervision, necessary revisions will be made in directives, bylaws and guidelines related to inspection and supervision.
124. In the process of gradually implementing risk based supervision and inspection system, more risky banks, sectors and instruments will be identified and additional resources including human resource and time will be devoted towards them. Accordingly, supervision time interval will also be reviewed.
125. Enhancing and strengthening supervisory capacity of NRB has been initiated with assistance of international agencies such as the IMF and World Bank. In this regard, 20 BFIs will be selected on the basis of risk management, corporate governance, connectivity and exposure to real estate sector for diagnostic review during the current fiscal year.
126. Early Warning System (EWS) will be developed and implemented with the technical assistance of IMF in order to trace out probable risk of BFIs and adopt corrective policy measures on time.

Unofficial Translation of Monetary Policy for Fiscal Year 2012/13 21
127. Necessary revisions will be made in Problem Bank Resolution Operational Manual and Toolkit prepared with the technical assistance of World Bank and implemented accordingly for the improvement of problematic BFIs in a phase-wise manner.
128. The current provision of Prompt Corrective Action (PCA) based on capital will be broadened in FY 2012/13 by incorporating liquidity and non-performing assets. The provision is expected to facilitate in developing a more sound, reliable and safe financial system.
129. BFIs mobilizing deposits exceeding two billion Nepalese Rupees shall have to conduct their own stress test based on Stress Testing Guidelines of NRB and shall have to submit report to this bank on a regular basis from this year. Likewise, liquidity monitoring framework will be prepared and implemented in the process of adopting forward-looking approach in inspection and supervision.
130. With a view to conduct inspection and supervision of information technology of BFIs in a structured form, an information technology guideline will be implemented. Further, a provision of mandatory system audit for BFIs will be adopted with the objective of identifying and measuring inherent risk of information technology of BFIs.
131. In order to make the supervisory functions of Nepal Rastra Bank more effective, off-site supervision will be strengthened by timely updating the information received from BFIs. More priority will be given to the asset quality test through conducting on-site inspection of big borrowers' collateral and projects in the process of on-site inspection.
132. A draft of Micro-finance Authority Act has already been submitted to the Government of Nepal for the establishment of microfinance authority. All necessary works will be put forward to set up a micro-finance authority as a regulatory institution for the regulation, inspection and supervision of micro-finance institutions.
133. Timely revisions will be made in the directives issued to BFIs carrying micro-finance activities so as to strengthen and promote stability of these financial institutions as well as ensure protection of stakeholders' interests.
134. A separate unified directive will be issued to micro-finance development banks to facilitate an effective and efficient on-site inspection and off-site supervision of these institutions. Further, inspection directives will be prepared and issued to non-governmental institutions licensed for operating financial intermediation. Similarly, a revision will be made on directives issued to cooperatives licensed for limited banking.
135. In the context of adopting financial stability as one of the major objectives of monetary policy, a separate Financial Stability Unit (FSU) will be set up to carry out regular study of the status and challenges of the financial sector. The FSU will publish financial stability report by analyzing the status, trend, probable risks and challenges of financial stability.

22 Nepal Rastra Bank 136. For enhancing financial discipline and transparency, Financial Information Unit
(FIU) will be further strengthened along with effective detection of financial crime by analyzing financial information in coordination with concerned stakeholders.
137. Provision will be made to submit Permanent Account Number (PAN) to BFIs by borrower accessing more than certain loan facility.
138. In the context of further modernizing Currency Management Department, a Currency Verification and Processing System (CVPS) and Shredding and Briquetting System (SBS) will be implemented for making soiled note destroying activity more systematic and environment-friendly.
139. Clean Note Policy, initiated in FY 2010/11, will also be continued in this fiscal year and note-sorting standard will be implemented in order to make Clean Note Policy more effective.
140. With a view to manage and simplify the payment system, measures like financial institutions' access to currency chest, expansion of facilities and modernization of the payment system will be carried out.
Foreign Exchange Management 141. A provision will be made to allow the commercial banks, provided that they do not
face any adverse liquidity condition, to invest up to 30 percent of their balance kept in the agency banks in the instruments such as call deposit, certificate of deposit or such other instruments having low risks and the maturity period not exceeding 2 years.
142. An arrangement will be made to provide exchange facility to the firms/companies against foreign bank guarantee if they need partial or full payment in advance for importing goods and services (including lease) against the payment of the convertible currencies, in equivalent amount on the basis of the foreign bank guarantee.
143. With the aim of providing foreign currency loan to exporters of readymade garments, carpet, pashmina, handicrafts and other products which earn foreign currencies, a refinancing will be provided to the commercial banks at the same day of granting credit for pre-shipment or post-shipment credit by them to such exporters.
144. Existing provision of providing foreign currency pre-shipment credit will be simplified so that such credit will be provided on the basis of the documents related to the agreements between the importer and exporter.
145. The existing ceiling of foreign exchange facility of USD 25,000 for one-time import payment to third countries (excluding India) through draft/TT has been increased to USD 30,000.
146. The existing ceiling of providing exchange facility equal to USD 6,000 to the individuals and organizations for different purposes on the basis of the necessary documents from the licensed BFIs has been increased to to USD 10,000. The use of such facility will be monitored strictly.

Unofficial Translation of Monetary Policy for Fiscal Year 2012/13 23
147. Foreign exchange facility up to INR 3 million will be made available from commercial banks to the Nepalese and foreign organizations/companies registered in Nepal and approved to do business for the payment to India based organization/companies on the basis of agreement/understanding for the access of different services.
148. Additional items will be added with rationale in the list of goods that can be imported from India against the payment of convertible foreign currency.
149. In the course of importing industrial raw materials from Indian industries against the payment of the convertible foreign currency, a provision will be introduced so that payment in foreign currency can be made to the sole agents if the producers of such raw materials have appointed a sole agent for direct sale of their production, provided that such goods are imported through them.
150. The existing policy of providing exchange facility for the freight charges in Indian currency while importing goods from India will be simplified.
151. The existing provision of foreign exchange facility on passport for only two times in a fiscal year to Nepalese citizens going abroad (excluding India) through private and formal way will be changed. As per the new provision, foreign exchange facility up to USD 2,500 will be provided each time. However, Nepalese citizens going abroad for trade promotion, trade fairs and trade workshops will be provided foreign exchange facility up to USD 5,000 each time as passport facility based on the evidence.
152. A provision will be made to allow Nepalese citizens who have foreign currency account to use maximum of USD 5,000 in foreign currency in a year from the foreign currency deposits in their account as per their necessity.
153. Any individuals or institutions who receive the gift or donations in foreign currency will be allowed to open the foreign currency account after declaring the source and necessary information.
154. Existing provision for foreign citizens to operate account in foreign currency till visa period only will be changed so that the foreigner having account in foreign currency during their stay in Nepal will be allowed to operate this account after expiry of their visa by updating their individual information if they wish to continue to operate their account for payment purposes in Nepal.
155. To collect reliable data on foreign direct investment inflows in the country and manage information of repatriation of profits, Nepalese companies will be required to submit information, at least semi-annually, at this bank, on foreign investment received after the approval of related institution of the Nepalese government and this bank. In addition, FDI policy pertaining to investment abroad by Nepalese citizens will be formulated.
156. Additional simplification and transparency will be made in the process of taking loan from abroad and its repayment by Nepalese companies as per the provision in the existing acts including Foreign Exchange (Regulation) Act, 2019 and public notice issued from this bank from time to time.

24 Nepal Rastra Bank 157. After pre-approval from this bank, Nepalese citizens who want to operate or
expand their business in Nepal will be allowed to access loan up to USD 200,000 from their relatives, non-resident Nepalese or institutions under the stipulated conditions. However, foreign currency will not be provided for interest servicing of such loan.
158. Currently, there is a provision of foreign exchange conversion facility to Nepalese citizens receiving gifts, tips etc. from foreign relatives and customers. This facility of up to USD 1000 or equivalent INR is available only through licensed BFIs. A provision will be introduced so that the facility of USD 500 or equivalent other convertible currencies will be available from licensed moneychangers undertaking transactions of foreign currency on the basis of their identity card including source of foreign currency.
159. Inspection and supervision directive will be prepared and implemented for effective inspection and supervision of companies licensed from this bank for conducting remittance and money-changer transactions.
160. There is the increasing trend of private sector remittance inflow from formal channel in recent years. Nepalese banks will be encouraged to open branches/representative offices in India, South Korea and other countries to channelize remittance inflow through formal channel.
161. Necessary arrangement will be made for smooth management of financial derivatives transactions in foreign currency.
Micro Finance and Financial Access 162. To make micro finance services more effective, emphasis will be given to include
individuals into the group. Loan limit to be provided by BFIs has been increased up to Rs. 1,00,000 per group member for microenterprises or micro business and up to Rs. 3,00,000 against acceptable collateral. Continuity has been given to the provision that “D” class financial institutions could extend such credit facility up to one third of their loan against collateral.
163. To create an environment to use the knowledge and skill of youths, who return to Nepal from foreign employment or higher education abroad, an arrangement will be made to provide refinance facility to BFIs against the loan extended to them to run business.
164. Current provision that loan and advances received by microfinance institutions for deprived sector lending shall not avail earning interest from depositing it in BFIs, will be monitored closely.
165. Specified amount of credit extended by BFIs to microenterprises run by females with technical and vocational training equivalent to secondary and higher secondary level, hydropower development up to 500 KW by community or private sector with investment of at least 50 percent, construction of irrigation system by consumer groups of rural area or cooperatives, purchase of specified agricultural tools in rural areas, community hospitals fulfilling specified conditions and servicing rural areas and cold storages established by farmers to store food grains could be accounted as deprived sector lending.

Unofficial Translation of Monetary Policy for Fiscal Year 2012/13 25
166. Field work of rural credit survey aimed to study various aspects like presence of BFIs and other financial intermediaries, status of institutional loan, informal financial transaction, financial access to rural people and interest spread, will be completed.
167. While providing loans more than Rs. 30,000 by licensed BFIs to individual/group member/group, current provision of acquiring/providing credit information from licensed microfinance development banks, cooperatives authorized for limited banking activities and non-government financial organizations within the working area of that bank branch will be effectively implemented.
168. Given the dearth of financial institutions in the nine districts of Manang, Humla, Kalikot, Mugu, Jajarkot, Bajang, Bajura and Darchula, necessary provision will be made to allow “D” class financial institutions to collect deposits from the general public up to five times of their core capital.
169. Rural Self Reliance Fund established in 1991 by government and run by Nepal Rastra Bank has been providing wholesale credit to cooperatives and non-government organizations for microfinance activities. Simplification will be made in lending procedure to include more cooperatives and non-government organizations of rural area for full utilization of the fund.
170. Since draft act of National Microfinance Development Fund has been submitted to Government of Nepal, autonomous microfinance fund will be established to enhance credit to poor and deprived sector by expanding base of microfinance transaction after its enactment.
Lastly, 171. Maintaining economic and financial sector stability is challenging even though
macro economic indicators are moving toward positive direction. Inflationary pressure has been building in latter period and credit to productive sector has not been expanded as expected despite excess liquidity in BFIs. Similarly, despite some positive signals, real estate business which comprises big exposure of BFIs has not got expected momentum. Additional effort is necessary to improve governance and structural reform of BFIs for the enhancement of financial stability and financial outreach. The monetary policy which is going to be implemented against this backdrop is expected to be helpful in controlling inflation, maintaining external sector stability, maintaining financial stability, extending financial outreach and attaining targeted economic growth by addressing the above mentioned challenges.
172. NRB thanks all stakeholders including various agencies of the GoN, financial institutions, professional and business associations, academicians and donor agencies for their cooperation in the formulation of this monetary policy. NRB also expects continued cooperation from all stakeholders in the implementation of the policy provisions and programs included in this monetary policy.

Appendix I
Annual Progress Matrix of Policy measures as outlined in
Monetary Policy of 2011/12
S.N. Point # Objectives/Programs Implementation Status
1 68 Containing annual average inflation rate at 7 percent.
Inflation rate is estimated to have stood at 8 percent due to adjustment in price of petroleum and depreciation of Nepalese currency.
2 69 Maintaining foreign exchange to cover at least 6 months of imports, and attaining the BOP surplus of Rs. 5 billion.
BOP surplus is estimated to have stood at Rs. 125 billion due to high growth of remittances.
3 70 Carrying out monetary management to facilitate the attainment of 5 percent economic growth.
Economic growth is estimated to have remained at 4.6 percent.
4 71 Maintaining growth of broad money supply at 12.5 percent.
Broad money supply growth is estimated to be 22.5 percent due to elevated growth of foreign exchange reserves.
5 72 Domestic credit, credit to government credit to private sector from BFIs increase by 13.7 percent, 12.1 percent and 14.0 percent respectively.
Domestic credit, credit to government and credit to private sector from BFIs estimated to have increased by 9.9 percent, 0.5 percent and 12.5 percent respectively.
6 73 Total deposit mobilization by BFIs grow by 13 percent.
Deposit growth of BFIs is estimated to be 22.4 percent due to elevated growth of remittances.

Appendix II
Progress Matrix of Policies and Program Pertaining to Financial Sector and Foreign Exchange Outlined in Monetary Policy of 2011/12
S.N. Point # Programs Implementation Status
1 74 Open market operation to be continued as the principal instrument of monetary policy operation.
In addition to repo, outright sale of government bond was utilized as a major instrument.
2 76 Cash Reserve Ratio (CRR) to be set up at 5.0 percent slashing down by 0.5 percent point.
Implemented through directive circulated on July 28, 2011.
3 80 Refinancing facility for liquidity management will be revised gradually.
Provision of refinancing facility for short term liquidity has been repealed since November 18, 2011 due to improved liquidity in banking and financial sector.
4 83 An initiation will be taken to establish Microfinance Authority to regulate MFIs and process will be forwarded to establish an autonomous Microfinance Fund.
To establish and operate proposed Microfinance Development Fund, a draft of ordinance has been submitted to Ministry of Finance, GoN.
5 84
A study to be conducted and the recommendations will be implemented about financial access in the hills of Far-western and Mid-western Development Regions where the access of financial service is very poor. A national strategy will be prepared to address the ineffective financial services due to low financial literacy.
a) A draft of study report has been prepared and final report is being prepared.
b) Preparation of national strategy paper is underway.
6 85
Interest free loan will be provided up to Rs 1.5 million to class 'D' financial institutions for certain period that open new branch and operates financial activities in nine specified districts where financial access is very poor
Implemented through a circular issued on July 28, 2011 and such facility of Rs. 1.5 million was provided to financial institutions under this provision.

28 Nepal Rastra Bank
S.N. Point # Programs Implementation Status
7 86
Deprived sector lending of commercial banks, development banks and finance companies will be increased to 3.5 percent, 3.0 percent and 2.5 percent respectively and the ratio will be increased by 0.5 percent per year for consecutive three years.
A circular issued on July 28, 2011 to the licensed 'A', 'B' and 'C' class BFIs to increase deprived sector lending by 0.5 percent point to meet the required ratio.
8 88 An arrangement of credit insurance will be made for deprived sector credit to BFIs for loans that goes to youth of deprived family for secondary and higher secondary technical education.
Implemented through a circular issued on December 5, 2011.
9 91 Loans up to Rs. 10 million issued from BFIs provided to community hospitals which are operating in the rural area and fulfills all terms and conditions could be accounted as deprived sector lending.
Implemented through a circular issued on July 28, 2011.
10 92 Credit up to Rs. 150 thousand per farmer who want to establish cold stores to preserve agro products will be considered as deprived sector lending.
Implemented through a circular issued on July 28, 2011.
11 94 An arrangement will be made to issue license for class 'D' financial institution focusing on the area where financial access is poor.
Licensing has been granted accordingly and a study is ongoing by a task force formed with member representative of various departments to incorporate additional standards.
12 96
Existing provision of providing interest free loan up to Rs. 5 million to BFIs on extending their branches in district head quarter and up to Rs. 10 million on extending their branches out of district headquarter of 22 remote districts specified by the GoN will be reviewed to restrict the possibility of its misuse. A provision of waiver on additional capital to finance companies on extending branches in specified 30 districts with poor presentation of BFIs will be introduced.
The policy provision on interest free loan revised and a policy provision introduced to waive additional capital requirement to open branch in 30 specified districts. The circular was issued on December 5, 2011. In FY 2011/12, interest free loan of Rs. 65 million was provided comprising Rs. 40 million to five “A” class financial institutions for opening seven branches, Rs. 25 million to two “B” class financial institution for opening three branches in remote districts.

Unofficial Translation of Monetary Policy for Fiscal Year 2012/13 29
S.N. Point # Programs Implementation Status
13 97
Deposit insurance scheme will be implemented in commercial banks and its limit will be gradually increased.
Implemented through a circular issued on July 28, 2011 regarding the provision of deposit guarantee up to Rs 200 thousand in saving and fixed account held by natural person in commercial banks as well. In addition, a circular was also issued on September 20, 2011 to gradually increase the threshold of deposit guarantee up to Rs. 500 thousand.
14 98
The rural credit survey started in FY 2011/12 will be continued in FY 2012/13 to get the information about the presence of BFIs and other financial intermediaries, situation of institutional credit, extent of informal financial intermediation, rural financial access, status of loan and interest rate etc.
The draft of base line survey received.
A steering committee has been formed and preliminary work has been started to execute the detail survey.
15 99 The ongoing financial sector reform program will be continued.
In the context of the termination of the Financial Sector Reform Program funded by the World bank in December 31, 2011, discussions with World Bank is ongoing to handle the reform program in a different way.
16 100 Implementation of BASEL II capital standard will be made more effective and a directive on Internal Capital Adequacy Assessment Process (ICAAP) will be prepared and implemented.
The draft has been prepared and is in the final stage for implementation.
17 101
In order to ensure the assets quality, the priority of supervision will be directed towards maintaining quality of credit. An arrangement will be made to conduct onsite supervision of all financial institutions within a year. For this purpose, all supervision departments will be strengthened.
a) The On-site supervision manual is being reviewed with the help of supervisory advisor of the Bank in Bank Supervision Department.
b) The direction on loan classification will be reviewed.

30 Nepal Rastra Bank
S.N. Point # Programs Implementation Status
18 102
Necessary revision will be made in existing Inspection and Supervision Bylaw, 2002. Adequate provisioning of human resource and departmental restructuring will be made for the enhancement of supervisory capability.
The draft of supervision bylaw 2069 has been prepared to replace the supervision bylaws 2059. The risk based supervision guideline is being prepared with the help of supervision advisor in Bank Supervision Department. The organizational structure has been reviewed by separating Financial Institution Supervision Department into separate Development Bank Supervision Department and Finance Company Supervision Department.
19 103
Special attention will be paid in mechanization of information system for a quick, reliable and factual transmission of information between NRB and other licensed BFIs for effective supervision.
With the aim of making supervision of IT based financial transactions easier, a circular regarding e-banking has been issued.
20 104
With the objective of strengthening offsite supervisory capacity, the existing early warning system will be made more effective. In addition, a contingency plan will be prepared by developing a system that identifies potential risks and their management for taking steps immediately to address contingency problems that emerge in the financial system. Under this system, problematic bank resolution framework will be prepared by including specified step-by-step programs of crisis management.
Review process is ongoing as per the plan of bank supervision advisor. In the process of reviewing supervision guidelines, the onsite manual is being revised and updated. Draft has been prepared to revise inspection and supervision by-law. Draft of Problem Bank Resolution Framework including operational manual has been prepared.
21 105
Necessary directive will be issued to banks to conduct stress test on their own and institution-wise liquidity monitoring framework will be prepared and implemented in order to strengthen forward-looking analysis for liquidity management of BFIs.
A. Liquidity Monitoring Framework has already been implemented. B. Stress Testing Guidelines have already been prepared and implemented.

Unofficial Translation of Monetary Policy for Fiscal Year 2012/13 31
S.N. Point # Programs Implementation Status
22 106
Implementation and monitoring process of Prompt Corrective Action Bylaw, 2008 will be made more effective.
Prompt Corrective Action By-Laws, 2064 has been effectively implemented. The PCA draft that also includes liquidity trigger is prepared and is under review. Liquidity has been monitored as per Liquidity Monitoring Framework.
23 107 A selective licensing policy will be adopted to establish financial institutions in rural areas with minimum access to financial services.
Study is ongoing to review licensing policy.
24 108
There has been increasing tendency of changing promoters and adjustment in ownership structure of share capital by BFIs that submitted application under existing licensing policy. A timely revision in existing policy provision will be made to overcome this problem so as to create an environment to promote BFIs by genuine investors.
Review of licensing policy is under study.
25 109 Necessary rectification will be made in fit and proper test of promoters of newly establishing BFIs.
This aspect is also being studied while reviewing licensing policy.
26 110
Financial stability will be strengthened through promotion of corporate governance, healthy competition and financial consolidation by encouraging BFIs for merger and acquisition
To facilitate the process of mergers and acquisition, a separate unit has been established in Regulation Department. The unit has been serving as facilitator and coordinator for merger and acquisition. Higher management and board members of FBIs have been encouraged and suggested for merger and acquisition. After the issue of Merger and Acquisition By-laws, 2068, four institutions have received final approval and seven institutions have received letter of intent for merger and acquisition.

32 Nepal Rastra Bank
S.N. Point # Programs Implementation Status
27 111
Provision pertaining to corporate governance, compliance of directives and monitoring will be implemented more effectively. The voluntary declaration records on loans taken from various BFIs by member of the board of directors and their family members in the names of their firms/companies or the firms/companies under their control will be updated.
Implemented through a circular issued on 2068/09/07.
28 112
For minimization of capital expenditure and other miscellaneous expenses, current provision of auditing long form audit report by external auditors will be made more effective.
The study report prepared by the taskforce comprising representatives from supervision departments is under discussion.
29 113
Necessary arrangement will be made to avoid credit risk arising from multiple banking.
A policy provision has been introduced regarding dissemination of credit information among each other while providing loans more than Rs. 30,000 to individual/group member/group by licensed 'D' class microfinance development banks, cooperatives authorized for limited banking activities and non-government financial organizations authorized for financial intermediation within the working area of that bank branch. A study has been ongoing to make necessary arrangement for controlling risk from multiple banking in other financial institutions.
30 114
To improve non-performing assets of BFIs, establishment of an asset management company with private sector participation will be encouraged.
Since Financial Sector Reform Program was terminated on December 31, 2011, further actions have been stopped. For establishment of Asset Management Company, discussions are continuing with stakeholders.

Unofficial Translation of Monetary Policy for Fiscal Year 2012/13 33
S.N. Point # Programs Implementation Status
31 115
Actions against willful defaulters accessing loan above Rs.10 million from BFIs will be made more effective. In coordination with GoN, the borrowers not investing borrowed fund in specified sectors and registering dummy firm to borrow on behalf of it as well as not repaying the loan willfully will be brought to justice.
A draft guideline for action has already been prepared.
32 116
The existing refinance facility will be reviewed so as to increase credit flow to the hydroelectricity projects from BFIs.
To increase credit to hydropower generation project, a circular was issued on 2068/08/19 with the provision of providing refinance facility at 6.5 percent to credit extended to this sector. Refinance facility of Rs. 1.27 billion was provided to BFIs for hydropower projects in 2011/12.
33 117 Necessary steps will be carried out to control, limit and regulate personal overdraft loans.
Ceiling of personal overdraft has been determined as Rs. 10 million.
34 118 Action plan submitted by BFIs to meet productive sector credit at 20 percent of industry average will be effectively monitored.
Implemented through a circular issued on 2068/4/12.
35 119
Commercial banks will be encouraged to operate mutual fund scheme in coordination with Security Exchange Board of Nepal.
Circular has been issued on 2067/12/09 to allow BFIs to run mutual fund. Accordingly, interested commercial banks have been given approval through amendment of their articles of association.
36 120
Necessary assistance will be provided to the GoN to establish a separate Secured Transaction Registry office.
Mechanization of secured transaction has been stopped due to termination of financial sector reform program. NRB has been in touch with Government of Nepal to provide necessary assistance in this regard.

34 Nepal Rastra Bank
S.N. Point # Programs Implementation Status
37 121 Currency Verification and Processing System (CPVS) and Shredding and Briquetting System (SBS) will be introduced.
Necessary preparation is ongoing for introducing CVPS and SBS.
38 122
Policy of maintaining clean notes in circulation by replacing soiled notes with fresh notes will be given continuity. Currency chest transactions will be modernized and expanded.
Clean note policy related tele-film “Sandesh” was broadcasted. Five interaction programs on clean note policy were organized. Multiple stitching practices in a packet of note have been limited to single stitch.
39 123 Broad monetary survey will be published regularly within FY 2011/12.
Broad monetary survey has been published regularly since fourth month of FY 2011/12.
40 124
An online unified data reporting system will be put in place to get timely and reliable data information from BFIs and to simplify data processing and preparation of report.
To simplify the task of data collection from BFIs that are necessary for different departments and dissemination, review of technical/financial proposal submitted by firms/companies regarding Data Collection and Dissemination System software is underway.
41 125
A policy provision will be introduced so that BFIs can extend credit denominated in foreign currency to hydroelectricity projects and can also invest in different foreign currency denominated instruments with the consent of NRB.
Implemented through a policy provision issued on 2068/07/20.
42 126 Arrangement will be made to exchange foreign currency as passport facility of up to USD 2,500 at once and USD 5,000 in each fiscal year.
Circular was issued on 2068/04/10.
43 127
Additional items will be added in the list of goods that can be imported from India against the payment of convertible foreign currency on the basis of rationality.
Through the circular issued on 2068/05/13, 3 additional items are included in the list of goods that can be imported from India against the payment of convertible foreign currency.

Unofficial Translation of Monetary Policy for Fiscal Year 2012/13 35
S.N. Point # Programs Implementation Status
44 128 Arrangement will be made to allow non-resident Nepalese to open foreign currency accounts.
Implemented through a policy provision issued on 2068/05/1.
45 129 Various issues on opening and operation of foreign currency account will be reviewed.
Implemented through a policy provision issued on 2068/05/1.
46 130 Necessary arrangement will made for opening and operation of foreign currency account by individuals, organizations and others.
Implemented through a policy provision issued on 2068/05/28.
47 131
The provision on maturity of advanced payment certificate issued by commercial banks to exporters will be revised so that such certificates can be issued for one year at the begining and can be renewed for any period by commercial banks themselves. Currently, such certificates can be issued for three years and required to renew in each 6 months.
Implemented through a circular issued on 2068/05/01. No of renewals reached 160.
48 132 Necessary amendment will be made on LC transactions including the usance letter of credit.
Draft of Usance Letter of Credit is being prepared. It is felt that interaction with stakeholders is essential in this regard.
49 133
A provision will be introduced so that institutions licensed by NRB can exchange cash upto USD 1,000 or equivalent other convertible currencies at a time upon the declaration of sources of income with their identity card.
Implemented through a circular issued on 2068/04/19.
50 134 New provision will be introduced to allow the settlement of card transaction between Nepal and Bhutan in Indian currency.
Implemented through a circular issued on 2068/05/06.

2010 2011* 2012* 2013*Monetary Aggregates Jul Jul Jul (e) Jul (p) Amount Percent Amount Percent Amount Percent1. Foreign Assets, Net 213,036.5 216,039.1 374,847.6 404,847.6 2,182.7 1/ 1.0 125,000.0 2/ 57.9 30,000.0 8.0 1.1. Foreign Assets 275,222.5 278,883.8 447,728.0 484,602.7 3,679.7 1.3 168,844.3 60.5 36,874.7 8.2 1.2. Foreign Liabilities 62,186.0 62,844.6 72,880.4 79,755.1 846.1 1.4 10,035.8 16.0 6,874.7 9.4 a. Foreign Currency Deposits 51,579.0 52,336.4 60,867.0 67,168.1 1,055.1 2.1 8,530.6 16.3 6,301.1 10.4 b. Other Foreign Liabilities 10,607.0 10,508.2 12,013.5 12,587.0 -209.0 -2.0 1,505.2 14.3 573.6 4.82. Net Domestic Assets 506,562.7 706,004.2 754,656.5 894,082.0 98,873.8 1/ 16.3 82,461.3 2/ 11.7 139,425.5 18.5 2.1. Domestic Credit 650,982.4 912,576.4 1,002,658.6 1,163,363.6 115,524.8 14.5 90,082.1 9.9 160,705.0 16.0 a. Net Claims on Govt. 133,128.8 163,439.4 164,309.5 190,326.3 26,852.8 19.7 870.2 0.5 26,016.8 15.8 i. Claims on Govt. 133,128.8 163,439.4 164,309.5 190,326.3 26,852.8 19.7 870.2 0.5 26,016.8 15.8 ii. Govt. Deposits 0.0 0.0 0.0 0.0 0.0 0.0 0.0 0.0 0.0 0.0
b. Claims on Non-Financial Govt. Ent. 5,443.1 6,347.7 9,000.0 10,530.0 2,850.7 81.5 2,652.3 41.8 1,530.0 17.0 c. Claims on Financial Institutions 11,759.9 15,467.0 11,014.8 13,010.0 -2,950.8 -16.0 -4,452.2 -28.8 1,995.2 18.1 Government 1,931.2 5,427.0 2,014.8 2,340.0 61.2 1.1 -3,412.2 -62.9 325.2 16.1 Non-Government 9,828.7 10,039.9 9,000.0 10,670.0 -3,012.0 -23.1 -1,039.9 -10.4 1,670.0 18.6 d. Claims on Private Sector 500,650.6 727,322.4 818,334.2 949,497.3 88,772.1 13.9 91,011.8 12.5 131,163.1 16.0 2.2. Net Non-monetary Liabilities 144,420.0 206,572.2 248,002.0 269,281.7 16,651.1 1/ 8.8 7,621.4 2/ 3.7 21,279.7 8.63. Broad Money (M2) 719,599.1 922,043.3 1,129,503.2 1,298,928.6 101,056.5 12.3 207,460.8 22.5 169,425.5 15.0 3.1. Money Supply (M1) 218,159.0 223,074.6 267,601.9 306,404.2 6,137.5 2.8 44,528.4 20.0 38,801.6 14.5 a. Currency 142,114.5 141,931.5 173,509.4 196,098.7 2,650.2 1.9 31,577.9 22.2 22,589.3 13.0 b. Demand Deposits 76,044.8 81,143.1 94,092.5 110,305.5 3,487.3 4.5 12,949.4 16.0 16,213.0 17.2 3.2. Time Deposits 501,440.1 698,968.7 861,901.3 992,524.5 94,919.0 15.7 162,932.4 23.3 130,623.9 15.24. Broad Money Liquidity (M3) 771,178.1 974,379.7 1,190,370.1 1,366,096.7 102,111.6 11.7 215,991.4 22.2 175,726.6 14.8
* Including 'B' and 'C' Class Financial Institutions 1/ Adjusting the exchange valuation gain of Rs 650.8 million.2/ Adjusting the exchange valuation gain of Rs 33808.5 million.e = Estimate.p = Projection.
Appendix 3
Annual Change2010/11* 2011/12* 2012/13*
(Rs. in Million)
Projection of Monetary Survey

List of Statistical Tables
Table 1 Real Gross Domestic ProductTable 2 Nominal Gross Domestic ProductTable 3 Gross National Disposable Income (GNDI)Table 4 National Consumer Price IndexTable 5 Monetary SurveyTable 6 Outright Sale AuctionTable 7 Outright Purchase AuctionTable 8 Repo AuctionTable 9 Reverse Repo AuctionTable 10 (A) Foreign Exchange InterventionTable 10 (B) Foreign Exchange Intervention (In US Dollar)Table 11 Standing Liquidity Facility (SLF)Table 12 Interbank Transaction Amount and Weighted Average RateTable 13 Net Domestic Borrowing of the Government of NepalTable 14 Structure of Interest RatesTable 15 Weighted Average Treasury Bills Rate (91-day)Table 16 Weighted Average Treasury Bills Rate (364-day)Table 17 Weighted Average Interbank Transaction Rate (Percent)Table 18 Government Budgetary Operation (On Annual Data Basis)Table 19 Outstanding Domestic Debt of the Government of Nepal Table 20 Direction of Foreign TradeTable 21 Balance of Payments SituationTable 22 Gross Foreign Exchange Holding of the Banking SectorTable 23 Import from India Against US Dollar PaymentTable 24 Indian Currency Purchase

Sectors 2006/07 2007/08 2008/09 2009/10 2010/11R 2011/12P 2007/08 2008/09 2009/10 2010/11R 2011/12P
Agriculture 184,796.0 195,559.0 201,464.0 205,517.0 214,777.0 225,357.0 5.8 3.0 2.0 4.5 4.9 Agriculture and Forestry 181,958.0 192,514.0 198,257.0 202,196.0 211,228.0 221,494.0 5.8 3.0 2.0 4.5 4.9 Fishery 2,838.0 3,045.0 3,207.0 3,321.0 3,549.0 3,863.0 7.3 5.3 3.6 6.9 8.8Non-Agriculture 330,330.6 349,743.4 364,915.0 384,570.0 397,629.0 414,606.0 5.9 4.3 5.4 3.4 4.3 Industry 86,792.0 88,305.0 87,784.0 91,295.0 93,908.0 95,498.0 1.7 -0.6 4.0 2.9 1.7 Mining and Quarrying 2,383.0 2,513.0 2,531.0 2,585.0 2,637.0 2,770.0 5.5 0.7 2.1 2.0 5.0 Manufacturing 39,891.0 39,545.0 39,132.0 40,291.0 41,216.0 41,744.0 -0.9 -1.0 3.0 2.3 1.3 Electricity, Gas and Water 13,065.0 13,204.0 12,750.0 12,989.0 12,929.0 13,884.0 1.1 -3.4 1.9 -0.5 7.4 Construction 31,453.0 33,043.0 33,371.0 35,430.0 37,126.0 37,100.0 5.1 1.0 6.2 4.8 -0.1 Services 243,538.6 261,438.4 277,131.0 293,275.0 303,721.0 319,108.0 7.3 6.0 5.8 3.6 5.1 Wholesale and Retail Trade 64,292.2 66,962.2 70,481.0 75,237.0 76,117.0 79,002.0 4.2 5.3 6.7 1.2 3.8 Hotels and Restaurant 8,278.1 8,851.1 9,056.0 9,646.0 10,359.0 11,217.0 6.9 2.3 6.5 7.4 8.3 Transport, Storage and Communications 44,094.3 48,225.8 51,585.0 54,657.0 57,757.0 61,707.0 9.4 7.0 6.0 5.7 6.8 Financial Intermediation 22,103.0 24,142.3 24,632.0 25,327.0 26,163.0 27,071.0 9.2 2.0 2.8 3.3 3.5 Real Estate, Renting and Business 41,240.0 45,544.0 46,421.0 47,818.0 48,894.0 50,346.0 10.4 1.9 3.0 2.3 3.0 Public Administration and Defence 9,262.0 9,319.0 10,012.0 10,405.0 10,805.0 11,411.0 0.6 7.4 3.9 3.8 5.6 Education 30,738.0 32,716.0 36,233.0 38,638.0 39,785.0 41,762.0 6.4 10.8 6.6 3.0 5.0 Health and Social Work 6,888.0 7,474.0 8,191.0 8,581.0 9,035.0 9,530.0 8.5 9.6 4.8 5.3 5.5 Other Community, Social and Personal Service 16,643.0 18,204.0 20,520.0 22,966.0 24,806.0 27,062.0 9.4 12.7 11.9 8.0 9.1Total GVA including FISIM 515,126.6 545,302.4 566,379.0 590,087.0 612,406.0 639,963.0 5.9 3.9 4.2 3.8 4.5Financial intermediation indirectly measured 21,476.0 23,042.9 23,725.0 24,327.0 25,069.0 25,841.0 7.3 3.0 2.5 3.1 3.1GDP at basic prices 493,650.6 522,259.6 542,654.0 565,760.0 587,337.0 614,122.0 5.8 3.9 4.3 3.8 4.6Taxes less subsidies on products 38,387.6 42,256.9 47,455.0 52,770.0 55,217.0 58,205.0 10.1 12.3 11.2 4.6 5.4GDP at producers price 532,038.2 564,516.5 590,109.0 618,530.0 642,554.0 672,327.0 6.1 4.5 4.8 3.9 4.6
R= Revised estimate.P= Preliminary estimate.Source: Central Bureau of Statistics.
Table 1
Percentage ChangeRs. in Million
(At 2000/01 Prices)Real Gross Domestic Product

Table 2Nominal Gross Domestic Product
(At Current Market Prices)
Sectors 2006/07 2007/08 2008/09 2009/10 2010/11R 2011/12P 2007/08 2008/09 2009/10 2010/11R 2011/12P
Agriculture 226,822.5 247,191.0 309,553.0 395,755.0 475,374.0 515,767.0 9.0 25.2 27.8 20.1 8.5 Agriculture and Forestry 223,536.0 243,323.0 305,477.0 391,519.0 470,850.0 510,760.0 8.9 25.5 28.2 20.3 8.5 Fishery 3,286.5 3,868.0 4,076.0 4,236.0 4,524.0 5,007.0 17.7 5.4 3.9 6.8 10.7Non-Agriculture 470,541.3 532,246.0 629,339.0 722,815.0 813,142.0 952,850.0 13.1 18.2 14.9 12.5 17.2 Industry 115,529.3 130,913.0 148,901.0 169,383.0 191,089.0 214,050.0 13.3 13.7 13.8 12.8 12.0 Mining and Quarrying 3,416.8 4,375.0 5,084.0 5,926.0 6,956.0 8,166.0 28.0 16.2 16.6 17.4 17.4 Manufacturing 52,172.2 57,185.0 65,447.0 70,924.0 79,489.0 90,547.0 9.6 14.4 8.4 12.1 13.9 Electricity, Gas and Water 14,841.3 15,219.0 14,629.0 15,244.0 15,288.0 16,565.0 2.5 -3.9 4.2 0.3 8.4 Construction 45,099.0 54,134.0 63,741.0 77,289.0 89,356.0 98,772.0 20.0 17.7 21.3 15.6 10.5 Services 355,012.0 401,333.0 480,438.0 553,432.0 622,053.0 738,800.0 13.0 19.7 15.2 12.4 18.8 Wholesale and Retail Trade 92,648.0 105,306.0 124,121.0 161,067.0 182,465.0 209,095.0 13.7 17.9 29.8 13.3 14.6 Hotels and Restaurant 10,043.0 11,503.0 13,943.0 17,347.0 21,866.0 26,164.0 14.5 21.2 24.4 26.1 19.7 Transport, Storage and Communications 69,555.0 76,818.0 92,618.0 95,304.0 102,724.0 122,406.0 10.4 20.6 2.9 7.8 19.2 Financial Intermediation 28,467.0 33,539.0 39,100.0 46,083.0 55,431.0 68,403.0 17.8 16.6 17.9 20.3 23.4 Real Estate, Renting and Business 70,791.0 73,630.0 81,625.0 93,747.0 106,236.0 119,991.0 4.0 10.9 14.9 13.3 12.9 Public Administration and Defence 12,227.0 14,352.0 18,556.0 21,695.0 24,819.0 31,087.0 17.4 29.3 16.9 14.4 25.3 Education 40,939.0 48,722.0 62,642.0 61,384.0 62,631.0 80,840.0 19.0 28.6 -2.0 2.0 29.1 Health and Social Work 8,568.0 10,963.0 13,744.0 15,382.0 16,469.0 22,712.0 28.0 25.4 11.9 7.1 37.9 Other Community, Social and Personal Service 21,774.0 26,500.0 34,089.0 41,423.0 49,412.0 58,102.0 21.7 28.6 21.5 19.3 17.6Total GVA including FISIM 697,364.0 779,442.0 938,892.0 1,118,570.0 1,288,516.0 1,468,617.0 11.8 20.5 19.1 15.2 14.0Financial intermediation indirectly measured 21,505.0 24,185.0 29,362.0 35,156.0 42,094.0 50,401.0 12.5 21.4 19.7 19.7 19.7GDP at basic prices 675,859.0 755,257.0 909,530.0 1,083,414.0 1,246,422.0 1,418,216.0 11.7 20.4 19.1 15.0 13.8Taxes less subsidies on products 51,968.0 60,401.0 78,744.0 109,358.0 121,997.0 138,809.0 16.2 30.4 38.9 11.6 13.8GDP at producers price 727,827.0 815,658.0 988,274.0 1,192,772.0 1,368,419.0 1,557,025.0 12.1 21.2 20.7 14.7 13.8R= Revised estimate.P= Preliminary estimate.Source: Central Bureau of Statistics.
Percentage ChangeRs. in Million

Table 3Gross National Disposable Income (GNDI)
(At Current Market Prices)
Sectors 2006/07 2007/08 2008/09 2009/10 2010/11R 2011/12P 2007/08 2008/09 2009/10 2010/11R 2011/12P
Consumption 656374.4 735469.9 895042.0 1056184.0 1251421.0 1402707.0 12.1 21.7 18.0 18.5 12.1Government consumption 66948.7 80663.0 106527.0 119189.0 131664.0 159677.0 20.5 32.1 11.9 10.5 21.3Private consumption 576910.7 641085.5 772762.3 916993.0 1096653.0 1216333.0 11.1 20.5 18.7 19.6 10.9Non-profit institutions 12515.0 13721.4 15752.7 20002.0 23104.0 26697.0 9.6 14.8 27.0 15.5 15.6Gross Capital Formation 208778.5 247272.0 313028.8 457395.0 445322.0 510590.0 18.4 26.6 46.1 -2.6 14.7Gross fixed capital formation 153336.9 178445.5 211038.8 264888.0 290693.0 305682.0 16.4 18.3 25.5 9.7 5.2 Public 24645.0 32992.6 44277.8 53665.0 66876.0 67330.0 33.9 34.2 21.2 24.6 0.7 Private consumption 128691.9 145452.9 166761.0 211223.0 223817.0 238352.0 13.0 14.6 26.7 6.0 6.5Change in stock 55441.7 68826.5 101990.0 192507.0 154629.0 204908.0 24.1 48.2 88.8 -19.7 32.5Total Domestic Demand 865153.0 982741.9 1208070.8 1513579.0 1696743.0 1913297.0 13.6 22.9 25.3 12.1 12.8Export of goods and services 93567.3 104207.2 122736.9 114298.0 121886.0 152369.0 11.4 17.8 -6.9 6.6 25.0Imports of goods and services 230893.3 271290.9 342535.8 434198.0 449199.0 507492.0 17.5 26.3 26.8 3.5 13.0Net export of goods and services -137326.0 -167083.7 -219798.9 -319900.0 -327313.0 -355123.0 21.7 31.6 45.5 2.3 8.5Gross Domestic Product 727827.0 815658.2 988274.0 1192772.0 1368419.0 1557025.0 12.1 21.2 20.7 14.7 13.8Net Factor Income 7431.8 7946.8 11749.5 9117.0 7549.0 14785.0 6.9 47.9 -22.4 -17.2 95.9Gross National Income 735258.8 823605.0 1000023.5 1201889.0 1375968.0 1571810.0 12.0 21.4 20.2 14.5 14.2Net Transfer 128992.0 182816.5 249487.0 282648.0 307859.0 400835.0 41.7 36.5 13.3 8.9 30.2Gross National Disposable Income (GNDI) 864250.8 1006421.5 1249510.5 1484537.0 1683827.0 1972645.0 16.5 24.2 18.8 13.4 17.2R= Revised estimate.P= Preliminary estimate.Source: Central Bureau of Statistics.
Rs. in Million Percentage Change

Index % Change Index % Change Index % Change Index % Change Index % Change
August 110.4 5.6 123.5 11.8 135.9 10.1 148.9 9.6 160.3 7.7
September 111.9 6.1 125.8 12.4 137.4 9.2 149.2 8.6 161.9 8.5
October 112.3 5.4 127.2 13.2 138.1 8.6 150.2 8.9 163.6 8.9
November 112.0 5.3 127.4 13.7 139.0 9.1 150.7 8.4 163.4 8.5
December 110.7 4.6 125.5 13.4 138.5 10.3 151.6 9.6 163.0 7.5
January 109.6 4.8 124.7 13.8 138.0 10.7 153.6 11.3 164.0 6.8
February 110.6 5.2 125.2 13.2 139.0 11.0 153.0 10.2 163.8 7.0
March 111.7 6.0 126.1 12.9 138.6 10.0 153.3 10.7 164.1 7.0
April 114.0 8.0 127.2 11.6 139.6 9.8 154.4 10.6 166.0 7.5
May 115.4 8.3 129.8 12.4 141.3 8.9 154.5 9.5 168.0 8.7
June 117.5 10.1 131.6 12.0 142.4 8.2 154.8 8.8 170.2 9.9
July 119.5 10.6 132.8 11.1 144.7 9.0 158.6 9.6
Annual Average 113.0 6.7 127.2 12.6 139.4 9.6 152.7 9.6 164.4* 8.0** Average of Eleven Months
National Consumer Price IndexBase Year 2005/06 = 100
Table 4
2008/09 2009/10 2011/122007/08 2010/11Mid-Month

2010 2011 2011 2012Monetary Aggregates July Jun July JunR Amount Percent Amount Percent1. Foreign Assets, Net 213,205.5 214,862.5 216,039.1 363,062.8 -335.6 1/ -0.2 113,215.2 2/ 52.4 1.1. Foreign Assets 275,204.1 276,767.2 278,883.8 434,441.4 1,563.2 0.6 155,557.6 55.8 1.2. Foreign Liabilities 61,998.6 61,904.7 62,844.7 71,378.6 -93.9 -0.2 8,533.9 13.6 a. Foreign Currency Deposits 51,281.3 51,360.5 52,336.4 59,492.0 79.2 0.2 7,155.6 13.7 b. Other Foreign Liabilities 10,717.2 10,544.2 10,508.2 11,886.6 -173.0 -1.6 1,378.3 13.12. Net Domestic Assets 607,781.3 675,923.8 706,004.2 724,222.0 70,135.1 1/ 11.5 52,026.3 2/ 7.4 2.1. Domestic Credit 796,598.2 882,767.2 912,576.4 967,427.1 86,169.0 10.8 54,850.7 6.0 a. Net Claims on Govt. 136,522.9 128,480.1 163,439.4 136,023.9 -8,042.9 -5.9 -27,415.5 -16.8 i. Claims on Govt. 136,522.9 134,906.9 163,439.4 165,701.9 -1,616.0 -1.2 2,262.5 1.4 ii. Govt. Deposits 0.0 6,426.9 0.0 29,678.0 6,426.9 29,678.0 b. Claims on Non-financial Govt. Ent. 5,876.1 7,446.3 6,347.7 9,205.1 1,570.2 26.7 2,857.4 45.0 c. Claims on Financial Institutions 15,648.8 15,609.7 15,467.0 10,849.8 -39.1 -0.3 -4,617.2 -29.9 i. Government 2,596.9 4,111.5 5,427.0 2,016.7 1,514.6 58.3 -3,410.4 -62.8 ii. Non-government 13,051.9 11,498.2 10,039.9 8,833.1 -1,553.8 -11.9 -1,206.8 -12.0 d. Claims on Private Sector 638,550.4 731,231.2 727,322.4 811,348.4 92,680.8 14.5 84,026.0 11.6 2.2. Net Non-monetary Liabilities 188,816.9 206,843.4 206,572.2 243,205.2 16,033.9 1/ 8.5 2,824.4 2/ 1.43. Broad Money (M2) 820,986.8 890,786.3 922,043.3 1,087,284.8 69,799.5 8.5 165,241.5 17.9 3.1. Money Supply (M1) 212,097.1 213,489.5 223,074.6 246,724.1 1,392.4 0.7 23,649.5 10.6 a. Currency 139,281.3 139,750.0 141,931.5 166,115.5 468.7 0.3 24,184.0 17.0 b. Demand Deposits 72,815.8 73,739.4 81,143.1 80,608.8 923.7 1.3 -534.3 -0.7 3.2. Time Deposits 608,889.7 677,296.8 698,968.7 840,560.7 68,407.1 11.2 141,592.0 20.34. Broad Money Liquidity (M3) 872,268.1 942,146.8 974,379.7 1,146,776.8 69,878.7 8.0 172,397.1 17.7
R = Revised estimates. 1/ Adjusting the exchange valuation gain of Rs. 1992.6 million. 2/ Adjusting the exchange valuation loss of Rs. 33808.5 million.
Table 5Monetary Survey
(Based on First Eleven Months' Data)
2010/11 2011/12Changes during the eleven months
(Rs. in Million)

AmountWtd. Int. Rate (%) Amount
Wtd. Int. Rate (%) Amount
Wtd. Int. Rate (%) Amount
Wtd. Int. Rate (%) Amount
Wtd. Int. Rate (%)
August - - 3,500.0 4.94 7,440.0 2.17 - - - -
September - - - - - - -
October - - - - 2,000.0 5.56 - -
November 500.0 3.44 2,000.0 5.20 - - - - - -
December 740.0 4.33 1,960.0 4.95 - - - - 5,400.0 3.59
January - - - - - - - - 3,000.0 2.98
February - - - - - - - - - -
March 2,460.0 4.87 - - - - - - - -
April 770.0 4.05 - - - - - - - -
May 2,000.0 5.38 - - - - - - - -
June 3,430.0 5.98 - - - - - - - -
July 4,950.0 5.65 - - - - - - - -
Total 14,850.0 4.81 7,460.0 5.03 7,440.0 2.17 2,000.0 5.56 8,400.0 3.28
(Rs. in million)
AmountWtd. Int. Rate (%) Amount
Wtd. Int. Rate (%) Amount
Wtd. Int. Rate (%) Amount
Wtd. Int. Rate (%) Amount
Wtd. Int. Rate (%)
August - - - - - - - - - - September - - - - - - - - - - October - - - - - - - - - - November - - - - - - - - - - December - - - - - - - - - - January - - - - 33,817.3 4.51 - - - - February - - - - - - - - - - March - - - - - - - - - - April - - - - - - - - - - May - - - - - - - - - - June - - - - - - - - - - July - - - - - - - -
Total - - - - 33,817.3 4.51 - - - -
Wtd. Int. Rate = Weighted Interest Rate.* The system of outright sale/purchase auction of treasury bills as a monetary instrument was introduced since 2004/05. The outright sale/purchase auction takes place at the initiative of NRB.
2011/12
2011/122007/08 2008/09
Table 6
Outright Purchase Auction*Table 7
2010/11
(Rs. in Million)
Mid-Month
Outright Sale Auction*
Mid-Month
2010/11
2009/10
2008/09 2009/102007/08

(Rs. in Million)Mid-Month 2007/08 2008/09 2009/10 2010/11 2011/12
August - - - - 728.0
September - - - - 15.8
October - - 1,000.0 3,000.0 -
November - - 2,000.0 2,000.0 -
December - - 13,000.0 - -
January 2,000.0 - 23,982.0 13,000.0 -
February 5,000.0 4,000.0 18,953.0 10,000.0 -
March 2,000.0 5,000.0 15,250.3 13,804.6 -
April - - 20,929.0 15,187.4 -
May - - 12,000.0 18,217.4 -
June - 2,000.0 11,996.5 7,194.3 -
July - - 12,566.0 9,982.4 - Total 9,000.0 11,000.0 131,676.8 92,386.1 743.7
(Rs. in Million)Mid-Month 2007/08 2008/09 2009/10 2010/11 2011/12August - 2,000.0 - 12,000.0 - September 1,000.0 3,520.0 1,000.0 7,000.0 - October 4,570.0 - - - - November - - - - - December - 3,500.0 - - - January - 4,240.0 - - - February - - - - - March - - - - - April 1,000.0 - - - - May - - - - - June - - - - - July - - - - -
Total 6,570.0 13,260.0 1,000.0 19,000.0 -
* The system of repo and reverse repo auction of treasury bills as a monetary instrument was introduced since 2004/05.Repo and reverse repo auction takes place at the initiative of NRB.
Table 8
Reverse Repo Auction*Table 9
Repo Auction*

Mid-Month Purchase Sale Net Injection Purchase Sale Net
Injection Purchase Sale Net Injection Purchase Sale Net
Injection
August 5574.13 183.84 5390.29 5766.14 0.00 5766.14 12823.19 0.00 12823.19 18375.28 0.00 18375.28
September 7770.00 974.74 6795.26 9851.09 0.00 9851.09 11110.19 0.00 11110.19 21283.07 0.00 21283.07
October 18467.03 0.00 18467.03 4561.76 0.00 4561.76 13842.10 0.00 13842.10 28964.09 0.00 28964.09
November 11548.76 0.00 11548.76 6372.05 0.00 6372.05 19304.08 0.00 19304.08 19856.76 0.00 19856.76
December 17492.02 0.00 17492.02 7210.12 0.00 7210.12 13241.12 363.03 12878.09 19211.93 0.00 19211.93
January 13494.70 0.00 13494.70 4258.92 446.76 3812.16 14667.67 0.00 14667.67 18781.57 0.00 18781.57
February 12134.07 0.00 12134.07 8642.31 0.00 8642.31 13870.01 0.00 13870.01 14785.68 0.00 14785.68
March 11919.78 0.00 11919.78 8950.89 0.00 8950.89 14411.04 0.00 14411.04 19341.30 0.00 19341.30
April 10794.48 0.00 10794.48 13701.53 0.00 13701.53 11399.27 0.00 11399.27 21063.93 0.00 21063.93
May 13464.80 0.00 13464.80 15581.09 0.00 15581.09 19306.00 0.00 19306.00 22301.30 0.00 22301.30
June 9098.50 377.70 8720.80 16544.96 0.00 16544.96 17024.00 0.00 17024.00 30485.22 0.00 30485.22
July 12276.90 0.00 12276.90 17665.92 0.00 17665.92 13661.98 0.00 13661.98 23827.30 0.00 23827.30Total 144035.17 1536.28 142498.89 119106.76 446.76 118660.00 174660.64 363.03 174297.61 258277.43 0.00 258277.43
Mid-Month Purchase Sale Net Injection Purchase Sale Net
Injection Purchase Sale Net Injection Purchase Sale Net
InjectionAugust 81.8 2.7 79.1 74.8 0.0 74.8 172.0 0.0 172.0 256.6 0.0 256.6September 109.6 13.8 95.9 126.6 0.0 126.6 149.0 0.0 149.0 288.2 0.0 288.2October 245.2 0.0 245.2 59.8 0.0 59.8 193.9 0.0 193.9 371.0 0.0 371.0November 149.5 0.0 149.5 85.3 0.0 85.3 270.9 0.0 270.9 250.9 0.0 250.9December 219.5 0.0 219.5 97.0 0.0 97.0 182.9 5.0 177.9 231.7 0.0 231.7January 174.5 0.0 174.5 57.4 6.0 51.4 202.3 0.0 202.3 222.4 0.0 222.4February 155.2 0.0 155.2 116.7 0.0 116.7 190.4 0.0 190.4 185.6 0.0 185.6March 147.7 0.0 147.7 121.7 0.0 121.7 199.1 0.0 199.1 244.4 0.0 244.4April 132.6 0.0 132.6 190.2 0.0 190.2 159.6 0.0 159.6 258.7 0.0 258.7May 168.9 0.0 168.9 218.9 0.0 218.9 271.3 0.0 271.3 265.0 0.0 265.0June 119.5 5.0 114.5 222.3 0.0 222.3 236.9 0.0 236.9 345.4 0.0 345.4July 159.1 0.0 159.1 237.1 0.0 237.1 191.3 0.0 191.3 266.3 0.0 266.3
Total 1862.9 21.5 1841.5 1607.6 6.0 1601.6 2419.4 5.0 2414.5 3186.2 0.0 3186.2
* The purchase and sale of foreign exchange takes place at the request (initiative) of commercial banks.
2010/11
Foreign Exchange Intervention*
2009/10
2010/11
2008/09
2008/09
2010/11
(Rs. in Million)2011/12
(US$ in Million)
Table 10 (A)
Table 10(B)Foreign Exchange Intervention (In US Dollar)*
2009/10

Table 11Standing Liquidity Facility (SLF)
(Rs. in Million)
Month 2005/06 2006/07 2007/08 2008/09 2009/10 2010/11 2011/12
August 400.0 0.0 0.0 18150.0 0.0 2950.0 3935.9
September 550.0 370.0 4080.0 3720.0 350.0 0.0 203.6
October 220.0 1575.0 9665.0 11155.0 3700.0 17892.4 69.6
November 0.0 2101.5 13135.0 2500.0 13234.0 30968.0 2.9
December 0.0 1074.7 9310.0 0.0 28178.9 29865.3 0.0
January 753.5 3070.0 10780.0 6010.0 19784.4 40038.3 36.0
February 200.0 0.0 25532.0 12260.0 18527.2 14924.9 45.0
March 160.0 300.0 0.0 29437.5 1394.3 19473.1 54.0
April 950.0 8630.0 3850.0 2150.0 6617.5 15559.9 27.0
May 4800.0 13821.0 21250.0 11220.0 67.1 15101.1 0.0
June 0.0 350.0 4500.0 11180.0 2.9 18952.0 1200.0
July 1850.0 15687.0 1730.0 0.0 4080.0 10949.1 0.0Total 9883.5 46979.2 103832.0 107782.5 95936.3 216674.0 5574.0
Month 2004/05 2005/06 2006/07 2007/08 2008/09 2009/10 2010/11 2011/12August 4309.0 20554.2 13397.0 35455.0 22432.0 9527.0 26345.5 46481.0September 13165.0 24670.5 18830.0 31353.0 21897.0 29763.0 22856.0 23655.0October 12145.0 12021.0 15855.0 35062.0 23934.0 26239.0 24944.0 13401.3November 9056.0 10369.0 14880.0 21472.0 36880.0 30559.5 45845.0 6483.8December 11018.0 15533.0 14180.0 20418.0 21661.0 22845.0 45152.9 8057.0January 11030.0 11255.5 17395.0 24379.0 19955.0 31964.0 36533.4 3737.2February 12710.0 14541.0 8962.0 12236.0 27293.0 24596.0 23749.7 10599.0March 9500.0 20075.0 7713.0 10443.0 18938.6 13045.0 27273.1 16760.0April 18162.0 15654.0 7295.0 12583.9 27518.0 26999.0 18992.7 16372.6May 13050.0 7970.0 20300.0 21570.0 27686.0 16177.0 25360.0 39224.0June 18334.3 10245.0 17397.0 17413.0 23702.0 14110.0 47529.0 20305.0July 20358.5 12862.0 13980.0 15934.2 21522.0 23022.0 52982.5 7692.6
Total 152837.8 175750.2 170184.0 258319.1 293418.6 268846.5 397563.8 212768.6
(Rs. in Million)
Table 12Interbank Transaction Amount and Weighted Average Rate

2005/06 2006/07 2007/08 2008/09 2009/10 2010/11 2011/12P
A Gross Borrowings 11849.9 17892.3 20496.4 18417.1 29914.0 33680.4 32910.0 Treasury Bills 10834.2 12051.6 12500.0 9000.0 19930.0 14997.0 17283.4 Development Bonds 750.0 5500.0 6070.0 7750.0 9041.0 8000.0 14000.0 National Saving Certificates 0.0 0.0 0.0 0.0 0.0 10680.0 1500.0 Citizen Saving Bonds 250.0 340.2 1926.4 1667.1 943.0 3.4 126.6 Special Bonds 15.7 0.5 0.0 0.0 0.0 0.0 0.0
B Payments 7360.0 9614.3 8561.4 8782.5 7928.0 6047.1 6000.4 Treasury Bills 1870.0 1647.5 1912.3 7518.0 4401.0 5535.4 6000.0 Development Bonds 2790.0 4282.1 3511.9 6.9 3000.0 0.0 0.0 National Saving Certificates 2700.0 2359.8 400.0 900.0 217.0 0.0 0.0 Citizen Saving Bonds 0.0 628.1 303.0 247.8 250.0 500.0 0.0 Special Bonds 0.0 696.8 2434.1 109.8 60.0 11.7 0.4
C Net Domestic Borrowings (NDB) (A-B) 4489.9 8278.0 11935.0 9634.6 21986.0 27633.3 26909.6 Treasury Bills 8964.2 10404.1 10587.7 1482.0 15529.0 9461.6 11283.4 Development Bonds -2040.0 1217.9 2558.1 7743.1 6041.0 8000.0 14000.0 National Saving Certificates -2700.0 -2359.8 -400.0 -900.0 -217.0 10680.0 1500.0 Citizen Saving Bonds 250.0 -287.9 1623.4 1419.3 693.0 -496.6 126.6 Special Bonds 15.7 -696.3 -2434.1 -109.8 -60.0 -11.7 -0.4
D Overdraft * 1071.0 -3122.5 -3946.4 8835.8 16711.5 20765.0 -29678.0E NDB net off Overdraft borrowings (C+D) 5560.9 5155.5 9830.6 18470.4 38697.5 48398.3 -2768.4F GDP (at producers price) 654084.0 727827.0 815658.0 988272.0 1193679.0 1369430.0 1558174.0G NDB/GDP in % 6.86 11.37 14.63 9.75 18.42 20.18 17.27H NDB net off Overdraft /GDP in % 8.50 7.08 12.05 18.69 32.42 35.34 -1.78
P Provisional, based on statistics of mid-June of FY 2011/12
(Rs. in Million) Net Domestic Borrowing of the Government of Nepal
Table 13

2010 2010 2011 2011 2011 2011 2012 2012 2012Jul Oct Jan Apr Jul Oct Jan Apr Jul
A. Policy RatesCRR 5.5 5.5 5.5 5.5 5.5 5.0 5.0 5.0 5.0Bank Rate 6.5 7.0 7.0 7.0 7.0 7.0 7.0 7.0 7.0Refinance Rates Against Loans to:
Sick Industries 1.5 1.5 1.5 1.5 1.5 1.5 1.5 1.5 1.5Rural Development Banks (RDBs) 2.0 1.5 1.5 1.5 2.0 1.5 1.5 1.5 1.5Export Credit in Domestic Currency 3.5 1.5 1.5 1.5 3.5 1.5 1.5 1.5 1.5Export Credit in Foreign Currency LIBOR+0.25 LIBOR+0.25 LIBOR+0.25 LIBOR+0.25 LIBOR+0.25 LIBOR+0.25 LIBOR+0.25 LIBOR+0.25 LIBOR+0.25
SLF Penal Rate# 3.0 3.0 3.0 3.0 3.0 3.0 3.0 3.0 3.0B. Government Securities
T-bills* (28 days) 8.7 4.6 8.8 9.7 8.1 0.7 0.2 0.2 0.1T-bills* (91 days) 8.1 5.6 8.2 9.1 8.5 1.8 0.7 1.1 1.2T-bills* (182 days) 8.3 5.6 9.0 8.8 8.6 3.5 2.3 1.8 2.0T-bills* (364 days) 7.3 6.4 8.6 8.8 8.6 4.4 3.0 2.7 2.7Development Bonds 5.0-9.0 5.0-9.0 5.0-9.0 5.0-9.5 5.0-9.5 5.0-9.5 5.0-9.5 5.0-9.5 5.0-9.5National/Citizen SCs 6.0-9.5 6.0-9.5 6.0-9.5 6.0-9.75 6.0-10.0 6.0-10.0 6.0-10.0 6.0-10.0 6.0-10.0
C. Interbank Rate 6.6 5.9 10.6 9.5 8.2 1.1 0.9 0.7 0.9CPI Inflation (annual average) 9.6# The SLF rate is determined at the penal rate added to the weighted average discount rate of 91-day Treasury Bills of the preceding week or repo rate of last 30 days, whichever is higher. * Weighted average discount rateLIBOR =London Interbank Offered Rate
Structure of Interest Rates
Mid-monthYear
(Percent per Annum)
Table 14

(Percent)Annual
Aug Sept Oct Nov Dec Jan Feb Mar Apr May Jun Jul Average1992/93 2049/50 10.17 10.45 12.17 11.68 12.03 12.36 12.57 12.43 11.30 9.56 11.28 11.92 11.341993/94 2050/51 8.49 5.94 7.24 8.74 6.05 3.93 7.57 7.56 6.38 4.93 5.31 6.01 6.501994/95 2051/52 6.36 6.26 6.54 7.02 6.91 6.99 7.38 7.97 8.12 7.94 7.89 8.33 7.351995/96 2052/53 8.34 8.61 8.78 9.14 9.69 11.83 12.68 12.21 10.93 12.70 12.88 12.66 10.931996/97 2053/54 12.18 11.75 11.43 11.63 11.51 11.47 11.62 10.99 9.77 8.51 6.03 5.62 10.221997/98 2054/55 4.87 3.36 3.81 3.36 2.63 2.71 3.90 4.00 4.17 3.44 3.24 2.87 3.521998/99 2055/56 1.61 0.90 0.85 2.88 3.24 3.29 1.61 1.21 2.16 3.09 3.35 3.32 2.331999/00 2056/57 3.40 2.90 3.41 4.09 3.99 4.44 5.16 5.60 5.46 5.73 5.46 5.36 4.662000/01 2057/58 5.43 5.22 4.87 5.24 5.30 5.26 5.17 4.55 3.87 4.67 4.94 4.95 4.962001/02 2058/59 4.78 3.78 4.66 4.96 4.95 4.85 5.19 5.39 5.05 4.86 4.52 3.78 4.712002/03 2059/60 3.42 3.49 3.60 4.03 3.75 4.10 4.01 3.91 4.06 2.91 1.67 2.98 3.482003/04 2060/61 4.03 3.66 3.70 3.68 3.85 3.95 3.94 3.81 1.70 0.70 0.82 1.47 2.932004/05 2061/62 0.62 0.63 1.34 1.97 2.40 2.08 2.38 2.94 3.11 3.70 3.82 3.94 2.462005/06 2062/63 2.26 3.38 3.10 2.69 2.20 2.46 2.20 2.65 2.89 3.63 3.31 3.25 2.842006/07 2063/64 2.99 2.78 2.54 2.11 1.98 2.67 2.60 2.36 1.85 2.43 2.17 2.77 2.422007/08 2064/65 4.25 2.14 2.35 3.03 3.59 3.86 5.79 5.54 4.07 5.32 5.41 5.13 4.222008/09 2065/66 5.17 3.73 6.08 5.55 4.72 4.32 6.64 6.83 5.98 6.73 6.00 6.80 5.832009/10 2066/67 1.77 2.41 2.73 4.67 6.35 8.74 9.01 7.79 7.35 7.41 6.77 8.13 6.502010/11 2067/68 3.81 3.77 5.63 7.73 6.82 8.21 7.78 8.09 9.06 9.00 8.34 8.52 7.412011/12 2068/69 3.98 2.28 1.82 0.97 0.80 0.70 0.61 0.97 1.09 0.83 1.34 1.15 1.31
(Percent)Annual
Aug Sept Oct Nov Dec Jan Feb Mar Apr May Jun Jul Average1997/98 2054/55 - - - - - 6.30 - - 7.25 - 6.99 - 6.861998/99 2055/56 - - - - - - - - 4.91 5.42 5.31 - 5.131999/00 2056/57 - - - - 5.67 5.57 6.08 7.28 6.14 - - - 6.162000/01 2057/58 - - - - 5.73 5.44 5.46 5.11 4.92 5.27 5.52 5.62 5.262001/02 2058/59 - - - - 5.51 5.15 5.66 5.56 5.14 5.04 4.99 4.43 5.202002/03 2059/60 - - - - 4.08 4.46 4.22 4.94 5.13 4.63 3.31 4.93 4.712003/04 2060/61 5.31 5.18 5.30 5.15 5.12 4.95 4.70 4.04 3.02 2.65 2.57 3.81 4.152004/05 2061/62 - - 3.53 - 3.06 2.49 2.78 3.54 3.98 4.84 4.87 4.79 4.322005/06 2062/63 - - 3.87 3.93 3.09 3.42 3.50 3.80 4.31 4.20 3.74 4.04 3.952006/07 2063/64 - - 3.78 3.33 3.04 3.14 3.21 3.01 3.09 3.55 3.19 4.00 3.502007/08 2064/65 - 3.04 3.04 3.28 3.40 4.67 6.45 5.95 4.82 5.30 5.66 6.47 5.492008/09 2065/66 - 3.56 5.57 5.65 4.96 5.20 6.84 6.19 5.96 6.53 6.59 6.55 6.062009/10 2066/67 - 3.39 - 6.04 5.43 7.39 8.11 0.00 7.60 - 6.96 7.28 7.852010/11 2067/68 - 5.41 6.38 7.65 7.19 8.61 - - 8.81 0.00 8.61 8.61 8.352011/12 2068/69 - 4.46 4.43 3.27 2.68 3.03 - 2.41 2.65 0.00 3.44 2.72 2.94
Table 15
FY in B.S.FY Mid-Month
Weighted Average Treasury Bills Rate (91-Days)
Table 16Weighted Average Treasury Bills Rate (364-day)
FY FY in B.S.
Mid-Month

Month/Year 2003/04 2004/05 2005/06 2006/07 2007/08 2008/09 2009/10 2010/11 2011/12
August 4.15 1.02 2.47 2.07 4.10 5.15 1.41 2.46 2.69September 2.67 0.39 3.87 1.83 2.18 2.33 2.00 3.24 1.33October 3.60 0.83 3.18 2.11 3.35 5.16 5.10 5.89 1.08November 4.21 2.24 2.36 1.20 3.73 5.34 9.22 9.79 1.11December 4.63 3.54 0.96 1.34 4.73 2.38 9.93 8.59 1.06January 4.68 3.49 1.22 3.03 4.93 3.37 12.83 10.58 0.90February 4.82 3.95 2.48 2.01 7.55 8.32 11.64 8.45 0.72March 3.67 4.33 2.84 1.39 5.07 6.38 8.85 10.18 0.69April 0.83 4.50 1.97 1.69 2.69 5.06 7.81 9.54 0.69May 1.01 4.28 3.52 3.35 6.48 7.07 7.13 10.43 0.75June 0.99 4.11 1.77 2.72 4.65 5.02 5.52 10.23 0.84July 0.71 4.71 2.13 3.03 3.61 3.66 6.57 8.22 0.86Annual Average 3.03 3.39 2.47 2.26 4.20 5.07 7.74 8.44 1.28
Weighted Average Interbank Transaction Rate (Percent)Table 17

2010/11 2011/12Sanctioned Expenditure 247322.0 276252.3 318318.9 11.7 15.2 Recurrent - - 235492.5 - - Capital - - 43798.1 - - a.Domestic Resources & Loans - - 39059.0 - - b.Foreign Grants - - 4739.1 - -Financial Resources - - 39028.3 - - Internal Resources and Debt - - 38463.1 - - Foreign Grant - - 565.2 - -Unspent Government Balance 6684.6 5195.2 12395.3 -22.3 138.6 Recurrent - - 3706.2 - - Capital - - 2971.3 - - Financial - - 5717.8 - -Actual Expenditure 240637.4 271057.1 305923.6 12.6 12.9 Recurrent - - 231786.3 - - Capital - - 40826.8 - - Financial - - 33310.5 - -Expenditure from Freeze Account 10179.3 6557.9 4822.1 -35.6 -26.5 Freeze 1. Recurrent - - 1452.5 - - Freeze 2. Capital - - 3369.6 - - Freeze 3. Financial - - 0.0 - -Total Expenditure 250816.7 277615.0 310745.7 10.7 11.9Resources 210084.9 227108.7 301791.6 8.1 32.9 Revenue - - 244148.7 - - Foreign Grants - - 46572.0 - - Financial Resources(Principal Payment) - - 4744.7 - - Non-budgetary Revenue, Net - - 4963.4 - - Other Revenues# - - 97.1 - - V.A.T. - - 69.4 - - Custom - - 253.9 - - Local Authority Accounts - - 942.4 - -Deficit (-) Surplus (+) -40731.8 -50506.3 -8954.1 24.0 -82.3Sources of Financing 40731.8 50506.3 8954.1 24.0 -82.3 Internal Loans 36527.8 45572.1 7762.6 24.8 -83.0 Internal Borrowing 29914.0 33680.0 36410.0 12.6 8.1 a. Treasury Bills 19929.9 14996.6 17283.4 -24.8 15.2 b. Development Bonds 9040.9 8000.0 14000.0 -11.5 75.0 c. National Saving Certificate 0.0 10680.0 5000.0 - -53.2 d. Civil Saving Cerficate 943.3 3.4 126.6 -99.6 3622.5 e. Overdraft (+) 7875.7 12889.3 -31770.0 63.7 -346.5 f. Others @ -1261.9 -997.2 3122.6 -21.0 -413.1 Foreign Loan 4204.0 4934.2 1191.5 17.4 -75.9
p Provisional# Change in outstanding amount disbursed to VDC/DDC remaining unspent.+ Negative signs indicates surplus@ Earned interest and others through Nepal Government transaction
Government Financial Statistics is based on 2001. So, statistics since FY 2011/12 cannot be compared with the statistics published in previous years
Headings
(Rs. in Million)
Table 18 Government Financial Situation
(On Cash Basis)
Percentage Change2009/10 2010/11 2011/12p
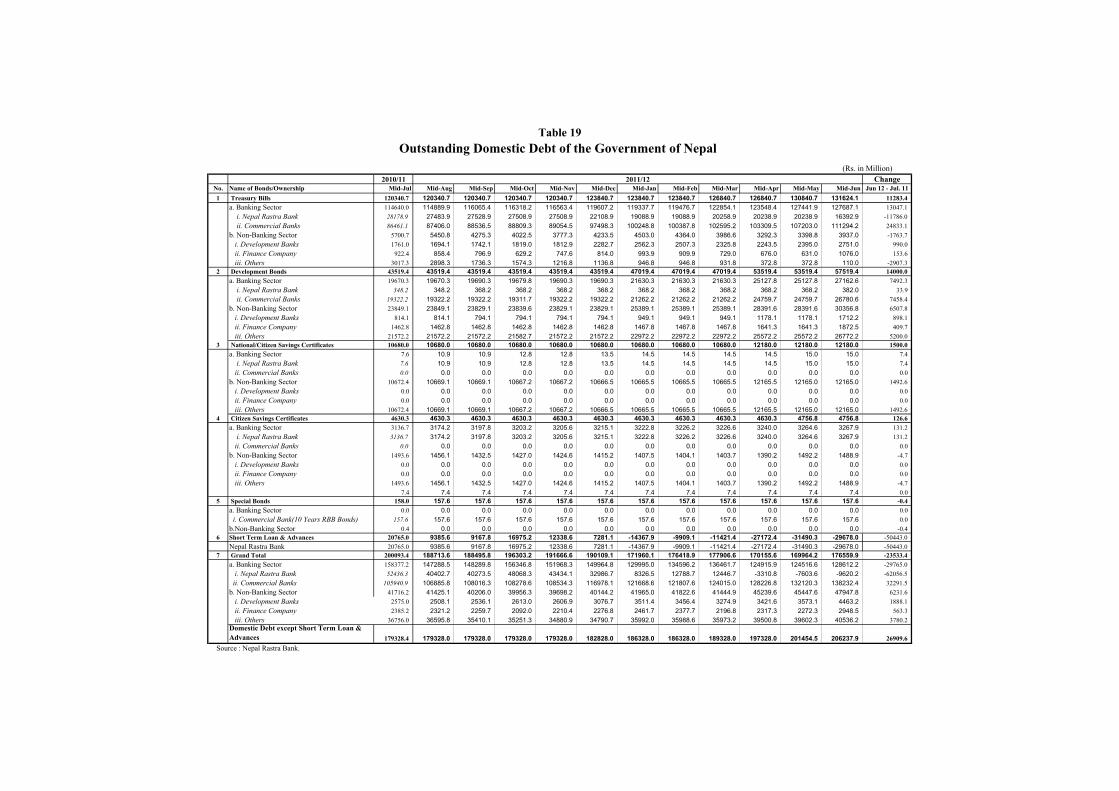
2010/11 ChangeNo. Name of Bonds/Ownership Mid-Jul Mid-Aug Mid-Sep Mid-Oct Mid-Nov Mid-Dec Mid-Jan Mid-Feb Mid-Mar Mid-Apr Mid-May Mid-Jun Jun 12 - Jul. 111 Treasury Bills 120340.7 120340.7 120340.7 120340.7 120340.7 123840.7 123840.7 123840.7 126840.7 126840.7 130840.7 131624.1 11283.4
a. Banking Sector 114640.0 114889.9 116065.4 116318.2 116563.4 119607.2 119337.7 119476.7 122854.1 123548.4 127441.9 127687.1 13047.1 i. Nepal Rastra Bank 28178.9 27483.9 27528.9 27508.9 27508.9 22108.9 19088.9 19088.9 20258.9 20238.9 20238.9 16392.9 -11786.0 ii. Commercial Banks 86461.1 87406.0 88536.5 88809.3 89054.5 97498.3 100248.8 100387.8 102595.2 103309.5 107203.0 111294.2 24833.1b. Non-Banking Sector 5700.7 5450.8 4275.3 4022.5 3777.3 4233.5 4503.0 4364.0 3986.6 3292.3 3398.8 3937.0 -1763.7 i. Development Banks 1761.0 1694.1 1742.1 1819.0 1812.9 2282.7 2562.3 2507.3 2325.8 2243.5 2395.0 2751.0 990.0 ii. Finance Company 922.4 858.4 796.9 629.2 747.6 814.0 993.9 909.9 729.0 676.0 631.0 1076.0 153.6 iii. Others 3017.3 2898.3 1736.3 1574.3 1216.8 1136.8 946.8 946.8 931.8 372.8 372.8 110.0 -2907.3
2 Development Bonds 43519.4 43519.4 43519.4 43519.4 43519.4 43519.4 47019.4 47019.4 47019.4 53519.4 53519.4 57519.4 14000.0a. Banking Sector 19670.3 19670.3 19690.3 19679.8 19690.3 19690.3 21630.3 21630.3 21630.3 25127.8 25127.8 27162.6 7492.3 i. Nepal Rastra Bank 348.2 348.2 368.2 368.2 368.2 368.2 368.2 368.2 368.2 368.2 368.2 382.0 33.9 ii. Commercial Banks 19322.2 19322.2 19322.2 19311.7 19322.2 19322.2 21262.2 21262.2 21262.2 24759.7 24759.7 26780.6 7458.4b. Non-Banking Sector 23849.1 23849.1 23829.1 23839.6 23829.1 23829.1 25389.1 25389.1 25389.1 28391.6 28391.6 30356.8 6507.8 i. Development Banks 814.1 814.1 794.1 794.1 794.1 794.1 949.1 949.1 949.1 1178.1 1178.1 1712.2 898.1 ii. Finance Company 1462.8 1462.8 1462.8 1462.8 1462.8 1462.8 1467.8 1467.8 1467.8 1641.3 1641.3 1872.5 409.7 iii. Others 21572.2 21572.2 21572.2 21582.7 21572.2 21572.2 22972.2 22972.2 22972.2 25572.2 25572.2 26772.2 5200.0
3 National/Citizen Savings Certificates 10680.0 10680.0 10680.0 10680.0 10680.0 10680.0 10680.0 10680.0 10680.0 12180.0 12180.0 12180.0 1500.0a. Banking Sector 7.6 10.9 10.9 12.8 12.8 13.5 14.5 14.5 14.5 14.5 15.0 15.0 7.4 i. Nepal Rastra Bank 7.6 10.9 10.9 12.8 12.8 13.5 14.5 14.5 14.5 14.5 15.0 15.0 7.4 ii. Commercial Banks 0.0 0.0 0.0 0.0 0.0 0.0 0.0 0.0 0.0 0.0 0.0 0.0 0.0b. Non-Banking Sector 10672.4 10669.1 10669.1 10667.2 10667.2 10666.5 10665.5 10665.5 10665.5 12165.5 12165.0 12165.0 1492.6 i. Development Banks 0.0 0.0 0.0 0.0 0.0 0.0 0.0 0.0 0.0 0.0 0.0 0.0 0.0 ii. Finance Company 0.0 0.0 0.0 0.0 0.0 0.0 0.0 0.0 0.0 0.0 0.0 0.0 0.0 iii. Others 10672.4 10669.1 10669.1 10667.2 10667.2 10666.5 10665.5 10665.5 10665.5 12165.5 12165.0 12165.0 1492.6
4 Citizen Savings Certificates 4630.3 4630.3 4630.3 4630.3 4630.3 4630.3 4630.3 4630.3 4630.3 4630.3 4756.8 4756.8 126.6a. Banking Sector 3136.7 3174.2 3197.8 3203.2 3205.6 3215.1 3222.8 3226.2 3226.6 3240.0 3264.6 3267.9 131.2 i. Nepal Rastra Bank 3136.7 3174.2 3197.8 3203.2 3205.6 3215.1 3222.8 3226.2 3226.6 3240.0 3264.6 3267.9 131.2 ii. Commercial Banks 0.0 0.0 0.0 0.0 0.0 0.0 0.0 0.0 0.0 0.0 0.0 0.0 0.0b. Non-Banking Sector 1493.6 1456.1 1432.5 1427.0 1424.6 1415.2 1407.5 1404.1 1403.7 1390.2 1492.2 1488.9 -4.7 i. Development Banks 0.0 0.0 0.0 0.0 0.0 0.0 0.0 0.0 0.0 0.0 0.0 0.0 0.0 ii. Finance Company 0.0 0.0 0.0 0.0 0.0 0.0 0.0 0.0 0.0 0.0 0.0 0.0 0.0 iii. Others 1493.6 1456.1 1432.5 1427.0 1424.6 1415.2 1407.5 1404.1 1403.7 1390.2 1492.2 1488.9 -4.7
7.4 7.4 7.4 7.4 7.4 7.4 7.4 7.4 7.4 7.4 7.4 7.4 0.05 Special Bonds 158.0 157.6 157.6 157.6 157.6 157.6 157.6 157.6 157.6 157.6 157.6 157.6 -0.4
a. Banking Sector 0.0 0.0 0.0 0.0 0.0 0.0 0.0 0.0 0.0 0.0 0.0 0.0 0.0 i. Commercial Bank(10 Years RBB Bonds) 157.6 157.6 157.6 157.6 157.6 157.6 157.6 157.6 157.6 157.6 157.6 157.6 0.0b.Non-Banking Sector 0.4 0.0 0.0 0.0 0.0 0.0 0.0 0.0 0.0 0.0 0.0 0.0 -0.4
6 Short Term Loan & Advances 20765.0 9385.6 9167.8 16975.2 12338.6 7281.1 -14367.9 -9909.1 -11421.4 -27172.4 -31490.3 -29678.0 -50443.0Nepal Rastra Bank 20765.0 9385.6 9167.8 16975.2 12338.6 7281.1 -14367.9 -9909.1 -11421.4 -27172.4 -31490.3 -29678.0 -50443.0
7 Grand Total 200093.4 188713.6 188495.8 196303.2 191666.6 190109.1 171960.1 176418.9 177906.6 170155.6 169964.2 176559.9 -23533.4a. Banking Sector 158377.2 147288.5 148289.8 156346.8 151968.3 149964.8 129995.0 134596.2 136461.7 124915.9 124516.6 128612.2 -29765.0 i. Nepal Rastra Bank 52436.3 40402.7 40273.5 48068.3 43434.1 32986.7 8326.5 12788.7 12446.7 -3310.8 -7603.6 -9620.2 -62056.5 ii. Commercial Banks 105940.9 106885.8 108016.3 108278.6 108534.3 116978.1 121668.6 121807.6 124015.0 128226.8 132120.3 138232.4 32291.5b. Non-Banking Sector 41716.2 41425.1 40206.0 39956.3 39698.2 40144.2 41965.0 41822.6 41444.9 45239.6 45447.6 47947.8 6231.6 i. Development Banks 2575.0 2508.1 2536.1 2613.0 2606.9 3076.7 3511.4 3456.4 3274.9 3421.6 3573.1 4463.2 1888.1 ii. Finance Company 2385.2 2321.2 2259.7 2092.0 2210.4 2276.8 2461.7 2377.7 2196.8 2317.3 2272.3 2948.5 563.3 iii. Others 36756.0 36595.8 35410.1 35251.3 34880.9 34790.7 35992.0 35988.6 35973.2 39500.8 39602.3 40536.2 3780.2Domestic Debt except Short Term Loan &Advances 179328.4 179328.0 179328.0 179328.0 179328.0 182828.0 186328.0 186328.0 189328.0 197328.0 201454.5 206237.9 26909.6
Source : Nepal Rastra Bank.
2011/12
Table 19Outstanding Domestic Debt of the Government of Nepal
(Rs. in Million)

2008/09 2009/10 2010/11Annual Annual Annual 2010/11* 2011/12*
Total Exports 67697.5 60824.00 64338.50 55068.60 57778.70 67214.50 4.9 16.3 To India 41005.9 39993.70 43360.40 36081.80 38791.30 45258.20 7.5 16.7 To Other Countries 26691.6 20830.30 20978.10 18986.80 18987.40 21956.30 0.0 15.6Total Imports 284469.6 374335.20 396175.50 339085.10 359333.30 419573.80 6.0 16.8 From India 162437.6 217114.30 261925.20 195227.10 239688.40 272262.00 22.8 13.6 From Other Countries 122032.0 157220.90 134250.30 143858.00 119644.90 147311.80 -16.8 23.1Total Trade Balance -216772.1 -313511.20 -331837.00 -284016.50 -301554.60 -352359.30 6.2 16.8 With India -121431.7 -177120.60 -218564.80 -159145.30 -200897.10 -227003.80 26.2 13.0 With Other Countries -95340.4 -136390.60 -113272.20 -124871.20 -100657.50 -125355.50 -19.4 24.5Total Foreign Trade 352167.1 435159.20 460514.00 394153.70 417112.00 486788.30 5.8 16.7 With India 203443.5 257108.00 305285.60 231308.90 278479.70 317520.20 20.4 14.0 With Other Countries 148723.6 178051.20 155228.40 162844.80 138632.30 169268.10 -14.9 22.11. Export / Import Ratio 23.8 16.2 16.2 16.2 16.1 16.0 India 25.2 18.4 16.6 18.5 16.2 16.6 Other Countries 21.9 13.2 15.6 13.2 15.9 14.92. Share in Total Export India 60.6 65.8 67.4 65.5 67.1 67.3 Other Countries 39.4 34.2 32.6 34.5 32.9 32.73. Share in Total Import India 57.1 58.0 66.1 57.6 66.7 64.9 Other Countries 42.9 42.0 33.9 42.4 33.3 35.14. Share in Trade Balance India 56.0 56.5 65.9 56.0 66.6 64.4 Other Countries 44.0 43.5 34.1 44.0 33.4 35.65. Share in Total Trade India 57.8 59.1 66.3 58.7 66.8 65.2 Other Countries 42.2 40.9 33.7 41.3 33.2 34.86. Share of Export and Import in Total Trade Export 19.2 14.0 14.0 14.0 13.9 13.8 Import 80.8 86.0 86.0 86.0 86.1 86.2
+ On customs data basis* First eleven months
Direction of Foreign Trade+Table 20
(Rs. in Million)Percent change
2009/10* 2010/11* 2011/12*

2011/1211 months Annual 11 months Annual 11 months 2010/11 2011/12
A. Current Account -28262.5 -28135.2 -14692.1 -12936.4 61560.8 -48.0 -519.0Goods: Exports f.o.b. 57208.5 63177.5 61706.0 68701.5 73904.0 7.9 19.8
Oil 0.0 0.0 0.0 0.0 0.0 - -Other 57208.5 63177.5 61706.0 68701.5 73904.0 7.9 19.8
Goods: Imports f.o.b. -332110.8 -366692.5 -352419.2 -388371.4 -413195.6 6.1 17.2Oil -46004.1 -51607.2 -68167.7 -75076.2 -84455.5 48.2 23.9Other -286106.7 -315085.3 -284251.5 -313295.2 -328740.1 -0.6 15.7
Balance on Goods -274902.3 -303515.0 -290713.2 -319669.9 -339291.6 5.8 16.7Services: Net -15443.6 -16385.3 -8692.8 -8674.6 14231.2 -43.7 -263.7
Services: credit 46736.6 51120.5 47412.8 53012.5 63840.4 1.4 34.6Travel 26401.8 28138.6 22917.3 24610.7 28757.5 -13.2 25.5Government n.i.e. 5754.7 6635.6 5182.1 5534.6 8287.0 -10.0 59.9Other 14580.1 16346.3 19313.4 22867.2 26795.9 32.5 38.7
Services: debit -62180.2 -67505.8 -56105.6 -61687.1 -49609.2 -9.8 -11.6Transportation -21224.4 -22964.6 -16293.9 -18604.7 -19421.1 -23.2 19.2Travel -30157.4 -32288.2 -25502.1 -27642.9 -21046.3 -15.4 -17.5O/W Education -11562.3 -12342.6 -6680.1 -7166.7 -5745.7 -42.2 -14.0
Government services:debit -1807.9 -1874.5 -1113.5 -1154.6 -1403.1 -38.4 26.0Others -8990.5 -10378.5 -13196.1 -14284.9 -7738.7 46.8 -41.4
Balance on Goods and Services -290345.9 -319900.3 -299406.0 -328344.5 -325060.4 3.1 8.6Income: Net 6853.7 9117.4 5818.5 7549.4 9565.0 -15.1 64.4
Income: credit 12174.4 14917.9 14624.0 17504.0 19142.7 20.1 30.9Income: debit -5320.7 -5800.5 -8805.5 -9954.6 -9577.7 65.5 8.8
Balance on Goods, Services and Income -283492.2 -310782.9 -293587.5 -320795.1 -315495.4 3.6 7.5Transfers: Net 255229.8 282647.7 278895.4 307858.7 377056.2 9.3 35.2
Current transfers: credit 259918.5 287770.6 281848.2 311156.7 381636.6 8.4 35.4Grants 24720.5 26673.6 24466.2 25780.0 32293.1 -1.0 32.0Workers' remittances 208421.5 231725.3 229524.2 253551.6 320379.8 10.1 39.6Pensions 24058.3 25850.7 25553.2 28993.4 25774.0 6.2 0.9Other (Indian Excise Refund) 2718.2 3521.0 2304.6 2831.7 3189.7 -15.2 38.4
Current transfers: debit -4688.7 -5122.9 -2952.8 -3298.0 -4580.4 -37.0 55.1B Capital Account (Capital Transfer) 11508.0 12578.3 14395.2 15906.1 15151.7 25.1 5.3Total, Groups A plus B -16754.5 -15556.9 -296.9 2969.7 76712.5 -98.2 -C Financial Account (Excluding Group E) -3432.3 7846.6 970.5 3212.5 28350.7 -128.3 2821.1
Direct investment in Nepal 2414.6 2852.0 6058.1 6437.1 8069.0 150.9 33.2Portfolio Investment 0.0 0.0 0.0 0.0 0.0 - -Other investment: assets -19256.1 -18253.9 -22258.3 -25762.2 -11734.5 15.6 -47.3
Trade credits -2011.8 -1009.0 -4824.5 -6133.4 -3991.2 139.8 -17.3Other -17244.3 -17244.9 -17433.8 -19628.8 -7743.3 1.1 -55.6
Other investment: liabilities 13409.2 23248.5 17170.7 22537.6 32016.2 28.1 86.5Trade credits 18032.6 21968.9 18756.0 18292.5 25197.8 4.0 34.3Loans -3402.5 -3933.5 -2141.9 2612.0 -239.0 -37.0 -88.8
General Government -3371.7 -3901.5 -2126.2 2631.6 -227.6 -36.9 -89.3Drawings 6332.4 6841.6 8652.5 13849.2 10830.6 36.6 25.2Repayments -9704.1 -10743.1 -10778.7 -11217.6 -11058.2 11.1 2.6
Other sectors -30.8 -32.0 -15.7 -19.6 -11.4 -49.0 -27.4Currency and deposits -7466.0 -1031.3 155.1 1231.7 7545.7 -102.1 4765.1
Nepal Rastra Bank 0.0 44.9 -44.5 -7.8 -37.2 - -16.4Deposit money banks -7466.0 -1076.2 199.6 1239.5 7582.9 -102.7 3699.0
Other liabalities 6245.1 6244.4 401.5 401.4 -488.3 -93.6 -221.6Total, Group A through C -20186.8 -7710.3 673.6 6182.2 105063.2 -103.3 15496.3D. Miscellaneous Items, Net 1858.4 3353.3 -854.1 -2767.8 15697.7 -146.0 -1937.8Total, Group A through D -18328.4 -4357.0 -180.5 3414.4 120760.9 -99.0 -67003.5E. Reserves and Related Items 18328.4 4357.0 180.5 -3414.4 -120760.9 -99.0 -67003.5
Reserve assets 15029.6 1058.2 583.2 -3011.7 -120275.9 -96.1 -20723.4Nepal Rastra Bank 10870.4 4398.2 -6611.7 -7531.4 -114348.2 -160.8 1629.5Deposit money banks 4159.2 -3340.0 7194.9 4519.7 -5927.7 73.0 -182.4
Use of IMF's Credit and Loans 3298.8 3298.8 -402.7 -402.7 -485.0 - 20.4Changes in reserve, net ( - increase ) 10862.4 3325.7 335.6 -2182.7 -113215.2 -96.9 -33835.2
Balance of Payments SituationTable 21
2010/11
(Rs in Million)
Particulars 2009/10Percent Change
During Eleven Months

Percent Change2007 2008 2008 2009 2011 2012 Mid-Jul To Mid-Jun
Mid-Jul. Mid-Jun Mid-Jul Mid-Jun Mid-Jul Mid-JunE 2010/11 2011/12Nepal Rastra Bank 224190.3 196840.9 205371.3 213538.6 213095.1 361954.3 4.0 69.9
Convertible 201756.0 160787.1 165992.7 172872.7 165257.5 272666.6 4.1 65.0Inconvertible 22434.3 36053.8 39378.6 40665.9 47837.6 89287.7 3.3 86.6
Commercial Bank 60070.4 58289.9 63517.4 56386.3 59058.0 65059.0 -11.2 10.2Convertible 56475.5 53029.3 58203.8 53238.6 55503.3 56846.0 -8.5 2.4Inconvertible 3594.9 5260.6 5313.6 3147.7 3554.7 8213.0 -40.8 131.0
Total Reserve 284260.7 255130.8 268888.7 269924.9 272153.1 427013.3 0.4 56.9Convertible 258231.5 213816.4 224196.5 226111.3 220760.8 329512.6 0.9 49.3 Share in total (in percent) 908.4 838.1 833.8 837.7 811.2 771.7 - -Inconvertible 26029.2 41314.4 44692.2 43813.6 51392.3 97500.7 -2.0 89.7 Share in total (in percent) 91.6 161.9 166.2 162.3 188.8 228.3 - -
Import Capacity (Equivalent Months)Merchandise 12.22 8.36 8.70 8.43 8.41 11.37 - -Merchandise and Services 9.96 7.04 7.35 7.27 7.26 10.15 - -
1.Gross Foreign Exchange Reserve 284260.7 255130.8 268888.7 269924.9 272153.1 427013.3 0.4 56.92.Gold, SDR, IMF Gold Tranche 555.3 6137.6 6315.3 6842.4 6730.6 7428.1 8.3 10.43.Gross Foreign Assets(1+2) 284816.0 261268.4 275204.1 276767.3 278883.7 434441.4 0.6 55.84.Foreign Liabilities 60392.8 57456.4 61998.4 61904.7 62844.5 71378.5 -0.2 13.65.Net Foreign Assets(3-4) 224423.3 203812.0 213205.7 214862.7 216039.2 363062.9 0.8 68.16.Change in NFA (before adj. ex. val.)* -52967.8 20611.2 11217.6 -1657.0 -2833.5 -147023.7 - -7.Exchange Valuation (- loss) 8348.4 -9887.8 -7891.9 1992.6 650.8 33808.5 - -8.Change in NFA (- increase) (6+7)** -44619.4 10723.4 3325.7 335.6 -2182.7 -113215.2 - -Period end buying rate (Rs/US$): 780.50 746.00 744.40 714.90 709.50 886.00 - -
E Estimated. * Change in NFA is derived by taking mid-July as the base and minus (-) sign indicates an increase. ** After adjusting exchange valuation gain/loss. Sources: Nepal Rastra Bank and commercial banks.
Particulars
Table 22Gross Foreign Exchange Holding of the Banking Sector
(Rs in Million)

Mid-Month 2005/06 2006/07 2007/08 2008/09 2009/10 2010/11 2011/12
August 980.1 957.5 2133.8 3417.4 3939.5 2628.6 3024.0
September 977.6 1208.0 1655.2 2820.1 4235.2 4914.0 5135.3
October 907.9 865.7 2411.6 1543.5 4145.5 4589.3 3823.3
November 1103.2 1188.3 2065.7 1571.4 3894.8 2064.9 3673.0
December 1583.7 1661.4 2859.9 2301.6 4767.4 3785.0 5468.8
January 1156.2 1644.0 3805.5 2016.8 4917.8 4026.8 5113.1
February 603.8 717.0 2962.1 2007.5 5107.5 5404.1 5923.4
March 603.0 1428.5 1963.1 2480.1 3755.8 4548.2 5524.6
April 1398.6 2052.9 3442.1 3768.2 4382.1 4505.9 4638.7
May 916.4 2714.8 3420.2 3495.0 3427.2 3263.9 5139.6
June 1181.5 1711.2 2205.7 3452.1 3016.2 4066.7 5497.4
July 1394.0 1571.8 3091.4 4253.1 2113.9 3970.4
Total 12805.9 17720.9 32016.4 33126.8 47702.9 47768.0 52961.1*
Mid-Month IC Purchase US$ Sale IC Purchase US$ Sale IC Purchase US$ Sale IC Purchase US$ Sale IC Purchase US$ SaleAugust 3641.6 90.0 5969.6 140.0 15930.4 330.0 7447.4 160.0 11624.7 260.0September 3675.4 90.0 2644.1 60.0 8748.6 180.0 9334.2 200.0 11060.0 240.0October 5542.7 140.0 3257.1 70.0 5630.0 120.0 9010.2 200.0 9697.6 200.0November 3932.4 100.0 10657.1 220.0 3739.2 80.0 6212.9 140.0 15859.2 320.0December 5531.6 140.0 6950.8 140.0 7453.6 160.0 14525.9 320.0 14515.7 280.0January 3943.5 100.0 4381.8 90.0 8316.9 180.0 9025.6 200.0 6380.3 120.0February 5125.8 130.0 6352.3 130.0 8302.1 180.0 10019.9 220.0 9969.6 200.0March 4799.9 120.0 7561.7 150.0 5503.2 120.0 8154.5 180.0 8907.2 180.0April 5624.8 140.0 5621.9 110.0 7246.6 160.0 12543.9 280.0 17195.6 340.0May 6474.8 160.0 6495.8 130.0 11627.9 260.0 12447.1 280.0 9503.3 180.0June 7678.4 180.0 5298.2 110.0 9332.1 200.0 12594.0 280.0 9980.1 180.0July 14631.6 340.0 8210.4 170.0 10263.0 220.0 12529.0 280.0 9025.3 160.0Total 70602.5 1730.0 73400.6 1520.0 102093.2 2190.0 123844.4 2740.0 133718.4 2660.0
* Aggregate of first eleven months
(Rs. in Million)
(Rs. in Million)
Table 23Import from India
Against US Dollar Payment
Table 24Indian Currency Purchase
2011/122007/08 2008/09 2009/10 2010/11