Monetary policy effectiveness in China: Evidence from a FAVAR model
21
Monetary policy effectiveness in China: Evidence from a FAVAR model * John G. Fernald 1 , Mark M. Spiegel * , Eric T. Swanson 2 Federal Reserve Bank of San Francisco, Economic Research,101 Market St, MS 1130 San Francisco, CA, USA article info Article history: Available online 20 May 2014 JEL codes: C3 E4 E5 Keywords: Measuring China's economy Dynamic factor model Factor-augmented VAR Monetary policy abstract We use a broad set of Chinese economic indicators and a dynamic factor model framework to estimate Chinese economic activity and inflation as latent variables. We incorporate these latent variables into a factor-augmented vector autoregression (FAVAR) to estimate the effects of Chinese monetary policy on the Chinese economy. A FAVAR approach is particularly well-suited to this analysis due to concerns about Chinese data quality, a lack of a long history for many series, and the rapid institutional and structural changes that China has undergone. We find that increases in bank reserve re- quirements reduce economic activity and inflation, consistent with previous studies. In contrast to much of the literature, however, we find that central-bank determined changes in Chinese interest rates also have substantial impacts on economic activity and inflation, while other measures of changes in credit conditions, such as shocks to M2 or lending levels, do not once other policy variables are taken into account. Overall, our results indicate that the monetary policy transmission channels in China have moved closer to those of Western market economies. Published by Elsevier Ltd. * The views expressed in this paper are those of the authors, and do not necessarily reflect those of anyone else affiliated with the Federal Reserve System. * Corresponding author. Tel.: þ1 415 974 3241. E-mail addresses: [email protected] (J.G. Fernald), [email protected] (M.M. Spiegel), [email protected] (E.T. Swanson). 1 Tel.: þ1 415 974 2135. 2 Tel.: þ1 415 974 3172. Contents lists available at ScienceDirect Journal of International Money and Finance journal homepage: www.elsevier.com/locate/jimf http://dx.doi.org/10.1016/j.jimonfin.2014.05.007 0261-5606/Published by Elsevier Ltd. Journal of International Money and Finance 49 (2014) 83e103
Transcript of Monetary policy effectiveness in China: Evidence from a FAVAR model

Journal of International Money and Finance 49 (2014) 83e103
Contents lists available at ScienceDirect
Journal of International Moneyand Finance
journal homepage: www.elsevier .com/locate/ j imf
Monetary policy effectiveness in China: Evidencefrom a FAVAR model*
John G. Fernald 1, Mark M. Spiegel*, Eric T. Swanson 2
Federal Reserve Bank of San Francisco, Economic Research, 101 Market St, MS 1130 San Francisco, CA, USA
a r t i c l e i n f o
Article history:Available online 20 May 2014
JEL codes:C3E4E5
Keywords:Measuring China's economyDynamic factor modelFactor-augmented VARMonetary policy
* The views expressed in this paper are those of tthe Federal Reserve System.* Corresponding author. Tel.: þ1 415 974 3241.
E-mail addresses: [email protected] (J.G. FeSwanson).
1 Tel.: þ1 415 974 2135.2 Tel.: þ1 415 974 3172.
http://dx.doi.org/10.1016/j.jimonfin.2014.05.0070261-5606/Published by Elsevier Ltd.
a b s t r a c t
We use a broad set of Chinese economic indicators and a dynamicfactor model framework to estimate Chinese economic activity andinflation as latent variables. We incorporate these latent variablesinto a factor-augmented vector autoregression (FAVAR) to estimatethe effects of Chinese monetary policy on the Chinese economy. AFAVAR approach is particularly well-suited to this analysis due toconcerns about Chinese data quality, a lack of a long history formany series, and the rapid institutional and structural changes thatChina has undergone. We find that increases in bank reserve re-quirements reduce economic activity and inflation, consistent withprevious studies. In contrast to much of the literature, however, wefind that central-bank determined changes in Chinese interestrates also have substantial impacts on economic activity andinflation, while other measures of changes in credit conditions,such as shocks to M2 or lending levels, do not once other policyvariables are taken into account. Overall, our results indicate thatthe monetary policy transmission channels in China have movedcloser to those of Western market economies.
Published by Elsevier Ltd.
he authors, and do not necessarily reflect those of anyone else affiliated with
rnald), [email protected] (M.M. Spiegel), [email protected] (E.T.
J.G. Fernald et al. / Journal of International Money and Finance 49 (2014) 83e10384
1. Introduction
China's economy has experienced remarkable structural and institutional change in recent decades.This change may affect the efficacy of counter-cyclical monetary and fiscal policy for Chinese economicactivity and inflation. In this paper, we examine whether or not that is the case in the context of afactor-augmented vector autoregression, or FAVAR, along the lines of Bernanke and Boivin (2003) andBernanke et al. (2005). Most previous studies have found that market-basedmonetary policies, such asinterest rates and reserve requirements, are unimportant in China relative to more direct, blunt creditpolicies such as “window guidance” for commercial bank lending levels. In contrast to this literature,we find, using recent data, that interest rates and reserve requirements are more important than directquantity measures of lending (which, on their own, are insignificant). These results suggest thatongoing institutional changes in China may have led the monetary policy transmission mechanism inthat country to have becomemore similar to that in the U.S. and otherWesternmarket economies (see,e.g., Bernanke and Blinder, 1992; Christiano et al., 1999).
Studying the monetary transmission mechanism in China raises two interesting challenges thatmotivate our approach of using a FAVAR model on relatively recent data. First, the well-knownskepticism about the quality of Chinese datadwhich even Vice Premier Li Keqiang famouslyadmitted were unreliable3dmakes a FAVAR very appropriate. That is, we take a broad and expansiveapproach and use a large number of series associated with Chinese economic activity and inflation toestimate the true underlying, latent values of these series. Second, the rapid pace of institutional andstructural change in China motivates our focus on the recent period, which includes both the GreatRecession and the ensuing recovery. To the extent that China's economy, as well as its policy andbanking institutions, have become more market-oriented, it is reasonable to think that the monetarytransmission mechanism might have evolved as well.
In terms of Chinese data, the quality of the reported output figures has long been under scrutiny(e.g., Holz, 2003, 2008; Nakamura et al., 2014). One approach, which we follow in our FAVAR model, isto focus on a variety of measures of economic activity. For example, Vice Premier Li claimed that helooked at several indicators such as electricity production, rail cargo shipments, and loan disburse-ments to gauge Chinese economic activity. In a recent study, Fernald and Spiegel (2013) validate theinformation content of a range of indicators of Chinese economic activity relative to an external, in-dependent statistical measure of that activitydnamely, exports to China and Hong Kong, as reportedby their major trading partners (the United States, European Union, and Japan). This measure should behighly correlated with true economic activity (either through domestic absorption or through re-processing for export), but is not subject to manipulation or bias by Chinese officials. Fernald andSpiegel report that a number of the alternative indicators they examine are more informative than isGDP asmeasures of economic activity. Moreover, they find that these alternative indicators typically dobetter in combinationdi.e., taking the first principal component of a set of indicators. They find that asmall set of indicators are particularly informative (electricity usage, new floor space added, China'sreported exports, and raw materials used), but the more general point is the informational content ofthe economic indicators other than GDP.
A FAVAR approach is particularly well suited to examinemonetary policy effectiveness when outputand inflation are imperfectly observed, latent variables. Under this approach, one considers a largenumber of economic indicators to estimate the unobserved latent variables that drive the systematiccomponents of the economy. This approach also minimizes ad hoc decisions about which data toinclude in a VAR and which not. Indeed, even in the U.S. context with relatively reliable data, Bernankeand Boivin (2003) and Bernanke et al. (2005) note that series such as output and inflation are notdirectly observabledthere are a variety of measures of each. They argue that the FAVAR approach leadsto better empirical estimates.
Applied to China, the dynamic factor model approach distills a diverse set of economic indicatorsinto underlying factors representing Chinese economic activity and inflation. The factor-model logic
3 Wikileaks (2007).
J.G. Fernald et al. / Journal of International Money and Finance 49 (2014) 83e103 85
suggests that such activity and inflation factors are plausiblymore accuratemeasures of these variablesthan any individual data series, and therefore may better represent the information sets relevant forpolicymakers or used by economic agents to make decisions.
Turning to the monetary transmission mechanism, market-based monetary policy instruments(such as changes in interest rates) were generally considered inadequate to control China's economy inthe 1990s. For example, Qin et al. (2005) argue that this inadequacy reflected the slower pace of re-forms in the banking and financial sectors relative to the rest of the economy. As a result, studies of thisperiod suggest that interest-rate policies pursued by the Peoples' Bank of China (PBOC) had little, if any,impact on the real side of the Chinese economy (e.g., Geiger, 2006; Laurens and Maino, 2007). Instead,policymakers seeking to control cyclical fluctuations relied on relatively direct credit policies, such astelling banks when to lend and not to lend. Studies of monetary policies pursued by the PBOC duringthis period tend to find that themonetary authority pursued a simplemoney growth rule, as in the caseof Burdekin and Siklos' (2008) findings for their 1990e2003 sample period.
As the 1990s came to a close, financial liberalization in China appeared to increase the impact ofmonetary policydand interest-rate policies in particulardon the real side of the Chinese economy(e.g., Dickinson and Liu, 2007). Zhang (2009) demonstrates in a DSGE model of the modern Chineseeconomy that an interest rate targeting rule employed by the PBOCwould likely be more effective thana money supply targeting rule in stabilizing China's economy. Chen et al. (2011) argue that the effec-tiveness of non-standard forms of monetary policy, such as “window guidance” for commercial banklending levels, are likely to diminish as financial markets become less distorted. Similarly, Fukumotoet al. (2010) argue that Chinese window guidance has been successful in the past, but that its suc-cess will diminish as the Chinese financial sector develops, in favor of more standard instruments, suchas policy interest rates. Still, financial liberalization is incomplete in China, with remaining ceilings onbank deposit rates and floors on lending rates (e.g. Feyzio�glu et al., 2009).
Given this institutional environment, it is an open question how standard China's monetarytransmission mechanism currently is, where the standard monetary transmission channel would beexemplified by the findings in Bernanke and Blinder (1992) and Christiano et al. (1999).4 To investigatethis issue, we incorporate our dynamic factor model estimates of Chinese output and inflation into astandard monetary policy VAR, identified via a recursive ordering as in the studies above.
We begin with a simple three-equation FAVAR, comprising an economic activity factor, an inflationfactor, and a (single) monetary policy instrument. In contrast to the previous literature, we find thatincreases in PBOC benchmark interest rates have standard impulse responsesdthat is, economic ac-tivity slows significantly in response to the shock, and inflation falls. Increases in reserve requirementsalso slow economic activity significantly. In contrast, innovations to M2 or lending have modestdandstatistically insignificantdeffects on output and inflation.5
These findings are representative of those from larger FAVAR systems as well: Innovations to in-terest rates and reserve requirements have economically and statistically significant effects, while ourlarge standard error estimates for innovations to lending, M2, and government spending are consistentwith no impact.
Of course, lending could still be part of the monetary transmission mechanism, as it is in standardmarket-oriented economies such as the U.S. That is, increases in interest rates and (to a lesser extent)reserve requirements do reduce the pace of growth of lending and monetary aggregates. The lack of an
4 It is beyond the scope of this paper to analyze the full range of policy tools. Today, Chinese monetary policy employsmultiple instruments and targets (He and Wang, 2012), and the relative importance of these instruments is unclear. He andWang (2012) characterize China's monetary policy framework as a “dual rate system,” where deposit and lending rates, aswell as window guidance targets for lending are set by monetary authorities, while bond rates are market-determined. Theyargue that this framework is conducive to continued liberalization of Chinese financial markets. We also do not discuss optimalpolicy. Liu and Zhang (2010) demonstrate in a particular model for China that a hybrid monetary policy that targets both themoney supply and the interest rate would outperform one that targets the interest rate alone.
5 We also consider the effects of a fiscal policy instrumentdoverall government spendingdbecause, to the extent thatChinese policymakers use multiple levers simultaneously, changes in monetary instruments could have a fiscal component aswell. However, we find that the standard error bands for the effects of government spending are very large, due the very highmonth-to-month volatility of that variable.

J.G. Fernald et al. / Journal of International Money and Finance 49 (2014) 83e10386
independent effect of innovations in these aggregates to these variables is consistent with typicalfindings for the U.S., wheremuch of the variation in quantity aggregates reflects idiosyncratic shocks tomoney demand rather than systematic policy (e.g., Bernanke and Blinder, 1992).
Our FAVAR allows us to analyze the role of countercyclical policy during and since the recentglobal financial crisis. China's growth experience during this period was exceptional: while economicactivity in both advanced and emerging economies fell dramatically, China's real GDP growthremained robust, averaging 7.4 percent during the period covering the U.S. recession. (This perfor-mance is all the more remarkable given that China's heavy reliance on trade might have been ex-pected to make it exceptionally vulnerable to the global downturn.) Surprisingly, we find that China'sstrong performance during the global financial crisis was not attributable to countercyclical mon-etary policy pursued by the Chinese government. That is, in the context of our FAVAR, when we setthe interest-rate and reserve-ratio innovations to zero, China's economic performance during thecrisis would actually have been better. The reason is timing: China was tightening monetary policyearly in 2008. Given the estimated transmission lags, the contractionary effects of that tighteningwere hitting the economy in late 2008 and into 2009dexacerbating the effects of the global financialcrisis on China.
The paper most closely related to the present one is He et al. (2013), who also use a FAVAR model toestimate the effects of Chinese monetary policy on the Chinese economy.6 In contrast to the presentpaper, those authors treat Chinese output and inflation as observed variables (measured by industrialproduction and the consumer price index, respectively), and use latent factors to capture the effects ofother variables on the Chinese economy, such as other Chinese economic indicators and measures ofU.S. output and inflation. They find that industrial production responds modestly to a shock to eitherthe benchmark lending rate or “market-based” PBOC policies, but responds strongly to shocks to totallending or M2. In contrast, we apply a dynamic factor model to Chinese output and inflation as well,given the widespread concerns about the quality of official Chinese measures of those variables. Wealso perform our analysis on a more recent sample then He et al. (2013), and are thus better able tostudy the performance of the Chinese economy during the recent global financial crisis and recovery.
The remainder of our paper is organized into 6 sections. Section II introduces our FAVAR meth-odology. Section III describes our data. Section IV presents our main results. Section V conducts anumber of robustness checks of those results. Section VI concludes. An Appendix provides someadditional robustness analysis.
2. FAVAR estimation method
Economic agents in China and elsewhere look at awide variety of economic indicators to synthesizea view of the state of the economy. However, estimating a standard vector autoregression (VAR) for alarge system of variables is infeasible without a very long history of data. This is particularly prob-lematic for China, due to its combination of limited data availability and rapid structural trans-formation. In practice, then, the relatively short samples of consistent data that we have for Chineseseries makes estimation of large VARs either impossible or highly unreliable due tooverparameterization.
In a dynamic factormodel, however, a small number of essential factors are extracted from the set ofall observable datadfor example, a Chinese “economic activity” factor can be extracted from dataseries on industrial production, electricity use, rail cargo shipments, loan disbursements, internationaltrade data, and so on. By focusing attention on the essential underlying factor (economic activity), thedimensionality of the model can be greatly reduced, allowing for estimation of a VAR in the underlyingfactor.
In particular, we assume that our numerous Chinese economic indicators, Xt, are determined byonly a small number of underlying factors, Ft, plus idiosyncratic noise, εt, according to:
6 Lescaroux and Mignon (2009) also estimate a FAVAR model for China to measure the impact of global oil shocks on theChinese economy. They do not examine the effects of monetary policy, but do include M2 as one of their economic indicatorvariables.

J.G. Fernald et al. / Journal of International Money and Finance 49 (2014) 83e103 87
Xt ¼ LFt þ εt (1)
where t indexes observations, the size of the vector Ft is less than the size of the vector Xt, and thematrix L is called the loadings of the indicators X on the factors F. The idiosyncratic errors εt may becorrelated both across series and across observations t, so long as that correlation is not “too strong.”7
In a dynamic factor model, the factors F (and data series X) are related over time, typically accordingto a linear process:
Ft ¼ AðLÞFt�1 þ ht (2)
where A(L) denotes a polynomial in the lag operator. Dynamic factor models date back to papers byGeweke (1977) and Sims and Sargent and Sims (1977). They have enjoyed a great resurgence of interestsince Stock andWatson (1998, 1999), and Forni et al. (2000), building on previous work by Connor andKorajczyk (1986), showed how these models can be efficiently applied to large panels of macroeco-nomic time series.
A factor-augmented VAR, or FAVAR, is a VAR inwhich some of the variables are factors taken from adynamic factor model:
�FtYt
�¼ AðLÞ
�Ft�1Yt�1
�þ ht (3)
where Yt denotes a vector of observable variables and Ft a vector of factors as above. Thus, a FAVARdiffers from a dynamic factor model in two main respects: First, some of the factors are assumed to bedirectly observed, while in a dynamic factor model this is generally not the case.8 Second, in a FAVAR,the econometrician is typically interested in identification of the FAVAR, rather than just forecasting.Thus, the key objects of interest in a FAVAR are typically impulse response functions or variance de-compositions, rather than just forecasts.
Following Stock andWatson (1998, 1999), we use principal components to estimate the factors Ft inthe dynamic factor model (1). This method is numerically robust and computationally efficient, and iseconometrically consistent for the latent factors F under the standard technical conditions discussed inStock andWatson (1998,1999). In contrast to Stock andWatson, but consistent with some other studiesin the literature (e.g., Ang and Piazzesi, 2003), we divide our economic indicators into two groupsdonecontaining measures of output and the other containing measures of inflationdand extract the firstprincipal component from each group to get our measures of an “output” factor and an “inflation”factor.9 This approach aids intuition by ensuring that each factor has a clear economic interpretation.10
Given that many Chinese series have short histories or other periods of missing data, our treatmentof missing data is of central importance.We first estimate the latent factors F and factor loadingsL fromthe data X using only those months for which we have data on all series, say from some date t0 to theend of our sample T. We next impute values for any data that are missing in month t0�1. We infer thevalues of the latent factors Ft0�1 using the data that are observed inmonth t0�1 together with the factor
7 For details, see Chamberlain and Rothschild (1983) and Stock and Watson (2002). In the classical literature on factoranalysis, the idiosyncratic errors ε are assumed to be uncorrelated across series and over time. This led Chamberlain andRothschild (1983) to coin the term “approximate factor model” to refer to the more general case considered here. Consistentwith the modern literature, we use the term “factor model” to refer to the more general case.
8 Bernanke and Boivin's (2003) preferred specification for U.S. data is to treat the federal funds rate as the observed variablein the model, but they also consider specifications in which output and/or inflation are also observed. For China, He et al. (2013)assume that industrial production and the CPI are observable variables. Given the questions that have been raised about thequality of Chinese data, we prefer to treat IP and the CPI as noisy indicators of the underlying latent activity and inflationfactors.
9 We also considered a specification with two output factors, measured as the first and second principal components of theeconomic activity indicators, and an inflation factor measured in the same way as above. The variance shares of the outputfactors were about 16% and 12%, respectively. While the second factor's variance was non-trivial, the impulse response func-tions for the extended six-variable FAVAR were quite similar to that reported for our baseline five-variable FAVAR below. Wethus use a single output factor for our baseline specification in the interest of parsimony.10 In the robustness analysis of Section V, we consider the alternative approach of extracting two factors from all of the datacollected into a single group.

J.G. Fernald et al. / Journal of International Money and Finance 49 (2014) 83e10388
loadings L and variances of the idiosyncratic errors ε and n. Once we have imputed values for themissing data in month t0�1, we reestimate the factor loadings L and latent factors F over the samplefrom t0�1 to T. We iterate this process backward, month by month, until we have imputed missingvalues for all series in all months t. This is essentially the same procedure as advocated by Stock andWatson (1998) for dealing with missing data.
As we demonstrate below, our estimate of Chinese economic activity captures well the broadmacroeconomic movements in China, particularly the impact of the global financial crisis and thesubsequent recovery from that period. Following Bernanke and Boivin (2003) and Bernanke et al.(2005), we then incorporate our estimate of Chinese economic activity into a VAR. We can thenapply standard VAR methods to estimate and identify the effects of Chinese monetary policy on theeconomy.
An important question is how we identify the monetary policy instrument and monetary policyshocks. For equation (3), we treat the policy variables as observables, i.e., the elements of Y. We thenassume a typical recursive ordering, with the economic activity and inflation factors ordered first,followed by the policy variablesdi.e., we assume that policy can respond endogenously to changes inactivity or inflationwithin themonth, but that policy innovations affect economic activity and inflationwith a lag of one month or more.
3. Data
We start our sample in January 2000 and end in September 2013. Because of rapid institutional andstructural change in China, data from the 1990s is arguably not very informative about the currentworkings of monetary policy, a view that is supported by He et al. (2013), who identify a structuralbreak in the relationships among Chinese data in 2002. Importantly, our sample period covers thesharp downturn during the global financial crisis as well as China's rapid subsequent recovery.
Note that some of the most important series that one might want to include in a set ofmeasures of economic activity, such as the PMI manufacturing index, are only available for Chinabeginning relatively recently, in 2005. This highlights the usefulness of our FAVAR methodologyfor China, which allows the inclusion of variables that have missing values over some portion ofour sample.11
The Chinese New Year raises a particular challenge. This holiday has a major effect on monthlyeconomic activity, but sometimes falls in January, sometimes in February, and sometimes crosses bothmonths. We address this issue for each individual economic activity and inflation variable xit by firstaveraging the values of the series for January and February. We then distribute that average valueacross the two months assuming that the growth rate from December to January equals the growthrate from January to February. This assumption addresses the large swings in economic activity thatappear in our data for these two months, but also implies that we are not getting any identificationfrom those two months considered separately.
After removing the effects of the Chinese New Year, we use the Census X-12 ARIMA package toseasonally adjust the raw levels of each individual variable.12 We then take month-to-month growthrates (calculated as 100 times the log-change) of each series and, following Stock and Watson (2012),remove a local mean from each series via a biweight filter. We then apply the factor-model method-ology as described above to the seasonally-adjusted monthly growth rates in order to extract the ac-tivity and price factors.
A list of all the variables included in our study is provided in Table 1 (all variables were downloadedfrom the CEIC Asia Database). As in Ang and Piazzesi (2003), we divide the data series into two
11 Although our FAVAR model is designed to fill in missing variables, the lack of continuity in the data is also a reason forfocusing on the more recent period rather than extending back to the 1990s. In particular, if most of the variables are missing, itis unclear how comparable the estimated factors are over time.12 In principle, the X-12 package can be used to adjust for moving holidays or other calendar effects such as Chinese New Year.However, those adjustments require imposing a fair degree of judgment about the impact of these calendar effects that isbeyond the scope of this paper.
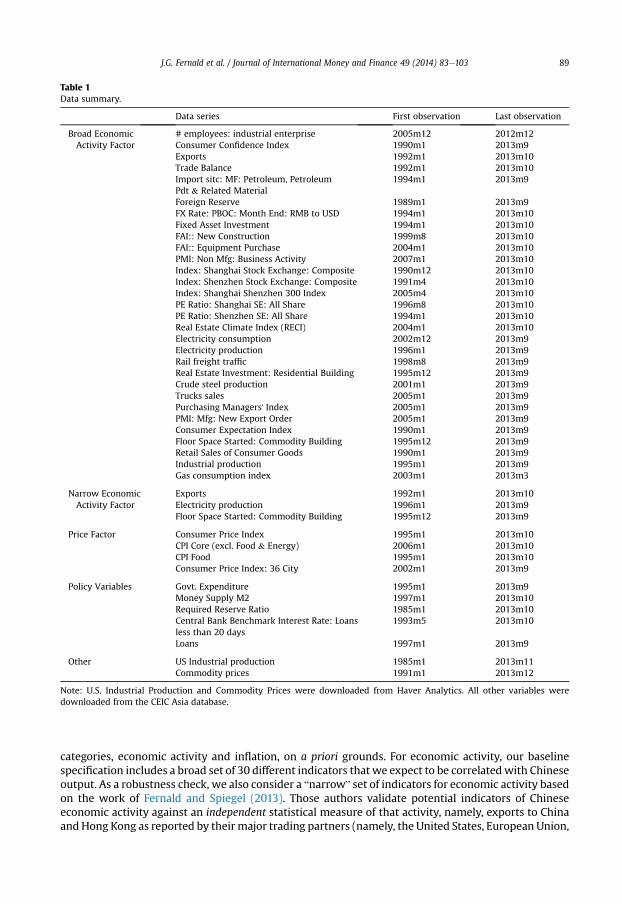
Table 1Data summary.
Data series First observation Last observation
Broad EconomicActivity Factor
# employees: industrial enterprise 2005m12 2012m12Consumer Confidence Index 1990m1 2013m9Exports 1992m1 2013m10Trade Balance 1992m1 2013m10Import sitc: MF: Petroleum, PetroleumPdt & Related Material
1994m1 2013m9
Foreign Reserve 1989m1 2013m9FX Rate: PBOC: Month End: RMB to USD 1994m1 2013m10Fixed Asset Investment 1994m1 2013m10FAI:: New Construction 1999m8 2013m10FAI:: Equipment Purchase 2004m1 2013m10PMI: Non Mfg: Business Activity 2007m1 2013m10Index: Shanghai Stock Exchange: Composite 1990m12 2013m10Index: Shenzhen Stock Exchange: Composite 1991m4 2013m10Index: Shanghai Shenzhen 300 Index 2005m4 2013m10PE Ratio: Shanghai SE: All Share 1996m8 2013m10PE Ratio: Shenzhen SE: All Share 1994m1 2013m10Real Estate Climate Index (RECI) 2004m1 2013m10Electricity consumption 2002m12 2013m9Electricity production 1996m1 2013m9Rail freight traffic 1998m8 2013m9Real Estate Investment: Residential Building 1995m12 2013m9Crude steel production 2001m1 2013m9Trucks sales 2005m1 2013m9Purchasing Managers' Index 2005m1 2013m9PMI: Mfg: New Export Order 2005m1 2013m9Consumer Expectation Index 1990m1 2013m9Floor Space Started: Commodity Building 1995m12 2013m9Retail Sales of Consumer Goods 1990m1 2013m9Industrial production 1995m1 2013m9Gas consumption index 2003m1 2013m3
Narrow EconomicActivity Factor
Exports 1992m1 2013m10Electricity production 1996m1 2013m9Floor Space Started: Commodity Building 1995m12 2013m9
Price Factor Consumer Price Index 1995m1 2013m10CPI Core (excl. Food & Energy) 2006m1 2013m10CPI Food 1995m1 2013m10Consumer Price Index: 36 City 2002m1 2013m9
Policy Variables Govt. Expenditure 1995m1 2013m9Money Supply M2 1997m1 2013m10Required Reserve Ratio 1985m1 2013m10Central Bank Benchmark Interest Rate: Loansless than 20 days
1993m5 2013m10
Loans 1997m1 2013m9
Other US Industrial production 1985m1 2013m11Commodity prices 1991m1 2013m12
Note: U.S. Industrial Production and Commodity Prices were downloaded from Haver Analytics. All other variables weredownloaded from the CEIC Asia database.
J.G. Fernald et al. / Journal of International Money and Finance 49 (2014) 83e103 89
categories, economic activity and inflation, on a priori grounds. For economic activity, our baselinespecification includes a broad set of 30 different indicators that we expect to be correlatedwith Chineseoutput. As a robustness check, we also consider a “narrow” set of indicators for economic activity basedon the work of Fernald and Spiegel (2013). Those authors validate potential indicators of Chineseeconomic activity against an independent statistical measure of that activity, namely, exports to Chinaand Hong Kong as reported by their major trading partners (namely, the United States, European Union,

J.G. Fernald et al. / Journal of International Money and Finance 49 (2014) 83e10390
and Japan). Fernald and Spiegel argue for taking the first principal component of electricity usage, newfloor space added, China's reported exports, and raw materials used. We use this narrower set of in-dicators (excluding raw materials, which is only available quarterly) as a check on the results of ourmore comprehensive factor model using all 30 economic activity indicators.13
For inflation, we have a smaller set of available economic indicators, comprising four measures ofconsumer prices and two of producer prices.
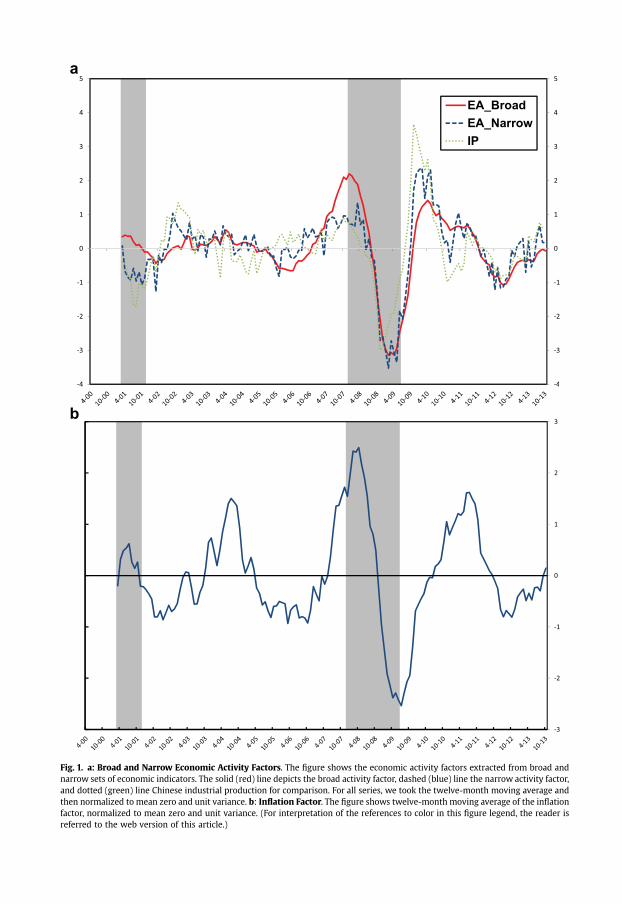
The top panel of Fig.1 presents estimates of the latent Chinese economic activity factor generated bythe broad and narrow data sets, along with Chinese industrial production (IP) for comparison. In thefigure, it can be seen that the estimates of economic activity are highly correlated, both with each otherand with the IP series. This is fairly reassuring, since these series are intended to capture essentially thesame latent variable. The narrow economic activity factor appears to have more high-frequency noiseand volatility than the broad factor, and IP seems to be somewhat noisier andmore volatile than both ofthe latent factors, consistent with the view that adding more indicators improves our estimate of thetrue underlying state of economic activity in China. Our economic activity estimates also capture wellthe slowdown in China during the global financial crisis, and the country's subsequent recovery. It isapparent that while China weathered the economic downturn better than most, it also was heavily hitby the global downturn. Finally, Fig. 1A suggests that our methodology for filling in missing data doesnot distort our estimate of economic activity, since our narrow factor is based on indicators for whichwe have a complete history of data over our sample.14
The bottom panel of Fig. 1 reports our estimated inflation factor. Again, our series appears to bepicking up the effects of the crisis well, including both the downturn in prices during the crisis and thesubsequent pickup in Chinese inflation during the recovery. As in the case of the economic activityseries, the data clearly demonstrate a strong impact from the crisis on Chinese prices.
For monetary policy, we consider five observable measures, reported at the bottom of Table 1: abenchmark short-term (less than 20-day) interest rate set by the PBOC; a longer-term rate (6months or less) for loans from the PBOC; the reserve requirement ratio; the money supply, asmeasured by M2; and the quantity of bank lending. The bank lending variable should, in principle,capture changes in window guidance, the Chinese government's well-documented policy ofmanipulating credit conditions through direct instructions to banks concerning whether to increaseor decrease their lending activity.15 Interest rates and reserve requirements are in units of per-centage points, and we do not seasonally adjust them. M2 and bank lending are in units ofseasonally-adjusted month-to-month growth rates.16 As with the individual data series, we removea local mean from each of these policy variables (other than the interest rates, although that didn'tmatter) using a biweight filter.17
Finally, we also consider a measure of fiscal policydthe seasonally-adjusted month-to-monthgrowth rate of government spending, which includes both central and local government
13 Boivin and Ng (2006) demonstrate that adding more data to a dynamic factor model can, in principle, have the perverseeffect of reducing forecast quality if the idiosyncratic errors of the factors are highly cross-correlated or if a factor with sub-stantial forecasting power is dominant in a small dataset but is a dominated factor in a larger dataset. By considering a “narrow”
as well as “broad” data set for our dynamic factor model, we make our analysis more robust to this potential problem.14 We also experimented with estimating an economic factor directly on 12-month changes in the data, rather than onmonth-to-month changes. The correlation of the resulting narrow and broad factors was 0.88. Clearly, there is much more noisein the month-to-month estimates, especially with the narrow measures. That said, the year-over-year indicators would not beappropriate given the “ordering” identification in our VAR.15 While we do not explicitly account for sterilization activity, our measure of M2 should also reflect central bank sterilizationdecisions through the central bank's budget constraint, as in Chang et al. (2013).16 We do not account for some of the policies that have been pursued by Chinese authorities. For example, the PBOC onseveral occasions took regulatory steps which appeared to curb activity in the “shadow” banking system of China. It would bedifficult for us to characterize the magnitudes of these policy actions. Of course, if these actions are correlated with other,observed, policy moves, the VAR may pick them up.17 Results were not much affected by the filtering. The exception was for the reserve requirement, where the raw data show amarked rise starting in 2007, with a modest dip down decline during the financial crisis, and then a further rise. Withoutfiltering, this trend shows up as an effect that is larger and a priori too persistent, relative to what we report. This examplehighlights some of the caveats around any VAR using a short sample of data.
a
b
Fig. 1. a: Broad and Narrow Economic Activity Factors. The figure shows the economic activity factors extracted from broad andnarrow sets of economic indicators. The solid (red) line depicts the broad activity factor, dashed (blue) line the narrow activity factor,and dotted (green) line Chinese industrial production for comparison. For all series, we took the twelve-month moving average andthen normalized to mean zero and unit variance. b: Inflation Factor. The figure shows twelve-month moving average of the inflationfactor, normalized to mean zero and unit variance. (For interpretation of the references to color in this figure legend, the reader isreferred to the web version of this article.)

J.G. Fernald et al. / Journal of International Money and Finance 49 (2014) 83e10392
spendingdbecause, to the extent that Chinese policymakers use multiple levers simultaneously,changes in monetary instruments could have a fiscal component as well.18
4. Results
We begin by considering simple three-variable VAR systems, with the economic activity factor,inflation factor, and each policy variable individually. All of our main empirical results come through inthis simple specification. We then consider the policy variables in combination, but our main con-clusions that policy interest rates and reserve requirements matterdwhile M2 and lending havemodest or no effectsdremain robust. In all cases, we estimate our model with two monthly lags foreach of the variables, in accordance with the AIC and BIC lag-selection criteria.19
Fig. 2 reports results using the broad economic activity factor. Each row of Fig. 2 corresponds to adifferent three-variable VAR, including a different monetary policy instrument. Each row of the figuregraphs the impulse responses of the economic activity and inflation factors to a one-standard-deviationshock to the correspondingmonetary policy instrument, assuming a recursive ordering for the variablesinwhich themonetary policy instrument is positioned last (so thatmonetary policy can respondwithinthe month to output and inflation, but neither output nor inflation responds within the month tomonetarypolicy).We concentrateon the responses of the factors themselves, rather than theobservableeconomic indicators, as those may be subject to misreporting or bad measurement (e.g., Fernald andSpiegel, 2013). In all cases, we plot cumulated impulse responses (with one-standard-deviation stan-dard error bands); since the activity and inflation factors correspond to growth rates rather than levels,the cumulated responses tell us howthe levels of activityandprices respond toagivenpolicy innovation.
The top row shows our main result: In response to a positive shock to the PBOC short-term interestrate, both activity and (with a lag) prices fall significantly over the next two years. These responses arein line with standard intuition and results for the effects of monetary policy in market-orientedeconomies such as the U.S. (e.g., Christiano et al., 1999). In contrast, most studies of China do notfind that market-based policy instruments are statistically significant (e.g., He et al., 2013). We explorethe robustness of this result further below.20
The second row of Fig. 2 shows that an increase in the required reserve ratio also reduces economicactivity and prices significantly.
Interestingly, rows three and four show that innovation to monetary aggregates (M2) and banklending have a positive effect on economic activity and prices, as onewould expect, but these responsesare not statistically significant, differing from zero by only about one standard error. Our FAVAR modelthus suggests that movements in monetary aggregates and window guidance in the form of quanti-tative targets for lending may not, in fact, be important channels for monetary policy over this period.Indeed, the lack of a substantive effect of innovations in M2 or bank lending on activity and inflation isconsistent with typical findings for the U.S., wheremuch of the variation in quantity aggregates reflectsidiosyncratic shocks to money demand rather than fundamental changes in monetary policy (e.g.,Bernanke and Blinder, 1992).
These simple results contrast with those of He et al. (2013), who find that economic activity issubstantively positively affected by increases in credit availability, as measured by the volume of banklending. Those authors also do not find a role for PBOC interest rates.21We discuss some reasons for thedifferences between their results and ours below.
18 We also considered the overall fiscal surplus as a measure of fiscal policy. This variable was also insignificant in its impacton our activity series. However, we prefer the government spending variable as it appears to be much less noisy from month tomonth.19 Depending on the model, the criteria typically choose between one and three lags. Results are robust to allowing for threelags. Allowing more lags inherently leads to choppier and less precise results, given the relatively short sample we use and theexplosion in the number of parameters. He et al. (2013) also use two lags.20 We also looked at the response to innovations in the PBOC rate for loans up to 6 months as the monetary policy instrumentand obtained results that were qualitatively similar.21 Ju et al. (2013) also find a role for monetary policy to influence Chinese trade activity through its influence on the creditchannel in a micro study.

Fig. 2. Impulse Responses from Three-Variable VARs (with Broad EA Factor). Note: Three-Variable VARs (broad economic activityfactor, inflation factor, policy variable). Each row corresponds to a separate three-variable VAR, with the broad economic activityfactor (EA), inflation factor (PR), and the policy variable shown. The left column shows the impulse response function of the eco-nomic activity factor, and the right column shows the impulse response of the inflation factor, to a policy innovation. Graphs showcumulative responses to a one-standard-deviation innovation. Shaded areas indicate bootstrapped one-standard-error bands aroundthe point estimates. Periods are months.
J.G. Fernald et al. / Journal of International Money and Finance 49 (2014) 83e103 93
Finally, the bottom row of Fig. 2 shows that government expenditures also have a small butinsignificant positive effect on economic activity and prices. We note, however, that the monthlygovernment spending data appears to be very noisy and may not be a good measure of the true stanceof fiscal policy. As such, we view the inclusion of government expenditures in our specification asprimarily a vehicle to enhance our ability to gauge the impact of different monetary policy instrumentsby allowing for fiscal effects.22
22 We also examined government spending shocks in a five-variable specification with reserve requirements and thebenchmark interest rate added. Fiscal policy consistently failed to have a significant impact on the economic activity or pricefactors, regardless of the ordering of the fiscal policy shock within the system.

J.G. Fernald et al. / Journal of International Money and Finance 49 (2014) 83e10394
Fig. 3 reports analogous results using the narrow economic activity factor rather than the oneestimated using the broader set of indicators. Results for interest rates are qualitatively similar, thoughless statistically significant, which we attribute to the fact that the narrow economic activity factorseems to be less precisely estimated than the broad factor, owing to the smaller number of indicatorsused. In particular, the policy innovations that displayed tenuous significance using the broad activityfactordM2, bank lending and government spendingdare now often inside the one-standard-errorbands. Among these, only bank lending retains even its marginally significant positive impact oneconomic activity, while none of the three have a noticeable (or statistically significant) impact onprices. Nevertheless, it is reassuring that a much noisier, but externally verifiable, measure of economicactivity yields qualitatively similar results for the policy variables that seem tomatter themost, namelyinterest rates and reserve requirements.
Fig. 3. Impulse Responses from Three-Variable VARs (with Narrow EA Factor). Three-Variable VARs (narrow economic activityfactor, inflation factor, policy variable). Each row corresponds to a separate three-variable VAR, with the narrow economic activityfactor (EA), inflation factor (PR), and the policy variable shown. The left column shows the impulse response function of the eco-nomic activity factor, and the right column shows the impulse response of the inflation factor, to a policy innovation. Graphs showcumulative responses to a one-standard-deviation innovation. Shaded areas indicate bootstrapped one-standard-error bands aroundthe point estimates. Periods are months.

J.G. Fernald et al. / Journal of International Money and Finance 49 (2014) 83e103 95
Figs. 4 and 5 report results for larger, five-variable FAVAR systems. In terms of recursive ordering,both systems include the broad economic activity factor and inflation factor as the first two variables,and the required reserve ratio and short-term interest rate as the last two variables.23 The third variablein each of the figures differsdFig. 4 uses M2, and Fig. 5 the quantity of bank lending. The orderingassumptions imply that the reserve ratio or the short-term interest rate can respond within the monthto changes in M2, or bank lending, or government spending, but that those variables do not respondwithin the month to the reserve ratio or the overnight interest rate.24 (That said, putting M2 or lendinglast in the VAR doesn't affect our results much.)
The results from the simple three-variable systems are remarkably robust. Shocks to the short-terminterest rate reduce economic activity and prices, and shocks to the required reserve ratio also reduceactivity. But M2 remains quantitatively unimportant for activity, and bothM2 and bank lending exhibitprice “puzzles” (responses that seem to have the wrong sign) according to these models.
Still, the results do show thatM2 and lending are not just noise. Both decline (lending significantly so)when the short-term interest rate rises. This suggests that some of the effect of the interest rate increasesmight be working through reduced lending (as one would expect), even if innovations to lending per sedo not appear to matter. This would be in keeping with the standardmonetary transmissionmechanism(e.g., Bernanke and Blinder, 1992), as well as some of the findings in the literature for China (e.g., Ju et al.,2013) that suggest part of the impact of monetary policy is through its influence on lending and credit.
An interesting question is why we find different results from previous studies, such as He et al.(2013). Subsequent to identifying a structural break in China's monetary transmission mechanismwith the launch of its floating exchange rate regime in 2005, those authors find that industrial pro-duction responds modestly to a shock to either the benchmark lending rate or to their estimate of thestance of “market-based” PBOC policies as a latent variable for their latter sample period estimatedfrom 2002-2010.25 They generate the market-based policy measure by choosing 15 policy data series,including interest rate and reserve requirement policies as indicator variables. In contrast to themarket-based policy stance, they find strong responses of industrial production and prices to shocks tototal lending or M2 for this latter period, and conclude that controlling loan volumes or the moneysupply is “more effective” than manipulating market-based monetary instruments in China.
Our paper differs from He et al. (2013) in a number of respects. First, we use more recent data, withsubstantively more coverage of the global financial crisis and its aftermath. Second, we apply theFAVAR framework somewhat differently: while He et al. (2013) treat industrial production and theconsumer price index as observed series, we put little faith in the reliability of any individual activity orprice series and instead rely on the factor model to characterize Chinese economic activity andinflation; we then examine the response of these factors to observed movements in policy variables,such as the overnight lending rate or reserve requirements. Our approach is more in keeping with thestandard FAVAR literature (e.g., Bernanke et al., 2005), which as discussed above is particularly suitedto address the problems associated with noise in Chinese data and that country's rapid structuraltransformation. Third, our dynamic factor estimation methodology allows us to consider indicatorvariables with missing values, which enables us to include a broader set of indicators to characterizeeconomic activity. This feature is particularly desirable for China, where many important series containepisodes of missing values or start in the middle of our sample.
We are able to partially replicate previous studies with our model, and several results are sug-gestive. First, if we end our sample prior to the failure of Lehman Brothers (when the Great Recessionbecame Great), then interest rate innovations are unimportant. Thus, including the Great Recession
23 We focus on the short-term interest rate because it was so similar to results with the six-month rate.24 We do not have a strong view as to whether output or inflation should be ordered before the other in the VAR (and, in fact,both recursive orderings are suspect). For the impulse responses we are interested indnamely, the responses to the monetarypolicy instrumentsdthe relative ordering of output and inflation in the VAR does not matter, so our results are robust to thischoice. However, it should be kept in mind that the impulse responses in the first two rows of Figs. 4 and 5 do depend on theordering of these two variables.25 Note that their time period roughly corresponds to our 2000e2013 time period, indicating that the move to a managedexchange rate peg should not pose a structural break problem for our analysis. They identify no impact for the early period,which runs from 1998 to 2005.
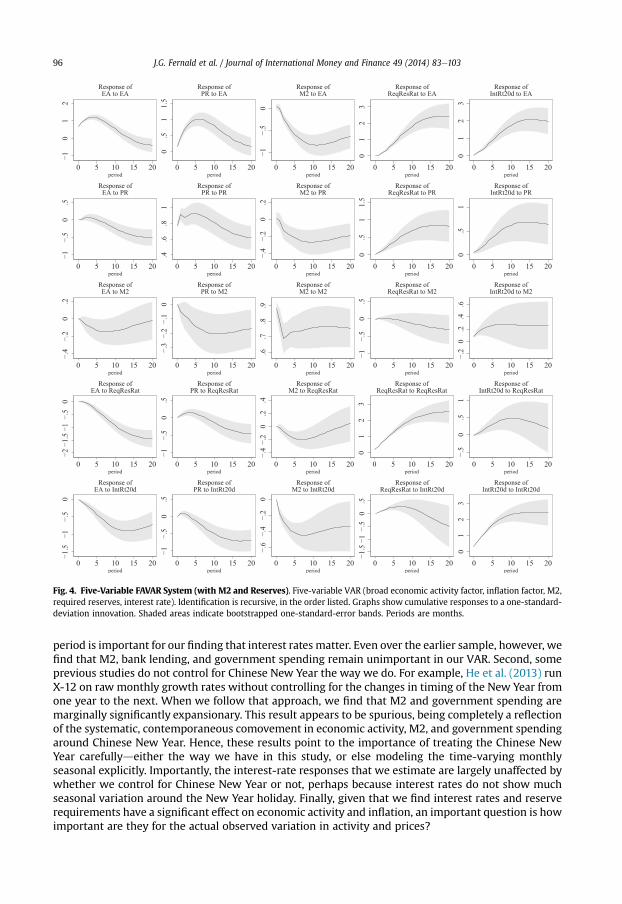
Fig. 4. Five-Variable FAVAR System (with M2 and Reserves). Five-variable VAR (broad economic activity factor, inflation factor, M2,required reserves, interest rate). Identification is recursive, in the order listed. Graphs show cumulative responses to a one-standard-deviation innovation. Shaded areas indicate bootstrapped one-standard-error bands. Periods are months.
J.G. Fernald et al. / Journal of International Money and Finance 49 (2014) 83e10396
period is important for our finding that interest rates matter. Even over the earlier sample, however, wefind that M2, bank lending, and government spending remain unimportant in our VAR. Second, someprevious studies do not control for Chinese New Year the way we do. For example, He et al. (2013) runX-12 on raw monthly growth rates without controlling for the changes in timing of the New Year fromone year to the next. When we follow that approach, we find that M2 and government spending aremarginally significantly expansionary. This result appears to be spurious, being completely a reflectionof the systematic, contemporaneous comovement in economic activity, M2, and government spendingaround Chinese New Year. Hence, these results point to the importance of treating the Chinese NewYear carefullydeither the way we have in this study, or else modeling the time-varying monthlyseasonal explicitly. Importantly, the interest-rate responses that we estimate are largely unaffected bywhether we control for Chinese New Year or not, perhaps because interest rates do not show muchseasonal variation around the New Year holiday. Finally, given that we find interest rates and reserverequirements have a significant effect on economic activity and inflation, an important question is howimportant are they for the actual observed variation in activity and prices?

Fig. 5. Five-Variable FAVAR System (with Bank Lending and Reserves). Five-variable VAR (broad economic activity factor, inflationfactor, bank lending, required reserves, interest rate). Identification is recursive, in the order listed. Graphs show cumulative re-sponses to a one-standard-deviation innovation. Shaded areas indicate bootstrapped one-standard-error bands. Periods are months.
J.G. Fernald et al. / Journal of International Money and Finance 49 (2014) 83e103 97
We address this question in two ways. First, variance decompositions (not shown) show that in-novations to interest rates and reserve requirements explain only a modest share of the variation ineconomic activity and prices. For example, in the five-variable VAR with M2, innovations to interestrates and reserve requirements together explain about 20 percent of the variance in activity and lessthan 10 percent of the variance in inflation at horizons of 12 or 24 months. Not surprisingly, in a fast-growing, rapidly evolving economy like China's, non-monetary factors are much more important inexplaining the pace and volatility of growth.
Second, Fig. 6 reports counterfactuals for three-variable VAR specifications in which we include theeconomic activity factor, inflation factor, and either the benchmark interest rate (Fig. 6a) or reserverequirements (Fig. 6b). We examine the counterfactual of how the economic activity factor would haveevolved if we “turned off” the innovations to the short-term interest rate and reserve requirements,respectively. These results show that, during the Great Recession, monetary policy actually exacerbatedthe slump in economic activity to some extent. The reason is intuitive: China tightened monetarypolicy in early 2008. The contractionary effects of those policy moves were hitting the economy later in

a
b
Fig. 6. a and b: Contribution of Interest Rate and Reserve Requirements to Economic Activity. Contribution of reserve re-quirements and interest rates to broad economic activity factor over our sample. The dashed line in each panel depicts the estimatedeconomic activity factor. The solid line depicts the counterfactual values from a three-variable VAR, setting the innovations to theshort-term interest rate or reserve requirements to zero.
J.G. Fernald et al. / Journal of International Money and Finance 49 (2014) 83e10398
2008dwhen the global economy, and China's economy with it, were hit by the downturn. Thisexperience illustrates one of the challenges of countercyclical monetary policy.
5. Robustness
5.1. External shocks
As China is a very open economy with a heavy reliance on imported raw materials, external shocksare potentially very important. As a robustness check on our above results, we therefore add a monthlyproxy for external output (namely, U.S. industrial production) and an index of commodity prices. Thisresults in a seven-variable specification, with produces the impulse response functions shown inFig. 7.26
26 To treat the external shocks as contemporaneously exogenous, we order our seven-variable specification with the U.S.industrial production variable first, the commodity shock series second, and series three through seven following the sameorder as the five-variable series reported in Fig. 4, above.
J.G. Fernald et al. / Journal of International Money and Finance 49 (2014) 83e103 99
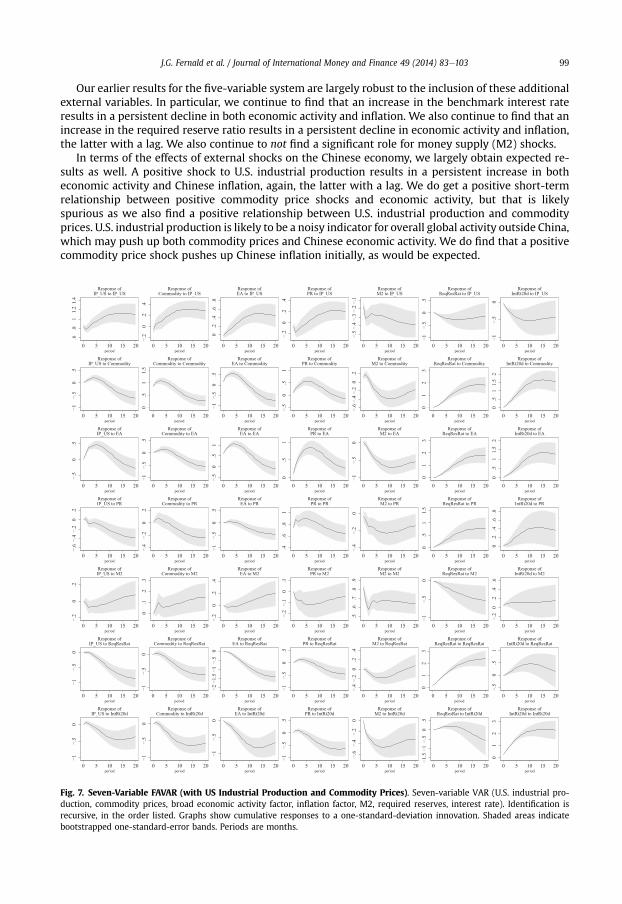
Our earlier results for the five-variable system are largely robust to the inclusion of these additionalexternal variables. In particular, we continue to find that an increase in the benchmark interest rateresults in a persistent decline in both economic activity and inflation. We also continue to find that anincrease in the required reserve ratio results in a persistent decline in economic activity and inflation,the latter with a lag. We also continue to not find a significant role for money supply (M2) shocks.
In terms of the effects of external shocks on the Chinese economy, we largely obtain expected re-sults as well. A positive shock to U.S. industrial production results in a persistent increase in botheconomic activity and Chinese inflation, again, the latter with a lag. We do get a positive short-termrelationship between positive commodity price shocks and economic activity, but that is likelyspurious as we also find a positive relationship between U.S. industrial production and commodityprices. U.S. industrial production is likely to be a noisy indicator for overall global activity outside China,which may push up both commodity prices and Chinese economic activity. We do find that a positivecommodity price shock pushes up Chinese inflation initially, as would be expected.
Fig. 7. Seven-Variable FAVAR (with US Industrial Production and Commodity Prices). Seven-variable VAR (U.S. industrial pro-duction, commodity prices, broad economic activity factor, inflation factor, M2, required reserves, interest rate). Identification isrecursive, in the order listed. Graphs show cumulative responses to a one-standard-deviation innovation. Shaded areas indicatebootstrapped one-standard-error bands. Periods are months.
a
b
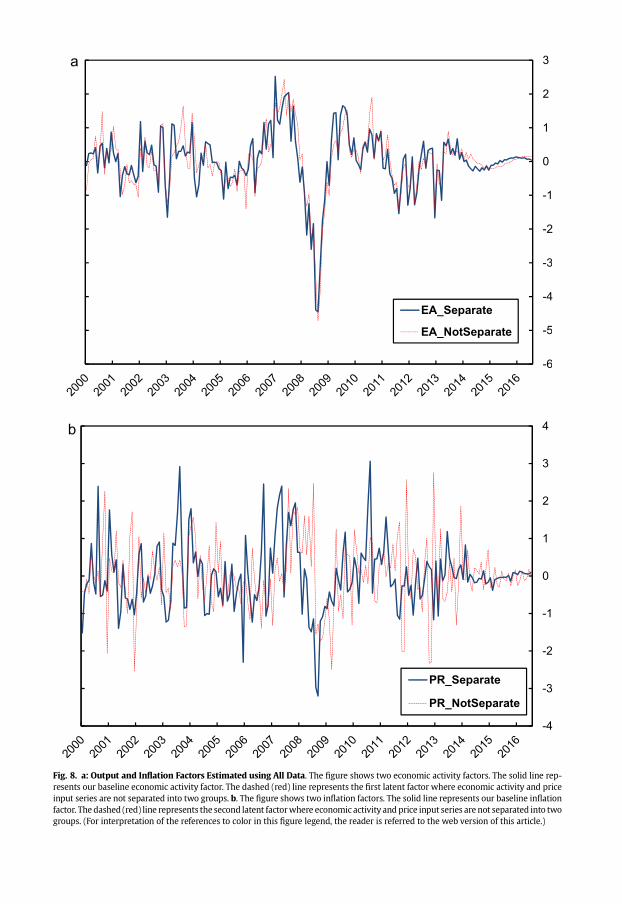
Fig. 8. a: Output and Inflation Factors Estimated using All Data. The figure shows two economic activity factors. The solid line rep-resents our baseline economic activity factor. The dashed (red) line represents the first latent factor where economic activity and priceinput series are not separated into two groups. b. The figure shows two inflation factors. The solid line represents our baseline inflationfactor. The dashed (red) line represents the second latent factorwhere economic activity and price input series are not separated into twogroups. (For interpretation of the references to color in this figure legend, the reader is referred to the web version of this article.)

J.G. Fernald et al. / Journal of International Money and Finance 49 (2014) 83e103 101
5.2. Pooled factor data
Our specifications follow Ang and Piazzesi (2003) and others in categorizing indicator variables asbeing associated with either economic activity or inflation. An alternative approach, followed byBernanke and Boivin (2003), is to pool all of the observable indicator variables and estimate the latentfactors of the model directly on this single set of indicators.
An advantage of this latter method for the present paper is that our inflation factor is based on arelatively small number of Chinese inflation indicators that are available at a monthly frequency for asufficiently long time period. The six inflation indicators that we do use could be insufficient forobtaining good estimates of true Chinese inflation (but would nevertheless be better than using anysingle indicator such as the CPI!). As a robustness check, we thus re-estimate our baseline specificationusing all 34 of indicator variables to estimate two latent factors without any category restrictions. Asshown in Fig. 8a, the first estimated factor from this procedure matches the economic activity factorfrom our baseline specification extremely closely. Similarly, Fig. 8b shows that the second fitted factoralso matches the inflation factor from our baseline specification very closely. The correlation coefficientbetween the first factor and the activity factor estimated above was 0.89, while the correlation coef-ficient between the second factor and the above price factor was 0.29. Nevertheless, as shown inAppendix Fig. A1, the impulse response functions with these factors substituted for the activity andprice factors in the five-variable specification in Fig. 4 look quite similar to those in that figure. Inparticular, we continue to find that a positive shock to the domestic interest rate has a persistentnegative impact on the first factor and also on the second factor, the latter with a lag.
6. Conclusions
This paper uses a FAVAR methodology to assess the impact of Chinese monetary policy. A FAVARapproach appears to be particularlywell suited for the Chinese economy, both due to its relatively shortspan of quality data available and to the likely fact that Chinese economic conditions and policy ruleshave changed dramatically over recent years. Our FAVAR approach accommodates data with differentstarting dates, and therefore allows for a broad set of indicator variables. Moreover, the FAVAR rep-resentation allows for the incorporation of many activity and price indicator variables while retaining aparsimonious VAR specification to assess policy impacts. Again, this is particularly promising for China,as the time series available for analysis are relatively short, and the data are likely to be noisy andtherefore benefit from our broad set of indicator variables.
Our results suggest that, contrary to earlier papers, China's monetary transmission mechanism isbeginning to lookmore standard. In particular, we identify a substantive role for interest rate policies inthe determination of both real economic activity and prices. The latter occurs with a lag. While theseresults contrast with earlier studies of the Chinese economy, they are directly consistent with a numberof studies in the literature for the U.S., suggesting that China's idiosyncratic monetary transmissionmechanisms may be a function of distortions to the Chinese economy, particularly in the Chinesecommercial banking system. These studies predict that, as these distortions diminish, the standardmonetary policy instruments are likely to gain importance in the monetary transmission mechanismand consequently, in Chinese monetary policy.
An important caveat is that ourmonetary policy FAVAR analysis does not tell uswhether the channelsof themonetary transmissionmechanism are the same in China as inWestern economies. The VAR itselfsimply tells us about timing. That is, the VAR finds that changes in interest rates that cannot be predictedbased on current as well as lagged activity and inflation are associated with later contractions in activityand prices. The mechanisms at work inWestern economies are that changes in central bank policy rateslead to changes in other market interest rates as well as broader financial conditions. These changes, inturn, affect the economic decisions of various agents in the economy. Further research is needed toassess the degree to which these channels of monetary transmission are the same in China.
Of course, China's economy is far from fully liberalized, and more non-standard Chinese monetarypoliciesdsuch as window guidance to Chinese commercial banksdare likely to continue to play a rolein its monetary policy going forward. Still, our results indicate that the liberalization of China'seconomy to date, particularly in its financial sector, has left that country's monetary transmissionmechanism closer to those of Western economies than previously realized.

J.G. Fernald et al. / Journal of International Money and Finance 49 (2014) 83e103102
Acknowledgments
We thank Eric Hsu and Kuni Natsuki for excellent research assistance, and Yin Wong Cheung, XuHan, and seminar participants at the City University, Hong Kong for helpful discussions, comments, andsuggestions.
Appendix
Fig. A1. Five-Variable System with Factors estimated with all observable non-policy variables (Factor 1, Factor 2, M2, RequiredReserves, Interest Rate). Note that in these graphs, “EA” refers to Factor 1, and “PR” refers to Factor 2. Graphs show cumulativeresponses to a one-standard-deviation innovation. Shaded areas indicate bootstrapped one-standard-error bands. Periods aremonths.
References
Ang, Andrew, Piazzesi, Monika, 2003. A no-arbitrage vector autoregression of term structure dynamics with macroeconomicand latent variables. J. Monetary Econ. 50 (4), 745e787.
J.G. Fernald et al. / Journal of International Money and Finance 49 (2014) 83e103 103
Bernanke, Ben S., Blinder, Alan S., 1992. The federal funds rate and the channels of monetary transmission. Am. Econ. Rev. 82 (4),901e921.
Bernanke, Ben S., Boivin, Jean, 2003. Monetary policy in a data-rich environment. J. Monetary Econ. 50, 525e546.Bernanke, Ben S., Boivin, Jean, Eliasz, Piotr, 2005. Measuring the effects of monetary policy: a factor-augmented vector
autoregressive (FAVAR) approach. Q. J. Econ. 120 (1), 387e422.Boivin, Jean, Ng, Serena, 2006. Are more data always better for factor analysis? J. Econ. 132, 169e194.Burdekin, Richard C.K., Siklos, Pierre L., 2008. What has driven Chinese monetary policy since 1990? Investigating the People’s
Bank’s policy rule. J. Int. Money Finance 27, 847e859.Chamberlain, Gary, Rothschild, Michael, 1983. Arbitrage, factor structure, and mean-variance analysis in large asset markets.
Econometrica 51, 1305e1324.Chang, Chun, Liu, Zheng, Spiegel, Mark M., 2013. Capital Controls and Optimal Chinese Monetary Policy, pp. 2012e2013. Federal
Reserve Bank of San Francisco Working Paper.Chen, Hongyi, Chen, Qianying, Gerlach, Stefan, 2011. The Implementation of Monetary Policy in China: the Interbank Market
and Bank Lending. HKIMR Working Paper 26/2011.Connor, Gregory, Korajczyk, Robert, 1986. Performance measurement with the arbitrage pricing theory: a new framework for
analysis. J. Financial Econ. 15, 373e394.Christiano, Lawrence, Eichenbaum, Martin, Evans, Charles, 1999. Monetary policy shocks: what have we learned and to what
end? In: Taylor, John, Woodford, Michael (Eds.), Handbook of Monetary Economics 1A. Elsevier, pp. 65e148.Dickinson, David, Liu, Jia, 2007. The real effects of monetary policy in China: an empirical analysis. China Econ. Rev. 18, 87e111.Fernald, John, Spiegel, Mark, 2013. Is China Fudging its Figures? Evidence from Trading Partner Data. Federal Reserve Bank of
San Francisco unpublished manuscript.Forni, Mario, Hallin, Marc, Lippi, Marco, Reichlin, Lucrezia, 2000. The generalized dynamic factor Model: identification and
estimation. Rev. Econ. Stat. 82, 540e554.Fukumoto, Tomoyuki, Higashi, Masato, Inamura, Yasanuri, Kimura, Takeshi, 2010. Effectiveness of Window Guidance and
Financial Environment In Light of Japan’s Experience of Financial Liberalization and a Bubble Economy. Bank of JapanReview, 2010-E-4.
Feyzio�glu, Tarhan, Porter, Nathan, Tak�ats, El}od, 2009. Interest Rate Liberalization in China. IMF Working Paper WP/09/171.Geiger, M., 2006. Monetary Policy in China (1994e2004): Targets, Instruments and Their Effectiveness. Wurzburg Economic
Papers 68.Geweke, John, 1977. The dynamic factor analysis of economic time series. In: Aigner, D.J., Goldberger, A.S. (Eds.), Latent Variables
in Socio-economic Models. North Holland, : Amsterdam) Ch, p. 19.He, Dong, Wang, Honglin, 2012. Dual-track interest rates and the conduct of monetary policy in China. China Econ. Rev. 23,
928e947.He, Qing, Leung, Pak-Ho, Chong, Terence Tai-Leing, 2013. Factor-augmented VAR analysis of the monetary policy in China. China
Econ. Rev. 25, 88e104.Holz, Carsten A., 2003. ‘Fast, Clear and accurate:’ how reliable are Chinese output and economic growth statistics? China Q. 173
(March), 122e163.Holz, Carsten A., 2008. China's 2004 economic census and 2006 benchmark revision of GDP statistics: more questions than
answers? China Q. 193, 150e163. March.Ju, Jiandong, Lin, Shu, Wei, Shang-jin, 2013. Monetary Policy, Credit Constraints, and Firm Exports: Evidence from China.
Columbia Business School unpublished manuscript.Laurens, Bernard J., Maino, Rodolfo, 2007. China: Strengthening Monetary Policy Implementation. IMF Working Paper 07/14.Lescaroux, François, Mignon, Val�erie, 2009. Measuring the effects of oil prices on China’s economy: a factor-augmented vector
autoregressive approach. Pac. Econ. Rev. 14 (3), 410e425.Nakamura, Emi, Steinsson, J�on, Liu, Miao, 2014. Are Chinese Growth and Inflation Too Smooth?. NBER Working Paper 19893.Qin, Duo, Quising, Pilipinas, He, Xinhua, Liu, Shigou, 2005. Modeling monetary policy transmission and policy in China. J. Policy
Model. 27, 157e175.Sargent, Thomas, Sims, Christopher, 1977. Business cycle modeling without pretending to have too much a priori economic
theory. In: Sims, C., et al. (Eds.), New Methods in Business Cycle Research. Federal Reserve Bank of Minneapolis,Minneapolis.
Stock, James, Watson, Mark, 1998. Diffusion Indexes. NBER Working Paper 6702.Stock, James, Watson, Mark, 1999. Forecasting inflation. J. Monetary Econ. 44, 293e335.Stock, James, Watson, Mark, 2002. Macroeconomic forecasting using diffusion indexes. J. Bus. Econ. Stat. 20, 147e162.Stock, James, Watson, Mark, 2012. Disentangling the Channels of the 2007e2009 Recession. Spring, pp. 81e135. Brookings
Papers on Economic Activity.Wikileaks (2007). http://wikileaks.org/cable/2007/03/07BEIJING1760.html.Zhang, Wenlang, 2009. China’s monetary policy: quantity versus Price rules. J. Macroecon. 31, 473e484.