INSTRUMENTS OF MONETARY POLICY IN CHINA AND THEIR ... · CHINA AND THEIR EFFECTIVENESS: 1994-2006....
52
No. 187 2008 February INSTRUMENTS OF MONETARY POLICY IN CHINA AND THEIR EFFECTIVENESS: 1994-2006
Transcript of INSTRUMENTS OF MONETARY POLICY IN CHINA AND THEIR ... · CHINA AND THEIR EFFECTIVENESS: 1994-2006....

No. 187 2008February
INSTRUMENTS OF MONETARY POLICY IN CHINA AND THEIR EFFECTIVENESS: 1994-2006


INSTRUMENTS OF MONETARY POLICY IN CHINA AND THEIR EFFECTIVENESS: 1994–2006
Michael Geiger
No. 187 February 2008
Acknowledgement: The author is grateful to: Kang Yitong, Yin Xiaobing and Chao Chen from the Graduate School of the People’s Bank of China (PBC) for all the help and discussions during his stay in Beijing, the Deutsche Bundesbank, the People’s Bank of China and the German Academic Exchange Service (DAAD) for making this stay possible, an anonymous referee, Nicolas Schlotthauer and Zhang Bin for their valuable comments. In particular, to Peter Bofinger and Heiner Flassbeck for their helpful comments and suggestions. The views expressed and remaining errors are the author’s responsibility. UNCTAD/OSG/DP/2008/2

ii
The opinions expressed in this paper are those of the author and are not to be taken as the official views of the UNCTAD Secretariat or its Member States. The designations and terminology employed are also those of the author. UNCTAD Discussion Papers are read anonymously by at least one referee, whose comments are taken into account before publication. Comments on this paper are invited and may be addressed to the author, c/o the Publications Assistant, Macroeconomic and Development Policies Branch (MDPB), Division on Globalization and Development Strategies (DGDS), United Nations Conference on Trade and Development (UNCTAD), Palais des Nations, CH-1211 Geneva 10, Switzerland (Telefax no: (4122) 9170274/Telephone. no: (4122) 9175896). Copies of Discussion Papers may also be obtained from this address. New Discussion Papers are available on the UNCTAD website at http://www.unctad.org.
JEL classification: E52, E58

iii
Contents
Page Abstract ...................................................................................................................................... 1
I. INTRODUCTION ...................................................................................................................... 1
II. INSTRUMENTS OF MONETARY POLICY IN CHINA......................................................... 4
A. Instruments of the People’s Bank of China as the
Central Bank of China......................................................................................................... 5
1. Price-based indirect instruments................................................................................... 5
(a) PBC lending and deposit rates.............................................................................. 6
(b) Discount and rediscount rate ................................................................................ 7
(c) Reserve requirements ........................................................................................... 7
(d) Open Market Operations (OMOs)........................................................................ 9
2. Quantity-based direct instruments .............................................................................. 11
(a) Window guidance............................................................................................... 12
(b) Direct People’s Bank of China lending .............................................................. 13
(c) Capital controls................................................................................................... 14
B. Other non-central bank policy instruments ....................................................................... 16
1. Price controls .............................................................................................................. 16
2. Wage controls............................................................................................................. 17
III. EFFECTIVENESS OF THE CHINESE MONETARY POLICY ............................................ 19
A. Intermediate targets........................................................................................................... 19
1. Monetary aggregates .................................................................................................. 19
(a) Controllability..................................................................................................... 20
(b) Relationship to inflation ..................................................................................... 23
(c) Monetary targeting policy and actual PBC reaction ........................................... 24
2. Domestic loan increase............................................................................................... 26
(a) Controllability..................................................................................................... 26
(b) Relationship to inflation ..................................................................................... 27
B. Final targets....................................................................................................................... 28
1. Inflation rate and GDP growth ................................................................................... 29
2. Exchange rate ............................................................................................................. 30
C. The role of the interest rate ............................................................................................... 31
D. Influence of quantity-based monetary and non-central bank policy instruments ............. 33
IV. CONCLUSION......................................................................................................................... 36
V. REFERENCES.......................................................................................................................... 38


* The author worked as an Assistant Economic Affairs Officer in the Division on Globalization and Development Strategies (DGDS) of UNCTAD from August 2004 to July 2005. Since October 2005, he has been working for the International Trade Centre (ITC).
INSTRUMENTS OF MONETARY POLICY IN CHINA AND THEIR EFFECTIVENESS: 1994–2006
Michael Geiger*
Abstract
China’s monetary policy applies to two sets of monetary policy instruments: (i) instruments of the Central Bank (CB), the People’s Bank of China (PBC); and (ii) non-central bank (NCB) policy instruments. Additionally, the PBC’s instruments include: (i) price-based indirect; and (ii) quantity-based direct instruments. The simultaneous usage of these instruments leads to various distortions that ultimately prevent the interest rate channel of monetary transmission from functioning. Moreover, the strong influences of quantity-based direct instruments and non-central bank policy instruments bring into question the approach of indirect monetary policy in general.
I. INTRODUCTION
The analysis argues that the monetary policy in China in the last decade was not only conducted and influenced by the People’s Bank of China (PBC), the Chinese central bank, but also by other authorities, mainly the central government. The PBC is neither goal, nor instrument independent, i.e. the PBC can neither set its final targets, nor its instruments without approval of the State Council. Moreover, non-central bank policy instruments are in place, which are not controlled by the central bank but have a direct influence on the final targets of monetary policy. Thus, the description of the instruments of monetary policy in China incorporates both the instruments of the central bank and other non-central bank instruments. The instruments of the central bank are divided into two parts: (i) price-based; and (ii) quantity-based monetary policy instruments. While the major Chinese particularities of the price-based instruments are shortly described in this paper, the main focus is on the quantity-based and non-central bank policy instruments. The subsequent analysis of the effectiveness of the monetary policy in China is dedicated to the explanation of the interdependency and the interaction between the following three types of instruments: 1. Central bank’s price-based instruments; 2. Central bank’s quantity-based instruments; and 3. Non-central bank and non-monetary instruments.

2
This distinction pays tribute to the fact that China’s economy and financial system is under transition from a planned towards a market- and price-based system. Having chosen a gradual approach of transformation, it is in the very nature that during the period of transition, price- and quantity-based measurements are in place simultaneously. Moreover, there are certain non-central bank instruments that particularly helped to reach price stability throughout the decade within the context of an uncompetitive and unsound banking environment. Price-stability is not the only final target of monetary policy in China. The PBC pursues three final targets, which are a paramount target of price-stability, a less important economic growth target and an additional exchange rate target (see box 1). China has a very specific economic environment. Thus, for an analysis of the instruments of monetary policy in China, it is important to recall some of these specific factors.1 First, there is a huge amount of non-performing loans (NPL) within the Chinese financial system. Officially, the central bank speaks of a NPL ratio of 20.36 per cent of all assets held by the four state-owned commercial banks (SOCBs), which amounted to around US$230 billion in 2004.2 While there was progress in lowering NPL ratios for the “Big Four” commercial banks: (i) Agricultural Bank of China; (ii) Bank of China; (iii) China Construction Bank; and (iv) Industrial and Commercial Bank of China between 2004 and 20063 for the banking system as a whole, the problem remains unsolved. Worse, in addition to the NPL problems that developed in the 1990s, there is evidence that the recent explosion in lending (triggered by the government’s economy-boosting measures) has resulted in a new NPL pile-up (EIU, 2005a: 13). Technically, the Chinese banking system is on the edge of bankruptcy. Independent estimates of the cost for a total bank restructuring are between 30 and 50 per cent of GDP (see Schlotthauer, 2003: 230; and EIU, 2005a: 36f). Second, most of the commercial banks lack capital adequacy. PBC officials speak about substantial deviations of the actual ratios and the 8 per cent capital adequacy ratio stated in the Basel Accord. Third, the four state-owned commercial banks have a quasi-monopoly in China’s financial market. They possess more than 80 per cent of the whole banking sector’s assets and liabilities and they account for around 80 per cent of the lending and 70 per cent of the deposit business. Furthermore, the “Big Four” still do not compete in all business and geographic areas with each other. The original tasks assigned to each of them, which also expand in the banks’ names, still segregate some parts. Fourth, interest rates are still subject to the control of the authorities. Despite great steps towards interest rate liberalization, there is still not sufficient competition and not enough room for credit-risk related credit decision-making.4 The situation of an unsound banking system with high NPL ratios, insufficient capital adequacy, a de facto monopoly of the SOCB and high political influence within the financial system have major impacts on the financial transmission process of the economy. First, there is a distorted behaviour of the SOCBs in terms of their risk assessment recognizable since the monopolizing SOCBs tend to be risk adverse. Through the strong position in the system, their restrictive behaviour can influence the overall impact of the central bank’s policy. For instance, one might think of a situation where the
1 This section is mainly based on a comment of Xie Ping (Xie, 2004b), the then Director of the Financial Stability Department of the PBC and the subsequent discussions during the Joint China-IMF Training Programme, High Level Seminar on China’s Monetary Policy Transmission Mechanism, 12–13 April 2004, Beijing. 2 This figure might even be too small. For example, Ernst & Young (Non-Performing Loan Report: Asia 2002) estimate the NPLs in China amount to US$500 billion (RMB 4,139 billion) at the end of 2002 and a decrease of 50 per cent in 2 years seems infeasible. 3 The improvements in the capital adequacy and non-performing loan ratios of BOC, CCB and ICBC in 2004 did not come as a surprise. Their timing was determined by the government’s wish of listing state-owned commercial banks on international stock exchanges to prepare them for the opening up of the financial system. This was scheduled for the end of 2006 along China’s commitments to the WTO entry. Accordingly, CCB went public in Hong Kong (China) in October 2005 followed by BOC in June and the ICBC at the end of 2006. 4 The market for bank deposits is yet completely controlled, while the ceilings on the lending market have been abolished for all institutions but the rural credit cooperatives since October 2004.

3
Box 1: Final targets of monetary policy in China The final targets of the PBC are stated in the “Law of the People’s Republic of China on the People’s Bank of China”. Article 3 says, “the aim of monetary policies shall be to maintain the stability of the value of the currency and thereby promote economic growth” (N.A., 1995 and N.A., 2003). Therefore, the central bank is committed to two different final targets in pursuing its monetary policy. First, the bank should aim for a policy that realizes price stability. Second, the banks’ policy should support the general economic policy and help to promote economic growth. Mehran et al. (1996) interpret this as the insight of Chinese officials that long-term economic growth can only be realized if long-term price stability predominates, i.e. in their view, price stability is the prominent target of the PBC (Mehran et al., 1996a: 19f). The PBC itself also claims to pursue the stability of the currency as the sole target of its monetary policy. Asked about the two official final targets of price stability and economic growth and their ranking in terms of importance, a PBC official unambiguously made clear that the PBC is not supporting the two targets but only the first one. Only if the target of price stability is reached, he concluded, the central bank would help to pursue other targets, i.e. the promotion of economic growth.5 In the context of the PBC, a non-independent central bank, it has to be doubted that the central bank is strong enough to ignore the goal of economic growth. In China, the central bank’s decision process is not sufficiently independent from the State Council’s directive.6 And governments rather have an economic growth bias than a low inflation bias.7 Thus, the interpretation Research of Mehran et al. (1996a) can only be supported in the context of an independent central bank constitution as it is, for instance, in the case of the European Central Bank (ECB). Therefore, based on the Law of the People’s Republic of China on the People’s Bank of China, it has to be concluded that the PBC pursuits at least two final targets, which are a paramount economical target and a less important political target. Additionally, between 1997 and 2005, China maintained a de facto peg of the Renminbi (RMB) to the United States Dollar (US$). According to Anderson (2003), the peg needed to have the add-on of de facto or quasi, since the official regulation allowed the RMB to fluctuate within a certain bandwidth (Anderson, 2003: 4). The de facto peg officially appeared to be a crawling peg with very narrow bands. With predominating higher trading bands between 1994 and 1996, the crawling peg arrangement was literally used and the RMB showed an 18-month appreciation path from 8.7 RMB per US$ in 1994 to 8.3 RMB per US$ in 1996. Facing the outbreak of the Asian crisis, the PBC narrowed the trading band and established the de facto peg of the RMB versus the US$ with a trading band of 0.4 per cent around the RMB/US$ 8.28 peg. The trading band was further tightened in November 2000 and stood at about 0.01 per cent fluctuation around the central parity of RMB/US$ 8.277 until 21 July 2005. The RMB was not completely fixed, but the trading band was very narrow. However, the strictness of the de facto exchange rate peg to the US$ leads to the conclusion that the de facto peg served as a final target of the Chinese monetary policy up to 21 July 2005. The immediate changes of the RMB reform in July 2005 included: (i) an outright appreciation of the RMB against the US$ of 2.1 per cent from 8.28 to 8.11; (ii) the change from a peg versus the US$ towards a peg against a basket of currencies; and (iii) the reversion to the crawling peg system in which the RMB can be allowed to fluctuate against the US$ up to 0.3 per cent against the exchange rate of the previous day (Anderson, 2005: 10 and Goldstein et al., 2007: 2–3). As a result, in the 18 months between July 2005 and December 2006, the exchange rate appreciated by a total of 6 per cent from 8.28 to 7.81 RMB/US$ (PBC, 2006g). The crawling peg has a very prominent role within the Chinese monetary policy set-up. Thus the exchange rate still has to be seen as the third final target of monetary policy in China.
5 Interview with Mr. Huang, Secretary of the Monetary Policy Committee of the PBC on 8 June 2004. 6 Article 2 of the Central Bank law says “The People’s Bank of China shall, under the leadership of the State Council, formulate and implement monetary policies” (N.A., 1995). 7 For instance, facing rising unemployment problems and sluggish growth in 2003 and 2004, European leaders repeatedly asked the ECB to lower the interest rates. On 27 February 2004, the German speaking newspaper “Die Welt” headlines “Schroeder and Raffarin call for an ECB interest rate cut”.

4
central bank wants to pursue a neutral stance of monetary policy. Due to the SOCBs obligation to meet capital adequacy requirements,8 the central bank induced neutral stance that might actually turn into a de facto restrictive attitude against the central bank’s will.9 Second, the state-owned commercial banks are not profit-driven.10 Resulting in long time lags for the implementation of interest changes, Xie Ping argues that “the weak motive of making profit of the four state-owned commercial banks makes monetary policy ineffective” (Xie, 2004b: 4). Third, a desired expansionary policy of the central bank can be absorbed via an increase of excess reserves of the SOCBs.11 Fourth, through monopolized open market operations, where the four SOCBs’ represent half of the total size of the Chinese operations, the SOCBs can manipulate the money market interest rates. Fifth, a strong lobby of state-owned commercial banks can undermine the central bank’s policies. Since the PBC functions under the influence of the government, the SOCBs can lobby the government to influence financial and banking related decisions that affect their own business operations. Additionally, the commercial banks are represented in the Monetary Policy Committee of the PBC. Indeed, the committee has no decision-making authority, but it is consulting the PBC in various financial and monetary policy related issues.12 Sixth, the central bank has insufficient instrument independence. The PBC cannot decide independently about the level of the interest rates. Moreover, according to Xie Ping, the PBC has to take into consideration an additional and purely political target, which is the reallocation of national income. This makes the instrument of the interest rate partially ineffective since interest rate adjustments are not necessarily consistent with the predominant monetary policy stance. “We can say that each adjustment was decided through bargaining of concerned parties, and the complicated process and long time lag of decision-making greatly decrease the effectiveness of interest rate, and even probably produce opposite effect to monetary policy goal” (Xie, 2004b: 5).
II. INSTRUMENTS OF MONETARY POLICY IN CHINA The PBC classifies its present set of monetary policy instruments into four categories (Xie, 2004a: 9):13 1. Instruments with ratios, i. e. reserve requirements; 2. Instruments with interest rates, i.e. central bank lending rates; 3. Quantitative instruments, i.e. open market operations (OMOs); and 4. Other instruments, i.e. central bank bills. The classification used in this work somewhat differs from the four categories. First, two main categories of central bank instruments are distinguished: (i) price-based; and (ii) quantity-based instruments. Second, all four above-mentioned categories are subsumed under the category of price-based instruments. Certainly, open market operations (OMOs) are originally designed to control the
monetary base and therefore can be counted as a quantity-based instrument. But, in a market-based financial system, every amount of monetary base has its corresponding price. Thus, the major central banks in the world use OMOs to control the money market rate rather than the monetary base. The PBC is no exception to this. For instance, the PBC carried out 24 repurchase operations (“repos”) in
8 Capital adequacy is subject to ever-tighter surveillance via the newly established China Banking Regulatory Commission (CBRC). 9 While such a situation was observable during the deflationary phase of the late 1990s, the recent past showed the contrary. In 2003, bank lending increased with higher ratios than the PBC was willing to accept. Sixty per cent of the granted loans have been granted by the four SOCBs. As a reaction, the PBC enforced its window guidance policy. 10 Other scholars like Dai (2002) are of the opinion that the desire for profit as early as 2002 already played a prominent role in commercial banks’ business operations. 11 This is true for the deflationary phase of 1998 to 2002 with an excess reserves ratio of 7.61 per cent in 2001. 12 The Monetary Policy Commitee meets quarterly and briefings of the meetings are available at www.pbc.gov.cn/english/xinwen/. 13 Xie mentioned that the PBC had introduced and tested 14 monetary policy instruments since 1983.

5
2001.14 In 19 operations, quantity tenders with a fixed interest rate were used. In the same year, in 26 reverse repos, solely quantity tenders with fixed interest rates were operated.15 Quantity-based instruments are instruments that are non-market conform, i.e. instruments that change the amount of money in the financial system without taking into account the price of money. Instruments that would fall into this category are nowadays abolished credit plan or newly introduced instruments like window guidance. Capital controls also can be counted to this category since controls leverage on the quantity of capital and not on its price. As a third kind of instruments, price and wage controls as non-central bank instruments will be highlighted. Non-central bank instruments influence the final targets16 of the monetary policy in China without being primarily monetary policy instruments. A. Instruments of the People’s Bank of China as the Central Bank of China 1. Price-based indirect instruments Monetary policy textbooks describe the transmission of monetary impulses, among others, via the interest rate channel of monetary policy transmission (see Bofinger, 2001). In a very simplified description, the interest rate channel can be described as follows: (i) in the case of a too expansionary
monetary stance, the monetary authorities would increase their primary lending rate; and (ii) in a completely market-based environment, the stance of the lending rate will be displayed in the inter-bank money market and through the expected channels, transformed them into all different
maturities. Thus, the commercial banks’ refinancing costs will rise due to the increase in the primary
lending rate. The higher the costs of financing for the commercial banks will lead to the higher interest rates for outflowing credits to third parties. Higher interest rates in turn will lead to a lesser demand for credits from the non-banking sector and thus lead to a slowing of the real sector. The reverse logic would apply for the situation of a too restrictive monetary stance. The interest rate instrument influences final targets via its interaction with intermediate targets. In China, the interest rate channel of monetary transmission is blurred. Due to the partially interest rate liberalization, price-based instruments in China have two different underlying mechanisms of action. First, there are instruments that transform the central bank’s policy stance through the interest rate
channel of monetary transmission, i.e. OMOs or minimum requirements. Second, there are
instruments that are not yet subject to full liberalization and thus act under the disguise of price-based instruments, i.e. PBC lending and deposit rates. This means that there are two different ways of transmission of interest rate changes: 1. The transmission of interest rate changes according to the (simplified) textbook interest rate
channel:
Interest rate change (PBC)
Change of interest rate to 3rd parties Change of refinancing costs of
commercial banks (CBs) 2. The transmission of interest rate changes as result of administered interest rate changes:
14 According to the Author’s own assessments based on data published on www.chinabond.com.cn. 15 The ratio of fixed interest rate tenders diminished in recent years due to the emergence of Central Bank bills to sterilize exchange rate inflows. To sterilize certain amounts of money, the focus is on the quantity rather than on the interest rates. Still, the interest rate on the money market showed a rather stable course. 16 The notion of “final targets” in this work refers to the three final targets of the Chinese monetary policy: (i) inflation rate; (ii) GDP growth rate; and (iii) exchange rate (Geiger, 2006: 7).
Interest rate change (PBC)
Change of interest rate to 3rd parties CBs have to change the interest rate for
money already at their disposal

6
) PBC lending and deposit rates
ie (2004a) tries to show that the PBC lending and deposit rates work in a similar market-oriented
he PBC administers two different benchmark interest rates: (i) the benchmark lending rate, which is
o adjust the benchmark lending rate, the PBC needs the consent of the State Council. Through this
(a Xway as facilities of Western central banks such as in the case of the European Central Bank (ECB), where the marginal refinancing and the deposit facility constitute the upper and lower limit of the money market interest rates.17 Accordingly, Xie argues that the PBC lending rate had constituted the upper limit of the money market rate since 1998 and that the lower limit of the money market from 1998 to 2002 was defined by the interest rate on required and excess reserves (XIE, 2004a: 20) 18. In theory, this is correct. But while there had certainly been progress towards a price-theoretic underpinning of monetary operations since the mid–1990s, the situation described by Xie (2004a) does not cover the whole financial system. In certain circumstances, the PBC lending and deposit rates have to be seen as an administrative order from the monetary authority that leverages on existing money already at the disposal of the commercial banks. Thus, credits to non-bank third parties are not necessarily based on a utility-calculation in terms of costs for refinancing from the PBC (the same logic applies for deposits respectively).19 Tthe one-year PBC lending rate; and (ii) the benchmark rate of central bank lending that is the rediscount rate.20 The PBC lending rate gives the commercial banks a certain degree in setting their interest rates according to their assessment. At the beginning of 2004, the upper limit of the lending rate for commercial banks and urban credit cooperatives was set to 170 per cent of the PBC benchmark rate and the ceiling for rural credit cooperatives at 200 per cent respectively. The lower limit of the lending rate for all financial institutions was installed at 90 per cent of the PBC’s benchmark rate. In October 2004, the ceiling for commercial banks and urban credit cooperatives was abolished and the cap for rural credit cooperatives increased to 230 per cent. The lower limit for all financial institutions remained unchanged (PBC, 2004g). While these and other liberalizations indicate progress towards market-determined interest rates,21 controlled interest rates are still a reality. For instance, the PBC still steers the deposit rates that commercial banks can grant to customers. This results in a particular problem, since the central bank has to make sure that the commercial banks have access to funds at rates below the deposit rates to ensure profitability of the commercial banks (CB) within the Chinese financial system (Xie, 2004a). Tdependency on the State Council, the “central bank lending rate is still not flexible to meet the needs called for by the pre-emptive or fine tuning of monetary policy” (PBC 2005c: 19). Moreover, the insufficient instrument independence of the PBC is the cause that monetary policy in China often fails to react timely to changes in the monetary policy environment. To mitigate this negative effect, since 25 March 2004, the PBC is allowed to add a surcharge on its central bank lending rate at its own
17 In the case of the ECB commercial banks, they can use the ECB facilities, the marginal refinancing facility and the deposit facility to finance their short-term liquidity (Bofinger, 2001). They can also use funds from the money market to balance their positions. All credit businesses to non-bank third parties have to be backed-up by Central Bank money. If the operations expire, the commercial banks will have to get new funds from the Central Bank or the money market. Through the interconnection to the money market, the marginal refinancing and the deposit facility constitute the upper and lower limit of the money market interest rates. Eventually, according to the interest rate channel of monetary transmission, the levels of the ECB’s facilities influence the rates of lending businesses between commercial banks and non-bank third parties. 18 In fact, the money market rate was constantly below the interest rates on reserves from 1996 to 1999. 19 The add-on problem that huge parts of credits are not negotiated according to project risks is not subject to this analysis. 20 Please refer to the next section of this chapter for details. 21 Since the start of “market-based interest rate reform” in 1993, a series of interest rates were liberalized such as: (i) interest rates in the inter-bank markets; (ii) the issuing rate of treasury bonds and policy financial bonds; (iii) the interest rate on foreign currency loans and large-value foreign currency deposits; (iv) interest rates on long-term large-value RMB negotiated deposits; and (v) the band of interest rates of loans in RMB was gradually widened (PBC, 2005c).

7
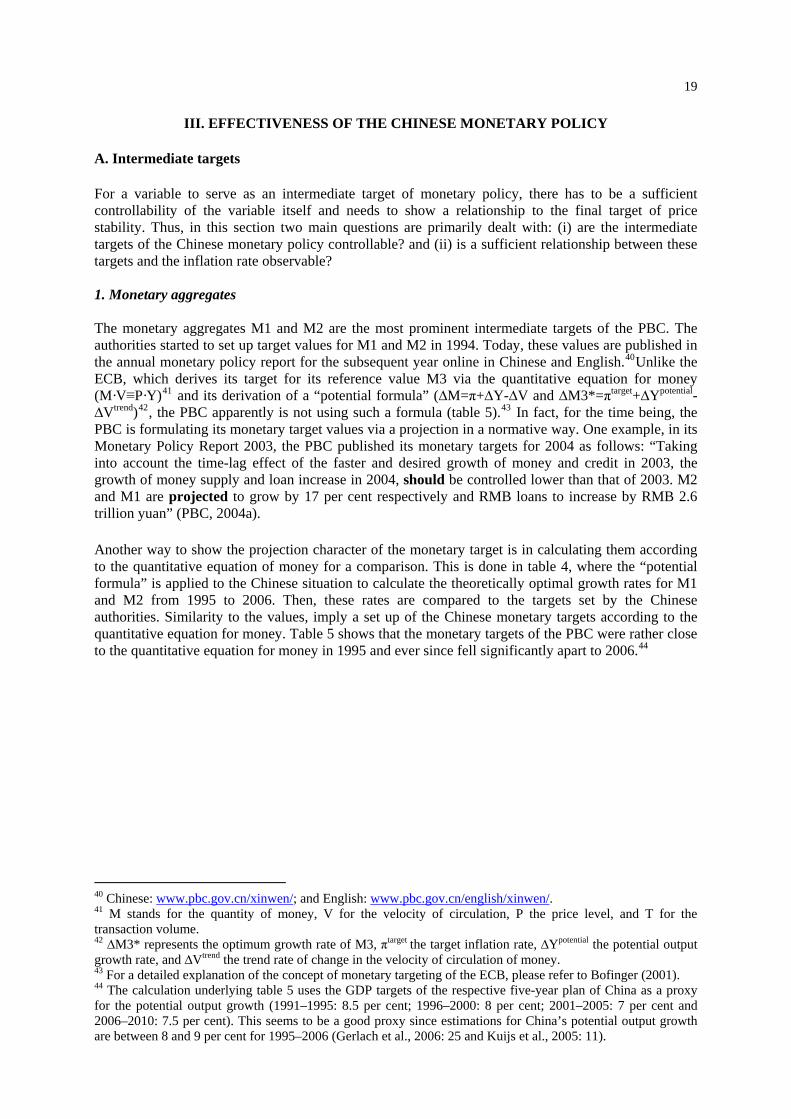
discretion (PBC, 2005c). The development of the PBC lending rate and the deposit rate in relation to the inflation rate are displayed in figure 1 from 1987 to 2006.
0%
3%
5%
8%
10%
13%
1987
1988
1989
1990
1991
1992
1993
1994
1995
1996
1997
1998
1999
2000
2001
2002
2003
2004
2005
2006
Deposit rate Lending rate
Source: IMF, International Financial Statistics .
Figure 1Development of the lending and deposit rates in China, 1987–2006
fact, the development of the PBC lending rate in 2006 points to an enhanced ability to fine-tune the
) Discount and rediscount rate
efore 1998, the discount and rediscount rates were set within a floating range of 5 per cent to 10 per
) Reserve requirements
he PBC introduced minimum reserve requirements in the year 1984 in order to control the financial
Ininstrument from the side of the PBC. In that year, two slight increases of the PBC lending rates followed each other very shortly. The first one on 28 April 2006, by 0.27 percentage points and on the second one on 19 August 2006, by 0.27 percentage points again up to 6.12 per cent. On the second occasion, the deposit rate was also increased by 0.27 percentage points to 2.52 per cent. (b Bcent below the commercial banks’ loan and PBC lending rates respectively. Since 1998, the rediscount rate was determined in line with other central bank lending rates. In 2004, the rediscount rate was installed as the benchmark rate of central bank lending, i.e. the PBC was given the possibility to change the central bank lending rates within a floating range around the rediscount rate without prior approval of the State Council. However, the turnover of operations within the rediscount instrument itself is too small to have some significant influence on the growth of monetary base. Thus, today the rediscount policy primarily aims at influencing the commercial paper market (PBC, 2004e; PBC, 2004f and Xie, 2004a: 3ff). (c Tsector liquidity. At first, the officials set different reserve obligations for the different deposits with regard to their origin and the institution actually holding the reserves.22 In 1985, the PBC combined all different reserve requirements and set one minimum reserve requirement at 10 per cent. But only from
22 For instance, the Agricultural Bank of China (ABC), the Industrial and Commercial Bank of China (ICBC), and the Bank of China (BOC) had to hold 20 per cent on deposits of companies as well as 40 per cent on money of urban and 25 per cent of rural origin. The China Construction Bank (CCB) had a requirement of 30 per cent regardless of the money’s origin.

8
1998 on the instrument of the reserve requirement was more actively used in 1998 (table 1).23 That year also marks the time when the PBC shifted its monetary policy from direct control to more indirect control and made open market operations (OMOs) the main instrument of its monetary policy. The Chinese reserve requirement regime has three particular features. First, minimum and excess reserves are interest bearing. According to Schlotthauer (2003), during the 1990s, the interest paid on the reserves was so high that there were years in which the dominant strategy of a commercial bank was to hold reserves at the central bank instead of granting a risky loan to an enterprise (Schlotthauer, 2003: 212). However, the PBC argues in favour of the interest-bearing component that in this case, it was able to constitute a lower limit for the money market rate (Xie, 2004a: 20). This, however, could not be constantly achieved (PBC, 2000). Second, the financial system holds high ratios of excess reserves, as shown above. Interestingly, rural credit cooperatives (RCCs) hold the highest ratio of excess reserves amongst all financial institutions in recent years (PBC, 2004a: 6). And RCCs are subject to credits in the direct central bank lending scheme as they are subsidized with central bank money at a very low lending rate. Thus, the example of RCCs show clearly that the administered command style of the PBC lending rates blur the price-theoretic interest rate channel of the Chinese financial system. Third, in April 2004, the PBC decided to formally introduce a policy of “differentiated required reserve ratio for different financial institutions” (PBC, 2004b), which linked the required reserve ratio applicable to financial performance indicators such as capital adequacy ratio and asset quality as well as geographic and institutional scope of the organization, i.e. rural and urban credit cooperatives (PBC, 2003c). Thus, in 2004, financial institutions with capital adequacy ratio below the 8 per cent threshold of the Basel Accord were subject to an 8 per cent required reserve ratio, while ratios for rural and urban credit cooperatives were frozen in the 1999 level to 6 per cent (PBC, 2004c and PBC, 2004d). This decision, however, largely seems to be a one-off event. Since then, reserve requirement ratios for financial institutions subject to the differentiated regime as well as the urban credit cooperatives were adjusted with the same stance as the general reserve requirement ratio24 (PBC, 2006a and PBC, 2006b), implying that by the end of 2006, the reserve ratio for financial institutions with insufficient
capital adequacy was 0.5 per cent higher and for urban credit cooperatives, it was 1.5 per cent lower
than for all other institutions. By the end of 2006, rural credit cooperatives were still subject to the 1999 ratio of 6 per cent. Table 1 shows the development of the reserve requirement in detail between 1985 and 2006. The table illustrates the mentioned passivity in using the instrument between 1985 and 1998 and the ever-increasing activity since 2003 with 5 upward adjustments of the general rate in the three years between 2003 and 2006. The justifications of the PBC in regard to these adjustments show that the reserve requirement ratio is more and more seen as a main instrument to control liquidity in the financial system at large and restrain the relatively fast growth of monetary and credit aggregates of the economy between 2003 and 2006 (PBC, 2003c; PBC, 2006a; PBC, 2006c and China Monetary Policy Reports, various issues). To this end, the requirement to hold reserves with the PBC is one means to offset the effects of ever rising capital inflows into China. Through the frequent adjustments, three of them in 2006, the PBC made clear that the instrument of reserve requirement is a major component of the current monetary policy toolbox .
23 Excess reserves can be voluntarily held only since 1998. 24 The general reserve requirement ratio applies to the “Big Four”: (i) ABC; (ii) BOC; (iii) CCB and (iv) ICBC, joint-stock commercial banks, city commercial banks, rural commercial banks (rural cooperative banks), China Agricultural Development Bank (a policy bank), trust and investment companies, finance companies, financial leasing companies and relevant foreign funded financial institutions.

9
Table 1 Reserve requirements in China: 1985–2006
Year Reserve requirement ratio (%) Change in percentage points
1985 10.0 ---
1987 12.0 2.0
1988 13.0 1.0
1998 8.0 -5.0
1999 6.0 -2.0
2003 (Sep) 7.0 1.0
2004 (Apr) 7.5 0.5
2006 (Jul) 8.0 0.5
2006 (Aug) 8.5 0.5
2006 (Nov) 9.0 0.5
Source: See Wei (1999: 145 f); PBC (2000) and PBC, China Monetary Policy Reports, various issues.
Note: In 2004, establishment of “differentiated required reserve ratio for different financial institutions”, i.e. since 1999, ratios for rural credit cooperatives are unchanged at 6 per cent and by the end of 2006, the reserve ratio for financial institutions with insufficient capital adequacy was 9.5 per cent and for urban credit cooperatives, it was 7.5 per cent.
(d) Open Market Operations (OMOs) In 1993, the PBC introduced the instrument of open market operations (OMOs) into its monetary policy toolbox. But the authorities soon had to realize that the institutional foundation with the absence of an inter-bank market and only rudimentarily liberalized interest rates was not strong enough to establish well functioning OMOs. Thus, in the following years, only few OMOs were carried out and on a very low scale. Therefore, the central bank decided to suspend OMOs in the year 1997.25 On 26 May 1998, the authorities officially re-introduced OMOs.26 Under new circumstances with a better institutional foundation, the operations were an immediate success. Ever since, OMOs have represented a key instrument for the conduct of monetary policy in China. Before 27 February 2003, open market operations were generally carried out once a week - on Tuesday. Between February 2003 and May 2004, several adjustments to the frequency have been made on trial basis with the occasional introduction of a second trading day - on Thursday, particularly between February and April 2003. This was a move to promote and support the institutional foundation for open market operations in China (PBC, 2003d). Since 11 May 2004, open market operations have been generally conducted on two days per week - Tuesday and Thursday. Open market operations include: (i) national bonds; (ii) Central bank bills; and (iii) financial bonds from other financial institutions, the so-called policy banks. They are traded as repurchase and outright market operations. Repurchase operations include: (i) repurchase agreements for the purpose of monetary base withdrawal (“repos”); and (ii) reverse repurchase agreements for fuelling monetary liquidity (“reverse repos”). Additionally, the central bank issues central bank bills, securities issued by the PBC. Generally speaking, the PBC withdraws monetary base by issuance of central bank bills and injects monetary base with their redemption (Dai, 2002; Dai, 2003: 57 and PBC, 2003c: 11f).
25 Please refer to Mehran et al. (1996a: 47) for a detailed description for the early years of OMOs. 26 Please refer to Dai (2003: 57) who delivers a detailed explanation of the conduct of OMOs in China.

10
From May 1998 to mid–2000, only repurchasing operations were utilized for the sole purpose of issuing base money. Since mid–2000, however, a major shift took place. Repurchase agreements were increasingly used to withdraw base money from the financial system (table 2). This became necessary as increasing amounts of foreign exchange had to be purchased with RMB to keep the de facto peg of the exchange rate (see box 2). Through the purchase of foreign exchange (“foreign exchange interventions”) the amount of RMB base money increased. To compensate (“sterilize”) for foreign exchange interventions, repurchase operations are one effective tool that can be applied. However, since there is a limit to the potential to sterilize through pure repurchasing operations, in 2003, the central bank started to additionally issue central bank bills (see table 2).27
Table 2 Open Market Operations in China, January 2000–December 2006
Year Total Reverse repos Repos
Central bank bills
2000 132 107 25 0
2001 50 26 24 0
2002 77 45 32 0
2003 73 6 18 49
2004 138 1 43 94
2005 189 3 62 124
2006 137 1 39 97
Total 796 189 243 364
Source: Author’s calculations based on data from www.chinabond.com.cn. While “reverse repos” made up the majority of operations up to 2002, starting from 2003, the usage of OMOs for the issuing of monetary base became insignificant (table 2). In fact, the usage of “repos” and the issuance of the Central Bank increased dramatically over time with a peak in 2005 reflecting the ever-increasing need for sterilization of foreign exchange interventions between 2003 and 2006 (see box 2). In 2006, only one “reverse repos” took place compared to 39 “repos” and 97 central bank bills (table 2).
27 On each trading day, the PBC publishes results on the same day. The information is announced via two web pages: (i) the “China Bond Market Information Network” (www.chinabond.com.cn) and (ii) the “China Money Network” (www.chinamoney.com.cn). Both sites are closely connected and partly operated by the PBC or one of its departments.

11
Box 2: Sterilization of foreign exchange inflows Sterilization measures are those operations that are able to keep the money market under control through offsetting the expansion of monetary base caused by foreign currency inflows with compensating measures. The problem of sterilization operations is that they cause costs. These sterilization costs are defined through the domestic and foreign interest rate differential. Domestically, on the one hand, the central bank has to offer a certain interest rate to absorb the excess liquidity. On the other hand, the central bank earns money on its acquired foreign exchange reserves. “Thus, if a central bank tries to target a constant nominal exchange rate (…) in a situation where the domestic interest rate is higher than the foreign rate, it is not able to defend its currency against strong appreciation pressure for long” (Bofinger, 2001: 390). There are currently two main opinions vis-à-vis the cost of sterilizing foreign exchange rate in China. The proponents of the argument that the exchange rate regime is one major cause of the uncontrollability of the development of monetary base in China usually argue that the costs (direct and indirect) of sterilization are too high to be maintained over an extended period (Goldstein, 2004: 27 and Goldstein et al., 2007: 7–8).28 The other group argue, correctly in the author’s view, that sterilization measures up to 2006 were always able to compensate all capital inflows into China, including those induced by the foreign exchange regime. As a result, the impact of capital inflows on the domestic liquidity conditions was virtually insignificant (Anderson, 2006 and Anderson, 2007). Moreover, several studies come to the conclusion that the sterilization costs in China are either very low or even negative, i.e. the PBC is likely to make money through the exchange rate regime (see Anderson, 2005; Anderson 2006; Green, 2005 and Qu, 2005). For instance, Green (2005) calculates that the PBC received a net income of the exchange rate peg in 2004 of “at least (…) US$8.4 billion (…) and possibly as much as US$15.4 billion” (Green, 2005: 25).29 Two main reasons can be put forward. First, low domestic interest rates vis-à-vis foreign interest rates. While this effect started to fade with the recent increases in domestic interest rates, still, as Anderson (2007) puts it: “short-term money market rates are not aggressively above the United States levels”. Second and more important, extraordinary stocks of foreign exchange reserves. It is crucial for the computation of the costs to compare the interest rate expenses of the outstanding debts for sterilization purposes with the whole stock of foreign exchange reserves. As Anderson (2005) points out that one has to compare interest payments for around US$200 billion domestically with interest gains of US$700 billion. In this situation, the lack of the exact knowledge of the interest rate return matters far less than Goldstein (2004) argues. The sheer size of the dollar stocks indicates that there is a profit, and the stock of US$ rose up to US$1,068 billion by the end of 2006.
2. Quantity-based direct instruments Before the reform era, the credit plan acted as the financial framework for the state investment plan. Necessary credits to reach the given output targets have been summed-up. Since the 1980s, the instrument of the credit plan has been adjusted several times according to the new financial and economical environment. In 1996, still, the credit plan was the most important monetary policy instrument of the PBC (Mehran et al., 1996a: 41f). Only in 1998, when the credit plan was officially abolished and OMOs were established, the latter became the main monetary policy instrument in the PBC’s toolbox. Today, preferential lending to certain areas and industries is still observable. Thus, credit allocation in those areas does not follow cost-utility criteria, i.e. credit allocation is not steered by the price but by the required and/or desired amount of money. In a nutshell, there is still a quasi credit plan in effect. However, compared to the long-term determination of the official credit plan(s) of former times, the amount-driven credit allocation of today serves on an ad hoc basis. The two instruments of window guidance and direct PBC lending are mainly used for the quantity-based allocation of credits in the Chinese financial system.
28 Yu Yongding, Professor at the Chinese Academy of Social Sciences and as a member of the Monetary Policy Committee at the PBC argues in a similar way. According to an article of the Financial Times from 14 April 2005, he “thinks sterilization can continue for ‘quite a while’ but says the cost is getting higher” (Balls et al., 2005). 29 This assessment was confirmed for the subsequent period of 2005–2006 through two new studies by Green as referred to by Goldstein et al. (2007).

12
(a) Window guidance The PBC started to adopt the policy of “window guidance”30 in 1998. The framework for the Chinese
window guidance was closely modelled according to the Japanese system, which had been in place for more than 40 years until its suspension in the early 1990s. This policy uses benevolent compulsion to persuade banks and other financial institutions to stick to official guidelines. Central banks put moral pressure on financial players to make them operate consistently with national needs (N.A., 2004). A major point of the concept is the temptation to influence the market participants through words rather than strict rules. Despite the phrase guidance, which implies a voluntary aspect in the system, the PBC has a major influence on the lending decisions especially to the four state-owned commercial banks (Ikeya, 2002: 2ff). The PBC regards the instrument “as an important monetary policy [that] can be combined with other instruments to guide market expectations”. By “making the market anticipate its monetary policy”, the PBC claims to achieve a more effective overall monetary policy (PBC, 2006g: 16). At times it remained unclear whether the PBC was the sole entity to control the instrument of window guidance. However, this issue appears to be resolved in the meantime (see box 3).
Box 3: Window guidance – is it the PBC’s business? In 2004, the responsibility to provide window guidance appeared to be unclear. While all of the mentioned measures in this section have been defined and carried out by the PBC itself, in April 2004, the China Banking Regulatory Commission (CBRC) advised 11 state-owned shareholding commercial banks31 to limit lending to certain sectors. Additionally, on 13 May 2004, the CBRC held a workshop with the “Big Four” commercial banks “aiming at improving the window-guidance” (CBRC, 2004). These were clear measures that had to be taken within the framework of window guidance. One observer stated that the CBRC in 2004 “gave strict window guidance to major local banks” (Hagiwara, 2004: 5). Moreover, in a press conference on 7 March 2005, the CBRC representatives reported that in 2004, the CBRC enhanced its roles in providing window guidance and risk signalling for banks” (CBRC, 2004). Since window guidance plays a major role in the monetary policy strategy of the PBC, this situation had to be resolved. As an instrument within the PBC toolbox, the PBC needs to be solely responsible for the application of window guidance, and transparency about its usage is necessary. However, with regards to the advice to limit lending in April and May 2004, the CBRC acted without the approval of the PBC, as was reported by Mr. Huang, the then Secretary of the Monetary Policy Committee of the PBC in a personal interview with the author of this study. In a move to provide more transparent window guidance policy, the PBC together with the CBRC and several ministries issued a joint guideline for bank lending by sector in May 2004 (Ma et al., 2004a: 3). Subsequently, no single-handed CBRC issued a window guidance measures reported in 2005 and 2006.
On 5 June 2003, the PBC initiated a particular window guidance process to curb the expansionary tendency in the economic cycle 2003–2004. This process was with publishing a notice about “Further Strengthening the Management of Real Estate Credit Business”, especially targeting the real estate sector. Following that, the PBC asked for window guidance meetings three times in the second half of 2003. In those meetings on 18 July, 11 August and 12 September, the PBC invited representatives from all Chinese financial institutions and repeatedly asked them to pay attention to the proper capital adequacy ratio and to prevent credit and liquidity risks. Facing a very fast growth of commercial bank loans to the real estate sector at that time, “the PBC timely signalled risks on real estate loans in June to further standardize its development and strengthened window guidance on commercial bank loans” (PBC, 2004a: 2). This was a rather strong urge to calm down the commercial banks lending for real estate businesses.
30 This is the translation of the Japanese expression. It is also known as “moral suasion” and “jawboning”. 31 Reportedly, the 11 commercial banks accounted for about 10 per cent of the total banking sector assets.

13
Since the beginning of 2004, monthly assessments of the PBC “to review economic and financial development and strengthen warnings for the commercial banks to guard against potential risks” (PBC, 2004h) have been added to the window guidance policy. In the monthly meetings, credit guidance and information about risks were provided to the commercial banks as an outcome of the assessments (PBC, 2004i). Furthermore, on 23 March 2004, a large-scale window guidance meeting with all commercial banks took place, with the target to set up a credit restriction mechanism according to the commercial banks’ risk-control abilities and their capital adequacy (PBC, 2004h). On 21 January 2005, besides the continuation of monthly assessments, one major window guidance
conference was convened (PBC, 2005d and PBC, 2006d). In the conference, representatives of the
state-owned commercial banks, joint-stock commercial banks, policy banks, and the PBC branch offices gathered with a particular focus on “credit support to the rural economy and the non-state sector”, since they play “a very important role in promoting the coordinated development of the national economy” (PBC, 2005d). Accordingly, the role of innovation within the financial institutions and improved financial services for agricultural loans were discussed. Since April 2006, a significant strengthening of window guidance has been recognizable, mainly due
to the pertinent high growth of the economy throughout the year (PBC, 2006e). Six meetings were scheduled on 27 April, 18 May, 13 June, 15 August, 3 November and 8 December. All meetings came shortly after respective gatherings by the State Council called for prudent macroeconomic policies to reign excessive loan growth. In the meetings, financial institutions’ representatives were “urged (…) to comprehensively, correctly, and actively implement the macroeconomic management policies formulated by the central government” (PBC, 2007a), a rather strong call to adhere to official guidelines. The meetings showed a mix of dampening efforts “to industries with excessive investment” as well as diversification with financial innovation and again through a special focus on rural areas and the non-state sector (PBC, 2006e; PBC, 2006f and PBC, 2006g). The reasons for the window guidance being relatively successful in China is to a great extent in the
fact that the governor of the PBC is a higher-ranking official than the leaders of the commercial banks. Thus, according to the hierarchical system, the commercial bank leaders have to adhere to orders made within the policy of the window guidance. (b) Direct People’s Bank of China lending Direct PBC lending as a monetary instrument is in the legacy of the planned economy, the usage of which was officially discontinued in 1994 (Mehran et al., 1996b: 19). However, the last decade or so was marked with a high amount of the central bank money permanently being in the financial system, evidence for instance, by excess reserve ratios well above the 10 per cent margin in the 1990s which only gradually came down to 7.61 per cent in 2001 and 5.38 per cent at the end of 2003. In 2005 and 2006, excess reserve holding stabilized between 4 and 5 per cent (PBC China Monetary Policy Reports, various issues and Cheng et al., 1996). This high amount of the central bank money to a great extent is caused through long-term central bank’s loans that are subject to low interest rates without being linked to the predominant monetary policy stance. The long-term loans can be seen as a “planned economy-style” fixed-quantity contribution from the central bank to the commercial banks. Direct central bank lending appears to be the main source of such provision of the central bank money. The total amount of outstanding central bank’s lending was over US$200 billion in 2002, which was about 9 per cent of the monetary aggregate M2 (Xie, 2004a: 20f). Today’s central bank’s lending appears in very different ways. As indirect subsidy for rural credit cooperatives with very low lending rates to those institutions and as “lender of last resort” to bail-out financial institutions as well as lender to local governments, asset management companies and rural credit cooperatives got rid of NPLs.

14
(c) Capital controls A third instrument within the quantity-based instrument toolbox of the central bank is capital controls.32 However, the instrument of capital controls differ fundamentally from window guidance and direct PBC lending as the capital controls’ aim is not the amount-driven credit allocation but the quantitative limitation and guidance of financial flows between China and the rest of the world. The case for capital controls in China can be mainly derived from the de facto fixed exchange rate target of the RMB since the Asian crisis in 1998 (see box 1).33 Based on Padoa-Schioppa’s “inconsistency triangle” or “unholy trinity”, pursuing autonomous monetary policy in a fixed exchange rate regime is incompatible with a free movement of capital. There are several ways out of the “unholy trinity” towards a “consistency triangle”. Bofinger (1999) argues in favour of a solution that leaves free capital flows and guarantees an autonomous monetary policy with the introduction of a semi-fixed exchange rate that is adjusted by the interest rate differential (“managed floating”). The most obvious solution, however, would be to constrain the capital mobility and thus reach a fixed exchange rate regime that still enables an autonomous monetary policy. And that is what is done in China. 34 According to the Annual Report 2003 of the State Administration of Foreign Exchange (SAFE), 50 per cent of the Chinese capital account transactions were either lightly controlled or not at all restricted, 30 per cent were more and 20 per cent tightly controlled. While there are no exact definitions of the respective scopes given, the figures show for certain that there is no complete opaqueness of the Chinese control system. Some areas purposefully are not subject to controls. In addition to the deliberately not controlled areas, there is a certain porosity within the areas under control. From 1994 to 2006, US$200 billion were able to cross the Chinese border as measured through the errors and omissions of figures in the Chinese balance of payments (figure 2), almost three-quarter were outflows (US$147 billion) and one-quarter capital inflows of (US$52 billion).
32 In fact, capital controls in China are administered by the State Administration of Foreign Exchange (SAFE), an institution that acts under the leadership of the PBC. 33 Two other prominent cases for capital controls are: First, the international assessment of the Asian financial crisis. UNCTAD’s Trade and Development Report 1998, stated that the “management of a country’s external assets and liabilities is linked […] [to factors like] good macroeconomic fundamentals, effective financial regulation and supervision, and even good corporate governance” (UNCTAD, 1998: 101). The report proceeds that “a key role here is played by policies aimed specifically at external assets and liabilities – most importantly, capital controls but also certain other measures” (UNCTAD, 1998: 101). Krugman pointed into the same direction in his assessment of the crisis: “Yes, there is [a way out], but it is a solution so unfashionable, so stigmatized that hardly anyone has dared to suggest it. The unsayable words are exchange controls” (Krugman, 1998). Second, various reports emphasize the importance of the extraordinary high Chinese savings rate in the country’s development story (see World Bank, 1997: 4ff). Based on this assessment, a key concern for the Chinese authorities is to keep alive the peoples’ confidence into the banking and financial sector. Preserving this confidence, however, becomes increasingly difficult in a situation with mounting non-performing loans and significant implicit future financial burdens due to the absence of a pension scheme and ever increasing environmental destruction. Having this in mind, a restricted capital account is a favourable option for the time being. As Kato put it in 2004: “Given the magnitude of the task that is required, it will be some time before the financial system is fully strengthened. Until then, maintaining China’s steady and gradual approach to capital account liberalization is appropriate” (Kato, 2004). 34 For a discussion of the responsibilities in the management of the capital controls through the State Administration of Foreign Exchange (SAFE), please refer to Geiger (2006).

15
-25
-20
-15
-10
-5
0
5
10
15
20
25
1994 1995 1996 1997 1998 1999 2000 2001 2002 2003 2004 2005 2006
Errors & Omissions
Source: IMF, International Financial Statistics .
Figure 2Porosity of Chinese capital controls, 1994–2006 (billion US$)
While the 1990s were characterized by huge amounts of capital outflows, the flows changed direction in 2002. Within three years between 2002 and 2004, capital of over US$52 billion came into the country. Large parts of these inflows can be accounted to rising expectations for RMB appreciation and thus constituted speculative inflows. The speculation for appreciation was also displayed by a shift in the prices for non-deliverable forward (NDF) RMB quotes. As Anderson (2003) shows, the market was expecting devaluation until mid-2002; then the market shifted its expectations and traded the US$ at an increasing discount against the RMB (see Anderson, 2003: 6 and Ma et al., 2004: 9). In 2005, capital flows in the errors and omissions of the balance of payments changed direction again and in just two years, US$29.5 billion flew out of the country. This surprising and significant change of direction is likely to be the product of two factors. First, inflows of “hot money” for speculative purposes have eased after the RMB reform on 21 July 2005. Second, Prasad et al. (2005) point to the possibility that “the errors and omissions category may in part reflect an accounting issue”, i.e. that China’s official foreign exchange holdings through SAFE are not valued according to market exchange rates, while the PBC’s stock of international reserves in the central bank’s balance sheet considers exchange rate fluctuations (Prasad et al., 2005: 12 and Ma et al., 2007: 17). The authorities decided to take a gradual approach for capital account liberalization and through this, they achieved a certain degree of free capital account transactions (Icard, 2004). Most liberalization steps up to 2004 were thought to ease the net inflow of capital since the basic balance of payments became increasingly positive (Ma. et al., 2004) and the de facto exchange rate peg got under pressure. To keep the peg at the desired rate, the central bank had to use foreign exchange market interventions, which in turn increased the monetary base in China. Two measures can be used to dampen, if not offset the effects on the monetary base. First, foreign exchange interventions can be sterilized to compensate for the increase of monetary base (see box 2). Second, through partly liberalization of the capital account, an increased outflow of capital can be triggered to balance the inflow of capital through increases outflows (Ma et al., 2007). In this regard, Chinese authorities since 2001 have been experimenting with the promotion of outward direct investment (ODI). In 2005, ODI accounted for US$11 billion. The so-called Qualified Domestic Institutional Investor (QDII) is a second means to trigger capital outflows. While it had been considered as early as 2002 (PBC, 2003d) the scheme was finally and officially introduced in April 2006. The scheme allows Chinese individual and institutional investors (including insurers) to invest onshore and hold US$ and RMB deposits in offshore markets. In one year between April 2006 and May 2007, QDII quota to banks and funds totalled US$14.2 billion (www.fundcn.org). Despite all these measures, Ma et al. (2007) find in their study about the

16
effectiveness of capital controls in China (up to 2006) that “China’s capital controls remain substantially binding” (Ma et al., 2007: 22). B. Other non-central bank policy instruments 1. Price controls Since 1998, three kinds of prices have been predominant in China (N.A., 1998a and WTO, 2001): (i) market-regulated prices, which are set by the market through supply and demand and are not faced
with any intervention from authorities; (ii) Government guidance prices, which can come either as a benchmark price or a floating range set by the government. The floating band is usually between 5 and 15 per cent; and (iii) Government prices, which are fixed prices set by the responsible government
authorities and are unchangeable unless approved by this authority. There are prices that have to be set by the central government and other prices that can be set and controlled by the province, the autonomous region or the municipality level. They can be set either by the relevant price department or other related departments. Basis for the control is the listing on so called price catalogues, which can be issued by both central and local governments.35 Centrally controlled prices need the approval of the State Council and prices for the local catalogues need the approval of the government by the appropriate level.36 Governments below the province, autonomous region or municipality level cannot issue their own price controls. Goods, public utilities and services are only eligible when they fall in one of the categories on the following table (table 3).
Table 3 Criteria for government control of prices in China
Item Facts / Prerequisite
Great importance for the development of the economy and the people’s living Scarcity Products Goods of a monopoly in nature
Public utilities
Important public utilities
Services Important services of public welfare
Source: Price Law of the People’s Republic of China, Article 18 (N.A., 1998a).
The report of the working party on the accession of China into the World Trade Organization (WTO) of 1 October 2001 defined the scope of price controls allowed to be in place in China after the WTO entry. The report lists all products, public utilities and services, which are subject to price controls according to the classifications of government pricing and government guidance pricing. The report emphasizes that controls “shall not be extended to goods or services beyond those listed (…) and China shall make best efforts to reduce or eliminate these controls” (WTO, 2001: 77ff).
35 According to the WTO Report of the Working Party on the Accession of China, the authorities are obliged to publish these catalogues in the Pricing Monthly of the People’s Bank of China which is partly available in the internet via www.hebwj.gov.cn. 36 In fact, it is not possible to distinguish the different price catalogues and show clearly which prices are subject to central or local control. Local governments have to inform the central government about their decision of controls which then incorporate the prices in its catalogue. In turn, local price catalogues also contain centrally administered prices. Thus, the central and local governments’ price catalogues are fairly similar.

17
As the eligible criteria show, one strong motive in favour of the introduction of price controls is the securization of the provision of goods and services of national importance.37 Additionally, the management of the general price level clearly is a motivation of price controls. Article 26 of the Price Law of the People’s Republic of China, which fits into the chapter, “Control and Adjustment to General Price Level”, states: “To stabilize the general price level is one of the major objectives of macroeconomic policy”.” Without directly referring to price controls, the law leaves no doubt that price controls are seen as one measurement of macroeconomic policy to influence the general price level. And there is evidence of the government’s active usage of the tool of price controls even in the post-WTO era. The recent threat of an overheating economy with growing inflation rates prompted the authorities to employ price-controlling measures more frequently, with the following: First, the National Reform and Development Commission (NRDC) in China instructed the provincial authorities in March 2004 to freeze any approval for price increases for the next quarter of the year. The freeze applies if either the m-o-m local CPI growth reaches 1 per cent or higher or y-o-y monthly local CPI reaches 4 per cent or higher for three consecutive months (Wu, 2004b). Second, using a more indirect measure, the NDRC also asked local governments to set ceilings for profit rates for fertilizer wholesales, i.e. 3 per cent in Heilongjiang and 2 per cent in Hunan Province. Accordingly, a 50 per cent rebate on VAT in the fertilizer industry was re-introduced. The move is aimed at raising the output of crop and thus reduce the inflationary prices in the food sector (see People’s Daily, 2004 and Tan, 2004). The recent development reminds of the call for a more effective price controls during the high inflation period of 1993–1994. In June 1995, the China Daily published an article with the title: “Strong measures need to guide pricing system” (Fu, 1995). The article quotes a research fellow of a research centre of the State Council who pointed that the lack of price controls in the market economy had a strong influence to the increasing inflation during that time. This was the beginning of a discussion that ended with the introduction of the Price Law of the People’s Republic of China in 1998. There are no signs that the authorities want to turn back events and re-introduce controls beyond the Price Law and the WTO agreement. However, it is evident that the authorities use their discretion in setting price controls more actively in times of inflationary or deflationary pressure. In 1998, for example, the first year of the deflationary period of the late 1990s, the authorities used the instrument and set minimum prices in 21 industries to ease the deflationary pressure (Roberts, 1998). However, the results were moderate; the deflationary environment lasted for 4 years indicating limitations of the instrument of price controls. 2. Wage controls Historically, in 1978, China’s wage regime was characterized by a centrally regulated salary system that, among other things, determined the wages according to regions, occupations, industries and sectors. The heart of the system was a classification scheme with more than 300 standardized occupational classifications used for the salary formation. After 1978, the wage regime had undergone three sets of reforms in 1985, 1992 and 1994–1995, respectively (Yueh, 2004). The two reforms in 1985 and 1992 incorporated an indexation of wages to the development of the consumer price index. Thus, high inflation had an impact on the wage level setting and higher wages, in turn, triggered higher inflation rates. This constituted circles that easily led to an inflationary spiral through ever increasing inflationary expectations.38 In 1994–1995, the authorities decided to undergo a wage reform that uncoupled the wage setting from the inflation rate and thus attempted to burst the circle of accelerating inflation expectations during the high inflation period of the early 1990s. The reform can be divided into a stricter rules-based (1994–
37 It is arguable if price controls can pursue such a target at all. Please refer to Rockoff’s “Price Controls” at www.econlib.org/ for a detailed discussion. 38 For a detailed discussion of the development of the inflation rate in China for the period 1978 to 1995, please refer to Imai (1997).

18
1995 I) and a more blurred recommendation-based part (1994–1995 II).39 Companies eligible to set their wages according to the rules-based component could use their discretion within the framework of two standards. First, the growth rate of the total salaries of an enterprise had to be below the growth rate of after-tax profitability. Second, the growth rate of per capita wages ought to be less than the growth rate of labour productivity. On the second standard, the recommendation-based part of the reform from the Ministry of Labour (MOL) (by MG) suggested to enterprises that “wages are set not only according to occupation and rank, but also based on skills and productivity” (Yueh, 2004: 153). Eligible companies for the 1994–1995 I reform are those companies that are publicly listed on the Shanghai or Shenzhen stock exchange. There was no distinction made between private and state ownership. However, it can be argued that private companies would welcome any productivity related in their wage setting and therefore start to set their wages according to the reform scheme. As will be shown later, a great part of the publicly listed companies were and still are subject to state control. Thus, the impact of the reform scheme heavily depends on the state’s capability in enforcing its rules. Companies eligible for the 1994–1995 II reforms are those SOEs that underwent a partly-ownership transformation without being listed on the stock exchange (Yueh, 2004). It will be argued that the number of companies and their employees falling under the 1994–1995 II wage scheme is much higher than the 1994–1995 I reform. The two reform approaches differ fundamentally in terms of the content as well as the scope of companies eligible. The second part of the reform represents a guideline, which enterprises are suggested to follow rather than stands for a strict rule. Geiger (2006) estimated the number of employees that fell under the 1994–1995 reforms and the share of total wages that could be affected (Geiger, 2006: 22–27). The author found that 12–15 per cent of the Chinese wage bill could potentially be influenced in 1995 and around 14 per cent in 2001 (table 4).
Table 4 The potential impact of the 1994–1995 wage reform on China’s total wage bill,
1995 and 2001
Reform Characteristics Number of employees (million)
Percentage of Chinese wage bill
1995 2001 1995 2001 1994/1995 I Rule-based n.a. 3 <=3% 3%
1994/1995 II Recommendation-based 18 12 12% 11%
I + II --- 18–21 15 12–15% 14% Source: Author’s calculations, based on data from China Security Regulatory Commission,
Statistical Information Online Database; China Statistical Yearbook, various issues and Thomson Datastream.
39 It is important to emphasize that the issues to be discussed in the 1994–1995 reform analysis relate primarily to the wage settings in state-owned or partly state-owned units in the industry sector. Therefore, any effects of the reforms are decreasing with a declining importance of state-owned enterprises in the Chinese economy. For example, from 1991 to 2001, the employment in the state-owned industrial sector declined sharply from 44.7 million to 18.2 million people whereas, employment in the non-state owned sector increased sharply from 1.82 million to 15.5 million people (National Bureau of Statistics of China, China Statistical Yearbook, several issues). Another obstacle in the calculation of wage control effects is the definition of “employment” in the context of state-owned enterprises. In 1998, around 8.8 million workers of the 15.7 million workers who have been laid-off within the state-owned sector have been subject to “xiagang”, i.e. affected employees are still registered at their work unit but do not go to work.39 For a detailed discussion of the development of the inflation rate in China for the period of 1978 to 1995, please refer to Imai (1997).
19
III. EFFECTIVENESS OF THE CHINESE MONETARY POLICY A. Intermediate targets For a variable to serve as an intermediate target of monetary policy, there has to be a sufficient controllability of the variable itself and needs to show a relationship to the final target of price stability. Thus, in this section two main questions are primarily dealt with: (i) are the intermediate targets of the Chinese monetary policy controllable? and (ii) is a sufficient relationship between these targets and the inflation rate observable? 1. Monetary aggregates The monetary aggregates M1 and M2 are the most prominent intermediate targets of the PBC. The authorities started to set up target values for M1 and M2 in 1994. Today, these values are published in the annual monetary policy report for the subsequent year online in Chinese and English.40Unlike the ECB, which derives its target for its reference value M3 via the quantitative equation for money (M·V≡P·Y)41 and its derivation of a “potential formula” (∆M=π+∆Y-∆V and ∆M3*=πtarget+∆Ypotential-∆Vtrend)42, the PBC apparently is not using such a formula (table 5).43 In fact, for the time being, the PBC is formulating its monetary target values via a projection in a normative way. One example, in its Monetary Policy Report 2003, the PBC published its monetary targets for 2004 as follows: “Taking into account the time-lag effect of the faster and desired growth of money and credit in 2003, the growth of money supply and loan increase in 2004, should be controlled lower than that of 2003. M2 and M1 are projected to grow by 17 per cent respectively and RMB loans to increase by RMB 2.6 trillion yuan” (PBC, 2004a).
Another way to show the projection character of the monetary target is in calculating them according to the quantitative equation of money for a comparison. This is done in table 4, where the “potential formula” is applied to the Chinese situation to calculate the theoretically optimal growth rates for M1 and M2 from 1995 to 2006. Then, these rates are compared to the targets set by the Chinese authorities. Similarity to the values, imply a set up of the Chinese monetary targets according to the quantitative equation for money. Table 5 shows that the monetary targets of the PBC were rather close to the quantitative equation for money in 1995 and ever since fell significantly apart to 2006.44
40 Chinese: www.pbc.gov.cn/xinwen/; and English: www.pbc.gov.cn/english/xinwen/. 41 M stands for the quantity of money, V for the velocity of circulation, P the price level, and T for the transaction volume. 42 ∆M3* represents the optimum growth rate of M3, πtarget the target inflation rate, ∆Ypotential the potential output growth rate, and ∆Vtrend the trend rate of change in the velocity of circulation of money. 43 For a detailed explanation of the concept of monetary targeting of the ECB, please refer to Bofinger (2001). 44 The calculation underlying table 5 uses the GDP targets of the respective five-year plan of China as a proxy for the potential output growth (1991–1995: 8.5 per cent; 1996–2000: 8 per cent; 2001–2005: 7 per cent and 2006–2010: 7.5 per cent). This seems to be a good proxy since estimations for China’s potential output growth are between 8 and 9 per cent for 1995–2006 (Gerlach et al., 2006: 25 and Kuijs et al., 2005: 11).

20
Table 5 Testing the ECB potential formula for the PBC, 1995–2006
Year Target
inflation (π)
+Output
potential (Y)
- Velocity of money (V) =
Optimum monetary growth
(M*) PBC targets
VM1 VM2 M1* M2* M1* M2* 1995 15.0 8.5 -0.05 -0.03 23.5 23.5 21-23 23-25 1996 10.0 8.0 -0.05 -0.03 18.0 18.0 18.0 25.0 1997 6.0 8.0 -0.05 -0.03 14.0 14.0 18.0 23.0 1998 5.0 8.0 -0.05 -0.03 13.0 13.0 17.0 16-18 1999 2.0 8.0 -0.05 -0.03 10.0 10.0 14.0 14-15 2000 1.0 8.0 -0.05 -0.03 9.0 9.0 15-17 14-15 2001 1.5 7.0 -0.05 -0.03 8.5 8.5 13-14 15-16 2002 1.5 7.0 -0.05 -0.03 8.5 8.5 13.0 13.0 2003 1.0 7.0 -0.05 -0.03 8.0 8.0 16.0 16.0 2004 3.0 7.0 -0.05 -0.03 10.0 10.0 17.0 17.0 2005 4.0 7.0 -0.05 -0.03 11.0 11.0 15.0 15.0 2006 3.0 7.5 -0.05 -0.03 10.5 10.5 14.0 16.0
Source: Author’s calculations, based on data from Ikeya (2002: 2); World Bank, World Development Indicators; PBC (1995); PBC (2003b: 2); PBC (2005e: 37); PBC (2005f: 50) and Xie (2004a: 2).
Note: Target inflation: the PBC publishes targets for inflation rate in its Monetary Policy Reports starting with the China Monetary Policy Report 2002, usually by referring to the Annual Central Government Economic Conference. Earlier targets are derived from (Xie, 2004a and Ikeya, 2002).
Output potential: GDP targets as set up in the corresponding Chinese five–year plan are taken as a proxy.
Velocity of money: Nominal GDP divided by money M1 (for velocity VM1) and M2 (for velocity VM2). The velocity was declining between 1995 and 2006 with a one-off increase in 2004–2005 followed again by a declining rate in 2006; to arrive at the trend decline rate, the average rates of changes of VM1 and VM2 were taken.
The question is why the PBC publishes a monetary targeting strategy with monetary targets, while the targets are not theoretically derived. The main reason for this might be in the charming character of applying a simple rule which reads: “If monetary growth exceeds (falls short) of the monetary target, short interest rates have to be increased (reduced). If monetary growth is in line with the target, the interest rate should be kept constant” (Bofinger, 2001: 248). Through the publication of monetary targets, the PBC gets into the position to apply this rule. In fact, it might be of secondary importance how the targets are derived but most important that they should be installed. However, today, the concept of monetary targeting is under criticism in general, primarily due to the questionable controllability of monetary targets and an insufficient relationship to inflation. Thus, an important reason for the use of monetary targeting in China certainly is the search for a nominal anchor, i.e. the commitment to a consistent and transparent policy framework that the public could use to monitor the actual policy (Croce et al., 2000). With this nominal anchor, the PBC might hope to gain reputation for its monetary policy just as the ECB did, once it was established (Mishkin, 2002). (a) Controllability Table 6 shows the comparison of the targeted and actual values of the Chinese monetary aggregates of M1 and M2 from 1994 to 2006. The targeted and the actual values fell together only three times in the case of M1 and only four times in the case of M2 aggregate. M1 values had less than one percentage point deviation in the years 1996, 2000 and 2001 and M2 aggregates met its targets in 1996, 1998,

21
1999 and 2001. Obviously, targets were met more easily, when target bands were formulated. Only in the year 1996, the precise targets of 18 and 25 per cent growth for M1 and M2 were met fairly
accurate. Strong deviations of more than 4 percentage points occurred three times for M1and M2 aggregates. The rather strong deviations particularly arose in the early phase of the formulation of monetary targets, after the high inflation rate of 24 per cent in 1994. From 1999, a more stable control in terms of lower deviations from the targets was realized. However, only two out of six targets were
met with deviations of less than one per cent between 1999 to 2006.45 Surprisingly, in 2004, when inflationary pressure was rather strong, the actual values were 3.4 percentage points less than the M1 target and 2.4 percentage points less than the M2 target (table 6).
Table 6 Targeted and actual values for the PBC’s monetary aggregates, 1994–2006
Year M1 growth (per cent)) M2 growth (per cent)
Target Actual Target Actual 1994 21 26.2 24 34.5 1995 21–23 16.8 23–25 29.5 1996 18 18.9 25 25.3 1997 18 16.5 23 17.3 1998 17 11.9 16–18 15.3 1999 14 17.7 14–15 14.7 2000 15–17 16.0 14–15 12.3 2001 13–14 12.7 15–16 14.4 2002 13 16.8 13 16.8 2003 16 18.7 16 19.6 2004 17 13.6 17 14.6 2005 15 11.8 15 17.6 2006 14 17.5 14 16.9 Source: See Ikeya (2002: 2); PBC (2001: 181); PBC (2003b: 2); PBC (2005a); PBC (2005e: 37); PBC
(2005f: 1,50); PBC (2006g: 4); Thomson DataStream; Wu (2004a); Xia et al. (2001: 35) and Xie (2004a: 2).
Note: For 2000, Xia et al. (2001) speak of a M1 and M2 targets of 14 per cent each. In this table, the official PBC figures are cited as mentioned by Xie (2004a).
As the performance record indicates the central bank’s ability to control the aggregates, the important question is whether the monetary targets were met. In the case of PBC, the comparison of the projected targets with the actual values casts doubt on this controllability. In general, the literature ascribes the uncontrollability of monetary aggregates primarily to the lack of stability of the demand for money. As a consequence, it is difficult (if not impossible) to steer monetary aggregates with short-term interest rates. In the particular case of the PBC, arguments about constraints induced through the exchange rate regime and an unstable money multiplier are often brought forward to explain the controllability problem of monetary targets in China. First, some scholars claim that the exchange rate regime with its de facto peg of the RMB to the US$ up to July 2005 and the subsequent crawling peg – both of which undervalued – are the main source of uncontrollability of the Chinese money supply. While Chinese scholars observed this problem for the 1990s (Xia et al., 2001 and Yu, na), other proponents see it mainly due to the undervaluation of the RMB in the recent years (Goldstein, 2004 and McCallum, 2004). Accordingly, the undervalued peg of
45 In this respect, the PBC is in good company. The German Bundesbank reached only 11 of its 24 monetary targets from 1975 to 1998, despite occasionally with very broad corridors of up to 3.9 per cent. Nevertheless, there is no doubt that the German Bundesbank performed very well in terms of low inflation.

22
the exchange rate leads to increasing foreign exchange inflows, which have to be converted into RMB and thus increased domestic money supply in China (see box 2). However, “the central bank can
‘sterilize’ some or all of this potential increase in liquidity (on base money) by undertaking a number of offsetting operations, the most important of which are typically sales of securities to the banks (i.e. open market operations in government bonds or sale of central bank bills) and increase in the reserve requirement” (Goldstein, 2004: 25). In fact, since 1994, foreign exchange inflows and their associated increase in monetary base were successfully sterilized through the monetary policy instruments of the PBC. Moreover, from 2000 when sterilization operations increased dramatically to offset capital inflows, the impact of the piling up of international reserves on the domestic liquidity condition was virtually insignificant (Anderson, 2006 and Anderson, 2007). Second, Xia et al. (2001) argue, among other factors that an unstable currency multiplier is a major cause of uncontrollability of monetary aggregates in China. The instability of the money multiplier would lead to unpredictability of the relationship between the monetary base and the monetary aggregates. A stable relationship, however, is crucial since the monetary aggregates are controlled through the steering of the monetary base. Therefore, an unstable and unsteady money multiplier makes the task of monetary targeting difficult. Indeed, table 7 shows that the currency multiplier was unstable from 1994 to 2004. Money multiplier
m1 decreased from 1.14 in 1994 to 1.03 in 1996. Then, from 1996 to 2005, the multiplier m1 was on a
stable increasing path and stood at 1.63 in 2005. In 2006, multiplier m1 decreased slightly to 1.62. In
the overall perspective, the development of the multiplier m1 shows an unstable and up-and-down
path between 1994 to 2006. Money multiplier m2 was on an ascending path from 1994 to 2006 with 2.73 in 1994 and 4.45 in 2006. Two breaks of this path are observable, the first one from 1995 to 1996 and the second one from 2005 to 2006. Throughout this period under consideration, the standard deviation of m1 was 0.21 with an average value of 1.40; m2 showed a standard deviation of 0.66 with an average of 3.67. Thus, table 7 supports Xia Bin’s observation of an unstable money multiplier.
Table 7 Monetary base, monetary aggregates and the money multiplier, 1994–2006
Monetary
Base Monetary Aggregate Money Multiplier Year (B) M1 M2 M1 m2 billion RMB m=M/B 1994 1,722 1,967 4,692 1.14 2.73 1995 2,076 2,308 6,074 1.11 2.93 1996 2,689 2,756 7,610 1.03 2.83 1997 3,063 3,481 9,187 1.14 3.00 1998 3,134 3,869 10,556 1.23 3.37 1999 3,362 4,698 12,104 1.40 3.60 2000 3,649 5,454 13,596 1.49 3.73 2001 3,985 6,169 15,641 1.55 3.92 2002 4,514 7,088 18,501 1.57 4.10 2003 5,284 8,412 22,122 1.59 4.19 2004 5,886 9,582 25,305 1.63 4.30 2005 6,434 10,690 29,838 1.66 4.64 2006 7,776 12,604 34,609 1.62 4.45
Source: Author’s calculations, based on data from IMF, International Financial Statistics.
It is difficult to argue that this is a particular problem of the Chinese monetary system. At the same time, the German Bundesbank’s money multipliers were also far from being stable. Between 1975 and 1989, the multipliers for M1, M2 and M3 (m1, m2, m3) had standard deviations of 0.05, 0.28 and 0.30

23
with average values of 2.59, 4.41 and 7.60.46 Moreover, Germany’s most prominent monetary aggregate M3 had a far unsteadier pace of change than China’s aggregate M2, which was on a trend ascending path between 1994 and 2006. In a nutshell, the conduct of monetary targeting in China seems not to be subject to a particular distortion through an unstable money multiplier. In the author’s view, the main reason for the controllability of monetary aggregates in China comes from a misleading interest rate channel for monetary transmission, which is mainly caused by the transition economy with the simultaneous usage of price- and quantity-based monetary instruments. (b) Relationship to inflation The second condition for a factor to be suitable as an intermediate target of monetary policy is a significant relationship to the overall goal of price stability.47 Figure 3 displays M2 target growth rates, M2 presents the actual growth rates and inflation rates from 1994 to 2006. At first sight, there
is a parallel run of M2 growth rates and inflation rate recognizable. Over the whole period from 1994 to 2006, the actual M2 growth rates are mirrored by the inflation rate fairly well. From 1997, M2 target growth rates show a particular close development with the inflation rate. This finding might be attributed to the fact that the monetary targets are set up as a projection based on adaptive expectations rather than as a theoretical derivation. In figure 3, six phases of monetary developments can be distinguished from 1994 to 2006: 1. 1994–1996: M2 actual > M2 target: according to the monetary target approach, when the actual monetary growth is higher than the target, inflationary pressure would be prevalent. Indeed, inflation was high during the three years under consideration. In fact, the inflation rate was on a declining path and stood at 24.2, 16.9 and 8.3 per cent in 1994, 1995 and 1996, respectively. It appears that the inflation declined along a decreasing trend of actual M2 growth that developed from 34.5 to 29.5 and 25.3 per cent.
2. 1996–1999: M2 actual < M2 target: the four years of 1996–1999 show actual M2 growth rates that are lower than target M2 growth rates. According to the monetary target approach, this would indicate deflationary tendencies. Indeed, declining rates of inflation developed from 8.3 to 2.8 to -0.8 to -1.4 per cent in 1996, 1997, 1998 and 1999, respectively.
3. 1999–2001: M2 actual < M2 target: after a short time of fitting the actual and target M2 growth rates in 1999, again the actual values were running below the target values in the subsequent years. This reinforced the prevailing deflationary pressures with inflation rates of -1.4, 0.3 and 0.5 per cent in 1999, 2000 and 2001, respectively. 4. 2001–2003: M2 actual > M2 target: in 2001, the situation changed fundamentally for the first time since 1996. The actual growth rates of M2 developed on a higher course than the targeted values, which signalled inflationary pressure. In fact, the inflation rate gained momentum and increased from -0.8 per cent in 2002 to 1.2 per cent in 2003 and 3.9 per cent in 2004. 5. 2004: M2 actual < M2 target: to fight the inflationary pressures, restrictive policy measures in 2003–2004 led to a decrease of the actual monetary growth and a drop below the initially targeted rate. Due to these measures, inflation stabilized at a level below 5 per cent at the end of 2004 and stood at 2.4 per cent in December.
46Author’s calculations, based on IMF, International Financial Statistics. 47 In this section, the focus is solely upon the analysis of the relationship of monetary aggregate M2 to inflation. This is justified through the prominence of M2 within the monetary policy set up by China.
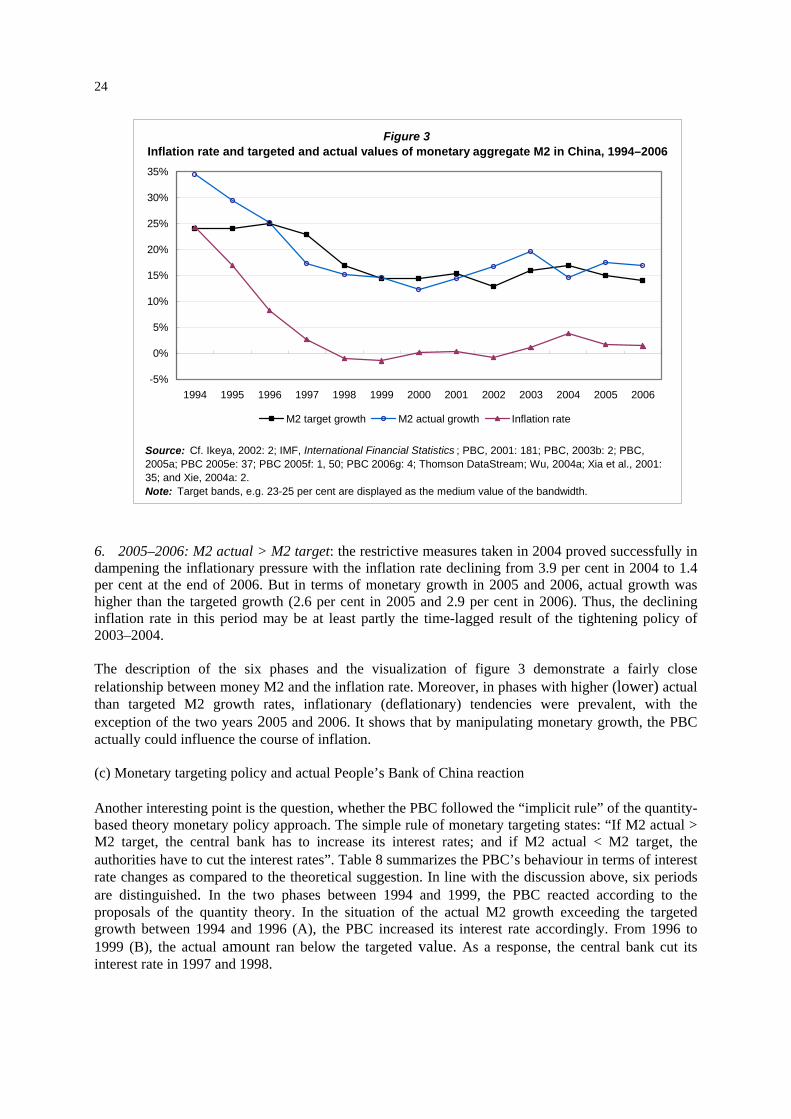
24
-5%
0%
5%
10%
15%
20%
25%
30%
35%
1994 1995 1996 1997 1998 1999 2000 2001 2002 2003 2004 2005 2006
M2 target growth M2 actual growth Inflation rate
Figure 3Inflation rate and targeted and actual values of monetary aggregate M2 in China, 1994–2006
Source: Cf. Ikeya, 2002: 2; IMF, International Financial Statistics ; PBC, 2001: 181; PBC, 2003b: 2; PBC, 2005a; PBC 2005e: 37; PBC 2005f: 1, 50; PBC 2006g: 4; Thomson DataStream; Wu, 2004a; Xia et al., 2001: 35; and Xie, 2004a: 2.Note: Target bands, e.g. 23-25 per cent are displayed as the medium value of the bandwidth.
6. 2005–2006: M2 actual > M2 target: the restrictive measures taken in 2004 proved successfully in dampening the inflationary pressure with the inflation rate declining from 3.9 per cent in 2004 to 1.4 per cent at the end of 2006. But in terms of monetary growth in 2005 and 2006, actual growth was higher than the targeted growth (2.6 per cent in 2005 and 2.9 per cent in 2006). Thus, the declining inflation rate in this period may be at least partly the time-lagged result of the tightening policy of 2003–2004. The description of the six phases and the visualization of figure 3 demonstrate a fairly close relationship between money M2 and the inflation rate. Moreover, in phases with higher (lower) actual than targeted M2 growth rates, inflationary (deflationary) tendencies were prevalent, with the exception of the two years 2005 and 2006. It shows that by manipulating monetary growth, the PBC actually could influence the course of inflation. (c) Monetary targeting policy and actual People’s Bank of China reaction Another interesting point is the question, whether the PBC followed the “implicit rule” of the quantity-based theory monetary policy approach. The simple rule of monetary targeting states: “If M2 actual > M2 target, the central bank has to increase its interest rates; and if M2 actual < M2 target, the authorities have to cut the interest rates”. Table 8 summarizes the PBC’s behaviour in terms of interest rate changes as compared to the theoretical suggestion. In line with the discussion above, six periods are distinguished. In the two phases between 1994 and 1999, the PBC reacted according to the proposals of the quantity theory. In the situation of the actual M2 growth exceeding the targeted growth between 1994 and 1996 (A), the PBC increased its interest rate accordingly. From 1996 to 1999 (B), the actual amount ran below the targeted value. As a response, the central bank cut its interest rate in 1997 and 1998.

25
Table 8 Monetary targeting policy reaction and actual PBC reaction, 1994–2006
Years Actual and targeted
growth rates (a) Textbook policy
reaction (b) Actual PBC
reaction PBC move
according theory? A 1994 – 1996 M2 actual > M2
target Interest rate increase.
Interest rate increase in 1995 and cut in 1996.
Yes, cut in 1996 justified by the overall decreasing inflation rate.
B 1996 – 1999 M2 actual < M2 target
Interest rate cut. Subsequent interest rate cuts 1997 and 1998.
Yes.
C 1999 – 2001 M2 actual < M2 target
Interest rate cut. No move within the period; interest rate cut between 2001 and 2002.
No, move too late.
D 2001 – 2003 M2 actual > M2 target
Interest rate increase.
No move within the period.
No.
E 2004 M2 actual < M2 target
Interest rate cut. Interest rate increase in October 2004, two years after M2 actual started to exceed M2 target.
No, interest rate increase needed in 2001–2003.
F 2005–2006 M2 actual > M2 target
Interest rate increase.
Two interest rate increases in 2006 (April and August)
Yes.
Note: (a) The six phases are derived from section III.A.1.b.
(b) The actual PBC reaction is based on the one-year lending (benchmark) rate as published in IMF, International Financial Statistics.
In the two phases of 1999–2001 and 2001–2003, the PBC widely ignored the indications of the theory. From 1999 to 2001 (C), the actual value was still below the targeted value, but the PBC did not cut the interest rate in a timely manner. The moves came very late in 2001 and 2002. In fact, since 2001, the real worth of monetary growth exceeded the targeted value. For example, the late move reinforced the overall change towards inflationary pressure rather than fighting deflationary pressures of the late 1990s. For the period 2001 to 2003 (D), actual value increased at a higher pace than the targeted values. The PBC did not react with an interest rate increase until October 2004. However, the actual values already came down below the target levels at the end of 2004 (E). Thus, the interest rate move came too late again. The restrictive stance of 2003–2004 had its influence on 2005. As a result, an interest rate increase was not imminent to face the fact that actual monetary growth was higher than the targeted growth rate in that year. Due to the persistence of the situation in 2006, the two interest rate moves in April and August 2006 indeed corresponded to the logic of the monetary targeting framework. Anyhow, the inflation rate continued its declining path in 2006 even though actual monetary growth was considerably higher than the targeted growth. The question is: Why did the PBC not act according to its monetary indicators, particularly from 1999 to 2004? Additionally, are there any other factors, rather than the interest rate, that have some major influence on the slope of the inflation rate? An answer frequently stated to face the first question is that due to the pegged exchange rate, increasing interest rates would trigger capital inflows and thus make it impossible to pursue an autonomous monetary policy in China (Goldstein, 2004; Goldstein et al., 2007 and McCallum, 2004). This argument, however, ignores the fact that China maintained and still maintains a certain degree of capital controls, and moreover has the instrument of sterilized foreign exchange market interventions (see box 2). In the author’s view, there must be other factors
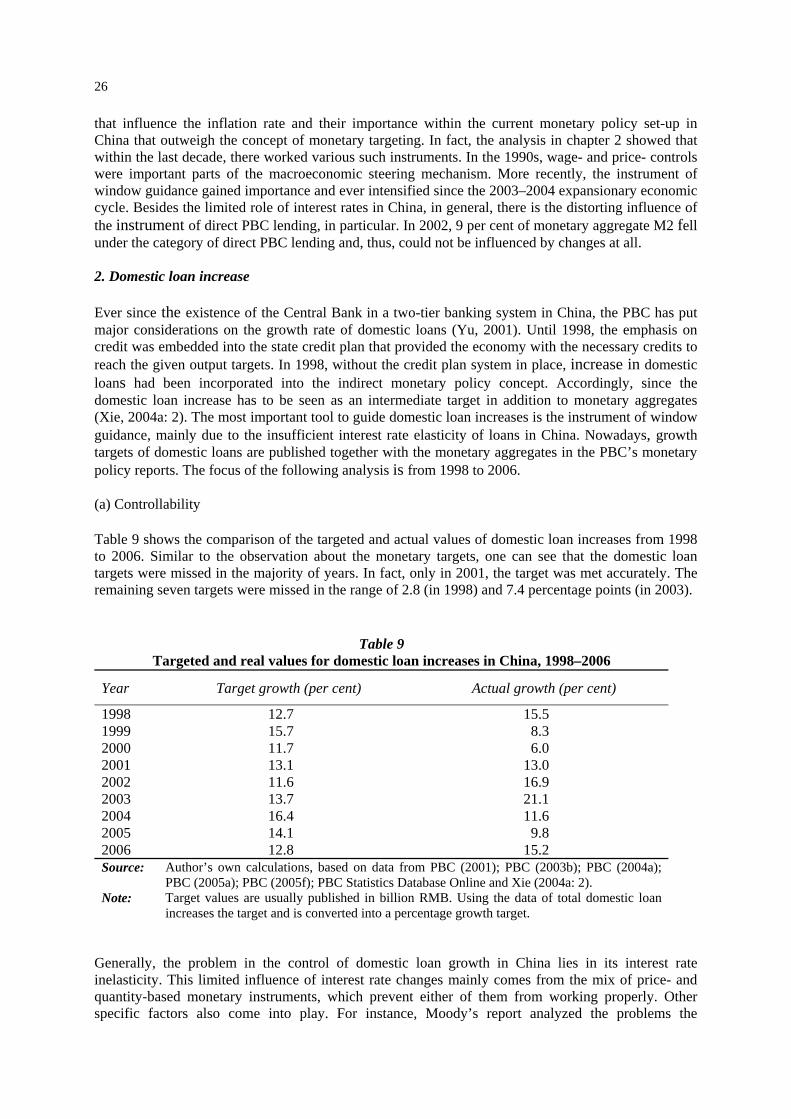
26
that influence the inflation rate and their importance within the current monetary policy set-up in China that outweigh the concept of monetary targeting. In fact, the analysis in chapter 2 showed that within the last decade, there worked various such instruments. In the 1990s, wage- and price- controls were important parts of the macroeconomic steering mechanism. More recently, the instrument of window guidance gained importance and ever intensified since the 2003–2004 expansionary economic cycle. Besides the limited role of interest rates in China, in general, there is the distorting influence of the instrument of direct PBC lending, in particular. In 2002, 9 per cent of monetary aggregate M2 fell under the category of direct PBC lending and, thus, could not be influenced by changes at all. 2. Domestic loan increase Ever since the existence of the Central Bank in a two-tier banking system in China, the PBC has put major considerations on the growth rate of domestic loans (Yu, 2001). Until 1998, the emphasis on credit was embedded into the state credit plan that provided the economy with the necessary credits to reach the given output targets. In 1998, without the credit plan system in place, increase in domestic
loans had been incorporated into the indirect monetary policy concept. Accordingly, since the domestic loan increase has to be seen as an intermediate target in addition to monetary aggregates (Xie, 2004a: 2). The most important tool to guide domestic loan increases is the instrument of window guidance, mainly due to the insufficient interest rate elasticity of loans in China. Nowadays, growth targets of domestic loans are published together with the monetary aggregates in the PBC’s monetary policy reports. The focus of the following analysis is from 1998 to 2006. (a) Controllability Table 9 shows the comparison of the targeted and actual values of domestic loan increases from 1998 to 2006. Similar to the observation about the monetary targets, one can see that the domestic loan targets were missed in the majority of years. In fact, only in 2001, the target was met accurately. The remaining seven targets were missed in the range of 2.8 (in 1998) and 7.4 percentage points (in 2003).
Table 9 Targeted and real values for domestic loan increases in China, 1998–2006
Year Target growth (per cent) Actual growth (per cent)
1998 12.7 15.5 1999 15.7 8.3 2000 11.7 6.0 2001 13.1 13.0 2002 11.6 16.9 2003 13.7 21.1 2004 16.4 11.6 2005 14.1 9.8 2006 12.8 15.2 Source: Author’s own calculations, based on data from PBC (2001); PBC (2003b); PBC (2004a);
PBC (2005a); PBC (2005f); PBC Statistics Database Online and Xie (2004a: 2). Note: Target values are usually published in billion RMB. Using the data of total domestic loan
increases the target and is converted into a percentage growth target. Generally, the problem in the control of domestic loan growth in China lies in its interest rate inelasticity. This limited influence of interest rate changes mainly comes from the mix of price- and quantity-based monetary instruments, which prevent either of them from working properly. Other specific factors also come into play. For instance, Moody’s report analyzed the problems the

27
authorities faced in 2003–2004 economic cycle to (re)gain control over the domestic loan increases with a focus on three specific issues (Wei, 2004). First, local governments do not have the necessary global perspective on economic matters but do often pursue self-interests. Therefore, since they have the power to influence lending decisions on local commercial banks, there is a shift from former centrally managed policy loans to more locally administered policy loans pursued by local governments. Second, corporate borrowers from the manufacturing sector are faced with rising raw material prices while they have huge capacities, which have been built up in recent years. The consequences are relatively low profit margins. An exit-option of this dilemma is an add-on investment on capacity in the hope of increased output and sales and an increased profitability. These expansion plans are usually financed by bank loans. Third, the credit
systems of the banks do not sufficiently apply risk-related credit policies that price the credits according to the underlying risks. Most loans are still priced around the central bank’s benchmark rates. The price as a tool to regulate the amount of credits cannot be applied, and thus, the total amount of granted loans is higher than the expected level. However, under the guidance of the China Banking Regulatory Commission, the Basel Accord capital adequacy ratio is subject to special consideration. Thus, this effect is declining since the overall lending mentality veers towards a more risk-related credit policies. (b) Relationship to inflation48 Figure 4 displays the development of the actual and targeted loan growth in comparison to the inflation rate from December 2000 to December 2006 on a monthly basis.
-5%
0%
5%
10%
15%
20%
25%
2000/12 2001/12 2002/12 2003/12 2004/12 2005/12 2006/12
Domestic loan target growth Domestic loan actual growth Inflation rate
Figure 4Inflation rate compared to targeted and actual values of domestic loan increase,
December 2000–December 2006
Source: Author's calculations, based on data from PBC, 2001; PBC, 2003b; PBC, 2004a; PBC 2005a; PBC 2005f; PBC Statistics Database Online; and Xie, 2004a: 2. Note: The black curve is a trend line for the target values since target values are not available monthly.
The actual loan growth shows an upward trend for the whole period until the peak of almost 24 per cent monthly y-o-y increase in domestic loans in August 2003. The decline in growth figures from 2003 onwards indicates the efforts of the Chinese authorities to implement a more restrictive monetary
48 The focus in this section is from December 2000 to December 2006, due to data constrains. Since December 2000, the PBC has published monthly data for domestic loan developments on its website www.pbc.gov.cn (see PBC Statistics Database Online).

28
stance to face the expansionary economic cycle of 2003–2004. At first sight, the figure shows a lagged relationship between domestic loans and the inflation rate. The time lag lies in the range of around 5 to 12 months. To illustrate the development in detail, a closer look on the five phases are helpful: Phase 1, with moderate loan increases of 6 to 9 per cent from December 2000 to May 2001. In response, the inflation rate drifted for a period of negative rates six months later in November 2001 and stayed deflationary for one year until December 2002. Phase 2, with stable loan growth rates of 12 to 15 per cent between June 2001 and August 2002. In reaction, five months after the loan growth rate hit the 15 per cent margin in August 2002, the deflationary pressure eased and the inflation rate showed positive rates from January 2003 onward. Phase 3, with volatile growth rates of loans of 16 to 24 per cent between September 2002 and May 2004 with the culmination of 23.9 per cent in August 2003. Consequential, the inflation rate showed an upward trend with a time lag of about 6 to 12 months. Due to the time lag and loan growth rates of above 15 per cent until May 2004, the inflation rate kept rising even though the loan growth rates showed a downward trend since the peak point of August 2003. Phase 4, with stable growth rates between 9 and 11 per cent from August 2004 to May 2006. In reaction, five months later, the loan growth rate calmed down below 15 per cent in June 2004, the inflationary pressure eased and the inflation rate showed a considerable decline to 2.8 per cent in November 2004. After a one-off increase in February 2005 to 3.9 per cent, the inflation rate embarked on a stable pace between 0.8 per cent and 1.9 per cent between May 2005 and November 2006. Phase 5, with increasing loan growth rates to around 15 per cent starting from June 2006. Consequential, five months after, the loan growth rate increased to over 15 per cent in July 2006, the
inflation rate increased to 2.8 per cent in December 2006. Twelve months later, the inflation rate stood at 5.6 per cent in July 2007. The short analysis above indicates that there is a “neutral stance” of domestic loan increases of 10 to 15 per cent that leads to an inflation rate of around 1 to 3 per cent,49 within a time lag of 5 to 12 months. This finding is confirmed through some simple econometric tests that show a significant correlation between the rising domestic loan and the development of the inflation rate. For the six years under consideration in figure 4, this relationship is manifested with a time lag of 8 months and a probability of 90 per cent. Additional support to the hypothesis of a “neutral stance” of loan increases comes from the fact that the PBC’s own growth targets,50 with the exception of 2004,51 are within the 10–15 per cent margin. However, figure 4 also shows the main problem of the approach to target loan growth through quantity-based instruments such as window guidance, i.e. the volatile growth rates that limit the ability to fine-tune monetary policy. B. Final targets After the discussion of the intermediate targets of the PBC with the description of their reasonable relationship to the inflation rate on the one hand, but their relative uncontrollability on the other hand, the explanation of the development of the final targets shows unexpected positive surprises. The
49 This finding can be backed by an “inefficiency stance” of 15 to 20 per cent that is displayed in the gap between the rates of the producer price index (PPI) and the consumer price index (CPI). 50 The targets for 1998 to 2002 are from Xie (2004a); targets from 2003–2006 are taken from the respective PBC’s China Monetary Policy Reports. 51 This relatively high result of loan increases in 2004 can be explained through the strong overshooting of the actual loan growth (21.1 per cent) vis-à-vis the targeted growth (13.7 per cent) in 2003 (table 9).

29
targets under consideration are the three final targets of monetary policy as identified in box 1 earlier in this study, which are: (i) inflation rate; (ii) the GDP growth rate; and (iii) the exchange rate. 1. Inflation rate and GDP growth Table 10 displays the targeted and real values for both the inflation rate and GDP growth between 1994 and 2006.
Table 10 Targeted and real values for the inflation rate and GDP growth, 1994–2006
Year Inflation rate
(Per cent) GDP growth rate
(Per cent) Target Actual Target Actual 1994 10 24.2 8.5 13.1 1995 15 16.9 8.5 10.9 1996 10 8.3 8.0 10.0 1997 6 2.8 8.0 9.3 1998 5 -0.8 8.0 7.8 1999 2 -1.4 8.0 7.6 2000 1 0.3 8.0 8.4 2001 1–2 0.5 7.0 8.3 2002 1–2 -0.8 7.0 9.1 2003 1 1.2 7.0 10.0 2004 3 3.9 7.0 10.1 2005 4 1.8 7.0 10.2 2006 3 1.5 7.5 10.7 Source: Ikeya (2002: 2); IMF, International Financial Statistics; (PBC 1995); PBC (1996); PBC (1997);
PBC (2003b); PBC (2005e); PBC (2005f); World Bank, World Development Indicators and Xie (2004a: 2).
Note: The GDP growth targets are defined in the 8th, 9th, 10th and 11th five-year plan respectively. It has to be noted that targets and forecasts for individual years may vary as they are often adjusted due to the circumstances of that year. The five-year plan figures take the longer view.
The years 1994 to 1996 are stamped by the authorities’ efforts to bring down the inflation rate from the high levels of the early 1990s. After missing the inflation target by almost 15 per cent in 1994, with an inflation rate of over 24 per cent, the authorities set more realistic and achievable targets in the subsequent years (table 10). From today’s perspective, these targets have been prudentially set to successfully achieve a gradual de-inflationary environment. The comparable strong breaches of the targets in 1997, 1998 and 1999, respectively, have to be seen in the light of a restrictive monetary stance that aimed at not allowing the inflation rate to rise again. In the mid-1990s, the authorities applied a variety of orthodox and non-orthodox measures (including wage controls) that within the time frame of two years led to a rather sharp decline of the inflation rate. The quick change from an inflationary to a deflationary environment in a very short time indicates the limited fine-tuning ability of the policy mix of that time.52 The generally deflationary environment between 1998 and 2002 contributed to the already difficult problem of fine-tuning. This was mainly caused and sustained by a huge amount of over-supply in the Chinese economy in general and within the state-owned sector, in particular. Lin (2000) argues that the deflation at that time was rather structural than a monetary policy induced problem. Starting in 2000, the actual inflation rate stabilized on a very low level supported by very low target inflation rates. The actual rates went up to 1.2 per cent in 2003 and 3.9 per cent in
52 For a more detailed discussion of the 1993–1995 economic cycle and a comparison to the 2003–2004 economic situation, please refer to Ma et al. (2004).

30
2004, as the targeted inflation rates did (table 10). Again, with a mixture of orthodox and non-orthodox measures (interest rate hike in October 2004; increased usage of window guidance) the inflationary pressure of 2004 was brought under control. The inflation rate was kept at low levels in 2005 and 2006 through the continuing application of the heterodox policy-mix with intensified window guidance and increases in the interest rate (twice) and minimum reserves (three times) in 2006. The GDP growth rates displayed in table 10 illustrate two main expansionary economic cycles between 1994 and 2006. In the mid–1990s and 2003–2006, it was GDP growth rates of 12.6 and
10.5 per cent in 1994 and 1995 led to inflationary pressures. The cycle of 2003–2006 is characterized with growth rates of around 10 per cent. These are impressive figures and well-above the medium-term growth targets of the central government as put forward in the five-year plan. In between the two cycles, from 1997 to 2002, GDP growth rate of 7 to 8 per cent could be realized, which generally matched the targets.53 To sum up, the authorities were able to control the inflationary pressures of 1993–1994 and 2003–2004, to keep prices generally stable between 1994 and 2006, and at the same time to realize an average annual GDP growth of 9.7 per cent. This remarkable achievements are certainly the result of the deployment of both orthodox and non-orthodox measures as described as a successful “heterodox policy mix” by Flassbeck et al. (2005). 2. Exchange rate China maintained a unilateral de facto peg between 1997 and 2005. Since the arrangement was not subject to any official agreement, there were no target values available. During that time, the trading volatility and the direction of the exchange rate path were at the discretion of the Chinese authorities. However, with the exchange rate reform of 21 July 2005 and the reversion to a crawling peg regime, the authorities’ discretion was somewhat cut. Box 1 above gives a more detailed explanation of the exchange rate regime. In its China Monetary Policy Report 2002, the PBC describes the development and the outcome of the exchange rate since 1994 (PBC, 2003b). Accordingly, the exchange rate policy was successful in achieving a stable RMB/US$ exchange rate and acquiring rising amounts of foreign exchange reserves. The report proceeds that both factors have increased the international status of the RMB and the attraction of foreign capital inflows. This led to an overall reinforcement of confidence in the Chinese economy and thus made the exchange rate an active tool in promoting economic development and maintaining economic and financial stability (PBC, 2003b). In the Chinese perspective, this assessment is certainly true. China’s de facto peg played a unique and positive role in the economy’s development of the last decade (Flassbeck et al., 2005). Additionally, foreign exchange reserves have been piled up massively and at the end of 2006, stood at US$1,068 billion, a value that certainly exceeds the need to safeguard the currency. Moreover, China was subject to the highest FDI inflows in the world in recent years (UNCTAD, 2004a). As the UNCTAD Trade and Development Report 2004
53 However impressive, the Chinese growth cannot belie that not all people in China participate in the growth story equally. According to the World Bank, the gini-coefficient of income inequality for instance, was rising from 0.18 in 1981 to 0.33 in 2001 in urban areas and from 0.25 in 1981 to 0.36 in rural China (UN China Common Country Assessment, 2004). The problems of disparity and unequal income distribution also attract more and more public attention. In February 2004, the People’s Daily referred to a report conducted by the Chinese Academy of Social Sciences with the headline “Survey shows increasingly urban-rural income gap in China”. According to the article, the leadership around Hu Jintao and Wen Jiabao is well aware of the problem and “urging coordinated development between rural and urban areas, as well as between western and eastern areas” (People’s Daily, 2004b). While the issue of inequality is very important for the future development of China, it is not subject to this work. For a detailed discussion of this subject and other development issues in China, please refer to the Millennium Development Goals: China’s Progress, UNDP report (2003) available at www.undp.org.cn.

31
points out, stability of monetary conditions in general, and the exchange rate in particular, are rewarded with increasing faith and thus increase international long-term capital inflows. Therefore, the international trust in the de facto peg’s sustainability prior to the RMB reform in 2005 played a crucial role in attracting international businesses in China. Regarding the international status of the exchange rate policy, the international community sent out ambiguous signals over the last decade. While the exchange rate played a crucial role in attracting foreign investors, the international community and the developed countries in particular, repeatedly had urged China to abandon the peg since 2002. Still in 1998, in reviewing the Asian crisis, the World Bank stated: “China’s decision to maintain exchange rate stability was and remains, in our view the correct policy, not only for economic recovery in the Asian region but also for China” (Bottelier,1998). Then in 1999, the international community expected the RMB to depreciate as a response to the appreciation vis-à-vis China’s neighbours. Xu (1999) asked: “Should or will the yuan depreciate?” The Vice-President of the Bank of China poured new fuel into the devaluation expectations in February 2002. The New York Times headlined: “Banker says China may need to devalue Renminbi” (McGregor, 2002). In December 2002, the international opinion changed direction and first called for an increase rate appreciation. The Financial Times made the start with its article: “Time for a switch to global reflation”, where Kuroda et al. (2002) urged China to appreciate the RMB. In the subsequent years, more and more countries and scholars got into the boat and supported the call for an RMB revaluation.54 The discussion culminated in China’s announcement of an exchange rate reform with an initial ( and for the time being one-time) appreciation of around 2 per cent in July 2005. Recalling the variety of policy recommendations, they illustrate the difficulty of the task to pursue an internationally accepted and, simultaneously, a domestically orientated exchange rate regime for the authorities. In retrospect, the principle to pursue a stable policy to attract foreign investors by largely ignoring the international academic and policy advices was the right strategy for China in the last decade. UNCTAD’s Trade and Development Report 2004 states that based on a stable and favourable exchange rate, China was able to attract large amounts of international long-term investors without giving speculators room for short-term gains on the capital markets. The report concludes that this policy was the best option under the current circumstances of a prevailing international trade regime and the absence of an international financial framework at the same time (UNCTAD, 2004b). C. The role of the interest rate Figure 5 shows the development and relationship of interest rates and intermediate targets in China. The displayed interest rates are the one-year lending rate, which is the official benchmark rate of the Chinese central bank and the 7-day money market rate, which is the most traded maturity on the Chinese interbank market. One part of the figure (a) presents the comparison of the interest rates with the growth rate of the monetary aggregate M2 and the right part; and (b) with the growth rate of domestic loans.55 According to a (simplified) textbook theory, the growth rates of monetary aggregates should increase with declining interest rates. Figure 5a shows that the reality is somehow different in the case of China. Here, M2 growth and the inflation rate show a rather parallel development, particularly
between 1994 and 2000, during which both M2 growth and inflation were decreasing. For the same period of time, a similar pattern is recognizable for domestic loan increases and the interest rates. This is equally surprising as domestic credits should increase with declining interest rates (figure 5b).
54Please refer to Woo (2003) to have an overview of the build-up of the pro-appreciation front. 55 The focus in this section is on M2 as the most prominent monetary aggregate.

32
0%
7%
14%
21%
28%
35%
1994 1996 1998 2000 2002 2004 2006
1-year lending rateMoney market - 7 daysDomestic loan increase
b) Interest rates and domestic loan incerase
0%
7%
14%
21%
28%
35%
1994 1996 1998 2000 2002 2004 20061-year lending rateMoney market - 7 daysM2 growth
a) Interest rates and monetary aggregate M2
Figure 5Interest rates, monetary aggregate and domestic loan increases in China, 1994–2006
Source: Author's calculations, based on data from IMF, International Financial Statistics ; Li et al., 2002: 8; PBC Statistics Database Online; Seto, 2002: 25; and Yang et al., 2004.Note: While the Chinese interbank market came into existence in the 1980s, institutional requirements for a functioning interbank market were introduced only in 1996. Thus, meaningful money market interest rates are available from 1996 onwards (cf. N.A., 2004c; and Liu, 2004). 7 days maturity data is chosen since this maturity has the highest trading volumes on the interbank market.
A major turning point of the run of the curves is the year 2000. M2 growth rates started to increase significantly from 2.3 per cent in 2000 to 19.6 per cent in 2003. Domestic loan increase rose from 6
per cent to 21.1 per cent, respectively. The rise was not triggered by the interest rate since interest rates were stable at 5.85 per cent from June 1999 to January 2002. This increase, however, was accompanied by a decrease of the benchmark interest rate from 5.85 per cent in 2001 to 5.31 per cent in 2002. Then the interest rate remained stable from February 2002 up to October 2004. Contrary to theory, M2 growth and domestic loans growth decreased from 19.6 to 14.6 per cent (M2) and from 21.1 to 11.6 per cent (loans). Thus the decreases have to be attributed to other tools such as window guidance, which had been intensified in the 2003–2004 cycle. On 29 October 2004, the benchmark lending rate was raised from 5.31 to 5.58 per cent. While M2 growth slightly decreased from 17.6 to 16.9 per cent from 2005 to 2006, domestic loan growth jumped from 9.8 to 15.2 per cent. The short and very simplified discussion of figure 5 indicates that there is no consistent textbook style reverse relationship between the interest rate on one hand and M2, and domestic loan growth on the other hand. The largely rectified relationship suggests that the interest rate channel as the mechanism for the transmission of monetary impulses in China is not functioning properly. The finding reflects the fact that China is an economy under transition, which is not yet completely market-based but not entirely centrally planned either. Despite efforts to introduce a market-based, indirect monetary policy approach anchored around open-market operations (OMOs), there is still the need for quantity-based monetary measures to achieve the monetary policy targets. This hybrid character has major implications. Imagine the event of an interest rate increase to fight inflation. If there are quantity-based instruments used simultaneously that primarily aim at given amounts of money without considering prices, the higher prices for the given amount of funds would lead to overall higher prices. Thus, the simple rule of monetary targeting of an interest rate increase could not lead to the desired outcome. Xie et al (2003) examined the effects of the interest rate policy in China, which confirms the problems underlying the simultaneous usage of price- and quantity-based instruments. They analyzed the relationship between the inflation rate and the interest rate from 1996 to 2002. As a result, they found that there is only a vague relationship between the two. If there are any effects at all, they conclude, there might be a dampening effect of raising interest rates but not a stimulating effect on falling rates.

33
Additionally, Xie et al. (2003) point to the important factor of time lags within the monetary policy transmission process. The decision lag of monetary policy would be between 6 to 10 months, with an overall time lag of interest rate effects of at least 18 months, which is also very volatile in different periods of time. Considering the latter, it is more astonishing that the PBC opted for the late interest rate moves in 2001, 2002 and 2004 (table 8). D. Influence of quantity-based monetary and non-central bank policy instruments Window guidance is the most prominent quantity-based monetary instruments of the PBC. The discussion above has shown that to face the recent expansionary cycle, window guidance was and still, is one of the main instruments used. The increasing emphasis on window guidance in the PBC’s monetary policy reports expresses the current importance of the instrument (PBC, 2004i and PBC 2005a). Stephen Green goes so far to state: “controlling credit growth by administrative means may be the most important means by which money supply is currently being constrained” (Green, 2005: 21). In fact, domestic loan increases calmed down significantly from 2003 to 2004 (figure 4). After a peak of almost 24 per cent in August 2003, growth rates showed a declining path and reached a sustainable level of below 15 per cent in June 2004. Towards the end of 2004, the domestic loan growth rate was stable at around 11 per cent. Still, the exact scope of window guidance meetings and the application of suasion in those meetings is publicly unknown. It is sure, however, that guidelines for lending volumes are given.56 Due to information constrains, it is not possible to estimate the exact impact of window guidance on the inflation rate. The power of price controls as a means of inflation control can be assessed for the years 2001 and 2002. Table 11 shows the shares of government guidance and government prices in 2002 according to three areas: (i) social retailing (A), (ii) agricultural products (B) and (iii) production inputs (C).57 The stance of government controlled prices that include both government guidance and government prices was at 5.2 per cent, 16.2 per cent and 14 per cent, respectively for (A), (B) and (C).
Table 11 Approximate share of government controlled prices in China, 2001–2002
Social
Retailing (A) Agricultural Products (B)
Production Inputs (C)
Type of prices (Per cent)
Market-regulated prices 94.7 83.3 86.0 Government guidance prices 1.2 7.1 4.4 Government prices 4.0 9.1 9.6 Government controlled prices 5.2 16.2 14.0
Source: WTO, 2001: 11. Note: Government controlled prices are the sum of government guidance prices and government prices.
The first two columns of table 12 display the definition of the basket of goods that is underlying the Chinese consumer price index (previous year=100; Paasche index) since January 2001. The weights
56 Green (2005: 21) is of the same opinion and proofs with reference to participants of window guidance meetings. 57 For simple reasons, it is assumed that government guidance prices and government prices are equally effective. Furthermore, since the actual stance of guidance within the bandwidth of the government guidance prices (section 1.2: 5-15 per cent) is hardly quantifiable, it is assumed that the values tend to be very close to the lower/upper margin in any deflationary/inflationary environment.

34
defined in 2001 only changed marginally and can be regarded constant between 2001 and 2004.58 Additionally, official statistics in China published a fixed-base index with 1985 as basis period (Lasperey index).59 The Lasperey index (1985=100) leads to the same changes as the Paasche index. Usually, references to CPI changes in China are linked to the CPI based on Paasche published by the National Bureau of Statistics of China (China Statistical Yearbook, various issues). Thus, the assessment of this section focuses on data of this CPI. The basket consists of 600–700 goods and services that are aggregated into 251 headings and 8 major categories (China Statistical Yearbook, 2004). The 8 categories include: (i) prices for food; (ii) alcoholic beverages and tobacco; (iii) clothing; (iv) household facilities and articles; (v) medicine and medical items; (vi) transportation and communication; (vii) recreation, education and cultural articles; and (viii) residence (table 12). The three items weighing most are: (i) food (34.4 per cent); (ii) residence (14.8 per cent); and (iii) recreation, education and cultural articles (14.3 per cent). Together, the three largest groups comprise 63.5 per cent (Shuai et al., 2001).
Table 12 Consumer Price Index and the potential impact of price controls in China, 2001/02
Basket weight [a]
Area of control (acc. Table 11)
Scope of control [b]
Potential impact [a*b]
Item (Per cent) (Per cent)
1 Food 34.4 A+B+C 35.4 12.2 2 Alcoholic beverages and
tobacco products 5.0 B 16.2 0.8 3 Clothing 8.9 B+C 35.4 3.2 4 Household facilities,
articles and services 6.5 A+C 19.2 1.2 5 Health care and personal
articles 8.% A+C 19.2 1.7 6 Transportation and
communication 7.3 A+C 19.2 1.4 7 Recreation, education
and culture articles 14.3 A 5.2 0.7 8 Residence 14.8 A+C 19.2 2.8 CPI total 100.0 24.1 Source: Author’s calculation, based on data from Shuai et al. (2001) and WTO (2001: 11). Note: The third column area of control estimates the kind of government controlled prices: social
retailing (A); agricultural products (B), and production inputs (C), applicable to the item.
The fourth column scope of control adds up the weights of the third column area of control according to table 11 (A = 5.2 per cent; B = 16.2 per cent and C = 14 per cent).
The remaining columns of table 12 combined the information of the weighting scheme of the 8 CPI items with the estimated share of government controlled prices within each of the items. The definition of government controlled prices is taken from table 11. The assessment about the potential scope of the price controls on the total CPI basket is derived as follows:60 First, in the third column area of control, it is assessed whether the eight categories of the basket fall under one or more areas of table 11. If the products of a category fall in all three areas, i.e. social retailing (5.2 per cent controlled
58 In this case, the difference of the monthly CPI values published by the National Bureau of Statistics of China and the results of an assessment of the monthly values using the weighting scheme of 2001 was calculated. The computations led to no deviation in 2002 and 2003 and to a mere 0.1 per cent deviation in 2004. 59 The weighting of the basket (1985=100) is not available. 60 It is assumed that the impact on the CPI basket equals the influence on the CPI.

35
prices), agricultural products (16.2 per cent controlled prices) and production inputs (14 per cent controlled prices), the category’s weight of 34.4 per cent is multiplied with 35.4 per cent. Thus, for instance, price controls in the category food could influence a maximum of 12.2 per cent of the total CPI basket. Due to various data constrains, the calculated impact represents the maximal possible influence on the CPI basket and the impact is likely to be overstated.61 Second, the potential impacts of each of the 8 categories are summed up to the potential impact of price controls on the whole CPI in China, which is around 24 per cent. However, due to the problems in the classification of the fourth column scope of control [b], the actual influence of the price controls on the inflation rate tends to be smaller than 24 per cent. Considering the data constrains, the influence is probably between 15 and 20 per cent.62 To assess the power of wage controls and its influence on the inflation rate, the slope of nominal wages needs to be compared with the slope of the inflation rate. Per definition nominal unit labour costs63 are very closely linked to the development of nominal wages. Thus, figure 6 displays the nominal unit labour costs as the measure for nominal wages and the inflation rate, which show a striking parallel run. The development of unit labour costs in the mid-1990s culminated in a more than 20 per cent increase in 1994. The inflation rate mirrored this movement and peaked with just less than 25 per cent in 1994. In the subsequent years, unit labour cost growth came down to 4.4 per cent in 1996 and to -3 per cent in 1997. The inflation rate again mirrored this run and decreased to 8.32 and 2.81 per cent in 1996 and in 1997, respectively. In 1997 and 1998, unit labour cost growth jumped up well above the inflation rate again, with rates of almost 10 per cent. In fact, 1998 can be seen as a turning point in the determination of the inflation rate. From that year onwards, the deflationary pressure was a primarily supply induced phenomenon that decoupled the inflation rate from the development of the unit labour cost and the nominal wage growth rate. The question is whether figure 6 serves as a proof of the effectiveness of the wage reform. Geiger (2006) argues that this is the case due to two considerations. First, the overall economic and social situation of the mid–1990s led to a strong enforcement of the regulations of the wage reform. Thus, the actual impact of the wage scheme was likely to be the potential impact of about 12–15 per cent of the total Chinese wage bill that was identified in table 4. Second, the similarities in wage growth rates of different sectors indicate that the state-owned sector acts has a guiding role for the whole economy (Geiger, 2006: 54–58). However, more recent developments on the job market in some parts of China increasingly undermine the wage regime in terms of inflation control. In 2004,
unexpectedly, some provinces started to claim shortages of labour. The Economist reported in October 2004 that the province of Guangdong in the Pearl River Delta was short of 2 million migrant workers (The Economist, 2004). It was further reported that the shortage of workers was evident throughout the manufacturing sector of the east coast from the Pearl River Delta up to Shanghai.
61 For instance, the assessment cannot consider the case where only one part of a group falls under social retailing but five components fall under the category of agricultural products. In this case, the whole set will be applied to social retailing and agricultural products. Additionally, a lack of exact definitions of the three areas of government controlled prices might lead to a wrong categorization of the components of a group. 62 Price controls have one major macroeconomic downside, which could be observed in the 2003–2004 economic cycle. They prevent the automatic stabiliser of increasing prices from working properly. Increasing prices in a situation of an expansionary economy would lead to decreasing demand and have a dampening effect on the economy. Reports about shortages in certain sectors and energy blackouts in 2003 and 2004 suggest that price controls in those sectors prevented the effectiveness of the build-in stabiliser (Areddy, 2004 and Qu, 2004: 5). 63 Change rate of gross income of employed population divided by the real GDP in RMB.

36
-5%
0%
5%
10%
15%
20%
25%
1987 1988 1989 1990 1991 1992 1993 1994 1995 1996 1997 1998 1999 2000
Unit labour cost growth Inflation rate
Figure 6Unit labour cost growth and the inflation rate, 1987–2000
Source: Author's calculation, based on data from ILO LABORSTA Internet Database; andIMF, International Financial Statistics .
IV. CONCLUSION The analysis has two key findings. First, the Central Bank’s intermediate targets of monetary aggregates and domestic loan increase were missed frequently. Second, the final target of inflation control and the establishment of price stability could nevertheless be reached alongside persistent high GDP growth. It is argued that the good achievement of the final targets of monetary policy in China from 1994 to 2006 was the product of the application of a heterodox mixture of monetary policy instruments in China since 1994. This mix incorporates two sets of monetary policy instruments: (i) instruments of the central bank (further categorized into price-based indirect and quantity-based direct instruments); and (ii) non-central bank policy instruments. Furthermore, the influences of the main non-central bank and quantity-based instruments are identified in this paper. Wage controls, mainly wage level controls helped to fight inflation in the mid-1990s. More recently, however, wage increases due to labour shortages in certain regions threatened to undermine the low inflation wage set-up. As the marketization of the Chinese economy proceeds a way back to the strong wage regime of the mid–1990s is unfeasible. However, further liberalization of the labour market may have an easing effect on wages, i.e. loosening barriers for migrant workers would enable the better interregional exchange of the workforce. Price controls, were actively used throughout the last decades based on data from 2001, it was estimated that between 15 and 20 per cent of the consumer price index could be influenced. However, price controls have certain dangers that have to be considered. They prevent the automatic stabilizer of rising prices from coming into play. Thus, in the long run and on the way towards a fully marketized economy, the authorities need to become less dependent on the tool, which is a process that finally should lead to the suspension of the tool. Window guidance, more recently, the instrument of window guidance was introduced. It came into its prominent role in the fight of the 2003–2004 expansionary economic cycle and in the subsequent high-growth years of 2005 and 2006. Currently, window guidance is the main monetary policy instrument available.

37
Despite the success of the non-central bank and quantity-based instruments, it is important to point out that none of them conforms with a marketized economy. Particularly, the guidance of credits through other than the profitability criteria tends to lead to misallocation of funds, and thus, to efficiency losses and macroeconomic distortions. While, for instance, window guidance plays a crucial role in the current policy set-up. In the long run, window guidance needs to be substituted by a comprehensive usage of price-based monetary instruments along with the ever-increasing marketization of the economy. In fact, the currently strong influences of quantity-based direct instruments and non-central bank policy instruments bring into question the approach of indirect monetary policy, in general. The study shows that the simultaneous usage of the two sets of instruments leads to various distortions that ultimately prevent the interest rate channel of monetary transmission from functioning. In fact, in the current set-up, the interest rate has to be considered as a supportive monetary instrument rather than the leading one. For instance, observers argued that the fear of capital inflows was the main reason for the late interest rate moves of the authorities, particularly within the 2003–2004 cycle. While such considerations certainly played a role, the main reason for not moving the interest rate need to be seen in the fact that interest rates are just not as effective as administrative and quantity-based measurements. In a way, there is a vicious circle prevalent in the usage of price- and quantity-based instruments. The full effect of price-based instruments can only come into play when there are no quantity-based influences involved. But as long as price-based instruments alone cannot deliver the desired effects of inflation control, the authorities still have to rely on quantity-based measures. There is no doubt that the overall strategy of a gradual transition of the Chinese economy and its financial system with the employment of a “heterodox policy mix” was one of the success factors for China’s recent rapid development (Flassbeck et al., 2005). However, given the achievements made, to reach another level of (institutional) development and to overcome the distortions faced by the price-based monetary policy instruments of the PBC, a sudden change with the suspension of all quantity-based instruments will be necessary in the future. Only then, price-based monetary instruments can come into full play, and the set-up of a monetary strategy anchored around indirect price-based instruments, as it was officially introduced in 1998, can be successful.
38
REFERENCES Anderson J (2003). The Complete RMB Handbook. Asian Economic Perspective, UBS Investment
Research, Hong Kong (China).
Anderson J (2005). The Complete RMB Handbook (Third Edition). Asian Economic Perspective, UBS Investment Research, Hong Kong (China).
Anderson J (2006). The Complete RMB Handbook (Fourth Edition). Asian Economic Perspective, UBS Investment Research, Hong Kong (China).
Anderson J (2007). The 2008 China Macro Almanac. Asian Economic Perspective, UBS Investment Research, Hong Kong (China).
Areddy JT (2004). China’s Inflation Weapon: Price Controls Beat Rising Interest Rates, But Shortages Result. Wall Street Journal, 20 August, New York.
Balls A, McGregor R and Swann C (2005). A Dollar Dilemma: China Assesses the Delicate Task of Revaluing its Currency. Financial Times, 14 April, London.
Bi J (2005). China’s New Concept for Development. China in a Globalizing World, United Nations Conference on Trade and Development, Geneva.
Bofinger P (1999). Options for the Exchange Rate Management of the ECB. The European Parliament (www.europarl.eu.int/), Luxembourg.
Bofinger P (2001). Monetary Policy: Goals, Institutions, Strategies and Instruments. Oxford University Press, Oxford.
Bottelier P (1998). The Role of Foreign Direct Investment and Multinational Corporations in China’s Development – China’s Response to the Asian Crisis. The World Bank, Washington.
Burdekin RCK and Whited H-H (2001). Exporting Hyperinflation: The Long Arm of Chiang Kai-shek. Claremont Colleges Working Papers, Claremont.
CBRC (2004). Chairman Liu Mingkang Answers the Questions Raised by the Press with Respect to Credit Growth. China Banking Regulatory Commission (www.cbrc.gov.cn/english), Beijing.
CBRC (2005). Remarkable Achievements in Strengthening China’s Banking Supervision. China Banking Regulatory Commission (www.cbrc.gov.cn/english), Beijing.
Chen H (2000). The Institutional Transition of China’s Township and Village Enterprises: Market Liberalization, Contractual Form Innovation and Privatization, Aldershot.
Cheng E (1996). Widespread Protest Alarm Beijing. Green Left Weekly, Issue 207, 18 October 1995, Chippendale, NSW.
Cheng H-S, Fong GH and Mayer T (1996). China’s Financial Reform and Monetary Policy: Issues and Strategies. The 1990 Institute (www.1990institute.org/), Burlingame.
China Internet Information Centre (2003). Marketization of State-Owned Enterprises. China Internet Information Center (www.china.org.cn), Beijing.
China Statistical Yearbook (Various Issues). National Bureau of Statistics of China, China Statistical Yearbook, Beijing.
Coady DP and Wang L (2000). Equity, Efficiency, and Labour-Market Reforms in Urban China: The Impact of Bonus Wages on the Distribution of Earnings. China Economic Review,11: 213–231.
Croce E and Khan MS (2000). Monetary Regimes and Inflation Targeting. International Monetary Fund, Finance and Development:A quarterly magazine of the IMF, Vol. 37, No. 3, Washington, DC.
Dai GY (2002). Chinese Central Bank’s Open Market Operation Practice (in Chinese). Shenzhen Finance Information Net, Vol. 2002, Issue 11, Shenzhen.
Dai GY (2003). Open Market Operations, Practice and Experience in China (in Chinese). Journal of Financial Research, Beijing, 271: 55–65.
EIU (2004). China Country Monitor. Economist Intelligence Unit Views Wire Asia, 8 November.

39
EIU (2005a). China Hand, Chapter 3: Finance. Economist Intelligence Unit, March, Hong Kong (China).
EIU (2006). China Hand, Chapter 1: Politics, Economy and Basic Data. Economist Intelligence Unit, Hong Kong (China).
Flassbeck H, Dullien S and Geiger M (2005). China’s Spectacular Growth Since the Mid-1990s, Macroeconomic Conditions and Economic Policy Challenges. China in a Globalizing World, United Nations Conference on Trade and Development, New York and Geneva.
Fu J (1995). Strong Measures Needed to Guide Pricing System. China Daily (North American Edition), New York.
Geiger M (2006). Monetary Policy in China (1994–2004): Targets, Instruments and their Effectiveness. Würzburg Economic Papers (WEP), No. 68, University of Würzburg, Würzburg.
Gerlach S and Peng W (2006). Output Gaps and Inflation in China. Bank for International Settlements, Working Paper, No. 194, Hong Kong (China).
Goldstein M (2004). Adjusting China’s Exchange Rate Policies. Institute for International Economics (www.iie.com), Washington, DC.
Goldstein M and Lardy N (2007). China’s Exchange Rate Policy: An Overview of Some Key Issues. Peterson Institute for International Economics, Conference on China’s Exchange Rate Policy (19 October), Washington, DC.
Green S (2005). Making Monetary Policy Work in China: A Report from the Money Market Front Line. Stanford Centre For International Development, Working Paper, No. 245, Stanford.
Hagiwara Y (2004). China’s Economy Seems Headed For A Soft-Landing. Bank of Tokyo-Mitsubishi, Tokyo-Mitsubishi Review, Vol. 9, No. 7, October, Tokyo.
Ikeya M (2002). China’s Unique Strengths and Weaknesses of Monetary Policy. R&I Asian Focus (www.r-i.co.jp/eng/), Hong Kong (China).
Imai H (1997). Output-Inflation Tradeoff in China. The Developing Economies, Vol. 35, No. 2, Chiba, 111-141.
Krugman P (1998). Saving Asia: It’s Time to Get Radical. Fortune, Vol. 138, Issue 5, New York, 74–80.
Kuijs L and Wang T (2005). China’s Pattern of Growth: Moving to Sustainability and Reducing Inequality. World Bank Policy Research, Working Paper, No. 3767, November, Washington, DC.
Kuroda H and Kawai M (2002). Time for a Switch to Global Reflation. Financial Times, 2 December, London.
Li Y and Peng X (2002). The Money Market in China: Theory and Practice. Institute of World Economics and Politics, Chinese Academy of Social Sciences, China and World Economy, No. 3, Beijing, 3–10.
Lin Y (2000). The Current Deflation in China: Causes and Policy Option. China Centre for Economic Research (Peking University), Working Paper Series, No. E2000002, Beijing.
Liu Y (2004). Finance and Economics, Bond Special: The New RMB Electronic Trading System. China Money (www.chinamoney.com.cn), Beijing.
Ma J and Spencer M (2004). China: Selective Tightening and Soft-Landing. Deutsche Bank Global Markets Research, Emerging Markets, Hong Kong (China).
Ma G and McCauley R (2007). Do China’s Capital Controls Still Bind? Implications for Monetary Autonomy and Capital Liberalization. Bank for International Settlements, Monetary and Economic Papers, Working Papers, No. 233, Hong Kong (China).
McCallum BT (2004). China’s Exchange Rate and Monetary Policy. Shadow Open Market Committee (www.somc.rochester.edu), 2 May, Rochester.
McGregor R (2002). Banker says China may Need to Devalue Renminbi. Financial Times, 5 February, London.

40
Mehran H, Quintyn M, Nordmann T and Laurens B (1996a). Monetary and Exchange System Reforms in China: An Experiment in Gradualism. International Monetary Fund, Occasional Paper, No. 141, Washington, DC.
Mehran H and Quintyn M (1996b). Financial Sector Reforms in China. International Monetary Fund, Finance and Development, Vol. 33, No. 1, Washington, DC.
Mishkin FS (2002). Monetary Policy. NBER, NBER Reporter, Winter 2001/02, Cambridge.
MOFCOM (2003). China to Reform GDP Calculation and Statistics Release. Ministry of Commerce of the People’s Republic of China (http://english.mofcom.gov.cn/), Beijing.
N.A. (1995). Law of the PRC on the People’s Bank of China. People’s Bank of China (www.pbc.gov.cn/english/jinrongfaguizhengce/), Beijing.
N.A. (1998a). Price Law of the People’s Republic of China. News Guangdong (www.newsgd.com/business/laws/).
N.A. (1998b). Statistical Fraud in China. Chinaonline, Chicago.
N.A. (2003). Law of the PRC on the People’s Bank of China (amended). People’s Bank of China (www.pbc.gov.cn/english/jinrongfaguizhengce/), Beijing.
N.A. (2004). Financial Directory: Moral Suasion. Australia and New Zealand Banking Group Limited (www.anz.com/edna/dictionary.asp), Melbourne.
PBC (1995). Almanac of China Finance and Banking 1994 (in Chinese), Beijing.
PBC (2000). China Financial Outlook 1994–2000. CD ROM, Beijing.
PBC (2001). Almanac of China’s Finance and Banking 2001 (English Edition), Beijing.
PBC (2003a). Main Responsibilities, Organizational Structure and Staff Quota Set for the People’s Bank of China. People’s Bank of China (www.pbc.gov.cn/english/xinwen/), Beijing.
PBC (2003b). China Monetary Policy Report 2002. People’s Bank of China (www.pbc.gov.cn/english/xinwen/), Beijing.
PBC (2003c). PBC Official Answers Questions on the Rise in Reserve Requirements Ratio. People’s Bank of China (www.pbc.gov.cn/english/xinwen/), Beijing.
PBC (2003d). Governor Zhou Xiaochuan Answers Questions on RMB Exchange Rate. People’s Bank of China (www.pbc.gov.cn/english/xinwen/), Beijing.
PBC (2004a). China Monetary Policy Report 2003. People’s Bank of China (www.pbc.gov.cn/english/xinwen/), Beijing.
PBC (2004b). The PBC Decided to Introduce Differentiated Required Reserve Ratios. People’s Bank of China (www.pbc.gov.cn/english/xinwen/), Beijing.
PBC (2004c). People’s Bank of China Decides to Raise Required Reserve Ratio. People’s Bank of China (www.pbc.gov.cn/english/xinwen/), Beijing.
PBC (2004d). Officials from the People’s Bank of China on Required Reserve Ratio Hike. People’s Bank of China (www.pbc.gov.cn/english/xinwen/), Beijing.
PBC (2004e). Highlights of China’s Monetary Policy in the First Quarter of 2004. People’s Bank of China (www.pbc.gov.cn/english/xinwen/), Beijing.
PBC (2004f). PBC Decided to Float Central Bank Lending Rate. People’s Bank of China (www.pbc.gov.cn/english/xinwen/), Beijing.
PBC (2004g). PBC Official on the Rise of Benchmark Interest Rates. People’s Bank of China (www.pbc.gov.cn/english/xinwen/), Beijing.
PBC (2004h). China Monetary Policy Report Q1, 2004. People’s Bank of China (www.pbc.gov.cn/english/xinwen/), Beijing.
PBC (2004i). China Monetary Policy Report Q3, 2004. People’s Bank of China (www.pbc.gov.cn/english/xinwen/), Beijing.
PBC (2005a). China Monetary Policy Report, Quarter Four, 2004. People’s Bank of China (www.pbc.gov.cn/english/xinwen/), Beijing.

41
PBC (2005b). Governor Zhou Xiaochuan Answers Questions on the Reform of the RMB Exchange Rate Regime. People’s Bank of China (www.pbc.gov.cn/english/xinwen/), Beijing.
PBC (2005c). Report on Steady Progress in Market-based Interest Rate Reform, Supplement to the China Monetary Policy Report. People’s Bank of China (www.pbc.gov.cn/english/xinwen/), Beijing.
PBC (2005d). PBC’s Window Guidance Conference Held to Support the Rural Economy, Small-and Medium-sized Enterprises and the Non-state Sector. People’s Bank of China (www.pbc.gov.cn/english/xinwen/), Beijing.
PBC (2005e). China Monetary Policy Report, Quarter One, 2005. People’s Bank of China (www.pbc.gov.cn/english/xinwen/), Beijing.
PBC (2005f). China Monetary Policy Report, Quarter Four, 2005. People’s Bank of China (www.pbc.gov.cn/english/xinwen/), Beijing.
PBC (2006a). A PBC Official Answers Questions on Adjustment of Reserve Requirement Ratio. People’s Bank of China (www.pbc.gov.cn/english/xinwen/), Beijing.
PBC (2006b). Highlights of China’s Monetary Policy in the Third Quarter of 2006. People’s Bank of China (www.pbc.gov.cn/english/xinwen/), Beijing.
PBC (2006c). The PBC Announced to Slightly Raise Reserve Requirement Ratio (15 August 2006). People’s Bank of China (www.pbc.gov.cn/english/xinwen/), Beijing.
PBC (2006d). Highlights of China’s Monetary Policy in 2005. People’s Bank of China (www.pbc.gov.cn/english/xinwen/), Beijing.
PBC (2006e). China Monetary Policy Report, Quarter Two, 2006. People’s Bank of China (www.pbc.gov.cn/english/xinwen/), Beijing.
PBC (2006f). China Monetary Policy Report, Quarter Three, 2006. People’s Bank of China (www.pbc.gov.cn/english/xinwen/), Beijing.
PBC (2006g). China Monetary Policy Report, Quarter Four, 2006. People’s Bank of China (www.pbc.gov.cn/english/xinwen/), Beijing.
PBC (2007a). Highlights of China’s Monetary Policy in 2006. People’s Bank of China (www.pbc.gov.cn/english/xinwen/), Beijing.
People’s Daily (2004a). China Takes Measures to Curb Price Rise. People’s Daily (http://english.people.com.cn/), Beijing.
People’s Daily (2004b). Survey shows Increasingly Urban-rural Income Gap in China. People’s Daily (http://english.people.com.cn/), Beijing.
Prasad E and Wei J (2005). The Chinese Approach to Capital Inflows: Patterns and Possible Explanations, International Monetary Fund, Working Paper, No. 05/79, Washington, DC.
Qu H (2004). Still Too Hot. HSBC Economic and Investment Strategy Unit, China Economic Insight, Vol. 17, Hong Kong (China).
Qu H (2005). Surging Capital Inflows Will Not Fuel Inflation. HSBC Economic and Investment Strategy Unit, China Economic Insight, Vol. 22, Hong Kong (China).
Qu Q (2003). Corporate Governance and State-owned Shares in China Listed Companies. Journal of Asian Economics, Stamford Connecticut, 14: 771–783.
Roberts D (1998). So Much for Competition; Beijing Slaps on Price Controls to Stanch Deflation. Business Week, Issue 3606, New York, 56.
Schlotthauer N (2003). Unternehmens- und Bankenreform in China. European University Studies, Peter Lang, Europäischer Verlag der Wissenschaften, Vol. 2969, Frankfurt am Main.
SCMP (2004a). China Springs Surprise with Interest Rate Rise; First Increase in Nine Years Rattles Stock and Currency Markets. South China Morning Post, 29 October, Hong Kong (China).
SCMP (2004b). China Shows it Can Move Markets; Global Reaction to Interest Rate Rise Underscores Growing Economic Might. South China Morning Post, 30 October, Hong Kong (China).

42
Seto D (2002). China’s Capital Markets Handbook. HSBC, Hong Kong (China).
Shuai R and Wan L (2001). Consumer Price Index in China. Statistics Singapore, International Conferences (www.singstat.gov.sg), International Workshop on Consumer Price Indices, 4–8 June, Singapore.
Taktoshi K (2004). Financial Sector Reform and Capital Account Liberalization. International Monetary Fund, Washington, DC.
Tan F (2004). China Moves to Curb High Domestic Fertilizer Prices. Asian Chemical News, Vol. 10, Issue 442, Sutton, 6.
The Economist (2002). How Cooked are the Books? The Economist, 14 March, London.
The Economist (2004). Amazingly, China has Labour Shortages. The Economist, 9 October, London.
UN China Common Country Assessment (2004). China Common Country Assessment – Balancing Development to Achieve A Xiaokang (Well-off) Society in China. UN China Country Team, August, Beijing.
UNCTAD (1998). Trade and Development Report 1998. United Nations Conference on Trade and Development, New York and Geneva.
UNCTAD (2004a). World Investment Report 2004. United Nations Conference on Trade and Development, New York and Geneva.
UNCTAD (2004b). Trade and Development Report 2004. United Nations Conference on Trade and Development, New York and Geneva.
Wang H (2002). Unequal Shares: How Tiananmen Protests Led to the New Market Economy. Le Monde Diplomatique, English Edition, April, Paris.
Wei F (1999). China’s Financial Sector Reform in the Transition to a Market Economy, Münster.
Wei SY (2004). China’s Economic Slowdown and Credit Impact on its Banks. Moody’s Investors Service, Global Credit Research, Special Comment, Hong Kong (China).
Wolf M (2005). China has Further to Grow to Catch Up with the World. Financial Times, 13 April, London.
Woo WT (2003). The Travails of Current Macroeconomic and Exchange Rate Management in China: The Complications of Switching to a New Growth Engine. UC Davis (www.econ.ucdavis.edu/), Davis.
World Bank (1997). China 2020 Development Challenges in the New Century. The World Bank, Washington DC.
WTO (2001). Report of the Working Party on the Accession of China. World Trade Organization, Geneva.
Wu X (2004a). China’s Monetary and Interest Rate Policy in 2004 (in Chinese). People’s Bank of China (www.pbc.gov.cn/english/hanglingdaojianghua/), Beijing.
Wu Z (2004b). Beijing orders price controls. The Standard (www.thestandard.com.hk), Hong Kong (China).
Xia B and Liao Q (2001). Money supply is no longer suitable to serve as intermediary target of China’s current monetary policy (in Chinese). Journal of Economic Research, Beijing, 8: 33–43.
Xie P and Yuan Q (2003). Analysis of the Effects of China’s Interest Rate Policy in Recent Years (in Chinese). Journal of Financial Research, Beijing, 275: 1–13.
Xie P (2004a). China’s Monetary Policy: 1998–2002. Joint China-IMF Training Programme: High-Level Seminar on China’s Monetary Policy Transmission Mechanism (12–13 April), Beijing.
Xie P (2004b). Comments on the effect of China Banking Sector’s Soundness and Competitiveness on Monetary Transmission Mechanism. Joint China-IMF Training Programme: High-Level Seminar on China’s Monetary Policy Transmission Mechanism (12–13 April ), Beijing.
Xu Y (1999). China’s Exchange Rate Policy. China Economic Review, 11: 262–277.

43
Yang YH and Long XT (2004). Changes in Mainland China’s Direct and Indirect Banking and Finance Structure (in Chinese). The Taipei Bills Finance Association http://www.tbfa.org.tw), Taipei.
Yu Y (2001). A Review of China’s Macroeconomic Development and Policies in the 1990s. Chinese Academy of Social Sciences (www.iwep.org.cn), June, Beijing.
Yu Y (na). China’s Macroeconomic Management of the Open Economy and China’s Accession into the WTO. Chinese Academy of Social Sciences (www.iwep.org.cn), Beijing.
Yueh LY (2004). Wage Reforms in China During the 1990s. Asian Economic Journal, Vol. 18, Issue 2: 149–164.
Zhang K (1995). Unemployment in China is Worsening. October Review, Vol. 22, Issue 4, Hong Kong (China).

44
UNCTAD DISCUSSION PAPERS
No. Date Author(s) Title
186 January 2008 Marwan Elkhoury Credit rating agencies and their potential impact on developing countries
185 July 2007 Robert Howse The concept of odious debt in public international law
184 May 2007 André Nassif National innovation system and macroeconomic policies: Brazil and India in comparative perspective
183 April 2007 Irfan ul Haque Rethinking industrial policy
182 October 2006 Robert Rowthorn The renaissance of China and India: implications for the advanced economies
181 October 2005 Dr. Michael Sakbani A re-examination of the architecture of the international economic system in a global setting issues and proposals
180 October 2005 Jörg Mayer and Pilar Fajarnes
Tripling Africa’s Primary Exports: What? How? Where?
179 April 2005 S.M. Shafaeddin Trade liberalization and economic reform in developing countries: structural change or de-industrialization?
178 April 2005 Andrew Cornford Basel II: The revised framework of June 2004
177 April 2005 Benu Schneider Do global standards and codes prevent financial crises? Some proposals on modifying the standards-based approach
176 December 2004
Jörg Mayer Not totally naked: textiles and clothing trade in a quota free environment
175 August 2004 S.M. Shafaeddin Who is the master? Who is the servant? Market or Government?
174 August 2004 Jörg Mayer Industrialization in developing countries: some evidence from a new economic geography perspective
173 June 2004 Irfan ul Haque Globalization, neoliberalism and labour
172 June 2004 Andrew J. Cornford The WTO negotiations on financial services: current issues and future directions
171 May 2004 Andrew J. Cornford Variable geometry for the WTO: concepts and precedents
170 May 2004 Robert Rowthorn and Ken Coutts
De-industrialization and the balance of payments in advanced economies
169 April 2004 Shigehisa Kasahara The flying geese paradigm: a critical study of its application to East Asian regional development

45
No. Date Author(s) Title
168 February 2004 Alberto Gabriele Policy alternatives in reforming power utilities in developing countries: a critical survey
167 January 2004 Richard Kozul-Wright and Paul Rayment
Globalization reloaded: an UNCTAD Perspective
166 February 2003 Jörg Mayer The fallacy of composition: a review of the literature
165 Nov. 2002 Yuefen Li China’s accession to WTO: exaggerated fears?
164 Nov. 2002 Lucas Assuncao and ZhongXiang Zhang
Domestic climate change policies and the WTO
163 Nov. 2002 A.S. Bhalla and S. Qiu China’s WTO accession. Its impact on Chinese employment
162 July 2002 Peter Nolan and Jin Zhang
The challenge of globalization for large Chinese firms
161 June 2002 Zheng Zhihai and Zhao Yumin
China’s terms of trade in manufactures, 1993–2000
160 June 2002 S.M. Shafaeddin The impact of China’s accession to WTO on exports of developing countries
159 May 2002 Jörg Mayer, Arunas Butkevicius and Ali Kadri
Dynamic products in world exports
158 April 2002 Yılmaz Akyüz and Korkut Boratav
The making of the Turkish financial crisis
157 Sep. 2001 Heiner Flassbeck The exchange rate: Economic policy tool or market price?
156 August 2001 Andrew J. Cornford The Basel Committee’s proposals for revised capital standards: Mark 2 and the state of play
155 August 2001 Alberto Gabriele Science and technology policies, industrial reform and technical progress in China: Can socialist property rights be compatible with technological catching up?
154 June 2001 Jörg Mayer Technology diffusion, human capital and economic growth in developing countries
153 Dec. 2000 Mehdi Shafaeddin Free trade or fair trade? Fallacies surrounding the theories of trade liberalization and protection and contradictions in international trade rules
152 Dec. 2000 Dilip K. Das Asian crisis: distilling critical lessons
151 October 2000 Bernard Shull Financial modernization legislation in the United States – Background and implications
150 August 2000 Jörg Mayer Globalization, technology transfer and skill accumulation in low-income countries

46
No. Date Author(s) Title
149 July 2000 Mehdi Shafaeddin What did Frederick List actually say? Some clarifications on the infant industry argument
148 April 2000 Yılmaz Akyüz The debate on the international financial architecture: Reforming the reformers
146 February 2000 Manuel R. Agosin and Ricardo Mayer
Foreign investment in developing countries: Does it crowd in domestic investment?
145 January 2000 B. Andersen, Z. Kozul- Wright and R. Kozul-Wright
Copyrights, competition and development: The case of the music industry
144 Dec. 1999 Wei Ge The dynamics of export-processing zones
143 Nov. 1999 Yılmaz Akyüz and Andrew Cornford
Capital flows to developing countries and the reform of the international financial system
142 Nov. 1999 Jean-François Outreville
Financial development, human capital and political stability
141 May 1999 Lorenza Jachia and Ethél Teljeur
Free trade between South Africa and the European Union – a quantitative analysis
140 February 1999 M. Branchi, A. Gabriele and V. Spiezia
Traditional agricultural exports, external dependency and domestic prices policies: African coffee exports in a comparative perspective
Copies of UNCTAD Discussion Papers may be obtained from the Publications Assistant, Macroeconomic and Development Policies Branch (MDPB), Division on Globalization and Development Strategies (DGDS), United Nations Conference on Trade and Development (UNCTAD), Palais des Nations, CH-1211 Geneva 10, Switzerland (Fax no: (4122) 917 0274/Tel. no: (4122) 917 5896). New Discussion Papers are accessible on the website at http://www.unctad.org