Molecular vibrayion
473
-
Upload
laurent-elena -
Category
Documents
-
view
35 -
download
2
description
vibration analysis
Transcript of Molecular vibrayion


ADVANCES IN MOLECULAR VIBRATIONS AND COLLISION DYNAMICS
MOLECULAR CLUSTERS
Volume3 �9 1998

This Page Intentionally Left Blank
ADVANCES IN MOLECULAR VIBRATIONS AND COLLISION DYNAMICS MOLECULAR CLUSTERS
Series Editon
Volume Editors:
JOEL M. BOWMAN Department of Chemistry Emory University
JOEL M. BOWMAN Department of Chemistry Emory University
ZLATKO BA(~I(~ Department of Chemistry New York University
V O L U M E 3 �9 1998
Stamford, Connecticut
@ JAI PRESS INC.
London, England

Copyright �9 1998 by JAI PRESS INC. 100 Prospect Street Stamford, Connecticut 06901-1640
JAI PRESS LTD. 38 Tavistock Street Covent Garden London WC2E 7PB England
All rights reserved. No part of this publication may be reproduced, stored on a retrieval system, or transmitted in any form or by any means, electronic, mechanical, photocopying, filming, recording, or otherwise without prior permission in writing from the publisher.
ISBN: 1-55938-790-4
ISSN: 1063-5467
Manufactured in the United States of America

CONTENTS
LIST OF CONTRIBUTORS
PREFACE Zlatko Ba&i~ and Joel M. Bowman
MOLECULAR CLUSTERS: REAL-TIME DYNAMICS AND REACTIVITY
Jack A. Syage and Ahmed H. Zewail
ENERGETICS AND DYNAMICS OF ARGON-WATER PHOTODISSOCIATION
Kurt M. Christoffel and Joel M. Bowman
INTERACTIONS BETWEEN CN RADICALS AND RARE GAS ATOMS: COLLISIONS, CLUSTERS, AND MATRICES
Michael C Heaven, Yaling Chen, and William G. Lawrence
VIBRATIONAL SPECTROSCOPY OF SMALL SIZE-SELECTED CLUSTERS
Udo Buck
QUANTUM MONTE CARLO VIBRATIONAL ANALYSIS AND THREE-BODY EFFECTS IN WEAKLY BOUND CLUSTERS
Clifford E. Dykstra
VIBRATION-ROTATION-TUNNELING DYNAMICS OF (HF)2 AND (HCI)2 FROM FULL-DIMENSIONAL QUANTUM BOUND-STATE CALCULATIONS
Zlatko Ba~i6 and Yanhui Qiu
vii
ix
61
91
127
163
183

vi CONTENTS
SPECTROSCOPY AND QUANTUM DYNAMICS OF HYDROGEN FLUORIDE CLUSTERS
Martin Quack and Martin A. Suhm
THE INFRARED SPECTROSCOPY OF HYDROGEN-BONDED CLUSTERS: CHAINS, CYCLES, CUBES, AND THREE-DIMENSIONAL NETWORKS
Timothy $. Zwier
AB INITIO CHARACTERIZATION OF WATER AND ANION-WATER CLUSTERS
$otiris S. Xantheas and Thorn H. Dunning, Jr.
DIFFUSION MONTE CARLO STUDIES OF WATER CLUSTERS
Jonathon K. Gregory and David C. Clary
REARRANGEMENTS AND TUNNELING IN WATER CLUSTERS
David J. Wales
SPECTROSCOPY AND MICROSCOPIC THEORY OF DOPED HELIUM CLUSTERS
K. B. Whaley
205
249
281
311
365
397
INDEX 453

LIST OF CONTRIBUTORS
Zlatko Baff.i#.
Joel M. Bowman
Udo Buck
Yaling Chen
Kurt M. Christoffel
David C Clary
Thom H. Dunning, Jr.
Clifford E. Dykstra
Jonathon K. Gregory
Department of Chemistry New York University New York, NY
Department of Chemistry Emory University Atlanta, GA
Max-Planck Institut fCir StrOmungsforchung GOttingen, Germany
Department of Chemistry Emory University Atlanta, GA
Department of Chemistry Emory University Atlanta, GA
Department of Chemistry University College London London, England
Environmental Molecular Sciences Laboratory Pacific Northwest National Laboratory Richland, WA
Department of Chemistry Indiana UniversitymPurdue University Indianapolis, IN
Department of Chemistry University of Cambridge Cambridge, England
vii

viii LIST OF CONTRIBUTORS
Michael C. Heaven
William G. Lawrence
Department of Chemistry Emory University Atlanta, GA
Department of Chemistry Emory University Atlanta, GA
Yanhui Qiu Department of Chemistry New York University New York, NY
Martin Quack Laboratorium fLir Physikalische Chemie Zurich, Switzerland
Martin A. Suhm
Jack A. Syage
Laboratorium ffir Physikalische Chemie Zurich, Switzerland
Syagen Technology, Inc. Tustin, CA
David J. Wales
K.B. Whale;,
$otiris S. Xantheas
University Chemical Laboratories Cambridge, England
Department of Chemistry University of California, Berkeley Berkeley, CA
Environmental Molecular Sciences Laboratory Pacific Northwest National Laboratory Richland, WA
Ahmed H. Zewail Arthur Amos Noyes Laboratory of Chemical Physics
California Institute of Technology Pasadena, CA
Timothy S. Zwier Department of Chemistry Purdue University West Lafayette, IN
PREFACE
Weakly bound, van der Waals and hydrogen-bonded clusters have received a great deal of attention from experimentalists and theorists alike in the past two decades. As is often the case, the surge of interest in these systems has been driven in part by impressive experimental advances, primarily the development of methods for synthesizing clusters of variable size and a variety of laser spectroscopic techniques for probing cluster properties in time and frequency domains. Another compelling reason to study clusters has been the realization that they provide an exceptional vehicle for exploring the microscopic aspects of a wide range of macroscopic phenomena of fundamental importance in chemistry, physics, and biology. This is due to two key advantages that clusters hold over bulk matter. One is the possibility to vary the cluster size in a controlled, stepwise fashion, and observe experimentally how diverse physical and chemical properties evolve from those characteristic for isolated molecules towards their respective macroscopic, bulk limits. In this sense, the clusters truly constitute a bridge which spans gas-phase molecules and con- densed phases. By building condensed matter one particle, atom or molecule, at a time, it is possible to gain quantitative understanding of the forces and dynamical processes operating in the bulk, with clarity and the level of detail that could not be achieved otherwise.
The second crucial advantage of molecular clusters stems from extremely low temperatures at which they are formed in supersonic jets. With virtually no internal excitation, such clustersare ideally suited to high-resolution spectroscopy. More-
ix

x PREFACE
over, ultra cold clusters populate appreciably only a narrow range of low-lying isomeric structures, which change little on the time scales of experiments performed in molecular beams. This well-defined environment can provide a particularly clear atomic-scale picture of intermolecular interactions, patterns of energy flow, and chemical reaction dynamics, which is not obscured by the disorder, spatial and temporal inhomogeneities unavoidable in bulk matter.
The distinctive properties of clusters mentioned above, which have been so valuable to experimentalists, are of great importance for theorists too. The relatively small number of degrees of freedom, well-characterized geometry, and control over the size, and therefore, the complexity of the system under investigation, make clusters conceptually and computationally simpler than condensed phase, allowing theoretical simulations with degree of rigor and, often, quantum-state-specific information that would not be feasible for bulk liquids and solids.
In fact, the hallmark of the field of cluster research, indeed the main reason for its vibrancy, has been the unusual synergy between the most sophisticated experi- ments and state-of-the-art theory. The rich stream of fascinating experimental findings has spurred the development and implementation of innovative theoretical methods, quantum and classical, for calculating the structural, spectroscopic, and chemical properties of clusters. Theoretical results have proved indispensable for the analysis and interpretation of the experimental data, and theoretical predictions have stimulated and guided further experiments.
Research involving clusters has grown in scope so enormously that no single book can hope to cover it completely. This volume focuses on molecular clusters, bound by van der Waals interactions and hydrogen bonds. Twelve chapters review a wide range of recent theoretical and experimental advances in the areas of cluster vibrations, spectroscopy, and reaction dynamics. The authors are leading experts, who have made significant contributions to these topics. The first chapter, by Syage and Zewail, describes the exciting results and new insights in the solvent effects on the short-time photo fragmentation dynamics of small molecules, obtained by combining heteroclusters with femtosecond laser excitation. The contribution by Christoffel and Bowman is on a related theme, and deals with their theoretical work on the effects of a single solvent (argon) atom on the photodissociation dynamics of the solute H20 molecule. Interactions between CN radicals and rare-gas atoms, clusters, and matrices are describeA in the chapter by Heaven, Chen, and Lawrence.
The following two chapters cover various experimental and theoretical aspects of the energetics and vibrations of small clusters. The chapter written by Buck gives an overview of the spectroscopy of size-selected neutral clusters, an area in which he has been a pioneer. The theoretical contribution by Dykstra describes diffusion quantum Monte Carlo (DQMC) calculations and non additive three-body potential terms in molecular clusters.

Preface xi
The next six chapters deal with hydrogen-bonded clusters, reflecting the ubiquity and importance of hydrogen bonds, and the need to understand the structures and intricate dynamics of hydrogen-bonded networks. Ba~i~ and Qiu present a full-di- mensional quantum treatment of the vibration-rotation-tunneling dynamics of HF and HCI dimers, while Quack and Suhm review the spectroscopy and DQMC calculations of larger BF clusters. The chapter by Zwier describes his incisive infrared spectroscopy of benzene-water clusters, which has led to experimental determination of the geometries of smaller water clusters, together with the far-in- frared (FIR) spectroscopy of water clusters by Saykally and co-workers. Xantheas and Dunning review their high level ab initio characterization of the energetics and vibrations of water and water anion clusters. Gregory and Clary present the DQMC studies of water clusters conducted by them which, among other things, have been essential for establishing the cage structure of the water hexamer observed in the FIR experiments by Saykally. In his contribution, Wales gives an elegant theoretical treatment of the rearrangements and dynamics of water clusters, providing quali- tative mechanistic interpretation for the observed tunneling splittings.
The final chapter, by Whaley, provides the microscopic theory of the dynamics and spectroscopy of doped helium clusters, highly quantum systems whose unusual properties have been studied extensively in the past couple of years.
Joel Bowman Zlatko B a~ir

This Page Intentionally Left Blank

MOLECULAR CLUSTERS" REAL-TIME DYNAMICS AND REACTIVITY
Jack A. Syage and Ahmed H. Zewail
Abstract . . . . . . . . . . . . . . . . . . . . . . . . . . . . . . . . . . . . . . 2
1. Introduction . . . . . . . . . . . . . . . . . . . . . . . . . . . . . . . . . . . . 2
2. Bond Dynamics: Dissociation and Caging . . . . . . . . . . . . . . . . . . . . 5
2.1. I2/Xn . . . . . . . . . . . . . . . . . . . . . . . . . . . . . . . . . . . . 5
2.2. I 2 / X n . . . . . . . . . . . . . . . . . . . . . . . . . . . . . . . . . . . . 17
2.3. Comparison with Condensed-Phase Studies: Solids and Liquids . . . . . 19
3. Electron Transfer . . . . . . . . . . . . . . . . . . . . . . . . . . . . . . . . . 21
3.1. Bzn/I2 . . . . . . . . . . . . . . . . . . . . . . . . . . . . . . . . . . . . 21
4. Proton Transfer . . . . . . . . . . . . . . . . . . . . . . . . . . . . . . . . . . 31
4.1. ROH*/Bn . . . . . . . . . . . . . . . . . . . . . . . . . . . . . . . . . . 32
4.2. Double Proton Transfer . . . . . . . . . . . . . . . . . . . . . . . . . . . 41
4.3. (NH3)n and Na(NH3)n . . . . . . . . . . . . . . . . . . . . . . . . . . . 44
5. Aligned Bimolecular Reactions . . . . . . . . . . . . . . . . . . . . . . . . . . 46
6. Barrier Crossing: trans-St i lbene Photoisomerization . . . . . . . . . . . . . . . 51
7. Concluding Remarks . . . . . . . . . . . . . . . . . . . . . . . . . . . . . . . 53
Acknowledgments . . . . . . . . . . . . . . . . . . . . . . . . . . . . . . . . . 53
Appendix: Tunneling Model for Proton Transfer in Clusters . . . . . . . . . . . 54
Note Added in Proof . . . . . . . . . . . . . . . . . . . . . . . . . . . . . . . . 56
References . . . . . . . . . . . . . . . . . . . . . . . . . . . . . . . . . . . . . 56
Advances in Molecular Vibrations and Collision Dynamics, Volume 3, pages 1-60. Copyright �9 1998 by JAI Press Inc. All rights of reproduction in any form reserved. ISBN: 1-55938-790-4

2 JACK A. SYAGE and AHMED H. ZEWAIL
ABSTRACT
In this chapter we present a review of the field of real-time chemical dynamics in clusters, with specific examples to illustrate the new level of understanding reached for microscopic solvation and reactivity. The experimental examples presented were chosen to represent a progression of chemical complexity, ranging from elementary bond breaking, to electron transfer, to proton transfer, and to bimolecular chemistry in aligned complexes. The chapter begins with a discussion of the fundamental processes of dissociation and recombination dynamics in solvent cages for the prototypical neutral and ionic cluster systems. We eventually discuss reactions in larger systems, elucidating the elementary steps of proton and double-proton transfer in acid-base and isomerization reactions. In describing recent work, we highlight the new experimental techniques designed to extract new dimensions in the chemical dynamics in clusters, namely time- and state-resolved measurements with product velocity and spatial angular resolutions.
1. INTRODUCTION
Experiments on molecular complexes and clusters formed in supersonic beam expansions are providing new levels of understanding of the effect that individual molecules have on the properties of chemical reactions in particular and on solvation in general. These aggregates can be studied by laser probes and their size-dependence sorted out by mass spectrometry and spectroscopy. A number of books and chapters have appeared on the subject (e.g. refs. 1, 2) and the excellent recent article by Castleman and Bowen gives an overview of the experimental progress made so far.3 Progress in lasers and molecular beams have allowed single-quantum state studies. Ultrafast lasers have reduced the time scale of study to that of elementary bond breaking and bond-making processes. Laser polarization techniques have been used to achieve molecular alignment, making possible measurements of angular distributions of products. And in sophisticated new experiments, all of these laser techniques have been brought to bear on molecular level samples. In fact, techniques to measure chemical properties of clusters have reached the point where direct comparisons with gas-phase and condensed-phase reactions can be made.
Solvation under controlled conditions of size and composition offers an oppor- tunity to examine different phenomena of reactivity at the microscopic level. Some of the important new details being learned about solvent influence on reacting molecules include the following:
�9 Coherent motion of solvent molecules. �9 Geometry and structure of the solvent about a solute molecule. �9 Energies of interaction by individual molecules. �9 Vibrational mode structure and dynamics.

Molecular Clusters 3
�9 Solvent critical number in phenomena such as electron and proton transfer and caging.
Because such processes can be studied at the microscopic level, clusters are an ideal medium for understanding the connection between gas-phase and condensed-phase phenomena and in learning about the breakdown of bulk-phase properties as a system becomes increasingly smaller in size. The structure of the solvent about a reacting molecule is a longstanding issue and the interactions exerted by the solvent often determine the fate of chemical reactions. Learning about solvent interactions in microscopic detail could potentially lead to important advances in the under- standing, and possibly control, of bulk-phase chemistry.
In this chapter, we present an overview of the rapidly expanding field of real-time dynamics in clusters. Measurements of cluster dynamics in the time domain began in 1983 with experiments probing excited-state lifetime (of isoquinoline) for various hydrogen bonding solvent molecules (Figure 1).4 To date, there are many groups conducting real-time measurements in clusters encompassing a large scope of interests; a number of reviews on time-resolved studies and on general topics in chemical dynamics in molecular clusters have been reported before. 5-9 Metallic clusters represent a branch for different classes of phenomena, interesting in their own right. In keeping with the format of this book, we focus on more detailed accounts of case studies primarily from the authors' laboratories to illustrate the
~C_--
t~ "-,".-,.'.'.. i I �9 o~ �9 $ ;." �9 �9 ,, "~- *..-...
a ; ~ ~,. . . . I t , "~ �9 ~ i ? e �9 ~. :...
., : ~" ., ~..- j ~. " --...._ :-.-.
WATER - 7.9 ns METHANOL - 4 .6
ACETONE - 2 .5 BARE ! Q 0 . 5 8
~ , .
.= ' �9 - . -
", '*,. " : ' " . -- . . WATER �9 ~- ! % "-~ "-.'.,-... 4 t ~o~. " ' * ' ~ " " "
" 'n4 " -. ~ . ~,: , "".-..- .. �9 t t E " ' ' ' ' ' " " "
"'.~ " "::.~ IVOL ""-",':,.',,,,..,,.,~ .. ~ BARE A"~" " " ' " ' . ,
I I , i i i --- "FI . i ii ....
0 .0 :5.8 7.8 11.4 15.2 18.9 Time (ns)
Figure 1. Excited state decay times of isoquinoline unsolvated and solvated as measured by time-correlated single-photon countin 8 in a free-jet expansion (ref. 4).

4 JACK A. SYAGE and AHMED H. ZEWAIL
new kinds of information being gained from these studies. We will present a series of studies chosen to illustrate a progression of chemical complexity ranging from elementary bond breaking, to electron transfer, to proton transfer, and to bimolecu- lar chemistry in aligned complexes. This chapter centers largely on bimolecular solute-solvent chemical interactions; those time domain studies that do not fall under this main theme are summarized in Section 7.
In Section 2, we consider one of the most classic and fundamental problems in chemistry, namely what happens when a diatomic molecule dissociates in a solvent cage? Key insights have been provided by a history of time-resolved studies of 12 dissociation/recombination in condensed phases. However, only recently have measurements been conducted in real time on solvated cluster systems such as I2/M,, and I2/M,,, where M,, is a solvent of n molecules of M, as a function of specific cluster size. These experiments have provided critical new understanding regarding the precise interaction of each solvent molecule, leading to cage escape vs. recom- bination probabilities, and measuring the actual coherent motions of bond breakage and caging in the solvent. In Section 3, we extend the discussion of 12 to complexes I2/Bz,,, Bz being benzene, wherein a competition between a charge transfer and a neutral channel to 12 dissociation occurs. In these studies new multi-dimensional probes involving time-resolved angle-velocity measurements of products are intro- duced. In Section 4, we cover an extensive series of studies on a prototypical acid-base reaction ROH*-B n ~ RO*- H+Bn (excited-state proton transfer), where ROH is an aromatic acid and B~ is a cluster of base molecules. Direct time domain studies have revealed that changing a single solvent molecule can lead to distinct chemical changes, sometimes affecting reaction rates by over 2 orders of magni- tude. These results are making possible the validation of a quantum level model of proton tunneling involving solvent dynamics that may be extended to describe condensed-phase behavior.
Section 5 covers sophisticated new techniques building on earlier advances in studying bimolecular chemistry using alignments of molecules in van der Waals complexes. Recently, differential reactive cross sections in angle and velocity have been measured in photodissociation of van der Waals complexes with product quantum-state resolution and femtosecond time resolution. We focus on recent studies on (CH3I)2 and I2/Bz n. The quantum-state-resolved work on (CH3I)2 re- vealed a bimodal angle-velocity distribution for the I atom fragment, indicating an inequivalency of the two individual molecules, and rapid spin-orbit relaxa- tion in I atom. The real-time measurements showed a 150 fs C- I bond scission and a build up of 12 in less than 500 fs. The I2/Bz ~ work has led to direct observation of the time evolution of the transition state and products for the charge transfer reaction Bz-I 2 ~ [Bz§ ~ ~ Bz-I + I, while monitoring the change in anisotropy and fragment translational energy.
The latest set of experiments described in Section 5, incorporating time-resolved and state-resolved differential cross-section measurements in aligned complexes, hold great promise of providing information needed to test quantum chemical

Molecular Clusters 5
dynamics in these finite-sized systems. The van der Waals bond in a dimer complex helps to fix the geometry and limit the range of impact parameters under study. The full dimensionality of how molecules collide and break up into products can be followed in real time using femtosecond excitation and angular probing of product velocities. Section 6 describes the effect of microscopic solvation on isomerization reactions, and in Section 7 we conclude the chapter. An appendix has been added describing a state-to-state theory of proton tunneling appropriate to clusters and extendable to the condensed phase, thus helping to unify the connection between gas-phase and condensed-phase chemistry.
2. BOND DYNAMICS: DISSOCIATION AND CAGING
2.1. 12/X.
Vibrational Predissociation (n = 1-4)
Dimer systems offer the simplest picture of solute-solvent interactions. In a series of experiments Gutmann et al. directly measured state-to-state rates of vibrational predissociation for 12 complexed to X = He, Ne, Ar, and H2 .1~ Questions of interest included: does the repulsive potential of the van der Waals bond determine the state-to-state rates of predissociation, and do vibrational and electronic predissociation have the same origin? The state-to-state process can be described by the following,
I* ' ~(vl,v))12 2X(vi) ~ . " (Vf) + X (1)
where excitation is to the B electronic state.
Experimental: Because of the picosecond time scale for these dynamics and the interest in probing state-specific effects, tunable picosecond duration pulses were used. ~~ The 532 nm output of a Nd:YAG laser was split to synchronously pump two cavity-dumped, etalon-tuned dye lasers. The pump laser was operated in the visible in order to excite specific vibration levels in the B-excited electronic states of 12. The probe laser was operated in the ultraviolet in order to pump electronically excited I2 to an ion-pair state, from which fluorescence was detected. Clusters were formed in a supersonic expansion using two arrangements. A continuous nozzle was used for Ar expansions to take advantage of the maximum repetition rate (800 Hz) of the laser. For H2, He, and Ne expansions, higher backing pressures were required, necessitating the use of a pulsed nozzle operated at about 100 Hz.
Excitation to a specific vibrational state ~ of the reactant I2 stretching mode is followed by vibrational redistribution to the vdWs mode. In the case of Ne,

6 JACK A. SYAGE and AHMED H. ZEWAIL
a single I2 quantum exceeds the vdW binding energy hence the product I2 is formed with ~ = ~ - 1 quanta. Real-time measurements of the rate of vibra- tional predissociation (VP) probe the coupling strength of the 12 reactant vibration to the vdW's mode. ~~ Examples of the product formation times for different initial vibrational excitations are shown in Figure 2. The VP rates increase monotonically with increasing vibrational excitation for Ne. The situation for Ar was different in the following ways: (1) because the vdW's bond energy is much greater, the VP process was favored by the ~ = ~ - 3 channel, and (2) an electronic predissociation (EP) competes with VP.
Interesting questions arise when the number of solvent molecules is increased systematically. 12 For example, do the rare gas solvent molecules dissociate sequen- tially, each event being a VP (direct, sequential mechanism), or does intramolecular vibrational redistribution (IVR) to unreactive modes occur first, followed by sequential VP (indirect, evaporative mechanism)? The state-to-state time-resolved dissociation rates indicate that the onset to IVR occurs for just two Ne atoms. These
- r - l - ' ' ' I ' ' ' i ' ' ' ! ' ' ' I ' ' ' I ' ' ' 1 ' ' ' I ' ' ' I ' ' ' I '~
ps
I,N~ (v,')---I , (v, ' - l ) + ~e
, l , , , l , , , I , , , ! , , , I , , , l , , , I , l l l , , , I , , , I , - 4 0 0 - 2 0 0 0 200 400 600 800 1000 1200 1400
Time ( p i c o s e c o n d s )
Figure 2. Representative pump-probe transients for vibrational levels v~ = 13, 18, and 23. The dashed line is the fit to an exponential rise function, from which the value of the state-to-state rate is given (refs. 10-12).

Molecular Clusters 7
measurements were extended to n = 3 and 4 Ne atoms to test statistical theories for small cluster systems. Campos-Martinez et al. conducted time-dependent Hartree- type calculations on the VP of I2-Ne 2 clusters. 13 The computations indicate a sequential dissociation of Ne, although some behavior bordering on internal vibra- tional relaxation was observed for high initial vibrational states. The computed trend in the lifetime vs. initial vibrational state was in very good agreement with experiment (Figure 3).
a'lL - 3 5 7 9 11 13
R1 1~)
100
80
01
60 01
E ~ 4 . . , | 40 . J
20
13
11 9 7 R= 1~)
5 3
(b) �9 " """ 11
3 3 5 7 9 11 13
Rl (~) (c)
, ' , , , , ,
, Experiment o.-o TDH (with corrected ZPE) H TDH
"-.~
t t
I I I II I I �9
16 17 18 19 20 21 22 23 24 Initial vibrational State v
l i ~ ' - ~ ~,",~,_~N'~ 13
5 3
3 5 7 9 11 13 R, I.tl
Figure 3. Snapshots at t = 10 ps when the initial state is v' = 17 and for channels (a) v' = 16, (b) v' = 15, and (c) v' = 14. The system is 12Ne2 and R1 (R2) is the distance from 12 to Nel (Ne2). Comparison of computed lifetimes with experimental lifetimes is also shown (ref. 13).

8 JACK A. SYAGE and AHMED H. ZEWAIL
Dissociation~Recombination in 12/Xn Macroclusters
By increasing the cluster size new solvent dynamics can be probed. In the case of I z, direct measures of dissociation/recombination dynamics can be obtained and compared to the analogous measurements in bulk solvents and condensed phases. 14 These events occur on much faster time scales than the predissociations described above for the smaller cluster systems. Experiments were conducted on clusters and on high-pressure gases.
Experimental: These experiments required femtosecond time resolution. The cluster experiments made use of a mode-locked Nd:YAG synchronously pumped linear, dispersion-compensated dye laser. ~4 The 615 nm output was passed through a Nd:YAG pumped, four-stage dye amplifier and then split into pump and probe pulses. The pump was used to generate a white-light continuum and the probe, frequency doubled to 308 nm. The continuum pulse was filtered and amplified by a 355-nm pumped three-stage dye amplifier to give tunable pump pulses (e.g. 480, 510, 520 nm for B state excitation and 614, 620, and 640 nm for A-state excitation of I2). As above, the probe pulse excites an ion-pair state of I2, which is detected by fluorescence. For the high-pressure gas experiments, 60 fs pulses were generated in a colliding- pulse mode-locked ring dye laser and amplified in a four-stage dye amplifier system pumped by a Nd:YAG laser. The amplified pulses were recompressed in a double-pass, two-prism arrangement and then separated into pump and probe pulses using a 50:50 beam splitter. The fundamental at 620 nm and the frequency doubled output served as pump and probe, respectively. Other wavelengths were selected by using a continuum generation.
Macroclusters consisting of around 40-150 Ar atoms solvating I2 were excited to the A state above its dissociative limit to I + I, and to B-excited electronic states at different energies above and below its dissociative limit to I + I". 14 The A state undergoes direct dissociation whereas the B state predissociates from a bound to a repulsive potential. The direct dissociation of I: in the A state leads to a high-energy impact of the I atoms on the frozen solvent cage. The Ar solvent cage provides an outer potential barrier that causes the I atoms to oscillate back to a nearly molecular state. Initial geometries and snapshots of the structural changes for A-state excitation are calculated in Figure 4 for an I2 solvated by 17 Ar atoms (two isomers presented) and 44 Ar atoms. These dynamics are manifested in the femtosec- ond transients in Figure 5 for 614 nm excitation. The rise and fall times for the first peak represent the formation of the excited-state wave packet and subsequent decay to I atom separations that no longer absorb the probe light. The signal reaches a minimum in about 250 fs followed by a prompt recovery to an optically absorbing state in about 300 fs. Molecular dynamics calcula- tions show that the recovery represents a coherent bound motion involving

Molecular Clusters 9
the solvent cage. The B state below the direct dissociative limit undergoes predissociation. The measured dynamics for 570 nm excitation in Figure 6 show a decay time of 15 ps, corresponding to the predissociation lifetime, followed by a 30 ps time scale recovery, due to recombination of solvent separated I atoms and vibrational relaxation.
These results provided the microscopic picture of the effect of solvation on dissociation and recombination. First, the time scale for direct dissociation, which was measured directly, is essentially unaffected by the solvent. Second, caging as
(a) 17 Ar
t = 0 fs t = 3 0 0 fs t = 6 6 0 fs t = 4 ps
(b) 17 Ar
0 0
t -- 0 fs t = 3 0 0 fs t - 6 6 0 fs
(c)44 Ar
Q �9
t = 0 fs = t = 6 6 0 f s
Figure 4. Snapshots of the structures of iodine (dark grey) in argon (light grey) solvent cages. (a) For 17 Ar atoms where one I atom is not capped, the subsequent recombination takes more than 4 ps. (b) For 1 7 atoms where 12 is fully enclosed, recombination following dissociation is direct. (c) For larger clusters, the 12 is almost always enclosed leading to caging that is direct and coherent (ref. 14).

10 JACK A. SYAGE and AHMED H. ZEWAIL
a recombination process following direct dissociation, is a coherent process, with the solvent essentially frozen in configuration on this time scale. The wave packet motion is illustrated in Figure 7. The process is in a highly nonequilibrium dynamics with the solvent. Third, vibrational relaxation occurs on a much longer time scale. Finally, unlike the direct dissociation case (A state), the case of predissociation (B state) shows clearly the solvent involvement in the collision-induced predissocia-
0.5
- - 0.3 e ~
0.1
-0.1
1.0
0.8
d _ 0.6
C q
0.4
0.2
E x p e r i m e n t a l v s M D : S t a t e s o f C a g i n g & C o h e r e n c e
. . . . ! . . . . ~ . . . . �9 . . . . ! . . . . ! . . . . ! . . . . .
( a ) M D
- A' ~ - A .;
MD
/ I \ i
0.0
(b) Experiment
�9 �9 0 7 ~ o
- 0 . 2 . . . . ' . . . . ' . . . . i , , , , , . . . . t , . �9 . i . . . .
- I 0 l 2 3 4 5
Time (ps)
Figure 5. LIF transients following A-state excitation at 614 nm. (a) Simula- tions for 12-Ar44 with initial temperature of 30 K. (b) Experimental transient from monitoring red-shifted fluorescence (400 nm). Probe wavelength is 307 nm for both simulations and measurements (ref. 14).

Molecular Clusters 11
tion and in the caging, but now on the picosecond time scale. The solvent reorgani- zation being on the time scale of bond breakage.
I2/X. in the High-Pressure, Supercritical Region
To compare with condensed-phase behavior at solvent densities comparable to clusters and liquids, high-pressure, supercritical fluids were studied by Lienau et
::3
�9 ~ 0.2
0.1
B-State D y n a m i c s : E x p e r i m e n t a l v s M D
0.4 , . . , . . . . . , . . . . . . . . . . , . . . . , . . . . , . . . . , . . . . , . . . . . . . T . . -
f (a) MD
0.3 i '
0.0
1.0
0.8
_ 0 . 6 r
0.4
M 0.2
0.0
~ ' " " " I " I ' " " I . . . . I . . . . I . . . . " ! ' " " " " | . . . . I . . . . I ' . . . . I ' " " ~ " -
(b) Experiment
�9 ~ o o �9
- ao 4o 5o 60 70 8o 90 T i m e ( p s )
Figure 6. LIF transients following B-state excitation at 570 nm. (a) Simula- tions for 12-Ar44 for initial temperature of 30 K. (b) Experimental transient. Probe wavelength is 307 nm for both simulations and measurements (ref. 14).

12 JACK A. SYAGE and AHMED H. ZEWAIL
al. to explore phenomena reflecting details of solute-solvent interactions. 15'16 Femtosecond excitation of 12 at the inner turning point of the B-state potential was achieved using 60 fs pulses from a CPM laser at 620 nm. Pressure was varied from 0 to a few thousand bar for the rare gases He, Ne, Ar, and Kr. The properties that were measured were: coherent nuclear motion of 12, rate of predissociation, and caging time and efficiency. Calculations of the solvent density and structure as a function of pressure for I2/Ne,, are illustrated in Figure 8.
Figure 2". Wave packet motion as a function of time. The wave packet was treated classically for the spatial distributions of I-I distances at given times. The distributions were obtained by averaging over 1000 independent trajec- tories (ref. 14).

Molecular Clusters 13
" tb 0 . . , ,.. , ,
�9 " -, . . . ' . ~
. . e " . . " " I "" " " o
�9 o
" ~ " ,., " " o
P = 100 bar
" . " I " " ~ o . t o
P = 600 bar
6
t 0 .
/~(1 �9
. , o , , P o
P = 900 bar P = 2000 bar
Figure 8. Snapshots of 12/Nen system at four different pressures. The atom positions are in accordance with M D simulations. Coordinates are in ang- stroms (ref. 16).

14 JACK A. SYAGE and AHMED H. ZEWAIL
o bar
201 bar
r
0 1 2 3 4
404 bar l
201 bar
'" 1210 bar 1628 bar
0 5 10 15 0 5 10 15
Time Delay (ps) Time Delay (ps)
Figure 9. Femtosecond transients of iodine in compressed supercritical argon at 295 K. Left: experimentally observed transient at Ar pressures of 0, 201, and 594 bar using LIF detection at the "magic angle" (54.7 ~ between the pump and probe pulses. Fluorescence detection wavelength: 340 nm- 0 bar, 351 nm - 201 bar, and 360 nm - 594 bar. Right: the transient behavior at longer times, showing the onset of caging with density changes (ref. 15).
Femtosecond transients as a function of Ar pressure are presented in Figures 9 and 10.15 In Figure 9, 12 vibrational coherence persisted for greater than 1.5 ps up to a pressure of 800 bar. Because the collision frequency between 12 and the bath gas is about 4 ps -1, these results indicate that at least 6 collisions are required to fully quench the vibrational coherence. At similar pressure, the 12 signal decays on the same time scale as the vibrational coherence. The mechanism for this relatively fast decay is collision-induced electronic predissociation. At pressures of 400 bar and above, the transient decays are followed by a slower rise. This trend represents geminate recombination of I atoms by a cage effect. The onset of caging occurs at pressures where the bath gas density begins to deviate from ideal gas behavior. Above 1200 bar, the rise of the transient appears to be biexponential, which is consistent with similar studies in liquid Xe. 17 These observations are assigned as fast vibrational relaxation with the A/A' states and slower curve crossing from the A ~ A' electronic states.
In the lighter rare gas solvents He and Ne, the vibrational coherence is only weakly affected by increasing pressure from 100 to 2000 bar. The transients for the
Molecular Clusters 15
b l
I:;. . . . . . ' ' . .... ' ; ' 'oba~"
.i,., " , , " i ,", ,
' , ', , 4, ." ', , 8 . ' , ! 2 0 ~ i 13-12 8-7 1-0
�9 ,. 1960 bar _, �9 . .
J e | I I . 2 . ! ~ ! ! _ _ _ _
1 5 100 115 130 Frequency (cm "1)
0
0 2 3 4 Time Delay [ps]
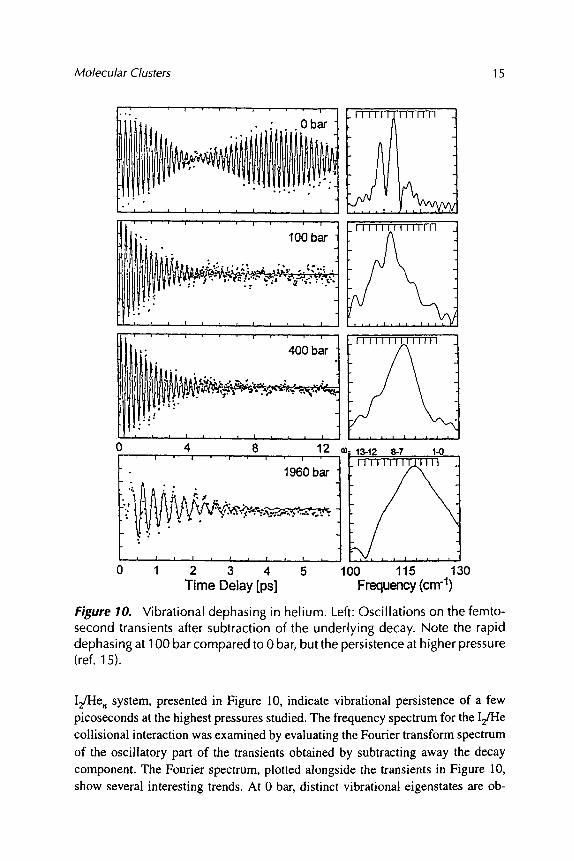
Figure 10. Vibrational dephasing in helium. Left: Oscillations on the femto- second transients after subtraction of the underlying decay. Note the rapid dephasing at 100 bar compared to 0 bar, but the persistence at higher pressure (ref. 15).
I2/He n system, presented in Figure 10, indicate vibrational persistence of a few picoseconds at the highest pressures studied. The frequency spectrum for the I2/He collisional interaction was examined by evaluating the Fourier transform spectrum of the oscillatory part of the transients obtained by subtracting away the decay component. The Fourier spectrum, plotted alongside the transients in Figure 10, show several interesting trends. At 0 bar, distinct vibrational eigenstates are ob-

16 JACK A. SYAGE and AHMED H. ZEWAIL
served with the maximum corresponding to the frequency co8, 7 = 113 cm -]. At a pressure of 100 bar He, the Fourier spectrum broadens significantly due to solvent- induced dephasing, and the intensity at higher frequencies increases. At 400 bar, the frequency spectrum is nearly completely broadened and shifted to higher frequency. The broadening and blue shifting increases at 1960 bar He.
Much of the underlying dynamics of solute-solvent interactions may be probed by measuring the correlation time for solute-solvent collisions and vibration-rotation couplings relative to the coherence or dephasing time T 2 and the energy relaxation time T1.16 Two regimes may be defined: slow modulation is when the correlation times are longer than T 2, and fast modulation is when they are much shorter than T 2. In the limit of very fast modulation, a motional narrowing of the properties of the solute may be observed. A measure of T] and T 2 as a function of
A m
v
M @ m
@ @ a
o} I i , @ C I11
"O I= m
0.8
0.6
0.4
0.2
~ B
~/T 2
l I T 1
50 mol/l
0 5 10 15 20 25 30
Number Density (atomslnm 3)
Figure 11. The behavior of the rates (1/T2 and 1/11) with solvent density for helium. The lines in this figure are polynomial fits to the experimental data. The densities were obtained from the known pressure-density conversion data reported elsewhere (ref. 16).

Molecular Clusters 17
He pressure revealed interesting behavior as shown in Figure 11. The T 1 behavior can be explained by collision-induced predissociation. The T 2 results, however, break into three regions: (1) a low-density region where 1/T 2 increases rapidly and linearly, (2) an intermediate-density region where 1/T z is relatively constant, and (3) a high-density liquid-like region where 1/T e increases again.
With the help of molecular dynamics (MD) simulations, the behavior of T 1 and T 2 with number density can be explained. The two principal forces involved are the real collisional force originating from the solute-solvent intermolecular interaction and a rotation-induced centrifugal force (i.e. vibration-rotation cou- pling). 18 The motional narrowing regime begins at a number density of about 10 nm -3. At this point the centrifugal force, which rises linearly at lower density, turns over and decreases (slowly) at higher density. This behavior is mirrored in the T 2 results up to about 20 nm -3. At this higher density the collisional force dominates and 1/T 2 increases again in rate.
2.2. I~/Xn
The dissociation/recombination dynamics for a charged solute molecule in a neutral solvent is likely to differ markedly from that of a neutral solute/solvent system. Whereas the dynamics in the latter case are mostly dominated by thermally activated collisional interactions, the reaction dynamics in the former case will be driven more by Coulomb interactions between the solute and solvent. The Lineber- ger group carried out experiments on mass-selected cluster ions of I2/X,, where X is CO 2 or Ar. 19-22 These solvents have similar mass, but differ greatly in their polarity. The principal measurements were the caging fraction, and the recombina- tion rates as a function of solvent cluster size.
Experimental: The Lineberger group employs a tandem mass spectrometer apparatus for time-resolved measurements of mass-selected cluster ions. 19,2~ Cluster ions are formed at the source of a pulsed valve by crossing the free jet expansion by a 1 keV electron beam. The cluster ions grow in size in the expansion and then are allowed to drift before being extracted into a tandem TOF mass spectrometer. In the linear TOF stage, the cluster ion masses separate and a pulsed mass gate allows a single mass through. Laser excitation occurs just beyond this region. The laser system is an Ar ion pumped Ti:Sapphire oscillator that is pulse-stretched and amplified in a regenerative amplifier, then recompressed, producing 150 fs, 1 mJ pulses at 790 rim. 21 Some of the earlier work from this group used a mode-locked Nd:YAG synchronously pumped dye laser and pulsed dye amplifier. 19.20 The dynamics of dissociation/recombination are probed by absorption recovery. Following pump excitation of I~, the ion dissociates to I + I- and no longer absorbs the probe pulse, which is of the same wavelength as the pump. IfI + I- recombines to IL and vibrationally relaxes, the cluster again can absorb the probe pulse.

18 JACK A. SYAGE and AHMED H. ZEWAIL
This absorption recovery is detected in the following way:
I 2 / X n hv~ ; I2 * Xn ~ [I + I-]Xn_ a ---) 12 X n _ a
- hv 2 ; I 2 * Xn_ a -")' [I + I-]X,,~_ b ---) I2Xn__a_ b (2)
The dissociation initiated by the pump causes some evaporation of solvent (desig- nated as a in Eq. 2). Hence, the resultant mass spectrum leads to fragment ions, which are signatures for 1-photon absorption. If 12 reforms after dissociation, the cluster will absorb the probe pulse, dissociate, and lose additional solvent [desig- nated as b]. Hence a second series of fragment ions are signatures for two-photon absorption, which is the absorption recovery signal.
The mass selection of I~/X n before pump-probe excitation enables a measure of the caging fraction as a function of solvent size n. The two product channels I-/X,,_ a and I~/X,,_ a in the first line of Eq. 2 are signatures for uncaged and caged dissociation, respectively. For CO 2 solvation, the first evidence of caging appears at n - 4, and the caging fraction increases monotonically reaching unity at about n - 15. 20 For Ar solvation, caging first appears at n - 10 and reaches a maximum caging fraction of about 0.50 at n - 16. ll The completion of the first solvation shell occurs at n - 16 for CO 2, and presumably a similar value for Ar. The results of the caging fraction are consistent with the polarity of the solvent. CO 2, having a larger charge separation (in form of an electric quadrupole moment) than Ar, forms a stronger ion-neutral bond as well as stronger solvent-solvent bonds than Ar. CO 2, therefore, forms a more rigid solvent cage than does Ar, accounting for the greater caging efficiency.
Time-resolved measurements of I~(CO2),, dissociation revealed two interest- ing observations as shown in Figure 12. 20 (1) the absorption recovery times decrease with increasing solvent size over the range n = 12-15; below and above these solvent sizes, the recovery times are asymptotic (---40 ps for n _< 12 and --10 ps for n _ 15), and (2) a recurrence at about 2 ps is observed in the absorption recovery for cluster sizes n = 14-17. These behaviors occur over a size range corresponding closely to the filling of the first solvation shell. The recurrence is attributed to coherent internuclear motion of I~ along the dissociative excited potential, which is now bounded by the solvent. This phenomena is analogous to the recurrence observed and discussed above for I2/Ar,,. 14 As with the I~Ar,, system, I~(CO2),, eventually recombines along the ground-state potential and undergoes vibrational relaxation to a distribution of states that are again optically active, accounting for the longer time dependence in the absorption recovery traces. The combination of experimental time-resolved measurements and theoretical support, particularly mo- lecular dynamics, are providing key understanding of these fundamental processes.
The Neumark group recently conducted a femtosecond photoelectron study on size-selected I2(Ar), , clusters. 23 They observed that the photodissociation of the

Molecular Clusters 19
o
eeoo �9 �9 �9 �9 �9 �9 �9 �9 �9 go. n = 17
t "; / oo, 0 / , . , n = 16 , 100~
PA �9 �9 �9 O 0 0 � 9 �9 �9 ~ 5 ",~" . . �9 9 5 ~
%,,,,p~mo d,,,,, f " o o �9 �9 �9 �9 ~ ~ �9 �9 n = 14 I ~ �9 �9 �9
0 " �9 " 8 9 ~
t " " ~ �9 �9 O0
0 , 0 , o o � 9 " ~ ~ = 13
�9 o �9 ~ oO�9 o �9 �9 �9 �9
�9 ~149 oo�9 n = 12 0 �9 " ~ 5 9 ~
l " 0 �9
0 ~ ~ ' ~ x j , I , - I 0 0 10 2 0 3 0
P u m p - P r o b e D e l a y (ps)
0 �9 p,,,i
0 I.., o
.<
40
Figure 12. I~ (C02)n (n = 12-17) absorption recovery data obtained with 720 nm pump and probe pulses with parallel polarization. Percentage values are fraction of caged products. The top trace is the laser pulse autocorrelation (ref. 20).
I~ for n = 6 solvent molecules is complete in about 200 fs (same for bare I~), but that the attractive interaction between the departing anion fragment and the solvent persists for about 1200 fs. For n = 20 cluster size, the photodissociated fragments are caged, leading to recombination and vibrational relaxation on the time scale of 35 ps and 200 ps, respectively, and that these processes occur on both the ground and excited electronic surfaces.
2.3. Comparison with Condensed-Phase Studies: Solids and Liquids
The above cluster experiments are especially valuable toward furthering the understanding of solvent interactions. They can also be directly compared to analogous studies in the condensed phase. The history of dissociation and cage

20 JACK A. SYAGE and AHMED H. ZEWAIL
recombination studies of 12 began in the condensed phase in the group of Eisen- thal, 24 and many groups have subsequently contributed to the theoretical and experimental studies; 17,25-27 for a review see the paper by Harris, Brown, and HarrisY For 12 in liquids, caging was not resolved, but inferred to be occurring in less than 2 ps. The resolved coherent process in clusters indicate the microscopic, not bulk, role of the solvent. Furthermore, consistent with the theoretical analysis 28 of Hynes and Nesbitt, the time scales of caging and VR are much different--fs and ps, respectively. The effect of the solvent on electronic predissociation and dephasing has been studied thoroughly in dense fluids. 15-17 Higher caging efficien- cies are also observed for polar solvents in condensed-phase studies of neutral I2. 27 This behavior is consistent with the results for I~/X n studies described above. The comparison with liquid state studies by Fleming's group 29 and solid-state studies by Apkarian's group shows interesting behavior for the dependence on solvent density, polarity, and structure. 3~ Apkarian has recently provided a theoretical treatment of the effect of local symmetry on the predissociation in order to reconcile liquid- and solid-state results. 31
For solids, Apkarian and coworkers measured the neutral 12 dissociation/recom- bination with femtosecond resolution in rare gas matrices. 3~ In these studies the solvent or matrix potential barrier is directly probed and the extent of lattice excitation measured. The rare gas matrix results show several recurrences as seen in Figure 13. The results exhibit behavior similar to that observed in the cluster results. The additional recurrences are also modulated by solvent-mode frequen-
I ! I ! i , i 1
e m
�9 , , �9 �9 w w ,
-o.s o.s ] .s z.s 3.s Delay (ps)
Figure 13. Temperature dependence of transients, recorded for a 704 nm pump. Simulations account for the major oscillations in the transients (ref. 30).

Molecular Clusters 21
cies, attesting to the stiffness of the matrix. In a series of beautiful experimental and MD theoretical studies by the Apkarian and Martens groups, they have discussed the detailed nature of the recombination process and coherence.
Barbara and coworkers measured I- dissociation/recombination dynamics in liquid solvents. 32 In a related experime2t, Ruhman and coworkers observed coher- ent vibrational motion of 12 resulting from 13 photodissociation in the con- densed phase. 33 These experiments have revealed the coherent nature of the dissociation/recombination process, thus providing a microscopic picture with connection between bulk liquid and cluster and solid phase phenomena.
3. ELECTRON TRANSFER
Charge transfer (CT) reactions are of fundamental interest in chemistry and biology. Because of the large change in charge density involving a coupling of ionic and covalent potentials, it is especially interesting to investigate the transition state, which presumably must have some hybrid structure intermediate between ionic and covalent configurations. We first consider a generic CT reaction A* + BC. In the entrance channel of the potential energy surface, the reactants canundergo a long-range CT that modifies the subsequent dynamics of the reaction. This very fast interconversion to an ionic-like transition state is referred to as a harpooning mechanism, and exhibits characteristic properties in the reactive scattering cross sections, 34 in the absorption spectra of CT complexes, 35 and in the femtosecond dynamics. 36'37 The separation of the transition state into products can then proceed along an ionic or a covalent potential. These properties are illustrated for the particular problem of Bz-I 2 in the potential energy diagram in Figure 14A.
Charge transfer, bimolecular reactions have been studied by femtosecond exci- tation of aligned van der Waals complexes. This method offers two principal benefits in detecting the transition state: (1) the collision time is precisely defined, and (2) the range of impact parameters is specified by the vdW geometry. 37'38 In Section 5 we discuss in more detail experiments that measure real-time and state-resolved angle-velocity properties of products from cluster photoexcitation. However, we introduce the technique of kinetic energy time-of-flight (KETOF) here because the experimental system studied B z,,/I 2 falls into the progression of reactions that we have outlined in the Introduction (i.e. from elementary to complex reactions).
3.1. Bzn/12
Overview and Results
The B z-I 2 complex in solution has been a prototype for studying charge transfer for many decades. 39'4~ The reaction may be viewed as a bimolecular reaction between benzene and 12 of the form:

22 JACK A. SYAGE and AHMED H. ZEWAIL
R (Bz-i)
(B)
i
B'"'2_.._._L e,,~, c ~ , (A)
Bz'*l 2
Bz+12 ~ l
Figure 14. (A) A schematic diagram showing the cuts on the potential energy surface (PES) along the Bz-I and I-I coordinates. The CT transition state is directly reached by the t = 0 fs pulse (~.*). The reaction proceeds through the exit channels either on the same CT PES shown in (A) or through nonadiabatic transitions, which lead to the I-I bond breakage. (B) A PES contour map of the Bz-12 CT state and a representative trajectory of the reaction on this PES (ref. 37).
Bz + 12 + hw ~ [Bz§ -..- I]** ~ Bz +- I- + I (3)
In the cluster experiment discussed here, excitation takes place directly to the collision complex as illustrated in Figure 14. The pump pulse excites the neutral ground-state complex to an excited CT state that induces a prompt electron transfer. This starts the Coulomb field attraction and subsequent collision that leads to products. The products are either Bz § I- + I or Bz - I + I. In either case, measuring the appearance of free I atom is a measure of the total rate from the harpoon region.
Experimental: The CT state was excited at 275 nm and other wavelengths. Reactions and products were probed by resonance ionization in a time-of-

Molecular Clusters 23
flight mass spectrometer (TOFMS). Iodine atoms from reaction were probed
by 2+1 REMPI at 304 nm. As the pulse had a bandwidth of 2 nm, both the
2P3/2 (I) and 2Pl/2 (I*) spin-orbit states are simultaneously detected. The laser system is similar to the one described in Section 2.1.2.
The transient for the appearance of free I atom is given in Figure 15; a time constant of 750 fs is observed. A schematic is also presented in Figure 15 to illustrate
the change in structure and charge as the complex evolves from neutral to CT state to transition state, and then to final products. The excitation to the CT state produces
a vibrationally excited, but bound 12 anion. An excursion involving nuclear coordi-
nates for Bz and 12 then takes place before break up into final products. The time constant of 750 fs indicates that the transition state lives for a few vibrational
t_ to t . t, I I I
', ~ -"[=750 :I:SO fs
. , I , I , I t . I . , _ I , I , 1 = I �9 - 5 0 0 0 5 0 0 1 0 0 0 1 5 0 0 2 0 0 0 2 5 0 0 3 0 0 0
, - . . . . ; ' - - 4
R e a c t i o n T i m e ( f s )
t-- to t , tf
Figure 15. The fs transient of free iodine atoms (open circles) following the Bz-12 complex excitation to its CT state by the 275 nm fs ( t - 0) laser pulse under the 1"1 complex condition (0.5 torr 13z). A single exponential fit (solid line) to this data with a response function convolution gives a rise time of 750 +_ 50 fs. The four panels at the bottom describe the structural changes of the axial geometry, illustrating the complex before t = 0 (t._), at t = 0 (to), in the harpoon region of the PES (t,), and following the final breakage to Bz+l - and I products (t f) (ref. 37).

24 JACK A. SYAGE and AHMED H. ZEWAIL
periods. An example trajectory illustrating the quasibound oscillations in the transition state is presented in Figure 14B.
A powerful added dimensionality to the experiment is the measurement of the product angle-velocity distribution. Figure 16 presents measurements of the 1D product velocity-component distributions for I atom recoil detected at specific angles. The complex here is o-xylene-I 2. The series of plots represent the velocity distribution as a function of delay time after excitation. One should note that the total signal increases with time, which is a measu:e of the rate of decay of the transition state to product. Examining more closely, one notices that the relative distribution of slow and fast I atoms changes with time. At longer time, the lower velocity component, which peaks at a translational energy of about 900 cm -l, increases relative to the fast component, which peaks at a translational energy of
I �9 " �9 I �9 " i " " " I �9 �9 ' I
Z=54.7 A)
1.4ps / t \ \ w ~
1.
o.4
! . . . . . . 1 , , , 1 L ~ , I
1600 8oo o .8oo .~8oo ,600
V z (m/sec)
I " ' ' I ' ' ' I ' ' ' I ' " ' i
(B) z_o o
L,t.YO''
~ 1 i i . 1 , , , I , , , I �9 �9 , I
800 0 -800 -1600
V z (m/sec)
Figure 16. Time-resolved, KETOF distributions of iodine atoms resulting from the o-xylene-12 reaction measured at a series of pump-probe delay times. Pump laser polarization is (A) at the magic angle and (B) at 0 ~ (parallel) with respect to the TOFMS axis. The pump-probe delay times are indicated for each distribution (ref. 37).

Molecular Clusters 25
about 5000 cm -1. In terms of formation rates, the high- and low-velocity compo- nents rise with time constants of about 450 ps and 1.4 ps, respectively. The anisotropy of the low- and high-velocity components is about 0.2-0.3 and 0.7-1.0, respectively.
Transition-State Geometry
An interesting issue is the structure of the transition state at the instant of excitation by the pump pulse. There is now strong experimental and theoretical evidence that 12 lies perpendicular to the aromatic ring in what is called the axial geometry. 41'42 This is to be compared to the "resting" or parallel geometry originally suggested by Mulliken. 4~ The measured I atom recoil anisotropy, however, tells a different story. For a strictly axial geometry, there is no transition moment perpen- dicular to the benzene ring. In this case, the transition moment, in the plane of benzene, would be perpendicular to the recoil direction of the I atom, which would then have a limiting anisotropy value for [3 o f - 1 . The measured values of 13, however, were positive. For the resting, in-plane geometry, the transition moment can be shown to also be perpendicular to the recoil direction, again in contradiction with the measured anisotropy.
The experimental results are understood by considering an oblique geometry. In simple terms, the two transition moments la01 and I.tll, which are parallel and perpendicular to the benzene ring and associated, respectively, with the axial and resting structures, form a linear combination that can give a positive anisotropy for a specific range of oblique angles. For instance, an 12 tilt angle of 30-35 ~ between the ktll transition dipole and the recoil direction is 30-35 ~ corresponds to a predicted anisotropy of ]3 = +1. The oblique angle occurs because of the large vibrational amplitude for the I2-Bz torsion, even for the vibrationless level. The Wiersma group has noted that ktll is typically much greater than l.t01, except at precisely the axial geometry where it goes to zero. 43 Hence the excitation prob- ability increases dramatically for tilt angles away from axial. This means that the transition state is formed at an oblique angle. The velocity distributions for both the I and I* have recently been studied by Young's group and are consistent with those
44 of the Caltech group.
Dynamics and Mechanism
The transition-state entrance channel may be described as follows: At time zero, the system is excited to a CT state creating an instantaneous Coulomb potential along the Bz-I coordinate that launches the reaction (Figure 14A). The sudden charge separation creating the attractive force is what is referred to as the harpoon mechanism. The Bz and 12 reactants undergo large amplitude collective vibrational motion (Figure 14B). The 12 also begins to vibrate to reach a new equilibrium bond length for 12 .

26 JACK A. SYAGE and AHMED H. ZEWAIL
The transition state, in less than 1 ps, enters the exit channel where it then branches into two major product channels: the ionic route Bz§ - + I and the neutral route BzI + I (there are other minor channels relating to different spin-orbit states of BzI and I, etc.). There have been many observations of the ionic channel in bimolecular encounters in the gas phase and in weakly bound complexes. Good examples include Rg* + X 2 (Rg: rare-gas atom; X2: molecular halogen) 45 and the harpoon reactions M + X 2 (M: alkali metal atom). 46
For the Bz-I 2 system, the neutral product channel lies about 2.6 eV lower in energy than ionic channel. A determination of the branching channel was made by an analysis of the I atom recoil velocities. At 277 nm excitation, the available energy in the ionic channel is about 0.4 eV (3200 cm-l). Based on recoil kinematics, the maximum translational energy available to the I atom is about 2000 cm -1. The peak translational energy would lie below this value due to internal excitation of the Bz+I - product. The experimental translational energy distributions for product iodine atom gives peaks at about 1000 cm -l and 5000 cm -1. The high-energy component is inconsistent with an ionic channel, as it exceeds the allowable energy available. These results suggest that the neutral reaction channel dominates and occurs as a result of back electron transfer. The low translational energy component is assigned to a one-molecule caging product. The basis for this conclusion is: (1) the recoil anisotropy is much lower than that for the high translational energy I-atom compo- nent, and (2) the low-energy component has a much slower rate constant for formation than the high-energy component, at least for o-xylene-I z, the system studied by time-resolved KETOE
Bz~I2
The effect of further solvation of 12 was investigated by increasing the pressure of Bz in the gas mixture. In Figure 17, the ab initio structure for Bzn/I 2 indicates that for relatively small solvent clusters the 12 lies on the surface of a Bz,, cluster; in other words an incomplete solvent shell. For larger solvent clusters, a complete solvation of 12 eventually ensues. The time dependence for I atom release was recorded for increasing cluster size distributions and exhibits behavior consistent with the ab initio structure calculations. In Figure 18, transients are shown next to the corresponding TOFMS. There is a distinct trend with increasing solvation for the I atom escape to slow down and for a second longer time component to grow in. In 1:1 complexes, the fast time component was found to be a composite of two dynamical events that are distinguishable by monitoring the I atom rise as a function of translational energy. The rise time for high- and low-energy I atoms was measured to be 450 fs and 1.4 ps, respectively. The high-energy I atom represents uncaged prompt dissociation, whereas the low energy indicates a collision or a caged dissociation, albeit a one-molecule cage effect for the 1:1 complex. For larger clusters this caged dissociation increases only moderately in Figure 18, indicating

Molecular Clusters 27
Figure 17. Molecular structure of 12/Bzn based on the results of ab initio (1:1 complex) and empirical (1 :n) potential calculations (ref. 116).
that some 12 lies on the surface of the solvent cluster, consistent with the calculated structure in Figure 17.
As the cluster size increases, a second long-time component becomes evident, increasing in intensity and time (from 19 to 75 ps in the examples in Figure 18). These dynamics are consistent with an I atom that is completely solvated. Caging of the dissociated I atom involves a cluster of solvent molecules, significantly slowing the escape of an I atom. For these larger clusters, the I atoms can become trapped and recombine. The different time constants measured in small and large clusters using kinetic energy analysis provide important insights into solvent structure, collisional interactions, and cage escape dynamics. Molecular dynamics simulations support the microscopic picture.

28 JACK A. SYAGE and AHMED H. ZEWAIL
3
n=l
_ _ l : ; L UL .....
n iin i nl Nun mnun n
Mass Spectra 4 Bzn'I2
5 6 e
d /
, | ! - ,_l._ . . | . ,,, . . . . .
b I I
- - - I . . . . . r - - " - ? - { . . . . . . L - l - - - - - ~ ' - . . . . - . . . . . . . . - - - - - - - - "
a
_ ~ _ k __ 1 . . . . . . . . . . . . . . .
�9 ' " " " ' i ' r-- , .=, I " ,t., �9 �9 I ' " " " �9 " ' I " " " " " " ' I " " " " " I . . . . I "
25 30 35 40 45 50 55
Time of Flight (ps)
Figure 18. (A) TOFMS and corresponding transients for I atom detection as a function of benzene vapor pressure in the gas mixture" (a) 0.5 tort, (b) 1.3 torr, (c) 3.3 torr, (d) 9.5 torr, and (e) 24 torr. (continued)

Molecular Clusters 29
e
a
J 0.75 ps
I " ' ' i . . . . i " " ' i " " " I " " " I ' ' ' I ' " "
-2 0 2 4 6 8 10 12
20 ps
~ . r ~ - - ~ . . = w - = _ r - - - . . ~ , ~ - ~ v ( b p = l U r ~ t ; ~ "
19 ps
�9 " I " " ~' " I . . . . I " t ' . . I . . . . I " "~ " " "
0 50 100 150 200 250
Reaction Time (ps)
Figure 18. (Continued) The experimental transients were fitted to a biexpo- nential function (ref. 37).

30 JACK A. SYAGE and AHMED H. ZEWAIL
B too
90
80
70
60 A r
| 50 E p
40
30
20
10
0 I I I ,. I . . I I I I I I , J
0 1 2 3 4 5 6 7 8 9 10 Distance (A)
Figure 18. (B)" MD simulations based on the results in Figure 17.
Comparison with Liquid Phase
Femtosecond measurements of the dynamics in liquids have been conducted by the groups of Wiersma 43'47 and Sension. 48 The former group focused on I2/mesity- lene and I2/toluene excitation at 310 nm (blue edge of the CT band) and the latter group on I2/mesitylene at 400 nm (the red edge). Both groups recorded transient absorption spectra over the range of about 400-700 nm. The Wiersma group measured a 25 fs transients assignable to the D-I photoproduct (where D is the aromatic electron donor) and to 12. The ratio of D-I to I-I bond breaking was reported to be about 1:3. The Sension group observed similar transient absorptions that were fully developed by 500 fs and had a time scale of <250 fs. The slower time scale for reaction in the latter work may be due to the longer wavelength excitation.
At comparable excitation energies, the transient absorption signal in liquid appears faster than does the high-energy I atom product in the results on the vdW complex. The different time scale can be partly explained by the D-I transient absorption signal which develops before complete I-I bond breaking that is required to detect free I atom. Bulk solvent-solute interactions may also account for faster dissociation. Transient absorption spectra in the liquid and gas phase

Molecular Clusters 31
assign the product to D- I and not D§ -, which is consistent with the conclusions of Bz-I 2 from I atom recoil velocity measurements.
Some information on solvent caging is obtained from a comparison of the results from the Caltech group 37 and the Wiersma group. 47 The latter liquid work revealed a slower rise following the initial 25 fs rise in the transient absorption traces. This was attributed to solute-solvent geometries in which the product I atom was launched into another solvent molecule to form D-I. The analog in isolated complexes is the low energy I atom that rises with a longer time constant than the high-energy I atom. The low-energy I atom results from an interaction with a second solvent molecule (e.g. Bz2-I2). Translational energy is lost and cage escape is delayed in the collision process. In liquid, the presence of many solvent molecules further cools the translational energy of the I atom to the point that it then combines with an aromatic solvent molecule.
4. PROTON TRANSFER
Excited-state proton transfer is a prototypical "large chemical system" that has been studied in clusters and condensed phase. The first spectroscopic study of ESPT in a cluster was reported by Leutwyler, Cheshnovsky, and coworkers for 1- naphthol(NH3),,. 49'5~ These experiments were important because they showed that it is possible to investigate how individual solvent molecules progressively stabilize the product states.
The dynamics in real time were first reported for naphtho151'52 and phenol 53-59 complexed to a variety of solvents. The Syage lab reported on picosecond dynamics of ESPT of phenol (PhOH) complexed to various solvents. 53-59 Several issues have been investigated: solvent dependence on rate, 7-9'53 cluster ion properties, 54'55 ESPT in phenol dimers, 56 structural effects, 56 photoelectron studies of solvent reorganization, 58 and the mechanism of proton tunneling. 7'59 The Zewail group 51'52 and the Bernstein and Kelley group 6~ have been studying similar properties for naphthol (NpOH). These studies have recently been extended by Caltech group to the femtosecond domain. 52 These investigators found that for 1-NpOH(NH3) n the minimum number of solvent molecules necessary to observe ESPT is n = 3. Our measurements for PhOH(NH3) n gave a corresponding value of n = 5. The difference in the critical ammonia solvent size for ESPT for phenol vs. 1-naphthol is consistent with the difference in acidity of the two Sl-excited aromatic acids (pK a of 4.1 and 0.5, respectively). 61
In a related series of experiments, Brucker and Kelley measured proton transfer rates in small solvent complexes formed in cryogenic argon matrices. 62 They observed similar solvent-size dependences for 1-naphthol-ammonia; however, the rates differed from that of the isolated clusters formed in molecular beams, presumably due to the polarizability of the Ar matrix. The above studies, which we discuss in more detail later in this review, are important because they can be related

32 JACK A. SYAGE and AHMED H. ZEWAIL
to the large literature of ultrafast studies of ESPT in solution by the groups of Robinson, 63 Barbara, 64 Huppert, 65'66 Clark, 67 Kelley, 68 and others.
4.1. ROH'/Bn
Background
Aromatic alcohols are more acidic in their S 1 state than in S 0. Photoexcitation, therefore, increases acidity giving rise to the term pH jump. 65 Excited-state proton transfer (ESPT) reactions have been studied extensively in the condensed phase including several time-resolved experiments. 63-68 These reactions are strongly solvent-dependent, largely because of the neutral acid AH (or AH ~ and the conjugate base A- (or A*-) which tends to be stabilized differently by the solvent. Hence, the acidities of the ground and excited states can change markedly with different solvents.
We represent proton transfer from the aromatic acid ROH (R = naphthyl or phenyl) by,
ROH*B~ --~ RO*-H+B,, (4)
which corresponds to a conversion from a locally excited S 1 state with a covalent O - H bond to an excited ion-pair state. B, refers to the solvent cluster consisting of n molecules of base B. A qualitative picture of the cluster potential energy curves for ground, excited, and ionic states is given in Figure 19 along with the pump-probe excitation/detection scheme used to measure the chemical rates. Figure 19 also shows representative ion energy distributions, measurable by photoelectron spec- troscopy. Representative excited-state reactant decay and product formation are shown in the insert. The product formation signal is due to dissociative ionization of the excited-state product to giving a detectable yield of NH~(NH3) m. This channel is minimal for reactant, and for some unknown reason does not occur for excited reactant or product for NpOH B, clusters.
Basicity and Solvent Size Dependence
There is now a fairly large collection of rate measurements for phenol and 1-naphthol in a variety of solvent clusters from which to learn about fundamental interactions of solvent molecules. Figures 20 and 21 show a series of excited state reactant decay curves for the phenol and 1-naphthol systems. The phenol results in Figure 20 show a distinct onset to reaction at n = 5 ammonia molecules. 7-9'53 The 1-naphthol results in Figure 21 show a threshold at n = 3. 51'52 A similar conclusion in the latter case was reached for measurements by Bernstein, Kelley, and cowork- ers. 6~ The PK~a values (i.e. the negative logarithm of the equilibrium constant K a for acid dissociation) of excited state 1-naphthol and phenol are 0.5 and 4.1, respec- tively, which converts to an enthalpy difference of 0.22 eV. 61 Thus, additional ammonia solvent molecules are required to stabilize ESPT in phenol compared to

Molecular Clusters 33
1-naphthol. If the rates of ESPT for NH 3 solvation in Figures 20 and 21 are plotted versus n, the resulting curve takes on a shape and inflection that is suggestive of an acid-base titration curve. Indeed, mass-specific, time-resolved cluster experiments correspond to single molecule titration measurements.
Measurements of ESPT in other solvents show striking differences compared to ammonia solvation. In Figure 20 no reaction is observed for PhOH(CH3OH) . up to n = 11. Water is also inactive for these moderate cluster sizes for phenol and for 1-naphthol. Knochenmuss et al. report reaction occurring in 1-naphthol(H20),, 69 but the thresholds are several hundred water molecules and the rates are on the nanosecond, not picosecond, timescale. For more basic solvent molecules, small
t,._
W
4.
[ Pheoo, ESPT I . __ * ~
4. I / ~ ' " PhOH+(NH3)J
" - H + B PhO n
PhOH B n ~ ~ ' ~ - ' " ~ ' " ~ ~
PhO-H" B Coordinate n
Figure 19. Schematic energy diagram for PhOH(NH3)n (consistent with n = 5). The pump and probe pulses are denoted as ,kl and ~2, and the excited-state proton transfer and solvent reorganization rate constants are given by k and ks, respectively. Approximate photoelectron band shapes are shown by the shaded areas. The ion signals for reactant and product are given in the insert and show matching kinetics (ref. 7).

34 JACK A. SYAGE and AHMED H. ZEWAIL
Cn
b3
i �9 i �9 i �9
4
5 5 ps 5
�9 65 ps 6
!
0 200 400 600
i �9 I �9 1 �9
, ....
_ .~./..-V" ..-..'....-..:y." "i-'- 2
, , 11
0 200 400 600
Time (ps)
Figure 20. Picosecond measurements of PhOH*Bn for B = NH3 and CH3OH using 266-nm pump and 532-nm, probe. The calculated curves for CH3OH solvation assumes a lifetime of 10 ns (ref. 53).
D "2 :D
e.,
r.#2
o
I-NpOH'(NH3) n
I " " " " " " " " " " " "" " n - I
: ~ - . . . .- . .
" ' ' " n - 2 ( A )
~ " " ' " ' " - " - " ' ' " ~ " " ' ~ - " n - 2(13)
n - 3
; 1 - 4
1 - N p O H ' ( H 2 0 ) n
~ ' B v .
. . . . . . . . . n - 1 3
I I i i i i
-0.5 0 0.5 1 !.5 2 2.5 -0.5 0 0.5 1 1.5 2 2.$
T i m e (ns) T i m e ( n s )
Figure 21. Picosecond measurements of 1-NpOH*Bn for B = NH3 and H20. 2A and 2B refer to different geometries for n = 2 ammonia molecules. Pump excitation was near the $1 origin and probe excitation was near the ionization threshold (refs. 51, 52).

Molecular Clusters 35
solvent-size thresholds for reaction are observed. In phenol, ESPT was observed for trimethylamine solvent at n = 3, and for hydrazine at n = 5. 53 In 1-naphthol a reaction was observed at n = 2 for piperidine solvent and not for water up to n = 20. 52
How do these cluster rates compare to condensed-phase measurements? The ESPT lifetimes in PhOH and 1-NpOH in ammonia are in the 20-100 ps range depending on vibrational energy. No measurements in bulk ammonia have yet been made. In water solution, the groups of Robinson and Clark measured room temperature lifetimes of about 40 ps for 1-NpOH. 63'67 In other condensed-phase systems, the ESPT rate is over an order of magnitude slower for 2-NpOH in water or for 1-NpOH in methanol or ethanol.
A mixed solvent system that strongly governs phenol reactivity is NH3/CH3OH. 53 Reaction rates for different solvent distributions of similar cluster size are presented in Figure 22. The substitution of a single CH3OH molecule for an NH 3 molecule causes a substantial decrease in reaction rate. Excited phenol in neat NH 3 solvent cluster (n,m) = (6,0) reacts in 65 ps whereas the (5,1) cluster reacts in 750 ps. Considering that the (5,0) cluster reacts in 60 ps (cf. Figure 20), the (5,1) result indicates that the addition of a single CH3OH molecule quenches the reactivity of the (5,0) cluster. This is surprising because it implies that the aggregate proton affinity of the solvent is somehow reduced by the addition of CH3OH. These results
' ! ! �9 | i l . r !
�9 l ehOH+ (NH3)n(CH3OH)m 1
~ n,m l _ ] ~ ' ~ : , : ~ , - ~ - - ~ 65ps 6,0
~ .~ " " "'" "" ." . . ". 750 ps 5,1
�9 . ' . .
0,6
~
I , . I . . , I J I �9 - -
0 200 400 600 Time (ps)
Figure 22. Picosecond measurements of PhOH*(NH3)n(CH3OH)m using 266-nm pump and 532-nm probe (ref. 53).

36 JACK A. SYAGE and AHMED H. ZEWAIL
highlight the importance of solvent structure. The concept of critical solvent structures in ESPT reactions has been investigated in the solution phase by Robin- son and coworkers. 62 Their picosecond measurements and theoretical analyses on aromatic acids (e.g. 1- and 2-naphthol) in H20 and alcohol (CH3OH and C2HsOH) support the notion that a critical solvent cluster core is necessary to act as an efficient proton acceptor. For 2-naphthol in H20, the critical solvent-core size is reported to be about four. 63
Energetics
A simple description of the energetics of ESPT can be visualized by starting from CT states in gas-phase molecules. 53 CT states generally occur at high energy. In phenol and naphthol, the relevant states are expected to lie at very high energy relative to the covalent S O and S l states because of the large energy required to form a free proton (the H atom ionization potential is 13.6 eV. The ion-pair state(s), which has large proton character, is stabilized strongly by complexation of phenol to molecules with high proton affinity. The lowering in energy of the ion-pair states by the first solvent molecule is comparable to the proton affinity of the solvent molecule (which is 8.8 eV for NH37~ Each additional solvent molecule contributes less and less stabilization (the stepwise proton affinity71'72); however, the cumula- tive stabilization by a few solvent molecules can lower the ion-pair state to energies comparable to that of the S l state, thus making ESPT thermodynamically allowed.
Solvent Reorganization
Here we consider what happens to the solvent structure after reaction occurs and, in so doing, consider the dynamical properties of the solvent. When proton transfer occurs, the solvent is no longer at equilibrium. The formation of a large product dipole is expected to exert a force on the solvent leading to further dynamics. For simplicity, we consider that reaction and solvent dynamics are separable, that is,
PhOH*...B~ k---T-+ [PhO*-.-.H+Bn]ur ~ [PhO*-'"H+B~]r s
(5)
where the subscripts ur and r denote unrelaxed and relaxed solvent configurations and k s is the solvent reorganization rate constant (cf. Figure 19).
Time-resolved ionization efficiency. The product formation curves for NH~ (NH3) m in the phenol/solvent,, studies showed two time dependences: a rapid rise matching the decay of the PhOH+(NHa)n signals (55-70 ps), and a much slower growth component of about 300 ps. 7-9'53'58 The fast time response is due to the ESPT reaction. The slow time response is ascribed to solvent cluster reorganization. For 1-NpOH(NH3),, a two component time dependence is observed for the excited state decay, which is attributed similarly to ESPT and solvent reorganization. The

Molecular Clusters 3 7
reorganization time varied from 200 ps to 3 ns depending on excitation energy and number of NH 3 molecules. 51'52'6~
Time-resolved photoelectron spectroscopy. A more detailed probe of ge- ometry change is obtained by monitoring the individual FC components to ioniza- tion by time-resolved photoelectron spectroscopy. 58 Photoelectron spectra are plotted in Figure 23a for different probe delay times. The spectra are broad because of the distribution of cluster sizes, large density of low-frequency modes, rapid vibrational redistribution, and large geometry change upon ionization. However, there is a general shift in the band with time reflecting the change in Franck-Condon factors for ionization as the solvent geometry in the excited-state product evolves. This method is analogous to the time-dependent Stokes shifts of emission bands in studies of solvent relaxation in the condensed phase. 73-76
The time dependence for the low-energy and high-energy photoelectron bands (gates A and B) is plotted in Figure 23b. The low-energy band (ions of high internal energy) increases rapidly in intensity and then decays at a slower rate. The high-energy band (ions of low internal energy) shows a corresponding slow rate of increase. These observations support the interpretation of a Franck-Condon distri- bution that changes with time due to solvent reorganization.
(o) (b) A B j - s
- 1 0 0 ps
J , . l ,- . . I I
0.0 1.0 2.0 3.0 (~v)
~ ~ ~
A
I
- 1 o o o 1oo 200 ~oo t(ps)
Figure 23. Time-resolved photoelectron spectra as a function of pump-probe delay time t. (a) Difference spectra corresponding to (pump + probe) - (pump). Gate widths are constant in time. (b) Observed time-dependences of the low-energy (gate A) and high-energy (gate B) photoelectron bands are plotted. Fitted curves were calculated for rate constants k = (50 ps) -I and ks = (300 ps) -I and spectral parameters discussed elsewhere (ref. 7, 58).
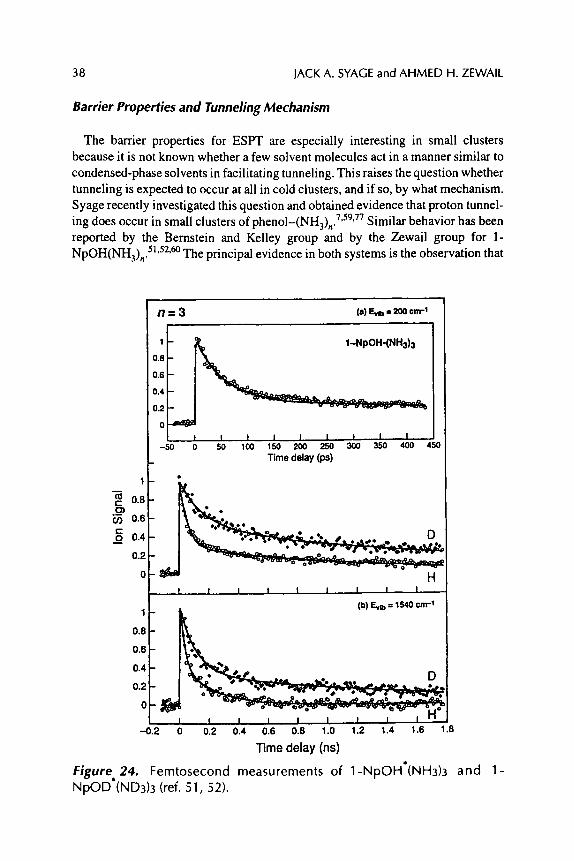
38 JACK A. SYAGE and AHMED H. ZEWAIL
Barrier Properties and Tunneling Mechanism
The barrier properties for ESPT are especially interesting in small clusters because it is not known whether a few solvent molecules act in a manner similar to condensed-phase solvents in facilitating tunneling. This raises the question whether tunneling is expected to occur at all in cold clusters, and if so, by what mechanism. Syage recently investigated this question and obtained evidence that proton tunnel- ing does occur in small clusters of phenol-(NH3)n. 7'59'77 Similar behavior has been reported by the Bernstein and Kelley group and by the Zewail group for 1- NpOH(NH3),,. 5]'52'6~ The principal evidence in both systems is the observation that
n -- 3 (=) E ~ = 200 cm-~
1 - ~ I_NpOH.(NH3) 3 0 . 8 -
0 .6
0.4 I - * " " ~ ' ~ ' ~ + - - - + ~ " ~ . ' Z ~ . . . . . . . . -~---~-,,~- 0.2 - l �9 Q, o~,o,--.-o,.-
0 I i ! i 1 ! I i i
-50 0 50 100 150 200 250 300 350 400 -450 Time delay (ps)
1 - �9
. . - , ,
r-(O 0.8 " �9
0.6 o
0 0.4
0.2
o H
(b) F-v.~ = lS40 cm-+ 1
0.8
0.6
0.4 "
0 ~ . ~ , , o _ 0 - ~ 0 �9 v
0
-0 .2 0 0.2 0.4 0.6 0.8 1.0 1.2 1.4 1.6 1.8
Time delay (ns)
Figure, 24. Femtosecond measurements of 1-NpOH*(NH3)3 NpOD (ND3)3 (ref. 51, 52).
and 1-

Molecular Clusters 39
the transfer rate for a deuteron is nearly an order of magnitude slower than for a proton, as seen in Figure 24.
Work is in progress to develop a model of proton tunneling in clusters that can be made applicable to condensed-phase systems in order to draw direct comparisons between these two very different solvent systems. A proton tunneling model in clusters has been described in detail elsewhere 7'59'77 and an abbreviated treatment is presented in the Appendix. In essence, it adapts the concepts of condensed-phase tunneling 78-8~ to a state-to-state treatment based on radiationless transition theory. 81 For the present chapter it suffices to understand qualitatively what elements are in the theory and why they are important. These are summarized in Figure 25. A minimum of four nuclear coordinates is needed: (1) the O-H coordinate qt4, which is the reaction coordinate, (2) the O-N coordinate QN, in which the O...N symmetric stretch modulates the internuclear distance between potential minima, which in turn modulates the barrier height and width, 78'79 (3) the solvent coordinate S, in which solvent modes cause fluctuations in the relative energies of reactant and product, 8~ and (4) coordinates corresponding to product accepting modes that reduce the electronic energy gap between reactant and product. 81 All coordinates, except for S are treated quantally. One does not expect quantitative agreement between theory
�9 O - H Coordina te
/1
O-H
�9 S o l v e n t coord ina te
Classical Marcus -AG"
�9 0 - - - N s y m m e t r i c s tre tch
W xo+Ax
w,= ~W(x) L , ( x ) ~
�9 Produc t v i b ra t i ona l coupl ing o
/ ~ 1 7 6 ' / fC~ ~, ~ ""~2'
0 t l p
Figure 25. Diagrams that qualitatively show the important nuclear coordi- nates used in the present tunneling model. Terms not defined in the text are as follows: VH, a, m, and U are O-H frequency, barrier width, reduced mass of tunneling particle, and barrier height, respectively. FC are Franck-Condon factors for a vibrationless reactant where cz is for the O-H vibration, and 13i are for all other modes i. m and n are quantum numbers for reactantand product, respectively (ref. 77).
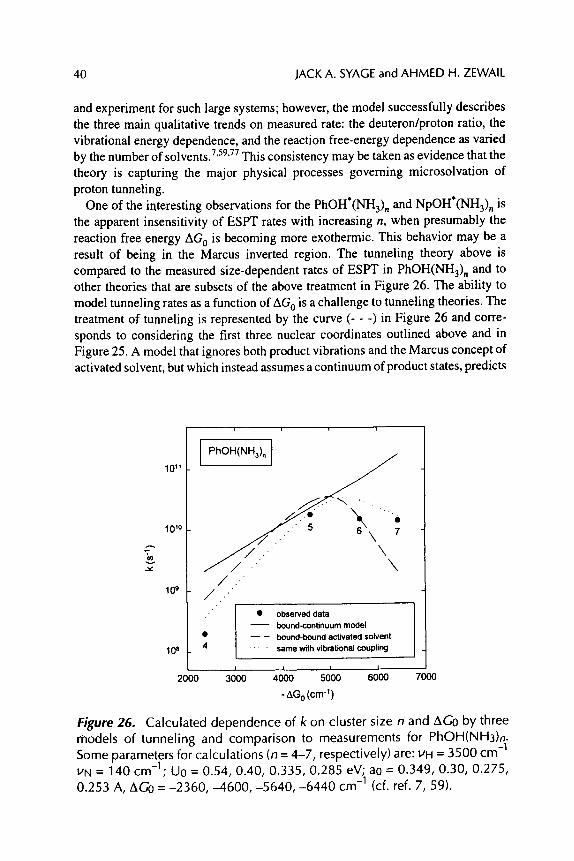
40 JACK A. SYAGE and AHMED H. ZEWAIL
and experiment for such large systems; however, the model successfully describes the three main qualitative trends on measured rate: the deuteron/proton ratio, the vibrational energy dependence, and the reaction free-energy dependence as varied by the number of solvents. 7'59'77 This consistency may be taken as evidence that the theory is capturing the major physical processes governing microsolvation of proton tunneling.
One of the interesting observations for the PhOH*(NH3) . and NpOH*(NH3),, is the apparent insensitivity of ESPT rates with increasing n, when presumably the reaction free energy AG O is becoming more exothermic. This behavior may be a result of being in the Marcus inverted region. The tunneling theory above is compared to the measured size-dependent rates of ESPT in PhOH(NH3) . and to other theories that are subsets of the above treatment in Figure 26. The ability to model tunneling rates as a function of AG O is a challenge to tunneling theories. The treatment of tunneling is represented by the curve (- - -) in Figure 26 and corre- sponds to considering the first three nuclear coordinates outlined above and in Figure 25. A model that ignores both product vibrations and the Marcus concept of activated solvent, but which instead assumes a continuum of product states, predicts
v
10+1
10+o
10 9
10 a
i i i !
[ PhOH(NH3)n ]
.,,~... �9 �9 '<,~ ........ ..e " e
/ . . " \
~ ."
~ ."
�9 observed data bound-continuum model
- - - bound-bound activated solvent . . . . . same with vibrational coupling
' ' o'oo 2000 3000 4 0 0 0 5000 6 7000
- A G o ( c m "1 )
Figure 26. Calculated dependence of k on cluster size n and AGo by three models of tunneling and comparison to measurements for PhOH(NH3)n. Some parameters for calculations (n = 4-7, respectively) are" VH = 3500 cm -1 VN = 140 cm -1" Uo = 0.54, 0.40, 0.335 0.285 eV; ao = 0.349, 0.30, 0.275 ! ! I 0.253 A, AGo = -2360, - 4 6 0 0 , - 5 6 4 0 , - 6 4 4 0 cm -1 (cf. ref. 7, 59).

Molecular Clusters 41
a continuously increasing tunneling rate with -AG 0. This calculation is represented by the curve (w) in Figure 26 and corresponds to considering the first two coordinates outlined above. The model that includes all four nuclear coordinates is represented by the curve ( . . . ) in Figure 26 and gives the best agreement with experiment. This treatment is also consistent with experimental measurements of the dependence of k on internal vibrational energy and on deuteration.
The phenol/NH 3 cluster systems have been the subject of some theoretical investigations. Yi and Scheiner carried out ab initio calculations of the potential energy surfaces for ground and excited and ionic electronic states of PhO-H-NH 3 that has helped elucidate the barrier properties for ESPT. al The calculated S 1 potential barrier is in reasonable agreement with the barrier deduced above for relating the experimental rates with a tunneling model. Siebrand and coworkers conducted structure calculations on the PhOH(NH3) n system to help understand the buildup of the solvent shell, particularly to understand if there is a special structure at five solvent molecules to explain the onset to reaction. 82 They generally find that the solvent bonds in chains and loops and that the loops are arranged to maximize the bonding between the reactive and the rest of the molecule. These results are in accord with experiment that indicates that up to 5 NH 3 form bonds off the reactive site by solvent-solvent bonds as opposed to some solvent molecules bonding independently to the aromatic ring. The structure calculations further show that the geometry for the reactant and product clusters (i.e. pre- and post-proton transfer) differ markedly. The slow solvent relaxation measured by time-resolved photoelec- tron spectroscopy is in agreement with their calculations.
4.2. Double Proton Transfer
The 7-azaindole dimer (7-AI) has been extensively studied because its structural specificity can serve as a model for DNA base pairing. A particularly interesting topic is whether excitation conditions that might change the hydrogen-bonding properties can disrupt base pairing to the extent that errors occur in DNA replica- tion. In particular, 7-AI dimer is known to undergo a double-proton transfer upon electronic state excitation. The pioneering work by Taylor, E1 Bayoumi, and Kasha in the condensed phase revealed red-shifted fluorescence indicative of a tautomer structure. 83 Picosecond, then femtosecond measurements have been made of this fast process in solution; an excited-state lifetime of 1.4 ps was measured for 7-AI excitation in hexadecane solution at room temperature. 84
In a series of papers, Fuke and Kaya and coworkers measured fluorescence excitation spectra of 7-AI dimer and other analogs in free-jet expansions. 85 One of the more remarkable observations was an apparent mode specificity to the rate of ESPT wherein the N...N intermolecular mode showed dramatically enhanced line intensities in the excitation spectra recorded when monitoring the tautomer fluo- rescence. These observations are consistent with vibrational barrier compression discussed in the tunneling model above. We describe this further shortly.

42 JACK A. SYAGE and AHMED H. ZEWAIL
The dynamics of bond breaking have only recently been measured. The Zewail group measured jet-cooled 7-AI dimer excited-state decay in a time-of-flight mass spectrometer using femtosecond pulses; 305-310 nm for excitation and 620 nm for ionization from the excited-state surface. 86 One of the principal questions regarding double-proton transfer, and more generally for all reactions involving multiple- bond reformation, is whether the reaction proceeds in a concerted, simultaneous manner, or whether it occurs in a series of steps. The latter possibility is illustrated in the sequence shown in Figure 27. The femtosecond transients recorded for the 7-AI dimer are presented in Figure 28. There is a distinct double-exponential decay that occurs at two different excess energies. These results are consistent with a stepwise proton transfer (i.e. an asymmetric reaction coordinate). The transients in Figure 28 were described as representing a fast single proton transfer to an intermediate state shown in Figure 27 that is asymmetric, followed by a second, slower proton transfer leading to the final, long-lived tautomer state.
Measurements were also conducted on deuterated species to test for the involve- ment of a tunneling mechanism. At 1 kcal/mol excess energy, the protonated dimer gave time constants of 360 fs and 1.7 ps, compared to 3.0 ps and 25 ps for deuterated dimer. 86 These values are consistent with a tunneling process through a double-well potential. Based on this model, a lower limit to the barrier height of 2.6 kcal/mol was derived for the second step. The barrier height for the first step is assumed to be less than the second step. Some interesting questions that remain are: (1) why is the ionization efficiency from the tautomer significantly less than from the reactant excited state, which leads to a transient decay, rather than a plateau or even a rising signal, and (2) is there any time-resolved evidence for the apparent mode-specific rate of tautomer formation reported by Fuke and Kaya?
In an attempt to answer these questions, Soep, Syage, and collaborators measured photoelectron spectra of 7-AI following subpicosecond excitation. 87 With regard to the first issue, it was observed that the tautomer excited state has poor Franck-Condon overlap with the corresponding dimer ion, consistent with the time-resolved data. The reason for this behavior is not yet known. The second question requires a sufficiently narrowband short pulse to resolve the bands
Base pair Intermediate Tautomer
Figure 27. Molecular structures showing two-step, or one-step, cooperative double proton transfer of the base-pair 7-azaindole dimer (ref. 86).

Molecular Clusters 43
. . . . ! - - - ' - i . . . . | . . . . i . . . . ! . . . . ' i . . . .
, . ~ J . . . . . . o , R
C :3 E',
o , , m -E = , =
C: g'3 C: O
b ..., E = 1.5 kcal mol -'1
"C = 920 fs
C E= 0 kcal mo1-1
~ = 650 fs
Time (ps)
Figure 28. Femtosecond transients of 7-AI clirner: (a) excess energy of 1.5 kcal/mol, fitted to a double-exponential decay, (b) same data fitted to a single-exponential decay, (c)excess energy of 0 kcal/mol, fitted to a double- exponential decay (ref. 86).
that have components of the N--.N mode. This requires using pulse durations that are similar to the time constant of the event being measured. Consequently instead of scanning the delay between ultrashort pump and probe pulses, an alternative method was invoked. By varying pulse duration, the competition between reaction and ionization of reactant excited state can be varied, resulting in different ioniza- tion yields. In the photoelectron spectrum of 7-AI dimer, a 10-20 fold decrease in intensity was observed for 5 ps vs. 800 fs excitation/ionization pulses of the same pulse energy when exciting the origin band as shown in Figure 29. A model for deriving time constants from the intensity changes has been developed. These methods should enable a determination whether the reaction rates exhibit mode- specificity. 87 The results in Figure 29 are consistent with the femtosecond rates measured 86 (see Note Added in Proof, page 56).
Experimental evidence for mode-specific ESPT may be found in the work by Fuke, Kaya and coworkers on the double proton transfer systems involving dimers

44 JACK A. SYAGE and AHMED H. ZEWAIL
300
200
I00
e n e r g y in eV 3 2 1
_~m, 7,-,-~ r-T--,----,- I ,- _
"r = .8 ps
5
. . . . . . . . _L . . . . . . . . . . L ............. __L . . . . . J . . . . . . . . . , ~ 1 0 0 0 E 0 0 0 3 0 0 0 4 0 0 0 5 0 0 0
r l S
Figure 29. Photoelectron spectra of 7-AI dimer by pump-probe ionization at 310.1 nm for two different pulse durations, 0.8 ps and 5.0 ps (ref. 87).
of 7-azaindole (7AI) and 1-azacarbazole (1AC). 85 In these cases, the active mode QN is an N...N symmetric stretch. These frequencies are 120 and 114 cm -1, respectively, in the (7AI)2 and (1AC)2 dimer excited states. Reaction times for (7AI) 2 are typically longer than 1 ps for all modes except the QN mode where lifetimes of 0.5 and 0.2 ps were determined for 1 and 2 quanta, respectively. The double-proton transfer rates are much slower in (1AC) 2 dimers, but a strong mode-specificity is still observed. Reaction times of 330, 130, and 65 ps were measured for 0, 1, and 2 quanta, respectively. Other modes had lifetimes of about 300 ps. In both the 7AI and 1AC dimers, a strong deuterium effect was observed, which is further evidence of a tunneling mechanism.
The tunneling model outlined in Section 4.1 supports the apparent mode-speci- ficity observed for 7-AI dimer. Excitation of a single quanta of the N...N stretch predicts a nearly order of magnitude increase in rate relative to the origin. Vibra- tional relaxation is not included in the calculation, which may diminish the calculated mode enhancement.
4.3. (NH3)n and Na(NH3)n
As an example of the important progress being made in ultrafast measurements of cluster chemistry involving bimolecular processes, we mention the work from

Molecular Clusters 45
the Castleman group on the protonation reaction in (NH3),, clusters following electronic state excitation. 88 Since this work is presented elsewhere in this book, we describe it only briefly. A considerable amount of work has been reported on the mass spectra of (NH3),, cluster from single-photon,89 multiphoton,90 and electron ionization. 91 The formation of protonated clusters (NH3)m H§ clusters is prevalent in each case. From the single-photon and the electron ionization work, it is clear that an ionic proton transfer reaction occurs, namely (NH3)n + ~ (NH3)n_m_IH + + NI-/2 + m(NH3), with some evaporation. However, reso- nance multiphoton ionization opens up a pathway for neutral hydrogen transfer followed by ionization. The former and latter processes are reminiscent of the studies of ladder climbing vs. ladder switching which dominated studies in the early days of multiphoton ionization of molecules. For the specific case of ammonia, Castleman refers to the two paths as absorption-ionization-dissociation (AID) and absorption-dissociation-ionization (ADI), respectively. For long-lived electroni- cally excited intermediate states, one would expect the AID mechanism to domi- nate. However, for very short-lived states, such as the directly dissociative A state, the ADI mechanism may be operative.
By measuring various ionic products as a function of femtosecond pump-probe delay time, the Castleman group could deduce that indeed, for long-lived states, such as the C' Rydberg state, only the AID pathway occurred. 88 This is evident in
, , . - 0
0
o
x 0
o +~ o XA~ ~ ~ + + o
o Xx~ x
+ o. x
:II
0~+
' I _
-200 -1 oo
~ o ,~+
g O
x ~
I I
o NH4"
~, (NH3) 2"
+ (NH~)zH+
x (NH3).H*
e o
I . i I i l i , I i t L i , _
0 1 O0 200 300 400 500 600 700 800
Pump-Probe Delay Time (femtoseconds)
Figure 30. Pump-probe transient of ammonia clusters with both pump and probe pulses at 624 nm through the C' states of ammonia molecules (ref. 88).
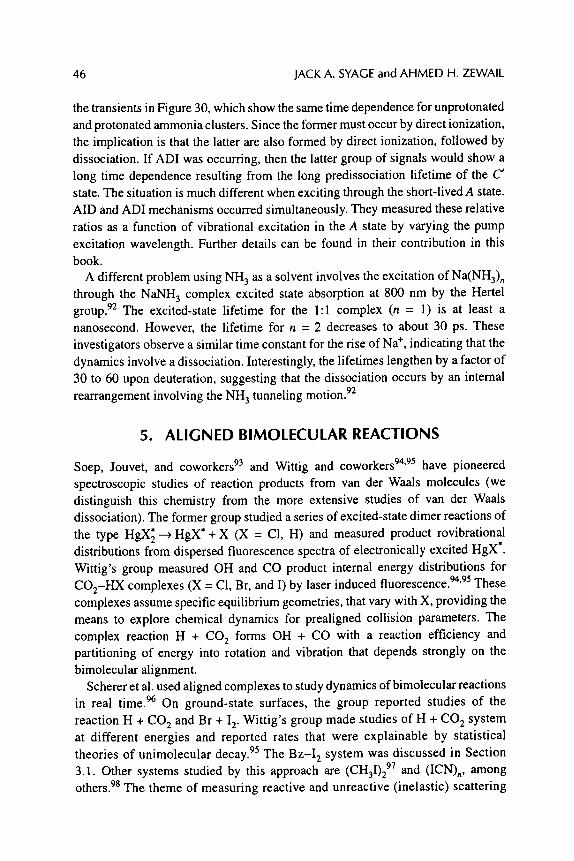
46 JACK A. SYAGE and AHMED H. ZEWAIL
the transients in Figure 30, which show the same time dependence for unprotonated and protonated ammonia clusters. Since the former must occur by direct ionization, the implication is that the latter are also formed by direct ionization, followed by dissociation. If ADI was occurring, then the latter group of signals would show a long time dependence resulting from the long predissociation lifetime of the C' state. The situation is much different when exciting through the short-lived A state. AID and ADI mechanisms occurred simultaneously. They measured these relative ratios as a function of vibrational excitation in the A state by varying the pump excitation wavelength. Further details can be found in their contribution in this
book. A different problem using N H 3 as a solvent involves the excitation of Na(NH3) n
through the NaNH 3 complex excited state absorption at 800 nm by the Hertel group. 92 The excited-state lifetime for the 1:1 complex (n = 1) is at least a nanosecond. However, the lifetime for n = 2 decreases to about 30 ps. These investigators observe a similar time constant for the rise of Na § indicating that the dynamics involve a dissociation. Interestingly, the lifetimes lengthen by a factor of 30 to 60 upon deuteration, suggesting that the dissociation occurs by an internal rearrangement involving the NH 3 tunneling motion. 92
5. ALIGNED BIMOLECULAR REACTIONS
Soep, Jouvet, and coworkers 93 and Wittig and coworkers 94'95 have pioneered
spectroscopic studies of reaction products from van der Waals molecules (we distinguish this chemistry from the more extensive studies of van der Waals dissociation). The former group studied a series of excited-state dimer reactions of the type HgX~---) HgX ~ + X (X = C1, H) and measured product rovibrational distributions from dispersed fluorescence spectra of electronically excited HgX'. Wittig's group measured OH and CO product internal energy distributions for CO2-HX complexes (X = C1, Br, and I) by laser induced fluorescence. 94'95 These
complexes assume specific equilibrium geometries, that vary with X, providing the means to explore chemical dynamics for prealigned collision parameters. The complex reaction H + CO 2 forms OH + CO with a reaction efficiency and partitioning of energy into rotation and vibration that depends strongly on the
bimolecular alignment. Scherer et al. used aligned complexes to study dynamics of bimolecular reactions
in real time. 96 On ground-state surfaces, the group reported studies of the
reaction H + CO 2 and Br + 12. Wittig's group made studies of H + CO 2 system at different energies and reported rates that were explainable by statistical theories of unimolecular decay. 95 The Bz-I 2 system was discussed in Section 3.1. Other systems studied by this approach are (CH3I)297 and (ICN) n, among others. 98 The theme of measuring reactive and unreactive (inelastic) scattering

Molecular Clusters 47
in bimolecular collisions initiated in aligned vdW complexes is also being applied to the study of O3-H20 complexes. 99
The Syage lab has been studying reaction dynamics in aligned complexes by monitoring product internal state, translational energy, and recoil angle. Whereas ultrafast techniques probe right in the transition state region of the potential energy surface, the product state-resolved probe looks at total energy partitioning resulting from the rapidly changing potential forces in transition state region. In the following, we review angle-velocity resolved measurements from aligned vdW complexes with time and state resolution on the popular system (CH3I),,.
One of the more interesting problems regarding photodissociation of (CH3I),, is the bimolecular reaction I + CH3I ~ 12 + CH 3. Vaida and coworkers first observed I~ in a molecular beam mass spectrometer, but were not able to confirm whether the signal occurred by ionization of neutral product 12 or by dissociation of cluster ions. l~176 The Syage group performed mass-selected photodissociation experiments on (CH3I)n + cluster ions and picosecond pump-probe experiments on the neutrals to show that the neutral 12 channel occurred. 1~ The groups of Ziegler and of Donald- son subsequently directly measured the vibrational energy distribution in the neutral 12, further substantiating the neutral pathway. 1~176 The early picosecond measure- ments indicated that 12 was formed within the 10 ps time resolution of the experiment. However, it was not known whether the reaction approached that for CH3I bond breaking in the repulsive A state, which was measured by the Caltech group to be about 150 fs. 97
A second interesting question is the partitioning between reactive and inelastic (unreactive) scattering. Recently, the Caltech group reported femtosecond meas- urements of the bimolecular reaction:
CH3I + I ---) [CH3II]* --) CH3I + I (inelastic) (6a)
CH 3 + 12 (reactive) (6b)
These experiments were conducted using KETOF probing which allowed them to monitor the time evolution of fast vs. slow I atoms. 97 The 12 product is relatively cold by comparison (discussed below). Reaction 6 was initiated in an aligned vdW complex (CH3I)2. The generally accepted geometry for the dimer involves an I..-I bond, with evidence for a bent C-I. . .I-C structure. The photodissociation of CH3I initiates the reaction whereby I is launched into the partner CH3I with a limited impact parameter. The inelastic scattering is measured in time and velocity by probe ionization of I atom. The experiment essentially measures the direct outcome of the CH3II* transition state prepared with the C...I and I...I coordinates of the vdW complex.
The transition state comes late in the potential energy surface as seen in Figure 31. The barrier to forming CH 3 + 12 is about 19 kcal/mol. Figure 31 shows an inelastic trajectory whereby an I atom can become trapped in the vdW potential well near the transition state. Without sufficient energy to surmount the reaction barrier, the transition state complex decomposes to CH3I + I. A series of femtosec-

48 JACK A. SYAGE and AHMED H. ZEWAIL
r162
Bimolecular Full Collision
It*
R (I-I)
Figure 31. Potential energy map for the bimolecular reaction CH31 + I reaction showing an inelastic scattering trajectory from an initial wavepacket (black oval). The three panels show the complex in the transition state (t*), as final products of the inelastic channel CH31 + I (tf), or final products of the reactive channel CH3 + 12 (tf)(ref. 97).
ond measurements of the appearance of low-velocity I atoms are presented in Figure 32. The traces under monomer and monomer + dimer conditions are given in Figures 32A and B. The difference gives the transient for inelastic I atom scattering for the CH3II ~ complex. Two distinct collisional times were observed for a collision energy of 1.29 kcal/mol; a delay of about 1.4 ps and an exponential rise of about 1.7 ps. The first time scale represents a measure of the coherent process in the entrance channel toward the transition state and the second time scale is a measure of the lifetime of the complex.
Detailed chemical dynamics of the inelastic scattering of an I atom were also measured in the long time limit by state-specific angle-velocity resolved measure- ments in the Syage lab. 1~ These measurements provide direct access to the
bimolecular differential cross section for differential cross section to Reaction 6a. In these experiments, the I(2P3/2) was resonantly ionized and the translational energy as a function of angle measured for collision energies of 2.16 kcal/mol and 2.87 kcal/mol. In both cases, a bimodal distribution of velocities was observed as shown in Figure 33. The higher energy distribution was also more anisotropic (forward-backward) scattering. These results are consistent with inequivalent I atoms and may result from a presumed bent dimer geometry in which the impact parameter for each potential I atom projectile is different, one being head-on and the other being glancing.
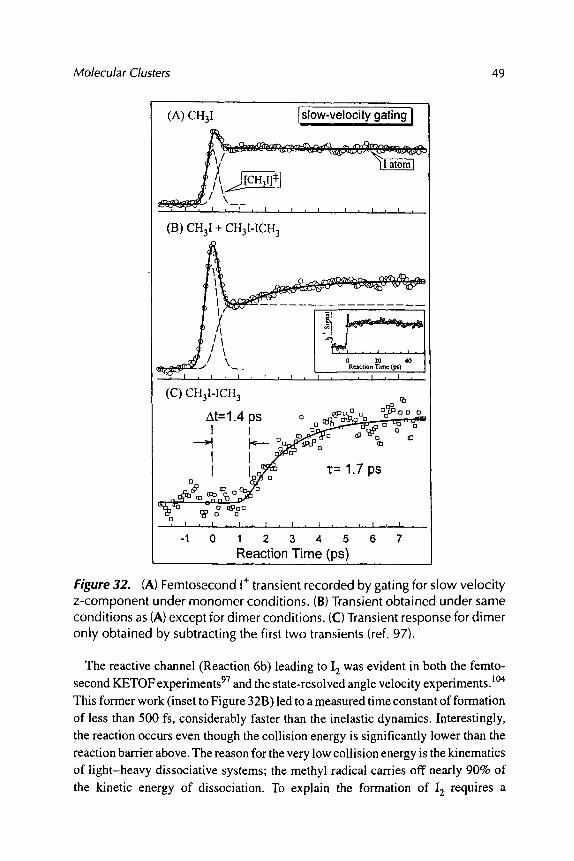
Molecular Clusters 49
(A) CH3I [siow-velocity gating|
(B) CH3I + CH3I-ICH 3
o
v
(C) CH3I-ICH 3
At:1.4 F" ~" o ~ ~ ~ ; ~ : ~-~ ] o t:x,,,,, , , - , v ' - ' - ozT " o
' F_y, o _~
o, I , I , I ~ I , I , I j 1 , I , I ,
-1 0 1 2 3 4 5 6 7 Reaction Time (ps)
Figure 32. (A) Femtosecond I + transient recorded by gating for slow velocity z-component under monomer conditions. (B) Transient obtained under same conditions as (A) except for dimer conditions. (C) Transient response for dimer only obtained by subtracting the first two transients (ref. 97).
The reactive channel (Reaction 6b) leading to 12 was evident in both the femto- second KETOF experiments 97 and the state-resolved angle velocity experiments. 1~ This former work (inset to Figure 32B) led to a measured time constant of formation of less than 500 fs, considerably faster than the inelastic dynamics. Interestingly, the reaction occurs even though the collision energy is significantly lower than the reaction barrier above. The reason for the very low collision energy is the kinematics of light-heavy dissociative systems; the methyl radical carries off nearly 90% of the kinetic energy of dissociation. To explain the formation of 12 requires a

50 JACK A. SYAGE and AHMED H. ZEWAIL
mechanism in which this energy is not lost. One explanation is a concerted mechanism based on a four-center process in which the C-I bonds are simultane- ously breaking while the I-I is being formed. ~~ Under this scenario, energy is not lost as kinetic energy in the departing CH 3. It is also possible that the CH 3 groups can bind to form C2H 6 as it does in larger clusters, l~176 The mass spectrum of (CH3I) n following A-state excitation and ionization using picosecond pulses shows an alternating pattern in Figure 34, suggesting loss of CH 3 in pairs. Whether or not C2H 6 forms in dimers, the formation ofI 2 seems to involve a four-center mechanism, analogous to what is observed for hydrogen halide dimers and clusters. 1~176 Further discussion of the mechanism of I9 formation from (CH3I) 2 excitation requires a more exacting determination of the dimer geometry than currently exists. Recent molecular dynamics studies by Shin et al. (private communication) have considered the reverse reaction of CH 3 + 12 and the time scales are generally consistent with the observed dynamical picture. 97
i ' l ' I l I l l I " ' l ' I l l I
oo]
I , I ~ I , 1 , I
-2 -1 0 1 2 1 ' I ' I ' I ' I
I
- 2 - 1 0 1 2
v z (kin/s)
Figure 33. 1(2p3/2) velocity spectrum for 0 ~ scattering following 304 nm excitation of (CH31)n as a function of increasing clustering conditions from (a) to (c). (d) Velocity spectrum for 90 ~ scattering under clustering conditions (ref. 104).

Molecular Clusters 51
I I I I I I 1 1 ! ! I ! I ! ! I I I I I I I I I I ! I I I I I I
ps-REMPI 266 nm
[ High Flux
.....I I 1 I I 1 J I 1 I J I I I
x 20 Low Flux I
--._JL ~. 6 7 8 9 10
I 1 I I I I I I I I i I 1 1 i I I 1 1 I 1 I I I ! 1 I 1 i 1 I I I I I I I I l
700 900 1100 1300 1500 ION MASS
Figure 34. Picosecond REMPI mass spectra at 266 nm for larger (CH31)n clusters. The alternation pattern represents loss of 2CH3, which is presumed to be due to C2H6 formation (ref. 101 ).
11 BARRIER CROSSING" TRANS-STILBENE PHOTOISOMERIZATION
The photoisomerization of trans-stilbene from its first excited state is a benchmark barrier crossing system that has been extensively studied in the condensed phase and gas phase. Some of the important issues regarding the role of solvation include the influence on the adiabaticity of the reaction and vibrational relaxation, espe- cially, both intramolecular vibrational redistribution (IVR) and intermolecular redistribution through van der Waals interactions.
A particularly interesting problem is an apparent increase in the rate of isomeri- zation in low-viscosity solvents relative to the rates measured at similar energies in molecular beam studies. 1~ Two possible explanations have emerged to explain this behavior: a collision-induced reduction in the nonadiabaticity of the barrier, which is presumed to involve a surface crossing, 1~ or the influence of solute-solvent cluster formation on the shape and barrier height of the reaction potential, ll~ A natural test of these premises is to measure isomerization rates as a function of microscopic solvation in clusters.

52 JACK A. SYAGE and AHMED H. ZEWAIL
Heikel et al. at Caltech conducted studies of trans-stilbene in hexane clusters ranging from n = 1 to 5 solvent molecules. Ill Measured transients are presented in
Figure 35. The general trends in the rate of isomerization as a function of solvent
cluster size and how they compare to gas and liquid phase are summarized as
follows: First, the barrier height decreases in the presence of solvent molecule.
�9 I " " " I " " " I " " " 1 " " " I " " " I " "
n = 0 / ~ E u - 2586 cm ~
x = 1 0 7 p s
- ' - ~ ' - ' - - ~ . ' - . . _ _ \ ~ " . - - - ? - " . t _~Z - ' r -7"
. I , , l i l i i l , , * l - , . I . , , I . ,
�9 I " " " I " " " I " " " 1 " " " I " " " i " "
n = l ".
!
�9 i " �9 - 1 �9 �9 �9 I " " �9 i " " �9 I " �9 " I " " ~
�9 .
n = 2 "
�9 -_.. : ..=
I
�9 I " " " I " " " I " " " I " " " I " " " I " "
�9 ~ , " o
�9 n = 3 " " ""-:.
.i 'i " �9 I " " " I " " " I " " " I " ' " I " " " I " "
o - . . , . . .
�9 . . . . . . , . . . : . . . . . . .
n = 4 ID
x = 2.37 n
, 200 ps �9 . ~_.-. - . j 200 ps
�9 I �9 �9 . I j �9 �9 I �9 �9 �9 I �9 �9 �9 I �9 �9 . I �9 .
T i m e . -
Figure 35. Measured transients of trans-sti lbene-hexanen, n = 0 - 4 , for ~pump = 283 nm, ~probe = 325 nm. Fitted single-exponential decay times are shown (ref. 111).

Molecular Clusters 5 3
Second, the overall rate and the relative increase with increasing internal energy is lower for the cluster systems than for the isolated trans-stilbene case. The results are counter intuitive given the observation that the isomerization rate is greater in the condensed phase than the gas phase at comparable energies. The cluster results are more representative of what is observed in high-density solvents. The decrease in rate with increasing n parallels the trend observed with viscosity. These striking results raised an interesting issue regarding the role of microscopic friction and IVR. Marcus has considered the former with a modified RRKM description ll2 and further experiments are underway to separate their influences.
7. CONCLUDING REMARKS
This chapter was not designed to survey the field, but instead to illustrate the power of the approach of using clusters as a microscopic media to study bond dynamics and caging, electron and proton transfer reactions, aligned bimolecular reactions, and barrier crossing. Advances in time-, velocity-, state-, and angular-resolution made it possible to examine the elementary steps with unprecedented details of dynamics and mechanisms. Future studies will undoubtedly continue to explore new systems and elucidate new physical and chemical phenomena. Two areas of future research are worth mentioning. On the experimental side, better charac- terization of cluster structure is needed in order to relate structures to dynamics. The techniques of rotational coherence spectroscopy 113 and ultrafast electron diffraction ll4 will be of great help; already the former has been successfully used by many groups. 115 On the theoretical side, more practical approaches are needed to ascertain structures and dynamics as the system increases in size, reaching the condensed-phase limit. For example, for the BznI 2 system described in the text, we have recently 116 obtained an ab initio structure for the 1"1 species, but then used empirical potentials to construct the solvation shell, and subsequently the molecular dynamics to compare with experiments. Can the approach be generalized to test different systems, perhaps based on simple bonding ideas? Much research will continue in this novel area of studying reactions in clusters. In their own right, clusters represent an interesting phase of matter to study and they could become the gateway to condensed-phase chemical dynamics. Besides, they exhibit the influence of weak interactions in a very direct way relevant to all noncovalent chemical structures and syntheses.
ACKNOWLEDGMENTS
This research was supported (AHZ) by grants from the National Science Foundation and (JAS) by the Aerospace Corporation. JAS also acknowledges NATO for a collaborative research grant.

54 JACK A. SYAGE and AHMED H. ZEWAIL
APPENDIX: TUNNELING MODEL FOR PROTON TRANSFER IN CLUSTERS
The details of a proton tunneling model for clusters are given in Refs. 7, 59, and 77. Here we present an overview. A starting point for a tunneling model incorpo- rating the nuclear coordinates outlined in Section 4.1 (and Figure 25) is a Golden Rule-type equation of the form:
W = (47t2/h)C29 (7)
The coupling term C is obtained from Bell theory for an O-H symmetric double- well potential with an inverted parabolic barrier, 117
h'o~H [ ~2a ] C= 2r~ exp - - -~- (2mU) 1/2 (8)
where C is the tunneling splitting and 2a and U are the barrier width and height as depicted in Figure 25. The density of states function 9 represents the set of modes that give rise to a tunneling resonance between reactant and product. We consider two contributions as shown in Figure 25" a Boltzmann term for solvent fluctuations giving the solvent configuration S o and a manifold of product vibrational states that are Franck-Condon coupled to the reactant state. The former term follows directly from classical Marcus theory of solvent modes, 79 usually associated with electron transfer, but applicable to proton transfer. The latter contribution has the em- bodiment of Jortner-Bixon radiationless transition theory, s~ The coupling of individual reactant and product states that combines the classical low-frequency Marcus solvent mode expression with the higher frequency Franck-Condon cou- pled quantum state treatment is given as follows,
Pm,n = ~ I"I (milni) exp{-~AG#m,,ni } (9) i=l
where M is the number of coupled modes, m i and n i are the number of quanta of mode i for reactant and product, respectively, 13 -1 is the energy per mode, and"
AGm'~i- 4)~, AGo + ~'s + . (ni- mi)hvi (10)
The reactant and product state m and n are denoted by Im) = Im 1 . . . . . raM) and In) = In 1 . . . . . riM), respectively. We note that only two modes are considered important in this analysis, the H oscillator (e.g. O-H and H-N for reactant and product for PhOH-NH3), and the O.-.N symmetric stretch mode. The sum over all product states gives an effective density of states"

Molecular Clusters 5 5
Pm=~
1 2 ,,* ~ M
E " " Z H (milni) exp{-~AG#mi,ni } nl=O n~=M i=l
(11)
The term effective means a weighted sum of the coupling strengths of all relevant
product states.
Proton tunneling rate constants from reactant state m are calculated by averaging the barrier properties over the O...N symmetric stretch vibrational wave function
to account for the modulation of barrier height and width as illustrated in Figure
25. This leads to the expression:
km = (vmlW(x)lvm)
4n 2 - T (VmIC(x)21Vr')Om
471; 2 h ~m f C(x)2fm( x) d'x
(12)
For low to moderate levels of reactant excitation (less than the O-H vibrational
frequency), only the O...N symmetric stretch mode needs to be considered for
reactant states, hence, m refers to number of quanta of the O...N stretch. The rate
constant as a function of internal energy is then given by some statistical function,
k(E) = SmPm(E)k m, where Pro(E) is the population probability of m quanta of the
O.--N stretch at energy E. Pro(E) can be a classical expression such as the Marcus-
Rice approximation. Figure 36 presents calculated tunneling rates as a function of AG O from specific
reactant states m. The stick figures show the Franck-Condon term. The envelopes
represent the rate constant k m for0 K (i.e. 13 -1 =0) and 300 K. An interesting outcome
of the state-to-state treatment of tunneling is the prediction of a structured depend- ence of k with AG O for clusters in the inverted region. The effect is strongest for
single-vibronic level excitation, particularly for the vibrationless level. For vibra-
tionless excitation of the reactant <m,v,mHI = <0,0l, the FC distribution in the
product is very structured. Convolving over the Marcus classical solvent mode
distribution for 300 K smooths out much of the structure, but it still persists in Figure
36c,c'. For a true thermal sample, a distribution of reactant vibrations would be
populated and the oscillations in the density of states would average out. In clusters,
however, the oscillatory nature of k vs. AG O should persist. Now there is no convenient way to vary the AG O without affecting other properties of the clusters;
however, a series of well controlled experiments might reveal the effect predicted
here.

56 JACK A. SYAGE and AHMED H. ZEWAIL
>*,
I :
----m-------r----------r------r------,t>l---- I / ~ <0,01nN, n
0 2000 4000 6000 8000
<2,01nN, n~>
C'
b'
0 2000 4000 6000 8000
-[AG O + X s] (cm 1)
Figure 36 , (a,a') Calculated tunneling rates based on Franck-Condon factors for an arbitrary proton transfer system consistent with previous clusters experiments; (b,b') envelope of the stick figure; (c,c') envelope after convolv- ing a classical Marcus-Boltzmann distribution for solvent mode excitation at 300 K. The left and right hand plots correspond to vibrationless and 2 quanta of O---N symmetric stretch excitation. The rate scale on the right hand plot is about a factor of 30 greater than on the left hand plot. (Input details are given ref. 77).
N O T E A D D E D IN P R O O F
More recently, the Cast leman group has trapped the intermediate, using Coulomb
explosion, and these elegant experiments 118 give time constants similar to those
measured by the Caltech group. 86 Finally, the nonconcerted pathway was also found
in our studies of the same system in liquid solutions. 119
REFERENCES
1. Bemstein, E. R. (Ed.). Atomic and Molecular Clusters; Elsevier Science: Amsterdam, 1990. 2. Scoles, G. The Chemical Physics of Atomic and Molecular Clusters; Elsevier Science: New York,
1990. 3. Castleman, Jr., A. W." Bowen, Jr., K. H. J. Phys. Chem. 1996, 100, 12911. 4. Felker, P. M.; Zewail, A. H. Chem. Phys. Lett. 1983, 94, 454. 5. Castleman Jr., A. W.; Wei, S. Annu. Rev. Phys. Chem. 1994, 45, 685. 6. Bemstein, E. R. J. Phys. Chem. 1992, 96, 10105. 7. Syage, J. A. J. Phys. Chem. 1995, 99, 5772.

Molecular Clusters 57
8. Syage, J. A. In Femtosecond Chemistry; Manz, J.; Woeste, L., Eds.; VCH Publishers: New York, 1995, p 475.
9. Syage, J. A. In Ultrafast Spectroscopy in Chemical Systems; Simon, J. D., Ed.; Kluwer Academic Press: New York, 1994, p 289.
10. Breen, J. J.; Willberg, D. M.; Gutmann, M.; Zewail, A. H. J. Chem. Phys. 1990, 93, 9180; Willberg, D. M.; Gutmann, M.; Breen, J. J.; Zewail, A. H. J. Chem. Phys. 1992, 96, 198.
11. Gutmann, M.; Willberg, D. M.; Zewail, A. H. J. Chem. Phys. 1992, 97, 8037. 12. Gutmann, M.; Willberg, D. M.; Zewail, A. H. J. Chem. Phys. 1992, 97, 8048. 13. Campos-Martinez, J.; Hemandez, M. I.; Roncero, O.; Villarreal, P.; Delgado-Barrio, G. Chem.
Phys. Lett. 1995, 246, 197. 14. Liu, Q.; Wang, J-K.; Zewail, A. H. Nature 1993, 364, 427; Wang, J-K.; Liu, Q.; Zewail, A. H. J.
Phys. Chem. 1995, 99, 11309; Liu, Q.; Wang, J-K.; Zewail, A. H. J. Phys. Chem. 1995, 99, 11321. 15. Lienau, Ch.; Williamson, J. C.; Zewail, A. H. Chem. Phys. Lett. 1993, 289; Lienau, Ch.; Zewail,
A. H. J. Phys. Chem. 1996, 100, 18629; Materny, A.; Lienau, Ch.; Zewail, A. H. J. Phys. Chem. 1996, 100, 18650.
16. Liu, Q.; Wan, C.; Zewail, A. H. J. Chem. Phys. 1996, 105, 5294; Liu, Q.; Wan, C.; Zewail, A. H. J. Phys. Chem. 1996, 100, 18666.
17. Hams, A. L.; Berg, M.; Harris, C. B. J. Chem. Phys. 1986, 84, 788. 18. Michels, J. P. J.; Scheerboom, Schouten, J. A. J. Chem. Phys. 1995, 103, 8338; Brueck, S. R. J.
Chem. Phys. Lett. 1977, 50, 516. 19. Ray, D.; Levinger, N. E.; Papanikolas, J. M." Lineberger, W. C. J. Chem. Phys. 1989, 91, 6533;
Papanikolas, J. M.; Gord, J. R.; I_~vinger, N. E.; Ray, D.; Vorsa, V.; Lineberger, W. C. J. Phys. Chem. 1991, 95, 8028.
20. Papanikolas, J. M.; Vorsa, V.; Nadal, M. E.; Campagnola, P. J.; Buchenau, H. K.; Lineberger, W. C. J. Chem. Phys. 1993, 99, 8733; Papanikolas, J. M.; Vorsa, V." Nadal, M. E.; Campagnola, P. J.; Gord, J. R.; Lineberger, W. C. J. Chem. Phys. 1992, 97, 7002.
21. Vorsa, V.; Campagnola, P. J.; Nandi, S.; Larsson, M.; Lineberger, W. C. J. Chem. Phys. 1996, 105, 2298.
22. Alexander, M. L.; Levinger, N. E.; Johnson, M. A." Ray, D." Lineberger, W. C. J. Chem. Phys. 1988, 88, 6200.
23. Greenblatt, B. J.; Zanni, M. T.; Neumark, D. M. Science. 1997, 276, 1675. 24. Chuang, T. J.; Hoffman, G. W.; Eisenthal, K. B. Chem. Phys. Lett. 1974, 25, 201. 25. Bado, P.; Wilson, K. R. J. Phys. Chem. 1984, 88, 655. 26. Abul-Haj, N. A.; Kelley, D. E J. Phys. Chem. 1987, 91, 5903. 27. Hams, A. L.; Brown, J. K.; Harris, C. B. Ann. Rev. Phys. Chem. 1988, 39, 341. 28. Nesbitt, D. J.; Hynes, J. T. J. Chem. Phys. 1982, 77, 2130. 29. Scherer, N. E; Ziegler, L. D." Fleming, G. R. J. Chem. Phys. 1992, 96, 5544. 30. Zadoyan, R.; Ashjian, P.; Li, Z.; Martens, C. C.; Apkarian, V. A. Chem. Phys. Lett. 1994,218, 504;
Zadoyan, R.; Li, Z.; Martens, C. C.; Apkarian, V. A. J. Chem. Phys. 1994, 101, 6648. 31. Private communication of work to be published. 32. Kliner, D. A. V.; Alfano, J. C.; Barbara, P. E J. Chem. Phys. 1993, 98, 5375. 33. Banin, U.; Waldman, A.; Ruhman, S. J. Chem. Phys. 1992, 96, 2416. 34. Polanyi, J. C. Science 1987, 236, 680; Lee, Y. T. ibid 1987, 236, 793. 35. Jouvet, C." Boivineau, M.; Duval, M. C." Soep, B. J. Phys. Chem. 1987, 91, 5416; Nelson, T. O.;
Setser, D. W.; Qin, J. J. Phys. Chem. 1993, 97, 2585. 36. Rose, T. S.; Rosker, M. J.; Zewail, A. H. J. Chem. Phys. 1989, 91,7415; Potter, E. D.; Herek, J.
L.; Pedersen, S.; Liu, Q.; Zewail, A. H. Nature 1992, 355, 66. 37. Cheng, P. Y.; Zhong, D., Zewail, A. H. J. Chem. Phys. 1996, 105, 6216; ibid. 1995, 103, 5153. 38. Syage, J. A. Chem. Phys. 1996, 207, 411; Syage, J. A. Chem. Phys. Len. 1995, 245, 605. 39. Benesi, H. A.; Hildebrand, J. H. J. Am. Chem. Soc. 1949, 71, 2703. 40. Mulliken, R. S. J. Am. Chem. Soc. 1950, 72, 610; ibid. 1952, 74, 811.

58 JACK A. SYAGE and AHMED H. ZEWAIL
41. Ferguson, E. E. J. Chem. Phys. 1956, 25, 577; Hassel, O.; Stromme, K. O. Acta. Chent Scand. 1958, 12, 1146; Fredin, L.; Nelander, B. J. Ant Chent Soc. 1974, 96, 1672.
42. Kochanski, E.; Prissette, J. Nouv. J. Chim. 1980, 4, 509. 43. Lenderink, E.; Duppen, K.; Everdij, E E X.; Mavri, J.; Torre, R.; Wiersma, D. A. J. Phys. Chem.
1996, 100, 7822. 44. DeBoer, G.; Burnett, J. W.; Fujimoto, A.; Young, M. A. J. Phys. Chem. 1996, 100, 14882. 45. Ku, J. K.; Setser, D. W. In Photochemistry and Photophysics above 6 eV; Lahmani, E, Ed.;
Elsevier: Amsterdam, 1985" Donovan, R. J. et al. Faraday Discuss. Chem. Soc. 1987, 84, 221. 46. Herschbach, D. R. Adv. Chent Phys. 1966, 10, 319; Kinsey, J. U; Kwei, G. H.; Herschbach, D.
R. J. Chem. Phys. 1976, 64, 2133. 47. Lenderink, E.; Duppen, K.; Wiersma, D. A. Chem. Phys. Lett. 1993, 211,503. 48. Pullen, S.; Walker II, L. A.; Sension, R. J. J. Chent Phys. 1995, 103, 7877. 49. Cheshnovsky, O.; Leutwyler, S. J. Chent Phys. 1988, 88, 4127; Knochenmuss, R.; Cheshnovsky,
O.; Leutwyler, S. Chem. Phys. Lett. 1988, 144, 317. 50. Droz, T.; Knochenmuss, R.; Leutwyler, S. J. Chent Phys. 1990, 93, 4520. 51. Breen, J. J.; Peng, L. W.; Willberg, D. M.; Heikal A.; Cong, E; Zewail, A. H. J. Chem. Phys. 1990,
92, 805. 52. Kim, S. K.; Breen, J. J.; Willberg, D. M.; Peng, L. W.; Heikal, A.; Syage, J. A.; Zewail, A. H. J.
Phys. Chem. 1995, 99, 7421. 53. Steadman, J.; Syage, J. A. J. Chem. Phys. 1990, 92, 4630; Syage, J. A.; Steadman, J. 3'. Chem.
Phys. 1991, 95, 2497. 54. Steadman, J.; Syage, J. A. J. Am. Chem. Soc. 1991, 113, 6786. 55. Syage, J. A.; Steadman, J. J. Phys. Chem. 1992, 96, 9606. 56. Syage, J. A. J. Phys. Chem. 1991, 95, 10326. 57. Steadman, J.; Fournier, E. W.; Syage, J. A. Appl. Opt. 1990, 29, 4962. 58. Syage, J. A. Chent Phys. Lett. 1993, 202, 227; Syage, J. A. Z Phys. D. 1994, 30, 1. 59. Syage, J. A. Faraday Discuss. Chem. Soc. 1994, 97, 401" Syage, J. A. J. Phys. Chem. 1993, 97,
12523. 60. Hineman, M. E; Bruker, G. A.; Kelley, D. E; Bemstein, E. R. J. Chem. Phys. 1992, 97, 3341. 61. Harris, C. M.; Selinger, B. K. J. Phys. Chem. 1980, 84, 1366; Ireland, J. E; Wyatt, E A. H. Adv.
Phys. Org. Chem. 1976, 12, 131. 62. Brucker, G. A.; Kelley, D. E J. Chent Phys. 1989, 90, 5243; Brucker, G. A.; Kelley, D. E Chem.
Phys. Lett. 1989, 136, 213; Swinney, T. C.; Kelley, D. E J. Phys. Chem. 1991, 95, 2430. 63. Lee, J.' Griffin, R. D.; Robinson, G. W. J. Chem. Phys. 1985, 82, 4920; Lee, J." Robinson, G. W.;
Webb, S. E; Philips, L. A.; Clark, J. H. J. Ant Chent Soc. 1986, 108, 6538. 64. Strandjord, A. J. G.; Courtney, S. H.; Friedrich, D. M.; Barbara, E E J. Phys. Chem. 1983, 87,
1125; Smith, T. E; Zakilika, K. Z.; Thakur, K.; Barbara, E E J. Am. Chem. Soc. 1991, 113, 4035. 65. Kosower, E. M.; Huppert, D. Annu. Rev. Phys. Chem. 1986, 37, 127. 66. Pines, E.; Huppert, D.; Agmon, N. J. Chem. Phys. 1988, 88, 5620; Agmon, N.; Huppert, D.; Pines,
E. J. Chem. Phys. 1988, 88, 563 l" Huppert, D. H.; Jayaraman, A.; Maines Sr., R. G." Steyert, D. W.; Rentzepis, E M. J. Chem. Phys. 1984, 81, 5596.
67. Webb, S. E; Philips, L. A.; Yeh, S. W.; Tolbert, L. M.; Clark, J. H. J. Phys. Chem. 1986, 90, 5154. 68. Brucker, G. A.; Kelley, D. E J. Phys. Chem. 1988, 92, 3805. 69. Knochenmuss, R.; Holtom, G. R.; Ray, D. Chent Phys. Lett. 1993, 215, 188. 70. Lias, S. G.; Liebman, J. E; Levin, R. D. J. Phys. Chem. Ref Data 1984, 13, 695. 71. Kebarle, E Annu. Rev. Phys. Chem. 1977, 28, 445; Grimsrud, E. E; Kebarle, E J. Am. Cheat Soc.
1973, 95, 7939; Mautner, M. J.; Speller, C. V. J. Phys. Chem. 1986, 90, 6616. 72. Hineman, M. E; Kelley, D. E; Bernstein, E. R. J. Chem. Phys. 1993, 99, 4533. 73. Maroncelli, M.; MacInnis, J.; Fleming, G. R. Science 1989, 243, 1674; Simon, J. D. Acc. Chem.
Res. 1988, 21, 128. 74. Barbara, E E; Walker, G. C.; Smith, T. E Science 1992, 256, 975.

Molecular Clusters 59
75. Kozik, M.; Sutin, N.; Winkler, J. R. Coord. Chem. Rev. 1990, 97, 23; Jarzeba, W.; Walker, G. C.; Johnson, A. E.; Kahlow, M. A.; Barbara, P. E J. Phys. Chem. 1988, 92, 7039.
76. Rothenberger, G.; Negus, D. K.; Hochstrasser, R. M. J. Chem. Phys. 1983, 79, 5360; Su, S-G." Simon, J. D. J. Chem. Phys. 1988, 89, 908.
77. Syage, J. A. In Femtochemistry; Chergui, M., Ed.; World Scientific Publishing: Singapore, 1996, p 157.
78. Borgis, D. C.; Hynes, J. T. Chem. Phys. 1993, 170, 315; Borgis, D. C.; Hynes, J. T. J. Chem. Phys. 1991, 94, 3619; Cukier, R. I.; Morillo, M. J. Chem. Phys. 1990, 91,857; Morillo, M.; Cukier, R. I. J. Chem. Phys. 1990, 92, 4833.
79. Marcus, R. A. Faraday Discuss. Chem. Soc. 1982, 74, 7; Marcus, R. A. Annu. Rev. Phys. Chem. 1964, 15, 155.
80. Jortner, J.; Bixon, M. J. Chem. Phys. 1988, 88, 167; Ulstrup, J.; Jortner, J. J. Chem. Phys. 1975, 63, 4358; Freed, K. E Acc. Chem. Res. 1978, 11, 74.
81. Yi, M.; Scheiner, S. Chem. Phys. Lett. 1996, 262, 567. 82. Siebrand, W.; Zgierski, M. Z.; Smedarchina, Z. K.; Vener, M.; Kaneti, J. Chem. Phys. Lett. 1997,
266, 47. 83. Taylor, C. A.; EI-Bayoumi, M. A.; Kasha, M. Proc. Natl. Acad. Sci. USA 1969, 63, 253; Ingham,
K. C.; EI-Bayoumi, M. A. J. Am. Chem. Soc. 1974, 96, 1674. 84. Hetherington, W. M.; Micheels, R. H.; Eisenthal, K. B. Chem. Phys. Lett. 1979, 66, 230; Share,
P.; Pereira, M.; Sarisky, M.; Repinec, S.; Hochstrasser, R. M. J. Luminescence 1991, 48/49, 204. 85. Fuke, K.; Keizo, K.; Misaizu, E; Kaya, K. J. Chem. Phys. 1991, 95, 4074; Fuke, K.; Kaya, K. J.
Phys. Chem. 1989, 93, 614. 86. Douhal, A.; Kim, S. K.; Zewail, A. H. Nature 1995, 378, 260. 87. Lopez-Martens, R.; Long, P.; Solgadi, D.; Soep, B.; Syage, J., Millie, Ph. Chent Phys. Lett. 1997,
273,219. 88. Wei S.; Purnell, J.; Buzza, S. A.; Stanley, R. J.; Castleman, Jr., A. W. J. Chem. Phys. 1992, 97,
9480; Wei, S.; Purnell, J." Buzza, S. A.; Castleman, Jr., A. W. J. Chem. Phys. 1993, 99, 755. 89. Ceyer, S. T.; Tiedemann, P. W.; Mahan, B. H.; Lee, Y. T. J. Chem. Phys. 1979, 70, 14; Shinohara,
H.; Nishi, N.; Washida, N. J. Chem. Phys. 1985, 83, 1939. 90. Echt, O.; Dao, P. D.; Morgan, S.; Castleman, Jr., A. W. J. Chem. Phys. 1985, 82, 4076; Shinohara,
H.; Nishi, N. Chem. Phys. Lett. 1987, 141,292. 91. Stephan, K.; Futrell, J. H.; Peterson, K. I.; Castleman, Jr., A. W.; Wagner, H. E.; Djuric, N.; Mark,
T. D. Int. J. Mass Spect. Ion Phys. 1982, 44, 167; Peifer, W. R.; Coolbaugh, M. T.; Garvey, J. F. J. Chem. Phys. 1989, 91, 6684.
92. Schultz, C. P.; de Vivie-Riedle, R.; Htihndorf, J.; Brockhaus, P.; Noack, E; Schultz, S.; Hertel, I.V. In Fast Elementary Processes in Chemical and Biological Systems, Tramer, A., Ed.; AlP Press: New York, 1996., p 658. Freudenberg, Th.; Stert, V.; Radloff, W.; Ringling, J.; Guidde, J.; Korn, G.; Hertel, I. V. Chem. Phys. Lett. 1997, 269, 523.
93. Jouvet, C.; Soep, B. Chem. Phys. Lett. 1983, 96, 426; Jouvet, C.; Boivineau, M.; Duval, M. C.; Soep, B. J. Phys. Chem. 1987, 91, 5416.
94. Wittig, C.; Sharpe, S.; Beaudet, R. A. Acc. Chem. Res. 1988, 21, 341; Shin, S. K.; Chen, Y.; Nicholaisen, S.; Sharpe, S. W.; Beaudet, A.; Wittig, C. Adv. Photochem 1991, 16, 249 and references therein.
95. Ionov, S. I.; Brucker, G. A.; Jaques, C.; Velachovic, L.; Wittig, C. J. Chem. Phys. 1993, 99, 6553. 96. Scherer, N. E; Khundkar, L. R.; Bernstein, R. B.; Zewail, A. H. J. Chem. Phys. 1987, 87, 1451;
Scherer, N. F.; Sipes, C.; Bernstein, R. B.; Zewail, A. H. J. Chem. Phys. 1990, 92, 5239. 97. Zhong, D.; Cheng, P. Y.; Zewail, A. H. J. Chem. Phys. 1996, 105, 7864. 98. Unpublished results (Zewail group); see also Wittig, C.; Zewail, A. H. Chemical Reactions in
Clusters, Bernstein, E.; Ed.; Oxford Press: Oxford, 1996. 99. Syage, J. A. Unpublished results.
100. Sapers, S. P.; Vaida, V.; Naaman, R. J. Chem. Phys. 1988, 88, 3638.

60 JACK A. SYAGE and AHMED H. ZEWAIL
101. Syage, J. A.; Steadman, J. Chem. Phys. Lett. 1990, 166, 159. 102. Wang, P. G.; Zhang, Y. P.; Ruggles, C. J.; Zeigler, U D. J. Chent Phys. 1990, 92, 2806. 103. Randall, K.L.; Donaldson, D. J. J. Phys. Chem. 1995, 99, 6763; Fan, Y.; Randall, K. L.; Donaldson,
D. J. J. Chem. Phys. 1993, 93, 4700. 104. Syage, J. A. Chem. Phys. 1996, 207, 411; Syage, J. A. Chem. Phys. Lett. 1995, 245, 605. 105. Momose, T.; Miki, M.; Uchida, M.; Shimizu, T.; Yoshizawa, I,; Shida, T. J. Chem. Phys. 1995,
103, 1400. 106. Buntine, M. A.; Baldwin, D. P.; Zare, R. N.; Chandler, D. W. J. Chem. Phys. 1991, 94 4672. 107. Young, M. A. J. Chem. Phys., 1995, 102, 7925; Young, M. A. J. Phys. Chem. 1994, 98, 7790. 108. Jensen, E. T.; Polanyi, J. C. J. Phys. Chem. 1993, 97, 2257. 109. Syage, J. A.; Felker, P. M.; Zewail, A. H. J. Chent Phys. 1984, 81, 4706; Felker, P. M.; Zewail, A.
H. J. Phys. Chem. 1985, 89, 5402. 110. Maneke, G.; Schroeder, J.; Troe, J.; Voss, E Ber. Bunsenges. Physik. Chem. 1985, 89, 896;
Schroeder, J.; Troe, J.; V6hringer, P. Chem. Phys. Lett. 1993, 203, 255. 111. Heikal, A. A.; Chong, S. H.; Baskin, J. S.; Zewail, A. H. Chem. Phys. Lett. 1995, 242, 380. 112. Marcus, R. A. Chem. Phys. Lett. 1995, 244, 10. 113. Felker, P. M.; Zewail, A. H. In Femtosecond Chemistry; Manz, J.; Woeste, L.; Eds., VCH
Publishers: New York, 1995, p 193, and references therein. 114. Williamson, J. C.; Zewail, A. H. J. Phys. Chem. 1994, 98, 2766; Dantus, M.; Kim, S. B.;
Williamson, J. C.; Zewail, A. H. J. Phys. Chem. 1994, 98, 2782; Williamson, J. C.; Cao, J.; lhee, H.; Frey, H.; Zewail, A. H. Nature 1997, 386, 159.
115. C6t6, M. J.; Kauffman, J. F.; Smith, P. G.; McDonald, J. D. J. Chent Phys. 1989, 90, 2864; Kauffman, J. E; C6t6, M. J.; Smith, P. G.; McDonald, J. D. J. Chem. Phys. 1989, 90, 2874; Topp, M. R. Int. Rev. Phys. Chem. 1993, 12, 149, and references therein.
116. Su, J.; Zewail, A. H .J. Phys. Chem. 1998, 102, 4082. 117. Bell., R. P. The Tunnel Effect in Chemistry; Chapman-Hall: New York, 1980, Chap. 2. 118. Folmer, D. E., Poth, L., Wisniewski, E. S,., Castleman Jr., A. W. Chem. Phys. Lett. 1998, 287, 1. 119. Chachisvilis, M., Fiebig, T., Douhal, A., Zewail, A. H. J. Phys. Chem. 1998, 102, 669.

ENERGETICS AN D DYNAMICS OF ARGON-WATER P HOTO D I SSOC IATI O N
Kurt M. Christoffel and Joel M. Bowman
Abstract . . . . . . . . . . . . . . . . . . . . . . . . . . . . . . . . . . . . . . 62
1. Introduction . . . . . . . . . . . . . . . . . . . . . . . . . . . . . . . . . . . . 62
2. Potentials . . . . . . . . . . . . . . . . . . . . . . . . . . . . . . . . . . . . . . 65
2.1. A r - H 2 0 ( X ) . . . . . . . . . . . . . . . . . . . . . . . . . . . . . . . . . 65
2.2. A r - H 2 0 ( A ) . . . . . . . . . . . . . . . . . . . . . . . . . . . . . . . . . 67 , . . . ,
2.3. A r - H 2 0 ( B ) . . . . . . . . . . . . . . . . . . . . . . . . . . . . . . . . . . 69
2.4. A r 2 - H 2 0 (X) . . . . . . . . . . . . . . . . . . . . . . . . . . . . . . . . 72
3. Dynamics . . . . . . . . . . . . . . . . . . . . . . . . . . . . . . . . . . . . . 74
3.1. Initial Condit ions . . . . . . . . . . . . . . . . . . . . . . . . . . . . . . 74
3.2. Equat ions of Motion . . . . . . . . . . . . . . . . . . . . . . . . . . . . 78
3.3. Analysis . . . . . . . . . . . . . . . . . . . . . . . . . . . . . . . . . . . 79
4. Results and Discussion . . . . . . . . . . . . . . . . . . . . . . . . . . . . . . 79
4.1. Tests of the Quasiclassical Tra jec tory Method . . . . . . . . . . . . . . . 79
4.2. Results for A r - H 2 0 ( X - A ) and H 2 0 ( X - A ) . . . . . . . . . . . . . . . . . 81
4.3. Results for Ar -HEO(X-B) and H 2 0 ( X - B ) . . . . . . . . . . . . . . . . . 84
5. Summary and Conclusions . . . . . . . . . . . . . . . . . . . . . . . . . . . . 87
Acknowledgments . . . . . . . . . . . . . . . . . . . . . . . . . . . . . . . . . 88
References . . . . . . . . . . . . . . . . . . . . . . . . . . . . . . . . . . . . . 88
Advances in Molecular Vibrations and Collision Dynamics, Volume 3, pages 61-89. Copyright �9 1998 by JAI Press Inc. All rights of reproduction in any form reserved. ISBN: 1-55938-790-4
61

62 KURT M. CHRISTOFFEL and JOEL M. BOWMAN
ABSTRACT
We review our recent research on the energetics and dynamics of Ar-H20(,~-,~) and Ar-H20(,~-B) photodissociations. The dynamics calculations need as input the potentials for Ar-H20 in the ground and first two singlet excited states. The potential for the ground electronic state is given by the sum of an H20(~) potential plus a previous, empirical van der Waals Ar-H20()t -~) potential. The potentials for the two excited states are based on previously reported ab initio potentials for H20 in the appropriate excited state, plus semiempirical potentials for Ar-OH(2H) and Ar- OH(2E) for the ,~ and/~ states, respectively, and for both states an empirical Ar-H potential was used. A switching function is used for both excited state potentials to ensure permutation symmetry with respect to the two H atoms. We also present a new potential for Ar2-H20(~), and compare the equilibrium structure with very recent microwave experiments. The photodissociation dynamics are done using full dimen- sional quasiclassical trajectory calculations. Initial conditions for the trajectories are obtained from a product of a Husimi phase-space density for the Ar-H200~) inter- molecular modes and a Wigner phase space density for the H2oot "-~) intramolecular modes. The Husimi phase-space density is derived from the ground-state wavefunc- tion for Ar-H20(~'). We review results for H20(3VOH,,~-~) and Ar-H20(3VOH, ,~-,'~) at 243 and 218 nm, and compare the resulting OH rotational distributions, and also relate them to recent experiments. To assess the accuracy of the trajectory approach, trajectory calculations are also reported for ,~'-,~ photodisso- ciation of H20 in the ground vibrational state at 166 nm and compared with previous full dimensional quantum wavepacket calculations. Rotation/vibration distributions of the OH f ragment are also ca lcu la ted for pho tod i s soc i a t i on of Ar-H20(4VOH,~'-,4) at 218 nm. New calculations are reported for the Ar- H20(,~'-/~) photodissociation; these show marked differences with the Ar- H20(~-,'~) photodissociation.
1. INTRODUCTION
Studies of photochemical processes in small clusters have only begun to appear within the last decade. The status of research in this field circa 1994 has been reviewed by Gerber et al. 1 At that time detailed theoretical and experimental results for photochemical processes in a number of triatomic clusters containing a diatomic molecule and a single solvent atom had become available. The small number of degrees of freedom in these three-atom systems makes them particularly amenable to experimental and theoretical investigations of medium (or solvent) effects. These effects of the surrounding medium on the behavior of reaction intermediates or products are usually called cage effects.
Several theoretical studies ofphotolysis o f H X (X = a halogen) in R g - H X (where Rg is a rare gas atom) complexes indicated that even a single solvent atom was sufficient to produce discernible cage effects. 2 One of the predicted cage effects was energy transfer to the cage atom by the H-atom photolysis product which

Argon-Water Photodissociation 63
should produce an observable broadening in the kinetic energy distribution of the product H atom (as compared to the corresponding distribution for photolysis of unclustered HX). Experimental verification of this broadening has been obtained for the Ar-HBr system. 3 Calculations also indicate that collisions of the departing H atom with the solvent atom should yield a more nearly isotropic angular distribution of the product H atom than occurs in photolysis of unclustered HX. To the best of our knowledge, this prediction has not yet been experimentally tested. In both classical and quantum calculations on the photolysis of HX in Rg-HX, Garcia-Vela et al. 2 observed resonance features attributed to temporary trapping of the H atom product between the two heavy atoms. Such resonance structures were not observed in more recent time-dependent wave packet calculations 4 employing a more realistic initial wavefunction for floppy Ar-HCI. At present there is no experimental evidence for any such quantum cage resonances.
More recently, the energetics and photodissociation dynamics of Arn-HF clusters have been reported. 5' 6 The potentials used in these studies for the ground electronic state of HF were built up from the highly accurate, empirical Ar-HF potential 7 plus an empirical Ar-Ar interaction. 8 For the excited-state potential the diatomic HF excited-state potential and pairwise Ar-F and Ar-H interactions were used, and for computational simplicity a Lennard-Jones potential was used for the pairwise Ar-Ar interaction.
The same year in which the Gerber review appeared, Nesbitt and coworkers reported results of a true experimental tour de force. 9 This group made a preliminary report of an investigation of photodissociation dynamics in a quantum, state- selected Ar-H20 complex. It can be anticipated that this larger system could exhibit dynamically richer behavior than the Rg-HX system because Ar-H20 should be capable of exhibiting additional cage effects on the internal state distributions of the diatomic OH photofragment.
The Nesbitt experiment essentially combined the techniques of vibrationally mediated photodissociation 1~ and photolysis in clusters. II The Ar-H20 clusters were formed in a slit supersonic expansion which effectively prepared the H20 monomer in the lowest rotational states (permitted by nuclear statistics). An optical parametric oscillator provided infrared excitation of Ar-H20 into a specific excited rovibrational state (which correlates with the 103)-000 state of H20) (on the ground electronic surface). For the photolysis laser wavelength used, this preexcited state had a much larger Franck-Condon overlap with the target excited electronic state (here the ,41B 1 first excited state) than does the vibrational ground state. A 248 nm excimer laser was then used to selectively induce the electronic transition of these vibrationally preexcited molecules into the,41B 1 state. On this surface, dissociation for unclustered water is known to be rapid and direct, and to produce rotationally cold OH(21-I§ 12 The rotational distribution of OH fragments in the ground vibra- tional state was probed by laser-induced fluorescence using a frequency-doubled dye laser which scans over the A(2E +) ~-- X(2H) band near 307 nm. To determine the effect of the Ar atom on the product rotational distribution, the experiment was

64 KURT M. CHRISTOFFEL and JOEL M. BOWMAN
repeated for the water "monomer," preexcited into the 103)-000 state. It was found that the product rotational distributions from the two precursor species (Ar-H20 and H20 ) are quite similar, both being very rotationally cold. (However, significant differences between the two distributions were seen for specific K rotational levels.)
From both experimental and theoretical perspectives, the Ar-H20 system is a particularly attractive system in which to study the effect of solvent atoms on photochemical dynamics in small clusters containing a triatomic molecule. The photodissociation of the unclustered H20 molecule in the first absorption band, H20(,~lA1) + h0~ --o H20(,z~IBI) -~H(2S) + OH(XEH), is probably the most studied and best understood triatomic photodissociation system. 12 Experiment and theory are in very good agreement on several aspects of this photodissociation process, including the absorption spectrum, product state distributions, the effect of different rotational and vibrational excitations on the photodissociation outcome, isotope effects (in HOD), and the Raman spectrum. The ,41B 1 surface is well isolated from other excited states (and thus nonadiabatic or curve crossing effects are negligible) and strongly repulsive, so that the photodissociation process is rapid, direct, and uncomplicated. These properties make it a system in which classical trajectory calculations (as we have performed) can be expected to reproduce experimental results reasonably well, given a sufficiently accurate excited-state potential surface. The potential energy surface of the ,41B 1 excited state has been determined by ab initio methods which include electron correlation at the CEPA level. 13 Additionally (as discussed in more detail below), reasonable representations of the Ar-OH(ErI) and Ar-H interactions are available. These potentials can be incorporated into a realistic representation of the Ar-H20(,4 ) potential surface, as described below.
Finally, an Ar-H20(Y 0 intermolecular van der Waals potential has been deter- mined by an empirical fit to spectroscopic data and it is used to obtain a realistic wavefunction for the initial state in dynamical studies of the photodissociation process.
An interesting variant of the Nesbitt experiment (which eliminates the initial infrared excitation step) would probe the role of a solvent atom when ground-state Ar-H20 is photodissociated using shorter wavelength UV radiation (-125 nm) corresponding to the second absorption band of H20 (associated with the ,Y1A 1 --~ B1A 1 electronic transition). In the proposed experiment, rotationally and vibrationally cold Ar-H20 clusters would be formed in a supersonic expansion, then photolyzed by short wavelength UV radiation (122 nm-135 nm), and the product rotational state distributions determined by laser-induced fluorescence measurements. Although the experiment above has not been performed, the photo- dissociation of unclustered H20 in the second absorption band has been the focus of extensive experimental 14,15a and theoretical 15 investigations which are in good agreement on the absorption spectrum and product rotational state distributions. These studies indicate that this process is much different in character from the rapid, direct photodissociation in the first band (described earlier above). Ab initio calculations of the BIA 1 potential energy surface at the MRD-CI level 15 indicate

Argon-Water Photodissociation 65
that it has a deep potential minimum (=3.3 eV) corresponding to a collinear geometry with one O-H bond appreciably stretched (R c ~ 3 %) compared to the ground-state equilibrium value (= 1.8 %). Due to the great difference in the equilib- rium geometries of the ,~lA 1 and BIA 1 states, a Franck-Condon transition from the ground state to the BIA 1 state produces molecules high up on the repulsive wall of the excited surface with energies 0.5-1.5 eV above the dissociation threshold (for H + OH(2Z)) on the BIA1 surface. The Franck-Condon region on the excited surface is highly anisotropic producing a strong torque on the excited molecules with the observable consequence that much of the excess energy appears as rotational energy of the diatomic OH fragment (as confirmed by theoretical calculations and experi- mental measurements). The minimum in the BlA1 surface arises from an avoided crossing with the ,~IA 1 surface with the result that surface-hopping from one state to another can occur. In fact this coupling is so strong that the majority of molecules make the "jump" to the lower potential energy surface where they dissociate into H atoms and OH in its ground electronic state (2I-1). A smaller fraction of the molecules remains on the excited ~tA 1 state and fragments into H atoms and OH radicals in their first excited electronic state QE).
A rigorous and realistic theoretical treatment of the photodissociation of Ar-H20 (and H20) in the second absorption band then would include both electronic states and the nonadiabatic coupling between them. We do not attempt such a realistic modeling of these photodissociation processes here. Instead we explore cage effects of an Ar atom on the photodissociation dynamics of a model (of H20 ,~IA 1 ~ BIA1) wherein the nonadiabatic coupling has been ignored. Particularly interesting features of this model (compared to the ,~ ~ ,~, photodissociation of Ar-H20) are the stronger van der Waals interactions of the Ar atom with both the triatomic molecule and the diatomic photofragment (described later below), and the concomitant potential for stronger cage effects, including the possibility of formation of Ar-OH(2y,) complexes.
2. POTENTIALS
Two sets of coordinates are used in our calculations. The dynamics calculations are done using Jacobi coordinates, and the potentials are expressed in a mixture of Jacobi coordinates and internuclear distances. Figure 1 shows both sets of coordi- nates. The Jacobi vectors are Q, R, and roa,, where Q is the position vector of Ar to the center-of-mass of H20, R is the position vector of H to the center-of-mass of OH', and roll, is the OH' internuclear position vector. The definitions of the internuclear distances in Figure 1 are self-explanatory.
2.1. Ar-H20(X)
For the purpose of a study of photodissociation of Ar-H20(YO the six degree-of- freedom potential can be well approximated by the sum of the H 2 0 ( ~ intramolecu-

66 KURT M. CHRISTOFFEL and JOEL M. BOWMAN
Figure 1. Coordinates for Ar-HOH'. Jacobi coordinates, defined in the text, are shown in (a) and internuclear distances are shown in (b).
lar potential plus the intermolecular van der Waals potential. The latter has been determined empirically by Cohen and Saykally; 16 they refer to this potential by the acronym AW2. This potential is given in terms of the distance of Ar to the center-of-mass of H20, Q, and the two spherical polar angles of Q, 0, and ~, measured with respect to the C2-axis of H20 in its equilibrium configuration. The azimuthal angle ~ is zero when all four atoms are coplanar, and the polar angle 0 is equal to zero when Ar is on the C2-axis. The coordinates of the minimum are 0 = 74.3 ~ ~ = 0 ~ (and ~ = 180~ Q = 3.64/~. A model of the equilibrium configuration is shown in Figure 2. This picture will be of some use in the discussion of the results below; however, it is not a realistic description of the structure of the Ar-H20 van der Waals complex, which is known to be quite floppy. 16' 17 Figure 3 is an equipotential contour plot of the AW2 potential in Q and 0, with ~ = 0 ~ As seen, the minimum configuration, which was depicted in Figure 2 is shallow (the well depth is 142 cm -1) and extended.
The role of the ground-state potential in quasiclassical trajectory calculations of photodissociation is to determine the initial conditions, via a phase-space density of the trajectories which are run on the excited-state potential. This phase-space density will be described in detail in the next section, and additional relevant details of the AW2 potential will be given there. In considering the part of the phase-space

Argon-Water Photodissociation 67
Figure 2. Model representation of the Ar-H20(,~) equilibrium geometry.
density for the internal degrees of freedom of H20, we used a method which does not require explicit use of a H20 potential, and so we omit discussion of that potential here.
2.2. Ar-H20(,~)
We devised a potential function for Ar-H20(,4) based on known two- and three-body potentials. In terms of bond lengths shown in Figure 1 b), the potential is given by,
V= VI~ O (FOH , row , rHu, ) + V:Cr_I.L20 (rAr H, r~o, r~H,) (1)
where vAH O is the (known) H20 potential in the fi, state, and V~_ u O(rArH, rat o, rAru, ) is th~ intermolecular potential. For the former, we used the ab in~tio potential of Staemmler and Palma, 13 which had been used extensively in previous calcula- tions of the photodissociation of H20 by Schinke and coworkers. ]2 The intermo- lecular potential, V~ H O(rArH , rAro' rArH') is not known; however, it should have the
�9 - 2
following properties. It should be symmetric with respect to permutation of the H atoms. Also, it should contain the relevant final-state interactions. As mentioned in the Introduction, the dominant final-state interaction is expected to be between Ar and OH(2FI), because of the expected prompt departure of one H atom. An additional Ar-H two-body interaction is also needed, as discussed below.

ol znp Ie!luzlod seln~ZlOUUmU! H-a'v" z q l p z s n ~^et t a~a ' let t l .IO:: I "tlOl.lal~.t~ltll. H-aV ue ~pnl3u ! ol pzpzzu znx 'HO p!~.u e aoj s! uo!loeazlu! (Hz)HO-aV zql zsne~z~/
"uo!lean~[luo~ O - H - J V aeZU!l zql aoj oazz slenbz zI~Ue s!ql leql qons 'H~ pue ~I saoloz^ zql uzznXl~l Zl~Ue ~ql pue '~t 'HO jo sseua-jo-a~luaa ~ql ol a V jo z~uels!p ~ql jo sttu~l u! u ~ ^ ! $ s! 1I "le!luzl od pzSeaz^e s!ql s! H~ A le!luzlod zql pue 'xzidtuoa HO-aV zql jo s~!lazdoad o!do3soala~ds zql zu.muzl~p ol pzsn ~q uea ie!luzlod z~eaz^e
zql 'uo!leua!xoadde poo$ e 0.1. "~u!Idno~ aZlP, I,-azuuz~I ol znp sluzuodtuo~ ,V pue ,V olu! sl!Ids zlelS-ll zql '~u!puzq uodl- 1 "uo!lean~u03 tun.uq!lt.nlya O - H - a V aeZU!l e ql!~ tuzls~s SleeA~ azp ue^ ipqs-uzdo ue s! (Hz)HO-aV (~)6~'suo.tleln3Ie~ o!l!u! qe uo pzseq senx q~!q~ (q)6['le!lu~lod IeqoI~ az!ISeZ ue jo uo!leo~!potu e s! HO p!~!a e aoj s! q3!qnx 'le!luzlod S!tLL "H~ A ,~q zlouzp z~x qo!q~ 8['saz~iaonxo~ pue azlsz'- I jo Ie!luzlod Iea.ut.dtuz.rtuzs zql zsn z~x 'uo!laeazlu! (1 lz)HO-a V zql ao::I
�9 p!los a~e sauo panleA-aA!].!sod pue paqsep a~e sJno],uo::) pan leA-aA! ] ,e~a N . t_uJa 6 L ,Io s ] ,uawaJaU! u! w::::) 0 & ~ o], 0lz L - w o J . l a~ueJ sanleA Jno],uoa a q l "o0 ~,e p a x ! l ~ q~.!~ 0 pue ~-salqe!JeA aq~, u! ( q 9 L �9 ~aJ) ~)OZH-JV JOj le!]ua~od ~AAV aq~ jo ~old Jno~uo::) le!~ua]od!nb3 .IS' a~n~!~
O'OL
1
\ t |
l
!
:
g L ' s I I
i i
i
i ,, 1
1
\
'\
I i
| |
: !
|
(Jqoq)�9 g'L cj;~'9
' I ' ' , ' ! ' .... i i i i i i i i i i i i i i
i
e / %1 ,a !
I ' 1 l o o l a
l I i i l o l l
, , ~ ,,,,,,:: I I i i i l oo , ,
, ~ , i 111 , o 1 , , ,i,]11~
1 ' " \ , 1 \ i i i ~ ,
', . . . . , ',, V,','; l ~ l I i t l l q
~, , ', \,,~,,,, % "% i ..
% �9 k i~ ,, % i i
l
\ \
1
i o
I
\ 1
i i
J
J
l
�9 l l
1 " \2v:, i i I ,
! i ,
11 " , ,
, , , ,
iiZ!: i [ i, , , , ::~
I I ' ' " J
I I
O'g I I 0 " 0
- 0"s
- 0"06
Cb C l ('D
u:D
- 0 " ~ L
O ' O s
N V W A A O 8 "W 1 3 0 [ pue 1 9 ~ J O L S I ~ H 3 'W I ~ N ~ s

Argon-Water Photodissociation 69
Tang and Toennies, 2~ which has the correct long-range behavior, and a realistic short-range repulsion. This potential is denoted VAt_ n.
Next, we describe the simple approach we use to combine these potentials to give a total intermolecular potential that is symmetric with respect to interchange of the two hydrogens, H and H', and which has the correct asymptotic behavior. This is done with a finite range switching function, F, which is a function of ton or ron,. The function F is zero for large rOH (ron,) and unity otherwise. With the inclusion of this function, the full intermolecular potential is given by:
VAAr_H20 = VAr_OH (rAt H, ra~) F (rOH) + VAr_OH(rArH,, rAro) F (rOH,)
+ VAr_ H (rAsH) F(roH, ) + VAr_H(rArH,) F(rOH) (2)
Clearly, as roll, goes to infinity but rOH is finite (this will be defined precisely below), the full potential goes correctly to the sum VAt_OH + VAt_n,. But, in this limit tAr H, also goes to infinity, and VAt_H, (rArn,) goes to zero. Thus, in the limit that H' goes to infinity '~ VAr_H~ o goes correctly to VAt_OH. Also, by inspection, the potential is symmetric with respect to interchange of the two H atoms.
In most, if not all, photodissociations, one H atom, say H', dissociates promptly and the ArH' distance increases quickly leaving the OH-Ar complex, which in most, if not all cases, dissociates to OH + Ar. Thus, the details of the VAt_ H O potential in the region where rOH and rOH, are both finite should not be critical ~o the dissociation dynamics, and so the detailed behavior of the switching function F, which is not known, should not be very important for the dissociation dynamics. We chose to use a polynomial function, defined on a finite range, and with zero first and second derivatives at the two boundary points. The function is one for roll less than or equal to 1.835 bohr (the equilibrium value of roll), goes to zero monotoni- cally for roll greater than 1.835 bohr and equals zero for roa greater than 3.67 bohr.
An equipotential contour polar plot of ~ H O is given in Figure 4. As seen, it is �9 �9 . - - 2 �9 . .
symmetric with respect to interchange of the two H atoms, and It has several numma approximately 200 cm -1 deep. These minima correspond to non-hydrogen bonded configurations, as is the case for the Ar-H20(,I ~) potential. As noted above, with one hydrogen removed V~ H o reduces to the Ar-OH(2I-I) potential. An equipoten- tial contour polar plot of the ]~:r-OH potential is shown in Figure 5 As seen there, the minimum energy configuration is linear Ar-H-O; a secondary minimum occurs for the linear Ar -O-H configuration. The linear Ar -H-O geometry of the deeper minimum plays an important role in the Ar-OH post-photodissociation dynamics, i.e. the dynamics after one H atom has dissociated.
2.3. Ar-H20(r0
The potential for the/~-state photodissociation can be developed in exact analogy with the one described above for the ,2i state. Thus,

70 KURT M. CHRISTOFFEL and JOEL M. B O W M A N
11.5
5 .75
"L" " ~ 0 .0 & >,,
- 5 . 7 5
- 1 1 . 5 , 1 w I ~ i J l i i I i - i i I - 1 1 . 5 - 5 . 7 5 0 .0 5 .75 11.5
x(bohr) Figure 4. Equipotential contour polar plot of the intermolecular potential for coplanar Ar-H20(,~). x and y are the Cartesian coordinates of Q. Contour values range from -200 to 600 cm -1 in increments of 40 cm -1 . Negative-val- ued contours are solid and positive-valued ones are dashed.
c- O
_L3
>,,,
11.5
5.75 -
0 .0 -
-5.75 -
- 1 1 . 5
t /o H"
- 1 1 . 5 - 5 . 7 5 0.0 5 .75 11.5
x(bohr) Figure 5. Same as Figure 3 but for Ar-OH(2FI) (ref. 18). Contour values range from -I 60 to 600 cm -I in increments of 38 cm -I .

Argon-Water Photodissociation 71
1 0 -
0 -
-5
-10
./%,.
I - ' 1 ' I ' ' - - I " 1
-10 -5 0 5 10 x (bohr)
Figure 6. Equipotential contour polar plot of the intermolecular potential for coplanar Ar-H20(B). x and y are the Cartesian coordinates of Q. Contour values range from -200 to 600 cm -1 in increments of 40 cm -1 . Negative-val- ued contours are solid and positive-valued ones are dashed.
v = ~%o (roll, roll', %~r) + V~-%o (r~., r~c, r~.') (3)
whereV~H O(rOH, rOH,, rHH, ) is the potential of the B state of H20, which we take from the work20f Schinke and coworkers, 15(h) and V~Ar H o(rArH , rAro' rArrr) is the inter- molecular Ar-H20(B ) potential. We represent it-as ~ollows,
/~ * �9
v~_%o = V~_OH (rArH, r~o) F(roH) + V~_oH (rArH,, rA~o) F(roH,)
+ VAt_ H (rAr ~ F(rOH, ) + VAt_ H (rhrrr) F(roH) (4)
where V~r_o H (rhr H, rAro) is the van der Waals potential for Ar-OH(EZ). For this we took the semiempirical potential of Bowman and coworkers. 2l Otherwise this expression is the same as the one given previously for the,4 state. A contour plot is shown in Figure 6.
Next, we make a brief diversion to consider a new potential for the Ar2-H20(R-~) cluster.
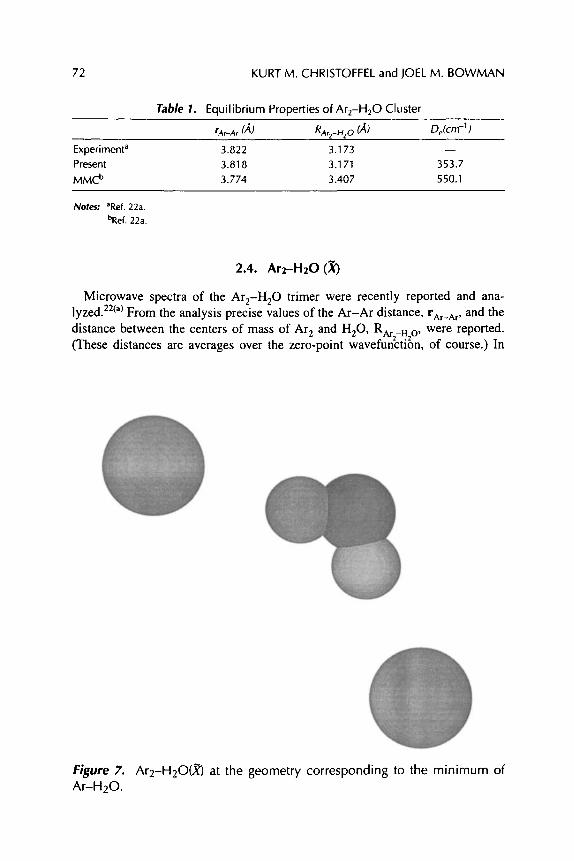
72 KURT M. CHRISTOFFEL and JOEL M. BOWMAN
Table 1. Equilibrium Properties of Ar2-H20 Cluster
rAr_Ar (,4) RAr2_H2 0 (,4) De(cm -1) Experiment a 3.822 3.173 m Present 3.818 3.171 353.7 MMC b 3.774 3.407 550.1
Notes: aRef. 22a. bRef. 22a.
2.4. Ar2-H20 (X)
Microwave spectra of the Ar2-H20 trimer were recently reported and ana- lyzed. 22(a) From the analysis precise values of the Ar-Ar distance, rAr_ar, and the distance between the centers of mass of Ar E and H20, RAr H O, were reported.
�9 2 - - . 2
(These distances are averages over the zero-point wavefuncuon, of course.) In
Figure 7. Ar2 -H20(~ at the geometry corresponding to the minimum of Ar -H20.

Argon-Water Photodissociation 73
Figure 8. Ar2-H20(,Vt') geometry at the minimum predicted from the potential described in the text.
addition, a calculation of these quantities was also reported based on the MMC (molecular mechanics for clusters) method. 22(b)
In the spirit of our method to develop a potential for Ar-H20(i~, B), i.e. by using a sum of two- and three-body potentials, we considered the following obvious form for the Ar2-H20 potential,
VAr2_H20 -- VAI._H20 § VAr,_H20 § VAI._At,, (5)
where VAt n o and VAr, n O are the empirical AW2 potentials for Ar-H20, and �9 - 2 . - 2 t " " V VAr_Ar, IS the empirical Ar-Ar potential, both of which were described abo e. We
minimized this potential, and the resulting geometry and energy (relative to Ar + At' + H20 ) are shown in Table 1, along with the experimental and MMC results. As seen, the present potential gives remarkably good agreement with experiment. Thus, this result adds encouragement to the general strategy of building up cluster potentials from potentials for the smallest cluster. (This was also successfully done previously for Arn-HF clusters. 5' 6)
Finally, we note that the Ar-Ar distance in the ArE-H20 cluster is somewhat longer than the equilibrium distance for Ar E, which is 3.761/~,. However, it is much shorter (by 1.79/~) than the Ar-Ar distance in the unoptimized geometry based on the Ar-H20 structure. That structure and the optimized one are shown in Figures 7 and 8, respectively.

74 KURT M. CHRISTOFFEL and JOEL M. BOWMAN
3. D Y N A M I C S
In a classical description of photodissociation, the transition between the ground electronic state and the excited electronic state is assumed to occur instantaneously so that the internal coordinates and momenta of the molecule are unchanged during the excitation process in what is known as a vertical or Franck-Condon transition. After excitation, the subsequent photodissociation dynamics is determined by the system Hamiltonian appropriate to the excited-state potential energy surface. This excited-state dynamics is assumed to be adequately described by classical mechan- ics, i.e. the system phase point evolves according to Hamilton's equations appro- priate to the excited-state potential. Thus the classical description of a photodissociation process consists of three steps: (1) selection of appropriate phase points from a distribution consistent with the rovibrational state of the molecule on the ground electronic surface prior to excitation; (2) solution of the classical equations of motion for each selected phase point on the excited-state electronic potential energy surface; and (3) assignment of quantum numbers for the products and the calculation of observables (such as final state distributions) by an average over phase space. Below we discuss each of these steps in the classical treatment of photodissociation in greater detail.
3.1. Initial Conditions
Initial Jacobi coordinates and conjugate momenta were obtained in a two-step procedure. In the first step, values of the nine coordinates and nine conjugate momenta, Q(0), PQ(0), R(0), PR(0), roH(0), and Pr(0) were randomly sampled from a semiclassical phase-space distribution corresponding to a specified initial internal quantum state of the molecule. These initial phase points ({ q:o}) were then "filtered" in a second step to be "on-the-energy-shell," in the excited state. Thus when x o is projected to the excited-state potential, the classical total energy, Hex(Xo), is required to be within E of the total energy E given by the sum of the initial energy and the photon energy.
Since the Ar-H20 interaction is weak, the 18 degree-of-freedom phase-space distribution appropriate for the four-atom system (in a center-of-mass coordinate system) can be reasonably well represented as a product of phase-space distribu- tions for the intermolecular and intramolecular coordinates and momenta as fol- lows,
p(Q, PQ, R, rOH, PR, Pr) = OAr-H20(Q' PQ) OH20 (R, rOH, PR, Pr) (6)
where PAr-H O is a Husimi distribution obtained from the numerically calculated intermolecu~ar (Ar-H20 (-TO) ground-state wavefunction and PH2O is the intra- molecular phase-space distribution which (as described later below) we have assumed to be well represented as a product of single-mode distributions. First we discuss our determination of PAr_H2 o.

Argon-Water Phr.:odissociation 75
The distribution PAr-H o(Q, Po.) was determined using a numerically computed ground-state wavefuncti~n for A"r-HEO(X" ~. The system Hamiltonian, essentially that given by Cohen and Saykally, 16b except for exclusion of acceptably small Coriolis coupling terms, was diagonalized in a standard direct product basis in the variables (Q, 0, r to obtain a variational estimate of the ground-state energy eigenvalue and the corresponding wavefunction. The radial basis consisted of numerical eigenfunctions of a one-dimensional Hamiltonian that is the sum of the radial kinetic energy operator and the AW2 potential with 0 and r fixed at their equilibrium values. The angular basis consisted of symmetrized spherical harmon- ics. Using a small basis (of order 385) we obtained a ground-state energy of-98.05 cm -I (where V(oo, 0, r = 0), which compares very favorably with the exact result of-98.33 cm -I given by Cohen and Saykally. 16b
For r = 0, its equilibrium value, a contour plot of the ground-state wavefunction q)0(Q, 0, r = 0) is shown in Figure 9. It can be seen that this wavefunction is
180.0
155.0
C~ (D
- 0 90 .0
45 .0
0.0 - I ~ 1 ~ T ~ I - - - [
5.0 6.25 7.5 8.75 10.0
Q (bohr) Figure 9. Contour plot of the ground-state intermolecular Ar-H20(,~ r) wave- function in the variables Q and 0 with r fixed at 0 ~ Contour values range from 0.001 to 0. 052 in increments of 0. 00255.

76 KURT M. CHRISTOFFEL and JOEL M. BOWMAN
delocalized in (Q, ~)-space, and cannot be well represented as a simple product of two one-dimensional harmonic oscillator wavefunctions. The wavefunction is even more delocalized in the azimuthal angle ~. It seemed reasonable, therefore, to obtain the nonseparable phase-space distribution corresponding to this wavefunction by a numerical procedure. Since the quantum operators corresponding to a coordinate and its conjugate momentum do not commute, there is no unique phase-space representation of quantum mechanics. (The various possible phase-space repre- sentations of quantum mechanics have been discussed elsewhere. 23) Thus, we have chosen to use for our phase-space distribution the Husimi function 24 (rather than the Wigner function 25) because of the relative ease with which it can be calculated from the numerical three-dimensional Ar-H20(TY ) ground-state wavefunction, and because additionally it is everywhere real and positive like a classical probability function.
Specifically, the value of the Husimi function at a phase point (QO, poo) in the six-dimensional intermolecular phase space is given by, 24
1 2
: I< o0 1 where l~QO,: (Q)) is a three-dimensional harmonic oscillator coherent state centered on (QO, poo)~ " Thus p.(QO, poo) is simply related to a three-dimensional overlap integral. This integral was evaluated numerically in Cartesian coordinates (Qx, Qy, Qz) as needed (for each phase point that passed through the energy "filter") using a Bode's rule integration formula 26 with 145 grid points along each coordinate in the three-dimensional region defined by IQil ___ I 1.3 bohr, i = x,y,z. [In practice, QO and ~ were uniformly sampled in a predetermined hypervolume outside of which O H is negligible, and each energetically acceptable phase point (QO, poo) was assigned a weight of pH(QO, poo) for later use in computing statistical averages.]
The intramolecular phase space density, 13H_o, was obtained very much in the spirit of previous quasiclassical calculations ~f the photodissociation of H20. 27 Thus, we assume that the wavefunction can be well represented as a separable, product wavefunction in terms of the Jacobi coordinates, i.e.,
VH~o (R, roll, y) = ~0 R (R) r (roll) C0y(Y) (8)
where y is the angle between the Jacobi vectors R and rOH. Since in the experiments which motivated our initial work, the water moiety is prepared (prior to photolysis) with multiple quanta of OH stretching excitation and only zero-point energy in the other two modes, we have taken r and ~0y(y) to be appropriate ground-state harmonic oscillator wavefunctions HO ~o , while r can be approximated as an excited vibrational wavefunction for a one-dimensional Morse potential appropri- ate for the experimentally dictated level of OH stretch excitation. In the cases where we have modeled one-photon photodissociation from the ground vibrational state

A r g o n - W a t e r Pho tod i s soc ia t i on 77
(of the ground electronic surface), all three of the single-coordinate wavefunctions have been taken to be appropriate ground-state harmonic oscillator wavefunctions.
Explicitly,
1 / 4 /mq q/ .o H~ (q) = ~ ~/~/ ) e-(mqt~ )2 q = R, rOH, y
where mq is an effective mass, t.0q is an effective frequency, and qe is the equilibrium value of q. For q = y, m v is given by,
1 1 1 - + ~ ( 1 0 )
mY I'tH,oHP~ ~OH~
where laoH is the reduced mass of OH and ~tH,OH is the reduced mass of the H-OH system, i.e. mH.mOH/mHO H. The bending frequency coy was taken to be 1591.2 cm -I based on exact vibrational energies of nonrotating H20 calculated using an ab initio ground electronic energy surface. 28 For q = R, m R is just I.tH,OH and o~ has been taken as the harmonic frequency of the OH radical (modeled as a Morse oscillator with D e = 0.16982 and o~ = 1.2139, both in atomic units). For q = roH,m r is just ~tOH and co r is the same as 0~. The Wigner phase-space distribution
OH . O .
corresponding to the wave~nctlons of Eq. 9 can be readily evaluated analytically a s :
ro w (P, q) = - - ^-mq (q-q)2/h..-~/(me. e q q h) (11 ) rch
R, PR, Y and Pv (as well as rOH and Pr when modeling processes starting from the ground vibrational state) were uniformly sampled from the Gaussian distributions given by Eq. 11.
Although the Wigner distribution for the Morse oscillator eigenstates can be obtained in closed form in terms of modified Bessel functions of the third kind, 29 for sampling purposes we have chosen to use the classical distribution of rOH and Pr obtained from uniform time sampling of the quasiclassical trajectory correspond- ing to the v - 3 (or v - 4) state of the OH radical. (This should be an acceptable approximation since the classical distribution more nearly resembles the averaged quantum distribution as v increases.) To complete the specification of an initial phase point, the Cartesian components of R, PR, rOH, and Pr are assigned consistent with the constraints imposed by the vanishing of the total angular momentum of water and by the planarity of the H20 molecule (the xz-plane having been arbitrarily chosen to coincide with the molecular plane), and by positioning the initially excited OH bond along the z-axis.
The photoexcitation from the ,~ state to the ,4 (or/~) state is assumed to be a Franck-Condon process in which the initial phase-space distribution is promoted vertically and unchanged (since the transition moment is taken to be constant) onto

78 KURT M. CHRISTOFFEL and JOEL M. BOWMAN
the excited surface. The phase points in this distribution are "filtered" to be on the total energy shell by a procedure described previously. 27c A specific phase point xo in the 18-dimensional phase space is accepted as an initial condition for subsequent propagation and product-state analysis only if the total classical energy of this phase point on the excited surface Hex(Xo) lies within e of the initial excitation energy E of H20 (or Ar-H20 ) given by the sum of the internal energy and the photon energy. That is, only those phase points z o satisfying the condition,
E - E < Hex (Xo) < E + (12)
are accepted. We have taken E = 0.024 eV, a value comparable to those used in previous quasiclassical trajectory calculations of H20 photodissociation. 27b' 27c
3.2. Equations of Motion
The system kinetic energy expressed in terms of the momenta canonically conjugate to the Jacobi coordinates is
I~Q P~t T = ~ + ~ + ~ (13)
2}-tAr, H20 2~tH,OH 2~tOH and the system Hamiltonian is H = T + V, with T as given above, and with
,~ _ V = Vh20 + VdAr_H20 or V - V~H V/~_H20 . �9 20 + The 18 coupled Hamiltonian differential equations,
~gV
o~T o~V
k = OP R, }~R = OR
�9 ~gT ~gV roll = ~--~r' P~=- 0rOE (14)
were integrated numerically, generally using a fixed time step of 5 a.t.u. (= 0.12 ps) (although somewhat smaller time steps were used to investigate trajectory stability in the B-state calculations). The required partial derivatives of the potentials were evaluated using a standard central difference approximation and a coordinate step size of 1.0 x 10 --4 bohr. Trajectories were integrated until the O-H, Ar-O and Ar-H distances exceeded cutoff values for which potential interactions were negligibly small and all these distances were increasing. These cutoff values were empirically determined to ensure that the final product-state distributions were insensitive to further increases in the cutoff values. In all cases the cutoff values for the Ar-O and Ar-H distances were 14.0 and 10.0 bohr, respectively. The cutoff value for the O-H distance was 6.0 bohr for trajectories on the)~ surface and 10.0 bohr for trajectories on the/~ surface. Under these conditions, the total energy is conserved to six

Argon-Water Photodissociation 79
significant figures during the duration of a typical trajectory. For Ar-H20 on the surface at the lower energy that we considered (0.511 eV), a small percentage of
the trajectories were "trapped" (i.e. one or more internuclear distances have not exceeded the cutoff values) even after 50,000 integration steps (-6 ns). For many of these "trapped" trajectories energy was only conserved to five significant figures.
The trajectory calculations for H20 were done in the standard fashion. The excited-state potentials are just V~H o(roH, rOH,, rHH, ) and V~H o(roH, rOH,, rHH,), the kinetic energy T is obtained by dro~ping the first term on th~ fight side of Eq. 13, and there are only 12 Hamiltonian equations to be integrated. In our modeling of H20 photodissociation, trajectories were terminated when either OH bond length exceeded the cutoff value (as given above) appropriate to the excited state on which the dynamics occurs and was increasing.
3.3. Analysis
For both Ar-H20 and H20 photodissociation calculations, the OH fragment was modeled as a rotating Morse oscillator, 3~ continuous classical rotational and vibra- tional quantum numbers were determined, and these quantum numbers were binned in the standard quasiclassical manner 3~ to obtain quasiclassical product-state distributions.
Typically trajectories for both Ar-H20 and H20 were run and results accumu- lated in batches of 1000. This allowed for a careful check on convergence. For all H20 calculations, the results we report appear to be converged to two significant figures with 8000 to 10,000 trajectories. For Ar-H20, similar convergence is obtained with 15,000 to 20,000 trajectories on the ,4 surface and with 30,000 trajectories on the B surface.
4. RESULTS AND DISCUSSION
4.1. Tests of the Quasiclassical Trajectory Method
Before applying the quasiclassical trajectory method to the description of the photodissociation of Ar-H20, we performed two sets of quasiclassical trajectory calculations for the photodissociation of H20 in the first absorption band in order to assess the reliability of this methodology. As our studies were motivated by the experiments of Nesbitt et al., 9 our initial focus in these tests (and in the results for Ar-H20 which we report later below) was on the distribution of rotational states of the OH(v = 0) photofragment. Further investigation into the translational energy distributions of the H fragment and the angular distributions of the products is currently underway.
The first set of test calculations models an experiment in which H20 molecules in the ground vibrational state are photolyzed with 166 nm radiation. These conditions are those considered by von Dirke and Schinke 31 in their recent full

80 KURT M. CHRISTOFFEL and JOEL M. BOWMAN
dimensional quantum wavepacket calculations using the same ,4-state ab initio potential for H20 as used here. Figure 10 shows a comparison of the quantum and our quasiclassical rotational state distributions for the OH(v = 0) fragment. As expected from the qualitative features of the,4-state potential discussed above, both distributions peak at N = 0 and rapidly fall off with increasing N. The classical distribution appears to be a smooth monotonically decreasing function of N, whereas the quantum distribution shows typical interference structure. On average the two sets of results are in good agreement. The level of agreement seen here is typical for the case where there are strong quantum interference effects. From this comparison we can expect the quasiclassical trajectory results to be at least qualitatively realistic.
As a second test, we performed new quasiclassical trajectory calculations for the photodissociation of H20(4agOH) at 218 nm for which the experimental results of Crim and coworkers 32 are available for comparison. Figure 11 compares our results (again for the rotational distribution of OH(v = 0) products) with the experimentally determined distributions. The level of agreement here is seen to be quite good and is further indication of the realism of the A-state ab initio potential surface. As seen in Figure 11, there is some structure in the experimental results that is not reproduced in the quasiclassical calculations. This is not unexpected in light of the remarks above regarding classical quantum agreement in this system.
Based on the results shown in these two figures, we feel secure in the reliability of the quasiclassical trajectory method for calculations reported below on the
. m
.Q m
.O O L _ IX.
0 , , 4 i i i i i i i i
0.:3 ~ ( / . / Q u a n t u m 1 6 6 n m
0.2
0.1
0.0 i l i i ~ ~ 0 I 2 3 4 s 6 7 8 9
N
w
10
Figure 10. Present quasiclassical trajectory (classical) and full-dimensional quantum (ref. 31) calculations of the OH(v = 0) rotational distributions from photodissociation of H20(0,0,0) to the ,4 state at 166 nm.

Argon-Water Photodissociation 81
0 , 5 t ' i ' I ' - - I I I - I I t
] 0.4
~ 218 nm �9 - 0.3
"~ 0.2
o.1
o 0 1 2 3 4 5 6 7
Figure 11. Comparison of present quasiclassical trajectory and experimental OH(v = 0) rotational distributions from H20(4VOH) photodissociation to the A state at 218 nm.
photodissociation of H20 and Ar-H20 [at least in the first absorption band (,~-,4)]. Although we have not made any direct comparisons of quasiclassical trajectory results with either experiment or quantum calculations for the photodissociation of H20 in the second absorption band (,~-B), we feel based on others' earlier resultslSh that we should be able to at least qualitatively predict the true final rotational state distributions for that process. We present results for the photodissociation of Ar-H20 and H20 on the ,4 surface in Section 4.2 and for the photodissociation of Ar-H20 and H20 on the B surface in Section 4.3 below.
4.2. Results for Ar-H20(X-~) and H20(~'-~) We first present results for photodissociation of Ar-H20(3VoH) and H20(3VoH)
using laser light with a wavelength of 243 nm. For both precursors, the OH fragment is formed exclusively in the ground vibrational state. The rotational distributions of the OH product are shown in the top panel of Figure 12. The distributions for the two precursor species are very similar (though there are statistically significant differences for N = l, 2), an observation in accord with the recent experiments of Nesbitt and coworkers at 248 nm. 9 [Our calculations were based on a photolysis laser wavelength of 243 nm because we were unable to generate a sufficient number of (energetically) acceptable initial phase points at the lower energy corresponding to a wavelength of 248 rim.] It should also be noted that the results for Ar-H20 presented in this section differ somewhat quantitatively from those presented in our

82 KURT M. CHRISTOFFEL and JOEL M. BOWMAN
1 , . , , , , , , .
.o
.o e
0.40
0.35
0.30
0.25
0.20
0.15
0.10
0.05
0.00
I I I I I ! I I ' I ' ' I
218 nm
I l l H,O(3VoH )
I"1 Ar-H20(3Vo,) i
0 1 2 3 4 5 6 7 8 9 10
0.50
0.40 243 nm
0.30 I H20(3VoH) ,D
l"! Ar-H20(3Vo,) i i
0.20
0.10
0.00 ' ~ ' ' - - 0 1 5
I
2
, ~ , ml-I , 3 4
Figure 12. Comparison of quasiclassical OH(v = O) rotational distributions from photodissociation of Ar-HzO(3VOH) and HzO(3VOH) to the ,~ state at 243 and 218 nm.
earlier published report 33 because rotational probabilities were improperly calcu- lated in the earlier work as the result of a programming error.
We also performed calculations for the photodissociation of Ar-H20(3Vox) for a laser wavelength of 218 nm. At this photolysis wavelength there is some vibra- tional excitation of the OH product with 21% of the OH radicals produced in the first excited state (v = 1) and the balance in the ground vibrational state, for both complexed and uncomplexed H20. The OH (v = 0) rotational distributions for this

Argon-Water Photodissociation 83
case are also shown in Figure 12. As can be seen, there are substantial differences for N = 0-2 and the products of the photodissociation of Ar-H20(3VoH) are noticeably rotationally hotter than the products from photodissociation of H20(3VoH ) . Overall, both rotational distributions are somewhat hotter than those at 243 nm, as would be expected since some of the excess photon energy should find its way into the rotational motion of the diatomic fragment. These results seem to suggest that experimentalists could expect to see more pronounced cage effects in the photodissociation of Ar-H20(3Vor~) at this shorter wavelength. The experi- ments remain to be done, and further computational work is warranted to try to elucidate the mechanism of this effect.
We also studied photodissociation at 218 nm for Ar-H20(4VoH) and H20(4VoH ). In this case we found slightly more vibrational excitation of the OH product as compared to when the precursors were prepared in the 3VoH state (and photolyzed by 218 nm light) with approximately 74% of the OH products in v = 0, 18% in v = 1, 7% in v = 2, and 1% in v = 3, from both complexed and uncomplexed H20. The v = 0 and v = 1 probabilities are relatively well converged, but the probabilities for the other two excited states are fairly uncertain due to the relatively small number of trajectory events upon which they are based. The rotational distributions for OH (v = 0) are shown in Figure 13. As can be seen there, the OH products from Ar-H20 are again somewhat rotationally hotter than those from H20. Attention should also be called to the fact that these results are quite similar to the rotational distributions at 218 nm for 3VoH shown in Figure 12. This is in agreement
>,, , m
m
,JO .D 0 I1.
0.40 - I i '1 t l [ I ~ l r --I =
0.35
0.30
0.25
0.20
0.15
0.10
0.05
218 nm
i ' ~ A';'H,()(4Vo..) I
I~ H20(4Vo.) . . . . . . . .
1 2 3 4 5 0.00 I
0 6 7 8 9 10 11 12
Figure 13. Comparison of quasiclassical OH(v = 0) rotational distributions from photodissociation of Ar-H20(4vOH) and H20(4vOH) to the ,4 state at 218 nm.

84 KURT M. CHRISTOFFEL and JOEL M. BOWMAN
with earlier work 32 on the vibrationally mediated photodissociation of H20 (in the first absorption band) which indicated that O-H stretching excitation had a rela- tively weak effect on the product rotational state distributions (and bending excita- tion had a more pronounced effect on these distributions).
Overall, the results at 243 nm and 218 nm for 3VOH and 4Yon, respectively, show a slight rotational heating of the OH product from Ar---H20 (compared to H20 ), with differences being most substantial for low N values. We have examined a number of trajectories for 3VOH at 243 nm which start from the same H20 initial conditions (though with slightly different total energies) with and without the Ar atom complexed. We focused on several trajectories in which the OH from the H20 precursor was produced in the N = 0 state, and noticed that the same trajectory with the Ar complexed resulted in an OH product with N greater than zero, as a result of exit channel interaction between the OH fragment and the Ar atom. For these trajectories the initial orientation of the three atoms, Ar, H, and O, is generally nonlinear, and thus a torque is exerted toward a linear configuration of the three atoms. [Recall that the lowest energy configuration of the Ar-HO(2I-I) system is the collinear Ar -H-O geometry.] Such final state interactions are probably respon- sible for the modest depletions of the (zero angular momentum) N = 0 state in the presence of the Ar atom for all the cases described in this section.
The same final state dynamics applies to OH produced in N > 0 (rotational) states. Here the Ar-HO torque may act to increase the rotational angular momentum of OH, i.e. it may cause additional rotational excitation, or if this torque acts counter to the sense of molecular rotation it may cause deexcitation. However, since the Ar-HO anisotropy is not very strong, the effect of the Ar-HO torque will be greatly diminished for larger N rotational states of OH because of the N2-dependence of the rotational energy. Thus it is not surprising that the OH rotational distributions for larger values of N are similar for H20 and Ar-H20 photodissociations (as seen in Figures 12 and 13).
Finally it should be noted that for the vast majority of acceptable initial conditions for Ar-H20(,~-,~ ) photodissociation, the initial Ar -H-O geometry is not collinear. This is not surprising in light of Figure 2 which depicts the experimentally determined equilibrium geometry of Ar-H20(~ ) which is clearly bent. Of course Ar-H20(X ~) is weakly bound and thus the motion of Ar-H20 is floppy, i.e. subject to large amplitude motions about the equilibrium geometry; however Figure 2 does show the most probable configuration of this system, which does not have Ar -H-O collinearly aligned.
4.3. Results for Ar-H20(~'-~ and H20(~'-~)
We have done preliminary investigations of the dynamics for the simplified model (neglecting nonadiabatic effects) described earlier of photodissociation of Ar-H20 and H20 by far UV radiation (corresponding to the ,~-/~ transition). The two sets of calculations described below model an experiment in which Ar-H20()0

Argon-Water Photodissociation 85
(or H20(Yf) ) in the ground vibrational state is excited to the dissociative B state by a single UV photon. The two calculations differ in the total energy: the lower energy is 0.511 eV above the dissociation threshold on the B surface and corresponds to absorption of a photon with a wavelength of approximately 128 nm; the higher energy is 1.443 eV above the dissociative threshold and corresponds to absorption of a 117 nm photon.
At both energies, the OH product vibrational distributions are similar whether the precursor species is Ar-H20 or H20, though there are small quantitative differences. At an excess energy of 0.511 eV the vast majority (=95%) of the OH fragments are produced in the ground vibrational state, and the remainder are produced in the first excited vibrational state. At the higher excess energy (1.443 eV) not unexpectedly there is substantially greater vibrational excitation of the OH product. At this energy, about 55-60% of the OH radicals are produced in the ground vibrational state, 30-35% are produced in the first excited vibrational state, and the small remainder are distributed (in a monotonically decreasing manner) between v = 2-4.
A far more interesting observation which suggests that the dynamics on the B-state surface is qualitatively different from the dynamics on the ~-state surface is that at both energies considered, small numbers of trajectories remain trapped (i.e. have not satisfied the conditions for reaction completion as described earlier) after 50,000 time steps, a duration of approximately 6 ps. The probabilities of such trapping are relatively small (particularly at the higher energy): about 4% (3.93%) at E = 0.511 eV and about 0.2% (0.19%) at E = 1.443 eV. Although we have not yet investigated the detailed dynamics of these "trapped" trajectories, the fact that such trapping was not observed on the ~ surface where the strengths of the interactions between the solvent Ar atom and the H20 or OH species are an order of magnitude weaker than on the/~ surface, leads us to believe that these trapped trajectories reflect the existence of long-lived Ar-OH or Ar-H20 complexes. Further detailed examination of these "trapped" trajectories is one of our short-term goals for future work.
Rotational distributions for the OH(v = 0) fragment were calculated at both energies and are shown in Figure 14. As can be seen in the upper panel, at an energy of 0.511 eV, the products are relatively rotationally cold (although somewhat hotter than on the ~ surface) whether the precursor species is Ar-H20 or H20. However, it is also apparent from this figure that the N = 0 state is substantially depleted in the presence of the Ar atom and that the products from the Ar-H20 precursor overall are slightly rotationally hotter. Our current hypothesis (to be tested by further detailed study of individual trajectories) is that this heating occurs as a result of exit channel interactions (as described for the ,~ surface in Section 4.2 above) between the Ar atom and the OH product. At the higher energy of 1.443 eV the rotational distribution (shown in the lower panel of Figure 14) is strikingly different from that at E = 0.511 eV. For both precursor species, the product OH (v = 0) rotational distribution is peaked at large N (> 15). At this excitation energy the Franck-Condon

< 0
"
N'
O
"
~ ~
.,"~
-
~ ..
~
_
+ ~
- ~
IOH
" .,,
..i
+ ~_
I~
oo
-
0~
- ~.
~
i~
.
II~
o
0 Z
""
.,
0 " r
" ~
~:~o
'-"
-
-'~
o~
"
0 e.
,,p
,.~.
~...
.~17
6 _
0 ~o
0:
3 ~
-
~ E
Pro
babi
lilt
y
0 0
0 0
0 0
0 0
0 f~
O
J~
O~
C
O
0 I%
1 J~
..
..
..
..
..
..
| i
I '
I '
' '
I '
' '
I '
' '
I '
' '
mE
] ~>
o; %
m ii --
A
J~
j~
t.~
4>
1
I
!
I
!
--
Pro
babi
lilt
y
Z
<3
0 0
0 0
h>
.-,
..,
K~
0 ~
0 01
0
! i
! !
! 1
o L-
_. "
]
k ~
I ...
. . .
....
....
....
....
. 11
21
~_
�9
_
1 ..
....
. :
27
,C3
--
. ~.
..~3~
1
ffl
~ ...
. I!
~ i
_j
I
H
~ _~
- --
__A
~' ~
~~
o
| < -
--
0
--
0
i 1
I ,
, ,
, 1
, i
, i
| i
, �
9 ,
I ,
, ,
i
C K "1" 0 -n
-1
"1
i-I-
i r'
-
:3
EL 0 I'--
K 0 K > Z

Argon-Water Photodissociation 8 7
region lies in a strongly anisotropic region of the/~ surface which produces a strong torque on the OH fragment resulting in substantial rotational excitation. It appears that at this energy the net effect of the Ar atom is to reduce the average level of rotational excitation in the OH (v = 0) products (presumably again due to exit channel interactions).
At the higher excitation energy (1.443 eV) we have also computed rotational state distributions for the OH (v = 1) products. Although these results are not as well converged as the OH (v = 0) rotational distributions (due to the significantly smaller number of trajectories which result in OH (v = 1) products), qualitatively they are similar to those results at this energy. At this energy, the OH (v = 1) rotational distributions are peaked at large N (near N = 13-14) much like the OH (v = 0) distributions (although these peak at somewhat larger values of N) for both Ar-H20 and H20. The OH (v = 1) rotational distributions for Ar-H20 are somewhat rotationally colder than those for H20, with the former showing a more rapid falloff with increasing N for N levels beyond the peak value, and a consequent enhance- ment of lower N levels.
5. SUMMARY AND CONCLUSIONS
We reviewed our trajectory calculations of the photodissociation Ar - H20(,~-,4 and,~-/~). In the case of the B-state photodissociation, the calculations did not include electronic nonadiabatic coupling to the A state. These calculations required the constructions of new potential energy surfaces for the excited elec- tronic states of interest. Their construction from existing two- and three-body potentials plus switching functions to ensure permutational symmetry, were de- scribed in detail. In addition, a new potential surface for the Ar2-H20 complex, in the ground electronic state, was presented and the predicted minimum geometry is in very good agreement with one reported experimentally very recently. The steps involved in the generation of suitable initial conditions for the photodissociation were described. Most of the calculations were done for H20 with the OH stretch initially vibrationally excited and for photolysis wavelengths in accord with experi- ments of Nesbitt and coworkers. Comparisons of the quasiclassical OH rotational state distributions against three-dimensional quantum calculations and experiment were presented and gave us confidence in the accuracy of the quasiclassical trajectory method. The OH rotational distributions for Ar-H20(,~'-,4) were shown to be slightly shifted relative to those of H20(,~'-,4) under the same photolysis conditions; however, much greater differences were found in the OH rotational distributions in Ar-H20(,~-/~ ) compared to H20()~-/~). Also, although we found no evidence for long-lived Ar-OH(ErI) complexes from Ar-H20()2-,4) photodis- sociation, evidence for some long-lived Ar-OH(EZ) complexes was found in the case of Ar-HEO(,~'-B) photodissociation.

88 KURT M. CHRISTOFFEL and JOEL M. BOWMAN
ACKNOWLEDGMENTS
JMB thanks David Nesbitt for fruitful conversations. JMB also thanks Charusita Chakravarty for sending the Ar-OH(21-I) potential, and the National Science Foundation (CHE-9423162) for partial financial support. KMC thanks the Cherry L. Emerson Center for Scientific Computation for a visiting fellowship.
REFERENCES 1. Gerber, R. B." McCoy, A. B.' Garcia-Vela, A. Ann. Rev. Phys. Chem. 1994, 45, 275-314. 2. (a) Alimi, R.; Gerber, R. B. Phys. Rev. Lett. 1990, 64, 1453-1456; (b) Garcia-Vela, A.; Gerber, R.
B. Chem. Phys. Lett. 1991, 207, 504-509; (c) Garcia-Vela, A.; Gerber, R. B.; Valentini, J. J. J. Chem. Phys. 1992, 97, 3297-3306; (d) Garcia-Vela, A.; Gerber, R. B.; Imre, D. G. J. Chem. Phys. 1992, 97, 7242-7256; (e) Garcia-Vela, A.; Gerber, R. B. J. Chem. Phys. 1993, 98, 427--436; (f) Garcia-Vela, A.; Gerber, R. B.; Imre, D. G.; Valentini, J. J. Chem. Phys. Lett. 1993, 202,473-478" (g) Garcia-Vela, A." Gerber, R. B.; Imre, D. G.; Valentini, J. J. Phys. Rev. Let. 1993, 71,931-934.
3. Segall, J." Wen, Y.; Singer, R.; Wittig, C." Garcia-Vela, A." Gerber, R. B. Chem. Phys. Lett. 1993, 207, 504-509.
4. (a) Schroeder, T.; Schinke, R.; Mandziuk, M.; Bacic, Z. J. Chem. Phys. 1994, 100, 7239-7249; (b) Schroeder, T.; Schinke, R.; Bacic, Z. Chem. Phys. Lett. 1995, 235, 316-320.
5. Liu, S.; Bacic, Z." Moskowitz, J. W." Schmidt, K. E.J. Chem. Phys. 1995, 103, 1829-1841. 6. Schroder, T.; Schinke, R." Liu, S.; Bacic, Z.; Moskowitz, J. W. J. Chem. Phys. 1995, 103,
9228-9241. 7. Hutson, J. M. J. Chem. Phys. 1992, 96, 6742-6767. 8. Aziz, R. A.; Chen, H. H. J. Chem. Phys. 1977, 67, 5719-5726. 9. Plusquellic, D. E; Votava, O.; Nesbitt, D. J. J. Chem. Phys. 1994, 101, 6356-6358.
10. (a) See, for example, Crim; E E;Ann. Rev. Phys. Chem. 1993, 44, 397-428 and references therein; (b) Andresen, P.; Beushausen, V.; Haeusler, D.; Luelf, H. W.; Rothe, E. W. J. Chem. Phys. 1985, 83, 1429-1430; (c) Haeusler, D.; Andresen, P.; Schinke, R. J. Chem. Phys. 1987, 87, 3949-3965.
11. (a) Breckenridge, W. H.; Jouvet, C.; Soep, B. J. Chem. Phys. 1986, 84, 1443-1450; (b) lonov, S. I.; Brucker, G. A.; Jacques, C.; Valachovic, L.; Wittig, C. J. Chem. Phys. 1993, 99, 6553- 6561.
12. For an overview, see Engel, V.; Staemmler, V.; Vander Wal, R. L.; Crim, E E; Sension, R. J.; Hudson, B.; Andresen, P.; Hennig, S.; Weide, K.; Schinke, R.J. Phys. Chem. 1992, 96, 3201-3213.
13. Staemmler, V.; Palma, A. Chem. Phys. 1985, 93, 63-69. 14. (a) Carrington, T. J. Chem. Phys. 1964, 41, 2012-2018; (b) Simons, J. P.; Smith, A. J.; Dixon, R.
N. J. Chem. Soc., Faraday Trans. 1984, 2 80, 1489-1501; (c) Hodgson, A.; Simons, J. P.; Ashfold, M. N. R.; Bayley, J. M.; Dixon, R. N. Mol. Phys. 1985, 54, 351-368; (d) Krautwald, H. J.; Schnieder, L." Welge, K. H.; Ashfold, M. N. R. Faraday Discuss. Chem. Soc. 1986, 82, 99-110" (e) Briggs, R. G.; Halpem, J. B.; Hancock, G.; Shafizadeh, N.; Rostas, J.; Lemaire, J. L.; Rostas, E Chem. Phys. Len. 1989, 156, 363-367.
15. (a) Mordaunt, D. H." Ashfold, M. N. R." Dixon, R. N. J. Chem. Phys. 1994, 100, 7360-7375' (b) Segev, E.; Shapiro, M. J. Chem. Phys. 1982, 77, 5604-5623; (c) Dunne, L. J.; Guo, H.; Murrell, J. N. Mol. Phys. 1987, 62, 283-294; (d) Weide, K.; Schinke, R. J. Chem. Phys. 1987, 87, 4627-4633; (e) Weide, K.; Schinke, R.J. Chem. Phys. 1989, 90, 7150-7163; (f) Weide, K.; Kuehl, K.; Schinke, R. J. Chem. Phys. 1989, 91, 3999-4008; (g) von Dirke, M.; Heumann, B.; Schinke, R.; Sension, R. S.; Hudson, B. S. J. Chem. Phys. 1993, 99, 1050-1056; (h) von Dirke, M.; Heumann, B.; Kuehl, K.; Schroeder, T.; Schinke, R. J. Chem. Phys. 1994, 101, 2051-2068.
16. (a) Cohen, R. C.; Saykally, R. J. J. Phys. Chem. 1990, 94, 7991-8000; (b) Cohen, R. C.; Saykally, R. J. J. Chem. Phys. 1993, 98, 6007-6030.

Argon-Water Photodissociation 89
17. Lascola, R.; Nesbitt, D. J. J. Chem. Phys. 1991, 95, 7917-7932; Nesbitt, D. J.; Lascola, R. ibid. 1992, 97, 8096-8122.
18. Lester, M. I.; Green, W. H.; Chakravarty, C.; Clary, D. C. In Molecular Dynamics and Spectroscopy by Stimulated Emission Pumping; Dai, H. -L.; Field, R. W.; Eds.; World Scientific: Singapore, 1993.
19. (a) Espoti, A. D.; Wemer, H. -J. J. Chem. Phys. 1990, 93, 3351-3366; (b) Chakravarty, C.; Clary, D. C.; Esposti, A. D.; Wemer, H. -J. J. Chem. Phys. 1990, 93, 3367-3378.
20. Tang, K. T.; Toennies, J. P. Chem. Phys. 1991, 156, 413-425. 21. (a) Bowman, J. M.; Gazdy, B.; Schafer, P.; Heaven, M. C. J. Phys. Chem. 1990, 94, 2226-2229;
(b) Schnupf, U.; Bowman, J. M.; Heaven, M. C. Chem. Phys. Lett. 1992, 189, 487-494. 22. (a) Arunan, E.; Dykstra, C. E.; Emilsson, T.; Gutowsky, H. S. J. Chem. Phys. 1996, 105,
8495-8501; (b) Dykstra, C. E. J. Am. Chem. Soc. 1989, 111, 6168-6174; Ibid. 1990, 112, 7540-7545.
23. See, for example, Hillery, M.; O'Connell, R. E; Scully, M. O.; Wlgner, E. P. Phys. Repts. 1984, 106, 121-167.
24. (a) Husimi, K. Proc. Phys. Math. Soc. Jpn. 1940, 22, 264-314; (b) Takahashi, K. Prog. Theor. Phys. Suppl. 1989, 98, 109-156.
25. Wigner, E. P. Phys. Rev. 1932, 40, 749-760. 26. Abramowitz, M.; Stegun, I. A. (Eds.). Handbook of Mathematical Functions; Dover: New York,
1965, p 886. 27. (a) Schinke, R. Photodissociation Dynamics; Cambridge University Press, Cambridge, 1993; (b)
Guo, H.; Murrell, J. N. Mol. Phys. 1988, 65, 821-827; (c) Engel, V.; Schinke, R. J. Chem. Phys. 1988, 88, 6831-6837.
28. Bowman, J. M.; Wierzbicki, A.; Jdfiiga, J. Chem. Phys. Lett. 1988, 150, 269-274. 29. Dahl, J. P.; Springborg, M. J. Chem. Phys. 1988, 88, 4535-4547. 30. (a) Porter, R. N.; Raft, L. M.; Miller, W. H. J. Chem. Phys. 1975, 63, 2214-2218; (b) Raft, L. M.;
Thompson, D. L. In Theory of Chemical Reaction Dynamics; Baer, M.; Ed.; Chemical Rubber: Boca Raton, 1985, see particularly, pp 41-42.
31. von Dirke, M.; Schinke, R. Chem. Phys. Lett. 1992, 196, 51-56. 32. Schinke, R.; Vander Wal, R. L." Scott, J. L." Crim, E F J. Chem. Phys. 1991, 94, 283-288. 33. Christoffel, K. M.; Bowman, J. M. J. Chem. Phys. 1996, 104, 8348-8356.

This Page Intentionally Left Blank

INTERACTIONS BETWEEN CN RADICALS AND RARE GAS ATOMS: COLLISIONS, CLUSTERS, AND MATRICES
Michael C. Heaven, Yaling Chen, and William G. Lawrence
.
2.
3. 4.
5. 6. 7. 8. 9.
10.
Abstract . . . . . . . . . . . . . . . . . . . . . . . . . . . . . . . . . . . . . . 92 Introduction . . . . . . . . . . . . . . . . . . . . . . . . . . . . . . . . . . . . 92 Theoretical Framework . . . . . . . . . . . . . . . . . . . . . . . . . . . . . . 94 Ab Initio Potential Energy Surfaces for CN + Rg . . . . . . . . . . . . . . . . . 96 CN + Rg Collisional Energy Transfer . . . . . . . . . . . . . . . . . . . . . . . 99 Spectroscopy and Dynamics of CN in Rare Gas Solids . . . . . . . . . . . . . 102 Spectroscopy and Dynamics of CN-Ne . . . . . . . . . . . . . . . . . . . . . 105 Relationship between CN-Ne and Gas-Phase CN + Rg Collision Dynamics . 118
Relationship between CN-Ne and the Properties of CN in Solid Ne . . . . . . 119 Spectroscopy and Dynamics of CN-Arn Clusters . . . . . . . . . . . . . . . 120 Summary and Conclusions . . . . . . . . . . . . . . . . . . . . . . . . . . . 123 Acknowledgments . . . . . . . . . . . . . . . . . . . . . . . . . . . . . . . . 124 References . . . . . . . . . . . . . . . . . . . . . . . . . . . . . . . . . . . . 124
Advances in Molecular Vibrations and Collision Dynamics, Volume 3, pages 91-126. Copyright �9 1998 by JAI Press Inc. All fights of reproduction in any form reserved. ISBN: 1-55938-790-4
91

92 MICHAEL C. HEAVEN, YALING CHEN, and WILLIAM G. LAWRENCE
ABSTRACT
CN radicals interacting with rare gas atoms (Rg) provide excellent prototype systems for studies of the evolution from isolated molecule to bulk matter properties. Binary CN + Rg interactions are readily probed through studies of inelastic collision dynamics and the spectroscopy of CN-Rg van der Waals complexes. As CN is a light species, ab initio calculations can provide valuable insights concerning the topologies of the intermolecular potential energy surfaces. Many-body interactions and morphology-related issues can be probed through studies of CN-Rgn clusters and CN trapped in solid Rg matrices. In this chapter we review CN + Rg collision dynamics, the structure and predissociation dynam- ics of the clusters CN-Ne and CN-Arn, and the properties of CN in rare gas solids. The results from these different environments are rationalized and related in terms of the characteristics of the intermolecular potentials.
1. INTRODUCTION
Clusters consisting of an atomic or molecular chromophore (M) associated with a small number of rare gas (Rg) atoms have been the subject of many experimental and theoretical investigations. 1-1~ These species have proved to be excellent models for studies of the relationship between the properties of small aggregates and those of bulk matter. Rare gas clusters are tractable systems because they are easily generated and do not greatly perturb the properties of the chromophore. The two-body solvent-solvent interactions are well known, and the three-body forces can be estimated with some confidence. Information concerning the interaction between the chromophore and the Rg atoms can be deduced from studies of collisions and spectroscopic data for the most elementary clusters, M-Rg, M-Rg 2, M-Rg 3, etc. (see, for example, Refs. 6 and 7). For a number of systems, intermo- lecular potential energy surfaces (IPSs) derived from spectroscopic data for ele- mentary clusters have been used to model properties of chromophores trapped in larger clusters or rare gas matrices. Hg, 2 Ba, 2 SF6 ,5 HE, II H20,12 and carbazole 3 are a few examples of the chromophores used in these studies.
In addition to providing data that can be used to understand larger clusters and matrices, studies of binary M-Rg complexes yield insights concerning gas-phase collision dynamics. It is usually not difficult to excite complexes to levels that are well above the dissociation limit. This can be accomplished by electronic, vibra- tional, or, in some cases, rotational excitation of the chromophore. The subsequent predissociations are the half-collision analogs of quenching, vibrational energy transfer, and rotational energy transfer, respectively. These events provide a means to look inside the extensive configurational and thermal averaging that is usually implicit in full-collision measurements. The properties of complexes can also be used to evaluate the quality of IPSs derived from ab initio calculations. This is particularly useful for light complexes that can be treated using high-level methods.

CN + Rg Collisions, Clusters, and Matrices 93
When related to condensed-phase properties, studies of predissociating com- plexes can shed light on relaxation processes induced by guest-host interactions in rare gas matrices. The relaxation dynamics occurring in clusters may mimic processes seen in matrices, provided that the clusters are sufficiently large, and have morphologies that resemble the matrix trapping sites.
To date, the majority of studies that have examined relationships between cluster and matrix properties have used closed-shell chromophores. Parallel investigations
E
u.l
3 5 0 0 0 -
3 0 0 0 0 -
2 5 0 0 0 -
2 0 0 0 0 -
1 5 0 0 0 -
I 0 0 0 0 -
5 0 0 0 -
0 L
B2Z +
A2[I
9
8
7
6
X2s +
1 ! i I
0 . 9 1.1 1.3 1.5 1.7
R/A
Figure 1. Potential energy curves for the low-lying electronic state of CN.

94 MICHAEL C. HEAVEN, YALING CHEN, and WILLIAM G. LAWRENCE
of open-shell chromophores are of interest because most condensed-phase reactions involve open-shell species, and the role of the solvent cage in a chemical reaction is far from understood. Studies of small free radicals in rare gas clusters and matrices provide a starting point for learning about the properties of solvated radicals. In recent years we have found that the CN radical is a particularly well-suited prototype for this purpose, l~ When trapped in rare gas matrices, CN exhibits shifts of the low-lying electronic states, 1~176 hindered rotation (in Kr and Xe), 21 and moderately slow vibronic energy transfer processes. 1~ In the gas phase, allowed transitions between the X 2Z+, A 21-I, and B 2Z+ states (Figure 1) permit studies of collisional electronic energy transfer with full initial and final state resolution. 23-2s,29,3~ CN has only 13 electrons, so interactions with the lighter rare gas atoms can be predicted using high-level ab initio methods. 26'31'32'33
In this chapter we summarize our work on the spectroscopy and dynamics of CN-Rg,, systems. We are particularly interested to learn how the properties of CN-Rg,, clusters relate to both the behavior of CN in matrices and the gas-phase energy-transfer dynamics. This is very much a work in progress. So far we have focused our attention on binary CN-Ne 14'15'16 and CN-Arn l~ clusters of moderate size. We have also performed a limited investigation of the relaxation dynamics of CN in solid Ar. 1~ The results show that many of the complex and matrix properties can be predicted, at least qualitatively, by considering just the CN-Rg pair poten- tials. Connections between matrix, cluster, and gas-phase energy-transfer processes are demonstrated, even though aspects of the latter are in conflict with the best theoretical models. 26'34 Morphology issues were found to be of central importance in comparing CN-Arn and matrix relaxation dynamics. 1~
The structure of this article is as follows. After outlining the theoretical repre- sentations used to describe CN-Rg interactions, we summarize previous experi- mental and theoretical work on CN + Rg collisional energy transfer. We then review the spectroscopy and energy transfer dynamics of CN in rare gas solids. Finally, results for CN-Ne and CN-Ar, are presented against this (mostly) historical background.
2. THEORETICAL FRAMEWORK
The formalism used here is that developed by Alexander and coworkers. 26'32-38 Electrostatic interactions between CN in a 2E+ state (X or B) and a rare gas atom result in a single IPS that may be defined by,
V z = (ZIVe,lZ) = ~ Vff (r, R) P~/(cos 0)
/=O
(1)
where IE) is the CN electronic wavefunction, r is the C-N internuclear distance, R is the distance from the CN center-of-mass to the rare gas atom, and 0 is the angle

CN + Rg Collisions, Clusters, and Matrices 95
between vectors r and R. In the following, 0 = 0 corresponds to linear CN-Rg. Equation 1 represents the angular dependence of the surface in terms of Legendre polynomials (a standard method for scattering calculations). This formalism facili- tates calculations of matrix elements and discussion of symmetry aspects of the surfaces.
Adiabatic interactions between CN(A2H) and a rare gas atom result in two potential energy surfaces. 36'37 For colinear CN-Rg configurations these surfaces are degenerate, but the degeneracy is broken when the atom approaches from the side. The physical reason for this is easily visualized by considering the CN n-electrons. The outer electronic configuration of CN(A) is ... (1 n)3(5ts)2. Nonlinear configurations of CN-Rg lower the symmetry to C s, and the x-orbitals may then be distinguished according to their reflection symmetry with respect to the triatomic plane (A' or A"). As the x(A')-orbital lies in the triatomic plane, the interaction between an electron in this orbital and Rg will be more repulsive than the interaction between a x(A")-electron and the atom. Potential energy surfaces defined by V A, = (FI(A')IV, tlFI(A'))and Va,, = (1-I(A")IVelII-I(A")) correspond to the configura- tions ~:(A') x(A") 2 and x(A') 2 x(A"), respectively. However, calculations of bound or scattering states that arise from these potentials are more conveniently performed if they are first combined to give the average (Vn) and difference (V 2) potentials. 36'37 These are defined by the expressions:
and
(Va" + VA') "0 Vn = 2 = Z V~t (r, R) P~t (cos O) (2)
I=0
V2 ~ (VA"--
I
2 = i_2 V~ (r, R) (~r + 2)[) P~ (cos O) (3)
Electrostatic interactions between CN and Rg cause nonadiabatic mixing of the 1-I(A') and 2E+(A') states. 26'31'32'34'38 This mixing can be represented by the potential surface:
-1 "0 ( ( ~ - 1)
Vl = (1-I(A')IVeIIE+) = ~ l>lE v} (r, R) [,(g+ 1)
1 / 2
) P~ (cos 0) (4)
To a first approximation, the four potentials can be associated with specific inelastic collision processes. V x determines the outcome of rotationally and vibra- tionally inelastic collisions for the ground or B state. 35 Similarly, V n determines the rovibrational energy transfer dynamics of the A state. 36'37 At the Hund's case (a) limit, V 2 is the potential responsible for spin-orbit state changing collisions (~ =

96 MICHAEL C. HEAVEN, YALING CHEN, and WILLIAM G. LAWRENCE
1/2 ~ f2 = 3/2). For coupling that is intermediate between Hund's cases (a) and (b), both V z and V 2 contribute to transfer between the F 1 and F 2 spin states (for low rotational levels of CN(A), which are close to the case (a) limit, F l _= 21-I3/2 and F 2 -___ 2I-Ilt2). Lastly, the V l potential mediates electronic energy transfer between the A and X states. 28'3s
The starting point for models of CN-Rg n clusters, or CN in rare gas matrices, is to assume that the atom-atom and atom-diatom interactions can be approximated by summing pair potentials. From this perspective, cluster- or matrix-induced shifts of the A - X transition energy are partly determined by differences in V x and V n. These potentials will also govern hindered rotation of CN(X) or CN(A) within the cluster or matrix, and the rovibrational relaxation dynamics. As for gas-phase collisions, spin-orbit and electronic energy transfer for CN in clusters and matrices should be promoted by the V 2 and V 1 potentials. The regions of the potential surfaces that will control these various processes depend on the details of the cluster geometry or matrix trapping site. For example, substitution of CN in a Ne lattice results in a "tight" trapping site, 18 where the interactions between CN and the nearest-neighbor Ne atoms are predominantly repulsive (short range). Conversely, the attractive regions of the CN-Rg potentials influence the dynamics of CN in the loose trapping sites provided by solid Kr. 21
3. AB INITIO POTENTIAL ENERGY SURFACES FOR CN + Rg
Ab initio calculations of the four CN(X, A) + Rg potential energy surfaces have been made for the lighter rare gas atoms He 26'31'33 and Ne. 32 A more limited set of calculations has been performed for CN(X, A) + Ar. 31
Werner et al. used the MCSCF-CI level of theory to compute potential energy surfaces for CN + He. 26'31 Even for this light system, large-scale calculations were needed to obtain accurate electronic energies. Consequently, Werner et 81. 26'31
focused their attention on the most interesting regions of the surfaces. As the CN vibrational amplitude is relatively small, and the vibration frequencies of both the A and X states are high, two-dimensional surfaces were calculated, with the CN bond length frozen at a suitable average value (e.g. r = 2.396 au for calculations related to CN(x) a = 3) + Rg collisions). A similar strategy was adopted by Yang and Alexander, 32 who used the MRCI + Q level of theory to obtain potential energy surfaces for CN-Ne. Their results for V z, V~,, and VA,, are shown as contour plots in Figure 2. A brief discussion of the characteristics of these surfaces is helpful at this point, as the potentials for CN-He, CN-Ne, and CN-Ar are qualitatively similar (the strength of the interaction increases with increasing mass of the rare gas atom, but the shapes of the surfaces remain the same). In Figure 2 it can be seen that all of the surfaces have shallow minima in the vicinity of R = 6-8 au. The minima correspond to a T-shaped equilibrium geometry for the A state, while the ground-state surface is noticeably less anisotropic in the region of the radial

CN + Rg Collisions, Clusters, and Matrices 97
~
"~'8
6
5 0 30 60 90 1'20 1'50 180
8(degree)
Figure 2. Ab initio intermolecular potential energy surfaces for CN + Ne. These contour plots represent two-dimensional adiabatic surfaces calculated for a fixed C-N distance of r = 2.396 bohr. The top panel shows the surface for CN(X) + Ne. The middle and lower panels show surfaces for CN(A 2]-I(A')) + Ne and CN(A 2I-I(A")) + Ne, respectively. The linear C-N-Ne geometry corresponds to 0 = O. The dashed contours indicate negative energies with the first contour a t -5 cm -1, and they descend in 5 cm -1 steps. The solid contours indicate positive energies starting at 0 cm -1, and they ascend in 50 cm -1 steps. This figure is reproduced with permission from ref. 32.
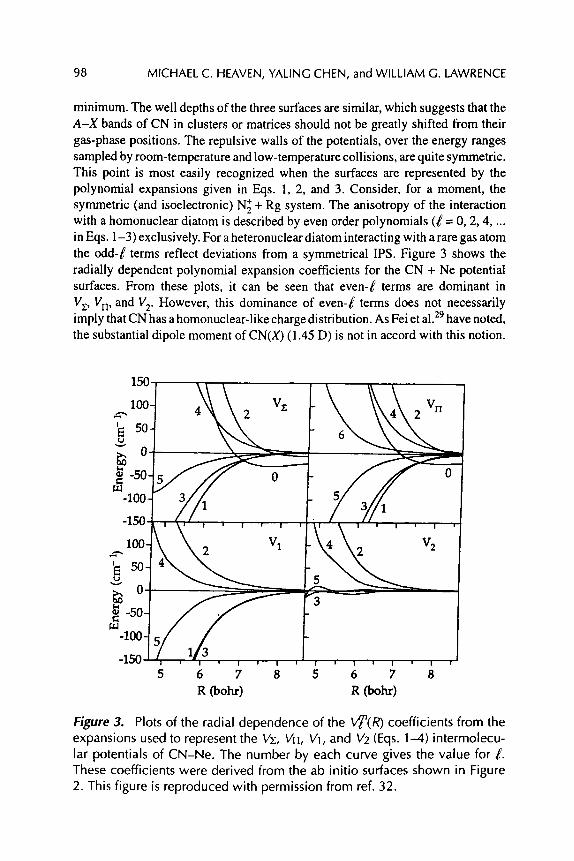
98 MICHAEL C. HEAVEN, YALING CHEN, and WILLIAM G. LAWRENCE
minimum. The well depths of the three surfaces are similar, which suggests that the A - X bands of CN in clusters or matrices should not be greatly shifted from their gas-phase positions. The repulsive walls of the potentials, over the energy ranges sampled by room-temperature and low-temperature collisions, are quite symmetric. This point is most easily recognized when the surfaces are represented by the polynomial expansions given in Eqs. 1, 2, and 3. Consider, for a moment, the symmetric (and isoelectronic) N~ + Rg system. The anisotropy of the interaction with a homonuclear diatom is described by even order polynomials (~ = 0, 2, 4 .... in Eqs. 1-3) exclusively. For a heteronuclear diatom interacting with a rare gas atom the odd-~ terms reflect deviations from a symmetrical IPS. Figure 3 shows the radially dependent polynomial expansion coefficients for the CN + Ne potential surfaces. From these plots, it can be seen that even-~r terms are dominant in V z, V n, and V 2. However, this dominance of even-g terms does not necessarily imply that CN has a homonuclear-like charge distribution. As Fei et al. 29 have noted, the substantial dipole moment of CN(X) (1.45 D) is not in accord with this notion.
150
,oo_ _ \ \\4\ v,,
0 - -50- .~
-100-
-11 / , 4 -
~-. 2 ~ N?- 4
~ o,~ ,, ..
- l o o - 5 / / -
-150 5 6 7 8 5 6 7 8
R (bohr) R (bohr)
Figure 3. Plots of the radial dependence of the V~(R) coefficients from the expansions used to represent the Vg, VII, V1, and V2 (Eqs. 1-4) intermolecu- lar potentials of CN-Ne. The number by each curve gives the value for ~. These coefficients were derived from the ab initio surfaces shown in Figure 2. This figure is reproduced with permission from ref. 32.

CN + Rg Collisions, Clusters, and Matrices 99
4. CN + Rg COLLISIONAL ENERGY TRANSFER
Rotationally inelastic CN(X) + Ar and CN(X) + He collisions have been studied by Fei et al. 29'3~ In this work individual rotational levels were populated by stimulated emission pumping, and collisional processes monitored by laser-induced fluores- cence (LIF). For collisions with He, transfer out of initial rotational levels in the range 0 < N < 4 1 was examined. 29 Total removal rate constants were found to be near gas kinetic for the lowest rotational levels, but they steadily decreased with increasing rotational angular momentum (N). By N = 41 the removal rate constant had fallen to 1/3 of the value observed for N = 0. In accordance with the usual energy gap dependence expected for collisional energy transfer, this trend reflects the fact
that the energy intervals between successive rotational levels increases linearly with N. These results were also in agreement with previous observations of the relative metastability of highly excited rotational levels of CN(X). 39'40 Final state rotational distributions clearly indicated the near-symmetric character of the IPS. 29 A strong propensity for even AN transfer was seen for small values of AN. This preference diminished with increasing IANI. In terms of the IPS, these results suggest that, for small values of g, the even-g terms are dominant, but, as g increases the (unsigned)
coefficients for even and odd terms become comparable in size. Rotational transfer resulting from CN(X) + Ar collisions followed a very similar
pattern. 3~ The total removal rate constants diminished with increasing N. When the rate constants were converted to cross sections, it was apparent that the removal
cross sections for Ar were roughly twice the size of the corresponding He cross sections. The final rotational state distributions for CN(X) + Ar showed the prefer- ence for even AN transfer for low values of AN. As compared to the He results, this preference was evident for a larger range of AN values. Overall, the CN(X) + He and CN(X) + Ar energy transfer measurements suggest that the shapes of the IPSs
for these collision pairs are quite similar, and consistent with the CN(X)-Ne IPS
shown in Figures 2 and 3. CN(A) + Rg collisions may induce pure rotational energy transfer (AJ r 0, AX"2 =
0), spin-orbit state transfer (Af2 = _+1), or internal conversion (IC) to the ground state. As IC results in an easily measured quenching of A - X fluorescence, it was the first of these processes to be investigated. Katayama et al. 41 studied the
fluorescence decay kinetics of CN 1) A ---- 3-9 in the presence of Ar. Multicomponent decays were observed, and interpreted in terms of transfer between adjacent vibrational levels of the A and X states. Approximate collision cross sections for the individual transfer steps were obtained from simulations of the decay curves. Katayama et al. 41 proposed that the cross sections for exothermic transfer could be
represented by an expression of the form,
auA '-" "x = a~tqu~,Ux exp(-IAEI/kT) (5)

100 MICHAEL C. HEAVEN, YALING CHEN, and WILLIAM G. LAWRENCE
where (Yel is an intrinsic electronic cross section, qo o is the diatomic Franck-Condon factor (FCF), and AE is the energy gap between tl~e ~nitial and final states. However, subsequent experimental studies of CN(A) + Rg collisions yielded results that were not consistent with Eq. 5. Dagdigian and coworkers 23-26'2s used optical-optical double resonance (OODR) techniques to observe rotational energy transfer within the A state (RET, including changes in the spin-orbit state) and A ~ X transfer (IC) induced by collisions with Ar. Absolute cross sections were not determined, but the relative cross sections for RET and IC were compared for the A state vibrational levels 9A = 3, 7, and 8. For these initial levels, the IC processes that involved the smallest vibronic energy gaps (~a --~ agx = aga + 4) were dominant. From Figure 1 it can be seen that, a9 A = 8 --) a9 x = 12 is endothermic by 62 cm -~, while a9 a = 7 ---) a9 x = 11, and a9 A = 3 ---) ~x = 7 are exothermic by 84 and 661 cm -1, respectively. Note also that the A - X FCFs become less favorable with decreasing a9 A (q8 1 = 0 18,
�9 8 , . 2 �9 q7,11 = 0.15, q3,7 = 0.03) . Fo r the levels examined, Dagdigian et al. 23-26'2 found that
IC was governed by small changes in the rotational angular momentum (N), rather than small changes in energy accompanied by large changes in the angular momen- tum. Hence, the vibronic energy gaps were not diminished through production of rotationally hot products. The relative cross sections for RET and IC were found to be comparable for the three A-state levels. As it is most unlikely that the RET cross sections would be strongly dependent on ~a, this comparison indicated that the cross sections for IC were of the same magnitude for a9 a = 3, 7, and 8. This observation, taken with the fact that IC was accompanied by small changes in N, was in obvious disagreement with the model proposed by Katayama et al. 41 For example, Eq. 5 predicts that the cross sections for the exothermic events t~/t = 7 --) a9 x = 11, and a9 a = 3 ---) t) x = 7 should differ by almost 2 orders of magnitude.
Dagdigian et al. characterized the CN(X) product state rotational distributions resulting from CN(A) + Ar 23'24'25 and CN(A) + He 26 IC, In several instances they found that transfer initiated from a single, parity-selected rovibronic level of the A state resulted in X-state rotational distributions that showed a preference for population of rotational levels with either even or odd values of the rotational quantum number, N. Transfer initiated from e-parity levels favored Mq = odd transitions, while transfer from f-parity levels favored Mq = even (Halpern and Huang 27 reported the same propensities for transfer induced by collisions with Ne). Wener et al. 31 explained this behavior in terms of the near-symmetric character of the V 1 potential. In the limit of homonuclear symmetry it is easy to show that the above preferences become rigorous selection rules based on conservation of the nuclear permutation symmetry (s/a). This point is illustrated in Figure 4. Interest- ingly, Ali et al. 25 did not observe an even/odd rotational level preference for transfer out of 1) m ----- 8.
Theoretical models of CN + He A --~ X energy transfer were developed by Werner, Alexander, and coworkers. 26'31'34 Initially, CN + He calculations were performed for comparison with the CN(A) + Ar energy transfer experiments; the lighter rare gas was used to facilitate ab initio calculation of the interaction potentials (this was

CN + Rg Collisions, Clusters, and Matrices 101
(J- 1 /2) e v e n
(J- 1 /2 ) o d d
f ~ "~ S
e, + , a
~X / I '
s + , a / / \ \ ~" _ // \\
e, -, s ." .. \x
-. e, +, S \ \
\ \ v \\ / > - -
" " f , + , s
N e v e n
e~ .-~ a ~ ~ , ,, . _
- ~ .... N o d d
2rI,, f , - ,a
2 4-
Figure 4. Schematic showing the symmetry properties relevant to collisional transfer between the 2I-lu and ~2E~ levels of a hornonuclear diatomic molecule. In this figure the lambda doublets are designated by e/f, the diatomic parity by +/-, and the inversion symmetry by s/a. Collisional transfer conserves the s/a symmetry.
a reasonable approach because, as noted above, the IPSs for He, Ne, and Ar have very similar topologies). Scattering calculations 34 that used the CN + He ab initio potentials reproduced several features of the CN + Ar IC dynamics. The propensity for transitions that involved small changes in N, and the final level symmetry preferences were both reflected in the calculated cross sections. The absence of a symmetry preference for transfer out of 1) a - " 8 was correctly predicted, even though the calculations did not provide any easily discerned reason for this anomaly [previously suggested explanations that involved nonadiabatic mixing of the A and X levels of free CN (gateway states) or loss of the near-symmetric character of V l for la A = 8 were not supported25]. The most significant difference between the experimental and theoretical cross sections was associated with the energy gap dependence. The theoretical cross sections were even more strongly dependent on the energy gap than would be expected from Eq. 5. The theoretical ratio for t~3--,7/t~7~ 11 was approximately 10 -5. On the basis of limited calculations for CN(A) + Ar, Werner et al. 34 concluded that the discrepancy was not simply a consequence of substituting He for Ar. As an additional check of the models, Dagdigian et al. 26 measured relative cross sections for CN0a a = 7) + He RET and IC. They also performed new scattering calculations with nonadiabatic mixing of the free CN A

102 MICHAEL C. HEAVEN, YALING CHEN, and WILLIAM G. LAWRENCE
and X levels included. In terms of the CN(X) product state rotational distribution, and the relative cross sections for RET vs. IC, reasonably good agreement between theory and experiment was achieved. Unfortunately, this study did not shed light on the reasons for the unusually large a9 A = 3 ~ a9 x = 7 cross section.
Since the work of Dagdigian and coworkers, 23'26'28 there have been other experi- mental studies that show that the IC cross sections are not sensitively dependent on the energy gaps. Halpern and Huang 27 examined CN A ~ X transfer induced by collisions with He, Ne, and Ar. For all three colliders they noted that the cross sections increased with increasing a9 A, but with a dependence that was much weaker than Eq. 1 predicts. CN is isoelectronic with N~, so it is of interest to note that N~ +He also exhibits unexpectedly large A2I-lu ~ X2Eg cross sections for large energy gap transitions. 42,43 In the case of N~, nonadiabatic mixing of the diatomic A and X states is symmetry forbidden, so gateway states are definitely not respon- sible for the large cross sections. Parallel to the situation for CN, high-level theoretical models of N~ + He transfer predicted cross sections that were exponen- tially dependent on the energy gaps. 43 The reasons for these discrepancies have yet to be determined.
5. SPECTROSCOPY AND DYNAMICS OF CN IN RARE GAS SOLIDS
A variety of techniques have been used to characterize CN trapped in rare gas matrices. The IR and B - X absorption spectra of CN in solid Ar were first reported by Milligan and Jacox. 17 Bondybey 18 used pulsed laser excitation of the B - X and A - X transitions to examine CN trapped in solid Ne. This work revealed several interesting facets of the B ~ A and A ~ X nonradiative relaxation dynamics. As Bondybey's results are of particular relevance to the work on the CN-Ne van der Waals complex and CN-Ar,, clusters described in the following sections of this article, they are reviewed in some detail here.
Bondybey 18 found that CN was isolated in two distinct sites in solid Ne (labeled I and II). These sites exhibited different matrix shifts, phonon wing structures, and relaxation dynamics. For the B - X transition, the site I and II matrix shifts were 8 and 38 cm -1, respectively (here, positive matrix shifts indicate that the transition was blue-shifted with respect to the gas-phase energy). Excitation of the B - X 0-0 band of 12CN in type I sites produced emission from the B state alone. The fluorescence decay rate was consistent with purely radiative relaxation. Excitation of the same band in type II sites produced emissions from both the B - X and A - X transitions. The latter originated from the vibrational levels 1~ a = 8, 9, and 10.
In contrast to the situation for the B - X transition, spectroscopic measurements for the A - X bands showed that site I suffered a greater matrix shift than site II (167 vs. 124 cm-l). The switch of the energy ordering of sites I and II for the A and B states provided the key to understanding the site-dependent B-state decay dynamics.

CN + Rg Collisions, Clusters, and Matrices 103
In Figure 1 it can be seen that, for gas-phase 12CN, the a9,~ = 10 level lies slightly above 98 = 0 (by 42 cm-l). For 12CN trapped in site I, the B state experiences its smallest blue shift, and the A state its greatest shift. Hence, the a9 a = 10 > a9 B = 0 energy ordering was preserved, so that B --> A transfer could only occur via the large energy gap (=1600 cm -1) a9 B = 0 ~ 1.) a -~ 9 transition. Evidently, this unfavorable process was not fast enough to compete with radiative decay. For 12CN in site II, the greater blue-shift of the B state was sufficient to push ~B = 0 above 1.) a
= 10, thereby opening a much more favorable transfer pathway. Results for 13CN in Ne were consistent with this model. Isotopic substitution brings ~a = 10 some 300 cm -1 below a9 B = 0, so that a9 B = 0 ---) 1) a = 10 is an open channel for 13CN in both trapping sites. As anticipated, excitation of 13CN in either site yielded A - X emission bands, and the B-state lifetime was noticeably shortened by nonradiative decay.
The model for B ~ A transfer relied on the assumption that the transfer rates would be sensitively dependent on the energy gap. For A ---> X transfer in solid Ne, Bondybey 18 found that the vibronic relaxation rates were consistent with the exponential energy gap relationship,
kuA~u x or e-I 3~'i (6)
where 13 is a constant. Surprisingly, the Franck-Condon overlap between the initial and final levels did not appear to influence the kinetics. More recently, Wurfel et al. 19 have shown that A ---) X transfer in Ne is faster for 12CN than 13CN because the
energy gaps are smaller for the lighter isotope. Bondybey and Nitzan 22 compared predictions of simplified models for interstate
transfer with the Ne matrix A ~ X transfer rates. The models were able to reproduce the basic trend of decreasing rates with increasing energy gaps, but they were too strongly dependent on the energy gap, and they retained some dependence on the Franck-Condon factors. Bondybey and Nitzan 22 considered a number of reasons for the shortcomings of the models. These included breakdown of the Franck-Con- don approximation and the possibility that the molecule-lattice couplings could be dependent on the initial vibrational state. Their models did not consider rotation of CN within the lattice. Fletcher et al. 44 developed a model that did include rotation, and they concluded that A ~ X transfer was accompanied by substantial rotational excitation of the CN. Such processes could account for the milder-than-expected dependence on the energy gap, which would be effectively diminished by rotational excitation. Work by Schallmoser et al. 21 shows that CN(X) can rotate in the large trapping sites provided by Kr and Xe matrices. There is evidence of hindered rotation or libration of CN(X) in Ar, while spectra taken in Ne suggest that the molecule does not rotate in this host at 5 K. However, given the excess energy available from A ~ X transfer, the latter observation did not necessarily exclude the model proposed by Fletcher et al. 44

104 MICHAEL C. HEAVEN, YALING CHEN, and WILLIAM G. LAWRENCE
The relaxation dynamics of CN in solid Ar are qualitatively similar to the dynamics of CN in Ne. The main differences stem from the stronger interaction with the more polarizable host. For example, as compared to CN in Ne, the A - X and B - X bands in Ar show much stronger and broader phonon side-bands. 1~176 The A - X transition blue-shifts by 324 cm -1, while the B - X transition is red-shifted by about -80 cm -1. The B ---> A transfer rate is much faster in Ar, to the extent that B-state emission has not been detected. 1~176 Instead, excitation of the B state results in emission from low vibrational levels of CN(A) (1) a < 3). l~ Thus, it appears that relaxation via A - X cascade is very rapid for 1,) a > 3 levels. Only when the energy gaps and Franck-Condon factors become very unfavorable (cf. Figure 1) does relaxation slow down to the point where radiative decay can begin to compete. Lin et al. l~ analyzed the fluorescence decay curves for CN(a) a < 2). As for CN(A) in Ne, kinetic modeling led to the conclusion that relaxation via A ~ X cascade was much faster than vibrational relaxation between successive vibrational levels of the A state. As Figure 5 shows, transfer rate constants derived from the kinetic model were in good agreement with the relationship:
ku ~ou x = kelquA,l,x e - f ~ (7)
i012 -
l O l l -
lOlO -
10 9 -
lO s -
10 ~
5 0 0
! I - 1 I 1
7 0 0 9 0 0 1 1 0 0 1 3 0 0 1 5 0 0
AE/cm "l
Figure 5. Semi-log plot showing the energy gap dependence of scaled A X transfer rates for CN in solid Ar at T = 12 K. The rates are scaled by 1/ClOA,~ x as the data are wel I-represented by Eq. 7.

CN + Rg Collisions, Clusters, and Matrices 105
In accordance with simplified theories, and in contrast to the behavior in Ne, transfer in Ar appeared to be sensitive to the Franck-Condon factors. This is a puzzling contrast. Breakdown of the Franck-Condon approximation is expected when the guest is strongly perturbed by the host. The interactions between CN and Ne are generally weaker than those between CN and Ar, so the Franck-Condon approxi- mation should be better, not worse, for Ne.
Based on the stronger guest-host interactions in Ar, it would also be expected that the A ~ X transfer rates were generally faster in Ar than Ne. In apparent disagreement with this expectation, Wurfel et al. 19 noted that the intensity of the A --~ X emission, relative to IR emission from ground-state vibrational transitions, was stronger in Ar than Ne. They attributed this result to faster A ~ X transfer in Ne. To explain this behavior they noted that the large blue-shift experienced by CN(A) in solid Ar increased the energy gaps, and suggested that this had a greater influence on the transfer rates than the change in the guest-host interaction strength. However, the time-resolved fluorescence measurements were consistent with faster A --~ X transfer in Ar. 10 For example, rates for 1.) A = 2 --~ a9 x = 6 of 1.3 x 10 6 and 2.5 x 10⁷ s -1 were obtained for Ne 18 and Ar l~ matrices, respectively. The implied discrepancy between the relative intensity and time-resolved fluorescence data can be resolved by assuming that the interactions with Ar cause nonradiative vibrational relaxation of CN ~x < 4.
The trend of increasing transfer rates with increasing mass of the Rg host continues for Kr and Xe. 2~ In Kr, CN(B) does not emit, and only the lowest vibrational levels of the A-state fluoresce. In Xe even the lowest A-state levels are quenched. The B-X absorption spectrum of CN in Xe shows that there is an unusually strong interaction between CN(B) and Xe 2~ (the transition is red-shifted by roughly 1000 cm-l). This may reflect mixing of the valence CN(B)-Xe state with nearby CN--Xe § charge transfer states.
6. SPECTROSCOPY AND DYNAMICS OF CN-Ne
CN-Ne was first detected via bands associated with the B-X transition. 13'15 Before describing these results, it will be helpful to define the notation used to label the energy levels. At a typical van der Waals distance, Ne interacts weakly with CN in the X, A, or B states. Consequently, the quantum numbers for the diatom provide useful labels for the levels of the complex. Due to the low anisotropy of the potential energy surfaces, bending of the complex is more realistically described as an hindered internal rotation (HIR) of the CN. For the B and X states of CN-Ne, the spin is so weakly coupled to the molecular frame that it does not produce measur- able splittings at the resolution of our measurements (0.06 cm-l). As the spin is a spectator, the levels of the complex are very similar to those of analogous closed- shell complexes. In the following, vibrational states of CN(X)-Ne and CN(B)-Ne are labeled by the quantum numbers 09, N K, Vs), where v is the monomer stretch,

106 MICHAEL C. HEAVEN, YALING CHEN, and WILLIAM G. LAWRENCE
v s is the intermolecular stretch, N represents the monomer angular momentum (excluding spin), and K is the unsigned projection of N on the intermolecular axis (note that in ref. 13, N and K were labeled as r and 9).
CN-Ne B - X bands were observed in the vicinity of the monomer 0-0 and 1-0 transitions. 13'15 Each monomer transition was accompanied by about eight bands of the complex. The rotational structures were relatively uncongested and easy to assign. Analysis of the bands showed that HIR was the dominant optically active mode in the spectrum; bands terminating on or originating from excited van der Waals stretch states (v s > 0) were not detected. The rotational constants for the various HIR levels were very similar, indicating that there was very little coupling of the radial and angular motions on the B-state IPS. Hence, it was a reasonable approximation to treat the HIR motion independently, using a one-dimensional effective angular potential energy curve. Based on this approximation, Figure 6 shows a schematic energy level diagram that illustrates the prominent bands of the CN-Ne B(0, N K, 0)-X(0, N K, 0) subsystem. The left-hand side of this figure shows the rotational levels of free CN, and the rotational transitions seen at the low temperatures achieved in a free-jet expansion. The associated HIR levels of CN-Ne, and the transitions that dominate the B - X system of the complex are shown on the right-hand side of the figure. Energy spacings between the HIR levels were used to
N--2, + . .
N ~ l o o
N
N ; I , - [
N----O, + I
s
CN
(0,2~ (0,2t,O) (0,22,0)
(0,1~
(0,11,0)
(0,0~
i (o,P,o) (0,I',0)
(0,0~
C N - N e
Figure6. Schematic showing the relationship between the allowed rota- tional transitions for CN B-X and the prominent hindered internal rotation bands seen in the CN-Ne spectrum.
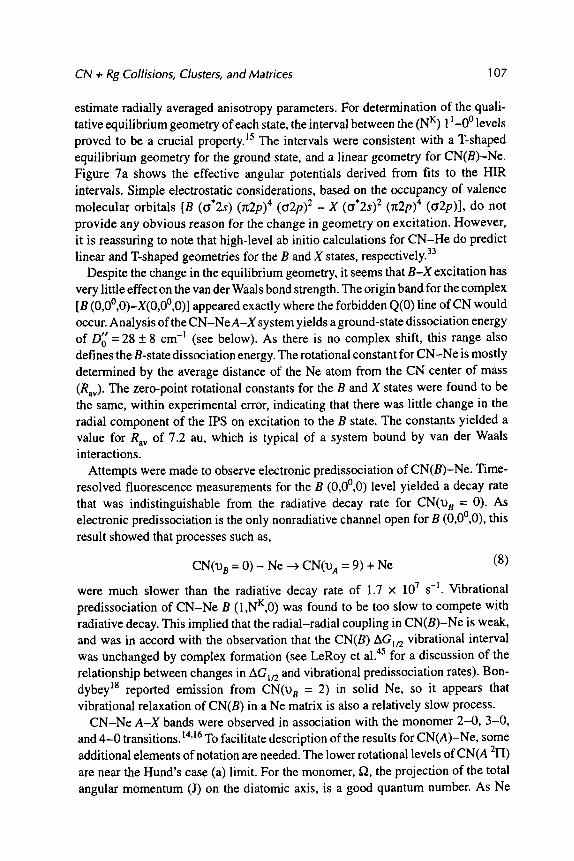
CN + Rg Collisions, Clusters, and Matrices 107
estimate radially averaged anisotropy parameters. For determination of the quali- tative equilibrium geometry of each state, the interval between the (N r) 11-0~ levels proved to be a crucial property. 15 The intervals were consistent with a T-shaped equilibrium geometry for the ground state, and a linear geometry for CN(B)-Ne. Figure 7a shows the effective angular potentials derived from fits to the HIR intervals. Simple electrostatic considerations, based on the occupancy of valence molecular orbitals [B (a '2s) (rt2p) 4 (o'2p) 2 - X (a '2s) 2 (rt2p) 4 (t~2p)], do not provide any obvious reason for the change in geometry on excitation. However, it is reassuring to note that high-level ab initio calculations for CN-He do predict linear and T-shaped geometries for the B and X states, respectively. 33
Despite the change in the equilibrium geometry, it seems that B-X excitation has very little effect on the van der Waals bond strength. The origin band for the complex [B (0,0~176 appeared exactly where the forbidden Q(0) line of CN would occur. Analysis of the CN-NeA-X system yields a ground-state dissociation energy
t t
of D O = 28 + 8 cm -1 (see below). As there is no complex shift, this range also defines the B-state dissociation energy. The rotational constant for CN-Ne is mostly determined by the average distance of the Ne atom from the CN center of mass (Ray). The zero-point rotational constants for the B and X states were found to be the same, within experimental error, indicating that there was little change in the radial component of the IPS on excitation to the B state. The constants yielded a value for Ray of 7.2 au, which is typical of a system bound by van der Waals interactions.
Attempts were made to observe electronic predissociation of CN(B)-Ne. Time- resolved fluorescence measurements for the B (0,0~ level yielded a decay rate that was indistinguishable from the radiative decay rate for CN(~ B = 0). As electronic predissociation is the only nonradiative channel open for B (0,0~ this result showed that processes such as,
CN(a9 s = 0) - Ne ---) CN(a9 A = 9) + Ne (8)
were much slower than the radiative decay rate of 1.7 x 10⁷ s -1. Vibrational predissociation of CN-Ne B (1,NK,0) was found to be too slow to compete with radiative decay. This implied that the radial-radial coupling in CN(B)-Ne is weak, and was in accord with the observation that the CN(B) AGu2 vibrational interval was unchanged by complex formation (see LeRoy et al. 45 for a discussion of the relationship between changes in AGu2 and vibrational predissociation rates). Bon- dybey 18 reported emission from CN(a9 B = 2) in solid Ne, so it appears that vibrational relaxation of CN(B) in a Ne matrix is also a relatively slow process.
CN-Ne A-X bands were observed in association with the monomer 2-0, 3-0, and 4-0 transitions. 14'16 To facilitate description of the results for CN(A)-Ne, some additional elements of notation are needed. The lower rotational levels of CN(A 2I-1) are near the Hund's case (a) limit. For the monomer, ~, the projection of the total angular momentum (J) on the diatomic axis, is a good quantum number. As Ne

108 MICHAEL C. HEAVEN, YALING CHEN, and WILLIAM G. LAWRENCE
(a)
. . . (
[ . i
5-
0 -
-5-
- I 0 - , l .... 0.0 60.0 120.0 1 8 0 . 0
('b) 40 -I ! . i
CN(A)-Ne 3O
i
20 V n
10-
O- V 2 -
-10
20 , , ' "j . . . . 0.0 60.0 120.0 18q).O
O (degrees)
Figure 7. (a) Effective angular potential energy curves for the X and B states of CN-Ne. (b) Effective angular potential energy curves for the average (VII) and difference (V2) potentials of CN(A)-Ne.

CN + Rg Collisions, Clusters, and Matrices 1 09
approaches CN(A 2I-I), each J level of the monomer splits into (2J + 1) projection states of the complex. These states may be labeled using signed values for P, where the sign is derived from the product f2 x E 46 Alternatively, starting from the perspective of a slightly different basis set, the states may be labeled by an unsigned value for P combined with a symmetry index. 47 The situation for CN(A)-Ne is such that the eigenfunctions do not correspond well to either limiting case. Consequently, the states are labeled using unsigned values for P with the subscript 'T' or "u" appended to denote the lower and upper energy states that have common values for J and P (e.g. a J = 3/2 level will split into P = 1/2 l, 1/2 u, 3/2 l, and 3/2 u projection states of the complex). With inclusion of the stretching motions, levels of CN(A 2FI)-Ne are labeled by (1)A, ~, J[P], Vs)"
Electronic predissociation processes were readily observed for CN(A)-Ne, to the extent that they complicated the task of obtaining spectroscopic data for the A - X system. Initial attempts to record LIF spectra for the A - X bands yielded a diffuse structure associated with the CN A 21-Iit2 1.) 3 -" 3 level. 14'15 Features associated with A 2I-I3/2 levels were not detected. As the CN A state is inverted 2 ( I-Ilt 2 lies above 2I-I3t2), we assumed that the complex bands associated with 2I-Ilt2 were homogene- ously broadened by the spin-orbit predissociation process,
CN(A 2I'll/2 1)a) -- Ne --> CN(A 2I-[3t 2 1)a) 4" Ne (9)
which produces a fluorescing fragment. The lack of detectable fluorescence from the 2FIlr2 levels was attributed to predissociation via IC, which yields nonfluore- scing fragments; i.e.:
CN(A 2H3t 2 1)3) -- Ne --> CN(X) + Ne (10)
OODR techniques were used to confirm these speculations and obtain spectra for CN(A 2H3t 2 1)A)- Ne. Fortunately, bands associated with 21-I3r 2 were found to be sharp, and they provided detailed information about the A-state IPSs.
Action spectra for the A (1)A, 3/2, J[P], v s) levels were obtained by using a tunable pulsed laser to scan through the A - X bands, while a second pulsed dye laser was used to monitor the appearance of CN(1) X = 1) 3 4- 4 ) fragments via the B - X bands. 16 Figure 8 shows a low-resolution action spectrum of the A (3, 3/2, 3/2[P], v s) - X (0, N K, 0) band system. This congested contour contains overlapping sub-bands that are built on HIR and low-frequency stretch levels. Assignments for the excited state stretch levels are indicated. Figure 9 shows the Vs= 0 bands at the best resolution that could be achieved with the available equipment. This trace shows partial rotational resolution, but it was still too congested to permit unambiguous assignment. Two OODR techniques were used to further simplify this spectrum. 16 Fluorescence depletion (FD) measurements were made by fixing a monitor laser on a previously assigned B - X feature, and sweeping the depletion (hole-burning) laser through the A - X bands. This technique reveals transitions that originate from the specific ground-state level tagged by the monitor laser. The FD spectra were

110 MICHAEL C. HEAVEN, YALING CHEN, and WILLIAM G. LAWRENCE
! 1 I 1
_ - 0 .
I 1 _ v s = l .
I .... I . ~ -
- j -
I I . 1 I
14370 14380 14390 14400 cm- 1
Figure 8. Low-resolution (0.3 cm -1) action spectrum of the CN-Ne A(3, 3/2, 3/2[P], vs) - X(O, N K, 0) band system. Groups of I--IIR levels associated with vs = 0, 1, and 2 are indicated. The features marked with a * originate from the X(0, 11 0) level
1
noisy, but of sufficient quality to permit identification of "hot" bands arising from the ground-state (0, 11, 0) level. Conventional B ~ A ~ X OODR proved to be the most effective technique for simplifying the A - X spectrum. Although lasers with pulse durations of about 10 ns were used for these experiments, the A - X predisso- ciation rates were slow enough that the A-state complexes could be excited before they dissociated. Figure 10 illustrates the spectral simplification achieved by this OODR scheme. For this trace the monitor laser was tuned to the R 1 band head of the B(5, 0 ~ 0) - A(3, 3/2, 3/213/2u],0) transition. Key rotational and HIR level assignments were established through systematic application of this two-dimen- sional decomposition technique.
As for the X and B states, A-state energy level patterns were consistent with weak couplings between the radial and angular motions. Again, HIR was successfully modeled using one-dimensional angular potentials. 16 The quality of this approxi- mation can be gauged from the spectral simulation shown in Figure 9. The HIR transitions that dominated the A - X spectrum, and their relationship to the rotational levels of free CN are shown in Figure 11. Angular potential energy curves for the

CN + Rg Collisions, Clusters, and Matrices 111
, CN R1(0.5)
hot bands
I I " I i ' ' l
14378.0 14380.0 14382.0 14384.0 14386.0 cm- 1
Figure 9. High-resolution (0.06 cm -1) action spectrum of the CN-Ne A(3, 3/2, 3/2[P], vs)-X(O, N K, 0) band system. The upper trace is the observed spectrum. Note that the strong line at 14380.7 cm -1 is due to the monomer R1 (0.5)transition. The lower trace is a numerical simulation. The broken lines indicate regions where the rotational structures associated with specific projection states are prominent.
A state, obtained from fits to the spectra, are shown in Figure 7b. Note that the anisotropy of the average potential was much greater than the difference potential, and the former dictates a T-shaped equilibrium geometry. Comparing the potential curves in Figure 7, it is evident that the A state is significantly more anisotropic than the X and B states, at least for the bound regions of the IPSs. This characteristic may be related to the fact that A-X excitation creates a vacancy in the x-bonding orbital [A (~2p) 3 (a2p) 2- X (g2p) 4 (o2p)]. In accordance with theoretical expectations for a radical with a ~3-configuration, 48 the difference potential was found to be small and positive (repulsive).
Although the A state of CN-Ne is more anisotropic than the ground state, the bond strength and radial equilibril,m distance do not change much on A-X excita- tion. The A state Vs= 0 rotational constants gave Ray = 3.8/~ and the origin of the A(3, 3/2, 3/213/21], 0) - X(0, 0 ~ 0) was displaced from the monomer R1(1/2) parent line (cf. Figure 11) by only 0.2 cm -1. Interestingly, the transition to the upper spin-orbit component [A(3, 1/2, 1/2[ 1/21], 0)] was blue-shifted by 3.8 cm -1, showing that Ne binds more tightly to CN(A 21-I3/2) than CN(A 21-11/2). The dissociation energy
p of CN(A 2FI1/2) - Ne was bracketed within the range 17 < D O (f2 = 1/2) < 32 cm -1

11 2 MICHAEL C. HEAVEN, YALING CHEN, and WILLIAM G. LAWRENCE
I I ! I
I
14384.0
A(3, 3/2, 3/213/2u], 0)- X (0, 0 o, 0)
R(3/'2)
R(I/2) t R(5/2)
rl R(7/'2)
i I I
14385.0 14386.0 14387.0 cm" 1
Figure 10. High-resolution (0.06 cm -1 linewidth) OODR spectrum of the CN-Ne A(3, 3/2, 3/213/2u], 0 ) - X(O, 0 ~ O)band. For this trace theaorobe laser (0.3 cm -1 linewidth) was tuned to the R1 band head of the/3 (5, 0 ~, O)- A (3, 3/2, 3/213/2u], O) transition. The spectrum was recorded by monitoring the B---X emission.
by examining the product state distributions resulting from spin-orbit predissocia- tion (see below).
Accurate ab initio calculation of potential energy surfaces for open-shell com- plexes is a computationally demanding task. It is, therefore, impressive to note the level of agreement between CN-Ne properties predicted from the ab initio surfaces of Yang and Alexander 32 and those derived from the spectroscopic data. The ab initio surfaces correctly predicted a T-shaped geometry for the A state, similar well-depths and R e values for both A and X states, and the greater anisotropy of the A state. The A state rotational constant (0.103 cm -l) was close to the measured value (0.109 cm-1). Calculated dissociation limits were within the experimental error bounds.
Inevitably, there were details of the ab initio surfaces that were not in such good agreement with experiment. The main problem with the ground-state surface is that it is not sufficiently anisotropic. As can be seen from Figures 2 and 3, the ab initio surface has almost no barrier to CN(X) rotation. The angular characteristics of the

CN + Rg Collisions, Clusters, and Matrices 113
J=3/2
J=l/2
J=3/2
!
J i i " ~
i
A 21"[i/2
I _ . ,
�9 . ~ . - , ~ , ~ _ . . . . . . . .
" I
A 21"I3/2
. . . . j
N=0,1=1/2, + ~ "-
C N X 2E+ C N - N e
3 /2 ,
~i 3 /2 l
b �9 ] _
ti~- - 1/21 +1 /2 . !'
i
,J_,__~':_- 1 /2~+1/2 u
P J
3/2. i
i
�9 3/2 l i
I/21 +I/2.
N=0, K=0
Figure 11. Schematic showing the relationship between the allowed rota- tional transitions for CN A-X and the prominent hindered internal rotation bands seen in the CN-Ne spectrum.
A-state surfaces were also slightly in error. In essence, the anisotropy of V n was underestimated, while that of V 2 was overestimated. Some error was present in the radial characteristics of the A-state surfaces as they predicted a -Ne stretch interval (AGlt2) of 12.8 cm -1, as compared to the measured value of 8.2 cm -1. As the theoretical binding energy appeared to be correct, this discrepancy indicates that the radial curvature of the average potential was overestimated in the vicinity of the minimum. Despite these shortcomings, Yang and Alexander 32 demonstrated that the ab initio surfaces could be used to predict the structure of the A-X bands with enough accuracy to reliably assign many of the observed features.
Spin-orbit predissociation of CN-Ne A(D A, 1/2, J[P], 0) was so rapid that the rotational structures of bands terminating on these levels were obscured by homo-

114 MICHAEL C. HEAVEN, YALING CHEN, and WILLIAM G. LAWRENCE
geneous line-broadening. 14-16 Simulations of the unresolved band contours yielded an average linewidth of 0.9 cm -1, corresponding to a predissociation rate of 1.7 x 10¹¹ s -1. The product state distributions resulting from spin-orbit predissociation were examined by probing the B - A bands of the fragments. Figure 12 shows a typical spectrum for the CN(A 21-13/2, 1.) a = 3 ) fragment. Product state distributions were somewhat dependent o n 1.) A and the feature within the A(a9 A, 1/2, J[P], v s) -
X(0, N K, 0) absorption contour that was excited. However, three characteristics of the distributions were always preserved: (1) population was not detected in levels with J > 7/2, (2) diatomic levels with -parity were preferentially populated, and (3) the most populated level was J = 7/2, -parity. The combined population of the J = 7/2 e and f levels accounted for about 60% of the total products. The sharp cutoff in the rotational distribution at J = 7/2 indicated that J = 9/2 levels were not populated because they were energetically inaccessible. Consequently, the mono- mer energy differences A 21"Ilt2 I~A, J = 1/2 - A 21-I3/2 D A, J' defined the upper (J' = 9/2) and lower (J' - 7/2) bounds for the dissociation energy noted above.
The preference for production of diatomic fragments in -parity states is another manifestation of the rather symmetric CN-Ne IPSs. The reason why -parity states were preferentially populated can be seen by considering the excitation process, and the diatomic components of the HIR states. Model calculations that used the potentials shown in Figure 7 indicate that the X(0, 0 ~ 0) level has 95% N = 0, J = 1/2, +parity diatomic character. Through preservation of the diatomic selection rules, excitation from this level strongly favors transitions to A-state levels of -diatomic parity. Our model showed that the upper levels of the stronger A - X bands had greater than 80% diatomic -parity character. That the diatomic character selected by excitation would be preserved during spin-orbit predissociation is obvious in the limit of a homonuclear diatom. In this case, conservation of the nuclear symmetry (s(-)s, a<-)a) dictates that -~-~-, +~-)+. For CN-Ne the spin-orbit predissociation is primarily mediated by the V 2 potential, so the -parity preference implies that V 2 is nearly symmetric. This is consistent with the symmetric V 2 IPS obtained from analysis of the CN(A)-Ne ro-vibronic structure (cf. Figure 7).
Yang and Alexander 32 calculated spin-orbit predissociation rates from their ab initio potentials. They obtained rates in the range of 3-8 x 101~ s -1. Considering the difficulty of such calculations, these results were in good agreement with the measurements. Yang and Alexander 32 did not examine product-state distributions, but it is almost certain that their model would tend to conserve the diatomic parity. Figure 3 shows that the ab initio V 2 potential is dominated by the symmetric V 2 and V 2 terms.
Product-state distributions of CN(X) resulting from IC predissociation of CN-Ne A(D A, 3/2, 3/2[P], 0) levels were probed via the B - X transition. 14-16 For example, Figure 12b shows a spectrum of the CN(gx = 7) fragments from IC predissociation of CN-Ne A(3, 3/2, 3/2[ 1/21], 0). There are two points worth noting about this rotational distribution. First, the degree of rotational excitation is quite modest. The excess energy available from the predissociation was 609 cm -1, but the average

CN + Rg Collisions, Clusters, and Matrices 115
' I . , I
(a) R l ( J ) - -
B - A 5 - 3
. , , ! , . , I , , i __
, , I I ..... i - i - P l ( J ) 3.5 1.5 1.5 3 .5
SRzt(J)
- - i '" i i 3.5 2 .5 1.5
, , w | ,
461.45 461.78
Q~(J)
A ' ' " ' I' ' " ' " ' !
�9 , ,
462.10 462.43 462.75
Excitation wavelength (nm)
| . . . .
(b) I
I . _
I I
6
. . . . I
R ( N ) ._
I I I I I I
4 2 0
[ . . . . .
P(N) I I 1 I I " I I l i i 1 1
2 4 6 8
B - X 4-7
491.3 491.8 I . . . . . . . . .
492.3 492.8 493.3
Excitation wavelength (nm)
Figure 12. (a) Photofragment excitation spectrum for CN(A 2H3/2, t)A = 3) fragments resulting from spin-orbit predissociation of CN-Ne A(3, 1/2, 1/211/2], 0). (b) Photofragment excitation spectrum for CN(X 2y_,+, t)x = 7) fragments resulting from IC predissociation of CN-Ne A(3, 3/2, 3/211/2], 0).

116 MICHAEL C. HEAVEN, YALING CHEN, and WILLIAM G. LAWRENCE
energy released to rotation was only 33 cm -1. Second, the spectrum in Figure 12b
exhibits a slight preference for population of even N rotational levels. Tuning the excitation source to different regions of the A(3, 3/2, 3/2[P], 0) - X absorption contour had little effect on the amount of energy released to rotation.
The preference for population of even N levels could be reversed or washed-out,
according to the initial CN-Ne levels selected. This behavior was clearly related to
the AN - even or odd preferences observed for gas-phase collisional A - X transfer. If we assume a symmetric form for the potential responsible for A - X transfer (V1), the preference for even N levels seen in Figure 12b is readily explained. It was
noted above that excitation from X (0, 0 ~ 0) selects A-state levels that have a large
J' (N' fraction of diatornic -parity character. For diatomic 21713/2 = 3/2 = 1) this level
I:= ,..q
,I I I I
~A =4 < 2 0 ns
'~ = 2800 ns
i i I i I
- 2 0 0 0 200 400 600 800 1000
Time (nsec)
Figure 13. Decay of CN-Ne A (t)A, 3/2, 3/211/2], 0)levels measured by sequential B-A-X excitation. The time axis corresponds to the delay between the pump and probe laser pulses.

CN + Rg Collisions, Clusters, and Matrices 117
is the e component of the lambda doublet, and Figure 4 shows that predissociation should favor AN = odd transitions to even ground-state levels. Transitions originat- ing from X(0, 1 l, 0) are expected to reverse this trend. Model calculations also show that there are states of the complex where the diatomic parity is not well-defined. Transitions to these levels have moderate intensities, and they should, on predisso- ciation, yield product distributions that do not markedly favor even or odd levels.
The observation of symmetry preferences in IC predissociation implies that the V 1 potential is nearly symmetric. For a homonuclear diatom, the V l potential would be represented by Eq. 4 using odd [ terms exclusively. Figure 3 shows that the ab initio V l surface for CN-Ne is dominated by the V I and V~ terms, and has the expected near symmetric form.
IC predissociation of CN-Ne A(1) a < 4, 3/2, 3/2[P], Vs) levels was slow enough that it could be followed using time-resolved methods. 14-16 In one series of experiments, pump and probe lasers were fixed on sequential B <---- A 6-- X transitions. Dissociation of the A-state complexes was followed by sweeping the delay between the two laser pulses. Decay curves obtained by this means are shown in Figure 13 (decay of the ~A = 4 levels was too fast for accurate determination using 10 ns laser pulses, but the fact that strong OODR signals could be detected indicates that the lifetimes were not much shorter than 10 ns). The predissociation rates were dependent on the body-fixed projection of the CN angular momentum, the total angular momentum, and vibrational excitation of the van der Waals stretch.
,.2
22
21- 12
20-
19-
18-
17-
16
450
A->X
4->8
k=k~lqv,v,, exp(-~lAEI) 3->7
i J ' I j ' - - I
500 550 600 650 700 750
AE,]cm" I
Figure 14. Semilog plot showing the energy gap dependence of scaled IC predissociation rates for CN(A 2FI3/2)-Ne.

118 MICHAEL C. HEAVEN, YALING CHEN, and WILLIAM G. LAWRENCE
However, these dependencies were far less dramatic than the dependence on o a that is evident in Figure 13. This dependence was expected for a process governed by energy gap relationships such as Eqs. 6 or 7. Figure 14 shows that the data were consistent with Eq. 7, but, as the predissociation rate for ~a = 4 was not accurately determined, the data could also give a respectable fit to Eq. 6 It should be noted that the energy gaps used in Figure 14 were corrected for the small amount of energy released to product rotation [despite changes in the energy gap, the CN(X) rotational distributions resulting from predissociation of the a9 a = 2 and 4 levels were very similar to the distribution of Figure 12b].
A theoretical model of the IC predissociation of CN-Ne A (3, 3/2, J[P], 0) was examined by Yang and Alexander. 32 For J = 3/2 they obtained a predissociation rate of 4 • 104 s -1, which was about a factor of 100 slower than the measured rate. They identified the most probable source of this discrepancy to be underestimation of the V l potential by the ab initio calculations.
7. RELATIONSHIP BETWEEN C N - N e A N D GAS-PHASE CN + Rg COLLISION DYNAMICS
In comparing the properties of binary complexes with results from studies of gas-phase collisions, two caveats should be borne in mind. First. the data being compared are mostly determined by different regions of the IPSs, and second, the predissociation of a complex corresponds to a relatively sharp resonance in a full-collision event; such resonances represent a very small fraction of the collisions occurring under normal "bulb" conditions. Despite these differences, the compari- sons are informative because the qualitative characteristics of the repulsive regions of the surfaces are reflected in the bound regions. For example, analysis of the spectral data for CN(X)-Ne indicates a near-symmetric IPS (cf. Figure 7), in agreement with the final-state symmetry preferences observed by Fei et al. 29'30 in their studies of CN(X) + He and CN(X) + Ar rotational energy transfer.
Potential energy curves and the data for spin-orbit predissociation of CN(A)-Ne suggest that preferences for final states of specific parity should be observed in collisional transfer (this is not the same as the e/f propensities predicted by Alexander 36 for a near case b 2I-I state). To date, state-resolved measurements of CN(A) + Rg spin-orbit transfer have not been examined carefully enough to know if such preferences exist. The final state symmetry preferences in A ~ X transfer have been discussed above, and it is clear that the IC predissociation dynamics of CN(A)-Ne are governed by the same near-symmetrical properties of the IPSs. The most intriguing difference between IC predissociation and collisional A ~ X transfer is provided by the energy gap dependencies. If an expression similar to Eq. 5 is valid for collisional A ~ X transfer, it is expected that the predissociation rate would be more sensitive to the energy gaps than the room-temperature collisional rate constants (predissociation being roughly equivalent to a very low-temperature

CN + Rg Collisions, Clusters, and Matrices 119
half-collision). However, scattering calculations for CN(A) + He at 300 K predict transfer cross sections that are strongly dependent on the energy gaps, 34 so the discrepancy between theory and experiment for collisional transfer is not simply a temperature effect. It is conceivable that scattering calculations with a more realistic V 1 potential could mimic the weak energy gap dependence seen in collisional transfer. However, comparisons of the relative probabilities for spin-orbit vs. IC transfer suggest that disturbingly large changes in V 1 may be needed to do this. Jihua et al. 23 reported that the spin-orbit and IC transfer cross sections were comparable for CN09 A - 3) colliding with Ar. In contrast, the spin-orbit predisso- ciation rate for CN(9 A - 3)-Ne exceeds the IC rate by more than four orders of magnitude. 14-16 We are currently studying CN(A) + Rg collisional transfer at low temperatures in hopes of gaining a better understanding of the temperature and energy gap effects.
Q RELATIONSHIP BETWEEN CN-Ne AND THE PROPERTIES OF CN IN SOLID Ne
18 The A - X transition of CN in solid Ne is blue-shifted from the gas-phase energy. Although the A - X transition of CN-Ne is almost unshifted, 16 the data for the complex are not inconsistent with the matrix behavior. Bondybey is and Schall- moser et al. 21 have shown that CN is trapped in tight sites in solid Ne. The CN bond length increases on excitation to the A state and this, in turn, will result in a more repulsive interaction with the surrounding lattice. This will, of course, blue-shift the A state relative to the ground state (this argument assumes that the pair potentials do not change much on excitation, as indicated by the results for the complex).
Spin-orbit relaxation of CN(A) could not be characterized in the matrix because the spectrum showed only one zero phonon line for each vibronic transition. It is probable that rapid spin-orbit relaxation broadened the upper spin-orbit levels to the point where they could not be distinguished from the phonon sidebands. The correlation between the complex IC predissociation rates and the matrix A - X transfer rates is surprisingly good. In both the complex and the matrix the rates are governed by the energy gaps, and the absolute values for the rates are comparable [e.g. for ~A = 3 --~ ~X = 7 the rates are 4 x 10⁶ (complex) 16 and 11 x 106 s -1 (matrix)IS]. Overall, the complex predissociation was more sensitively dependent on the energy gaps. Fletcher et al. 44 suggestion that the energy gaps are diminished in the matrix through rotational excitation of CN(X) does not appear to be supported by the data for CN-Ne. As IC predissociation did not produce rotationally hot products, and there is no obvious reason to expect that transfer induced by interactions with a Ne lattice would be more successful in promoting rotational excitation.
Electronic predissociation of CN(B)-Ne could not be detected, 13 which indicates that the complex should be compared with CN isolated in a type I Ne lattice site.

120 MICHAEL C. HEAVEN, YALING CHEN, and WILLIAM G. LAWRENCE
For this site the B - X transition exhibited a small, 8 cm -1 blue-shift. This shift is really too small to analyze in terms of simple models. The C-N bond length decreases on excitation to the B state, so it might be expected that this would reduce the repulsive interactions and thereby red-shift the transition. Apparently, the change in the anisotropy of the CN-Ne pair potential, coupled with contributions from many-body interactions, are enough to offset the effects of CN contraction and produce the observed blue-shift.
9. SPECTROSCOPY AND DYNAMICS OF CN-Arn CLUSTERS
In early attempts to generate CN-Ar binary complexes, we seeded CN in a free-jet expansion driven by pure Ar. These experiments did not produce CN-Ar in useful concentrations, but CN-Ar n clusters of moderate size (containing approximately 10 to 200 Ar atoms) were readily observed. Subsequent studies of these clusters revealed relaxation dynamics that differed significantly from the relaxation behav- ior of CN is solid Ar matrices. 1~
For the experiments described here, the average cluster size was controlled by varying the expansion source pressure. The scaling relationship of Farges et al. 49 was used to estimate the average cluster size for a given source pressure. CN-Ar n clusters were first observed by LIF associated with the monomer B - X 0-0 band. 1~ For low source pressures (<1.0 atm) the jet spectrum was dominated by the rotational lines of CN. As the source pressure was increased from 1.0 to 1.5 atm, structured CN-Ar,, cluster bands appeared between the CN R-branch lines. Further increases in source pressure caused the cluster bands to merge into a single broad feature that could not be resolved using a laser linewidth of 0.06 cm -1. The maximum of the broad feature blue-shifted with increasing pressure. This trend was not monotonic, and the characteristics of the cluster feature were constant for pressures above 2 atm. Figure 15 shows an example of the CN-Ar n B - X excitation spectrum recorded under high-pressure conditions. This spectrum was indistin- guishable from the B - X absorption spectra reported for CN isolated in solid Ar. From the dependence of the LIF spectrum on the source pressure it seemed that the "matrix limit" was approached for (n) > 70. The red tail of the absorption feature extends to energies below that of the gas-phase band origin, so the B state is red-shifted in Ar.
An obvious and striking difference between clustered and matrix isolated CN was the fact that B-state emission could be seen from the clusters. Dispersed fluorescence spectra were recorded with the excitation laser tuned to the maximum of the cluster absorption band (387 nm). As Figure 15 shows, emissions from both the B ~ X and A ~ X transitions were observed. For source pressures below 2.5 atm the intensity distribution of the fluorescence spectrum was not pressure- dependent (i.e. the distribution of population among the emitting levels was

CN + Rg Collisions, Clusters, and Matrices 121
. , . . d t ~
8
O
25600
I . . . . I , , r _ _
! ! -
25800 26000 26200
Excitation energy / cm" t
2 3 4
g
, ,
350 450 550 650
Emission wavelength / nm
5 ~A---9
..... ~A--8
A ---~X
i
750
Figure 15. The upper panel shows the B-X excitation spectrum for CN-Arn clusters with (n) = 100. The lower panel shows an emission spectrum obtained by exciting CN-Arn clusters at 387 nm. For the A-X bands, vibrational progressions originating from 1)A = 9 and 8 are indicated.
constant). In addition, the spectrum was not dependent on the delay between the excitation pulse and the fluorescence detection gate over the range of 0.5 to 5 Its. These measurements showed that the distribution of emitting states was not changing with time over the stated interval. The A ~ X spectrum from the clusters was also very different from the matrix spectrum. As indicated in Figure 15, the emission following B <---- X excitation of the clusters came from high-vibrational levels of the A-state; those lying immediately below 9B = 0. For matrix isolated CN, emission from a9 A > 4 levels could not be detected. Time-resolved fluorescence measurements for the high A state vibrational levels excited via the clusters gave results that were consistent with radiative decay of unperturbed CN(A).

122 MICHAEL C. HEAVEN, YALING CHEN, and WILLIAM G. LAWRENCE
These observations could be rationalized by assuming that the CN-Ar n clusters consist of CN bound to the surface of an Ar n subunit. Excitation of the B state is then followed by B ~ A predissociation,
CN(B) - Arn ~ CN(A) + Arn (11)
and emission from the CN(A) fragments. Although the resolution of the dispersed fluorescence spectrum was not good enough to distinguish CN from CN-Ar n on the basis of the positions of the band centers, the above interpretation was advanced in ref. 10 as it was consistent with the time-resolved fluorescence data. We have since demonstrated that free CN(A) is ejected from the clusters by using a second laser to probe the fragments via the B-A transition. 5~ Figure 16 shows a typical photofragment excitation spectrum for the B-A 10-9 band. The rotational structure confirmed that the product was free CN(A). Note that the pump-probe delay time used in recording Figure 16 was long enough to allow for some collisional relaxation of the products. The nascent rotational distribution was much hotter than that seen in Figure 16, and population was seen in both the g2 = 3/2 and 1/2 spin-orbit states.
The surface-bound structure for CN-Ar n clusters suggests that the CN-Ar bond is weaker than the Ar-Ar bond. If this is correct, the relative bond strengths can
t I I , I
�9 I I 315 I 515 1 ]5 R~(J) 1.5 . .
I i !
484.0 484.2 484.4 484.6 484 .8
Excitation wavelength (nm)
Figure 16. Photofragment excitation spectrum for CN(A 2]-I, 1)A = 9) frag- ments resulting from predissociation of CN(B, 138 = 0) - Arn clusters. This trace shows a segment of the B - A 2I'I3/2 1 0-9 band.

CN + Rg Collisions, Clusters, and Matrices 123
also explain the fact that binary CN-Ar complexes were not detected in CN/Ar expansions. Binary complexes can only be formed by three-body collisions, so they are generated in the high gas density region of the expansion, where collisions are frequent. Under these conditions the clusters will be rapidly destroyed by exchange reactions of the form:
CN-Ar,, + Ar ---) CN + Arm+ 1 (m _ 1). (12)
Hence, the smaller clusters will never achieve a significant steady-state concentra- tion. In the low gas density region of the expansion, where there are Ar n clusters that are large enough to accommodate the binding energy, CN-Ar,, clusters may be formed by CN + Ar n two-body association reactions. With this mechanism CN is preferentially bound to the surface, and the stronger Ar-Ar bond will not permit CN to enter the cluster.
Given the surface-bound structure of the clusters, it was surprising to find that the matrix and cluster B-X spectra had the same appearance. Neither the matrix or (n) > 70 cluster spectra exhibited the equivalent of a zero-phonon line. This suggests that the broad absorption contour was a phonon sideband in the matrix, and that it corresponded to excitation of low-frequency Ar modes in the cluster. The latter spectrum was further complicated by contributions from a range of different size clusters, and the similarity of the cluster and matrix spectra may be accidental.
Clearly, the CN(B) decay dynamics were sensitive to the local morphology. Time-resolved fluorescence measurements for CN(B)-Arn yielded a decay rate that was the same as the radiative decay rate for CN(B), within experimental error (due to problems with scattered laser light, a much faster decay rate was erroneously reported in Ref. 10). As the decay rate was determined with an accuracy of about 10%, the implication was that the B-A predissociation rate was one-tenth or less of the radiative rate (Fpr e < 1.6 x 10⁶ s-l). Conversely, B-A relaxation in solid Ar was fast enough to preclude detection of B-state fluorescence (F~! > 2 x 10⁸ s-l).
These results demonstrate a well-known pitfall that may be encountered in trying to relate cluster and matrix properties. Some cluster properties may appear to approach the matrix limit with increasing size, but this does not necessarily imply that all properties will approach the limit, or that the local morphologies are similar.
10. SUMMARY AND CONCLUSIONS
Interactions between CN radicals and rare gas atoms have been studied in the gas phase, in small clusters, and in cryogenic rare gas matrices. The data obtained provide an opportunity to examine the way in which the properties of the isolated radical evolve as the radical is solvated. For the X and A states of CN it has been shown that the CN-Rg pair potentials are nearly symmetric. The consequences of this symmetry are clearly reflected in the CN + Rg inelastic collision dynamics and the electronic predissociation of CN(A)-Ne.

124 MICHAEL C. HEAVEN, YALING CHEN, and WILLIAM G. LAWRENCE
Both IC predissociation of CN(A)-Ne and the vibronic relaxation kinetics of matrix isolated CN show strong dependencies on the energy gaps. There appears to be a significant difference between these half-collision processes and CN(A) + Rg full-collision dynamics. Gas-phase transfer cross sections are almost inde- pendent of the energy gaps. This aspect of the full-collision dynamics cannot be explained by current theoretical models. It is possible that differences between the full- and half-collision dynamics stem from the fact that they sample different regions of the IPS. Future studies of the temperature dependence of the transfer rate constants may provide useful insights concerning this apparent anomaly.
From the limited data available, it seems that questions regarding the minimum size of a CN-Rg n needed to mimic matrix properties are dependent on the property and the identity of Rg. The IC rates for CN(A)-Ne and CN(A) in solid Ne are comparable, suggesting that only a few atoms are needed to reproduce the matrix rates. Comparisons of the spectral shifts suggest that a few solvation spheres of Ne atoms may be needed to achieve the matrix limit.
Comparisons of the properties of CN-Ar n clusters with those of CN in solid Ar are complicated by differences in morphology. Clearly, CN is trapped inside an Ar cage in the matrix, while it prefers to reside on the surface of CN-Ar n clusters. Despite this difference, and perhaps by accident, the B - X absorption spectrum for the clusters is remarkably similar to the matrix result when (n) > 70. The relaxation dynamics are very different for Ar clusters and matrices. The non-wetting structure of the clusters does not cause a strong mixing of the B and A states. Consequently, B-state emission is observed, and B ---> A transfer, when it does occur, ejects CN(A) from the cluster. In solid Ar, B ---> A transfer is very rapid and the A-state products are further relaxed by multiple collisions with the surrounding lattice.
From the results presented here it can be seen that CN is a particularly promising chromophore for studies of the properties of a molecular free radical in the most elementary type of solvent. In future work we will examine CN-Rgn clusters with Rg = Ne, Ar, Kr, and n = 1, 2, and 3. Using this data, it should be possible to develop realistic models for a diatomic radical trapped in a matrix or cluster. Ultimately, it is hoped that such models will contribute to our understanding of the various way in which solvent cages participate in chemical reactions.
ACKNOWLEDGMENTS
We thank M. H. Alexander and M. Yang for many helpful discussions, and for permission to use figures reproduced from ref. 32. We gratefully acknowledge the support for this work provided by the National Science Foundation.
REFERENCES 1. Goyal, S.; Schutt, D. L.; Scoles, S. Acc. Chem. Res. 1993, 26, 123. 2. Breckenridge, W. H.; Jouvet, C.; Soep, B. Advances in Metal and Semiconductor Clusters; JAI
Press, Stamford, CT, 1995, Vol. 3, p 1.

CN + Rg Collisions, Clusters, and Matrices 125
3. Leutwyler, S.; B6siger, J. Chem. Rev. 1990, 90, 489. 4. Bacic, Z.; Miller, R. E. J. Phys. Chem. 1996, 100, 12945. 5. Chartland, D. J.; Shelley, J. C.; LeRoy, R. J. J. Phys. Chem. 1991, 95, 8310. 6. Nesbitt, D. J. Faraday Discussions 1994, 97, 1. 7. Anderson, D. T.; Davis, S.; Nesbitt, D. J. J. Chem. Phys. 1997, 107, 1115. 8. Fei, S.; Zheng, X.; Heaven, M. C." Tellinghuisen, J. J. Chem. Phys. 1992, 97, 6057. 9. Randell, K. L.; Donaldson, D. J. Chem. Phys. 1996, 211,377.
10. Lin, H.- S.; Erickson, M. G.; Lin, Y.; Basinger, W. H.; Lawrence, W. G.; Heaven, M. C. Chem. Phys. 1994, 189, 235.
11. Liu, S.; Bacic, Z.; Moskowitz, J. W.; Schmidt, K. E. J. Chem. Phys. 1994, 101, 6359. 12. Liu, S.; Bacic, Z.; Moskowitz, J. W.; Schmidt, K. E. J. Chem. Phys. 1994, 101, 8310. 13. Lin, Y.; Heaven, M. C. J. Chem. Phys. 1991, 94, 5765. 14. Fei, S.; Heaven, M. C. J. Chem. Phys. 1993, 98, 753. 15. Fei, S.; Heaven, M. C. In Laser Techniques for State-Selected and State-to-State Chemistry; SPIE
Proceedings, 1993, Vol. 58, p 286. 16. Lawrence, W. G.; Chen, Y.; Heaven, M. C. J. Chem. Phys. 1997, 107, 7163. 17. Milligan, D. E.; Jacox, M. E. J. Chem. Phys. 1967, 47, 278. 18. Bondybey, V. E. J. Chem. Phys. 1977, 66, 995. 19. Wurfel, B. E.; Schallmoser, G.; Lask, G. M.; Agreiter, J.; Thoma, A.; Schlachta, R.; Bondybey, V.
E. Chem. Phys. 1993, 174, 255. 20. Thoma, A.; Schallmoser, G.; Smith, A. M.; Wurfel, B. E.; Bondybey, V. E. J. Chem. Phys. 1994,
100, 5387. 21. Schallmoser, G." Thoma, A." Wurfel, B. E.; Bondybey, V. E. Chem. Phys. Lett. 1994, 219, 101. 22. Bondybey, V. E.; Nitzan, A. Phys. Rev. Lett. 1977, 38, 889. 23. Jihua, G.; Ali, A.; Dagdigian, P. J. J. Chem. Phys. 1986, 85, 7098. 24. Furio, N.; Ali, A.; Dagdigian, P. J. J. Chem. Phys. 1986, 85, 3860. 25. Ali, A.; Jihua, G.; Dagdigian, P. J. J. Chem. Phys. 1987, 87, 2045. 26. Dagdigian, P. J.; Patel-Misra, D.; Berning, A.; Werner, H.-J.; Alexander, M. H. J. Chem. Phys.
1993, 98, 8580. 27. Halpern, J. B.; Huang, Y. Research in Chemical Kinetics; Compton, R. G.; Hancock, G.; Eds.;
Elsevier Science, 1994, Vol. 1, p 347. 28. Dagdigian, P. J. Ann. Rev. Phys. Chem. 1997, 48, 95. 29. Fei, R.; Lambert, H. M.; Carrington, T.; Filseth, S. V.; Sadowski, C. M.; Dugan, C. H. J. Chem.
Phys. 1994, 100, 1190. 30. Fei, R.; Adelman, D. E.; Carrington, T.; Dugan, C. H.; Filseth, S. V. Chem. Phys. Lett. 1995, 232,
547. 31. Werner, H.-J.; Follmeg, B." Alexander, M. H. J. Chem. Phys. 1988, 89, 3139. 32. Yang, M.; Alexander, M. H.; J. Chem. Phys. 1997, 107, 7148. 33. Shafigullin, M.; Schnupf, U.; Heaven, M. C. Unpublished results. 34. Werner, H.-J.; Follmeg, B." Alexander, M. H." Lemoine, D. J. Chem. Phys. 1989, 91, 5425. 35. Alexander, M. H. J. Chem. Phys. 1982, 76, 3637. 36. Alexander, M. H. J. Chem. Phys. 1982, 76, 5974. 37. Alexander, M. H. Chem. Phys. 1985, 92, 337. 38. Alexander, M. H.; Corey, G. C. J. Chem. Phys. 1986, 84, 100. 39. Heaven, M.; Miller, T. A.; Bondybey, V. E. Chem. Phys. Lett. 1983, 84, 1. 40. Hay, S.; Shokoohi, F.; Callister, S.; Wittig, C. Chem. Phys. Lett. 1985, 118, 6. 41. Katayama, D. H.; Miller, T. A.; Bondybey, V. E. J. Chem. Phys. 1979, 71, 1662. 42. Dentamaro, A. V.; Katayama, D. H. Phys. Rev. A. 1991, 43, 1306. 43. Berning, A.; Werner, H.- J. J. Chem. Phys. 1994, 100, 1953. 44. Fletcher, D.; Fujimura, Y.; Lin, S. H. Chem. Phys. Lett. 1978, 57, 400. 45. LeRoy, R. J.; Davies, M. R.; Lam, M. E. J. Phys. Chem. 1991, 95, 2167. 46. Dubemet, M.-L.; Flower, D.; Hutson, J. M. J. Chem. Phys. 1991, 94, 7602.

126 MICHAEL C. HEAVEN, YALING CHEN, and WILLIAM G. LAWRENCE
47. Alexander, M. H.; Gregurick, S.; Dagdigian, P. J. J. Chem. Phys. 1994, 101, 2887. 48. Dagdigian, P. J.; Alexander, M. H.; Liu, K. J. Chem. Phys. 1989, 91,839. 49. Farges, J.; de Feraudy, M. E; Raoult, B.; Torchet, G. J. Chem. Phys. 1986, 84, 3491. 50. Chen, Y.; Lawrence, W. G.; Heaven, M. C. J, Chem. Phys. 1998, Aug. 15.

VIBRATIONAL SPECTROSCOPY OF SMALL SIZE-SELECTED CLUSTERS
Udo Buck
Abstract . . . . . . . . . . . . . . . . . . . . . . . . . . . . . . . . . . . . . 128
1. Introduction . . . . . . . . . . . . . . . . . . . . . . . . . . . . . . . . . . . 128
2. Experimental Methods . . . . . . . . . . . . . . . . . . . . . . . . . . . . . . 130
2.1. Size Selection . . . . . . . . . . . . . . . . . . . . . . . . . . . . . . . 130
2.2. Depletion Spectroscopy . . . . . . . . . . . . . . . . . . . . . . . . . 132
3. Theoretical Methods . . . . . . . . . . . . . . . . . . . . . . . . . . . . . . . 135
3.1. Potential Models . . . . . . . . . . . . . . . . . . . . . . . . . . . . . 135
3.2. Vibrational Spectra . . . . . . . . . . . . . . . . . . . . . . . . . . . . 138
4. Methanol Clusters . . . . . . . . . . . . . . . . . . . . . . . . . . . . . . . . 139
4.1. Results from IR Spectroscopy . . . . . . . . . . . . . . . . . . . . . . 139
4.2. Isomeric Transitions . . . . . . . . . . . . . . . . . . . . . . . . . . . 146
5. Hydrazine Clusters . . . . . . . . . . . . . . . . . . . . . . . . . . . . . . . . 151
6. Summary . . . . . . . . . . . . . . . . . . . . . . . . . . . . . . . . . . . . . 155
Acknowledgments . . . . . . . . . . . . . . . . . . . . . . . . . . . . . . . . 158
References . . . . . . . . . . . . . . . . . . . . . . . . . . . . . . . . . . . . 158
Advances in Molecular Vibrations and Collision Dynamics, Volume 3, pages 127-161. Copyright �9 1998 by JAI Press Inc. All rights of reproduction in any form reserved. ISBN: 1-55938-790-4
127

128 UDO BUCK
ABSTRACT
Weakly bound molecular clusters are size-selected by momentum transfer in a scattering experiment with atoms and then photodissociated by infrared photons to generate depletion spectra as function of their size. From the measured line shifts, which depend sensitively on the excited mode, the cluster size, and the forces involved, detailed information is obtained on the structure of the clusters by accom- panying calculations. Case studies are presented for the CO and OH stretch mode of methanol and the NN stretch and the NH2 wag mode of hydrazine clusters in the size range from n = 2 to n = 10. Different isomers are identified by their spectra and these fingerprints are used for the determination of isomeric transitions in methanol hexamers. While methanol clusters are dominated by stable cyclic isomers with Sn symmetry for the even numbered ones, the spectra of hydrazine can only be explained by the contributions of several isomers which exhibit three-dimensional structures from the tetramer onwards. The requirements of the potential models and the methods for calculating realistic spectral shifts are discussed.
1. INTRODUCTION
The investigation of structural and dynamical properties of molecular clusters has attracted much interest. 1-3 These clusters are usually weakly bound by either van der Waals forces or hydrogen bonds. They are expected to form the link between single molecules in the gas phase and the bulk condensed phase. Compared with crystalline matter, they are of finite size without the symmetry of the space group, they have a large surface-to-volume ratio, and they can change their properties when adding or subtracting one constituent. Compared with stable molecules, the clusters form many more isomeric structures which can easily be interchanged. These transitions resemble, to a certain extent, the phase transitions of the bulk.
In this chapter we want to address the behavior of small, homogeneous molecular clusters in the size range from n = 2 to n = 10. For the larger clusters in this size range, reliable experimental information is lacking. The smallest complexes, dimers and trimers, are usually well studied in numerous high-resolution spectroscopic experiments 4-6 and large clusters are very often well described by the behavior of the condensed phase which is explored in electron diffraction experiments. 7'8 Aside from the more general questions on the structure of these clusters, their dynamical behavior is also of special interest since these clusters play a key role for the understanding of the microscopic interactions and perturbations between solvents and solutes in solutions. A further dynamical question is the investigation of the isomeric transitions and the related question of phase transitions 9'1~ and the disso- ciation after the excitation of the molecular vibrations. The flow of energy between an excited intramolecular mode and the motion along the weakly bound intermo- lecular dissociation coordinate is an extremely interesting mode-coupling problem which has attracted, and still attracts much interest. 5'1~'12

Vibrations of Size-Selected Clusters 129
The common tool in all these investigations is infrared spectroscopy which is one of the classic methods to get structural information on molecules. Therefore it is not surprising that this method has also been widely applied to molecular clusters. In particular, these studies include direct absorption experiments with infrared 4 and far-infrared excitation 6'13 and the optothermal detection method, 5'14-16 in which the positive (excitation) or negative (dissociation) energy content of the beam is detected by a low-temperature bolometer. All these methods, however, work best for the small complexes, since in these cases the spectra themselves are used to identify the cluster size based on accompanying calculations.
For larger clusters additional size-specific information is necessary. The reason is that the techniques for generating free cluster beams, namely the supersonic adiabatic expansion or the aggregation in cold gas flows, produce in almost all cases a wide distribution of cluster sizes. 17 In principle, the problem could be solved by a size-specific detection method. The most commonly used method for this purpose, however, the ionization and the subsequent mass selection in a mass spectrometer, is hampered by the ubiquitous fragmentation during the ionization process. It is caused by the energy released into the system as the clusters change from their neutral to their ionic equilibrium structure. This excess energy then leads to
18,19 For the molecu- evaporation of neutral subunits, and thus fragmentation occurs. lar species considered here, the resulting fragmentation pattern is often modified by fast chemical reactions of the ionized molecular units with neutral partner molecules within the cluster 19'2~ In any case, a simple mass spectrum does not at all characterize the neutral cluster distribution.
Therefore selection methods have to be applied to make sure that the experiments are carried out with one neutral cluster size only. One possibility is to use special ionization techniques for a certain class of molecules. A well-known example is the two-color resonant two-photon ionization of aromatic molecules. 21'22 In this case the neutral and ionic equilibrium structures are similar and by carefully adjusting the ionization energy near the threshold region, fragmentation is avoided. In addition, the first step, the excitation of a suitable electronic state, can be made size-specific, so that a very reliable method results. This is, however, restricted to molecules with suitable electronic transitions. An alternative method is the momen- tum transfer in a scattering experiment with atoms. In this way mass distributions of very large clusters (n = 10,000) were obtained by deflection from a crossed jet under multiple-collision conditions. 23 In the high-resolution version of this method, small clusters (n < 10) were separated from each other by making use of their
19 20 24 different angular and velocity distribution in a single collision experiment. ' ' Thus it is the main purpose of this chapter to summarize studies on the structure
and dynamics of molecular clusters using the scattering method for the preparation of clusters of one size and combining it with depletion spectroscopy based on infrared photo dissociation. The selection method is followed by an appreciable loss of intensity and thus certain restrictions in the experimental possibilities concerning the resolution have to be taken into account. But by applying this

130 UDO BUCK
technique, we have the great advantage that we definitely know that we measure the spectra of one cluster size only.
We begin this review in Section 2 with a description of the techniques used in these experiments, the size selection by momentum transfer, and the infrared depletion spectroscopy which is, in fact, based on vibrational predissociation. We shortly introduce the lasers used in these experiments. Then the theoretical tools, which include the discussion of the intermolecular potentials involved in the calculation of the cluster structures and the calculation of the corresponding vibrational spectra, are presented in Section 3.
In Sections 4 and 5 the results obtained for size-selected molecular clusters are presented. We start with a detailed description of the measured spectra and their relation to the cluster structure. We try to answer the following questions: (1) How can the spectrum, characterized by the line shifts, be related to the structure of the clusters? (2) What is the dependence on cluster size and excited mode? (3) Are there differences for different bonding types and what are the reasons for these? As examples the linear hydrogen-bonded (CH3OH), , and the multiple hydrogen- bonded (N2H4) n clusters will be presented.
We will also show some results on the dynamical behavior of methanol hexamers. This includes the calculation of structural transitions and their first experimental realization. In Section 7 a summary of what is known on the structure and the dynamical behavior of the investigated clusters will be given.
Several articles and reviews on the spectroscopy of size-selected molecular clusters have already appeared. Some of them are relatively short contributions to conferences 25-28 which also address other subjects. Others deal only with a certain aspect of the field or do not contain the latest results which have been obtained both in the interpretation of the measured infrared spectra and in terms of new experi- mental results. 29-32
2. EXPERIMENTAL METHODS
2.1. Size Selection
The method of size selection by momentum transfer in a scattering experiment with atoms under single-collision conditions has been described in detail in the literature 19'24'27 so that we give here only a short account of the principle. The method is based on the fact that the heavier clusters are scattered into smaller angular ranges with different final velocities compared to the lighter clusters. This is demonstrated pictorially in Figure 1.
It is best explained by a velocity vector (or Newton) diagram which is constructed on the basis of conservation of momentum and energy. Such a schematic diagram is shown in Figure 1, assuming that the cluster beam (velocity v c, mass n �9 m l) is crossed by the atomic beam (v s, ms) at an intersection angle of 90 ~ The relative velocity is given by the difference vector g = v c - v s. For elastic scattering all final

Vibrations of Size-5elected Clusters 131
Cluster- beam
Target- beam
-G; Figure 1. Schematic arrangement and Newton diagram for the scattering of a cluster beam (velocity Vc) by a target beam (velocity vs). The circles are the positions of elastically scattered clusters of the size n.
I center-of-mass (cm) velocities u c are restricted to end on a sphere around the center-of-mass with the radius:
u~n) = msg/(nm I + ms ) (1)
For the used in-plane geometry of the two beams and the detector, the spheres are reduced to circles. In the case of inelastic scattering, one has to take into account the transferred energy AE which changes the final velocity according to
�9 ) u c = u c (1 - AE/E) 1/2 where E is the collision energy. Since the clusters have nearly the same velocity v c, their relative velocities are
nearly independent of the cluster size, while the final cm velocities u~ ") are quite different. With increasing mass of the clusters they decrease and so do the radii of the circles in the diagram (see Eq. 1 and Figure 1). For the laboratory (lab) angle shown in the diagram only trimers, dimers, and monomers are detected, whereas the maximum scattering angle 0 4 for tetramers is smaller. It is immediately clear from this picture that larger clusters can easily be excluded by choosing the correct angle for detection. For the necessary additional discrimination against smaller clusters, two solutions are used: the measurement of the velocity or the measure- ment of the m a s s . 19'20'24
In the first method, in addition to the angle, the final velocity is specified. For this purpose, either time-of-flight analysis or a mechanical velocity selector is used. This procedure is general and completely independent of the subsequent detection process. In the second method a mass spectrometer is used to discriminate against the smaller clusters. This procedure works only if at least a small fraction of the cluster M n is detected at the nominal mass of the ion M~n or at a fragment mass M+~ which is larger than that of the next smaller cluster M~_ 1. This method is used for the size selection of the molecular clusters presented here. They are very often

132 UDO BUCK
detected at the protonated masses so that, for example (CH3OH),, appears at (CH3OH)n_ l H§ one mass unit larger than the next smaller nominal cluster mass.
The procedure requires, in general, a high-resolution molecular beam apparatus and intense cluster beams with good expansion conditions to minimize the angular (A0 < 0.1 ~ and velocity spread (Av /v < 0.05) of the colliding beams. The first part is realized by skimmed beams introducing additional apertures. The latter is usually achieved by expanding a mixture of 2 to 10% of the gas in helium or neon.
The natural limit of this procedure for size-selecting clusters is given by the fact that the maximum deflection angles for the different sizes come closer and closer together with increasing n. In our experimental arrangement, it is no problem to select clusters with n = 6 for monomer masses around m I = 50 u, when He is used as scattering partner (m s = 4 u). These values depend, however, very much on the masses and velocities of the particles. Increasing m c = n m I and v c deteriorates the resolution, while increasing m s and v s improves it. In the former case, the Newton circles shrink, while in the latter case, the contrary is valid. For the masses, this result follows directly from Eq. 1, while for the velocities, it can be visualized from Figure 1.
These considerations were recently demonstrated in experiments with acetoni- trile which was seeded in neon instead of helium, which decreases v c. Scattering from Ne and Ar instead of He also increases m s. At a lab scattering angle of 6 ~ cluster sizes of n = 5, 12, and 20 are detected for the scattering from He, Ne, and Ar, respectively. In this way (CH3CN)n clusters were selected up to 33 + 8. 27,33 The error range which is calculated from the mass (lower limit) and the deflection angle (upper limit) reflects largest possible limits and is probably much smaller in reality.
In general, the intensity loss which is caused by the scattering process is in the order of 10 -6 so that size-selected neutral beams of one cluster size with the intensity of 3 x 10¹² particles per sr and s are obtained.
It is noted that during the scattering process a certain amount of energy is transferred into the cluster. This is especially valid if Ne or Ar is used as the scattering partner instead of He. This fact does not disturb the size selection. As already mentioned earlier, the radii of the Newton circles get smaller and the procedure works as with elastic scattering. The reason is twofold. First, the different cluster sizes are, in general, equally affected by the inelastic scattering and thus all the circles become smaller by the same amount. Second, by selecting the deflecting angle for the detection close to the elastic limit, the influence of the internal excitation can be reduced. In any case, this effect can be measured by time-of-flight analysis and is taken into account in the data evaluation.
2.2. Depletion Spectroscopy
The method of size selection is now combined with an adequate spectroscopic procedure. Here we use the well-established depletion technique by vibrational
5 34 36 predissociation. ' - The monomer with the vibrational coordinates qi and the

Vibrations of Size-Selected Clusters 133
intramolecular potential U m (qi) is excited within the cluster from the ground state v = 0 to the excited state v' = 1. The cluster is bound by the intermolecular interaction
potential V (qi, Rj) of the complex with the stretching coordinates Rj. Because of the excitation, this potential is shifted upwards, and in general slightly modified.
Usually, the energy of one vibrational quantum of the monomer is larger than the binding energy of the cluster so that the excited bound state of the cluster couples to the continuum of the ground state and the cluster dissociates. These dissociation spectra contain the following information:
1. The line shift Av which is caused by the interaction of the excited oscillator with the surrounding molecules gives information on the structure of the cluster.
2. The linewidth F contains, if homogeneously broadened, information on the lifetime and thus on the dynamical coupling of the intramolecular vibrational mode to the intermolecular modes of the cluster.
Here we are essentially interested in the frequency shift. The transition frequency v 0 of the unperturbed system shifts by Av if the potential energy of the complex in the excited state V' (qi, Rj) is different from that in the ground state V (qi, Rj). Typical reasons are a larger (smaller) well depth or a wider (steeper) curvature of the excited state which lead to a red (blue) shift of the frequency.
The actual experimental arrangement is shown in Figure 2. By adjusting the detector to a certain angle and mass, one cluster size is selected. Then the scattered
beam is attenuated by the radiation of a laser beam counter-propagating along the beam direction. The dissociation is measured by monitoring the decrease in the
Dissociation e (OPO, CO,-Laser) ^ ~ ~
Selection l, Cluster Beam ,~
Figure2. Experimental arrangement to measure photodissociation depletion spectra with size selected clusters. The size selection is achieved by deflection and a quadruple mass spectrometer.

134 UDO BUCK
intensity as a function of the laser frequency v and the laser fluence F. The fraction of dissociating molecules Pdis is given by,
N O - N (v) (2) Pdis(V) = No = 1 - ~ X i exp [- oi (v) F/hv]
i
where N O and N(v) are the cluster signals with laser off and on, X i is the fraction of isomer i in the beam, v is the laser frequency, and a i (v) is the dissociation cross section of the corresponding isomer. This is usually expressed by the Lorentzian line shape which is predicted by theoretical considerations. 32 The three quantities hay, F, and a are then obtained from the position, the width, and the amplitude of the Lorentzians fitted to the data. In the case of more than one line per cluster, a i (v) has to be replaced by a sum over these lines. It is noted that the implicit assumption in these derivations, the homogeneity of the linewidth F, is not neces- sarily fulfilled by the measurements which might be inhomogeneously broadened by rotational and librational states. In such a case F is simply a measure of the distribution.
Because of the scattering process, the dissociation takes place with internally excited clusters. In order to avoid this excitation, Huisken and coworkers apply a slightly different experimental arrangement. 29 Here, the laser-molecular beam interaction takes place before the scattering center where the clusters are still cold. Then the cluster beam is dispersed by the He beam, and cluster-specific detection is obtained as in the first case. Although the laser interacts with all clusters in the beam, only the dissociation of the cluster size to which the detector is adjusted will be measured. This arrangement can cause problems if a larger cluster, which is a dissociation product, does not leave the beam fast enough and reaches the scattering region where it is counted as nondissociated and contaminates the detector signal. Thus the method introduced here is better suited for measuring larger clusters since they are dissociated after the size selection, while the method of Ref. 29 is superior for resolving structures in smaller clusters since the clusters are colder.
This effect, however, can in turn be used to study the influence of the internal excitation on the measured spectra. The results show that the influence becomes less important the larger the cluster is. Thus we observed no difference in the width of the spectra of (CH3CN)n clusters for n = 8, n = 9, and n = 24 which were selected by scattering from He, Ne, and Ar, respectively. 33 Apparently, the large number of degrees of freedom of these clusters helps to distribute the energy so that no measurable effect is found in the spectra. The same result is observed when the spectra of collisionally deflected clusters are compared with those obtained from cold ones. Only for dimers with their restricted possibilities to distribute the energy, are large differences observed. 37-4~
The actual experimental setup for measuring depletion spectra of size-selected clusters consists of a high-resolution crossed molecular beam machine coupled with laser excitation. For the excitation in most cases a high-power continuous-wave

Vibrations of Size-Selected Clusters 135
CO 2 laser in the 10 l.tm range is used in order to achieve a reasonable fraction of dissociating clusters. The wavelength range has been extended to the 3 l.tm range by employing a Nd:YAG laser-pumped optical parametric oscillator. 41 Thus the important stretching vibrations in which hydrogen atoms are involved also become experimentally accessible by this method.
A further interesting experimental result is that for all the systems measured up to now, with one exception only, a linear fluence dependence is measured and thus the validity of applying Eq. 3 is confirmed. Such a result is expected for one-photon absorption processes. It is, however, surprising for a number of clusters, for which the CO2-1aser photon of about 12.5 kJ/mol is not sufficient to dissociate them. Examples are methanol dimers and trimers which were definitely shown in elegant double- and triple-resonance experiments to dissociate only after the absorption of two and three photons, respectively. 42 This is in complete agreement with the calculations of the binding energies where the zero-point energies are taken into account. Given the laser fluence of about 50 to 100 mJ/cm 2 in the present experi- ments, a multiphoton excitation with a nonlinear fluence dependence is expected. This was, however, with the exception of the benzene trimer,43 never observed in all the investigated systems and cluster sizes. The explanation is given in a recent calculation of such processes. 32 Under the condition that the anharmonicity of the system is smaller than the decay rate of the dissociation process, we get a linear power dependence. Now the first step can be made resonant and the second photon reaches the excited state within the width which is broadened by the decay process despite the two-photon energy mismatch. This means that the rate-limiting step is the single-photon excitation with a fast decay after the second photon is absorbed.
3. THEORETICAL METHODS
Experiments on clusters should, in general, be accompanied by calculations for the benefit of both fields. The experiments usually cannot be interpreted in an unam- biguous way without calculations since too many degrees of freedom are involved. On the other hand, the calculations are, because of the same reasons, approximative so that a comparison with the real data is advisable. For the present problem, first the structure of the clusters has to be determined since this information is not yet measurable for clusters by a method like X-ray diffraction analysis in solid-state physics. For the structure calculations which are based on procedures of finding the minimum of the binding energy, a reliable interaction potential has to be used. Then the line shifts have to be calculated for the direct comparison with the experimental data. We will discuss the two problems separately.
3.1. Potential Models
Complete ab initio calculation of the total energy surfaces including configura- tion interaction effects are still difficult when state-of-the-art methods are applied

136 UDO BUCK
and clusters larger than trimers are involved. 44 In many cases model potentials which are based on reliable multicenter potentials are used. These potentials are usually written as:
V = Vre p + Vdi s + Velec + Vin d (3)
We will discuss the different terms separately. In general, they are obtained from ab initio calculations at the Hartree-Fock self-consistent field (SCF) level 45-47 or from further approximative schemes like the test-particle method of Ahlrichs and coworkers 48'49 or the systematic model of Wheatley and Price 5~ which is based on properties of ab initio wavefunctions of the monomer. A further approximative step in which the parameters are fitted to experimental data is done in empirical methods. 51,52
Vre p is the repulsive first-order contribution to the electronic exchange energy. The distance and orientation dependence can be approximated by a sum of site-site interactions at i and j on different molecules:
Vrep = Z aij exp (-BiYij). (4) i,j
The sites are usually the positions of the atoms and sometimes also the bonds with the lone-pair electrons included. The second term represents the attractive long- range dispersion or van der Waals forces which are obtained in second-order" perturbation theory and which are often truncated after the first instantaneous dipole-dipole term:
Vcfis = - Z Cij/R6ij" Fij(Rij ) - ' ' ' " (5) i,j
A damping function, F O. (Rij), reduces this term at small distances. 53'54 This contri- bution is calculated by ab initio methods or taken from semiempirical formulas using the known polarizabilities.
The third term is the first-order contribution to the electrostatic energy,
Ve,~x = 1/(4~EO) ~ qtqj/Rij + . . . ij
(6)
which is written here as the sum of interactions between point charges qi where e 0 is the dielectric constant. The site charges can be determined by calculating or measuring the electrostatic multipole field 5~ which is then reproduced by the point-charge model or a truncated series of the multipoles themselves which sometimes also includes a penetration term.
The last term is caused by the induction of multipole moments in the polarizable molecule j by the charge distribution of the other molecules at different sites i, i' and vice versa:

Vibrations of Size-Selected Clusters 13 7
1 qiqi" gind=-"2 ~t ip Z Cs R2 R2 j
�9 . j
(7)
This is the only term which is nonadditive and which contributes, in the case of hydrogen-bonded systems, to the well-known cooperative effect: an increase of the incremental bonding energy per molecule with increasing cluster size. 56-58 For van der Waals systems it is small and very often the pairwise additive model is also used for hydrogen-bonded systems. To account for the nonadditive contributions without calculating them, the parameters of the model are sometimes adjusted according to measurements of the condensed phase. 52 Once the potential parameters are chosen, the structures are obtained by starting with randomly selected geometries and minimizing the binding energy. We would like to summarize this section by stating that the interaction potential is modeled at three different types of sophistication:
1. Ab initio: In this case, a complete calculation of the intra- and the intermo- lecular potential is performed. It is usually based on the Hartree-Fock approximation and sometimes corrections by configuration interaction are added.
2. Systematic models: Here, expressions given above are used and the parame- ters are determined from simplifying calculations. 48'5~
3. Empirical Models: In this case, simple Lennard-Jones or similar potential representations together with the electrostatic term are used. Potential pa- rameters are fitted to calculations and data of the condensed phase. 51'52
We will partly give reference to the potentials of types 1 and 3, but use mainly for the calculation of the properties of methanol and hydrazine clusters a systematic potential model (type 2). 59'60 They are essentially obtained from ab initio monomer wavefunctions, using a modification of the systematic potential method described previously for chlorine-chlorine 5~ interactions. There are considerable advantages inherent in using SCF monomer calculations rather than supermolecule calcula- tions: monomer calculations are free of basis set superposition errors; only one or a few monomer calculations are required, whereas supermolecule calculations have to cover the whole configuration space for each molecule, and supermolecule calculations give only an estimate of the total potential energy, which is difficult to correct for basis set and correlation effects, whereas monomer calculations give physically meaningful components such as those in Eq. 6. These components can be adjusted if necessary to reproduce known molecular properties such as mul- tipoles and polarizabilities. It is also easier to find reasonable functional forms that fit the components in Eq. 3 separately, rather than fitting the total potential energy obtained from supermolecule calculations.

138 UDO BUCK
3.2. Vibrational Spectra
For the calculation of the vibrational line shifts we have developed two different procedures which are based on the normal mode analysis. The first method, subsequently called the molecular approach, goes back to a procedure which was originally derived for solvents in liquids. 61 As a starting point, both the intra- and the intermolecular potentials are expanded in a Taylor series in dimensionless normal coordinates 62 of the isolated molecule:
1 1 Um (q)='2 Z O')i 4 +-~ Z l~ijkqiqJ qk +' '"
i ijk (8)
/)V 1 02V (9)
i ij
For the cluster we have to sum, in addition, over the different molecules. This summation is left out in Eqs. 8 and 9. The first equation corresponds to the conventional normal mode approach including cubic anharmonicities. Note that for symmetric molecules some of the cubic force constants Cqk vanish. The second equation describes the intermolecular interaction in terms of the all coordinates. Using nondegenerate perturbation theory one obtains for the shift of the vibrational excitation frequency (v = 0 --~ v = 1)'63
1 /)2V ~ fl__VV Ali~o = -~ i)q---~i - ~j toj ~qj" (10)
The first term, which is obtained in first order, represents the change of the force constant, while second term obtained in the second order represents the effect of a force (-i) V/ ()qj) which shifts the equilibrium value of the normal coordinate multiplied by the corresponding anharmonic force constant. Thus a steeper poten- tial (i)2V/()q 2 > 0) causes a blue shift, while an elongation of the bond OV/qi < O) leads to a red shift, if the anharmonic force constant is negative. 64 In case of homogeneous clusters, the perturbation theory has to be extended to degenerate states and instead of using Eq. 10 the result is obtained by diagonalization of the corresponding perturbation energy matrix. 64 In this way the manifold of the excited degenerate states in the cluster is coupled. This leads in some cases to a splitting of the frequencies. These modes can be viewed as linear combinations of the respective normal modes of the constituent molecules. In the same way transition dipole moments can also be calculated as a vector sum of the moments of the individual molecules. In second order, the excited modes are coupled to the other vibrational modes of the same molecule. A further improvement in which also the vibrations of the different molecules are coupled has been introduced by Beu. 65

Vibrations of Size-Selected Clusters 139
The disadvantage of this approach lies in the fact that in zeroth order the somewhat unrealistic harmonic approximation of the molecule is used. Therefore we have developed a different procedure that starts from the complete cluster and includes the anharmonic intramolecular force field of the single molecules and the complete intermolecular potential between the monomer constituents already in zeroth order. We call this method the cluster approach. After the normal mode analysis of the complete cluster, the anharmonic corrections are calculated in the usual perturbation theory up to quartic corrections. 66 In cases of very anharmonic potentials a variational calculation using a harmonic oscillator basis has also been used. The procedure has, in addition, the advantage that the complete set of frequencies for all modes is obtained. A method based on similar considerations has been published by Watts. 67
4. METHANOL CLUSTERS
4.1. Results from IR Spectroscopy
Methanol is an important polar solvent with a nearly linear hydrogen bond. The solid phases are known to be made up of parallel hydrogen bonded chains with coordination number z = 2. 68 Similarly, the dominating structures of the liquid are chains and to a lesser extent also rings with two hydrogen bonds per molecule on the average. Structures with one bond per molecule (terminated chains) and three bonds per molecules (branching points) are present but with less probability. 69 On the other hand, it is well known that properties of the gas phase like the thermal conductivity clearly demonstrate the existence of larger clusters in ethanol vapor. 58 Free methanol clusters have been thoroughly investigated by the scattering method both in the range of the CO and the OH stretch mode. We will discuss the results separately.
The CO Stretch Mode
In the range of the CO stretch mode near 1033.5 cm -l line-tunable CO 2 lasers were used both for internally excited clusters up to n = 638,70 and also very recently up to n = 871 using cw lasers, and cold clusters up to n = 4 using pulsed lasers. 39 The experimental results agree where they are available very well with each other. The spectra, which are taken in the experimental arrangement of Figure 2 are shown in Figure 3. Here, the laser interacts with slightly excited complexes. In the case of the dimer, the measurements are carried out in the direct beam so that mainly cold ones are probed. 72 This is achieved by making the seeding mixture very dilute to assure that only dimers are in the beam. The results are again in good agreement with the experiment conducted with size-selected, cold species. 39
The dimer spectrum is characterized by a two-peak structure with one peak shifted by -6.8 cm -1 to the red and another one shifted by + 18.5 cm -1 to the blue

140 UDO BUCK
-30 0 30 60 -30 0 30 60 - ! - - ! - - 1 - - , �9 - | - �9 ! - - ! - - | -
1.0- = - - n = 8 - 1 . 0
0.5 - 0.5
0.0 " ' , . . . . . . . . . . 0.0 0.6 - n=4 -- n=7 1.0
c 0.3 i 0.5 O i
O i
' - ' 0.0 U. 0.0
0.6 - n=3 -- n = 6 0 . 8
"~ u 0 ~ -10 cm-1
.~ 0.3 0.4 E3 ~ . ,
0 . 0 " , . . . . , . . . . . "
i 0.50 - n=2 - n=5 1.0
0.25 - ~ ~ 0.5
0.00 . . . . L . ~ , L ~ - ' ~ 0.0 1000 1050 1100 1000 1050 1100
-1 Frequency / cm
Figure 3. Measured photodissociation spectra of size-selected methanol clusters near the CO stretch mode at 1033.5 cm -1 (from refs. 38, 71,72). The upper scale marks the frequency shifts. The sticks are calculated spectra with relative intensities using the minimum energy configuration based on the systematic potential and the cluster approach in the anharmonic (n = 4-13) or
59 the variational (n = 2-3) approximation. The values on the right hand side are shifted by the amount indicated in order to match the experimental results.
compared with the frequency of the free CO stretch mode. For the next larger clustersmthe trimer, tetramer, and pentamernthe experimental data have been interpreted as resulting from one peak only, shifted to the blue by +7.5 cm -1, + 10.8 cm -l, and + 14.3 cm -1, respectively. We note that the full width at half maximum F is smaller for the tetramer compared with that for the trimer and the pentamer. This behavior changes with the hexamer. Now a double peak structure appears with one peak shift by only +6.9 cm -l and the other one shifted further to the blue by + 18.5
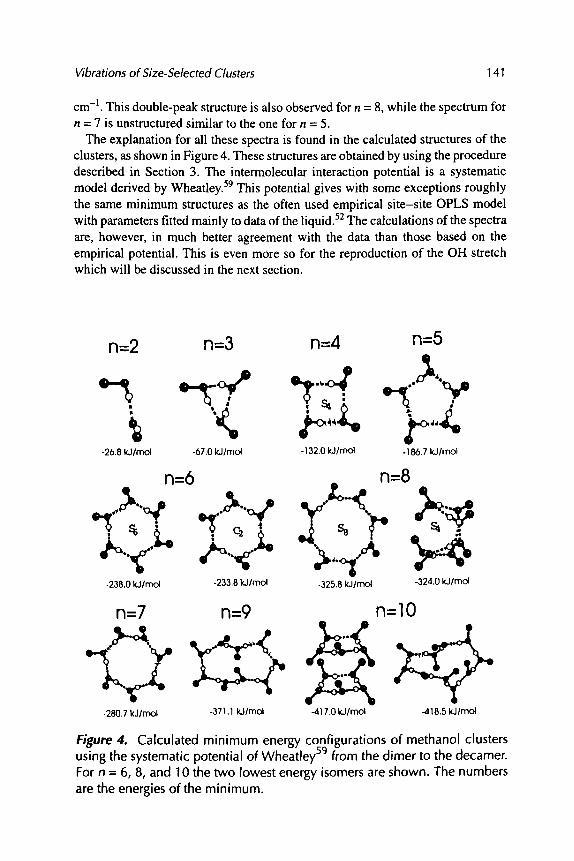
Vibrations of Size-Selected Clusters 141
cm -I. This double-peak structure is also observed for n = 8, while the spectrum for n = 7 is unstructured similar to the one for n = 5.
The explanation for all these spectra is found in the calculated structures of the clusters, as shown in Figure 4. These structures are obtained by using the procedure described in Section 3. The intermolecular interaction potential is a systematic model derived by Wheatley. 59 This potential gives with some exceptions roughly the same minimum structures as the often used empirical site-site OPLS model with parameters fitted mainly to data of the liquid. 52 The calculations of the spectra are, however, in much better agreement with the data than those based on the empirical potential. This is even more so for the reproduction of the OH stretch which will be discussed in the next section.
n=2 n=3 n=4 n=5
-26.8 kJlmol -67.0 kJlmol -132.0 kJlmol -I 86.7 kJlmol
n=6 n=8
-238.0 kJlmol -233.8 kJlmol -325.8 kJlmol -324.0 kJlmol
n=7 n=9 n=lO
-280.7 kJlmol -37 I. I kJlmol -417.0 kJlmol -418.5 kJlmol
Figure 4. Calculated minimum energy configurations of methanol clusters using the systematic potential of Wheatley s9 from the dimer to the decamer. For n = 6, 8, and 10 the two lowest energy isomers are shown. The numbers are the energies of the minimum.

142 UDO BUCK
The dimer exhibits a linear hydrogen bond, while the trimer and tetramer are non-planar rings with C l and S 4 symmetry, respectively. This is in,contrast to the structures calculated for the OPLS potential 52 which are planar with C3h and C4h symmetry, respectively. For the larger clusters the odd ones n = 5, 7, and 9, exhibit distorted tings, while the even ones continue to show S 6 and S 8 symmetry. These are very symmetric structures with the methyl groups pointing alternately up and down. The decamer is the first cluster for which, aside from the distorted, elongated, cyclic structure, a doubled five-membered ring also appears which has nearly the same binding energy. It is noted here that for n = 6 and 8 there also exists some isomeric structures close to the just-mentioned minimum-energy configurations. They are also displayed in Figure 4. For the hexamer it is a ring with C 2 symmetry with four methyl groups pointing down and two pointing up and for the octamer a folded ring with S 4 symmetry.
Now let us try to explain the line shifts based on these structure calculations. Here we apply the methods mentioned earlier in Section 3. The procedure used for the calculations is the cluster approach with anharmonic corrections. 59'66 The intra- molecular force field is a modified version to that in Ref. 73. The results are presented by the sticks in Figure 3, which also give an indication of the relative intensities. For the dimer, the excited CO stretch mode is in a nonequivalent position with respect to the hydrogen bond. The O atom of the acceptor participates directly in the bond, while this is not the case for the donor. This explains the line splitting. The calculation gives a red shift for the acceptor and a larger blue shift for the donor in nearly complete agreement with the measurements. The red shift originates mainly from the elongation of the C-O distance in the attractive hydrogen bond. The blue shift results from a stronger force constant and the coupling to the OH mode which squeezes the C-O distance.
For the larger odd-sized clusters, nonplanar tings are found in the structure calculations. This behavior results in spectra in which the number of lines corre- spond to the cluster size since each CO oscillator contributes to the spectrum. This gives three lines for the trimer, five for the pentamer, and seven for the heptamer. In contrast, the even-numbered, symmetric structures with S n symmetry exhibit two lines only. The calculations show that the two peaks originate from the coupled symmetric and antisymmetric motion of all the CO oscillators.
The predictions are in good agreement with the measurements for n = 5 to n = 8 as far as the form of the spectra is concerned. Indeed, the hexamer and the octamer exhibit a two-peak structure as predicted, while the pentamer and the heptamer show broad unstructured features caused by several lines. The absolute values of the calculations are systematically shifted to larger frequencies. This is not the case for the results of n = 2 to n = 4. Here the agreement is perfect with respect to the absolute scale. The low resolution of the line-tunable laser, however, prevented us from resolving the three narrow lying lines for the trimer and the two lines for the tetramer, although the lines of largest intensity match very well the measured spectra. The almost perfect agreement of calculated and measured spectra up to n

Vibrations of Size-Selected Clusters 1 43
= 5 clearly indicates that the new systematic model potential is a very good one. The deviations which occur for the larger clusters in the absolute shift are probably caused by the potential model which is mainly a very accurate dimer potential but neglects, aside from induction effects, repulsive three-body interactions.
The explanation given in previous publications saying that the "single" line structure of the trimer and tetramer are an indication of a planar structure of these clusters can definitely be ruled out, since the OPLS potential 52 on which these conclusions for the structures were based, does not predict the correct shifts. All the more realistic potential models predict for the trimer a slightly distorted planar structure which causes the degenerate IR-active band to split into two components and the symmetric IR-inactive vibration to become IR-active.
The quantitative comparison of the line-shift calculations based on the different potential models and the different approximations is given in Table 1 for three selected clusters. The best result is obtained as already discussed for the systematic potential model and the cluster approach with anharmonic corrections. The varia- tional calculations do not improve this result. The results based on the empirical OPLS potential gives incorrect shifts or splitting. This is better for the SCF calculation, which predicts the correct splitting but fails for the shifts. This can
Table 1. Measured 38'39'71'72'74 and Calculated Line Shifts of the CO and OH Stretch Mode of Selected Methanol Clusters a
OPL5 Systematic SCF
n, mode exp mol -1 mol-2 clu-h c lu -a clu-h c lu -a clu-v scf-h
2, CO + 18.5 29 18 13 14 16 20 20 12
-6.8 1.3 2 -5 -5 -12 -7 -7 -14 3, CO 7.5 4 23 13 14 8 10 11 8
5 7 9 1 3 5 6 -2
6,CO 18.5 33 29 13 15 20 26 29 4 6.9 17 23 10 11 3 13 15 -3
2,OH 3 21 -43 -35 -25 -40 -26 17 -3 -107 -239 -222 -261 -234 -162 -146 -131 -78
3,OH -172 -262 -233 -187 -163 -135 -116 -211 -194 -171 --178 -120 -248 -225 -200 -213 -155
6,OH -361 -347 -295 -387 -347 -203 -451 -389 -333 -426 -376 -250
Note: aln cm -1 for different methods: mo1-164; mol-2, 6s clu 66 with h harmonic, a anharmonic, v variational calculation of the frequencies using the empirical OPLS potential of Jorgensen s2 and the systematic
s9 model of Wheatley; scf 47 ab initio calculations in the SCF approximation.

144 UDO BUCK
partly be traced back to the harmonic approximation which is used in these calculations. With respect to the line-shift calculations, the cluster approach is, in general, superior to the molecular approach as is the anharmonic correction to the harmonic calculation.
The OH Stretch Mode
Recently, results for the excitation of the OH stretch mode at 3681 cm -] have also become available which are based on completely size-selected beams. Huisken and coworkers measured the dimer 41'4~ and the trimer, 74 while in our laboratory spectra from n = 4 to n = 9 were taken. 71 Compared with the CO stretch mode, the OH stretch mode exhibits much larger shifts to the red caused by the lowering of the curvature of the interaction potential of the hydrogen bond. Therefore this system should be a much more critical test both for the potential model and the method for calculating the shifts. In principle, the spectra should display a similar structure as those for the CO stretch mode. The experimental results are shown in Figure 5 for the dimer and trimer and in Figure 6 for the other clusters. The dimer, tetramer, and hexamer show the expected two bands. The octamer, however, has a structured spectrum with three peaks. Regarding the odd cluster sizes, the trimer spectrum consists of three separate lines, while the larger ones, n = 5, n = 7, and n = 9 exhibit spectra with several weak bumps which, in general, are broader than
,m, e- D 0.25 ..o
L_
< 0.20 c,.
. o 0 . 1 5
0.10 LL "0 -.~ 0.05 o,~ o o 0.00 u) r
. . = . a
i
q p
v
' [ . . ' I ' 1 '1 ' n : 2 ! n : 3
.. - 3 5 c m "~ .
�9 ~ " ' �9 OtlO~ ..
,,,
i . I i i i i . i . i .
3550 3600 3650 3700 :21400 :3450 3500 3550 3600 -1 Frequency / cm
Figure 5. Measured photodissociation spectra of methanol dimers 39 and trimers 74 near the OH stretch mode at 3681 cm -I . The sticks are calculated spectra using the minimum energy configurations based on the systematic potential and the cluster approach with the variational approximation, s9 The values for the trimer are shifted by the amount indicated in order to match the experimental results.

Vibrations of Size-Selected Clusters 145
-60O r u i
1.0 -
0 ~ -
o 0.0 , , I - . I
o 1.0 - ci:1 t ___
U. "13 (D �9 ,--' 0.5 -
o O~
i:5 o.o: 1.0 -
0 , 5 -
0 , 0 -
- 5 0 0 - 4 0 0 - 3 0 0 - 6 0 0 - 5 0 0 - 4 0 0 - 3 0 0 �9 l �9 I �9 I �9 I �9 I �9 I �9 I
n - ~ 6 - -
i .
~,,o ~
J . I . L m . I , �9 , - , , �9 I " :
n=5 -" n=8 -
�9 " -
�9 ~176 "L n - - 4 - -
go
n=7
3100 3200 3300 3400 3100 32~)0 3300 3400 Frequency / cm
Figure 6. Measured pbotodissociat ion spectra of size selected methanol clusters near the OH stretch mode at 3681 cm -1. The sticks are calculated spectra with relative intensities using the minimum energy configurations based on the systematic potential and the cluster approach in the anharmonic approximation. 59 For the octamer also the lines of the second lowest energy approximation is presented by the sticks with a full point on top.
the corresponding even clusters. According to our discussion in the previous section, this is exactly the behavior that we expected.
Thus it is not too surprising that the calculations based on the model potential of Wheatley 59 predict essentially the correct trends: large red shifts ranging from 100 to 500 cm -1. For the detailed comparison displayed as stick spectra in the figures, we chose within the cluster approach the anharmonic approximation based on variational calculations for n = 2 and 3 and perturbation theory for n = 4 to 9. Further

146 UDO BUCK
results for the dimer, trimer, and hexamer are again presented in Table 1. For the dimer the large red shift of the donor as well as the nearly unshifted acceptor molecule are reproduced with an error of about 20 cm -1. In case of the trimer, the splitting is predicted correctly with an error in the absolute shift o f - 3 5 cm -1. For the larger clusters the agreement with the pattern is satisfactory, while the absolute shift is usually less than measured. It is noteworthy that the two-band structure of the tetramer, the hexamer with S n symmetry, and the multi-line spectra of the pentamer, heptamer, and nonamer are correctly predicted. A special case is the octamer. The lowest energy configuration of S 8 symmetry should give two lines only. The spectrum, however, is much broader with, at least, one additional peak. This is a clear indication that another isomer contributes to the data. The second lowest isomer of S 4 symmetry, a folded ring, exhibits three additional lines. If they are included in the comparison, the agreement with the data is improved apprecia- bly. In general, the absolute red shifts are too small. The value is largest for the tetramer with about -100 cm -1 and decreases to 80 cm -1 for n = 5, and to about 50 cm -1 for n = 6 and 7. For n = 8 and n = 9 it is nearly correct.
We note that the new systematic potential is able to reproduce both the details and the trends in the spectra of the different cluster sizes. It fails to predict the absolute values of the shifts. The largest deviation found for the tetramer might be an indication that the cooperative effect, which is largest here, is not properly taken into account since three body effects in the repulsive part of the potential are left out. There is apparently a contradiction to the results observed for the CO stretch mode where the largest deviations occurred for n = 8, while n = 4 is predicted correctly. We have, however, taken into consideration that the OH stretch mode is a much more sensitive probe of hydrogen bonding than the CO stretch mode for which indirect couplings might lead to compensating effects.
The detailed comparison of Table 1 clearly exhibits that the predicted line shift of the OPLS potential are too large for the dimer and too small for the hexamer. As for the different approximations within the cluster approach, the good agreement with the experimental data of dimer and trimer is only obtained in the variational calculation. There is no doubt that at least the anharmonic approximation has to be used in the calculations. Two recent ab initio calculations based on SCF 47 and DFT 75 methods and the harmonic approximation give good agreement with the experi- mental values for the scaled frequency shift of n = 5 and n = 6. For the smaller ones their predictions are partly better (n = 4) and partly worse (n = 2) than those obtained in the calculations presented here.
4.2. Isomeric Transitions
The "melting" of clusters is, in general, described as isomerization among a multitude of isomers. 9'1~ The gross features of the size and temperature dependence of this cluster isomerization crucially depend on their interaction and their chemical properties. Weak short-range interactions in rare gas clusters like Ar n lead to a large

Vibrations of Size-Selected Clusters 147
number of isomers and phase transitions occur preferentially between the lowest energy configurations, usually belonging to an icosahedral growth sequence, and the many other isomers representing the solid-liquid transition of the bulk. A special effect of the finite size is the difference between the melting and condensa- tion temperature which disappears for n ~ oo. Strong long -range interactions in small alkali halide clusters involve isomerization among a very small number of well-characterized isomers, a nice example being the cube ---> ring transition of (NaCI)4 .75-77 In both binding types, the melting temperature decreases with de- creasing cluster size and is lower than the bulk value, a result which has recently been observed experimentally for metallic clusters 78 and which can be rationalized by the absence of more and more nearest neighbors with an increasing number of surface atoms.
Similar calculations for weakly bound molecular clusters are rare. Therefore we will first present calculations on the isomeric transitions which occur for the well-investigated methanol clusters and then demonstrate how they can be meas- ured. A good indicator for such a transition is the relative root-mean-square(rms) fluctuations of distances ~Scm between the centers of mass of the molecules as a function of temperature. They are calculated by averaging the results of classical trajectory calculations in molecular dynamics (MD) simulations,
_ 2 n((~)-(ri j>2)l/2 5cm -- n(n - 1----'--~ ~ ( r i j ) ' (11)
i<j
where r~/is the distance between the center of mass of molecule i and that of molecule j. According to the Lindemann criterion a substance undergoes melt- ing when ~Scm reaches about 0.1. The results for the methanol hexamer are given in Figure 7 79,80 for the two different interaction potentials of Ref. 52 (fight panel) and Ref. 59 (left panel). An almost linear increase of 5cm with increasing T is an indication of the thermal expansion of the system. The molecules of the cluster vibrate about their well-defined minimum positions, but the system cannot pass over any potential barriers. An abrupt rise in 8cm, however, indicates a structural transition. The newly accessed configuration space reveals further local minima on the corresponding potential hypersurface, and the fluctuation between these min- ima accounts for the sharp rise in ~Scm.
Two of these sharp rises are clearly observed in the calculations. They occur at different temperatures for the two potential models. The first one is observed below ~Scm < 0.1 at about T = 110 and 35 K, respectively. Then the curve flattens again, signaling that the structural transition has taken place and that there is rapid fluctuation between the two isomeric states. A second "phase transition" occurs at T = 270 and 210 K, respectively. Calculations of the mean squares displacements which are related to the self-diffusion in the cluster confirm that the first transition is one between two isomers in the solid-like regime, while the second one is a

148 UDO BUCK
g O . 1 t ,O
0 . 2 ,. . �9 �9 , . . . . . . , . . . . ,,, , . . . . , . . ., �9 , . , . �9 .
O P L S " "
�9 ,~e
I , , . . | . . . . | . . . .
3 0 0 0 1 0 0 2 0 0 3 0 0
T / K
S y s t . P o t e n t i a l
o" �9 �9 ~
, Oo~ ,o t o%e"
CfS
p , , . , ~ , p , ~ , t
0 . 0 . . . . | . . . . | . . . . l
0 1 0 0 2 0 0
Figure 7. Calculated relative rms bondlength fluctuations, which are dimen- sionless, against temperature for methanol hexamers 79'8~ and two interaction
�9 5 9 - 5 2 potentnals: syst. and OPLS. The steps indicate single or multi-state (rigid to fluxional) isomeric transitions.
solid-like to liquid-like transition. The pure isomeric transition is between the two lowest lying minima of the hexamer, those with S 6 and C 2 symmetry that are energetically well-separated from the other structural isomers. They are shown in Figure 8 in order to better visualize the similarities and differences between these two isomers. We note that the melting temperature of the bulk at T = 175.2 K is well below the above-mentioned transition temperatures. This result is a conse- quence of the unique binding properties of these clusters which exhibit a maximum of relative binding energies for the tetramer because of geometric and cooperativity effects in the hydrogen bonding. 58
Now we have to answer the question: is there any chance to measure these isomeric transitions? The great majority of such investigations are carried out by computer simulation. Although the calculation of IR spectra revealed detailed dependences on the melting phenomena, 81'82 conclusive experimental information is difficult to get since the experiments are typically performed with a distribution of cluster sizes. 83 In addition, it turned out to be misleading to derive conclusions on such transitions from spectral line shapes alone. 84
As mentioned earlier, the IR spectra are an unambiguous fingerprint of different isomers. In case of the methanol hexamer the S 6 isomer shows a double-peak structure, while at least four different lines with measurable intensities should appear for the less symmetric C 2 isomer. 79'85 Thus the only problem left is how to change the temperature experimentally. We have simply heated the nozzle, hoping that in competition with evaporative cooling the cluster temperature in the beam

Vibrations of Size-Selected Clusters 149
Figure B. Calculated structures of the two lowest energy isomers of methanol hexamers with C2 (bottom) and 56 (top) symmetry. 79 - -
also increases. The experimental result confirms this expectation. The measured IR spectra of size-selected methanol hexamers which are produced at two different nozzle temperatures are shown in Figure 9 for the CO 85 and OH stretch modes, g~
Let us first discuss the result for the CO stretch mode. The lower curve taken at 300 K clearly exhibits a two-peak structure which is characteristic for the S 6 isomer. The frequency shifts to 1040 and 1051 cm -z are in very good agreement with results obtained previously 38'72 (see also Figure 3). This means that under the expansion conditions of this experiment the temperature of the clusters is so low that only the energetically lowest isomer, the one of S 6 symmetry, is present in the beam. In contrast, the upper spectrum, taken at the nozzle temperature 493 K, shows a completely different shape. It is broader and the onset of absorption in the frequency regions below and above that of the S 6 isomer is stronger than the usual line broadening. We have fitted this spectrum, keeping the two peaks of the S 6 isomer at the values obtained in the low-temperature spectrum. Four additional peaks at 1034, 1 044, 1054, and 1066 cm -l are necessary to get agreement with the experi- mental results. Four lines were also predicted in the calculation of the band shifts of the C 2 isomer, as For these reasons, the changes are interpreted as a transition from the S6-symmetry configuration to the second most stable isomer of C 2 symmetry which bears strong IR intensities in these regions.
Similar results were obtained recently for the OH stretch mode The spectrum at 300 K is dominated by two bands which are smeared out at 373 K. In this case, five additional lines originating from the C 2 isomer have been taken into account in the fit procedure. In contrast to the results for the CO stretch mode, the spectrum at 300

150 UDO BUCK
1.00
0.80
q
0.e0
r " 0.40
.o O o.2o L_
LI. 0.00
~ t 0)
.O:S oJo T = 300 K O 0 Of) o .eo �9
.co ~ 0.40
0.1~ 1000 10~0 1040 1000 tOeO 1100
Frequency / cm-'
1.00 . . . . , . . . . , . . . . , . . . . , . . . . , . . . . , . . . .
o eo T = 373 K
0.60
T = 3 0 0 K
0.60
o,..
0.40
0.20
O.(Xl 3100 3150 3200 3250 3300 3350 3400 3450
I " 0.40
0 . ~ .
0 ( ~ 0.20
I,,,,,
I,J. "0 o.oo (D
0.80 . . , , .
0 0
a
Frequency I cm-'
Figure 9. Measured IR-dissociation spectra of size selected methanol hex- amers at two different nozzle temperatures for the excitation of the CO (left) a5 and the OH (right) a~ stretch mode. The unshaded double peak structure is caused by the $6, the shaded one by the C2 isomer.
K could be better reproduced by a small amount of the C 2 contribution. This can be the consequence of the increased sensitivity in the measurement of the OH stretch mode. In any case the transition occurs in the same temperature range.
The determination of what cluster temperature the measured source temperature corresponds to now remains. Since the transition temperature depends crucially on the potential model, this procedure has to be carefully checked. In our previous publication 85 a simple collisional relaxation model was used to estimate the cluster temperature. We are now working on a much better model which takes into account the cluster formation up to the hexamer in the expansion, the energy released by this process, and the relaxation of the hexamer in collisions with the carrier gas. The necessary cross sections for these events are simulated by classical trajectory calculation. 8~ The preliminary results give temperatures in the range of 100 K, in good agreement with the result based on the systematic potential of Wheatley. 59
In summary, the detailed comparison with the experimental results shows, depending somewhat on the chosen observable, a very good qualitative reproduc- tion of the shifts up to a quantitative agreement which allows us to uniquely identify the cluster structures and to explain the origin of the results. The necessary

Vibrations of Size-Selected Clusters 151
conditions are a realistic potential model for which adjusted intra- and intermolecu- lar components with a good description of the electrostatic energy are used, as well as and a reliable method for calculating the shifts with at least anharmonic corrections.
5. HYDRAZINE CLUSTERS
Hydrazine (N2H4) n clusters have been studied 86'87 since the two amino groups,which are twisted against each other by 90 ~ , indicate an interesting bonding behavior. In addition, some of the modes should exhibit large amplitude motions of the hydrogen atoms. The photodissociation spectra for n = 2 to n = 6 are shown in Figure 10, which also contains new results obtained with isotopically substituted CO 2 lasers marked by open dots. 88 In the range of our laser, the antisymmetric N H 2
wagging (v12 at 937 cm -1) and the N-N stretch mode (v 5 at 1098 cm -1) are excited. The N - N stretch mode is characterized by one peak which is only slightly shifted to the red and does not show any size dependence. The other mode, however, in which all four hydrogen atoms move in phase with respect to the N-N axis, shows a completely different behavior. Already the dimer exhibits an appreciable blue shift. We recognize three peaks at 978 (41), 985 (48), and 1002 (65) cm -1. The numbers in parenthesis denote the shifts compared with the monomer frequency. The first two agree with the results obtained in experiments with "cold" dimers which are generated in a very dilute mixture in the direct beam and for which the same type of laser is used. 86'88 The general trend is continued by the trimer, for which two peaks are observed with the main peak blue-shifted to 1025 (88) cm -1. For the tetramer, pentamer, and hexamer the values reach 1049 (112) cm -1. In general the spectra are quite broad with some indications of underlying structures.
On the basis of the limited experimental information and preliminary structure calculations based on an empirical model potential, 51 we concluded that the line splitting of the dimer is caused by nonequivalent positions in a chain-like configu- ration and that the two peaks of the trimer result from two different isomers of a chain and a ring structure. 31'86'87 The calculations of the line shifts, however, could only reproduce the N-N stretch but not the NH 2 wag mode for which red shifts were predicted. 6~
Therefore we constructed a new potential surface based on the systematic model potential of the Wheatley type which was described in Section 3. The results of the structure calculations of the lowest energy configurations from the dimer to the hexamer and additional isomeric configurations for the dimer and the pentamer are shown in Figure 11. 60 Indeed they exhibit different bonding characteristics com- pared with the methanol clusters which might explain the different frequency shifts. The two lowest energy configurations of the dimer have two hydrogen bonds in which the N atom and the H atom of each molecule act as acceptor and donor, respectively. In the third lowest configuration, one molecule contains two donor

152 UDO BUCK
0 . 6 -
0 . 3 "
0 . 0 - -
0 . 6 -
0.3 "
{:: -~ 0.0 - (,.) (~ 0 . 6 -
LL "13 (1) *., 0 . 3 -
. . . r o (/) o~ 0 . 0 : ,..
a 0 . 6 -
0.3 -
0.0 ~
0.2 -
0.1 -
0 , 0 " I 90O
,, ~ = 6 - - "
.i ,I
n-4 ,~ =." i ! A iij- j
.,_ I
11=2 II I I I n=2
I A " A ~'. i '~ ~.11 IL ~ ' " i �9 I
1000 1100 900 1000 1100 -1 Frequency / c m
Figure 10. Measured photodissociation spectra of size selected hydrazine clusters near the NH2 wag (937 cm -1) and the NN stretch mode (1098 cm-1 ).86 The open circles are taken by an isotopically substituted CO2 laser. 88 The sticks present the calculated spectra for the lowest energy isomer (left panel) and the three lowest energy isomers (right panel). 6~
and the other one two-acceptor amino groups. The latter one is the lowest energy configuration found with the empirical potential. The trimer is cyclic with one hydrogen bond per molecule and the tetramer as well as all the larger clusters show three-dimensional structures with more than one bond per molecule. There are, in addition, several isomeric structures found in the calculations which exhibit bond- ing structures similar to those displayed in Figure 11. An exception is the pentamer for which symmetric and asymmetric structures are obtained which are also displayed in Figure 11.

Vibrations of Size-Selected Clusters 153
The line-shift calculations 6~ based on these minimum energy configurations and the molecular approach are also shown on the left hand part of Figure 10 as stick spectra with relative intensities. At a first glance, the predicted line shifts are in good agreement with the experiment. This is especially true for the trimer, the tetramer, and the hexamer for which only minor problems in the intensity are left. The general trend of the pronounced blue shift that is smallest for the dimer, the increase of this shift from the dimer to the trimer, and from the trimer to the larger clusters are correctly predicted without any adjustment of the potential. A closer inspection, however, reveals some discrepancies. In the case of the dimer the calculated splitting does not explain the measured splitting of about 8 cm -l between the two peaks around 980 cm -]. In case of the pentamer there are no predicted lines around 1050 cm -], where a pronounced shoulder appears in the measured spectrum.
-~1,~ ~lmol
n=2
"
-~L.OO k, JIn'd -17.C~ k.J/n"~
n=3 n=4 n=6 "'g -:.. ~' ~ : ~
�9 I i
Figure 11. Calculated minimum energy configurations of hydrazine dimers through hexamers. For dimers and pentamers also further isomers are pre- sented. 6~ The minimum energies are indicated.

154 UDO BUCK
A solution to this problem is that more than one isomer contributes to the measured spectra. This is clearly demonstrated by the experimental findings for the dimer which display at least three peaks. One isomer, however, can only produce two bands. Thus we have calculated the line shifts of the second and third lowest minimum energy configurations using the same potential model and the same theoretical procedure. The results are given on the right hand part of Figure 10. For the dimer and the trimer, the positions of the contributions of the different isomers are displayed on top of the spectra. Now the calculations are in much better agreement with the data. For the three larger clusters we get a nearly perfect prediction of the measured spectra which mainly represent the envelope of several single lines originating from the three isomers. In the case of the dimer and the trimer, the lines are bunched together in two groups, in close resemblance to the measured features. The peak in the middle at 985 cm -1, however, is not very well reproduced. In a recent study we found that there exists also chiral dimers of which the lowest energy configuration exactly reproduces this peak. The results for the other configurations and cluster sizes are not significantly changed by these types of isomers.
We note that in the case of the dimer the quite symmetric minimum energy configuration leads to a much larger line splitting of 61.4 and 32.3 cm -1 than the third lowest energy configuration with two nonequivalent positions which gives 35.8 and 17.2 cm -l. In the former case, the reason is the collective motion of one hydrogen-bonded and one free atom per molecule and two free hydrogen atoms per molecule. Now the origin of the three peaks at 978 (41), 985 (48), and 1002 (65) cm -1 is easily interpreted. The peak at the largest frequency of 1002 cm -1 originates from the motion of the hydrogen-bonded H atoms of the lowest and second lowest energy configuration. The next peak at 985 cm -1 is caused by the lowest energy configuration of the chiral dimer (not shown in the figure). The peak and the shoulder at 978 cm -1 is composed by the motion of the free H atoms of the lowest two energy configurations and the two peaks of the third lowest energy isomer.
In case of the trimer the situation is similar. All three isomers contribute with one line to the largest frequency peak and with two lines to the shoulder. In general, the shifts are larger than for the dimer, since now three H atoms are hydrogen bonded. For the pentamer, the lowest energy isomer, which is rather symmetric with a total of seven hydrogen bonds distributed in three single and two double bonds per molecule, only accounts for the first peak in the measured spectrum. Two further isomers are necessary to predict the complete spectrum. They show with a total of eight H bonds more double (3) than single (2) bonds per molecule. This leads to the largest shift of about 120 cm -1. The tetramer and the hexamer spectra are already well-reproduced by the four and six lines of the lowest energy isomers, respectively. The tetramer with two single and two double H bonds resembles more the symmet- ric pentamer, while the hexamer with one single and five double H bonds is similar to the asymmetric pentamer. Nevertheless, the contributions of the other isomers improve the picture slightly.

Vibrations of Size-Selected Clusters 15 5
Table 2. Number of Bound H Atoms in Hydrazine Clusters a
n 2 3 4 5 sym 5 6
3-1 2 3 2 3 2 1 2-2 m __ 2 2 3 5
total 2 3 6 7 8 11
Note: a3-1 means 3 free and 1 bound H atoms, 2-2 means 2 free and 2 bound H atoms per molecule.
In Table 2 we give the total number of hydrogen bonds for the lowest energy configurations and their ratio of free to bound H atoms per molecule. The dimer and the trimer appear in chain or ring configurations with one hydrogen bond per molecule (3-1). All larger clusters are composed of three-dimensional arrange- ments with at least two molecules with two hydrogen bonds (2-2). Depending on the ratio of two (2-2) to one (3-1) hydrogen-bonded molecules, shifts in the range of 120 cm -1 are obtained very close to the line shift of the amorphous solid which probably consists of a network of molecules with two hydrogen bonds.
In summary, we conclude that the NH 2 motion in the hydrazine clusters is heavily distorted and leads, similar to the results for the umbrella motion of NH3 ,89 to large blue shifts in the spectra. In the latter case, however, the calculated cyclic structures of the trimer and tetramer 44 resemble much more the results obtained for methanol than those obtained for hydrazine, since in both cases only one acceptor molecule is present. For hydrazine more than one isomer is necessary to reproduce the data and from the tetramer onwards three-dimensional structures are present. The measured frequencies can be traced back to particular motions within these isomers and not so much to the behavior of one isomer as is observed for the methanol clusters.
6. SUMMARY
The field of weakly bound neutral molecular clusters has enjoyed a remarkable growth in recent years. The main experimental tools are combinations of different spectroscopic methods with those size-selecting the clusters. Pure mass spectro- scopic methods do not give valuable information on the neutral cluster structures and energetics because strong fragmentation occurs during the ionization process and the measured intensities reflect very often only the stability of the cluster ions after a complicated fragmentation and evaporation process. From the successfully employed experimental methods, we have presented here results based on the combination of the size-selective process based on the scattering by an atomic beam with infrared photodissociation, resulting in depletion. Although most of the results have been obtained in the size range below n = 10, the experiments show that n = 20 can be reached. Because of the low-beam intensities, usually powerful CO 2

156 UDO BUCK
lasers in the 10 ~m range have been used. Since a couple of years, however, the pulsed OPO system in the 3 I.tm range has also been used to carry out experiments in the frequency range of the important HF stretch mode of hydrogen fluoride and the OH stretch mode of water. 90-92
The major effects of the cluster on the spectral properties of the monomer are to shift the peaks and to broaden the width. The former point gives detailed informa- tion on the structure, while the latter one is dependent on the decay dynamics. The two systems presented in detail in this chapter--the hydrogen-bonded methanol CH3OH and hydrazine N2H 4 cluster--exhibit a great variety of behaviors. The N-N stretch vibration of hydrazine undergoes very small shifts and does not depend on the cluster size, while the asymmetric NH 2 wag mode of the same molecule exhibits large blue shifts which do depend on cluster size but already converge at about n = 6 to the value of the amorphous solid. A sensitive size dependence is also observed for the methanol clusters both for the moderate blue shifts of the CO stretch mode and the very large red shifts of the OH stretch mode.
All these data are strongly correlated with the structure of the clusters and the underlying interaction potential. Therefore reliable theoretical methods were de- veloped to first calculate the minimum energy configurations which are based on detailed model potentials and to determine from them the spectra which are compared with the data. In this way all the measured spectral features could be explained. For the potential models, it proved necessary to use the so-called systematic models which give a very good description of the electrostatic forces by means of a distributed multipole expansion. Empirical potentials which are based on fits to the liquid were not able to reproduce the data. For the calculation of the line shifts, a molecular- and a cluster-based procedure were developed which start with a normal mode analysis. The final line shifts are then calculated with the help of methods which are mainly based on perturbation theory and in some cases also on variational calculations. While the former methods gave reliable results for hydrazine clusters, the results for methanol clusters could only be reproduced by the latter method. There are still some discrepancies left, the origin of which cannot easily be traced back to errors in the potential or the calculation of the line shift. In general, it proved necessary to calculate the line shifts in the anharmonic approxi- mation.
Based on the comparison of the experimental and the calculated data, a clear picture of the cluster structures emerges for the two systems. For methanol, the chain-like structure of the dimer is also found in the solid, since this is the optimum geometry for the interaction of two or an arrangement of many particles which consists of subunits of chains of dimers. The clusters in the size range up to n = 9 behave, however, differently. They essentially form rings which are very symmetric with S n symmetry for the even numbered ones and a bit distorted for the odd numbered ones, since the methyl groups cannot be arranged in an alternating up and down fashion. The reason for the ring formation is simply that the number of bonds which are now available for these structures is larger compared with open

Vibrations of Size-Selected Clusters 157
chain-like arrangements. Then it does not matter that the stabilization energy per bond is usually smaller, since the ideal bonding configuration of the dimer has to be strained. The well-known cooperativity effect of the hydrogen bonds is largest for the tetramer. The decamer is the first cluster for which a weakly bound two-membered ring system is energetically, at least, close to a very distorted cyclic structure. The characteristic feature of these methanol clusters is that these tings are the dominant energetically favored isomers. Only for the larger, even clusters, the hexamer and the octamer, other cyclic, isomeric configurations are found which are nearly as stable as the global cyclic arrangements.
For hydrazine clusters with two possible hydrogen bonds, the results are quite different. The dimer and the trimer form cyclic structures with two and three bonds; that is one bond per molecule. From the tetramer onwards, three-dimensional structures are found with an increasing number of two bonds per molecule. For all cluster sizes, at least the three lowest energy isomers contribute to the measured spectra.
We note here that many of our results indicate that the investigated standard solvent molecules form very stable aggregates so that the interaction between a solvated molecule and the solution very probably takes place with a cluster instead of an ensemble of single molecules. In all cases investigated, the structures observed in the low-temperature solids are not seen for the clusters in the investigated size range. The transition to the ordered crystalline structure of the solid usually occurs at much larger cluster sizes in the range of 100 particles per cluster. 8 These values are smaller than those found for atomic van der Waals clusters, but much larger than the size range considered here. It is still an open question how these clusters behave in the size range between n = 10 and n = 20. It is expected that they consist of combinations of rings and chains with branching points and look like the frozen structure of a liquid, or better, an amorphous solid. 7 This state is already reached for hydrazine clusters at n = 6. Based on the promising techniques introduced here, we will probably get the general answer soon.
The problem of multiple isomeric configurations has been tackled by applying double resonance techniques which allows one to distinguish whether a line splitting is caused by nonequivalent positions in one cluster or by two different isomers. In this way the existence of isomers in the mixed acetone-ethylene clusters has been observed. 32 In the case of the methanol hexamer, however, only the isomer with S 6 symmetry is found in the beam under expansion conditions at room temperature. The simulation of the structural transitions reveals to be a pure isomeric one to the still solid-like C 2 isomer and a multistate isomerization to a liquid-like state at much higher temperatures. The actual transition temperatures depend strongly on the potential model used in the calculations. It varies from 35 to 110 K for the first and from 210 to 270 K for the second transition.
We have tried to measure the pure isomeric transition of the methanol hexamer using the spectra as fingerprints and heating the nozzle. 8~ The preliminary results indicate that the systematic potential model for which the larger values are predicted

158 UDO BUCK
is in better agreement with the data. This opens a very attractive field of new experiments, since there is not only the strong dependence on the interaction potential but for some clusters like acetonitrile also very interesting perspectives arise, since even numbered clusters exhibit much higher transition temperatures than odd clusters.
Finally I would like to point out a new, promising field which is based on nearly the same spectroscopic techniques described here. This is the IR spectroscopy of molecules and molecular clusters imbedded in or absorbed on the surface of large rare gas clusters. It is expected that the medium of the large cluster simplifies the spectra like in the well-known matrix spectroscopy. The pioneering experiments have been performed by Scoles 93 using bolometric detection. Later on the mass spectrometer was also used as a detector 94 which opens the possibility to study the behavior of larger clusters. A special case are He clusters which are a superfluid quantum liquid with a temperature of 0.4 K. 95-97 In recent experiments with methanol clusters embedded in these droplets we observed that for n > 3 different isomers are found than in our experiments with free clusters, namely trimer tings with monomers and dimers attached to it. This is certainly a consequence of the low temperature and the building process of the molecular clusters by diffusion and capture where the stable trimer ring cannot be opened to form further cyclic structures.
ACKNOWLEDGMENTS
I acknowledge with gratitude the many contributions of my former students on both the experimental and the theoretical part, Dr. C. Lauenstein, Dr. A. Rudolph, Dr. X. J. Gu, Dr. M. Hobein, Dr. I. Ettischer, Dr. B. Schmidt, and Dr. J. G. Siebers as well as the guest scientists Prof. T. Beu and Dr. R. J. Wheatley. I am especially grateful to my coworkers Dr. I. Ettischer and Dr. J. G. Siebers for their important contribution of the most recent results and their valuable help and advice in preparing the manuscript and the figures. Part of the work was supported by the Deutsche Forschungsgemeinschaft in SFB 357 and in SP "Molekulare Cluster".
REFERENCES 1. Benedek, G.; Martin, T. E; Pacchioni, G. (Eds.). Elemental and Molecular Clusters; Springer:
Berlin, 1988. 2. Scoles, G. (Ed.). The Chemical Physics of Atomic and Molecular Clusters, North-Holland:
Amsterdam, 1990. 3. The complete issue Faraday Discuss. Chent Soc. 1994, 9Z 4. Nesbitt, D. J. Chent Rev. 1988, 88, 843. 5. Miller, R. E. Science 1988, 240, 447. 6. Saykally, R. J.; Blake, G. A. Science 1993, 259, 1570. 7. Farges, J.; de Feraudy, M. E; Raoult, B; Torchet, C. Adv. Chent Phys. 1988, 70, 45. 8. Bartell, L. S.; Harsanyi, L.; Valente, E. J../. Phys. Chem. 1989, 93, 6201 and references cited
therein.

Vibrations o f Size-Selected Clusters 159
9. Berry, R. S.; Beck, T. L.; Davies, H. L.; Jellinek, J. Adv. Chem. Phys. 1988, 70, 74. 10. Jortner, J.; Scharf, D.; Landmann, U. In Elemental and Molecular Clusters; Benedek, G.; Martin,
T. P.; Pacchioni, G., Eds.; Springer: Berlin, 1988, p 148. 11. Janda, K. C. Adv. Chem. Phys. 1985, 60, 201. 12. Zewail, A. H. Science 1988, 242, 1645. 13. Blake, C. A.; Laughlin, K. B.; Cohen, R. C.; Busarow, K. L.; Gwo, D.-H.; Schmuttenmaer, C. A.;
Steyert, D. W.; Saykally, R. J. Rev. Sci. lnstrum. 1991, 62, 1693. 14. Cough, T. E.; Miller, R. E.; Scoles, G. J. Chem. Phys. 1978, 69, 1588. 15. Miller, R. E. J. Phys. Chem. 1986, 90, 3301. 16. Coker, D. E; Watts, R. O. J. Phys. Chem. 1987, 91, 2513. 17. Kappes, M.; Leutwyler, S. In Atomic and Molecular Beam Methods; Scoles, G., Ed.; Oxford
University Press: New York, 1988, p 380. 18. Habedand, H. Su~ Sci. 1985, 156, 305. 19. Buck, U. J. Phys. Chem. 1988, 92, 1023. 20. Buck, U. In The Chemical Physics of Atomic and Molecular Clusters; Scoles, G., Ed.; North-Hol-
land: Amsterdam, 1990, p 543. 21. Btimsen, K. O.; Lin, L. H.' Selzle, H. L." Schlag, E. W. J. Chem. Phys. 1989, 90, 1299. 22. Leutwyler, S.; Btisinger, J. Chem. Rev. 1990, 90, 489. 23. Gspann, J.; Vollmer, H. In Rarified Gas Dynamics; Karamcheti, K., Ed.; Academic Press: New
York, 1974, p 261. 24. Buck, U.; Meyer, H. J. Che~ Phys. 1986, 84, 4854. 25. Buck, U. In Dynamics of Polyatomic van der Waals Complexes; Halberstadt, N.; Janda, K. C. Eds.;
NATO ASI Series. Plenum: New York, 1990, p 42. 26. Buck, U.Atomic Physics 1992,13, 557; Walther, H.; H~insch, T. W.; Neizert, B., (Eds.). American
Institute of Physics: New York. 27. Buck, U. Ber. Bunsenges. Phys. Chem. 1992, 96, 1275. 28. Buck, U. Dynamical Processes in Molecular Physics; Delgado-Barrio, G., Ed.; IOP; Bristol, 1993,
p 275. 29. Huisken, E Adv. Chem. Phys. 1991, 81, 63. 30. Buck, U. J. Phys. Chem. 1994, 98, 5190. 31. Buck, U. Clusters of Atoms and Molecules; Haberland, H., Ed.; Springer: Berlin, 1994b, p 396. 32. Buck, U. Adv. At. Mol. Opt. Phys. 1995, 35, 121. 33. Buck, U.; Ettischer, I. Faraday Disscuss. Cheat Soc. 1994, 97, 215. 34. Gough, T. E." Knight, D. C." Rowntree, P. A." Scoles, C. J. Cheat Phys. 1986, 90, 4026. 35. Vernon, M. E; Krajnovich, D. J." Kwok, H. S.; Lisy, J. M.; Shen, J. R.; Lee, J. T. J. Chem. Phys.
1992, 77, 47. 36. Hoffbauer, M. A.; Liu, K.; Giese, C. E; Gentry, W.R.J. Chem. Phys. 1987, 78, 5567. 37. Buck, U.; Lauenstein, C.; Rudolph, A. Z Phys. D 1991, 18, 181. 38. Buck, U.; Gu, X. J.; Lauenstein, C.; Rudolph, A. J. Chem. Phys. 1990, 92, 6017. 39. Huisken, E; Stemmler, M. Chem. Phys. Lett. 1988, 144, 391. 40. Huisken, E; Stemmler, M. Z Phys. D 1992, 24, 277. 41. Huisken, E; Kulcke, A.; Laush, C.; Lisy, J.M.J. Che~ Phys. 1991, 95, 3924. 42. Bizzari, A.; Stolte, S.; Reuss, J.; van Duijneveldt-van de Rijdt, J. G. C. M.; van Duijneveldt, F. B.
Cheat Phys. 1990, 143, 423. 43. de Meijere, A.; Huisken, E J. Chent Phys. 1990, 92, 5826. 44. Xantheas, S. S.; Dunning, T.H., Jr., this edition. 45 Greet, J. C.; Ahlrichs, R.; Hertel, I. V. J. Chent Phys. 1989, 133, 191; Kofranek, M.; Karpfen, A.;
Lischka, H. Chem. Phys. 1987, 113, 53. 46. Bone, R. G. A., Amos, R. D.; Handy, N. C. J. Chem. Soc., Faraday Trans. 1990, 11, 193 I. 47. Bleiber, A.; Sauer, J. Pol. J. Cheat 1998. In press. 48. BiShm, H. J.; Ahlrichs, R. J. Chent Phys. 1982, 77, 2028.

160 UDO BUCK
49. Ahlrichs, R.; Brode, S.; Buck, U.; DeKieviet, M.; Lauenstein, C.; Rudolph, A.; Schmidt, B. Z. Phys. D 1990, 15, 341.
50. Wheatley, R. J.; Price, S. L. Mol. Phys. 1990, 71, 1381. 51. Nemenoff, R. A.; Snir, J.; Scheraga, H. A. J. Phys. Chem. 1978, 82, 2504. 52. Jorgensen, W. L. J. Phys. Chem. 1986, 90, 1276. 53. Ahlrichs, R.; Penco, R.; Scoles, G. Chent Phys. 1977, 19, 119. 54. Tang, K. T.; Toennies, J. P. J. Chem. Phys. 1984, 80, 3725. 55. Stone, A. J. Chem. Phys. Lett. 1981, 83, 233; Stone, A. J.; Alderton, M. Mol. Phys. 1985, 56, 1047. 56. Karpfen, A.; Beyer, A.; Schuster, P. Chem. Phys. Lett. 1983, 102, 289. 57. Detrich, J.; Corongiu, G.; Clementi, E. Chem. Phys. Lett. 1984, 112, 426. 58. Curtiss, L. A.; Blander, M. Chem. Rev. 1988, 88, 827. 59. Buck, U.; Siebers, J. G." Wheatley, R. J. J. Chent Phys. 1998, 108, 20. 60. Beu, T. A.; Buck, U.; Siebers, J. G." Wheatley, R. J. J. Chem. Phys. 1997, 106, 6795. 61. Buckingham, A. D. J. Chem. Soc., Faraday Trans. 1960, 56, 753. 62. Westlund, O. O.; Lynden-Bell, R. M. Mol. Phys. 1987, 60, 1189. 63. Buck, U.; Schmidt, B. J. Mol. Liq. 1990, 46, 181. 64. Buck, U.; Schmidt, B. J. Chem. Phys. 1993, 98, 9410. 65. Beu, T. Z Phys. D 1994, 31, 95. 66. Buck, U.; Siebers, J. G. Eur. Phys. J. D 1998, 2, 207. 67. Watts, R. O. In The Chemical Physics of Atomic and Molecular Clusters; Scoles, G., Ed.;
North-Holland: Amsterdam, 1990, p 271. 68. Torrie, B. H." Weng, S.-X." Powell, B. M. Mol. Phys. 1989, 67, 575. 69. Palinkas, G.; Hawlicka, E.; Heinzinger, K. J. Phys. Chem. 1987, 91, 4334. 70. Buck, U.; Gu, X. J.; Lauenstein, C.; Rudolph, A. J. Phys. Chem. 1988, 92, 5561. 71. Buck, U.; Ettischer, I. J. Chem. Phys. 1998, 108, 33. 72. Buck, U.; Hobein, M. Z Phys. D 1993, 28, 331. 73. Schlegel, H. B.; Wolfe, S.; Bemardi, E J. Chem. Phys. 1977, 67, 4181. 74. Huisken, E; Kaloudis, M.; Koch, M.; Werhahn, O. J. Chem. Phys. 1996, 105, 8950. 75. Hagemeister, E C.; Gruenloh, C. J.; Zwier, T. S. J. Phys. Chem. A 1998, 102, 82. 76. Jortner, J.; Scharf, D.; Ben-Horin, N.; Even, U.; Landman, U. In The Chemical Physics of Atomic
and Molecular Clusters; Scoles, G., Ed.; North-Holland: Amsterdam, 1990, p 43. 77. Martin, T. P. Phys. Rep. 1983, 95, 167; Heidenreich, A,; Jortner, J.; Oref, I. J. Chem. Phys. 1992,
97, 197. 78. Schmidt, M.; Kusche, R.; von Issendorf, B.; Haberland, H. Nature 1998, in press. 79. Buck, U.; Schmidt, B.; Siebers, J. G. J. Chem. Phys. 1993, 99, 9428. 80. Buck, U.; Ettischer, I.; Lohbrandt, P.; Siebers, J. G., unpublished results. 81. Eichenauer, D.; LeRoy, R. J. J. Chem. Phys. 1988, 88, 2898. 82. Kmetic, M. A.; LeRoy, R. J. J. Chem. Phys. 1991, 95, 6271. 83. Gu, X. J." Levandier, D. J.; Zhang, B.; Scoles, G." Zhuang, D. J. Chem. Phys. 1990, 93, 4898. 84. Ben-Horin, N.; Even, U.; Jortner, J. J. Chem. Phys. 1992, 97, 5988. 85. Buck, U.; Ettischer, I. J. Chem. Phys. 1994, 100, 6974. 86. Buck, U. Gu, X. J.; Hobein, M." Lauenstein, C. Chem. Phys. Len. 1989, 163, 455. 87. Buck, U.; Gu, X. J.; Hobein, M." Lauenstein, C.; Rudolph, A. J. Chem. Soc., Faraday Trans. 1990,
86, 1923. 88. Beu, T. A.; Buck, U.; Ettischer, I.; Hobein, M.; Siebers, J. G.; Wheatley, R. J. J. Chem. Phys. 1997,
106, 6806. 89. Huisken, E; Pertsch, T. Chem. Phys. 1988, 126, 213. 90. Huisken, F.; Kaloudis, M.; Kulcke, A.; Laush, C.; Lisy, J. M. J. Chem. Phys. 1995, 103, 5366. 91. Huisken, E; Kaloudis, M.; Kulcke, A. J. Chem. Phys. 1996, 104, 17. 92. Buck, U.; Ettischer, I.; Melzer, M.; Buch, V.; Sadej, J. Phys. Rev. Lett. 1998. 80, 2578.

Vibrations o f Size-Selected Clusters 1 61
93. Amar, E G.; Goyal, S.; Levandier, D. J.; Perera, L.; Scoles, G. Clusters of Atoms and Molecules; H. Haberland, Ed.; Springer: Berlin, 1993.
94. Huisken, E; Stemmler, M. J. Che~ Phys. 1993, 98, 7680. 95. Goyal, S." Schutt, D. L.; Scoles, G. J. Phys. Chem. 1993, 97, 2236. 96. Hartmann, M.; Miller, R. E.; Toennies, J. P.; Vilesov, A. Science 1996, 272, 1631. 97. Whaley, K. B., this edition.

This Page Intentionally Left Blank

QUANTUM MONTE CARLO VIBRATIONAL ANALYSIS AND THREE-BODY EFFECTS IN WEAKLY BOUND CLUSTERS
Clifford E. Dykstra
Abstract . . . . . . . . . . . . . . . . . . . . . . . . . . . . . . . . . . . . . 164 1. Introduction . . . . . . . . . . . . . . . . . . . . . . . . . . . . . . . . . . . 164
1.1. Weak Interaction . . . . . . . . . . . . . . . . . . . . . . . . . . . . . 165 1.2. Quantum Monte Carlo . . . . . . . . . . . . . . . . . . . . . . . . . . 167
2. Vibrational Feedback in Generating Potentials . . . . . . . . . . . . . . . . . 169 2.1. Assessing the Role of Contributing Elements . . . . . . . . . . . . . . 169 2.2. The Interaction of Argon and Hydrogen Sulfide . . . . . . . . . . . . . 170
3. Pairwise and Many-Body Elements in Weak Interaction Potentials . . . . . . 172 4. Three-Body Effects . . . . . . . . . . . . . . . . . . . . . . . . . . . . . . . 174
4.1. HCN Chains . . . . . . . . . . . . . . . . . . . . . . . . . . . . . . . 174 4.2. Arn--HF Clusters . . . . . . . . . . . . . . . . . . . . . . . . . . . . . 177
5. Conclusions . . . . . . . . . . . . . . . . . . . . . . . . . . . . . . . . . . . 180 Acknowledgments . . . . . . . . . . . . . . . . . . . . . . . . . . . . . . . . 180 References . . . . . . . . . . . . . . . . . . . . . . . . . . . . . . . . . . . . 180
Advances in Molecular Vibrations and Collision Dynamics, Volume 3, pages 163-182. Copyright �9 1998 by JAI Press Inc. All fights of reproduction in any form reserved. ISBN: 1-55938-790-4
163

164 CLIFFORD E. DYKSTRA
ABSTRACT
Weak intermolecular interaction can be viewed as and can be modeled as arising from a number of competing elements. As the understanding of these elements grows, attention turns to the role of their subtler many-body manifestations, not just the pairwise interactions. The prospect of many-body effects, particularly three-body effects, being important in the behavior of clusters arises because the number of three-body collections increases with the number of monomers faster than the number of pairs. The subtlety of three-body features, especially in trimers and tetramers where they first arise, means a clear resolution of their sizes from experimental data is a challenge. However, rigorous vibrational analysis coupled with adjustable interaction models offers certain capability to delineate the many-body from the pairwise effects. The technique of quantum Monte Carlo is quite useful in this pursuit. Its use in the actual development of an interaction potential surface is discussed along with pres- entation of calculational information about the sizes and types of certain many-body contributors in weakly bound clusters. The knowledge that results enhances the quality of interaction models and thereby the quality of computational simulation of a host of chemical problems.
1. INTRODUCTION
We may think of molecules as able to interact with each other two ways, weakly and chemically. Of course, such distinction does not arise from different terms in a molecular Hamiltonian; the distinction is more phenomenological. Chemical bond- ing generally means significant changes in electronic structure and energy changes of 50 kJ mo1-1 and more, whereas weak interaction is inclusive of intermolecular interactions not associated with chemical bonding and not associated with the distinct orbital changes that go with bond formation and bond breaking. Where weak interaction yields potential wells, their depth is usually less than 50 kJ mo1-1. Weak interaction has certain features that may be approached classically, and that simpler level of physics offers considerable guidance in representing potential energy surfaces of weakly interacting clusters, guidance we do not have for the potential surfaces of chemically reactive systems.
Weak interaction continues to lie at the frontiers of chemistry. It is the link between the detailed nature of chemical bonds in molecules and condensed-phase molecular phenomena ranging from phase transitions to solvent effects on reactions to biological functioning. Forty years ago, Charles Coulson I introduced a review of hydrogen bonding, one form of weak interaction, by saying it "plays a very conspicuous role in human life, for it is responsible for the adherence of dirt to our skin, the structure of proteins, the action of glues and adhesives, the rigidity of many synthetic polymers, such as polyamides, and a good many other biological phe- nomena." Weak interaction does not explain all such complex phenomena, but it is perhaps the least understood of the elements that together dictate such phenomena. Coulson's review included some very forward-looking notions about the ultimate

Weak Interaction Quantum Monte Carlo 165
role of simulation for understanding some of these complex phenomena and among the prerequisites for such simulation are explicit weak interaction potentials.
Today, computer simulation of biological problems has become widespread, and numerous model potentials exist for chemical and weak interaction. New capability is developing that will lead to much more critical knowledge of weak interaction and ultimately improved interaction potentials. Attention to the cooperative or many-body effects in a cluster of three or more interacting molecules is important. These effects constitute a relatively subtle class but one that is crucial in the link between molecular features and the behavior of aggregations. It is also one whose role has become subject to much more critical elucidation than ever before, and that serves as a focus of this report.
1.1. Weak Interaction
Coulson's early review of hydrogen bonding I was one of the several places where the idea being advanced was the partitioning of weak interaction energetics. In the case of each hydrogen bond in water ice, Coulson estimated energetic contributions that he labeled as electrostatic (6 kcal mol-l), delocalization (8 kcal mol-l), repulsive (-8.4 kcal mol-l), and dispersion (3 kcal mol-1). The sum of these contributions was within 2 to 3 kcal mo1-1 of the known water hydrogen bond energy. The important notion we carry today is that weak interaction can be regarded as arising from a number of elements, some attractive and some repulsive. In other words, weak interaction is a juxtaposition of competing effects. That presents a difficulty for theoretical analysis, for it is a sum of positive and negative contribu- tions that must be obtained reliably.
Another leap forward in the theoretical picture came within two decades of the Coulson paper. Morokuma 2-4 and then Kollman 5 devised means to partition the electronic energies obtained from ab initio calculations into elements that contribute to hydrogen bonding. This clarified thinking about the pieces that contribute as the elements were more concretely defined. The interaction of permanent charge fields, the energy of polarization (induction), exchange repulsion, charge transfer, and dispersion were recognized as potential players in hydrogen bonding and sub- sequently in van der Waals clusters. A more contemporary and very thorough discussion of a perturbative approach to partitioning elements in van der Waals complexes using ab initio calculations can be found in the review by Jeziorski, Moszynski, and Szalewicz. 6
Recent claims of a "new type of intermolecular interaction, the H...H or dihydro- gen bond" reported by Crabtree and coworkers 7 could very well indicate something other than the usual elements of weak interaction. On the other hand, their observation might prove to I~e a quite normal expression of weak interaction, though perhaps one with a less usual weighting of the same competing elements. There is clearly a delicate balance point among attractive and nonattractive elements that adds complexity to weak interactions. In fact, even the partitioning of ab initio

166 CLIFFORD E. DYKSTRA
energies can be done in different ways with the result that the features of charge transfer and polarization can be rather smoothly blended to suit.
A concrete result of efforts at dissecting weak interaction energies is giving direction to the construction of model potentials. For instance, we noticed 10 years ago 8 that by taking the change in a monomer's electronic structure upon cluster formation to be due to polarization, there was usually good accounting for the evolution of cluster properties. This led us to put polarization upfront in modeling weak interaction and include other elements in a simple, direct fashion. The result was a potential energy surface scheme designated molecular mechanics for clusters 9 (MMC) which uses high level ab initio information on molecular electrical prop- erties (permanent moments, multipole polarizabilities, hyperpolarizabilities) in the evaluation of the classical electrical interaction of a cluster. This naturally combines the permanent charge field interaction with polarization energies and it is a rigorous nonempirical evaluation. Though it follows classical laws, the contribution is really semiclassical since it arises from monomer properties associated with, and calcu- lated for, the quantum mechanical electron distribution of the monomers. The other MMC potential elements were treated empirically and not as fully. Mostly, they have been represented collectively via atom-atom "6-12" potential terms with parameters selected so that the overall potential gave the best match with available spectroscopic information. The parameters, like electrical properties, were assigned to monomers, and this inforced transferability meant that once such an MMC representation of a molecule was obtained, an interaction surface could be calcu- lated for it with any other MMC-represented monomer.
A strong focus on electrostatics is found in a number of weak interaction models starting with the 1985 model of Buckingham and Fowler. l0 The interaction energy in that model is obtained from point charges, dipoles, and quadrupoles assigned to atoms, with the atoms not allowed to approach closer than their van der Waals radii allow. Intermolecular polarization has been incorporated into molecular mechanics force fields (e.g. refs. 11-14) often with isotropic dipole polarizabilities assigned to non-hydrogen atoms. At a more basic level are models of distributed polarizabili- ties of molecules (e.g. refs. 15-18) and direct means for extracting distributed polarizability values from ab initio calculations, 19 all of which are available for incorporation into force fields.
That so very many of the theoretical and experimental investigations of weak interaction strive to predict and understand structure, energy, and dynamics of clusters implies an underlying "chemistry of weak systems" or a sub-chemistry. Within it, structural understanding means being able to predict and account for cluster structures through physical arguments akin to orbital arguments about molecular structure. A complete "weak chemistry" also requires dynamical insight in view of the floppiness that goes with weakly bound species, and interest in weakly bound complexes has been one of several stimuli for development of dynamical methods.

Weak Interaction Quantum Monte Carlo 167
1.2. Quantum Monte Carlo
Characteristic of weakly bound clusters are shallow potential surfaces with extended troughs or other regions of flatness. These are highly anharmonic surfaces wherein even ground-state vibrational excursions can lead well away from an equilibrium. Quantum Monte Carlo is one technique that is being used increasingly on such problems.
Diffusion quantum Monte Carlo (DQMC), one of several QMC approaches, 2~ gained considerable attention with Anderson's development for molecular elec- tronic structure. 21 With DQMC, the computational equivalent of integration of the Hamiltonian is the evaluation of the potential at numerous geometries; the search for the eigenstate is via imaginary-time propagation. DQMC offers great generality in application to different types and sizes of clusters because it does not involve a basis set or integration.
The procedure for DQMC comes about 21 from recognizing an equivalence of the differential equation for diffusion 22 and the time-dependent differential Schrtidin- ger equation on replacing the time variable, t, in the SchriSdinger equation by an imaginary time variable, x = it. Monte Carlo (MC) techniques used to obtain a numerical solution of the diffusion equation can then be used to simulate the modified Schrtidinger equation. In solving a diffusion equation by MC, particles are moved in randomized, discrete time steps and then may be replicated or destroyed depending on the energetic favorability of where a particle has been moved. An exact solution corresponds to the limiting case of an infinite number of diffusing particles, the length of the time steps approaching zero, and the number of time steps approaching infinity. In DQMC, psuedo particles ("psips") 21 propa- gate in imaginary time x. At a particular instant in imaginary time, each psip represents a particular geometrical arrangement of the atoms/molecules in the system, and at every such arrangement, the potential energy is evaluated. After many time steps, the distribution of the paths of the psips reflects one state (the ground state, generally) because of the exponential decay in imaginary time of higher energy states that may have been mixed initially.
Only the potential energy is explicitly evaluated in the DQMC propagation steps. The kinetic energy operator in the Schrticlinger equation plays its role in the randomized selection of the movement of the psips. [For a time step Az, random displacements for a set of pisps are taken from a specific Gaussian distribution of displacements whose mean is zero and whose standard deviation (distribution width) is (AT,/mi) l'r2 where m i is the particle mass.] The kinetic energy must be separable in the geometrical degrees of freedom, as satisfied for a point mass since
2 p2)/(2m)" r - (p x + + Application of DQMC to weakly bound clusters goes back at least to the work
of Coker et al. on the water dimer and trimer, 23 followed by a further calculational study of the water dimer by Coker and Watts. 24 Sun and Watts 25 and Quack and Suhm 26 used DQMC to study the HF dimer, including the particularly demanding calculation of the tunneling splitting.

168 CLIFFORD E. DYKSTRA
Analyzing the vibrations of weakly bound clusters does not necessarily call for relaxing the internal structures of the monomers as done in the first DQMC studies of clusters. Often, constituent molecules in a cluster may be treated approximately as rigid species. This amounts to a separation of the relatively fast intramolecular vibrations from the usually slower intermolecular (weak mode) vibrations. Elimi- nating high-frequency motions allows for the use of longer time steps for a given level of precision and thereby less steps for a simulation to span a fixed interval of time. Also, for other than small molecules, the rigidity assumption reduces the number of degrees of freedom and thereby the calculation cost. Rigid molecule DQMC (or rigid body, RBDQMC) calculations have been reported for several weakly bound dimers. 27-32 Recently, Gregory and Clary have developed a rigid body quantum Monte Carlo technique for directly obtaining tunneling splittings in clusters by simultaneously finding weights of the two tunneling states. 31 Sandier et al. have developed the capability to obtain several excited vibrational states. 32 There has also been a recent implementation of rigid body DQMC applied to the problem of a diatomic molecule surrounded by rare gas atoms by Niyaz et al. 33 A comparison of DQMC and RBDQMC for the water dimer by Gregory and Clary 30 has shown good agreement for zero-point energies and rotational constants.
QMC propagation of rigid bodies is a combination of translation of their mass centers and rotation about their mass centers. For the kinetic energy operator to have the separable form required for equivalence with a diffusion equation, the propagation of rotation about mass centers needs to be done about each of the three principal axes (a,b,c) of the molecule with moments of inertia taking the place of masses. We begin an RBDQMC calculation with the selection of an initial geometry for each molecule, i, in a cluster. This is a selection of the location of the molecule's mass center plus a selection of rotation angles about each of the three principal axes of the molecule. In our procedure 34 a matrix U i is calculated from these orientation angles of the t~h molecule. Then, at each time step and for each psip, in addition to translating the mass centers, the molecules are rotated about their principal axes by small angular increments selected from a gaussian distribution and designated { 8R a, 8R b, 8Re} i where the/-subscript refers to the i th molecule. U i is updated via the construction of three matrices which correspond to incremental rotations about the principal axes which may be at any orientation. Note that for some unit vector ~ = (x,y,z), the unitary transformation matrix, W, for a rotation about ~ by an angle 0 is: 35
1 0 0 0 -z y ( -y2-z2 xy xz
W = ~ 1 +sin0 Zy 0 oX +2s in2(0 /2 ) / xy ! - x 2 - z 2 yz
0 x xz yz -x2-y 2
So, W is found with ~ being the current direction of one of the molecule's principal axes, which means the components of n are simply the elements of the correspond- ing row of the current U i matrix and 0 is the corresponding increment from the set {SR a, 8R b, 8Re} i. U i is multiplied by W to yield the U i matrix updated for this first

Weak Interaction Quantum Monte Carlo 169
rotation about a principal axis. The process is repeated for the other two axes. In this way, three successive small-angle rotations about principal axes of a molecule, whatever its current orientation, are performed. This process is derivable from analysis via quaternions, 36 mathematical devices that have sometimes been em- ployed in classical molecular dynamics simulations. 37'38
The expression above for W is valid only if ~ is normalized, and the sequence of rotations about three axes requires that they be strictly orthogonal. After many successive diffusion steps, the limits on a computer's numerical precision can lead to deviations from orthonormality, and ultimately serious errors. This numerical problem is overcome 35 by Schmidt orthogonormalization of the rows of a current U matrix prior to forming the Ws. We have found this need not be done on every step, and the very conservative default choice in our program is to do the orthonor- realization every 10th diffusion step. It then adds little computational cost but insures numerical precision.
The explicit construction of U i matrices for RBDQMC facilitates the evaluation of interaction energies involving tensor molecular properties (e.g. electrical re- sponse properties). Molecular property tensors are transformed to a laboratory axis system to evaluate fields and field gradients experienced by partner molecules, and the field and field gradient tensors are back-transformed to the principal axis system and the electrical energy is then directly evaluated. Rotation of tensor properties and time-step rotation of molecules are combined. 35 Test calculations on the water dimer to study convergence behavior of both energy and rotational constants with respect to the time step length and number of psips showed it was tractable to carry out calculations to +0.1 cm -1 in the energy and with further simulation to obtain rotational constants with a standard deviation of several MHz.
The diffusion simulation of the solution of the Schr6dinger equation yields weights for each of the psips used in a simulation. For a specific time x 0 after a steady state has been achieved in the diffusion simulation, one may associate the weights with the specific cluster geometries corresponding to the different psips. The square of the weights are analogous, but not strictly the same as the square of the wavefunction. 3s However, the true probability density may be obtained by descendant weighting, 22'24'39 or weighting each psip at time x 0 by the number of its descendants in further propagation. Thus, for small clusters, DQMC can yield energetic and certain property information with controllably small errors in the dynamics. This means it can provide for serious tests of interaction potentials.
2. VIBRATIONAL FEEDBACK IN GENERATING POTENTIALS
2.1. Assessing the Role of Contributing Elements
The equilibrium structure on an interaction potential energy surface for a weakly bound cluster tends to differ from the cluster's on-average structure in the ground

170 CLIFFORD E. DYKSTRA
vibrational state as derived from microwave transition frequencies because of the floppiness and anharmonicity of weakly bound clusters. A conclusion about the roles of the various contributing elements of weak interaction in determining an equilibrium structure has limited value. The difference between the on-average and equilibrium structures highlights the possibility that the weighting of elements at any one structure may not be representative, especially for a detailed analysis. On the other hand., the closer connection with experiment achieved through careful vibrational analysis can help assess the quality of the surfaces and perhaps give a more meaningful view of the role of contributing elements. Going one step further, this connection can be used in a feedback cycle to change a model surface and improve it.
There are several requisites for using vibrational analysis to develop a model potential. Error introduced in the analysis should not distort the potential, and the adjustability of the potential should be not be so great as to preclude a vibrational "search through parameter space." QMC is one of a number of approaches that are nicely suited. The error in QMC depends on the length of the simulation, and is controllable; no approximations are made in the Hamiltonian, nor is there any basis set truncation. The search among model parameter values can be guided by the partitioning of weak interaction with different types of contributions having differ- ent functional forms. In the case of the MMC model, the use of ab initio values for electrical response properties limits the parameter space for searching to those parameters in the nonelectrical terms. We have done parameter searches for the "6-1 2" atom-atom terms in MMC for water 28'34 and for nitrogen 28 that end up with values of (B + C)/2 for different isotopic forms within a few percent of experimental values. This suggests that at least that level of reliability is attainable with the relatively simple type of potential used in MMC and that we can distinguish effects of competing elements to that level.
2.2. The Interaction of Argon and Hydrogen Sulfide
Whereas ab initio calculations can provide a grid of potential energies for a system, QMC requires evaluation of the potential at numerous non-grid points. Suhm has reported a scheme that accomplishes this by weighting the energies of nearby grid points, 4~ and Brown et al. have employed neural networks to fit an analytic function to the ab initio grid. 41 The idea of the Hartree-Fock plus damped dispersion (HFD) approach, 42 which is quite effective for insuring correct close-in behavior of long-range elements, could also be used. Of course, the explicit or implicit fitting of an ab initio potential surface retains errors in the surface arising from incomplete treatment of electron correlation and basis set deficiencies. For small clusters of small molecules, these error sources in ab initio treatment can be reduced about as far as one likes; however, the practical situation for larger problems means that there are lingering errors in well-depths, location of minima, and curvature of the surface. The Ar-H2S cluster is an interesting example where we

Weak Interaction Quantum Monte Carlo 171
have used a modest correlation treatment, MP2, to find a 425-point grid of energies, and have refined the surface via a sequence of QMC calculations and comparison with spectroscopically obtained rotational constants. 43
Gutowsky et al. 44 recently reexamined the microwave spectra of the set of dimers,
Ar-H2S, Ar-D2S, and Ar-HDS stimulated by the recognition of two internal rotor states of the analog species Ar-H20. 45-49 Ar-H20 has a planar equilibrium struc- ture and a shallow potential surface such that extensive in-plane bending can be accomplished with little change in potential energy. Gutowsky et al. found a corresponding pair of states for both Ar-HES and Ar-D2S, but with an intriguing difference from the argon-water dimers. Deuterium substitution of HES leads to an increase in the rotational constant of the lower state of Ar-HES, not the usual decrease that is seen for Ar-H20. No reason was apparent from the data.
Our investigation of the potential surface of Ar-HES with large basis MP2 ab initio calculations 43 showed a wide trough for the argon atom to nearly "orbit"
hydrogen sulfide in a "shell" that partially encloses H2S. Selected calculations were performed with larger bases and with higher level correlation treatments to confirm the trough/shell feature. Next, the classical electrical interaction potential which forms half of the MMC model was generated at the 425 grid points using ab initio values for the permanent moments and multipolar polarizabilities 5~ of H2S and for the polarizabilities 51 of At. These energy contributions were found to be small thereby showing the primary source of attraction to be the dispersion interaction between the two heavy atoms. A multisite version of the MMC potential proved to be a workable form of the potential wherein three "6-12" sites for HES, apart from the atomic sites, helped account for the slight anisotropy of the dispersion interac- tion.
The rotational constants for Ar-HES and At-DES at equilibrium are typical, not
anomalous. However, since the trough/shell feature of the surface suggests compli- cated vibrational excursions, the ground vibrational state rotational constants of the two isotopic forms were obtained with RBDQMC. These values were much closer than the equilibrium values. Furthermore, with adjustments to the "6-12" surface parameters made through repeated RBDQMC calculations (parameter space search), adjustments small enough to be within the size of lingering error in the ab initio energies, (B + C)/2 values within 2% of the experimental values for both forms were obtained (Table 1). It was then clear that the intriguing spectroscopic manifestation of deuterium substitution 44 was very much associated with vibra- tional motion. The surface shows that vibrational excursions along the trough can change the distance between argon and the HES mass center by a considerable amount. With the trough's flatness, the small H-to-D mass change turns out to increase remarkably the vibrational state probability density corresponding to the argon being in the middle of the trough; that is, at a greater c.o.m, separation.

1 72 CLIFFORD E. DYKSTRA
Table 1. Ar-H2S and Ar-D2S (B + C)/2 Rotational Constants (MHz)
Ar-H2S Ar-D2S
Ab initio surface equilibrium 43 QMC average using fitted ab initio surface 43 QMC average using modified surface 43
Experiment 44
1917 1825 1644 1598 1706 1699 1681 1707
0 PAIRWISE AND MANY-BODY ELEMENTS IN WEAK INTERACTION POTENTIALS
From the standpoint of weak interaction, the "body" in many-body effects is usually a molecule; however, sometimes reference is made to many-body terms in systems as simple as the Ar-HF dimer on taking each atom as one body. This latter usage combines intramolecular interaction with intermolecular interaction. Under the approximation of rigid monomers, all intramolecular dependence in the potential can be absorbed into monomer properties leaving only intermolecular elements. We adopt that view in this discussion; the many-body effects in a cluster refer to many-monomer effects. This does not preclude relaxing the assumption of mono- mer rigidity, as will be seen in one example.
The prospect of many-body effects having a significant impact on the behavior of a cluster has much to do with the number of such interactions. Recall that for a collection of N items, the number of groupings of the items into M-membered units is N ( N - 1 ) . . . ( N - M + 1)/M !. For N = 10, there are about three times as many three-membered groups as pairs, and were there some type of three-body interaction that had no distance dependence, it could offset a pairwise interaction three times larger. Of course, all interaction elements diminish with increasing distance, and further analysis is needed. For a uniform distribution of A particles about a single B particle, the number of A-B pairs with a certain separation distance R increases as R 2, whereas the number of A-B-B groups increases as R 3. This dependence on numbers of interacting groups is in the opposite direction of the inverse power dependence on R of the contributing elements of weak interaction. Their specific distance dependence completes this analysis.
The interaction of permanent charge fields (permanent moments) is strictly pairwise additive; however, polarization energies have many-body contributions. The many-body polarization term with the least fall-off with distance for a system of neutral monomers (no point charges) is that of the field due to two monomers' dipole moments polarizing a third monomer. This has the same R -4 dependence as the pairwise interaction of one dipole with a polarizable center. If we multiply this dependence by the number of pairs and three-membered groups for a given R, then the pairwise polarization in a large assembly falls off more quickly with R than the

Weak Interaction Quantum Monte Carlo 173
three-body polarization. On that basis, polarization must be regarded as a poten- tially significant source of many-body contributions provided the monomers are polar and polarizable.
Continuing the same argument to four-body interactions would require consideration of three monomers' dipoles interacting with the fourth monomer's hyperpolarizabil- ity. We have found for a wide range of molecules that hyperpolarizabilities contribute quite small energies for the usual size of the fields arising from neighboring molecules, even fields of highly polar molecules. Though the formal argument might be made that many-body hyperpolarization has a slower fall-off with distance than pairwise hyperpolarization in a large assembly because of the number of four-membered groups as opposed to pairs, both are generally very small parts of the total electrical interaction.
Dispersion is the interaction of instantaneous multipoles. Pairwise dipole-dipole dispersion has an R -6 dependence. The slowest fall-off Of many-body dispersion is that of dipole-dipole-dipole (DDD) dispersion which Axilrod and Teller 52 showed has an R -9 dependence. The geometrical dependence, foDD, has the following form, taking R i as the length of a side of the triangle formed by three interacting atoms and 0 i as the angle opposite the side of length R i.
1 + 3 cos 01 cos 0 2 cos 0 3 fDDD = e~ g 3 g~
Algebraic manipulation yields an expression for fDDD that requires only the dis- tances between centers and can be readily evaluated from position coordinates,
2 e l 2R2 2R3 2 + 3 g 2R 4 - 6 R 6 fDDD - - 8
n n where R" = R7 + R z + R 3. Meath and Koulis 53 have considered the next most com- plicated types of multipolar multibody dispersion, such as dipole-dipole-quadru- pole (DDQ) dispersion. Each higher order multiple increases k in the overall R -k distance dependence.
It is quite clear that many-body effects are manifested in condensed phases. A nice illustration of this was in the work by Morse and Rice 54 on water ice. Essentially, they found that pair potentials are incapable of yielding both the correct separation of two water molecules in a gas-phase dimer and the water-water separation of ice Ih. Many-body effects are crucial to getting the density of ice correct. White and Davidson 55 have used ab initio calculations on (H20)6 with Morokuma partitioning 2-4 to compare two- and three-body interactions. They found that three-body interactions in this cluster could be as sizable as two-body next-nearest neighbor interactions. They applied their results to a unit cell of ice and reached a significant conclusion about ice: "The Morokuma analysis shows that the large three-body terms are almost entirely due to polarization while the

174 CLIFFORD E. DYKSTRA
non-neighbor two-body terms are almost entirely electrostatic." (They use "elec- trostatic" to refer only to permanent charge field interaction.)
There is a fast-growing body of experimental information on multimonomer clusters that are small enough for detailed analysis of microwave and high-resolu- tion infrared spectra (for instance, refs. 56-60). This growing body of information is crucial to the ultimate understanding of the nature of many-body contributions to weak interaction.
4. THREE-BODY EFFECTS
4.1. HCN Chains
Clusters of HCN molecules are an interesting testing ground for many-body effects in collections of polar molecules. Crystallographic work shows that HCN forms linear chains. 61 Microwave spectra have been analyzed for (HCN) 2 62 and (HCN)3 ,63 and both clusters are characterized as linear. Infrared spectroscopy has confirmed the linear structure of the trimer, 64 though a cyclic form of (HCN) 3, presumably less stable, has also been observed. 65 Thus, experimental information is available that gives an idea of the contraction in HCN-HCN separation from the dimer to the limit of an infinite chain. That contraction is due to both pairwise and many-body effects, the contraction from pairwise potentials coming from attraction of next-nearest neighbors and so on.
MMC calculations done on linear HCN chains show the effect of certain potential elements on the contraction that comes with increasing chain length. 66 The MMC electrical representation of HCN is a point dipole, quadrupole, and octupoleat the molecule's center of mass, a dipole polarizability, dipole-quadrupole polarizability, quadrupole polarizability, and the dipole hyperpolarizability. The atom-atom Lennard-Jones ("6-12") potential parameters were empirically chosen in part to reproduce the experimental structure for (HCN) 2 62 less an estimated adjustment for vibrational averaging effects. Geometry searches for the equilibrium structures of various (HCN),, chains were carried out by successive adjustment of intermo- lecular structural parameters. The innermost HCN pair was always the one with the closest spacing, and that spacing is used to track the separation distance as chain length increases. Generally, all but the outer eight separations (left and fight) were found to be within 0.0001/~ of the inner pair separation for the longest chains. To compare the contraction due to electrical polarization with that due to many-body dispersion, dipole-dipole-dipole (DDD) dispersion was added to the MMC poten- tial assuming a molecule-centered form (i.e. each fluctuating dipole at the center of mass) and then all polarization energetics were deleted from the potential. The coefficient of the DDD term was chosen to force the contraction in separation distance from (I-ICN)2 to (HCN)3 to be that obtained with the MMC potential.
Table 2 lists the MMC equilibrium energies, separations, and dipole moments for a number of HCN chains. The energies are partitioned according to permanent

Weak Interaction Quantum Monte Carlo 175
Table 2. Model Potential Results for Linear (HCN) n Clusters a n: 2 3 5 10 20 30 50
Energy per bond (cm -I) Permanent moment 1633 1744 1841 1916 Polarization 183 263 340 402 Total MMC potential 1452 1598 1728 1831
Closest pair separation (A) MMC potential 4.421 4.395 4.360 4.349 without polarization 4.4 78 4.467 4.417 4.448 ad hoc DDD 4.478 4.452 4.424 4.417
Dipole per monomer (D) 3.350 3 .501 3.640 3.768
1883 1900 1914
4.346 4.346 4.346 4.447 4.447 4.446 4.416 4.416 4.416 3.834 3.856 3.875
Note: aRef. 66.
4.43 -
4.4-
4.37-
ti ~ "-'- ,---' . . . . . .
4.34
0E+0 10 20 30 40 50
M M C
. . . . . Dir. Pol.
. . . . N o Pol.
A-T
N u m b e r of H C N ' s
Figure 1. Contraction in the separation distance (/~) for linear HCN chains as a function of the chain length. 66 The curves show the closest pair separation in a chain with the number of monomers given by the horizontal axis. The solid curve was obtained with the MMC model potential. Also displayed are curves obtained by excluding back polarization (the direct polarization curve), excluding all polarization, and excluding all polarization but adding a dipole-dipole-dipole dispersion term, the Axilrod-Teller term (A-T), whose coefficient was artificially chosen to yield the same dirner to trimer contrac- tion as the MMC curve. Even with this unrealistically huge DDD dispersion, the full extent of contraction is not achieved in the absence of polarization energetics. The three curves obtained with the modified potentials have been shifted along the vertical axis so as to make their values for the dimer coincide with the MMC dimer value and thereby give a comparison of the contraction with each potential.

1 76 CLIFFORD E. DYKSTRA
moment interactions, polarization energetics and the "6-12" term contributions. As one would expect for a linear arrangement, the dipole-dipole interactions are always attractive, whereas the quadrupole interactions are repulsive. The polariza- tion contribution is about one-sixth of the net electrical interaction. The on-average separation distance of the monomers in the ground vibrational state of (HCN) 2 from microwave spectra 62 is 4.447/~, and the average c.o.m, separation in (HCN) 3 is 4.395/~.63 The c.o.m, in the crystal is 4.34/~.61 In comparison, the MMC equilib- rium separation for the dimer is 4.421/~, or 0.026/~ shorter than the on-average value, this difference having been built into the MMC parameter selection as an estimate of the vibrational averaging effect. 8 Using this estimate, the contraction in separation distance from the dimer (4.447 - 0.026 = 4.421) to the crystallographic value is 0.08/~. The MMC dimer to 50-mer contraction in separation distance is 0.076/~. With complete neglect of polarization, 42% of this contraction is obtained. With direct polarization (neglect of back polarization) an additional 37% of the contraction results. Mutual or back polarization gives the remaining 21%. Figure 1 displays how the contraction develops with increasing chain length.
Campbell and Kukolich measured the dipole moment 67 of the ground rotational state of (HCN)2 and reported a value of 6.552 D. The MMC value is 6.700 D at the MMC equilibrium. The difference between 6.552 D and twice the experimental value 68 for the dipole of HCN is 0.647 D. MMC, which uses an ab initio equilibrium dipole moment for HCN, gives a very similar enhancement of 0.624 D. This agreement is a strong indication of the ability to account for a property change via polarization analysis, and it reinforces the idea that the changes in electronic structures of the monomers due to weak interaction are changes primarily associ- ated with polarization. The average dipole per monomer approaches an infinite chain value of about 3.9 D. This an enhancement of at least 0.8 D over the isolated monomer dipole.
Karpfen 69 has carried out ab initio SCF calculations on the HCN dimer and on the single molecule unit cell of an infinite chain using a crystal orbital method. The separation distance in the infinite chain with the largest basis set, a polarized double zeta set, was 4.374 ,~. Though this is very close to the crystallographic value, 61 the dimer separation distance of 4.512 ,~ obtained in these calculations corresponds to a rather large contraction of 0.138 ~. The dipole moment obtained for the dimer using the largest basis was 7.223 D. This is somewhat larger than the experimental value, 67 but with the SCF level treatment, the monomer's dipole is also a bit too large, by 0.26 D. So, the enhancement in the dimer's dipole found in these calculations is 0.72 D. (Kofranek et al. have reported correlated ab initio results showing a dipole enhancement in the dimer of 0.646 D, 7~ almost identical to the experimental results.) For the infinite chain, the enhancement of the dipole per monomer is 0.48 D, 69 which is smaller than our model results. The model results follow from ab initio electrical properties that were obtained with a larger basis than in Karpfen's study, and basis sets certainly play some role in the difference.

Weak Interaction Quantum Monte Carlo 177
An important result of Karpfen's study 69 was the determination that pairwise effects can account for only a fraction of the contraction in separation distance from the dimer to the infinite chain. It was also argued that cooperative effects are important in the energy of interaction. Ab initio results on clusters with up to five HCNs 7~ have confirmed the increasing per monomer stabilization with increasing chain length. MMC results show the role of cooperative or many-body effects quite clearly, too.
The results with the ad hoc potential (Table 2) with the dipole-dipole-dipole (DDD) dispersion interaction necessarily show a contribution to contraction of the separation distance in linear chains. The distance dependence of the DDD term is the same as the distance dependence for certain electrostatic terms, and so, the ad hoc calculational experiment that was performed is mostly a test of this as a three-body interaction. The coefficient for this term was chosen so that it alone brought about the contraction in separation distances from the dimer to the trimer; the coefficient was unrealistically huge. One can see that its effect on the separation distance (Figure 1) is very much like the effect of direct polarization, which is also a three-body contribution, but it falls short of the contraction that results from polarization. Realistic treatment of many-body dispersion should have a much smaller effect than this ad hoc term, and at some level of detail, it will not be ignorable. However, polarization is clearly significant in the contraction in HCN chains. If monomers in a cluster have no permanent charge field (i.e. atoms), then a different balance of many-body effects will be found as in the next example.
4.2. Arn--HF Clusters
Changes in the vibrational frequencies of molecules are useful markers of weak interaction. A small molecule's vibrational frequencies will tend to shift even for the very weak interaction with a rare gas atom. The size and direction (red or blue) of the shift is related to the nature of the interaction, though in a more complicated manner than being simply proportional to the well-depth (interaction strength). Clusters with several rare gas atoms weakly attached to a molecule are readily formed in molecular beams, and hence, the effects of several weak-bonding partners are observable. To the extent that they can be separated, many-body effects are revealed. Furthermore, the limit of an infinite number of bonding partners and limiting effect of many-body interactions corresponds to vibrational spectra in a rare gas matrix.
Spectroscopically determined structures 72-76 and HF vibrational frequencies 75-78 of Arl_a-HF clusters are available. Dynamical analysis with different model potentials have quite closely reproduced the HF frequency shifts in one or in several of these clusters very well. 33'78-83 QMC calculations 33 of Niyaz et al. were per- formed with pairwise additive potentials and gave very good agreement with experimental values, as shown in Table 3. Likewise, calculations of Mcllroy and
80 Nesbitt using pair potentials yielded very good agreement with a collection of

178 CLIFFORD E. DYKSTRA
Table 3. ArnHF Clusters: HF Frequency Shifts, 6v
Calculations
Expt. MMC + DDD Re(. 33 Ref. 82 Ref. 81
ArHF(n = 0) Energy (cm -1) -76.82 -101.26 ArHF(n = 1 ) Energy (cm -1) -86.29 -110.94 8VHF ArHF (cm -1) -9.6575 -9.47 -9.67 -9.65 8VHF Ar2HF (cm -1) -14.8377 -15.22 -15.38 -15.60 ~VHF Ar3HF (cm -1) -19.2677 -18.63 -20.57 -21.11 8VHF Ar4HF (cm -1) -19.7077 -19.34 -21.08 -21.72
-101.26 -110.91
-9.65 -15.35
spectroscopic data for these clusters. However, as Nesbitt has pointed out, 78 the agreement with experiment diverges slightly from that obtained for the dimer, Ar-HF, and it is in a direction that suggests the pairwise potentials alone are too attractive. Hutson and coworkers 81 have included three-body exchange and the three-body effect of the exchange-induced Ar 2 quadrupole interaction with the molecular charge field and in doing so diminished the error in the 14.827 cm -1 HF red-shift in Ar2-HF from 0.527 cm -1 to 0.049 cm -1.
We have carried out another set of calculations 84 on the Arn-HF clusters systems to offer a different kind of test of the role of many-body effects on the HF red-shift. The potential function was that of MMC, though with the neglect of the HF hyperpolarizability and of back or mutual polarization, both giving quite small effects in a system wherein only one monomer has a permanent charge field. This means that up to three-body polarization effects are included in the potential, but no higher order effects. A special feature we have exploited with MMC is the use of electrical properties that have been calculated for specific vibrational states. In this case, we have available from our earlier ab initio calculations and diatomic vibrational treatments, sets of dipoles, quadrupoles, dipole polarizabilities, dipole- quadrupole polarizabilities, and quadrupole polarizabilities for the v = 0 and v = 1 states, and in fact for higher lying vibrational states. Thus, there is one MMC surface for Arn-HF(v = 0) and a different surface for Ar,,-HF(v = 1). We can find the equilibrium structures and energies on both surfaces. The difference in equilibrium energies is the nondynamical part of the HF frequency shift. Using the original MMC parameters, this nondynamical shift is 17.4 cm -l for Ar2-HF, 18.5 for Ar3-HF, and 18.9 for Ara-HF. Comparison with experimental values (Table 3) shows these are reasonable values for the Ar 3 and Ar 4 clusters, but there is an overshoot for Ar2-HF. At this point, RBDQMC was employed for a more mean- ingful comparison with experiment and to improve the surfaces.
To carry out RBDQMC calculations of Arn-HF clusters using the MMC type of potential requires a specification of the atom positions in the fixed HF(v = 0) and HF(v = 1) monomers. The separations chosen correspond to the on-average

Weak Interaction Quantum Monte Carlo 179
rotational constants of HF in the two vibrational states. Then, using a cycle of RBDQMC calculations, the MMC parameter space was searched for both surfaces so as to reproduce the spectroscopic (B + C)/2 values for Ar-HF (v = 0 and 1) and the red-shift to 2%. The parameters optimized for the two surfaces in this manner were slightly but not significantly different. They were more noticeably different from the original MMC parameters which were obtained without the advantage of DQMC analysis. With these new parameters, an evaluation of the nondynamical contributions to the shifts were 19.9 cm -1 for Ar2-HF, 29.6 cm -1 for Ar3-HF, and 30.8 cm -1 for Ar4-HF, a value that overshoots the observed shift (Table 3). With dynamical effects obtained via DQMC for Ar2-HF, the shift is 18.5 cm -1, which again overshoots the spectroscopic value (Table 3).
The next step was a preliminary test of three-body dispersion DDD terms. Pairwise dipole-dipole dispersion is attractive, and one might expect many-body dispersion to be a correction that increases the overall attraction in an Arn-HF cluster. DDD dispersion is attractive for linear arrangements, but this changes as the arrangement of the three centers is bent. As Axilrod and Teller illustrated, simple right and equilateral triangular arrangements of three atoms have repulsive DDD terms. 52 The Ar, -HF clusters are not linear; Ar2-HF is essentially triangular. Thus, DDD terms could diminish the overall stability of the cluster, and the differential amount of this effect for HF(v = 0) versus HF(v = 1) would affect the HF frequency shift.
A DDD interaction was added to each of the two potentials with one parameter for Ar-Ar-Ar interaction and one for Ar-Ar-HF. The HF was treated as a single isotropic center. RBDQMC calculations were then carried out as a coarse search through the DDD parameter space so as to improve the agreement with experiment to at least 1 cm -1 for the red-shifts of ArE-HF and Ara-HE This search produces a differential DDD effect between the two states of HF. The DDD parameters are not too much larger than the corresponding parameter we obtained for the DDD term in the He 3 surface, 85 a fewer-electron system that would be expected to have lesser DDD interaction. The small DDD interaction potential terms provide for a several cm -1 effect on the red shifts of Ar2-HF and Ar3-HF.
The difference between the Ar3-HF and Ar4-HF shifts, which is the incremental effect of adding the fourth Ar, is small because this Ar forms zhe apex of a tetrahedral Ar 4 cluster opposite the triangular face at which HF is attached. The RBDQMC/MMC + DDD calculated difference in shifts is 0.7 cm -1 compared to the spectroscopic difference value 77 of 0.44 cm -l. The MMC + DDD potential makes it appear reasonable that the size of dipole-dipole-dipole dispersion and the difference between Ar-Ar-Ar and Ar-Ar-HF repulsive contributions could play a role in how the HF red-shift evolves with addition of Ar atoms, perhaps in concert with exchange multipole three-body effects in these systems. 81 Thus, like the motivation for recent studies with still more argon atoms, 82'83 the objective of calculating the red-shift from that of Ar-HF to the 41 cm -1 shift in an Ar matrix 86

180 CLIFFORD E. DYKSTRA
still holds the promise of valuable insight. With the MMC + DDD potential, this shift value has been very closely approached. 84
5. CONCLUSIONS
Partitioning of ab initio electronic energies focuses the problem of weak interaction on different elements such as the interaction of permanent charge fields, dispersion, exchange repulsion, and polarization. As understanding of weak interaction phe- nomena grows, the attention to contributing elements is at increasingly finer levels of detail. Vibrational analysis has become crucial for assessing potentials, model and ab initio, against experiment. The vibrational analysis can also guide the process of modeling an interaction potential provided the model is carefully chosen. Separating electrical interaction, which can be quite rigorously connected to monomer properties that are obtainable to good accuracy, from the whole interac- tion allows for the efficient use of vibrational analysis in the refinement of just one part of a potential. This appears to hold considerable promise for one of the most difficult features of weak interaction, many-body effects, particularly those n o t
associated with electrical polarization. It is quite likely that considerable modeling progress can be made by incorporation of three-body potential terms associated with polarization, dispersion, and exchange-induced multipoles. Overall, theoreti- cal/computational capabilities are rapidly emerging that can use spectroscopic information on trimers and larger clusters to get solid information on at least three-body and possibly higher order effects.
ACKNOWLEDGMENTS
This work was supported, in part, by a grant from the National Science Foundation through the Theoretical and Computational Chemistry Program (CHE-9403545).
REFERENCES 1. Coulson, C. A. Research 1957, I0, 149. 2. Morokuma, K. J. Chem. Phys. 1971, 55, 1236. 3. Kitaura, K.; Morokuma, K. Int. J. Quant. Chem. 1976, 10, 325. 4. Umeyama, H.; Morokuma, K. J. Am. Chem. Soc. 1977, 99, 1316. 5. Kollman, P. J. Am. Chem. Soc. 1977, 99, 4875. 6. Jeziorski, B.; Moszynski, R.; Szalewicz, K. Chem. Rev. 1994, 94, 1887. 7. Crabtree, R. H.; Siegbahn, P. E. M.; Eisenstein, O.; Rheingold, A. L.; Koetzle, T. E Accts. Chem.
Res. 1996, 29, 348; Richardson, T. B.; de Gala, S.; Crabtree, R. H.; Siegbahn, P. E. M. J. Am. Chem. Soc. 1995, 117, 12875.
8. Dykstra, C. E. Accts. Chem. Res. 1987, 21,355. 9. Dykstra, C. E. J. Am. Chem. Soc. 1989, 111, 6168.
10. Buckingham, A. D.; Fowler, P. W. Can. J. Chem. 1985, 63, 2018. 11. Howard, A. E.; Singh, U. C.; Billeter, M.; Kollman, P. A. J. Am. Chem. Soc. 1988, 110, 6984. 12. Caldwell, J.; Dang, L. X.; Kollman, P. A. J. Am. Chem. Soc. 1990, 112, 9144.

Weak Interaction Quantum Monte Carlo 181
13. Kuwajima, S.; Warshel, A. J. Phys. Chem. 1990, 94, 460. 14. King, G.; Warshel, A. J. Chem. Phys. 1990, 93, 8682. 15. Applequist, J.; Carl, J. R.; Fung, K.-K. J. Am. Chem. Soc. 1972, 94, 2952; Applequist, J. J. Chem.
Phys. 1973, 58, 4251. 16. Birge, R. R. J. Chem. Phys. 1980, 72, 5312; Birge, R. R." Schick, G. A.; Bocian, D. E J. Chem.
Phys. 1983, 79, 2256. 17. Miller, K. J.; Savchik, J. A. J. Am. Chem. Soc. 1979, 101, 7206; Miller, K. J. J. Am. Chem. Soc.
1990, 112, 8533; 8543. 18. Stout, J. M.; Dykstra, C. E. J. Am. Chem. Soc. 1995, 117, 5127. 19. Stone, A. J. Mol. Phys. 1985, 56, 1065. 20. Ceperley, D. M.; Mitas, L. Adv. Chem. Phys. 1996, 93, 1. 21. Anderson, J. B. J. Chem. Phys. 1975, 63, 1499. 22. Kalos, M. H. Phys. Rev. 1970, A2, 250. 23. Coker, D. E ; Miller, R. E.; Watts, R. O. J. Chem. Phys. 1985, 82, 3554. 24. Coker, D. E; Watts, R. O. J. Phys. Chem. 1987, 91, 2513. 25. Sun, H.; Watts, R. O. J. Chem. Phys. 1990, 92, 603. 26. Quack, M.; Suhm, M. A. J. Chem. Phys. 1991, 95, 28; ibid, Chem. Phys. Lett. 1995, 234, 71. 27. Buch, V. J. Chem. Phys. 1992, 97, 726. 28. Franken, K. A.; Dykstra, C. E. J. Chem. Phys. 1994, 100, 2865; ibid, Chem. Phys. Len. 1994, 220,
161. 29. Sandier, P.; Jung, J. O.; Szczesniak, M. M.; Buch, V. J. Chem. Phys. 1994, 101, 1378. 30. Gregory, J. K.; Clary, D. C. Chem. Phys. Lett. 1994, 228, 547. 31. Gregory, J. K." Clary, D. C. J. Chem. Phys. 1995, 102, 7817. 32. Sandier, P.; Buch, V.; Sadlej, J. J. Chem. Phys. 1996, 105, 10387. 33. Niyaz, P.; Bacic, Z.; Moskowitz, J. W.; Schmidt, K. E. Chem. Phys. Lett. 1996, 252, 23. 34. Dykstra, C. E.; Van Voorhis, T. A. J. Comput. Chem. 1997, 18, 000. 35. Altman, S. L. Rotations, Quaternions and Double Groups; Clarendon Press: Belfast, 1986, p 74. 36. Evans, D. J. Mol. Phys. 1977, 34, 317. 37. Tildesley, D. J.; Madden, P. A. Mol. Phys. 1981, 42, 1137. 38. Reynolds, P. J. J. Chem. Phys. 1990, 92, 2118; East, A. L. U; Rothstein, S. M.; Vrbik, J.J. Chem.
Phys. 1990, 92, 2120. 39. Suhm, M. A.; Watts, R. O. Phys. Rep. 1991, 204, 293. 40. Suhm, M. A. Chem. Phys. Lett. 1993, 214, 373; 1994, 223, 474. 41. Brown, D. E R.; Gibbs, M. H.; Clary, D. C. J. Chem. Phys. 1996, 105, 7597. 42. Hepburn, J.; Scoles, G.; Penco, R. Chem. Phys. Lett. 1975, 36, 451; Ahlrichs, R.; Penco, R.; Scoles,
G. Chem. Phys. 1977,19, 119; Douketis, C." Hutson, J. M." On', B. J.; Scoles, G. MoL Phys. 1984, 52, 763.
43. de Oliveira, G; Dykstra, C. E.J. Chem. Phys. 1997, 106, 5316. 44. Gutowksy, H. S.; Emilsson, T.; Arunan, E. J. Chem. Phys. 1997, 106, 5309. 45. Fraser, G. T.; Lovas, E J.; Suertrarn, R. D.; Matsumura, K. J. Mol. Spectr. 1990, 144, 97. 46. Cohen, R. C.; Saykally, R. J. J. Chem. Phys. 1991, 95, 7891. 47. Lascola, R.; Nesbitt, D. J. J. Chem. Phys. 1991, 95, 7917; 1992, 97, 8096. 48. Germann, T. C.; Gutowksy, H. S. J. Chem. Phys. 1993, 98, 5235. 49. Arunan, E.; Emilsson, T.; Gutowksy, H. S. J. Am. Chem. Soc. 1994, 116, 8418. 50. de Oliveira, G.; Dykstra, C. E. Chem. Phys. Lett. 1995, 243, 158. 51. Mahan, G. D. Phys. Rev. 1980, A22, 1780. 52. Axilrod, B. M." Teller, E. J. Chem. Phys. 1943, 11,299. 53. Meath, W. J.; Koulis, M. J. Mol. Struct.-Theochem. 1991, 226, 1. 54. Morse, M. D.; Rice, S. A. J. Chem. Phys. 1982, 76, 650. 55. White, J. C.; Davidson, E. R. J. Chem. Phys. 1990, 93, 8029. 56. Peterson, K. I.; Suenram, R. D.; Lovas, E J. J. Chem. Phys. 1989, 90, 5964; ibid, 1995,102, 7807.

182 CLIFFORD E. DYKSTRA
57. Liu, K.; Brown, M. G.; Caner, C.; Saykally, R. J.; Gregory, J. K.; Clary, D. C. Science 1996, 381, 501.
58. Arunan, E.; Emilsson, T.; Gutowksy, H. S. J. Chent Phys. 1994, 101,861. 59. Gutowksy, H. S." Hoey, A. C." Tschopp, S. L.; Keen, J. D.; Dykstra, C. E. J. Chent Phys. 1995,
102, 3032. 60. Gutowksy, H. S." Arunan, E.; Emilsson, T.; Tschopp, S. L.; Dykstra, C. E. J. Chent Phys. 1995,
103,3917. 61. Dulmage, W. L.; Lipscomb, W. N. Acta Crystallogr. 1951, 4, 330. 62. Buxton, L. W.; Campbell, E. J.; Flygare, W. H. Chem. Phys. 1981, 56, 399; Georgiou, K.; Legon,
A. C.; Millen, D. J.; Mj6berg, E J. Proc. R. Soc. Lond. 1985, A399, 377. 63. Ruoff, R. S.; Emilsson, T.; Klots, T. D.; Chuang, C; Gutowksy, H. S. J. Chent Phys. 1988, 89, 138. 64. Maroncelli, M.; Hopkins, G. A.; Nibler, J. W.; Dyke, T. R. J. Chem. Phys. 1985, 83, 2129. 65. Jucks, K. W.; Miller, R. E. J. Chent Phys. 1988, 88, 2196. 66. Dykstra, C. E. J. Mol. Struct.-Theochem. 1996, 362, 1. 67. Campbell, E. J.; Kukolich, S. G. Che~ Phys. 1983, 76, 225. 68. Battacharya, B. N.; Gordy, N. Phys. Rev. 1960, 119, 144. 69. Karpfen, A. Chem. Phys. 1983, 79, 211. 70. Kofranek, M.; Lischka, H.; Karpfen, A. Mol. Phys. 1987, 61, 1519. 71. Kofranek, M.; Karpfen, A.; Lischka, H. Chem. Phys. 1987, 113, 53. 72. Gutowksy, H. S.; Klots, T. D.; Chuang, C.; Keen, J. D.; Schmuttenmaer, C. A.; Emilsson, T. J.
Chent Phys. 1985, 83, 4817; ibid, 1987, 86, 569. 73. Gutowksy, H. S.; Klots, T. D.; Chuang, C.; Schmuttenmaer, C. A.; Keen, J. D.; Emilsson, T. J. Am.
Chem. Soc. 1985, 107, 7174; ibid, 1987, 109, 5633. 74. Gutowksy, H. S.; Klots, T. D.; Chuang, C.; Ernilsson, T.; Ruoff, R. S.; Krause, K. R. J. Chem.
Phys. 1988, 88, 2919. 75. Fraser, G. T.; Pine, A. S. J. Chent Phys. 1986, 85, 2502. 76. Lovejoy, C. M.; Schuder, M. D.; Nesbitt, D. J. J. Chem. Phys. 1986, 85, 4890; ibid, Chem. Phys.
Lett. 1986, 127, 374. 77. McIlroy, A." Lascola, R.; Lovejoy, C. M.; Nesbitt, D. J. J. Phys. Chem. 1991, 95, 2636. 78. Nesbitt, D. J. Annu. Rev. Phys. Chem. 1994, 45, 367. 79. Nesbitt, D. J.; Child, M. S.; Clary, D. C. J. Chent Phys. 1989, 90, 4855. 80. Mcllroy, A.; Nesbitt, D. J. J. Chertt Phys. 1992, 97, 6044. 81. Hutson, J. M. J. Chent Phys. 1992, 96, 6752; Cooper, A. R.; Hutson, J. M. J. Chent Phys. 1993,
98, 5337; Emesti, A.; Hutson, J. M. Phys. Rev. 1995, A51,239. 82. Liu, S.; Bacic, Z.; Moskowitz, J. W.; Schmidt, K. E. J. Chem. Phys. 1994, 100, 7166; ibid, 1994,
101, 10181; ibid, 1995, 103, 1829. 83. Grigorenko, B. L.; Nemukhin, A. V.; Apkarian, V. A.J. Chem. Phys. 1996, 104, 5510. 84. Dykstra, C. E. J. Chem. Phys. 1998, 108, 6619. 85. Parish, C. A.; Dykstra, C. E. J. Che~ Phys. 1993, 98, 437. 86. Anderson, D. T.; Winn, J. S. Chem. Phys. 1994, 189, 171.

VI B RATI O N-ROTATI O N-TU N N ELI N G DYNAMICS OF (HF)2 AND (HCI)2 FROM FULL-DIMENSIONAL QUANTUM BOU N D-STATE CALCU LATIONS
Zlatko Ba~:i?: and Yanhui Qiu
Abstract . . . . . . . . . . . . . . . . . . . . . . . . . . . . . . . . . . . . . 184 1. Introduction . . . . . . . . . . . . . . . . . . . . . . . . . . . . . . . . . . . 184 2. Theory . . . . . . . . . . . . . . . . . . . . . . . . . . . . . . . . . . . . . . 185
2.1. Coordinate System and Hamiltonian . . . . . . . . . . . . . . . . . . . 185 2.2. Basis Set . . . . . . . . . . . . . . . . . . . . . . . . . . . . . . . . . 186 2.3. Basis Set Contraction via Sequential Diagonalization and Truncation . 188
2.4. Vibrationally Adiabatic Approximation . . . . . . . . . . . . . . . . . 189 3. Potential Energy Surfaces . . . . . . . . . . . . . . . . . . . . . . . . . . . . 190 4. Vibration-Rotation-Tunneling Dynamics of (HF)2 and (HC1)2 . . . . . . . . 193
4.1. Dissociation Energies . . . . . . . . . . . . . . . . . . . . . . . . . . . 194 4.2. Donor-Acceptor Interchange Tunneling Splittings . . . . . . . . . . . 195 4.3. Intra- and Intermolecular Vibrations . . . . . . . . . . . . . . . . . . . 200
5. Summary . . . . . . . . . . . . . . . . . . . . . . . . . . . . . . . . . . . . . 202
Advances in Molecular Vibrations and Collision Dynamics, Volume 3, pages 183-204. Copyright �9 1998 by JAI Press Inc. All rights of reproduction in any form reserved. ISBN: 1.55938-790-4
183

184 ZLATKO BA~_I(~ and YANHUI QIU
Acknowledgments . . . . . . . . . . . . . . . . . . . . . . . . . . . . . . . . 203 Note Added in Proof . . . . . . . . . . . . . . . . . . . . . . . . . . . . . . . 203 References . . . . . . . . . . . . . . . . . . . . . . . . . . . . . . . . . . . . 203
ABSTRACT
We review significant advances in the full-dimensional (6D) quantum treatment of the rovibrational levels of (HF)2 and (HC1)2 made in the past couple of years. The bound-state methodology employed in these treatments is presented. This is followed by a discussion of various spectroscopic properties obtained from rigorous 6D calculations, such as the dissociation energies, tunneling splittings and their depend- ence on inter- and intramolecular vibrational excitations of the dimers, frequency shifts of monomer vibrations, and intermolecular vibrations in different intramolecu- lar vibrational manifolds. The theoretical results are compared with the experimental data.
1. INTRODUCTION
Since the pioneering molecular-beam study of (HE)2 by Dyke et al., l and the first high-resolution infrared (IR) spectroscopy of (HCI)2 by Ohashi and Pine, 2 the two HX (X = F, C1) dimers have become the favorite prototype systems for investigating fundamental aspects of the structure, spectroscopy, and dynamics of hydrogen bonds. 3 Despite their small size and relative simplicity (two intra- and four inter- molecular degrees of freedom), HX dimers display extraordinary richness of quantum dynamical behavior, which has constantly pushed experiment and theory to their limits. The two light H atoms in (HX)2 give rise to coupled, large amplitude, highly anharmonic intermolecular vibrations, and to vibration-rotation-tunneling (VRT) spectroscopy which differs qualitatively from that of more rigid molecular species. Of particular importance is the large amplitude, multidimensional tunnel- ing between two equivalent equilibrium geometries of (HX) 2. This intricate motion interchanges the roles of the two HX monomers as hydrogen-bond donor and acceptor, and splits the dimer levels by an amount which reflects the tunneling rate. Such tunneling among equivalent configurations is ubiquitous in larger, more complex hydrogen-bonded clusters, such a s (nEO)n .4
Extensive investigations of HF and HCl dimers (and their isotopomers) by means of microwave, near-IR, far-IR, and Raman spectroscopy have produced a wealth of highly accurate experimental data. We refer the reader to some recent experimental papers on (H~2 5-8 and (HCI)2 ,9'10 which also provide excellent reviews of the activity in this area and references to earlier work. Although the data contain detailed information about the potential energy surface (PES) of the dimers, due to the exquisitely complex vibrational dynamics, extracting this information is a formidable task which requires all the resources of modem theoretical chemistry. Recent methodological advances have made possible rigorous full-dimensional

VRT Dynamics of (HF)2 and (HCI)2 185
(6D) calculations of the rovibrational levels of diatom-diatom complexes, includ- ing (HF)211-15 and (HCI)2 .16 The progress in dynamical treatments has been matched by the development of ab initio-based 6D PESs of HX dimers. 17-21 The combination of rich experimental data sets and powerful, approximation-free theoretical tools makes (HCI) 2 and (HF) 2 ideal model systems for quantitative characterization of the global PESs of hydrogen bonds, and of the quantum bound state and dissociative dynamics on them. 3
In this chapter we review the quantum 6D bound-state calculations of HF and HCI dimers and compare the theoretical results with the available experimental data. The methodology is outlined in Section 2. Section 3 describes the PESs employed in (HX) 2 calculations. The VRT dynamics of (HF) 2 and (HCI) 2 is discussed in Section 4. A summary is given in Section 5.
2. THEORY
2.1. Coordinate System and Hamiltonian
The PESs of hydrogen-bonded dimers such as (HF) 2 and (HC1) 2 have multiple minima separated by low barriers. The resulting vibration-rotation-tunneling (VRT) dynamics of the coupled low-frequency modes on these surfaces can not be investigated using the normal-mode coordinates and methods appropriate for the rovibrational spectra of rigid and semi-rigid molecular species. 22'23 Instead, one must employ coordinate systems developed in the context of molecular scattering theory. Such coordinates, whose definition is not based on any particular reference geometry, can describe the full range of nuclear motions, bound and unbound, of the weakly bound complexes, including interconversions among various isomeric structures. 24-26
Multidimensional quantum calculations of the rovibrational levels of weakly bound complexes consisting of two linear molecules are generally carried out in the diatom-diatom Jacobi coordinates { R, 0 l, 0 2, q), r 1, r 2 } shown in Figure 1. The first four coordinates are intermolecular; R represents the distance between the centers of mass of the monomers AB and CD, 01 and 0 2 are two in-plane orientation angles, and qo is the out-of-plane torsional angle. The last two coordinates, r I and r 2, describe the intramolecular vibrations of the two monomers. This coordinate set has been routinely used in theoretical treatments of collisions between two diatomic molecules, including the scattering of two HF molecules. 27'28
The full-dimensional (6D) rovibrational Hamiltonian of a diatom-diatom system for a given total angular momentum J, in the body-fixed frame and the Jacobi coordinates of Figure 1 can be written as.ll,14,16
a2 ( j - j l9 2 ~ H = - ~ ~ + ~ - - + + ~ + V r 2, R) + h I h 2 (r2) (1)
21.t 0R 2 21aR 2 2~lr 2 2~r22 (rl' (rl) +

186 ZLATKO BA~I(~ and YANHUI QIU
A C
r
q~ B
D
F i g u r e 1. Jacobi coordinates for a diatom-diatom system AB-CD. R is the center-of-mass distance between the monomers AB and CD, and g0 is the out-of-plane torsional angle.
In Eq. 1, Ix is the reduced mass associated with the centers of mass of the two monomers, J is the total angular momentum operator, and Jl and j2 are the rotational
angular momentum operators of the two monomers, which are coupled to form Jl2"
The diatomic reference Hamiltonian h i (ri) (i = l, 2) is defined as,
t~ ~2 hi (ri) = _ 2ixi Or 2 + Vi (ri) (2)
where Ixi is the reduced mass of the i-th diatom and V i is a reference potential for diatomic vibration. V i is obtained by making a cut along r i (i = 1, 2) through the 6D PES for a large value of the intermolecular coordinate R, when the interaction
potential between the two monomers is close to zero.
2.2. Basis Set
The matrix representation of the Hamiltonian in Eq. 1 is formed in the following 6D basis. 11'14'16 For the intermolecular coordinate R of the dimer, a pointwise discrete variable representation (DVR) 24'29'3~ is used, since it allows a particularly effective implementation of the basis set contraction scheme of Ba~.ie and Light, 24'3~ described below. A sine DVR of Colbert and Miller, 31 consisting of uniformly
spaced points { Ri} , has proved to be convenient for this purpose. The angular and intramolecular components of the eigenfunctions of H are expanded in terms of the
(primitive) 5D rovibrational basis for diatom-diatom systems,
xJMs = vJM~. f~v JM~. (3) vjK " jK = Y),Jri,2 Kc)v, *v~

VRT Dynamics of (HF)2 and (HCI)2 187
where e = (-1)J,+J2 +l is the parity of the system, v and j denote (k'l, V2) and (J'l, J2, Jl2), respectively, and r (i -- 1,2) are the vibrational eigenfunctions of the monomers AB and CD, i.6. the eigenfunctions of h i (ri) in Jm~ Eq . 2. Y) d v , 2 tc in Eq. 3 is the normalized body-fixed (BF) total angular momentum eigenfuniz~ion which can be written as,
Y:~ ~SK0)-'/2 ~f-2J + 1 [/~K. " ] = (1 + yjt,K + E (--1) J+jl+j2+jl2 DJK, M YJ~2 K (4) 8~ M -/;2
where D s ( O ~ ) is the Wigner rotation matrix 32 with three Euler angles K.M (O �9 ~F), and Y~lztc is the angular momentum eigenfunction of jl 2, JIJ2
YJ~zK=:,:2 Z <jlmlJ2 K - ml ljl2K > Yjtm, (01' O) yj2g_m, (0 2, qg) (5) m !
Yjmbeingthesphericalharmonics.NoteinEq.4therestrictionE (-1)/,§ =1 for K = 0. The above rovibrational basis has been discussed in detail by Alexander and DePristo, 33 whose work also provides a useful reference for the BF representation of diatom-diatom systems in general. In the BF rovibrational basis of Eq. 3, the matrix elements of the potential can be written as,
(6) < JMF. yJME vJME vJME Xvjtc IV (R) I ..v,j, tc , > = 8tctc, <. jtc I V , (R) I " j,x >
with Vvv , being the effective 4D potential:
Vvv, = < ~,, .v iVlCv ] r (7)
The potential V in Eq. 7 is the full 6D PES. Explicit expressions for the matrix elements in Eqs. 6 and 7 can be found elsewhere, lt'14'16
The centrifugal potential term (J - jig) 2 in Eq. 1 is not diagonal in the BF representation, and its matrix elements in the BF basis of Eq. 3 are,
yJMF. , vJMF. _ )2 vJMF. <Xvjmx~l ( J - J~2)21 -" vTtC > : ~5~ v' < - ix I (J .J~2 I "/x" >
: ,:8>
where the matrix W is given by,
WJ;'~ = {[J (J + 1) + Jr2 (Jl2 + 1) - 2K 2] fitch" ,K'
- ~ K ~'+ (1 + ~KO) 1Ix Jl2K ~K+I,K"
- X~K X~,x (1 + 8K~) 1/2 8K_t,h.}
and the quantity ~. is defined as:
(9)

188 ZLATKO BA~I(~ and YANHUI QIU
~'AB = [A (A + 1 ) - B (B + 1)] 1/2. (10)
When the two monomers AB and CD are identical, as in (HCI) 2 and (HF)2 , the Hamiltonian in Eq. 1 is invariant with respect to the interchange of the two subunits. It is important to take advantage of this additional symmetry, because it can result in major saving of computation time and memory. Following earlier treatments of the exchange symmetry for two identical molecules, 34'35 the basis functions xJM~ vjX in Eq. 3 can be symmetrized as,11,14,16
and,
x . ~ M ~ _ v JM~ ~ } vjK = Avj,v)' {YJK t~ *v + E (-1) J'2 ~']K (11)
(12) = = ~ )]-1/2 A~j,~ 7 [2 (1 + 5vv ~j~,)]-l/2 [2 (1 + 5v, v~ 7,J~
with V and ~" denoting (vz,vl) and (J2, Jl, J12), respectively. The restrictions on quantum numbers of v and j in Eq. 11 are v I > v 2 and Jl > J2 for v I = v2 .33 Note that for v 1 = v 2 and Jl = J2, the allowed J12 quantum numbers must satisfy the condition Pex E (-1)J~2 = 1. Matrix elements of the Hamiltonian in this exchange-symmetry adapted basis are easily expressed in terms of those in the unsymmetrized basis, in Eqs. 6-9.14,36
The symmetrized basis in Eq. 11 permits block diagonalization of the rovibra- tional Hamiltonian matrix into four symmetry blocks, which correspond to four possible combinations of the total parity (P - + 1) of the system and the monomer exchange symmetry (+).11 The total parity P is defined as the system parity e times the factor ( - 1)J. Therefore, the symmetry of (HCI) 2 eigenstates can be labeled with the symbol (P)+. The four symmetry blocks are diagonalized separately, thus reducing greatly the computational effort.
2.3. Basis Set Contraction via Sequential Diagonalization and Truncation
The above 6D basis, which is a direct product of the sine-DVR basis in the radial coordinate R and the primitive BF rovibrational basis functions of Eq. 3, would be prohibitively large for direct diagonalization. Our 6D calculations of (H~2 ll and (HC1)216 typically employed about 30 DVR points R i and a 5D rovibrational basis of the size 1000-2000; this would give rise to a final 6D Hamiltonian matrix whose dimension would exceed 30,000.
We addressed this problem by implementing the sequential diagonalization and truncation method of BaSiC and Light 24'30'37'38 which, as demonstrated by numerous
applications to demanding three- and four-atom systems, can drastically reduce the basis set size with no loss of accuracy. For this purpose at each DVR point R i, a matrix representation of the intermediate 5D Hamiltonian H adi (Ri) defined as,

VRT Dynamics of (HF)2 and (HCi)2 189
( j �9 2 --,]12) J~ J~2
H adi (R i )= 2l.tR 2 + . . . . . + 2 t2r + V(q, r 2, R) + h I (q) + h 2 (r2) (13)
is constructed in the 5D B F rovibrational basis of Eq. 3, or in its symmetrized version in Eq. 11 for the case of two identical monomers. Its matrix elements (in the unsymmetrized basis) can be obtained as,
yJMe Hadi vJME > Hadi (Ri)vjK, vT"K" = < "'vjK [ (Re) I"vTK"
= 8 vZj/sx, c + E2)
+ 8jfSrtc {Sv2,v;Jl (Jl + 1) < ~v,
1
2bt2r 2
1
21air21 *v; >
yJME I V(R ) { vJM~ + < "'vjK "rtvTK" >
vm~l( J �9 2 -- J12) ] v'JMk > (14) < "'vjK "Xv'fi( +
2 2i where e i (i = 1, 2) is the eigenvalue of h i (ri) in Eq. 2.
The eigenvectors produced by diagonalizing the matrix in Eq. 14 at every DVR point R i constitute a 5D quasiadiabatic basis which depends parametrically on R i, and is well adapted to the features of the PES. As a result, the size of the quasiadiabatic basis can be decreased sharply by retaining only those eigenvectors whose eigenvalues are below a certain energy cutoff (determined by the maximum rovibrational level energies of interest), and discarding the rest. The final matrix of the 6D Hamiltonian, transformed to the (severely) truncated quasiadiabatic basis, is much smaller (about 2000-300011'16) than it would be in the primitive rovibra- tional function basis. The matrix of this size is readily diagonalized, producing the desired 6D rovibrational energy levels and wave functions.
2.4. Vibrationally Adiabatic Approximation
Although the methodology described in the preceding sections practically elimi- nates the need for approximate, reduced-dimensionality bound state calculations of systems with three and four atoms, such treatments are still useful for interpreting the results of rigorous calculations, and in initial stages of refining PESs. We want to point out that the sequential diagonalization-truncation scheme outlined above, in addition to being an essential component of a full-dimensional method, makes it especially easy to perform some widely used approximate calculations. 16

190 ZLATKO BA~I(~ and YANHUI QIU
One popular method for approximate calculation of bound states of weakly bound systems, introduced by Holmgren et al. for atom-diatom van der Waals (vdW) complexes, 39 assumes an adiabatic or Born-Oppenheimer separation between the radial coordinate (R) and all other internal, angular and intramolecular, degrees of freedom (f2). The angular/intramolecular part of the Hamiltonian which paramet- rically depends on R, denoted H ang (f2; R), is diagonalized on a grid of R values. The eigenvalues of H ang (if2; Ri) provide a family of effective 1D potentials (adi- abats) Uef f (R) for the radial (stretching) motion of the complex. Within this adiabatic approximation, the (ro)vibrational levels of the complex are obtained by solving a 1D radial Schrtidinger equation for the Hamiltonian H rad (R):
f f ~)2 (15) H rad (R) = - 2---~ 0R ---S + Uef~ (R)
This approach has been applied to triatomic vdW complexes 39'4~ and to a couple of diatom-diatom systems, including the HCI dimer for the 4D case with fixed HCI bond lengths. 41'42
It is easy to see that the intermediate 5D Hamiltonian H adi (Ri) of Eq. 13 is actually Hang(~; Ri) for diatom-diatom complexes. By connecting the corresponding eigenvalues at different DVR points R i one obtains a set of 1D potentials Ueff(R ) which appear in Eq. 15. The resulting 1D Schrtidinger equation in the coordinate R can be solved numerically, giving the rovibrational levels of the complex in the adiabatic approximation. 16
3. POTENTIAL ENERGY SURFACES
The significance of HX (X = E CI) dimers as simple, yet realistic paradigms for understanding the fundamentals of hydrogen bonding has prompted a number of large-scale ab initio calculations aimed at mapping out their global PESs. A 6D PES for HF dimer was first calculated ab initio at 1061 points by Kofranek et al., 43 and subsequently fitted by Bunker et al. 17 to a 6D analytical function (BJKKL). Quack and Suhm 18 used the same ab initio points to develop another analytical repre- sentation of the 6D HF dimer PES. The parameters of this 6D PES (SQSBDE) were empirically adjusted to reproduce the experimental dissociation energy and the ground-state rotational constant of (H~ 2. Recently, Klopper et al. 19 reported a new 6D PES for (HF)2 based on 3284 ab initio points, together with several empirically refined analytical fits to these points. We have been testing these promising new PESs by means of 6D quantum bound-state calculations and comparison with experiment; the results will be presented in a future publication. 44
The 6D PES of the HC1 dimer was calculated ab initio for 1654 geometries by Karpfen et al.; 45 it was then fitted by Bunker et al. 2~ to a 6D analytical function. Elrod and Saykally 21 recently refined the intermolecular (4D) portion of this

VRT Dynamics of (HF)2 and (HCI)2 191
potential function by a direct nonlinear least-squares fit to available microwave, far-IR, and near-IR spectroscopic data, the first such undertaking for a diatom-dia- tom complex. Tao and Klemperer 46 calculated ab initio the 4D intermolecular PES for (HCI)2 at the MP2 level.
We have employed successfully the ES1 PES in the first fully coupled 6D calculations of the rovibrational (J = 0, 1) levels of (HCI)2 ,16 when both HCI subunits are in the ground vibrational state. But, for HCl-excited (HCI) 2, the ES 1 and the ab initio 2~ PES yielded essentially zero tunneling splitting for the lowest energy state of the dimer, 47 in contrast to the experimental value of about 3 cm -~. When one of the subunits is vibrationally excited, the tunneling process involves exchange of the vibrational energy between the two monomers. Closer examination has shown that for the ES1 (and ab initio) PES, the potential matrix elements responsible for such intramolecular energy transfer are 4 to 5 orders of magnitude smaller than for the SQSBDE PES of (HF) 2, which is clearly insufficient to produce appreciable tunneling splittings. In an attempt to correct this deficiency, we decided to add to the ES 1 PES a 6D electrostatic interaction potential which depends linearly on the intramolecular vibrational coordinates r I and r 2 of HCI dimer; the electro- static terms present in the ES 1 PES are constants, independent of the HC1 stretches. This very simple electrostatic model, described in detail elsewhere 47 and denoted EL2, has greatly improved the description of the tunneling dynamics in HCI dimer as demonstrated by the results discussed below. The new combined semiempirical (ES 1) + electrostatic (EL2) PES will be referred to as ES 1 + EL2.
We now discuss those aspects of the PESs of HX dimers essential for under- standing their spectroscopy. The equilibrium geometries of the two dimers, for the ES 1 PES of (HC1)2 and the SQSB DE PES of (HF) 2, are displayed in Figure 2. Both dimers are planar, roughly L-shaped, and have nearly linear hydrogen-bonded structures. The two HX subunits are not equivalent in this geometry. The monomer on the left in Figure 2 is referred to as the "bound" subunit, or the hydrogen bond (or proton) donor. The subunit to the right, whose proton does not participate in the hydrogen bond, is referred to as the "free" HX, or hydrogen bond (or proton) acceptor.
However, the equilibrium structures in Figure 2 do not do justice to the complex- ity of the vibrational dynamics of HX dimers. In both dimers, the roles of the two HX subunits as proton donor and acceptor are readily interchanged, largely through the so-called "geared" motion between two equivalent configurations depicted schematically in Figure 3, where the monomers rotate in opposite directions. The motion is in the tunneling regime and is therefore highly quantum; it gives rise to the well-known splitting of the rovibrational levels of HX dimers. For both ( H ~ 2 and (HCI)2, this minimum-energy donor-acceptor interchange tunneling pathway is associated with a well-defined, rather deep potential valley in the (01, 0 2) plane, for planar geometry of the dimers, which connects the two equivalent global minima on the PES. It is shown in Figure 4 for the SQSBDE PES of ( H ~ 2. The tunneling

(21
ZLATKO BA(~I(~ and YANHUI QIU
F
192
(21
Figure 2. The equilibrium geometries of (HCI)2 (ES1 PES) and (HF)2 (SQSBDE PES).
paths of both HF and HCI dimers exhibit a low-energy saddle at a C2h geometry, but the two tunneling barriers have very different energies, 352 cm -1 in (H ~ 2 (SQSBDE PES) compared to only 48 cm -1 in (HCI) 2 (ES 1 PES). This has strong implications for the rovibrational level structure of the two dimers, discussed in the following section.
T x,
A A W
W Xl
x~ t l
Figure 3. Donor-acceptor interchange via geared rotation of the two HX subunits.

VRT Dynamics of (HF)2 and (HCI)2 193
180
160
140
120
t~ 100 Q)
"0
o~ 80
60
40
20
0 20 40 60 80 1 O0 120 140 160 180
01 (deg . )
Figure 4. Contour plot of the SQSBDE PES of (HF)2, for n = r2 = 1.744 a0, R = 5.197 a0, and q~ = 180 ~ The first contour is a t - 1 5 5 0 . 0 cm -1, and spacing between the contours is 50 cm -1 .
4. VIBRATION-ROTATION-TUNNELING DYNAMICS OF (HF)2 AND (HCI)2
This section reviews the results of full-dimensional (6D) bound-state calculations of (HF)2 and (HC1)2 and their comparison with the available experimental data. The theoretical results reported here for (HF) 2 have been obtained on the SQSBDE PES of Quack and Suhm, 18 while those for the HCI dimer pertain to the ES1 PES of Elrod and Saykally, 21 with the electrostatic potential (EL2) added for the HC1- stretch excited states. 47
As mentioned in Section 2, the eigenstates of HX dimers can be labeled with the symbol (P)• where P = _+1 is the total parity of the system and +_ designates the

194 ZLATKO BA(~I(~ and YANHUI QIU
exchange symmetry. In addition, the HX dimer eigenstates are commonly labeled with the set of approximate vibrational quantum numbers (VlV2V3VaV5V6). The first two, v 1 and v 2, stand for the intramolecular high-frequency stretching vibrations of the free and bound HX, respectively. The remaining four quantum numbers denote the intermolecular, low-frequency vibrational modes of the dimers, the in-plane "antigeared" (cis) bend (v3) corresponding to internal rotation of the two HX monomers in the same direction, the van der Waals stretch (v4), the in-plane "geared" (trans) bend (v 5 ), and the out-of-plane torsion (v6). It must be kept in mind that due to coupling between different degrees of freedom, these labels at best provide approximate zero-order descriptions of the dimer eigenstates. The assign- ments are made by inspecting numerous cuts through the wavefunctions; mode mixing makes the nodal structure often too irregular to allow unambiguous assign- ment.
4.1. Dissociation Energies
The HX dimers have large zero-point energies (ZPEs) as a result of the coupled large amplitude intermolecular vibrations, which mostly involve the motions of the two light H atoms. Consequently, a large difference exists between the equilibrium binding energy (De) obtained simply from the global minimum of the PES, and the dissociation energy (Do) from quantum dynamical calculations, which can be compared directly to experiment. This is evident from Table 1. In the case of HF dimer, the difference between D e and D 0, actually the 6D ZPE, is 506 cm -1 for the SQSBDE PES; the ZPE is 32% of D e. The situation is similar for the HCI dimer; D e and D O differ by the 6D ZPE of 276 cm -1 (ES 1 PES), which represents 40% of
D e �9
The D O from 6D calculations of HF dimer 11-13 on the SQSBDE PES, 18 1057.33 cm -l, is close to the experimental value 48 of 1062 + 1 cm -1. The new ab initio-based 6D PES by Klopper et al. 19 (SC-2.9) produces even better agreement with experi- ment; diffusion quantum Monte Carlo (DQMC) 19 and variational 6D calculations 44
Table 1. Theoretical and Experimental Dissociation Energies (Do) of (HF)2 and (HCl)2 a
(HF)2 (HCI)2
Property Theory Experiment Theory Experiment
Do 1057.33 1062 + 1 416.25 431 + 22
De 1563.20 - - 692 ZPE 505.87 m 275.75
Note: a Also shown are the calculated equilibrium binding energies (D e) and zero-point energies (ZPE) of both dimers. The theoretical properties for (HF) 2 were calculated on the SQSBDE PES, and for (HCI) 2 on the ES1 PES. All quantities are in cm -1 .

VRT Dynamics of (HF)2 and (HCl)2 195
give Dos of 1062 and 1061.31 cm -1, respectively, which are within the uncertainty of the experimental result.
The D O of (HC1)2 has not been determined as accurately as for (HF)2; its experimental value 49 is 431 + 22 crn -1, while the 6D calculation16 on the ES 1 PES gives the D o of 416.25 cm -1. This result, although an improvement over the 6D value obtained 16 for the ab initio PES 2~ (377.63 cm-l), implies that further improve- ments of the PES for (HC1)2 are needed.
4.2. Donor-Acceptor Interchange Tunneling Splittings
The large amplitude tunneling motion, which reverses the proton donor/acceptor roles of the two HX moieties, splits the levels of (HX) 2 into closely spaced pairs of states with opposite exchange symmetry. Experiments have revealed strong de- pendence of the tunneling splittings on H/D isotopic substitution and excitation of both intra- and intermolecular vibrational modes of (HE)25-8 and (HCI)2 .9'10 The large body of experimental data can be compared with the predictions from full- dimensional quantum calculations.
Ground-State Tunneling Splittings and Isotope Effect
The ground-state tunneling splitting measured for (I--IC1)2 ,5~ 15.5 cm -l, is more than 20 times that of (HF)2, ~'52 0.66 cm -~. Table 2 shows that these experimental observations, made for the ground-HF- and HCl-stretching states of the respective dimers, are reproduced well by our 6D calculations. The calculated 6D ground-state tunneling splittings for (HCI)216 and (H~211-13 are 0.44 and 14.94 cm -1, respec- tively. The description of (HF) 2 tunneling splitting is noticeably improved on the SC-2.9 PES, 19 for which 6D calculations yield 19'44 the value of 0.61 cm -1. The much larger tunneling splitting in HC1 dimer, while undoubtedly a result of complicated intermolecular vibrational dynamics, can be traced to the fact that its C2h tunneling barrier of about 50 cm -1 is much lower than the corresponding barrier in (HF) 2, =340 cm -1.
Table 2. Theoretical and Experimental Ground-State Tunneling Splittings (in cm -1) for (HF) 2, (DF)2, (HCI)2, and (DCI) 2, for the Ground Vibrational State of the
Monomers a Dimer Theory Experiment (HF)2 0.44 0.658690(1 ) (DF)2 0.03 0.0527207(14) (HCI)2 14.94 15.476680(4)
(DCI)2 - - 5.968(20)
Note: aThe theoretical splittings for (HF) 2 and (DF) 2 were calculated on the SQSBDE PES, while those of(HCI) 2 and (DCI) 2 are for the ES1 PES.

196 ZLATKO BA~_I(~ and YANHUI QIU
Elementary quantum mechanics suggests that substituting the hydrogens in (HX) 2 with deuterium atoms should reduce the tunneling splittings. The experimen- tal and theoretical results for (DF)2 and (DC1) 2 (experiment only) in Table 2 confirm this expectation. However, deuteration of (HF) 2 decreases the tunneling splitting by 12-fold (experiment, 15-fold from the calculations), while the reduction is less than threefold for (HC1)2, testimony to the complex tunneling dynamics in HX dimers.
Effect ofvl and v2 HX-Stretch Excitations
The tunneling coordinate in HX dimers is well-defined, and corresponds approxi- mately to the geared rotation of the HX subunits shown in Figure 3. Nevertheless, the tunneling dynamics is far from being one-dimensional, and in fact involves all internal degrees of freedom of the dimers. This is evident from the experimental observations that the excitation of various intra- and intermolecular vibrational modes changes drastically the tunneling splittings in (H~ 5-8 and (HC1)2 .9'1~ 2
For the discussion which follows, it should be pointed out that for the free-HX (v l, 2vl) excited levels of (HX) 2, the lower energy component of the tunneling doublet has (-) exchange symmetry, 9'53'54 in contrast to the bound-HX (v 2, 21,,2) excited levels, whose lower tunneling sublevel is of (+) exchange symmetry (as in ground-HX-stretching levels). Consequently, the tunneling splittings, defined as the energy difference between the (-) and (+) components of a tunneling pair, are negative for v 1, 2u I excited states.
Experimental results in Tables 3 and 4 show that excitation of the free-HF (vl) and bound-HF (u2)-stretching fundamentals of (HF) 2 reduces the ground-state tunneling splitting by a factor of three, while v I and v 2 excitations in (HCI) 2 lead to a fivefold decrease in the tunneling splitting. The calculated ratios of the tunneling splitting for v t and v 2 relative to that for the ground-HX-stretching state, -0.29 (vl) and 0.20 (v2) for (HF)2 ,14'15 and -0.15 (Vl) and 0.16 (v2) for (I-ICI)2 ,47 agree reasonably well with experiment. Smaller tunneling splittings in v~ and v 2 fundamentals have been generally attributed to the difficulty of transferring the vibrational energy between the two HX subunits in the course of tunneling, s5
The agreement between theory ~4 and experiment 56 deteriorates for the overtone (2vl) excitation of (HF)2. The tunneling splitting calculated for the SQSBDE PES, -0.014 cm -1, is an order of magnitude smaller than the experimental value, -0.21 cm -~. The reasons for this discrepancy are not clear. It is hoped that the calcula- tions 44 employing the SC-2.9 PES will shed light on this problem, also allow comparison with the tunneling splittings measured for the second HF-stretching overtone of (HE)2 .53
Dependence on Intermolecular Vibrational Excitations
We discuss separately the effects of intermolecular excitation on tunneling in (HF) 2 and (HCI) 2 since it turns out they are qualitatively different.

VRT Dynamics of (HF)2 and (HCI)2 197
Quantum 6D bound-state calculations (on the SQSBDE PES) for ground -ll and excited 14'15 HF-stretch states of (HF) 2 have predicted strong intermolecular mode specificity of the tunneling splittings. Theoretical results displayed in Table 3 show that for the ground-HF stretch as well as v 1 and v 2 manifolds, the v 5 geared bend excitation causes by far the largest increase (by a factor of 17-23) in tunneling splitting, relative to that in the ground intermolecular state of the same manifold. This is easy to understand, since the geared bend mode correlates strongly with the donor-acceptor interchange tunneling pathway. Not surprisingly in view of this argument, excitation of the v intermolecular stretching mode in different HF- 4 stretch manifolds is predicted 14'15 to increase the tunneling splitting more modestly, approximately 2-6-fold.
The theoretical results in Table 3 are generally in qualitative agreement with the experimental data regarding the mode dependence of tunneling splittings, although the calculated (J = 0) splittings are consistently smaller than the corresponding experimental values. Moreover, the predicted tunneling splittings of the v 4 and v 5 intermolecular modes built on the v 1 fundamental are larger than for the analogous levels in the v 2 manifold, which contradicts the experimental results. Finally, the 6D calculations for the ground-HF-stretch states zl predict a 34-fold increase in the tunneling splitting for the v 3 antigeared bend fundamental, which is in sharp contrast with the observed 1.5-fold decrease between v I and v 1 + v 3. This signals a deficiency of the SQSBDE PES along the antigeared bend coordinate.
There are no experimental data on tunneling splittings in excited intermolecular states of (HC1)2, leaving us to discuss the intriguing theoretical predictions. 47 Table 4 shows that the intermolecular mode dependence of tunneling splittings in (HCI) 2 differs profoundly from that for (H~ 2 (Table 3). In the ground-HCl-stretch states, the tunneling splitting increases only 3.4-fold in the excited geared bend mode (2v5), compared to the 7.5-fold increase in (HF) 2. Furthermore, the tunneling splitting actually decreases with increasing v 5 excitation, from 51 cm -1 in 2v 5 to 40 cm -l in the 4v 5 state. This can be contrasted with the sixfold increase in tunneling splitting for (HF)2, in going from 2v 5 to 4v 5 (Table 3).
Even more surprising are trends in the v 1 and v 2 vibrational manifolds. The tunneling splittings in vl(v2) + v 4 and vl(v2) + 2v 5 states are virtually the same as those of the vl(v2) fundamental. This is very different from the behavior of the analogous levels of (HF) 2, which exhibit pronounced mode dependence.
The explanation for this unusual tunneling dynamics of (HCI) 2 is provided in part by Table 5. It is evident from there that all levels of (HC1) 2 having two or more quanta in the v 5 mode are above the C2h tunneling barrier, unlike (HF) 2 where the states with up to five quanta in v 5 lie below the tunneling barrier. The implication is that the (HC1)2 progression in the v 5 mode is not in the tunneling regime at all, while that of (HF)2 is. Consequently, there is no reason to consider the neighboring levels of (HCI)2 with even and odd v 5 quantum numbers, respectively, as forming tunneling pairs, especially since the separation between them is quite uniform (40-50 cm -1) and does not fit into a tunneling pattern.

198 ZLATKO BA~I(~ and YANHUI QIU
This explains the puzzling dependence of the tunneling splitting on w 5 excitation (in ground HCl-stretch states) discussed above. It is clear now that the levels involved do not form tunneling doublets; instead, they are rather evenly spaced excitations of the v 5 mode.
The nearly constant tunneling splittings in the w 1 and w 2 manifolds can be understood with the help of Table 6, which shows the vibrational levels of (HC1) 2 associated with v 1 and w 2 excitations. It is evident that the intermolecular levels of the (+) and (-) exchange symmetry blocks have very similar energies, measured from the (+) and (-) sublevel, respectively, of the w 1 or w 2 fundamental. Conse- quently, the intermolecular levels are split by a nearly constant amount, which is very close to the tunneling splittings in v 1 or v 2 fundamentals.
Table 3. Experimental and Theoretical Tunneling Splittings Aw (in cm -1) of HF dimer for Selected Vibrational (J = 0) States in the Ground (%), w l, and w 2
HF-Stretching Manifolds a
State Aw (Experiment) Aw (Theory) Aw /Aw I (Theory)
Vo 0.658690(I) 0.44 I Vo + v3 - - 15.02? 34.14?
Vo + v4 - - 0.98 2.23 Wo + 2w5 - - 7.48 17.00
Wo + 4Ws ~ 46.55 105.8
W 0 + V 6 1.626(1) (K= 1) 1.75 3.98
Wl -0.2155(3) -0.128 1
wl + v3 -0.1447(4) ~
Vl + v4 - I .6639(22) -0.796 6.22
vl + 2Vs -2.7391 (I I ) -2.283 17.84 w l + v 6 - - _ _
V2 0.2334(4) 0.089 I v 2 + w 3 ~ _ 1#2 + 1'/4 - - 0.41 4.61
u2 + 2Ws 3.5868(9) 2.028 22.79
v 2 + w 6 0.2203(6) (K = I) -- --
Note: ~he tunneling splittings are defined as Aw = E~, - E~, with the superscript denoting the exchange symmetry of the state. The tunneling splitting is negative when the lower component of the tunneling pair has (-) exchange symmetry, as in the v 1 manifold. The theoretical splittings were calculated on the SQSBDE PES. Also shown are the ratios of the calculated tunneling splittings Av/Avg where Av s is the tunneling splitting of the lowest energy state in each of the three monomer-stretching manifolds.

VRT Dynamics of (HF)2 and (HCI)2 199
Table 4. Experimental and Theoretical Tunneling Splittings Av (in cm -1) of HCI Dimer for Selected Vibrational (J = 0) States in the Ground (v0), vl, and v 2
HCI-Stretching Manifolds a
State &v (Experiment) Av (Theory) Av /Avg (Theory)
Vo 15.47668(4) 15.26 I I,'o + I,'4 - - 6.81 0.45 Vo + 2v5 - - 51.36 3.36 1,'o + 41,15 - - 40.34 2.64
vl -3.3237(4) -2.31 1 vl + 1,'4 - - - 1 . 8 9 0.82
Vl + 2v5 - - - 2 . 2 8 0 .89
v2 3.1 760(4) 2.45 1 V2 + V4 - - 1.93 0.79 1,'2 + 2Vs - - 2.57 1.05
v 1 + 4v s ~ 2.06 0.85
Note: aThe tunneling splittings are defined as Av = E~,- E~, with the superscript denoting the exchange symmetry of the state. The tunneling splitting is negative when the lower component of the tunneling pair has (-) exchange symmetry, as in the v 1 manifold. The theoretical splittings were calculated on the ES1 + EL2 PES. Also shown are the ratios of the calculated tunneling splittings Av/Avg, where Av 8 is the tunneling splitting of the lowest energy state in each of the three monomer-stretching manifolds.
To conclude this section, our calculations 47 predict intermolecular mode depend- ence of tunneling splitting in HCI dimer very different from that observed in HF dimer, with tunneling splittings of the former being almost insensitive to intermo- lecular excitation. Spectroscopic data are needed for tunneling splittings in combi- nation states of (HCI) 2 to test these predictions.
Table 5. Comparison of the C2h Tunneling Barriers and the Calculated Energy Levels of the Geared Bend (Vs) Intermolecular Mode of (HF) 2 and (HCI)2 in the
Ground Vibrational State of the Monomers [v 1 v 2 = 00] a
(HF) 2 ~HCI)2
C2h Barrier 352 48
(v3 v4 Vs v6)) (0000) 0.00 0.00 (001 O) 0.44 14.94 (0020) 160.58 53.48 (0030) 168.06 103.81 (0040) 292.65 148.16
(0050) 340.13 188.08
Note: aThe data shown (in cm -1) are for the SQSBDE PES of (HF) 2 and the ES1 PES of (HCI) 2. The barriers are relative to the global minima of the respective 6D PESs.

200 ZLATKO BA(~I(Z and YANHUI QIU
Table 6. 6D Vibrational Energy Levels of (HCI) 2 for v 1 and v 2 HCI-Stretching Fundamentals [(v I v~)= (01), (10)] for Even Parity and Total Angular Momentum
J= 0 on the ES1 + EL2 PES a (P = +l) + (P = +l)-
(vlv2v3v4vsv6) Energy AEol AE10 (vlv2v3v4vsv6) Energy gEol AE10
(010000) 2856.98 0.00 (010010) 2859.43 0.00 (100000) 2876.69 0.00 (100010) 2874.38 0.00
(010020) 2 9 1 2 . 3 5 55.37 (010030) 2 9 1 4 . 9 2 55.49 (010100) 2 9 3 1 . 9 6 74.98 (010110) 2 9 3 3 . 8 9 74.46 (100100) 2942.48 65.79 (100110) 2940.59 66.21
(100020) 2967.22 90.53 (100030) 2964.94 90.56
(010120) 2972 .13 115.15 (010130) 2974 .50 115.07 (010200) 2994 .98 138.00 (010210) 2996 .38 136.95 (100200) 3002.35 125.66 (100210) 3000.98 126.60
(010040) 3011 .23 154.25 (010050) 3013 .29 153.86
Note: aThe energies (in cm -1) are relative to the 6D ground-state energy of-425.259 cm -1 . AE01 (AElo) is the energy difference between excited and the lowest energy level in the (01) [or (10)] vibrational manifold of that symmetry block.
4.3. Intra- and Intermolecular Vibrations
Intramolecular Vibrational Frequency Shifts
The frequencies of the two intramolecular V l and v 2 HX-stretching vibrations in (HX)2 are slightly lower ("red-shifted") than the vibrational frequency of the isolated HX monomer. This indicates softening of the intramolecular HX potential upon complexation and hydrogen bond formation. The theoretical and experimental v 1 and v 2 frequency shifts for (HF)2 and (HCI)2 are displayed in Table 7. The v 2 bound-HX stretch is red-shifted more than the v I free-HX stretch, in both HF and HC1 dimer. This is expected, since the bound-HX subunit directly participates in (and is perturbed by) the hydrogen bond, while the free HX does not. The experimental v 1 and v 2 red shifts of (HF)257 are significantly larger than those for (HCI)2 ,9 consistent with much stronger hydrogen bonding in the former.
The v 1 and v 2 red-shifts calculated f o r (HF)214'15 are approximately two-thirds of the experimental values. It may be added that the frequency shifts obtained 44 for the new SC-2.9 PES, 19 -34.1 cm -l (vl) and -96.88 cm -l (rE), are much closer to experiment. Concerning HCl dimer, the ES 1 PES with added model for electrostatic interaction (ES1 + EL2), overestimates the v 1 red-shift and comes close to the measured v 2 red-shift. 44
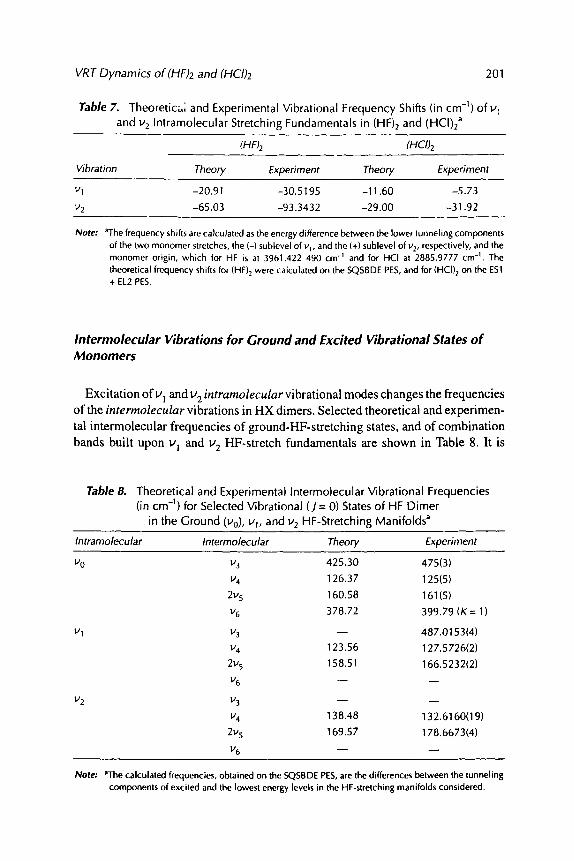
VRT Dynamics of (HF)2 and (HCI)2 201
Table 7. Theoretica: and Experimental Vibrational Frequency Shifts (in cm -1) of v 1 and v 2 Intramolecular Stretching Fundamentals in (HF)2 and (HCI)2 a
(H~ (HC/)2
Vibration Theory Experiment Theory Experiment
Vl -20.91 -30 .5195 -11 .60 -5 .73
V2 -65 .03 -93 .3432 -29 .00 -31 .92
Note: aThe frequency shifts are calculated as the energy difference between the lower tunneling components of the two monomer stretches, the (-) sublevel of v 1, and the (+) sublevel of v 2, respectively, and the monomer origin, which for HF is at 3961.422 490 cm -1 and for HCl at 2885.9777 cm -1. The theoretical frequency shifts for (HF) 2 were calculated on the SQSBDE PES, and for (HCI) 2 on the ES1 + EL2 PES.
Intermolecular Vibrations for Ground and Excited Vibrational States of Monomers
Excitation ofv I and V 2 intramolecular vibrational modes changes the frequencies of the intermolecular vibrations in HX dimers. Selected theoretical and experimen- tal intermolecular frequencies of ground-HF-stretching states, and of combination bands built upon v 1 and v 2 HF-stretch fundamentals are shown in Table 8. It is
Table 8. Theoretical and Experimental Intermolecular Vibrational Frequencies (in cm -1) for Selected Vibrational (J = 0) States of HF Dimer
in the Ground (Vo), wl, and v 2 HF-Stretching Manifolds a
Intramolecular Intermolecular Theory Experiment v 0 w 3 425.30 475(3)
v 4 126.37 125(5)
2v s 160.58 161(5)
v 6 378.72 399.79 (K = 1 )
v l v 3 - - 487.0153(4)
1./4 123.56 127.5726(2)
2v s 158.51 166.5232(2)
v 6 - -
V2 V 3 ~
V 4 138.48 132.6160(19)
2u s 169.57 178.6673(4)
v6 w
Note: aThe calculated frequencies, obtained on the SQSBDE PES, are the differences between the tunneling components of excited and the lowest energy levels in the HF-stretching manifolds considered.

202 ZLATKO BA~I(~ and YANHUI QIU
Table 9. Theoretical and Experimental Intermolecular Vibrational Frequencies (in cm -I) for Selected Vibrational (J = 0) States of HCl Dimer in the Ground
Vibrational State of the Monomers a Vibration Theory Experiment
v3 243.23
v4 72.53
2v5 53.48 (38.54) (37.64540)
v 6 164.21 1 6 0 . 7 7 8
Note: aThe theoretical frequencies were calculated on the ES1 PES. The numbers in brackets are for the transition v s = 1 --~ v s = 2.
observed experimentally 6'58 that the frequencies of v 4 and v 5 intermolecular modes increase when v 1 or v 2 is excited, relative to those for ground-HF stretches, with the v 2 mode causing a larger increase.
It is evident from Table 8 that the SQSBDE PES is successful in reproducing the observed intermolecular fundamentals for ground-HF-stretching states. 11'12 The only failure is the substantial underestimate of the v 3 fundamental frequency. However, the calculations 14'15 yield lower v 4 and v 5 frequencies in the v 1 than in the ground-HF-stretch manifold, which contradicts the experimental data, and points out the need for improved description of this aspect of mode coupling in (HF)2. The V 4 and v 5 fundamentals calculated for v 2 excitation are in good agreement with experiment.
Experimental information about the intermolecular vibrations of HC1 dimer are scant; they are presented in Table 9, together with the theoretical values. 16 The only intermolecular fundamental that has been observed directly is the v 6 out-of-plane torsion. Further refinement of the 6D PES for (HCI) 2 is contingent on a more complete experimental characterization of the intermolecular vibrations.
5. S U M M A R Y
We have reviewed the recent full-dimensional theoretical treatments of HX (X = F, C1) dimers. The quantum methodology for fully coupled 6D calculations of the rovibrational energy levels of general diatom-diatom complexes was described first. Its key component is a sequential diagonalization and truncation procedure, which generates a compact quasiadiabatic basis sufficiently small to allow construc- tion and diagonalization of the full 6D Hamiltonian matrix. Next, we discussed various aspects of the rich VRT dynamics of (HF) 2 and (HC1) 2. The existing 6D PESs yield results which are generally in semiquantitative agreement with the wide range of experimental data. The agreement between theory and experiment is better for ground-HX-stretching vibrational states than for HX-stretch excited states of

VRT Dynamics of (t-1t:)2 and (HCI)2 203
the dimers. Further progress certainly requires higher level ab initio calculations of global PESs of (HX) 2, which can be systematically refined through comparison of spectroscopic observables calculated in 6D and their experimental counterparts. This would produce quantitatively accurate, truly benchmark-quality PESs for these fundamental hydrogen-bonded dimers.
ACKNOWLEDGMENTS
We thank Prof. John Z. H. Zhang and Mr. Qian Wu for many helpful and stimulating discussions. This work has been supported by the National Science Foundation, through the Grant CHE-9613641.
NOTE ADDED IN PROOF
The list of recent experimental papers on (I-IF)2 cited in the Introduction inadver- tently omitted several important earlier contributions by Martin Quack and cowork- ers (ETH, ZUrich), which were the first to provide high-resolution spectroscopic data about the intermolecular vibrational modes of (HF)2. The relevant references are: Puttkamer, K. v.; Quack, M. Mol. Phys. 1987, 62, 1047; Puttkamer, K. v.; Quack, M. Chem. Phys. 1989, 139, 31; and Quack, M.; Suhm, M. A. Chem. Phys. Lett. 1990, 171, 517.
REFERENCES 1. Dyke, T. R.; Howard, B. J.; Klemperer, W. J. Chem. Phys. 1972, 56, 2442. 2. Ohashi, N.; Pine, A. S. J. Chent Phys. 1984, 81, 73. 3. Ba~id, Z.; Miller, R. E. J. Phys. Chent 1996, 100, 12945. 4. Liu, K.; Cruzan, J. D.; Saykally, R. J. Science 1996, 271,929. 5. Anderson, D. T.; Davis, S.; Nesbitt, D. J. J. Chent Phys. 1996, 104, 6225. 6. Anderson, D. T.; Davis, S.; Nesbitt, D. J. J. Chent Phys. 1996, 105, 4488. 7. Davis, S." Anderson, D. T.; Farrell, Jr., J. T.; Nesbitt, D. J. J. Chent Phys. 1996, 104, 8197. 8. Davis, S.; Anderson, D. T.; Nesbitt, D. J. J. Chem. Phys. 1996, 105, 6645. 9. Schuder, M. D.; Lovejoy, C. M.; Lascola, R.; Nesbitt, D. J. J. Chem. Phys. 1993, 99, 4346.
10. Schuder, M. D.; Nelson, Jr., D. D.; Nesbitt, D. J. J. Chem. Phys. 1993, 99, 5045. 11. Zhang, D. H.; Wu, Q.; Zhang, J. Z. H.; yon Dirke, M.; Ba~id, Z. J. Che~ Phys. 1995, 102, 2315. 12. Necoechea, W. C." Truhlar, D. G. Chem. Phys. Lett. 1994, 231, 125. 13. Quack, M.; Suhm, M. A. Chem. Phys. Lett. 1995, 234, 71. 14. Wu, Q.; Zhang, D. H.; Zhang, J. Z. H. J. Chem. Phys. 1995, 103, 2548. 15. Volobuev, Y.; Necoechea, W. C.; Truhlar, D. G. J. Phys. Chem. 1997, 101, 3045. 16. Qiu, Y.; BaSiC:, Z. J. Chem~ Phys. 1997, 106, 2158. 17. Bunker, P. R.; Jensen, P.; Karpfen, A.; Kofranek, M.; Lischka, H. J. Che~ Phys. 1990, 92, 7432. 18. Quack, M.; Suhm, M. A. J. Chem. Phys. 1991, 95, 28. 19. Klopper, W.; Quack, M.; Suhm, M. A. Che~ Phys. Lett. 1996, 261, 35. 20. Bunker, P. R.; Epa, V. C.; Jensen, P.; Karpfen, A. J. Mol. Spectrosc. 1991, 146, 200. 21. Elrod, M. J.; Saykally, R. J. J. Chem. Phys. 1995, 103, 933. 22. Califano, S. Vibrational States; Wiley, London, 1976.

204 ZLATKO BA~I(~ and YANHUI QIU
23. Papou~ek, D.; Aliev, M. W. Molecular Vibrational-Rotational Spectra; Elsevier: Amsterdam, 1982. 24. Ba~ir Z.; Light, J. C. Annu. Rev. Phys. Chem. 1989, 40, 469. 25. Cohen, R. C." Saykally, R. J. Annu. Rev. Phys. Chem. 1991, 42, 369. 26. van der Avoird, A.; Wormer, P. E. S.; Moszynski, R. Chem. Rev. 1994, 94, 1931. 27. DePristo, A. E.; Alexander, M. H. J. Chem. Phys. 1977, 66, 1334. 28. Schwenke, D. W.; Truhlar, D. G. J. Chem. Phys. 1988, 88, 4800. 29. Light, J. C.; Whitnell, R. M.; Park, T. J.; Choi, S. E. In Supercomputer Algorithms for Reactivity,
Dynamics and Kinetics of Small Molecules; NATO ASI Ser. C, 277; Lagana, A., Ed.; Kluwer: Dordrecht, 1989, p. 187.
30. Ba~i~, Z. In Domain-Based Parallelism and Problem Decomposition Methods in Computational Science and Engineering; Keyes, D. E.; Saad, Y.; Truhlar, D. G., Eds.; SIAM: Philadelphia, 1995, p. 263.
31. Colbert, D. T.; Miller, W. H. J. Chem. Phys. 1992, 96, 1982. 32. Rose, M. E. Elementary Theory of Angular Momentum; Wiley, New York, 1957. 33. Alexander, M. H.; DePristo, A. E. J. Chem. Phys. 1977, 66, 2166. 34. Davison, W. D. Chem. Soc. Faraday Discuss. 1962, 33, 71. 35. Takayanagi, K. Adv. Mol. Phys. 1965, 1, 149. 36. Zhang, D. H.; Zhang, J. Z. H. J. Chem. Phys. 1993, 99, 6624. 37. BaSiC, Z.; Light, J. C. J. Chem. Phys. 1986, 85, 4594. 38. Ba~i~:, Z.; Light, J. C. J. Chem. Phys. 1987, 86, 3065. 39. Holmgren, S. L.; Waldman, M.' Klemperer, W. J. J. Chem. Phys. 1977, 67, 4414. 40. Hutson, J. M.; Howard, B. J. Mol. Phys. 1980, 41, 1123. 41. Althorpe, S. C." Clary, D. C." Bunker, P. R. Chem Phys. Lett. 1991, 187, 345. 42. Elrod, M. J.; Saykally, R. J. J. Chem. Phys. 1995, 103, 921. 43. Kofranek, M.; Lioschka, H.; Karpfen, A. Chem. Phys. 1988, 121, 137. 44. Qiu, Y., Zhang, J. Z. H.; BaSiC:, Z.; Mtiller, H.; Quack, M.; Suhm, M. Manuscript in preparation. 45. Karpfen, A.; Bunker, P. R.; Jensen, P. Chem. Phys. 1991, 149, 299. 46. Tao, E M.; Klemperer, W. J. Chem. Phys. 1995, 103, 950. 47. Qiu, Y.; Zhang, J. Z. H.; Ba~i~:, Z. J. Chem. Phys. 1998, 108, 4804. 48. Bohac, E. J.; Marshall, M. D.; Miller, R. E. J. Chem. Phys. 1992, 96, 6681. 49. Pine, A. S.; Howard, B. J. J. Chem. Phys. 1986, 84, 590. 50. Schuder, M. D.; Nelson, Jr., D. D.; Nesbitt, D. J. J. Chem. Phys. 1989, 91,4418. 51. Blake, G. A.; Bumgamer, R. E. J. Chem. Phys. 1989, 91, 7300. 52. Below, S. P.; Karyakin, E. N.; Kozin, I. N.; Krupnov, A. E; Polyansky, O. L.; Tretyakov, M. Y.;
Zobov, N. E; Suenram, R. D.; Lafferty, W. J. J. Mol. Spectrosc. 1990, 141,204. 53. Chang, H. C.; Klemperer, W. J. Chem. Phys. 1994, 100, 1. 54. Pine, A. S.; Lafferty, W. J. J. Chem. Phys. 1983, 78, 2154. 55. Fraser, G. T. J. Chem. Phys. 1989, 90, 2097. 56. Suhm, M. A.; Farrell, J. T.; Mcllroy, A.; Nesbitt, D. J. J. Chem. Phys. 1992, 97, 5341. 57. Pine, A. S.; Lafferty, W. J.; Howard, B. J. J. Chem. Phys. 1984, 81, 2939. 58. Bohac, E. J.; Miller, R. E. J. Chem. Phys. 1993, 99, 1537.

SPECTROSCOPY AND QUANTUM DYNAMICS OF HYDROGEN FLUORIDE CLUSTERS
Martin Quack and Martin A. Suhm
Abstract . . . . . . . . . . . . . . . . . . . . . . . . . . . . . . . . . . . . . 206 1. Introduction . . . . . . . . . . . . . . . . . . . . . . . . . . . . . . . . . . . 206 2. Spectroscopy . . . . . . . . . . . . . . . . . . . . . . . . . . . . . . . . . . . 208 3. Potential Energy Hypersurfaces (PES) . . . . . . . . . . . . . . . . . . . . . 209 4. Quantum Dynamical Approaches . . . . . . . . . . . . . . . . . . . . . . . . 211
4.1. Variational Techniques . . . . . . . . . . . . . . . . . . . . . . . . . . 211 4.2. Diffusion Quantum Monte Carlo (DQMC) Techniques:
The General DQMC Approach for Ground-State Properties . . . . . . . 213 4.3. Symmetry Restricted DQMC Approach for Excited States . . . . . . . 214 4.4. Quasiadiabatic Channel Quantum Monte Carlo Method for
Rotationally and Vibrationally Excited States . . . . . . . . . . . . . . 215 4.5. Classical and Harmonic Approximations . . . . . . . . . . . . . . . . . 217
5. Spectroscopy and Dynamics of the Dimer (HF)2 and Its Isotopomers . . . . . 218 5.1. Rovibrational States of (HF)2: Spectroscopy and Theory . . . . . . . . 218 5.2. Hydrogen Bond Interconversion . . . . . . . . . . . . . . . . . . . . . 218 5.3. Hydrogen Bond Dissociation . . . . . . . . . . . . . . . . . . . . . . . 225 5.4. Hydrogen Bond Libration . . . . . . . . . . . . . . . . . . . . . . . . 226
Advances in Molecular Vibrations and Collision Dynamics, Volume 3, pages 205-248. Copyright �9 1998 by JAI Press Inc. All rights of reproduction in any form reserved. ISBN: 1-55938-790-4
205

206 MARTIN QUACK and MARTIN A. SUHM
6. Spectroscopy and Dynamics of the HF "Filmer . . . . . . . . . . . . . . . . . 227 7. Spectroscopy and Dynamics of Higher HF Oligomers . . . . . . . . . . . . . 230
7.1. Experimental HF Stretching Spectra as Assigned to Different Cluster Sizes (HF)n . . . . . . . . . . . . . . . . . . . . . . . . 230
7.2. Stretching Frequency Shift Predictions . . . . . . . . . . . . . . . . . . 234 7.3. Intracluster Vibrational Redistribution . . . . . . . . . . . . . . . . . . 235 7.4. Cluster Isomerization . . . . . . . . . . . . . . . . . . . . . . . . . . . 236 7.5. Concerted Hydrogen Exchange . . . . . . . . . . . . . . . . . . . . . . 237
8. Hydrogen Fluoride Nanocluster Dynamics . . . . . . . . . . . . . . . . . . . 238 9. Conclusions and Outlook . . . . . . . . . . . . . . . . . . . . . . . . . . . . . 241
Acknowledgments . . . . . . . . . . . . . . . . . . . . . . . . . . . . . . . . 242 References . . . . . . . . . . . . . . . . . . . . . . . . . . . . . . . . . . . . 243
ABSTRACT
Hydrogen fluoride clusters (HF)n and their isotopomers are reviewed as prototype systems for hydrogen bond dynamics. Infrared spectroscopy and ab initio calculations of potential hypersurfaces provide deep insights into the quantum dynamics of the hydrogen bonds in these clusters. Infrared spectroscopic developments using cooled cells, supersonic jets, Fourier transform, and laser techniques have contributed to the progress in our understanding of these clusters, as well as new developments in the analytical representation of empirically refined multidimensional potential hypersur- faces based on many body decompositions. The essential link between potential hypersurfaces and spectroscopic data is provided by quantum dynamical techniques allowing for numerically exact (or almost exact) predictions from solutions of the multidimensional rovibrational Schr6dinger equation. The application of quantum dynamical approaches such as quantum Monte Carlo techniques and variational techniques to hydrogen fluoride clusters is summarized. Properties and processes considered include hydrogen bond formation and dissociation, concerted hydrogen bond switching, hydrogen transfer, libration, and intramolecular vibrational-rota- tional redistribution. Spectral shifts, isotope effects, and the convergence of properties of small clusters to condensed phase properties in large clusters are discussed. We successively review results for the dimer, (HF)2, the trimer, (HF)3, and larger oligo- mers (HF)n including finally nanocrystalline clusters with n > > 100. Apart from a review of fundamental spectroscopic data we summarize also our current knowledge of the kinetic processes in these clusters, with timescales ranging from femtoseconds to microseconds, as derived from high-resolution spectroscopy.
1. INTRODUCTION
Condensed molecular matter is largely shaped by interatomic and intermolecular
forces: fluidity, surface tension, volatility, conductivity, diffusivity, phase state, and hardnessRthey all depend on how the constituent atoms and molecules interact with each other. 1 Primary processes of cluster dissociation, rearrangement, and

Spectra and Dynamics of (HF)n 207
further reactions govern these properties. Their detailed investigation profits sub- stantially from small system sizes. This provides the key incentive for studying isolated molecular clusters in the gas phase. By gradually increasing the cluster size, one can hope to approach condensed phase behavior without having to give up the simplicity of finite systems. Towards the same goal, it is advantageous to choose prototype systems which contain as little nonessential complexity as possible.
Undoubtedly, the hydrogen bond 2 is among the most important intermolecular interactions. 3 Hydrogen fluoride (I-IF) is the simplest molecule which can undergo such a polar hydrogen bond with itself. In particular the dimer (HF) 2 can be and has been studied by high-resolution rotational-vibrational spectroscopy. 4-7 Fur- thermore, the series of (I-W) n clusters (n = 2, 3, 4, 5, 6 . . . . ) provides a sequence along which the structure, energetics, and dynamics of the hydrogen bond can be studied particularly well by both experiment and theory. 8 But HF offers additional incentives for a detailed study. Its equilibrium vapor phase exhibits an unmatched clustering tendency at normal temperatures and pressures. 9 In contrast to carboxylic acids, 1~ the clustering does not peak at the dimer. Cooperative effects are very pronounced--the interaction energy in a larger cluster exceeds by far the sum of all molecular pair interactions 8 and the dynamics changes accordingly with cluster size. Finally, HF is a powerful solvent 11 for ionic and biomolecular matter and an important etching agent in semiconductor industry.
Experimentally, infrared (IR) spectroscopy provides a sensitive tool for the study of hydrogen bonds. 2'12 Modern supersonic expansion techniques, 13 possibly com- bined with rovibrational Fourier transform infrared (FTIR) and laser spectros- copy, 14 offer access to hydrogen-bonded clusters in a collision-free environment, while the particular properties of HF also allow a study of these clusters in equilibrium gas cells. 15'16 NMR spectroscopy can provide important complemen- tary information, 17 which has remained largely unexplored for HF in the last decades. 18,19
On the theoretical side, the small number of electrons in HF allows for high-level electronic structure calculations and for the accurate mapping of multidimensional potential energy hypersurfaces (PES), on which the nuclear dynamics can be investigated. 8 The small reduced mass of the HF molecule together with the pro- nounced anisotropy of its hydrogen bond interaction typically call for a quantum dynamical treatment, 2~ with sizeable quantum effects already at the zero-point level.
The purpose of this review is to summarize some of the recent IR spectroscopic and dynamical insights which have been obtained for clusters of HF from the dimer to nanometer-size aggregates. Rather than being exhaustive, we will highlight a few key dynamical features. A brief review of the connection to thermodynamic properties of the vapor phase has already been published. 9 Other reviews have concentrated on the PES 8'21 and on early dynamical work 21 on HF clusters, or have embedded HF cluster work in a wider framework of molecular aggregates. 22-33 Collisional energy transfer, 21'34 for which accurate dynamical calculations on the most recent PES remain to be done, is not reviewed here. Reviews of some

208 MARTIN QUACK and MARTIN A. SUHM
time-dependent quantum dynamical techniques and symmetry considerations related generally to our work on molecular and cluster dynamics can be found in refs. 35,36.
2. SPECTROSCOPY
Hydrogen bonds convert rotational and translational degrees of freedom into intermolecular vibrations and strongly influence the participating intramolecular X-H stretching modes. Hence, rotational-vibrational spectroscopy is a natural choice for their study. As genuine hydrogen bonds are important in electronegative elements of the first Period (X = N, O, F) with relatively small polarizabilities, linear Raman spectroscopy has not played a dominant role, although it can be useful. 37 The lack of low-lying electronically excited states in HF prevents the application of powerful visible and near-UV laser techniques. 38 Radio-frequency and micro- wave spectroscopy played an important role in characterizing the HF dimer through its large amplitude tunneling motion 4'39'4~ at the start of the era of high-resolution spectroscopy of molecular complexes a quarter century ago. In the future, this frequency range may receive revived interest due to the reliable prediction of vibrationally averaged structures of isotopomeric hydrogen fluoride clusters, which carry a small, zero-point motion-induced dipole moment. For the time being, IR spectroscopy remains the single major spectroscopic approach to elucidate the dynamics of HF clusters. One may distinguish two different techniques:
1. In direct absorption methods, the IR attenuation by the clusters is determined as a function of wavenumber ~. This involves FTIR spectroscopy 6'7' 9'16'41'42 as well as diode, 43 difference frequency, 44-47 color center 48'49, and Raman-shifted dye lasers. 5~ These techniques provide reliable information about the spectra, including band strengths and linewidths. In favorable cases, the latter may be decomposed into instrumental, Doppler, pressure, and lifetime broadening contributions. Some- times, sensitivity can be a problem, unless pulsed supersonic expansions 43'44'51'52 or long-path cells 7'16'53 are employed. The sensitivity limits inherent in broadband FTIR spectroscopy have been alleviated recently by using a buffered, synchro- nously pulsed rapid-scan technique. 9'52 In this method, the full low-resolution (0.2-10 cm -1) IR spectrum is measured in a single rapid scan during an intense substance pulse of 50-500 ms duration. The pulse is diluted in a vacuum buffer chamber before entering the mechanical pumping system. By increasing the size of the buffer chamber, the achievable spectral resolution Av (determined by the pulse duration tp via A~ = l/(2tpVm) where v m is the mechanical mirror speed) can be increased up to the instrument limits without the need for a larger pumping system. In this way, FTIR jet spectroscopy 54-56 can be applied routinely to molecu- lar clusters in a wide size range. 52
2. On the other hand, spectroscopies have been employed, which detect the IR absorption indirectly. These include laser-induced fluorescence, 57 bolometric de-

Spectra and Dynamics of (HF)n 209
tection, 48'58'59 as well as size-selective scattering and predissociation experi- ments. 6~ While bolometric techniques have led to beautifully detailed photofrag- ment distributions for HF dimer, 48 combination with scattering permits discrimination of a given cluster size against all others without requiring rotational analysis (see Section 7). Classical predissociation spectroscopy with mass spectro- scopic detection is often misled in its cluster size assignment by extensive cluster ion fragmentation, 62'63 unless it is combined with careful isotope substitution experiments. 64 Double-resonance spectroscopy 65 and saturation spectroscopy 66 have also been applied successfully. Often, these types of spectroscopy have a higher detection sensitivity than direct linear absorption experiments. However, their correct interpretation occasionally requires a detailed knowledge of the available fragmentation channels and typically, they do not resolve the problem of vibrational assignment in any better way than direct absorption techniques.
3. POTENTIAL ENERGY HYPERSURFACES (PES)
Our current knowledge about the PES of HF clusters is summarized in a recent review 8. It derives from two complementary approaches. Ab initio supermolecule calculations at various levels of sophistication 67-69 provide important geometrical and energetical trends as a function of cluster size. Although these trends refer to local minimum energy and saddle point structures rather than to experimentally observable (vibrationally averaged) quantities, they yield qualitative information about the convergence of cluster properties towards the condensed phase. 33 At the highest levels available and for small clusters, 7~ supermolecule predictions turn out to be even quantitatively reliable in some cases. However, more global PES scans 72 and representations 72'73 are required to verify this reliability, because comparison to experimental data involves a nonlocal quantum treatment of the nuclear dynamics (see Section 4). Reliable inversion procedures to obtain a full- dimensional PES from spectroscopic data without quantum-chemical guidance do not seem to be in reach for systems of more than three atoms, 74 thus suggesting the use of large-scale ab initio PES scans. For practical reasons, such scans usually have to be carried out at somewhat lower levels. 72'75 In order to be useful, they require empirical adjustments. 72'76 In order to be applicable to larger clusters as well, they should be based on a many-body decomposition scheme. 8'17'68 The idea is to separate the total energy of the cluster in a given geometry into three or more parts (illustrated here for a pentamer structure, with circles sketching the cluster structure and filled circles denoting those molecules which contribute to a given energy termS):
1. The energy of the monomers at the geometry in which they are found in the cluster relative to their free equilibrium energy, the so-called one-body potential V 1. In HF pentamer there are five such terms, each one corresponding to a process"

210 MARTIN QUACK and MARTIN A. SUHM
63 v , �9 ~ (I)
�9
Oo d This monomer relaxation contribution is particularly important for strong hydrogen bonds, such as those present in larger HF clusters. It destabilizes the cluster with respect to the monomers, but this is overcompensated by the stabilization effect on the other contributions at the cluster minimum structure. Often, in a rigid-body framework, 77 this term is neglected.
2. The pair potential V 2, which describes the interaction of two monomers in a given (monomer and pair) geometry of the cluster relative to separated monomers in the same monomer geometry. In the pentamer there are ten such terms, 8 each one corresponding to a process:
63 �9 v' �9 ~ (2)
~ O Oe �9
Typically, the sum over all these pair interactions in a cluster is the most important energetical contribution close to the global minimum structure. Often, it is the only contribution considered at all. 78-8~
3. The three-body potential V 3, which describes that part of the interaction of three monomer units in a given cluster geometry which is not captured by monomer relaxation nor by the three pair interactions. In the pentamer there are ten such terms, 8 each one corresponding to a process:
63 + e �9 + O�9 + O�9 V3~ O�9 ~ + Oo (3)
�9 �9 De �9 Oe �9 go �9 + �9
The three-body potential is often neglected in simplified treatments, 78-81 but it turns out to be essential in hydrogen-bonded systems, reaching up to one-half of the pair interaction in HF clusters at their minimum geometries and much more in some other conformations. 8'17 The popular reduction of the three-body potential to simple induction mechanisms is also not applicable here. 68'82-84
In principle, further contributions involving four-, five- and higher body forces would have to be included for clusters beyond the trimer. However, their importance typically decreases quickly after the three-body term. 8'17'68 They can be neglected
altogether for some applications (minimum energy structures, hydrogen bond rearrangements, and energetics at moderate accuracies) or may be restricted to four-body terms in others (highly accurate structures and binding energies, collec- tive vibrations, hydrogen transfer reactions). 8'85
The first generation of empirically refined full-dimensional pair potentials for HF clusters is represented by the SQSBDE PES, 76 which was mainly based 86 on

Spectra and Dynamics of (HF)n 211
systematic ab initio scans by the Vienna group. 75 Currently, the best available pair potentials are SC-2.9 and SO-3, two related, empirically refined fits of more than 3000 high-level ab initio points. 72'87 They are usually combined with a monomer potential of generalized Poeschl-Teller type. 72'87'88 The best available analytical three-body potential HF3BG 8'68'89 is a fit to 3000 ab initio points at lower level without empirical refinement, as the three-body term is relatively insensitive to basis size and correlation treatment. For more details, see ref. 8.
4. QUANTUM DYNAMICAL APPROACHES
The connection between these potential energy surfaces and spectroscopic re- sults 14'9~ requires a careful characterization of the multidimensional dynamics of HF clusters. The cluster sizes discussed here range from the tetratomic dimer to nanometer-scale aggregates. The applicable dynamical methods depend very criti- cally on this size. While complete full-dimensional bound state and quantum scattering calculations are only in reach for a pair of diatomics, the largest of these clusters can at most be treated at a locally harmonic or classical dynamical level, except for maybe the quantum ground state. Figure 1 schematically orders some of the available methods according to their applicability to HF clusters of increasing size.
We shall give a very brief outline of the possibilities and limits of some of the more important methods which have been applied to HF clusters, before presenting results for individual cluster sizes.
4.1. Variational Techniques
For low-dimensional problems, rigorous variational techniques using finitebasis set or discrete variable representations of the complete configuration space are very powerful. 91'92 Applications to clusters of two flexible diatomic molecules (six vibrational degrees of freedom) represent the state of the art in this field 93 and can provide a very accurate description of the bound and metastable state dynamics of (HE)2 ,94-96 including photofragment formation and distribution. 97-99 Collocation methods have been used as well. 1~176 For larger systems, selective diagonalization techniques are useful, l~176
From the rigorous variational approaches, a series of approximate methods can be derived. For the HF dimer, a powerful approximation consists in adiabatically separating the two high-frequency monomer vibrations from the four low-fre- quency hydrogen bond modes. 16'72'105-108 The resulting (4 + 2)D adiabatic wavefunc- tions retain the full dimensionality of the problem but can be obtained much more economically. This also allows for an efficient and accurate treatment of rotationally highly excited states, 72'1~176 which are currently too demanding for rigorous treat- menu. Limitations of the adiabatic approach will be discussed in Section 5.
In a "crude adiabatic" (4D) approach, 16 the monomer degrees of freedom are kept fixed at their equilibrium value or at some effective, vibrationally averaged geome-

212 MARTIN QUACK and MARTIN A. SUHM
full dimensional quantum scattering
variational bound states
- - - DQMC excited states
- - DQMC excited state approximations
- - - subspace grid/variational techniques
-- - vibrational SCF + correlation approaches
- - ab initio harmonic force fields
. . . . DQMC ground states and adiabatic channels
- - on the fly "ab initio" classical dynamics
- - harmonic frequencies
- - classical dynamics
I I I ..... I ' I - I - I ..... I I I t / 1 2 4 8 16 32 64 128 256 512 (HF)n
Figure 1. Approximate order ing of various dynamica l me thods accord ing to their applicabil i ty to HF clusters (HF)n of increasing size n.
try.109,110 While this introduces some arbitrariness, it is a reasonable assumption for
weakly interacting monomers if one is mostly interested in the van der Waals modes.
HF dimer is a borderline case, whereas larger HF clusters interact too strongly to
make this a very useful assumption. 8 For larger molecules such as water and
ammonia, the rigid monomer approach is often a prerequisite for the application of
variational techniques and for the availability of suitable interaction PES. 9~176 In larger HF clusters, where a full variational treatment is out of reach even for
frozen monomers, one can clamp further coordinates and concentrate on reduced subspaces. Such approaches have also been applied to (HF)2 ,112 where one can
check their reliability against more rigorous treatments. Investigations of the
n-dimensional pure HF stretching subspace for (H~,<642 and of the three in-plane
or the three out-of-plane librations for (HE)365 have given important insight into
subspace anharmonicities and have supported experimental assignments. However,
great care is indicated in such treatments, since anharmonic contributions of the

Spectra and Dynamics of (HF)n 213
neglected low-frequency modes can be very substantial, in particular when one deals with dissociative degrees of freedom. 31'76'113 In such cases, it is advisable to include at least the zero-point energy of the bath modes, i.e. to treat the subspace dynamics on an adiabatic surface.
Rather than freezing certain degrees of freedom, one may consider a variational self-consistent-field representation of the coupled modes, ll4'lls which is so suc- cessful in the field of electron dynamics. First results along these lines, including also the perturbation treatment of neglected mode correlations, are quite promis- ing, 114 but rigorous tests for well-characterized cluster systems such as HF dimer remain to be carried out.
Finally, one may ask whether one-dimensional variational treatments may be useful for such hydrogen-bonded clusters. The high symmetry and strong coupling in the HF ring complexes leaves relatively little room for a meaningful one-dimensional coordinate choice, unless the symmetry is broken via isotopic substitution. 52 In HF dimer, one can in fact devise one-dimensional paths for dissociation and hydrogen bond interchange, but simplified treatments of the dynamics along these paths 116'117 seem to lead to erroneous results. Again, a minimum requirement appears to be inclusion of the zero-point energy contribu- tions of neglected bath modes. 76'118 This leads us to a completely different class of dynamical methods, which are dealt with in the next sections.
4.2. Diffusion Quantum Monte Carlo (DQMC) Techniques: The General DQMC Approach for Ground-State Properties
Even if the essential dynamical aspects of a molecular cluster are born out of a restricted subspace of the PES and can thus be treated with variational methods, there will typically be nontrivial zero-point energy contributions of the remaining modes. Neglect of these contributions will lead to systematic errors in the compari- son between experiment and theory. For hydrogen-bonded systems, such errors are particularly large, because the spatial containment of the light hydrogen in the intermolecular bond gives rise to a sizeable spread in momentum.
The diffusion quantum Monte Carlo approach 119-125 provides a rigorous and simple method to evaluate the zero-point energy E 0 and wavefunction ~go of arbitrary subspaces (including the full configuration space) up to very large cluster sizes, given the potential energy hypersurface V. The method relies on an isomor- phism between the N-particle time-dependent Schrrdinger equation for nuclear motion (masses mk), when written in terms of an imaginary time equivalent (it/h= 'r,),
O(it/l~) - k=-, ~mt V2 - ( V - ER) Ig
and a multidimensional transport equation for ~:
(4)

214 MARTIN QUACK and MARTIN A. SUHM
0, / The wavefunction ~1/is mimicked by a discrete distribution of random walkers which undergo multidimensional anisotropic diffusion with diffusion coefficient D k in coordinate space and a first-order growth/shrinkage process according to the local potential energy V, shifted dynamically by a coordinate-independent term E R. For long (imaginary) times, a stochastic stationary distribution of the random walkers can be reached. It corresponds to the ground state wavefunction ~g0 of the cluster (or a given subspace), and the potential energy shift E R required to achieve stationarity is equal to the numerically exact cluster ground state energy E o, to within a symmetrical error bar which results from the stochastic nature of the simulation.
When applied in cartesian coordinate space without any restrictions, the DQMC method can be used to predict the spectroscopically observable dissociation energy D O of the cluster, which is linked to the electronic dissociation energy D e , via,
Do = De _ &E ~ (6)
where ZkE 0 is the difference in zero-point energies between the cluster and its fragments. Such accurate dissociation thresholds are important for the correct interpretation of predissociation experiments and for the thermodynamics and kinetics of evaporation and condensation.
4.3. Symmetry Restricted DQMC Approach for Excited States
Another DQMC application arises when the multidimensional configuration space of the cluster is divided symmetrically by a given hypersurface and random walkers are killed whenever they attempt to cross the hypersurface. In this way, one can generate a wavefunction which is antisymmetric with respect to this hypersur- face. 122'126'127 Usually, the hypersurface can be distorted in one or more dimensions
without destroying its symmetry. 12s In such a case, the algorithm will generate an upper bound of the exact lowest antisymmetric eigenstate of the cluster. In rare (low-dimensional) cases, the dividing (nodal) surface is completely defined by symmetry and an exact excited eigenstate is obtained. For instance, a cluster of four ordered atoms will be either planar, left-handed, or right-handed with respect to some stereochemical convention. The hypersurface of all planar configurations separates left- from right-handed clusters and is fully determined by this symmetry requirement alone. In such a case, the quantum Monte Carlo method can be used to obtain the corresponding lowest symmetric and antisymmetric eigenstates with- out approximation. If the nodal surface of a given cluster vibrational state is known approximately, e.g. from an SCF calculation, 114'115 DQMC can be used to obtain better estimates of cluster eigenstates using this fixed node. ~29 Furthermore, the nodal surfaces can be optimized in order to improve the eigenvalues fur- ther.68,127,130,131

Spectra and Dynamics of (HF)n 215
4.4. Quasiadiabatic Channel Quantum Monte Carlo Method for Rotationally and Vibrationally Excited States
If the random walk is constrained to a subspace of the full configuration space, it yields the zero-point energy of this subspace alone, which could be the space of bath modes in a restricted variational calculation. 76'I 18 For example, one can solve
the Schrrdinger equation for the nuclear motion in a cluster such as HF dimer for clamped HF...HF distance R. The resulting eigenvalues of the Hamiltonian as a function of R define adiabatic channels, 113'132 which are important for statistical
theories of reaction kinetics. The DQMC algorithm can be used to accurately calculate the lowest adiabatic channel for reactions of nearly arbitrary complexity, e.g. for enzyme reactions, if an analytical PES is available. In simple cases, symmetry also allows for the calculation of excited channels in the spirit of the previous section. An example for HF dimer, where the lowest channel of each
I
K rU
1000-
800
600
400
200
0
-200
400
600
800
-1000
-1200
-1400
-1600
i
t i
#
i f
i i
i i i
~J
~ V W ) l J , l ) l ~ ) V w t ~ V V r l V W ~ V l ~ , V t l w W ~ l V ' V w t l v v v v I
5O0 1000
R/pro Figure 2. Lowest quasiadiabatic DQMC dissociation channels of each sym- metry (full lines with symbols, A +, B +, A-, 8- from bottom to top) for HF dimer together with the minimum energy path (dashed curve). 76 The channel energies are shown with respect to two separate HF monomers in their lowest quantum states and the minimum energy path goes to 0 for large R.
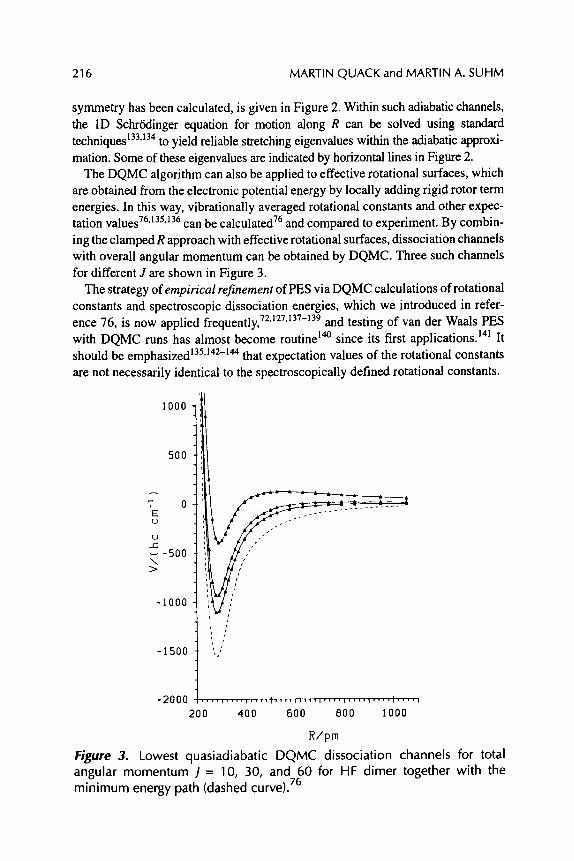
216 MARTIN QUACK and MARTIN A. SUHM
symmetry has been calculated, is given in Figure 2. Within such adiabatic channels, the 1D Schr&linger equation for motion along R can be solved using standard techniques 133'134 to yield reliable stretching eigenvalues within the adiabatic approxi- mation. Some of these eigenvalues are indicated by horizontal lines in Figure 2.
The DQMC algorithm can also be applied to effective rotational surfaces, which are obtained from the electronic potential energy by locally adding rigid rotor term energies. In this way, vibrationally averaged rotational constants and other expec- tation values 76'135'136 can be calculated 76 and compared to experiment. By combin- ing the clamped R approach with effective rotational surfaces, dissociation channels with overall angular momentum can be obtained by DQMC. Three such channels for different J are shown in Figure 3.
The strategy of empirical refinement of PES via DQMC calculations of rotational constants and spectroscopic dissociation energies, which we introduced in refer- ence 76, is now applied frequently,72'127'137-139 and testing of van der Waals PES with DQMC runs has almost become routine 14~ since its first applications. TM It should be emphasized ~3s'~42-144 that expectation values of the rotational constants are not necessarily identical to the spectroscopically defined rotational constants.
500
,.-..,
"-' 0 E { J
U ..C
,-, - 5 0 0 \
-I000
W
o
I
-1500
-2000
I000
200 400 600 800 I000
R/pm
Figure 3. Lowest quasiadiabatic DQMC dissociation channels for total angular momentum J = 10, 30, and 60 for HI: dimer together with the minimum energy path (dashed curve). 76
Spectra and Dynamics of (HF)n 217
The main advantage of the DQMC method over basis set approaches is its favorable scaling with system size, which it has in common with other Monte Carlo techniques, and the numerically exact nature of the result for selected vibrational states. Beyond the determination of vibrationally averaged cluster structures and dissociation energies, which are important for the interpretation of spectroscopic predissociation measurements, DQMC is most powerful in combination with variational subspace treatments, to which it can add the zero-point energy of the neglected bath modes in an adiabatic framework. 76
4.5. Classical and Harmonic Approximations
If global PES are available but quantum dynamical treatments are out of reach, one can resort to classical dynamical treatments. As discussed, one should be aware of sizeable errors for HF and other hydrogen-bonded systems in this case. In early applications to liquid HE 78'145 and HF clusters, 79 the error in the (pairwise additive) PES was at least comparable to that of the classical approximation and the two tend to partially compensate each other. 9 The classical dynamical treatment of HF clusters in Ar matrices has been applied for estimates of matrix shifts. 146 One may also consider to embed a local quantum subsystem into a classical solvent environ- ment, but this will be less advantageous in a homogeneous HF cluster.
On the fly dynamical evaluations or "ab initio molecular dynamics ''147'148 cir- cumvent the need for an analytical PES but they are still limited to relatively inexpensive and consequently approximate electronic structure approaches, usually density functional theory. 149'15~ Nevertheless, they have provided valuable theoreti- cal insights into the structure of liquid HF. 151 The inclusion of thermal quantum effects via path integral approaches 1s2'153 would be particularly attractive for the hydrogen fluoride system due to its pronounced librational quantization.
If sufficiently accurate global PES are not available but a rough dynamical characterization of the cluster is required, one can resort to the local harmonic approximation, which is included as a standard option for many electronic structure approaches in quantum chemistry codes both for minima in the potential and for saddle points (transition state structures). Due to the correspondence between quantum and classical harmonic oscillators, such a quadratic force-field diagonali- zation is equivalent to low-temperature classical dynamics simulations. The har- monic approach will miss out important features of large amplitude motion such as tunneling splittings, 4 pronounced anharmonicities, 42 overtone and combination bands, 14 and anomalous isotope effects 31'76'118 but it provides a qualitative picture of the fundamental spectrum for the more strongly bound HF clusters and--most importantly--of cluster-size trends. Also, the harmonic force field is a reasonable meeting point between empirically refined analytical potential energy surfaces and high level ab initio benchmark calculations which would be too expensive for systematic surface scans. 71'154 Quite often, substantial error compensation between various anharmonic effects contributes to the apparent success of the harmonic

218 MARTIN QUACK and MARTIN A. SUHM
approximation (see Section 7.2), but when this cancellation is understood through careful anharmonic analysis, it can even be exploited for predictions of spectro- scopic properties. 41,42,52 Recently, we have developed an efficient quasiadiabatic channel approach for polyatomic molecule spectroscopy, treating many degrees of freedom quasiharmonically. 248 This approach may sometimes be useful for large clusters, involving possibly large polyatomic molecules as monomer units.
5. SPECTROSCOPY AND DYNAMICS OF THE DIMER (HF)2 AND ITS ISOTOPOMERS
Among all HF clusters, the dynamics of the dimer has been characterized in most detail. We will first summarize observed vibrational states of this complex in comparison to theory and then concentrate on the discussion of some key primary processes in this prototypical system, namely the hydrogen bond interconversion process, the dissociation process and the librational dynamics.
5.1. Rovibrational States of (HF)2: Spectroscopy and Theory
The character and nomenclature of the six vibrational modes of HF dimer have been summarized before. 76 Basically, the modes occur in three pairs. At the low-frequency end, there is a pair of bend (vs) 7 and FF stretch (v4)76 vibrations, whose degree of mixing is sensitive to details of the potential energy surface and isotopic substitution. 46,72,76,155 A pair of librations (v 3, V6 )6'47'72'76 occurs at higher
frequency in the far-infrared, and will be discussed in Section 5.4. Finally, there is a pair of high-frequency HF stretching modes (v 1, V2 )5'16'53'72'76'156 whose excitation by one or more 16'43'44,57'157 quanta systematically affects the low-frequency hydro- gen bond dynamics. 16'46'47 Our direct experimental knowledge about the hydrogen bond modes and rotation around the FF axis with K quantum number is summarized in Figure 4. 7 It has been confirmed and extended by the investigation of hydrogen bond modes in combination with HF stretching vibrations. 46'47
With the help of recent accurate PES and dynamical methods, many spectro- scopic details can be reproduced and understood, while others can be predicted. Table 1 gives a selection of level predictions in comparison with experiment. In particular, the performance of a recent ab initio PES (GR121R12-CP) and its empirical refinement (GISC-2.9), the performance of the (4 + 2)D adiabatic sepa- ration compared to a full 6D treatment, and the performance of earlier PES (SQSBDE and SNB) can be judged. Details are discussed elsewhere 72'87'96'1~176 and in the following sections.
5.2. Hydrogen Bond Interconversion
Hydrogen bond interconversion in HF dimer, schematically represented by,

Spectra and Dynamics of (HF)n 219
~ F ~.'' H(2) --- F ~ F--H(') "'" F (7)
has been considered as one of the central primary processes of cluster dynamics ever since its first characterization a quarter century ago through the observation of a tunneling-split ground state 4 with a splitting of A~ T = 0.658690 cm -l. The one-dimensional disrotatory potential trough along which the exchange occurs is rather well-established, 53'116,118,158 but the tunneling dynamics is not determined by
E
FV| b"
- 4 0 0
300
200
I00
v6-1
B A
v-O v5-1 v 4- I
^ B ^ B ^ 8
3
_.o._ Hu
'i
/i7" Figure 4. Energy level scheme for experimentally characterized (HF)2 K sublevels of hydrogen bond modes in the far-IR, 7'19 complemented by some theoretical predictions. Horizontal bars indicate levels which have been assigned via rovibrational transitions (marked as connecting lines). Dashed bars mark levels which are tentatively assigned (via transitions which are shown as dashed lines) or predicted. Predictions of microwave transitions are also shown as dashed lines (MW). The K quantum number is indicated between the pairs of tunneling sublevels ( ] - 'v ib = A, B).

+ +
+ +
+ +
+ +
I I
I I
I I
I I
-r
~-4
o-
_ o.
"~
-.
t'~
-n
O_
~ O"
--~
D-
"r
--~
.....
0 -.
~ 0
--,
0 ..
~ 0
00
00
--
' --
' 0
0 O
0
.-'
..-'
00
~.
~ .-
' --
" "-
' --
" 0
0
O0
~,
,) ~.
~ ~.
,~ t
~
.-'
.-~
00
~~
o~
~
~~
oo
II
~D
0 r~
b,
:,4
.~
b,
~ ,-4
-.
v
~o
~
. .
__.L
co
~..)
o~
--,
'~
-~
~.;
~ ~
'~
~ o~
0
~.)
~ o'
~ ~-
; o0
.~
~
t~.)
o~
,,.o
~ --
, "~
o~
o
~ u-
, ~.
; ~.
~ --
, ~,
.; o
~-~
4~.
O0
(.,n
0 O
0 r,
~
~o
i~)
o~
.-,
-,~1
~11
~.)
~,
~ ~1
o'
~ --
~ ~-
~ o0
I~
.) 0o
~r
~ -'
"~
1 ~
~ --
' 0'
~ '~
0 -~
0
'~1
O~
0 I~
.~
~.m
~
-.."
--~
~.,~
0
~,.~
~
~ ~.
; ~
u-,
o u-
, ~
~.~
~ ~
.~
o0
o ".4
.~
~.
; .,~
~
.~.
--,
.~
~ ~
u-,
~ o0
~
~ ~
~ ~
~ ~
~ ~
~ ~
~ ~
b ~
~ b0
L,
.; ~
L,.;
~.
60
.~
b L,
.; Lo
~
L,.;
u-;
L,.;
~o
k;
o ~
o --
" u;
o
~,~
",,4
o'~
.~
0'~
~D
0
~~
~~
~o
~~
~~
~=
~
~o
o~
- ~
~ ~
~ ~
o~
o~
0
0~
~
~ ~
~~
~
~ ~
~ 0
~
~ ~
~
~0
~
~ ~
~ ~
~ ~
~ ~
~ ~
0 ~
~ ~
~ ~
~0
~
~ 0
~~
0~
~
~ ~
~ ~
~0
~
0~
~
~ 0
~0
~~
~~
0~
~~
~
~ ~
0~
0
~ ~
0
~ ~
~~
0
r~
..,..
~x
3
_-K
.~
r
r r "T
T
"1"1
3 o _,-~
.
o <
r r 3 r 3 i
o 3
>.
~0
.-I
Z ,0
C
N
-4
7 C
"T
3:

Spectra and Dynamics of (HF)n 221
Table 1. continued
Notes: atsvrdenotes tunneling splittings, harmonic wavenumbers to are given for comparison. The adiabatic (4+2)D approach is described and refined in refs. 107,108. Some v 3 assignments (marked ?) are difficult due to extensive mode mixing. See text and ref. 72 for details. bAccurate DQMC calculations 72 give v 6 = 378.6(8) cm -1 and AVr(V 6) = 1.85(30) cm -1 Cprobably too low by ---40 cm -1, see section 5.4 dDQMC gives Do~he = 1057.5(0.5)cm -1 on the SQSBDE surface. 1~
the barrier height alone. The width of the barrier and the coupling to the other vibrational modes are equally important, as illustrated in Figure 5. Even for closely related PES such as the series R 12-CP/SC-2.9/SO-3, the correlation between barrier height and tunneling splitting is counterintuitive. Rather than increasing with decreasing barrier height, the tunneling splitting APT even increases in the sequence. Other things remaining equal, the tunneling splitting will of course increase monotonically with decreasing barrier, until it converges to the appropriate free rotor level spacing. But this one-dimensional argument does not apply for a fully coupled potential. Empirically adjusted PES such as $2,159'16~ and to lesser extent the SNB 8'68'I05'106 and the 4D BH 53'1~ potential, have considerably lower barriers than ab initio calculations of appropriate quality. 72'87 Nevertheless, the predicted tunneling splittings are similar (Figure 5), while the recent ab initio based PES are much more successful for other experimental data. 72
The calculation of the ground-state tunneling splitting AP T on 6D PES of HF dimer was first achieved via DQMC methods, 76'12~ which provide a tight upper bound for this quantity, 1~ as the wavefunction node is nearly exclusively deter- mined by symmetry. 118 However, these results carry a relatively large statistical error bar (AP T = 0.4 + 0.4 cm -1, 0.45 + 0.15 cm -l for the SQSBDE surface 76'1~ unless correlated sampling techniques are employed. 161'162 For rigid monomers, i.e. on the 4D intermolecular PES, the excited wavefunction node is given exactly by symmetry, so that rigorous DQMC calculations are possible. 118 This can be ex- ploited in rigid-body DQMC calculations 163 of molecular clusters, 164 but in each case, one has to check carefully whether the node is really determined by symmetry alone. The 4D tunneling splitting of HF dimer has also been evaluated variation- ally 97'1~176176 in good agreement with the 6D and 4D DQMC results. 1~ Highly accurate 6D ground-state tunneling splittings for HF dimer have become available recently 94'96'16~ and confirm that the monomer zero-point motion has a rather small influence on the interconversion rate.
With respect to hydrogen bond interconversion, HF dimer is clearly in the high barrier limit. The ground-state splitting amounts to less than 2% of the low barrier limit of 2Bo ,76 where B 0 is the rotational constant of an HF molecule. Therefore, one expects that rovibrational excitation can have pronounced effects on the splittings and the experimental characterization of these effects is an ongoing

222 MARTIN QUACK and MARTIN A. SUHM
I ) EB/C hc cm- 400 -
380
360 i
340 .
320
300
280
260
24O
220
200 .4
BH
SNB
I;2
, , , , t , t , , J , , , , t , , , , i , , , , i , , , , v , , , , I , , , ,
.5 .6 .7 .8 1 A~T/Cm-
Figure 5. Correlation of the (HF) 2 ground-state tunneling splitting AV T with the electronic barrier height EB of hydrogen bond interconversion (Eq. 7) for various analytical PES. The lower left corner of the labels marks the corre- sponding values for the BJKLK, 117'159 SQSBDE, 76'94 R12-CP, 72 SC-2.9, 72 SO-3, 87 BH, 53'109 SNB, 8'68'105'106 and $2159'160 potential energy hypersur-
faces. The solid vertical line gives the experimental tunnelling splitting 4'118 and the hatched area denotes the currently best estimate for the barrier height. 72
challenge. Excited-state tunneling splittings known up to 1989 have been summa- rized before. 16'165 Figure 6 contains an updated graphical compilation up to the first HF stretching overtone (see also Table 1).
For the definition of the sign of the tunneling splitting we use the total vibrational symmetry of the state, Fvib, which can be either symmetric (A) or antisymmetric (B) with respect to monomer exchange (in addition to + o r - parity6'166). The splitting is defined as the energy of the B state minus the energy of the A state. Separation of the vibrational symmetry Fvi b into a contribution from the HF stretching symmetry ['stretch and a contribution from the tunneling symmetry Ftu n is possible in theoretical calculations but by no means trivial from a purely experi- mental point of view. 16'43'44'1~176

Spectra and Dynamics of (HF)n 223
2v^ [x5 ]
~ I Z / ' _ . Z - ' ~ _ _ _ _ ~ / / / _ . Z / t ' _ _ _ _ . , . ' i ' Z / J _ZIL'_ _ _ _ . . , , # ~ . , / ~
v A
'~'_ _ _ ~{-~_ _ _ . . , , d ' i i _~s-f_ _ _ _ A ' / / , / / - -
v D
v 0
i i
L. + v 4 +v 5 +v 6 +v 3
Figure 6. Trends 16'165 in experimentally measured tunneling splittings Vrvib=B- VFvib=A (vertical bars proportional to the splitting) as a function of hydrogen bond excitation (v4, v5, v6, w3, from left to right), as a function of HF stretch excitation (wD, VA, 2VA, from bottom to top) and as a function of rotational excitation around the A axis (quantum number K = 0 . . . 4, from front to back, indicated by horizontal hatched bars in perspective view). Black horizontal bars connect measured levels of the same vibrational state with different K, i.e. those which allow for a K-dependence analysis of the splitting. Downward vertical bars indicate negative tunneling splitting (Fvib), due to either antisymmetric stretch excitation (Fstretc h = B, as in vA) or due to an inverted hydrogen bond exchange doubling (]-'tun = A above ]"tun = B). The 2WA results 43'174 are magnified 5-fold to show the subtle switchover of tunneling sign between K = 2 and K = 3. Results for the tetrad with 3 HF stretching quanta 16'57'157'167 are not shown.

224 MARTIN QUACK and MARTIN A. SUHM
As illustrated in Figure 6, important gaps remain to be filled for hydrogen bond fundamental vibrations. 6'7'76 The v 4 tunneling splitting has been experimentally estimated to be larger than 2 cm -1 from a vibrational ground-state perturbation analysis. 76 For the v 5 vibration, only one tunneling level for K = 3 could be assigned. 7 HF stretching fundamentals (v D, predominantly involving the donor molecule, and v A, mainly involving the acceptor stretch), 16'53 first 16'43'44 and second overtones 16'57'167 are relatively well-characterized, although one member of each overtone polyad remains undetected. 43'157 Recently, several hydrogen bond vibrations built on HF 46'47 and DF 168 stretching fundamentals have been meas- ured and interpreted. While the results provide valuable predictions for the location of pure hydrogen bond vibrations in the far-infrared and information on the inter-intramolecular coupling, the splittings cannot be easily extrapolated to the HF stretching ground state. This has to do with a general hindrance of the interconversion process by monomer excitation 16'53 (see Figure 6), also found in other dimers. 169'17~ Several mechanisms for this vibration-induced slowdown of tunneling have been proposed. 16'21'53'158'167'169'171'172 Basically, these fall in two
categories"
1. HF stretching excitation stabilizes the dimer, as directly evidenced by the shift of the corresponding monomer vibrations to lower frequencies in the clus- ter. 16,53 This stabilization may be less pronounced near the interconversion barrier, hence leading to a larger barrier and a smaller tunneling splitting. 173 Adiabatic (4 + 2)D calculations on existing potential energy surfaces do not seem to support this interpretation. While there are adiabatic barrier effects, they are not sufficiently pronounced nor are they systematically reducing the splitting. 1~ Furthermore, full 6D calculations 95 on the same PES suggest that the splitting reductions must be also due to other effects. The situation is by no means simple because of many possible definitions of effective adiabatic tunneling potentials.
2. During interconversion, HF stretching excitation has to be transferred from one monomer to the other (see Eq. 7). This leads to adiabatic diagonal corrections 158 and diabatic effects 169 whenever the two monomers are excited by different amounts. In essence, the character of the wavefunction changes quickly in the vicinity of the barrier, introducing an additional dynamical bottleneck. An excellent experimental test of this model might be the as yet unobserved tunneling splitting in the state with one HF stretching quantum in each monomer, 16'43 which should only exhibit adiabatic effects relative to the ground-state splitting of 0.66 cm -1. 6D calculations indeed predict this splitting to be relatively large 95 for the SQSBDE surface. Furthermore, a state with three stretching quanta distributed over the two monomers 57 exhibits a substantially larger experimental tunneling splitting than states where all three quanta are localized in one monomer. 57 It seems possible, and perhaps even likely, that both effects, the general tightening of the hydrogen bond and the extra dynamical effects due to restricted vibrational energy exchange, as
Spectra and Dynamics of (HF)n 225
well as other, more complicated phenomena, contribute to the reduction of the tunneling splitting upon HF stretching excitation.
Building upon the early observations of the N = 153 and the N = 2 and 3 polyads, 16 several groups have recently contributed to experimental progress in measuring various HF stretching excited levels and tunneling splittings. 43'44-47'57'67'174 The experimental situation is thus fairly clear. However, there seems to be no simple model predicting the experimental observations.
The accurate prediction of tunneling splittings in these highly excited states is a considerable challenge. This includes the analytical PES representation, as rela- tively subtle couplings are involved. In some cases, such as for the state with two quanta in the free HF stretch, 16'43'44 the tunneling splitting is even reversed with respect to several earlier theoretical calculations. 44'72'95'I~ A sufficiently refined PES should be able to reproduce and explain this qualitative anomaly, which depends on the K-rotational state 16'43'44'174 (see Figure 6) and for which possible causes have already been discussed. 16'44 The exact quantum dynamics on the recently published SO-3 potential 87 seems to correctly reproduce the experimental observations, 96 which have defeated the previous attempts of simpler explanations.
Although tunneling splittings are particularly sensitive probes of the accuracy of a PES, one should not rely exclusively on them. For example, the empirically refined 50-3 87 and SC-2.972 surfaces, the purely ab initio BJKLK surface, 117 and the $2 surface, 151 which was refined specifically along the tunneling coordinate, all perform quite similarly for a set of six known tunneling splittings with various degrees of HF stretch excitation. 96'159 However, the BJKLK and, in particular, the $2 surface are too flat in the librational degrees of freedom. Furthermore, the $2 surface 16~ clearly underestimates the low-frequency bend and even the tunneling barrier. 72 Thus, a PES should ideally be judged by its overall performance in comparison to as many different experiments as possible, rather than by results for a specific property. Equally important, accurate dynamical methods must be employed for judging fine details, since approximations can lead to error compensations generating a fortuitous deceptive agreement between experiment and theory. The latter did happen for the ground-state tunneling splitting 116 and perhaps also the K-rotational excitation of the out-of-plane bending mode 76 (see Section 5.4).
5.3. Hydrogen Bond Dissociation
The breaking and making of hydrogen bonds is at the heart of biochemical processes, condensation and evaporation phenomena, and other important proc- esses. Hence it deserves particular attention in the simple prototype (HF) 2. With the accurate experimental determination of the dissociation energy 175'176 of (HF) 2,
= 48 76 177 178 D o 1062 + 1 cm -1 and the extension to mixed isotopomers, ' ' ' useful benchmarks for high quality dimer PES have become available via DQMC and Eq.
72 87 6. These are matched in our recent SC-2.9 and SO-3 pair potentials, ' and even

226 MARTIN QUACK and MARTIN A. SUHM
the less accurate SQSBDE PES has been of some help in the experimental assignments. 48'178 Our best prediction of the as yet unmeasured (DF)2 dissociation energy would be 1175 cm -1, with an estimated uncertainty of +5 cm-1. 72'87
Despite obvious quantitative limitations, a one-dimensional picture of dissocia- tion can have its merits. Such a one-dimensional picture should however include the zero-point energy of the remaining vibrational modes, i.e. it should be based on adiabatic channels. 76'113,132,179 As discussed in Section 4.2, the DQMC method lends itself very well to the construction of selected adiabatic channels, 76 and this principle has been adapted for other systems as well. 129'18~ In the case of the dimer, adiabatic channels are also generally accessible from variational calculations. 1~176 Via such an adiabatic treatment, the F-F stretching fundamental has been success- fully predicted near the experimental location of 125(5) cm-1, 76 which is also confirmed by extrapolation from near-infrared combination band spectroscopy. 46
The manifold of adiabatic channels without HF stretch excitation determines the thermal dissociation kinetics of (HF) 2, which has not yet been studied experimen- tally in any detail. 8'181 Much more attention has been devoted to photochemical (pre) dissociation of the dimer ever since the first high-resolution HF stretching spectra 5 and a multitude of state-specific predissociation data have been collected since t hen . 16'43'44'46'47'53'57'59'155,176,177,182-187 It is found that predissociation in
(HF) 2 is sensitive to rotational, tunneling, HF stretching, and hydrogen bond mode excitation, with lifetimes ranging from a few ps to more than 20 ns. Several simplified models 59'167,188-191 have been proposed, but none of them is able to explain all the data. In this situation, multidimensional golden rule 97 and time- dependent 9s predictions should prove very useful 99 when combined with suffi- ciently accurate PES. 72'87 Together with detailed photofragment distributions, 176 the predissociation lifetimes provide very sensitive tests of the accuracy of the PES beyond the regions of configuration space which are probed by the hydrogen bond fundamental vibrations. Preliminary results, based on the early SQSBDE surface, 76 are quite promising. 97
5.4. Hydrogen Bond Libration
When a hydrogen bond is formed, the engaged hydrogen atom becomes con- strained within the plane perpendicular to the bond. In principle, this gives rise to a degenerate pair of vibrational degrees of freedom, called librations. Due to a small departure of the hydrogen bond from linearity and due to the nonlinear arrangement of the second hydrogen in HF dimer, the degeneracy is lifted and one can distinguish an in-plane and an out-of-plane libration. The out-of-plane libration vl~ was the first hydrogen bond mode to be detected and assigned experimentally ~' in (HF) 2 at rotational resolution, and the initial K = 1 assignment has been extended to K = 2165 and tentatively also to K = 3, 76 the latter being based on approximate calculations without supporting rotational analysis of the spectrum. Here K is the quantum number for rotation parallel to the librational plane, i.e. around the F-F axis. Around

Spectra and Dynamics of (HF)n 227
this axis, rotation is strongly quantized in HF dimer due to the absence of heavy off-axis atoms. 53'173 This also explains the strong K dependence of the tunneling splitting, since centrifugal forces push the equilibrium geometry towards the interconversion saddle point 53'173 (Figure 6). The in-plane libration v 3 was the last hydrogen bond mode to be found experimentally, until today only in combination with an HF stretching mode. 47 For both librations, the K = 0 fundamental band origin remains unknown. The smooth behavior of the K = 1, 2, 3 levels of v 6 suggested an extrapolated K = 0 band center of ~6 = 380 cm-l. 76'1~ This was apparently supported by approximate DQMC calculations (neglecting Coriolis couplings 76) of the K = 1,2, 3 levels for the SQSBDE surface in excellent agreement with experimental data. 76 On the same PES, exact DQMC calculations of K = 0 yield I~ 6 = 378 cm-l. 76 However, variational calculations 97'1~ reveal a complex Coriolis coupling situation for K > 0 with pronounced level shifts, while they confirm the rigorous DQMC prediction for K = 0. The coupling is actually so strong that it pushes the K = 1 level below the K = 0 level (see Figure 4), a remarkable and rarely found situation, 192 which had been discussed as a possibility for HF dimer spectra assignments before, 6'193 but without definitive conclusions. Hence, it turns out that inaccuracies in the SQSBDE surface 76 and the underlying ab initio data base 75 are compensated by neglect of Coriolis coupling in the excited K states, a notion which is supported by isotopomeric dissociation energies 48'177 and high- level ab initio predictions. 7~ The new SC-2.9 and SO-3 PES, which are based on a much larger ab initio basis set than SQSBDE, predict a more anisotropic librational subspace. Now, a much higher v 6 fundamental band c e n t e r I~) 6 -.- 420 cm -1 is found to be compatible with the observed K > 0 states 17'72 as well as with combination band data. 47'72'1~176 The K = 0,1 level inversion persists and is thus
seen to be a robust feature of the various (HF) 2 PES. In contrast, the K = 1 v 6 tunneling splitting is found to be very sensitive to details of the PES, differing by a factor of 5 between SQSBDE and SC-2.9 and still by about 20% between the very similar SO-3 and SC-2.9 surfaces. 72'87'96 We note that a band near 380 cm -l, which several plausible assignments have been proposed, 6'76 may involve the missing K = 0 level of V 6 in a AK = -1 transition from the vibrational ground state. This and the missing direct evidence for the v 3 fundamental near 480 cm -I suggest an experi- mental reinvestigation of the relevant far-infrared region, which is currently underway in our laboratory by improved FTIR-long path cell absorption techniques.
6. SPECTROSCOPY AND DYNAMICS OF THE HF TRIMER
Given a sufficiently complete characterization of the HF dimer spectroscopy and quantum dynamics, the trimer (HF)3 offers the unique opportunity to extract and evaluate three-body contributions to hydrogen bonding. 8'6s Although the number of internal degrees of freedom is doubled relative to the dimer, the C3h symmetry of this cluster should assist a rotationally resolved spectral analysis. Nevertheless,

228 MARTIN QUACK and MARTIN A. SUHM
relatively little is known experimentally about the gas-phase IR spectrum of (HF) 3 and its isotopomers. A comprehensive predissociation study with isotopic substitution 64 indicates that (HF)3 can decay into three monomers as well as into a dimer and a monomer upon excitation of the HF stretching fundamental. From the isotopic substitution pattern, a cyclic structure with C3h symmetry can be inferred, but rapid intramolecular vibrational redistribution (IVR) and predissocia- tion on a 2-20 ps timescale preclude an accurate structure determination. 64 DQMC calculations on a full-dimensional PES including the three-body term 68 confirm that two predissociation channels are open to (HF) 3 after HF stretch excitation, with the three-monomer channel being almost closed for cold clusters, as generated in a supersonic beam. This changes with successive deuteration, 68 and no open predissociation channel is finally predicted for (DF)3 .68 Again, the prediction is borderline, with the dimer + monomer channel being nearly open. However, subsequent improvements in the PES 72'89 confirm the prediction, whereas neglect of anharmonic zero-point contributions or neglect of three-body effects would reverse it. 68
In order to test the cluster stability and structure predictions made by the PES, a high-resolution IR spectrum of the DF stretching fundamental of (DF) 3 was recorded. 31'45 It consists of a dense line pattern including Doppler limited lines, indicative of excitation below (or at best very slightly above) the lowest dissociation channel. From the coarse-grained spectral structure, the cluster symmetry, planarity, and rotational constants can be derived. These are in good agreement with the predictions on the three-body inclusive PES, if (and only if) multidimensional zero-point averaging is taken into account. 31'68'194 The resulting F - F distance is 257-260 pro, where the uncertainty is dominated by possible anharmonic Coriolis contributions to the effective rotational constants. This is significantly shorter than the corresponding estimate for HF dimer 8'72 of 273.5 + 1 pm, in line with the important role of three-body contributions. In addition to providing a crucial test for the quality of the available three-body PES, the experimental spectra contain evidence for a rapid IVR process on a time scale of about 40 ps, 45 apparently involving essentially all available rovibrational states of a given J quantum number and therefore a multitude of states with up to nearly two hydrogen bonds broken. This is an interesting example of highly "statistical, global ''195 rovibrational dy- namics near dissociation threshold, for which quantum-dynamical calculations remain to be performed.
Little is known experimentally about the low-frequency modes of (HF) 3. An IR double-resonance study provides evidence for two overtone states in the CO 2 laser range, which were tentatively assigned via reduced dimensionality calculations. 65 For the fundamentals themselves, approximate DQMC calculations were carried out on the older PES. 68 They suggest that the anharmonic band centers lie 15-25% below the corresponding harmonic frequencies, although this may change some- what for the new SO-3 + HF3BG surface. Noteworthy is an inverse isotope effect for the F - F stretching vibration VFF in (HF) 3 and in (DF)3 (I~FF[(H~3] <

Spectra and Dynamics of (HF)n 229
(P~[(DF)3]), found in matrix spectra 196 and confirmed by calculations on the PES. 31'68 Harmonic predictions on the PES 8 are in good agreement with high-level ab initio benchmarks, 154 although both harmonic force fields may still be in error by several percent and experimental data would be highly desirable.
The experimental study of the trimer is complicated by the lack of substantial amounts of this cluster in the gas phase because its high ring strain leads to a relatively low stability compared to the tetramer and pentamer. 8'31'69 In fact, at and slightly above room temperature the rings are predicted to be broken up to open chains to a significant degree. This is not the case for the larger ring clusters, on which we will concentrate in the next section.
500
0
! E -500 u
o -I000
\ -1500
-2000
-2500
-3000
-3500
t l
I I I I I I
�9 /
/
0 500 1000 1500
R/pm
Figure 7. One-dimensional minimum energy path (dashed) and (HF)3 (up- per), (DF)3 (lower full curve) lowest adiabatic channels for dissociation into a dimer and a monomer, obtained from the SNB + HF3BL PES 68 via clamped coordinate DQMC. R is the distance between monomer and dimer centers of mass. All channels are referred to zero for infinite separation. Dashed lines with positive energies represent the zero-point energy along the path (upper: H; lower: D isotopomer) and the fine dashes represent an exponential fit 113 with c~ = 0.45/~ (see also ref. 76).

230 MARTIN QUACK and MARTIN A. SUHM
Dissociation of the trimer may occur in two steps. For illustration, we show in Figure 7, the lowest adiabatic channel VQ(R) for fragmentation of the trimer (HF) 3 leading to (HF)2 + HF as a function of center-of-mass separation R of the two fragments. 68 Also shown is the correspondingly steeper channel for (DF)3, which explains the inverse isotope effect discussed above. These one-dimensional chan- nels include the effective anharmonic zero-point motion of all but the reaction coordinate (R) modes. The inflection in the outgoing channels marks the breaking of one hydrogen bond to form a floppy chain, followed by a steeper increase of the energy when the second bond is broken. According to the analytical PES and DQMC calculations along this reaction path, there seems to be no electronic or zero-point energy barrier for the reverse formation of the trimer out of a dimer and a monomer. However, other reaction paths are conceivable for this complex and may involve such a barrier. We note that the recombination (HF) 2 + HF --o (HF) 3 is special in the reactant (I-W)2 having an open chain structure, into which HF can insert directly without breaking a hydrogen bond. The process is less simple for the larger clusters.
0 SPECTROSCOPY AND DYNAMICS OF HIGHER HF O L I G O M E R S
It is now well established that larger oligomers (H~n_<6 have a planar or nearly planar ring structure. 8 HF ring clusters of larger size have been postulated for decades to account for the unusual properties of the HF vapor phase. 3'197-199 Without going into the historical details, we emphasize that the preeminent role of the hexamer in this context should be viewed more as that of a representative for a range of three to four important medium-sized clusters, 9 rather than as a singularly abundant species such as S 8 in elemental sulfur chemistry. We will not deal with thermodynamic vapor-phase data 198'2~176 which provide rigorous tests of the avail- able PES, if both the data and the dynamical analysis are sufficiently accurate. 9'76 Rather, we concentrate on the size-specific spectroscopic evidence which has accumulated over the past years and which has given rise to some controversy, recently. 41'42'52'61'2~ 1-204
7.1. Experimental HF Stretching Spectra as Assigned to Different Cluster Sizes (HF)n
Forty years ago, recognizing the power of IR spectroscopy in elucidating the dynamics of HF clusters, Smith 15 recorded equilibrium spectra of HF vapor in a wide range of temperatures and pressures. While both the librational and the HF stretching region were studied, the latter is most conclusive in terms of cluster composition (Figure 8). Two strong, broad, overlapping bands were found consid- erably shifted to lower frequencies with respect to the free monomer transitions around 3961 cm -l. From the pressure dependence of the IR absorption on the outer

Spectra and Dynamics of (HF)n 231
wings of the bands (see Figure 8), Smith concluded that the band to lower wavenumbers is due to (H~ 6 and the one at higher wavenumbers due to (HF) 4. While Smith's early results could be experimentally confirmed by more recent FTIR-spectroscopy of HF vapor under equilibrium conditions at various tempera- tures in cells16(Figure 8), questions arose concerning the assignments of the cluster spectra. In the light of more recent theoretical calculations of the energetical and spectral properties of these clusters, 67'68 based also on our dimer PES 76 comple- mented by a three-body term, 68 the most puzzling fact was the apparent absence of evidence for the intermediate pentamer, (H~ 5, while the existence of only one IR-active band per cluster can be easily explained by the C,h symmetry. 41'67
This provided the motivation for recording HF cluster FTIR spectra under supersonic jet conditions to reduce inhomogeneous broadening. 41 Earlier molecular beam spectra of HF clusters 49'62 had been too far away from the thermodynamical vapor-phase composition to be useful in this context. By choosing a wide range of expansion conditions (backing pressure, dilution in He, nozzle distance) it is possible to smoothly reduce spectral congestion without losing track of the thermal equilibrium spectra. 41 The jet spectra reveal an additional band, hidden under- neath the inhomogeneous double-hump structure of the cell spectra (Figure 8). Upon cooling, all band maxima shift to lower wavenumber, thus allowing an
2 G2 u
o ~ 5 9 .
..D
32~00 ' ' .34'00 " 3E '00 ' 38 ' 00 ' 4 0 ' 0 0 ' -!
~/cm
Figure 8. Comparison of cooled cell ls'16 and early He-seeded jet FTIR spectra 41 of HF. In the cell spectrum (7"= 264 K) one can see rotational lines of HF (1), subbands of the dimer (2), a weak trimer absorption (3), HF-H20 impurities and two broad bands ('4', '6'), assigned by Smith to the tetramer
41 and hexamer of HF. 15 Two jet spectra with expansion temperatures of =200 K (middle) and =150 K (lower trace) illustrate considerable thermal shifts of the large cluster bands and reveal an additional band (5), which we assign to the pentamer. 41

232 MARTIN QUACK and MARTIN A. SUHM
approximate extrapolation to the 0 K homogeneous band structure. By adopting Smith's pressure-dependence results, by considering the dependence of the band intensities on expansion conditions, and by comparing to matrix isolation spec- tra 196'2~ and harmonic ab initio frequency shift predictions relative to the monomer as a guidance, we tentatively proposed the cluster size assignment shown in Figure 8, namely a tetramer band near 3445 cm -1, a pentamer band at 3300 cm -1, and a hexamer band at 3245 cm -1, all of them most likely HF stretching fundamentals. 41
This assignment was later challenged 2~ by a combined predissociation-scattering investigation based on the powerful "size-selective" technique of Buck and Meyer 2~ with some modifications. 61 Through a combination of mass-spectroscopic detec- tion with He beam scattering, the ambiguity due to cluster ion fragmentation in the mass spectrometer is minimized. Basically, a size assignment shifted by one monomer unit is proposed 61'2~ as compared to ref. 41, i.e. the band originally assigned to (HF)5 is claimed to be due to (HF) 6 etc. A (HF) 4 band near 3636 cm -1 can be unambiguously identified, whereas no band is found at 3445 cm -1 to be assigned 41 the tetramer. Slightly shifted from that position, near 3453 cm -l, and in close vicinity of a power gap in the dissociating laser, a band is found and assigned to the pentamer based on its scattering angle dependence, which clearly differs from that of the 3636 cm -l band. Building on this, the lower frequency predissociation bands, which agree in position with the FTIR spectra, 41 are assigned to the hexamer (3300 cm -1) and heptamer (3245 cm-l).
In contrast, our own FTIR reinvestigation of the spectra, resulting in much better signal-to-noise ratios through the use of the synchronously pulsed technique, 9'42'52 confirms our original assignment (Figure 941). Furthermore, we suggest a plausible interpretation of the previously unassigned bands in terms of combination bands with a totally symmetric ring breathing vibration, 42'2~176 in excellent agreement with extensive theoretical calculations 42 and with additional support from deutera- tion experiments. 52
In our view, the key problems of the ( H ~ n predissociation-scattering experi- ment 61'2~ and our suggested explanations are the following:
1. The (HF)4 band near 3636 cm -1 is most likely not due to a fundamental HF stretching transition. We suggest that it is a combination band, 42 such as the ones we find for (HF)5 and (HF)6, in excellent agreement with theoretical and far-infrared 9 evidence.
2. The "pentamer band" near 3453 cm -l in the predissociation experiment falls in between the FTIR tetramer fundamental at 3445 cm -1 and the FTIR pentamer combination band near 3470 cm -l. We suggest that it continues into the laser power gap and that it may in fact be largely identical to the FTIR combination band.
3. There is no band in the predissociation spectrum coinciding with the FTIR tetramer band at 3445 cm -1. We suggest that the cold tetramer gives a negligible predissociation signal because it is probably slightly below dissociation threshold after excitation near 3445 cm -1 (in analogy to the (DF) 3 case31'45'68), 17'41'42 as

Spectra and Dynamics of (HF)n 233
illustrated in Fig. 10 below. Collision with He atoms for the purpose of size selection
may induce fragmentation of the highly vibrationally excited clusters, but the
resulting angular scattering distribution for successful fragmentation events will
lack contributions at maximum angle due to the inelastic nature of the dissociative collision. 42 Thus, the tetramer may appear to have a larger kinematic mass. This is
what one finds experimentally--an angular distribution between that of a tetramer
and that of a pentamer. 4. The size assignments for the larger clusters (n > 4) in the predissociation-
scattering experiment 6]'2~ essentially build on the assignment of the 3453 cm -]
band and may have to be revised accordingly.
We propose to repeat the scattering experiment with a warmer expansion (e.g. in He 2~ and to close the laser power gap. 2~ The resulting spectra should be able to
test our tentative interpretation, which appears to be the only one which is able to
explain all available data. Alternative explanation attempts based on branched
structures 2~ or based on a fundamental HF stretch assignment of the 3636 cm -1 band 61 cannot explain the available experimental evidence 4'52 nor are they compat- ible with reliable theoretical results. 9'42'68
v.r 713 5
(.2
..O
C~ (J3
~ V p T
-Vrr B 5
+2v~
- I w ) ! i i
30'00' ' '32'00' ' '34'00' ' '36'00' ' 3800 40'00 -I ~/cm
Figure 9. Synchronously pulsed jet FTIR spectrum s2 of HF diluted in He under conditions where (HF)n with n = 5, 6, 7 dominate the structured part of the cluster absorption. Compare also to Figure 8. In addition to fundamental HF stretching modes (VHF) , combination (+VFF, possibly +21~FF) and difference bands (-I~FF) , presumably with the totally symmetric FF stretching band, 9'42's2 can be seen. There is no need to invoke other than simple ring structures for the structured absorptions in the spectrum, while the broad background may
41 be partly due to isomers ,42,203 or larger clusters. 41

234 MARTIN QUACK and MARTIN A. SUHM
While the only IR active HF stretching vibration in the planar cyclic HF clusters is the lowest degenerate (E) mode, 41'67 Raman spectroscopy can be used to detect the totally symmetric (A) HF stretching mode, which is part of the reaction coordinate for simultaneous exchange of all hydrogen atoms between adjacent fluorine atoms (see Section 7.5 and Eq. 8 below). Supersonic jet Raman spectra for HF clusters are not available, but the experimental difference between the IR active E and the Raman active A band maxima is = 160 cm -1 at room temperature. 15'37 This is consistent with theoretical predictions at harmonic level 42'69 in view of the large thermal and anharmonic effects, a!
7.2. Stretching Frequency Shift Predictions
The controversial assignments discussed in the preceding section demonstrate the importance of reliable frequency predictions for the correct assignment of IR spectra of hydrogen bonded clusters. 41'42'52 The wavenumber shift A~ = PHF (H~ - ~HF ((I-IF)n) of the HF stretching vibration relative to the isolated HF molecule is most useful, because it depends strongly on cluster size. This shift is typically to lower wavenumbers for hydrogen bonds. AI~ as defined is thus positive. Three levels of treatment may be distinguished:
1. The harmonic approximation (At0), which considers the local curvature at the cluster minimum and compares it to that of the free monomer. It is most popular in ab initio investigations because it can be obtained at relatively little extra cost and because it is apparently quite successful. 69'75'154
2. A combined anharmonic treatment of the high frequency HF stretching degrees of freedom, while the intermolecular coordinates remain clamped to their minimum energy values. This approximation is sometimes used for one or two high-frequency modes, 21~ whereas it becomes more demanding for a larger number of coupled anharmonic oscillators 211 such as in ( H ~ n with n _ 3. 42 For these, we find that the anharmonic diagonal corrections can be quite large, increasing the shifts by 15 to 35%. 42
3. Zero-point energy along the low-frequency hydrogen bond modes, in par- ticular along the librational coordinates, weakens the effective interaction between the monomers. This indirect mode coupling is neglected in the harmonic approxi- mation. Some qualitative aspects can be captured by a modification of the cluster geometry at which the harmonic approximation is applied. 212 More rigorously, the zero-point motion can be included adiabatically via DQMC bath treatments or by full-dimensional variational calculations. 72'94'1~ The effect for HF clusters is to reduce the wavenumber shifts by about 10 to 30%, thus approximately compensat- ing for the diagonal anharmonicity effect discussed in 2 above.
In combination with systematic basis set and correlation errors, 69'72 the effects mentioned under 2 and 3 explain why simple harmonic treatments according to 1 are often surprisingly successful in predicting fully anharrnonic experimental

Spectra and Dynamics of (HF)n 235
frequency shifts, in particular once they are scaled or designed to reproduce experiment for a given cluster size. One should not interpret this success of the harmonic approximation as evidence for harmonic behavior in hydrogen bonding.
7.3. Intracluster Vibrational Redistribution
After HF stretching excitation, most HF clusters have two pathways available for the redistribution of the deposited energy 16 (see ref. 36, 213 for conceptual aspects). The energy may flow within the HF stretching manifold and into bound hydrogen bond modes (intramolecular vibrational redistribution, IVR) or it may lead to dissociation of the cluster, i.e. it may partially flow into fragment translation and rotation (predissociation, PD). In the HF dimer, predissociation in N = 1 or N = 2 stretching manifold cannot be described as a sequential process of IVR followed by dissociation, because the density of quasibound rovibrational levels is too low. 16 It is thus "direct" or semidirect with off resonance intermediates. 214 This gives rise to highly nonstatistical rates, as discussed above (Section 5.3). In the larger, more strongly bound and more strongly coupled clusters, direct predissociatilon after HF stretching excitation is also an option in many cases, at least energetically (see Figures 10, 11). However, there are indications 45'52'64 that in these systems disso- ciation may typically be preceded by fast and extensive IVR processes, the disso- ciation process would thus be sequential. It is conceivable but by no means certain that the second step of dissociation can be described by statistical theories. 215
From the widths of the (HF), and (DF), absorptions with n = 5 to 7 recorded in a supersonic jet 42'52 (Figure 9) one can derive 0.3 ps as a lower bound for 17IV R after HF (DF) stretching excitation. This is most likely a speedup of IVR relative to (HF) 3 (2-20 ps) 64 and (DF)3 (40 ps). 45 While there may be residual contributions to the widths such as inhomogeneous structure and direct predissociation (in the case of (HF)n, see Figure 10), there is evidence that these are not dominant, 52 although vibrationally inhomogeneous structure is difficult to exclude in the jet expansions. Matrix isolation spectra at low temperatures 2~ exhibit bandwidths comparable to those in the supersonic jet, but here, the possibility of inhomogeneous broadening due to the matrix environment has to be considered. A decay time of 0.3 ps can be compared 216 in magnitude to macroscopic sound propagation across a single hydrogen bond distance of 150 pm in liquid HF, which is among the liquids with a particularly low speed of sound. 217 However, vibrational energy migration by sound is not identical to IVR. Further experimental and theoretical investigations will be required before a definitive confirmation and explanation for this apparently very fast IVR process can be given. The great increase in the rate of IVR in (HF)~4 compared to (HF)3 can be associated with a systematic increase of the highest low-frequency modes in the larger clusters, which breaks the adiabatic separation of high- and low-frequency modes.

236 MARTIN QUACK and MARTIN A. SUHM
Do/ hc cm -~ ]
4000 ....+....~
3500 "" ' "
3000
2500
2000
1500
1000
500
A
2 3 4 5 6 7 8
~HF/Cm -t
4000
3500
3000
2500
2000
1500
I000
500
0 n
Figure 10. Comparison of best estimates for the stepwise dissociation energy ADo (left scale, E3) according to (HF)n ~-- (HF)n-1 + HF with the IR active fundamental excitation wavenumber FHF (right scale, +; for n = 2 the average of the two IR active bands is chosen, for n > 5 the strongest band is shown) according to current assignment 41'42'53'64 as a function of cluster size n. Where Do/hc is above PHF, the cold cluster is stable with respect to single- photon excitation. This is probably the case for (HF)4.
7.4. Cluster Isomerization
With increasing cluster size, the number of possible (H~,, isomers and their interconversion pathways grows quickly. For HF trimer, these are briefly summa- rized in Figure 6 of ref. 9. Starting with the tetramer, the number of isomers consisting of smaller rings with attached side chains grows quickly with size. 42'68'203 They may play a dynamical role as intermediates in cluster growth 9 and hydrogen bond isomerization processes, 17 but thermodynamically they are not competitive with simple ring structures up to at least the hexamer, For even larger cluster sizes,
9 68 sandwich structures of two and more ring clusters become competitive.' Our strategy to characterize cluster isomerism is to combine Monte Carlo searches with deterministic minimizations on the inexpensive analytical PES, with subsequent
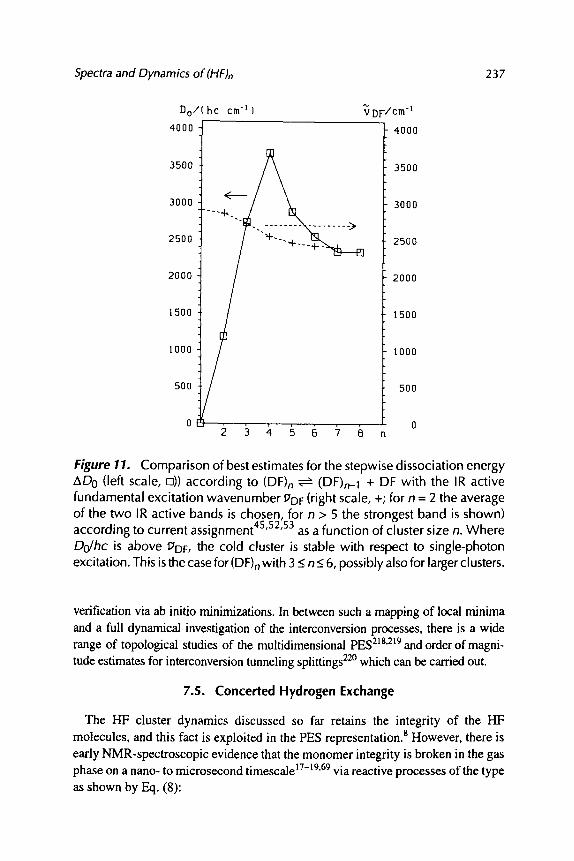
Spectra and Dynamics of (HF)n 237
D o / ( h c cm - t )
4000 -I
3500
3000
2500
2000
1500
I000
500
~D: - / cm -t
--+._
4000
3500
3000
2500
2000
1500
I000
500
0 F , 0
Figure 11. Comparison of best estimates for the stepwise dissociation energy ADo (left scale, o)) according to (DF)n ~ (DF)n-1 + DF with the IR active fundamental excitation wavenumber PDF (right scale, +; for n = 2 the average of the two IR active bands is chosen, for n > 5 the strongest band is shown) according to current assignment 45'52'53 as a function of cluster size n. Where Do/hc is above PDF, the cold cluster is stable with respect to single-photon excitation. This is the case for (DF)n with 3 < n___ 6, possibly also for larger clusters.
verification via ab initio minimizations. In between such a mapping of local minima and a full dynamical investigation of the interconversion processes, there is a wide range of topological studies of the multidimensional PES 218'219 and order of magni- tude estimates for interconversion tunneling splittings 22~ which can be carried out.
7.5. Concerted Hydrogen Exchange
The HF cluster dynamics discussed so far retains the integrity of the HF molecules, and this fact is exploited in the PES representation. 8 However, there is early NMR-spectroscopic evidence that the monomer integrity is broken in the gas phase on a nano- to microsecond timescale 17-19'69 via reactive processes of the type as shown by Eq. (8):

238 MARTIN QUACK and MARTIN A. SUHM
~ (8)
Reliable ab initio predictions of the barriers for such concerted hydrogen exchange processes are quite demanding, as electron correlation and basis set requirements are very high. 69 The best available data hint at a zero-point energy corrected barrier of 40 + 10 kJ mo1-1 for both the tetramer and the pentamer, 17 with smaller clusters having substantially higher barriers. 17'69 This barrier size is consistent with experi- mental rate data, 18 even without tunneling corrections, which may be quite signifi- cant in these systems. 221'222 More detailed kinetic predictions will have to wait for analytical PES 8'223 or new interpolation techniques 224-227 which can describe the exchange process, for appropriate reduced dimensionality treatments, 69 or for accurate on-the-fly dynamical evaluations. 221 Experimentally, there is so far no evidence for the exchange process from infrared spectroscopy, 52 although high- resolution far-infrared spectroscopy may be able to resolve the associated split- tings. 14'24 On the NMR side, a reinvestigation of the gas-phase dynamics at low temperatures and pressures might be rewarding. 17
In the context of the preceding section, it should be emphasized that HF stretching excitation in HF oligomers is close to the threshold for hydrogen exchange for n > 4. This can be seen in relation to the rapid IVR observed in these bands, 52 although many dynamical aspects have to be considered.
8. HYDROGEN FLUORIDE NANOCLUSTER DYNAMICS
The (HF),, clusters discussed so far may be considered "natural" as they constitute a substantial fraction of the vapor phase at thermodynamic equilibrium, 9'41 under typical cell conditions. 16 Supersonic jet expansions offer the opportunity to generate even larger clusters by increasing stagnation pressure. The HF stretching spectra observed under these expansion conditions change qualitatively, as shown in Figure 12. The low-pressure expansion is dominated by medium-sized ring clusters, as discussed in Section 7.1. At higher pressures, two strong, broad bands emerge at lower and higher wavenumbers. These bands have no correspondence in the gas-phase spectra of HF nor do they coincide with the broad, unstructured band of liquid HF at room temperature. 228 However, they correspond quite well to the symmetric and antisymmetric HF stretching bands in solid HF, 229 both in band position and in relative intensity (Figure 12). Only the lower frequency band is slightly shifted to higher wavenumber in the cluster spectra. It thus seems that these clusters have a solid-like structure.
Solid I-IF is known to consist of infinite hydrogen-bonded zig-zag chains. 23~ Interaction between the chains is weak and their relative dipole orientation has been controversial but is now known to be parallel, TM at least for DE Thus, solid HF may

Spectra and Dynamics of (HF)n 239
' s ' ' ' k . . . .
. . o
rO 3 . 5 b a r ' ~ " ' - " ~ - . . . . . . . . . . t _ J . . _ l _ _ _ l
7 A 5 c . . . . . . . . . . . . . .
0 5 bar xlO -- I .... . c ~ ,, , - ' , . - - , , , . . - ;-~ ) _ - --j- ,
3000 3200 3400 3500 3800 -I 9/cm
Figure 12. Jet FTIR spectra of HF expansions in He, with backing pressure and dilution increasing from the bottom to the top. The ring cluster bands visible at low pressures (marked with a number for fundamentals and with a superscript c for combination bands according to our assignment) vanish in favor of two broad bands (SN, AN) which correspond closely to solid state absorptions (indicated with S, A). For details see ref. 52.
be the chemically simplest ferroelectric. 232 The IR spectrum is dominated by the strongly coupled hydrogen bonds within the chains, which give rise to an unusually large splitting between the fully symmetric (in phase) and pairwise antisymmetric (antiphase) HF stretching fundamentals. 229 The slow convergence of these funda- mentals and in particular of the low-frequency component with chain length has been studied in detail, 233 and we give a further illustration of this in Figure 13. The spectrum of a single HF molecule embedded in a chain of DF molecules shows a less pronounced chain length dependence (Figure 13), in agreement with experi- ment. 52
It is tempting to interpret the experimental shift of the cluster band (SN) relative to the solid (S, Figure 13) as a measure of chain length, but there could be other reasons such as crystalline disorder. From the absence of pronounced scattering contributions to the spectrum, one ,nay however conclude that the cluster size is clearly below 1 lxm. On the other hand, a subnanometer size should give rise to larger deviations from the solid spectra due to surface effect, 234 hence the designa- tion "nano(meter)crystalline" appears to be appropriate. 52
The nanocluster phase 235 deserves further attention. During aggregation, these clusters are most likely liquid because of the release of condensation energy. Due

240 MARTIN QUACK and MARTIN A. SUHM
(D
{.3
r
c3 {.r)
._C) cO
IHFI 4
[HFI 8
_ _ ~ AN ~ / O N X ~ ~ , ~ .... ~ . . . . . . . . . . . . . .
, , |
2500 30'00 35'00 40'00 "~/cm-1
Figure 13. Simulation of (HF)n zig-zag chain spectra (n = 2, 4, 8, 16) with 9% DF impurity statistically distributed over the chain. Harmonic wavenum- ber shifts relative to free HF and DF from hybrid density functional (B3LYP 6-31 +G*) force field calculations are scaled by 0.75 for HF stretches and by 0.80 for DF stretches before convoluting the transitions with a 20 cm Lorentzian band profile. The scaling factors approximately take into account the overestimation of frequency shifts at B3LYP 6-31 +G* level 69 and anhar- monic contributions.42 The spectral changes from n = 2 to n = 16 illustrate the slow convergence of the stretching frequencies with chain length. It is seen that the experimental spectrum (bottom trace, 4% HF and an impurity of DF in Ar, expanded at a backing pressure of 7.5 bar s2) is probably due to a distribution of clusters containing significantly longer chains. The symmetric stretch (SN)is clearly seen in all simulated spectra, whereas the antisymmetric stretch (AN) only starts to be visible as a cluster of transitions in the n = 16 chain due to the lack of appropriate boundary conditions. 233 The isotopically isolated DF stretch vibration (I N) converges more rapidly with cluster size.
to evaporative cooling, they may ultimately freeze, and this homonucleation kinet- ics has been modeled recently. 236 Details may certainly depend on expansion conditions and nozzle geometry, but a large number of experimental cluster phases determined by electron diffraction in Laval expansions can be modeled with remarkable success by a simple expression, which merely depends on the liquid range (interval between normal melting (T m) and boiling (T b) temperatures) of the compound and its melting entropy (ASm) according to 237

Spectra and Dynamics of (HF)n 241
rb- R c = ~ + 0.007 (9)
R c values above 0.32 correlate with liquid-like clusters, whereas compounds with R c values below 0.3 are found to be solid. According to this expression, HF (Rc= 0.39) should clearly form liquid clusters, and our evidence for solid clusters seems to provide the first exception to the nucleation model. This may be due to the unusual evaporation properties of H ~ or it may simply reflect differences in expansion conditions. Clearly, this finding requires further systematic investigation. There may be important kinetic effects 16 in HF condensation, beyond the simple, quasithermodynamic model of ref. 237. Very recent results for water, 5~ which falls in between the liquid and solid regimes of Bartell's rule, seem to indicate both liquid and solid nanoclusters. Supersonic jet generation of nanometer size material is an interesting alternative to methods using a cold buffer gas,238-241 as it enables the study of short-time behavior under collision-free conditions in these exciting new states of matter.
9. CONCLUSIONS AND OUTLOOK
We have illustrated several facets of hydrogen bond dynamics in this review by covering cluster sizes from two to many hundreds or thousands of monomer units. We have considered fundamental processes such as state-specific tunneling and predissociation in (HF)2, ring opening in the trimer, vibrational frequency shifts, hydrogen transfer and energy redistribution in the oligomers, and the phase dynam- ics of nanocrystalline clusters, thus revealing the prototypical role of hydrogen fluoride in this field. Some of the dynamical processes are summarized in Figure 14 as a function of cluster size and characteristic timescale. The latter is obtained from spectroscopic analysis leading to time-dependent molecular quantum dynamics 36'249 and theoretical predictions, whereas time domain experi- ments 216'242-244 are not yet available for infrared clusters. Several dynamical effects remain to be modeled in quantitative detail and the infrared spectra are not yet complete, but important progress is foreseeable in the near future. The recent development of a HF pair dipole surface, 87 which ~oes beyond simple induction models, 245 should provide useful infrared intensity information and other couplings of the HF dimer dynamics to electric fields 246 and laser radia- tion. 35'36'249 Still, important questions related to the hydrogen bond kinetics, thermally averaged or state specific, have to be answered before a truly com- prehensive understanding of hydrogen bonding in (HF) n and its isotopomers can be claimed. Future work will concentrate on both experimental and theoretical approaches to quantitative kinetic data along these lines, deriving rate constants and quantum wavepacket motion for the underlying processes in hydrogen bonded clusters.

242 MARTIN QUACK and MARTIN A. SUHM
! O g l 0 ( r / s ] -6
hydrogen -7 \ exchange
-8 PD
+
-9 " r t u n
-10
-11 fast . . . . . . . . . . . .
-12 ~ s t r e t c h IVR
'T'vl -14 iI-F
-15 2 3 '~ 5 6 7 n
Figure 14. Schematic time scale diagram for typical dynamical processes in HF clusters as a function of cluster size n from femto- to microseconds. The vibrational periods ('~vib) for F-F stretching, librational and H-F stretching
67-69 In the modes remain separated from each other for all cluster sizes. dimer, observed stationary state hydrogen bond exchange tunneling periods ('~tun) and metastable state predissociation lifetimes (PD) (see Section 5) accidentally cover the same range, 16'53 but both can be much shorter for states which have not (yet) been observed or not yet analyzed. For larger cluSters, intracluster vibrational relaxation (IVR) after HF stretching excitation
45,52,64 probably becomes faster than direct predissociation. Concerted ex- change of hydrogen atoms between adjacent fluorine atoms in medium sized HF ring clusters is predicted to occur on a ns to Its time scale at room temperature.17,221,222 In all cases, the indicated boundaries are only approxi- mate.
ACKNOWLEDGMENTS
This work has profited from contributions by and discussions with a large number of people, most of whom can be found in the list of references. In particular, we should mention K. AI-Shamery (n6e von Puttkamer), Z. Bali(:, L. Bartell, U. Buck, P. R. Bunker, E. U. Franck, R. B. Gerber, T.-K. Ha, Y. He, F. Huisken, A. Karpfen, W. Klopper, M. Lewerenz, K. Liedl, D. Luckhaus, C. Maerker, R. Marquardt, R. Meyer, R. E. Miller, H. Mialler, D. Nesbitt, M.

Spectra and Dynamics of (HF)n 243
Parrinello, K. Peterson, K. von Puttkamer, H. E Schaefer III, E von Ragu6 Schleyer, U. Schmitt, R. Signorell, J. Stohner, D. Truhlar, G. Tschumper, and J. Zhang. Our research is supported by the Schweizerischer Nationalfonds. We gratefully acknowledge generous allocations of computing resources by the Competence Centre of Computational Chemistry (C 4 project) in Ztirich, and the Centro Svizzero di Calcolo Scientifico (CSCS/SCSC) in Manno, Switzerland.
REFERENCES 1. Hirschfelder, J. O.; Curdss, C. E; Bird, R. B. Molecular Theory of Gases and l.a'quids; Wiley: New
York, 1954. 2. Pimentel, G. C.; McClellan, A. L. The Hydrogen Bond; Freeman, 1960. 3. Pauling, L. The Nature of the Chemical Bond, 2nd edn.; University Press: Oxford, 1940. 4. Dyke, T. R.; Howard, B. J.; Klemperer, W. J. Chem. Phys. 1972, 56, 2442-2454. 5. Pine, A. S.; Lafferty, W. J. J. Chem. Phys. 1983, 78, 2154-2162. 6. Puttkamer, K. v.; Quack, M. MoL Phys. 1987, 62, 1047-1064. 7. Quack, M.; Suhm, M. A. Chem. Phys. Lett. 1990, 171,517-524. 8. Quack, M.; Suhm, M. A. In Conceptual Perspectives in Quantum Chemistry; Calais, J.-L.,
Kryachko, E. S., Eds.; Conceptual Trends in Quantum Chemistry, Vol. III; Kluwer: Dordrecht, 1997, pp 417-465.
9. Suhm, M. A. Ber. Bunsenges. Phys. Chem. 1995, 99, 1159-1167. 10. Sievert, R.; Cadez, I.; Van Doren, J.; Castleman, Jr., A. W. J. Phys. Chem. 1984, 88, 4502-4505. I 1. Simons, J. H. In Fluorine Chemistry; Simons, J. H., Ed.; Academic Press: 1950, Chapter 6, pp
225-259. 12. Badger, R. M.; Bauer, S. H. J. Chem. Phys. 1937, 5, 839-851. 13. Kappes, M.; Leutwyler, S. In Atomic and Molecular Beam Methods; Scoles, G., Ed.; Oxford
University Press, 1988, Chapter 15, pp 380-415. 14. Quack, M. Ann. Rev. Phys. Chem. 1990, 41,839-874. 15. Smith, D. E J. Chem. Phys. 1958, 28, 1040-1056. 16. Puttkamer, K. v.; Quack, M. Chem. Phys. 1989, 139, 31-53. 17. Klopper, W.; Quack, M.; Suhm, M. A. Mol. Phys. 1998, 94, 105-119. 18. Mackor, E. L.; MacLean, C.; Hilbers, C. W. Recl. Tray. Chim. 1968, 87, 655-672. 19. Hinderrnann, D. K.; Comwell, C. D. J. Chem. Phys. 1968, 48, 2017-2024. 20. Whaley, K. B. Int. Rev. Phys. Chem. 1994, 13, 41-84. 21. Truhlar, D. G. In Proceedings of the NATO Workshop on the Dynamics of Polyatomic van der
Waals Complexes, NATO Ser. B 227, 1990, pp 159-185. 22. Buckingham, A. D.; Fan-Chen, L. Int. Rev. Phys. Chem. 1981, 1,253-269. 23. Nesbitt, D. J. Chem. Rev. 1988, 88, 843-870. 24. Saykally, R. J.; Blake, G. A. Science 1993, 259, 1570-1575. 25. Chalasihski, G.; Szczr M. M. Chem. Rev. 1994, 94, 1723-1765. 26. Elrod, M. J.; Saykally, R. J. Chem. Rev. 1994, 94, 1975-1997. 27. Leopold, K. R.; Fraser, G. T.; Novick, S. E.; Klemperer, W. Chem. Rev. 1994, 94,
1807-1827. 28. Nesbitt, D. J. Ann. Rev. Phys. Chem. 1994, 45, 367-399. 29. Nesbitt, D. J. Faraday Discuss. 1994, 97, 1-18. 30. Klemperer, W. Ann. Rev. Phys. Chem. 1995, 46, 1-26. 31. Suhm, M. A.; Nesbitt, D. Chem. Soc. Rev. 1995, 24, 45-54. 32. BaEic, Z.; Miller, R. E. J. Phys. Chem. 1996, 100, 12945-12959. 33. Karpfen, A. In Molecular Interactions--From van der Waals to Strongly Bound Complexes;
Scheiner, S., Ed., Wiley: New York, 1997, pp 265-296.

244 MARTIN QUACK and MARTIN A. SUHM
34. Robinson, J. M.; Pearson, D. J.; Copeland, R. A." Crim, E E J. Chem. Phys. 1985, 82, 780-788.
35. Quack, M. In Broeckhove, J., Lathouwers, L. (Eds.)./ime Dependent Quantum Molecular Dynamics: Experiment and Theory. Proceedings of NATO ARW 019/92. NATO ASI Series Vol. 299; Plenum Press: New York, 1992, pp 293-310.
36. Quack, M., Chapter 27 in Manz, J., Woeste, L. (Eds.) Femtosecond Chemistry, Proc. Berlin Conf. Femtosecond Chemistry, Berlin, March 1993; Verlag Chemic: Weinheim, 1995, pp 781-818.
37. LeDuff, Y.; Holzer, W. J. Chem. Phys. 1974, 60, 2175-2178. 38. Btirgi, T.; Droz, T.; Leutwyler, S. Chem. Phys. Lett. 1995, 246, 291-299. 39. Lafferty, W. J.; Suenram, R. D.; Lovas, E J. J. Mol. Spectmsc. 1987, 123, 434-452. 40. Belov, S. P.; Karyakin, E. N.; Kozin, I. N.; Krupnov, A. E; Polyansky, O. L.; Tretyakov,
M. Y.; Zobov, N. E; Suenram, R. D.; Lafferty, W. J. J. Mol. Spectmsc. 1990, 141,204-222. 41. Quack, M.; Schmitt, U." Suhm, M. A. Chem. Phys. Lett. 1993, 208, 446-452. 42. Luckhaus, D." Quack, M.; Schmitt, U.; Suhm, M. A. Bet Bunsenges. Phys. Chem. 1995,
99, 457-468. 43. Signorell, R.; He, Y.; MUller, H. B.; Quack, M.; Suhm, M. A. In Maier, J. P., Quack, M. (Eds.).
Proceedings of the l Oth International Symposium on Atomic, Molecular, Cluster, Ion, and Surface Physics; Vdf Publishers: ZUrich, 1996, pp. 256-259.
44. Suhm, M. A.; Farrell, Jr., J. I".; Mcllroy, A.; Nesbitt, D. J. J. Chem. Phys. 1992, 97, 5341-5354.
45. Suhm, M. A.; Farrell, Jr., J. T." Ashworth, S.; Nesbitt, D. J. J. Chem. Phys. 1993, 98, 5985-5989.
46. Anderson, D. T.; Davis, S.; Nesbitt, D. J. J. Chem. Phys. 1996, 104, 6225-6243. 47. Anderson, D. T.; Davis, S.; Nesbitt, D. J. J. Chem. Phys. 1996, 105, 4488-4503. 48. Bemish, R. J.; Wu, M." Miller, R. E. Faraday Discuss. 1994, 97, 57-68. 49. Sun, H.; Watts, R. O.; Buck, U. J. Chem. Phys. 1992, 96, 1810-1821. 50. Paul, J. B." Collier, C. P.; Saykally, R. J." Scherer, J. J.; O'Keefe, A. J. Phys. Chem. A
1997, I01,5211-5214. 51. Anderson, D. T.; Davis, S.; Zwier, T. S.; Nesbitt, D. J. Chem. Phys. Lett. 1996, 258,
207-212. 52. Quack, M.; Schmitt, U.; Suhm, M. A. Chem. Phys. Lett. 1997, 269, 29-38. 53. Pine, A. S." Lafferty, W. J." Howard, B. J. J. Chem. Phys. 1984, 81, 2939-2950. 54. Amrein, A.; Quack, M.; Schmitt, U. Z Phys. Chem. N. E 1987, 154, 59-72. 55. Amrein, A.; Quack, M.; Schmitt, U. J. Phys. Chem. 1988, 92, 5455-5466. 56. Hartz, C. L.; Wofford, B. A.; Mclntosh, A. L.; Meads, R. E; Lucchese, R. R.; Bevan, J. W. Ber.
Bunsenges. Phys. Chem. 1995, 99, 447-456. 57. Chang, H.-C.; Klemperer, W. J. Chem. Phys. 1994, 100, 1-14. 58. Gough, T. E.; Miller, R. E.; Scoles, G. Appl. Phys. Lett. 1977, 30, 338-340. 59. Pine, A. S." Fraser, G. T. J. Chem. Phys. 1988, 89, 6636-6643. 60. Buck, U. Ber. Bunsenges. Phys. Chem. 1992, 96, 1275-1284. 61. Huisken, E; Kaloudis, M.; Kulcke, A.; Laush, C.; Lisy, J. M. J. Chem. Phys. 1995,103, 5366-5377. 62. Lisy, J. M.; Tramer, A.; Vernon, M. E; Lee, Y. T. J. Chem. Phys. 1981, 75, 4733-4734. 63. Dayton, D. C.; Miller, R. E. Chem. Phys. Lett. 1988, 143, 181-185. 64. Michael, D. W.; Lisy, J. M. J. Chem. Phys. 1986, 85, 2528-2537. 65. Kolenbrander, K. D.; Dykstra, C. E.; Lisy, J. M. J. Chem. Phys. 1988, 88, 5995-6012. 66. Laush, C.; Lisy, J. M. J. Chem. Phys. 1994, 101, 7480-7487. 67. Karpfen, A. Int. J. Quantum Chem. (Quant. Chem. Symp.) 1990, 24, 129-140. 68. Quack, M.; Stohner, J.; Suhm, M. A. J. Mol. Struct. 1993, 294, 33-36. To be published. 69. Maerker, C.; yon Ragu6 Schleyer, P.; Liedl, K. R.; Ha, T.-K.; Quack, M.; Suhm, M. A. J. Comp.
Chem. 1997, 18, 1695-1719. 70. Peterson, K. A.; Dunning, Jr., T. H. J. Chem. Phys. 1995, 102, 2032-2041.

Spectra and Dynamics of (HF)n 245
71. Collins, C. L.; Morihashi, K.; Yamaguchi, Y.; Schaefer III, H. E J. Chem. Phys. 1995, 103, 6051-6056.
72. Klopper, W.; Quack, M.; Suhm, M. A. Chem. Phys. Lett. 1996, 261, 35-44. 73. Stone, A. J. The Theory of lntermolecular Forces; Clarendon Press: Oxford, 1996. 74. Bowman, J. M.; Gazdy, B.; Schafer, E; Heaven, M. C. J. Phys. Chem. 1990, 94, 2226-2229. 75. Kofranek, M.; Lischka, H.; Karpfen, A. Chem. Phys. 1988, 121, 137-153. 76. Quack, M.; Suhm, M. A. J. Chem. Phys. 1991, 95, 28-59. 77. Dykstra, C. E. J. Phys. Chem. 1990, 94, 180-185. 78. Klein, M. L.; McDonald, I. R. J. Chem. Phys. 1979, 71,298-308. 79. Zhang, C.; Freeman, D. L.; Doll, J. D. J. Chem. Phys. 1989, 91, 2489-2497. 80. Honda, K.; Kitaura, K.; Nishimoto, K. Bull. Chem. Soc. Japan 1992, 65, 3122-3134. 81. Wright, D.; El-Shall, M. S. J. Chem. Phys. 1996, 105, 11199-11208. 82. Chalasifiski, G.; Cybulski, S. M.; Szczc~niak, M. M.; Scheiner, S. J. Chem. Phys. 1989, 91,7048-
7056. 83. Szczr M. M.; Chalasiflski, G. J. Mol. Struct. (Theochem) 1992, 261, 37-54. 84. Szczr M. M.; Chalasifiski, G. In Molecular Interactions--From van der Waals to Strongly
Bound Complexes; Scheiner, S., Ed.; Wiley: New York, 1997, Chapter 2, pp 45-79. 85. Detrich, J.; Corongiu, C.; Clementi, E. Chem. Phys. Lett. 1984, 112,426-430. 86. Quack, M.; Suhm, M. A. MoL Phys. 1990, 69, 791-801. 87. Klopper, W.; Quack, M.; Suhm, M. A. J. Chem. Phys. 1998, 108, 10096-10115. 88. Simsek, M.; Yal~in, Z. J. Math. Chem. 1994, 16, 211-215. 89. Suhm, M. A. Chem. Phys. Lett. 1994, 223, 474-480. 90. Avoird, A. v. d.; Wormer, P. E. S.; Moszynski, R. Chem. Rev. 1994, 94, 1931-1974. 91. Ba~i~, Z.; Light, J. C. Ann. Rev. Phys. Chem. 1989, 40, 469-498. 92. Bowman, J. M.; Gazdy, B. J. Chem. Phys. 1990, 93, 1774-1784. 93. Bramley, M. J.; Carrington, Jr., T. J. Chem. Phys. 1993, 99, 8519-8541. 94. Zhang, D. H.; Wu, Q." Zhang, J. Z. H.; yon Dirke, M.; Bacic, Z. J. Chem. Phys. 1995, 102,
2315- 2325. 95. Wu, Q." Zhang, D. H.; Zhang, J. Z. H. J. Chem. Phys. 1995, 103, 2548-2554. 96. Bacic, Z.; Qiu, Y.; Zhang, J. Z. H.; MUller, H. B.; Quack, M.; Suhm, M. A. in preparation. 97. Zhang, D. H.; Zhang, J. Z. H. J. Chem. Phys. 1993, 99, 6624-6633. 98. Zhang, D. H.; Wu, Q.; Zhang, J. Z. H. J. Chem. Phys. 1995, 102, 124-132. 99. von Dirke, M.; Bacic, Z.; Zhang, D. H.; Zhang, J. Z. H. J. Chem. Phys. 1995, 102, 4382-4389.
100. Cohen, R. C.; Saykally, R. Ann. Rev. Phys. Chem. 1991, 42, 369-392. 101. Bramley, M. J.; Trump, J. W.; Carrington, Jr., T.; Corey, G. C. J. Chem. Phys. 1994, 100,
6175-6194. 102. Maynard, A. T.; Wyatt, R. E.; lung, C. J. Chem. Phys. 1995, 103, 8372-8390. 103. Wyatt, R. E.; lung, C.; Leforestier, C. Acc. Chem. Res. 1995, 28, 423-429. 104. Leforestier, C." Braly, L. B." Liu, K." Elrod, M. J.; Saykally, R. J. J. Chem. Phys. 1997, 106,
8527-8544. 105. Quack, M.; Suhm, M. A. Chem. Phys. Lett. 1995, 234, 71-76. 106. Quack, M.; Suhm, M. A. Theor. Chim. Acta 1996, 93, 61--65. 107. Luckhaus, D.; Meyer, R.; Quack, M.; Suhm, M. A. to be published. 108. Luckhaus, D.; Mtiller, H. B.; Quack, M.; Suhm, M. A. in preparation. 109. Barton, A. E." Howard, B. J. Faraday Discuss. Chem. Soc. 1982, 73, 45-62. 110. Marshall, M. D.; Jensen, E; Bunker, E R. Chem. Phys. Lett. 1991, 176, 255-260. 111. Schiitz, M.; [(lopper, W.; Lttthi, H.-E; Leutwyler, S. J. Chem. Phys. 1995, 103, 6114-6126. 112. Althorpe, S. C.; Clary, D. C.; Bunker, E R. Chem. Phys. Lett. 1991, 187, 345-353. 113. Quack, M.; Troe, J. Bet Bunsenges. Phys. Chem. 1974, 78, 240-252. 114. Jung, J. O.; Gerber, R. B. J. Chem. Phys. 1996, 105, 10332-10348. 115. Jelski, D. A.; Haley, R. H.; Bowman, J. M. J. Comp. Chem. 1996, 17,1645-1652.

246 MARTIN QUACK and MARTIN A. SUHM
116. Bunker, P. R.; Carrington, Jr., T.; Gomez, P. C.; Marshall, M. D.; Kofranek, M.; Lischka, H.; Karpfen, A. J. Chem. Phys. 1989, 91, 5154-5159.
117. Bunker, E R.; Jensen, E" Karpfen, A.; Kofranek, M." Lischka, H. J. Chent Phys. 1990, 92, 7432-7440.
118. Quack, M.; Suhm, M. A. Chent Phys. Lett. 1991, 183, 187-194. 119. Anderson, J. B. J. Chent Phys. 1975, 63, 1499-1503. 120. Sun, H.; Watts, R. O. J. Chent Phys. 1990, 92, 603-616. 121. Lester, Jr., W. A.; Hammond, B. L. Ann. Rev. Phys. Chent 1990, 41,283-311. 122. Suhm, M. A.; Watts, R. O. Phys. Reports 1991, 204, 293-329. 123. Hammond, B. L.; Lester, Jr., W. A.; Reynolds, E J. Monte Carlo Methods in Ab Initio Quantum
Chemistry; World Scientific: Singapore, 1994. 124. Ceperley, D. M.; Mitas, L. Adv. Chent Phys. 1996, XCIII, 1-38. 125. Kosztin, I.; Faber, B.; Schulten, K. Ant J. Phys. 1996, 64, 633-644. 126. Anderson, J. B. J. Chent Phys. 1976, 65, 4121-4127. 127. Sandier, E; Buch, V.; J., Sadlej, J.; J. Chent Phys. 1996, 105, 10387-10397. 128. Klein, D. J." Pickett, H. M. J. Chent Phys. 1976, 64, 4811-4812. 129. Lewerenz, M.; Watts, R. O. Mol. Phys. 1994, 81, 1075-1091. 130. Caffarel, M.; Claverie, E; Mijoule, C.; Andzelm, J.; Salahub, D. R. J. Chent Phys. 1989, 90,
990-1002. 131. Barnett, R. N.; Sun, Z." Lester, Jr., W. A. Chent Phys. Lett. 1997, 273, 321-328. 132. Quack, M.; Troe, J. In Encyclopedia of Computational Chemistry; Wiley: New York, 1998. In
press. 133. Cooley, J. W. Math. Comput. 1961, 15, 363-374. 134. Meyer, R. J. Chent Phys. 1970, 52, 2053-2059. 135. Hollenstein, H.; Marquardt, R. R." Quack, M." Suhm, M. A. J. Chent Phys. 1994,101, 3588-3602. 136. Sandier, P.; Buch, V.; Clary, D. C. J. Chent Phys. 1994, 101, 6353-6355. 137. Sandier, P.; oh Jung, J.; Szczesniak, M. M.; Buch, V. J. Chent Phys. 1994, 101, 1378-1391. 138. Franken, K. A.; Dykstra, C. E. J. Chent Phys. 1994, 100, 2865-2870. 139. Dykstra, C. E.; van Voorhis, T. A. J. Comput. Chent 1997, 18, 702-711. 140. Meredith, A. W.; Ming, L.; Nordholm, S. Chent Phys. 1997, 220, 63-78. 141. Coker, D. E; Miller, R. E.; Watts, R. O. J. Chem. Phys. 1985, 82, 3554-3562. 142. Laurie, V. W.; Herschbach, D. R. J. Chent Phys. 1962, 37, 1687-1693. 143. Emesti, A.; Hutson, J. M. Chent Phys. Lett. 1994, 222, 257-262. 144. Sorenson, J. M.; Gregory, J. K.; Clary, D. C. Che~ Phys. Lett. 1996, 263, 680-686. 145. Jorgensen, W. L. J. Chent Phys. 1979, 70, 5888-5897. 146. Nemukhin, A. V.; Grigorenko, B. L. Int. J. Quantum Chem. 1997, 62, 55-65. 147. Car, R.; Parrinello, M. Phys. Rev. Lett. 1985, 55, 2471-2474. 148. Bueker, H.-H.; Helgaker, T.; Ruud, K.; Uggerud, E. J. Phys. Chent 1996, 100, 15388-15392. 149. Lee, C.; Yang, W.; Parr, R. G. Phys. Rev. B 1988, 37, 785-789. 150. Becke, A. D. J. Chent Phys. 1992, 96, 2155-2160. 151. R6thlisberger, U.; Parrinello, M. J. Chent Phys. 1997, 106, 4658-4664. 152. Cheng, H.-P.; Barnett, R. N.; Landman, U. Chem. Phys. Lett. 1995, 237, 161-170. 153. Marx, D.; Parrinello, M. J. Chent Phys. 1996, 104, 4077-4082. 154. Tschumper, G. S.; Yamaguchi, Y.; Schaefer III, H. E J. Chent Phys. 1997, 106, 9627-9633. 155. Davis, S.; Anderson, D. T.; Farrell, Jr., J. T.; Nesbitt, D. J. J. Chem. Phys. 1996, 104,
8197-8209. 156. Jensen, P.; Bunker, P. R." Karpfen,, A." Kofranek, M.; Lischka, H. J. Chent Phys. 1990, 93,
6266-6280. 157. Chuang, C.-C.; Tsang, S. N.; Klemperer, W." Chang, H.-C. J. Phys. Chent A. 1997, 101,
6702-6708. 158. Mills, I. M. J. Phys. Chent 1984, 88, 532-536.

Spectra and Dynamics of (HF)n 247
159. Volobuev, Y.; Necoechea, W. C.; Truhlar, D. G. J. Phys. Chem. A 1997, 101, 3045-3048. 160. Necoechea, W. C.; Truhlar, D. G. Chem. Phys. Lett. 1996, 248, 182-188. 161. Huiszoon, C.; Briels, W. J. Chem. Phys. Len. 1993, 203, 49-54. 162. Lewerenz, M. J. Chem. Phys. 1996, 104, 1028-1039. 163. Buch, V. J. Chem. Phys. 1992, 97, 726-729. 164. Gregory, J. K.; Clary, D. C. J. Chem. Phys. 1995, 102, 7817-7829. 165. Puttkamer, K. v." Quack, M.; Suhm, M. A. Infrared Phys. 1989, 29, 535-539. 166. Quack, M. Mol. Phys. 1977, 34, 477-504. 167. Chang, H.-C.; Klemperer, W. J. Chem. Phys. 1996, 104, 7830-7835. 168. Davis, S.; Anderson, D. T.; Nesbitt, D. J. J. Chem. Phys. 1996, 105, 6645-6664. 169. Fraser, G. T. J. Chem. Phys. 1989, 90, 2097-2108. 170. Schuder, M. D.; Lovejoy, C. M.; Lascola, R.; Nesbitt, D. J. J. Chem. Phys. 1993, 99, 4346. 171. Sibert III, E. L. J. Phys. Chem. 1989, 93, 5022-5024. 172. Jensen, P.; Bunker, P. R.; Karpfen, A. J. Mol. Spectrosc. 1991, 148, 385-390. 173. Puttkamer, K. v.; Quack, M.; Suhm, M. A. Mol. Phys. 1988, 65, 1025-1045. 174. He, Y.; MUller, H. B.; Quack, M.; Suhm, M. A. In preparation. 175. Pine, A. S.; Howard, B. J. J. Chem. Phys. 1986, 84, 590-596. 176. Bohac, E. J.; Marshall, M. D.; Miller, R. E. J. Chem. Phys. 1992, 96, 6681-6695. 177. Farrell, Jr., J. T.; Suhm, M. A.; Nesbitt, D. J. J. Chem. Phys. 1996, 104, 9313-9331. 178. Oudejans, L.; Miller, R. E. J. Phys. Chem. A. 1997, 101, 7582-7592. 179. Hofacker, L. Z. Naturforschg. A 1963, 18, 607-619. 180. Gregory, J. K.; Whales, D. J.; Clary, D. C. J. Chem. Phys. 1995, 102,1592-1596. 181. Vasilev, G. K.; Makarov, E. E; Chemyshov, Y. A.; Yakushev, V. G. Sov. J. Chem. Phys. 1987, 4,
1515-1527. 182. DeLeon, R. L." Muenter, J. S. J. Chem. Phys. 1984, 80, 6092-6094. 183. Rensberger, K. J.; Copeland, R. A.; Robinson, J. M.; Crim, E E J. Chem. Phys. 1985, 83,
1132-1137. 184. Huang, Z. S.; Jucks, K. W.; Miller, R. E. J. Chem. Phys. 1986, 85, 3338-3341. 185. Fraser, G. T.; Pine, A. S. J. Chem. Phys. 1989, 91,633-636. 186. Marshall, M. D." Bohac, E. J.; Miller, R. E. J. Chem. Phys. 1992, 97, 3307-3317. 187. Bohac, E. J.; Miller, R. E. J. Chem. Phys. 1993, 99, 1537-1544. 188. Ewing, G. E. J. Chem. Phys. 1980, 72, 2096-2107. 189. Halberstadt, N.; Br~,chignac, P.; Beswick, J. A.; Shapiro, M. J. Chem. Phys. 1986, 84, 170--175. 190. Pine, A. S. In Weber, A., Ed., NATO ASI Series: Structure and Dynamics of Weakly Bound
Molecular Complexes; D. Reidel, 1987, pp 93-105. 191. Miller, R. E. Science 1988, 240, 447-453. 192. Yamada, K.; Winnewisser, M. J. Mol. Spectrosc. 1977, 64, 401-4 14. 193. Suhm, M. A. Dissertation, ETH Ziirich, 1990. 194. Marquardt, R.; Quack, M.; Stohner, J.; Suhm, M. A. In Supercomputing Projects Switzerland
1991/1992; CSCS/EPFI./ETHZ, 1993, pp 31-34. 195. Quack, M. Faraday Discuss. Chem. Soc. 1981, 71,309-311,325-326, 359-364. 196. Andrews, L.; Davis, S. R.; Hunt, R. D. Mol. Phys. 1992, 77,993-1003. 197. Simons, J.; Hildebrand, J. H. J. Am. Chem. Soc. 1924, 46, 2183-2191. 198. Franck, E. U.; Meyer, E Z Elektrochemie 1959, 63, 571-582. 199. Janzen, J.; Bartell, L. S. J. Chem. Phys. 1969, 50, 3611-3618. 200. Strohmeier, W.; Briegleb, G. Z Elektrochemie 1953, 57, 662, 668. 201. Kulcke, A. Ber. - Max-Planck-lnst. Str~mungsforsctt 1994, 13, 1-160. 202. Huisken, E; Kaloudis, M.; Kulcke, A.; Voelkel, D. Infrared Phys. Technol. 1995, 36, 171-178. 203. Huisken, E; Tarakanova, E. G.; Vigasin, A. A." Yukhnevich, G. V. Chem. Phys. Len. 1995, 245,
319-325. 204. Huisken, F.; Kaloudis, M.; Vigasin, A. A. Chem. Phys. Len. 1997, 269, 235-243.

248 MARTIN QUACK and MARTIN A. SUHM
205. Andrews, L.; Bondybey, V. E.; English, J. H. J. Cheat Phys. 1984, 81, 3452-3457. 206. Buck, U.; Meyer, H. Phys. Rev. Lett. 1984, 52, 109-112. 207. Stepanov, B. I. Nature 1946, 157, 808. 208. Vernon, M. E; Lisy, J. M.; Krajnovich, D. J.; Tramer, A.; Kwok, H.-S.; Shen, Y. R.; Lee, Y. T.
Faraday Discuss. Cheat Soc. 1982, 73, 387-397. 209. Huisken, E; Kaloudis, M.; Koch, M.; Werhahn, O. J. Chent Phys. 1996, 105, 8965-8968. 210. Michael, D. W.; Dykstra, C. E.; Lisy, J. M. J. Cheat Phys. 1984, 81, 5998-6006. 211. Botschwina, P.; Schulz, B.; Horn, M.; Matuschewski, M. Cheat Phys. 1995, 190, 345-362. 212. Astrand, P.-O.; Karlstrtim, G.; Engdahl, A.; Nelander, B. J. Chem. Phys. 1995, 102, 3534-3554. 213. Beil, A." Luckhaus, D.; Quack, M." Stohner, J. Ber. Bunsenges. Phys. Cheat 1997, 101, 311-328. 214. Quack, M. J. Cheat Soc. Faraday Discuss. 1995, 102, 383-384. 215. Quack, M. II Nuovo Cimento 1981, 63B, 358-377. 216. Laenen, R.; Rauscher, C. J. Cheat Phys. 1997, 106, 8974-8980. 217. Lagemann, R. T.; Knowles, C. H. J. Cheat Phys. 1960, 32, 561-564. 218. Franke, G.; Hilf, E. R.; Borrmann, P. J. Cheat Phys. 1993, 98, 3496-3502. 219. Wales, D. J.; Walsh, T. R. J. Cheat Phys. 1996, 105, 6957-6971. 220. Wales, D. J. J. Am. Cheat Soc. 1993, 115, 11191. 221. Liedl, K. R.; Seku~ak, S.; Kroemer, R. T.; Rode, B. M. J. Phys. Cheat A 1997, 101, 4707--4716. 222. Loerting, T.; Liedl, K. R.; Rode, B. M. J. Am. Cheat Soc. 1998, 120, 404-412. 223. Chang, Y.-T.; Miller, W. H. J. Phys. Cheat 1990, 94, 5884-5888. 224. Suhm, M. A. Chem. Phys. Lett. 1993, 214, 373-380. 225. Varandas, A. J. C.; Marques, J. M. C. J. Cheat Phys. 1994, 100, 1908-1920. 226. Collins, M. A. Adv. Cheat Phys. 1996, XCIII, 389-453. 227. Brown, D. E R.; Gibbs, M. N.; Clary, D. C. J. Cheat Phys. 1996, 105, 7597-7604. 228. Adams, R. M.; Katz, J. J. J. Opt. Soc. Amer. 1956, 46, 895-898. 229. Kittelberger, J. S.; Homig, D. E J. Cheat Phys. 1967, 46, 3099-3108. 230. Atoji, M.; Lipscomb, W. N. Acta Cryst. 1954, 7, 173-175. 231. Johnson, M. W.; Sandor, E.; Arzi, E. Acta Cryst. B 1975, 31, 1998-2003. 232. Merkel, C.; Blumen, A. Ber. Bunsenges. Phys. Cheat 1977, 81, 1110. 233. Karpfen, A.; Yanovitskii, O. J. Mol. Struct. (Theochem) 1994, 307, 81-97. 234. Devlin, J. P.; Buch, V. J. Phys. Cheat B 1997, I01, 6095--6098. 235. Wales, D. J.; Doye, J. P. K. J. Cheat Phys. 1995, 103, 3061-3070. 236. Bartell, L. S. J. Phys. Cheat 1996, 100, 8197-8199. 237. Bartell, L. S.; Harsanyi, L.; Valente, E. J. J. Phys. Cheat 1989, 93, 6201-6205. 238. Barnes, J. A.; Gough, T. E.; Stoer, M. Rev. Sci. Instr. 1989, 60, 406--409. 239. Dunder, T.; Miller, R. E. J. Cheat Phys. 1990, 93, 3693-3703. 240. Disselkamp, R.; Ewing, G. E. J. Cheat Phys. 1993, 99, 2439-2448. 241. Bauerecker, S.; Taucher, E; Weitkamp, C.; Cammenga, H. K. In Proceedings of the SPIE:
Application of Tunable Diode and Other Infrared Sources for Atmospheric Studies and Industrial Process Monitoring; Fried, A., Ed.; SPIE, 1996, Vol. 2834, pp 257-261.
242. Felker, P. M.; Zewail, A. H. Advances in Chemical Physics: Evolution of Size Effects in Chemical Dynamics I 1988, 70, 265-364.
243. Bingemann, D.; Gorman, M. P.; King, A. M.; Crim, E E J. Cheat Phys. 1997, 107, 661-664. 244. Woutersen, S.; Emmerichs, U.; Bakker, H. J. J. Cheat Phys. 1997, 107, 1483-1490. 245. Gregory, J. K.; Clary, D. C.; Liu, K.; Brown, M. G.; Saykally, R. J. Science 1997, 275, 814-817. 246. Bemish, R. J.; Chan, M. C.; Miller, R. E. Cheat Phys. Lett. 1996, 251, 182-188. 247. Howard, B. J.; Dyke, T. R.; Klemperer, W. J. Cheat Phys. 1984, 81, 5417-5425. 248. Fehrensen, B.; Luckhaus, D.; Quack, M. z Physik. Chem. 1998. In press. 249. Quack, M. J. Mol. Struct. 1995, 347, 245-266.

THE INFRARED SPECTROSCOPY OF HYDROGEN-BONDED CLUSTERS: CHAINS, CYCLES, CUBES, AND THREE-DIMENSIONAL NETWORKS
Timothy S. Zwier
Abstract . . . . . . . . . . . . . . . . . . . . . . . . . . . . . . . . . . . . . 250 Introduction . . . . . . . . . . . . . . . . . . . . . . . . . . . . . . . . . . . 250 Experimental Methods . . . . . . . . . . . . . . . . . . . . . . . . . . . . . . 251
2.1. Resonant Two-Photon Ionization . . . . . . . . . . . . . . . . . . . . . 251 2.2. Hole-Burning Spectroscopy . . . . . . . . . . . . . . . . . . . . . . . 251
2.3. Resonant Ion-Dip Infrared Spectroscopy (RIDIRS) . . . . . . . . . . . 252 2.4. Fluorescence-Dip Infrared Spectroscopy (FDIRS) . . . . . . . . . . . 253 Selected Systems . . . . . . . . . . . . . . . . . . . . . . . . . . . . . . . . . 253
3.1. The x H-bond: Benzene-H20 . . . . . . . . . . . . . . . . . . . . . . 253 3.2. Contrasting Intramolecular and Intermolecular H-Bonds: The
Tropolone-H20 Complex . . . . . . . . . . . . . . . . . . . . . . . . 257 3.3. Hydrogen-Bonded Chains: Benzene-(Water)2, Benzene-
(Methanol)2, Benzene-(Methanol)3, and (Benzene)2--(Methanol)3 . . . 260
3.4. Hydrogen-Bonded Cycles: Benzene-(Water)3--5 and Benzene-(Methanol)4._6 . . . . . . . . . . . . . . . . . . . . . . . . . 263
Advances in Molecular Vibrations and Collision Dynamics, Volume 3, pages 249-280. Copyright �9 1998 by JAI Press Inc. All r iots of reproduction in any form reserved. ISBN: 1-55938-790-4
249

250 TIMOTHY S. ZWlER
3.5. Three-Dimensional H-Bonded Networks: Benzene-(Water)6,7 . . . . . 269 3.6. Hydrogen-Bonded Cubes: Benzene--(Water)8 . . . . . . . . . . . . . . 273
4. Conclusion . . . . . . . . . . . . . . . . . . . . . . . . . . . . . . . . . . . . 278 Acknowledgments . . . . . . . . . . . . . . . . . . . . . . . . . . . . . . . . 278 References . . . . . . . . . . . . . . . . . . . . . . . . . . . . . . . . . . . . 278
ABSTRACT
The OH stretch infrared spectra of several neutral clusters representing prototypical examples of several H-bonding topologies are reviewed. The technique of resonant ion-dip infrared spectroscopy is employed to obtain size- and conformation-selected spectra. Among the types of clusters considered are (1) the rt H-bond in benzene-H20, (2) the intramolecular H-bond in tropolone-H20, (3) the H-bonded chains found in benzene-(water)2, benzene-(methanol)2,3, and (benzene)2-(methanol)3, (4) the H- bonded cycles found in benzene-(water)3_5 and benzene-(methanol)4-6, (5) the three-dimensional networks found in benzene-(water)6,7, and (6) the H-bonded cubes of D2a and $4 symmetry found in benzene-(water)8.
1. I N T R O D U C T I O N
The network of hydrogen bonds present in the liquid and solid phases of water and the alcohols plays a pivotal role in the chemical and physical properties of these phases. In liquids, hydrogen bonds are being rapidly broken and reformed so that the OH stretch infrared spectrum of the liquid reflects the wide range of H-bonding environments present. 1'2 Even in the solid where the H-bonded networks are better defined, the strong coupling across H-bonds and the macroscopic extent of the network lead to broadened spectra which often hide the details of the smaller H-bonded units which make it up. 3-7
The study of molecular clusters of polar, protic solvents offers an alternative view of networks of H-bonds by limiting the sizes and conformations present to those produced in significant abundance in the supersonic expansion. Of course, even in a supersonic expansion, the range of cluster sizes and the number of conformations which can be formed provides a strong incentive to find reliable methods for probing the clusters on a size- and conformation-selective basis.
Among the most powerful and widely used spectroscopic probes of hydrogen bonding are the hydride stretch vibrations. 8 In a hydrogen-bonded Y...HX complex, the high-frequency HX stretch (-3700 cm -l when X = O) is sensitive to the H-bond since it vibrates directly against it. The HX stretch fundamental undergoes large vibrational frequency shifts and intensity changes which reflect the number, strength, and type of H-bonds present. In liquid water and alcohols, the OH stretch absorption spreads over nearly 700 cm -1, due in large measure to the range of H-bonding environments sampled. In simple 1:1 complexes the relationship be- tween the frequency, intensity, and breadth of the OH stretch absorption and the

Chains, Cycles, and Cubes 251
strength or length of the H-bond have been systematically studied for some time. 8-1: However, in larger H-bonded clusters the relationship between the hydride stretct infrared spectrum and (1) the size of the H-bonded cluster, (2) the number ol H-bonds in the cluster, (3) its H-bonding topology, and (4) the coupling ant cooperative strengthening within the H-bonds of each topology is less well-estab. lished or understood.
This has provided much of the motivation for the work reviewed herein. The mair focus of this chapter will be on the OH stretch infrared spectroscopy of size- ant conformation-selected benzene-(water), and benzene-(methanol),n clusters. As w~ will see, these clusters provide examples of several important H-bonding topolo. gies, including H-bonded chains, cycles, cubes, and three-dimensional networks In addition, the interaction of the (water), or (methanol) m cluster with benzen~ occurs via a n H-bond, whose spectroscopic manifestations will also be reviewed Finally, the tropolone-H20 complex will provide a clear comparison of the uniqu~ characteristics of intramolecular and intermolecular O...HO hydrogen bonds in single complex.
2. EXPERIMENTAL METHODS
2.1. Resonant Two-Photon Ionization
In all the benzene-(solvent), cluster studies, resonant two-photon ionizatior (R2PI)-time-of-flight mass spectroscopy 12 provides the means for selecting a giver conformation and size cluster for study by near-infrared spectroscopy. The resonan excitation step for R2PI employs the S 1 ~-- S O transition(s) of the benzene chromo, phore(s) in the cluster. The R2PI spectra probe the clusters via the perturbation: imposed on benzene's vibronic spectrum by the solvent molecules in the cluster. ,~ complication of these studies is that the neutral clusters can undergo fragmentatior following photoionization if the Franck-Condon factors to the ion favor formatiol of vibrationally excited cluster ions with sufficient energy to fragment. 13-17 The R2PI spectroscopy of benzene-(solvent), clusters and the details of the cluster siz~ assignments have been reviewed elsewhere, 12 and serve here mainly as a backdrol to the infrared spectroscopy. Only in cases where the R2PI spectroscopy plays pivotal role in understanding the infrared spectroscopy will further details bc provided.
2.2. Hole-Burning Spectroscopy
As the cluster size or compositional complexity of the hydrogen-bonded cluster: grows, the probability for forming multiple conformational isomers of a givel cluster size also rises. In such cases, UV-UV hole-burning spectroscopy 18 provide: a crucial probe of the number of distinct species present in a given mass channel In hole-burning spectroscopy (Figure 1 a), a high-power UV pulse set on a transitioJ

252 TIMOTHY S. ZWlER
a ) / / f ' / / / / / B W n +
B*W n
BW n
c) / / . , i / / / / / B Wn +
BWn(S~)
BWn(v) BW n
b) / / / / " ~ " / / B Wn +
d)
B*W.
BW n
BWn(Sl)
BWn(V) BW n
Figure 1. Schematic energy level diagrams for the experimental methods employed in studying hydrogen-bonded clusters: (a) Resonant two-photon ionization (R2PI), (b) UV-UV hole-burning spectroscopy, (c) resonant ion-dip infrared spectroscopy (RIDIRS), and (d) fluorescence-dip infrared spectros- copy (FDIRS).
of interest in the R2PI spectrum is used to remove population from the ground state of the species responsible for the transition. A second UV pulse is then tuned through the R2PI spectrum and the difference R2PI spectrum with and without the hole-burning laser present is recorded. All transitions originating from the same ground state as the hole-burned transition will appear in the hole-burning spectrum.
2.3. Resonant Ion-Dip Infrared Spectroscopy (RIDIRS)
RIDIRS, first developed by Page et al., 19'20 can be used to record the infrared spectrum of a single size and conformation cluster free from interference from other clusters present in the expansion. A detailed description of our implementation is given elsewhere. 21 As in its Raman analog (introduced by Felker and coworkers), 22 species selection is achieved (Figure 1 b) by monitoring the ion signal due to a single

Chains, Cycles, and Cubes 253
vibronic transition of a given mass cluster ion in R2PI-TOFMS. Infrared absorp- tions are then detected as a depletion in the ion signal at the mass of interest. The method finds its unique strength in providing both wavelength and mass selection, which together strongly discriminate against more than one species contributing to the infrared spectrum so recorded. The advantages of the method are complemen- tary to the inelastic scattering method of neutral cluster size selection introduced by Buck. 23 The higher resolution mass selection of RIDIRS enables the study of mixed clusters in which multiple species of nearby mass may exist. Furthermore, the infrared spectrum of different conformational isomers of the same mass can also be studied free from interference from one another as long as the ultraviolet spectra of the two species are distinguishable. 18 On the other hand, a major constraint of the RIDIRS method is its necessary incorporation of a species capable of R2PI in the cluster.
2.4. Fluorescence-Dip Infrared Spectroscopy (FDIRS)
The fluorescence-based analog of RIDIRS, fluorescence-dip infrared spectros- copy (FDIRS, Figure 1 c), retains the wavelength selectivity of RIDIRS, but forfeits mass selectivity. 24-27 Nevertheless, it is the method of choice in infrared (IR) studies of aromatics which fluoresce but are not easily probed by R2PI. The tropolone-H20 complex has been studied using this technique. 26
3. SELECTED SYSTEMS
3.1. The n H-bond: Benzene-H20
While much of the emphasis in this review is on the OH...O hydrogen bonds formed between water or methanol molecules, the interactions of water or methanol with benzene also are of considerable inherent interest. Despite its status as a nonpolar hydrocarbon, benzene possesses an electron-rich aromatic n cloud which can serve as acceptor site for a nontraditional hydrogen bond referred to as a H-bond. 13'21'28-3~ Such n H-bonds provide significant stabilization of aromatic
residues in biological systems, 31 motivating studies of the properties of the 7z H-bond.
Among the more important conclusions of matrix IR, 32 R2PI, 14 and microwave studies 29'3~ of the C6H6-H20 complex is that the n H-bond supports large-ampli- tude tumbling of water on benzene's surface already at the zero-point level. The vibrationally averaged position of the water molecule in the complex is what would be expected for a hydrogen bond; namely, on the sixfold axis of benzene with its hydrogen(s) pointing toward the ring. 14'29'3~ However, its ability to reorient on the aromatic n cloud with little cost in energy is qualitatively different than the more traditional, linear Y.. .H-X hydrogen bond with a localized electron pair.

254 TIMOTHY S. ZWlER
The RIDIR spectra of C6H6-H20 (Figure 2a) and C6H6-HOD (Figure 3a) 21 in the OH stretch region exhibit striking manifestations of the large-amplitude motions present. In a rigid complex with a single, well-defined structure, the OH stretch IR spectrum of C6H6-H20 and C6H6-HOD should be composed of two transitions (symmetric and antisymmetric stretch) and one transition (OH stretch), respec- tively. However, as many as seven transitions are resolved in the RIDIR spectrum of C6H6-H20 (Figure 2a), while five transitions appear in C6H6-HOD (Figure 3a). Furthermore, several of the combination bands in the C6H6-HOD spectrum are several times more intense than the OH stretch fundamental, in apparent disregard of the usual Av = _+1 IR selection rules.
A model which qualitatively accounts for the observed transitions incorporates two large-amplitude motions in the complex: (1) internal rotation of H20 or HOD about the sixfold axis of benzene(0), and (2) torsion of the water molecule in its plane (~).21 In C6H6-H20 , OH stretch transitions out of the lowest ortho (H) and para (E) ground-state levels are observed. A transition at 3634 cm -1 is assigned as an unresolved pair of parallel transitions (E-Y'. and 1-I-H) involving the symmetric stretch fundamental (at 3657 cm -1 in free H20 ). In the antisymmetric stretch region, perpendicular bands at 3713, 3748, and 3774 cm -1 are assigned as 1-I---)E, E-oH,
o ,,.,.i r
:::3
; > - , ~
c~
I - , .4
; > . . . ,~
" ' I . . . . I . . . . I ' '
. . . . . .
b)
" , t , I ~ , , I |
3600 3700 3800 Frequency Shift (cm l )
Figure 2. RIDIR spectra of (a) C6H6-H20, (b) C6H6-CH3OH, and (c) (C6H6)2-H20 in the OH stretch region of the infrared.

Chains, Cycles, and Cubes 255
and FI-~A transitions involving free internal rotor levels of the antisymmetric stretch, respectively. The spacing of the transitions is consistent with nearly free internal rotation of H20 about benzene's sixfold axis in both ground and vibration- ally excited states.
In C6H6-HOD, the local mode OH stretch has components parallel and perpen- dicular to benzene's sixfold axis, so that both parallel and perpendicular transitions can appear in the spectrum. Combination bands involving both internal rotation and in-plane torsion of HOD are prominent in the spectrum, leading to its unusual appearance. The stick diagram in Figure 3b is representative of the quality of fit possible with this simple, two-dimensional model. The form of the in-plane potentials for torsion along p which reproduces the qualitative features of the OH
z(o)--no)
z(o)-n(o)
~o)--zO)
~o)-z(o) [
J : t i
0 I0 20
b) Calculated fit
T.,(O)--~2) T_.,(O)---rI(2) /
- i ! i ": 30 40 50
I 60
I I I 0 I0 20
I I I I 30 40 50 60
Relative F~qucn~ 7 (cm-1)
Figure 3. (a) RIDIR spectrum of C6H6-HOD in the OH stretch region. (b) Computed "best-fit" spectrum for C6H6-HOD using a two-dimensional model involving free internal rotation in ~ and the OH(v = 0) and OH(v = 1) potential along the in-plane torsion (p) from Figure 4.

256 TIMOTHY S. ZWlER
stretch fundamental spectrum are shown in Figure 4. Best fits are found for slightly asymmetric, double-minimum potentials with large-amplitude excursions for HOD over nearly 180 ~ even at the zero-point level. Thus while the H20 or HOD molecules nominally have the hydrogen(s) pointing toward the ring, they sample nearly half the orientational space allowed to them.
0 0 -
80-
20-
0 - I
-2.5
~oo
8 0
2C
0
-2.5
I "'1 I I I I I I I I -2.0 -1.5 -1.0 -0.5 0.0 0.5 l.O 1.5 2.0 2.5
p(radians) ..
b)
-2.0 -1.5 -1.0 -0.5 0.0 0.5 1.0 1.5 2.0 2.5 p(radians) . . . .
Figure 4. (a) OH(v = 0) and (b) OH(v = 1) potentials along the in-plane torsional coordinate p which give the fit to the experimental spectrum shown in Figure 3b.

Chains, Cycles, and Cubes 257
One might expect on this basis that the large-amplitude motion of water in the H-bond is possible because the r~ H-bond is so weak. However, high-level ab initio calculations predict binding energies of 2.8 kcal/mol after correction for basis set superposition error, more than half that of the water dimer (4.7 kcal/mol). 33-37 Instead, the two hydrogen-bonding hydrogens present in water, when combined with the highly symmetric, delocalized n cloud, provide the means for compensat- ing for a weakening of the H-bond to one hydrogen with a strengthening of that with the other hydrogen as water tumbles on the surface of benzene.
The unique character of the n H-bond with water is further emphasized by its comparison with the ~ H-bonds in benzene-methanol 38 and (benzene)2-H20. 39 As Figure 2b shows, the RIDIR spectrum of the benzene-methanol complex consists of a single OH stretch transition at 3639 cm -1, 42 cm -1 red-shifted from that of free methanol (3681 cm-1). The lack of any combination bands indicates that large- amplitude motions which reorient or modulate the strength of the r~ H-bond are either lacking or the associated modes are uncoupled to the OH stretch. The 42 cm -1 red-shift is somewhat greater than the 20-25 cm -l shifts present in the symmetric and antisymmetric stretch transitions in benzene-H20, 21 consistent with the ex- pected increase in strength of the n H-bond with methanol.
The RIDIR spectrum of (benzene)2-H20 (Figure 2c) also shows no evidence for large-amplitude motions. The spectrum displays symmetric and antisymmetric OH stretch fundamentals, both of which are shifted --42 cm -1 from their corresponding frequencies in the water monomer. No combination bands are observed. UV-UV hole-burning spectra of the (benzene)2-H20 complex by Scherzer et al. 4~ lead to the conclusion that the water molecule in (benzene)2-H20 is rt H-bonded to one of the two benzenes in the cluster, with the other benzene largely unperturbed. The ultraviolet spectrum is closely reminiscent of that for the benzene dimer, 41 and studies of isotopically substituted clusters are consistent with the benzene dimer in (benzene)2-H20 retaining its nominal T-shaped structure 22'41'42 even in the pres- ence of the water molecule. The structural isomer probed by the RIDIR spectrum of Figure 2c is one in which water is n H-bonded to the "stem" benzene of the dimer "T". For our purposes here, the significance of the RIDIR spectrum of (benzene) 2- H20 is that the asymmetry produced by the "top" benzene molecule is enough to quench the large-amplitude motions of the water molecule in its n H-bond to the point that combination bands involving these motions are not observable.
3.2. Contrasting Intramolecular and Intermolecular H-Bonds: The Tropolone-H20 Complex
One of the more notable characteristics of the tropolone molecule is its intra- molecular OH...O hydrogen bond. In the bare molecule, the H-atom in this hydrogen bond can tunnel between equivalent minima, when accompanied by a single-bond/double-bond rearrangement in the seven-membered pseudoaromatic ring, as shown below.

258 TIMOTHY S. ZWIER
Hx ,,H
At the ground-state zero-point level, the tunneling splitting is only 0.99 cm-1, 43 making the tunneling sensitive to quenching by asymmetric perturbations from its surroundings. In the tropolone-H20 complex, water can hydrogen bond to tro- polone in any one of several sites. The two lowest energy sites are exterior to the keto oxygen, or in a cyclic interior structure in which the water molecule acts simultaneously as H-bond donor and acceptor.
HX,
H /(3.. I H . H\
�9 """ 0 0
Tropolone-H~O exterior i s o m e r Tropolone-H20 ring isomer
Recent studies of the near-infrared spectroscopy of the tropolone-HzO complex have been carried out by our group :e and by Mikami and coworkers. ~ The combined insight provided by the FDIR spectra, recent S~<---S O spectroscopy from the group of Sekiya, as and ab initio calculations 2e implicate the exterior structure as most consistent with the data. However, a rotationally resolved spectrum would still be helpful. Within the context of this review, the FDIR spectra provide a striking comparison between the OH stretch spectral signatures of the intramolecular and intermolecular OH.-.O H-bonds. The fluorescence-dip IR spectrum from our work 2e is shown in Figure 5. Three OH stretch fundamentals are observed in the spectrum, and can be assigned nominally to a free OH stretch on the water molecule (3724 cm-l), a hydrogen-bonded OH stretch of water (3506 cm-1), and the intra- molecularly H-bonded OH stretch of tropolone (-3150 cm-a).
In intermolecularly H-bonded complexes, the strength of the hydrogen bond is correlated with three features of the X-H stretch IR intensity: the magnitude of the frequency shift, the integrated absorption intensity, and (in many cases) the breadth of the transition, a Intramolecular H-bonds, on the other hand, experience large frequency shifts without the corresponding large intensity increase. 8 This is dem- onstrated in striking fashion in the spectrum of Figure 5. The intermolecularly H-bonded OH stretch fundamental has a frequency shift from the free OH stretch of 218 cm -1. Its intensity is artificially reduced in Figure 5 by the lower LiNbO s OPO power in the narrow frequency range from 3490-3510 cm -1 region. 2e After correction for the OPO power, the 3506 cm -~ transition is several times more intense

Chains, Cycles, and Cubes 259
100
80
.~_ 60
._o s
o
40
0
20
0
-1 I I I I I 3 0
/ Water Free OH
Water H-bonded OH
I
Tropolone OH |
I I I I I I I 2soo 3000 3zoo 3400 3 ~ 3soo 4000
IR Frequency (cm "l)
Figure 5. Fluorescence-dip IR spectrum of the tropolone-H20 complex.
than the free OH stretch, as is anticipated for intermolecularly H-bonded OH stretch transitions. In contrast, the intramolecularly H-bonded OH stretch fundamental is shifted by 575 cm -1, yet its integrated intensity is only about one-fourth that of the intermolecularly H-bonded transition. The conclusion presented by the tropolone- H20 complex is similar to that derived from previous studies in the condensed phase; 8 that intramolecular H-bonds produce very large frequency shifts and extensive broadening without the corresponding increase in intensity.
There are obvious differences between the intramolecular and intermolecular H-bonds in TrOH-H20. First, the intramolecular H-bond is strongly bent, with the O-H bond calculated to be 38 ~ relative to a line joining the oxygen atoms. 26 Second, the calculated O-O separation in tropolone is only 2.50 /~ (using DFT with Becke3LYP functional and 6-31 +G'[2d,p] basis set), 26 much shorter than the 2.82 ,~ distance calculated for the water-keto O-O separation in the exterior isomer at the same level of theory. Finally, the intramolecular H-bond allows electronic structural effects induced by the H-bond to be felt throughout the framework of the tropolone molecule in a way that intermolecular H-bonds do not. The translation of these structural differences into the observed vibrational frequency shifts and intensities is correctly reproduced by the harmonic vibrational frequency results from both ab initio and DFT methods. Nevertheless, the connection between the

260 TIMOTHY S. ZWlER
crowded, highly nonlinear, intramolecular H-bond and its OH stretch spectral signatures (large frequency shift, small intensity increase) lacks a simple physical explanation, pointing to a clear need for further theoretical and experimental work.
Finally, the breadth and complexity of the bands are also highly mode-specific and clearly run counter to density-of-states arguments. Despite being the highest frequency mode, the free OH stretch transition (3724 cm -1) is instrumentally sharp (1.8 cm -1 FWHM). The water hydrogen-bonded OH fundamental is also a rather sharp transition, but is flanked by three close-lying satellite bands 13, 23, and 34 cm -1 above it. The tropolone OH absorption is in the same frequency region as in the bare molecule, but broadened to over 100 cm -1 in TrOH-H20. Distinct substructure in the band is present, with an average spacing of 10-15 cm -1. The breadth of the intramolecular OH stretch reflects the strong coupling of this "crowded" bond with background states at that energy. The overall breadth of the band is most likely dictated by 2:1 Fermi resonances with several modes in the molecule, among them being the C-H bend, O-H bend, and keto stretch. These resonances are present in the intramolecular OH stretch due to the large shift down in frequency of the intramolecularly H-bonded OH stretch from its comparative isolation in a non-H-bonded environment.
3.3. Hydrogen-Bonded Chains: Benzene-(Water)2, Benzene-(Methanol)2, Benzene-(Methanol)3, and
(Benzene)z-(Methanol)3
In this section and those which follow, the larger benzene-(water) n and benzene- (methanol),,, clusters are used as examples of several important H-bonding solvent topologies. In all the benzene-(ROH),, clusters studied to date (R = H, CH3), benzene resides on the surface of an (ROH)~ cluster in which all n solvent molecules are bound together in a single (ROH) n unit. The surface-attached benzene molecule then serves both as a means for size-selection of the cluster and as a weak symmetry-breaking perturbation for the (ROH),, cluster. The H-bonding structures represented by these clusters include chains, cycles, cubes, and other three-dimen- sional networks, which will be discussed in turn in Sections 3-6. Here we focus attention on the H-bonded solvent chains formed in benzene-(water)2 ,14'46-48 benzene-(methanol)2 , benzene-(methanol)3, 38 and (benzene)2-(methanol)3 .18 In what follows, a short-hand notation for the clusters will be used in which benzene (B), water (W), and methanol (M) are referred to by a single letter.
The RIDIR spectra of BW 2 and BM 2 are shown in Figure 6a and b, respectively. The OH stretch absorptions are closely analogous to those in the free water 49'5~ and methanol 51'52 dimers, in which one OH group acts as H-bond donor and the other oxygen atom as H-bond acceptor in the OH...O H-bond. Both spectra are consistent with structures in which the H-bonded dimer is bound to one side of benzene via the ~ H-bond on the acceptor molecule. One effect of the n H-bond is to reduce the frequency of the acceptor OH stretch from its monomer value (zero on the relative

Chains, Cycles, and Cubes 261
4
. . . . I . . . . I . . . . " I . . . . I ' ' ' I ' '
D
D ~
. .
a>
[ " . . . . . . - i - I - 7 - - / - - - I - , , , i I - - , - T - - I , , , , l . . . . . . .
-400 -300 -200 -100 0 100
Frequency Shift (cm "1)
Figure 6. RIDIR spectra of (a) benzene-(H20)2, (b) benzene-(CH3OH)2, and (c) benzene-(CH3OH)3. (d) The spectrum calculated for benzene-(CH3OH)3.
frequency scale of Figure 6). This is most clearly evident in BM 2, where the rc H-bond shifts the frequency of the acceptor OH stretch to 3605 cm -1, 76 cm -1 lower than the OH stretch in the methanol monomer. This frequency shift is almost twice that in BM 1, reflecting a cooperative strengthening of the n H-bond induced by the presence of the second methanol. The donor OH stretch absorptions, which are the lowest frequency bands in both spectra, are also shifted down in frequency from their values in free WE 49'50 and ME 51 (by 50 and 68 cm -1, respectively) in the presence of benzene. This indicates a cooperative strengthening of the donor OH H-bond induced by benzene.
The RIDIR spectrum of BM 3 (Figure 6c) is shown above the calculated spectrum (Figure 6d) for BM 3. The close correspondence with calculation and with the matrix-isolated M 3 chain, 53 when combined with the lack of such correspondence for other H-bonding topologies (such as cyclic or T-shaped54), gives a firm assign- ment for the methanol trimer in BM 3 as a H-bonded chain. This structure, shown schematically in Figure 7, is of particular interest because the lowest energy

262 TIMOTHY S. ZWlER
~ e eo e
Figure 7. Schematic diagram of the structure of benzene--(methanol)3, in- corporating a methanol trimer chain whose terminal OH is ~ H-bonded to benzene's ~ cloud.
structure for the free methanol trimer is cyclic, not chain. 54 The presence of benzene thus reverses the stabilities of these H-bonding topologies.
The reasons for this reversal in stability are clear. Cyclic M 3 has three strained methanol-methanol H-bonds and no free OH groups available for r~ H-bonding to benzene. In forming the chain M 3, on the other hand, two strong, linear methanol- methanol H-bonds can be formed, with the terminal methanol OH available to form a cooperatively strengthened r~ H-bond with benzene. In BM 3, the rt H-bonded OH stretch has a frequency shift o f -92 cm -l, approaching that of the donor OH group in the methanol dimer (-108 cm-1). The strong interaction with benzene also increases the intensity of the r~ H-bonded OH stretch absorption relative to that of free OH as expected of a H-bonded OH group.
It should be noted that the methanol trimer also forms a H-bonded chain in (benzene)2-(methanol) 3 clusters. 18 A combination or R2PI, IR-UV hole-burning and RIDIR spectroscopies has been used to identify and assign two isomeric forms of B2M 3 in which the M 3 chain is attached to a distorted benzene dimer "T" via a
H-bond with either the stem (isomer A) or top (isomer B) of the benzene dimer T. The R2PI and hole-burning spectroscopies supply the UV spectrum, and deci- sively assign absorptions due to the two distinct benzene chromophores in the B2M 3 isomers. The RIDIR spectra of both isomers are clearly those of a methanol trimer chain, with absorption frequencies and intensities bearing a close one- for-one-correspondence with the corresponding bands in BM 3. This close corre- spondence provides some evidence that the OH stretch spectral signatures of the methanol trimer chain are robust to perturbations by its surrounding environment, a necessity for its clear identification in other media.
In summary, a distinguishing spectral signature of H-bonded chains is the presence of the "free" terminal OH. In the presence of benzene, this OH group is
H-bonded to benzene, and thereby shifted to lower frequency by 40-100 cm -1, depending on the length of the chain. The other OH groups have frequencies dictated both by their positions in the chain and the strength of coupling with other

Chains, Cycles, and Cubes 263
OH groups in the chain. These absorptions occur in the same frequency region as those due to cyclic (ROH),, clusters of the same size.
3.4. Hydrogen-Bonded Cycles: Benzene-(Water)3_s and Benzene-(Methanol)4_6
The RIDIR spectra of BW n and BM m clusters provide several examples of cyclic cluster topologies and their spectral signatures; specifically when n = 3-5 and m = 4-6. 38,46,47 Because the corresponding pure W,, and M,,, clusters also have cyclic lowest-energy structures, much insight can be gained from a comparison of the BW n and BM m clusters with their pure Wn or M m counterparts. Saykally and cowork- ers 55-59 have recently obtained rotationally resolved spectra of the W n clusters with n = 3-5 in the far-infrared which confirm a cyclic structure for the clusters and determine the basic structural parameters and tunneling behavior of the clusters. The trimer, tetramer, and pentamer have planar or near-planar heavy-atom configu- rations in which the free OH groups alternate positions above and below the plane of the ring. The cooperative strengthening of the H-bonds with increasing cycle size leads to a decreasing O-O separation which is asymptotically approaching that of bulk ice. 6~ Tunneling between multiple minima involving the flipping of free H-atom positions is quite facile. 55-58'62-64
The OH stretch infrared spectra of cyclic W n clusters with n = 3-5 and M,,, clusters with m = 3 have recently been recorded by Huisken and coworkers. 49-51'65 A schematic diagram of the cyclic W n spectra is shown in Figure 8 to illustrate their general features. The OH groups in the cyclic clusters divide into two groups: free OH (F) groups exterior to the ring and single-donor (S) OH groups involved in the H-bonded ring. The large difference in force constants between these two groups changes the form of the OH stretch normal modes from the symmetric and antisymmetric stretch modes found in the water monomer. All free OH stretch fundamentals occur at about 3715 cm -1, approximately the mean of the symmetric stretch (3657 cm -1) and antisymmetric stretch (3756 cm -1) of the water monomer. They appear in a near-degenerate clump due to the very weak coupling between the free OH groups. In the single-donor region, the high symmetry of the cyclic clusters leads to a very simple spectrum for cyclic W~. As shown in Figure 8, the cooperative strengthening of the H-bonds produces single-donor absorptions which shift to lower frequency as the size of the hydrogen-bonded cycle increases. As Honegger and Leutwyler 66 have pointed out, in the pure, cyclic (H20) n clusters, the high symmetry of the clusters and the strong coupling between the H-bonded OH groups lead to single-donor OH stretch vibrations which are delocalized throughout the ring. The spread in single-donor frequencies then reflects the strength of the coupling between hydrogen bonds. The normal modes differ primarily in the phase of oscillation of the individual OH bonds in the mode, reminiscent of longitudinal phonons with differing numbers of nodes. 66
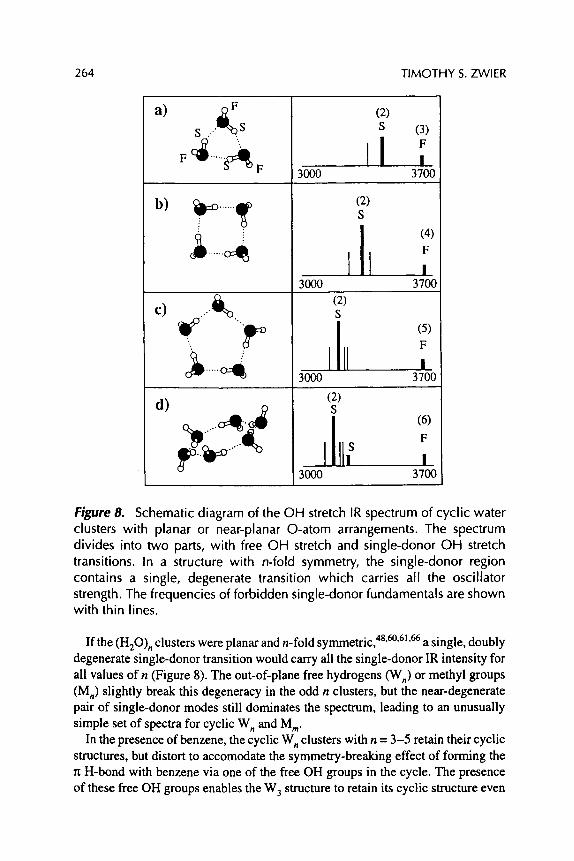
264 TIMOTHY S. ZWlER
a)
b)
c)
S . . . . ~ S
. . . . .
3000
...'~ 3000
3000
3000
(2) s
ll (2) s
(3) F I
3700
(4) F
37100
(2) S
(5)
Iii 3700
(2) S
F S
II , , 3700
Figure 8. Schematic diagram of the OH stretch IR spectrum of cyclic water clusters with planar or near-planar O-atom arrangements. The spectrum divides into two parts, with free OH stretch and single-donor OH stretch transitions. In a structure with n-fold symmetry, the single-donor region contains a single, degenerate transition which carries all the oscillator strength. The frequencies of forbidden single-donor fundamentals are shown with thin lines.
If the (H20)n clusters were planar and n-fold symmetric, 48'6~ a single, doubly degenerate single-donor transition would carry all the single-donor IR intensity for all values of n (Figure 8). The out-of-plane free hydrogens (W n) or methyl groups (M n) slightly break this degeneracy in the odd n clusters, but the near-degenerate pair of single-donor modes still dominates the spectrum, leading to an unusually simple set of spectra for cyclic W n and M m.
In the presence of benzene, the cyclic W n clusters with n = 3-5 retain their cyclic structures, but distort to accomodate the symmetry-breaking effect of forming the
H-bond with benzene via one of the free OH groups in the cycle. The presence of these free OH groups enables the W 3 structure to retain its cyclic structure even

Chains, Cycles, and Cubes 265
Figure 9. Optimized structures for (a) W 3 and (b) BW 3 at the MP2/6-31 + G[2d, p] level of theory (ref. 48).
in the presence of benzene, since a n H-bond can be formed with benzene without rearranging to the chain structure, as occured in BM 3. Nevertheless, the largest effect of benzene on W n is observed for W 3, whose bent, weak H-bonds are most sensitive to external perturbations.
Figure 9 presents the structures calculated 48 by ab initio methods for W 3 and BW 3. The effects of benzene are clearly seen in the BW 3 RIDIR spectrum of Figure 10a. The OH stretch fundamental at 3657 cm -1 (shift -49 cm -1) is assigned to the
H-bonded OH stretch, consistent with formation of a weak H-bond between one of the free OH groups on cyclic W 3 and benzene. In the single-donor region, the once-degenerate pair of single-donor transitions are now resolved into two bands at 3550 and 3508 cm -1 and the forbidden transition at 3423 cm -1 has gained significant intensity. Figure 1 la and b compare the RIDIR spectrum of BW 3 with that calculated by ab initio methods. The qualitative effect of benzene is admirably reproduced by calculations 48 employing either MP2 ab initio or density functional theory with the Becke3LYP functional and a 6-31 + G[2d, p] basis set, but both calculations somewhat overestimate the magnitude of the vibrational frequency shifts. Quantitative accuracy requires QCISD methods which have not been ex- tended to B W,,. Nevertheless, the MP2 and DFT calculations indicate that the asymmetric distortions of the W 3 ring when it is complexed to benzene lead to a partial localization of the single-donor vibrational modes. This localization induces intensity in the lowest frequency OH stretch transition (which is forbidden in W3), and breaks the degeneracy of the other two OH stretch modes.
The RIDIR spectra ofBW 4 and BW 5 (Figure 10b and c) follow a similar pattern. The free OH stretch transitions appear, as always, in the 3710-3725 cm -1 region, followed by a rt H-bonded OH stretch transition at 3652 (n = 4) or 3646 cm -1 (n =

266 TIMOTHY S. ZWlER
_=
~d v
O
~D
�9 ' I ' ' ' I ' ' ' I ' ' ' I
�9 ' 2 0 0 ' ' ' ! I J i ! , J , ! 3 3400 3600 3800
Frequency (cm "l)
' ' I ' ' ' I ' ' ' I ' ' ' I ]
d)
3200 3400 3600 3800
Frequency (cm "l)
Figure 10. RIDIR spectra in the OH stretch region of the benzene--(ROH)n clusters in which (ROH)n is cyclic. (a) BW3, (b) BW4, (c) BW 5, (d) BM4, (e) BMs, and (f) BM6.
5). A set of single-donor transitions characteristic of a cyclic W n subcluster are shifted further to the red as n increases, as anticipated from the pure W n results. The perturbing influence of benzene is sufficient to induce intensity in most of the single-donor OH stretch transitions, due to partial localization of the modes promoted by benzene. 48 In BW 4, we tentatively assign the central single-donor transition as an unresolved doublet and the upper and lower single-donor transitions as the once-forbidden satellite bands (Figure 8). The distribution of intensifies in the BW 5 single-donor region suggests that the W 5 cluster may distort away from planar in the presence of benzene.
The RIDIR spectra of the cyclic BM= clusters with m = 4-638,54 are shown in Figure 10d and f. The dramatic changes in the RIDIR spectra relative to those for the smaller BM 3 clusters (Figure 6b and c) demonstrate that a structural change from H-bonded chains to H-bonded cycles occurs at m = 4. Since each methanol monomer possesses a single OH group, formation of a H-bonded M= cycle ties up all OH groups in OH..-O H-bonds. The OH stretch infrared spectrum then consists of a set of single-donor transitions shifted by over 300 cm -1 from the free OH transitions. Unlike the W, clusters which retain free OH groups which can rt H-bond

Chains, Cycles, and Cubes 267
to benzene, the cyclic M m subunits interact only weakly with benzene. The calcu- lated IR spectrum for cyclic M 4 is compared with experiment in Figure 11 c and d. The presence of benzene, which has a fairly dramatic effect on the single-donor transitions in the cyclic W, clusters, produces a comparatively modest change in the cyclic M 4 spectrum. In particular, the forbidden satellite bands predicted for cyclic M 4 in the absence of benzene (Figure 1 ld) gain only weak intensity in its interaction with benzene. The degeneracy of the pair of transitions carrying all the IR intensity is broken, but the splitting is only partially resolved in the RIDIR spectrum of BM 4 (Figure 1 lc).
The density functional theory calculations (Becke3LYP 6-31+G*) 54 used for comparison with experiment in Figure 11 provide reasonable quantitative agree- ment with experimental vibrational frequency shifts for the M m clusters. Analogous
o,,,~
~
I ' ' ' I ' ' ' 1 ' ' ' 1 , ' '
a)
. . . . . . .
b)
. . . . . . . . . . . . . . . . . . . . . . . . . . . . . . . . . . . . . . . . . . . . . . . . . . . . . . . . . . . . . . . . . . . . . . . . . . . . . . . . . . . . . . . . . . . . . . . . ~ .....................................
c) .>
-600 -400 -200 0
Frequency Shift (cm "1)
Figure 11. (a) RIDIR spectrum of BW3. (b) IR spectrum calculated for BW 3 using MP2 results for BW3, (c) RIDIR spectrum of BM4. (d)IR spectrum calculated for M4 using DFT Becke3LYP with a 6-31 +G* basis set.

268 TIMOTHY S. ZWIER
calculations on tetramer chain, branched chain, and branched cyclic clusters lack even a qualitative correspondence with experiment, strengthening the assignment
of the M 4 subcluster in BI~,14 as cyclic. The RIDIR spectra of BM 5 and BM 6 (Figure 10e and f) also show only single-
donor transitions characteristic of a cyclic M m subcluster. Here the broadening and congestion of the transitions are such that the OH stretch fundamentals appear more-or-less as a single band, with only hints of underlying structure survivir, g. Nevertheless, in BM 6, three similar-intensity bands are partially resolved (Figure 1 Of). This is at odds with the calculations of the chair form of the cyclic hexamer in which a single, degenerate pair of bands carries all the IR intensity. Instead, the splitting and intensity distribution is better reproduced by a distorted boat form of the cyclic hexamer 38 which spreads its intensity over several transitions in distorting
away from planarity. While the present data is not conclusive in this regard, the observed intensity pattern suggests that benzene may serve as a template about which the methanol hexamer distorts in order to maximize its dispersive interac- tions with the benzene ring. As Figure 12 shows, the low-energy cost associated with distortion to a boat structure (~ 1.5 kcal/mol) produces a cavity which can accept benzene "edge on" with "bow" and "stem" methyl groups interacting with opposite sides of the r~ cloud of benzene, reminiscent of the beginnings of a first solvent shell around benzene.
Finally, both the BW n and BM m clusters show distinct evidence of mode-selective broadening in the OH stretch absorptions. In BW 4 and BW 5, the single-donor transitions are distinctly broader than the free OH and rt H-bonded OH stretch fundamentals, consistent with the stronger coupling with intermolecular modes expected for the single-donor modes. More dramatic effects are seen in BM m, where the transitions change from instrument-limited for the chain M m subclusters with m < 3 to broad, congested bands spread over 50-100 cm -1 for the cycles with m = 5,6.
In liquid water and methanol at room temperature, 1'2 the large breadths of the OH stretch bands (several hundred wavenumbers) are due to a complicated super- position of homogeneous and inhomogeneous contributions, with the latter thought to dominate. 7'67'68 The spectra of Figure 10 are those out of the zero-point vibra-
tional level of a single conformation of a finite-sized H-bonded, gas-phase cluster held at a temperature of a few Kelvin. The spectra thereby serve as a limiting case for comparison with the spectra of room-temperature liquids. The observed breadths are due to mixing of the OH stretch fundamental with a high density of background states at that level. At the same time, comparatively little intensity in combination bands built on the OH stretch fundamentals is evident. The nature of the background states responsible for the broadening of the fundamentals and a physical understanding of the order-of-magnitude of the breadths await further experimental investigation and theoretical insight.

Chains, Cycles, and Cubes 269
~
Figure 12. Schematic picture of a possible structure for BM6 which qualita- tively accounts for the intensity distribution of the single-donor OH stretch bands in the RIDIR spectrum of BM 6 (Figure 10f). Note the cavity formed by this distorted boat form of M6 which can accomodate interactions of benzene with both sides of the ring.
3.5. Three-Dimensional H-Bonded Networks: Benzene-(Water)6,r
The cyclic lowest energy structures just described for the water trimer, tetramer, and pentamer have water molecules with coordination numbers of two, preferring to form strong, linear H-bonds as single-acceptor/single-donor (AD) monomers. However, in its condensed phases, the great majority of water molecules have coordination numbers of four, 69 forming two H-bonds as donor and two as acceptor in nominally tetrahedral sites. The development in the preferred H-bonding topolo- gies between these two size extremes is exceedingly interesting since the observed lowest energy structure(s) result from a delicate interplay between the requirements of two-body and multibody terms in water's intermolecular potential. In particular, the water hexamer and heptamer provide the first examples of water clusters for which three-dimensional H-bonded networks effectively compete with the cyclic structure for the lowest energy H-bonding arrangement. 7~
Figure 13 presents the RIDIR spectra of the dominant BW 6 and BW 7 species observed in our expansion mixtures. The spectra provide immediate evidence for a major structural shift in these clusters. While the BW n (n = 3-5) spectra (Figure

270 TIMOTHY S. ZWlER
10a and c) possess a widening gap between the n H-bonded and single-donor OH stretch regions, at n = 6 several transitions appear in this gap between 3400 and 3600 cm -1. Of the several water hexamer structures within a few kcal/mol of the minimum, high-level MP2 calculations identify cage (Figure 14b) and prism (Figure 14c) network structures with similar energies to the cyclic (Figure 14a) hexamer. The cage structure has two double-donor water molecules and a rather asymmetric structure, while the prism hexamer has three double-donor water molecules and higher symmetry. When extrapolated to the infinite basis-set MP2 limit, the cage structure is calculated to be slightly more stable than cyclic (by 0.08 kcal/mol) and prism (by 0.13 kcal/mol) after ZPE corrections. 77
The comparison with the ab initio calculations on the free W 6 cluster shows that the transitions in the 3400-3600 cm -1 region are indeed due to double-donor water molecules formed when W 6 (and W 7) take on three-dimensional network structures.
F t D
�9 ,,,,d
' ' I ' ' ' I ' ' ' i ' ' ' I ' ' ' I
F
D 71;
s
3000 3200 3400 3600 3800
Frequency (cm l )
Figure 13. RIDIR spectra ofthe dominant form of (a) BW 6 and (b) BW7 cluster found in the expansion.

Chains, Cycles, and Cubes 271
Figure 14. Lowest energy water hexamer structures of three structurally distinct types: (a) cyclic, (b) cage, and (c) prism. MP2 ab initio calculations using a 6-31+G[2d,p] basis set including zero-point energy and basis set superposition error corrections predict relative binding energies for cycle and prism which are 0.08 and 0.13 kcal/mol higher than the cage.
Whereas the cyclic water hexamer is computed to have a frequency gap of almost 400 cm -1 between free OH (F) and single-donor OH (S) transitions, the cage (Figure 15a) and prism structures (Figure 15b) have four and six transitions in the double- donor region (D), respectively. The cyclic water hexamer is thus ruled out as the structure present in BW 6.
The computed spectra suggest a means of distinguishing between the cage and prism structures in the experimental spectrum. The number of resolved double- donor bands in the experimental spectrum (Figure 13a) is better matched by the

272 TIMOTHY S. ZWlER
four double-donor transitions characteristic of the cage W 6 s t ruc tu re (Figure 15a). Furthermore, the free OH stretch region, with its set of distinct transitions spread over more than 20 cm -1, is also more consistent with the cage than prism structure. The cage structure has several uniquely positioned free OH groups, each with its characteristic absorption frequency (Figure 15b), consistent with experiment. On the other hand, the higher symmetry of the W 6 prism leads to a calculated set of free OH stretch bands nearly degenerate with one another.
The computed spectrum for free W 6 does differ from the BW 6 spectrum in not having a n H-bonded OH stretch and in having a different spacing of transitions in the single-donor region. Due to the highly strained structures for W 6, calculated OH stretch spectra are sensitively dependent on the position of benzene attachment and the level of theory used. Nevertheless, it is the cage W 6 structure that we tentatively assign to the W 6 subcluster in BW 6. Such an assignment is consistent with the far-IR studies of Saykally and coworkers 59 who have recorded fully
r~" '"I .... J"'"l .... i .... I .... i .... I .... J .... I .... I .... l,,J,I .... I .... I''"l''"
a) W 6 Cage (2 double donors)
b) W 6 Prism (3 double donors)
S D
,,,,I,,,, I,,,,I,,,,I,,,, I,,,,I,,,,I,,,, I,, u I,,,,I,,,, I,,, i I,,,, I[,,,I,,,iI,,,,
-700 -600 -500 -400 -300 -200 - 100 0
Figure 15. Simulated spectra for (a) W 6 (cage), and (b) W 6 (prism) structures using the vibrational frequencies and IR intensities calculated by Kim et al. (ref. 71) at the MP2 6-31+G(2d,p) level of theory. The Gaussian widths are chosen to correspond to those of nearby transitions in the experimental spectrum (Figure 13a).

Chains, Cycles, and Cubes 273
resolved VRT spectra of this s a m e W 6 structure formed in a slit supersonic expansion.
The spectrum of BW 7 (Figure 13b) is also characteristic of a three-dimensional network structure. The comparison of the spectra ofBW 6 and BW 7 shows a transfer of intensity from the free OH region into the double-donor region, as one would expect if the water heptamer in B W 7 has more than two double-donor water molecules. Here the double-donor transitions are more clearly separated from the single-donor transitions than in BW 6. Six double-donor transitions are resolved or partially resolved (at 3591, 3580, 3570, 3522, 3509, and 3456 cm-1), pointing to the presence of three double-donor water molecules in BW 7.
3.6. Hydrogen-Bonded Cubes: Benzene-(Water)8
The gas-phase water octamer (W8) holds a unique position among water clusters. From a structural viewpoint, both ab initio 78-81 and model potential 78'82-86 calcu- lations predict that the lowest energy structure for the octamer is nominally cubic, with the eight tricoordinated water molecules taking up positions at the corners of the cube. There are fourteen cubic structures for the water octamer which differ only in the orientations of the H-bonds in the cube. Of these, the S 4 and D2a symmetry structures shown in Figure 16a and b are calculated to be at least 2 kcal/mol more strongly bound than the others. 82 These species may be viewed as being formed from the dimerization of two water tetramers with the single-donor H-bonds oriented in the opposite (D2d) or same ($4) directions in the two tings.
The R2PI spectra monitoring the RW +-nW+ " " 6 ~'"S mass channels in the origin region of the SI~---S 0 transition of benzene are shown in Figure 17a and c, respectively, s7 Since the S l~---S 0 transition of benzene is electric dipole-forbidden, the transitions in this region are weakly induced by the symmetry-breaking effect of the water molecules complexed to benzene. BW n clusters with n = 1-6 fragment following one-color R2PI by loss of a single water molecule, but beginning at n = 6, intensity
W + + is seen in both B ,,-1 and In the and mass BWn_ 2 channels, as BW~ BW~ channels, a set of four transitions is clearly seen. These transitions dominate the spectrum in the BW~ mass channel, and are assigned to the BW s neutral cluster.
UV-UV hole-burning spectroscopy has been used to determine whether the R2PI transitions assigned to BW s are assignable to a single structural isomer. The hole-burning spectrum (not shown) clearly divides into two parts, indicating the presence of two structural isomers, BW8(I ) and BW8(II ). Each is dominated by a 60 I doublet (at 64.1 and 68.3 cm -1 above the 6~ transition of benzene for I and II, respectively) arising from the weakly broken degeneracy of the 61 level in the presence of the water octamer.
Figure 18a and b present the RIDIR spectra of BWs(I) and BWs(II) recorded free from interference from one another by monitoring their respective transitions in R2PI. The spectra are strikingly similar to one another and comparatively simple, belying similar, high-symmetry W s structures. As with the network BW,, clusters

a)
c)
1
....... ; d e j o , Hz~ I I
, ? 031" ,
j. ~_ I W" t, / L ~ - " ~ r " ~ : ...... ~ '~
b)
d)
jq~..~OI .......... .~H~.C~o ~ O 4 Hi6
.... .... I O ~ . - - "
N t ~ - " : "
' (~ k , S ~ II
274 TIMOTHY S. ZWIER
Figure 16. (a) 54 and (b) D2dstructures calculated for the water octamer. The cubic structures can be viewed as two cyclic tetramers (top and bottom) in which the direction of the hydrogen bonds in the two cycles is the same (54) and opposite (D2d). (c) BW8(54) and (d) BWs(D2d) structures.
with n = 6 and 7, the OH stretch absorptions can be readily assigned to free OH (F, 3713.5 cm-1), n H-bonded OH (n, 3637 cm-l), double-donor OH (D, ~3550 cm-]), and single-donor OH transitions (S, below 3300 cm-]). BW8(I) has two resolved double-donor bands which dominate the double-donor transitions, while BW8(II) has a single band dominating this region.
87 Density functional theory (DFT) calculations of the structures, binding ener- gies, harmonic vibrational frequencies, and IR intensities have been carried out on the S 4 and D2a W 8 isomers both in the presence and absence of benzene. The optimized structures calculated for BW8(S4) and BW8(D2a) are shown in Figure 16c and d, respectively. The binding energies calculated for the Wa(D2~ ) and W8($4) clusters are nearly identical. In the absence of vibrational zero-point corrections, the D2a structure is predicted to be 0.06 kcal/mol more strongly bound than S 4, but this energy ordering is reversed after ZPE corrections are made.

Chains, Cycles, and Cubes
I ' I ' I ' I '
275
i i !
i |
i !
i
i i l i i i i i l " i i
i
I , I , I , I
0 40 80 120 Relative Frequency (cm 1)
Figure 17. One-color resonant two-photon ionization spectra of benzene- (water)n clusters near the origin of the Sl <--So transition of benzene monitoring the benzene(water ) + ions with (a) n = 6, (b) n = 7, and (c) n = 8. The zero of the frequency scale is the frequency of the (forbidden) SI<--S0 origin of benzene monomer (38086 crn- ). The assignment of transitions to BW7 and BW8 are given in the spectrum.
In the free DE, / and S 4 water octamers, the oxygen atoms do not form a perfect cube, but distort to accomodate shorter H-bonds involving AAD-->ADD (2.64/~) and longer ADD-->AAD (2.83 /~) hydrogen bonds. Here "A" and "D" refer to acceptor and donor, respectively. The presence of benzene causes only small further distortions in the S 4 and DEd W 8 clusters.
The computed OH stretch IR spectra for BW8(S 4) and BWa(D2d) are simulated in Figure 19a and b by placing gaussian widths corresponding to experiment on the computed transitions. While the calculations tend to overestimate the magnitudes of the vibrational frequency shifts, the overall agreement with experiment is sufficiently good to allow an assignment of the BW 8 isomers responsible for the observed spectrum to be made. Particularly in the double-donor region the OH

276 TIMOTHY S. ZWlER
"I't r~'ai'r~'l "I" ,, "l r" 'l~"lvw y~
i
, - ~ , - I r l l r r r -
i
!
i I
w J ~ ~ w ~ I ~ ~ w ~ I w w ~ ~ i w ~ ~ i J ~ w ~ I ~ ~ ~ w I ~ ~ ~ I ~ ~ ~ ~ I
3000 3200 3400 1 3600 3800 IR F r e q u e n c y ( c m )
Figure TS. Resonant ion-dip IR spectra of the transitions (a) 64.1 cm -1, and (b) 66.3 cm -1 above the 6~ transition of free benzene, corresponding to BWs(I) and BWs(II) from Figure 17a and b, respectively. The spectrum in (a) is assigned to BW8(54 cubic) and that in (b) to BWs(Dzd cubic). The OH stretch fundamentals assigned to free OH (F), • H-bonded OH (n), double-donor OH groups (D), and sinRle-donor OH groups (53 are indicated. The sharp transi- tions at 3048 crn - r and 3101 crn -1 are C-H stretch fundamentals of the benzene molecule in the cluster.
stretch spectra calculated for the S 4 and Dza structures ofW 8 differ from one another in precisely the way observed experimentally. In the W 8 clusters, the strongest double-donor vibrations are nominally antisymmetric stretch vibrations delocal- ized over the double-donor water molecules in the cube. In the Dza isomer, a doubly degenerate set of vibrations at 3645 cm -] carries all the anti-symmetric double- donor (D-a) intensity, whereas in the S 4 isomer there are double-donor bands separated by 20 cm -] that carry appreciable intensity. This difference is maintained in the presence of benzene. The presence of the benzene splits the allowed degenerate pair of vibrations in both the Dza andS 4 isomers (by about 10 cm-]), but this splitting is insufficient to be resolved in the spectrum given the inherent

Chains, Cycles, and Cubes 277
I i
S
I ! ! I 1 I ' I"
D-a
~: F
A L a)
Z I
-800
D-a
l I L I l I i -700 -600 -500 -400 -300 -200 -100 0
Frequency Shift (cm "1)
Figure 19. OH stretch vibrational frequency shifts and IR intensities calcu- lated for the OH stretch normal modes of (a) BW8(54) and (b) BWs(D2d). The DFT calculations employed the Becke3LYP functional and 6-31 +G[d,p] (26) and 6-31G(d) basis sets on the water and benzene molecules, respectively. Designations above the transitions are for free OH (F), x H-bonded OH (~), double-donor symmetric stretch (D-s), double-donor antisymmetric stretch (D-a), and single-donor (S) modes. The comparison with the experimental spectra of Figure 18 leads to an assignment of Figure 18a to the BW8(54) isomer and Figure 18b to BW8(D2d). The calculated transitions are given Gaussian widths corresponding to the experimental widths from Figure 18.
width of the transitions (20 cm-l). The matchup with the experimental spectra of Figure 18 leads to an assignment of BWs(I) as BWs(cubic $4)andBW8(II) as BW8(cubic DEe). Weaker transitions due to the symmetric stretch double-donor transitions are observed between 3450 and 3520 cm -l, also consistent with the predictions of the calculations.
The single-donor region (v < 3300 cm -1) undergoes a more dramatic change in benzene's presence than did the double-donor region. In the absence of benzene the single-donor vibrations are delocalized over all four single-donor OH groups in the cube, leading to a concentration of the IR intensity in a single transition (DEe) or a doubly degenerate set of transitions ($4). However, since the binding of benzene to the cubes occurs via the free OH group of one of the single-donor water molecules, the single-donor normal modes calculated for BWs(cubic DEe) and BWa(cubic

278 TIMOTHY S. ZWlER
$4) become partially localized. This partial localization induces intensity in other- wise forbidden transitions and breaks the degeneracies of other levels as shown in Figure 19.
The RIDIR spectra of Figure 18 provided the first spectral data on the cubic D2d and S 4 structures of the water octamer. The single benzene molecule attached to the surface of these isomeric structures provides a means of selectively recording their IR spectra free from interference with one another, while causing a modest local distortion in the W s structures. The OH stretch frequencies and the intensities and breadths of the IR transitions provide unique signatures of these cubic struc- tures, distinguishing them from the bicoordinated cyclic structures of the water trimer to pentamer, and the tetra-coordinated water molecules found in liquid water and ice. Perhaps their most striking characteristic is the strong double-donor transitions at 3550 cm -1, which are absent from both bi- and tetra-coordinated structures.
4. CONCLUSION
The molecular clusters serving as the subject of this review, benzene-(ROH)n clusters with R = H, CH3, and tropolone-H20, have provided a remarkably diverse set of hydrogen-bonding structural types for study. In the simple bimolecular complexes benzene-H20 and tropolone-H20, the unique spectral characteristics of ~ H-bonds and intramolecular H-bonds have been explored. Larger benzene- (H20) n and benzene-(CH3OH)m clusters with n = 2-8 and m = 2-6 provide examples of hydrogen-bonded chains, cycles, three-dimensional networks, and cubes. Given this diversity, the development of hydrogen-bonding topology in even larger W,, and M m clusters will be a rich area for future study, as will the study of isotopically substituted and mixed benzene-(water)n(methanol) m clusters.
ACKNOWLEDGMENTS
Many members of the Zwier group have contributed to the studies reviewed herein, including Nate Pribble, Chris Gruenloh, Fred Hagemeister, Joel Carney, Caleb Arrington, and Rex Frost. The delightful collaboration with Ken Jordan and Sharon Fredericks (Univ. of Pittsburgh), who carried out all the B Wn ab initio calculations, is also gratefully acknow- ledged. This research was supported by the National Science Foundation.
REFERENCES 1. Fall M.; Whalley, E. J. Chem. Phys. 1961, 34, 1554-68. 2. FalL M.; Ford, T. A. Canadian J. Chem. 1966, 44, 1699-1707. 3. Ikawa, S.-I.; Maeda, S. Spectrochimica Acta 1968, 24A, 655-665. 4. Bertie, J. E.; Labbe, H. J.; Whalley, E. J. Che~ Phys. 1969, 50, 4501-4520. 5. Franks, E The Properties oflce; Franks, E, Ed.; Plenum: New York, 1972, Vol. 1, p 115. 6. Knuts, S.; Ojamae, L.; Hermansson, K. J. ChenL Phys. 1993, 99, 2917-28.

Chains, Cycles, and Cubes 279
7. Hermansson, K.; Knuts, S.; Lindgren, J. J. Cheat Phys. 1991, 95, 7486-96. 8. Pimentel, G. C.; McClellan, A. L. The Hydrogen Bond; W.H. Freeman: San Francisco, 1960. 9. Legon, A. C.; Millen, D. J. Cheat Rev. 1986, 86, 635-57.
10. Leopold, K. R.; Fraser, G. T.; Novick, S. E.; Klemperer, W. Chem. Rev. 1994, 94, 1807-27. 11. Sandorfy, C. Topics Curr. Chem. 1984, 120, 41-84. 12. Garrett, A. W.; Zwier, T. S. Resonant Two-Photon Ionization Studies of Benzene-(Solvent) n
Clusters; Garrett, A. W.; Zwier, T. S., Eds.; World Scientific, 1994, Vol. 8, pp 129-188. 13. Gotch, A. J.; Zwier, T. S. J. Cheat Phys. 1990, 93, 6977-86. 14. Gotch, A. J.; Zwier, T. S. J. Cheat Phys. 1992, 96, 3388-401. 15. Garrett, A. W.; Zwier, T. S.J. Cheat Phys. 1992, 96, 3402-10. 16. Garrett, A. W.; Severance, D. L.; Zwier, T. S. J. Chem. Phys. 1992, 96, 7245-58. 17. Garrett, A. W.; Zwier, T. S. J. Phys. Chem. 1992, 96, 9710. 18. Pribble, R. N.; Gruenloh, C.; Zwier, T. S. Cheat Phys. Lett. 1996, 262, 627-632. 19. Page, R. H.; Shen, Y. R.; Lee, Y. T. J. Cheat Phys. 1988, 88, 5362-76. 20. Page, R. H.; Shen, Y. R.; Lee, Y. T. J. Cheat Phys. 1988, 88, 4621-4636. 21. Pribble, R. N.; Garrett, A. W." Haber, K.; Zwier, T. S. J. Cheat Phys. 1995, 103, 531-44. 22. Felker, P. M. Cheat Rev. 1994, 94, 1784. 23. Buck, U.; Gu, X.; Lauenstein, C.; Rudolph, A. J. Phys. Chem. 1988, 92, 5561-62. 24. Ebata, T.; Mizuochi, N.; Watanabe, T.; Mikami, N. J. Phys. Chem. 1996, 100, 546-550. 25. Frost, R. K.; Hagemeister, E C." Arrington, C. A.; Zwier, T. S. Cheat Phys. 1996, 105, 2595-604. 26. Frost, R. K.; Hagemeister, E C.; Arrington, C. A.; Schleppenbach, D.; Zwier, T. S.; Jordan, K. D.
J. Cheat Phys. 1996, 105, 2605-17. 27. Frost, R. K.; Hagemeister, E; Arrington, C.; Schleppenbach, D.; Laurence, G.; Zwier, T. S. J. Phys.
Chem. 1996, 100, 16835--42. 28. Augspurger, J. D.; Dykstra, C. E.; Zwier, T. S. J. Phys. Chem. 1992, 96, 7252-57. 29. Suzuki, S.; Green, P. G.; Bumgarner, R. E.; Dasgupta, S.; Goddard, W. A. I.; Blake, G. A. Science
1992, 257, 942-45. 30. Gutowsky, H. S.; Emilsson, T.; Arunan, E. J. Chent Phys. 1993, 99, 4883-93. 31. Atwood, J. L.; Hamada, E; Robinson, K. D.; Orr, G. W.; Vincent, R. L. Nature 1991, 349, 683-84. 32. Engdahl, A.; Nelander, B. J. Phys. Chem. 1985, 89, 2860-64. 33. Feller, D. J. Chent Phys. 1992, 96, 6104. 34. Chakravorty, S. J.; Davidson, E. J. J. Phys. Chem. 1993, 97, 6373. 35. Kim, J.; Lee, J. Y.; Lee, S.; Mhin, B. J.; Kim, K. S. J. Cheat Phys. 1995, 102, 310-17. 36. Rijdt, J. G. C. v. D.-v. d.; Duijneveldt, F. B. v. J. Cheat Phys. 1992, 97, 5019. 37. Kim, K.; Jordan, K. D. J. Phys. Chem. 1994, 98, 10089. 38. Pribble, R. N.; Hagemeister, E; Zwier, T. S. J. Cheat Phys. 1997. 39. Pribble, R. N.; Zwier, T. S. Unpublished results. 40. Scherzer, W.; Selzle, H. L. Private communication. 41. Scherzer, W.; Kratzchmer, O.; Selzle, H. L.; Schlag, E. W. Z Naturforsch 1992, 47a, 1248. 42. Arunan, E.; Gutowsky, H. S. J. Chent Phys. 1993, 98, 4294. 43. Tanaka, K.; Honjyo, H.; Tanaka, T.; Takaguchi, H.; Ohshima, Y.; Endo, Y. Unpublished results. 44. Mitzusuka, A.; Fujii, A.; Ebata, T.; Mikami, N. J. Cheat Phys. 1996, 105, 2618-2627. 45. Sekiya, H.; Hamabe, H.; Ujita, H.; Nakano, N.; Nishimura, Y. Cheat Phys. Lett. 1996, 255,
437-44. 46. Pribble, R. N.; Zwier, T. S. Science 1994, 265, 75-79. 47. Pribble, R. N.; Zwier, T. S. Faraday Discuss. 1994, 97, 229. 48. Fredericks, S.; Jordan, K. D.; Zwier, T. S. J. Phys. Chem. 1996, 100, 7810-7821. 49. Huisken, E; Kaloudis, M.; Kulcke, A. J. Cheat Phys. 1996, 104, 17-25. 50. Frochtenicht, R.; Kaloudis, M.; Koch, M.; Huisken, E J. Cheat Phys. 1996, 105, 6128-6140. 51. Huisken, E; Kulcke, A.; Laush, C.; Lisy, J. M. J. Cheat Phys. 1991, 95, 3924-29. 52. Huisken, E; Stemmler, M. J. Chent Phys. 1993, 98, 7680-91.

280 TIMOTHY S. ZWlER
53. Coussan, S." Bakkas, N.; Loutellier, A.; Perchard, J. R; Racine, S. Chent Phys. Lett. 1994, 217, 123-29.
54. Hagemeister, E; Zwier, T. S. J. Phys. Chem. A 1988, 102, 82-94. 55. Liu, K.; Elrod, M. J.; Loeser, J. G.; Cruzan, J. D.; Pugliano, N.; Brown, M. G.; Rzepio, J.; Saykally,
R. J. Faraday Discuss. 1994, 97, 35-41. 56. Liu, K.; Loeser, J. G.; Elrod, M. J.; Host, B. C.; Rzepiela, J. A.; Pugliano, N.; Saykally, R. J. J.
Ant Chent Soc. 1994, 116, 3507-3512. 57. Cruzan, J. D.; Braly, L. B.; Liu, K.; Brown, M. G.; Loeser, J. G.; Saykally, R. J. Science 1996,
271, 59-62. 58. Liu, K.; Brown, M. G.; Cruzan, J. D.; Saykally, R. J. Science 1996, 271, 62-64. 59. Liu, K.; Gregory, J. K.; Brown, M. G.; Carter, C.; Saykally, R. J.; Clary, D. C. Nature 1996, 381,
501-503. 60. Xantheas, S. S.; Dunning, T. H., Jr. J. Chem. Phys. 1993, 99, 8774-92. 61. Xantheas, S. S. J. Chent Phys. 1995, 102, 4505-17. 62. Olthof, E. T. H.; Avoird, A. v. d.; Wormer, P. E. S.; Liu, K.; Saykally, R. J. Chent Phys. 1996, 105,
8051-8063. 63. Pugliano, N." Cruzan, J. D.; Loeser, J. G.; Saykally, R. J. J. Chent Phys. 1993, 98, 6600-17. 64. Gregory, J. K." Clary, D. C. J. Chent Phys. 1996, 105, 6626-6633. 65. Huisken, E; Kaloudis, M.; Koch, M.; Werhahn, O. J. Chent Phys. 1996, 105, 8965-8968. 66. Honegger, E.; Leutwyler, S. J. Chent Phys. 1988, 88, 2582-95. 67. Ojamae, L.; Tegenfeldt, J.; Lindgren, J.; Hermansson, K. Chent Phys. Lett. 1992, 195, 97-103. 68. Ojamae, L.; Hermansson, K.; Probst, M. Chent Phys. Lett. 1992, 191,500-06. 69. Ladanyi, B. M.; Skaf, M. S. Annu. Rev. Phys. Chem. 1993, 44, 335-68. 70. Fitzgerald, G.; Lee, C.; Chen, H. J. Chent Phys. 1994, 101, 4472-4473. 71. Kim, K.; Jordan, K. D.; Zwier, T. S.J. Ant Chent Soc. 1994, 116, 11568-69. 72. Laasonen, K." Parrinello, M." Car, R.; Lee, C.; Vanderbilt, D. Chem. Phys. Lett. 1993, 207, 208-13. 73. Mhin, B. J." Kim, H. S.; Kim, H. S.; Yoon, C. W." Kim, K. S. Chent Phys. Lett. 1991, 176, 41-45. 74. Franken, K. A.; Jalaie, M.; Dykstra, C. E. Chent Phys. Lett. 1992, 198, 59-66. 75. Tsai, C. J.; Jordan, K. D. Chent Phys. Lett. 1993, 213, 181-88. 76. Belford, D.; Campbell, E. S. J. Chem. Phys. 1987, 86, 7013-24. 77. Fredericks, S. Y.; Jordan, K. D. Private communication. 78. Tsai, C. J.; Jordan, K. D. J. Chem. Phys. 1991, 95, 3850-3853. 79. Lee, C.; Chen, H.; Fitzgerald, G. J. Chent Phys. 1995, 102, 1266-1269. 80. Estrin, D. A." Paglieri, L." Corongui, G.; Clementi, E. J. Phys. Chem. 1996, 100, 8701-8711. 81. Knochenmuss, R.; Leutwyler, S. J. Chent Phys. 1992, 96, 5233-44. 82. Tsai, C. J.; Jordan, K. D. J. Phys. Chem. 1993, 97, 5208-5210. 83. Kim, K. S.; Dupuis, M.; Lie, G. C.; Clementi, E. Chent Phys. Lett. 1986, 131,451-456. 84. Wales, D. J.; Ohmine, I. J. Chent Phys. 1993, 98, 7245-7256. 85. Wales, D. J.; Ohmine, I. J. Chem. Phys. 1993, 98, 7257-7268. 86. Brink, G." Glasser, L. J. Phys. Chem. 1984, 88, 3412-3414. 87. Gruenloh, C.; Carney, J.; Arrington, C.; Zwier, T. S.; Fredericks, S. Y.; Jordan, K. D. Science 1997,
276, 1676-1681. 88. Zwier, T. S. Ann. Rev. Phys. Chem. 1996, 47, 205-241.

AB INITIO CHARACTERIZATION OF WATER AND ANION-WATER CLUSTERS
Sotiris S. Xantheas and Thom H. Dunning, Jr.
Abstract . . . . . . . . . . . . . . . . . . . . . . . . . . . . . . . . . . . . . 281
Introduction . . . . . . . . . . . . . . . . . . . . . . . . . . . . . . . . . . . 282
Water Clusters . . . . . . . . . . . . . . . . . . . . . . . . . . . . . . . . . . 283
2.1. Structures . . . . . . . . . . . . . . . . . . . . . . . . . . . . . . . . . 283
2.2. Energetics . . . . . . . . . . . . . . . . . . . . . . . . . . . . . . . . . 290
2.3. Vibrational Spectra . . . . . . . . . . . . . . . . . . . . . . . . . . . . 291
Negative Ion-Water Clusters . . . . . . . . . . . . . . . . . . . . . . . . . . 294
3.1. General . . . . . . . . . . . . . . . . . . . . . . . . . . . . . . . . . . 294
3.2. Potential Energy Surfaces of the n = 1 Clusters . . . . . . . . . . . . . 294
3.3. Structures of the n = 2 -4 Clusters . . . . . . . . . . . . . . . . . . . . 300
3.4. Structures of the Larger Clusters: "Interior" vs. "Surface" States . . . . 304 Acknowledgments . . . . . . . . . . . . . . . . . . . . . . . . . . . . . . . . 305
References . . . . . . . . . . . . . . . . . . . . . . . . . . . . . . . . . . . . 306
ABSTRACT
An overview of recent developments in the field of ab initio modeling of the structures,
energetics, and vibrational spectra of water and negative ion-wate r clusters is
Advances in Molecular Vibrations and Collision Dynamics, Volume 3, pages 281-309. Copyright �9 1998 by JAI Press Inc. All rights of reproduction in any form reserved. ISBN: 1-55938-790-4
281

282 SOTIRIS S. XANTHEAS and THOM H. DUNNING, JR.
presented. Electron correlation is important for the accurate description of the optimal structures of the first few water clusters. The minima of the trimer through pentamer are rings with homodromic hydrogen bonding networks. For the water hexamer there exist at least four isomers lying within 1 kcal/mol of the global minimum which is a tetramer unit with two "capping" waters. First principles calculations predict a systematic contraction of the nearest neighbor oxygen-oxygen separation with increasing cluster size, a trend that is consistent with the information resulting from the fitting of the experimentally obtained rotational constants. They also produce a red shift of the frequency associated with the hydrogen bond in the rings that is comparable to the shift measured experimentally. For the case that the hydrogen- bonding network is disrupted due to the presence of an anion, representative examples suggest the interplay between the structural and spectral trends of the clusters and the relative strengths of the anion-water vs. the water-water interactions.
I. I N T R O D U C T I O N
Because of the importance of water in life, 1-2 a significant amount of research has been devoted to the study of aqueous clusters as a means of understanding the fundamental interactions between water and various solutes. 3'4 This information is needed in order to understand the role of the solvent in many chemical processes where water participates either as a "spectator" or is directly involved in the process. To this end, an understanding of how water molecules alter both the quantitative and qualitative features of a gas-phase potential energy surface (PES) is invaluable in modeling the important phenomenon of solvation. The effect of solvation on a gas-phase PES can be significant since it can not only alter quantitative but qualitative features as well. For example, the lower dissociation asymptote for NaC1 in the gas-phase is the one leading to ground-state atoms, Na(1S) and CI(2p), with the asymptote corresponding to ionic dissociation, Na § + CI-, lying over 35 kcal/mol higher in energy. 5'6 In aqueous solution NaCI dissociates to ions, dramati-
cally highlighting the change in the PES upon solvation. The structural, energetic, and spectral features of the first few water and ion-
water clusters offer a wealth of information towards understanding the phenomenon of solvation. 7 For instance, experimental evidence suggests the buildup of"shells" with even a few water molecules around ions such as hydroxide. 8 In addition, the energetic features of the clusters provide the foundations for the development and parametrization of interaction potentials needed to study the macroscopic proper- ties of aqueous systems. Finally, the spectral features offer an indirect probing of the hydrogen-bonding network and its modification due to the presence of solutes.
This chapter focuses on the ab initio modeling of water and negative ion-water clusters. It is not intended to exhaustively review the vast literature in this area as this has been recently accomplished (cf. refs. 3, 4, 7) but rather provide an account of recent developments in the field.

Water and Anion-Water Clusters 283
2. WATER CLUSTERS
2.1. Structures
The water dimer is the simplest cluster exhibiting hydrogen bonding between water molecules. Its structure has been experimentally determined from the rota- tional constants 9-11 derived from its microwave spectra. 9-13 This analysis is com- plicated by the existence of low-barrier interconversion pathways that "scramble" the hydrogen atoms within each subunit, producing splittings in the microwave spectra. 14-18 The minimum energy configuration, shown in Figure 1, corresponds to an almost linear hydrogen bond between the two water molecules, one acting as a proton donor, the other as proton acceptor.
An accurate determination of the water dimer optimal geometry, interaction energy, and other essential features of its PES has drawn a lot of attention 19-31 because of their importance in determining the two-body interaction potential for water. 32-33 Figure 2 shows the variation of the intermolecular O-O separation, Re(O-O), with increasing orbital basis sets and level of electron correlation. The computational approaches presented in Figure 2 provide accurate treatments of electron correlation coupled with simultaneous expansion of the orbital basis set towards the complete basis set limit. The former is achieved by describing electron correlation at the second- and fourth-order (MP2, MP4) M~ller-Plesset perturba- tion 34 and the coupled cluster 35 including single and double excitations (CCSD) with perturbative estimation of the triple excitations [CCSD(T)] levels 36'37 of theory. The latter is accomplished by using the family of augmented correlation consistent basis sets 38'39 aug-cc-pVnZ (n = 2-5) which simultaneously expand the radial and angular part of the wave function and approach the complete basis set limit for large n.
The effect of the basis set superposition error (BSSE) in Figure 2 is estimated by using the function counterpoise method; 4~ geometries on the BSSE surface (open
Figure 1. Optimal configuration of the water dimer. The shaded area denotes the symmetry plane.

284 SOTIRIS S. XANTHEAS and THOM H. DUNNING, JR.
symbols in Figure 2) are obtained via numerical minimization. 29 The small differ- ence between the MP2 and MP4/CCSD(T) results indicates that electron correlation is adequately described even at the MP2 level for this system. As can be seen, the intermolecular separation, Re(O-O ), converges smoothly with increasing basis set size. In order to compare the calculated equilibrium structure (i.e. the corresponding rotational constants) with the one obtained from the fit of the experimental data, the effect of vibrational averaging must be considered. This requires a knowledge of an extended portion of the PES of the dimer, 14-18'41'42 and is not considered here.
The PES of the trimer is of particular importance since it provides valuable information about the nonadditive three-body interaction energy term between three water molecules. 45'48 The equilibrium geometry for the water trimer exhibits a cyclic structure with three hydrogen bonds in which all three water molecules are arranged in a homodromic fashion; i.e. they act both as proton donors and proton acceptors to neighbors 43-5~ as seen in Figure 3. This structure is consistent with earlier molecular beam electric resonance experiments 51 which suggested a cyclic structure with a small (<0.05 Debye) dipole moment. The minimum energy structure of the trimer is chiral giving rise to 96 isoenergetic minima on the PES upon permutation of the hydrogen atoms; these minima can be further classified into 48 enantiomeric pairs. The optimal geometry has no symmetry elements with
O 6
2.98
2.96
2.94
2.92
2.90
Q MP2-fc - - .O-- MP2-fc (BSSE)
�9 CCSD(T) [] CCSD(T) (BSSE) A MP4-fc
MP4-fc (BSSE) nnlln
I I I . n
a ug-cc-p VDZ a ug-cc-p YTZ a ug-cc-p VQZ a ug-cc-p VSZ
basis set designation
Figure 2. Water dimer intermolecular separation. Variation of the intermo- lecular O - O distance Re(O-O) with the size of the augmented correlation consistent basis sets aug-cc-pVnZ (n = 2-5) for various levels of theory. Filled/open symbols correspond to the uncorrected/BSSE-corrected numbers, respectively. The BSSE-corrected geometries were obtained by numerical optimization on the BSSE surface.

Water and Anion-Water Clusters 285
Figure 3. Global minima of the water trimer through pentamer clusters.
two of the "free" hydrogen atoms lying above the plane defined by the three oxygen atoms and the third one below. However, an "average" structure of C3h symmetry was used in order to fit the experimentally measured vibration-rotation-tunneling (VRT) spectra 52-55 within the G48 subgroup of the molecular symmetry group. These transitions arise from the tunneling motions of the hydrogen atoms between the various minima. Extensive studies of both the qualitative and quantitative features of the trimer PES as well as the isomerization pathways have been performed 56-6~ in order to theoretically predict the VRT splittings.
The initial interpretation of the VRT splittings yielded intermolecular O-O separations that were almost identical to the corresponding one in the dimer. 52 However, high-level ab initio calculations 48 predicted significant contractions in the intermolecular O-O separations, of the order of 0.12/~ with respect to the dimer. These theoretical studies and an analysis of the rearrangement pathways 56'58 on the trimer PES fueled further experimental measurements that resulted in a reinterpre- tation 53 of the VRT spectra yielding a structure more in line with the theoretical predictions as regards the contraction of the intermolecular O-O separation with respect to the dimer. It should be noted that the process of associating the fitted rotational constants with a structure is not unique; to this end accurate first principles predictions offer a valuable complement in the interpretation of the experimental data.
First-principle calculations predict a cyclic homodromic structure 49'61-66 of S 4 symmetry (cf. Figure 3) for the water tetramer. Analysis of the measured far-infrared VRT spectra for the fully deuterated water tetramer 67'68 suggested that this is the

286 SOTIRIS S. XANTHEAS and THOM H. DUNNING, JR.
smallest possible molecular symmetry group that describes a rigid (nontunneling) cluster. As in the water trimer case, tunneling is observed and the C4h(M ) subgroup of the complete permutation inversion (PI) group must be employed to rationalize the experimental data. 67 To this end, theoretical predictions of the low-energy rearrangement pathways between the various isomers 69 have provided guidance in elucidating the tunneling dynamics.
The minimum energy configuration for the water pentamer (C l symmetry) follows the same homodromic pattern 49'64'66'7~ observed for the trimer and tetramer. VRT spectra for the fully deuterated cluster corresponding to tunneling motions of the hydrogen atoms have been experimentally observed 72 and the rearrangement mechanisms and corresponding tunneling splittings calculated. 73 It should be noted that, at the minimum energy configurations for the trimer through pentamer, each water molecule acts both as a proton donor and a proton acceptor (da configuration) to its neighbors; these configurations have on the average one hydrogen bond per water molecule. This locally inhomogeneous arrangement is probably not representative of configurations found in bulk water in which each water molecule participates on the average in two hydrogen bonds.
For the trimer through pentamer water clusters the possibility of hydrogen bonding via arrangements other than (da) leads to the existence of isomers that lie higher in energy than the ring homodromic configurations. For the water trimer ab initio calculations suggest two "open" structures of the type (d,aa,d) and (a, dd,a); i.e. configurations having only two hydrogen bonds and the central water molecule acting either as a double donor or a double acceptor (cf. Figure 4), lying approxi- mately 6 kcal/mol above the cyclic structure. 46'74 The energetic difference between the open structures and the ring minimum can be rationalized in terms of the absence of the two-body interaction between the end water molecules (slightly repulsive) as well as to a repulsive three-body nonadditive component. For the water tetramer, first-principles calculations predict 75 a "cage" isomer and another ring isomer of different-than-homodromic hydrogen-bonding arrangement which lie 4.8 and 10.5 kcal/mol above the S 4 minimum, respectively (Figure 4). For the water pentamer the "cage" isomer shown in Figure 4 lies only 1.8 kcal/mol above the ring minimum. 75
For the water hexamer ab initio calculations suggest that there are at least four isomers, shown in Figure 5, lying within 1 kcal/mol of each other.75-79 Experimental studies s~ have suggested that, besides the water dimer, the hexamer can bind an electron by forming a dipole bound state. For this to occur a dipole moment larger than 1.62 Debye is required. 81's2 For the trimer through pentamer clusters no dipole bound anions are observed in accordance with the small dipole moments of the ring structures of the trimer and pentamer and the zero-dipole moment of the S 4 minimum of the tetramer. The observation of the dipole bound state for the hexamer supports the existence of a geometry with a large (> 1.62 Debye) dipole moment, while at the same time excludes the ring minimum of S 6 symmetry (zero dipole moment). Recent VRT experiments complemented with quantum Monte Carlo simulations have suggested s3 that a tetramer configuration with two capping water

Water and Anion-Water Clusters 287
Figure 4. Local minima of the water trimer through pentamer clusters.
molecules ("cap" isomer of Figure 5) best fits the observed rotational constants obtained from the VRT data.
Among the larger (n > 6) water clusters the cubic structure of the octamer has received much attention, 64'84-89 serving as a building block for the formation of fused-cubic structures 86'88-9~ as well as a model to explain the peculiar behavior of the specific heat of water in the 273-373 K temperature range. 9l
Although most interaction potentials for water have been developed with the intent to reproduce the macroscopic properties of liquid water they have occasion- ally been used in order to simulate the properties of different environments like water clusters. It is therefore not surprising that the number of low-lying local minima for water clusters obtained using empirical potentials is much larger than those resulting from first-principles ab initio calculations. For example, the TIP4P potential 92 produces 21 local minima for the water pentamer within 7 kcal/mol of the global minimum. 93 In many cases, however, the number of minima decreases when more accurate interaction potentials or first-principles calculations are em- ployed due to the collapse of structures to configurations lower in energy. 76 Successful attempts have been made to incorporate many-body effects into purely pairwise-additive potentials derived from the water dimer PES. 94-95

288 SOTIRIS S. XANTHEAS and THOM H. DUNNING, JR.
Figure 5. Low-lying isomers of the water hexamer.
An additional limitation of most existing interaction potentials is the fact that they employ rigid water molecules and therefore cannot describe the changes in the intramolecular internal coordinates 49 upon cluster formation. These are listed in Table 1 for the n = 2-6 ring minima. The changes in these geometrical parameters from the isolated monomer values result in relaxation or distortion energies as large as 1.0 kcal/mol/monomer for the various isomers of the water hexamer. The relaxation (or distortion) energy is the energy penalty for distorting the geometry of an isolated water molecule to the corresponding one in the cluster.
The effect of hydrogen bonding is mainly manifested by an increase in the hydrogen-bonded OH stretch, R(O-H)b, and, to a lesser extend, a smaller change in the intramolecular angle,fill-O-H). The elongation of R(O-H) b is almost linear for n = 2-4 but levels off for the pentamer and hexamer to a value of AR(O-H) b = 0.022/~. This will lead to a red shift in the corresponding frequency with respect to the isolated monomer.
As regards the changes in the intermolecular internal coordinates upon cluster formation, also listed in Table 1, we note that the contraction of the intermolecular O-O separation, Re(O-O ), observed in the transition from the dimer to the trimer, continues for the larger ring clusters, although to a lesser extent. Electron correlation is found to be very important in accurately describing the intermolecular separation of the ring structures. 49 Some levels of density functional theory (DFT) have also
76 86 96 been found to be satisfactory ' ' in reproducing the MP2 results 49 in contrast to the Hartree-Fock (H~ theory which was found to significantly overestimate the intermolecular separations. 49

Water and Anion-Water Clusters 289
Table 1. Structural Trends in the Inter- and Intramolecular Internal Coordinates of Water Clusters with Cluster Size a
I n t e r n a l C o o r d i n a t e n = 1 n = 2 n = 3 n = 4 n = 5 n = 6
Intramolecular Internal Coordinates f (H-O-H) 103.8 104.0
104.3
R(O-H) b 0.965 R(O-H)f 0.965
0.973 0.964 0.966 0.966
R(O-O) 2.920
d(O...H-O) 171.3
105.0 105.0 104.5 104.7 105.3 104.9 105.3 104.9
104.9 105.0
0.978 0.985 0.986 0.986 0.964 0.965 0.964 0.964
Intermolecular Internal Coordinates 2.798 2.743 2.722 2.799 2.723 2.800 2 . 7 2 5
2.726 2.734
148.4 167.7 173.0 151.1 175.7 151.3 175.9
176.7 176.8
2 . 7 1 6
178.7
Note: aCalculations are performed at the MP2 level of theory with the aug-cc-pVDZ basis set.
Figure 6.
2.95
2 .90
o,~ 2.85
~5 ~ 2 .8o
2 .75
, "R O"
- O- - B - L Y P
�9 "-Q-- M P 2
- - .'. - . L i q u i d W a t e r ( 4 ~
Ice lh N
m
2 .70 I I I I
2 3 4 5 6
rl (number of water molecules)
Variation of intermolecular 0--0 separation with cluster size.

290 SOTIRIS S. XANTHEAS and THOM H. DUNNING, JR.
The variation of Re(O-O ) with the size of the cluster, 49'96 shown in Figure 6, is almost exponential. The stars correspond to the vibrationally averaged O-O sepa- rations, Ro(O-O), from the fitting of the VRT spectra. 53'67'68 The difference between the R 0 and R e values represent the magnitude of the vibrational corrections for each cluster (as well as any intrinsic errors in the calculations or the analysis of the experimental data). Nevertheless the variation of the experimentally deduced Ro(O-O) follows very closely the calculated trend in the corresponding Re(O-O) for n = 3-5.
The strain associated with the formation of the ring in the trimer is apparent from the deviation of the intermolecular d(O...H-O) angle by almost 30 ~ from linearity. This strain is eased for the tetramer through ring hexamer clusters as indicated by the fact that for these clusters the hydrogen bond is almost linear.
2.2. Energetics
The association energies of small water clusters are important in the development of interaction potentials for water, especially due to the general lack of experimental data for these quantities. The interaction energy of the water dimer, in particular, provides information regarding the parametrization of the leading two-body term in interaction potentials that are used to model liquid water. The variation of the electronic energy difference, AE e, for the water dimer at the levels of theory and
t~ r j
<1
- 4 . 4
- 4 . 6
- 4 . 8
- 5 . 0
- 5 . 2
Ii - o MP2-fc (~ssE) II
CCSDm II �9 [] CCSDCn (BSSE)II
�9 �9 .. ~ M P ~ f c !! [~.. .. .. .. .. M P ~ f c ( B S S E ) I I
fl . . . . O
- 5 . 4 ' I ... J I
aug-cc-pVDZ aug-cc-pVTZ aug-cc-pVQZ aug-cc-pVSZ
basis set designation
Figure 7. Variation of the electronic energy difference, AEe, with the size of the augmented correlation consistent basis sets aug-cc-pVnZ (n = 2-5) for various levels of theory. Filled/open symbols correspond to the uncor- rected/BSSE-corrected numbers, respectively.

Water and Anion-Water Clusters 291
0.35
Ice Ih 0.30 . . . . . . . . . . . . . . . . . . . . . . . . . . . . . . . . . . . . . . . . . . . . . . .
0.10
0 . 0 5 I .... I I , I . . . . I -
2 3 4 5 6
0.25 >
o.2o
f'~ 0.15
tl (number of water molecules)
Figure 8. Variation of the electronic energy difference per water molecule for the clusters dimer through hexamer with cluster size. Numbers are obtained at the MP2/aug-cc-pVDZ level of theory and are corrected for BSSE.
basis sets reported in Section 2.1 for the optimal geometry [MP2, MP4, CCSD(T)] is shown in Figure 7. The extrapolated MP2/CBS limit 29 for ZkE~ is -4.94 kcal/mol, in good agreement with the extrapolated MP2/CBS limit o f -5 .0 + 0.1 kcal/mol based on the MP2/6-311 ++G(2d,2p) dimer geometry. 97 Core/valence correlation effects are found to increase z~E e by -0.05 kcal/mol. 97 Once again the effects of higher correlation on the electronic energy difference are minimal as indicated by the small difference between the MP2, MP4, and CCSD(T) results. 29'97 In order to compare the computed ZkE e with an experimentally observable quantity like the enthalpy, vibrational and temperature effects need to be accounted for.
The variation of the electronic energy difference per water molecule (AEJn) with cluster size for the dimer through hexamer is shown in Figure 8. The results are obtained at the MP2/aug-cc-pVDZ level of theory 75 and are corrected for BSSE. The solid line traces an exponential fit to the data that yields a limit of 1.52 kcal/mol for large n, almost identical to the result obtained for ice Ih. 98
2.3. Vibrational Spectra
The observed changes in the intramolecular internal coordinates of water in the clusters [cf. Table 1 and Section 2.1] will induce corresponding shifts in the individual intramolecular vibrational frequencies with respect to the isolated mole- cule. For instance, the changes in the monomer geometry due to complexation in the dimer are responsible for 2/3-rds of the shift of the donor molecule, the remaining 1/3-rd of the shift arising from the field of the acceptor molecule. 99 The homodromic ring arrangement of the n = 3-5 minima which allows for only one hydrogen bond per water molecule produces two categories of OH stretches, identified by their participation or not in the hydrogen bond. The existence of a

292 SOTIRIS S. XANTHEAS and THOM H. DUNNING, JR.
different hydrogen-bonding network such as the one found in the cage isomers of the tetramer, pentamer, and hexamer clusters will, of course, introduce a larger spread in the OH-stretching frequencies. The shifts of the intramolecular harmonic frequencies with respect to the water bend and the average of the symmetric and asymmetric stretching frequencies (1623 and 3872 cm -1, computed 49 at the MP2/aug-cc-pVDZ level) are listed in Table 2. Positive numbers indicate blue- shifted (larger) frequencies, whereas negative numbers correspond to red-shifted (smaller) frequencies relative to the monomer harmonic frequencies.
The frequency shifts of the hydrogen bonded OH stretches for the dimer through pentamer clusters have been recently measured using infrared molecular beam depletion and fragment spectroscopy. 1~176 The comparison between the experimen- tally measured red shifts and the MP2/aug-cc-pVDZ calculated shifts 49'1~ are shown in Figure 9. The red shift of the frequency associated with the hydrogen- bonded OH-stretching vibration is consistent with the elongation of the correspond- ing R(O-H)b due to hydrogen bonding (cf. Table 1). The shifts in the OH-stretch frequencies correlate well with the changes in the corresponding equilibrium bond distances. In fact, we find that the calculated frequencies obey Badger's rule, 1~176 which relates the force constant K e with R e via,
K e (R e - dij) 3 = D
Table 2. Shifts in the Harmonic Vibrational Frequencies of the Ring Clusters with Respect to the Monomer a
A s s i g n m e n t n = 2 n = 3 n = 4 n = 5 n = 6
co(H-O-H) +1 +9 +14 +19 +14 +28 +12 +30 +31 +27
+37 +30 +39 +27 +60 +60 +58
+68 +58 +76
co(O-H)f +57 +26 + 15 + 13 + 17 +35 +24 +15 +15 +17
+20 +15 +17 +17 +14 +17 +17
+19 +17 +18
co(O-H) b - 73 -231 -350 -380 -379 -160 -240 -388 -387 -398
-299 -388 -433 -398 --481 -442 -455
-523 -455 -528
Note: apositive/negative numbers correspond to blue/red shifts, respectively.

Water and Anion-Water Clusters 293
)
1.,,i
II
< 1
300
250
200
1 5 0
100
5 0
h o@o @~
ooo ~176
j I ,, i I I
2 3 4 5 H
Figure 9. Comparison of experimental and theoretical results for the shifts in the bonded OH-stretching vibrations with respect to the dimer.
where dij and D are constants. The MP2/aug-cc-pVDZ results for Re(O-H) b and (%(O-H)b for the clusters including the pentamer when least-squares fitted to the function,
Re = dij +~ / D
yield a value of 0.70/~ for d U which is in remarkably good agreement with the value of 0.68 tl, originally proposed by Badger for bonds between first row atoms.
The cluster intramolecular harmonic frequencies, listed in Table 2, show a blue shift approaching 70 cm -1 in the intramolecular bends and a red shift in the OH stretches ranging from --50 cm -l ("free" OH) to --500 cm -1 ("hydrogen-bonded" OH) with respect to water monomer. Our estimate for the shift in the bending frequencies is consistent with the experimental observation of a broad band cen- tered near 1700 cm -l in the infrared spectrum 1~ of water. This band has been associated almost entirely with the monomer bending mode, significantly broad- ened by interactions with other molecules in the liquid, and moved to higher frequencies by about 70-100 cm -l (ref. 105). In comparison, the bending frequency for Ice I is shifted by 55 cm -l to the blue with respect to the gas-phase monomer. 1~ The estimates for the frequency shifts are comparable with experimental measure- ments of the infrared spectra of water clusters, 1~176176 which identify broad bands centered below 3500 cm -1 and around 3700 cm -1 associated with the OH-stretching modes. The bands below 3500 cm -1 correspond to the "bridge" OH stretches and are shifted >400 cm -1 below the average of the OH stretches of 3888 cm -l in water (the calculated estimate is a shift of--500 cm -l to the red). Finally, the bands above 3700 cm -1 that are strongly concentrated near 3840 cm -1 correspond to the non-hydrogen-bonded "free" OH stretches and are shifted --50 cm -l below the

294 SOTIRIS S. XANTHEAS and THOM H. DUNNING, JR.
average of the two OH stretches in water. In liquid water there should be less distinction between the "bridge" and "free" OH groups--in one configuration an OH group may correspond to a "bridging" group, in another configuration it may correspond to a "free" group. Thus, in the liquid we should see a shift in the frequencies ranging from a few cm -l to --500 cm -1. The most intense infrared frequency of the water pentamer l~ at 3417 cm -1 is associated with a red shift of 455 cm -1 with respect to the monomer, very close to the one obtained by considering the center of the broad band observed in water (472 cm -1) in this range.
3. NEGATIVE I O N - W A T E R CLUSTERS
3.1. General
Negative ions form hydrogen bonds with the hydrogen atoms of water molecules. This results in the n = 1 clusters having an "asymmetrically bound" water molecule in general, a fact that clearly distinguishes them from the "symmetrically bound" via the oxygen atom positive ion-water clusters. 7 Hydrogen bonding results in the distortion of the water molecule in the cluster from its equilibrium geometry in isolation. The distortion depends on the strength of the ion-water interaction and is mainly manifested by the elongation of the hydrogen-bonded OH stretch of water, a fact that results in a red shift of the corresponding frequency with respect to isolated water in a manner similar to the one observed for water clusters. Since negative ion-water interactions are, in principle, much larger ll~ than interactions between water molecules, geometrical relaxation of a water molecule bound to a negative ion and, in turn, the corresponding frequency shifts are larger than the ones observed for water clusters. It is therefore clear that understanding the features of negative ion-water potential energy surfaces is very important since these features reflect the characteristics of the hydrogen bond and its variation upon the strength of the ion-water interaction. Furthermore a knowledge of negative ion-water interactions assists in the parametrization of interaction potentials that can be used to explore the energetic and dynamic properties of the larger clusters and model the phenomenon of solvation of ions in aqueous solutions.
3.2. Potential Energy Surfaces of the n = 1 Clusters
For monatomic anions, the main features of the ion-water PES are determined by the relative position of the X- + H20 and HX + OH- asymptotes. Characteristic experimental values ill of the two asymptotic limits for typical negative ions are shown in Table 3. For most monatomic anions the first asymptote is significantly lower in energy than the second one resulting in a single minimum that corresponds to the X-(H20 ) configuration on the PES (cf. Figure 10). A second minimum of the type OH-(I-~) may appear in cases where the second asymptote is either compa- rable to or lower in energy with the first asymptotic limit. In order for HX + OH-

Water and Anion-Water Clusters 295
Table 3. Asymptotic Limits for the X- + H20 and HX + OH- Asymptotes of Various Ions a
(A): X- + H20 (B): HX + OH- Ion (kcal/mol) (kcal/mol) BE(A-B) (kcal/mol)
H- -22.9 -32.8 +9.9 CN- -41.9 -1.9 -40.0 F- -117.0 -98.0 -19.0 CI- -111.9 -54.9 -57.0 Br- -106.5 -39.7 -66.8 I- -102.0 -26.0 -76.0
Note: aValues (in kcal/mol) correspond to enthalpies of formation (A/g).
to be lower in energy than X- + H20, the ion X- should be at least 24.3 kcal/mol less thermodynamically stable than the acid HX. This is, for example, the case for the hydride ion, H-, whose potential energy surface is shown in Figure 11 along the reaction coordinate that interconverts the two structures and connects to the asymptotic limits. The two minima, H-(H20) and OH-(H2), which have been studied both experimentally 112-117 and theoretically, 118-125 are almost isoenergetic
and separated by a small (-2.9 kcal/mol) barrier. Even if the HX + OH- asymptote is not lower than the X- + H20 asymptote, the closer the two asymptotes, the larger the interaction between the two states. This can result in the appearance of "shoulders" on the ground-state PES. For the case of fluoride ion, the fact that the
Figure 10. Optimal geometry of the X-(H20) cluster with labeling of the atoms.

296 SOTIRIS S. XANTHEAS and THOM H. DUNNING, JR.
m 0 -5
e~
| - 1 0
m
-15
-20
H" + H20
T 17.4//16.3 13.8//11.[lOll
0.1_+0.9
�9 1.6
Legend: MP2/aug-cc-p VDZ // MP4/aug-cc.p VDZ // Exp.
Figure 11. Potential energy surface of the H-(H20) cluster at the MP2/aug- cc-pVDZ level of theory. The structures of the two minima and the transition state are also shown.
energy difference between the F- + H20 and HF + OH- asymptotes is just 19.1 kcal/mol (cf. Table 3) in conjunction with the strong ion-water interaction energy 126 results in a very anharmonic hydrogen-bonded R(O-Hb) stretch. Figure 12 shows the energy as a function of R(O-Hb) when the rest of the internal coordinates are kept fixed at their optimal values for the F(H20) minimum (i.e. the H b atom is moving along the line indicated by the arrow in Figure 12). This cut through the PES reveals the appearance of a pronounced "shoulder" for (R-Re) < -0.3 /~ corresponding to the HF(OH-) configuration. The harmonic frequency of the hydrogen-bonded OH stretch, R(O-Hb), is 2090 cm -1, red-shifted by 1782 cm -1 with respect to the average of the symmetric and asymmetric harmonic stretches in water. A simple one-dimensional treatment along the normal mode displacement suggests an anharmonicity of 538 cm -1. It is clear that a harmonic treatment of this system will be inadequate and anharmonic effects need to be included. A proper description will require the use of a "double-well" potential. 127
The hydroxide ion-water cluster is a special case where the two asymptotes coincide due to permutational symmetry. Its structure and PES has been the subject of extensive experimental 8,128-134 and theoretical studies 135-143 due to the impor- tance of this species in many chemical processes, including the modeling of proton transfer in water.144 The minimum energy configuration corresponds to a hydrogen- bonded asymmetric structure of C 1 symmetry arising from the interaction of one of the hydrogens of water with the lone pairs of the hydroxide ion. The hydrogen- bonded atom, Hb, can be exchanged between the two oxygen atoms giving rise to

Water and Anion-Water Clusters 297
0 E t~
40
30
20
10
0
F" ~ 0
�9 I �9 �9 , ! ! ! �9 ! �9 �9 �9 | i �9 �9 I �9 �9
-0.6 -0.4 -0.2 0 0.2
( R - R e ) ,
Figure 12. Potential energy surface of the F-(H20) cluster as a function of R(O-Hb) computed at the CCSD(T)/aug-cc-pVTZ level of theory. The rest of the internal coordinated are kept fixed at their optimal values for the F-(H20) minimum.
a double well along this path. However, the electronic barrier is very small, less than 0.3 kcal/mol, and zero-point energy corrections in the harmonic approximation were found to stabilize the symmetric transition state more than the two minima resulting in an effective single-minimum potential. The PES of this cluster is characterized by a very anharmonic motion of H b between the two oxygen atoms. This is the only low-lying minimum on the PES with other possible arrangements (e.g. dipole-dipole configurations) corresponding to higher order critical points.
The topology of the hydroxide-water PES is shown schematically in Figure 13 where subscripts a, b, and c are used to denote the hydrogen atoms. Isomerization occurs via two mechanisms: one is characterized by a low barrier (indicated by horizontal arrows in Figure 13) and corresponds to the proton transfer ofH b between the two oxygen atoms. Another isomerization mechanism is due to the scrambling of the hydrogen atoms in the water monomer and has a larger barrier. This pathway for this process corresponds to the rotation of the water molecule relative to the hydroxide ion. A quantitative representation of the hydroxide-water PES with the various isomerization pathways is shown in Figure 14. The various critical points, their point group symmetries, number of imaginary frequencies (in parentheses), and interconversion pathways are also shown. Arrows indicate the motion of the hydroxide and water fragments along the imaginary mode that converts the critical point to the C 1 (asymmetric) minimum.
The previous example illustrates that the PESs of diatomic negative ions with water can be quite complicated and offer a rich variety of structural and spectral

(a...bc)
I (a...cb)
(ba...c) ~ (b...ac)
(ab...c) (b...ca)
(ac...b) (c...ba)
(ca...b) ~ (c...ab)
(~O C . . . ~I )
I (cb...a)
(a...bc)
: lower barrier pro ton transfer
: higher barrier w a t e r hydrogen scrambl ing
: denotes H a O ' " H b O H c
Figure 13. Topology of the hydroxide-water PES indicating the various isomerization pathways.
0 -
10
2 0
30
H20+OI~ Potential Energy Surface of
_ (c2~ OH'(H20)
\ o"::.oo
H ~ _Hb ~_.. ~...o~o \o.. ,7~ o.~,o,, "o. . , - / C2v(2) C s (1)
Hb (C1) ~ ~'~ oHe--OH c
- o~ C l ( 0 ) _
O Hb--OH�9
c1(o) _
H OH r OH�9 ~ HmO-- HbOH~
H O H~- OH c ~ HbO-- HaOI~
Figure 14. Schematic PES of the hydroxide-water cluster indicating the isomerization pathways and higher order critical points. Calculations were performed at the MP2/aug-cc-pVDZ levc! of theory.
298
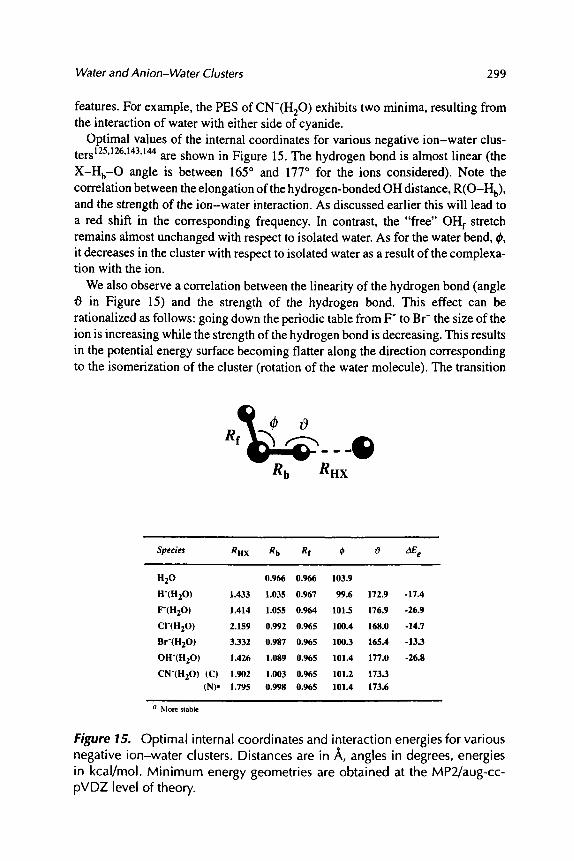
Water and Anion-Water Clusters 299
features. For example, the PES of CN-(H20 ) exhibits two minima, resulting from the interaction of water with either side of cyanide.
Optimal values of the internal coordinates for various negative ion-water clus- ters125,126,143,144 are shown in Figure 15. The hydrogen bond is almost linear (the X-Hb-O angle is between 165 ~ and 177 ~ for the ions considered). Note the correlation between the elongation of the hydrogen-bonded OH distance, R(O-Hb), and the strength of the ion-water interaction. As discussed earlier this will lead to a red shift in the corresponding frequency. In contrast, the "free" OHf stretch remains almost unchanged with respect to isolated water. As for the water bend, ~, it decreases in the cluster with respect to isolated water as a result of the complexa- tion with the ion.
We also observe a correlation between the linearity of the hydrogen bond (angle 0 in Figure 15) and the strength of the hydrogen bond. This effect can be rationalized as follows: going down the periodic table from F to Br- the size of the ion is increasing while the strength of the hydrogen bond is decreasing. This results in the potential energy surface becoming flatter along the direction corresponding to the isomerization of the cluster (rotation of the water molecule). The transition
_ _
Rb RHX
Species RHX R b Rf r 0 /iF. e
H20 0.966 0.966 103.9
H'(H20) 1.433 1 .035 0.967 99.6 172.9 -17.4
F'(H20) 1.414 1 .055 0.964 1 0 1 . 5 176.9 -26.9
Ci'(H20) 2.159 0.992 0.965 100.4 168.0 -14.7
Br'(H20) 3.332 0.987 0.965 100.3 165.4 -13.3
OH'(H20) 1.426 1.089 0.965 101.4 177.0 -26.8
CN'(H20) (C) 1.902 1.003 0.965 101.2 173.3
(N) a 1.795 0.998 0.965 101.4 173.6
a More stable
Figure 15. Optimal internal coordinates and interaction energies for various negative ion-water clusters. Distances are in t~, angles in degrees, energies in kcal/mol. Minimum energy geometries are obtained at the MP2/aug-cc- pVDZ level of theory.

300 SOTIRIS S. XANTHEAS and THOM H. DUNNING, JR.
state for the isomerization process is a "bifurcated" structure of C2v symmetry having two hydrogen bonds. It is a first order transition state with imaginary frequencies of 538i, 286i and 245i cm -l for F , CI-, and Br-, respectively. The corresponding classical barriers are 7.5, 1.6, and 1.1 kcal/mol. Zero-point energy corrections in the harmonic approximation slightly increase the barrier for F- (to 7.7 kcal/mol), but have the opposite effect for CI- and Br-, decreasing the barrier to 1.3 and 0.8 kcal/mol, respectively. Based on the trend observed here, it is expected that the isomerization process is nearly "free" for iodine-water, a fact which is expected to produce a splitting in the OH bands due to scrambling of the hydrogens of the water molecule.
3.3. Structures of the n = 2-4 Clusters
Because negative ions form a hydrogen bond with one of the hydrogen atoms of the water molecule, the lone pairs on the oxygen atom are available for hydrogen bonding with additional water(s) which can also bind to the negative ion via their hydrogens. Therefore most negative ion-water trimers, X-(H20) 2, have "cyclic" structures. These structures can be rationalized as follows: the first water molecule is bound to the ion in a fashion more or less resembling the structure of the n = 1 cluster; the second one attempts to maximize its hydrogen bonding by forming two hydrogen bonds with the X-(H20) fragment, one with X- and the other with the first H20. This leads to a cluster that, in general, has different X-H bond lengths, as shown in Figure 16. This will, in turn, produce different shifts in the hydrogen- bonded OH stretches of water relative to the isolated molecule.
The degree of hydrogen bonding between the two water molecules largely depends on the strength of the ion-water interaction as well as geometrical factors. For negative ions that are strongly bound to water, such as F- and OH-, the two ligands are aligned almost along the lone pairs of the ion with minimal interaction between them. The corresponding H - X - H angles, O, (cf. Figure 16) for the clusters of these two ions are 95.9 ~ and 116.8 ~ resulting in a large O-O separation between the two water molecules and therefore weakening of hydrogen bonding between them. In fact, the two-body water-water interactions are repulsive at the trimer geometries for the F- (+0.85 kcal/mol) and OH- ions. The fluoride ion therefore represents an exception to the picture of the "cyclic" trimers since it forms an optimal structure of C 2 symmetry that exhibits essentially no hydrogen bonding between the water molecules. For other ions that are more weakly bound to water, such as CI-, Br-, and CN-, hydrogen bonding between the two water molecules becomes more prominent. The attractive water-water interactions are a result of the smaller O angles and the shorter O-O separations. For CI-(H20)2, for example, the water-water interaction is attractive (-1.2 kcal/mol) at the optimal geometry of the n = 2 cluster. However, the barrier for the "rotation" of one of the water molecules along the ionic hydrogen bond that breaks the hydrogen bond with the other water is only 0.5 kcal/mol.

Water and Anion-Water Clusters 301
R, , ,R2
Roo
Species R2
H'(H20) 2 1.433 1.607
F'(tt20) 2 1.515 1.538
C1"(I-120) 2 2 . 1 2 8 2.364
Br'(l-120) 2 2 .318 2.567
OH'(I-120) 2 1.543
CN'(H20) 2 1.757 2.249
RI 0 Roo r , =
86.1 3.157 100.3
95.9 3.636 101.5
66.8 3.045 100.9
63.1 3.031 100.8
4.375 101.7
2.985 102.1
1.560 116.8
74.7
98.4
100.9
99.4
99.7
101.5
99.6
Figure 16. Optimal internal coordinates for various X-(H20)2 trimers at the MP2/aug-cc-pVDZ level of theory.
The dynamic properties of these clusters are related to the quantitative features
of the PESs and, in particular, the bamers to isomerizations. The minimum energy structures of the n = 2 clusters are, save F-(H20) 2, asymmetric with R 2 significantly greater than R 1. The energy difference between the minimum energy geometries and more symmetric geometries can be very small. For example, for F-(H20) 2, the energy difference between the C 2 minimum and the C i first order transition state (O = 180 ~ corresponding to a wagging motion through a quasilinear configuration is very small (--0.1 kcal/mol) suggesting large amplitude motions of the two water
molecules around the ion, an observation consistent with the observed lack of hydrogen bonding between the waters. For Cl-(H20) 2 the fact that some hydrogen bonding exists between the two water molecules results in a dramatic change in the PES compared to the fluoride-water trimer. The C i geometry is now a third order transition state lying 2.2 kcal/mol above the C 1 minimum.
As the cluster grows, so do the various combinations of hydrogen bonding networks around the ions and, consequently, the number of local minima that exist. For the n = 3 clusters, X-(H20)3, we were able to identify two low-lying minima,

302 SOTIRIS S. XANTHEAS and THOM H. DUNNING, JR.
one having a "pyramidal" structure of C 3 symmetry in which the three water molecules form the base of a pyramid with the ion on top, the other a "ring" arrangement of C s symmetry in which only two water molecules are directly bonded to the ion while the third one is acting as a double donor to the first two (cf. Figure 17). The energy difference between these two isomers is usually small (1-3 kcal/mol) with the pyramidal one being more stable for most negative ions we have considered so far. The least linear motion (LLM) path connecting the two was found to have a relatively large (--7 kcal/mol) barrier for OH-(H20) 3. The two minima are characterized by different hydrogen bonding networks: in the pyramidal minimum all water molecules act as proton donors to the ion as well as both proton donors and proton acceptors to another water molecule. In the ring minimum two water molecules act as proton donors to the ion and proton acceptors from the third water which acts as a double donor to the first two. The fact that the two have a different distribution of OH bond lengths is, again, expected to produce vibrational bands in that region that are characteristic of the isomer.
Due to the presence of the different hydrogen bonding networks in the two isomers we expect the nonadditive effects (mainly the three-body term) to be qualitatively different for the two isomers. An analysis of these effects for the fluoride- and chloride-water trimers suggests that the ion-water-water three-body term is repulsive for the pyramidal minimum. The qualitatively similar three-body
J %
Pyramidal (C 3) Ring (C s)
I x %~%
Pyramidal (C 4) "3+I" (C 1)
Figure 17. Optimal structures of the minima for the X-(H20)n (n = 3, 4) clusters.

Water and Anion-Water Clusters 303
term in the ring minimum (both water molecules bonded to the ion) is also repulsive. However, the three-body term corresponding to the arrangement in which only one water molecule is bonded to the ion is attractive. The pyramidal minimum is also characterized by an attractive three-body water-water-water interaction due to the fact that the arrangement of the three water molecules in the cluster resembles more or less the one of the water trimer. Again the magnitude of the ion-water interaction controls the degree of distortion of the basal trimer from the water trimer geometry. A quantitative account of this effect is shown in Figure 18. The stronger the ion-water interaction, the less competitive the hydrogen bonding between the water molecules and therefore the larger the distortion of the basal triangle from the water trimer optimal geometry. For negative ions exhibiting strong interactions with water, such as fluoride and hydroxide, this distortion amounts to more than 0.5/~ in the intermolecular O-O separation. For larger negative ions such as chloride and bromide, the size of the ion results in a longer distance from the center of the basal triangle (variable Y in Figure 18), a fact that results in stronger hydrogen bonding between the water molecules in the cluster. For the case of chloride- and bromide- water trimers the O-O separation is only 0.2 A longer than the corresponding separation in the water trimer.
Species Y Roo
(H20)3 2.800
H'(H20) 3 1.837 3.134
OH'(H20)3 1.812 3.321
F'(H20)3 1.816 3.247
Ci'(H20)3 2.717 3.009
Br'(H20)3 2.926 2.988
Figure 18. Optimal internal coordinates for some X-(H20) 3 pyramidal min- ima of the n = 3 clusters.

304 SOTIRIS S. XANTHEAS and THOM H. DUNNING, JR.
For the n = 4 cluster of chloride and bromide we have identified two low-lying minima on the PES, a pyramidal one of C a symmetry and a second one of C 1 symmetry resembling the structure of the pyramidal trimer with the fourth water along the edge of the pyramid. For both ions the pyramidal isomer is more stable by 2.1 (CI-) and 3.1 (Br-) kcal/mol. However, this structural pattern is by no means universal. For example, based in a change of the slope of the experimentally determined incremental association enthalpies of the hydroxide-water clusters 8 that showed a shell effect after n = 3, it has been proposed that the geometry of the n = 4 cluster of the hydroxide ion is rather OH-(H20)3(H20), i.e. the fourth water molecule bonds to the water cluster rather than the ion.
3.4. Structures of the Larger Clusters: "Interior" vs. "Surface" States
The previous section suggests that the search for local minima especially for n > 3 requires extensive sampling of a multidimensional PES. Furthermore, the pres- ence of hydrogen bonding between the water molecules in the clusters requires an accurate description of the individual dispersion interactions, therefore imposing additional requirements on the theoretical treatment. Because of this, accurate first principles calculations are by no means exhaustive in locating all the local minima for the larger clusters. Alternative approaches have utilized empirical interaction potentials 145-151 that, although they can sample the corresponding PESs much more quickly, oftentimes fail to reproduce even their qualitative features.
An issue that has currently attracted attention and it is still a matter of scientific debate, is the question as to whether halide ion-water clusters form "interior" (I) or "surface" (S) states, i.e. whether the ion lies inside or on the surface of a water cluster. 152,153 The situation can arise since the ion will not necessarily have the same coordination number (number of nearest water molecules) in the cluster and in solution. In the cluster environment the structural arrangement is driven by the minimization of the energy associated with both ion-water and water-water interactions. In the on-average homogeneous solution environment, on the other hand, the ion-water interaction is dominant since the water-water interactions are essentially saturated. Therefore the packing of water molecules around an ion in a cluster is not necessarily the same as in solution.
Apart from dynamical considerations, the relative stability between (I) and (S) states is clearly an interplay between the total ion-water and water-water interac- tions, as was previously reported 152-153 by Combariza, Kestner, and Jortner. Any empirical interaction potential that attempts to quantify this issue, has to at least accurately reproduce these two interactions. A source of information for the halide ion-water interaction is the experimentally measured 133'134 incremental enthalpies of formation of the X-(H20) ~ clusters. First-principles calculations cannot only complement the experimental data, but also assist in choosing between several sets of conflicting experimental measurements as has, for instance, been demonstrated for the enthalpy of formation of the hydroxide- and fluoride-water clusters. 143'154

Water and Anion-Water Clusters 305
The case of the fluoride-water clusters clearly demonstrates that the dynamic as well as the static properties of clusters need to be taken into account to accurately model the competition between I and S states. For the F-(H20) 3 cluster, the energy difference between the C 3 pyramidal minimum and the C3h transition state is just 0.3 kcal/mol. 126 This result is due to the fact that hydrogen bonding between the water molecules at the C 3 minimum geometry is very weak, with the energetics being dominated by the much stronger fluoride-water interaction. Incremental enthalpies of formation for the fluoride-water clusters have been reported by Kebarle and coworkers. 133'134 However, more recent experimental measurements by Hiraoka et al. 155 yielded enthalpies of formation that are from 3 to 15% larger than Kebarle's estimates for the n = 2-5 clusters. The range of Hiraoka's measure- ments is within 0.3 kcal/mol (n = 2) and 1.3 kcal/mol (n = 3) of the results of recent ab initio calculations 126 which, at the same time, suggested a value for the enthalpy of formation of the n = 1 cluster that is -28.9 kcal/mol or -20% higher than Kebarle's estimate o f -23 .3 kcal/mol. Although Hiraoka et. al. did not measure AH0,1, the agreement between their results and the ab initio calculations for the n = 2 and 3 clusters suggests that Kebarle's estimate might indeed be too low.
The (20%) difference noted above in the dominant fluoride-water interaction will affect the solvation properties of fluoride both in aqueous clusters and in bulk water. A polarizable water potential that was reparametrized using the ab initio results for the n = 1 cluster 154 yielded near 0 K minimum energy structures for the n = 1-3 clusters are quite similar to the corresponding ones obtained by ab initio calculations. Furthermore, from MD simulations at finite temperature (300 K), a competition between (S) and (I) states was observed with the (I) states dominating for the clusters with six or more water molecules. A configuration in which the ion lies on or close to the surface of a water cluster exhibits, in general, less ion-water and more water-water bonding. In contrast, the (I) states have more ion-water interactions than the (S) states. In the case at hand, by increasing the strength of the ion-water interaction by 10%, the total stabilization energy due to ion-water interactions was more competitive with respect to the corresponding one due to water-water interactions. This clearly results in reducing the number of water molecules needed to form an interior state in a finite cluster. Indeed (I) states appear "earlier" (i.e. for smaller n) than in previous studies that used the same water-water interaction potential but the weaker ion-water interaction (-23.3 kcal/mol).
ACKNOWLEDGMENTS
This work was performed under the auspices of the Division of Chemical Sciences, Office of Basic Energy Sciences, US Department of Energy under Contract DE-AC06-76RLO 1830 with Battelle Memorial Institute, which operates the Pacific Northwest National Laboratory. Computer resources were provided by the Division of Chemical Sciences and by the Scientific Computing Staff, Office of Energy Research, at the National Energy Research Supercomputer Center (Berkeley, CA).

306 SOTIRIS S. XANTHEAS and THOM H. DUNNING, JR.
REFERENCES 1. Teeter, M. M. Proc. Natl. Acad. Sci. USA 1984, 81, 6014. 2. Niedle, S.; Berman, H.; Shieh, H. S. Nature 1980, 288, 129. 3. LBL Research Review 1991, 16, 2. 4. Clusters of Atoms and Molecules II: Solvation and Chemistry of Free Clusters, and Embedded,
Supported and Compressed Clusters; Haberland, H., Ed.; Springer-Verlag: Berlin, 1994, Vol. 56. 5. Moore, C. E. Atomic Energy Levels; Natl. Bur. Stand.: Washington DC, 1949, Vols. I-III, Circ
467. ' 6. Hotop, H.; Lineberger, W. C. J. Phys. Chem. Ref. Data 1985, 14, 731; Mead, R. D.; Stevens, A.
E.; Lineberger, W. C. In Gas Phase Ion Chemistry; Bowers, M. T., Ed.; Academic: New York, 1984. 7. Studies in Physical and Theoretical Chemistry: The Chemical Physics of Solvation; Dogonadze,
R. R.; Kalman, E.; Komyshev, A. A.; Ulstrup, J., Eds., Elsevier: Amsterdam, 1985, Vols. 38A-C; Kollman, P. A. In Modern Theoretical Chemistry: Applications of Electronic Structure Theory; Schaefer, H. E III, Ed.; Plenum: New York, 1977, Vol. 4, p.109. For a recent review see Robinson, G. W.; Zhu, S.-B.; Singh, S.; Evans, M. W. Water in Biology, Chemistry and Physics. Experimental Overviews and Computational Methodologies; World Scientific: Singapore, 1996.
8. Meot-Ner (Mautner), M.; Speller, C. V. J. Phys. Chem. 1986, 90, 6616. 9. Dyke, T. R.; Mack, K. M.; Muetner, J. S. J. Chem. Phys. 1977, 66, 498.
10. Dyke, T. R. J. Chem. Phys. 1977, 66, 492. 11. Odutola, J. A.; Dyke, T. R. J. Chem. Phys. 1980, 72, 5062. 12. Huang, Z. S.; Miller, R. E. J. Chem. Phys. 1989, 91, 6613. 13. Huang, Z. S.; Miller, R. E. J. Chem. Phys. 1988, 88, 8008. 14. Hougen, J. T. J. Mol. Spectrosc. 1985, 114, 395. 15. Coudert, L. H.; Lovas, E J.; Suenram, R. D.; Hougen, J. T. J. Chem. Phys. 1987, 87, 6290. 16. Coudert, L. H.; Hougen, J. T. J. Mol. Spectrosc. 1988, 130, 86. 17. Fraser, G. T. Int. Rev. Phys. Chem. 1991, 10, 189. 18. Pugliano, N.; Saykally, R. J. J. Chem. Phys. 1992, 96, 1832. 19. Curtiss, L. A.; Pople, J. A. J. Mol. Spec. 1975, 55, 1. 20. Diercksen, G. H. E; Kraemer, W. P.; Roos, B. O. Theor. Chim. Acta 1975, 36, 249. 21. Frisch, M. J.; Pople, J. A.; Del Bene, J. A. J. Phys. Chem. 1985, 89, 3664. 22. Frisch, M. J.; Del Bene, J. A.; Binkley, J. S.; Schaefer, H. E III J. Chem. Phys. 1986, 84, 2279. 23. Szalewicz, K.' Cole, S. J." Kolos, W." Bartlett, R. J. J. Chem. Phys. 1988, 89, 3662. 24. Smith, B. J.; Swanton, D. J." Pople, J. A.; Schaefer, H. E III; Radom, L. J. Chem. Phys. 1990, 92,
1240. 25. Marsden, C. J." Smith, B. J.; Pople, J. A." Schaefer, H. F. III; Radom, L. J. Chem. Phys. 1991, 95,
1825. 26. Kim, K. S.; Mhin, B. J.; Choi, U.-S.; Lee, K. J. Chem. Phys. 1992, 97, 6649. 27. Feller, D. J. Chem. Phys. 1992, 96, 6104. 28. Van Duijneveldt-van de Rijdt, J. G. C. M.; van Duijneveldt, E B. J. Chem. Phys. 1992, 97, 5019. 29. Xantheas, S. S. J. Chem. Phys. 1996, 104, 8821. 30. Kim, J.; Lee, J. Y.; Lee, S.; Mhin, B. J.; lOm, K. S. J. Chem. Phys. 1995, 102, 310. 31. For a recent review see van Duijneveldt, E B.; van Duijneveldt-van de Rijdt, J. G. C. M.; van
Lenthe, J. H. Chem. Rev. 1994, 94, 1873 and references therein. 32. Matsuoka, O." Clementi, E.; Yoshimine, M. J. Chem. Phys. 1976, 64, 1351. 33. Corongiu, G.; Clementi, E. J. Chem. Phys. 1992, 98, 2241 and references therein. 34. Mr C." Plesset, M. S. Phys. Rev. 1934, 46, 618. 35. Cizek, J. Adv. Chem. Phys. 1969, 14, 35. 36. Purvis, G. D.; Bartlett, R. J. J. Chem. Phys. 1982, 76, 1910. 37. Scuseria, G. E.; Janssen, C. L.; Schaefer, H. E III J. Chem. Phys. 1988, 89, 7382. 38. Dunning, T. H. Jr. J. Chem. Phys. 1989, 90, 1007.

Water and Anion-Water Clusters 307
39. Kendall, R. A.; Dunning, T. H. Jr.; Harrison, R. J. J. Chem. Phys. 1992, 96, 6796. 40. Boys, S. E; Bernardi, E MoL Phys. 1970, 19, 553. 41. Althorpe, S. C.; Clary, D. C. J. Chem. Phys. 1994, 101, 3603. 42. Gregory, J. K.; Clary, D. C. J. Chem. Phys. 1995, 102, 7817. 43. Honegger, E.; Leutwyler, S. J. Chem. Phys. 1988, 88, 2582. 44. Garrett, B. C.; Melius, C. F. In Theoretical and Computational Models for Organic Chemistry;
Formosinho, S. J., Ed.; Kluver Academic: Netherlands, 1991, p. 35. 45. Habitz, P.; Bagus, P.; Siegbahn, P.; Clementi, E. Int. J. Quant. Chem. 1983, 23, 1803; Chalasinski,
G.; Szczesniak, M. M.; Cieplak, P.; Scheiner, S. J. Chem. Phys. 1991, 94, 2873. 46. Mo, O." Yanez, M." Elguero, J. J. Chem. Phys. 1992, 97, 6628. 47. Van Duijneveldt-van de Rijdt, J. G. C. M.; van Duijneveldt, F. B. Chem. Phys. 1993, 175, 271. 48. Xantheas, S. S.; Dunning, T. H. Jr. J. Chem. Phys. 1993, 98, 8037. 49. Xantheas, S. S.; Dunning, T. H. Jr. J. Chem. Phys. 1993, 99, 8774. 50. Fowler, J. E.; Schaefer, H. F. III J. Am. Chem. Soc. 1995, 117, 446. 51. Dyke, T. R.; Muetner, S.J. Chem. Phys. 1972,57, 5011. 52. Pugliano, N.; Saykally, R. J. Science 1992, 257, 1937. 53. Liu, K.; Loeser, J. G.; Elrod, M. J.; Host, B. C.; Rzepiela, J. A.; Pugliano, N.; Saykally, R. J. J.
Amer. Chem. Soc. 1994, 116, 3507. 54. Liu, K.; Elrod, M. J.; Loeser, J. G.; Cruzan, J. D.; Pugliano, N.; Brown, M. G.; Rzepiela, J.;
Saykally, R. J. Faraday Discuss. 1994, 97, 35. 55. Suzuki, S.; Blake, G. A. Chem. Phys. Lett. 1994, 229, 499. 56. Wales, D. J. J. Am Chem. Soc. 1993, 115, 11180. 57. Wales, D. J. J. Am Chem. Soc. 1993, 115, 11191. 58. Schtitz, M.; BUrgi, T.; Leutwyler, S.; Btlrgi, H. B. J. Chem. Phys. 1993, 99, 5228. 59. Klopper, W.; SchUtz, M. Chem. Phys. Len. 1995, 237, 536. 60. Pinto, Y.; Hel-Or, H. Z.; Avnir, D. J. Chem. Soc., Faraday Trans. 1996, 92, 2523. 61. Lentz, B. R." Scheraga, H. A. J. Chem. Phys. 1973, 58, 5926. 62. Belford, D.; Campbell, E. S. J. Chem. Phys. 1987, 86, 7013. 63. Wawak, R. J.; Wimmer, M. M.; Scheraga, H. A. J. Phys. Chem. 1992, 96, 5138. 64. Kim, K. S.; Dupuis, M.; Lie, G. C." Clementi, E. Chem. Phys. Lett. 1986, 131,451. 65. Dykstra, C. E. J. Chem. Phys. 1989, 91, 6472. 66. Knochenmuss, R.; Leutwyler, S. J. Chem. Phys. 1992, 96, 5233. 67. Cruzan, J. D.; Braly, L. B.; Liu, K.; Brown, M. G.; Loeser, J. G.; Saykally, R. J. Science 1996,
271, 59. 68. Cruzan, J. D.; Brown, M. G.; Liu, K.; Braly, L. B.; Saykally, R. J. J. Chem. Phys. 1996,105, 6634. 69. Schtitz, M.; Klopper, W.; Ltithi, H.; Leutwyler, S. J. Chem. Phys. 1995, 103, 6114. 70. Plummer, P. L. M.; Chen, T. S. J. Chem. Phys. 1987, 86, 7149. 71. Burke, L. A.; Jensen, J. O.; Jensen, J. L.; Krishnan, P. N. Chem. Phys. Lett. 1993, 206, 293. 72. Liu, K.; Brown, M. G.; Cruzan, J. D.; Saykally, R. J. Science 271, 62 (1996). 73. Wales, D. J.; Walsh, T. R. J. Chem. Phys. 199@ 105, 6957. 74. Xantheas, S. S. Phil. Mag. B 1996, 73, 107. 75. Xantheas, S. S. J. Chem. Phys. Submitted. 76. Tsai, C. J.; Jordan, K. D. Chem. Phys. Lett. 1993, 213, 181. 77. Mhin, B. J., Kim, J.; Lee, S.; Lee, J. Y.; Kim, K. S. J. Chem. Phys. 1994, 100, 4484. 78. Lee, C.; Chen, H.; Fitzgerald, G. J. Chem. Phys. 1994, 101, 4472. 79. Kim, K.; Jordan, K. D.; Zwier, T. S.J. Am. Chem. Soc. 1994, 116, 11568. 80. Haberland, H.; Ludewigt, C." Schindler, H.-G.; Worsnop, D. R. J. Chem. Phys. 1984, 81, 3742. 81. Garrett, W. R. J. Chem. Phys. 1980, 73, 5721. 82. Garrett, W. R. J. Chem. Phys. 1982, 77, 3666. 83. Liu, K.; Brown, M. G.; Carter, C.; Saykally, R. J.; Gregory, J. K.; Clary, D. C. Nature 1996, 381,
501.
308 SOTIRIS S. XANTHEAS and THOM H. DUNNING, JR.
84. Tsai, C. J.; Jordan, K. D. J. Chem. Phys. 1991, 95, 3850. 85. Ferrari, A. M.; Garrone, E.; Ugliengo, P. Chem. Phys. Lett. 1993, 212, 644. 86. Lee, C.; Chen, H.; Fitzgerald, G. J. Chem. Phys. 1995, 102, 1266. 87. Gruenloh, C. J.; Carney, J. R.; Arrlngton, C. A.; Zwier, T. S.; Fredericks, S. Y.; Jordan, K. D.Science
1997, 276, 1678. 88. Wales, D. J.; Ohmine, I. J. Chem. Phys. 1993, 98, 7245. 89. Wales, D. J.; Ohmine, I. J. Chem. Phys. 1993, 98, 7257. 90. Eggen, B. R.; Marks, A. J.; Murrell, J. N.; Farantos, S. C. Chem. Phys. Lett. 1994, 219, 247. 91. Benson, S. W.; Siebert, E. D.J. Am. Chem. Soc. 1992, 114, 4269. 92. Jorgensen, W. U; Chandrasekhar, J.; Madura, J. D.; lmpey, R. W.; Klein, M. U J. Chem. Phys.
1983, 79, 926; Jorgensen, W. L.; Madura, J. D. Mol. Phys. 1985, 56, 1381; Jorgensen, W. L.; Tirado-Rives, J. J. Am. Chem. Soc. 1988, 110, 1657.
93. Tsai, C. J.; Jordan, K. D. J. Phys. Chem. 1993, 97, 11227. 94. Wojcik, M.; Clementi, E. J. Chem. Phys. 1986, 85, 3544; ibid. 1986, 84, 5970. 95. Lie, G. C.; Corongiu, G.; Clementi, E. J. Phys. Chem. 1985, 89, 4131; Detrich, J.; Corongiu, G.;
Clementi, E. Chem. Phys. Lett. 1984, 112, 426. 96. Kim, K.; Jordan, K. D. J. Phys. Chem. 1994, 98, 10089; Xantheas, S. S. J. Chem. Phys. 1995,102,
4505. 97. Feyereisen, M." Feller, D.; Dixon, D. A. J. Phys. Chem. 1996, 100, 2993. 98. Batista, E.; Jonsson, H.; Xantheas, S. S. Unpublished results. 99. Dixon, D. A. Private communication.
100. Huisken, E" Kaloudis, M.; Kulcke, A. J. Chem. Phys. 1996, 104, 17. 101. Xantheas, S. S. Water pentamer optimal geometry and harmonic frequencies. Unpublished results. 102. Badger, R. M. J. Chem. Phys. 1934, 2, 128; ibid. 1935, 3, 710. 103. Herzberg, G. Molecular Spectra and Molecular Structure: I. Spectra of Diatomic Molecules; 2
ed.; Van Nostrand Reinhold: New York, 1950, p. 457. 104. Bayley, J. G.; Kartha, V. B.; Stevens, W. H. Infrared Phys. 1963, 3, 211. 105. Coker, D. E; Reimers, J. R.; Watts, R. O. Aust. J. Phys. 1982, 35, 623. 106. Water: A Comprehensive Treatise; Franks, E, Ed.; Plenum: New York, 1972, Vol. 1, Chap. 4, p.
133. 107. Coker, D. E; Miller, R. E.; Watts, R. O. J. Chem. Phys. 1985, 82, 3554. 108. Wuelfert, S.; Herren, D.; Leutwyler, S. J. Chem. Phys. 1987, 86, 3751. 109. Vernon, M. E; Kranjovich, D. J.; Kwok, H. S.; Lisy, J. M.; Shen, Y. R.; Lee, Y. T. J. Chem. Phys.
1982, 77, 47. 110. Keesee, R. G.; Castleman, A. W. Jr. J. Phys. Chem. Ref Data 1986, 15, 1011. 111. Chase, M. W. Jr.; Davies, C. A.; Downey, J. R. Jr.; Frurlp, D. J.; McDonald, R. A.; Syverud, A. N.
J. Phys. Chem. Ref Data 1985, 11, Suppl. 1. 112. Henchman, M.; Paulson, J. E Radiat. Phys. Chem. 1988, 32, 417. 113. Paulson, J. E; Henchman, M. Bull. Am. Phys. Soc. 1982, 27, 108. 114. Paulson, J. E; Henchman, M. In Ionic Processes in the Gas Phase; Almoster Ferreira, M. A., Ed.;
Reidel: Dordrecht, Holland, 1984; NATO ASI Ser. C, Vol. 118. 115. Kleingeld, J. C.; Nibbering, N. M. M. Int. J. Mass. Spectrom. Ion Phys. 1983, 49, 311. 116. Griffiths, W. J.; Harris, E M. Int. J. Mass. Spectrom. Ion Proc. 1987, 77, R7; Griffiths, W. J.; Harris,
E M. Org. Mass Spectrom. 1987, 22, 812. 117. De Lange, W.; Nibbering, N. M. M. Int. J. Mass. Spectrom. Ion Proc. 1987, 80, 201. 118. Karl, R. E.; Csizmadia, I. G. J. Am. Chem. Soc. 1977, 99, 4539. 119. Glidewell, C. J. Mol. Struct. 1980, 67, 121. 120. Squires, R. R. In Ionic Processes in the Gas Phase; Almoster Ferreira, M. A., Ed.; Reidel:
Dordrecht, Holland 1984; NATO ASI Set. C, Vol. 118. 121. Cremer, D.; Kraka, E. J. Phys. Chem. 1986, 90, 33. 122. Chalasinski, G.; Kendall, R. A.; Simons, J. J. Chem. Phys. 1987, 87, 2965.

Water and Anion-Water Clusters 309
123. Ortiz, J. V. J. Chem. Phys. 1989, 91, 7024; J. Phys. Chem. 1990, 94, 4762. 123. Gutowski, M.; Simons, J.; Hernandez, R." Taylor, H. L. J. Phys. Chem. 1988, 92, 6179. 124. Gutowski, M.; Simons, J. J. Chem. Phys. 1990, 93, 3874. 125. Xantheas, S. S.; Dunning, T. H. Jr. J. Chin. Chem. Soc. 1995, 42, 241. 126. Xantheas, S. S.; Dunning, T. H. Jr. J. Phys. Chem. 1994, 98, 13489. 127. Kreevoy, M. M.; Liang, T. M. J. Amer. Chem. Soc. 1980, 102, 3315; Weil, D. A.; Dixon, D. A. J.
Amer. Chem. Soc. 1985, 107, 6859. 128. Klots, C. E.; Compton, R. N. J. Chem. Phys. 1978, 69, 1644. 129. Knapp, M.; Echt, O.; Kreisle, D.; Recknagel, E. J. Chent Phys. 1986, 85, 636. 130. Van Doren, J. M.; Barlow, S. E.; Depuy, C. H., Bierbaum, V. M. Int. J. Mass Spec. Ion Proc. 1987,
81, 85. 131. Yang, X.; Castleman, A. W. Jr. J. Phys. Chem. 1990, 94, 8500. 132. De Paz, M.; Giardini, A. G.; Friedman, L. J. Chem. Phys. 1970, 52, 687. 133. Ashadi, M.; Kebarle, P. J. Phys. Chem. 1970, 74, 1483. 134. Payzant, J. D.; Yamdagni, R.; Kebarle P. Can. J. Chem. 1971, 49, 3308. 135. Newton, M. D.; Ehrenson, S. J. Am. Chem. Soc. 1971, 93, 4971. 136. Szczesniak, M. M.; Scheiner, S. J. Chem. Phys. 1982, 77, 4586. 137. McMichael Rohlfing, C.; Allen, L. C.; Cook, C. M. J. Chem. Phys. 1983, 78, 2498. 138. Sapse, A.-M.; Osorio, L.; Snyder, G. Int. J. Quant. Chem. 1984, XXVI, 223. 139. Ohta, K.; Morokuma, K. J. Phys. Chem. 1985, 89, 5845. 140. Andr6s, J. L.; Dur~, M.; Lled6s, A." Bertr~in, J.; Chem. Phys. Lett. 1986, 124, 177. 141. Carbonell, E.; Andr6s, J. L.; Lled6s, A.; Dur~, M.; Bertr~, J. J. Am. Chem. Soc. 1988, 110, 996. 142. Del Bene, J. E. J. Phys. Chem. 1988, 92, 2874. 143. Xantheas, S. S. J. Am. Chem. Soc. 1995, 117, 10373. 144. Xantheas, S. S. Structures and vibrational spectra of bromide-water clusters. Unpublished. 145. Zhao, X. G.; Gonzalez-Lafont, A.; Truhlar, D. G. J. Chem. Phys. 1991, 94, 5544. 146. Kirtenmacher, H.; Popkie, H.; Clementi, E. J. Chem. Phys. 1973, 58, 5627. 147. Perera, L.; Berkowitz, M. L. J. Chem. Phys. 1994, 100, 3085. 148. Caldwell, J. D.; Kollman, P. A. J. Phys. Chem. 1992, 96, 8249. 149. Asada, T.; Nishimoto, K.; Kitaura, K. J. Phys. Chem. K. 1993, 97, 7724. 150. Dang, L. X.; Smith, D. E. J. Chem. Phys. 1993, 99, 6950. 151. Dang, L. X.; Rice, J. E.; Caldwell, J.; Kollman, P. A. J. Am. Chem. Soc. 1993, 113, 2481. 152. Combariza, J. E.; Kestner, N. R.; Jortner, J. Chem. Phys. Lett. 1993, 203, 423. 153. Combariza, J. E.; Kestner, N. R.; Jortner, J. J. Chem. Phys. 1994, 100, 2851. 154. Xantheas, S. S.; Dang, L. X. J. Phys. Chem. 1996, 100, 3989. 155. Hiraoka, K.; Mizuse, S.; Yamabe, S. J. Phys. Chem. 1988, 92, 3943.

This Page Intentionally Left Blank

DIFFUSION MONTE CARLO STUDIES OF WATER CLU STERS
Jonathon K. Gregory and David C. Clary _
, , . . . . , , , , .
Abstract . . . . . . . . . . . . . . . . . . . . . . . . . . . . . . . . . . . . . 312
1. Introduction . . . . . . . . . . . . . . . . . . . . . . . . . . . . . . . . . . . 312
2. Diffusion Monte Carlo (DMC) . . . . . . . . . . . . . . . . . . . . . . . . . 314
2.1. I somorphism . . . . . . . . . . . . . . . . . . . . . . . . . . . . . . . 314
2.2. The R a n d o m Walk . . . . . . . . . . . . . . . . . . . . . . . . . . . . 316
2.3. Cont inuous Weighting . . . . . . . . . . . . . . . . . . . . . . . . . . 316
2.4. Reference Energy . . . . . . . . . . . . . . . . . . . . . . . . . . . . . 317
2.5. Descendant Weighting . . . . . . . . . . . . . . . . . . . . . . . . . . 318
2.6. Rigid Body Diffusion Monte Carlo ( R B D M C ) . . . . . . . . . . . . . 318
2.7. Exci ted States . . . . . . . . . . . . . . . . . . . . . . . . . . . . . . . 320
3. Tunnel ing . . . . . . . . . . . . . . . . . . . . . . . . . . . . . . . . . . . . 321
3.1. Introduction . . . . . . . . . . . . . . . . . . . . . . . . . . . . . . . . 321
3.2. Molecular Symmet ry . . . . . . . . . . . . . . . . . . . . . . . . . . . 324
3.3. Tunnel ing in D M C . . . . . . . . . . . . . . . . . . . . . . . . . . . . 325
3.4. Correlated Sampling . . . . . . . . . . . . . . . . . . . . . . . . . . . 326
4. Simulat ion Details . . . . . . . . . . . . . . . . . . . . . . . . . . . . . . . . 327
4.1. Potential Energy Surfaces . . . . . . . . . . . . . . . . . . . . . . . . 327
4.2. Quan tum Simulat ions . . . . . . . . . . . . . . . . . . . . . . . . . . . 329
5. The Water Dimer . . . . . . . . . . . . . . . . . . . . . . . . . . . . . . . . . 329
5.1. Introduction . . . . . . . . . . . . . . . . . . . . . . . . . . . . . . . . 329
5.2. Tunnel ing Splittings . . . . . . . . . . . . . . . . . . . . . . . . . . . 329
Advances in Molecular Vibrations and Collision Dynamics, Volume 3, pages 311-363. Copyright �9 1998 by JAI Press Inc. All rights of reproduction in any form reserved. ISBN: 1-55938-790-4
311

312 JONATHON K. GREGORY and DAVID C. CLARY
6. The Water Trimer . . . . . . . . . . . . . . . . . . . . . . . . . . . . . . . . . 332 6.1. Introduction . . . . . . . . . . . . . . . . . . . . . . . . . . . . . . . . 332 6.2. Dynamics . . . . . . . . . . . . . . . . . . . . . . . . . . . . . . . . . 333
7. The Water Tetramer . . . . . . . . . . . . . . . . . . . . . . . . . . . . . . . . 336 7.1. Introduction . . . . . . . . . . . . . . . . . . . . . . . . . . . . . . . . 336 7.2. Dynamics . . . . . . . . . . . . . . . . . . . . . . . . . . . . . . . . . 337
8. The Water Pentamer . . . . . . . . . . . . . . . . . . . . . . . . . . . . . . . 339 8.1. Introduction . . . . . . . . . . . . . . . . . . . . . . . . . . . . . . . . 339 8.2. Dynamics . . . . . . . . . . . . . . . . . . . . . . . . . . . . . . . . . 340
9. The Water Hexamer . . . . . . . . . . . . . . . . . . . . . . . . . . . . . . . 343, 9.1. Introduction . . . . . . . . . . . . . . . . . . . . . . . . . . . . . . . . 344 9.2. Structural Assignment . . . . . . . . . . . . . . . . . . . . . . . . . . . 345 9.3. Dynamics of the Cage Hexamer . . . . . . . . . . . . . . . . . . . . . 345 9.4. Quantum Simulations . . . . . . . . . . . . . . . . . . . . . . . . . . . 350 9.5. Conclusions . . . . . . . . . . . . . . . . . . . . . . . . . . . . . . . . 352
10. General Trends with Cluster Size . . . . . . . . . . . . . . . . . . . . . . . . . 353 10.1. Introduction . . . . . . . . . . . . . . . . . . . . . . . . . . . . . . . . 353 10.2. Relaxation Effects . . . . . . . . . . . . . . . . . . . . . . . . . . . . . 353 10.3. Zero-Point Energies . . . . . . . . . . . . . . . . . . . . . . . . . . . . 354 10.4. Association Energies . . . . . . . . . . . . . . . . . . . . . . . . . . . 355 10.5. Hydrogen Bond Energies . . . . . . . . . . . . . . . . . . . . . . . . . 355 10.6. Rotational Constants . . . . . . . . . . . . . . . . . . . . . . . . . . . 357 10.7. O...O Distances . . . . . . . . . . . . . . . . . . . . . . . . . . . . . . 357
11. Conclusions . . . . . . . . . . . . . . . . . . . . . . . . . . . . . . . . . . . . 358 Acknowledgments . . . . . . . . . . . . . . . . . . . . . . . . . . . . . . . . 359 References . . . . . . . . . . . . . . . . . . . . . . . . . . . . . . . . . . . . 359
ABSTRACT
The application of the diffusion Monte Carlo (DMC) method to the calculation of vibrationally averaged structures and tunneling dynamics of water clusters from the dimer to the hexamer is described. Use of the rigid body DMC approach and correlated sampling for different tunneling states gives high accuracy with minimal computa- tional expense. These techniques, together with the positioning of nodes of excited state wavefunctions by symmetry and use of highly realistic intermolecular potentials including many-body forces, provide a realistic quantum mechanical description of these clusters and allows for detailed and systematic comparisons with spectroscopic data.
1. INTRODUCTION
The study of water clusters is of fundamental importance to our understanding of
properties of liquid water and ice and it provides a bridge between the water dimer, the structure of which is known experimental ly I and has been characterized quite
well theoretically, 2 in the condensed phase. There is a particular need to gain greater

DMC Studies of Water Clusters 313
understanding of the non-pairwise additive interactions which play a significant role in determining the nature of the intermolecular forces between water mole- cules. The advent of far-infrared vibration-rotation-tunneling spectroscopy 3-5 has prompted much theoretical activity aimed at characterizing the structures and dynamics of small water clusters.
Most theoretical structural studies for water clusters have been based upon ab initio calculations 6-9 but these have limitations, especially for the larger clusters where such calculations are very demanding. The water dimer is sufficiently small to facilitate accurate calculations, 2 and a recent publication has dealt with this system using MP2 calculations with some large basis sets. l~ Extensive MP2 ab initio geometry optimizations have been performed for the water trimer, locating transition states as well as minima. 9'I1'12 In addition, the rearrangements have been studied to provide insight into the possible origins of observed tunneling split- tings. 13'14 A grid of ab initio points for the torsional space of the trimer has been used for a full quantum mechanical study in only the torsional degrees of free- dom 11'15-17 and a sophisticated study of the water tetramer potential energy surface has recently been reported by Schtitz et al. 18 and Wales and Walsh. 19
The most stable structures for the pentamer and, more significantly, the hexamer, are not well known due to a deficiency in experimental data and to the complexity of the theoretical calculations required to study them accurately. Most calculations for these clusters have involved energy minimizations which have been carried out at the SCF level of theory 2~ although density function 21-23 and MP2 24 optimizations have also been used recently. In addition, there has been a number of studies using various empirical potential functions. 25-27 Although these calculations are consid- erably cheaper than ab initio methods and allow a thorough examination of the potential energy surface, they are generally limited by the quality of the potentials used. The two most obvious deficiencies of these potentials are the use of rigid monomers and the neglect, or incomplete description, of the many-body forces which are so important in water clusters. Although harmonic frequencies and hence the harmonic zero-point energy can be calculated, the potential energy surfaces of water clusters are extremely flat and anharmonic, and this is not a good approach to use.
However, a combination of empirical potential and ab initio calculations has indicated that, as for the trimer and tetramer, the most stable pentamer is probably cyclic. 28-32 A more detailed examination of this cyclic structure has appeared 8'33 and recently been observed experimentally. 34 The dynamics of this structure remain to be characterized in detail although Wales and Walsh 35 reported rearrangements for a number of water pentamers including the cyclic structure which appears to have, at least partially, dynamics analogous to the trimer. However, tunneling splittings similar to those in the trimer have not yet been observed experimentally. 34
The hexamer is harder to characterize since the large number of nearly isoener- getic minima are closer together than the probable accuracy obtained using empiri-
20 27 28 36 37 cal potentials . . . . and ab initio studies 20-22,26,32,37,38 T h i s is quite possibly

314 JONATHON K. GREGORY and DAVID C. CLARY
the smallest water cluster for which a cyclic structure is not the most stable, a question to be addressed later. The water octamer and larger clusters are known to prefer three-dimensional structures 2s'39 and the hexamer is thought to be the transition stage between cyclic and noncyclic structures.
In 1986, Coker and Watts 4~ showed how the diffusion Monte Carlo (DMC) method, previously applied in electronic structure problems, 41 could be adapted to solve the Schrfdinger equation for nuclear motion, assuming that the electronic energy was known for any realistic geometry; in other words if an analytical potential energy surface was available for the simulation. Vibrational DMC 42-51 has many advantages: most notably a favorable size scaling, use of Cartesian coordi- nates, and inherent simplicity. The fact that excited states cannot normally be obtained has been seen as a drawback in that the method is not used extensively. However, it cannot be ignored that DMC facilitates a theoretical probe of the dynamics of the ground vibrational state of larger clusters to good accuracy. The method has been used, particularly for weakly bound complexes, since the strong couplings and anharmonicities of the intermolecular modes mean that more ap- proximate methods are inadequate. In the next section, the theory behind the DMC method, particularly how it can be applied to nuclear dynamics, is fully described. We then go on to describe a systematic application of DMC to examine the vibrationally averaged structures and tunneling dynamics of water clusters from the dimer to the hexamer.
2. DIFFUSION MONTE CARLO (DMC)
2.1. Isomorphism
It will be described how it is possible to solve the nuclear Schrfdinger equation for a quantum system, given a suitable potential energy surface. In atomic units (a.u.), the nuclear time-dependent Schrfdinger equation for a system of N particles is,
N
i ~l/(r'~gt t) = _ s ~ 1 V211/(r ' t) + Vxg(r, t)
k=-I
(1)
where ~ is the wavefunction, V the potential energy, r the positional coordinates, t the time and m k the mass of particle k. Transforming into imaginary time (1: = it) gives"
N ~l/(r, 1:~ 1
al: = s ~ VkZqt(r' ~:) - V~(r, "r,) k=-I
(2)
By considering only the first term on the right of this equation, it is possible to make an analogy with the classic diffusion equation,

DMC Studies of Water Clusters 315
a c = n v 2 c (3) Ot
where C defines a probability at position r and time r The wavefunction can therefore be interpreted as a probability density in a diffusion process where the diffusion constant is defined by D = 1/2m~. This connection implies that the Schr6dinger equation may be simulated by a diffusion process and solved by a random walk. The linearity of the Schr6dinger equation means that a population of random walkers (replicas) may be used; a replica essentially defines a possible geometry of the molecular system and partially describes the wavefunction. How- ever, it is first necessary to examine the role of the second term on the right hand side of Eq. 2. If this term alone were to be present then there would be a form corresponding to a normal first order differential equation:
OC = kC (4) ~)t
This describes a branching process, such as exponential growth or decay of a population. It is now possible to see a means of simulating the Schr6dinger equation by subjecting a population of noninteracting replicas to a random walk, with weight adjustment corresponding to simulating the two terms on the right of Eq. 2. These two terms will be described in more detail later.
To gain more insight into simulating the Schr6dinger equation, consider the formal solution to Eq. 1 which is:
V(r, t)= Z cntPnexp(-itEn) n
In the imaginary time frame being used, this becomes,
(5)
V(r, a:)= ~ c,q~nexp(-xEn) (6) n
where q~ and En represent the eigenfunction and eigenvalues of the quantum states. As the imaginary time variable becomes large, the dominant term in Eq. 6 corre- sponds to the lowest eigenstate:
~(r, x) --> Co(Poexp(-xEo) (7)
At large "c, the higher energy eigenstates will have decayed to zero to a good approximation. However, a means for isolating E 0 is needed otherwise this too will have decayed to zero, assuming it has a finite value. This is achieved by introducing a reference energy which stabilizes the lowest energy (ground) state. This reference energy will be described in more detail later. The ground-state energy is obtained by averaging this reference energy over the simulation.

316 JONATHON K. GREGORY and DAVID C. CLARY
It has therefore been shown how, in principle, the ground vibrational state of any quantum system may be obtained, assuming that the corresponding PES is available in some analytical form.
2.2. The Random Walk
The random walk is achieved by displacing the x, y, and z coordinates of all atoms in the system in question. These random steps arise from using a finite time-step (A'0 much as in classical Monte Carlo or molecular dynamics simulations. They are not only dependent on Ax but also on the mass of the atom being moved (mk),
due to the fact that molecular vibrations depend on the mass of the atoms involved. The relationship between the displacement, Ar, and Ax and m k is known from the Einstein equation, 52
D = ArZ/2Ax (8)
and since, by comparing Eqs. 2 and 3 it can be seen that D = 1/2m k, the displacement is given by:
1/2
A r = A(~-~k / (9)
However, by using a finite value of the displacement, replicas would be moved around on a grid of points in N dimensions, spaced Ar apart. To avoid this, a Gaussian distribution is used to determine the actual displacements so that, in principle, any region of the potential energy surface can be explored. The Gaussian distribution is centered at zero and has a standard deviation of (Ax/rnk) 112.
2.3. Continuous Weighting
Incorporation of the potential energy term in the Schr6dinger equation into the simulation is achieved by assigning to each replica a weight which changes with the energy as it diffuses over the potential energy surface. Numerically, this corresponds to,
Wi = W i e x p [ _ ( V i _ Eref)A,l: ] (10)
where V i is the potential energy of the i th replica and Ere f is a reference energy discussed in the next section. If a replica is in a region of low energy, its weight will increase in line with the large ground-state wavefunction and vice versa. This method was used by Sun and Watts, 43 replicas previously being replicated or deleted with a probability governed by the exponential part of Eq. 10 as described by Anderson. 53
The continuous weighting method has two advantages: first it does not require the use of random numbers, and second the population of replicas remains constant

DMC Studies of Water Clusters 317
rather than fluctuating about its initial size. However, there is a problem in that, statistically, the use of a random walk without any bias means that most replicas will diffuse into unimportant high-energy regions of the PES, resulting in low accuracy. This problem is avoided by deleting any replica whose weight falls below a certain critical threshold and by duplicating the replica with the highest weight so that the total weight and number of replicas are conserved. Obviously, this "repacking" imposes boundary conditions on the wavefunction, but, so long as the weight at which it is done is small enough, the error introduced is negligible. Suhm and Watts 46 suggest that the critical weight below which repacking is carried out should be 1/N where N is the total population (typically 1000), and this is the criterion employed in this work.
2.4. Reference Energy
It is possible to isolate the ground state of Eq. 6 only if we can prevent the exponential part from decaying to zero at large time values. Since the energy cannot be negative, this can be achieved only if the exponent itself becomes zero, by introducing a reference energy, Ere f, so that the solution to the Schrrdinger equation in imaginary time becomes:
V(x, x) = y_~ c.q~.exp(-x(E. - g re f ) ) (11) n
It is necessary to isolate the ground state by making Ere f equal to E 0. This circular problem can be solved by using a feedback technique as introduced by Anderson. 53 At the beginning of the simulation, the reference energy is set to be equal to the mean potential energy of the population of replicas (V). At each time-step, it is adjusted according to,
Eref = -~_ (x(W- N) (12) N
where W is the total weight, N the total number of all replicas, and c~ an adjustable parameter. If the total weight of replicas rises, Ere f will decrease, in effect reducing the total weight, since the exponent in Eq. 10 will become more negative. Con- versely, a smaller total weight will increase the value of this exponent.
The value of ct is so chosen as to minimize statistical uncertainties, which would arise if it was too large, but to avoid the population evolving too slowly which would result from very small cz values. In this respect, there is correlation between the value of tx and the time-step for the simulation and this relationship is imposed on all work here according to t~ = 1/A1;. 43 The value of the reference energy will fluctuate during the simulation but its mean value will be the exact ground-state energy, assuming a negligible time-step error.

318 JONATHON K. GREGORY and DAVID C. CLARY
2.5. Descendant Weighting
As described so far, the DMC formalism allows calculation of the vibrational ground state energy and wavefunction for any quantum system. However, since the wavefunction can be obtained, it is possible to calculate quantities of the form,
I A (13) P= Ill*(r)P~(r)dr A
so long as P is not a differential operator. However, it is inappropriate to obtain an exact quantum probability distribution (~2) by simply squaring the weights of the replicas. 54 The general method is to employ descendant weighting as described by Kalos 55 which works as follows. The value of the property Pi is calculated for each replica at each time-step and this value is weighted, according to the weight of the replica (Wi). Descendants of this'replica (Di), arising from the repacking in the continuous weighting part of the algorithm, are then followed. The vibrationally averaged property P is calculated from:
e ----
Z w,P,D,
~.~.WiDi !
(14)
Like the energy, P also may be calculated as the average value over the entire simulation, and the corresponding standard deviation used as a measure of the statistical uncertainty.
2.6. Rigid Body Diffusion Monte Carlo (RBDMC)
In the DMC method described in the previous section, the simulation of the diffusion term is achieved by moving each atom at random in three dimensions so that all vibrational modes of the system are simulated. The intramolecular modes are of high frequency and demand that a small time-step is used to ensure a negligible time-step error. If the intermolecular modes are treated independently, a larger time-step can be employed in the simulation since this lower frequency vibrational motion occurs over a larger time scale. A method for treating monomers as rigid bodies, and hence eliminating intramolecular vibrations from the DMC simulation, has been developed by Buch 56 and applied to van der Waals systems. 56-59
Consider a molecule reorientating itself by random steps of small angular displacement. The probability that it will be found pointing into a solid angle element at time t is defined by P(~, t), where ~ is defined in terms of three Euler angles: 3ff2 =/)~ sin 0 30 3~. The equation of motion for this molecule is, 6~
OP(~, t)/dt =-.q-[P(ff2, t) (15)

DMC Studies of Water Clusters 319
where t is the time and His the Hamiltonian. This shows that it is possible to use a diffusion equation to describe the probability distribution for a body undergoing random anisotropic rotation. 6~ The solution to Eq. 15 can be shown to be, 6~
P(~2, t) = f P(E20)P(E20 1 E2, t)/)E20 (16)
where P(E2o) is the probability that the molecule was described by an initial angle E20 at t = 0. The function describing the evolution of the motion from an initial state is the conditional probability that, if the molecule was at initial orientation E20, it will be at E2 at a later time t; this is given by, 6~
P(~o I ~, t)= 2 ~ l l * n ( ~ 2 O ) W n ( f 2 ) e x p ( - ( E n - Vref)t) n
(17)
where Vre f is the reference energy, and ~n and E, are the eigenfunctions and eigenvalues of .q-s
In Eq. 15, the Hamiltonian is given by,
H = - ( L . D . L) (18)
where D is the rotational diffusion tensor. However, as we are working in the coordinate system that diagonalizes D, we can rewrite Eq. 18 as,
H= 2 DiL2 i
(19)
which defines the system in terms of diffusion constants (Di) and Cartesian angular-momentum operators (Li). This Hamiltonian is identical to that for a rigid rotor, with the diffusion constants defined as O i = 1/21 i, I i being the moment of inertia of the body about the axis (i = a,b,c). The magnitude of the random rotations about the a, b, and c axes, for a given time-step, is given by a Gaussian distribution centered about zero, with a standard deviation of (A'r,/li) v2. This is similar to the nonrigid case (see Eq. 9) except that the moment of inertia has replaced the mass.
It has already been described how, in DMC, the Cartesian coordinates of each atom are adjusted randomly so as to simulate diffusion. In order to treat a set of rigid bodies, each molecule is given a set of rotational coordinates in a body-fixed frame and the center of mass of each molecule has Cartesian coordinates in the laboratory frame. The translational diffusions are performed in the same way as in conventional DMC, with the standard deviation of the zero-centered Gaussian being given by (Ax/M) 1/2, where M is the total mass of the body. The body-fixed frame movements are performed as random rotations about the three principal axes; the matrices for these rotations are of the form: 64

320 JONATHON K. GREGORY and DAVID C. CLARY
( c o s r sine 0 /c 0 0 - S o 0 / (COin Z sin z ! -s ~ cost~ O 1 -s Z cos
(20)
/ O 0 ~ ~sin0 0 cos0J / 0
The advantage of this rigid body diffusion Monte Carlo (RBDMC) procedure is that a much larger time-step 56'57'66 may be used. For the same computational effort, a RBDMC calculation gives improved statistical accuracy 58 for intermolecular properties over the normal DMC algorithm as it extends over a larger time.
The only difference between the DMC and RBDMC algorithms is the step by which the random walk is executed: in DMC this corresponds to random movement of all atoms in three dimensions, whereas in RBDMC the monomers are subject to rotational diffusion and a relative translational motion.
2.7. Excited States
All discussions so far have shown how ground-state vibrational states can be obtained by DMC. The advantage of DMC over other similar quantum methods is the favorable size scaling of the method which makes it unique in its application to larger systems such as will be discussed here. However, the main problem arising with DMC, certainly compared to methods which show far worse size-scaling, is that excited states cannot be obtained easily. The problem derives from the need to enforce the correct nodal surfaces for excited states and is analogous to a similar difficulty in electronic structure DMC (which is actually present for ground electronic states due to the indistinguishability of electrons which requires antisym- metry in electronic wavefunctions).
In electronic structure calculations, the approximation for solving this problem is the fixed-node method as introduced by Anderson. 53'67'68 Although the exact nodal surface can be known only from a full solution of the Schrtidinger equation, the fixed-node method has been used extensively in electronic structure calculations in conjunction with trial wavefunctions which reproduce the required nodal sur- face. 41 The fixed-node method is best imagined by considering the first excited state of a particle in a two-dimensional (rectangular) box. Assume we know that the wavefunction for the first excited state is antisymmetric with respect to inversion about the center of the box. This is not an unrealistic assumption given that we make similar deductions as to the form of wavefunctions due to knowledge of the behavior of electrons, or application of group theory to make the same predictions about vibrations. We can impose a node at the center of the box and perform a DMC simulation with a nodal surface along which the wavefunction is zero. Given that this boundary divides the box into two regions of the same shape, one calculation is sufficient to determine the total energy. The implementation of this is simple in DMC: we remove any replica that crosses the nodal surface and therefore generates a population on only one side of the nodal plane. In principle the fixed-node method will introduce an error since a replica close to a node for subsequent time-steps may

DMC Studies of Water Clusters 3 21
have in fact crossed and recrossed the node in an interval less than the time-step. This error can be corrected for but becomes negligible in the limit of a small time-step as discussed by Anderson. 68
The fixed-node method has been used also in vibrational DMC. 43'46'49'69 How-
ever, it has limitations in that the prediction of nodal surfaces for excited vibrational states is difficult, even in the simplest case of a diatomic where the anharmonic potential means that the wavefunction is not symmetric about the minimum (as it is for an harmonic oscillator). The node problem was addressed by Coker and Watts 4~ using an orthogonalization method which generates the n m vibrationally excited state by constraining it to be orthogonal to all lower n - 1 states, which must be known. This method is accurate but, not surprisingly, difficult to implement and computationally expensive and has seen only two applications. 43'46
Rotational states have been slightly easier to tackle than have vibrational ones due to the fact that the correct nodal surfaces can be more easily constructed. The work of Whaley and coworkers 7~ has been used to study excited rotational states of quantum clusters. This work has used importance sampling with trial wavefunc- tions corresponding to the rotationally excited nodal surface in addition to imposing the required fixed nodes.
In molecular spectroscopy, it is well known that the study of vibrational and rotational states is fundamental to understanding properties. Given this, it is not surprising that there is much theoretical effort put into studying such states. However, below the resolution of vibrations and often rotations, there is a phenome- non known as tunneling. Tunneling splittings are spectroscopic observables in the same way as are vibrations and rotations, a good example is the umbrella inversion of ammonia from C3v to D3h to C3v again. It is only recently, however, that experiments have started to probe tunneling in chemically interesting systems 5 and this has provoked attempts over the last few- years to calculate the corresponding quantities. The problem for theoreticians is that conventional methods cannot cope with the large number of degrees of freedom in systems larger than dimers. DMC does not have this problem but we need a method to generate excited tunneling states, within DMC, to calculate tunneling splittings.
3. TUNNELING
3.1. Introduction
In quantum mechanics, we think of a molecule as having a set of discrete and quantized vibrational energy levels. For a simple diatomic molecule, this can.be represented as a 1D potential as shown in Figure 1 a. This is also equivalent to a 1D representation of a coordinate for a multidimension system. The bottom of the well represents the minimum energy structure and all wavefunctions are localized around this minimum. For clarity the potential has been drawn as symmetric, but

322 JONATHON K. GREGORY and DAVID C. CLARY
(a) (b) (c)
Figure 1. Potential energy curves and vibrational energy levels for three different cases as described in the text.
in reality would be anharmonic with the energy levels becoming closer together towards the top of the well.
Consider a case where there exists more than one minimum energy structure, when two different permutations of atoms are equivalent energetically but non- equivalent permutationally. In other words, they have the same structure but, when the atoms are labeled, these structures are not superimposable. If these minima are separated by only a small barrier then the wavefunctions localized on each will interact and the energy levels will be split as shown in Figure lb. The vibrational states shown (0, 1, 2, 3, 4, 5, 6 ....... ) now become (0 § 0-, 1 § 1-, 2 § 2-, 3 § 3- . ...... ). Of course, if the barrier is too large there will be two sets of energy levels and no splittings since the wavefunctions cannot mix as in Figure 1 c.
One of the best known examples of tunneling is the "umbrella inversion" of the ammonia molecule. In 1932, the spectrum of ammonia was observed and every rovibrational line appeared as a doublet, 73'74 a result of the interaction of the wavefunctions for the two distinct minima, analogous to Figure 1 b. This tunneling means that an ammonia molecule inverts with a very high frequency through a planar D3h transition state as shown in Figure 2. Of course, in many polyatomic molecules there could be many possible permutations of identical atoms to cause tunneling splittings. However, many of these would require high barrier rearrange- ments too contorted to produce an observable splitting, e.g. breaking covalent bonds. This introduces a concept of "feasibility" into the discussion of tunneling which will be addressed in the next section.
For weakly bound, or van der Waals, complexes, tunneling splittings are made more likely by the fact that, unlike covalent bonds, the relatively weak hydrogen bonds holding the complex together may break and reform quite readily. One of the simplest of such systems is the dimer of hydrogen fluoride, (HF) 2, which exists in two nonsuperimposable forms which may interconvert with a fairly low bamer of about 300 cm -1, as illustrated in Figure 3. Sun and Watts 43 and Quack and Suhm 42

DMC Studies of Water Clusters 323
Figure 2. Inversion of ammonia from a C3vminimum to a D3h transition state back to isoenergetic but permutationally distinct C3v minimum.
have used the DMC method to calculate the tunneling splitting in (HF)2. However, the accuracy obtained is low and, in addition, no general method has been formu- lated for obtaining excited tunneling states from DMC simulations. Two modifica- tions of the standard DMC method are introduced which, when used together, give a powerful approach for computing small tunneling splittings. Furthermore, a general method is introduced in which nodal surfaces for excited tunneling states can be defined.
The first modification is the rigid body version of DMC (RBDMC), which enables the calculations to be done with a larger time-step and therefore to greater accuracy. 56 The second modification is that the ground and excited states are treated simultaneously in one simulation and the tunneling splittings, which are the differences between the energies of these states, can be calculated with greater
Figure 3. Hydrogen exchange tunneling in (HF)2 from a Cs minimum to a C2h transition state back to an isoenergetic but permutationally distinct Cs minimum.

324 JONATHON K. GREGORY and DAVID C. CLARY
accuracy than if the states were to be considered independently. Furthermore, since tunneling states can have different symmetries under permutation-inversion opera- tions, the position of nodes in the wavefunctions for such states is known, and approximations do not have to be applied in forcing a state of particular symmetry.
A complete theoretical description of van der Waals systems must therefore incorporate the effects of tunneling, as has been recognized for some time, and theoretical calculations of the tunneling splittings in (HE)2 ,43'75'76 (H20)2 ,77-80 and (NH3)2 81 have been reported. In addition, spectroscopic data have been explained using molecular symmetry considerations (see next section) for the van der Waals dimers (HF)2 ,82 (H2CO)2 ,83 (C2H2)2 ,84 (H20)2 ,85 and (NH3)2 .81 Since water clusters are van der Waals systems, it is vital that considerations of their tunneling dynamics are incorporated into the present work. In the next section, the theory for describing tunneling, and showing how it can be applied to calculate tunneling splittings using the DMC method, will be described.
3.2. Molecular Symmetry
It is well known that group theory can be used to analyze rigid molecules in terms of symmetry operations and point groups, and that this is useful in, for example, characterizing molecular vibrations. However, for van der Waals complexes, which are highly nonrigid, this is not possible. Rather, the molecular symmetry (MS) group described by Longuet-Higgins 86'87 should be used. The foundations of MS theory will be described briefly here; how it can be applied to various water clusters can be found elsewhere 78'8~ and in the rest of this review. The reader may need to refer to more comprehensive treatments if necessary. 87'89
Consider the following symmetry operations with which the Hamiltonian must be invariant, that is to say, may permute atoms but not change the structure of the complex:
P: permutation of any set of identical nuclei (position and spin)
E*: inversion of all particles through the center of mass
P*: the product of the above (E*P = PE*)
Application of the above gives rise to the complete nuclear permutation inversion (CNPI) group. However, as discussed in the previous section, many permutations of atoms may be irrelevant because either the width or the height of the barrier between them is too large for tunneling to occur. For example, in van der Waals systems, any permutations which involve breaking covalent bonds can certainly be ignored. This gives rise to a concept which states that a feasible permutation is one which does not require a transformation through an insuperable energy bar- rier. 87'9~ Consideration of feasibility gives rise to an effective MS group which is far simpler than the CNPI group.

DMC Studies of Water Clusters 325
Consider the example of (HE)2 which has a minimum energy structure of C s symmetry and a center of mass separation of 2.766/~ as confirmed from spectros- copy. 82'92'93 There are only two nonsuperimposable versions of this structure and the G 4 character table 87 therefore characterizes (HF) 2. Here, E is the identity (12) which exchanges monomer subunits and E ~ and (12)* are the products of these operations with the inversion operator E ~ Since there is a plane of symmetry, there are four elements in the group. The operations E and (12)* and also E* and (12) correspond to the same structure. The two structures of (HF) 2 can interconvert by means of "hydrogen exchange tunneling" along a trans-planar path 94'95 via a C2h transition state as shown in Figure 3. This results in a ground-state splitting of 0.66 cm-1. 92 A number of theoretical models have attempted to reproduce this number, many showing good agreement, and a useful summary of these has been publish- ed. 5~
3.3. Tunneling in DMC
In Section 2.7 a fixed node method for generating excited states was described. This is a simple method but its major disadvantage is the required knowledge, a priori, of the corresponding nodal surface. For excited vibrational states, this is normally impossible to determine from simple theoretical arguments and, except in some cases, 49 fixed-node methods cannot be used to generate vibrational excited states in DMC.
Application of the MS group to a system allows us to determine the nodal surface of a particular excited tunneling state. The location of the nodes depends upon knowledge of the transition states for each of the operations in the character table. Since the corresponding rearrangements occur between isoenergetic minima, it is often fairly easy to predict the form of the transition states. Returning to the example for (HF) 2, the tunneling splitting could be calculated with DMC as follows.
It is necessary to calculate the energy difference between the A § and B § states where the former is simply the ground state and is therefore obtained trivially without any constraints. For the B § state, however, it is necessary to constrain the wavefunction so as to have a node corresponding to the (12) operation (monomer exchange) having a -1 for this state. It is intuitive that the nodal boundary on the PES will correspond to all points for which the two intermolecular H...F distances are the same, one of which being the transition state in Figure 3. It is therefore trivial to put this nodal surface in the simulation by simply deleting any replica which violates the condition FI..-H 2 < F2...H 1. The B § wavefunction has antisymmetry due to the fact that the minima are isoenergetic and it is this antisymmetry which makes it possible to obtain the energy of this state by generating only half the wavefunction. This approach for (I-~) 2 has actually been described by Gregory and Clary 66 in work not presented here.
The rearrangement for (HF) 2 is a symmetric degenerate rearrangement (SDR) and the nodal surface can be exactly defined. However, some of the cases we will

326 JONATHON K. GREGORY and DAVID C. CLARY
describe are ADRs (asymmetric degenerate rearrangements) 96 and the exact posi- tion of the nodes is not rigorously defined. However, as will be described, knowledge of reaction paths means that the nodal surface can be defined to reasonable accuracy. Since a potential energy surface is relatively fiat in the region of the transition state, the slight misplacement of a node should cause only a small error.
3.4. Correlated Sampling
It has been described how MS theory can be used to define a nodal surface and consequently generate excited tunneling states in a fixed node DMC simulation. However, a problem exists in that most tunneling splittings are very small (<1 cm-1). DMC simulations can easily obtain accuracies better than 1%, good enough to make comparison with spectroscopic observables such as dissociation energies and rotational constants, but of insufficient resolution for the relatively small-energy splittings between most tunneling states.
The solution to the problem of sufficient accuracy in tunneling splitting calcula- tions comes from first identifying its cause. It is possible to calculate a tunneling splitting by performing two independent DMC simulations and calculating the difference between the energies obtained. In the simulation, the states differ because in the excited state the replicas are deleted when they cross nodes and such crossings are allowed in the nodeless ground state. The random walk in both simulations will be exactly the same because the mass of the atoms does not change. The smaller a splitting, the fewer node crossings there will be and the more similar the wavefunc- tion will be to the ground state. It is therefore possible to include both states in the same simulation where the only modification is that different weights are used for each state.
The replicas are subject to the normal random walk and weight adjustments; the only difference is that the nodal surfaces of the excited state may demand that replicas are occasionally removed from the simulation. This can be achieved by simply setting W n , the weight of replica i in state n, to zero, and continuing with the calculation. A replica is deleted from the simulation only when both its weights have become, by either continuous weighting or node crossing, less than the critical value discussed in Section 2.3. Assuming the tunneling splitting is small, the corresponding excited tunneling state will have only a small percentage of replicas with zero weights at any time. The result of doing this is that the fluctuating energy values for each state become highly correlated and the differences between them can be calculated much more accurately than by taking energy differences from two totally separate DMC simulations. This method is known as correlated sampling and will be employed in many of the calculations described later.
An example of correlated sampling for the ground and excited states correspond- ing to the hydrogen exchange tunneling motion in the benzene-water complex, reported by us previously, 97 is shown in Figure 4. In this case, the tunneling splitting

DMC Studies of Water Clusters 327
-8600
" 8700 ,.Q
= -8800
-8900
= -9000
�9 w �9 �9 �9
. . . . . . .
I
�9 .
-9100 . . . . . 20 40 60 80 100 120
Imaginary Time (*1000 a.u.)
Figure 4. Energy of the ground state (dotted line) and excited tunneling state (continuous line) against imaginary time for part of a RBDMC simulation of benzene--water showing the energy correlation between the two states.
is actually of the order of wavenumbers which explains why the two states are not very well correlated. This example has been chosen since it represents a case where the tunneling splitting is obtained to about the same accuracy using correlated sampling as for two separate simulations. For smaller splittings, correlated sam- piing would be more accurate, while larger splittings should be calculated from taking the difference between two completely independent simulations. Of course, it is possible also to simulate more than two states in a simulation by having more sets of weights defining different nodal surfaces. However, this is only useful when all states are close in energy. If one state is significantly different from the others being considered, then the accuracy of all splittings calculated will be reduced, not simply those involving this state. This arises from the fact that replicas can be removed from the simulation only when their weights in all states are zero.
4. SIMULATION DETAILS
4.1. Potential Energy Surfaces
Since the publication of the first model for the interaction between water 98 molecules, there have been proposed many intermolecular potentials. These have
been formulated either as pair potentials, describing as accurately as possible the interaction between two water molecules, 99-1~ or as effective pair potentials usually empirically fitted to reproduce properties of bulk water (Figure 5). 98'1~ Most widely used in dimer calculations has been the PES of Reimers, Watts, and Klein (RWK). ]]] The qualitative features of this potential were used in the model

328 JONATHON K. GREGORY and DAVID C. CLARY
H3
O1 H2
04
H5
Figure 5. The Cs structure of the water dimer. The donor and acceptor monomers are so called because they donate and accept hydrogens to form the hydrogen bond.
of tunneling in (H20)2 by Coudert and Hougen 112-114 and it has also been used in calculations on the vibrational frequencies of (HEO)n. 115 However, recent work 116 comparing the barriers to tunneling predicted by this PES with ab initio calculations suggests that, while the qualitative features are reasonable, the predicted tunneling barriers contain quite large errors. The most recent water dimer PES by Millot and Stone ll7 compares better with experiment for the equilibrium geometry and also with recent ab initio calculations. 116 Most of the calculations presented here will be based on this potential. Two forms of the ASP-PES will be used. The first is the water dimer potential which is used in a pairwise manner so that the energy on a cluster of water molecules is obtained from,
E n = ~ V(i,j) (21)
i<j~n
where V(i,j) is the pairwise interaction between monomers i and j, and n is the total number of monomers in the cluster. The second PES is similar to this pairwise version but also contains many-body forces.
To facilitate a description of the many-body forces in the clusters, the potential has been modified to calculate an n-body induction energy, following the expression for the induction energy of a collection of monomers described by Stone. ll8 It is desirable to employ an iterative procedure when calculating the total induction energy since a molecule A will induce a moment on molecule B which will itself induce a moment on molecule C and so on. Such a scheme has been included in the three-body potential and the induction energy is iteratively calculated until it changes by less than 1 cm -l. In addition, a simple Axilrod-Teller 119 triple-dipole type term has been added for the dispersion energy between all possible three-body interactions, the constant for which was taken from the paper by Margoliash et al. 12~ The overall three-body interaction is dominated by the relatively large induction term and is therefore attractive. The many-body short-range contributions to the potential are neglected as they are expected to be negligible. Any severe inaccura- cies caused by the neglect of the many-body, short-range dispersion or other terms

DMC Studies of Water Clusters 329
will be highlighted in comparison with the ab initio results. ASP-NB will be used to describe the full petential including three-body dispersion and up to N-body induction energies, while ASP-P will refer to the potential neglecting all non-pair- wise additive effects.
4.2. Quantum Simulations
In all RBDMC simulations, a population of 1000 replicas was used and consisted of an equilibrium stage and a propagation stage, over which properties were averaged. For the dimer, trimer, and tetramer, equilibrium periods of 1000 steps of 50 a.u. were used, while those for the pentamer and hexamer were longer, consisting of 5000 steps of 50 a.u.; this is necessary due to the large dimensionality of these potential energy surfaces and the likely presence of a large number of minima. The energy values were obtained by averaging over Vrefduring the entire propagation stage of the simulation which was usually between 10,000 and 50,000 steps at a time-step of 20 a.u. Descendant weighting 55 was used to estimate rotational constants and vibrationally averaged internal coordinates.
5. THE WATER DIMER
5.1. Introduction
High-resolution spectroscopy has been used to study the geometry and the energy levels of van der Waals dimers, allowing the characterization of the intermolecular vibrational ground states 121'122 and the determination of potential energy surfaces from the experimental data. 123 Althorpe and Clary 77'124 have calculated the bound states of (H20)2 using a basis set approach, previously found to give good agreement with exact calculations for (HF)2 .75 From these calculations, the tunneling splittings and some of the intermolecular modes of (H20) 2 have been calculated for three different PESs.
Basis set and close-coupling methods show an unfavorable scaling with respect to the size of the system. The principal advantage of DMC is that extension to larger systems does not result in a large increase in the computational demands. This will prove to be vital in using DMC to study the larger clusters. However, there are only six (intermolecular) dimensions for the interaction between two rigid water mole- cules and, in contrast to any larger systems, other methods can be used for bound state calculations in the water dimer. 77'79'124 The application of DMC to the water dimer is not novel but is an excellent test of the DMC method against existing results.
5.2. Tunneling Splittings
The RBDMC results have been described by us in more detail elsewhere and shown to agree with variational calculations using the same PES. 78 The splitting
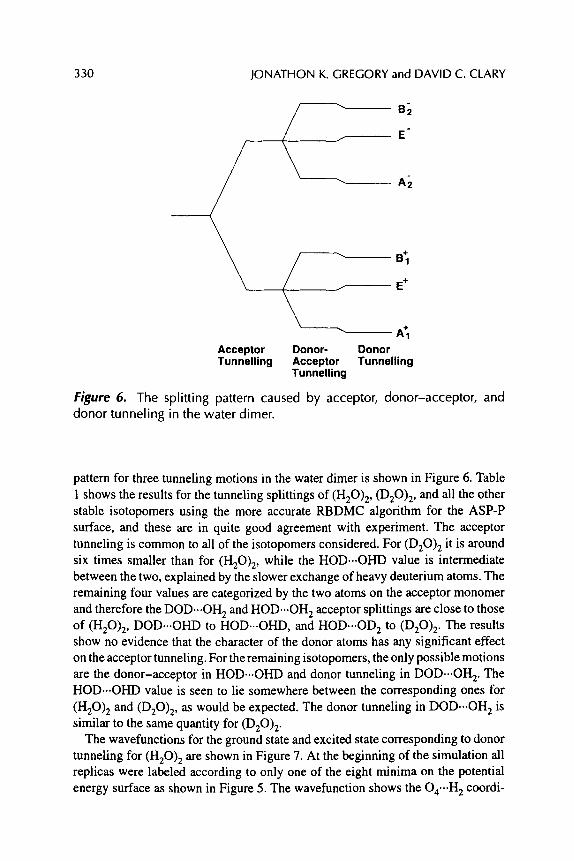
330 JONATHON K. GREGORY and DAVID C. CLARY
f E
. . . . . . ~ B ~
j ~ _ . ~ ~ E "l"
Acceptor Donor- Tunnelling Acceptor
Tunnelling
Donor Tunnelling
Figure 6. The splitting pattern caused by acceptor, donor-acceptor, and donor tunneling in the water dimer.
pattern for three tunneling motions in the water dimer is shown in Figure 6. Table 1 shows the results for the tunneling splittings of (H20) 2, (D20) 2, and all the other stable isotopomers using the more accurate RBDMC algorithm for the ASP-P surface, and these are in quite good agreement with experiment. The acceptor tunneling is common to all of the isotopomers considered. For (D20) 2 it is around six times smaller than for (H20) 2, while the HOD..-OHD value is intermediate between the two, explained by the slower exchange of heavy deuterium atoms. The remaining four values are categorized by the two atoms on the acceptor monomer and therefore the DOD...OH 2 and HOD...OH 2 acceptor splittings are close to those of (H20)2, DOD...OHD to HOD...OHD, and HOD...OD 2 to (D20)2. The results show no evidence that the character of the donor atoms has any significant effect on the acceptor tunneling. For the remaining isotopomers, the only possible motions are the donor-acceptor in HOD.--OHD and donor tunneling in DOD...OH 2. The HOD...OHD value is seen to lie somewhere between the corresponding ones for (H20)2 and (D20)2 , as would be expected. The donor tunneling in DOD...OH 2 is similar to the same quantity for (D20)2.
The wavefunctions for the ground state and excited state corresponding to donor tunneling for (H20)2 are shown in Figure 7. At the beginning of the simulation all replicas were labeled according to only one of the eight minima on the potential energy surface as shown in Figure 5. The wavefunction shows the O4".'H 2 coordi-

DMC Studies of Water Clusters 331
Table 1. Calculated Values of the Tunneling Splittings (in cm -1) for All the Water Dimcr Isotopomers Using the RBDMC Approach
Donor Donor-Acceptor Acceptor
(H20) 2 RBDMC 0.02(1 ) 2.3(5) Exp. 152 0.02 0.8
(D20) 2 RBDMC 0.0012(4) 0.02(1 ) Exp. Is3'154 0.03
DOD. . .OHD RBDMC 0.0014(4) Exp. Iss 0.007
HOD.. -OH D RBDMC __ 0.17(6) Exp. 156 - - 0.44
HOD. . .OH 2 RBDMC __
HOD. . -OD 2 RBDMC ~
DOD.. .OH 2 RBDMC 0.0012(4)
9.3(3)
9.4
1.5(5) 1.2
2.6(4) 1.4 2.4(4)
8.3(6) 1.1(3)
8.7(5)
Note: aThe statistical uncertainty with respect to the last decimal place is given in brackets. A dash indicates that a tunneling splitting does not occur due to the symmetry of the dimer. All values have been calculated with the ASP-P surface as described in the text.
nate. In the ground state this widens, showing the effect of tunneling which causes the H 2 hydrogen to move out of the hydrogen bond and consequently causes an increased intermolecular O-..H separation. However, the excited state has only one peak since the nodal constraints mean that donor-acceptor tunneling is prevented and the hydrogen remains in the hydrogen bond.
!
I
I l
i !
. . . . . . . . . / /
i . i ,
1.5 2
i ~.
, " ,
\ \ . . ._ , . \
"\
",..
i i ! i l
2.5 3 3.5 4 4.5 5
Figure 7. Wavefunction (in/~) showing the ground (dotted line) and excited (upper line) tunneling states for donor-acceptor tunneling in (H20) 2.

332 JONATHON K. GREGORY and DAVID C. CLARY
6. THE WATER TRIMER
6.1. Introduction
Over 25 years ago the first theoretical work on the structure of the water trimer was published, suggesting that the global minimum was a cyclic structure. 6'125 More calculations made shortly after this implied that a chain structure had a lower energy, 126-128 but this in turn was proved wrong a few years later. 129 The minimum energy cyclic structure of the water trimer has the form shown in Figure 8.
The structure of the water trimer was first deduced experimentally by Pugliano and Saykally in 1992 using tunable, far-infrared, vibration-rotation-tunneling (FIR-VRT) spectroscopy. 13~ Their suggested six-membered ring structure agrees with all ab initio calculations at the nartree-Fock 127-129'131'132 and MP29'33'133
levels of theory. Three hydrogen atoms reside in the plane of the oxygen atoms, and form hydrogen bonds. The remaining three atoms are not hydrogen-bonded: two point above the oxygen plane and one below it. Following the convention of Schiitz et al., the positions of the free hydrogens can be labeled as (u)p, (p)lanar, or (d)own describing where they lie with respect to the plane of the ring. This means that the global minimum can exist in six distinct forms, namely (uud), (udd), (udu), (dud), (duu), and (ddu). By also taking into account the fact that the hydrogen on all three monomers may be permuted and that the direction of the hydrogen bonds may be reversed, there is a total of 6 x 23 x 2 = 96 versions of the cyclic trimer global minimum within each domain of stationary points. These domains are considered separate since to interconvert structures in different domain would involve breaking covalent bonds.
The importance of non-pairwise forces in water clusters has been discussed by Xantheas and Dunning. 7 Comparisons between ab initio calculations on water dimer and trimer predict that three-body interactions contribute around 10% of the binding energy in (H20)3 .33'133'134 The three-body water potential, ASP-NB, to- gether with the analogous pairwise version, ASP-P are used for these calculations.
H9
07
O1
H5
Hti
Figure 8. The cyclic minimum energy structure of the water trimer found using the ASP-NB surface.

DMC Studies of Water Clusters 333
The ASP-P surface will be useful in comparing with the ASP-NB results so as to assess the contribution of the three-body forces. We have described the water trimer in more detail elsewhere, 78'8~ including structural details.
6.2. Dynamics
Pugliano and Saykally 13~ also suggested the existence of three tunneling motions likely to occur in (H20)3 and (D20)3. These three rearrangements would be sufficient to interconvert all 96 versions within one domain of the global minimum. This exciting experimental work was followed up immediately by Wales 13 who calculated rearrangements and transition states, estimating approximately the tun- neling splittings for these rearrangements. Liu et al. 134 reevaluated the experimental data in the light of the theoretical results. 13'135 Two of the three mechanisms required to interconvert all 96 trimers are shown in Figure 9, of which the first is a single flip of one of the unbound monomer hydrogens which interconverts six structures, the second actually exchanges the hydrogens in one of the hydrogen bonds via a bifurcated transition state, and therefore accesses another 8 (23) structures. With only these two rearrangements, there would be two sets of 48 structures which would be unable to interconvert. Pugliano and Saykally 13~ suggested a cw-ccw tunneling mechanism by which all three hydrogen bonds reverse from a clockwise (cw) to counterclockwise (ccw) direction. This mechanism is not shown since it has not been proven theoretically. The first two mechanisms (single-flip and bifurcation) were first obtained by Wales 13 although the transition state for the single-flip mechanism had actually been obtained from empirical potential calcu- lations some time earlier. 136
Single Flip Tunnelling
Bifurcation Tunnelling
Figure 9. Two probable pathways representing the tunneling interconver- sions in the cyclic water trimer.

334 JONATHON K. GREGORY and DAVID C. CLARY
B; F~ F~ A~
§ § B2 B3 F;F; FA*F~
§ § A3 A2
B~ B~ F~F~ F~F~" A~ A~
§ B1
§ A1
Single Flip Bifurcation Tunnelling Tunnelling
Figure 10. The splitting pattern caused by single flip and bifurcation tunnel- ing in the water trimer.
Since there are 96 isoenergetic minima on the PES of the water trimer and since the equilibrium conformation is of C 1 symmetry, the highest order MS group is G96, the same as for (C2H2) 3 described in detail by Bone et al. 137'138 Tunneling splittings appear in rovibrational energy levels as a result of exchange of identical particles occurring through a low-energy barrier. Motions which interconvert any of the 96 isoenergetic minima can be considered to produce tunneling splittings, but only those tunneling motions with low barriers will produce observable splittings. The splitting diagram for water trimer is shown in Figure 10. The single-flip tunneling interconverts six minima and therefore will give rise to six states with J = 0 and K = 0. The symmetries of these six states will be A~, A~, A~, A T, A~, and A 3. The bifurcation tunneling motion will split each of the six single flip states further into eight states: one each of A and B symmetry and two of (triply degenerate) F

DMC Studies of Water Clusters 335
symmetry. TM The cw-ccw tunneling (not shown) would cause each of the 48 states shown to be split into a doublet, except that the A 2, A 3, B 2, and B 3 states would become degenerate E states, giving a G96 MS group.
As with the water trimer, it is necessary to work out how the possible permutations in G96 can be incorporated into the RBDMC simulation. The single flip of a hydrogen occurs via a transition state in which the tunneling hydrogen is coplanar with the three oxygen atoms. It is therefore possible to identify a flip as being when the angle between the cross product of the two corresponding O - O vectors and the O - H bond in question passes through 90 ~ Exchange of monomer in bifurcation tunneling is identified as before when the non-hydrogen bonded O-..H distance becomes less than the bonded distance.
The tunneling states that correspond to the splitting pattern shown in Figure 10 were calculated using both the ASP-P and ASP-NB surfaces together with the RBDMC algorithm, with correlated sampling of energy differences as well as incorporation of a fixed-node approximation for excited states. A simulation was carried out with all replicas starting with a structure corresponding to that shown in Figure 8, and the cw-ccw tunneling splitting was calculated. This was done by removing any of the 48 structures which had a reversed hydrogen-bond structure. A tunneling splitting was not obtained; that is to say the splitting was zero, and not one of the 48 structures in question was observed at any time in the simulation. This implies that, even if a mechanism for cw-ccw tunneling does exist, its barrier is too high to produce an observable splitting.
By showing cw-ccw tunneling to be nonfeasible, the problem is simplified somewhat. Only the G48 MS group (not G96 ) needs to be considered. All 48 states in G48 were calculated and the ground-state single-flip and bifurcation tunneling splittings were trivially obtained and are shown in Table 2. In comparing the ASP-P and ASP-NB surfaces, it is seen that the single-flip motion is largely unchanged, but shows a slight decrease with the inclusion of three-body effects; this is not surprising since it was observed that the wavefunctions for this coordinate were almost identical for each potential. There is a decrease in the bifurcation tunneling splittings due to the greater strength of the hydrogen bonds arising from the three body forces. 8~ It is surprising that this difference is not larger since tunneling splittings show an exponential dependence on barrier height which the wavefunc-
Table 2. Tunneling Splittings (GHz) for (H20) 3 and (D20)3 Mechanism ASP-P ASP-N B
(H20) 3 Single Flip 600 541 Bifurcation 0.9 0.6
(D20) 3 Single Flip 120 84 Bifurcation 0.21 0.15

336 JONATHON K. GREGORY and DAVID C. CLARY
Vibrationally Excited
State
Ground State
Av T - AV.r* Experiment
Av r Theory
Figure 11, The comparison between the calculated tunneling splittings and those observed experimentally. AOT is the tunneling splitting in the ground state and A0~-the tunneling splitting in the excited state.
tions suggest is increased for the ASP-NB surface. As discussed previously, the tunneling splittings in the ground state of the water trimer have not been observed experimentally directly. However, the reported experimental values of 289 MHz and 5 MHz for (H20)3 and (D20)3, respectively, correspond to the difference in bifurcation tunneling splittings between the ground state and an excited vibrational state. 134 These would therefore be expected to be lower (but of the same order of magnitude) than our values, as observed. The situation is shown in Figure 11 with the arrow representing two possible infrared transitions.
7. THE WATER TETRAMER
7.1. Introduction
It has been well known for a number of years that the global minimum of the water tetramer is a cyclic structure with S 4 symmetry. 9'25'33'132'139 The four oxygens lie almost in a plane with the four free hydrogens adopting trans-type arrangements to give an alternating up-down-up-down pattern, referred to as the (udud) or (dudu) structure (Figure 12). A study of the four-dimensional torsional space of the cyclic tetramer 18 has shown the existence of four permutationally distinct but nevertheless isoenergetic (uudd) local minima within each domain of stationary points. There also exist two second-order stationary points: (updp) which interconverts the four local minima, and (uppd) which connects them to the global minimum. In this context, p indicates that a free hydrogen is coplanar with the four oxygens and is consequently "flipping" from one side of the ring to the other. Two flips must occur for an interconversion between local minima or between local and global minima; four would be required to interchange the two permutations of the global minimum, (udud) and (dudu). Hence, there is expected to be a stark contrast in tunneling

DMC Studies of Water Clusters 3 3 7
Figure 12. The 54 minimum energy structures of the cyclic tetramer found using the ASP-NB surface.
dynamics when compared to the water trimer 13 where the presence of an odd number of water molecules means that a single flip can interconvert degenerate structures, e.g. (uud) ~ (udd).
A theoretical study of the structure and dynamics of the water tetramer is presented using the RBDMC method to perform quantum simulations. The ASP- NB potential is used together with that of Karlstrrm and coworkers 14~ which will be called "NEMO." Both PESs give good agreement for the structures and energetics of water tetramer with MP2 ab initio geometry optimized results as discussed in more detail previously for the ASP-NB. 88 However, the NEMO surface probably facilitates a better description of the flipping motion of the unbound hydrogens in the water tetramer. 88
7.2. Dynamics
The even number of monomers and S 4 symmetry in the tetramer is expected to lead to somewhat different tunneling dynamics than those of the water trimer, as already discussed. Probably the most obvious degenerate rearrangement of the global minimum in the tetramer would involve a simultaneous flipping of all four free hydrogens as depicted in Figure 13. Indeed, it is such a rearrangement that is
(udud) (dudu)
Figure 13. The simultaneous flipping motion of all four unbound hydrogens in the water tetramer corresponding to the tunneling splitting calculated.

338 JONATHON K. GREGORY and DAVID C. CLARY
Table 3. Internal Coordinates for the Water Tetramer (A and degrees) and Rotational Constants (MHz) Obtained from the Quantum
Simulations with the ASP-NB and NEMO Potentials a
NEMO ASP-NB Experiment 142
Minimum Vib. Av. Minimum Vib. Av. Vib. Ab.
O...O 2.748 2.836 2.710 2.803 2.78
O...D-O 167.6 164.8 165.8 ]64.6 --
A = B 3592 2961 3713 3063 3080
C 1835 1522 1901 1585 1500
Note: aThe vibrationally averaged values are for (D20) 4. The value of C was fixed in the experimental determination of the A and B rotational constants.
put forward by Cruzan et al. to rationalize the tunneling doublets observed experi- mentally for ( D 2 0 ) 4 (Table 3). 142 The mechanism is not unlike that observed in the
ammonia molecule shown in Figure 2. Using a knowledge of the MS group combined with a correlated sampling
procedure, it is possible to calculate tunneling splittings within the RBDMC approach although, since the pathway for the interconversion is not clear, the nodal constraints are not necessarily exact and the value will be only approximate. This has been done for (H20)4 and (D20)4, giving the values 1200 and 17 MHz with the NEMO PES. With the ASP-NB PES, no tunneling splitting is obtained, probably a reflection of the fact that this potential does not correctly describe the movement of the free hydrogens, as discussed in the previous section. The latter value for the, NEMO PES is in fair agreement with the separation of the experimental doublets of 5.6 MHz, 142 which is the difference between the tunneling splitting in the ground state and in a vibrationally excited state. Since there are two versions of the global minimum, (udud) and (dudu), this tunneling splitting would be expected to produce doublets, as seen in the spectrum. As in the case of the trimer, these numbers are not directly comparable, as shown in Figure 11, and the experimental number should be lower. The ground- and excited-state wavefunctions for one of the flipping coordinates are shown in Figure 14. The ground state is symmetric due to the relatively rapid interconversion of the isoenergetic (udud) and (dudu) structures over the simulation timescale. The excited state is nonsymmetric but has no node since nondegenerate motions such as (udud) ~ (updd) ---> (uddd) can occur.
There are three possible pathways which can realistically be thought of as connecting the (udud) and (dudu) global minima as shown below.
1. (udud) ~ (pppp) ~ (dudu) 2. (udud) ~ (uppd) ~ (uudd) ~ (pudp) ~ (dudu)

DMC Studies of Water Clusters 339
' l - ~ l . . . . . . . .
o 2'o 4'o 6'o -sb i6o ~o ~o ~0 ~o
Figure 14. Wavefunctions showing the flipping motion in the water tetramer of one of the free hydrogens in degrees where 90 ~ corresponds to the hydrogen lying in the oxygen plane. All four hydrogens are equivalent due to the 54 symmetry. In the ground state the wavefunction is symmetric while in the excited state it is nonsymmetric.
(udud) ----> (udup) --> (uuud) --> (uudp) --> (uudd) ---> (pudd) --> (dudd) ---r (dudp) ---> (dudu).
Path 1 would involve motion through a single fourth-order stationary point, (pppp) of D4h symmetry; path 2 through two isoenergetic second order stationary points, (uppd) and (pudp); and path 3 via four isoenergetic transition states, (udup), (uudp), (pudd), and (dudp). The ASP-NB relative energies of these stationary points with respect to the global minimum are + 1908 cm -l, +956 cm -1, and +634 cm -1 for paths 1-3, respectively. Hence, as the complexity of the path increases, the energy change decreases. For this reason, it is therefore not clear which, if any, of the three pathways dominates the torsional dynamics of the cyclic water tetramer.
8. THE WATER PENTAMER
8.1. Introduction
The dynamics of the cyclic water pentamer, the most stable (H20)5 structure, will be considered. Comparison will be made with the recent experimental work by Liu et al. 142 in particular by considering the tunneling dynamics in this system, reporting

340 JONATHON K. GREGORY and DAVID C. CLARY
calculations of tunneling splittings, and also comparing with rotational constants and experimental structures derived from them.
Early work on the water pentamer using empirical potentials highlighted the existence of a number of low lying minima 25'136 Work with more accurate poten- tials, including many-body terms, suggested that the cyclic minimum was the most stable 28'29'143 although contradictory results have also been published. 144 However,
it is generally believed that the cyclic form is indeed the most stable and many ab initio studies have concentrated on this alone. 7'8'31,33 The first step into a theoretical characterization of the dynamics of the water pentamer has appeared in the form of an ab initio SCF/DFT study of a number of rearrangements between minima for various pentamer structures. 35 When the mechanisms corresponding only to the cyclic global minimum are considered, the pentamer displays two rearrangements analogous to those well-characterized in the trimer. 13'134
8.2. Dynamics
As a starting point the ASP-NB potential energy surface in the region of the cyclic structure was examined thoroughly. 145 The minimum energy structure of the cyclic pentamer can be considered to be similar to that of the trimer and is shown in Figure 15. It is to be noted that the pentamer structure is slightly puckered in a way similar to the structure of cyclopentane. The cyclic structure shown is not actually the global minimum on the ASP-NB surface but this is not a major concern for the RBDMC calculations since the other minima on the potential energy surface will not be explored in the simulation.
First discussed will be the rotational constants and vibrationally averaged coor- dinates for the cyclic structure in Figure 15, obtained from the RBDMC simulation by using descendant weighting, s5 Liu et al. 34 report an experimental average center of mass separation of 2.825 A, obtained by fitting a point mass model to the A and B rotational constants for (D20) 5. The theoretical rotational constants are those of an oblate symmetric top (A = B~2C within the statistical error of the RBDMC simulation). The average calculated value of A and B is 1739 (+10) MHz, in excellent agreement with the experimental value of 1750 MHz, while our value of C is 894 MHz, fixed in the experimental determination of A and B. The vibrationally
. . . . . . . . . .
Figure 15. The cyclic minimum energy structure of the water pentamer found using the ASP-NB surface.

DMC Studies of Water Clusters 341
averaged center of mass separation is 2.802 (+ 0.005)/~ for the fully deuterated trimer. The agreement between theory and experiment is therefore good, with the difference of about 0.02/~ easily attributable to slight errors in the potential energy surface and the assumed planarity of the point mass model from which the experimental value was obtained.
To understand the tunneling dynamics, the region of the ASP-NB surface close to the cyclic structure was thoroughly searched for transition states, and eigenvector following 146 was used to characterize the corresponding reaction paths. Only degenerate rearrangements of the cyclic structure are of interest: two such degen- erate rearrangements exist, shown in Figure 16 and described as "single-flip tunneling" and "bifurcation tunneling." These mechanisms are analogous to those described for the trimer and shown in Figure 9. It is recalled that, in the trimer, the single flips give rise to six structures, referred to as (uud), (udd), (udu), (dud), (duu), and (ddu). There are 10 analogous structures for the pentamer, namely (dudud), (duduu), (duddu), (duudu), (ddudu), (ududu), (ududd), (uduud), (uddud), and (uudud). Given that the hydrogens on each monomer may be permuted, the order of the effective molecular symmetry group is probably G320. There is a total of 10 x 23 x 2 = 640 distinct structures of the cyclic pentamer, the factor of 2 arising from structures with the hydrogen bonds going in a counterclockwise direction. As with the trimer, there is no mechanism to facilitate this interconversion. Using the two degenerate rearrangement mechanisms in the pentamer combined with a knowledge of the G320 MS group, 35 it is possible to calculate the associated splittings in the water pentamer using the same approach as for the smaller clusters. This is achieved by using the RBDMC algorithm with correlated sampling of energy differences.
Single Fltp Tunnelling
. . . . . . . .....
(~ ....... ~ , (~ ....... ( ~ ~... d "-..
Bifurcation Tunnelling
. . . . . . . . . . . . . . . . . . . . . . . .
Figure 16. The two degenerate rearrangements of the water pentamer char- acterized using the ASP-NB surface. The middle structure in each case is the transition state in the rearrangement. In the single flip pathway, the free hydrogen is labeled as up (u), planar (p) or down (d) for clarity.

342 JONATHON K. GREGORY and DAVID C. CLARY
Table 4. Tunneling Splittings (GHz) for the Water Pentamers for the Two Mechanisms Calculated Using the ASP-NB Potential Together
with the RBDMC Algorithm with Correlated Sampling Single Flip Bifurcation
(H20) 5 ASP-P 17 0.7 (D20) 5 ASP-P 1.5 0.14 (H20) 5 ASP-NB 6.3 0.22 (D20) 5 ASP-NB 0.9 0.07
The splittings in (H20)5 and (D20)5 corresponding to both rearrangements have been calculated and are shown in Table 4. The values for the pentamer, calculated with (ASP-NB) and without (ASP-P), the n-body iterated induction energy, are compared with those previously reported for the water trimer. This will therefore show how the splittings change in transition from the trimer to the pentamer and will give an indication of the many-body effect. Each tunneling splitting calculation on the cyclic pentamer represents a computational effort of around 40 hours of CPU time on a DEC Alpha 3000-600 workstation and is accurate only to within +50%. Greater accuracy was not sought since we do not expect the accuracy of the ASP-NB surfaces to be any better than this. Before discussing the splittings, we note that Wales 35 finds no significant change in the barriers for these motions between the trimer and pentamer, nor do his approximate estimates of the splittings change significantly between the trimer 13 and pentamer. 35
In comparing the splittings obtained with those reported previously for the trimer, we see that the bifurcation tunneling is decreased by around a factor of 3 for both isotopomers. This is not surprising since there is increased cooperativity and less strain probably leading to stronger hydrogen bonds than is the case in the trimer. Very surprisingly, the single-flip tunneling decreases by a factor of around 100 from the trimer to the pentamer. Given that Wales' results 35 would seem to contradict this, we have examined the wavefunctions for the pentamer averaged over a total time of 2.5 x 10⁵ atomic units and compared them to those of the trimer; these are shown in Figure 17. The hydrogen-bond distance is contracted slightly in the pentamer, the corresponding angle being larger and less strained. The hydrogen-
Figure 17. Wavefunctions (in ,/k and degrees) for internal coordinates of the water pentamer (right), shown in comparison with the same results for the trimer (left). From top to bottom are shown the hydrogen bond wavefunctions (O-..H), the hydrogen bond angles (O...H-O), the movement of the hydrogen bonds out of the plane and finally the corresponding motion of the free hydrogens.

i J"
c~
',-.
c~
c~
c~
r~
i
q~
I
e~
f~
C~
c~
f~
cu~

344 JONATHON K. GREGORY and DAVID C. CLARY
bonded hydrogens in the trimer do not average out to be exactly in the [OOO] plane (0~ �9 two are less and one is greater than 0 ~ A similar trend occurs in the pentamer with two less, two greater, and one (the red line) virtually equal to 0 ~ The two wavefunctions at the bottom of Figure 17 characterize the single-flip tunneling of the unbound hydrogens, where 0 ~ corresponds to a hydrogen lying fiat (the transition state in Figure 16). The lack of symmetry in these wavefunctions is due to the fact that the initial coordinates for the RBDMC simulation are those of the minimum energy structure. In the trimer, the pseudorotation arising from the single-flip tunneling is seen to be rapid, with the wavefunction for the hydrogen first to flip becoming almost symmetric over the simulation timescale. However, for the pentamer, although the first flip can be indicated by a slight probability on the left of one of the wavefunctions, it is clear that the flip is occurring on a significantly shorter time scale. This explains the decrease in this tunneling motion by two orders of magnitude in transition from the trimer to the pentamer. The calculations shown in Table 4 suggest that this large decrease is not due to many-body force since the ASP-P values (pairwise interactions only) do not differ significantly from the ASP-NB values.
The most likely explanation for the observed change in dynamics from the trimer to pentamer is related to the considerable movement of the pentamer oxygen atoms during the rearrangements shown in Figure 16. The pathways for the single-flip and bifurcation tunneling processes in the trimer and pentamer were thoroughly exam- ined to confirm this. In the latter case, significant oxygen movement is necessitated by the fact that the puckering of the ring must change for the rearrangement to be degenerate. However, it is still possible that the significant lowering of the single- flip tunneling splittings may also, at least partially, be an artifact of the potential energy surface. Wales '35 SCF and DFT results indicate a smaller barrier and less oxygen movement for the single-flip motion, both of which would imply that our splittings are too small; more accurate ab initio calculations would be needed to confirm this.
9. THE WATER HEXAMER
9.1. Introduction
As mentioned earlier, the water hexamer is seen as a transition point in the stability of cyclic and noncyclic structures. It has become clear over the last few years that there are a number of almost degenerate hexamer structures, thus the identification of the most stable structure is difficult. 20-22'26'27'28'32'36-38 To a lesser extent, other structures for the smaller clusters exist in the same way but the cyclic structures are at much lower energy. It is clear that ab initio calculations are unable to distinguish the almost isoenergetic minima of the water hexamer from the fact that reordering of structures occurs when the basis set is changed, as well as when effects of basis set superposition error (BSSE) and harmonic zero-point energy are

DMC Studies of Water Clusters 345
considered. In addition, since vibrational averaging causes significant structural changes, as highlighted already for the smaller clusters, even an accurate ab initio characterization of the global minimum may not be sufficient to obtain agreement with experiment.
Empirical potentials such as the ASP-NB cannot be considered to be any more accurate than ab initio methods but do facilitate a more thorough examination of the potential energy surface in question and can be used for diffusion Monte Carlo calculations to obtain ground-state properties. For this reason, here we will aim to identify the structure of a recently observed water hexamer by comparison with vibrationally averaged rotational constants.
In the present section, we first show how RBDMC calculations make it possible to assign the structure observed experimentally. We consider several distinct low-energy hexamer structures which were chosen on the basis of calculations with the ASP-NB PES and previous theoretical work. 147
9.2. Structural Assignment
Quantum simulations were performed 147 on the five hexamer structures shown in Figure 18 and for details of these simulations reference should be made to Section 4.2. Rotational constants were obtained using descendant weighting 55 and are shown in Table 5 in comparison with the minimum energy ASP-NB and MP2 values. The first point to note is that the ASP-NB minimum energy values are in good agreement with the DZP/MP2 results. However, vibrational averaging changes the rotational constants by a large amount for all structures, again high- lighting the importance of the inclusion of zero-point energies in comparison with experiment.
Experimentally, 147 the observed rotational constants are A = 2.164 GHz, B = 1.131 GHz, and C = 1.069 GHz for the vibrational ground state. These correspond closely to the vibrationally averaged ASP-NB values for the cage structure which are within 1%, 3%, and 2% for A, B, and C, respectively. This represents excellent agreement between theory and experiment considering the complexity of the 30-dimensional water hexamer intermolecular potential energy surface. No other structure gives a set of rotational constants close to experiment and it is therefore possible to assign a cage structure to the experimental spectrum.
9.3. Dynamics of the Cage Hexamer
The structures of the water hexamer discussed (prism, cage, book, boat, and cyclic) are very different from one another. This makes the theoretical identification of the cage structure as the one observed experimentally highly plausible as compared to the other four structures. However, given that there are so many near-degenerate structures for the hexamer, it is important to know whether experi- ment is observing a single structure or if the experimental spectrum represents some superposition of more than one minimum. It is almost certain that a structure as

346 JONATHON K. GREGORY and DAVID C. CLARY
Prism Book
Boat Cage
Cyclic
Figure 18. Some of the low-energy structures for the water hexamer obtained using the ASP-P and ASP-NB surfaces as described in the text.
distinct as one of the other four considered could not be present in the ground state, as agreement between the experimental rotational constants and those of the vibrationally averaged (theoretical) cage structure is too close. However, if other variants of the cage structure exist then this may imply a superposition of cage-like structures in the ground state.
To address this question, 2000 further geometry optimizations were carried out with the ASP-NB surface starting from structures displaced only slightly from the cage. Over 100 different minima were characterized in this way and so the rotational constants of each were examined. Only structures which gave rotational constants within 10% of the values obtained from the RBDMC quantum simulation for the

DMC Studies of Water Clusters 347
cage (see Table 5) were considered. A large number of transition states also were located and the corresponding reaction paths calculated: only if both minima had
rotational constants within 10% of the RBDMC results was the reaction path
considered. All of the following discussion relates only to structures, transition
states and reaction paths that satisfy these constraints. There are four almost degenerate versions of the cage structure which differ from
each other only in the position of two unbound hydrogens on the far left and right. These four structures are shown in Figure 19, labeled according to the (u)p or (d)own nature of the free hydrogens, by which the four minima differ. The energetic ordering is (uu) < (du) < (ud) < (dd) for the ASP-NB surface and the relative energies of the latter three structures are +32 cm -1, +61 cm -1, and +71 cm -1. These structures
were used in MP2 geometry optimizations with DZP basis sets, and the character of each was retained. The DZP/MP2 ordering is (du) < (uu) < (dd) < (ud) where the latter three have relative energies of +9 cm -1 , +39 cm -1, and +78 cm -1 . So, although
the ordering of the structures is not the same, both methods are in agreement in
terms of the energetic proximity of the four cages. There are two more sets of four cage-like structures and one structure for each
set, predicted by the ASP-NB surface, is shown in Figure 20. These sets of four structures will be referred to by { 2 } for those on the left and { 3 } for those on the right so that the two structures are labeled (dd){ 2} and (dd){ 3 }. The structures corresponding to subset {2} are on average 415 cm -1 (ASP-NB) and 599 cm -1
(DZP/MP2) higher than the lowest four structures, referred to as { 1 }. The corre-
Table S. Rotational Constants (GHz) for the Five Water Hexamer Structures
A B C
Prism DZP/MP2 1.716 1.440 1.381 ASP-NB (min) 1.752 1.504 1.421 ASP-NB (vib.av.) 1.607 1.355 1.256
Cage DZP/MP2 2.284 1.158 1.109 ASP-NB (min) 2.345 1.195 1.145 ASP-NB (vib.av.) 2.136 1.096 1.043
Book DZP/MP2 1.958 1.094 0.798 ASP-NB (min) 1.984 1.173 0.866 ASP-NB (vib.av.) 1.798 1.078 0.802
Boat DZP/MP2 1.900 1.102 1.013 ASP-NB (min) 2.015 1.067 0.999 ASP-NB (vib.av.) 1.733 1.125 1.054
Cyclic DZP/MP2 1.255 1.255 0.637 ASP-NB (min) 1.257 1.257 0.636 ASP-NB (vib.av.) 1.211 1.211 0.598

348 JONATHON K. GREGORY and DAVID C. CLARY
"- . .
(uu){1} (du){1}
........ ~d){1} (dd){1} Figure 19. Four distinct but nearly isoenergetic cage-like structures of the water hexamer characterized with the ASP-NB surface.
sponding average between subsets {1} and {3} is 405 cm -1 (ASP-NB) and 750 cm -l (DZP/MP2).
The {2} structures have a relative ordering of (ud) < (uu) < (dd) < (du) with corresponding energies of +148 cm -1, +219 cm, -1, and +385 cm -1 (ASP-NB), and +185 cm -1, +275 cm -1, and +481 cm -1 (DZP/MP2). For the { 3} structures, the ordering of (ud) < (dd) < (uu) < (du) gives relative energies of +206 cm -1, +224 cm -1 and +440 cm -1 (ASP-NB), and +261 cm -l, +257 cm -1, and +556 cm -1 (DZP/MP2). The ordering of the (uu){ 3} and (dd){ 3} structures reverses at the DZP/MP2 level but the { 2 } structures have the same ordering. The { 2 } and { 3 } subsets are not only higher in energy than those in Figure 19 but are also spaced further apart.
Just as important a question as the relative stabilities of the four cages is that of whether they may be interconverted and if so how easily. Eight transition states
(dd){2} (dd){3} Figure 20. Structures representing the other two subsets of four cage struc- tures for the water hexamer.

DMC Studies of Water Clusters 349
exist on the ASP-NB surface to facilitate rearrangements of the four structures in each subset. For each set of four minima, there are four single flips and four bifurcations by which the four are linked. Each individual minimum is linked directly by a transition state to only two of the other three minima. One example of each type of rearrangement is illustrated in Figure 21 for two of the structures in Figure 19: the transition states are labeled where "f" and "b" indicate that a monomer is in the process of undergoing a flip or bifurcation, respectively. The two dotted lines for the (ub) transition states indicate the bifurcation; these hydrogen bond distances are 2.52/~ and 2.60/~, as compared to the original distance of 2.11 /~. Four second order saddle points connect the (uu)/(dd) and (ud)/(du) structures which cannot be interconverted by only one flip or bifurcation.
Transition states were found, all with barriers greater than 1000 cm -l on the ASP-NB surface, which facilitate interconversion between the { 1 } and { 2} subsets and the { 1 } and { 3 } subsets. A given structure can only transform into one of the four in the other subsets having the correct orientation of free hydrogens so 8 (2 x 4) and not 32 (2 • 16) transition states exist to facilitate these rearrangements, two examples of which are shown in Figure 22. The other six paths are analogous to those shown, differing only in the positions of the unbound hydrogens. The mechanisms involve motion of two monomers and are similar to the donor-ac- ceptor tunneling in the water dimer. 114 The four dotted lines in the transition state show the two bonds breaking and the two forming, while the dashed lines represent actual hydrogen bonds which exist in both minimum-energy structures. Each transition state shows a bifurcation, as characterized in transition states in the water trimer and water pentamer. In addition to this can be seen two water monomers in
Single Flip
(uu)(1 } (uf)(l} (ud){1 } B i furcat ion
(uu){1} (ub){1} (ud){1}
Figure 21. One each of the four single flip and bifurcation rearrangements which link the (uu), (du), (ud), and (dd) cage structures of the cage water hexamer.

350 JONATHON K. GREGORY and DAVID C. CLARY
�9 - . , . , .0/ - . . , . . : - . .
(dd)(l} (ddl{2)
Figure 22. Two of the rearrangements which interconvert the {1} and {2} and the {1} and 13} minima of the water hexamer.
a similar arrangement to the C 2 transition state for donor-acceptor tunneling in the water dimer.
Transition states corresponding to interconversions between subsets { 2 } and { 3 } were not found. This could be because the barriers are so high that the structures were not located or simply that they do not exist. By looking at the { 2} and {3 } structures on the fight of Figure 22, it is apparent that they cannot be interconverted without movement of at least three water monomers, a more complicated mecha- nism than those shown in Figure 22.
9.4. Quantum Simulations
Having made a thorough characterization of the topology of the potential energy surface of the cage water hexamer, the RBDMC method is applied, using the ASP-NB surface, to actually simulate the vibrational ground state. This provides insight into the two questions raised by the characterization of 12 minima and (in total) 32 transition states in the previous section: first, is the ground state a superposition of all four low-energy minima shown in Figure 19; second, is interconversion between these (subset { 1 }) and any of the other 8 minima (subsets { 2 } and { 3 }) possible?
To answer these points, a quantum simulation was performed using a total of 4000 replicas. The initial geometries of these replicas were chosen as the four minima shown in Figure 19 with 1000 replicas being assigned to each structure. The simulation consisted of an equilibrium stage of 5000 steps of 50 a.u. followed by 25,000 steps at a time-step of 20 a.u. Descendant weighting 55 was used to estimate vibrationally averaged internal coordinates.
To identify the presence of any of the 8 higher energy minima represented in Figure 20, wavefunctions were obtained for the eight hydrogen bonds. Any delo- calization of the ground-state wavefunction on these structures will be seen in these wavefunctions since at least two hydrogen bonds must be broken for the cage to

DMC Studies of Water Clusters 351
rearrange into structures of the type { 2 } and { 3 }. These wavefunctions are shown in Figure 23. The corresponding vibrationally averaged distances were also calcu- lated, showing a significant variation between the shortest (1.87 ]k) and longest (2.19 ]k) average distances. However, given that the corresponding vibrationally averaged separation in the water dimer is 2.20 ,/k and that the wavefunctions all seem to be localized on a single well, there is no evidence that any hydrogen bond exchange motions leading to the higher energy structures in subsets { 2 } and { 3 } take place. The fact that the DZP/MP2 separation of minima and barriers for the appropriate interchanges increase consistently gives more justification for the conclusion that the {2} and { 3 } structures are not present in the ground-state wavefunction.
To show which of the four minima in Figure 19 contribute to the ground-state structure, it is necessary to look at the angles of the hydrogens on the far left and far right of these structures since this is the only way in which the differ. This is done by using two angles, one for each hydrogen, and plotting two-dimensional wavefunctions for the motion involved. The description of the angles is fairly simple and has been given elsewhere. 148
Using the four angles described, two-dimensional wavefunctions were averaged in the simulation on a 25 x 25 grid with each angle defined between 0 and 180~ these wavefunctions are shown in Figure 24. The wavefunction is largely localized on one minimum, that corresponding to the lowest energy (uu) structure. However, the top wavefunction does show some delocalization due to the presence of the (du) structure, which has a relative energy of +32 cm -1 on the ASP-NB surface. However, the bottom wavefunction shows none of the delocalization which would arise due to the (dd) and (du) minima in the ground vibrational state. Although the DZP/MP2
, i / ", '"... ':::::... . . . . ,.. .... . . . . . . . .. ~ , " . . . . . . . . . . , , . "-~ . . . . ::-- . . . . .
i i ii i i
1 1.5 2 2.5 3 3.5 4 Intermolecular OH distance
Figure 23. Wavefunctions for the O...H distances (,~) for the eight hydrogen bonds corresponding to the cage structure of the water hexamer.

352 JONATHON K. GREGORY and DAVID C. CLARY
Wavefunction
' " ~ , ' . . ~ a : 2 ~ , B S . : ' - : e . . . . .
-':<'-~-.3~.~Z;--';,-'- . . . . 0180
30 ~ , ~ ~ 90 thetalb
thetala 120 150 30 180
Wavefunction
!
theta2a 120 150 180 30
Figure 24. Two-dimensional wavefunctions for the single-donor single-ac- ceptor hydrogens of the water hexamer cage structure.
ab initio results gave a different ordering of the four minima, their relative energy differences were similar to those for the ASP-NB surface (see discussion in Section 10.3); in addition, the DZP/MP2 barriers for this flipping motion are actually smaller. It is therefore likely that the cage hexamer observed experimentally is actually to some extent a superposition of the four minima in Figure 19. To demonstrate this exactly would require a potential energy surface with barriers and relative energies of these four minima in agreement with accurate ab initio calcu- lations.
9.5. Conclusions
The water hexamer is a complicated system to which to apply theoretical methods. This is because of its vastly complex 24-dimensional potential energy surface with a large number of nearly isoenergetic minima. This has made it the smallest water cluster whose most stable structure has not yet been well charac- terized.

DMC Studies of Water Clusters 3 5 3
However, we have shown how RBDMC simulations give predictions of rotational constants accurate enough for an assignment to be made to the experimental spectrum. Given this assignment, we have performed the first detailed investigation into the water hexamer PES using the ASP-NB empirical potential and ab initio calculations. This study shows that there are a number of minima very similar to the cage structure assigned. This leads to the question as to whether the experimen- tal spectrum actually corresponds to more than one minimum. However, the RBDMC simulation of the hexamer allows wavefunctions as shown in Figures 23 and 24 to be obtained which suggest that the ground state of the water hexamer is indeed centered on one minimum.
10. GENERAL TRENDS WITH CLUSTER SIZE
10.1. Introduction
We have so far presented DMC results for individual water clusters from the dimer to the hexamer and made comparisons with experimental quantities. The fact that reasonably accurate theoretical calculations can now be made for these clusters not only facilitates detailed comparison with experiment but also allows trends with cluster size to be examined. It is interesting to know how certain quantities change as the number of monomers increases and, although accurate results are available only for a limited range, the trends observed may be useful in making comparisons with bulk quantities.
10.2. Relaxation Effects
Owing to the use of a rigid monomer potential, the effects of monomer relaxation have been neglected in the RBDMC simulations. Relaxation is important when comparing the effect this will have on the relative stabilities of different structures. The values are from DZP/MP2 ab initio calculations which are described in more detail elsewhere. 149 They are positive since they should be considered as a relative measure of the destabilization due to hydrogen bond formation. They are obtained by taking the difference between the monomer energies in the optimized cluster geometry and the total relaxed monomer energies. A plot of the values is shown in Figure 25 where the line is the best fit to the most stable structures for each system (all cyclic except the cage hexamer).
In comparing the tetramer and pentamer values, the general trend is that the structures with fewer hydrogen bonds are more destabilized although this is clearly a small effect. For the most stable dimer, trimer, and tetramer structures, an almost linear increase in relaxation energy is observed at the DZP/MP2 level, as previously observed by Xantheas. 7 However, this linearity is not continued for the pentamer, as can be seen in Figure 25. For the tetramer and pentamer, the relaxation effect is in inverse proportion to the number of hydrogen bonds. For example, in the
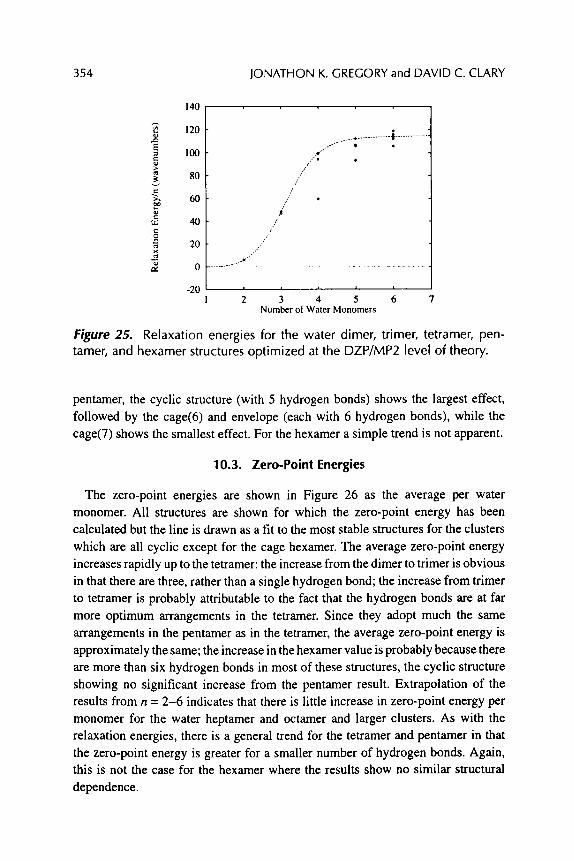
354 JONATHON K. GREGORY and DAVID C. CLARY
E
t _ .
140
120
100
80
60
40
20
0
/ - " �9 �9 /
,,
,, ,,'
, / ' �9
/"
. /
-20 . . . . . 1 2 3 4 5 6 7
Number of Water Monomers
Figure 25. Relaxation energies for the water dimer, trimer, tetramer, pen- tamer, and hexamer structures optimized at the DZP/MP2 level of theory.
pentamer, the cyclic structure (with 5 hydrogen bonds) shows the largest effect, followed by the cage(6) and envelope (each with 6 hydrogen bonds), while the cage(7) shows the smallest effect. For the hexamer a simple trend is not apparent.
10.3. Zero-Point Energies
The zero-point energies are shown in Figure 26 as the average per water monomer. All structures are shown for which the zero-point energy has been calculated but the line is drawn as a fit to the most stable structures for the clusters which are all cyclic except for the cage hexamer. The average zero-point energy increases rapidly up to the tetramer: the increase from the dimer to trimer is obvious in that there are three, rather than a single hydrogen bond; the increase from trimer to tetramer is probably attributable to the fact that the hydrogen bonds are at far more optimum arrangements in the tetramer. Since they adopt much the same arrangements in the pentamer as in the tetramer, the average zero-point energy is approximately the same; the increase in the hexamer value is probably because there are more than six hydrogen bonds in most of these structures, the cyclic structure showing no significant increase from the pentamer result. Extrapolation of the results from n = 2-6 indicates that there is little increase in zero-point energy per monomer for the water heptamer and octamer and larger clusters. As with the relaxation energies, there is a general trend for the tetramer and pentamer in that the zero-point energy is greater for a smaller number of hydrogen bonds. Again, this is not the case for the hexamer where the results show no similar structural dependence.

DlvlC Studies of Water Clusters 355
1200 , . , . , , ,
1000
8OO E
N
200
o . . J . . . . . . . . . . . . .
. - - �9
o . . - "
/
/ /
/ /
/ /
,/ e
0 | , i | , I , , , I
2 3 4 5 6 7 Number of Water Monomers ( n )
Figure 26. Zero-point energies (cm -1) per water monomer for all water dimer, trimer, tetramer, pentamer, and hexamer structures obtained from the quantum simulations with the ASP-NB potential (ASP-P for the dimer). The solid line represents a 1 D fit through the most stable structures in each case.
10.4. Association Energies
In Figure 27 is shown the incremental association energy (Do), representing the process (H20)n_l + H20 ~ (H20)n , as a function of the number of monomers in the cluster. The line is drawn through the most stable structures. Up to the pentamer these are all cyclic and the association energy for the pentamer is considerably more positive than for the tetramer. The cyclic hexamer has a value still higher than the pentamer but the cage structure (through which the line is drawn) has an association energy smaller than the relatively stable tetramer. This shows the origin of the transition in stability of cyclic and three-dimensional structures.
10.5. Hydrogen Bond Energies
Figure 28 shows the average hydrogen bond energy (D O divided by the number of hydrogen bonds for the structure in question) again illustrating how the transition point arises. Although the cyclic pentamer and hexamer structures allow greater freedom for the orientation of the hydrogen bonds, due to less strain in the ring, this leads to only a slight increase in stability per hydrogen bond. The hydrogen bond orientations in the tetramer must be fairly close to ideal. There is only a slight gain in average hydrogen bond energy achieved from the tetramer to the pentamer so that the noncyclic structures of the latter, with more hydrogens, attain comparable energy. However, the cyclic pentamer is almost certainly still the most stable but, when going to the hexamer, shows virtually no gain in hydrogen bond energy for the cyclic structure, as shown in Figure 28, and this presumably is the reason for

356 JONATHON K. GREGORY and DAVID C. CLARY
E ==
r
eu0
e-.
O
t~ <
E
-1000
- 1500
-2000
-2500
-3000
',, ,,
',, ,, ,, ',,
',
', ',,
,,
. cycl ic
,,' ' , ,' ',,
" ' " ' " " " ' " o " ' " " " " ' ' " , 0 b
i i i I 1
2 3 4 5 6 7 Number of Water Monomers
Figure 27. Incremental association energies represented by the process (H20)n-1 + H20 --~ (H20)n. The values are calculated from Do[(H20)n] - D0[(H20)n-1] where Do[(H20)n-1] is the dissociation energy of the cyclic cluster with one fewer monomer and D0[(H20)n] is the dissociation energy for the structure in question. The line is drawn through the most stable structures which are all cyclic except for the cage hexamer. The cyclic hexamer is shown for comparison.
- l O 0 0
E = - 1 1 0 0 = > ~ -1200
~ -1300
~ -1400
0
m -1500
~ -1600
:7: -1700
e,
�9 cage(7~
. lalem
. book ' , . envelope
,, ~ cage(el .,. cage
,, \ .,
" ,'"" * boat ', ,, "~..cyclic ."
" ' - . . . . .,
...... ",,"cyclic �9 cyclic i i i i i ,
l 2 3 4 5 6 7 Number of Water Monomers
Figure 28. Hydrogen bond energies plotted against the number of mono- mers. This is obtained from dividing Do by the number of hydrogen bonds for the particular structure. The line is drawn through the most stable structures.

DMC Studies of Water Clusters 3 5 7
structures with more hydrogen bonds, such as the cage and the prism, becoming more stable. 147
10.6. Rotational Constants
We have concentrated mostly on the dynamics of the small water clusters described. Previous publications have gone into more detail about the structures of the various clusters. 58'78'8~ To highlight the agreement achieved between RBDMC simulations using the ASP-NB PES and experimental results, we have tabulated each in Table 6 for all of the clusters described here. Generally there is good agreement in all sets of rotational constants. The discrepancies probably arise due to inaccuracies in the potential energy surface.
10.7. O...O Distances
The average O...O separations for the cyclic clusters is shown in Figure 29. The minimum values obtained from optimizations using the ASP-NB surface (ASP) and
Table 6. Rotational Constants (MHz) for the Most Stable Structures for the Water Trimer, Tetramer, Pentamer, and Hexamer a
. . . . . . .
ASP-NB Vib. Av. b Experimental b
Dimer (B + C)/2 6574 5860 6161 c
Trimer A 6886 5676 5796 d B 6769 5676 5796 d C 3507 3316 AF
Tetramer A 3 713 3063 3080 e B 3713 3063 3080 e C 1901 1583 AF
Pentamer A 2150 1739 1750 f B 2110 1739 1750 f C 1102 849 AF
Hexamer A 2345 2136 2164g B 1195 1096 1131g C 1145 1043 1069g
Notes: aThe vibrationally averaged results, from the RBDMC simulations with the ASP-NB surface, are shown together with the minimum energy values and comparison with experiment is made. Except for the hexarner, all are oblate tops for which the experimental value of C cannot be determined and so is arbitrarily fixed (AF). bThe theoretical vibrationally averaged and experimental results correspond to (H20) 2, (D20) 3, (D20)4, (D20)5, and (H20) 6. CDimer experiment from ref. 157. el'rimer experiment from ref. 134. eTetramer experiment from ref. 142. fPentamer experiment from ref. 34. gHexamer experiment from ref. 147.

358 JONATHON K. GREGORY and DAVID C. CLARY
3 . 1
E
�9 !
3.0
2.9
Liquid
2.8 l h Ice
2 . 7
i "" , . .
, . . ..
~ , ', . . ,. ,, . . . . .
, ',, ". . . ,.~ �9 . .
' , , , " ~ . .
.~, . . . . . . . . . . . . . . . . . . . . . . . �9 ~ " . . - - . ". . b : ' : . .
. . . . . . . . . . . . . . . - % - - - ~ . . . . = - ~ x P . . . . . "~'Y- " - . . . . . . . . . .
. . . . . . " . . . . ~ MP2 -. . . . . . o . . . . . . . . . . . . . . ,, ASP
2.6 ' ' ' ' ' 1 2 3 4 5 6 7
Number of Water Monomers (n)
Figure 29. 0-.-0 separation as a function of cluster size for the cyclic clusters from the dimer to the hexamer.
ab initio (MP2) are shown, together with the experimental values from the review of Saykally. 5 Also shown are fits through each set of corresponding data, and dotted lines corresponding to the experimental O...O separations in liquid water and ice I h. There is fairly good agreement between the MP2 and ASP-NB values. The theory values are obtained from the quantum simulations with the ASP-NB surface and are in good agreement with experiment. There is no experimental value available for the hexamer. All the plots suggest rapid convergence of the O...O separation to a constant value. For the theory curve, this value is close to that of ice I h at -150 ~ (2.755/~),150 which is not surprising since this structure is based upon one similar to that of the cyclic hexamer. The asterisk (*) denotes the theory value for the cage hexamer structure which is probably the most stable structure (smallest D0). 147 This structure shows an average O...O separation very close to that of liquid water at 50 ~ (2.84/~).151
11. C O N C L U S I O N S
We have described diffusion Monte Carlo as a powerful tool for studying the structures and tunneling dynamics of small water clusters. Due to the relatively weak intermolecular interactions involved in these systems, leading to strongly anharmonic potentials, they are very difficult to treat. In addition, the number of degrees of freedom involved, which for N rigid monomers is 6N-6, means that conventional theoretical methods cannot accurately treat all the modes in systems larger than the dimer. Diffusion Monte Carlo shows a favorable size scaling in this

D M C Studies o f Water Clusters 359
respect and can therefore be applied in useful calculations such as those described here on the water clusters from the dimer to the hexamer. We have described results for the water dimer, trimer, tetramer, pentamer, and hexamer. The calculations are useful in comparing with accurate experimental results, predicting trends with increasing cluster size, and assessing the accuracy of potential energy surfaces.
Almost all the work we have done has shown the ASP-NB potential energy surface to perform quite well, both in comparison with experimental results and with ab initio calculations. However, it is clear that there are limits with this model and, in the future, effort needs to go into producing better water potentials. Such a potential should be able to match the best ab initio calculations in describing the topology of the PES, including accurate barrier and dissociation estimates.
In trying to understand the properties of liquid water and ice, the study of clusters with only a few monomers may seem very limited. However, at the very least these structures represent a starting point and also form the current limit for accurate spectroscopic and theoretical studies. We have described how a relatively new method can be used to perform accurate theoretical studies on water clusters and to compare well with experiment. We have shown that diffusion Monte Carlo is a powerful method to apply to the structures and dynamics of small, weakly bound water clusters. The inherent simplicity of the DMC method, together with its power, are likely to make it more popular in the study of ever more difficult systems.
ACKNOWLEDGMENTS
The authors are grateful for the help of Victoria Buch, Chris Gregory, Marius Lewerenz, Claude Millot, Richard Saykally, Jon Sorenson, Anthony Stone, and David Wales for help in various aspects of the work described here. This work was supported by the Engineering and Physical Sciences Research Council.
REFERENCES 1. Dyke, T. R.; Mack, K. M.; Muenter, J. S. J. Chem. Phys. 1977, 66, 498. 2. Scheiner, S. Ann. Rev. Phys. Chem. 1994, 45, 23. 3. Loeser, J. G.; Schuttenmaer, C. A.; Cohen, R. C.; Elrod, M. J.; Steyery, D. W.; Saykally, R. J.;
Bumgarner, R. E.; Blake, G. A. J. Chem. Phys. 1992, 97, 4727. 4. Pugliano, N.; Saykally, R. J. J. Chem. Phys.. 1992, 96, 1832. 5. Liu, K.; Cruzan, J. D.; Saykally, R. J. Science 1996, 271,929. 6. Del Bene, J. E.; Pople, J. A. J. Chem. Phys. 1970, 52, 4858. 7. Xantheas, S. S. J. Chem. Phys. 1994, 100, 7523. 8. Xantheas, S. S. J. Chem. Phys. 1995, 102, 4505. 9. Xantheas, S. S.; Dunning, Jr., T. H. J. Chem. Phys. 1993, 98, 8037.
10. Nova, J. J.; Planas, M.; Rovira, M. C. Chem. Phys. Len. 1996, 251, 33. 11. SchUtz, M.; BUrgi, T." Leutwyler, S.; Btirgi, H. B. J. Chem. Phys. 1993, 99, 5228. 12. Fowler, J. E.; Schaefer, H. E J. Am. Chem. Soc. 1995, 117, 446. 13. Wales, D. J. J. Am. Cheat Soc. 1993, 115, 11180. 14. Walsh, T. R.; Wales, D. J. J. Chem. Soc., Faraday Trans. 1996, 92, 2505.

360 JONATHON K. GREGORY and DAVID C. CLARY
15. Klopper, W.; Schtitz, M. Chem. Phys. Lett. 1995, 237, 536. 16. van Duijneveldt-van de Rijdt, J. G. C. M.; van Duijneveldt, F. B. Chem. Phys. Lett. 1995, 237,
560. 17. BUrgi, T.; Graf, S.; Leutwyler, S.; Klopper, W. J. Chem. Phys. 1995, 103, 1077. 18. SchUtz, M.; Klopper, W.; LUthi, H.; Leutwyler, S. J. Chem. Phys. 1995, 103, 6114. 19. Wales, D. J.; Walsh, T. R. J. Chem. Phys. 1997, 106, 7193. 20. Mhin, B. J.; Kim, J.; Lee, S.; Lee, J. Y.; Kim, K. S. J. Chem. Phys. 1994, 100, 4484. 21. Laasonen, K.; Parrinello, M.; Car, R.; Lee, C.; Vanderbilt, D. Chem. Phys. Lett. 1993, 207, 208. 22. Lee, C.; Chen, H.; Fitzgerald, G. J. Chem. Phys. 1994, 101, 4472. 23. Lee, C.; Chen, H.; Fitzgerald, G. J. Chem. Phys. 1995, 102, 1266. 24. Kim, K.; Jordan, K. D.; Zwier, T. S. J. Am. Chem. Soc. 1994, 115, 11568. 25. Kirn, K. S.; Dupuis, M.; Clementi, E. Chem. Phys. Lett. 1986, 131,451. 26. Belford, D.; Campbell, E. S. J. Chem. Phys. 1987, 86, 7013. 27. Franken, K. A.; Jalaie, M." Dykstra, C. E. Chem. Phys. Lett. 1992, 198, 59. 28. Schrtider, E H. Chem. Phys. 1988, 123, 91. 29. Pillardy, J.; Olszewski, K. A.; Piela, L. J. Mol. Struct. 1992, 270, 277. 30. Burke, L. A.; Jensen, J. O.; Jensen, J. L." Krishnan, P. N. Chem. Phys. Lett. 1993, 206, 293. 31. Knochenmuss, R.; Leutwyler, S. J. Chem. Phys. 1992, 96, 5233. 32. Tsai, C. J.; Jordan, K. D. J. Phys. Che~ 1993, 97, 5208. 33. Xantheas, S. S.; Dunning, T. H. J. Chem. Phys. 1993, 99, 8774. 34. Liu, K.; Brown, M. G.; Cruzan, J. D.; Saykally, R. J. Science 1996, 271, 62. 35. Wales, D. J.; Walsh, T. R. J. Che~ Phys. 1996, 105, 6957. 36. Vegiri, A." Farantos, S. C. J. Chem. Phys. 1993, 98, 4059. 37. Mhin, B. J.; Kim, H. S.; Kim, H. S.; Yoon, C. W.; ICdm, K. S. Chem. Phys. Lett. 1991, 176, 41. 38. Tsai, C. J.- Jordan, K. D. Chem. Phys. Lett. 1993, 213, 181. 39. Tsai, C. J.; Jordan, K. D. J. Chent Phys. 1991, 95, 3850. 40. Coker, D. E; Watts, R. O. Mol. Phys. 1986, 58, 1113. 41. Anderson, J. B. Int. Rev. Phys. Chem. 1995, 14, 85. 42. Quack, M.; Suhm, M. A. J. Chem. Phys. 1991, 95, 28. 43. Sun, H.' Watts, R. O. J. Chem. Phys. 1990, 92, 603. 44. Quack, M.; Suhm, M. A. Chem. Phys. Lett. 1991, 183, 187. 45. Coker, D. E; Watts, R. O. J. Phys. Chem. 1987, 91, 4866. 46. Suhm, M. A.; Watts, R. O. Phys. Rep. 1991, 204, 293. 47. Suhm, M. A. Chent Phys. Lett. 1993, 214, 373. 48. Sandier, P.; Buch, V.; Clary, D. C. J. Chent Phys. 1994, 101, 6353. 49. Lewerenz, M." Watts, R. O. Mol. Phys. 1994, 81, 1075. 50. Quack, M. A.; Suhm, M. A. Chem. Phys. Lett. 1995, 234, 71. 51. Lewerenz, M. J. Chem. Phys. 1996, 104, 1028. 52. Einstein, A.Ann. Phys. 1906, 19, 371. 53. Anderson, J. B. J. Chent Phys. 1975, 63, 1499. 54. Reynolds, P. J. J. Chem. Phys. 1990, 92, 2118. 55. Kalos, M. H. Phys. Rev. A 1967, 2, 250. 56. Buch, V. J. Chem. Phys. 1992, 97, 726. 57. Sandier, P.; Jung, J. O.; Szczc~,niak, M. M.; Buch, V. J. Chem. Phys. 1994, 101, 1378. 58. Gregory, J. K.; Clary, D. C. Chem. Phys. Lett. 1994, 228, 547. 59. Franken, K. A.; Dykstra, C. E. J. Chem. Phys. 1994, 100, 2865. 60. Favro, L. D. Phys. Rev. 1960, 119, 53. 61. Perrin, E J. Phys. Radium 1934, 5, 497. 62. Pert'in, E J. Phys. Radium 1936, 7, 1. 63. Freed, J. H. J. Chem. Phys. 1964, 41, 2077. 64. Zare, R. N. Angular Momentum; Wiley: New York, 1988.

DMC Studies of Water Clusters 361
65. Favro, L. D. Fluctuation Phenomena in Solids; Academic Press: New York, 1965. 66. Gregory, J. K.; Clary, D. C. Chem. Phys. Lett. 1995, 237, 39. 67. Klein, D. J.; Pickett, H. M. J. Chem. Phys. 1976, 64, 4811. 68. Anderson, J. B. J. Chem. Phys. 1975, 65, 4121. 69. Coker, D. E" Watts, R. O. J. Phys. Chem. 1987, 91, 2513. 70. McMahon, M. A.; Barnett, R. N.; Whaley, K. B. J. Chem. Phys. 1993, 99, 8816. 71. Whaley, K. B. Int. Rev. Phys. Chem. 1994, 13, 41. 72. McMahon, M. A.; Whaley, K. B. J. Chem. Phys. 1995, 103, 2561. 73. Dennison, D. M.; Hardy, J. D. Phys. Rev. 1932, 39, 938. 74. Bell, R. P. The Tunnel Effect in Chemistry; Chapman and Hall: New York, 1980. 75. Althorpe, S. C.; Clary, D. C.; Bunker, P. R. Chem. Phys. Lett. 1991, 187, 345. 76. Marshall, M. D.; Jensen, P.; Bunker, P. R. Chem. Phys. Lett. 1991, 176, 255. 77. Althorpe, S. C.; Clary, D. C. J. Chem. Phys. 1994, 101, 3603. 78. Gregory, J. K." Clary, D. C. J. Chem. Phys. 1995, 102, 7817. 79. Althorpe, S. C.; Clary, D. C. J. Chem. Phys. 1995, 102, 4390. 80. Gregory, J. K.; Clary, D. C. J. Chem. Phys. 1995, 103, 8924. 81. Nelson, D. D.; Klemperer, W. J. Chem. Phys. 1987, 87, 139. 82. Dyke, T. R.; Howard, B. J.; Klemperer, W. J. Chem. Phys. 1972, 56, 2442. 83. Lovas, E J.; Suenram, R. D.; Coudert, L. H.; Blake, T. A.; Grant, K. J.; Novick, S. E. J. Chem.
Phys. 1990, 92, 891. 84. Ohshima, Y.; Matsumoto, Y.; Tukami, M.; Kuchitsu, K. Chem. Phys. Lett. 1988, 147, 1. 85. Dyke, T. R. J. Chem. Phys. 1977, 66, 492. 86. Longuet-Higgins, H. C. Mol. Phys. 1963, 6, 445. 87. Bunker, P. R. Molecular Symmetry and Spectroscopy; Academic: New York, 1979. 88. Gregory, J. K.; Clary, D. C. J. Chem. Phys. 1996, 105, 6626. 89. Peet, A. C. Vibrational Predissociation of Van Der Waals Complexes Containing Ethylene; Ph.D.
thesis, Cambridge University, 1987. 90. Bunker, P. R. In Vibrational Spectra and Structure; Durig, J. R., Ed.; Marcel-Dekker: New York,
Vol. 3, 1976. 91. Natanson, G. A.Adv. Chem. Phys. 1985, 58, 55. 92. Howard, B. J.; Dyke, T. R.; Klemperer, W. J. Chem. Phys. 1984, 81, 5417. 93. Ohashi, N.; Pine, A. S. J. Chem. Phys. 1984, 81, 73. 94. Hougen, J. T.; Ohashi, N. J. Mol. Spec. 1985, 109, 134. 95. Mills, I. M. J. Phys. Chem. 1984, 88, 532. 96. Nourse, J. G. J. Am. Chem. Soc. 1980, 102, 4883. 97. Gregory, J. K.; Clary, D. C. Mol. Phys. 1996, 88, 33. 98. Bemal, J. D.; Fowler, R. H. J. Chem. Phys. 1933, 1,515. 99 Popkie, H.; Kistenmacher, H.; Clementi, E. J. Chem. Phys. 1973, 59, 1325.
100. Kistenmacher, H.; Lie, G.; Popkie, H.; Clementi, E. J. Chem. Phys. 1974, 61,546. 101. Kistenmacher, H." Popkie, H.; Clementi, E.; Watts, R. O. J. Chem. Phys. 1974, 60, 4455. 102. Matsuoka, O." Clementi, E.; Yoshimine, M. J. Chem. Phys. 1976, 64, 1351. 103. Clementi, E.; Habitz, P. J. Phys. Chem. 1983, 87, 2815. 104. Carravetta, V.; Clementi, E. J. Chem. Phys. 1984, 81, 2646. 105. Bounds, D. G. Chem. Phys. Lett. 1983, 96, 604. 106. Rowlinson, J. S. Trans. Far. Soc. 1949, 45, 974. 107. Rowlinson, J. S. Trans. Far. Soc. 1949, 47, 120. 108. Jorgensen, W. L. J. Am. Chem. Soc. 1981, 103, 335. 109. Jorgensen, W. L. J. Chem. Phys. 1982, 77, 4156. 110. Jorgensen, W. L." Chandrasekhar, J.; Madura, J. D.; Impey, R. W.; Klein, M. L. J. Chem. Phys.
1983, 79, 926. 111. Reimers, J. R.; Watts, R. O.; Klein, M. L. Chem. Phys. 1982, 64, 95.

362 JONATHON K. GREGORY and DAVID C. CLARY
112. Coudert, L. H.; Hougen, J. T. J. Mol. Spec. 1988, 130, 86. 113. Hougen, J. T. J. Mol. Spec. 1985, 114, 395. 114. Coudert, L. H.; Hougen, J. T. J. Mol. Spec. 1990, 139, 259. 115. Reimers, J. R.; Watts, R. O. J. Chent Phys. 1984, 85, 83. 116. Smith, B. J.; Swanton, D. J.; Pople, J. A." Schaefer, H. E; Radom, L. J. Chem. Phys. 1990, 92,
1240. 117. Millot, C.; Stone, A. J. Mol. Phys. 1992, 77, 439. 118. Stone, A. J. Chent Phys. Lett. 1989, 155, 102. 119. Axilrod, B. M.; Teller, E. J. Chent Phys. 1943, 11,299. 120. Margoliash, D. J.; Proctor, T. R.; Zeiss, G. D.; Meath, W. J. Mol. Phys. 1978, 35, 747. 121. Cohen, R. C.; Saykally, R. J. J. Phys. Chent 1992, 96, 1024. 122. Nesbitt, D. J. Ann. Rev. Phys. Chent 1994, 45, 367. 123. Hutson, J. M. Ann. Rev. Phys. Chent 1990, 41,123. 124. Althorpe, S. C. Bound State Calculations For Van Der Waals Dimers; Ph.D. thesis, Cambridge
University, 1994. 125. Del Bene, J. E.; Pople, J. A. Chem. Phys. Lett. 1969, 4, 426. 126. Hankins, D.; Moskowitz, J. W.; Stillinger, E H. Chent Phys. Lett. 1970, 4, 527. 127. Hankins, D.; Moskowitz, J. W.; Stillinger, E H. J. Chent Phys. 1970, 53, 4544. 128. Lentz, B. R.; Scheraga, H. A. J. Chem. Phys. 1973, 58, 5296. 129. Del Bene, J. E.; Pople, J. A. J. Chem. Phys. 1973, 58, 3605. 130. Pugliano, N.; Saykally, R. J. Science 1992, 257, 1937. 131. Herndon, W. C.; Radhakrishnan, T. P. Chem. Phys. Lett. 1988, 148, 492. 132. Honegger, E.; Leutwyler, S. J. Chent Phys. 1988, 88, 2582. 133. M6, O.; Y~fiez, M.; Elguero, J. J. Chem. Phys. 1992, 97, 6628. 134. Liu, K.; Loeser, J. G.; Elrod, M. J.; Host, B. C.; Rzepiela, J. A.; Pugliano, N.; Saykally, R. J. J.
Ant Chent Soc. 1994, 116, 3507. 135. Liu, K.; Elrod, M. J.; Loeser, J. G.; Cruzan, J. D.; Pugliano, N.; Brown, M. G.; Rzepiela, J. A.;
Saykally, R. J. Faraday Discuss. 1994, 97, 35. 136. Owicki, J. C.; Shipman, L. L." Scheraga, H. A. J. Phys. Chent 1975, 79, 1794. 137. Bone, R. G. A.; Rowlands, T. W.; Handy, N. C.; Stone, A. J. Chent Phys. 1991, 72, 33. 138. Bone, R. G. A. New Applications of the Molecular Symmetry Group; Ph.D. thesis, Cambridge
University, 1992. 139. Koehler, J. E. H.; Saenger, W.; Lesyng, B. J. Comput. Chem. 1987, 8, 1090. 140. Wallqvist, A.; Ahlstrom, P.; Karlstr6m, G. J. Phys. Chent 1990, 94, 1649. 141. Astrand, P. O.; Linse, P.; Karlstr6m, G. Chent Phys. 1995, 191, 195. 142. Cruzan, J. D.; Braly, L. B.; Liu, K.; Brown, M. G.; Loeser, L. G.; Saykally, R. J. Science 1996,
271,59. 143. Vernon, M. E" Krajnovich, D. J.; Kwak, H. S.; Lisy, J. M.; Shen, Y. R." Lee, Y. T. J. Chent Phys.
1982, 77, 47. 144. Plummer, P. L. M.; Chen, T. S. J. Chent Phys. 1987, 86, 7149. 145. Stone, A. J.; Popelier, P. L. A.; Wales, D. J. ORIENT." A Program for Calculating Electrostatic
Interactions between Molecules. Version 3.1.1.; University of Cambridge, 1995. 146. Cerjan, C. J.; Miller, W. H. J. Chent Phys. 1981, 75, 2800. 147. Liu, K.; Brown, M. G.; Saykally, R. J.; Gregory, J. K.; Clary, D. C. Nature 1996, 391,501. 148. Gregory, J. K.; Clary, D. C. J. Phys. Chent 1997, 101, 6813. 149. Gregory, J. K.; Clary, D. C. J. Phys. Chent 1996, 100, 18014. 150. Peterson, S. W.; Levy, H. A. Acta Cryst. 1957, 10, 70. 151. Narten, A. H.; Thiessen, W. E.; Blum, U Science 1982, 217, 1033. 152. Zwart, E.; Ter Meulen, J. J.; Meerts, W. L.; Coudert, L. H. J. Mol. Spec. 1991, 147, 27. 153. Karyakin, E. N.; Fraser, G. T." Suenram, R. D. Mol. Phys. 1993, 78, 1179. 154. Suenram, R. D.; Fraser, G. T.; Lovas, E J. J. Mol. Spec. 1989, 138, 440.

D M C Studies o f Water Clusters 363
155. Fraser, G. T.; Pate, B. H." Suenram, R. D. J. Mol. Spec. 1993, 161,312. 156. Karykin, E. N.; Fraser, G. T." Lovas, E J.; Suenram, R. D.; Fujitake, M. J. Chem. Phys. 1995, 102,
1114. 157. Odutola, J. A.; Dyke, T. R. J. Chent Phys. 1980, 72, 5062.

This Page Intentionally Left Blank

REARRANGEMENTS AND TUNNELING IN WATER CLUSTERS
David J. Wales
Abstract . . . . . . . . . . . . . . . . . . . . . . . . . . . . . . . . . . . . . 365 1. Introduction . . . . . . . . . . . . . . . . . . . . . . . . . . . . . . . . . . . 366 2. The Effective Molecular Symmetry Group . . . . . . . . . . . . . . . . . . . 366 3. Geometry Optimizations and Rearrangement Pathways . . . . . . . . . . . . 368 4. Water Dimer . . . . . . . . . . . . . . . . . . . . . . . . . . . . . . . . . . . 370 5. Water "Filmer . . . . . . . . . . . . . . . . . . . . . . . . . . . . . . . . . . . 373 6. Water Tetramer . . . . . . . . . . . . . . . . . . . . . . . . . . . . . . . . . . 381 7. Water Pentamer . . . . . . . . . . . . . . . . . . . . . . . . . . . . . . . . . 386 8. Water Hexamer . . . . . . . . . . . . . . . . . . . . . . . . . . . . . . . . . 388
Acknowledgments . . . . . . . . . . . . . . . . . . . . . . . . . . . . . . . . 393 References . . . . . . . . . . . . . . . . . . . . . . . . . . . . . . . . . . . . 393
ABSTRACT
Low-energy rearrangement mechanisms for the global minima of water clusters containing from two to six monomers are reviewed. The implications of these mechanisms for the effective molecular symmetry group and tunneling splitting patterns are considered in the light of recent far-infrared vibration-rotation-tunneling spectroscopy for each system. Comparisons are also made with other vibrational
calculations.
Advances in Molecular Vibrations and Collision Dynamics, Volume 3, pages 365-396. Copyright �9 1998 by JAI Press Inc. All fights of reproduction in any form reserved. ISBN: 1-55938-790-4
365

366 DAVID ]. WALES
1. INTRODUCTION
Water clusters have been much studied both experimentally and theoretically in the last couple of decades. The fundamental role of water as an almost ubiquitous solvent in chemistry and biochemistry is certainly responsible for much of this interest. Furthermore, water represents a paradigmatic hydrogen-bonded system, and understanding the bonding in water clusters is therefore of great importance in the theory of intermolecular forces. 1-6 A number of studies have appeared dealing with the effects of many-body forces in small water clusters, 7-12 hydrogen-bond network rearrangement dynamics 13 and with the spectral shifts which arise on complex formation. 14-16 Recent far-infrared vibration-rotation tunneling (FIR- VRT) experiments have sparked particular interest because of the exceptional resolution of up to around 1 MHz. 17-2~ The interplay of theory and experiment in assigning and interpreting such spectra has continued the tradition which began with the experimental determination of the structure of the water dimer by Dyke, Mack, and Muenter 21 in 1977.
The latest experiments pose new challenges to theory because the tunneling splittings that are now resolved can only be explained from a global view of the potential energy surface (PES). The large amplitude motions which generally occur in these weakly bound complexes sample regions of the PES far from the bottom of potential wells. Theoreticians must therefore characterize transition states and rearrangement pathways to provide complete reaction graphs to explain or predict the tunneling splittings observed. 22 The splitting patterns, which may be compared directly with experiment, are primarily determined by the detailed connections between permutational isomers which are summarized in the reaction graph. Pathway calculations are highly desirable because predicting the details of a given rearrangement mechanism from the transition state alone may be difficult.
In the present review we will focus mainly on the water trimer, tetramer, pentamer, and hexamer, where new FIR-VRT results have recently been obtained, and mention the water dimer largely for completeness. Many ab initio calculations for the equilibrium geometries of these clusters have been reported, and a reason- ably up-to-date listing will be provided. However, only a handful of papers have reported the rearrangement mechanisms which are of paramount importance in the present work. Before discussing our present understanding of each of these clusters in turn, we must first provide an overview of the effective molecular symmetry group which provides an appropriate classification scheme for the energy levels of nonrigid systems.
2. THE EFFECTIVE MOLECULAR SYMMETRY GROUP
Quantum tunneling effects provide indirect information about the underlying PES through the corresponding rearrangement mechanisms. To classify the energy levels in such systems we must go beyond the usual point group symmetry, which

Rearrangements of Water Clusters 367
is only appropriate for rigid molecules. This leads us to consider the effective molecular symmetry group and permutation-inversion operations.
The PES will generally contain permutational isomers of each local minimum. Following the nomenclature of Bone et al. 23 we will refer to a s tructure as a
particular molecular geometry and a version as a particular labeled permutational isomer of a given structure. Minima which are directly connected by a given rearrangement are said to be adjacent . Tunneling splittings occur when rovibronic wavefunctions localized in potential wells corresponding to different permutational isomers interfere with each other. The textbook example is the inversion of ammonia, where doublet splittings arise from the interconversion of pairs of versions through a planar transition state. 24-25 The splittings are largest when the intervening barrier is small, the path length short, and the effective mass low. Hence observable splittings are generally associated with a low-energy transition state which mediates a degenera te rearrangement mechanism 26 linking permutational isomers of the same structure. There are actually two kinds of degenerate rearrange- ment: 27 symmetric, where the two sides of the path are related by a symmetry operation, and nonsymmetric where the two sides are inequivalent. In all the following discussions we employ Murrell and Laidler's definition of a transition state as a stationary point with a single negative Hessian eigenvalue. 28
The Hamiltonian is invariant to arbitrary permutations of atoms of the same element, and also to inversion of all coordinates through the space-fixed origin. Molecular energy levels may therefore be classified according to irreducible representations (IR's) of the complete nuclear permutation-inversion (CNPI) group which is the direct product of the inversion group and the group containing all possible permutations of identical nuclei. The CNPI group is a true symmetry group of the full molecular Hamiltonian in the absence of external fields, and the elements are usually referred to as permutation-inversions (PI's). Unfortunately the CNPI group grows in size factorially with the number of equivalent nuclei, and rapidly becomes unwieldy. The order, hcNPi, is,
hcNPi = 2 l - I hi! i
where n i is the number of atoms of element i in the molecule. However, Longuet- Higgins 29 showed that it is not necessary to consider the full CNPI group but only a subgroup of PI's, the effective molecular symmetry (MS) group, which corre- spond to experimentally resolvable tunneling splittings. 3~ The associated rearrange- ment mechanisms are said to be f eas ib le . For rigid molecules the MS group is isomorphic to the point group: 31-34 the corresponding PI's are equivalent to overall rotation of the molecule, and are therefore always feasible.
Feasible rearrangements with nonzero associated barriers lead to an increase in the order of the MS group to include the corresponding PI and all its products with the operations in the MS group of the rigid molecule. Alternatively, we can regard

368 DAVID J. WALES
the MS group as a subgroup of the CNPI group obtained by removing all the PI's for a given reference version that are not feasible. If the order of the MS group, hMs, is smaller than hcNPI then it must satisfy hcNPi/hMs = L where L is an integer. The versions are then grouped into L disconnected sets each with hMs members which can all be interconverted by combinations of feasible operations; each such do- main 35 has an equivalent reaction graph. When there are no feasible rearrangements hus is the order of the rigid molecule point group, hRM, and there are therefore hcNPi/hRM distinct versions of any given stationary point on the PES. 23 Since each minimum supports an equivalent stack of rovibronic energy levels all such states are hcNPi/hRM-fold degenerate.
Resolvable tunneling splittings arise when the vibronic functions localized in the potential wells of distinct versions interfere with one-another sufficiently. The wavefunctions can then be written to a good approximation as linear combinations of the localized functions which transform according to IR's of the MS group. Here there is an obvious analogy to the linear combination of atomic orbitals (LCAO) approach where the delocalized molecular orbitals transform according to IR's of the prevailing point group. To find the best wavefunctions of this form one must solve a secular problem, and since the localized wavefunctions decay exponentially in the classically forbidden barrier regions it may be reasonable to make a Htickel- type approximation in which only the interaction of adjacent minima is considered. This approach does not appear to be appropriate for CH~, 36 but is a good first approximation for the water trimer, as discussed in Section 5. In the latter calcula- tions all the diagonal elements of the Hamiltonian take the unperturbed value for the level in question, and the off-diagonal elements, referred to generically as [3, are matrix elements between wavefunctions localized on adjacent versions. Given such approximations it may be possible to solve the secular problem and obtain analytic results as a function of the [3 parameters. The 13's are generally difficult to evaluate quantitatively, but this may not be necessary since the splitting pattern alone may be sufficient to assign spectral features to a given mechanism. The full reaction graph and the properties of the associated MS group can be obtained automatically by a simple computer program given a minimal set of generator permutation-inversions .37
0 GEOMETRY OPTIMIZATIONS A N D REARRANGEMENT PATHWAYS
Most of the rearrangement mechanisms reported in the following sections were characterized by the author using eigenvector-following procedures 38 which have been described in detail elsewhere. 39-4~ Analytic first and second derivatives of the energy were used at every step. In the ab initio calculations these derivatives were mostly generated by the CADPAC program, 41 and Cartesian coordinates were used throughout. Pathways were calculated by taking small displacements of 0.03 a o

Rearrangements of Water Clusters 369
away from a transition state both parallel and antiparallel to the transition vector, and then employing eigenvector-following energy minimization to find the associ- ated minimum. The pathways obtained by this procedure have been compared to steepest-descent paths and pathways that incorporate a kinetic metric 42 in previous work--the mechanism is generally found to be represented correctly. 43
Calculations employing rigid-body intermolecular potentials were performed using the ORIENT3 program, 44-46 which contains the same optimization package
adapted for center-of-mass/orientational coordinates. This program can treat inter- molecular potentials based upon Stone's distributed multipoles 47-48 and distributed polarizabilities; 49-5~ simpler models based upon point charges and Lennard-Jones
interactions fall within this framework. Some of the calculations in the present work employ the relatively sophisticated ASP rigid water intermolecular potential of Millot and Stone 51 (somewhat modified from the published version) and the much simpler but widely-used TIP4P form. 52-53
In the ab initio Hartree-Fock (HF) calculations two basis sets were considered. The smaller double-~ 54-55 plus polarization (DZP) basis employed polarization
functions consisting of a single set ofp functions on each hydrogen atom (exponent 1.0) and a set of six d functions on each oxygen atom (exponent 0.9) to give a total of 26 basis functions per monomer. The larger basis set, denoted DZP+diff, includes the above DZP functions with an additional diffuse s function on each hydrogen atom (exponent 0.0441) and diffuse sets of s and p functions on each oxygen atom (exponents 0.0823 and 0.0651 for s and p, respectively), 56 to give 32 basis functions per monomer. Correlation corrections were obtained through both second order MNler-Plesset (MP2) theory 57 and density functional theory (DFT). 58 In the DFT calculations we employed the Becke nonlocal exchange functional 59 and the Lee-Yang-Parr correlation functional 6~ (together referred to as BLYP); derivatives of the grid weights were not usually included and the core electrons were not frozen. Further details can be found in the original papers. Calculations were deemed to be converged when the root-mean-square gradient fell below 10 -6 atomic units. This is sufficient to reduce the six "zero" normal mode frequencies to less than 1 cm -1 in the HF and MP2 calculations. When derivatives of the grid weights were not included, the largest of the six "zeros" can be of order 20 cm -1 for the DFT
stationary points. Several parameters are useful in characterizing the rearrangement pathways. The
first is the integrated path length, S, which was calculated as a sum over eigenvec- tor-following steps as in previous work. The second is the distance between the two minima in nuclear configuration space, D. The third is the moment ratio of displacement, 61 y, which gives a measure of the cooperativity of the rearrangement,
N 2 . [Qi(s) - Qi(t)] 4 !
2 [Q(s)-

370 DAVID J. WALES
where Qi(s) is the position vector in Cartesian coordinates for atom i in minimum s, etc., and N is the number of atoms. If every atom undergoes the same displacement in one Cartesian component then y - l, while if only one atom has one nonzero component then ), = N.
4. WATER DIMER
Many experimental and theoretical studies of (I-I20)2 and (D20)2 followed the pioneer- ing experiment of Dyke, Mack, and Muenter. 21 More comprehensive reviews of previous ab initio and experimental work can be found elsewhere; 62-63 recent experiments include a complete characterization of the tunneling dynamics in a vibrationally excited state of (D20)2 .64 Dyke 21 classified the rovibronic energy levels in terms of permutation-inversion group theory, and Coudert and Hougen used their internal-axis method and an empirical intermolecular potential to analyze the tunneling splittings theoretically. 65-67
Smith et al. 68 characterized a number of stationary points on the dimer PES and considered the effects of basis set and correlation energy upon the Hessian indices of each one. They identified three true transition states and also performed con- strained calculations of the donor-tunneling pathway. Unconstrained pathway calculations have recently been reported for all three transition states, 69 including counterpoise-corrected 7~ binding energies, and barrier heights allowing for mono- mer relaxation. 71
There are 2 x 2! x 4 !/2 = 48 distinct versions of the water dimer global minimum; ham = 2 because the equilibrium geometry has point group Cs; one "donor" monomer acts as a single hydrogen-bond donor to the other "acceptor" molecule. 72 Mechanisms involving the disruption of covalent bonds lie much too high in energy to produce observable tunnelings, and hence the largest subgroup we need to consider has order 2 x 2! x (2!) 2 = 16, where the first factor accounts for the inversion mechanism, the second factor accounts for permutation of the two oxygen nuclei, and the last term accounts for the permutation of the two hydrogen (or deuterium) atoms within each monomer. The maximum value possible for hMs without break- ing covalent bonds is therefore 16, and the largest number of versions that can be linked by operations in this group is 8. Dyke showed that this group, G(16), is isomorphic to the point group O4h .21
The mechanism which produces the largest tunneling splitting involves the effective interchange of the two hydrogen atoms in the acceptor monomer. The corresponding transition state has C l symmetry when electron correlation is in- cluded in the calculation. 68'69 The pathway found in unrestricted geometry optimi- zations is shown in Figure 1 ;69 it corresponds to a "methylamine-type" process 73 rather than a direct rotation about the local C 2 axis of the acceptor monomer. The path is represented by nine snapshots where the first and last frames are the two minima, the middle frame is the transition state and three additional frames on each

Rearrangements of Water Clusters 3 71
minimum C s
4
transition state C 1
B 3 4
minimum C s
Figure 1. Acceptor-tunneling rearrangement for (H20)2 calculated at the DZP+diff/BLYP level.
side of the path were selected to best illustrate the mechanism. (All the figures in this article were produced using Mathematica.) 74 A suitably scaled transition vector is superimposed on each transition state; this displacement vector lies parallel to the Hessian eigenvector corresponding to the unique negative eigenvalue.
The "methylamine-type" process is in agreement with the analysis of Pugliano et al. 64 for the ground-state acceptor tunneling path. Versions are connected in pairs by this mechanism, and hence each rigid-dimer rovibrational level is split into two. Experimentally, the ground-state splitting is 2.47 cm-l, 75 in good agreement with a five-dimensional treatment of the nuclear dynamics by Althorpe and Clary. 76 The
MS group for the rigid dimer has dimension two and the MS group has order four when the a.cceptor tunneling process is considered to be feasible.
The next largest splitting is caused by donor-acceptor interchange, for which Smith et al. 68 found a cyclic transition state with C i symmetry. In the corresponding rearrangement the roles of the donor and acceptor monomers are interchanged (Figure 2). This process on its own connects versions in closed sets of four, but when combined with acceptor tunneling the MS group increases in size to order 16, i.e. the largest it can be without breaking covalent bonds. The versions are then

372 DAVID I. WALES
4 3
minimum Cs
3 4
transition state C i
4
~ A
minimum C s
Figure 2. Donor-acceptor-interchange rearrangement for (H20)2 calculated at the DZP+diff/BLYP level.
connected in sets of eight, and the splitting pattern within the simplest Htickel-type approximation 37 is,
[3 a + 213~(A~), [3a(E+), ~a- 2~da(B~l) '
-~a + 2~da(A2) ' -~a (E-')' - ~ a - 213~(B-22)
where [3 a and 13da are the acceptor-tunneling and donor-acceptor interchange ma- trix elements. Experimentally, the tunneling splittings due to donor-acceptor interchange are about a factor of five smaller than those associated with acceptor tunneling. 75
The final process which appears to have an observable effect on the energy levels is donor tunneling (Figure 3). However, no further splittings are possible because acceptor tunneling and donor-acceptor interchange tunneling already link the versions in sets of eight--higher connectivity is not possible without breaking covalent bonds. If the matrix element corresponding to donor tunneling is [3 d, then the splitting pattern in the simplest Htickel approximation becomes:

Rearrangements of Water Clusters 3 73
3 4
minimum C s
3 4
A ~ / B <---
l transition state C2v
3
1
minimum Cs
Figure 3. Donor-tunneling rearrangement for (H20)2 calculated at the DZP+diff/BLYP level.
~a -I- 213da + ~d(A~), ~a- ~d( E+)' 13.- 213d~ + ~d(B~),
--~a + 2~da + ~d(A2), --~a- [3d(E-~, -13a- 2~da + ~d(B-2z )
This pattern has been found in the model calculations of Coudert and Hougen 6547 and by Althorpc and Clary. 76 The tunneling levels no longer occur in plus-minus pairs because donor tunneling introduces odd-membcred tings into the reaction graph, vv
5. WATER TRIMER
In the new wave of results the most complete understanding of the experimental tunneling splittings has been achieved for the water trimer. The first FIR-VRT results were reported by Pugliano and Saykally,78 who found that every line in their spectrum of (D20)3 was split into regularly spaced quartets with a spacing of about 6 MHz, i.e. 2 x 10 -4 cm -l. The equilibrium geometry of the global minimum was confirmed as a cyclic asymmetric structure in early theoretical 79 and experimental 8~ work and a number of additional calculations have been presented. 81-85

374 DAVID J. WALES
However, the energy level patterns observed in the most recent FIR-VRT experi- ments are those of an oblate symmetric rotor, and the values obtained for all three vibrationally averaged rotational constants reveal a large negative inertial defect, implying extensive out-of-plane motion of the non-hydrogen-bonded hydrogens. These results can be reconciled by vibrational averaging over large amplitude motions of the free (non-hydrogen-bonded) hydrogens on the timescale of the FIR-VRT experiment.
To describe the geometries of cyclic water clusters SchiJtz et al. 86 introduced a useful notation which we will now summarize. When the water monomers each act both as a single hydrogen bond acceptor and a single donor they can be identified according to whether the free hydrogen is up, down, or planar, and are labeled u, d, and p, respectively. For example, the cyclic global minimum of (H20) 3 (see Figure 4) may be represented as (uud). The order of the labels in brackets is also conventional, so that hydrogen-bond donation occurs from left to fight, allowing further discrimination of isomers. However, there is still some redundancy in this notation; for example, cyclic permutations such as (uud), (udu), and (duu) represent the same isomer. In cyclic water clusters with odd-membered rings it may also be helpful to classify the monomers according to which side of the ring most of the free hydrogens lie above. This splits the water molecules into majority and minority sets, and for the trimer a unique description is obtained by further specifying whether the majority monomers donate or accept a hydrogen bond from the single minority monomer. 43
The vibrational averaging of the water trimer which leads to an oblate symmetric top spectrum is caused by the facile single flip mechanism illustrated in Figure 4. This (udp) transition state was probably first characterized by Owicki et al. 87 for an empirical potential, and was recognized by Pugliano and Saykally in their original paper. 78 The only ab initio pathways for this rearrangement have been reported by Wales, 88 in agreement with surveys of the trimer PES by other workers. 56'89-91
The (uud) global minimum has an equilibrium geometry of C 1 symmetry, and so the total number of versions on the PES is 2 x 3! x 6! = 8640. However, if covalent bonds cannot be broken then these minima fall into 90 sets each containing 2 x 3! x (2!) 3 = 96 versions. The single flip mechanism links each version to two others; a suitable PI generator for the labeling scheme of Figure 4 is (ACB)(153)(264)*, where the cycle notation indicates that oxygen A is replaced by oxygen C, oxygen C by oxygen B, etc. Three applications of this generator take the reference version into its enantiomer, and three more transformations return the system to the original version. This mechanism therefore connects versions in sets of six with a cyclic
78 reaction graph. The MS group also has order six and is isomorphic to C3h. The secular problem in the simplest Htickel approximation is identical to that for the benzene molecule; 88'9~ the splitting pattern is,
2~f(A l), ~f(E2), -~f(El), -2~f(A 2 )

Rearrangements of Water Clusters 375
Figure 4. Single-flip rearrangement of the water trimer.
where the symmetry labels correspond to Pugliano and Saykally's convention 78
(A 1 and E 1 have even parity under E*) and 13f is the appropriate tunneling matrix element for the flip. This mechanism may be a barrierless "pseudorotation" process
when zero-point energy is accounted for. Two further degenerate rearrangements for the trimer with significantly higher
barriers were found in ab initio calculations. 88 Estimates of the associated tunneling
splittings suggested that one of these processes, illustrated in Figure 5, is probably responsible for the quartet splittings observed at high resolution. The generator PI corresponding to Figure 5 is (34)* and the transition state involves a bifurcated arrangement with one double-donor molecule and one double-acceptor, as for the donor-tunneling mechanism in the water dimer, above. The rearrangement in the trimer is therefore known as bifurcation or donor tunneling. When both the bifurcation mechanism and the single flip are feasible, the MS group has order 48, 88
and is referred to as G(48). Two further vibrational transitions of (D20) 3 were subsequently reported, a
c-type transition 92 at 41.4 cm -1 and an a-type transition 93-94 at 98.1 cm -l. An a-type
band has also been reported at 82.5 cm -l, but was not assigned in detail. 94 The

376 DAVID J. WALES
Figure 5. Bifurcation rearrangement of the water trimer.
original strongly perturbed transition reported by Pugliano and Saykally 7s is now thought to be a hot band. A c-type transition at 87.1 cm -1 has also been analyzed. 93'94 The bands assigned by Liu et al.93 have a rigorously symmetric rotor structure, and all the transitions reported have a regular quartet splitting of every rotational line, both in terms of the spacings and the intensities. Liu et al. 93 revised the O-..O distances estimated by Pugliano and Saykally 78 and showed that the new spectra were consistent with the G(48) group analyzed by Wales, 88 rather than the largest possible MS group of dimension 96. 95 G(48) is also the appropriate MS group for the acetylene trimer if rotation of a single monomer is the only feasible rearrange- ment. 23
Further theoretical and experimental work has now led to an even more detailed understanding of the dynamics in the trimer. Systematic ab initio calculations revealed that the number of flips which accompany the bifurcation is sensitive to the level of theory employed, 43 which probably reflects the facile nature of the flip. There are actually six possibilities for the bifurcation pathway; the rearrangement shown in Figure 5 involves a bifurcation of the minority monomer and flips for both

Rearrangements of Water Clusters 377
the monomers that are initially majority-type. All six distinct paths lead to the same MS group, namely G(48), as in fact does the third degenerate rearrangement found by Wales. 88 However, there are two distinct splitting patterns, denoted A and B in Table 1, and three of the bifurcation paths fall into each one. 43 Both splitting patterns include regular quartets, but A also has irregularly spaced quartets, suggesting that the actual mechanism is one of the three belonging to type B, for which suitable generators are (56)*, (12)*, and (34)*; generators for the mechanisms belonging to type A are (ACB)(164253), (ABC)(136245), and (ACB)(152634)*. 43
In the most recent work, further analysis of the 87.1 cm -l band for (H20)3 has provided an assignment for each line and has revealed that some of the quartets are further split into double ts . 96 The latter study includes a rigorous derivation of a Hamiltonian for the constrained three-dimensional torsional space of the free hydrogens along with explicit expressions for the effective monomer moments of inertia and for the Coriolis coupling operator between the internal and overall rotations. 96 For nonrotating clusters with J = 0 the results are very similar to those of Wales. 88 However, for J > 0 there are significant Coriolis coupling effects. Using
Table 1. Calculated Tunneling Splitting Patterns for the Water Trimer when the Single-Flip and Bifurcation Rearrangements are Feasible a
A B
2~ + 2 ~ (A~) 213~ + ~ (A~,) 2 1 2~ + ~-[3 b (~) 2l~ + 7 ~ (F2)
21It" 2 _ _ ~ (~) 2~f- 2~b (A~) 2 ~ - l] b (A~)
5 1 13, + 132 (T?I (~ ~) ~ + ~ (~)
Bf BB (r22 (~) E22) [~mbf -1 -- ~b ("r22) ~_5
~b (7~'I) ~f- ~ (~l (~) L'22) 5
1 --Bf + Pb (TT �9 ~) -~f + ~ISb (~) ~ - ~ ( ~ ~) -~f - ~ (~)
_~f 5 - ~ (~) ~ - ~ (~ �9 ~)
-2~f + 213 b (A?) -2l~ + 13,o (A~) 2 1 -2~f + ~.ig b (~ ) -2~f + ~.ig b (~ )
- 2 ~ - 2 ~l~b (~) ~b (r22) -2~- i
- 2 ~ - 213, o (A~) -2~ f - ~]b (A~)
Note: a'lhere are two possible patterns depending upon the number of flips accompanying the bifurcation. 43

378 DAVID J. WALES
an empirical model to represent the bifurcation tunneling matrix elements it was also possible to deduce that the generator for the bifurcation mechanism should include the inversion operation. This is consistent with the analysis of Walsh and Wales, 43 mentioned above, since all the generators which give only regular quartet splittings of type B do indeed contain the inversion. A more general Hamiltonian allowing for relative motion of the monomer centers-of-mass was deduced by Xantheas and Sutcliffe, 97 but it has not yet been used in any calculations.
Quantum dynamical treatments of the torsional vibrations using the discrete variable representation 98 (DVR) have appeared in one, 86 two, 99 and three dimen- sions, l~176176 and confirm the "benzene-like" splitting pattern. 88'9~ The most recent calculations 96 improve upon the phenomenological forms adopted for the Hamil- tonian in previous work and include overall rotation. Good agreement was found for the lower-lying transitions using a potential energy surface calculated by van Duijneveldt-van de Rijdt and van Duijneveldt, 91 but better results were obtained for the higher-lying states using a potential fitted by Btirgi et al. 9~
Unfortunately there is little prospect of extending DVR calculations to more than about six coupled internal degrees of freedom. However, it has been possible to treat all the internuclear degrees of freedom quantum mechanically using a diffu- sion Monte Carlo (DMC) approach 1~ which scales much more favorably with system size. In most of the applications to water clusters a rigid body DMC formulation has been employed 12'1~176 which enables larger time steps to be taken because the intramolecular vibrations are frozen. Empirical intermolecular poten- tials have been developed for which good agreement is obtained with the vibration- ally averaged rotational constants observed experimentally, and estimates for tunneling splittings have also been reported where a fixed nodal surface is intro- duced into the wavefunction. Direct comparison with the splittings observed experimentally is not possible, because the latter are the sum or difference of splittings in the ground and excited states. Nevertheless, the calculated values generally seem to have reasonable orders of magnitude.
The principal difficulty in applying the rigid-body DMC approach is the avail- ability of a realistic intermolecular potential. This problem is particularly acute for calculations of excited states, where the potential should ideally support the correct rearrangement mechanisms. For excited states it is also necessary to design an order parameter which determines when a nodal surface is about to be crossed. This may be possible when the transition states have been well-characterized in ab initio
22 40 43 88 calculations ' ' ' but it is difficult to know how to proceed for the water tetramer (see Section 6) where the tunneling pathway is unclear. 1~ In fact, most of the degenerate rearrangements in small water clusters which may lead to tunneling splittings have asymmetric pathways, and so even detailed knowledge of the transition state does not rigorously determine the position of the nodal surface in such cases.
Three-dimensional DVR calculations have been conducted to compare the be- havior of different empirical potentials. The phenomenological Hamiltonian of

Rearrangements of Water Clusters 3 79
Sabo et al. 10~ was employed in which only rotation about the hydrogen-bonded O-H bond is permitted,
"q'/" =-Beff + ' ~ 2 2 + + V(r r r
where ~i are the torsional angles in question and the value of Bef f was taken to be 19.63 cm -1 for H20 and 9.82 cm -1 for D20. For each torsional degree of freedom the basis functions were chosen as,
1 xll ( r ) = ~ eimCJ, m = 0 , + l . . . . . +_N
giving a total of (2N + 1)3 basis functions for a given value of N. The DVR grid points are then uniformly spaced in each coordinate,
~j 2xj = ~ , j = l , 2 . . . . . 2 N + l
2N+ 1
Hence we obtain a direct product DVR with grid points ( ~ , (~k,2 ~) , and using the known analytic form for the kinetic energy operator 1~ we obtain the Hamiltonian matrix elements,
adefbC= Tda~eb~fc + Teb~da~fc + Tfc~da~eb + g (~d, ~ , ~3)~da~eb~fc '
where, for example,
N(N + 1)/3, a =d,
Tda= eeff(-1) d'a cos [ x ( d - a ) / ( 2 N + 1)] , a r
2sin 2 [/t(d- a)/(2N + 1)]
The lowest eigenvalues were converged to an accuracy better than 0.1 cm -1 for both
(H20) 3 and (D20)3 using an iterative Lanczos matrix diagonalization procedure. The potentials considered were TIP4P, 53 modEPEN 89 and two variants of the ASP
potential, 51 ASP-2W, and ASP-4W, the latter both with and without iteration of the induction energy to convergence. The results for the modEPEN potential agree to four significant figures with those obtained by Sabo et al. 1~176 The ASP-2W and ASP-4W potentials include distributed multipoles 51 up to rank 2 and 4, respectively, and are otherwise the same. The value of N required to converge the levels illustrated in Figure 6 varied from only 7 and 9 for modEPEN and TIP4P to 13 and 14 for ASP-2W and ASP-4W. The convergence was similar for both (H20) 3 and (D20)3. It is clear from Figure 6 that the splittings obtained for the ASP potentials are much smaller than for the other two; the reason for this is not yet known. The spectrum obtained for the modEPEN potential seems to match the predicted la u <-- lag

0 m
3 0 0 -
250 -
00-
150 -
100-
5 0 -
es eu
ag
eg
ag
ag
eu
au
a u ag e~
ag
ag a u
ag
eu
ag
eu au au
eg au
a u ag
ag
au
eg
eg
au
au
eg flu,
eg
eu
ag
ag
e~
au
e u " au au
eg au eg eu ag ag ,
. - -__ eu ,, eg eu
a s ag a s
m o d E P E N TIP4P A S P - W 2 A S P - W 2 A S P - W 4
lau ~ lag
transition?
Figure 6. Lowest lying torsional states calculated using the DVR approach for (H20) 3 for a variety of empirical potentials.
380

Rearrangements of Water Clusters 381
transition best, but unfortunately this potential exhibits unphysical behavior outside the torsional space. 43
6. WATER TETRAMER
Two FIR-VRT experiments have now been reported for (D20)4, revealing a sym- metric doublet splitting of 5.6 MHz. 1~176 The cyclic global minimum of the tetramer, (udud), has point group S 4 and is expected to behave rather differently from the trimer and pentamer discussed in Sections 5 and 7. In the cyclic clusters with odd-membered rings, two of the free hydrogens are forced to lie in adjacent positions on the same side of the ring. The odd-membered ring systems are therefore frustrated and both exhibit facile single-flip degenerate rearrangements. 22'4~ The (udud) global minimum of the tetramer, on the other hand, is not frustrated, and a single-flip process does not constitute a degenerate rearrangement in this system.
There have been numerous theoretical studies of (H20)4 beginning in the 1970s, 7'1~176176 but the most systematic surveys of the stationary points in the torsional space are those of Schiitz and coworkers. 119-12~ The latter studies confirmed the absence of a direct degenerate rearrangement of the (udud) global minimum in the torsional space, and prompted us to perform a more extensive survey of the tetramer PES including calculations of rearrangement mechanisms. 1~ At some levels of theory we found a direct degenerate rearrangement of (udud) via a (dbdu) transition state--a summary of the stationary points located is given in Figure 7.
The small tunneling splitting observed experimentally is probably consistent with the lack of a low-energy degenerate rearrangement mechanism. However, it is possible to interconvert (udud) and (dudu) via an effective quadruple flip in several different ways. Cruzan et al. 1~ consider a concerted quadruple flip via a (pppp) structure in their original paper. Alternatively, there are stepwise paths via the transition states (uudp) and (uupd) and intervening (uudd) or (uuud)-type minima or paths involving the index two saddle points (udpp) and (updp). 1~ There does not appear to be a (uuud)-type stationary point in our Hartree-Fock calculations, but this structure is a local minimum when density functional theory is used and for the ASP potential that we considered. 1~ These results probably indicate that the (uuud) stationary point has only marginal stability. The (udbd) transition state generally lies either above or close to the (pppp) index four saddle and the (udpp) and (updp) index two saddles in the ab initio calculations. At the Hartree-Fock level the (uudp) and (uupd) transition states both correspond to asynchronous double flips (Figure 8) which link (udud) and (uudd)-type minima. However, in the density functional calculations they mediate single-flip processes involving (uuud)-type minima. 1~
In fact the effective MS group is the same regardless of whether the four flips occur together or sequentially, and is isomorphic to Cah with eight elements. 1~ The CNPI group has order 2 x 4! x 8! = 1,935,360, but if we only include PI's which

Figure 7. Some of the stationary points on the water tetramer potential energy surface. (udud), with $4 symmetry, is the global minimum.
382

Rearrangements of Water Clusters 383
Figure 7. (Continued)
do not disrupt covalent bonds then we define 2520 subgroups of the CNPI group of dimension 2 x 4! x (2!)4= 768 each. Since the (udud) global minimum has point group S 4 the largest number of versions which could be connected without breaking covalent bonds is 768/4 = 192. The quadruple flip links versions in pairs, regardless of how it actually occurs, and would lead to doublet splittings with levels of Ag and B u symmetry at energies of 131 and-[31 respectively, where [31 is the appropriate tunneling matrix element, in agreement with Cruzan et al. 1~ The splitting pattern if the rearrangement corresponding to the (udbd) transition state (Figure 8c) is feasible is significantly more complicated and does not appear to agree with experiment. 1~
At present the available evidence supports the assignment of the tunneling splittings to an effective quadruple flip. However, we cannot yet be sure what the precise tunneling pathway is. Gregory and Clary have reported DMC calculations for two different empirical potentials, one of which produced no tunneling splitting while the other produced a result of the same magnitude as the experimental

384 DAVID J. WALES
splitting. 1~ However, it is not clear which pathway these calculations correspond to. We have made rough estimates of the tunneling matrix elements associated with the various paths 1~ and concluded that tunneling via the true transition states (uudp) and (uupd) and intermediate local minima may be the most important contributions. However, further calculations will be needed to check this suggestion. It is also relevant that observable tunneling splittings have been predicted for isotopomers of the water trimer which would also necessitate tunneling via higher energy local minima.lOl, 121
Figure 8. Rearrangement mechanisms calculated ab initio for (H20)4. (a) Asynchronous double flip for the (uudp) transition state (DZP/HF). (b) Asyn- chronous double flip for the (uupd) transition state (DZP/HF). (c) Degenerate rearrangement of (udud) via a bifurcated (udbd)transition state (DZP/HF).

(b)
Figure 8. (Continued)
385

386 DAVID J. WALES
7. WATER PENTAMER
The water pentamer exhibits a number of similarities to the trimer in that the cyclic global minimum is a frustrated structure with two adjacent free hydrogens on the same side of the ring. Liu et al. 122 have reported FIR-VRT results for (D20) 5 which did not reveal any tunneling splittings. The order of the CNPI group for the pentamer is 2 x 5! x 10! = 870,912,000 and since the global minimum has point group C 1 this is also the number of distinct versions. If we include only PI's which do not disrupt covalent bonds, then the versions are partitioned into 113,400 subgroups of dimension 2 x 5! x (2!) 5 = 7680 each.
There have been n u m e r o u s p rev ious t heo re t i c a l s tud ies of (H20)5,8,15,80,111,113,115,123-126 but the only quantum mechanical calculations of
Figure 9. (a) Single flip and (b) bifurcation mechanisms calculated ab initio for (H20)5 .40

Rearrangements of Water Clusters 387
Figure 9. (Continued)
rearrangement mechanisms are those recently reported by Wales and Walsh. 4~ Fourteen pathways were characterized in the latter study, including relatively low-energy degenerate rearrangements of the cyclic global minimum (Figure 9) which are analogous to the flip and the bifurcation mechanism in the trimer, described in Section 5. After correction for zero-point energy the barrier for the single flip disappears, while that for the bifurcation is 577 cm-1. 4~ As for the trimer it is likely that the precise number of flips which accompany the bifurcation process will be sensitive to the level of the calculation.
Both the flip and the bifurcation mechanism considered in isolation lead to an effective MS group of order 10 isomorphic to Csh where each version is connected to two others in a cyclic reaction graph containing 10 versions. The predicted splitting pattern in the simplest Hiickel approximation is the same as for the r~-system of 10-annulene (cyclodecapentaene):

388 DAVID J. WALES
p pp p
213(A'), ~13(E2'), ~-l]3(E1), -~- l l ] (El) , - -013(E2) , -213(A")
where 13 is the ap~opriate tunneling matrix element, ~ = ( ~ - + 1)/2 is the golden ratio and ~-1 = ('45 - 1)/2 = 1/~. The symmetry species in parentheses are appro- priate if the generator corresponds to the operation S 5 of Csh. If both the flip and bifurcation mechanisms are feasible then the MS group increases in dimension to order 320 and the splitting pattern becomes rather complicated. 4~
Qualitative estimates of the associated tunneling splittings using perturbation theory 37 give similar orders of magnitude to the trimer for both mechanisms. 4~ Gregory and Clary have also attempted to calculate these splittings using DMC with several different empirical potentials. 100 For these rearrangements, defining the nodal surfaces is not as problematic as for the tetramer because the mechanisms are clear, 22'4~ but the cyclic structure is not the global minimum for the pentamer with any of a number of variants of the ASP potential that have been considered. 4~176 In fact the ASP-NB potential considered by Gregory and Clary does not produce a detectable tunneling splitting in the tetramer, 100 although good agreement is ob- tained for the vibrationally averaged rotational constants. Nevertheless, the DMC results obtained for the pentamer are in reasonable agreement with the order of magnitude estimates obtained by perturbation theory" the splitting for the bifurca- tion mechanism is predicted to decrease by a factor of 3 from the trimer, while the splitting due to the flip decreases by a factor of between 30 and 100.1~176 The larger decrease for the flip may be due to the greater motion of the heavier oxygen atoms in the pentamer which is necessitated by the puckering of the corresponding minimum. 1~ Given all the approximations involved in obtaining these estimates, it is not really clear if even a factor of 100 constitutes a significant difference. This is especially true in view of the fact that the splittings may vary appreciably with the vibrational state. The absence of splittings from the spectra of (D20)5 reported so far is probably because the bifurcation tunneling is unresolvable and the splittings due to the flip are larger than the range scanned experimentally (3 cm-1). 122 The observation of a symmetric top spectrum in the experiment 122 makes us confident that the flip mechanism is feasible and leads to the observed vibration- ally averaged structure. Tunneling splittings due to both the flip and the bifurcation may have been detected for (H20)5 in the latest experiments. 128
8. WATER HEXAMER
On the basis of an isotope mixture test Liu et al. 129 have assigned a VRT band of (H20)6 at 83 cm -l. In contrast to (H20)3, (H20)4, and (H20)5 the lowest energy minimum of the hexamer is probably not cyclic, and the four lowest energy isomers reported by Tsai and Jordan 13~ are separated by only about 100 cm -1. The most accurate ab initio calculations performed to date suggest that a "cage" structure lies lowest, followed closely by "prism" and "book" forms (see Figure 10). TM To assign

Rearrangements of Water Clusters 389
Figure 10. Cage, prism, and book forms of (H20)6.
the experimental spectrum to a particular structure DMC calculations were con- ducted to find the predicted vibrationally averaged rotational constants; the cage isomer was found to match best. 129
In fact there are various isomers with different hydrogen-bonding patterns for all three of the structures illustrated in Figure 10, and with so many isomers lying so close in energy it is not clear why only one of them has been observed experimen- tally. It may be that only one particular isomer absorbs in the range so far scanned, or that the temperature of the clusters in the beam is low enough for one structure to dominate. The spectrum is described as "near-prolate" by Liu et al.129 who have also suggested that the VRT transition in question corresponds to a torsional motion of one of the single-donor, single-acceptor monomers. It is noteworthy that even full vibrational averaging over these degrees of freedom would not result in a prolate symmetric top spectrum for the cage. Experimentally, each line is split into a triplet with equal spacings of 1.92 MHz and intensities in the ratio 9:6:1.129 Liu et al. have also suggested an explanation for this splitting pattern which has been explored in more detail by Wales 69 who considered rearrangements of the cage isomer of (H20)6 and (D20)6 for the ASP-2W 51 and TIP4P 53 potentials. The cage isomer is not the lowest in energy for either of these potentials, although zero-point energy effects could change the relative ordering in this system. 129
In the ASP-W2 calculations the induction energy was not iterated to convergence since this process is time-consuming and made no qualitative difference in previous studies of the water pentamer.40 Furthermore, the independent study of the hexamer by Gregory and Clary, described in this volume, 132 is in complete agreement with the present work, and includes additional ab initio geometry optimizations. Hence the remaining paragraphs will focus on aspects of the splitting pattern and additional two-dimensional vibrational calculations to avoid duplicating descriptions of these results. The four lowest energy isomers of the cage structure, which differ only in the conformation of the free hydrogens at the two single-donor, single-acceptor monomers, are illustrated in Figure 11. No degenerate rearrangements were located for these isomers, labeled C1 to C4, but pathways corresponding to both single flip and bifurcation processes have been characterized (see Table 2 and Figures 12 and

390 DAVID J. WALES
Figure 11. Isomers of the cage structure for (H20)6 calculated using the ASP-W2 potential with binding energies in cm -1 .
Table 2. Rearrangement Mechanisms which Interconvert Cage Isomers of (H20)6 Calculated with the ASP-W2 Potential a
Min 1 A 1 TS A 2 Min 2 S D y Description
C1 560 -15,428 508 C2 2.8 2.1 13.7 single flip C1 641 -15,347 589 C2 2.9 2.2 7.6 bifurcation C1 323 -15,664 251 C3 1.7 1.3 15.4 single flip C1 1,1 35 -14,853 1063 C3 3.2 2.1 8.5 bifurcation C2 325 -15,612 285 C4 1.7 1.3 16.2 single flip C2 1,058 -14,878 1018 C4 3.4 2.1 8.6 bifurcation C3 524 -15,391 506 C4 2.7 2.0 14.1 single flip C3 650 -15,266 631 C4 2.7 2.2 7.9 bifurcation
Note: a'l'he energies are in cm -1 . Min 1 is the lower mininum, A 1 is the higher barrier, TS is the transition state and A 2 is the smaller barrier corresponding to the higher minimum Min 2. S is the integrated path length in t~, and 7 is the cooperativity index. All these quantities are defined in Section 3.

Rearrangements of Water Clusters 391
Figure 12. Single-flip mechanism which interconverts C1 and C2 for the ASP-W2 potential.
sions: four for each cage isomer C1-C2. It is noteworthy that the single-flip mechanisms are the most localized and have the shortest paths, as indicated by the parameters ~', S, and D (see Section 3).
The resulting effective MS group can be found in this case by considering the effective generators for combinations of flip and bifurcation processes which together result in a permutation of the same structure. 133 The resulting group contains four elements and is isomorphic to C2v .69 The four versions are connected in a cyclic reaction graph so that the simplest HOckel n-treatment gives a splitting pattern equivalent to that of the re-system in cyclobutadiene,
213(A1), 0(A 2, B1), -213(B 2)
where the symmetry labels are appropriate for a particular correspondence between the PI's and the elements of C2v .69 The accidental degeneracy of the A 2 and B l states would be broken at higher resolution because the 13 matrix elements connecting the four versions of each isomer are all slightly different. The relative nuclear spin weights for rovibronic states are 9:3:3:1 for (H20)6 and 4:2:2:1 for (D20) 6 corre- sponding to A l :A2:B1 :B2. If the accidental degeneracy is unresolved then the relative

392 DAVID J. WALES
Figure 13. Bifurcation mechanism which interconverts CI and C2 for the ASP-W2 potential.
intensities of the three triplet components would be 9:6:1 for (H20)6 and 4:4:1 for (D20)6. This result is equivalent to that obtained by Liu et al. 129 who considered hypothetical direct degenerate rearrangements. If the present model is correct then similar splitting patterns are expected for all four cage isomers C1-C4. The same analysis can also be applied to another set of four cage isomers which lie rather higher in energy. 69 These higher energy cage isomers are described in more detail by Gregory and Clary. 132
For the TIP4P potential 53 there are only two cage isomers rather than four because one of the single-donor, single-acceptor monomers (the one with two double-donor neighbors) has only one torsional state while the other still has two, as for ASP-2W above. In this case there is a direct degenerate rearrangement corresponding to permutation of the hydrogens attached to the monomer with only one torsional minimum; the various pathways are described in Table 3 where the two cage minima are labeled C 1' and C2'. There are sufficient connections to produce the same triplet splitting pattern described for the ASP-2W potential, so either topology could explain the experimental results.
Two-dimensional DVR calculations were conducted for the torsional motions of the two single-donor, single-acceptor monomers using both the ASP-2W and TIP4P

Rearrangements o f Water Clusters 39 3
Table 3. Rearrangement Mechanisms which Interconvert Cage Isomers of (H20) 6 Calculated with the TIP4P Potential a
Min 1 A 1 75 A 2 Min 2 S D y Description
C1' (-16,533) 14 -16,519 2 C1' (-16,533) 825 -15,708 813 C1' (-16,533) 1361 -15,172 1361
C2' (-16,521) 1.3 1.2 14.1 single flip C2'(-16,521) 3.6 2.2 8.6 bifurcation C1"(-16,533) 4.5 2.2 8.7 bifurcation
Note: a-i'he energies are in cm -1. Min 1 is the lower minimum, A 1 is the higher barrier, TS is the transition state, and A 2 is the smaller barrier corresponding to the higher minimum Min 2. 5 is the integrated path length in ,~, D is the displacement betwen minima in/~, and y is the cooperativity index. All these quantities are defined in Section 3.
potentials and the same framework as outlined for the trimer in Section 5. 69 The
relaxation of all the other water molecules is therefore neglected in this model. The wavefunctions for the TIP4P potential were all found to be delocalized over both
the torsional degrees of freedom, and can be classified according to the number of nodes as a function of the two torsional angles. For the ASP-W2 potential, the three lowest energy wavefunctions are localized in the wells corresponding to the C1, C2, and C3 isomers, but the fourth, seventh, and eighth functions are delocalized over two isomers in each case. 69 The localized nature of the ASP-W2 ground state agrees with the DMC calculation of Gregory and Clary,132 which includes all the
intermolecular degrees of freedom for a very similar empirical potential. It is not possible to assign the experimental transitions on the basis of such simplistic models, but the fact that both empirical potentials exhibit some delocalization between cage isomers is probably significant, and suggests that vibrational averag- ing over the torsional motions may occur, especially in excited vibrational states.
This appears to be in agreement with the experimental observation of a near-prolate top spectrum. 129 Since the ASP-W2 potential is probably more realistic than the
TIP4P model the present results indicate that the experimentally observed tunneling splittings in transitions from the ground state may be due primarily to delocalization of the vibrational excited states.
ACKNOWLEDGMENTS
The author gratefully acknowledges discussions with Prof. Z. Ba/~i~:, Prof. D. C. Clary, Dr J. K. Gregory, Prof. R. J. Saykally, Dr. A. J. Stone and Ms T. R. Walsh and financial support from the Royal Society of London and the EPSRC.
REFERENCES 1. Buckingham, A. D.; Fowler, E; Stone, A. J. Int. Rev. Phys. Chem. 1986, 5, 107. 2. Nelson, D. D.; Fraser, G. T.; Klemperer, W. Science 1987, 238, 1670. 3. Maitland, G. C.; Rigby, M.; Smith, E. B.; Wakeham, W. A. Intermolecular Forces; Clarendon
Press: Oxford, 1981.
394 DAVID J. WALES
4. Cohen, R. C.; Saykally, R. J. Annu. Rev. Phys. Chem. 1991, 42, 369. 5. Hutson, J. M. Annu. Rev. Phys. Chem. 1990, 41, 123. 6. Stone, A. J. The Theory oflntermolecular Forces; Oxford University Press: Oxford, 1996. 7. Koehler, J. E. H.; Saenger, W.; Lesyng, B. J. Comput. Chem. 1987, 8, 1090. 8. Hermansson, K. J. Cheat Phys. 1988, 89, 2149. 9. Chalasifaski, G.; Szcz~.~,niak, M. M.; Cieplak, P.; Scheiner, S. J. Cheat Phys. 1991, 94, 2873.
10. Xanthezs, S. S. J. Cheat Phys. 1994, 100, 7523. 11. Elrod, M. J.; Saykally, R. J. Cheat Rev. 1994, 94, 1975. 12. Gregory, J. K.; Clary, D. C. J. Cheat Phys. 1995, 103, 8924. 13. Ohmine, I. J. Phys. Chem. 1995, 99, 6767. 14. Honegger, E.; Leutwyler, S. J. Cheat Phys. 1988, 88, 2582. 15. Knochenmuss, R.; Leutwyler, S. J. Cheat Phys. 1992, 96, 5233. 16. Xantheas, S. S.; Dunning, T. H. J. Cheat Phys. 1993, 99, 8774. 17. Cohen, R. C.; Saykally, R. J. J. Phys. Chem. 1990, 94, 7991. 18. Pugliano, N.; Saykally, R. J. J. Cheat Phys. 1992, 96, 1832. 19. Saykally, R. J.; Blake, G. A. Science 1993, 259, 1570. 20. Liu, K.; Cruzan, J. D.; Saykally, R. J. Science 1996, 271,929. 21. Dyke, T. R. J. Cheat Phys. 1977, 66, 492.
Dyke, T. R.; Mack, K. M.; Muenter, J. S. J. Cheat Phys. 1977, 66, 498. 22. Wales, D. J. Science 1996, 271,925. 23. Bone, R. G. A.; Rowlands, T. W.; Handy, N. C.; Stone, A. J. Molec. Phys. 1991, 72, 33. 24. Dennison, D. M." Hardy, J. D. Phys. Rev. 1932, 39, 938. 25. Bell, R. P. The Tunnel Effect in Chemistry; Chapman and Hall: New York, 1980. 26. Leone, R. E.; Schleyer, P. v. R. Angew. Cheat Int. Ed. Engl. 1970, 9, 860. 27. Nourse, J. G. J. Amer. Cheat Soc. 1980, 102, 4883. 28. Murrell, J. N.; Laidler, K. J. J. Cheat Soc., Faraday Trans. 1968, 64, 371. 29. Longuet-Higgins, H. C. Mol. Phys. 1963, 6, 445. 30. Berry, R. S. Rev. Mod. Phys. 1960, 32,447. 31. Hougen, J. T. J. Cheat Phys. 1962, 37, 1433. 32. Hougen, J. T. J. Cheat Phys. 1962, 39, 358. 33. Hougen, J. T. J. Phys. Chem. 1986, 90, 562. 34. Bunker, P. R. Molecular Symmetry and Spectroscopy; Academic Press: New York, 1970. 35. Watson, J. K. G. Canad. J. Phys. 1965, 43, 1996. 36. Kolbuszewski, M.' Bunker, P. R. J. Cheat Phys. 1996, 105, 3649. 37. Wales, D. J. J. Amer Cheat Soc. 1993, 115, 11191. 38. Cerjan, C. J.; Miller, W. H. J. Cheat Phys. 1981, 75, 2800; Simons, J.; JCrgenson, P.; Taylor, H.;
Ozment, J. J. Phys. Chem. 1983, 87, 2745; O'Neal, D.; Taylor, H.; Simons, J. J. Phys. Chem. 1984, 88, 1510; Banerjee, A.; Adams, N.; Simons, J.; Shepard, R. J. Phys. Chem. 1985, 89, 52; Baker, J. J. Comput. Chem. 1986, 7, 385; Baker, J. J. Comput. Chem. 1987, 8, 563.
39. Wales, D. J. J. Cheat Phys. 1994, 101, 3750. 40. Wales, D. J.; Walsh, T. R. J. Cheat Phys. 1996, 105, 6957. 41. Amos, R. D.; Rice, J. E. CADPAC: The Cambridge Analytic Derivatives Package, Issue 4.0;
Cambridge, 1987. 42. Banerjee, A.; Adams, N. P. Int. J. Quant. Chem. 1992, 43, 855. 43. Walsh, T. R.; Wales, D. J. J. Chem. Soc., Faraday Trans. 1996, 92, 2505. 44. Popelier, P. L. A." Stone, A. J.; Wales, D. J. J. Cheat Soc., Faraday Discuss. 1994, 97, 243. 45. Wales, D. J.; Popellier, P. L. A.; Stone, A. J. J. Cheat Phys. 1995, 102, 5556. 46. Wales, D. J.; Stone, A. J.; Popelier, P. L. A. Cheat Phys. Lett. 1995, 240, 89. 47. Stone, A. J. Cheat Phys. Lett. 19111, 83, 233. 48. Stone, A. J.; Alderton, M. Mol. Phys. 1985, 56, 1047. 49. Stone, A. J. Mol. Phys. 19115, 56, 1065.

Rearr.~,}gements of Water Clusters 395
50. Le Sueur, C. R.; Stone, A. J. Mol. Phys. 1993, 78, 1267. 51. MiUot, C.; Stone, A. J. Mol. Phys. 1992, 77, 439. 52. Jorgensen, W. L. J. Am. Chem. Soc. 1981, 103, 335. 53. Jorgensen, W. L.; Chandraesekhar, J.; Madura, J. W.; Impey, R. W.; Klein, M. L. J. Chem. Phys.
1983, 79, 926. 54. Dunning, T. H. J. Chem. Phys. 1970, 53, 2823. 55. Huzinaga, S. J. J. Chem. Phys. 1965, 47, 1293. 56. Fowler, J. E.; Schaefer, H. E J. Amer. Chem. Soc. 1995, 117, 446. 57. Mr C.; Plesset, M. S. Phys. Rev. 1934, 46, 618. 58. Parr, R. G.; Yang, W. Density Functional Theory ofAtoms and Molecules; Oxford University Press:
London, 1989. 59. Becke, A. D. Phys. Rev. A 1988, 38, 3098. 60. Lee, C.; Yang, W.; Parr, R. G. Phys. Rev. B 1988, 37, 785. 61. E H. Stillinger and T. A. Weber Phys. Rev. A 1983, 28, 2408. 62. Fraser, G. T. Int. Rev. Phys. Chem. 1991, 10, 189. 63. Scheiner, S. Annu. Rev. Phys. Chem. 1994, 45, 23. 64. Pugliano, N.; Cruzan, J. D.; Loeser, J. G.; Saykally, R. J. J. Chem. Phys. 1993, 98, 6600. 65. Hougen, J. T. J. Mol. Spectr. 1985, 114, 395. 66. Coudert, L. H.; Hougen, J. T. J. Mol. Spectr. 1988, 130, 86. 67. Coudert, L. H.; Hougen, J. T. J. Mol. Spectr. 1990, 139, 259. 68. Smith, B. J.; Swanton, D. J.; Pople, J. A.; Schaefer, H. E; Radom, L. J. Chem. Phys. 1990, 92,
1240. 69. Wales, D. J. In Theory of Atomic and Molecular Clusters--2; Jellinek, J., Ed.; Springer-Verlag:
Berlin. In press. 70. Boys, S. E; Bemardi, E Mol. Phys. 1970, 19, 553. 71. Xantheas, S. S. J. Chem. Phys. 1996, 104, 8821. 72. Odutola, J. A.; Dyke, T. R. J. Chem. Phys. 1980, 72, 5062. 73. Tsuboi, M.; Hirakawa, A. Y.; Ino, T; Sasaki, Y.; Tamagake, K. J. Chem. Phys. 1964, 41, 2721. 74. Mathematica 2.0; Wolfram Research Inc., Champaign, IL, 1989. 75. Zwart, E.; ter Muelen, J. J.; Meerts, W. L.; Coudert, W. H. J. Mol. Spectrosc. 1991, 147, 27. 76. Althorpe, S. C.; Clary, D. C. J. Chem. Phys. 1994, 101, 3603. 77. Coulson, C. A.; Rushbrooke, S. Proc. Camb. Phil. Soc. 1940, 36, 193. 78. Pugliano, N.; Saykally, R. J. Science 1992, 257, 1937. 79. Del Bene, J." Pople, J. A. J. Chem. Phys. 1973, 58, 3605. 80. Vernon, M. E; Krajnovich, D. J.; Kwok, H. S.; Lisy, J. M.; Shen, Y. R.; Lee, Y. T. J. Chem. Phys.
1982, 77, 47. 81. M6, O.; Y~fiez, M.; Elguero, J. J. Chem. Phys. 1992, 97, 9. 82. van Duijneveldt, F. B.; de G.-den Hartogh, M.; van Duijneveldt-van de Rijdt, J. G. C. M. Croat.
Chem. Acta 1992, 65, 1. 83. van Duijneveldt-van de Rijdt, J. G. C. M.; van Duijneveldt, F. B. Chem. Phys. 1993, 175, 271. 84. Xantheas, S. S.; Dunning, T. H. J. Chem. Phys. 1993, 98, 8037. 85. Xantheas, S. S. J. Chem. Phys. 1995, 102, 4505. 86. Schtitz, M.; BUrgi, T.; Leutwyler, S.; Btirgi, H. B. J. Chem. Phys. 1993, 99, 5228.
SchUtz, M.; BUrgi, T.; Leutwyler, S.; BUrgi, H. B. J. Chem. Phys. 1994, 100, 1780. 87. Owicki, J. C.; Shipman, L. L.; Scheraga, H. A. J. Phys. Chem. 1975, 79, 1794. 88. Wales, D. J. J. Amer. Chem. Soc. 1993, 115, 11180. 89. Klopper, W.; SchUtz, M.; Liithi, H. P.; Leutwyler, S. J. Chem. Phys. 1995, 103, 1085. 90. BUrgi, T.; Graf, S.; Leutwyler, S.; Klopper, W. J. Chem. Phys. 1995, 103, 1077. 91. van Duijneveldt-van de Rijdt, J. G. C. M.; van Duijneveldt, E B. Chem. Phys. Lett. 1995, 237,
560. 92. Suzuki, S.; Blake, G. A. Chem. Phys. Lett. 1994, 229, 499.

396 DAVID J. WALES
93. Liu, K.; Loeser, J. G.; Elrod, M. J.; Host, B. C.; Rzepiela, J. A.; Pugliano, N.; Saykally, R. J. J. Amer. Chem. Soc. 1994, 116, 3507.
94. Liu, K.; Elrod, M. J., Loeser, J. G." Cruzan, J. D." Brown, M." Saykally, R. J. Faraday Discuss. Chem. Soc. 1994, 97, 35.
95. Balasubramanian, K.; Dyke, T. R. J. Phys. Chem. 1984, 88, 4688. 96. van der Avoird, A.; Olthof, E. H. T.; Wormer, E E. S. J. Chem. Phys. 1996, 105, 8034. Olthof, E.
H. T.; van der Avoird, A.; Wormer, E E. S.; Liu, K; Saykally, R. J. J. Chem. Phys. 1996, 105, 8051. 97. Xantheas, S. S.; Sutcliffe, B. T. J. Chem. Phys. 1995, 103, 8022. 98. Ba~i~:, Z.; Light,,J. C. Annu. Rev. Phys. Chem. 1989, 40, 469. 99. Klopper, W.; Sch0tz, M. Chem. Phys. Lett. 1995, 237, 536.
100. Sabo, D.; BaSiC, Z." B0rgi, T.; Leutwyler, S. Chem. Phys. Lett. 1995, 244, 283. 101. Sabo, D.; BaSiC, Z.; Btirgi, T.; Leutwyler, S. Chem. Phys. Lett. 1996, 261,318. 102. Anderson, J. B. J. Chem. Phys. 1975, 63, 1499. 103. Gregory, J. K.; Clary, D. C. J. Chem. Phys. 1995, 102, 7817. 104. Gregory, J. K.; Clary, D. C. J. Chem. Phys. 1996, 105, 6626. 105. Wales, D. J.; Walsh, T. R. J. Chem. Phys. 1997, 106, 7193. 106. Colbert, D. T.; Miller, W. H. J. Chem. Phys. 1992, 96, 1982. 107. Cruzan, J. D.; Braly, L. B.; Liu, K.; Brown, M. G.; Loeser, J. G.; Saykally, R. J. Science 1996,
271,59. 108. Cruzan, J. D.; Brown, M. G.; Liu, K.; Braly, L. B.; Saykally, R. J. J. Chem. Phys. 1996,105, 6634. 109. Del Bene, J., Pople, J. A. J. Chem. Phys. 1970, 52, 4858. 110. Lentz, B. R.; Scheraga, H. A. J. Chem. Phys. 1973, 58, 5296. 111. Kistenmacher, H.; Lie, G. C.; Popkie, H." Clementi, E. J. Chem. Phys. 1974, 61,546. 112. Kim, K. S.; Dupuis, M.; Lie, G. C.; Clementi, E. Chem. Phys. Lett. 1986, 131,451. 113. Schr6der, K. P. Chem. Phys. 1988, 123, 91. 114. Herndon, W. C.; Radhakfishnan, T. P. Chem. Phys. Lett. 1988, 148, 492. 115. Tsai, C. J.; Jordan, K. D. J. Phys. Chem. 1993, 97, 11227. 116. Laasonen, K.; Parrinello, M.; Car, R.; Lee, C.; Vanderbilt, D. Chem. Phys. Len. 1993, 207, 208. 117. Lee, C.; Chen, H.; Fitzgerald, G. J. Chem. Phys. 1995, 102, 1266. 118. Estrin, D. A.; Paglieri, L.; Corongiu, G.; Clementi, E. J. Phys. Chem. 1996, 100, 8701. 119. SchUtz, M.; Klopper, W.; Luthi, H. P.; Leutwyler, S. J. Chem. Phys. 1995, 103, 6114. 120. Engkvist, O.; Forsberg, N.; Sch0tz, M.; Karlstrtim, G. Mol. Phys. 1997, 90, 277. 121. Liu, K.; Brown, M. G.; Viant, M. R.; Cruzan, J. D.; Saykally, R. J. Mol. Phys. 1996, 89, 1373. 122. Liu, K.; Brown, M. G.; Cruzan, J. D.; Saykally, R. J. Science 1996, 271, 62. 123. Plummer, P. L. M.; Chen, T. S. J. Chem. Phys. 1987, 86, 7149. 124. Bosma, W. B.; Fried, L. E.; Mukamel, S. J. Chem. Phys. 1993, 98, 4413. 125. Burke, L. A.; Jensen, J. O.; Jensen, J. L." Krishnan, P. N. Chem. Phys. Lett. 1993, 206, 293. 126. Krishnan, P. N.; Jensen, J. O.; Burke, L. A. Chem. Phys. Lett. 1994, 217, 311. 127. Gregory, J. K.; Clary, D. C. J. Phys. Chem. 1996, I00, 18014. 128. Saykal!y, R. J. Personal communication. 129. Liu, K.; Brown, M. G.; Carter, C.; Saykally, R. J.; Gregory, J. K.; Clary, D. C. Nature 1996, 381,
501. 130. Tsai, C. J.; Jordan, K. D. Chem. Phys. Lett. 1993, 213, 181. 131. Kim, K.; Jordan, K. D.; Zwier, T. S.J. Amer. Chem. Soc. 1994, 116, 11568. 132. Gregory, J. K.; Clary, D. C. In the present volume, Sorenson, J. M.; Gregory, J. K.; Clary, D. C. J.
Phys. Chem. A. 1997, 101, 6013. 133. Dalton, B. J.; Nicholson, P. D. Int. J. Quantum Chem. 1975, 9, 325.

SPECTROSCOPY AND MICROSCOPIC THEORY OF DOPED HELIUM CLUSTERS
K. B. Whaley
Abstract . . . . . . . . . . . . . . . . . . . . . . . . . . . . . . . . . . . . . 398 1. Introduction . . . . . . . . . . . . . . . . . . . . . . . . . . . . . . . . . . . 398
2. Experimental Studies of Doped Helium Clusters . . . . . . . . . . . . . . . . 401 2.1. Infrared Spectroscopy . . . . . . . . . . . . . . . . . . . . . . . . . . 402 2.2. Electronic Spectroscopy . . . . . . . . . . . . . . . . . . . . . . . . . 407 2.3. Scattering and Ionization Studies . . . . . . . . . . . . . . . . . . . . . 411
3. Microscopic Theoretical Methods" Monte Carlo Algorithms . . . . . . . . . . 412 3.1. Variational Monte Carlo . . . . . . . . . . . . . . . . . . . . . . . . . 413 3.2. Diffusion Monte Carlo . . . . . . . . . . . . . . . . . . . . . . . . . . 419 3.3. Path Integral Monte Carlo . . . . . . . . . . . . . . . . . . . . . . . . 424
4. Structural Studies . . . . . . . . . . . . . . . . . . . . . . . . . . . . . . . . 426 4.1. Pure HeN . . . . . . . . . . . . . . . . . . . . . . . . . . . . . . . . . 426
4.2. Atomic and Molecular Doped HeN . . . . . . . . . . . . . . . . . . . . 427
4.3. Related Quantum Clusters-Doped (HE)N . . . . . . . . . . . . . . . . . 435 5. Dopant Spectroscopy Calculations . . . . . . . . . . . . . . . . . . . . . . . 436
5.1. Infrared Spectra of Molecules in HeN . . . . . . . . . . . . . . . . . . 436
Advances in Molecular Vibrations and Collision Dynamics, Volume 3, pages 397-451. Copyright �9 1998 by JAI Press Inc. All rights of reproduction in any form reserved. ISBN: 1.55938.790-4
397

398 K.B. WHALEY
5.2. Electronic Spectroscopy of Atoms in HeN and (H2)N . . . . . . . . . . . 441 5.3. Electronic Spectroscopy of Molecules in HeN . . . . . . . . . . . . . . 443
6. Summary . . . . . . . . . . . . . . . . . . . . . . . . . . . . . . . . . . . . . 444 Acknowledgments . . . . . . . . . . . . . . . . . . . . . . . . . . . . . . . . 444 References . . . . . . . . . . . . . . . . . . . . . . . . . . . . . . . . . . . . 445
ABSTRACT
In recent years helium clusters have been shown to provide a gentle, low-temperature, quantum matrix environment with considerable use for performing spectroscopic measurements on a variety of atomic, molecular, and complexed species. They have also demonstrated a significant potential for synthesis of clusters and weakly bound complexes, via controlled pick-up processes within a cluster beam. Doped helium clusters are thus of increasing interest to the chemistry community. These experimen- tal advances have been accompanied by a growing number of microscopic theoretical calculations, based on quantum Monte Carlo methods, which aim to ascertain the role of the underlying quantum mechanical behavior of the helium in the cluster and dopant properties. This review summarizes the experimental advances and measure- ments made on doped helium clusters, together with the microscopic theoretical methods and calculations. The focus here is on dopant spectroscopy for atoms, molecules, and complexes, and on developing an understanding of how this is affected by the quantum cluster environment. Studies of pure HeN and the related quantum clusters of molecular hydrogen, (H2)N are also discussed briefly to provide points of reference.
1. INTRODUCTION
In many regards, clusters of helium atoms constitute the extreme quantum mechani- cal limit of van der Waals clusters. They possess the weakest van der Waals binding energy per particle as a result of the very weak He-He pair potential and their behavior at all sizes is dominated by both quantum delocalization and exchange effects. The very smallest clusters, He N, N = 2 and 3 which are the analogues of the extensively studied dimeric and trimeric van der Waals clusters, are barely bound and are diffuse in the extreme, with sizes of order 50-100/~.l Free helium clusters as made in molecular beam expansions range from these "huge" diffuse clusters to much more dense aggregates o f -106 atoms. Bulk helium solidifies only under application of pressures above 25 atmospheres, so that these clusters which exist at internal pressures of one atmosphere and less, and temperatures of less than one degree Kelvin, are definitely liquid-like. Furthermore, because of their extreme delocalization they can be regarded as microscopic droplets of quantum liquid whose behavior is dominated by zero-point fluctuations, coherence phenomena, and collective excitations, rather than a classical liquid characterized by thermal fluctuations and random motions. Their quantum character gives rise to an array of
Dopant Spectroscopy in Helium Clusters 399
unusual and fascinating low-temperature behavior which has become a subject of increasing experimental and theoretical study in recent years.
Both the physics and, increasingly, the chemistry community are interested in these unique weakly bound quantum clusters. As finite size analogues of bulk liquid helium, they have been predicted to show superfluid behavior and characteristic collective excitations, 2,3 i.e. measurable manifestations of quantum statistical ef- fects. For physicists, the way in which these properties depend upon size, and their modification in a finite system, are of key interest. Theoretical analysis offers here the opportunity to develop new understanding into the microscopic origins, inter- relation, and consequences of both superfluid and Bose condensate behavior. From a chemical point of view, since it was recently shown following early studies of atomic scattering by helium cluster beams, 4--6 that free helium clusters readily "pick-up" foreign species, 7-9 the usefulness of these as a cold and gentle matrix serving both spectroscopic and synthetic purposes has become evident from a rapidly increasing number of experimental studies of atoms, molecules, and clusters in He N .
The study of doped helium clusters has therefore rapidly developed into a key area of study for quantum van der Waals clusters. Introducing atomic and molecular dopants allows on the one hand an indirect probe of the quantum liquid behavior while the unusual quantum solvation of the impurity offers new possibilities for trapping and interrogation of weakly bound and metastable species, for preparation and spectroscopic analysis of cold clusters, as well as for the spectroscopy of large molecules. It also holds out the promise of exploring the use of quantum clusters for the study of reactive species and for control of elementary reaction dynamics in ultracold matrices possessing extremely efficient heat transfer mechanisms.
Using an impurity species to probe the properties of the quantum liquid cluster has a parallel in the study of impurities in bulk liquid helium. Early studies in bulk focused primarily on ionic mobilities for the intrinsic species He +, He~ lo, and e- 11, and also for foreign ions. 12 Such mobility measurements have yielded valuable insight into both the scattering of elementary excitations and the quantum hydro- dynamic properties of the superfluid. 12-14 Ionic motion was shown early on to be a source of quantized vortex rings, 15 and negative ion trapping at vortices 16 led to the direct observation of vortex lines. 17'18 Ions have continued to be important probes of vorticity. 19 Most notably, studies of negative ion mobility under pressure allowed the demonstration and measurement of the Landau critical velocity for roton creation. 2~ Spectroscopic studies were initially limited by difficulties in dissolving sufficient quantities of foreign species, although emission spectra of N 2 and 0 2 impurities 21 and of He 2 22 were already detected in the 1960s, with the latter showing unresolved rotational structure accompanying slightly blue-shifted vibra- tional transitions. A subsequent study resolved this fine structure for He 2 and showed that in this case the rotations are apparently decoupled from the liquid, retaining the gas-phase rotational constants and showing a much higher statistical temperature. 23

400 K.B. WHALEY
Development of novel ion implantation techniques in the 1980s led to new spectroscopic possibilities. Recombination emission of N and O was seen following implantation of ions from plasma discharges in Gordon's group in 1981. 24 Plasma discharges were combined with laser vaporization to introduce metal ions by Dupont-Roc and coworkers in 1985. 25 At the same time, the Heidelberg group developed an ion source based on Penning ionization of thermally evaporated metal atoms. 26 Combining these sources with accelerating gates in the liquid allowed introduction of high density clouds of atomic ions on which laser spectroscopy could be performed. 25-27 The first spectroscopic measurements made on metal ions were fluorescence studies of Ba+. 25-27 These showed broad lines slightly blue- shifted from the gas-phase positions and were interpreted in terms of the bubble model developed previously for electrons and He*. 27 The Heidelberg group then used recombination with electrons to yield high densities of neutral atoms. 2s More recently, the laser ablation technique has provided a general procedure to disperse neutral foreign species into liquid helium. 29'3~ These methods have opened the way to systematic emission and excitation spectroscopy studies of impurities in bulk helium. Most of these have been performed in the liquid phase, but some high-pressure studies in the solid have also been made. 31A variety of such measurements have now been made, for metal atoms, 32-36 ions, 27'37'38 and most recently also of diatomic metal species which are probably formed by recombination. 39'4~ So far, however, no organic molecules have been successfully implanted into liquid helium. In this context therefore, the pick-up of atoms and molecules of all types into helium clusters can be viewed as providing an alternative route for bypassing the traditional problem of achieving spontaneous dissolution of impurities into the quantum liquid, and of achieving the impurity densities necessary for spectroscopic interrogation. A recent review by Takami surveys the advances in the spectroscopy of atoms and molecules in the bulk, and provides a useful complement to the present review. 41
This chapter is primarily concerned with the microscopic theoretical description of doped helium clusters and with the spectroscopic analysis of their properties. To date most attention has focused on clusters of 4He, the bosonic isotope (nuclear spin zero) rather than on the fermionic isotope 3He (nuclear spin 1/2). This is because, by analogue with the bulk phases, any superfluid or other macroscopic manifesta- tions of quantum coherences will be attainable at higher and thus more easily accessible temperatures (the bulk superfluid transition temperature T x is 2.17 K for 4He compared to --2 mK for 3He). This review will therefore concentrate on dopants in 4HEN, making only passing reference to the corresponding fermionic systems. There are several key issues for theory, which can be separated to a only a limited extent. First, how the dopant affects the quantum liquid properties and the coupling between dopant and cluster excitations. Second, how the quantum environment affects the dopant dynamics and spectroscopy. In order to exemplify these issues, Section 2 first gives a summary of experimental studies of doped helium clusters.

Dopant Spectroscopy in Helium Clusters 401
A description of theoretical methods for microscopic calculations follows in Section 3 and the progress to date is summarized in Sections 4 and 5.
2. EXPERIMENTAL STUDIES OF DOPED HELIUM CLUSTERS
The first beam of free helium clusters was produced in 1961, 42 following the original suggestion of Becker that scattering of atoms from these might be used to observe superfluidity in HeN .43 Subsequent experiments by Becker, Gspann, and coworkers 4-6'44'45 focused on the scattering of atoms and molecules from clusters and demonstrated that large clusters (N ~ 104-10 8) could be deflected by both atomic and molecular beams. 5,6 Estimates of cluster drag coefficients made from such atomic deflection experiments were lower than expected for complete mo- mentum flux transfer and suggested that the impinging species might penetrate the cluster, 6'46 although it was unclear whether they would be absorbed or would reemerge ("droplet transparency"44). Electron-impact studies led to electronically excited metastable clusters and mass spectrometric analysis of droplet size and velocity. 47 Smaller clusters were also being studied with mass spectrometry to determine (ionized) cluster size distributions. 4s'49 The Toennies group in Gtittingen used excitation spectra for metastable clusters to show that impurity gases (N 2 and O2) were indeed absorbed by the helium clusters. 5~ This was followed by a series of experiments employing mass spectrometric analysis which showed conclusively that the free helium clusters can not only readily pick-up a variety of atomic and molecular species, s'9'5~ but also that clustering of these within the He N can be made to occur in a controlled fashion. 52 Small angle (mrad) single-collision deflection measurements enabled the size distribution of neutral clusters to be measured. 53 This allowed the calibration of size dependence on nozzle temperatures and stagnation pressures, which is now routinely used to measure average sizes of neutral clusters in most experiments with doped HeN .54 A significant breakthrough in probing the quantum cluster behavior then came when Scoles and coworkers at Princeton showed in 1992 that one can employ spectroscopic methods for interro- gation of the impurity species attached or embedded by a pick-up collision, 55 with the first infrared absorption measurements on a molecular dopant, SF6 .56 Since then a number of infrared studies of rovibrational spectra of embedded molecules have been made, as well as several measurements of electronic spectra of atoms and molecules. These now constitute the majority of the rapidly growing number of experiments on these systems, and are summarized below.
Most of the spectroscopic experiments on doped helium clusters made to date ostensibly measure absorption, although some dispersed fluorescence emission measurements have also been made. 57-59 It is important to bear in mind the detection method when interpreting the experimental spectra. All infrared measurements, and some electronic spectroscopy measurements, are made by measuring the depletion of the cluster beam depletion (BD) in the forward direction after absorption of a

402 K.B. WHALEY
photon. The depletion is usually extracted from mass spectrometric analysis. Bolometric and hot wire detection techniques have also been used. Interpretation of a beam depletion spectrum as the dopant absorption spectrum relies on the assumption that after absorption the dopant releases its energy to the helium cluster, which results in one or more possible processes causing the cluster signal measured in the forward scattering direction to be reduced. For embedded species, the most important process contributing to this is evaporation of He atoms, leading to a reduction in the size of the cluster as well as to a recoil-induced broadening of the beam profile. For surface attached species, desorption of the dopant itself is also significant. Beam depletion measures only processes in which energy transfer to the cluster is involved (and is therefore insensitive to resonant fluorescence). In contrast, electronic spectra measured by laser-induced fluorescence (LIF) of the dopant reflect only that fraction of absorption which is followed by processes involving by radiative decay. Time resolution of the LIF signal can however provide indirect information on the contributions of nonradiative quenching processes, via their effect on the time dependence of the radiative decay. 59
2.1. Infrared Spectroscopy
The first spectroscopic measurement on a dopant species was made for SF 6, for which the v 3 vibration was probed. 56'6~ Resolved rotational fine structure of this vibration have since been observed in both 4He clusters 62'63 and in low-purity 3He clusters. 64 With commercially available 3He, the latter necessarily contain a small percentage of 4He (~0.1%), which amounts to about 50 4He atoms for N = 45,000, and which is significant for quantitative analysis of the spectra. The high-resolution spectra are characterized by very narrow line widths (240-280 MHz, or 0.008- 0.010 cm -l 63--65). There is no evidence of the heterogeneous broadening common for impurities probed by conventional matrix isolation spectroscopy. 66 In particular, there is no splitting of the vibrational degeneracy, which implies that octahedral symmetry is preserved around the SF6 ,67 unlike the situation for SF 6 in matrices formed by the heavier rare gases. 68-71 If the homogeneous width is assumed due primarily to population relaxation, this implies a lower bound of-525 ps for the excited-state lifetime. The vibrational band origin displays only a small red shift from the gas-phase value (~ -1.5 cm-l), which is qualitatively understood in terms of the small polarizability of helium (see discussion below and in Section 5). This shift can be made to vary, depending on the proportion of 4He/3He in the cluster. 64 A most striking experimental feature of these rotational spectra is that they are very well fit by empirical Hamiltonians of the same symmetry as the free molecule, but with modified rotational and centrifugal distortion constants, B (~l/3B 0) and D (~104D0). Within the resolution of the experiment, no splitting of the rotational sub-bands deriving from given J state is apparent, which would otherwise suggest a more obviously hindered rotor. Thus the empirical view that results is of a freely rotating SF~rHe M entity of spherical top symmetry, with M - 6-8. In the isotopically

Dopant Spectroscopy in Helium Clusters 403
mixed clusters the 4He component preferentially migrates to the dopant because of its heavier mass and consequent stronger binding, resulting in an identical rotational spectrum. 64 Experiments with greater purity 3He (10-6% 4He)72 are discussed below. From the intensities of the high-resolution spectrum, the temperature of the clusters can be determined as T-- 0.38 K for 4HeN 64 and T - 0.15 K for 3H%v,64 in agreement with the predictions reached from classical evaporation theory. 73
Larger dopant clusters of virtually any composition can be made relatively easily by varying the pressure in the pick-up chamber. 52 These first spectroscopic studies of SF6He s were therefore followed by infrared studies of dimers and higher clusters of SF6 ,61'74 as well as by complexes of SF 6 with heavier rare gases inside helium clusters. 75 With the exception of SF6-Ne, the SF 6 absorption now shows a splitting into parallel and perpendicular bands. These spectra are only partially rotationally resolved, but the band contours can all be reasonable well fit to similar empirical models with rigidly attached He atoms which retain the symmetry of the gas phase complex. The fitted linewidth is also quite narrow (0.015 cm-l). SF6-Ne is a revealing exception: the single absorption peak profile can be fit assuming a partial delocalization of the Ne around the SF 6, suggesting that this is a considerably more "floppy" complex. 65'75
In a recent high-resolution study, the infrared spectroscopy of the linear molecule OCS has been measured in 4HEN. 72'76 This shows similarly narrow linewidths (150-600 MHz, i.e. 0.005-0.02 cm-1). Analysis of the rotational fine structure for the v 3 asymmetric band also allows an empirical fit by the model of a rigidly rotating molecule retaining the gas-phase symmetry, but again with a considerably reduced rotational constant (B -- 1/3 B0) and with increased centrifugal distortion constant D (D ~ 103 Do). The vibrational frequency also shows a relatively small red shift of ~ -0.56 cm -1. An interesting additional feature seen for OCS but absent (or not resolvable) for SF 6, is that the linewidths increase with J, implying an additional J-dependent coupling to the cluster. The origin of this coupling is currently not clear, although one possibility is a coupling to the relative orbital angular momen- tum associated with the pick-up collision. Rotationally resolved spectra have also been measured for NH3He N 77,78 and a few rotational lines have been measured for H20 in HeN. 79 For NH 3 the rotational constant is decreased by 24%, a significantly smaller reduction than for the heavier molecules, SF 6 and OCS. In this instance it is not possible to explain the required increase in moment of inertia by any empirical model of rigidly attached He atoms, s~ The umbrella mode shows a blue shift of 17.2 cm -1, and the inversion splitting is reduced by -30% in the vibrational ground state and by -67% in the first excited vibrational state. The blue shift indicates that the effect of the helium on the umbrella mode is more complex than on stretching modes, involving the short-range part of the interaction in addition to the long-range terms. This is also reflected by the magnitude of the shift, which is remarkably large relative to the red shifts characteristic of stretching modes. The reduction of the inversion splitting is qualitatively also understandable in terms of hindrance by the surrounding helium. Less rotational data are available for H20, but it appears that

404 K.B. WHALEY
the rotational constants are changed very little from their gas-phase values in this c a s e . 79 For both OCS and NH 3 where sufficient data exist to estimate a temperature, the same value of T - 0.4 K was obtained as with SF 6. Another example of a light dopant is provided by HF. 81 Here the rotational levels are sufficiently widely spaced that only one rotational level is populated in the helium clusters, giving rise to only one observable transition, R(0). Thus it was not possible to extract the effective rotational constant from experiment in this case. However, microscopic calcula- tions, based on an accurate He-HF interaction potential (see below) which were able to reproduce the vibrational red shift of 2.64 cm -1 with high accuracy, showed that the HF behaves as a nearly free rotor, leading to the conclusion that the rotational constant is most likely unperturbed. 8~
Table 1 summarizes the experimental results for molecular rotations in 4HeN obtained for isolated molecules to date. The glyoxal results are obtained from fine structure of the electronic spectrum, discussed below. It is remarkable that all of these spectra can be fit by empirical free rotor Hamiltonians, with the major difference from the gas-phase spectra being the decreased rotational constants. Any splitting of the rotational sub-bands due to lowering of the symmetry in the helium environment is less than the current resolution, i.e. 0.003 cm-1. 72 The increasing percent change in rotational constants evident with the increase in molecular moment of inertia implies that the efficiency of rotational coupling between a molecular dopant and the helium environment is strongly dependent on the mass differential, or alternatively, on the frequency of rotation. In simple terms this is qualitatively understandable in terms of the higher rotational energy levels of the lighter dopant. These may lie above the angular barriers in the interaction potential, particularly when the zero-point motion in the dopant-helium coordinates is high, so that the dopant acts effectively as a true free rotor. 8~
Table 1. Molecular Rotations in HeN a
Molecule Bo (cm -1) B in He N
HF 20.56 free rotor, = B o (theory) b H20 27.8, 14.5, 9.3 - free rotor, B - Bo c NH 3 9.94 B = 76% Bo d (Cl iO) 2 1.8, O. 16, O. 14 B ~ 33-50% Bo e OCS 0.20 B = 33% Bo f
SF 6 0.091 B = 33% Bog
Notes: aB o are the gas-phase rotational constants. bRef. 81. CRef. 79. dRef. 77, 78. eRef. 65. fRef. 65, 76. gRef. 64.

Dopant Spectroscopy in Helium Clusters 405
The situation summarized in Table 1 is quite different from that in both conven- tional cryogenic matrices and classical liquids. In conventional matrices, rotations are typically either frozen out or strongly hindered, 66's2 with a few exceptions for small molecules in highly symmetric sites. 83-86 In classical liquids, generally rotational envelopes with no resolvable fine structure are seen. s7 The lack of rotational structure is usually interpreted in terms of solute rotational and orienta- tional relaxation arising from randomizing collisions with solvent atoms within less than one rotational period, resulting in diffusive behavior, as's9 However discrete rotational lines in liquid solutions can be seen for diatomics with large rotational energy level spacings, in particular for H 2 and isotopic analogues in a variety of solvents where virtually free rotation is found, 9~ and for hydrogen halides in liquid SF6 .92-94 The rotational lines in the latter show J-dependent shifts from the corresponding gas-phase positions, 93 indicative of some rotational hindrance. These discrete rotational spectra in liquids have been explained within a fluctuating liquid cage model which retains a quantum description of the rotating solute s7'95-97 and which can therefore be regarded to some extent as a dynamical generalization 95 of the rotation-translation model for hindered rotation in matrices, s2's3 Which of the two theoretical interpretations is more appropriate in a given instance depends both on the rotational constants and on the liquid density. 96'9s
Key questions which arise from Table 1 are then: Why for the heavier molecules whose rotational levels lie well below the angular barriers and have small spacings is the rotational motion also empirically consistent with a freely rotating entity having identical molecular symmetry but heavier mass? Why does the hindrance of the dopant rotation not cause greater perturbation of the rotational spectrum, as in the conventional matrices 66's2 and classical liquids discussed above? Quantitative analysis of these rotational spectra requires analysis of the quantum nature of the surrounding helium, in particular the role of superfluidity in this, and constitutes a major challenge for theory (see Section 5). A central issue here is whether the observed empirical free rotation with reduced B value is a consequence merely of the extremely weak interactions with the helium, or whether the superfluid nature of the helium is essential for this. Very recently, new experimental insight was achieved with the measurement of the infrared absorption spectrum for OCS in ultrapure 3HeN (10-6% SHe, i.e., less than one 4He atom in a cluster of 12,000) at 0.15 K. 72 Here, in contrast to the situation in pure 4HeN or in mixed 3HejaHeN clusters, a single broad spectral feature is observed with no rotational fine structure. Such behavior is characteristic of rotation in a classical solvent, as discussed above, and is consistent with the fact that the 3He clusters are not superfluid at these temperatures. This key experimental result suggests that superfluidity is essential for the observation of rotational structure corresponding empirically to free rota- tion. It would be interesting to extend these measurements to the fermionic superfluid, 3He. Unfortunately prospects for achieving the mK temperatures nec- essary for experimental investigation of superfluid 3HeN currently appear small.

406 K.B. WHALEY
Infrared measurements have also been made on a number of other small mole- cules and complexes. 65'77'79'81'99-1~ Huisken and coworkers have measured O-H
and H-F vibrational frequency shifts in a number of hydrogen-bonded complexes and their corresponding monomers in HeN .81'99'1~176176 The rotational structure is not resolved in these experiments. Comparison with the corresponding vibrational shifts in heavier matrices (rare gases, D 2 and N2) show that the helium cluster shifts follow the usual correlation with ~T-~-c, where T c is the critical temperature of the matrix entity. 99 This is consistent with the predominant contribution to the vibra- tional shifts for high-frequency stretch modes being due to the dipolar and disper- sive interactions: the attractive nature of these therefore always results in a red shift, which is relatively small in He N because of the low polarizability of helium. Bending modes and large amplitude motions such as the umbrella mode in NH 3 (see above), or the more complex bending modes in larger organic molecules (see below) also involve repulsive contributions and may give blue shifts as a result. The vibrational shifts measured for molecular dopants in He N to date are summarized in Table 2. The correlation between stretches and red shifts, and between larger amplitude motions and blue shifts is evident.
Table 2. Molecular Vibrations in HeN a Molecule Mode z~v (cm -1) in He N
HF bond stretch -2.64 b H20 asymmetric stretch, v 3 -( I .5-2.5) c H-bonded complexes O-H, H-F stretches Av o~ -q'~c d SF 6 cage vibration, v 3 - I .41 e OCS asymmetric stretch, v I -0 .56 f (NH3) 2 acceptor umbrella mode, v I ~ 0 g
donor umbrella mode, v 2 ~ - 9 g pentacene "butterfly" bend +8 h NH 3 umbrella mode, v 2 +17.4 i (CHO) 2 S 1 torsion, v 7 +4.6J
$1 CCO bend, v s +0.1J S 1 CH wag, v 8 +0.9 j
Notes: aT c is the critical temperature of helium. bRef. 81. CRef. 79. dRef. 99. eRef. 63. fRef. 65, 76. gRef. 101. hRef. 65. iRef. 77, 78. JRef. 104. iRef. 77, 78. JRef. 104.

Dopant Spectroscopy in Helium Clusters 407
One important issue for clusters is that while it is relatively easy to make these "clusters within a cluster" by multiple pick-ups, it is difficult to cleanly size separate these, so that subsequent mass spectrometric analysis may be complicated by fragmentation of larger clusters. 79'1~176 Knowledge of the free, gas-phase dopant spectra can assist in deconvoluting the cluster spectra and is therefore extremely useful here. Careful pressure analysis also helps. Often the cluster spectra are very similar, and are merely cleaner as a result of the lower temperature provided by the liquid helium environment. This is the case with acetonitrile complexes. 1~ For some hydrogen-bonded complexes, significant differences between gas-phase and cluster spectra are found, indicating different structures in the two environments. Thus methanol complexes larger than the trimer appear to favor chain structures in helium clusters, rather than the ring structures seen in the gas-phase. 1~ The ammonia dimer is an interesting instance in which striking similarities as well as differences appear, indicating a generally similar structure, but with some subtle differences. 1~ The gas-phase structure of (NH3) 2 is dominated by large amplitude motions, including an interchange tunneling, and the averaged equilibrium struc- ture is intermediate between a cyclic and a linear hydrogen-bonded structure. The cluster spectrum shows strong quenching of the interchange tunneling, but no shift of either vibrational frequencies or the inversion tunneling of the two NH 3 units. The quenching of the interchange motion by helium is not surprising, and indicates that the dimer structure is more localized than in the gas-phase, with detailed analysis showing a preference for the "cyclic" structure in which the lone pairs on the N atoms are approximately antiparallel, l~ However, in its lack of vibrational shifts the (NH3) 2 behavior is quite unique and differs strongly from the monomer (see above). The helium cluster "nanomatrix" can also allow study of complexes for which the gas-phase spectrum is inaccessible. This is the case with the formic acid dimer which is too strongly bound to predissociate upon absorption of an infrared photon, so that the gas-phase dimer cannot be seen in a beam depletion experiment. However, embedding the dimer in He N allows the absorption energy to be dissipated to the surrounding helium, causing evaporation which now leads to the desired beam depletion. 1~176
2.2. Electronic Spectroscopy
Infrared spectroscopy has so far yielded primarily information relating to the perturbation of the dopant energy levels by the quantum environment. To probe the excitations of the quantum environment electronic spectroscopy has proven more useful. 58'65'1~176 Electronic excitations of molecules which cause a relatively mild change in molecular geometry can allow the coupling to phonon-type excitations of the cluster to be accessed. These can be detected as phonon wings on vibronic lines, as in conventional matrix isolation spectroscopy. 1~ The distinction between a sharp zero phonon line (ZPL) and a broader adjacent band was first seen for doped He N in the spectrum of surface attached Na 2 (see below). 1~ That the wings are

408 K.B. WHALEY
indeed due to phonons was demonstrated recently for glyoxal embedded in Heir, where such wings are seen both on the 0 ~ electronic band origin and on other vibrational bands of the S O ~ S l excitation. The phonon wing is separated from the zero phonon line (ZPL) by a gap 1~ and is distinguishable from the rotational fine structure of the ZPL. Such a gap is not seen in the corresponding spectrum in a solid argon matrix, t lo The rotational fine structure has not yet been completely resolved, but preliminary empirical free rotor spectral fits give a 33-50% reduction in rotational constants. 65 The phonon wing structure for glyoxal in He N has been successfully interpreted in terms of a one-phonon excitation of compressional modes in a quantum liquid using the displaced harmonic oscillator Huang-Rhys theory for impurities in solid matrices, together with the spectrum of elementary excitations in bulk (superfluid) liquid helium. The roton and maxon regions in this elementary excitation spectrum provide extrema in the density of states which can persist as peaks in the phonon wing structure. Analysis of the glyoxal phonon wing showed a peak at the roton energy. 1~ While this may not be as convincing as directly demonstrating a state of superfluid flow in the Heir, this demonstration of the consistency of the excitation spectrum with the elementary excitations associated with superfluid helium is the first experimental indication that free helium clusters may indeed be superfluid, as theory has predicted. 2'3'111
More complex phonon structure which may allow analysis of vibrational (pho- non) excitations in solvation layers around the dopant has been found in larger, asymmetric dopants such as pentacene, porphine, and phthalocyanine. 65'1~ In contrast, the spectrum of C60 inside He N is to all appearances unchanged from the gas-phase spectrum, 1~ with much smaller shifts than the planar organic species, suggesting that in this case there may be less coupling of the electronic excitation with the helium environment. To understand just when and how the phonon sideband structure appears, one needs more detailed information on the interaction of these dopants in their electronic excited states with helium. Furthermore, the internal vibrational modes of these larger organic molecules also show a more complex behavior than the smaller species. Glyoxal, tetracene, and pentacene all show small blue shifts (<_8 cm -1) for some vibrational modes, which appears to be associated with large amplitude motion and consequent repulsive interaction con- tribution to the shift.
While still preliminary and incomplete in terms of their interpretation and understanding, it is already clear that these spectroscopic studies, including the series of increasingly large organic molecules, dramatically demonstrates the significant potential of helium clusters to provide cold, inert matrix-like environ- ments. In this respect, helium clusters provide several advantages over the conventional cryogenic matrices used for matrix isolation spectroscopy. 1~ The absence of heterogeneous broadening, observation of unusually weakly hindered (or empirically-"free") rotation for molecules as large as SF 6 and glyoxal, and consistently narrow linewidths are all useful advantages for performing high-reso- lution spectroscopy on large molecules. However dopant spectroscopy in Heir can

Dopant Spectroscopy in Helium Clusters 409
also be seen as inheriting certain features of conventional matrix spectroscopy which should assist our understanding of dopant interaction with the quantum environment in He N . Thus we have seen that the trends in vibrational shifts measured to date are generally understandable within the trends observed in solid matrices, 66 while the observation of phonon wing structures also has parallels in matrices. 1~ Furthermore, since virtually any foreign species is picked up by helium clusters, it also offers a route to study of extremely weakly bound species and of metastables, in parallel with the original use of conventional matrices as an isolation device for unstable species. 113
The use of He N as a vehicle for forming and interrogating such weakly bound species has been demonstrated in a series of experiments involving pick-up of alkali atoms by HeN .57'58'1~ The alkali-He interaction is weaker than the He-He interaction itself. As a result, alkali metal species are attached to the surface of HeN 118 rather than embedded inside the cluster as is the case with the inorganic and organic molecules studied so far. Multiple spin states of the multimeric species are readily formed on the surface since no mechanism to induce spin changes is present. In fact, the high-spin states appear in LIF spectra at significantly higher relative intensities than expected on statistical grounds, which is interpreted in terms of the greater energy dissipation and hence evaporation of the more strongly bound low-spin states. 57 These techniques have allowed study of several metastable spin states which are otherwise difficult to access, e.g. Na 2 in the triplet state (bound by
14 57 115 174 cm -1 only) l and Na 3 in its lowest quartet state. ' Analysis of Na 2 shows small vibrational shifts (2.4 cm -1 for the singlet, 4.8 cm -1 for the triplet) and virtually no change in rotational constants. This is consistent with the picture of a surface-attached species which undergoes rapid desorption. In bulk He II vibrational shifts of order 1000 cm -l are seen for Na 2 and no rotational structure is evident because of extreme line broadening. 39'4~ Each dimer line of the surface-attached species also shows sideband structure, which may contain infor- mation on coupling to surface and internal compressional modes, analogous to the phonon wings observed in the electronic spectra of molecules. 65'1~ Thus helium clusters also offer the interesting scenario of providing a route to synthesis of weakly bound complexes, via surface attachment. In a related experiment, Scheide- mann and coworkers have analyzed the ionization of surface bound species formed in pick-up of Li by He N and demonstrated that weakly bound ionic complexes such as HeLi § can be formed by a Penning ionization mechanism, lIT
While the extremely weak interaction of these surface attached complexes appears to allow a very clean interpretation in terms of the corresponding gas-phase spectra, several interesting open questions remain. One is that the rotational fine structure of the surface-desorbed species measured in LIF do not allow a unique rotational temperature to be assigned, TM unlike the infrared spectra of embedded molecules discussed above. Furthermore, the width of the (phonon) sidebands differs for the singlet and triplet species (-80 cm -l for the singlet, -30 cm -1 for the triplet). TM This was interpreted as implying a smaller coupling of the triplet

410 K.B. WHALEY
molecule to the helium surface, although the relative magnitude of the vibrational shifts (see above and refs. 114, 116) might suggest the inverse. Theoretical analysis of these sidebands, and their spin-dependent widths, would be very interesting since the surface attached species may be expected to couple primarily to surface excitations (ripplons), rather than to the interior compressional modes. Further- more, the surface is expected on theoretical grounds to have a significant enhance- ment of the Bose Einstein condensate fraction, nearly 100% compared to only 10% in the bulk. 119'120
The electronic spectra of atoms attached to or embedded in helium clusters are also increasingly objects of study. Here there are a number of bulk reference experiments, which are however all characterized by broad linewidths due to efficient coupling of the valence electrons with surface modes of the surrounding bubble-like configuration of helium. 31,33,36,121-124 These bulk studies typically show blue shifts due to the primarily repulsive interaction of the excited states. M611er et al. have studied the electronic excitations of rare gas atoms in He N using synchrotron radiation and luminescence detection. 125 Here the atomic lines are also systemati- cally blue-shifted, but are accompanied by broad bands whose origin is unclear. Broad structures due to strong coupling are avoided for surface-attached alkali atoms. In bulk helium, alkali atoms are so heavily quenched that no fluorescence can be detected. However, on helium clusters the alkalis show very asymmetric fluorescence excitation spectra, consisting of weakly shifted doublets (with spin orbit structure for K) with very long blue tails and a small red-shifted tail. 5g Analysis in terms of a static model allowed the spectra to be qualitatively understood in terms of bound-bound and bound-continuum transitions in a one-dimensional effective alkali-cluster potential. With this distinction, a combination of dispersed fluores- cence and excitation spectroscopy has been used to obtain an experimental estimate of the binding energy of Na on the surface, while time resolution of the emission measurements has indicated formation of an He*-Na exciplex. 59 For these alkali species on He N , the absorption spectra obtained from beam depletion measurements are similar, unlike the case on (H2) N where the two methods of detection give significantly different spectra. 126 This indicates that on He N quenching of the electronically excited state is negligible.
Heavier metal atoms are more strongly bound to helium, and are therefore more easily solvated. Motivated by the desire to avoid the line broadening typical for atoms in bulk liquid helium, Toennies' group first implanted europium atoms and showed that the inner shell 4f --~ 5d excitations remain sharp, although there is a significant amount of additional broad structure relative to the gas-phase spectrum which is not yet understood. 127 Implantation of solvated metal atoms has been further exploited by the Toennies group to make clusters of metal atoms in HeN. 128 To date, formation of clusters of Ag and of In with up to --20 atoms has been demonstrated, the size being currently limited purely by detection. Formation of such metal clusters opens the way to an exciting new set of investigations for metal clusters in an ultracold environment, including reactivity studies. For theory, these

Dopant Spectroscopy in Helium Clusters 411
cold metal clusters present a considerable challenge since the complexities of the metal cluster states further compounds the difficulties of dealing with the coupling to the helium environment.
2.3. Scattering and Ionization Studies
In addition to the recent spectroscopic studies for doped He N , more experimental effort has also continued to go into cluster scattering and ionization measurements. Single-collision measurements of scattering deflection angles indicate that momen- tum transfer from incident atoms and molecules to the cluster from incident atoms and molecules is indeed complete. 53 Integral scattering cross sections for nonpolar atoms and molecules appear to be independent of the nature of the impinging particle and are essentially given by the classical value Oclass = 7tR2' where R N is the cluster radius. 52'129 The pickup process itself has been studied recently in consid- erable detail, with measurement of capture, coagulation, and evaporative loss cross sections, and sticking coefficients for a variety of atoms and molecules. 117'13~ The "pick-up" capture and coagulation cross sections are generally less than total cross sections 52 and are dependent on the mass and dipolar character of the incident species. 13~ Several experimental investigations into ionization of and charge trans- fer in doped He clusters have been made using mass spectrometric methods in conjunction with cluster beams. 117'131-133 The stability of charged RgHe~v ions has previously been studied with drift tube techniques. TM Electron attachment has been used to form negatively charged clusters He~,. 135-137 The stability of these states in external electric fields suggests that the excess electron is located in the cluster interior within a bubble, as in the bulk, 14 rather than in a surface state. 136 Such electron bubble states provide an interesting and potentially useful impurity probe of the helium cluster, despite their high intrinsic metastability. They are expected to have optical spectra in the infrared, as in the bulk. 138'139 Photodetachment studies of these bubble states have been made, 14~ and recently their lifetimes in large clusters (N ~ 105-10 7) have been measured with a deflection technique. 137 Both detachment and the explicit lifetime measurements yield ms lifetimes, which are vastly smaller than expected from tunneling of the electron bubble to the surface. 136 Finally, a few dynamical studies of doped clusters have also been initiated. Thus vibrational predissociation rates have been measured for very small cluster sizes, including both neutral (CI 2 141) and ionized (N~ 142) dopants.
In all of the cluster beam studies, the interrogation of the dopant is performed within the flight time of the cluster, i.e. on a ms time scale. Thus it is not necessary that the dopant be soluble in helium in a thermodynamic sense. The attractiveness of this facile mode of trapping virtually any species in a nanoscale cold and inert environment has prompted an increasing number of experimental groups to face the technical challenges of this type of cluster beam experimentation. It is apparent from the above rapidly growing set of examples that one can use helium clusters not only to obtain cold molecules of arbitrary size, but also to form cold clusters of

412 K.B. WHALEY
molecular, atomic, and metallic species. In some of the cases described above, this allowed formation or interrogation of complexes which are otherwise difficult to form (formic acid dimer, Na2). This clearly holds a lot of promise for general cluster science, in addition to the demonstrated potential for high-resolution spectroscopy of large molecules.
0 MICROSCOPIC THEORETICAL METHODS: MONTE CARLO ALGORITHMS
Microscopic calculations of doped helium clusters start with a potential model, (usually additive) masses, and in some cases trial wave functions or their equivalent. All particles are treated quantum mechanically, and the aim is to provide as complete a description as possible so that the role of quantum effects, both delocalization and exchange, may be accurately assessed. They are to be distin- guished from the quasi-classical 143'144 and density functional 145-147 approaches.
The latter has proven quite useful in recent years since with relatively little effort one can go to larger sizes than are feasible to study with the quantum Monte Carlo methods described here, and for many properties they can give similar results to the microscopic calculations. However the focus of this review will be limited to the microscopic calculations which are less restricted by phenomenological input, and are thus better suited to test fundamental concepts of quantum scaling and detailed many-body effects. It is important to emphasize the role of the interaction potential in such microscopic studies. Since we are dealing with weakly bound systems, these are generally difficult to obtain from ab initio calculations and one relies heavily on empirical potentials, calibrated when possible by scattering and transport measurements. Since one is looking often at small effects, the importance of having an accurate potential cannot be overemphasized. This currently provides one of the major barriers to more rapid progress on the theoretical side for these systems. An interesting development here is the introduction of neural nets for fitting high-dimensional ab initio potentials for efficient use in quantum Monte Carlo calculations. 148
Theoretical studies of these systems can be divided into zero-temperature and finite-temperature studies. For both situations quantum Monte Carlo methods provide an optimal microscopic approach. At zero temperature, which implies analysis of ground states, variational and diffusion Monte Carlo methods are used, while at finite temperature path integral Monte Carlo methods are used. The latter necessarily yields thermal averages. If individual excited states are required, these are best sought after with modifications of the T = 0 Monte Carlo methods. In this section we summarize the basic algorithms and technical details for each of these Monte Carlo methods as applied to doped quantum clusters.

Dopant Spectroscopy in Helium Clusters 413
3.1. Variational Monte Carlo
This constitutes the simplest microscopic approach, both conceptually and technically. It amounts to the variational optimization of a trial wave function ~'T(R) by the iterative Monte Carlo evaluation of the ground-state energy inte- gral:149,150
<E) : f q~* (R)h(R)q.'(R)dR/f q~~ (R)q.'(R)dR
M (1)
= M-I Z EL (R/) i=I
A Here E L (I~.) denotes the local energy ~P(R)-'H(R)~P(R) evaluated at a configuration I~., and M is the total number of sampled configurations. A configuration l~. is a 3N+N'-dimensional vector specifying the position of the N He atoms and the N' coordinates of the dopant species. The latter may include rotation and vibration in addition to translation. A general Monte Carlo walk consists of a Markov chain of configurations R~. with a rule for transition probabilities between them. For Eq. l to be valid, the set of R~. must be sampled from the probability distribution function P(Ri) = ILP(I~.)I2/~IW(R)I2dR.
Sampling of the probability distribution is achieved with the Metropolis Monte Carlo algorithm. 151 This specifies a stochastic walk through the configuration space, with a transition probability for steps which ensures detailed balance. In the simplest Metropolis formulation a uniform transition probability density is sam- pled, i.e. a proposed step from R to R" is randomly selected within a hyper-cube of side A, where the step size A is chosen so that -50% of the moves are accepted. The new configuration R' is then accepted with probability"
W(R,)I2/ (2) A(R, R') = min 1, rt,(R)12 |
J
This transition probability rule, based on a sampled probability density and an acceptance criterion, correctly drives the system to the desired equilibrium distri- bution, P(R). Eq. 2 constitutes an "unguided" Metropolis walk which attempts to move uniformly through configuration space. Greater efficiency is sometimes achieved by using a guiding function to choose the attempted moves, 152 resulting in a generalized Metropolis walk. In a generalized Metropolis walk 15~ one samples a nonuniform transition density T(R ---> R') and detailed balance is then maintained by modifying the acceptance probability, Eq. 2 to:
T(R' ---> R)Iq~(R')I 1) (3) A g : ( R , R ' ) = m i n I, T - ~ - - ~ ~ )

414 K.B. WHALEY
A useful transition density is provided by the Green's function for the Fokker- Planck equation derived from transforming the time-dependent Schrrdinger equa- tion for a guiding function Wg.150 This results in a diffusion through configuration space which is biased by the behavior of Wg, and asymptotically samples IWgl 2. Thus, expectation values such as Eq. 1 must incorporate a reweighting factor,
i -1 "-
t o ensure that the average is computed over I~12. Introduction of such a bias in the sampling procedure is referred to as importance sampling and is very important in diffusion Monte Carlo (see below).
Variational optimization of the wavefunction W is usually performed by minimi- zation of the energy, of the variance, or of a combination of the two. Further constraints can be added, e.g. to ensure orthogonalization. 153 Automated parameter optimization, e.g. using conjugate gradient techniques, is possible. However opti- mization of parameters specific to the dopant species by hand, i.e. by sequential scanning of the parameter space, is generally adequate.
One of the main reasons for using a Monte Carlo method to describe the nuclear motion in a helium cluster is the ability to deal with many body wavefunctions which accurately describe the strong correlations induced by the highly repulsive nature of the He-He interaction potential, but which are not analytically integrable. The beneficial scaling of a Monte Carlo integration scheme is an additional motivation. Both conventional basis set methods and the more novel spectral decomposition methods based on time-dependent techniques scale exponentially with the number of degrees of freedom. This will always be true when the Hilbert space is represented in a direct product fashion, whether with a basis or grid representation, and thus limits such approaches to small systems (N < 6). In contrast, Monte Carlo methods scale as a polynomial of N, typically with N 3 for up to several hundred particles. (The precise value of the exponent depends on how small the absolute error is allowed to be.) An alternative polynomial scaling approach would be provided by mean field methods, but these are inadequate for accurate treatment of the combination of strong inter particle correlations and extreme delocalization, as is a normal mode analysis.
The trial wave functions employed for doped helium clusters are typically of the form:
~IJ = H Z (}~', Rx) H xll(rij ) (5) i~ He i<j~. He
Here ~l(rij ) describes the He-He correlations, and ~1/(1~., R x) the correlations be- tween the helium atoms and the dopant species. This factorization is optimal for

Dopant Spectroscopy in Helium Clusters 415
liquid-like clusters. For more structured clusters, such as the molecular quantum clusters (H2) N, the use of shadow wavefunctions to enhance possible emergence of structured density profiles has been investigated. 154'155 The He-He factor can be readily adapted from the very accurate exponentially correlated basis functions which have been developed for bulk liquid He over the last 20 years. 156 A very flexible form is given by, 152
exp{-t 2 (rij)} (6)
5
t2 (rij) = Z ckrT, J ~ + b In rij + ar~ k=l
which may be simplified to, e.g.,
(7)
t2(ru) = CSr~ 5 + c2r~ 2 + b In rij + arij (8)
still retaining high accuracy, or further to,
t2(r/j ) = csrTq5 + arij (9)
if less accuracy is required. Equation 9 retains the essential physics" the parameter a (a < 0) controls the long-range part designed to ensure self-binding, and the parameter c 5 controls the short range part dealing with the hard-core repulsion between He atoms. The term exp(-csr~f ) is the original Jastrow form proposed by McMillan for bulk He modeled with a Lennard-Jones interaction, 157 where it allows the 1/r 12 singularities in the local energy to be eliminated (cusp condition). 1~ Barnett and Whaley have explored the use of alternative short-range terms tailored to the more accurate Hartree-Fock plus dispersion (HFD) forms of the He-He interaction potential. 152 For larger clusters, three-particle He -He-He correlations can be included, as for pure HeN .158 However when the dopant-He binding energy is greater than the He-He binding, this is generally less significant than in He N . For this reason, and also because of the computational overhead associated with three-body terms they have not yet been incorporated in any doped cluster calcu- lations. Some groups also prefer to eliminate the long-range part of t2(rij ) and to enforce self-binding instead through an additional quasi-single particle factor such as,
v(Ru) = exp(-c(l~. - Rc,,) 2) (10)
which requires evaluation of an N-particle term, 159 or via a simple Fermi term. 158'16~ The He-dopant factor in Eq. 6 refers to a single dopant. Hoos and Lewerenz have
used a multi-configuration factor x(rix) --) )(,(rix ) + X(rix ) to describe the wave- function for two separated rare gas impurity atomsain a helium cluster. 161 The dopant internal degrees of freedom can be explicitly correlated with the He atoms, or

416 K.B. WHALEY
factored out but still parameterized. For example, for a molecular dopant with rotational degrees of freedom, one could employ,
Rx) = a, f3, y) (11)
or,
Z(l~., R x) = O(r/x)q~(a, 13, Y) (12)
where O(r~) is a function of the distance between the center of mass of the dopant Z and each helium atom i, and the angles et, [3, and y are the Euler angles expressing the dopant orientation relative to a laboratory fixed flame. For isotropic dopant-He interactions, as with rare gases or ground-state alkali atoms, O(r~x) is the only factor, and consequently this has been most extensively investigated to date. One can, of course, employ the same functional form for O(rix) as for ~t(rq). This is quite appropriate when Lennard-Jones interactions are employed. Barnett modified Eq. 7 to match a one-dimensional Morse oscillator function at small distances in order to achieve good trial functions for systems such as SF 6 and CI 2, which have Morse type repulsive interactions with He67:
O(ro) = exp(--exp(y- cry) + b In ror ar~) (13)
To date, relatively few studies incorporating anisotropic interactions have been made. In the first of these, SF 6 in He N, Barnett and Whaley presented a very simple philosophy to build accurate anisotropic trial functions which is based on azoncept of response to the potential. 67 This is to construct Eq. 11 from an isotropic function such as Eq. 13 by incorporating angular-dependent terms possessing the same symmetry as the interaction potential, which cause the wavefunction to decrease when the potential increases, and vice versa. For SF6He ~ this was achieved by making the modifications y --~ ~r2K(O, q~) - ~/, and b --> b' + y"r2K('O, q~), where K(O, r is defined in terms of the tensor harmonies incorporated in the symmetry- decomposed interaction potential. A similar approach was used for anisotropic calculations on C12He ~ 162 and FHetr sl In all of these examples, the long-range term, represented in Eq. 13 by a~ , was made isotropic, justified by the relatively short range of the potential anisotropy. The use ofEq. 11 is well suited to this overall philosophy of wavefunction response to the interaction potential. When the rota- tional kinetic energy is included, however, in particular when considering excited states (within the fixed node approximation, sex below), Eq. 12 becomes more attractive since it allows the possibility of systematically modifying the free rotor functions which are the eigenfunctions of kinetic energy for molecular dopants. The use of such trial functions, as well as generalized combinations of Eqs. 11 and 12 have yet to be explored.
Some groups have employed atom-atom correlation functions, i.e.,

Dopant Spectroscopy in Helium Clusters 417
K
a,a = H k=l
(14)
which does then also introduce some angular anisotropy. 163'164 This is however restricted and cannot be as easily related to the anisotropy of the interaction potential as the explicit molecular factor, Eq. 11. Vibrational degrees of freedom are generally frozen out, or treated adiabatically. The motivation for this is partly physical, partly practical. For light molecules such as HF the time scales for molecular vibrations are much higher than that of the He motions, so an adiabatic, or even frozen approximation works well. sl The same is in principle true for the v 3 mode in SF 6. However in addition it must be realized that while the anisotropy of the dopant-He interaction may be known empirically (or in a few cases, from ab initio calculations) generally very little, or nothing, is known about the dependence of the dopant-He interaction potential on the internal (molecular) vibrational degrees of freedom. In such cases, the dopant vibration can only be studied with approximate models (see below).
Choice of the trial function is dictated by both physical and computational considerations. Clearly the ease and cost of computing the local energy is important, so one seeks to use the minimum number of parameters for a given accuracy. Physically, the function must be able to describe structuring of the helium density around/near the impurity, at all distances. The above functions are typically moti- vated by obtaining good dimer wavefunctions to provide a starting set of parame- ters, and not by such many particle effects. The latter can be added post facto by first observing the extent of structure allowed by Eqs. 5-13, and then modifying ~(rij ) to accommodate this. One well-studied example of this is SF 6, a very strongly bound dopant (well depth 62 K) which induces layering of helium in at least two shells. Barnett and Whaley modified the He-He correlation factor to incorporate three-particle He--dopant-He correlations, ~(r/j, r/x, t)x ), in order to better describe this shell structure. 67 Instead of adding such effective three-particle correlations, Chin and Krotscheck improved the variational description by incorporating an additional two body term,
/ i/ Iror Cl (15) exp --0.5 L- ~/1
into ~(r/x ), with parameters c I and d I representing the position and width of the solvation shells. 165 In general, when seeking to improve trial wavefunctions for a variational calculation, it is important to also consider whether the VMC will be followed by a diffusion Monte Carlo calculation (Section 3). Since DMC can give exact results, for both energetics, and with some more effort, also for structure, if VMC will be followed by a DMC calculation it is not always necessary to obtain the highest accuracy possible in a VMC calculation. On the other hand, a good trial

418 K.B. WHALEY
function for DMC calculations employing importance sampling can considerably increase the efficiency. Thus it is useful to develop an understanding of the essential physical requirements of good trial wavefunctions even if the VMC calculation is to be used as input to a DMC calculation.
These exponentially correlated functions all automatically possess the even permutation symmetry required for description of the 4He-I = 0 boson clusters in their nuclear ground state. For the fermionic clusters of 3He such Jastrow-type correlation functions have to be multiplied by, e.g., Slater determinants of single- particle functions to give the requisite antisymmetry. To date, no microscopic studies of doped 3He clusters have been made, although pure clusters have been studied. 158'166 Nodal constraints are also introduced in excited states of the boson clusters. The energies of excited states can be calculated by Metropolis sampling over an excited state wavefunction with fixed nodes. When the nodal symmetry of an excited state is known, this can be used to make a variational optimization of excited states; i.e. one obtains the lowest excited state of a given symmetry. Such an approach has been explored for rotationally excited states of doped quantum clusters. 162 Trial wavefunctions of the form:
WLM = ~t, MWo (16)
were used, where qJo is of the same functional form as the nodeless ground state, and ~t.M is an eigenfunction of the total cluster angular momentum. The latter may be distributed over one or more components, giving rise to a large number of possible trial functions. 12~ In general, such trial functions with nonzero angular momentum can be complex, which gives rise to regions of negative probability density P(R) = [Wt.M (R)I2/J I~t'u4 (R)I 2 dR. one
/ i
Although could then sample sepa- rately within each nodal region to accumulate contributions to Eq. 1, in practice it is more convenient to make use of the fact that calculation of the energy and expectation values of operators commuting with L z can be made using only the real part of the wavefunction ~Ft. M (R). 167
For other operators, such as the current, sampling over the entire wavefunction is necessary. 12~ In these rotational studies, variational optimization was carried out only on the nodeless factor ~g 0. Such a procedure differs from the classic Feynman variational approach to excited states in which a trial ansatz such as Eq. 16 is also made, but with the stipulation that the nodeless factor be equal to the ground-state function and the excitation function is then optimized. The Feynman approach, motivated by consideration of harmonic oscillator functions, is more appropriate to collective vibrations and such variational calculations have been carried out for the compressional modes of SF6He N within the unrestricted variational approach of Krotscheck. 168 Nodal positions in excited-state trial functions without obvious symmetry can also be treated as variational parameters, as has been recently done in a direct calculation of the vibrational energy levels of CI 2 in HeN .153 Lewerenz has shown that in this case it is advisable to add a penalty factor to the minimization

Dopant Spectroscopy in Helium Clusters 419
functional which ensures that orthogonality is maintained and that the optimal nodal position remains physical.
One final, computational, point for VMC calculations concerns the way in which Metropolis moves are made for rotational motions of dopants. Translational mo- tions are easily and effectively dealt with by uniform sampling of a unit hypercube, as mentioned above. Rotational motion of nonrigid dopants is automatically ac- complished when all constituent atoms are moved independently in this fashion. Rigid body rotation of molecular dopants requires sampling of the curved rotational space. For rigid rotation of diatomic dopants Lewerenz has applied a method of adiabatic constraints in which each constituent atom is moved in Cartesian space as usual, and the resultant diatomic coordinates are then scaled to ensure that the intramolecular bond vector remains constant with the center of mass at the new position. 153'232 Direct sampling of the rotational space is outlined in the DMC context below.
3.2. Diffusion Monte Carlo
Diffusion Monte Carlo (DMC) is a stochastic Green's function method for solving the imaginary time Schrrdinger equation:
- h ---- ~(R, t)= ( H - Er)~(R, t) /)t
(17)
Written out explicitly, this is seen to be analogous to a diffusion equation with an additional first order rate term:
O. t~(R, t)= E DiV2~( R' t) + (E T - V(R))O(R, t) Ot
i
(18)
Here D i = 1~/2m i is a mass-dependent "diffusion constant" for each particle i, which derives explicitly from the translational kinetic energy. Rotational terms in H introduce additional complications, discussed below. E r is a reference energy, which is chosen to reduce the fluctuations in the rate term. DMC employs an analytic short time approximation to the Green's function for Eq. 18 to propagate an initial wavefunction ~(0) in imaginary time: 169
tl~(R, t + x) = ; dR'G(R ~ R'; x)O(R', t)dR' (19)
The method is usually employed as a relaxation method, i.e. provided that ~(0) contains some nonzero overlap with the true ground-state wavefunction, asymp- totically ~(t ---~oo) will become equal to the true ground-state wavefunction. Thus DMC is not intrinsically limited, unlike VMC. Since one is interpreting �9 as a probability density, it must either be nodeless or else the solution be constructed locally within constant nodal regions (fixed node approximation). Modifications to

420 K.B. WHALEY
lift the nodal constraint have been proposed however. 170 To effect the propagation, the first-order short-time Green's function,
~mi)3/2{ mi } J
x exp{--x(V(R) - Er) } (20)
(with h = 1) is most commonly used. An initial ensemble of configurations ("random walkers," "replicas," or "psips") is distributed according to tI~(R, t = 0). Equation 17 is then numerically implemented in a two stage process. First, the configurations diffuse in time according to the first, Gaussian, factor in Eq. 20. Each walker carries a weight (initially unity) which is then adjusted after the diffusive step to accommodate the second, growth/decay factor of Eq. 20, i.e.:
wi(t + Z) = wi(t ) exp[--x { V(I~.) - Er} ] (21)
The growth process can alternatively be controlled by branching in which each walker is replicated according to its weight, or by a combination ofreweighting and branching. 15~ The reweighting and/or branching may be accompanied by an adjust- ment of the reference energy. 17~ Anderson showed that once the asymptotic region has been reached, the ground-state energy is given by the statistical average of the
169 potential energy:
M
E o = ~_, w i V(I~.) (22)
i=1
Characteristic of this unbiased implementation of DMC is that densities are sampled from the nonphysical density distribution O(R), rather than from I~(R)I 2. Expectation values of nondifferential operators can be constructed indirectly by descendant weighting (see below) or by finite field methods. 172-174
This unbiased DMC algorithm has been used extensively by a number of groups for analysis of vibrational states of van der Waals clusters 16~ including several studies of doped quantum clusters. 177-179 In the fixed node approximation the algorithm is very simple. It is also stable: for the bounded pair potentials relevant to the nuclear motions of van der Waals clusters no problem with divergent weights is encountered. This contrasts with the situation in electronic structure calculations where the coulomb divergences cause large fluctuations in the potential energy and hence in the branching factors. 15~ Nevertheless, the absence of any sampling bias renders the algorithm overall relatively inefficient for weakly bound systems when the wavefunctions are diffuse. First, when walkers make a diffusive step out to asymptotic regions, the probability of return is so low that walkers are too easily "lost," and the cluster dissociates. Second, the branching fluctuates according to

Dopant Spectroscopy in Helium Clusters 421
variations in the potential energy V(R) which will necessarily be large when the wavefunction is delocalized with appreciable amplitude over large regions of configuration space. While these problems are not so severe for hydrogen-bonded clusters, heavier van der Waals species, or even hydrogen clusters, it becomes an acute problem for the extremely diffuse helium clusters unless these are doped by a species with relatively high binding energy, such as a charged molecule. 178 The weaker the binding energy and consequently the more diffuse the cluster, the longer the propagation times necessary in order to achieve statistical error bars which are acceptably small relative to the binding energy. The evaluation of descendant weights becomes even more demanding.
For these reasons, and for others which will become clear below, DMC calcula- tions for doped quantum clusters are best carried out with importance sampling. Here one multiplies the exact wavefunction by a guiding (trial) function ~Fr(R ) to define a new probability distribution function,
f(R, t) = ~Fr(R).(R, t) (23)
in terms of which the imaginary time Schr6dinger equation becomes a Fokker- Planck equation:
f(R, t) = E DiV~ f(R, t) - (EL(R) - Er)f(R, t) - Z DiVi" (f(R, t)FQi (R)) (24) Ot
i i
Here FQ, i (R)= V i lnl~Fr(R)l 2 is a "quantum force" which provides an additional drift contribution to the diffusion process. Propagation of f(R, t) is achieved with the importance sampling Green's function:
Gt(R --~ R', t) = ~ t (R)G(R ~ R', t)~r~r(R, t) (25)
Reynolds et al. showed that the short-time analogue of Eq. 20, with the diffusion factor modified to incorporate the addition drift term, i.e.,
G(R ---) R'; x) = I~. ~ 2n(--~33
/ 2 2
exp { - ~ x R - R ' - -~ /FQa(R)
X exp{-x(V(R) - Er) } (26)
when implemented together with an acceptance/rejection probability analogous to Eq. 4,
G(R _._> R,, x)~Fr(R,)/ A(R---) R', x)= min 1, G(R' ---> R, x)~Fr(R) '
(27)
yields a very efficient sampling. 18~ The first crucial difference between Eq. 26 and Eq. 20 is the quantum force term, FQ,i(R). This forces the random walkers to go in the direction of increasing ~F r and efficiently returns walkers which diffuse out to

422 K.B. WHALEY
regions of low binding, avoiding the problem of dissociation. Second, the rate terms are now controlled by the local energy, rather than the potential energy. The former is a much smoother function of R, resulting in considerably less statistical fluctua- tions. The closer the trial function to the true wavefunction, the more constant EL(R ) and hence the smaller the variance. In the limit that ~ r (R) = ~(R) the variance can in fact be shown to be zero. '81 Formally, Eq. 26 no longer yields a strictly first-order propagator because of the introduction of the acceptance prob- ability. Chin has developed an alternative propagator which is strictly second order. 182 The relative merits of these and other short-time propagators have been analyzed by Umrigar et al. 183
Numerical implementation of importance sampled DMC proceeds similarly as in the unbiased algorithm, with the addition of the acceptance/rejection test after each combined diffusion/branching step and the diffusive step being modified by the drift due to FQ(R). If the latter is removed, one obtains the importance sampled VMC walk referred to earlier. In the general case, the ground-state energy is then given by the average over the local energy in the asymptotic regime:
M
Eo = ~_~ w,EL(Ri) (28)
i=1
A Expectation values of all operators O(R) commuting with the Hamiltonian may be similarly obtained exactly from averages of the corresponding "local" operator
A eL(R) = ~F~I(R)O(R)~Fr(R). Matrix elements of other operators which are func- tions of position may be calculated via the method of descendant weights. 184 This accumulates the population obtained from each initial configuration 1~., with weight w i, Pdesc(l~.)= Zj/J/__ 1 wj. Asymptotically, Pdes~(l~.)t~* q)(Ri)/Wr(Ri), so that this factor may be useo to convert the mixed average obtained by direct averaging of an operator over the random walk to the exact matrix element. Thus,
f f(R>(3b(R)dR- f ~>(R)I~(R)qJr(R)dR (29)
while:
A /--Woo f A f(R)P~sc(R)O(R)dR --> ~(R)O(R),~)(R)dR (30)
In practice, since descendant weighting is rather costly, one often constructs instead second order estimates of the desired matrix elements from,
(O)2n d = 2 f f(R)(~(R)dR- f ~T(R)C~(R)~T(R)dR + O ([A~T] 2) (31)
where A~Is T = O(R) - ~Fr(R ) and the second term is the VMC average. This second- order estimate is relatively inexpensive to evaluate and comparison between the mixed and second-order values can be used as a qualitative measure of convergence.

Dopant Spectroscopy in Helium Clusters 423
For derivative operators no exact construction exists, although kinetic energy terms can be calculated via the finite field method. 174
In the fixed node approximation, the Schrrdinger equation is solved separately in each nodal region. Steps across nodal surfaces are forbidden, and the quantum force may be modified near the nodes. 167'183 The trial function for importance sampling, q~r(R) is usually taken from VMC so that it is already a fairly good representation of O(R). For doped quantum clusters, the incorporation of the dopant degrees of freedom is a prime matter of concern. Dopant translational motion is straightforward to include, as is vibrational motion of diatomics, both with and without importance sampling since these degrees of freedom can be dealt with by translational diffusion. Thus the dopant center of mass, and for diatoms each constituent atom, are moved diffusively in three Cartesian dimensions just like the He atoms, according to Eqs. 20 or 26. The only issue here is the very different imaginary time scales involved, which prompts one to use a frozen vibrations or adiabatic 81'153'178 description whenever possible.
For rigid body rotations, however, the free-particle component of the Green's functions, Eqs. 20 and 26, have to be modified. One obtains additional terms describing rotational diffusion, with angular derivative operators and prefactors dependent on the moment of inertia, e.g. d i = h2/2Ii for a spherical top. In addition, when importance sampling is employed, there will be a contribution to the quantum force from the angular derivatives. For rigid body diatomics within rotationally unbiased DMC, i.e. no rotational quantum forces, these issues can be avoided just as in VMC, by making transitional moves of all constituent atoms, followed by imposition of an adiabatic constant bond length constraint. 81'178232 More generally, but still within rotationally unbiased DMC, rigid body rotation has also been dealt with by using a product of one-dimensional short-time rotational Green's functions about the inertial axes . 164'175'176 This introduces additional short-time commutator errors since rotations about two different axes do not commute, unlike translations along the axes. As long as no rotational quantum forces are incorporated, the full three-dimensional short-time rotational Green's function 185'186 could also be used. However rotational quantum forces can only easily be derived for one-dimensional rotations, so when performing importance sampling on dopant rotational degrees of freedom it appears necessary to use a product of one-dimensional rotational Green's functions. A consistent DMC algorithm for general molecular dopants (nonsymmetric tops) which allows importance sampling of both rotational and translational degrees of freedom on an equal footing has recently been developed. 187
Another key benefit of using importance-sampled DMC is that the trial function can be designed to approximate not only ground states, but also excited states including the complex valued trial functions carrying angular momentum, Eq. 16. As in VMC, employing the real part of the trial function yields the energy and expectation values of operators commuting with L z. These excited states cannot be accessed with an unbiased DMC walk. Importance sampling thus offers a much greater flexibility, ina additon to greater efficiency.

424 K.B. WHALEY
Excited states can also be investigated directly with a newly developed algorithm based on diffusion Monte Carlo. 188 This is the projection operator imaginary time correlation function approach, a spectral evolution method (POITSE) which takes advantage of the dynamic exploration of excited states implicit in the intermediate, nonasymptotic, time regime of a diffusion Monte Carlo propagation. A key element of this approach is the use of projection operators designed to isolate particular classes of excited states. One then defines the imaginary time correlation function,
~(t) = (l[/i~A e x p [ - ( n - Ei)t/h]A+[~tli) (32)
for these projection operators, A, and then inverse Laplace transformation yields the spectral function:
K(o~) = ~ I(Vi[Al~gf)l 2 6(E i - Ef + fifo) (33) f
Equation 33 is a sum of delta functions located at the energy differences between the initial state ~gi and the final states ~t'f accessed by the projection operator A. Thus suitable choice of A allows the excited-state energies to be individually extracted, thereby avoiding problems associated with multiexponential decays. In the POITSE method ofBlume et al., 188 Eq. 32 is evaluated stochastically by making a Metropolis Monte Carlo sampling over the initial state according to the probability density Ill/i[ 2 and performing a DMC sidewalk at each sampled configuration to propagate A+l~i) according to exp[-(H- Ei)t/fi]. The inverse Laplace transformation, which is numerically an ill-conditioned problem, is performed with the Bayesian approach of the maximum entropy method 189'19~ which results in finite width approximations to the delta functions of Eq. 33. Tests of this new method on low-dimensional systems show that it performs well in extracting both vibrational and rotational states. 188'191'192 The accuracy of the results depend both on the quality of the Monte Carlo data, and to some extent also on the model assumptions about the form of Eq. 33 required by the maximum entropy analysis. However the main problem of congestion of such spectral functions can be avoided as mentioned above by the appropriate design of specific projection operators for individual states. This attractive feature, coupled with the beneficial scaling of the Monte Carlo evaluation for large systems, makes this approach very suitable for calculation of excited states of dopants in quantum clusters.
3.3. Path Integral Monte Carlo
The path integral method allows quantum calculation of thermodynamic averages via the introduction of Feynman paths in imaginary time. 193 It relies on the Feynman path representation of the density matrix,
~R, R'; ~3)= f . . . f dRldR2.. , dRm0(R, R 1; ,)p(R l, Re; , ) . . . p(RM_ l, R'; (~4)

Dopant Spectroscopy in Helium Clusters 425
where 13 = 1/kaT and x = ~3/M, with M the number of path integral partitions. For a Bose system such as 4He, exchange symmetry is incorporated by summing over all permutations P of particle labels:
(35) o(R, R'; 13)= ~--~.w ~ o(R, PR'; 13)
P
The thermal expectation value of any operator is then given by:
~'~ I " " I dRdR,.., dRM_,dR'(RIAIR')I3(R, R l" x)O(Rl, 112; x).. . P(RM_ l, PR'; I;) (A)= P
2 I " " I dRdR,.., dRM_,dR'p(R, R," x)p(R,, 112; x)... P(RM_,, PR'; x) P (36)
PIMC refers to the evaluation of these highly multi-dimensional integrals by Monte Carlo methods. 194 When the exchange symmetry is neglected this can be done in a straightforward manner using standard high temperature approximations for o(Ri., Rj; x), and leads to the common pictorial representation of"chains" connect- ing configuration "beads" at different imaginary times. 195 Two significant compli- cations arise in applications to helium. 194 The first is that for helium at low temperatures the high-temperature (primitive) approximations to the short-time density matrix are very inefficient, and it is necessary to numerically derive the exact high-temperature density matrix. This can be done by the matrix squaring method. 196 Second, to study the superfluid phase it is necessary to incorporate the exchange permutational symmetry which gives rise to interconnections between different imaginary time "chains?' The latter is achieved with the generalized multilevel Metropolis scheme of Pollock and Ceperley, but is however computa- tionally quite time-consuming.
The advantages of the PIMC method compared to the T= 0 methods are twofold. First, there is no wavefunction bias, the only input being pair potentials, masses, and temperature. Second, it is then possible to perform finite T calculations and to examine the thermal effects of permutation exchange. Furthermore, this can be switched on and off to allow separation of exchange effects from single-particle quantum behavior, i.e. delocalization deriving from the thermal de Broglie wave- length. However to date its use for doped quantum clusters has been limited. In part this is due to the computational complexity described above, deriving from the extreme quantum behavior of the cluster. These issues are less extreme for H 2 than for helium, and the first PIMC study of a doped quantum cluster, Li(H2)N; 197 therefore not only neglected exchange, but also employed the standard high-tem- perature primitive approximation. In addition, when this primitive approximation is inappropriate as for He, derivation and representation of the high-temperature density matrix becomes exceedingly complex for anisotropic dopant-He interac- tion potentials with dopant rotation providing a further complication. These issues

426 K.B. WHALEY
have been avoided so far by employing only isotropic interactions; e.g. in the study of SF6HeN, 111 but are clearly important to develop further. Finally, it should be pointed out that not all expectation values of interest are directly accessible to the PIMC method. This is illustrated in Section 5.1 by discussion of the heterogeneous spectral line profile.
4. STRUCTURAL STUDIES
In this section the structural conclusions of microscopic calculations for doped helium clusters are summarized. To provide the context for the structural perturba- tions induced by molecular and atomic dopants, the structural characteristics of the pure 4HeN species are first reviewed.
4.1. Pure HeN
The very smallest clusters, with N = 2 and 3, are to be distinguished first from the larger clusters. The dimer He 2 is close to resonance, possessing only one bound state at energy -1.3 mK. 19s This results in the remarkable phenomena of trimeric bound states for He 3 which become unbound as the strength of the two-body potential is artificially increased (Efimov states). 199-2~ The molecular dimensions of He 2 and He 3 are huge: the average internuclear separation in He 2 is -50/~, while the excited Efimov state in He 3 is over 100,/k in size. l This truly extreme delocalized behavior for the smallest clusters is due to the transformation of the resonant two-body interaction into a long-range three-body attractive interaction having the range of the scattering length, ~ 100/~ for He. 2~ However the ground state of the trimer is considerably more compact, with a root-mean-square (rms) radius (R2) 1/2 - 6-7/~,203 and it possesses a large weight from near collinear configura- tions. 2~ The large difference in size between the ground-state and the excited- Efimov states may allow detection of the elusive Efimov states for He 3 by diffraction. 2~
As N increases from 3 to 7 the cluster rms r a d i u s (R2) 1/2 decreases somewhat and correlates with a large percentage increase in binding energy for each additional atom. 2~ For N > 7, the rms radius increases again corresponding to an approxi- mately constant volume increase per atom. This break is consistent with a limit on compactness placed by the hard-core nature of the He-He repulsion. All clusters are liquid-like, with a diffuse surface region of extent 6-7/~, and a uniform interior density which reaches the bulk value at N - 70. High-accuracy calculations have shown evidence for residual density oscillations in the surface region of larger clusters, which can be attributed to traces of hard-core packing. 2~ The presence of nonhomogeneous local structure has recently been demonstrated with the use of three-body correlation functions. 2~ At the one-particle density level, however, it is quite appropriate to regard the pure clusters as liquid-like droplets where the delocalization in the ground state or at low temperatures is purely quantum
Dopant Spectroscopy in Helium Clusters 427
mechanical, deriving both from the low mass and from the exchange symmetry. Because of the liquid-like character it is relatively easy to deform the clusters, either as a result of introducing a foreign species as discussed below, or as a result of rotational excitation. This has been seen in VMC and DMC calculations performed for rotationally excited clusters. 12~ Compressional and surface excitations of the neutral clusters have also been studied with quantum Monte Carlo methods. 159'168
4.2. Atomic and Molecular Doped HeN
The structural perturbations of the liquid droplet introduced by a dopant depends first on its location. This relies in principle on two factors. The first, and most significant is the strength of the dopant binding to He, relative to the He-He interaction which has a well depth o f - 11 K. 21~ Based on this chemical considera- tion, one therefore expects that alkali atom dopants, whose binding to He is even weaker than the He-He interaction and for which no dimeric species are formed, will be located at the surface of the cluster, while molecules which bind relatively strongly to He (i.e. have well depths larger than 11 K) will be located in the interior. This is borne out by the quantum Monte Carlo calculations, and is consistent with all available experimental data to date. Thus in the cluster ground state, alkali metals, Na and Li, sit outside the cluster on the surface, while more strongly bound atoms such as Xe and Ag, and the molecules C12, HF, and SF 6, are located in center where they can maximize the attractive interactions with the surrounding helium. Table 3 lists the dopant-He well depths, dimer-binding energies, and dopant location of all species which have been studied by QMC to date. This very basic chemical consideration of binding strength underlies also the correlation between location and binding strength in classical doped clusters.
The second factor, which can in principle affect the dopant location, is the change in exchange energy of the local helium environment introduced by the foreign species. This effect derives from the loss of exchange symmetry and hence of attractive exchange energy between the neighboring helium atoms and those which have either been displaced by or are pinned to the dopant species. This energy may be estimated from the increase in exchange energy for a single impurity atom replacing one helium atom, AEex, which has been calculated by Ceperley using PIMC. 194 AEex increases from essentially zero above the superfluid transition temperature, T~., to a maximum value of ~ 1 K, at about I K. Below this temperature, AEex decreases to zero at T= 0, where there is no distinction between a bosonic and a classical fluid. Thus for a large and strongly bound dopant species with M helium atoms in the nearest neighbor solvation shell, assuming that all of these M atoms no longer participate in exchange permutation paths with their neighbors because of the stronger binding to the dopant, will give an estimate of AEex = M K for the maximum increase in exchange energy. In principle, this loss of exchange energy could drive a dopant to the surface to minimize its number of neighboring helium atoms. However this effect will be opposed by the loss of chemical binding to the

428 K.B. WHALEY
Table 3. Pair Interaction Well Depth VX.He Dimer Binding Energy E 0 (XHe), and Location in Cluster HeN for Atomic and Molecular Dopants
VX.He --E 0 (XHe) (K) (K) Location Theory Experiment
Na
Li
Cu Ag Ne Xe Ar Ar +
H2
D2 HF
Cl 2
SF 6
1.86 a -0 .02 q surface b surface c
2.10 a -0 .0015 q surface b surface c
4.61 d 0.55 b center b 6.62 d 1.38 b center b interior e
21.08 f 3.74g centerg interior h 28.09 f 11.12g center i interiorJ
29.57 f 10.03 g centerg interiorJ 405.16 k 328.6g centerg i nteriorJ
13.231 0.0251 delocal ized I 13.231 0.5401 center m 57.70 n 11.08 n center n interior n
47.48 ~ 25.03 ~ center ~ 62.21P 38.3 p center~ interior p
Notes: aRef. 242. bRef. 214. CRef. 58. dRef. 218.
�9 eRef. 128. fRef. 248. gRef. 212. hRef. 7, 8. iRef. 217. JRef. 52. kRef. 220. Ilsotropic potential, ref. 204. mRef. 237. nAnisotropic potential, ref. 81. ~ potential, ref. 162. PAnisotropic potential, ref. 67. qRef. 216.
dopant. In general, for strongly bound molecular species such as SF 6 the latter effect prevails. Thus, the best candidate for seeing such an effect is a dopant with similar binding strength to helium itself, e.g. Ne or H 2. (3He binds more weakly to 4He than the latter does to itself because of the lower reduced mass, and so this always forms surface states in any case.)
Unpublished PIMC results do give indications that Ne is not located at the center of the cluster at finite temperatures, 211 while T = 0 VMC/DMC calculations show

Dopant Spectroscopy in Helium Clusters 429
it to be centrally located. 212 Experimental results suggest an interior location, but are not conclusive. 8'9 More detailed temperature-dependent calculations are neces- sary to determine the role of the exchange energy in this case. H 2 is also a very interesting case here. VMC studies for relatively small cluster sizes, i.e., He20, show that at T - 0 a single H 2 dopant is extensively delocalized throughout the cluster, with a maximum in the surface region. 2~ It would therefore be very interesting to examine the temperature dependent location in this case, as well as for the heavier isotope D 2 which is already centrally located at T = 0. 213
The uniform density of the quantum liquid clusters can be locally quite strongly perturbed by dopant species. The weakest structural perturbations are produced by the weakly bound, surface-localized alkali atoms. Figure 1 shows the formation of a dimple-like depression for Na on He/v. 214 This structure was expected from density functional calculations for the corresponding bulk systems. 118 Similar behavior is seen for LiHeN .214 Presumably a similar dimple-like depression is formed with the alkali dimers, e.g. Na 2, but no microscopic calculations for these have yet been made. On a finite cluster, the question arises whether the surface-bound alkali species break the symmetry and are localized on one side, or whether they are only localized in the radial direction and are delocalized over the entire surface. While the microscopic calculations yield the full 3N + N'-dimensional wavefunction, this question is difficult to answer for an atom because there is no natural space fixed
I I I ,,I l
-15 -10 -5 0 5 10 15
15
10 r/lO0 pm
z/lO0 pm
Figure 1. Contour plot of helium density about a surface attached Na atom in NaHe7s, displayed in cylindrical coordinates (z, r) with z the axial
214Th e coordinate and r the radial coordinate in the plane perpendicular to z. Na atom is located on the z-axis at z - 15 ,~. The density contours range from 0.001 i~ -3 to 0.0175 ~-3, with the highest density closest to the z axis, and are averaged over the azimuthal angle. Results shown are DMC mixed expectation values.

430 K.B. WHALEY
axis to use as a reference for sampling the angular location of the dopant atom. Thus Figure 1 gives only an indication of the anisotropy of the He distribution relative to the body fixed Na-Hecm axis, where Hecm denotes the center of mass of the He. Within an adiabatic approximation, one can use this anisotropic distribution to construct an effective potential for angular motion of the Na on the surface and hence to estimate the extent of delocalization. However it seems that one cannot directly sample the angular variations of the Na atoms.
From the chemical-binding arguments given above, dopant species located in the cluster interior are by definition more strongly bound to He than the latter is to itself, and so one expects significant perturbations of the uniform local helium density. Radial density profiles for the helium density about the dopant suggest that a shell structure is formed, with peak densities greater than the bulk He density, and with the number of peaks dependent on the binding energy. Figure 2 shows the radial helium density profiles for SF 6 67 and HF, sl both of which form at least two such "solvation shells." The more strongly bound SF 6 has higher peak density and the number of helium atoms in the first "shell" is about 23, while that in the correspond- ing "shell" for HF is about 15. 215 The helium density profile about the dopant may also be anisotropic. This was evident for SF 6 in the first set of DMC calculations, 67 where the anisotropic interaction potential was used but the rotational kinetic energy of SF 6 was neglected. For SF 6 the strong anisotropy in the helium density is very slightly reduced when the dopant rotational kinetic energy is incorporated, due to the zero-point motion in the angular coordinates. ~87 The anisotropy is correspondingly weaker for HF and the He density relative to the dopant is nearly perfectly isotropic here, as expected from the extreme delocalization evident in the HeHF dimer, sl This contrasting behavior is due both to the weaker anisotropy of the HF-He interaction, and to the lighter mass of the HF dopant relative to SF 6 and consequently greater dopant zero point energy and delocalization.
The more strongly bound CI 2 is intermediate between these two molecules. DMC studies for N = 6 and N = 20 show a high degree of anisotropy in the smaller cluster, with the 6 He atoms delocalized roughly in the equatorial ring about the diatomic, while the helium density in N = 20 appears not to be very anisotropic and is less tightly bound to the molecule. 162 A recent study for N = 1-8 using a different potential clearly shows the helium density growing at the CI 2 "caps" once the equatorial belt is filled, for N > 7 (Figure 3). 153 Green's function Monte Carlo (GFMC) calculations have also been made for very small clusters with C12 .163 The number of atoms required for a complete first quantum solvation "shell" is not known for CI 2, but is at least 20 since only a single shell in the radial density profile is seen for all sizes studied to date. For C12Hetr the structural perturbations induced by overall cluster rotation have also been studied. Both the helium density and, to a lesser extent, the dopant density undergo some centrifugal distortion upon rotational excitation, with the effect being more pronounced in the larger cluster where the helium density is less tightly bound to the molecule. 162

Dopant Spectroscopy in Helium Clusters 431
(a)
0.080 ! I -- 20
. . . . : 3 9
0.060 - - . . . . . 69 . . . . . 111
.=>, 499 r 0.040 L- c: 6)
�9 p
o.o o
0.000 ~ ~ ~ ~.._':_~.__.h_-~ . . . . 0 5 10 15 20
R (.,&,) (b )
0 . 0 5 [ �9 i �9 w - , �9 " ' , �9 , r , . , . w �9
H e H F n
0.04 ~ Radial Density -
p . . ~ .
0.02
0.01 1
0.00 0 2 4 6 8 10 12 14 16 18
r / 100 pm
Figure 2. (a) Radial helium density profiles for SF6HeN, with N = 20, 3, 69, 111, and 499 (from ref. 67). The second order DMC extrapolation is used here. The horizontal solid line represents the density of bulk liquid helium. (b) Radial helium density profiles for HFHeN, with N = 1, 3, 5, 7, 9, 11, 13, 15 (solid lines), 20, 25, 30, 35, 40, 45, 50 (dashed lines), and N = 98 and 198 (from ref. 81). The method of descendant weights was used to extract exact expectation values here. The dotted horizontal line represents the density of bulk liquid helium.

432 K.B. WHALEY
0:06 0.05 0.04 0.03 0.02 0.01
0
10
-5
7../100 pm 5 - - ' - " - ~ 0
"- 5 r/lO0 pm
Figure 3. Contour plot of helium density about CI2He8 in cylindrical coor- dinates (z, r) averaged over the azimuthal angle. 15YThe coordinate origin is located at center of the CI2 bond and the z axis is directed along the bond. The vertical scale is in A -3. Exact DMC results, generated with the method of descendant weights.
The interpretation of such "solvation shells" in doped helium clusters requires some caution. Unlike a classical cluster, the solvating helium atoms are not localized in the T = 0 calculation. The nonzero density between shells is evidence of the quantum delocalization. Furthermore, because of the permutation symmetry, helium atoms can exchange between "shells" even at T = 0 K. The difference between these quantum shell structures and a classical solvation shell is clearly illustrated by the size dependence of the peak densities in Figure 2b. For a classical cluster, the first solvation shell would be completed before the second one begins to accumulate. In contrast, for the quantum cluster HFHe N shown here, the peak density in the first shell continues to increase, while the second shell is growing. 81 Another indicator of the distinction between this quantum shell structure and a classical solvation shell is the participation of the shell atoms in superfluid behavior. Finite temperature PIMC calculations for SF6He N at T = 2.5 K (the cluster dissoci- ates at about 5K) show nearly identical helium distributions to those at T = 0 K. 111 Microscopic calculation of the superfluid fraction via the contribution of permuta- tion exchange paths shows however that many of the long permutation paths responsible for superfluidity involve atoms in several solvation shells, including atoms very close to the dopant. This is summarized in Figure 4. Thus it is important to realize that this quantum "shell structure" does not correspond to classically localized, solid-like particles.
Heavier rare gas atoms (Ar, Xe) and metal atoms (Cu, Ag) embedded in the cluster interior show similar shell structure. 161'214'217 Experimental indications confirm an

Dopant Spectroscopy in Helium Clusters 433
10
-5
-I0 ! -I0
t " r r !
(a) i
: i
X
,
t I F
F
(b)
-10 -5 0 5 10 X
Figure 4. PIMC "snapshots" of imaginary time paths projected onto the XY-plane for SF6He39 (from ref. 111 ). Thin solid lines---permutation cycles of length 1 He atom; thick dotted line--permutation cycle of length 3 He atoms; thick solid line--permutation cycle of length 1 5 He atoms. The SF6 mass was set to infinity here. Lengths given in ~.
interior location for the rare gases 8'52 and for Ag. 128 From Table 1 we see that the well depth of the Xe-He interaction is approximately three times that for He-He, but the metal atoms have smaller dimeric well depths 218 than He-He. However the heavier masses of these metal atoms results in significant binding in the dimer, so that surface localization is not favored. The presence of the dopant-induced density oscillations around metal atoms, illustrated for Agile N 214 in Figure 5, is a little surprising although not out of line with the magnitude of the (dimer) binding energies. This theoretical prediction is important since it shows that the conven- tional bubble model for foreign atoms is a severe approximation. The bubble model assumes that impurity atoms form cavities with diameters determined by the repulsive interaction, and that the helium density outside the cavity is unperturbed. Originally proposed for electrons in liquid helium, and later adopted for neutral impurity atoms, 32'219 this model has been widely used for the interpretation of metal atom spectroscopy in liquid helium. 41
The intermediate character of the quantum dopant H 2 with regard to its location has been mentioned above. One can regard H2He N as a mixed quantum cluster, in which both components are extremely delocalized. Correspondingly, there is little noticeable perturbation of the He density by the H2 .2~ With the heavier isotope D 2 the onset of a quantum shell structure about the centrally located dopant is evident at larger cluster sizes (N ~ 20). 213 For the dopant series H 2, D 2, HF, CI 2, and SF 6 the structural trends thus clearly parallel the energetic trends.
All of the above studies dealt with neutral dopant species. Charged dopants have received less theoretical attention. Lewerenz has compared the structure of Ar§

434 K.B. WHALEY
Density
0.05 f 0.04 0.03 0.02 I- 0.01
20 -15
z/lO0 pm
15 10 r/lO0 pm
Figure S. Contours of helium density around Ag for ARHe199, in cylindrical coordinates (z, r) averaged over the azimuthal angle.21~rVertical scale in t~ -3. Also shown is the Ag density, which forms the sharp central peak. This is suppressed by a factor of 100, to fit on the same scale as the helium density. Exact DMC results generated with the method of descendant weights.
with that of the neutral ArHe N in a VMC/DMC study 212 using an accurate empirical He-Ar + potential. 22~ Quantum solvation shells are found for both species, with approximately 12 atoms in the first shell. The dopant charge was seen to noticeably compact the surrounding helium, resulting in much higher peak density in the first shell for Ar+HeN, as well as larger angular correlations in this shell. This is not surprising in view of the significantly stronger binding of the ionic species (Table 3). Both structural and energetic criteria can be used to characterize shell structure. Changes in the energy derivative with respect to cluster size can be used to correlate shell growth and completion, as well as to isolate magic numbers of high stability. Energy derivatives with respect to cluster size show a minimum for Ar+Hejv at N = 12, indicating a magic number here, and some structure for the ionic species at larger sizes, but relatively smooth behavior for the neutrals.
A similar study has been carried out by Wu and Watts for Xe§ using a simple potential model in which the xenon charge is represented by addition of an r -4
217 charge-induced dipole term to the Xe-He interaction. The analogue species Ne§ has not yet been studied, but would constitute an interesting comparison because of the significantly larger binding energy of the dimer (core) ion which has been cited as the origin of the anomalous magic number N = 13 determined by drift tube experiments. 134 This system would therefore provide a good test of the pairwise additivity assumption made in most potential models. Brown et al. have

Dopant Spectroscopy in Helium Clusters 435
made unbiased DMC calculations for small clusters of N~ HeN ,178 (N < 12) using an angle-dependent potential. This size range lies below the completion of a first solvation shell and no evidence for any significant anisotropy in the helium density was found, unlike the situation for C12 above. For all charged dopants, there is a large energetic effect, with the binding energies increased by at least an order of magnitude over that for the neutral analogues. This is what makes an unbiased DMC feasible (see above). No calculation has addressed the role of many-body polariza- tion effects for charged helium clusters yet. While these were found to be significant in charged xenon clusters, 221'222 their magnitude should be considerably reduced for helium. Nevertheless, the relative weight of these with respect to the He-He contribution to the binding would be useful to explore for strongly bound charged dopants such as Ne.
4.3. Related Quantum Clusters-Doped (H2)N
Doped clusters of molecular hydrogen display some similarities with doped helium clusters. The structural characteristics of the pure clusters (H2) N are quite difficult to converge, both in zero-temperature calculations 155 and in finite-temperature PIMC calculations. 223 The H2-H 2 dimer is more strongly bound than He 2, and as a result the molecular hydrogen clusters possess greater cohesive energy and are also more highly structured. Nevertheless, a comparison of relative accuracies of liquid-like, solid-like, and shadow wavefunctions for VMC studies yielded the conclusion that the liquid-like trial functions are most accurate, despite the consid- erably higher degree of structure found relative to Heir. 155 Zero-temperature, DMC calculations have been made for B(H2)N ,179 Li(H2)~,, and Li(D2)jv, 155 and Hg(H2)12 and Mg(H2)12 .177 Finite-temperature PIMC calculations have also been made for Li(HE)N. 223'224 Boron is an open-shell atom and so for this dopant it is necessary to take into account the potential anisotropy due to the orientation of the p orbital. In the B(H2) N calculations, 179 as in a recent DMC calculation for the analogous open shell system BArE ,225 the lowest energy adiabatic interaction potential was derived for each cluster configuration. In all of these calculations the H 2 was treated as a spherical atom, which is assumed justifiable by the low pressure effective in unconfined clusters.
The results of these calculations for doped molecular hydrogen clusters show that a lithium atom sits outside the cluster, as in its helium analogues (Section 4.2), while the other foreign atoms listed above are located in the cluster interior. For the latter, the H 2 density appears quite delocalized about the dopant species. However, these studies are currently too limited in size range and not enough microscopic calcula- tions for the pure clusters exist yet for one to determine the extent of structural perturbation caused by the dopant species. Thus the existence of quantum "solva- tion shells" analogueous to those in doped Hetr has not yet been demonstrated. Finally some work has been done on the mixed isotopic clusters (D2)N.(H2) N. These can be regarded as a special kind of quantum doped quantum cluster, like the HEHe N

436 K.B. WHALEY
cluster mentioned earlier (Section 4.1). Two recent PIMC studies of the mixed hydrogen clusters show segregation effects, 226-22s which could provide a way to control the location of a tertiary dopant.
5. DOPANT SPECTROSCOPY CALCULATIONS
Microscopic calculations of dopant spectra is currently a very active and rapidly progressing area of theoretical research on quantum clusters. A number of calcula- tions have been made for dopant vibrational frequency shifts. Rotational spectra of molecular dopants are more difficult to deal with theoretically, yet these appear to hold the key to understanding the role played by superfluidity in the dopant spectral response and thus constitute a key problem for current microscopic theory. Elec- tronic spectra of metal atoms in quantum clusters have been addressed within the semiclassical Franck-Condon approach. Here the main problem is the accuracy of the excited-state potentials, and this is the limiting factor in extending such microscopic calculations of electronic spectra to the molecular dopants which have been recently studied experimentally. In this section we therefore not only summa- rize the microscopic calculations made to date, but also describe the more approxi- mate treatments which have been employed when quantum Monte Carlo calculations are not possible, whether this is due to technical reasons or to lack of accurate interaction potentials.
5.1. Infrared Spectra of Molecules in HeN
Infrared spectra of all molecules studied to date are characterized by small vibrational shifts and by modified rotational structure. Theory has addressed each of these aspects separately. Calculation of vibrational shifts require knowledge of the intramolecular stretching (bending) dependence of the dopant-He interaction potential. This is generally not known~HeHF 229 and N~-He 23~ are the only systems for which ab initio calculations have explicitly incorporated this. Empirical pair potentials either assume rigid dopant, or impose vibrational averaging, resulting in at best dopant vibrational-state specific interaction potentials. The first vibrational shift calculation was made for a relatively complicated dopant, SF 6, for which no vibrational dependence of the interaction with helium is known. Therefore this shift was calculated approximately, using the instantaneous dipole-induced dipole (DID) model proposed by Eichenauer and LeRoy for the vibrational shifts of molecules in argon clusters. TM In this model the perturbative dopant vibrational energy level shifts AE n = (~0znl~ntlzn~0), which should be given by matrix ele- ments of the quadratic terms in the internal normal mode expansion of the SF6-He interaction potential, are replaced by electrostatic terms deriving from the attractive Component. This results in the following expression for the spectral shift of the triply degenerate v 3 vibration,
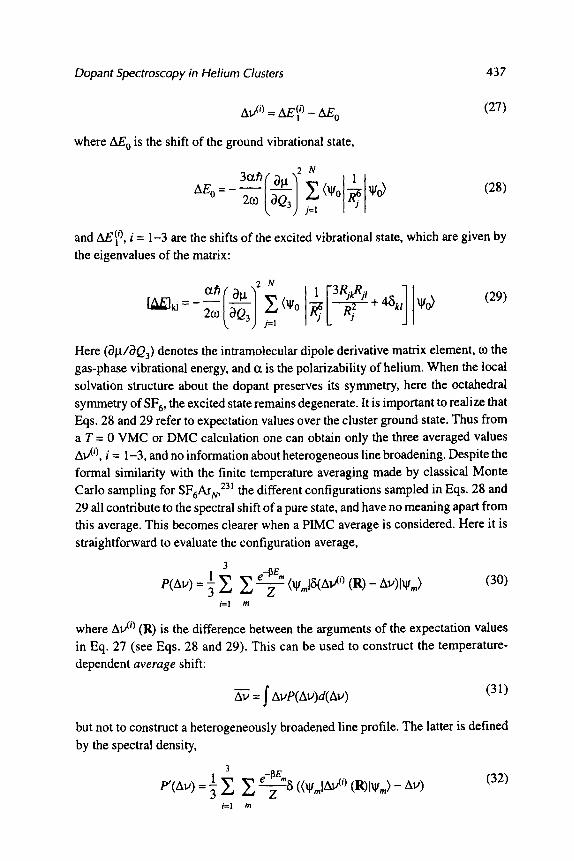
Dopant Spectroscopy in Helium Clusters 437
Alj(i) _-- ~ i ) _ / ~ E o (27)
where AE o is the shift of the ground vibrational state,
2 N
AE~ = 2(o 1
�9 0) (28)
and AE~ i), i = 1-3 are the shifts of the excited vibrational state, which are given by the eigenvalues of the matrix:
2 N
I I ~ u = - 2-'- ~ . ~ j +48t ~o)
Here Og/i)Q3 ) denotes the intramolecular dipole derivative matrix element, co the gas-phase vibrational energy, and a is the polarizability of helium. When the local solvation structure about the dopant preserves its symmetry, here the octahedral symmetry of SF 6, the excited state remains degenerate. It is important to realize that Eqs. 28 and 29 refer to expectation values over the cluster ground state. Thus from a T = 0 VMC or DMC calculation one can obtain only the three averaged values Av {i), i = 1-3, and no information about heterogeneous line broadening. Despite the formal similarity with the finite temperature averaging made by classical Monte Carlo sampling for SF6ArN, TM the different configurations sampled in Eqs. 28 and 29 all contribute to the spectral shift of a pure state, and have no meaning apart from this average. This becomes clearer when a PIMC average is considered. Here it is
straightforward to evaluate the configuration average,
3 1 e -~e- e(Av) =~ ~ ~] --2-- (VmlS(A~0 (R) - AV)IVm) (30)
i=1 m
where Av (0 (R) is the difference between the arguments of the expectation values in Eq. 27 (see Eqs. 28 and 29). This can be used to construct the temperature- dependent average shift:
= I AvP(Av)d(Av) (31)
but not to construct a heterogeneously broadened line profile. The latter is defined
by the spectral density,
3 1 e -13E - (32) ~(~v) =~ Y~ ~]-2-~ (<VmlAV(')(R)IVm)- ~v)
i--'1 m
438 K.B. WHALEY
m
which gives the same value of the average shift Av when averaged over as in Eq. 30, but which is unfortunately not a simple configuration average accessible to PIMC evaluation. Nevertheless, comparison of the PIMC spectral distribution, Eq. 30, at T = 2.5 K with the corresponding T = 0 spectral distributions,
3 1
Pr=0 (Av)=-~ ~ (V,,IAv (i) ( R ) - Avlv,,)
i=1
(33)
showed reasonably good qualitative agreement for SF6He N, suggesting that the effect of heterogeneous line broadening is small at the temperatures relevant to experiment (< 1 K). For SF6He~r the average shift of the v 3 vibration resulting from both T = 0 DMC and PIMC at T = 2.5 K within the IDID model is - -0.8 cm -1, which is about one-half the experimental value of-1 .43 cm -1. The IDID model neglects any repulsive contribution to the shift, as well as higher order attractive contributions. Thus while it necessarily results in a red shift, it is difficult to estimate the sign of corrections to the model. The model could also be improved by addition of many-body polarization effects, but these would be relatively small for helium.
More exact calculations have been made for diatomic dopants, in particular for HF and for N 2, where the diatomic stretching dependence of the dopant-He interaction potential has been computed by ab initio methods. Several very different adiabatic schemes have been suggested to overcome the problem of time scale differences between the dopant vibrations, which are generally of relatively high frequency compared to the characteristic helium atom motions. Blume et al. therefore employed an adiabatic separation of the fast HF vibration from the slow He motions and constructed a vibration-averaged state-specific interaction poten- tial, i.e., HF(v)-He. These were used to calculate the cluster energy for each vibrational state, with the diatomic bond length being readjusted to a constant, v-dependent value after each Monte Carlo step. The adiabatic energy difference was then used to obtain the vibrational energy shift, according to,
Av = AE,,__o- ZIE~I (34)
where the energies are measured relative to the dissociation limit. The HF vibra- tional shifts were calculated as a function of cluster size N for N < 200, and found to decrease from the dimer value of-0.19(1) cm -1 to a saturation value of-2.7(1) cm -1 at N ~ 50-100. This correlates approximately with the filling of the first nearest neighbor quantum solvation "shell" (see Figure 2b). The theoretical shift is in very good agreement with the experimentally measured red shift of-2.65(15) cm -1, attesting to the accuracy of the interaction potential and of the calculation. One significant feature of the latter is the use of correlated sampling techniques to reduce error for these very small shifts. The authors also found good results from a perturbational treatment of the adiabatic potential difference which allowed sampling on the ground-state surface only and thereby also reduced the statistical

Dopant Spectroscopy in Helium Clusters 439
errors in the vibrational shift. The same method was used by Lewerenz 232 and by Niyaz et al. for vibrational shifts of HF in argon clusters, 164 but here the shifts are significantly larger (_>10 cm -1) and so correlated sampling is not required. The accuracy of these vibrationally adiabatic DMC calculations based on high-quality multidimensional interaction potentials, for both HFAr N and FHe N, is sufficiently high that the comparison with experiment now allows systematic investigation of higher order, nonadditive potential contributions.
Clary and coworkers have explored the opposite, inverse adiabatic separation for calculation of the vibrational energies of N~ in HeN .178 A series of unbiased DMC calculations was carried out for just the He atoms, with the N-N vibrational coordinate frozen at a range of values. The DMC energies were used to construct a one-dimensional vibrational potential for N~ which was then diagonalized. This study was restricted to small sizes (N < 12). Because of the relatively strong binding energy of the charged dopant, no importance sampling was necessary, but this could become more significant for larger sizes (the average binding energy per He atom was seen to decrease, which indicates more diffuseness and greater associated sampling problems). The inverse adiabatic shifts were seen to grow linearly with the number of helium atoms for small sizes (N < 8), and to be relatively large, e.g. -5.59(7) cm -1 for N = 8. It would be interesting and indeed feasible to estimate the nonadiabatic terms within this scheme and to estimate the relative error introduced by the approximation.
If computational time is not an issue, and the intramolecular stretching depend- ence of the potential is known, sampling of all degrees of freedom provides a more complete approach to studying vibrational shifts. In a very recent study Beck and Watts used a site-site interaction potential for H20-He constructed to fit ab initio data for the rigid molecule, and used this to study the vibrational shifts of the water monomer in He N within the fixed node approximation. 233 This yielded a red shift of 1.5 cm -~ for the asymmetric stretch mode, in agreement with the experimental measurements, 79 and larger blue shifts (- 4-6 cm -1) for the bend and symmetric stretch modes, indicating a more complex interaction for the latter modes (see discussion in Section 2).
Ideally, one would like to go beyond the fixed node approximation. Some exploration in this direction is now beginning. Thus, in a recent study of CI2He N with model interaction potentials Lewerenz has investigated the explicit calculation of excited vibrational states of a diatomic dopant with a variable node in the diatomic vibration. 153 The cluster wavefunction is based on the usual factorization of Eq. 6, together with the analogue of Eq. 12 for dopant vibration. The dopant vibrational factor possesses a node, whose position is an additional parameter within a constrained VMC calculation for the excited vibrational state. The impo- sition of constraints, i.e. a penalty function on the minimization functional, is required to ensure that orthogonality with the ground-state wavefunction is main- tained. Further exploration of these and other TM dynamic node approaches (nodal

440 K.B. WHALEY
release) may lead to new insight into the effect of solvation on intramolecular vibrations.
The rotational spectra of molecules embedded in He N poses considerable more problems for theoretical analysis than the corresponding vibrational spectra. Mo- lecular vibrations are usually red-shifted by small amounts, consistent with the dominance of the polarization components of the interaction potential in vibrational level shifts (Section 2). Rotational spectra present more of a puzzle, with their empirical interpretation in terms of freely rotating entities which vary from the bare dopant for the lighter molecules (HE al H20, 79) to a "dressed" dopants with small numbers of helium atoms rigidly attached for the heavier molecules (SF 6 and its complexes, 75 OCS76). While the heavier mass dopants would be expected to be hindered to a greater extent, the observation of empirical free rotor behavior is unique to the He matrix environment.
As mentioned in Section 2.1, a central question here is to what extent the superfluidity of the He nanomatrix plays a role. In microscopic terms, one can alternatively ask whether the apparent free rotor behavior is merely a result of the weak molecule-He interaction or whether the presence of appreciable quantum mechanical exchange in the environment is crucial. All microscopic calculations for SF 6 which incorporate the anisotropy of the interaction potential show signifi- cant density oscillations in the angular distribution of He around the dopant (see Figure 3). In a static picture, such an anisotropic solvation shell would imply a strongly hindered rotation, and splitting of the rotational degeneracy in the upper states. One task for theory therefore is to reconcile the empirical analysis of free rotor-like dopant rotation with the microscopic structural results of extensively delocalized, but still anisotropic quantum solvation shells. This necessarily requires addressing the excited rotational states directly. Ground-state calculations alone do not allow one to draw conclusions about the dynamics. Thus it is not clear whether in a rotational excited state the dopant sees an anisotropic cage or whether the anisotropic helium density adiabatically follows the dopant so that the latter effectively sees an isotropic solvation shell. The role of the helium superfluidity in spectroscopy is related, since the dynamic behavior of the quantum solvation shells will be influenced by this.
The first calculation which incorporated dopant rotational kinetic energy was the ground-state calculation of HFHe N using vibrationally adiabatic HF-He potential surfaces. 81 Here the H and F atoms were moved independently and then the HF bond rescaled to impose the vibrational adiabaticity constraint. As mentioned in Section 2, this calculation showed near isotropic helium density distribution about the J = 0 HF, leading to the conclusion that the rotation is unhindered, and that the same rotational constant would be found as in the gas-phase. Fixed-node DMC calculations for rotationally excited states of a general rigid rotor dopant with importance sampling of all degrees of freedom has recently been achieved and applied to several molecules from Table 1 in 4HEN. 1s7 Calculation of the first few low-lying excited states yields a free rotor level structure with reduced rotational

Dopant Spectroscopy in Helium Clusters 441
constants, confirming the experimental observations. Fixed-node calculations for the corresponding excitations in 3HEN, which determine the T = 0 spectra in a fermionic cluster are in progress.
The recently developed imaginary time spectral evolution method 18s can also be applied to the rotational excitations. As described in Section 3.2, this method currently only yields the rotational excitation energies, and not additional informa- tion such as the associated helium density in the excited state. However it is not restricted by the fixed node approximation. For molecules in 4HeN this approach yields similar conclusions for the dopant rotations, i.e. an approximately free rotor level structure with reduced rotational constant, provided that only the first few levels are probed. 246 Other, more phenomenological, approaches to understanding the increased moments of inertia should also be explored. Semiclassical estimates of the kinetic energy of the fluid undergoing a cage pseudo-rotational motion about a rotor have been used to estimate moment of inertia increments for a hindered rotors in conventional matrices. 235 PIMC may allow analysis of kinetic contribu- tions in the surrounding helium, with the advantage that one can switch exchange on and off, and thereby isolate the contributions from superfluidity. Density profiles computed by quantum Monte Carlo can be combined with hydrodynamical formu- lations of the quantum fluid. 236 It may also be useful to explore generalizations of the fluctuating liquid cage models (Section 3 and refs. 95-97) to a quantum liquid solvent.
Two papers have also broached the possibility of additional structure due to cavity vibrations of embedded dopants. 237'238 Dopant delocalization within the effective cavity, to an extent dependent on the dopant-He reduced mass, is expected for all species, and is borne out by the results of VMC and DMC calculations. While the energies of these are relatively easy to estimate, the crucial question of whether these excitations possess any oscillator strength has not really been addressed. To answer this question, it is necessary to know the coupling between the dopant intramolecular vibrations and the dopant-He coordinate. Furthermore, these may couple strongly with the dopant rotation and thereby influence the rotational lineshapes.
5.2. Electronic Spectroscopy of Atoms in HeN and (H2)N
Calculations of electronic spectra for atoms attached to or embedded in quantum clusters have been restricted so far to alkali atoms, for which the standard pertur-
239 bative approach to generate electronically adiabatic excited-state potentials is deemed valid. This can then be combined with the semiclassical generalized Franck-Condon theory to evaluate the electronic absorption spectrum in the presence of the matrix, using either the zero-temperature 24~ or finite-temperature 197 densities to derive the Franck-Condon weighting factors. Such microscopic calcu- lations have been made for Li(H2) N 155,197 and Li(D2)N ,lss and are in progress for alkali atoms on HeN .241

442 K.B. WHALEY
The basic features of the alkali spectra on helium clusters were explored by Kanorsky and coworkers with an adiabatic model in which the alkali moves in a one-dimensional, static trapping potential provided by the dimple profile of the helium cluster. 58 In the absence of microscopic calculations, the density profile was approximated by that of the infinite surface, lIB In this simplified one-dimensional model both excited- and ground-state wavefunctions can be explicitly calculated and therefore the Franck-Condon overlap matrix elements evaluated directly. However these overlaps will be sensitive to distortions and shifts of the excited- state potential curves due to fluctuations, both zero-point and finite-temperature induced, and therefore the amplitudes of the calculated spectra are not guaranteed. Comparison of the absorption spectra calculated from this one-dimensional model with experimental LIF spectra showed overall good agreement. The positions of the main spectral features, peaks near the gas-phase absorptions accompanied by long blue tails, are well reproduced for all three alkalis studied~Li, Na, and K. The only significant discrepancy between theory and experiment is the linewidths for the heavier species, Na and K. This is consistent with the structural findings from microscopic calculations which show that all alkalis are located outside the cluster surface, with the Li furthest away as a result of its light mass (despite the strongest binding (Table 3 and refs. 118,242). The Li atom therefore couples less to density fluctuations in the surface which would affect the linewidths.
For the related system Li on (H2) N, both zero-temperature VMC/DMC 155 and finite-temperature PIMC 197 spectral calculations have been made. The earlier PIMC calculations employed pseudo potentials for the excited state, while the ground-state calculations used the recently calculated ab initio pair poten- tials. 243 Li also penetrates bulk hydrogen, and the 2s-2p electronic absorption has been measured both on clusters and in the bulk. This system is a prototypical high energy density material, TM and considerable interest therefore focuses on understanding the relation between the Li dopant spectrum and its location. For Li(H2) N, the zero-temperature semiclassical Franck-Condon analysis (summarized in the corresponding calculations for Li in bulk hydrogen 24~ using the ab initio pair potentials obtains overall good agreement with the experimental absorption spec- trum obtained by beam depletion. 126 This is shown in Figure 6, where it is however clear that the experimental spectra are systematically red-shifted relative to the theoretical predictions. There are a number of possible reasons for this. Several approximations are made in the description of the interaction potentials~the excited states are dealt with perturbatively and neglect coupling to higher lying states (which can indirectly give rise to many-body effects245), the H 2 is approxi- mated as spherical, and the long-range components of the ab initio potentials are subject to uncertainties for these weakly bound systems. 243 Incorporation of the nuclear coordinate dependence of the dipole moment operator may also have an effect. Theoretical questions also arise in the'use of the semiclassical, mean-value approximations required to make the Franck-Condon analysis computationally tractable for a high-dimensional system. 24~ These are relevant for (H2) N and He N

Dopant Spectroscopy in Helium Clusters 443
8 . 0 . . . . . . I i
i t
6 . 0 -
= ! O
= ! ~ 4 . 0 - O
-Q ! < I
I 2.0 F
i
0.0 -300
. . . . . . i
i i
i i -200 -100 0 100 200 300 400
AE (cm ~)
Figure 6. Electronic spectra for the 2s-2p transition of Li attached to (H21)~( ~ Solid line---experimental results obtained by beam depletion for N ~ 1000. Dashed line--theoretical results from the semiclassical Franck-Conclon analysis together with T = 0 DMC probability distributions 15s using the ab initio pair potentials of ref. 243.
because of the strongly anharmonic nature of the vibrational modes. However, despite this it is clear that one is evaluating a Franck-Condon line shape here, and no ambiguity about the meaning of the calculated T = 0 line shape exists, unlike the situation in infrared spectra discussed above (Section 5.1).
5.3. Electronic Spectroscopy of Molecules in HeN
No quantum Monte Carlo-based calculations have yet been made for electronic spectra of molecular dopants, primarily because of the lack of accurate interaction potentials for electronic excitations of molecules with helium. Because of the complexity of the phenomena seen in electronic excitations (Section 2) this is an area where well-chosen calculations based on simple physical models are useful to identify specific aspects for more microscopic study. One such example is the analysis of the phonon side bands for glyoxal 1~ in terms of the modified Franck- Condon theory for impurity spectra in solid matrices, due originally to Huang and Rhys. 247 In this theoretical analysis, the only microscopic input required is the phonon spectrum of the cluster environment around the glyoxal, and the effective volume increase of the molecule upon electronic excitation. With the latter derived from experimental estimates, the phonon side-band structure in ref. 104 could be fit by assuming the cluster phonon spectrum is only slightly distorted from the bulk spectrum at its extrema, i.e. the roton and maxon regions. While microscopic calculations show that a dopant can significantly perturb the phonon spectrum for small cluster sizes, 168 the behavior for large cluster sizes is not well known, as is

444 K.B. WHALEY
also the coupling to electronic excitations. Given the rapidly increasing number of experimental results in this area, it is clearly a fertile field for future microscopic calculations.
6. SUMMARY
This review has surveyed the rapidly growing field of spectroscopy in doped quantum clusters of helium and hydrogen, and described the current status of microscopic theoretical calculations on these systems. Both experiments and theory on these unique, highly quantum, nanoscale clusters present considerable technical challenges. I have attempted to show these challenges, together with the wealth of new and unusual information available from study of atoms and molecules in helium clusters. First, the range of spectroscopic experiments currently being made attests first to the novel use of helium clusters as an ultracold, gentle quantum matrix for high-resolution spectroscopy, and for assembly of new clusters of a wide variety of materials. Second, it also dramatically demonstrates the use of dopant spectros- copy in the miniature, nanoscale quantum solvation environment provided by the cluster to probe both the microscopic solvation structure and the elementary excitations in a superfluid. Both of these features rely essentially on the finite-size of the helium clusters and the ability to make spectroscopic investigations on these which thereby bypasses the problems associated with the lack of a thermodynami- cally stable solvated state in bulk helium. Manipulation of the finite-size quantum clusters therefore gives access to a whole new range of analytic and synthetic experiments on large molecules and clusters.
While the microscopic theory of ground-state structure and energetics of doped quantum clusters is now well developed, it is clear that the primary challenge for theory is now to provide a microscopic understanding of the characteristic dopant spectroscopic features and their relation to the superfluid and Bose condensed nature of the cluster environment. New advances in calculation of excited states show promise here, at least for infrared molecular spectra. The area of electronic excitations and coupling of these to cluster collective excitations is in contrast relatively unexplored by microscopic methods. A crucial element here is the availability of potential energy surfaces for excited dopant interactions with helium. In most cases even rudimentary knowledge of the key features of the excited-state potentials is missing. Thus both input from ab initio quantum chemical calculations is required, as well as further investigation of the more empirical models of the excited state couplings and dynamics.
ACKNOWLEDGMENTS
I thank Professor J. P. Toennies for his kind hospitality during a sabbatical year at the Max Planck Institute for Str6mungsforschung in G6ttingen where this review was written, and the Alexander von Humboldt Foundation for a Senior Research Award. I also thank Dr. M.

Dopant Spectroscopy in Helium Clusters 445
Lewerenz, Dr. U. Buck, Dr. E Huisken, and members of the Toennies group for making available unpublished results and for many stimulating discussions, and Professor G. Scoles, Dr. A. Vilesov and Dr. E Federmann for critical readings of the manuscript. Research on this subject in my group has been supported by the National Science Foundation, the Air Force Office of Scientific Research under the High Energy Density Materials (HEDM) program, and the Petroleum Research Fund. Computations were performed on the Cray machines at the San Diego Supercomputer Center under grants from the NSF Metacenter and NPACI programs.
.
8. 9.
10. 11. 12. 13.
14.
15. 16. 17. 18. 19. 20. 21. 22.
23. 24. 25. 26. 27.
28. 29. 30. 31. 32.
REFERENCES Esry, B. D.; Lin, C. D.; Greene, C. H. Phys. Rev. A 1996, 54, 394. RamaKrishna, M. V.; Whaley, K. B. Phys. Rev. Lett. 1990, 54, 1126. Sindzingre, P.; Klein, M. L.; Ceperley, D. M. Phys. Rev. Lett. 1989, 63, 1601. Becker, E. W.; Gspann, J.; Krieg, G. In Proceedings of the 14th International Conference on Low Temperature Physics, North-Holland: Otaniemi, Finland, 1975, pp 426. Gspann, J.; Vollmar, H. J. Physique 1978, 39, 330. Gsparm, J. In Physics of Electronic and Atomic Collisions; Datz, S. Ed.; North-Holland: Amster- dam, 1982, pp 79. Scheidemann, A. Ph.D. Thesis, University of Goettingen, 1989. Scheidemann, A.; Schilling, B.; Toennies, J. P.; Northby, J. Physica B 1990, 165, 135. Scheidemann, A.; Toennies, J. P.; Northby, J. A. Phys. Rev. Lett. 1990, 64, 1899. Atkins, K. R. Phys. Rev. 1959, 116, 1339. Meyer, L.; Reif, R. Phys. Rev. 1961, 123, 727. Glaberson, W. I.; Johnson, W. W. J. Low Temp. Phys. 1975, 20, 313. Schwarz, K. W. InAdvances in Chemical Phys.; Prigogine, I.; Rice, S. A. Eds.; Wiley: New York, 1975, Vol. 33, pp 1. Fetter, A. L. In The Physics of Liquid and Solid Helium; Bennemann, K. H.; Ketterson, J. B. Eds.; Wiley: New York, 1976, Vol. 1, pp 209. Rayfield, G. W.; Reif, E Phys. Rev. 1964, 136, 1194. Careri, G.; McCormick, W. D.; Scaramuzzi, R. Phys. Lett. 1992, 1, 61. Williams, G. A.; Packard, R. E. Phys. Rev. Lett. 1974, 33, 280. Williams, G. A.; Packard, R. E. J. Low Temp. Phys. 1980, 39, 353. Donnelly, R. J. Quantized Vortices in Helium I1; Cambridge University Press: Cambridge, 1991. Ellis, T.; McClintock, P. V. E. Philosophical Trans. Roy. Soc. London A 1985, 315, 259. Jortner, J.; Meyer, L.; Rice, S. A.; Wilson, E. G. Phys. Rev. Lett. 1964, 12,415. Dennis, W. S.; Durbin, E. J.; Fitzsimmons, W. A.; Heybey, O.; Waiters, G. K. Phys. Rev. Lett. 1969, 23, 1083. Keto, J. W.; Soley, E J.; Stockton, M.; Fitzsimmons, W. A. Phys. Rev. A 1974, 10, 872. Gordon, E. B.; Khmelenko, V. V.; Pelmenev, A. A.; Pugachev, O. E Physica 1981, 108B, 1311. Himbert, M.; Lezama, A.; Dupont-Roc, J. J. Physique 1985, 46, 2009. Bauer, H.; Hausmann, M.; Mayer, H. J.; Reyher, E. Phys. Lett. A 1985, IlOA, 279. Reyher, H. J.; Bauer, H.; Huber, C.; Mayer, R.; Sch~ifer, A.; Winnacker, A. Phys. Lett. A 1986, 115, 238. Bauer, H.; Beau, M.; Bernhardt, A.; Friedl, B.; Reyher, H. J. Phys. Lett. A 1989, 137, 217. Amdt, M.; Kanorsky, S. I.; Weis, A.; H~sch, T. W. Phys. Lett. A 1993, 174, 298. Fujisaki, A.; Sano, K.; Kinoshita, T.; Takahashi, Y.; Yabuzaki, T. Phys. Rev. Lett. 1993, 71, 1039. Kanorsky, S. I.; Arndt, M.; Dziewior, R.; Wies, A.; H~sch, T. W. Phys. Rev. B 1994, 50, 6296. Bauer, H.; Beau, M.; Friedl, B.; Marchand, C.; Miltner, K.; Reyher, H. J. Phys. Lett. A 1990, 146, 134.

446 K.B. WHALEY
33. Hui, Q.; Persson, J. L.; Beijersbergen, J. H. M.; Takami, M. Zeitschrififiir Physik B 1995, 98, 353. 34. Kinoshita, T.; Fukuda, K.; Takahashi, Y.; Yabuzaki, T. Zeitschriftfiir Physik B 1995, 98, 391. 35. Takahashi, Y.; Fukuda, K.; Kinoshita, T.; Yabuzaki, T. Zeitschriftfiir Physik B 1995, 98, 395. 36. Tabbert, B.; Beau, M.; Gunther, H.; Haussler, W.; zu Putlitz, G.; et al. Zeitschrififiir Physik B 1995,
97, 425. 37. Tabbert, B.; Beau, M.; Foerste, M.; GUnter, H.; Htinninger, C.; Hust, H., et al. Zeitschrififar Physik
B 1995, 98, 399. 38. Bauer, H.; Beau, M.; Fischer, J.; Reyher, H. J.; Rosenkranz, J.; Venter, K. Physica B 1990,165-166,
137. 39. Takahashi, Y.; Sano, K.; Kinoshita, T.; Yabuzaki, T. Phys. Rev. Lett. 1993, 71, 1035. 40. Persson, J. L.; Hui, Q.; Nakamura, M.; Takami, M. Phys. Rev. A 1995, 52, 2011. 41. Takami, M. Comments Atom. Mol. Phys. 1996, 32, 219. 42. Becker, E. W.; Klingelhtfer, R.; Mayer, H. Zeitschriflfiir Naturforschung 1961, 16a, 1259. 43. Becker, E. W. Zeitschrififiir Physik D 1986, 3, 101. 44. Gspann, J. Physica 1981, 108B, 1309. 45. Gspann, J.; Ries, R. Surface Sci. 1985, 156, 195. 46. Gspann, J. In Rarefied Gas Dynamics; Beloserkovskii, O. M." Kogan, M. N.; Kutateladze, S. S.;
Rebrov, A. K. Eds.; Plenum: New York, 1982, Vol. 2, pp 1187. 47. Gspann, J.; Vollmar, H. J. Chem. Phys. 1980, 73, 1657. 48. van Deursen, A. P. J.; Reuss, J. J. Chem. Phys. 1975, 63, 4559. 49. Stephens, E W.; King, J. G. Phys. Rev. Lett. 1983, 51, 1538. 50. Toennies, J. E In International School of Physics "Enrico Fermi," Course CVII, Varenna, Italy,
1988; North Holland, 1990, pp 597. 51. Buchenau, H." Northby, J." Knuth, E. L.; Toennies, J. E; Winkler, C. J. Chem. Phys. 1990, 92,
6875. 52. Lewerenz, M.; Schilling, B.; Toennies, J. E J. Chent Phys. 1995, 102, 8191. 53. Lewerenz, M.; Schilling, B.; Toennies, J. P. Chent Phys. Lett. 1993, 206, 381. 54. Harms, J.; Hartmann, M.; Sch/511kopf, W.; Toermies, J. P.; Vilesov, A. E In Atomic Physics 15
(Proceedings of the Fifteenth International Conference of Atomic Phys., Amsterdam, 1996); Linden Van den Heuvell, H. B.; Walraven, J. T. M.; Reynolds, M. W., Eds.; World Scientific: Singapore, 1997, pp. 391.
55. Gough, T. E.; Mengel, M.; Rowntree, P. A.; Scoles, G. J. Chem. Phys. 1985, 83, 4958. 56. Goyal, S.; Schutt, D. L.; Scoles, G. Phys. Rev. Lett. 1992, 69, 933. 57. Higgins, J.; Ernst, W. E.; Callegari, C.; Reho, J." Lehmann, K. K.; Scoles, G., et al. Phys. Rev. Lett.
1996, 77, 4532. 58. Stienkemeier, E; Higgins, J.; Callegari, C.; Kanorsky, S. I.; Ernst, W. E.; Scoles, G. Zeitschriflfiir
Physik D 1996, 38, 253. 59. Reho, J.; Callegari, C.; Higgins, J.; Ernst, W. E." Lehmann, K. K., et al. Faraday Discussions 1997,
10& 161. 60. Goyal, S.; Schutt, D. L.; Scoles, G. Phys. Rev. Lett. 1994, 73, 2512. 61. Goyal, S.; Schutt, D. L.; Scoles, G. J. Phys. Chent 1993, 97, 2236. 62. Frtchtenicht, R.; Toennies, J. P.; Vilesov, A. E Chem. Phys. Lett. 1994, 229, 1. 63. Hartmann, M.; Miller, R. E.; Vilesov, A." Toennies, J. P. Phys. Rev. Lett. 1995, 75, 1566. 64. Harms, J.; Hartmann, M.; Toennies, J. P.; Vilesov, A. E; J. Mol. Spec. 1997, 185, 204. 65. Hartmarm, M. Ph.D. Thesis, University of Gtttingen, 1997. 66. Matrix Isolation Spectroscopy; Barnes, A. J.; Orville-Thomas, W. J.; Muller, A.; Gaufres, R., Eds.;
D. Reidel: Dordrecht, Holland, 1981, Vol. 76, pp 603. 67. Barnett, R. N.; Whaley, K. B. J. Chem. Phys. 1993, 99, 9730. 68. Jones, L. H.; Swanson, B. I. J. Chem. Phys. 1983, 79, 1516. 69. Jones, L. H.; Swanson, B. I. J. Chem. Phys. 1984, 80, 2980. 70. Swanson, B. I.; Jones, L. H. J. Chem. Phys. 1980, 73, 986.

Dopant Spectroscopy in Helium Clusters 447
71. Swanson, B. I.; Jones, L. H. J. Chem. Phys. 1981, 74, 3205. 72. Grebenev, S.; Sartakov, B.; Toennies, J. P.; Vilesov, A. E Science 1998, 279, 2083. 73. Brink, D. M.; Stringari, S. Zeitschrififiir Physik D 1990, 15, 257. 74. Goyal, S.; Schutt, D. L.; Scoles, G. J. Phys. Chemistry 1995, 99, 6755. 75. Hartmarm, M.; Miller, R. E.; Toennies, J. P.; Vilesov, A. E Science 1996, 272, 1631. 76. Grebenev, S.; Havenith, M.; Hartmann, M.; Sartakov, B.; Toennies, J. P.; Vilesov, A. E In
preparation. 77. Behrens, M. M. S. Thesis, University of G6ttingen, 1996. 78. Behrens, M.; Buck, U." Froechtenicht, R." Hartmann, M.; Huisken, E, et al. J. Chem. Phys. 1998.
In press. 79. Fr6chtenicht, R.; Kaloudis, M.; Koch, M.; Huisken, F. J. Chem. Phys. 1996, 105, 6128. 80. Huisken, F.; Buck, U. Private communication. 81. Blume, D.; Lewerenz, M.; Huisken, F.; Kaloudis, M. J. Chem. Phys. 1996, 106, 8666. 82. Friedman, H.; Kimel, S. J. Chem. Phys. 1965, 43, 3925. 83. Durig, J. R.; Sullivan, J. E In Matrix Isolation Spectroscopy; Barnes, A. J.; Orville-Thomas, W.
J.; MUller, A.; Gaufres, R. Eds.; D. Reidel: Dordrecht, Holland, 1981, Vol. 76. 84. Warren, J. A.; Smith, G. R.; Guillory, W. A. J. Chem. Phys. 1980, 72, 4901. 85. Esser, H.; Langen, J.; Schurath, U. Berichte der Bunsen Gesellschafi fiir Physikalische Chemie
1983, 87, 636. 86. Schallmoser, G.; Thoma, A.; Wurfel, B. E.; Bondybey, V. E. Chem. Phys. Lett. 1994, 219, 101. 87. Burshtein, A. I.; Temldn, S. I. Spectroscopy of Molecular Rotation in Gases and Liquids;
Cambridge University Press: Cambridge, UK, 1994. 88. Gordon, R. J. J. Chem. Phys. 196S, 43, 1307. 89. Flygare, W. H. Molecular Structure and Dynamics; Prentice-Hall: Englewood Cliffs, NJ, 1978. 90. Holzer, W.; Le Duff, Y.; Ouillon, R. Comptes Rendus Hebdomadaires des Seances de L'Academie
des Sciences de Paris 1971, 273B, 313. 91. Orlova, N. D.; Pozdnyakova, L. A.; Khodos, E. B. Optics Spectros. 1974, 37, 340. 92. Birnbaum, G.; Ho, W. Chem. Phys. Lett. 1970, 5, 334. 93. Huong, P. V.; Couzi, M.; Perrot, M. Chem. Phys. Lett. 1970, 7, 189. 94. Orlova, N. D.; Pozbnyakova, L. A. Optics Spectros. 1973, 35, 624. 95. Galatry, L.; Robert, D. Chem. Phys. Lett. 1970, 5, 120. 96. Robert, D.; Galatry, L. J. Chem. Phys. 1971, 55, 2347. 97. Serebrennikov, Y. A.; Temldn, S. I.; Burshtein, A. I. Chem. Phys. 1983, 81, 31. 98. Talin, B.; Galatry, U; Klein, U J. Chem. Phys. 1977, 66, 2789. 99. Huisken, E; Kaloudis, M.; Vigasin, A. A. Chem. Phys. Lett. 1997, 269, 235.
100. Huisken, E; Kaloudis, M.; Koch, M. J. Chem. Phys. 1997. Submitted. 101. Behrens, M.; Buck, U.; Froechtenicht, R.; Hartmann, M.; Havenith, M.J. Chem. Phys. 1997, 107,
7179. 102. Behrens, M.; Buck, U.; Froechtenicht, R.; Hartmann, M. Unpublished. 103. Kaloudis, M. Ph.D. Thesis, University of G6ttingen, 1996. 104. Hartmann, M.; Toennies, J. P." Vilesov, A. F.; Benedek, G. Czechoslovak J. Phys. 1996, 46 ($6),
2951. 105. Hartmann, M.; Toennies, J. P.; Vilesov, A. E Unpublished. 106. Close, J. D." Federmann, E; Hoffmann, K." Quaas, N. Chem. Phys. Lett. 1997, 276, 393. 107. Bondybey, V. E.; Smith, A. M.; Agreiter, J. Chem. Rev. 1996, 96, 2113. 108. Stienkemeier, E; Higgins, J.; Ernst, W. E.; Scoles, G. Zeitschrififiir Physik B 1995, 98, 413. 109. Hartmann, M.; Mielke, E; Toennies, J. P.; Vilesov, A. F.; Benedek, G. Phys. Rev. Lett. 1996, 76,
4560. 110. van lzendoom, L. J.; Allamandola, L. J.; Baas, E; K6rnig, F.; Greenberg, J. M. J. Chem. Phys.
1986, 85, 1812. 111. Kwon, Y.; Ceperley, D. M.; Whaley, K. B. J. Chem. Phys. 1996, 104, 2341.

448 K. 13. WHALEY
112. Persistent Spectral Hole Burning: Science andApplications; Moerner, W. E., Ed.; Springer: Bedin, 1988, Vol. 44.
113. Whittle, E." Dows, D. A.; Pimentel, G. C. J. Chem. Phys. 1954, 22, 1943. 114. Stienkemeier, F.; Higgins, J.; Ernst, W. E.; Scoles, G. Phys. Rev. Lett. 1995, 74, 3592. 115. Higgins, J.; Callegari, C.; Reho, J.; Stienkemeier, F.; Emst, W. E.; Lehman, K. K., et al. Science
1996, 273, 629. 116. Stienkemeier, E; Ernst, W. E.; Higgins, J.; Scoles, G. J. Chem. Phys. 1995, 102, 615. 117. Scheidemann, A.; Kresin, V. V.; Hess, H. J. Chem. Phys. 1997, 107, 2839. 118. Ancilotto, E; Cheng, E.; Cole, M. W.; Toigo, E Zeitschrififiir Physik B 1995, 98, 323. 119. Griffin, A.; Stringari, S. Phys. Rev. Lett. 1996, 76, 259. 120. Cheng, E.; McMahon, M. A.; Whaley, K. B. J. Chem. Phys. 1996, 104, 2669. 121. Hui, Q.; Persson, J. L.; Beijersbergen, J. H. M.; Takami, M. Laser Chem. 1995, 15, 221. 122. Foerste, M." Gabrysch, M.; Gunther, H.; Kunze, M.; zu Putlitz, G.' et al. Czechoslovak J. Phys.
1996, 46, 367. 123. Tabbert, B.; Beau, M. R.; Fischer, J." zu Putlitz, G. Physica B 1994, 194, 731. 124. Persson, J. L.; Hui, Q.; Jakubek, Z. J.; Nakamura, M.; Takami, M. Phys. Rev. Lett. 1996, 76, 1501. 125. Pietrowski, R. v.; Rutzen, M.; Haeften, K. v.; Kakar, S.; M611er, T. Zeitschrift~r Physik D 1997,
40, 22. 126. Callegari, C.; Higgins, J.; Stienkemeier, E; Scoles, G. J. Phys. Che~ A 1998, 102, 95. 127. Bartelt, A.; Close, J. D.; Federmarm, E; Hoffmann, K.; Qaas, N.; Toennies, J. P. Zeitschriflfiir
Physik D 1997, 39, 1. 128. Bartelt, A.; Close, J. D.; Federmann, E; Quaas, N.; Toennies, J. P. Phys. Rev. Lett. 1996, 77,
3525. 129. Harms, J.; Toennies, J. P.; Dalfovo, E Phys. Rev. B 1998. In press. 130. Hess, H.; Larsen, D. S.; Scheidemann, A. Preprint 1997. 131. Scheidemann, A.; Schilling, B.; Toennies, J. P. J. Phys. Chent 1993, 97, 2128. 132. Fr'ochtenicht, R.; Henne, U.; Toennies, J. P.; Ding, A.; Fieber-Erdmarm, M.; Drewello, T. J. Chem.
Phys. 1996, 104, 2548. 133. Callicoatt, B. E.; Mar, D. D.; Apkarian, V. A.; Janda, K. C. J. Chent Phys. 1996, 105, 7872. 134. Kojima, T. M.; Kobayashi, N.; Kaneko, Y. Z. Phys. D 1992, 22, 645. 135. Gspann, J. Physica B 1991, 169, 519. 136. Northby, J. A.; Kim, C.; Jian, T. Physica B 1994, 197, 426. 137. Farnik, M.; Henne, U.; Samelin, B.; Toennies, J. P. Phys. Rev. Lett. 1998. Submitted. 138. Grimes, C. C.; Adams, G. Phys. Rev. B (Condensed Matter) 1990, 41, 6366. 139. Grimes, C. C.; Adams, G. Phys. Rev. B 1992, 45, 2305. 140. Kim, C.; Yurgenson, S.; Northby, J. A. Zeitschriftfiir Physik D 1997, 40, 119. 141. Cline, J. J.; Reid, B. P." Evard, D. D.; Sivakumar, N.; Halberstadt, N." Janda, K. C. J. Chem. Phys.
1988, 89, 3535. 142. Bieske, E. J.; Nizkorodov, S.; Friedmann, A.; Maier, J. P. Int. J. Mass Spectrom. 1994, 135, 19. 143. Fredj, E.; Gerber, R. B.; Ratner, M. A. J. Chem. Phys. 1996, 105, 1121. 144. Garcia-Vela, A.; Villareal, P." Delgado-Barrio, G. J. Chem. Phys. 199@ 92, 6504. 145. Barranco, M.; Hernandez, E. S. Phys. Rev. B 1994, 49, 12078. 146. Hernandez, E. S.; Barranco, M. Phys. Rev. B 1995, 51, 9364. 147. Casas, M.; Dalfovo, E; Lastri, A.; Serra, L.; Stringari, S. Zeitschriftfi~r Physik D 1995, 35, 67. 148. Brown, D.; Clary, D. J. Chem. Phys. 1996, 105, 7597. 149. Kalos, M. H.; Whitlock, P. Monte Carlo Methods; Wiley: New York, 1986, Vol. I. 150. Hammond, B. L.; Reynolds, P. J.; Lester, W. A. Monte Carlo Methods in Ab Initio Quantum
Chemistry; World Scientific: Singapore, 1994. 151. Metropolis, N.; Rosenbluth, A. W.; Rosenbluth, M. N.; Teller, A. H.; Teller, E. J. Chent Phys.
1953, 21, 1087. 152. Barnett, R. N.; Whaley, K. B. Phys. Rev. A 1993, 47, 4082.

Dopant Spectroscopy in Helium Clusters 449
153. Lewerenz, M. To be published. 154. Ramakrishna, M. V.; Whaley, K. B. Zeitschriftfar Physik D 1990, 20, 223. 155. Cheng, E.; Patel, M.; Whaley, K. B. To be published. 156. Usmani, O. N.; Fantoni, S.; Pandharipande, V. R. Phys. Rev. B 1982, 26, 6123. 157. McMillan, C. W. Phys. Rev. A 1965, 138, 442. 158. Pandharipande, V. R.; Pieper, S. C.; Wlringa, R. B. Phys. Rev. B 1986, 34, 4571. 159. Chin, S. A.; Krotscheck, E. Phys. Rev. B 1992, 45, 852. 160. Rick, S. W.; Doll, J. D. J. Chem. Phys. 1991, 95, 3605. 161. Hoos, G. M. S. Thesis, University of G6ttingen, 1994. 162. McMahon, M. A.; Whaley, K. B. J. Chem. Phys. 1995, 103, 2561. 163. Bacic, Z.; Kennedy-Manduziak, M.; Moskowitz, J. W.; Schmidt, K. E. J. Chem. Phys. 1992, 97,
6472. 164. Niyaz, P.; Bacic, Z.; Moskowitz, J. W.; Schmidt, K. E. Chem. Phys. Lett. 1996, 252, 23. 165. Chin, S. A.; Krotscheck, E. In Recent Progress in Many-Body Theories; Schachinger, E. Ed.;
Plenum Press: New York, 1995, Vol. 4. 166. Barnett, R. N.; Whaley, K. B. J. Chem. Phys. 1995, 102, 2290. 167. McMahon, M. A.; Barnett, R. N." Whaley, K. B. J. Chem. Phys. 1993, 99, 8816. 168. Chin, S. A.; Krotscheck, E. Phys. Rev. B 1995, 52, 10405. 169. Anderson, J. B. J. Chem. Phys. 1975, 63, 1499. 170. Anderson, J. B. Int. Rev. Phys. Chem. 1995, 14, 285. 171. Suhm, M. A.; Watts, R. O. Phys. Rep. 1994, 204, 293. 172. Hollenstein, H.; Marquadt, R. R.; Quack, M.; Suhm, M. A. J. Chem. Phys. 1994, 101, 3588. 173. Wells, B. H. Chem. Phys. Lett. 1985, 115, 89. 174. Sandier, P.; Buch, V.; Clary, D. J. Chem. Phys. 1994, 101, 6353. 175. Buch, V. J. Chem. Phys. 1992, 97, 726. 176. Gregory, J. K.; Clary, D. C. J. Phys. Chem. 1995, 102, 7817; Gregory J. K.; Clary, D. C. J. Phys.
Chem. 1996, I00, 18014. 177. Broude, S.; Gerber, R. Chem. Phys. Len. 1996, 258, 416. 178. Brown, D. F. R.; Gregory, J. K.; Clary, D. C. J. Chem. Soc., Faraday Trans. 1996, 92, I I. 179. Vegiri, A.; Alexander, M.; Gregurick, S.; McCoy, A. B.; Gerber, R. B. J. Chem. Phys. 1994, 101,
2577. 180. Reynolds, P. J.; Ceperley, D. M.; Alder, B. J.; I.aster, W. A. J. Chem. Phys. 1982, 77, 5593. 181. Kalos, M. H.; Levesque, D.; Verlet, L. Phys. Rev. A 1974, 9, 2178. 182. Chin, S. A. Phys. Rev. A 1990, 42, 699 I. 183. Umrigar, C. J.; Nightingale, M. P.; Runge, K. J. J. Chem. Phys. 1993, 99, 2865. 184. Liu, K. S.; Kalos, M. H.; Chester, G. V. Phys. Rev. A 1974, I0, 303. 185. Furry, W. H. Phys. Rev. 1957, 107, 7. 186. Schulman, L. Phys. Rev. 1968, 176, 1558. 187. Lee, E.; Farrelly, D.; Whaley, K. B. J. Chem. Phys. 1998. Submitted. 188. Blume, D.; Lewerenz, M.; Niyaz, P.; Whaley, K. B. Phys. Rev. E 1997, 55, 3664. 189. Jarrell, M.; Gubematis, J. E. Phys. Rep. 1996, 269, 133. 190. Bryan, R. K. Eur. Biophys. J. 1990, 18, 165. 191. Blume, D.; Lewerenz, M.; Whaley, K. B. Mathematics and Computers in Simulation 1998, 47,
135. 192. Blume, D.; Lewerenz, M.; Whaley, K. B. J. Chem. Phys. 1997, 107, 9067. 193. Feynman, R. P. Statistical Mechanics; Benjamin-Cummins: Reading, MA, 1972. 194. Ceperley, D. M. Rev. Mod. Phys. 1995, 67, 279. 195. Chandler, D.; Wolynes, P. J. J. Chem. Phys. 1981, 74, 4078. 196. Klemm, A. D.; Storer, R. G. Australian J. Phys. 1973, 26, 43. 197. Scharf, D.; Martyna, G. J.; Klein, M. L. J. Chem. Phys. 1993, 99, 8997. 198. Janzen, A. R.; AzJz, R. A. J. Chem. Phys. 1995, 103, 9626.

450 K.B. WHALEY
199. Efimov, V. Comments Nuclear Particle Phys. 1990, 19, 271. 200. Efimov, V. Phys. Lett. 1970, 33B, 563. 201. Efimov, V. Soviet J. Nuclear Phys. 1971, 12, 589. 202. Tang, K. T.; Toennies, J. P.; Yiu, C. L. Phys. Rev. Lett. 1995, 74, 1546. 203. RamaKrishna, M. V.; Whaley, K. B. J. Chem. Phys. 1990, 93, 8939. 204. Barnett, R. N.; Whaley, K. B. J. Chem. Phys. 1992, 96, 2953. 205. Schollkopf, W.; Toennies, J. P. J. Chem. Phys. 1996, 104, 1155. 206. Whaley, K. B. Int. Rev. Phys. Chem. 1994, 13, 41. 207. Mushinski, A.; Nightingale, M. P. J. Chem. Phys. 1994, 101,883. 208. McMahon, M. A.; Barnett, R. N.; Whaley, K. B. J. Chem. Phys. 1996, 104, 5080. 209. Lewerenz, M. J. Chem. Phys. 1997, 106, 4596. 210. Aziz, R. A.; McCourt, E R. W.; Wong, C. C. K. Mol. Phys. 1987, 61, 1487. 211. Ceperley, D. M. Unpublished. 212. Lewerenz, M. Unpublished. 213. Barnett, R. N.; Whaley, K. B. Zeitschriftfiir Physik D 1994, 31, 75. 214. Lewerenz, M. To be published. 215. Lewerenz, M. Private communication. 216. Kleinekath6fer, U.; Lewerenz, M.; Mladenovic, M. Phys. Rev. Lett. 1998. Submitted. 217. Wu, J. Ph.D. Thesis, University of Washington, Seattle, 1995. 218. Eichenauer, D.; Harten, U.; Toennies, J. P.; Celli, V. J. Chem. Phys. 1987, 86, 3693. 219. Hickman, A. P.; Lane, N. E Phys. Rev. Lett. 1971, 26, 1216. 220. Carrington, A.; Leach, C. A.; Marr, A. J.; Shaw, A. M.; Viant, M. R.; Hutson, J. M. et al. J. Chem.
Phys. 1995, 102, 2379. 221. Martyna, G.; Berne, B. J. J. Chem. Phys. 1989, 90, 3744. 222. Gay, J. G.; Berne, B. J. Phys. Rev. Lett. 1982, 49, 194. 223. Scharf, D.; Martyna, G.; Klein, M. Chem. Phys. Lett. 1992, 197, 231. 224. Kinugawa, K.; Moore, P. B.; Klein, M. L. J. Chem. Phys. 1997, 106, 1154. 225. Alexander, M. H.; Walton, A. R.; Yang, M.; Yang, X.; Hwang, E.; Dagdigian, P. J. J. Chem. Phys.
1997, 106, 6320. 226. Chakravarty, C. Phys. Rev. Lett. 1995, 75, 1727. 227. Chakravarty, C. J. Chem. Phys. 1996, 104, 7223. 228. Buch, V. J. Chem. Phys. 1994, 100, 7610. 229. Moszynski, R.; Jeziorski, B." van der Avoird, A.; Wormer, P. E. S. J. Chem. Phys. 1994, 101, 2825. 230. Zenevich, V. A.; Lindinger, W.; Billing, G. D. J. Chem. Phys. 1992, 97, 7257. 231. Eichenauer, D." LeRoy, R. J. J. Chem. Phys. 1988, 88, 2898. 232. Lewerenz, M. J. Chem. Phys. 1996, 104, 1028. 233. Beck, D. R.; Watts, R. O. Preprint. 234. Beck, D. R.; Henkelmann, G.; Watts, R. O. Preprint. 235. Manz, J. J. Am. Chem. Soc. 1981, 102, 1802. 236. Sartakov, B.; Vilesov, A. E; Whaley, K. B. Unpublished. 237. McMahon, M. A.; Barnett, R. N.; Whaley, K. B. Zeitschriftfiir Physik B 1995, 98, 421. 238. Toennies, J. P.; Vilesov, A. E Chem. Phys. Lett. 1995, 235, 596. 239. Bailing, L. C.; Wright, J. J. J. Chem. Phys. 1983, 79, 2941. 240. Cheng, E.; Whaley, K. B.J. Chem. Phys. 1996, 104, 3155. 241. Lewerenz, M.; Whaley, K. B. Unpublished. 242. Kleinekathofer, U.; Tang, K. T.; Toennies, J. P.; ~u, C. L. Chem. Phys. Lett. 1996, 249, 257. 243. Konowalow, D. In High Energy Density Matter (HEDM) Conference; USAF Phillips Laboratory,
Edwards Air Force Base: Woods Hole, MA, 1993. 244. Carrick, P. In High Energy Density Matter (HEDM) Conference; USAF Phillips Laboratory,
Edwards AFB, CA: Woods Hole, MA, 1993, pp 1. 245. Langhoff, P. J. Phys. Chemistry 1997, 100, 2974.

Dopant Spectroscopy in Helium Clusters 451
246. Blume, D.; Lewerenz, M.; Mladenovic, M.; Whaley, K. B. J. Chent Phys. Submitted. 247. Pryce, M. H. L. In Phonons in Perfect Lattices and in Lattices with Point Imperfections; Oliver &
Boyd: Edinburgh and London, 1966, pp 403. 248. Keil, M.; Danielson, L. J.; Dunlop, P. J. J. Chent Phys. 1991, 94, 296.

This Page Intentionally Left Blank

INDEX
Ab initio characterization of water and anion-water clusters, 281-309
Aligned bimolecular reactions dynamics of, 46 in molecular clusters, 46-51 potential energy map of, 48 spectroscopic studies, 46 transition state studies of, 49
Anion-water cluster ab initio characterization of,
281-309 equilibrium properties of, 72, 73 geometry of, 72, 73, 75 theoretical treatment of, 76-79
Argon-water photodissociation dynamics of, 73-79 energetics and dynamics of, 61-89 Jacobi coordinates of, 66 microwave studies, 72 potential function for, 67-69 quasiclassical trajectory method.
79-81, 86 results, 81-87 trimer studies, 72-73
Arn-HF clusters, 177-180 HF frequency shifts in, 178
Barrier crossing in molecular clusters, 51-52
trans-stilbene photoisomerization studies, 51, 52
Benzene-(methanol)2, spectroscopic studies of, 261
Benzene-( methanol )3 diagram of, 262, 269 spectroscopic studies of, 254, 261 theoretical studies of, 261
Benzene-(water)2, spectroscopic studies of, 261
Benzene-(water) n diagram of, 271 hydrogen-bonded cubes, 273-278 simulated spectra of, 271 spectroscopic studies of, 269, 270
Benzene-water studies, 253-257 OH potential plot, 256 rigid body diffusion Monte Carlo
studies of, 327 spectroscopic studies of, 254
Charge transfer transition state benzene-iodine system, 22, 23 dynamics of, 25, 26 geometry of, 25 mechanism of, 25, 26 in molecular clusters, 22
CN and Ar, 120-123 dynamics of, 120-123
453

454 INDEX
energy gap dependence of, 1 04 excitation spectrum of, 121 photofragment excitation spectrum
for, 122 relaxation dynamics of, 104 spectroscopy of, 120-123 studies, 99 theoretical treatment of, 100
CN and Ne action spectrum of, 110, 111 allowed rotational transitions of, 106 collision dynamics, 118-119 decay of, 116 dynamics of, 105-118 effective angular potential energy
curves for, 108 electronic predissociation of, 107,
109 OODR spectrum of, 112 photofragment excitation spectrum
of, 115 potential energy surfaces for, 97 predissociation of, 117 properties in solid Ne, 119-120 radial dependence on, 98 rotations transitions of, 113 spectroscopy of, 105-118 spin-orbit predissociation of, 113
CN and rare gas atoms ab initio calculations of, 96-99 and collisional energy transfer,
99-102 dynamics of, 102-105 spectroscopy of, 102-105
CN potential energy curves for, 93 theoretical treatment of, 94-96
CN radicals, interactions with rare gas atoms, 91-126
Collisional transfer in a homonuclear diatomic molecule, 101
Coulomb interactions, in molecular clusters, 17
Depletion spectroscopy, 132-135 instrumentation for, 133
Diatom-diatom system, Jacobi coordinates for, 186
Diffusion Monte Carlo studies, 419-424
and use of Schr&linger equation, 314,315
benzene-water studies, 327 continuous weighting, 316, 317 descendant weighting, 318 description of, 314-321 excited states treatment, 320, 321 isomorphism in, 314-316 random walk calculations, 316 reference energy, 317 rigid body, 318-320 tunneling in, 325-326 water clusters, 311-363
Diffusion quantum Monte Carlo techniques, 213, 214
symmetry restricted approach, 214 Discrete variable representation, of
water trimer, 378 Doped helium clusters
Ag doping of, 434 atomic doping, 427-435 C1 doping of, 430, 432 diffusion Monte Carlo studies,
419-424 dopants used, 408 electronic spectroscopy of,
407-411,441-443 electronic spectroscopy of dopants,
443,444 embedded, 410 experimental studies of, 401-412 HF doping of, 430 infrared spectroscopy of, 402-407,
436-441 ionization studies, 411, 412 molecular doping, 427-435 molecular rotations in, 404

Index 455
molecular vibrations in, 406 pair interaction well depth, 428 path integral Monte Carlo studies,
424-426 rare gas doping of, 432, 434 scattering studies, 411, 412 SF 6 doping of, 430, 431,433 sodium doping of, 429, 430 spectroscopy and microscopic
theory of, 397-451 spectroscopy calculations of, 436 structural studies, 426-436 variational Monte Carlo studies,
413-319 and weakly bound species, 409
Doped hydrogen clusters, 435,436 electronic spectroscopy of, 441-443
Effective molecular symmetry group, 366-368
Electron transfer, in molecular clusters, 21-31
Fluorescence-dip IR spectroscopy, 253 Full-dimensional quantum
calculations, 81
(HC1) 2 dependence on intermolecular
vibrational excitations, 196-200 dissociation energies of, 184, 195 donor-acceptor interchange, 192 donor-acceptor interchange
tunneling splittings, 195-200 dynamics of, 183-204 equilibrium geometries of, 192 intra- and intermolecular vibrations
of, 200-202 isotope effect, 195, 196 potential energy surfaces of,
190-193 stretch excitations of, 196
vibration-rotation-tunneling dynamics of, 193-202
HCN chains, 174 dipole moments of, 176 energies, 175 separation distances as function of
chain length, 175 He N , structural studies, 426, 427 HF clusters
classical approximations of, 215-218
comparison of dynamical methods for, 212
dynamics of, 209, 210 harmonic approximations of,
215-218 Monte Carlo analyses of, 213-215 potential energy hypersurfaces of,
209-211 quantum dynamical approaches for,
211-218 spectroscopic methods for, 208,209 spectroscopy and quantum
dynamics of, 205-248 variational techniques for, 211
(H~2 and hydrogen bond libration, 226,
227 contour plot of, 193 correlation of ground-state
tunneling, 222 dependence on intermolecular
vibrational excitations, 196-200 dissociation energies of, 194, 195 donor-acceptor interchange, 192 donor-acceptor interchange
tunneling splittings, 195-200 dynamics of, 2, 183-204, 218-227 energy level scheme for, 219 energy pathway of, 216, 217 equilibrium geometries of, 192

456 INDEX
experimental and theoretical anharmonic transition wavenumbers for, 220, 221
hydrogen bond dissociation of, 225, 226
hydrogen bond interconversion, 218-225
intra- and intermolecular vibrations of, 200-202
isotope effect, 195, 196 potential energy surfaces of,
190-193 rovibrational states of, 218 spectroscopy of, 218-227 stretch excitations of, 196 tunneling slow-down of, 223, 224 tunneling splittings trends of, 224 vibration-rotation-tunneling
dynamics of, 193-202 dissociation energy path for, 229 dynamics of, 227-230 spectroscopy of, 227-230
(HF)~ concerted hydrogen exchange, 237,
238 dissociation energy, 236 FTIR analysis of, 231-233,239, 240 intracluster vibrational
redistribution of, 235 isotope studies of, 237 nanocluster dynamics, 238-241 spectral dependence on size, 242 spectroscopy of, 230-238 stretching frequency shift
predictions of, 234, 235 Hole-burning spectroscopy, 251,252 Hydrazine clusters
bound H atoms in, 155 Hydrazine clusters
calculated minimum energy configurations of, 153
experimental methods, 151 photodissociation of, 152
spectroscopic methods, 152 vibrational spectroscopy of,
151-155 Hydrogen bonding, and clusters, 165 Hydrogen-bonded chains, 260-263 Hydrogen-bonded clusters
benzene-water studies, 253-257 experimental methods for, 251-253 H-re bonds, 253-257 IR spectroscopy of, 249-280
Hydrogen-bonded cubes geometries of, 274 OH stretch vibrational frequency
shifts of, 277 resonant ion-dip IR spectra of, 276 spectroscopic studies of, 273-278 two-photon ionization spectrum of,
275 Hydrogen-bonded cycles
diagrams of, 265 hydrogen bonding in, 264 spectroscopic studies of, 263,266,
267
Iodine/carbon dioxide systems, 18 Isoquinoline, excited state decay times
of, 3
Jacobi coordinates, 66
Methanol clusters bondlength fluctuations of hexamer,
148 calculated minimum energy
configurations of, 141 calculations for weakly bound, 147 dimer, 142 isomeric transitions, 146 line shifts of, 143 low energy isomers of hexamer, 149 melting, 146 odd-sized, 142 OH stretch mode, 144

Index 457
photodissociation spectra of dimer, 144
photodissociation spectra of selected clusters, 140, 144
temperature dependence on, 150 vibrational spectroscopy of, 139
Microscopic theoretical methods, 412-426
Molecular clusters, 1-60 aligned bimolecular reactions,
46-51 and barrier crossing, 51-52 B-state excitation, 10 bond dynamics of, 5-21 charged solute molecule, 17-19 and charge transfer transition state,
21 condensed-phase studies, 19-20 and Coulomb interactions, 17 dimer systems, 5 dissociation of, 8-11 double proton transfer, 41-44 dynamics and mechanism of, 25, 26 and electron transfer, 21-31 high-pressure, supercritical studies,
11-17 iodine systems, 5-7 lifetimes of, 8 liquid phase comparison, 27 photochemical studies of, 62 and pressure effects, 26, 27 and proton transfer, 31--46 reactivity, 1-60 real-time dynamics, 1-60 recombination of, 8-11 temperature dependence on, 20 transition state geometries of, 25 and tunneling, 40 vibrational predissociation of, 5-7
Monte Carlo algorithms, 412-426
Negative ion-water clusters, 294-305 calculated geometries of, 303
calculated PES of, 296 comparison of ions, 295 description of, 294 fluoride, 297 geometries of, 295, 302 hydrogen bonding in, 300 hydroxide, 296, 297, 298 interaction energies for, 299 optimal internal coordinates for, 299 PES of, 294-300 structures of, 300-304 structures of large clusters, 304, 305 trimers, 301
Newton diagram, 131
Pair interaction well depth, of doped helium clusters, 428
Path integral Monte Carlo studies, 424-426
Photodissociation, argon-water system, 61-90
Proton transfer in molecular clusters, 31-46
alcohols, 32-41 in amines, 44-46 in ammonia, 45 aromatic alcohols, 32 barrier properties, 38 in base pairs, 42 basicity dependence, 34 double proton transfer, 41--44 energetics of, 36, 37 energy diagram of, 33 and ionization efficiency, 36 phase comparisons of, 34 solvent dependence, 34 and solvent structure, 36 tunneling model, 38, 39, 53-56
Quantum bound-state calculations, 183-204
coordinate system of, 184-188 Hamiltonian of, 185-188

458 INDEX
Quantum dynamics of HF, 205-248 Quantum Monte Carlo
diffusion, 167 procedure for, 167-169
Quantum Monte Carlo vibrational analysis, three-body effects in weakly bound clusters, 163-182
Quasiadiabatic channel quantum Monte Carlo Method, 215
Quasiclassical trajectory method, 79-81
versus full-dimensional quantum calculations, 80, 81
Rare gas atoms, interactions with CN radicals, 91-126
Rearrangements, in water clusters, 365-396
Resonant ion-dip IR spectroscopy, 252, 253
Resonant two-photon ionization, 251 Rigid body diffusion Monte Carlo
studies, 318-320
Schr6dinger equation, 314, 315 Small-size clusters, vibrational
spectroscopy of, 127-161
Three-body effects in weakly bound clusters, 163-182
calculations of, 176 dipole moments of, 176 HCN chain energies, 174, 175 separation distances as function of
chain length, 175 trans-Stilbene, photoisomerization
studies, 51, 52 Tropolone-water studies
comparisons of tautomers, 258 fluorescence-dip IR spectrum of,
259 hydrogen bond studies of, 257-260
Tunneling, 365-396 correlated sampling, 326, 327 description of, 321-324 in diffusion Monte Carlo
calculations, 325 in excited state, 336 hydrogen exchange, 323 in water trimers, 333, 334 molecular symmetry considerations,
324 potential energy curves of, 322 umbrella inversion, 322, 323
Variational Monte Carlo studies, 413-419
Vibrational feedback in generating potentials, 169-172
argon and hydrogen sulfide, 170-172
effect of equilibrium structure, 169 isotope effects, 171, 172
Vibrational spectroscopy, 138, 139 experimental methods, 130-135 hydrazine clusters, 151-155 instrumentation for, 131 methanol clusters, 139-151 methanol CO stretch, 139 of small-size clusters, 127-161 potential models, 135, 136 theoretical methods, 135-139
Water clusters ab initio characterization of,
281-309 association energies in, 355 diffusion Monte Carlo studies of,
311-363 dimer, 283 energetics of, 290-294 geometry optimizations of, 368-370 harmonic vibrational frequency
shifts of, 292 hexamer, 286, 288

Index 459
hydrogen bond energies in, 355, 356 hydrogen bonding experimental and
theoretical shifts in, 293 hydrogen bonding in, 288, 292 minima of, 287 negative ion, 294-305 (See also
Negative ion-water clusters) O-O distances in, 357, 358 O-O variation in, 289, 290 pentamer, 286 PES simulation of, 327-329 rearrangement pathways in,
368-370 rearrangements and tunneling in,
365-396 relaxation energies in, 354 relaxations effects in, 353, 354 rotational constants, 357 size trends, 353-358 structural trends in, 289 structures of, 283-290 tetramer, 285 trimer, 284 tunneling in, 321-327 (See also
Tunneling) variations of electronic energy
difference, 290, 2921 vibrational spectra of, 291-294 zero-point energies in, 354, 355
Water dimer, 283 calculations of rearrangement, 371 configuration of, 283 don or- acceptor-interch ange
rearrangement of, 372, 373 excited states of, 331 intermolecular separation of, 284 isotope studies, 330, 370 isotopomers of, 331 PES of, 328 rearrangements and tunneling in,
370-373 tunneling splittings, 329, 330 van der Waals, 329
Water hexamer, 286, 344-353 bifurcation mechanism, 392 boat structure, 346, 347 book structure, 346, 347 cage structures, 345-348, 351,352 cyclic structure, 346, 347 description of, 344, 345 dynamics of, 345-350 forms for, 389, 390 isomers of, 288 prism structure, 346, 347 quantum simulations, 350-352 rearrangement mechanisms for, 390 single flip mechanism, 391 structure of, 345
Water pentamer, 286, 339-344 bifurcation mechanism, 386, 387 cyclic minimum energy structure of,
340 description of, 339-340 dynamics of, 340 rearrangements and tunneling in,
341,386-388 single flip mechanism, 386 tunneling splittings for, 342 wavefunctions in, 342, 343
Water tetramer, 285 calculated rearrangement
mechanisms for, 384, 385 description of, 336 dynamics of, 337-339 FIR-VRT experiments on, 381 internal coordinates for, 338 isotope studies of, 381 minimum energy structure of, 337 PES, 382, 383 rearrangements and tunneling in,
381-385 wavefunctions of, 339
Water trimer bifurcation rearrangement of, 376 calculated tunneling splitting
patterns of, 377

460 INDEX
cyclic minimum energy structure of, 332
diffusion Monte Carlo studies of, 378, 379
discrete variable representation of, 378, 379
dynamics of, 333,374 excited state tunneling in, 336 geometries of, 374 global minima of, 285 isotopic studies of, 335 lowest lying torsional states of, 380 PES of, 284
quantum dynamical treatment of, 378
rearrangements and tunneling in, 373-381
single-flip rearrangement of, 375 spectroscopic studies of, 332 splitting patterns in 334 tunneling of, 333
Wave packet motion, 12 Weak interaction potentials, 172-174
theoretical treatment of, 173
Zero phonon line, 408