Molecular identification of Physalis species (Solanaceae ... · Draft 2 30 Abstract: 31 Physalis...
21
Draft Molecular identification of Physalis species (Solanaceae) using a candidate DNA barcode: the chloroplast psbA–trnH intergenic region Journal: Genome Manuscript ID gen-2017-0115.R2 Manuscript Type: Article Date Submitted by the Author: 07-Sep-2017 Complete List of Authors: Feng, Shangguo; Hangzhou Normal University, College of Life and Environmental Sciences Jiao, Kaili; Hangzhou Normal University Zhu, Yujia; Hangzhou Normal University Wang, Hongfen; Shandong Xiajin First Middle School Jiang, Mengying; Hangzhou Normal University Wang, Huizhong; Hangzhou Normal University, College of Life and Environmental Sciences Is the invited manuscript for consideration in a Special Issue? : This submission is not invited Keyword: Physalis, DNA barcoding, psbA–trnH region, molecular identification https://mc06.manuscriptcentral.com/genome-pubs Genome
Transcript of Molecular identification of Physalis species (Solanaceae ... · Draft 2 30 Abstract: 31 Physalis...

Draft
Molecular identification of Physalis species (Solanaceae)
using a candidate DNA barcode: the chloroplast psbA–trnH intergenic region
Journal: Genome
Manuscript ID gen-2017-0115.R2
Manuscript Type: Article
Date Submitted by the Author: 07-Sep-2017
Complete List of Authors: Feng, Shangguo; Hangzhou Normal University, College of Life and
Environmental Sciences Jiao, Kaili; Hangzhou Normal University Zhu, Yujia; Hangzhou Normal University Wang, Hongfen; Shandong Xiajin First Middle School Jiang, Mengying; Hangzhou Normal University Wang, Huizhong; Hangzhou Normal University, College of Life and Environmental Sciences
Is the invited manuscript for consideration in a Special
Issue? : This submission is not invited
Keyword: Physalis, DNA barcoding, psbA–trnH region, molecular identification
https://mc06.manuscriptcentral.com/genome-pubs
Genome

Draft
1
Molecular identification of Physalis species (Solanaceae) using a candidate DNA 1
barcode: the chloroplast psbA–trnH intergenic region 2
Shangguo Feng 1, 2
, Kaili Jiao 2, Yujia Zhu
2, Hongfen Wang
3, Mengying Jiang
2, 3
Huizhong Wang 2, * 4
1 College of Bioscience & Biotechnology, Hunan Agricultural University, Changsha 5
410128, China 6
2 Zhejiang Provincial Key Laboratory for Genetic Improvement and Quality Control 7
of Medicinal Plants, College of Life and Environmental Sciences, Hangzhou Normal 8
University, Hangzhou 310036, China 9
3 Shandong Xiajin First Middle School, Xiajin 253200, China 10
11
12
*Corresponding author 13
Huizhong wang: [email protected]. 14
The email addresses of the other co-authors: [email protected] (Shangguo 15
Feng), [email protected] (Kaili Jiao), [email protected] (Yujia Zhu), 16
[email protected] (Hongfen Wang), [email protected] (Mengying Jiang). 17
18
19
20
21
22
23
24
25
26
27
28
29
Page 1 of 20
https://mc06.manuscriptcentral.com/genome-pubs
Genome

Draft
2
Abstract: 30
Physalis L., an important genus of the family Solanaceae, includes many 31
commercially important edible and medicinal species. Traditionally, species 32
identification is based on morphological traits; however, the highly similar 33
morphological traits among Physalis species make this approach difficult. In this 34
study, we evaluated the feasibility of using a popular DNA barcode, the chloroplast 35
psbA–trnH intergenic region, in the identification of Physalis species. Thirty-six 36
psbA–trnH regions of Physalis species and of the closely related plant Nicandra 37
physalodes were analyzed. The success rates of PCR amplification and sequencing of 38
the psbA–trnH region were 100%. MEGA V6.0 was utilized to align the psbA–trnH 39
sequences and to compute genetic distances. The results show an apparent barcoding 40
gap between intra- and inter-specific variations. Results of both BLAST1 and 41
nearest-distance methods prove that the psbA–trnH regions can be used to identify all 42
species examined in the present study. In addition, phylogenetic analysis using 43
psbA–trnH data revealed a distinct boundary between species. It also confirmed the 44
relationship between Physalis species and closely related species, as established by 45
previous studies. In conclusion, the psbA–trnH intergenic region can be used as an 46
efficient DNA barcode for the identification of Physalis species. 47
Keywords: Physalis; DNA barcoding; psbA–trnH region; molecular identification 48
49
50
51
52
53
54
55
56
57
58
59
Page 2 of 20
https://mc06.manuscriptcentral.com/genome-pubs
Genome

Draft
3
Introduction 60
Physalis is one of the important genera of the plant family Solanaceae, 61
comprising ranged from 75 to 120 species (Maggie 2005; Martinez 1998; Chinese 62
Academy of Sciences 1978; Wei et al. 2012). Most Physalis species are distributed in 63
tropical and temperate regions of the Americas, and a few species are native to 64
Eurasia and Southeast Asia (Feng et al. 2016; Maggie 2005; Martinez 1998; Chinese 65
Academy of Sciences 1978; Wei et al. 2012). In China, there are five Physalis species 66
(Physalis alkekengi, P. angulate, P. peruviana, P. pubescens, and P. minima) and two 67
varieties (P. alkekengi var. franchetii, P. angulate var. villosa), which are mainly 68
distributed in the eastern, central, southern and southwestern regions (Chinese 69
Academy of Sciences 1978). Because of their high content of vitamins, minerals, and 70
antioxidants, many Physalis species possess potential medicinal properties such as 71
anti-bacterial, anti-inflammatory, and anti-cancer activity (Hong et al. 2015; Ji et al. 72
2012; Wei et al. 2012). For example, P. alkekengi var. franchetii, a standard medical 73
plant recorded in the Pharmacopoeia of the People’s Republic of China, is used in 74
traditional Chinese medicine for the treatment and prevention of sore throat, tumors, 75
cough, leishmaniasis, eczema, hepatitis, and urinary problems (Chinese 76
Pharmmacopoeia Editorial Committee 2015; Yang et al. 2016). Moreover, some 77
Physalis species such as P. philadelphica, P. peruviana, and P. pubescens are 78
extensively cultivated for their edible fruits in many regions of the world (Sang-Ngern 79
et al. 2016; Zamora-Tavares et al. 2015; Zhang et al. 2016). 80
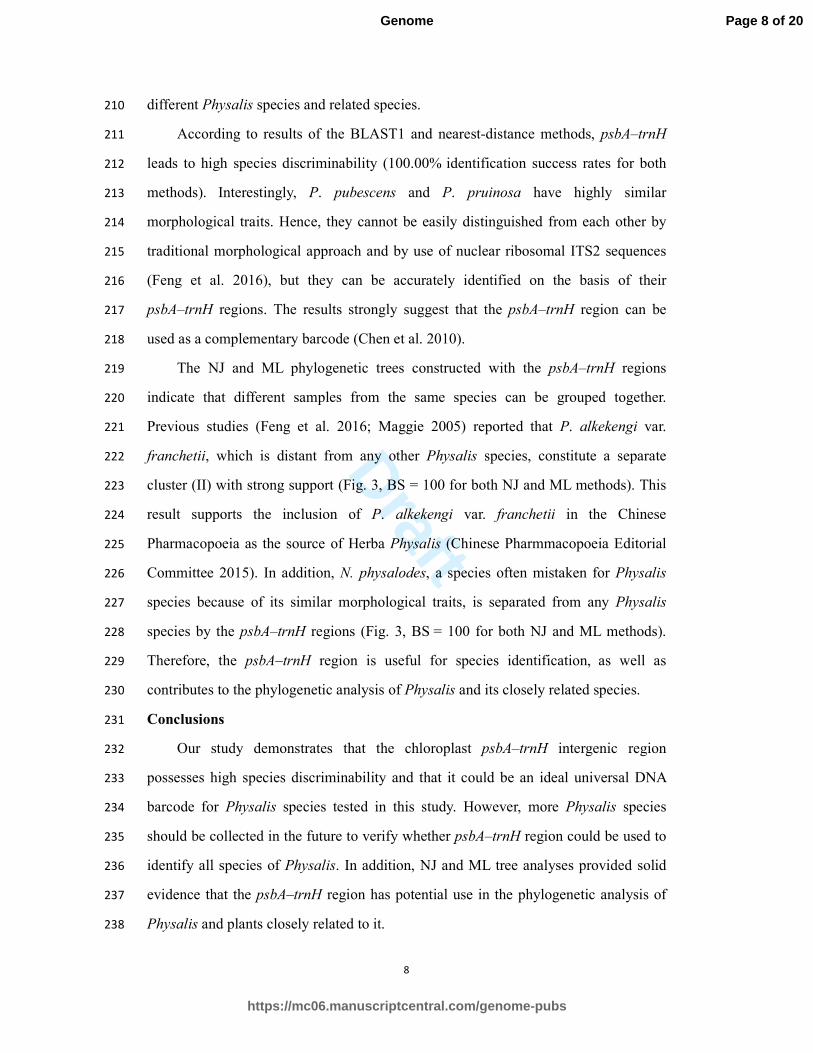
Because of their highly similar morphological characteristics, misidentification 81
of Physalis species is common (Fig. 1). For example, P. minima can be confused with 82
P. angulate or P. pubescens in applications in traditional Chinese medicine (Feng et al. 83
2016; Chinese Academy of Sciences 1978). In addition, some species of another 84
genus such as Nicandra physalodes are often mistaken for Physalis species (Feng et al. 85
2016) (Fig. 1). The amounts of biologically active compounds and their application 86
value differ among Physalis species and their related species. Thus, incorrect 87
identification of Physalis species can lead to their inappropriate usage and failures in 88
their genetic resource conservation. The traditional morphological authentication 89
Page 3 of 20
https://mc06.manuscriptcentral.com/genome-pubs
Genome
Draft
4
approach is often affected by heritable variation and growth environment (Maggie 90
2005; Vargas-Ponce et al. 2011). Hence, a rapid and reliable identification method for 91
Physalis is essential. 92
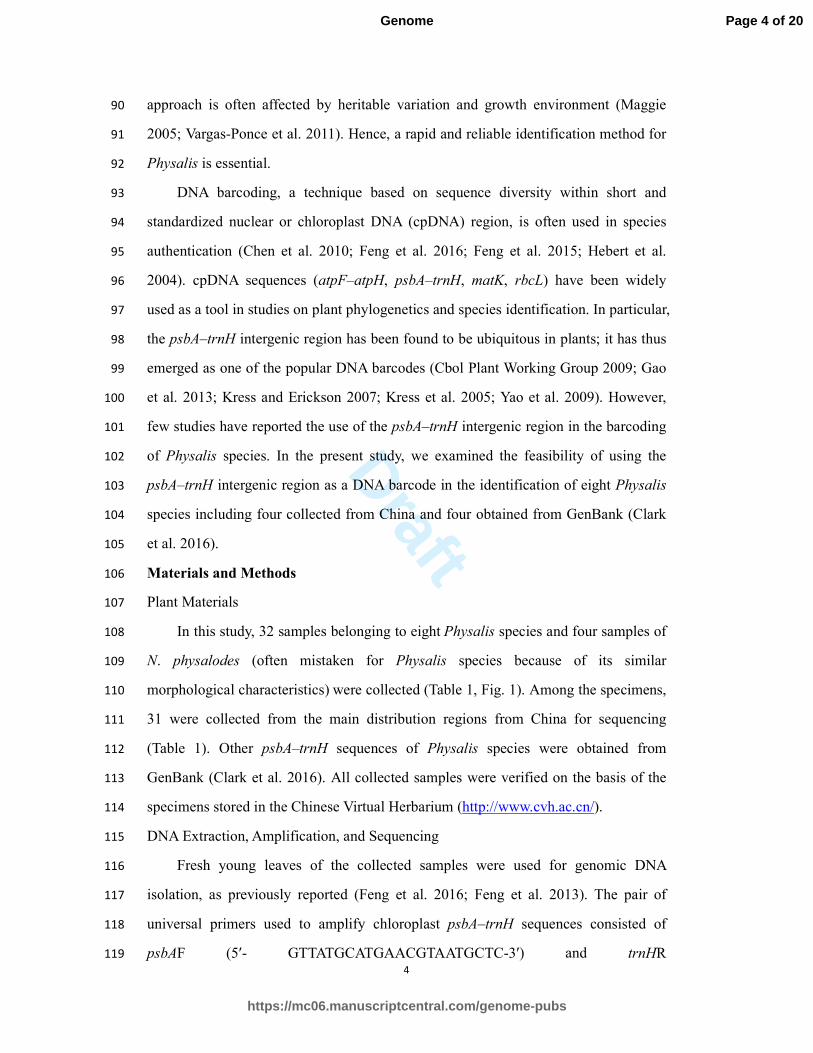
DNA barcoding, a technique based on sequence diversity within short and 93
standardized nuclear or chloroplast DNA (cpDNA) region, is often used in species 94
authentication (Chen et al. 2010; Feng et al. 2016; Feng et al. 2015; Hebert et al. 95
2004). cpDNA sequences (atpF–atpH, psbA–trnH, matK, rbcL) have been widely 96
used as a tool in studies on plant phylogenetics and species identification. In particular, 97
the psbA–trnH intergenic region has been found to be ubiquitous in plants; it has thus 98
emerged as one of the popular DNA barcodes (Cbol Plant Working Group 2009; Gao 99
et al. 2013; Kress and Erickson 2007; Kress et al. 2005; Yao et al. 2009). However, 100
few studies have reported the use of the psbA–trnH intergenic region in the barcoding 101
of Physalis species. In the present study, we examined the feasibility of using the 102
psbA–trnH intergenic region as a DNA barcode in the identification of eight Physalis 103
species including four collected from China and four obtained from GenBank (Clark 104
et al. 2016). 105
Materials and Methods 106
Plant Materials 107
In this study, 32 samples belonging to eight Physalis species and four samples of 108
N. physalodes (often mistaken for Physalis species because of its similar 109
morphological characteristics) were collected (Table 1, Fig. 1). Among the specimens, 110
31 were collected from the main distribution regions from China for sequencing 111
(Table 1). Other psbA–trnH sequences of Physalis species were obtained from 112
GenBank (Clark et al. 2016). All collected samples were verified on the basis of the 113
specimens stored in the Chinese Virtual Herbarium (http://www.cvh.ac.cn/). 114
DNA Extraction, Amplification, and Sequencing 115
Fresh young leaves of the collected samples were used for genomic DNA 116
isolation, as previously reported (Feng et al. 2016; Feng et al. 2013). The pair of 117
universal primers used to amplify chloroplast psbA–trnH sequences consisted of 118
psbAF (5ʹ- GTTATGCATGAACGTAATGCTC-3ʹ) and trnHR 119
Page 4 of 20
https://mc06.manuscriptcentral.com/genome-pubs
Genome

Draft
5
(5ʹ-CGCGCATGGTGGATTCACAAATC-3ʹ) (Sang et al. 1997). PCR amplification 120
was conducted using 25 µL volumes containing 1× PCR buffer with MgCl2, 0.4 mM 121
dNTPs, 0.4 µM of each primer (synthesized by Sangon Biotech Co., Ltd., Shanghai 122
China), and 1.0 U Taq DNA polymerase (TaKaRa Bio., Kyoto, Japan). PCR 123
amplification was conducted in a Mastercycler Nexus gradient thermocycler 124
(Eppendorf AG, Hamburg, Germany) with the following parameter settings: holding 125
at 94ºC for 5 min followed by 32 cycles at 94ºC for 50 s, at 55ºC for 50 s, and at 72ºC 126
for 1.5 min, and a final extension at 72ºC for 10 min. The amplification products were 127
sequenced in both directions by Sunny Biotechnology Co., Ltd., Shanghai, China. 128
Data Analysis 129
The program Clustal W (Thompson et al. 2002) was used to align the chloroplast 130
psbA–trnH regions obtained from all samples, but this was assisted by manual editing. 131
MEGA 6.0 was used to calculate the genetic distances with the Kimura two-parameter 132
(K2P) model (Tamura et al. 2013). Inter-specific divergences were evaluated by 133
average inter-specific distance, minimum inter-specific distance, and average theta 134
prime calculated using the K2P model, while the intra-specific variation was 135
determined from the metrics average intra-specific distance, coalescent depth, and 136
theta based on the K2P model (Chen et al. 2010; Meyer and Paulay 2005). The 137
distributions of intra-specific variability were compared against those of the 138
inter-specific variability using DNA barcoding gaps (Chen et al. 2010; Meyer and 139
Paulay 2005). Wilcoxon two-sample tests were carried out as previous study (Chen et 140
al. 2010). BLAST1 and nearest-distance methods were performed to assess the 141
discriminatory efficacy of psbA–trnH sequences for the collected species (Feng et al. 142
2015; Slabbinck et al. 2008). For the BLAST1 method, the reference database for 143
all psbA–trnH regions were searched using the BLAST program 144
(http://blast.ncbi.nlm.nih.gov/Blast.cgi). For the nearest-distance method, 145
identification was based on all pairwise genetic distances calculated between each 146
query and each of the reference sequences, as well as among the reference sequences. 147
Phylogenetic analysis was conducted according to the neighbor-joining (NJ) and 148
maximum likelihood (ML) methods using MEGA 6.0 (Tamura et al. 2013), with the 149
Page 5 of 20
https://mc06.manuscriptcentral.com/genome-pubs
Genome

Draft
6
following parameters: 1000 bootstrap replicates, Tamura-Nei model, and complete 150
elimination of all positions containing gaps and missing data. 151
Results 152
PCR Efficiency, Sequencing, and Characteristics of the psbA–trnH regions 153
The success rates of PCR amplification and sequencing of the psbA–trnH regions 154
from the sampled specimens were 100%. The lengths of the psbA–trnH regions were 155
in the range 492 to 553 bp, having an average of 515 bp (Table 1). The GC content 156
ranged from 26.95% to 29.47%, with an average of 28.28%. Therefore, the sequence 157
length and GC content of the psbA–trnH regions varied. The GenBank accession 158
number of each psbA–trnH region is given in Table 1. 159
Genetic Divergence within and between Species 160
Genetic divergences were calculated using MEGA 6.0. The six metrics used to 161
evaluate the inter-specific versus intra-specific variation are shown in Table 2. The 162
genetic distances of the three intra-specific metrics (average intra-specific distance, 163
coalescent depth, and theta) are far less than the genetic distances of the three 164
inter-specific metrics (average inter-specific distance, minimum inter-specific distance, 165
and theta prime) (Table 2). Significant differences between the inter-specific and 166
intra-specific divergences were also demonstrated by Wilcoxon two-sample tests 167
(Table 3). 168
Assessment of the Barcoding Gap 169
The distributions of genetic distance of all tested samples calculated using the 170
K2P model of intra- versus inter-specific variation on a scale of 0.004 distance units 171
were analyzed (Fig. 2). We observed a barcoding gap between intra-specific and 172
inter-specific variation (Fig. 2). The intra-specific genetic distance was in the range of 173
0.000–0.008 and the proportion of intra-specific genetic distance that equal zero 174
reached 89.89%. The inter-specific genetic distance ranged from 0.002 to 0.922, and 175
the proportion of inter-specific genetic distance of ≥0.011 was 82.33% (Fig. 2). 176
Species Discriminability of psbA–trnH 177
The results of both BLAST1 and nearest-distance methods indicate that the 178
identification rates at the species level using psbA–trnH are 100.0% accurate (Table 4) 179
Page 6 of 20
https://mc06.manuscriptcentral.com/genome-pubs
Genome
Draft
7
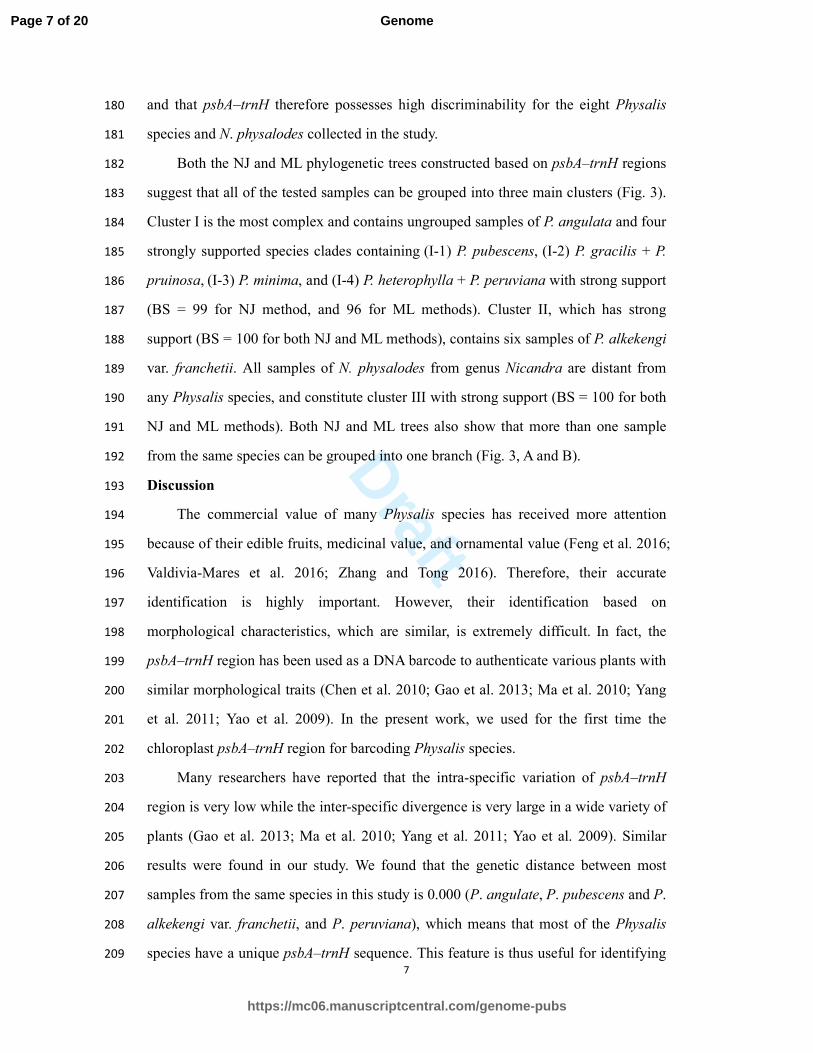
and that psbA–trnH therefore possesses high discriminability for the eight Physalis 180
species and N. physalodes collected in the study. 181
Both the NJ and ML phylogenetic trees constructed based on psbA–trnH regions 182
suggest that all of the tested samples can be grouped into three main clusters (Fig. 3). 183
Cluster I is the most complex and contains ungrouped samples of P. angulata and four 184
strongly supported species clades containing (I-1) P. pubescens, (I-2) P. gracilis + P. 185
pruinosa, (I-3) P. minima, and (I-4) P. heterophylla + P. peruviana with strong support 186
(BS = 99 for NJ method, and 96 for ML methods). Cluster II, which has strong 187
support (BS = 100 for both NJ and ML methods), contains six samples of P. alkekengi 188
var. franchetii. All samples of N. physalodes from genus Nicandra are distant from 189
any Physalis species, and constitute cluster III with strong support (BS = 100 for both 190
NJ and ML methods). Both NJ and ML trees also show that more than one sample 191
from the same species can be grouped into one branch (Fig. 3, A and B). 192
Discussion 193
The commercial value of many Physalis species has received more attention 194
because of their edible fruits, medicinal value, and ornamental value (Feng et al. 2016; 195
Valdivia-Mares et al. 2016; Zhang and Tong 2016). Therefore, their accurate 196
identification is highly important. However, their identification based on 197
morphological characteristics, which are similar, is extremely difficult. In fact, the 198
psbA–trnH region has been used as a DNA barcode to authenticate various plants with 199
similar morphological traits (Chen et al. 2010; Gao et al. 2013; Ma et al. 2010; Yang 200
et al. 2011; Yao et al. 2009). In the present work, we used for the first time the 201
chloroplast psbA–trnH region for barcoding Physalis species. 202
Many researchers have reported that the intra-specific variation of psbA–trnH 203
region is very low while the inter-specific divergence is very large in a wide variety of 204
plants (Gao et al. 2013; Ma et al. 2010; Yang et al. 2011; Yao et al. 2009). Similar 205
results were found in our study. We found that the genetic distance between most 206
samples from the same species in this study is 0.000 (P. angulate, P. pubescens and P. 207
alkekengi var. franchetii, and P. peruviana), which means that most of the Physalis 208
species have a unique psbA–trnH sequence. This feature is thus useful for identifying 209
Page 7 of 20
https://mc06.manuscriptcentral.com/genome-pubs
Genome
Draft
8
different Physalis species and related species. 210
According to results of the BLAST1 and nearest-distance methods, psbA–trnH 211
leads to high species discriminability (100.00% identification success rates for both 212
methods). Interestingly, P. pubescens and P. pruinosa have highly similar 213
morphological traits. Hence, they cannot be easily distinguished from each other by 214
traditional morphological approach and by use of nuclear ribosomal ITS2 sequences 215
(Feng et al. 2016), but they can be accurately identified on the basis of their 216
psbA–trnH regions. The results strongly suggest that the psbA–trnH region can be 217
used as a complementary barcode (Chen et al. 2010). 218
The NJ and ML phylogenetic trees constructed with the psbA–trnH regions 219
indicate that different samples from the same species can be grouped together. 220
Previous studies (Feng et al. 2016; Maggie 2005) reported that P. alkekengi var. 221
franchetii, which is distant from any other Physalis species, constitute a separate 222
cluster (II) with strong support (Fig. 3, BS = 100 for both NJ and ML methods). This 223
result supports the inclusion of P. alkekengi var. franchetii in the Chinese 224
Pharmacopoeia as the source of Herba Physalis (Chinese Pharmmacopoeia Editorial 225
Committee 2015). In addition, N. physalodes, a species often mistaken for Physalis 226
species because of its similar morphological traits, is separated from any Physalis 227
species by the psbA–trnH regions (Fig. 3, BS = 100 for both NJ and ML methods). 228
Therefore, the psbA–trnH region is useful for species identification, as well as 229
contributes to the phylogenetic analysis of Physalis and its closely related species. 230
Conclusions 231
Our study demonstrates that the chloroplast psbA–trnH intergenic region 232
possesses high species discriminability and that it could be an ideal universal DNA 233
barcode for Physalis species tested in this study. However, more Physalis species 234
should be collected in the future to verify whether psbA–trnH region could be used to 235
identify all species of Physalis. In addition, NJ and ML tree analyses provided solid 236
evidence that the psbA–trnH region has potential use in the phylogenetic analysis of 237
Physalis and plants closely related to it. 238
Page 8 of 20
https://mc06.manuscriptcentral.com/genome-pubs
Genome

Draft
9
Acknowledgments 239
This study was supported in part by the National Natural Science Foundation of China 240
(31470407), the Zhejiang Provincial Public Welfare Technology Applied Research 241
Foundation of China (2014C32090), the Hangzhou Scientific and Technological 242
Program (20150932H04), and the Hangzhou Scientific and Technological Program 243
(20150932H03). 244
References 245
Cbol Plant Working Group. 2009. A DNA barcode for land plants. Proc Natl Acad Sci U S A 106(31): 246
12794-12797. doi: 10.1073/pnas.0905845106. 247
Chen, S., Yao, H., Han, J., Liu, C., Song, J., Shi, L., Zhu, Y., Ma, X., Gao, T., Pang, X., Luo, K., Li, Y., 248
Li, X., Jia, X., Lin, Y., and Leon, C. 2010. Validation of the ITS2 region as a novel DNA barcode 249
for identifying medicinal plant species. PLoS One 5(1): e8613. doi: 250
10.1371/journal.pone.0008613. 251
Chinese Academy of Sciences. 1978. Flora of China. Science press, Beijing, China 67: 50. 252
Chinese Pharmmacopoeia Editorial Committee. 2015. Pharmacopoeia of the People's Republic of 253
China. Chemical Industry Press, Beijing, China I Part: 360-361. 254
Clark, K., Karsch-Mizrachi, I., Lipman, D.J., Ostell, J., and Sayers, E.W. 2016. GenBank. Nucleic 255
Acids Res 44(D1): D67-72. doi: 10.1093/nar/gkv1276. 256
Feng, S., Jiang, M., Shi, Y., Jiao, K., Shen, C., Lu, J., Ying, Q., and Wang, H. 2016. Application of the 257
Ribosomal DNA ITS2 Region of Physalis (Solanaceae): DNA Barcoding and Phylogenetic Study. 258
Front Plant Sci 7: 1047. doi: 10.3389/fpls.2016.01047. 259
Feng, S., Jiang, Y., Wang, S., Jiang, M., Chen, Z., Ying, Q., and Wang, H. 2015. Molecular 260
Identification of Dendrobium Species (Orchidaceae) Based on the DNA Barcode ITS2 Region and 261
Its Application for Phylogenetic Study. Int J Mol Sci 16(9): 21975-21988. doi: 262
10.3390/ijms160921975. 263
Feng, S., Zhao, H., Lu, J., Liu, J., Shen, B., and Wang, H. 2013. Preliminary genetic linkage maps of 264
Chinese herb Dendrobium nobile and D. moniliforme. J Genet 92(2): 205-212. doi: 265
10.1007/s12041-013-0246-y. 266
Gao, T., Ma, X., and Zhu, X. 2013. Use of the psbA-trnH region to authenticate medicinal species of 267
Fabaceae. Biol Pharm Bull 36(12): 1975-1979. doi: 10.1248/bpb.b13-00611. 268
Hebert, P.D.N., Penton, E.H., Burns, J.M., Janzen, D.H., and Hallwachs, W. 2004. Ten species in one: 269
DNA barcoding reveals cryptic species in the neotropical skipper butterfly Astraptes fulgerator. P 270
Natl Acad Sci USA 101(41): 14812-14817. doi: 10.1073/pnas.0406166101. 271
Hong, J.M., Kwon, O.K., Shin, I.S., Song, H.H., Shin, N.R., Jeon, C.M., Oh, S.R., Han, S.B., and Ahn, 272
K.S. 2015. Anti-inflammatory activities of Physalis alkekengi var. franchetii extract through the 273
inhibition of MMP-9 and AP-1 activation. Immunobiology 220(1): 1-9. doi: 274
10.1016/j.imbio.2014.10.004. 275
Ji, L., Yuan, Y.L., Luo, L.P., Chen, Z., Ma, X.Q., Ma, Z.J., and Cheng, L. 2012. Physalins with 276
anti-inflammatory activity are present in Physalis alkekengi var. franchetii and can function as 277
Michael reaction acceptors. Steroids 77(5): 441-447. doi: 10.1016/j.steroids.2011.11.016. 278
Page 9 of 20
https://mc06.manuscriptcentral.com/genome-pubs
Genome

Draft
10
Kress, W.J., and Erickson, D.L. 2007. A two-locus global DNA barcode for land plants: the coding rbcL 279
gene complements the non-coding trnH-psbA spacer region. PLoS One 2(6): e508. doi: 280
10.1371/journal.pone.0000508. 281
Kress, W.J., Wurdack, K.J., Zimmer, E.A., Weigt, L.A., and Janzen, D.H. 2005. Use of DNA barcodes 282
to identify flowering plants. P Natl Acad Sci USA 102(23): 8369-8374. doi: 283
10.1073/pnas.0503123102. 284
Ma, X.Y., Xie, C.X., Liu, C., Song, J.Y., Yao, H., Luo, K., Zhu, Y.J., Gao, T., Pang, X.H., Qian, J., and 285
Chen, S.L. 2010. Species identification of medicinal pteridophytes by a DNA barcode marker, the 286
chloroplast psbA-trnH intergenic region. Biol Pharm Bull 33(11): 1919-1924. doi: 287
JST.JSTAGE/bpb/33.1919 [pii]. 288
Maggie, W.P.S., M. 2005. Untangling Physalis (Solanaceae) from the Physaloids: A Two-Gene 289
Phylogeny of the Physalinae. Systematic Botany 30(1): 216-230. doi: 290
http://dx.doi.org/10.1600/0363644053661841. 291
Martinez, M. 1998. Revision of Physalis section Epeteiorhiza (Solanaceae). Ann Ins Biol Bot 69: 292
71-117. doi: 10.1002/ece3.102. 293
Meyer, C.P., and Paulay, G. 2005. DNA barcoding: error rates based on comprehensive sampling. PLoS 294
biology 3(12): e422. doi: 10.1371/journal.pbio.0030422. 295
Sang-Ngern, M., Youn, U.J., Park, E.J., Kondratyuk, T.P., Simmons, C.J., Wall, M.M., Ruf, M., Lorch, 296
S.E., Leong, E., Pezzuto, J.M., and Chang, L.C. 2016. Withanolides derived from Physalis 297
peruviana (Poha) with potential anti-inflammatory activity. Bioorg Med Chem Lett 26(12): 298
2755-2759. doi: 10.1016/j.bmcl.2016.04.077. 299
Sang, T., Crawford, D., and Stuessy, T. 1997. Chloroplast DNA phylogeny, reticulate evolution, and 300
biogeography of Paeonia (Paeoniaceae). Am J Bot 84(8): 1120. DOI: 10.2307/2446155. 301
Slabbinck, B., Dawyndt, P., Martens, M., De Vos, P., and De Baets, B. 2008. TaxonGap: a visualization 302
tool for intra-and inter-species variation among individual biomarkers. Bioinformatics 24(6): 303
866-867. doi: 10.1093/bioinformatics/btn031. 304
Tamura, K., Stecher, G., Peterson, D., Filipski, A., and Kumar, S. 2013. MEGA6: Molecular 305
Evolutionary Genetics Analysis version 6.0. Mol Biol Evol 30(12): 2725-2729. doi: 306
10.1093/molbev/mst197. 307
Thompson, J.D., Gibson, T., and Higgins, D.G. 2002. Multiple sequence alignment using ClustalW and 308
ClustalX. Current protocols in bioinformatics: 2.3. 1-2.3. 22. doi: 10.1002/0471250953.bi0203s00. 309
Valdivia-Mares, L.E., Zaragoza, F.A.R., Gonzalez, J.J.S., and Vargas-Ponce, O. 2016. Phenology, 310
agronomic and nutritional potential of three wild husk tomato species (Physalis, Solanaceae) from 311
Mexico. Sci Hortic-Amsterdam 200: 83-94. doi: 10.1016/j.scienta.2016.01.005. 312
Vargas-Ponce, O., Perez-Alvarez, L.F., Zamora-Tavares, P., and Rodriguez, A. 2011. Assessing Genetic 313
Diversity in Mexican Husk Tomato Species. Plant Mol Biol Rep 29(3): 733-738. doi: 314
10.1007/s11105-010-0258-1. 315
Wei, J.L., Hu, X.R., Yang, J.J., and Yang, W.C. 2012. Identification of Single-Copy Orthologous Genes 316
between Physalis and Solanum lycopersicum and Analysis of Genetic Diversity in Physalis Using 317
Molecular Markers. Plos One 7(11). doi: 10.1371/journal.pone.0050164. 318
Yang, Y., Zhai, Y., Liu, T., Zhang, F., and Ji, Y. 2011. Detection of Valeriana jatamansi as an adulterant 319
of medicinal Paris by length variation of chloroplast psbA-trnH region. Planta Med 77(1): 87-91. 320
doi: 10.1055/s-0030-1250072. 321
Yang, Y.K., Xie, S.D., Xu, W.X., Nian, Y., Liu, X.L., Peng, X.R., Ding, Z.T., and Qiu, M.H. 2016. Six 322
Page 10 of 20
https://mc06.manuscriptcentral.com/genome-pubs
Genome

Draft
11
new physalins from Physalis alkekengi var. franchetii and their cytotoxicity and antibacterial 323
activity. Fitoterapia 112: 144-152. doi: 10.1016/j.fitote.2016.05.010. 324
Yao, H., Song, J.Y., Ma, X.Y., Liu, C., Li, Y., Xu, H.X., Han, J.P., Duan, L.S., and Chen, S.L. 2009. 325
Identification of Dendrobium species by a candidate DNA barcode sequence: the chloroplast 326
psbA-trnH intergenic region. Planta Med 75(6): 667-669. doi: 10.1055/s-0029-1185385. 327
Zamora-Tavares, P., Vargas-Ponce, O., Sanchez-Martinez, J., and Cabrera-Toledo, D. 2015. Diversity 328
and genetic structure of the husk tomato (Physalis philadelphica Lam.) in Western Mexico. Genet 329
Resour Crop Ev 62(1): 141-153. doi: 10.1007/s10722-014-0163-9. 330
Zhang, C.R., Khan, W., Bakht, J., and Nair, M.G. 2016. New antiinflammatory sucrose esters in the 331
natural sticky coating of tomatillo (Physalis philadelphica), an important culinary fruit. Food 332
Chem 196: 726-732. doi: 10.1016/j.foodchem.2015.10.007. 333
Zhang, W.N., and Tong, W.Y. 2016. Chemical Constituents and Biological Activities of Plants from the 334
Genus Physalis. Chemistry & biodiversity 13(1): 48-65. doi: 10.1002/cbdv.201400435. 335
336
337
338
339
340
341
342
343
344
345
Page 11 of 20
https://mc06.manuscriptcentral.com/genome-pubs
Genome

Draft
12
346
Table 1 Voucher information, GenBank accession numbers, sequence lengths and GC content of the psbA-trnH sequences for all samples 347
examined in the study 348
Species Name Locality information Longitude (E) Latitude (N)
Voucher No. GenBank
Accession No.
Sequence
lengths (bp)
GC content
(%)
Physalis angulata L. Xiaoshan, Hangzhou, Zhejiang, China 120°15′ 30°11′ PHZ0001 KY263828 504 29.17
P. angulata Lin’an, Hangzhou, Zhejaing, China 119°43′ 30°14′ PHZ0002 KY263829 504 29.17
P. angulata Pujiang, Jinhua, Zhejiang, China 121°30′ 31°04′ PHZ0003 KY263830 504 29.17
P. angulata Yueqing, Wenzhou, Zhejiang, China 120°58′ 28°06′ PHZ0004 KY263831 504 29.17
P. angulata Luotian, Huanggang, Hubei, China 115°23′ 30°47′ PHZ0005 KY263832 504 29.17
P. angulata Xiajin, Dezhou, Shandong, China 116°00′ 36°57′ PHZ0006 KY263833 504 29.17
P. angulata Baohua, Honghe, Yunnan, China 102°20′ 23°17′ PHZ0007 KY263834 504 29.17
P. alkekengi var. franchetii
(Mast.) Makino
Nong’an, Changchun, Jilin, China 125°10′ 44°25′ PHZ4001
KY263848
501
26.95
P. alkekengi var. franchetii Faku, Shenyang, Liaoning, China 123°24′ 42°30′ PHZ4002 KY263850 501 26.95
P. alkekengi var. franchetii Donggang, Dandong, Liaoning, China 124°08′ 39°51′ PHZ4003 KY263851 501 26.95
P. alkekengi var. franchetii Donggang, Dandong, Liaoning, China 124°08′ 39°51′ PHZ4004 KY263852 501 26.95
P. alkekengi var. franchetii Zoucheng, Jinan, Shandong, China 116°59′ 35°24′ PHZ4005 KY263853 501 26.95
P. alkekengi var. franchetii Zoucheng, Jinan, Shandong, China 116°59′ 35°24′ PHZ4006 KY263854 501 26.95
P. gracilis Miers GenBank – – – HG963529 509 28.09
P. heterophylla Nees GenBank – – – HQ596787 492 29.47
P. minima L. Tangshan, Hebei, China 118°10′ 39°37′ PHZ3001 KY263844 506 28.66
P. minima Pingdingshan, Henan, China 113°11′ 33°46′ PHZ3002 KY263845 506 28.66
P. minima Heze, Shandong, China 115°28′ 35°14′ PHZ3003 KY263846 506 28.66
Page 12 of 20
https://mc06.manuscriptcentral.com/genome-pubs
Genome

Draft
13
P. minima Lishui, Zhejiang, China 119°55′ 28°28′ PHZ3004 KY263847 506 28.85
P. minima Lou’An, Anhui, China 116°31′ 31°44′ PHZ3005 KY263848 506 28.66
P. peruviana L. GenBank – – – HQ216179 509 28.88
P. peruviana GenBank – – – HQ216178 509 28.88
P. pruinosa (Waterf.) M.
Martinez
GenBank – – –
HG963524 509
28.49
P. pubescens L. Faku, Shenyang, Liaoning, China 123°24′ 42°30′ PHZ2001 KY263835 525 28.38
P. pubescens Guta, Jinzhou, Liaoning, China 121°07′ 41°06′ PHZ2002 KY263835 525 28.38
P. pubescens Changhai, Dalian, Liaoning, China 122°35′ 39°16′ PHZ2003 KY263837 525 28.38
P. pubescens Chaoyang, Zhaodong, Heilongjiang, China 126°15′ 45°52′ PHZ2004 KY263838 525 28.38
P. pubescens Baiquan, Qiqiha’er, Heilongjiang, China 126°05′ 47°35′ PHZ2005 KY263839 525 28.38
P. pubescens Aihui, Heihe, Heilongjiang, China 127°29′ 50°14′ PHZ2006 KY263840 525 28.38
P. pubescens Nong’an, Changchun, Jilin, China 125°10′ 44°25′ PHZ2007 KY263841 525 28.38
P. pubescens Nong’an, Changchun, Jilin, China 125°10′ 44°25′ PHZ2008 KY263842 525 28.38
P. pubescens Tonghua, Changchun, Jilin, China 125°45′ 41°40′ PHZ2009 KY263843 525 28.38
Nicandra physalodes (L.)
Gaertn.
Yiwu, Jinhua, Zhejiang, China
120°04′ 29°18′ NHZ0001
KY263855
552
27.54
N. physalodes Jiujiang, Jiangxi, China 115°59′ 29°42′ NHZ0002 KY263856 552 27.72
N. physalodes Changsha, HuNan, China 112°56′ 28°13′ NHZ0003 KY263857 553 27.12
N. physalodes Xiaoshan, Hangzhou, Zhejiang, China 120°15′ 30°11′ NHZ0004 KY263858 553 27.12
Page 13 of 20
https://mc06.manuscriptcentral.com/genome-pubs
Genome

Draft
14
Table 2 Analyses of inter-specific divergence and intra-specific variation of the 349
chloroplast psbA–trnH regions 350
Measurement K2P value
All inter-specific distance 0.280 ± 0.027
Theta prime 0.246 ± 0.024
Minimum inter-specific distance 0.243 ± 0.024
All intra-specific distance 0.000 ± 0.000
Theta 0.001 ± 0.001
Coalescent depth 0.002 ± 0.001
351
352
353
354
355
356
357
358
359
360
361
362
363
364
365
366
367
368
369
370
371
372
373
Page 14 of 20
https://mc06.manuscriptcentral.com/genome-pubs
Genome

Draft
15
374
Table 3 Results of Wilcoxon two-sample tests for the distribution of intra- vs. 375
inter-specific divergences 376
No. of inter-specific distances No. of intra-specific distances Wilcoxon W P value
533 89 4357 4.06e-50
377
378
379
380
381
382
383
384
385
386
387
388
389
390
391
392
393
394
395
396
397
398
399
400
Page 15 of 20
https://mc06.manuscriptcentral.com/genome-pubs
Genome

Draft
16
401
Table 4 Comparison of efficiencies of authentication of chloroplast psbA–trnH region 402
using different methods 403
Methods of
identification
No. of
samples
No. of
species
Correct
identification
Incorrect
identification
Ambiguous
identification
BLAST1 36 9 100% 0 0
Nearest-distance 36 9 100% 0 0
404
405
406
407
408
409
410
411
412
413
414
415
416
417
418
419
420
421
422
423
424
425
426
Page 16 of 20
https://mc06.manuscriptcentral.com/genome-pubs
Genome

Draft
17
Figure captions 427
Fig. 1 Plant morphology of P. angulate, P. alkekengi var. franchetii, P. minima, P. 428
pubescens, and Nicandra physalodes. 429
Fig. 2 Relative distributions of inter-specific divergence and intra-specific variation of 430
the psbA–trnH region based on K2P genetic distance. 431
Fig. 3 Neighbor-joining (NJ) and maximum likelihood (ML) trees based on 432
psbA–trnH sequences. Numbers above branches indicate bootstrap support (BS) 433
values (BS≥50). (A): NJ tree and (B): ML tree. 434
435
436
437
Page 17 of 20
https://mc06.manuscriptcentral.com/genome-pubs
Genome
Draft
Fig. 1 Plant morphology of P. angulate, P. alkekengi var. franchetii, P. minima, P. pubescens, and Nicandra physalodes.
169x107mm (300 x 300 DPI)
Page 18 of 20
https://mc06.manuscriptcentral.com/genome-pubs
Genome

Draft
Fig. 2 Relative distributions of inter-specific divergence and intra-specific variation of the psbA–trnH region based on K2P genetic distance.
150x107mm (300 x 300 DPI)
Page 19 of 20
https://mc06.manuscriptcentral.com/genome-pubs
Genome

Draft
Fig. 3 Neighbor-joining (NJ) and maximum likelihood (ML) trees based on psbA–trnH sequences. Numbers
above branches indicate bootstrap support (BS) values (BS≥50). (A): NJ tree and (B): ML tree.
166x103mm (300 x 300 DPI)
Page 20 of 20
https://mc06.manuscriptcentral.com/genome-pubs
Genome